Embed Size (px)
Citation preview
KEYSTONE DIALOGUE ON
GLOBAL CLIMATE CHANGE
FINAL REPORT
MAY 2003

The Keystone Center Dialogue on Global Climate Change 2
Photo Credits on Cover (from left to right): Reflected Solar Radiation, October 2002, Earth Observatory, NASA Earth’s Temperature, Credit: GMS, GOES-8, Meteosat, SSEC, NCDC, U. Wisc., NOAA Ocean Planet Pole to Pole, Credit: SeaWiFS Project, ORBIMAGE, GSFC, NASA Earth in True Color, Credit: Reto Stockli (IACETH), MODIS, GSFC, NASA
The Keystone Center Dialogue on Global Climate Change 3
THE KEYSTONE DIALOGUE ON
GLOBAL CLIMATE CHANGE
Final Report May 2003
For additional Copies of this report, please visit www.keystone.org
1628 Saints John Road, Keystone, CO 80435 (970) 513-5800 (970) 262-0152 fax 1020 16th Street, NW, 2nd Fl, Washington, D.C. 20036 (202) 452-1590 (202) 452-1138 fax

The Keystone Center Dialogue on Global Climate Change 4
ACKNOWLEDGEMENTS The Keystone Center would like to thank all of the participants in this Dialogue for their time and commitment to working towards consensus on this complex issue. We would also like to thank the following for their generous financial support of this project:
Alcan
American Electric Power
BP America, Inc.
Cantor Fitzgerald
Cummins, Inc.
DuPont
General Motors
Natsource, LLC.
PSE&G
The Energy Foundation
The Turner Foundation
Toyota
Wisconsin Energy
The Keystone Center Dialogue on Global Climate Change 5
The Keystone Center Dialogue on Global Climate Change 6
TABLE OF CONTENTS
TABLE OF CONTENTS .............................................................................................................................................................6
INDEX OF TABLES AND FIGURES ......................................................................................................................................7
EXECUTIVE SUMMARY..........................................................................................................................................................8
LIST OF ABBREVIATIONS AND ACRONYMS ..............................................................................................................15 A NOTE ON UNITS:................................................................................................................................................................... 15
CHAPTER 1 INTRODUCTION............................................................................................................................................17
CHAPTER 2 DESCRIPTION OF DIALOGUE PROCESS ..........................................................................................19
CHAPTER 3 ANALYSIS OF REFERENCE CASES AND EMISSION BUDGETS ..............................................22 ANALYSIS OF INTERNATIONAL EMISSION ALLOWANCE SHARING.................................................................................... 24 GLOBAL REDUCTIONS REQUIRED FROM THE REFERENCE CASE........................................................................................ 25 U.S. REDUCTIONS REQUIRED FROM THE REFERENCE CASE............................................................................................... 25 DISCUSSION OF RESULTS......................................................................................................................................................... 28
CHAPTER 4 SECTOR STUDIES .........................................................................................................................................30 A) THE ELECTRIC SECTOR....................................................................................................................................................... 32 B) DEMAND SIDE MANAGEMENT........................................................................................................................................... 43 C) BIOLOGIC SEQUESTRATION................................................................................................................................................ 46 D) ENERGY INTENSIVE MANUFACTURING SECTOR............................................................................................................. 54 E) THE AUTO SECTOR.............................................................................................................................................................. 58 F) INTEGRATION OF SECTOR STUDIES ................................................................................................................................... 62
CHAPTER 5 CONCLUSIONS ...............................................................................................................................................66
APPENDIX A LIS T OF PARTICIPANTS AND PRESENTERS ..................................................................................69
APPENDIX B TECHNICAL NOTE ON MINICAM MODEL .....................................................................................72
APPENDIX C DECIS ION CRITERIA .................................................................................................................................82
The Keystone Center Dialogue on Global Climate Change 7
INDEX OF TABLES AND FIGURES TABLES TABLE 3-1: GLOBAL AND US REFERENCE CASE IN MMTC……………………………………….. 23 TABLE 3-2: HYPOTHETICAL ALLOWANCE SHARING AGREEMENTS…………………………...…… 24 TABLE 3-3: GLOBAL CO2 REFERENCE CASE EMISSIONS, EMISSIONS BUDGETS AND REDUCTIONS..25 TABLE 3-4: GLOBAL CO2 REFERENCE CASE EMISSIONS, EMISSION BUDGETS AND REDUCTIONS.. 25 TABLE 3-5: U.S. CO2 REFERENCE CASE EMISSIONS, EMISSION BUDGETS AND REDUCTIONS…….. 26 TABLE 3-6: U.S. CO2 REFERENCE CASE EMISSIONS, EMISSION BUDGETS AND REDUCTIONS…….. 27 TABLE 4-1: ASSUMED U.S. EMISSION REDUCTIONS FROM THE REFERENCE CASE ……………..…. 31 TABLE 4-2: BASE CASE EMISSIONS AND EFFECT OF $25 PER TONNE CARBON PRICE ……………. 34 TABLE 4-3: RESULTS OF “SENSITIVITY TEST ON SINGLE VARIABLES”……………………………..35 TABLE 4-4: BASE CASE EMISSIONS AND EFFECT CARBON PRICE ………………………….. 37 TABLE 4-5: RESULTS OF MULTIPLE VARIABLE SENSITIVITY CASE…………………………. 37 TABLE 4-6: ANALYSIS OF DIFFERENT POLICY OPTIONS……………………………………. 38 TABLE 4-7: ENERGY DEMAND UNDER FOUR CASES………………………………………. 44 TABLE 4-8: DSM PROGRAM COST, 2001 $BILLION……………………………………….. 45 TABLE 4-9: ANNUAL BIOLOGICAL SEQUESTRATION AT CERTAIN PRICES…………………... 49 TABLE 4-10: EMISSIONS REDUCTIONS FROM A POLICY……………………………………. 51 TABLE 4-11: REDUCTIONS FROM ENERGY INTENSIVE MANUFACTURING SECTOR…………. 56 TABLE 4-12: THREE COMPOSITE SCENARIOS ASSESSED IN STUDY…………………………. 61 TABLE 4-13: ASSUMED U.S. EMISSION REDUCTIONS FROM THE REFERENCE CASE ………...63 TABLE 4-14: POLICY SET 1 – “LOW CARBON VALUES” …………………………………… 63 TABLE 4-15: POLICY SET 2 – “HIGH CARBON VALUES” …………………………………... 64 TABLE B-1: ENERGY CONSUMPTION ASSUMPTIONS……………………………………….. 74 TABLE B-2: A1G REGIONAL POPULATION ASSUMPTIONS ………………………………… 74 TABLE B-3: REGIONAL GDP ……………………………………………………………… 75 TABLE B-4: HYPOTHETICAL ALLOWANCE SHARING AGREEMENTS………………………… 78 TABLE B-5: GLOBAL GHG EMISSION BUDGETS…………………………………………… 78 TABLE B-6: USA GHG EMISSION REDUCTIONS FROM REFERENCE CASE…………………..79 FIGURES FIGURE ES-1: FIGURE ES-1: U.S. CO2 EMISSIONS BUDGETS ……………………………… 10 FIGURE 3-1: U.S. EMISSION BUDGETS………………………………………………….….. 27 FIGURE 4-1: ELECTRICITY SECTOR MODEL………………………………………………… 33 FIGURE 4-2: ELECTRICITY - SENSITIVITY ANALYSIS……………………………………….. 35 FIGURE 4-3: ELECTRICITY - AGGREGATED RESULTS OF STRESS TEST……………………… 38 FIGURE 4-4: ELECTRICITY - ANALYSIS OF DIFFERENT POLICY OPTIONS…………………… 39 FIGURE 4-5: ELECTRICITY - COMPONENTS OF EMISSION REDUCTIONS…………………….. 42 FIGURE 4-6: DSM - ENERGY DEMAND UNDER FOUR CASES……………………………… 45 FIGURE 4-7: SEQUESTRATION - SAMPLE SUPPLY CURVE FOR THE U.S……………………... 48 FIGURE 4-8: SEQUESTRATION - PRODUCTION PROFILE FOR ONE TREE SPECIES……………. 49 FIGURE 4-9 SEQUESTRATION – EMISSION REDUCTIONS FROM A POLICY…………………...51 FIGURE 4-10 AUTO- MODEL FOR ANALYSIS……………………………………………… ..59
The Keystone Center Dialogue on Global Climate Change 8
EXECUTIVE SUMMARY
The Keystone Dialogue on Global Climate Change brought together approximately 30 representatives from environmental non-governmental organizations (ENGOs), industry, and the research and technical communities. The purposes of the dialogue were (1) to review the magnitude and timing of carbon dioxide (CO2) reductions required globally and by the United States to achieve four concentration ceilings under alternative international allocations of these reductions; and (2) to review policies for their ability to achieve the U.S. reductions from three key emitting sectors and from biologic sequestration. This dialogue was predicated upon the long-term goal of stabilizing atmospheric CO2 concentrations embedded in the United Nations Framework Convention on Climate Change (UNFCCC), an international agreement that has entered into force. The project’s focus on long-term stabilization of CO2 concentrations is consistent with the UNFCCC and distinguishes it from many other studies. The analysis concludes that significant CO2 emission reductions are required on a global basis and by the United States from the reference case in order to achieve the range of concentration ceilings (450-750 parts per million volume) (ppmv)) under discussion by the international community. Significant technological advances are incorporated into the reference case. Achieving the “business as usual” levels of technological progress and associated emission reductions will require a major effort. The U.S. share of global emission reductions required for stabilization were developed as a benchmark for this analysis, given a specific set of assumptions regarding international participation in a global program designed to reduce greenhouse gas emissions and modeling framework. The selection of the cases used for analysis does not constitute an endorsement or prediction by the Dialogue group. The second part of the study focuses on potential sources of emission reductions and explores the impacts of policy, timing and carbon prices on private firms’ investment decisions during the timeframe from 2010 to 2030. This analysis concludes that carbon prices of $25-50/tonne C (or $6.20-$12.40/ton CO2
1) combined with additional policies starting in 2010 would result in the achievement of half to nearly all of the emission reductions required by the United States by 2020 and 2030 under the burden sharing alternatives utilized in this analysis. The majority of reductions come from improvements in the electricity supply-side, end use electric efficiency and through biologic sequestration, although reductions are also achieved in the energy intensive manufacturing sectors as well. This study does not include roughly 20% of the U.S. CO2 inventory2, including emissions resulting from non-passenger transportation such as trucking, shipping and rail. Further study of these sources could yield significant additional reductions. The Study’s key findings are summarized below:
1 This study is reported in metric units of carbon except in a few instances where the short tons of carbon dioxide are also reported. A chart illustrating the conversion factors is in a note following the Executive Summary. 2 This study does not include non-CO2 greenhouse gases (ghg) and not all CO2 gases. It does include roughly 75% of the total U.S. ghg inventory and 80% of the total U.S. CO2 inventory.
The Keystone Center Dialogue on Global Climate Change 9
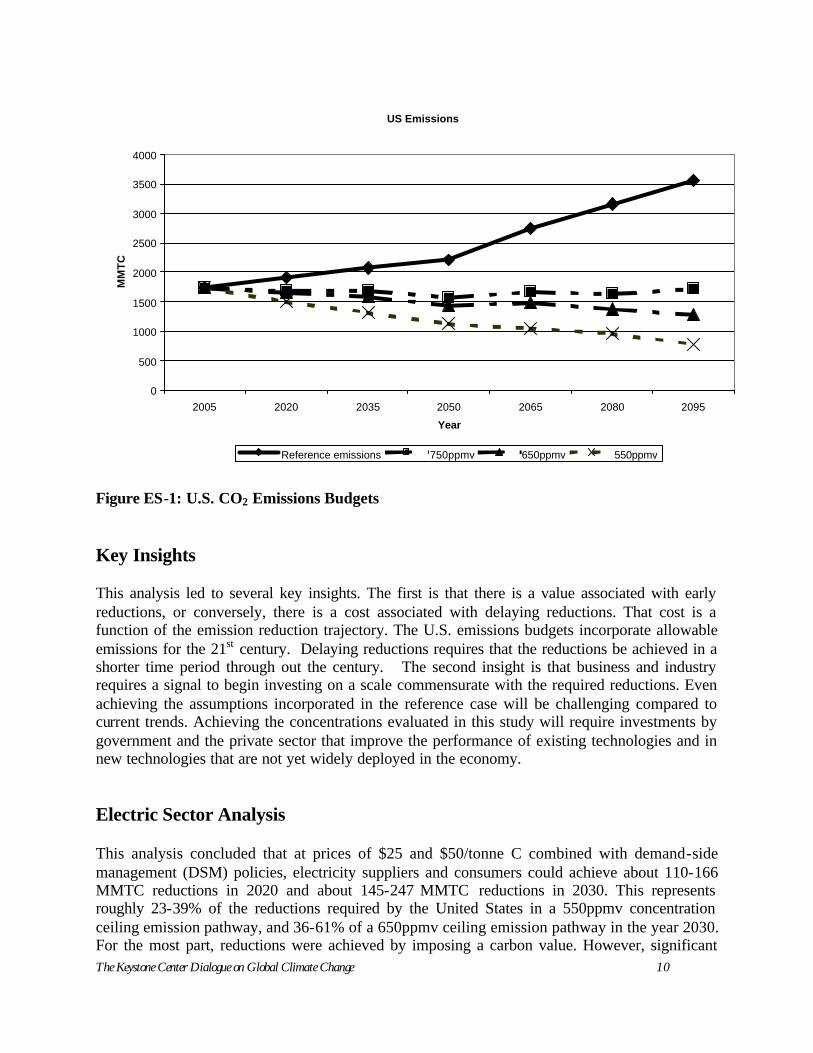
Global and U.S. Reference Case and Budgets The reference case is the assumed level of emissions globally and within the United States that would occur absent policy intervention designed to reduce CO2 emissions. The scenario used to develop the reference case for this analysis assumes rapid economic growth, low population growth, and significant technology development, and focuses on technological change in the energy system. The reference case also incorporates aggressive technology assumptions, including power plant efficiency approaching 60% globally by 2050 and annual energy efficiency improvements on a global basis until 2100. Even with this level of technological improvement, the reference case shows CO2 concentrations increasing to three times pre-industrial levels by the end of the century, or to roughly 725ppmv. The WRE3 emission trajectories were applied to constrain the concentration of CO2 to 450, 550, 650 and 750ppmv. The resulting emission trajectories are treated as the global CO2 emissions budgets for this study and are discussed further in Chapter 3. A more detailed technical note presents them in Appendix B. In establishing the CO2 emissions budgets for each participating country, including the U.S., the global CO2 emissions permits are allocated to those countries participating in the program based upon the rules in Table 3-2. These rules include alternative assumptions regarding developing country participation in an international regime designed to reduce CO2. They assume that China enters an international program to control CO2 emissions beginning in 2020 or 2035 and that other developing countries enter the program when they reach per capita income levels equal to China's at the date it entered the mandatory program. Actual U.S. emissions (and actual emissions in all regions) are determined by applying a carbon value to all energy transactions in the U.S. The resulting emissions budgets for the U.S. (see Figure ES-1) represent the least cost emission reductions required to attain the emission pathways consistent with the range of concentration ceilings studied. This emissions mitigation may lead to emissions levels that are less than, greater than, or equal to the amount of permits allocated according to the rules in Table 3.2. The extent to which actual emissions are less than allocated permits implies international permit sales, while actual emissions that are greater than allocated permits require international purchase of permits. For simplicity, the primary benchmarks used in the report are the 550ppmv and 650ppmv concentration ceilings, assuming China enters in 2035 (rule 3b in Table 3-2). It should be noted that it was virtually impossible to attain the 450ppmv concentration with China entering in 2035, given the benchmark assumptions used in the model for this analysis.
3 Wigley, T.M.L., R. Richels & J.A. Edmonds. 1996. “Economic and Environmental Choices in the Stabilization of Atmospheric CO2 Concentrations,” Nature. 379(6562): 240-243.
The Keystone Center Dialogue on Global Climate Change 10
US Emissions
0
500
1000
1500
2000
2500
3000
3500
4000
2005 2020 2035 2050 2065 2080 2095
Year
MM
TC
Reference emissions 750ppmv 650ppmv 550ppmv
Figure ES-1: U.S. CO2 Emissions Budgets Key Insights This analysis led to several key insights. The first is that there is a value associated with early reductions, or conversely, there is a cost associated with delaying reductions. That cost is a function of the emission reduction trajectory. The U.S. emissions budgets incorporate allowable emissions for the 21st century. Delaying reductions requires that the reductions be achieved in a shorter time period through out the century. The second insight is that business and industry requires a signal to begin investing on a scale commensurate with the required reductions. Even achieving the assumptions incorporated in the reference case will be challenging compared to current trends. Achieving the concentrations evaluated in this study will require investments by government and the private sector that improve the performance of existing technologies and in new technologies that are not yet widely deployed in the economy. Electric Sector Analysis This analysis concluded that at prices of $25 and $50/tonne C combined with demand-side management (DSM) policies, electricity suppliers and consumers could achieve about 110-166 MMTC reductions in 2020 and about 145-247 MMTC reductions in 2030. This represents roughly 23-39% of the reductions required by the United States in a 550ppmv concentration ceiling emission pathway, and 36-61% of a 650ppmv ceiling emission pathway in the year 2030. For the most part, reductions were achieved by imposing a carbon value. However, significant
The Keystone Center Dialogue on Global Climate Change 11
reductions were also achieved through increased DSM and energy efficiency policies. The analysis also suggests that a carbon value alone is not sufficient to achieve reductions but has to be combined with policies directly mandating DSM activities such as conservation or appliance standards. Further, the electric sector analysis quantifies the impact of delaying the start time of the reductions policy and finds that a delay of ten years results in cumulative increase in emissions of roughly 440 million tonnes over what would have been emitted if reductions commenced earlier. This means that in later years the amount of reductions that would need to be achieved would be up 200% of the expected yearly emissions from the electric sector by 2030 in order to stay on the concentration ceiling emission pathways. Fuel switching4 was not found to be a major source of reductions; it accounted for only 3% of the total sector reductions with carbon prices at $50/tonne of carbon. In contrast to several other studies, the Keystone analysis attempts to model investment behavior, and it concludes that high switching costs coupled with price and policy uncertainty make fuel switching a less valuable option for purposes of climate policy than some believe. In contrast, significant reductions are achieved through demand elasticity, the addition of new more efficient generating capacity, DSM, and changes in plant dispatch. The Keystone study also assumes that most existing nuclear capacity is re-licensed and remains on- line in 2030. Emissions from the electric sector grow if carbon emitting fuel sources replaces nuclear capacity. The analysis projects that renewable generation technologies (solar, wind and biomass) play a prominent role in the future capacity additions and in reducing carbon emissions. However, a policy scenario completed for this study shows found that providing additional subsidy for solar and wind technologies does not necessarily result in additional major reduction in emissions from the electric sector in 2030. This is a result of several modeling assumptions that are discussed in Chapter 4. Biologic Sequestration The analysis concludes that biologic sequestration could achieve 94-167 MMTC reductions in 2020 and 112-203 MMTC reductions in 2030 at carbon prices of $25 and 50/tonne and with only a 5-year lag time. This equates with roughly 18-32% of the U.S. share of the reductions required to achieve a 550ppmv concentration ceiling emission pathway, and roughly 28-50% of the U.S. share of reductions required in these timeframes to achieve a 650ppmv ceiling emission pathway in 2030. The study suggests that biologic sequestration could be an important bridging strategy since the relatively short-term reductions could help to “buy time” while new lower and non-emitting technologies are developed and deployed. Despite this optimistic view of biologic sequestration in a concentration strategy, there are issues that warrant attention. For example, at some point, there will be diminishing carbon sequestration returns as trees reach saturation points. Further, leakage and permanence issues must be addressed and factored into the calculated sequestration benefits. The workgroup also noted that conservation of tropical forests is potentially an additional source of reductions that could also provide significant ancillary benefits, although the study did not quantify these benefits.
4 Fuel switching in this sense means the actual repowering of a generator with a new fuel and not merely displacement through changes in dispatch.
The Keystone Center Dialogue on Global Climate Change 12
Energy Intensive Manufacturing Analysis This analysis used the AMIGA model to examine a subsector of the manufacturing sector that lies within the main SIC code for the industrial sector. In this study, seven sectors were aggregated into the energy intensive manufacturing analysis: Petroleum Refining; Iron and Steel; Aluminum; Chemicals; Pulp and Paper; Chlorine and Chlorates; and Stone, Clay and Glass. In the model, this sector achieved 40-52 MMTC reductions in 2020 and 58-71 MMTC reductions in 2030 under carbon prices of $25 and $50 per tonne and policies that encouraged the development of new technologies. This amount is roughly 9-11% of the U.S. share of reductions required to achieve a 550ppmv concentration ceiling emission pathway and roughly 14-18% of reductions to achieve a 650ppmv ceiling emission pathway in 2030. This sector was difficult to model in large part because of the diversity of economic activity that these sectors represent. Yet, developing separate models for each industry would have been prohibitively expensive in terms of cost and time. Another challenge in reviewing this sector is in assessing the true impact of leakage. Industry experience provided anecdotal evidence of the impacts of a carbon price on reductions from this sector. Several believe that leakage will result when production of energy intensive goods in countries without emissions limitations displaces production of the same goods in countries that have imposed emissions limitations. Passenger Autos The analysis used a market-driven model to establish a business as usual case for this sector and to explore the impact of carbon prices and various policies on consumer preferences for lower-emitting vehicles. In general, the model showed that carbon prices of $25 and $50/tonne carbon alone induced minimal reductions. However, the introduction of policies with larger incentives (including a fuel tax and subsidies designed to facilitate demand for hybrid electric vehicles (HEVs)) increased the level of reductions. Some dialogue participants suggested changes to the model that, short of changing the model’s underpinnings, would change the baseline case including: (1) baseline emissions; (2) the timing of reductions; and (3) the mix of available technology. Some participants believe that these changes would have resulted in greater reductions than those shown in the model that was utilized, although they would not have changed the basic finding that the carbon price signals considered were not sufficient alone to induce significant emission reductions. The Dialogue was unable to make these changes due to resource constraints. Thus, technical staff did not undertake further work on the analysis. Because of the level of concern about the model inputs and results, and inability to undertake further analysis, the Dialogue is not including the emissions reductions for the passenger automobile sector study in the integrated policy analysis. Instead, it recognizes the potential for significant reductions from the automobile sector and believes that further work is necessary to determine the reductions that may be achieved.
The Keystone Center Dialogue on Global Climate Change 13
Integration of Sector Studies The study assessed the reductions to be achieved within each sector and also reviewed the cumulative reductions that could be achieved by integrating the results of the sector studies. Two illustrative sets of integrated policies were developed, although neither represents a recommendation by the Dialogue. The first set was the modest case and represented the reductions achieved by applying a $25/tonne carbon value across all sectors along with some policies to achieve DSM. This first policy set achieved reductions of 265 MMTC in 2020 and 370 MMTC in 2030. This represents 59% of the U.S. share of reductions to achieve a 550ppmv concentration ceiling emission pathway, and 92% of reductions to achieve a 650ppmv ceiling emission pathway in 2030. The aggressive case represented the reductions achieved by applying a $50/tonne carbon charge across all the sectors along with the additional DSM policies. This second set achieved reductions of 354 MMTC in 2020 and 530 MMTC in 2030. This represents 84% of the U.S. share of reductions to achieve a 550ppmv concentration ceiling emission pathway and 131% of reductions to achieve a 650ppmv ceiling emission pathway in 2030. Conclusions One can draw several primary conclusions from this study.
A. Significant emission reductions from the reference case are required globally and by the United States at key points in time in order to achieve virtually every concentration ceiling pathway studied.
B. Reference case projections already contain aggressive assumptions regarding improvements in efficiency and global technological performance. Therefore, achieving assumptions incorporated in the reference case requires significant progress from current U.S. and global trends.
C. The results of this study show that the United States can achieve approximately 60% of reductions required to achieve its share under a 550ppmv concentration ceiling emission pathway in 2030 and about 90% of the reductions required to achieve the 650ppmv ceiling emission pathway in 2030 by applying a carbon value of $25/tonneC ($6.20/ton CO2).
D. The results of this study show that by applying a carbon value of $50/tonne C ($12.40/ton CO2), the United States can achieve more than 85% of the reductions required to achieve its share under a 550ppmv concentration ceiling emission pathway in 2030 and about 130% of the reductions required to achieve the 650ppmv ceiling emission pathway in 2030.
E. Companies need a signal that emissions will be limited before they will begin significant investment in new efforts to reduce emissions. If emissions growth needs to significantly slow and even decline by the 2020-2030 timeframe in order to achieve cost-effective stabilization, investments will need to begin soon in order for the United States to realize the reductions in that timeframe.
F. Most of the emission reductions estimated in this study to occur by 2030 are the result of refinement and deployment of existing technologies. However, achievement of the even larger reductions required after 2030 will require significant technology breakthroughs.

The Keystone Center Dialogue on Global Climate Change 14
G. Both the electric sector (primarily through greater efficiencies in electricity use, dispatch changes and new lower emitting capacity additions) and biologic sequestration could provide significant sources of reductions; other sectors could also potentially provide significant reductions and warrant further study.
The Keystone Center Dialogue on Global Climate Change 15
LIST OF ABBREVIATIONS AND ACRONYMS BAU business as usual CFCs Chlorofluorocarbons CH4 methane CO2 carbon dioxide CO2e carbon dioxide equivalent DSM demand side management EIM Energy Intensive Manufacturing ghg greenhouse gas GDP Gross Domestic Product HEVs hybrid electric vehicles HFCs Hydrofluorocarbons IGCC integrated gasification combined cycle IPCC Intergovernmental Panel on Climate Change MMTC million metric tons of carbon MPG miles per gallon MTC metric tones of carbon N2O nitrous oxide NERC National Electric Reliability Council NGOs non-governmental organizations PFCs Perfluorocarbons ppmv parts per million volume R&D research and development SRES Special Report on Emissions Scenarios SO2 sulfur dioxide SF6 Sulfur hexafluoride SUVs sport utility vehicles UNFCCC United Nations Framework Convention on Climate Change WRE Wigley, Richels and Edmonds A Note On Units: Except in the few places where both forms are used, this document uses the convention of reporting in metric tonnes of carbon rather than short tons of CO2. In a few cases the conversion is provided in short tons of CO2 in brackets for the readers’ convenience. For reference:
1 Metric Tonne of Carbon (MTC) = 4.03 Short Ton of CO2 (TCO2) and $1/MTC = 0.25 $/TCO2 $25/MTC = $6.20/TCO2 $50/MTC = $12.40/TCO2 480 MMTC = 1,936 million TCO2 640 MMTC = 2,581 million TCO2

The Keystone Center Dialogue on Global Climate Change 16
The Keystone Center Dialogue on Global Climate Change 17
CHAPTER 1 INTRODUCTION
he Keystone Dialogue on Global Climate Change was convened in October 2000 to provide a forum for representatives of the key emitting sectors, non-governmental organizations (NGOs) and public policy experts to explore: (1) the quantities of carbon
dioxide (CO2)5 emissions that could be emitted globally and by the United States during the 21st century consistent with achieving alternative concentrations of CO2 in the atmosphere; and (2) potential policies to reduce emissions to those levels. This study also aims to assist Dialogue participants and policy makers to understand the level of reductions from the reference case estimates used for the Dialogue’s analysis that will be required to achieve alternative concentration ceilings at varying points during the 21st century. Stabilization of atmospheric concentrations necessary to prevent dangerous anthropogenic interference with the climate system is the primary environmental objective incorporated into the United Nations Framework Convention on Climate Change (UNFCCC), an international agreement that has entered into force. The Dialogue’s emphasis on the UNFCCC and its stabilization objective was a specific decision made by project participants, as it requires a focus on the century scale nature of the climate change problem. The objective of the UNFCCC, stabilizing the concentrations of CO2 and other greenhouse gases (ghg), is not the same as stabilizing CO2 emissions. Because emissions accumulate in the atmosphere and persist for long periods of time, the concentration of CO2 will continue to rise for several hundred years even if emissions are held at current levels or slightly reduced. In fact, global CO2 emissions are projected to increase significantly over the remainder of this century. Thus, without action to reduce emissions, atmospheric concentrations of CO2 are projected to increase over time. The UNFCCC process has not yet specified a particular target concentration that would prevent dangerous anthropogenic interference with the climate system. However, most of the international debate is focused on CO2 concentration ceilings that range from 450 parts per million volume (ppmv) to 750ppmv. Thus, these concentration ceilings have been the basis of the Dialogue’s analysis. In order to stabilize concentrations at any level in this range, significant emission reductions from the reference case would be required during the course of the 21st century.
5 Note: this paper focuses on CO2 concentrations rather than CO2 equivalencies.
TThe Dialogue’s emphasis on the UNFCCC and its stabilization objective was a specific decision made by project participants …
The Keystone Center Dialogue on Global Climate Change 18
In order to focus on the long-term nature of the climate problem, participants agreed to the following objectives for the Dialogue: w Jointly explore the magnitude and timing of global emission reductions from reference
case estimates required to achieve stabilization of CO2 in the atmosphere. w Determine the magnitude and timing of the reductions from the reference case estimates
required by the United States in a global effort to stabilize concentrations under alternative international emission allowance sharing arrangements.
w Evaluate the policy options that could be utilized to achieve these reductions.
w Provide decision-makers with guidance on how key variables (public policies, carbon
prices) affect the investment decisions of key economic sectors. The Dialogue’s analyses and deliberations were focused on building understanding around the global and U.S. emissions budgets in the 21st century necessary to achieve atmospheric stabilization. Once the reductions from the reference case estimates were understood, Dialogue participants agreed to review public policies and CO2 values on a per tonne basis that could affect the investment decisions of four key emitting areas including: (1) electric generation and use (including demand side management); (2) biologic sequestration; (3) energy intensive manufacturing; and (4) passenger automobiles. These areas were selected for analysis because they represent approximately 75% of U.S. ghg emissions and 80% of the U.S. CO2 emissions. The purpose of understanding the dynamics that affect decisions in the key sectors is to provide participants with sufficient information to reduce uncertainty surrounding the climate issue. This could allow for the development of investment strategies and compatible public policies that facilitate the reduction of CO2 emissions in an economically sustainable fashion. This Keystone Dialogue on Global Climate Change is unique for both its focus on long-term analyses of the effort required by the United States within a global context to achieve atmospheric stabilization and the fact that it is driven by diverse stakeholders involved in the climate policy debate. Chapter Two of this report describes the process that was undertaken to manage the Dialogue and identifies participants. Chapter Three presents the derivation of the global and U.S. reference cases and emission budgets. Chapter Four presents the sector studies and of biologic sequestration. Chapter Five presents conclusions. In addition, there are several appendices including a detailed technical note describing the modeling used to develop estimates in Chapter Three.
The Keystone Center Dialogue on Global Climate Change 19
CHAPTER 2 DESCRIPTION OF DIALOGUE PROCESS
The Keystone Center Since 1975, the Keystone Center, a non-profit 501(c)(3) organization, has worked to enable leaders from government, the public, non-governmental organizations, and industry, as well as technical experts to collaboratively explore productive ways of addressing controversial and complex issues, and build consensus for creative action. Keystone’s mission is to foster critical thinking and problem solving through education, analysis, and dialogue with all segments of civil society. Headquartered in Keystone, Colorado, the organization was founded with the intention of developing and implementing a way of resolving disputes that arose from the National Environmental Policy Act (NEPA). It has since moved into the policy areas of energy, the environment and public health. Its staff includes mediators, business professionals and others with training in related fields such as environmental science and public policy.
Description of Process The Keystone Dialogue on Global Climate Change was convened in October of 2000 and conducted four plenary sessions. Several study groups implemented the work plan recommended by the plenary sessions. The key substantive and procedural attributes of this Dialogue are that it: w Is focused on achieving the long-term environmental objectives of the UNFCCC, an
international environment agreement ratified by the U. S. Senate and that has entered into force;
w Is driven by analysis that details the global emissions reductions required from the reference case necessary to stabilize atmospheric concentration of CO2 in the atmosphere;
w Identifies the emissions reductions required by the United States from the reference case in a global effort to stabilize concentrations under alternative international emission allowance sharing arrangements;
w Identifies and analyzes some key policies available to achieve those reductions; w Begins to identify how carbon values or prices affect decisions in the key sectors; w Separates policy prescription from analysis; w Builds on the research already conducted within the sectors/organizations; w Utilizes a structured process with neutral facilitators and technical experts; w Includes a range of perspectives from key stakeholder groups; and w Requires that group recommendations have the support of all participants.
[The report] identifies the emissions reductions required by the U.S. from the reference case in a global effort to stabilize concentrations under alternative emission allowance sharing arrangements.
The Keystone Center Dialogue on Global Climate Change 20
The plenary sessions were held on: w October 5 & 6, 2000 w April 17 & 18, 2001 w February 21 & 22, 2002 w November 6 & 7, 2002
Study Groups were established to oversee the Dialogues’ analyses. The groups met several times throughout the process to (1) frame and review the analyses regarding atmospheric concentrations that were the basis of the Dialogue’s work; and (2) oversee the individual sector analyses. The Study Groups received direction from the full Dialogue Group. Study Groups w Policy Sets/Carbon Values/Integration w Electricity Generation and DSM w Energy Intensive Industries w Sequestration w Automobiles w Public Outreach w Decision Criteria
Participants in The Keystone Center’s Dialogue on Global Climate Change The group involved in the Keystone Dialogue on Global Climate Change includes representatives from the key emitting sectors, non-governmental organizations, and other significant parties and organizations engaged in the debate on climate change policy. Dialogue participants are leaders in their organizations and recognized experts in their fields. Participating organizations have played prominent roles in national and international efforts to address climate change related issues. They include:
Industry
Alcan, Inc. American Electric Power BP America, Inc. Cummins, Inc. DuPont PSE&G Toyota Wisconsin Energy ENGO’s Natural Resources Defense Council Union of Concerned Scientists
The Keystone Center Dialogue on Global Climate Change 21
Other Organizations Interested in Climate Change Policy Battelle CO2E.com EPRI Natsource LLC Office of the U.S. Global Change Research Program Stratus Consulting Van Ness Feldman, P.C. Foundations The Energy Foundation The Turner Foundation Technical Assistance The organizations that follow provided the technical analyses to implement the Dialogues’ work plan. The Charles Clark Group – Technical Lead for the Dialogue Argonne National Laboratory Charles River Associates Department of Agricultural Economics, Texas A&M University EPRI Global Energy Partners, LLC Natsource LLC – Lead Facilitator Onward Associates Pacific Northwest National Laboratory/Battelle Richard Smallwood, Modeling Consultant Standard and Poor’s, Applied Decision Analysis A detailed list of staff, participants and technical consultants is included in Appendix A.
Funding The Keystone Center is a non-profit organization under section 501(c)(3) of the Internal Revenue Code. It raises funds to support all aspects of its work. The Keystone Center strives to achieve balance in funding from charitable foundations, government, corporations and other sources. For this project roughly half of the funding was received from charitable foundations and the remaining half from private corporations. In addition, the project enjoyed significant in-kind contributions including a large amount of modeling work and subject area expertise. The Keystone Center is grateful for these generous contributions.
The Keystone Center Dialogue on Global Climate Change 22
In order to achieve stabilization at any ceiling, we need to slow the growth of CO2 emissions and then achieve absolute reductions from the reference case…
CHAPTER 3 ANALYSIS OF REFERENCE CASES AND EMISSION
BUDGETS
ialogue participants agreed to review the quantities of reductions from the reference case required globally and by the United States to achieve 450-750ppmv concentration ceilings
and the carbon prices necessary to achieve those reductions. The reductions and emissions budgets necessary to achieve the 450-750ppmv ceilings would be determined on a global basis and then the reductions required by the United States under alternative international emission allowance sharing arrangements would be calculated. It is important to note that there are several alternative international emission allowance sharing arrangements that could be utilized to undertake this analysis. This analysis’ selection of one is not intended as a prediction or recommendation but rather was selected to solely to provide a benchmark for analysis of the sectors. The analysis is based on use of the MiniCAM model, which is a long-term, global, market equilibrium model of energy, agriculture, land-use, and economy interactions. Results of this model have been included extensively in the Intergovernmental Panel on Climate Change (IPCC) assessments; IPCC is the lead international scientific body assessing climate change. A Technical Note in Appendix B presents detailed information on the construction of the model and the assumptions that are included in the runs used for the Keystone Study. A brief summary of those assumptions is included here for the reader’s reference. The “Keystone analysis” uses scenario A1G from the new Special Report on Emissions Scenarios 6 (SRES) as a point of reference, or the reference case, for emissions of CO2 in the absence of policies to stabilize the concentration of CO2 in the atmosphere. All SRES scenarios were based on the assumption that no policies are adopted to specifically address climate change. The A1 scenario family describes a future world of very rapid economic growth, low population growth, and the rapid introduction of new and more efficient technologies. Major underlying themes are convergence among regions, capacity building and increased cultural and social interactions, with a substantial reduction in regional differences in per capita income. The A1 scenario family develops into four groups that describe alternative directions of technological change in the energy system. This study uses group or storyline G within the A1 family of scenarios.
6 Nakicenovic, N., et al. 2000. Special Report on Emissions Scenarios. Cambridge University Press, Cambridge, United Kingdom.
D
The Keystone Center Dialogue on Global Climate Change 23
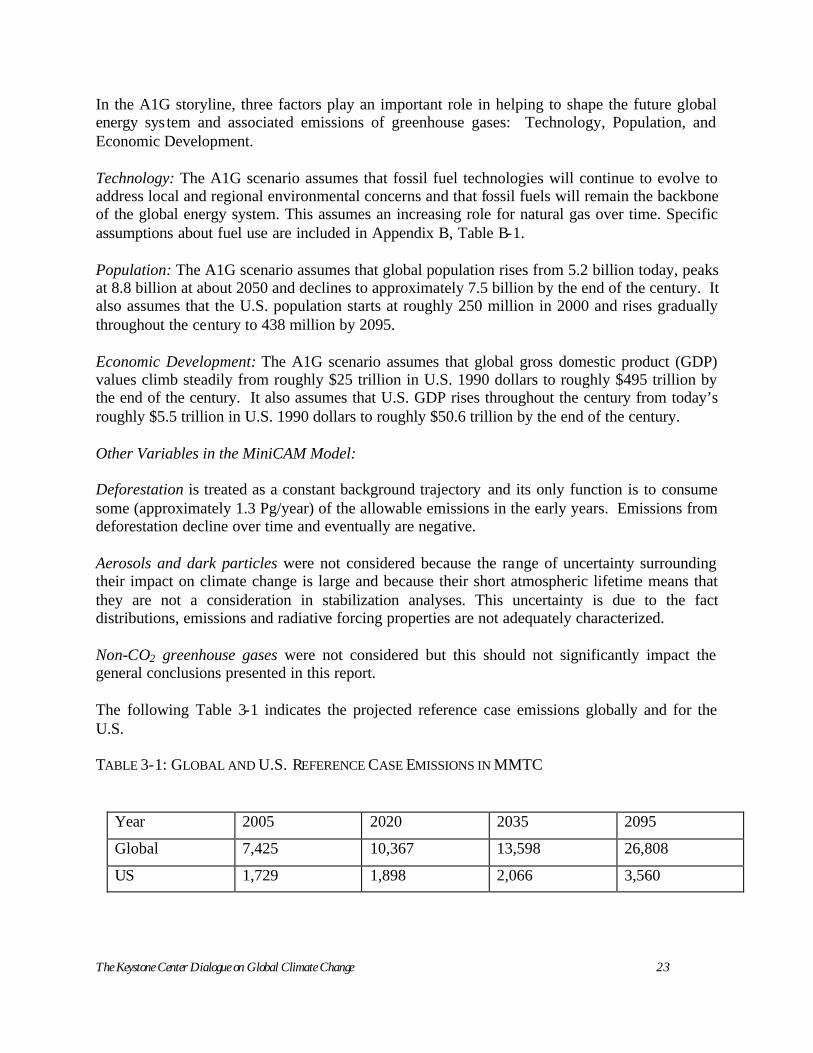
In the A1G storyline, three factors play an important role in helping to shape the future global energy sys tem and associated emissions of greenhouse gases: Technology, Population, and Economic Development. Technology: The A1G scenario assumes that fossil fuel technologies will continue to evolve to address local and regional environmental concerns and that fossil fuels will remain the backbone of the global energy system. This assumes an increasing role for natural gas over time. Specific assumptions about fuel use are included in Appendix B, Table B-1. Population: The A1G scenario assumes that global population rises from 5.2 billion today, peaks at 8.8 billion at about 2050 and declines to approximately 7.5 billion by the end of the century. It also assumes that the U.S. population starts at roughly 250 million in 2000 and rises gradually throughout the century to 438 million by 2095. Economic Development: The A1G scenario assumes that global gross domestic product (GDP) values climb steadily from roughly $25 trillion in U.S. 1990 dollars to roughly $495 trillion by the end of the century. It also assumes that U.S. GDP rises throughout the century from today’s roughly $5.5 trillion in U.S. 1990 dollars to roughly $50.6 trillion by the end of the century. Other Variables in the MiniCAM Model: Deforestation is treated as a constant background trajectory and its only function is to consume some (approximately 1.3 Pg/year) of the allowable emissions in the early years. Emissions from deforestation decline over time and eventually are negative. Aerosols and dark particles were not considered because the range of uncertainty surrounding their impact on climate change is large and because their short atmospheric lifetime means that they are not a consideration in stabilization analyses. This uncertainty is due to the fact distributions, emissions and radiative forcing properties are not adequately characterized. Non-CO2 greenhouse gases were not considered but this should not significantly impact the general conclusions presented in this report. The following Table 3-1 indicates the projected reference case emissions globally and for the U.S. TABLE 3-1: GLOBAL AND U.S. REFERENCE CASE EMISSIONS IN MMTC
Year 2005 2020 2035 2095
Global 7,425 10,367 13,598 26,808
US 1,729 1,898 2,066 3,560
The Keystone Center Dialogue on Global Climate Change 24
Analysis of International Emission Allowance Sharing This study examined issues that surround the stabilization of alternative concentrations of CO2. Stabilization of the concentration of greenhouse gases is the goal of the UNFCCC. The study examined alternative concentrations of CO2 including 450, 550, 650 and 750ppmv. The dialogue did not make a judgment regarding the appropriate concentration ceiling. Emissions trajectories published in Wigley, Richels and Edmonds7 (WRE) were utilized to constrain the concentration of greenhouse gases to 450, 550, 650 or 750ppmv. Five hypothetical policy agreements, or rules, were examined that could limit emissions along WRE emissions paths. These are displayed in Table 3-2:
TABLE 3-2: HYPOTHETICAL INTERNATIONAL EMISSION ALLOWANCE SHARING AGREEMENTS
1. Global, common carbon tax, all countries participating from the beginning
2. Historical emissions 2000, with allocations adjusted for economic growth, all countries participating from the beginning
3a. Historical emissions 2000, with allocations adjusted for economic growth, Annex I countries lead, China follows in 2020, other countries follow when they reach China’s year 2020 income per capita
3b. Historical emissions 2000, with allocations adjusted for economic growth, Annex I countries lead, China follows in 2035, other countries follow when they reach China’s year 2035 income per capita
4. Equal per capita emissions 2000, all countries participating from the beginning
The five policy regimes use one of two policy mechanisms, either a carbon tax or a tradable permit system. Each was implemented as an idealized system. This means that they achieve least-cost reductions. In establishing the CO2 emissions budgets for each participating country, including the U.S., the global CO2 emissions permits are allocated to those countries participating in the program based upon the rules in Table 3-2. In the analysis undertaken in the Dialogue, it is assumed that all regions require permits for CO2 emissions. A global carbon permit market is also assumed. This value of carbon is assumed to be communicated to economic agents in the region through a carbon emission fee or a domestic emission permit system. Thus, emitters will limit emissions to the level where the cost of mitigation equals the international value of CO2.
7 Wigley, T.M.L., R. Richels & J. A. Edmonds. 1996. "Economic and Environmental Choices in the Stabilization of Atmospheric CO2 Concentrations," Nature. 379(6562):240-243.
The Keystone Center Dialogue on Global Climate Change 25
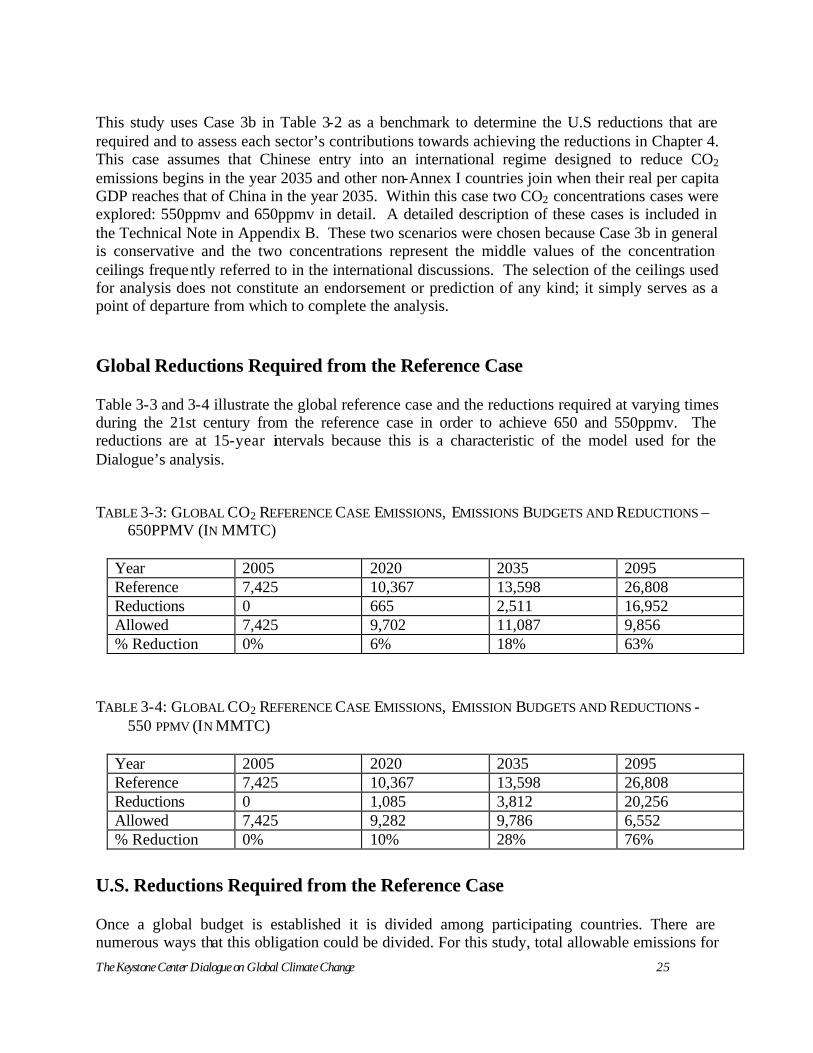
This study uses Case 3b in Table 3-2 as a benchmark to determine the U.S reductions that are required and to assess each sector’s contributions towards achieving the reductions in Chapter 4. This case assumes that Chinese entry into an international regime designed to reduce CO2 emissions begins in the year 2035 and other non-Annex I countries join when their real per capita GDP reaches that of China in the year 2035. Within this case two CO2 concentrations cases were explored: 550ppmv and 650ppmv in detail. A detailed description of these cases is included in the Technical Note in Appendix B. These two scenarios were chosen because Case 3b in general is conservative and the two concentrations represent the middle values of the concentration ceilings frequently referred to in the international discussions. The selection of the ceilings used for analysis does not constitute an endorsement or prediction of any kind; it simply serves as a point of departure from which to complete the analysis. Global Reductions Required from the Reference Case Table 3-3 and 3-4 illustrate the global reference case and the reductions required at varying times during the 21st century from the reference case in order to achieve 650 and 550ppmv. The reductions are at 15-year intervals because this is a characteristic of the model used for the Dialogue’s analysis.
TABLE 3-3: GLOBAL CO2 REFERENCE CASE EMISSIONS, EMISSIONS BUDGETS AND REDUCTIONS – 650PPMV (IN MMTC)
Year 2005 2020 2035 2095 Reference 7,425 10,367 13,598 26,808 Reductions 0 665 2,511 16,952 Allowed 7,425 9,702 11,087 9,856 % Reduction 0% 6% 18% 63%
TABLE 3-4: GLOBAL CO2 REFERENCE CASE EMISSIONS, EMISSION BUDGETS AND REDUCTIONS -
550 PPMV (IN MMTC)
Year 2005 2020 2035 2095 Reference 7,425 10,367 13,598 26,808 Reductions 0 1,085 3,812 20,256 Allowed 7,425 9,282 9,786 6,552 % Reduction 0% 10% 28% 76%
U.S. Reductions Required from the Reference Case Once a global budget is established it is divided among participating countries. There are numerous ways that this obligation could be divided. For this study, total allowable emissions for
The Keystone Center Dialogue on Global Climate Change 26
participating parties were equal to the global budget less the emissions from the non-participating countries. For example, assume that global allowable emissions in some year are 3,000 tonnes, and that non-participating countries emit 1,000 tonnes. In this case, the emissions to be divided among participating parties are equal to 2,000 tonnes (3,000 tonnes -1,000 tonnes). It is important to note that if non-participants’ emissions are too large, it becomes impossible for participants to limit global emissions to the trajectories described in Tables 3-3 and 3-4. For convenience, this study uses the case where China enters in 2035 followed by other non-participating countries as the benchmark for detailed comparisons. In this case, it is not possible to attain the 450ppmv trajectory, given the constraints of the MiniCam model. To complete the process of establishing the U.S. emission budgets within the 650 and 550ppmv ceilings, the concepts of emissions allowances and emissions claims require definition. Emissions allowances are the emissions of CO2 allocated to each region, and which can be sold or purchased depending on actual emissions. Emissions claims are used to derive emissions allowances. A region’s claim is computed by taking its GDP for that year (in real terms) and multiplying it by the emissions intensity (C/GDP) for the year in which that region began mitigation. Assume that U.S. energy intensity is 0.4 and that GDP is 5000, then its claims total 2,000. If total claims by all regions amount total 10,000, then the U.S. share of claims would be 0.2 = 2,000/10,000 = (the U.S. claim)/(total claims) or 20%. The share of U.S. claims is applied to total allowable emissions to compute the U.S. emissions allowance or budget. Following the example from above, this means that of the 2,000 emissions allowances to be divided among mitigating parties, the U.S. would receive 20% or 400=0.2 x 2,000.
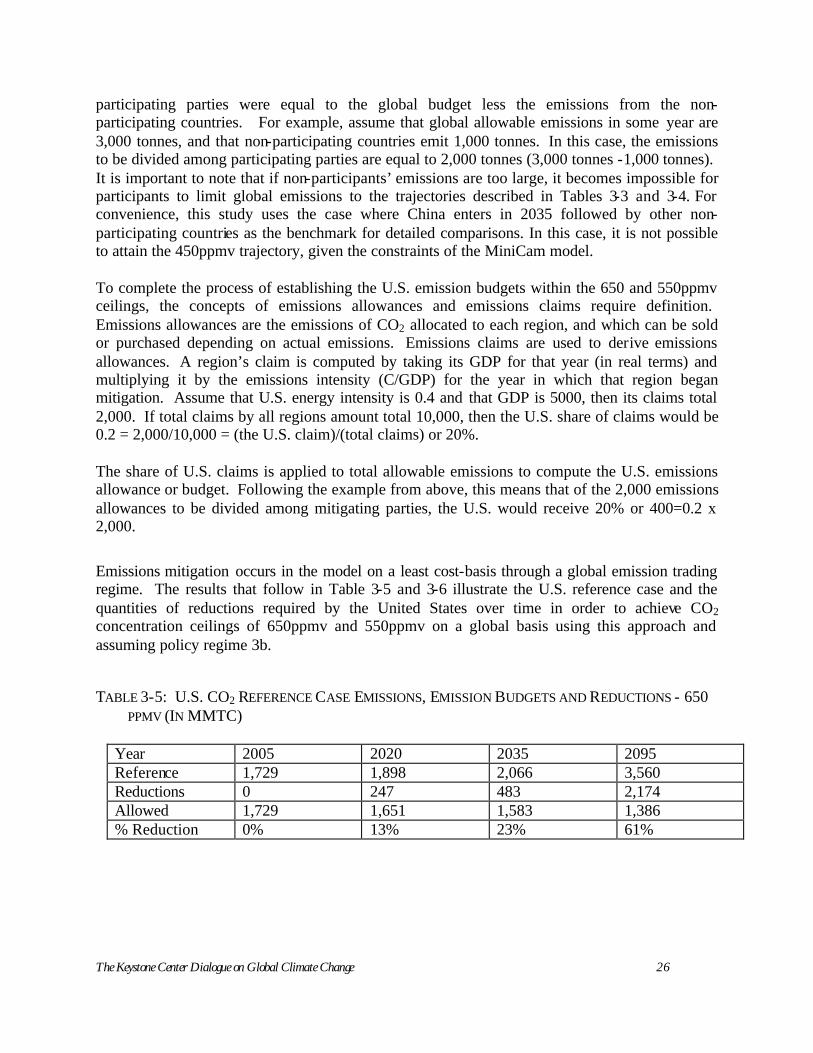
Emissions mitigation occurs in the model on a least cost-basis through a global emission trading regime. The results that follow in Table 3-5 and 3-6 illustrate the U.S. reference case and the quantities of reductions required by the United States over time in order to achieve CO2 concentration ceilings of 650ppmv and 550ppmv on a global basis using this approach and assuming policy regime 3b.
TABLE 3-5: U.S. CO2 REFERENCE CASE EMISSIONS, EMISSION BUDGETS AND REDUCTIONS - 650 PPMV (IN MMTC)
Year 2005 2020 2035 2095 Reference 1,729 1,898 2,066 3,560 Reductions 0 247 483 2,174 Allowed 1,729 1,651 1,583 1,386 % Reduction 0% 13% 23% 61%
The Keystone Center Dialogue on Global Climate Change 27
TABLE 3-6: U.S. CO2 REFERENCE CASE EMISSIONS, EMISSION BUDGETS AND REDUCTIONS - 550 PPMV (IN MMTC)
Year 2005 2020 2035 2095 Reference 1,729 1,898 2,066 3,560 Reductions 0 401 748 2,781 Allowed 1,729 1,497 1,318 779 % Reduction 0% 21% 36% 78%
These results are presented graphically in Figure 3-1.
U.S. Emissions Budgets
0
500
1000
1500
2000
2500
3000
3500
4000
2005 2020 2035 2050 2065 2080 2095
Year
MM
TC
Reference 650ppmv 550ppmv
Figure 3-1 U.S. Emission Budgets
The Keystone Center Dialogue on Global Climate Change 28
Discussion of Results Time Value of Carbon: There are economic costs to stabilizing concentrations of CO2 in the atmosphere. However, there are also economic and environmental costs to inaction. In order to achieve stabilization at any ceiling evaluated in this study, the growth of CO2 emissions must be slowed and then be reduced on an absolute basis from the reference case in order to achieve an emissions budget that correlates to the concentration ceilings studied. If CO2 emissions continue to grow unabated, then the amount of emissions that needs to be reduced will increase and the reductions will need to be achieved within a shorter period of time. As a result, it will be more costly to achieve stabilization.
Based upon the ceiling and pathway ultimately selected, and the timeframe for reductions, it could be more cost-effective for the U.S. economy to achieve an emissions budget consistent with a concentration ceiling if policy-makers begin reductions sooner and provide firms with adequate lead times to plan their investments in processes, technologies and production to achieve necessary emission reductions. Such lead times would likely allow the United States to get on a glide path to achieve the reductions in a non-disruptive fashion. It will be more expensive for the economy to achieve an emissions budget consistent with a concentration ceiling if reductions were delayed and rapid and precipitous reductions were required later. Such an approach would likely lead to investments in capital stock that might subsequently have to be retired prematurely, increasing costs.
Continued emissions growth may also foreclose the achievement of alternative concentration ceilings necessary to prevent dangerous anthropogenic interference with the climate system. Some believe that the United States would not be able to live within emissions budgets consistent with a 450ppmv ceiling. The Technical Note in Appendix B shows that under various international emission allowance sharing assumptions, it would be necessary for the United States (and other countries) to start achieving reductions from the reference case emissions in 2005 in order to achieve the 450ppmv concentration ceiling. If developing country participation is delayed beyond a certain date, it would be impossible to stabilize concentrations at 450ppmv within the constraints of the MiniCam model.
Challenging Assumptions in Reference Case
The data in Tables 3-5 and 3-6 illustrate the U.S. CO2 reductions from the projected reference case emission levels necessary to achieve emissions budgets that correlate to concentration ceilings emission pathways for 550ppmv and 650ppmv. Based on this finding, one can conclude that it will be a challenge for the United States to get on a pathway consistent with stabilization. The challenge will be more or less difficult depending upon the concentration level ultimately selected. The challenge becomes clearer when the technological assumptions that are incorporated in the reference case are considered. Technology assumptions incorporated in the A1G (reference case) scenario assume aggressive technological improvement from current levels. Thus, significant investment and technological breakthroughs are required in order to achieve the emission levels incorporated in the base case. Some of the assumptions incorporated in the base case follow.
The Keystone Center Dialogue on Global Climate Change 29
• 57 % of total energy needs in 2100 will be supplied from fossil fuels—down from 88% in 1995.
• Biomass energy in 2100 will be used at a scale that exceeded total global energy use in 1975.
• 75% of electricity in 2100 will be generated from non-emitting sources compared to roughly 33% in 1995.
• Power plant efficiency will approach 60% on a global basis by 2050 • The fuel efficiency of the global transportation fleet will improve dramatically by 2050 • End-use efficiency in all sectors and regions will improve annually on a global basis
through the end of the century. The reference case incorporates major improvements in technology that require significant research success and a fundamental shift in the energy system towards carbon-free fuels. Under the reference case, technology will allow for the creation of increased economic output with reduced levels of energy and improved carbon performance. However, the other variables that affect CO2 emission levels (population growth, per capita economic growth) have a major impact on CO2 emissions. Even with improvements in technological performance built into the reference case, increases in population growth and economic activity swamp the improvements in energy and carbon intensity resulting in significantly higher emissions and concentrations by the end of the 21st century. Under the reference case, global emissions increase from roughly 6.0 billion tonnes of carbon in 1990 to over 26.8 billion tonnes by the end of the century. Carbon dioxide concentrations increase from approximately 400ppmv in 2010 to approximately 725ppmv in 2100. This represents an increase to nearly three times pre- industrial levels. There is a gap between the technologies that are anticipated to come into use under the A1G scenario and those required for stabilization at any level below 725ppmv. This means that achieving a ceiling of 725ppmv will require significant technological improvement. Achieving any of the three ceilings below 725ppmv that have been used for analysis in the Dialogue will require new technologies (or gap technologies) that are not yet in widespread use in the economy.
The Keystone Center Dialogue on Global Climate Change 30
CHAPTER 4 SECTOR STUDIES
ignificant emission reductions can be achieved with carbon values of $25 and $50/tonne. This conclusion is based on the outcomes of this study in which the Dialogue agreed to
analyze four key sectors to determine the CO2 reductions that could be achieved by alternative public policies and carbon values. The Dialogue’s sector studies focused on four emission and emission reduction sectors as well as a separate discussion on DSM:
(1) electricity (a) generation; (b) DSM;
(2) biologic sequestration; (3) energy intensive manufacturing; and (4) passenger automobiles.
These sectors were selected for analysis because: (1) they represent approximately three quarters of total U.S. CO2 emissions 8; (2) the macroeconomics of these sectors has been studied; and (3) there is widespread experience with policy tools to reduce emissions from these sectors. About one quarter of the total U.S. ghg inventory was left out of the Dialogue 9. These include emissions from non-CO2 gas emitting sources (e.g., sources of CH4, N2O, HFCs, PFCs and SF6), commercial transportation, and residential and commercial housing and office stock not associated with electricity use. The Dialogue focused on CO2 because it represents such a large portion of national ghg emissions and has a significant impact on atmospheric concentration levels over the course of a century. It is likely that additional cost-effective reductions are available for the remaining approximately 25% of the national inventory. This is an issue that warrants further analysis. As described in Chapter Two, work was completed on these sector studies through individual work groups. Participation in each group was open to members of the Dialogue and actual participation is described in Appendix A. This chapter includes six sections. The first five present the sector analyses with the electric sector split into generation and DSM. Although each analysis is different, there are certain consistencies between them. Each develops a “business as usual” (BAU) case10 for the sector and
8 Based on review of Table ES-1: Recent Trends in U.S. Greenhouse Gas Emissions and Sinks, Inventory of US Greenhouse Gas Emissions and Sinks, 1990-1999, US EPA, April 2001. 9 Ibid. 10 Chapter Three developed reference cases for total allowable CO2 emissions. The BAU case for each sector is independent of the reference cases and serves as a benchmark against which to measure reductions from each sector or area.
S
Significant emission reductions can be achieved with carbon values of $25 and $50/
The Keystone Center Dialogue on Global Climate Change 31
then attempts to quantify the emissions reductions achieved from each sector in 2020 and 2030 based upon carbon prices of $25 and $50/tonne or policies that achieve reductions at comparable costs or levels of difficulty. The reductions to be achieved as a result of these prices and policies will ultimately be compared to the U.S. emission budgets developed in the reference cases in Chapter Three. Each sector study also explores factors affecting the timing of reductions. Finally, each study attempts to describe, if not quantify, full potential reductions over time and other policy considerations of importance. It is important to note that due to contention over the auto model and inputs, there was no consensus on the model’s numeric results. Consequently, quantitative results from the auto analysis are not included in this chapter. The sixth section elaborates the Dialogue’s efforts to integrate all of the sector studies into comprehensive policy sets to determine the total reductions that could be achieved. For purposes of comparison, the Dialogue selected a set of emission targets that correspond to Case 3b in Table 3-2, and that achieve stabilization at the concentration ceilings of 550 and 650ppmv. The MiniCAM model used for the analysis in Chapter Three includes 15-year increments. As a result, its emission targets focus on the years 2020 and 2035. The models used in this chapter focused on the periods 2010, 2020, and 2030. Therefore, emission budgets in the reference case for 2030 were interpolated rather than taken directly from the model. These targets are included in the following Table 4-1. TABLE 4-1: ASSUMED U.S. EMISSION REDUCTIONS FROM THE REFERENCE CASE (IN MMTC)
PPMV in 2100 / Year 2020 2030 650ppmv 247 404 550ppmv 401 632
We learned, as the Dialogue evolved, that, for a number of reasons, certain sectors are easier to assess. The Electric Sector is relatively homogenous and the study was able to build on existing analysis. Thus, this study is more comprehensive than others. The Energy Intensive Manufacturing study provides a useful initial assessment of reduction opportunities and the dynamics that affect investment decisions but would benefit from additional work. The auto sector study had to adopt a different approach. The business-as-usual projections from the model proved controversial; also, applying carbon prices indicated a minimal response. Additional policies and measures were developed that would impact consumer purchase decisions. This analysis provides interesting insights but warrants further analysis. There are some common insights that warrant mentioning up front and that are described in more detail in each section. The first is that leakage is an issue facing all sectors. Leakage refers to carbon releases due to compensating activities that would not have otherwise happened unless the action to reduce carbon was taking place. A classic example is substitution where a source of carbon controls its emissions by reducing its activity and “gets credit” for reducing emissions. Meanwhile, a second source simply increases its activities, thereby increasing its emissions without facing any penalty for increased emissions. In some cases leakage may be easier to account for or prevent than in other sectors. Similarly, the transaction costs associated with reducing, measuring and transacting reductions can also have a major effect on the level of
The Keystone Center Dialogue on Global Climate Change 32
reductions obtained. Again, in some cases, (e.g., large point sources) it is much easier to control than in other cases (e.g., small landowners). A) The Electric Sector Summary: This analysis showed that at prices of $25 and $50/tonne C and with a combination of DSM policies, electricity suppliers and consumers could achieve about 110-165MMTC reductions in 2020 and about 145-250 MMTC reductions in 2030. This represents roughly 23-39% of the reductions required by the United States in a 550ppmv concentration ceiling emission pathway, and 36-61% of a 650ppmv ceiling emission pathway in the year 2030. For the most part, reductions were achieved by imposing a carbon value; however, significant reductions were achieved through increased DSM. The analysis also suggests that a carbon value alone is not sufficient to achieve reductions but has to be combined with policies directly mandating DSM activities such as conservation or appliance standards. Fuel switching11 was not a major source of reductions. It accounted for 3% of the total sector reductions with carbon prices at $50/tonne of carbon12. In contrast to several other studies, the Keystone analysis attempts to model investment behavior and it concludes that high switching costs coupled with price and policy uncertainty make this a less attractive option than some believe. In contrast, significant reductions are achieved through demand elasticity, the addition of new capacity, DSM, and changes in plant dispatch. The Keystone study also assumes that most existing nuclear capacity is re-licensed and remains on-line in the 2030 timeframe. Emissions grow if nuclear capacity is replaced by other emitting fuel sources. The analysis projects that renewable generation technologies (solar, wind and biomass) play a prominent role in the future capacity additions and in reducing carbon emissions. However, a policy scenario completed for this study shows found that providing additional subsidy for solar and wind technologies does not necessarily result in additional major reduction in emissions from the electric sector in 2030. This is a result of several modeling assumptions that are discussed in this section. Overview: The electric sector consists of a system to convert fuels into electricity and to transmit and distribute power to customers for end-use consumption. The primary source of CO2 emissions in the power sector is the combustion of fossil fuels and a secondary “source” is inefficiency in generation, transmission line losses and end-use. Inefficiency throughout the power system results in emissions. The sector emits about 600 million tonnes of carbon per year, roughly 40% of total U.S. emissions. There are several policies that can be utilized to reduce emissions from the power sector. They range from influencing the selection of new generating units and the operation of the generation fleet to intervening in end-use markets to encourage more efficient use of electricity in all sectors of the economy. Working with customers to increase efficiency is called DSM. This section discusses the policies that impact the supply side of the industry value chain; DSM will be addressed in the following section.
11 Fuel switching in this sense means the actual repowering of an existing unit with a new fuel and not merely displacement through changes in dispatch. 12 In fact, the model showed relatively little fuel switching before carbon prices exceed $100/tonne.
The Keystone Center Dialogue on Global Climate Change 33
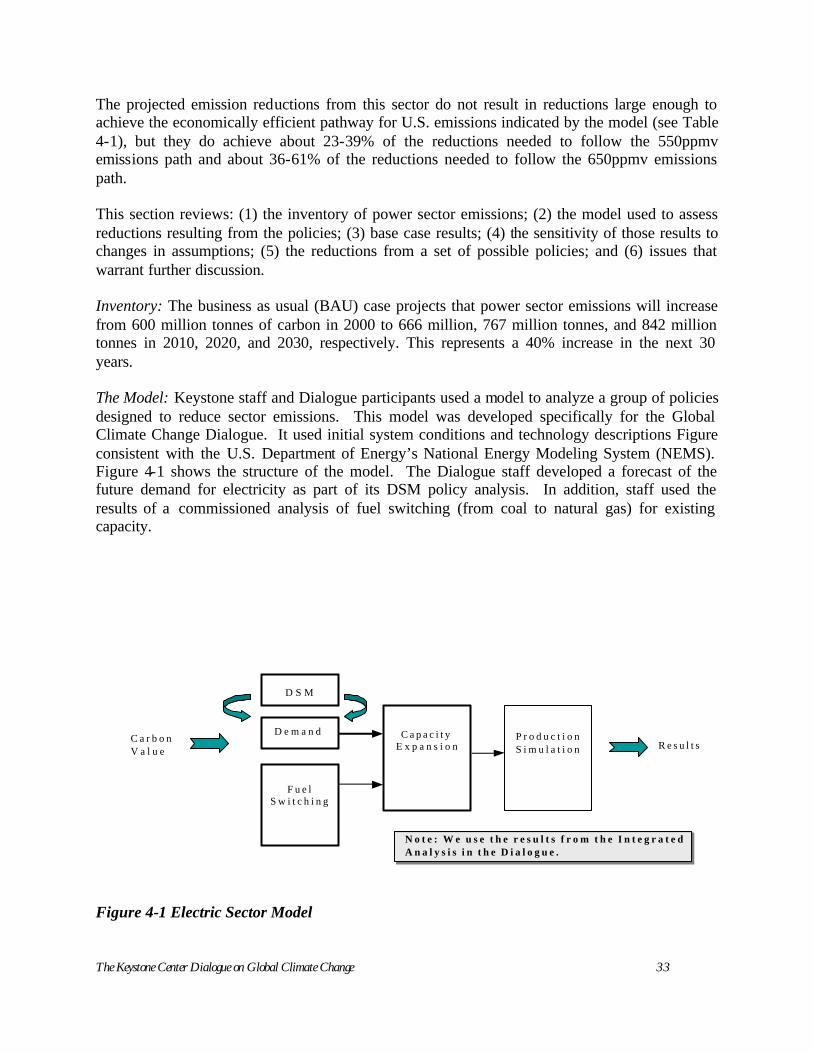
The projected emission reductions from this sector do not result in reductions large enough to achieve the economically efficient pathway for U.S. emissions indicated by the model (see Table 4-1), but they do achieve about 23-39% of the reductions needed to follow the 550ppmv emissions path and about 36-61% of the reductions needed to follow the 650ppmv emissions path. This section reviews: (1) the inventory of power sector emissions; (2) the model used to assess reductions resulting from the policies; (3) base case results; (4) the sensitivity of those results to changes in assumptions; (5) the reductions from a set of possible policies; and (6) issues that warrant further discussion. Inventory: The business as usual (BAU) case projects that power sector emissions will increase from 600 million tonnes of carbon in 2000 to 666 million, 767 million tonnes, and 842 million tonnes in 2010, 2020, and 2030, respectively. This represents a 40% increase in the next 30 years. The Model: Keystone staff and Dialogue participants used a model to analyze a group of policies designed to reduce sector emissions. This model was developed specifically for the Global Climate Change Dialogue. It used initial system conditions and technology descriptions Figure consistent with the U.S. Department of Energy’s National Energy Modeling System (NEMS). Figure 4-1 shows the structure of the model. The Dialogue staff developed a forecast of the future demand for electricity as part of its DSM policy analysis. In addition, staff used the results of a commissioned analysis of fuel switching (from coal to natural gas) for existing capacity.
Figure 4-1 Electric Sector Model
C a r b o nV a l u e R e s u l t s
D S M
D e m a n d
F u e lS w i t c h i n g
C a p a c i t yE x p a n s i o n
P r o d u c t i o nS i m u l a t i o n
N o t e : W e u s e t h e r e s u l t s f r o m t h e I n t e g r a t e dA n a l y s i s i n t h e D i a l o g u e .
The Keystone Center Dialogue on Global Climate Change 34
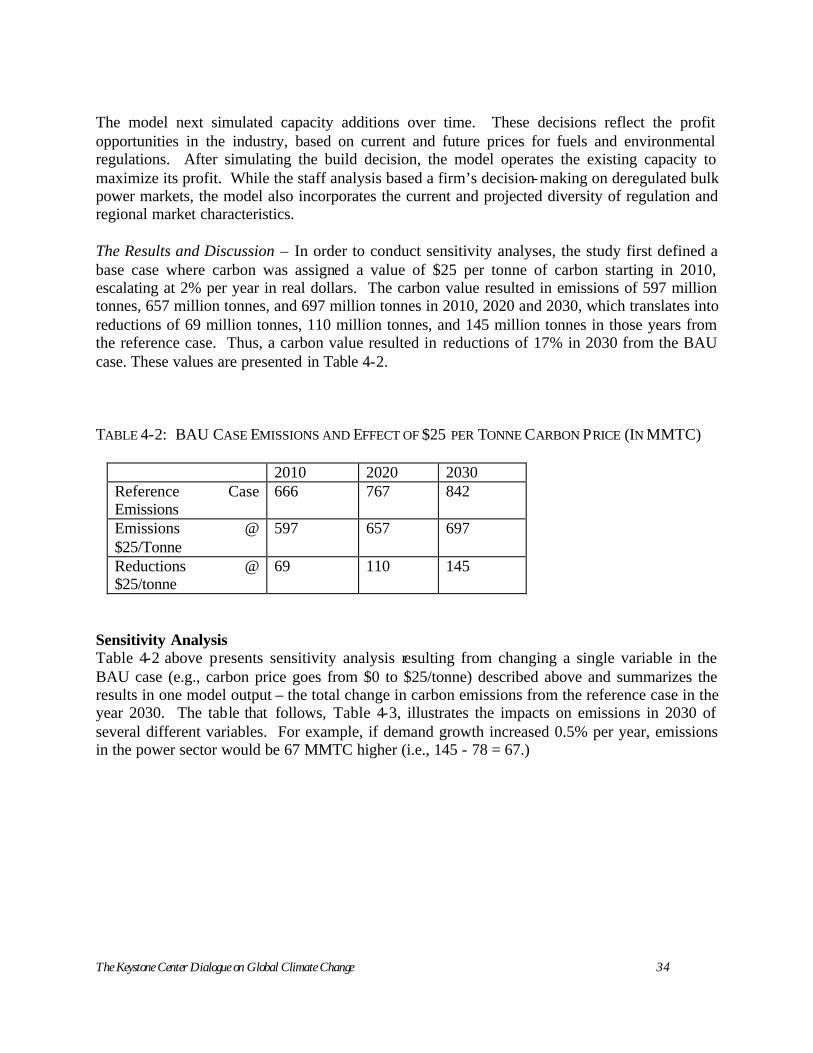
The model next simulated capacity additions over time. These decisions reflect the profit opportunities in the industry, based on current and future prices for fuels and environmental regulations. After simulating the build decision, the model operates the existing capacity to maximize its profit. While the staff analysis based a firm’s decision-making on deregulated bulk power markets, the model also incorporates the current and projected diversity of regulation and regional market characteristics. The Results and Discussion – In order to conduct sensitivity analyses, the study first defined a base case where carbon was assigned a value of $25 per tonne of carbon starting in 2010, escalating at 2% per year in real dollars. The carbon value resulted in emissions of 597 million tonnes, 657 million tonnes, and 697 million tonnes in 2010, 2020 and 2030, which translates into reductions of 69 million tonnes, 110 million tonnes, and 145 million tonnes in those years from the reference case. Thus, a carbon value resulted in reductions of 17% in 2030 from the BAU case. These values are presented in Table 4-2. TABLE 4-2: BAU CASE EMISSIONS AND EFFECT OF $25 PER TONNE CARBON PRICE (IN MMTC)
2010 2020 2030 Reference Case Emissions
666 767 842
Emissions @ $25/Tonne
597 657 697
Reductions @ $25/tonne
69 110 145
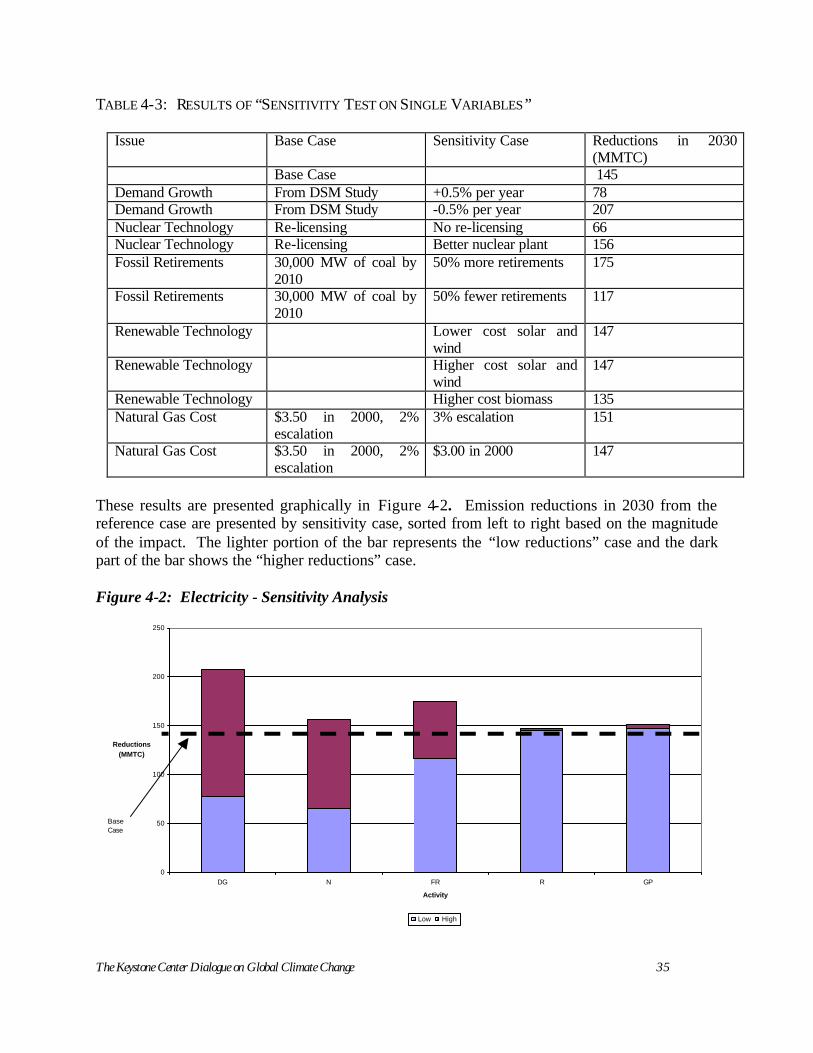
Sensitivity Analysis Table 4-2 above presents sensitivity analysis resulting from changing a single variable in the BAU case (e.g., carbon price goes from $0 to $25/tonne) described above and summarizes the results in one model output – the total change in carbon emissions from the reference case in the year 2030. The table that follows, Table 4-3, illustrates the impacts on emissions in 2030 of several different variables. For example, if demand growth increased 0.5% per year, emissions in the power sector would be 67 MMTC higher (i.e., 145 - 78 = 67.)
The Keystone Center Dialogue on Global Climate Change 35
TABLE 4-3: RESULTS OF “SENSITIVITY TEST ON SINGLE VARIABLES”
Issue Base Case Sensitivity Case Reductions in 2030 (MMTC)
Base Case 145 Demand Growth From DSM Study +0.5% per year 78 Demand Growth From DSM Study -0.5% per year 207 Nuclear Technology Re-licensing No re-licensing 66 Nuclear Technology Re-licensing Better nuclear plant 156 Fossil Retirements 30,000 MW of coal by
2010 50% more retirements 175
Fossil Retirements 30,000 MW of coal by 2010
50% fewer retirements 117
Renewable Technology Lower cost solar and wind
147
Renewable Technology Higher cost solar and wind
147
Renewable Technology Higher cost biomass 135 Natural Gas Cost $3.50 in 2000, 2%
escalation 3% escalation 151
Natural Gas Cost $3.50 in 2000, 2% escalation
$3.00 in 2000 147
These results are presented graphically in Figure 4-2. Emission reductions in 2030 from the reference case are presented by sensitivity case, sorted from left to right based on the magnitude of the impact. The lighter portion of the bar represents the “low reductions” case and the dark part of the bar shows the “higher reductions” case. Figure 4-2: Electricity - Sensitivity Analysis
0
50
100
150
200
250
DG N FR R GP
Activity
Reductions (MMTC)
Low High
BaseCase
The Keystone Center Dialogue on Global Climate Change 36
Impacts of Demand Growth Demand growth is the most variable, a finding that will be reflected in the value of DSM policies discussed below. Impacts of Nuclear Retirements The life of existing nuclear plants is also critical because, if they are not re-licensed, the model predicts that this non-emitting technology will for the most part be replaced with combined cycle natural gas plants. While these plants emit less carbon than many existing plants the net is a large increase in CO2 emissions. Impacts of Retiring Coal Fired Plants Sensitivity analyses conclude that retiring coal fired plants also has a large impact on the power sector. These plants are old and relatively inefficient compared to new units that are added. However it is important to note that regulated companies are reluctant to replace assets upon which they earn a return. In addition, non-regulated generators are finding that price volatility makes even infrequent operation profitable, so they are more likely to mothball plants rather than shut them down permanently. Impacts of Renewables and Natural Gas Prices According to the model, renewable technologies and natural gas prices have minimal impacts on sector wide emissions. The reason for the minimal impact of gas prices on power sector emissions came as a surprise to several plenary session members. The reason for this result is that gas is the fuel of choice for new units across the range of gas prices investigated. When higher prices makes gas fueled generation less attractive, it is replaced with a mix of lower emitting and higher emitting generation. Impacts of Increased Carbon Values In this case, all of the variables of the base case were maintained but carbon values were increased to $50/tonne in year 2010, increasing at 2% per year. The results of this analysis and the reductions achieved at $25/tonne are illustrated in Table 4-4.
The Keystone Center Dialogue on Global Climate Change 37
TABLE 4-4: BAU CASE EMISSIONS AND EFFECT OF $25 AND $50 PER TONNE CARBON PRICE (MMTC)
Emissions or Emissions Reductions (MMTC)
2010 2020 2030
BAU CASE 666 767 842 Emissions @ $25/Tonne
597 657 697
Reductions @ $25/tonne
69 110 145
Emissions @ $50/tonne
540 601 595
Reductions @ $50/tonne
126 166 247
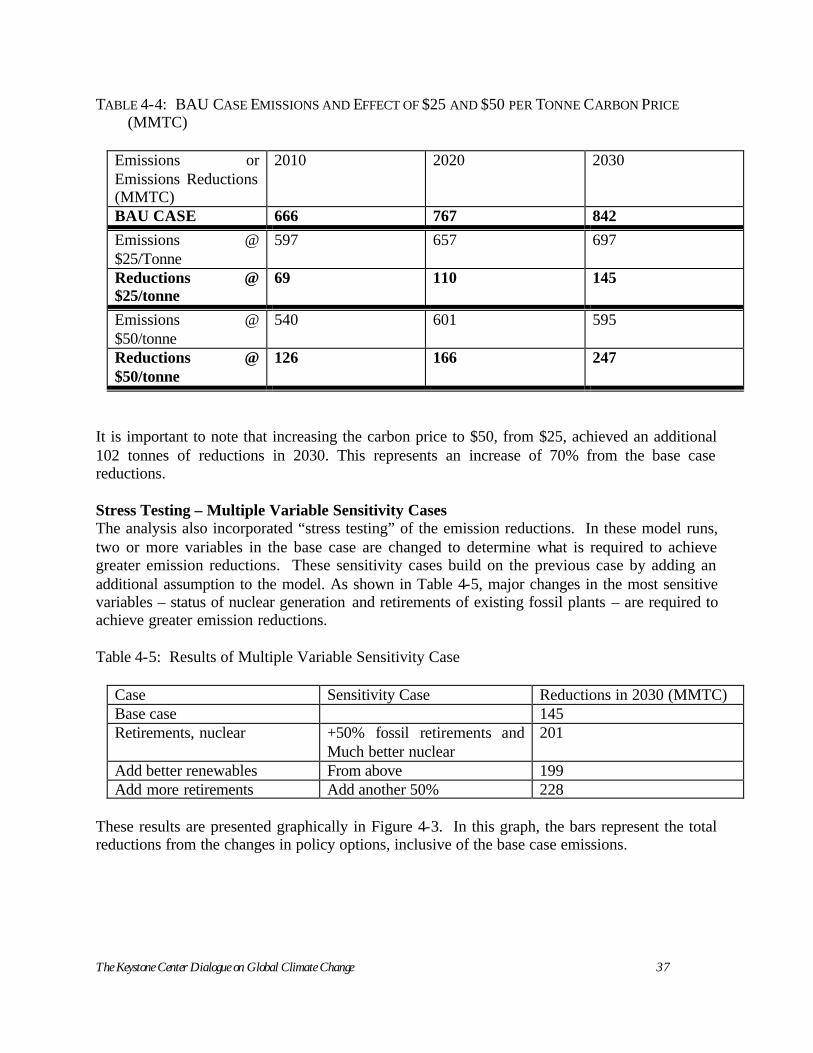
It is important to note that increasing the carbon price to $50, from $25, achieved an additional 102 tonnes of reductions in 2030. This represents an increase of 70% from the base case reductions. Stress Testing – Multiple Variable Sensitivity Cases The analysis also incorporated “stress testing” of the emission reductions. In these model runs, two or more variables in the base case are changed to determine what is required to achieve greater emission reductions. These sensitivity cases build on the previous case by adding an additional assumption to the model. As shown in Table 4-5, major changes in the most sensitive variables – status of nuclear generation and retirements of existing fossil plants – are required to achieve greater emission reductions. Table 4-5: Results of Multiple Variable Sensitivity Case
Case Sensitivity Case Reductions in 2030 (MMTC) Base case 145 Retirements, nuclear +50% fossil retirements and
Much better nuclear 201
Add better renewables From above 199 Add more retirements Add another 50% 228
These results are presented graphically in Figure 4-3. In this graph, the bars represent the total reductions from the changes in policy options, inclusive of the base case emissions.
The Keystone Center Dialogue on Global Climate Change 38
Figure 4-3: Electricity - Aggregated Results of Stress Test
0
50
100
150
200
250
Base R+N +Ren +Ret
Case
Reductions MMTC
Base Add'l Reduction
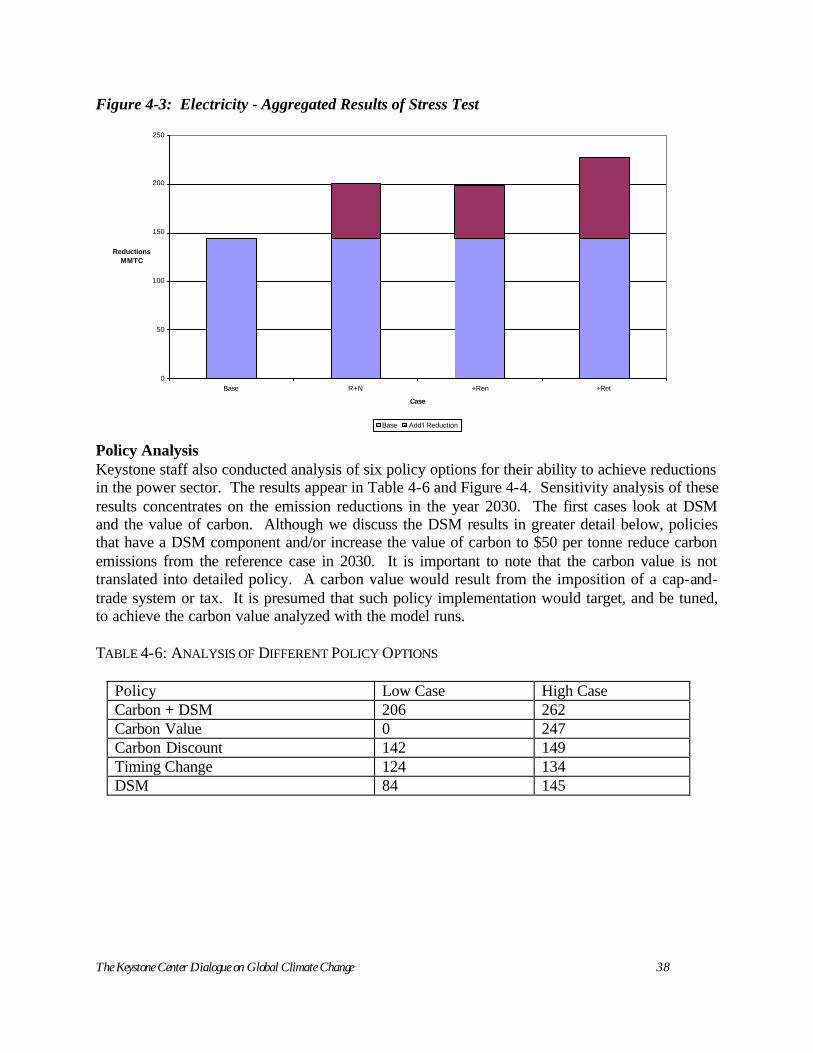
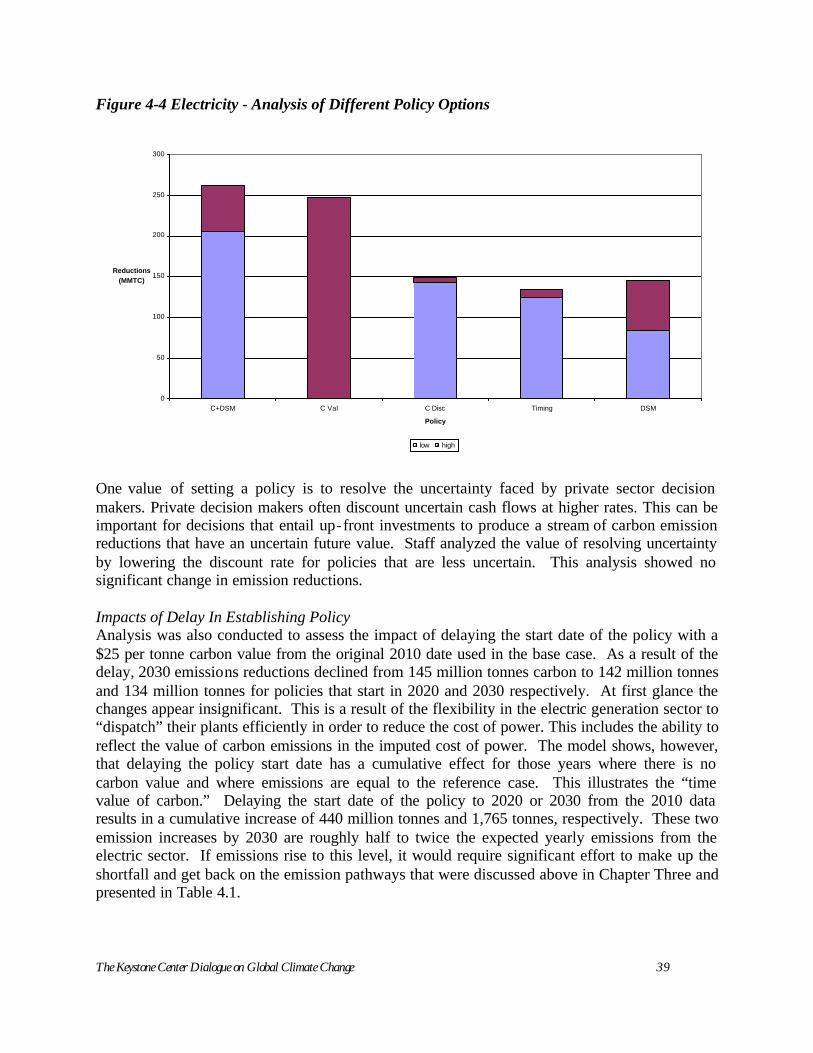
Policy Analysis Keystone staff also conducted analysis of six policy options for their ability to achieve reductions in the power sector. The results appear in Table 4-6 and Figure 4-4. Sensitivity analysis of these results concentrates on the emission reductions in the year 2030. The first cases look at DSM and the value of carbon. Although we discuss the DSM results in greater detail below, policies that have a DSM component and/or increase the value of carbon to $50 per tonne reduce carbon emissions from the reference case in 2030. It is important to note that the carbon value is not translated into detailed policy. A carbon value would result from the imposition of a cap-and-trade system or tax. It is presumed that such policy implementation would target, and be tuned, to achieve the carbon value analyzed with the model runs. TABLE 4-6: ANALYSIS OF DIFFERENT POLICY OPTIONS
Policy Low Case High Case Carbon + DSM 206 262 Carbon Value 0 247 Carbon Discount 142 149 Timing Change 124 134 DSM 84 145
The Keystone Center Dialogue on Global Climate Change 39
Figure 4-4 Electricity - Analysis of Different Policy Options
0
50
100
150
200
250
300
C+DSM C Val C Disc Timing DSM
Policy
Reductions (MMTC)
low high
One value of setting a policy is to resolve the uncertainty faced by private sector decision makers. Private decision makers often discount uncertain cash flows at higher rates. This can be important for decisions that entail up-front investments to produce a stream of carbon emission reductions that have an uncertain future value. Staff analyzed the value of resolving uncertainty by lowering the discount rate for policies that are less uncertain. This analysis showed no significant change in emission reductions. Impacts of Delay In Establishing Policy Analysis was also conducted to assess the impact of delaying the start date of the policy with a $25 per tonne carbon value from the original 2010 date used in the base case. As a result of the delay, 2030 emissions reductions declined from 145 million tonnes carbon to 142 million tonnes and 134 million tonnes for policies that start in 2020 and 2030 respectively. At first glance the changes appear insignificant. This is a result of the flexibility in the electric generation sector to “dispatch” their plants efficiently in order to reduce the cost of power. This includes the ability to reflect the value of carbon emissions in the imputed cost of power. The model shows, however, that delaying the policy start date has a cumulative effect for those years where there is no carbon value and where emissions are equal to the reference case. This illustrates the “time value of carbon.” Delaying the start date of the policy to 2020 or 2030 from the 2010 data results in a cumulative increase of 440 million tonnes and 1,765 tonnes, respectively. These two emission increases by 2030 are roughly half to twice the expected yearly emissions from the electric sector. If emissions rise to this level, it would require significant effort to make up the shortfall and get back on the emission pathways that were discussed above in Chapter Three and presented in Table 4.1.
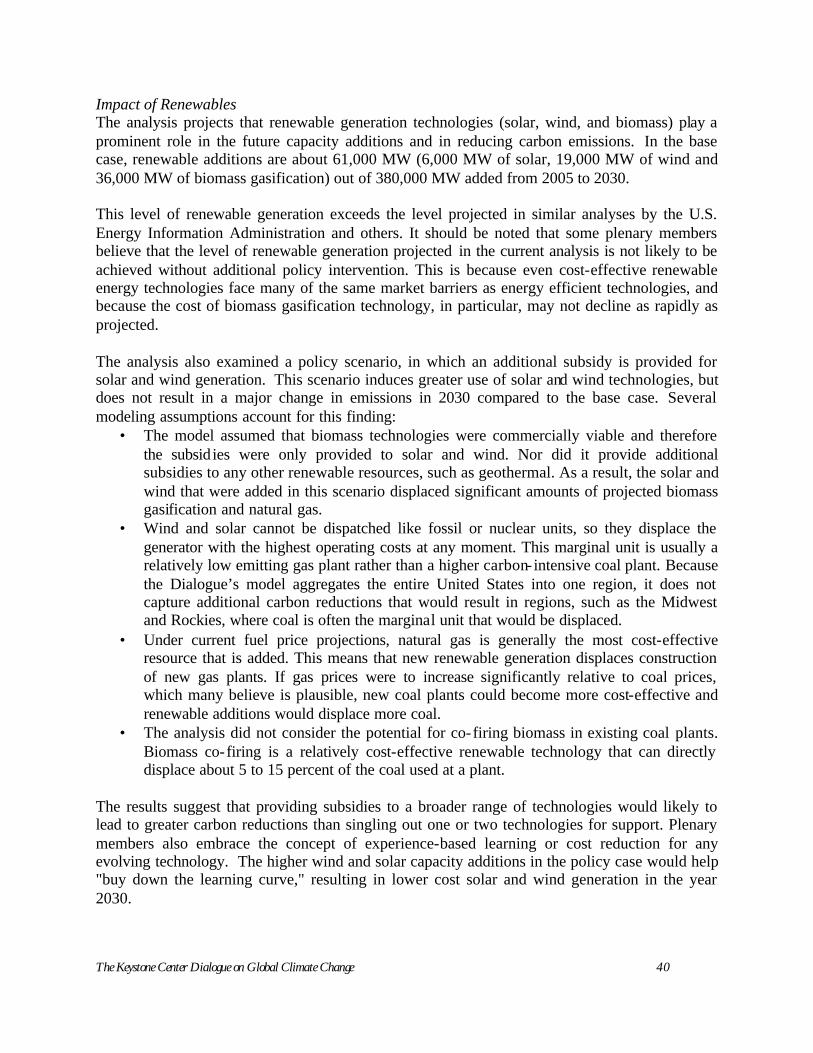
The Keystone Center Dialogue on Global Climate Change 40
Impact of Renewables The analysis projects that renewable generation technologies (solar, wind, and biomass) play a prominent role in the future capacity additions and in reducing carbon emissions. In the base case, renewable additions are about 61,000 MW (6,000 MW of solar, 19,000 MW of wind and 36,000 MW of biomass gasification) out of 380,000 MW added from 2005 to 2030. This level of renewable generation exceeds the level projected in similar analyses by the U.S. Energy Information Administration and others. It should be noted that some plenary members believe that the level of renewable generation projected in the current analysis is not likely to be achieved without additional policy intervention. This is because even cost-effective renewable energy technologies face many of the same market barriers as energy efficient technologies, and because the cost of biomass gasification technology, in particular, may not decline as rapidly as projected. The analysis also examined a policy scenario, in which an additional subsidy is provided for solar and wind generation. This scenario induces greater use of solar and wind technologies, but does not result in a major change in emissions in 2030 compared to the base case. Several modeling assumptions account for this finding:
• The model assumed that biomass technologies were commercially viable and therefore the subsid ies were only provided to solar and wind. Nor did it provide additional subsidies to any other renewable resources, such as geothermal. As a result, the solar and wind that were added in this scenario displaced significant amounts of projected biomass gasification and natural gas.
• Wind and solar cannot be dispatched like fossil or nuclear units, so they displace the generator with the highest operating costs at any moment. This marginal unit is usually a relatively low emitting gas plant rather than a higher carbon- intensive coal plant. Because the Dialogue’s model aggregates the entire United States into one region, it does not capture additional carbon reductions that would result in regions, such as the Midwest and Rockies, where coal is often the marginal unit that would be displaced.
• Under current fuel price projections, natural gas is generally the most cost-effective resource that is added. This means that new renewable generation displaces construction of new gas plants. If gas prices were to increase significantly relative to coal prices, which many believe is plausible, new coal plants could become more cost-effective and renewable additions would displace more coal.
• The analysis did not consider the potential for co-firing biomass in existing coal plants. Biomass co-firing is a relatively cost-effective renewable technology that can directly displace about 5 to 15 percent of the coal used at a plant.
The results suggest that providing subsidies to a broader range of technologies would likely to lead to greater carbon reductions than singling out one or two technologies for support. Plenary members also embrace the concept of experience-based learning or cost reduction for any evolving technology. The higher wind and solar capacity additions in the policy case would help "buy down the learning curve," resulting in lower cost solar and wind generation in the year 2030.
The Keystone Center Dialogue on Global Climate Change 41
It should be noted that further analysis could provide a greater understanding of the impacts of renewable energy on power system emissions. Some dialogue participants believe that analysis that shows greater reductions from increased renewable energy is more credible. These participants point to a growing literature that evaluates an alternative policy not analyzed by Keystone staff—a renewable electricity standard (RES)—a requirement that renewable energy sources provide a minimum share of future electricity use13. On the other hand, other observers note that the institutional and physical issues associated with connecting renewable energy sources to the power grid must be resolved in order to increase the use of renewables on a significant scale. Components of Emission Reductions Keystone staff performed additional analysis on the variables that produced the emission reductions in two of the policy cases – the DSM cases with a carbon value of either $25 per tonne or $50 per tonne. It is hard to assign the reductions to any single factor for two reasons. First, the policy components interact. For example when a carbon value increases the price of electricity, DSM programs have greater impact. Second, any combination of policies competes for the cheapest reductions in the model. However the results in Figure 4-5 attempt to make the assignment. The analysis concludes that reductions are achieved primarily from adding less-carbon intensive new capacity, demand response (price elasticity) and re-dispatch of the existing fleet to reflect carbon values.
13 Energy Information Administration, Analysis of Strategies for Reducing Multiple Emissions from Electric Power Plants: Sulfur Dioxide, Nitrogen Oxides, Carbon Dioxide, and Mercury and a Renewable Portfolio Standard, SR/OIAF/2001-03, June 2001. http://www.eia.doe.gov/oiaf/servicerpt/epp/pdf/sroiaf(2001)03.pdf. Union of Concerned Scientists, Renewing Where We Live: A National Renewable Energy Standard Will Benefit America’s Economy, February 2002.
The Keystone Center Dialogue on Global Climate Change 42
Figure 4-5 Electricity - Components of Emission Reductions
0
50
100
150
200
250
300
FS DE CE Dis DSM Total
Component
Reductions (MMTC)
0$ 25$ 50$
Key: FS = Fuel Switching DE = Demand Elasticity CE = Capacity Expansion DIS = Change in Dispatch DSM = DSM activities (energy efficiency) Impact of Fuel Switching on Emissions Sector Wide The Dialogue analysis found that at prices of $25 and $50 per tonne of carbon, minimal fuel switching of existing units from coal to gas occurs. In this case, “fuel switching” refers to physically altering a boiler so that it combusts a new fuel, not simply displacing generation from a boiler which combusts one fuel with generation from a different boiler that combusts a different fuel. This finding is in contrast to the results obtained by many analysts. This analysis concludes that carbon values of $25/tonne and $50/tonne induce minimal amounts of fuel switching. Keystone staff believes that the different results occur because this study used an alternative analytical framework. The analysis used in this dialogue replicates the process that competitive firms would use to make the fuel switch decision in the face of uncertain natural gas prices and carbon values. Considering uncertainty in the fuel switching analysis introduces two major influences. First, the switch from coal to natural gas requires a large investment for a future stream of highly uncertain profits from gas generation and lower carbon emissions. As discussed above, companies will discount those profits at a higher rate because of ongoing uncertainty. Second, companies will not switch the minute that coal, gas and electric prices combined with carbon values indicate that investment is justified. Rather, the companies will wait to see if the price scenario is likely to persist over time. Because of this delay, the companies effectively have a higher carbon price threshold for switching.
The Keystone Center Dialogue on Global Climate Change 43
A simple break-even analysis shows that switching from coal to gas would occur at $30 to $45 per tonne carbon. However, by addressing the impact of uncertainty, the Keystone analysis shows that the new break-even point is $45 to $89 per tonne of carbon. This difference in fuel switching behavior has potential implications for policy analysis of U.S. climate policies. The Keystone analysis found that fuel switching is expensive and generates minimal emissions reduction in the $50 per tonne of carbon case. Impacts of New Capacity on Power Sector Emissions The addition of new units results in some reductions. However, gas fired combined cycle units dominate future capacity additions. As these are the new units of choice in the base case, their addition has minimal effect. In addition, significant amounts of new capacity have recently been added, thereby reducing the need for new capacity over the thirty-year horizon. Since the carbon value increases the price of electricity, simple demand elasticity effects depress energy consumption, and thus reduce carbon emissions. Impacts of Changes in Dispatch Orders As noted above the electric system is very flexible, with a diverse set of technologies that are dispatched to meet load. When carbon has a value, the order of this dispatch changes to produce more energy with plants that emit less CO2. Changes to the dispatch orders achieve significant reductions in the $50 per tonne case. Finally, DSM programs reduce demand and thus CO2 emissions. The effect diminishes as the value of carbon increases because the rate of CO2 emitted per kilowatt-hour of electricity generated drops with an increase in carbon prices. Issues for Further Study Dialogue participants expressed support for research into more efficient, lower emitting technologies in the power sector. One example would be to continue the development of integrated gasification combined cycle generating (IGCC) plants. These plants achieve greater efficiencies in the use of coal and provide an important future option. If capture and disposal of carbon can also be developed, then IGCC plants can be retrofitted with the capture technology. Compared to existing pulverized coal plants, the IGCC technology is especially suited to carbon removal from the fuel rather than from the combustion waste stream. Thus, this technology could play an important role in a future concentration strategy. For a variety of reasons including budget constraints and the timeframe of analysis, no quantitative analysis of the impact of these technologies on sector emissions was undertaken. B) Demand Side Management Overview: The previous section described the impact of carbon values and policies on electric sector emissions. These policies generally targeted the supply side of the industry, shifting investment in new generation and the operation of existing resources. The section referred to the role that DSM policies could play in achieving additional emission reductions; these are discussed further here.
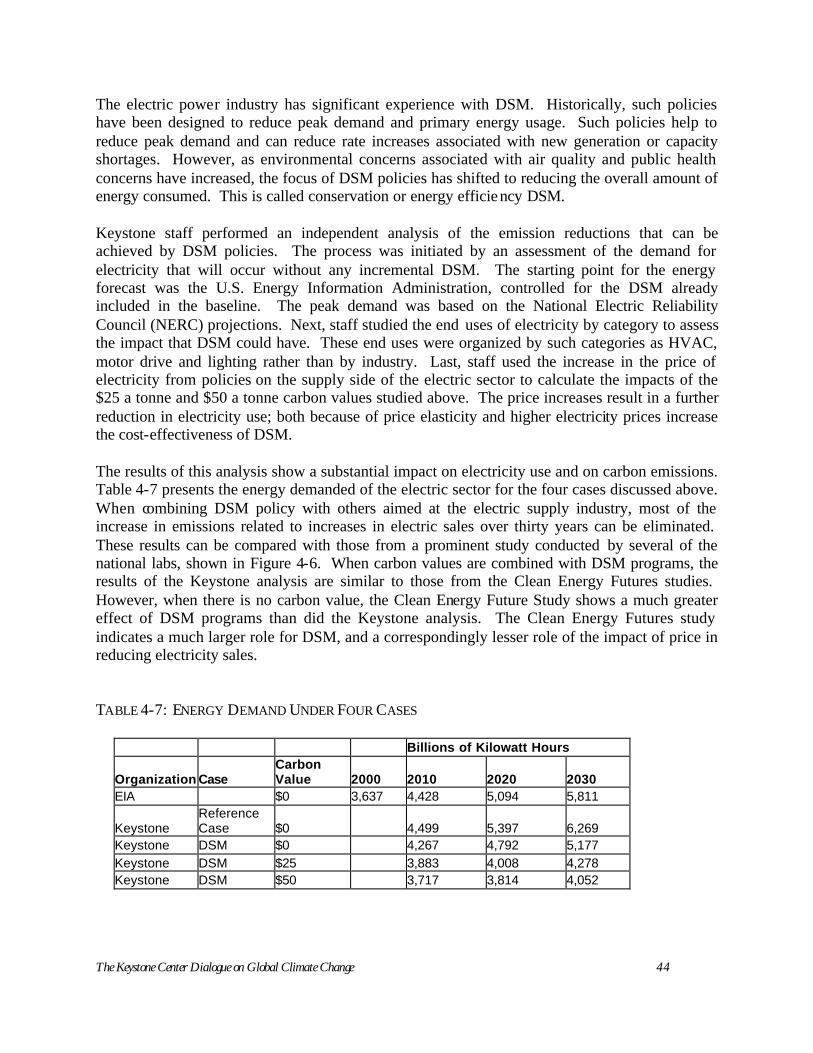
The Keystone Center Dialogue on Global Climate Change 44
The electric power industry has significant experience with DSM. Historically, such policies have been designed to reduce peak demand and primary energy usage. Such policies help to reduce peak demand and can reduce rate increases associated with new generation or capacity shortages. However, as environmental concerns associated with air quality and public health concerns have increased, the focus of DSM policies has shifted to reducing the overall amount of energy consumed. This is called conservation or energy efficiency DSM. Keystone staff performed an independent analysis of the emission reductions that can be achieved by DSM policies. The process was initiated by an assessment of the demand for electricity that will occur without any incremental DSM. The starting point for the energy forecast was the U.S. Energy Information Administration, controlled for the DSM already included in the baseline. The peak demand was based on the National Electric Reliability Council (NERC) projections. Next, staff studied the end uses of electricity by category to assess the impact that DSM could have. These end uses were organized by such categories as HVAC, motor drive and lighting rather than by industry. Last, staff used the increase in the price of electricity from policies on the supply side of the electric sector to calculate the impacts of the $25 a tonne and $50 a tonne carbon values studied above. The price increases result in a further reduction in electricity use; both because of price elasticity and higher electricity prices increase the cost-effectiveness of DSM. The results of this analysis show a substantial impact on electricity use and on carbon emissions. Table 4-7 presents the energy demanded of the electric sector for the four cases discussed above. When combining DSM policy with others aimed at the electric supply industry, most of the increase in emissions related to increases in electric sales over thirty years can be eliminated. These results can be compared with those from a prominent study conducted by several of the national labs, shown in Figure 4-6. When carbon values are combined with DSM programs, the results of the Keystone analysis are similar to those from the Clean Energy Futures studies. However, when there is no carbon value, the Clean Energy Future Study shows a much greater effect of DSM programs than did the Keystone analysis. The Clean Energy Futures study indicates a much larger role for DSM, and a correspondingly lesser role of the impact of price in reducing electricity sales. TABLE 4-7: ENERGY DEMAND UNDER FOUR CASES
Billions of Kilowatt Hours
Organization Case Carbon Value 2000 2010 2020 2030
EIA $0 3,637 4,428 5,094 5,811
Keystone Reference Case $0 4,499 5,397 6,269
Keystone DSM $0 4,267 4,792 5,177 Keystone DSM $25 3,883 4,008 4,278 Keystone DSM $50 3,717 3,814 4,052
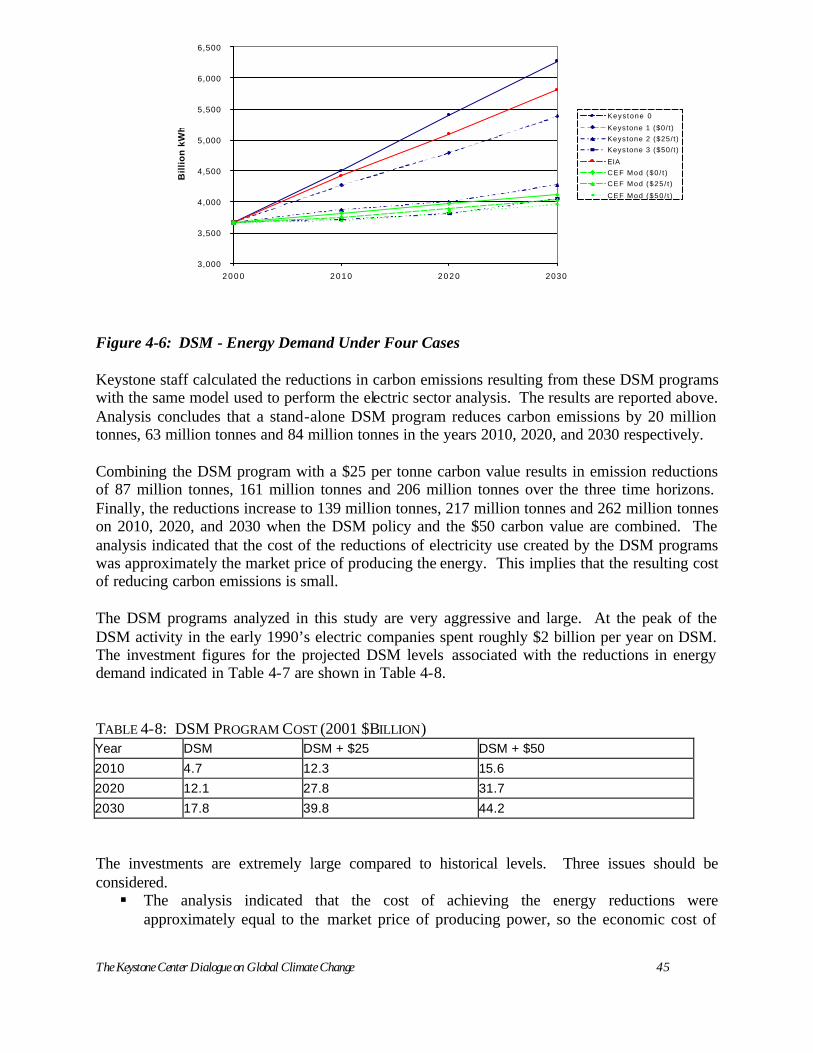
The Keystone Center Dialogue on Global Climate Change 45
Figure 4-6: DSM - Energy Demand Under Four Cases Keystone staff calculated the reductions in carbon emissions resulting from these DSM programs with the same model used to perform the electric sector analysis. The results are reported above. Analysis concludes that a stand-alone DSM program reduces carbon emissions by 20 million tonnes, 63 million tonnes and 84 million tonnes in the years 2010, 2020, and 2030 respectively. Combining the DSM program with a $25 per tonne carbon value results in emission reductions of 87 million tonnes, 161 million tonnes and 206 million tonnes over the three time horizons. Finally, the reductions increase to 139 million tonnes, 217 million tonnes and 262 million tonnes on 2010, 2020, and 2030 when the DSM policy and the $50 carbon value are combined. The analysis indicated that the cost of the reductions of electricity use created by the DSM programs was approximately the market price of producing the energy. This implies that the resulting cost of reducing carbon emissions is small. The DSM programs analyzed in this study are very aggressive and large. At the peak of the DSM activity in the early 1990’s electric companies spent roughly $2 billion per year on DSM. The investment figures for the projected DSM levels associated with the reductions in energy demand indicated in Table 4-7 are shown in Table 4-8. TABLE 4-8: DSM PROGRAM COST (2001 $BILLION) Year DSM DSM + $25 DSM + $50
2010 4.7 12.3 15.6
2020 12.1 27.8 31.7
2030 17.8 39.8 44.2
The investments are extremely large compared to historical levels. Three issues should be considered. § The analysis indicated that the cost of achieving the energy reductions were
approximately equal to the market price of producing power, so the economic cost of
3,000
3,500
4,000
4,500
5,000
5,500
6,000
6,500
2 0 0 0 2 0 1 0 2 0 2 0 2030
Bil
lio
n k
Wh
Keys tone 0
Keystone 1 ($0/ t )
Keystone 2 ($25/ t )
Keystone 3 ($50/ t )
EIA
CEF Mod ($0 / t )
CEF Mod ($25 / t )
CEF Mod ($50 / t )
The Keystone Center Dialogue on Global Climate Change 46
achieving associated carbon reductions is low. This means that resources would likely be directed to DSM programs rather than in investments in new capacity.
§ The total expenditures to reduce carbon emissions are large. As illustrated in Table 4-1, in 2030 U.S. ghg emissions must be reduced by about 400 million tonnes from the reference case to achieve a 650ppmv concentration in 2100 and about 630 million tonnes to achieve a 550ppmv concentration for the U.S. to be on a trajectory to achieve the reductions indicated by the international emission allowance sharing analysis. If the average cost of the reductions is one-half of the marginal cost of the reductions, then the total economic cost is roughly $5 billion (400 million tonnes per year x $25 per tonne x 50%) to $15.7 billion (630 million tonnes x $50 per tonne x 50%) for the United States.
§ The expenditures can be compared with the industry revenue of roughly $300 billion per year and capital expenditures on electricity production of about $10 billion per year between 2000 and 2030 in the electric sector base case. By any measure the large size of the projected DSM programs is unprecedented, and as a result, there is some risk associated with their success.
The Dialogue participants did not design specific programs for DSM. However, they did identify two important design issues. First, DSM programs should broadly target market transformation rather than narrowly focus on incentives for transactions. For example, incentives focused on transactions might try to influence the purchase of a high efficiency lighting system for a commercial building. In contrast, incentives focused on transforming the standard building lighting system designs seen in national building construction markets leading to larger reductions. These DSM programs also have more persistent impacts over time. There are many successful examples of market transformation. Second, policies should carefully consider the appropriate organization to implement DSM programs. As the electric industry has been restructured with a greater emphasis on competitive markets, observers were concerned that electric service providers would not want to implement DSM programs that reduced their sales. However, in many locations a robust deregulated end-use service sector has not developed, and the remaining regulated companies are still important DSM implementers. Furthermore, electricity distribution companies will continue to be regulated even in areas with competitive wholesale markets. Performance-based regulation of distribution companies can be designed so that they have appropriate incentives to invest in cost-effective DSM, rather than maximize throughput. Keystone staff did not do a detailed analysis of the DSM potential for natural gas use in the commercial and residential sectors. C) Biologic Sequestration Summary: The analysis concludes that biologic sequestration could achieve 94-167 MMTC reductions in 2020 and 112-203 MMTC reductions in 2030 at carbon prices of $25 and $50/tonne and with only a 5-year lag time. This equates with roughly 18-32% of the U.S. share of the reductions to achieve a 550ppmv concentration ceiling emission pathway, and roughly 28-50% of the U.S. share of reductions to achieve a 650ppmv ceiling emission pathway in 2030. The study suggests that biologic sequestration could be an important bridging strategy since the
The Keystone Center Dialogue on Global Climate Change 47
relatively short-term reductions could help to “buy time” while new lower and non-emitting technologies are developed and deployed. Despite this optimistic view of biologic sequestration in a concentration strategy, there are issues that warrant attention. These include a concern that at some point there will be diminishing returns as trees reach saturation points. The issues of leakage and permanence must also be addressed. Although the study did not quantify these benefits, the work group also noted conservation of tropical forests is potentially an untapped source of reductions that could also provide significant ancillary benefits. Overview: Greenhouse gases or CO2 are both emitted and taken up or sequestered through land use activities, especially forestry and management of cropland and rangeland. Collectively, these actions are referred to as biologic sequestration14. In the United States, from 1990-1995, a net amount of roughly 275 MMTCE per year was sequestered through these activities, or about 15-18% of annual total emissions.15 The Keystone study suggests that with appropriate incentives for landowners, biologic sequestration in the United States can be enhanced significantly and at costs of roughly $25-$50/tonne C or roughly $6-$12/ton CO2. This analysis concludes that with lag times of 5 to 10 years, the sector could achieve between roughly 95 and 200 MMTC reductions in 2030 at these carbon values. This represents roughly 15-30% of the 550ppmv goal and 25-50% of the 650pmmv goal. However, over time the level of sequestered carbon is likely to diminish as the capacity of lands to sequester carbon is reduced. As a result, biologic sequestration appears to be a promising component of a “bridging” strategy that can provide significant CO2 reductions in the short-term while less carbon emitting and non-carbon emitting technologies are developed to achieve the necessary reduction in the longer-term. This section describes: (1) the sequestration “inventory”; (2) the model used to develop estimates; (3) the results; and (4) caveats to the study and other issues that require further analysis. Inventory: In the U.S. emissions inventory, sequestration activities are summed into a net figure that reflects both sequestration and emissions resulting from land use activities. Because of the re-growth of forests, abandonment of agriculture in some areas, fire suppression, and other factors, the United States is a net carbon sink in the land use sector. (The tropics, on the other hand, are a significant source of ghg emissions resulting largely from deforestation.). Thus, emissions from deforestation associated with development, timber harvests, soil disturbance from agriculture, and other land-uses is countered by the increase in carbon sequestration in newly planted trees, growth of existing forests, changes in agriculture practices and other land-use changes. Over the past decade the amount of carbon sequestered through these biologic processes has stayed relatively constant at about 275 MMTC per year (though it is declining over time) and as such is treated as the reference case for sequestration. This assumption is controversial. However, there is no alternative estimate of the reference case that is widely accepted. The Model: The sequestration study used a model to explore incremental increases in sequestration above the annual average net sequestration levels resulting from policies that would create a market price (or demand) for carbon and that enabled individual landowners or
14 There are several types of sequestration including biologic or terrestrial, geologic and ocean. This paper explores only biologic sources. Any reference in this section to sequestration generally should be considered a reference to biologic sequestration. 15U.S. EPA, Table ES -1, Inventory of U.S. Greenhouse Gas Emissions and Sinks: 1990-1999; April 2001.
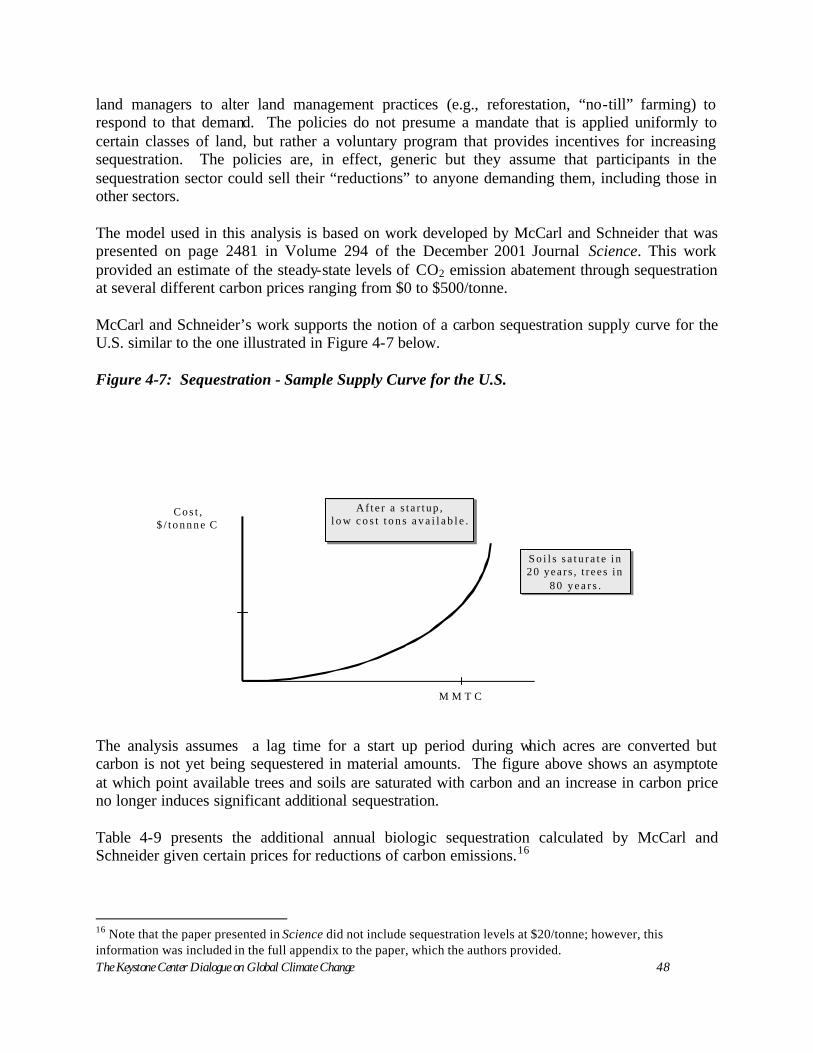
The Keystone Center Dialogue on Global Climate Change 48
land managers to alter land management practices (e.g., reforestation, “no-till” farming) to respond to that demand. The policies do not presume a mandate that is applied uniformly to certain classes of land, but rather a voluntary program that provides incentives for increasing sequestration. The policies are, in effect, generic but they assume that participants in the sequestration sector could sell their “reductions” to anyone demanding them, including those in other sectors. The model used in this analysis is based on work developed by McCarl and Schneider that was presented on page 2481 in Volume 294 of the December 2001 Journal Science. This work provided an estimate of the steady-state levels of CO2 emission abatement through sequestration at several different carbon prices ranging from $0 to $500/tonne. McCarl and Schneider’s work supports the notion of a carbon sequestration supply curve for the U.S. similar to the one illustrated in Figure 4-7 below. Figure 4-7: Sequestration - Sample Supply Curve for the U.S.
C o s t ,$ / t o n n n e C
M M T C
A f t e r a s t a r t u p ,l o w c o s t t o n s a v a i l a b l e .
Af t e r a s t a r t up ,l o w c o s t t o n s a v a i l a b l e .
So i l s s a tu ra t e i n20 yea r s , t r ees in
8 0 y e a r s .
S o i l s s a t u r a t e i n20 yea r s , t r ees in
8 0 y e a r s .
The analysis assumes a lag time for a start up period during which acres are converted but carbon is not yet being sequestered in material amounts. The figure above shows an asymptote at which point available trees and soils are saturated with carbon and an increase in carbon price no longer induces significant additional sequestration. Table 4-9 presents the additional annual biologic sequestration calculated by McCarl and Schneider given certain prices for reductions of carbon emissions.16
16 Note that the paper presented in Science did not include sequestration levels at $20/tonne; however, this information was included in the full appendix to the paper, which the authors provided.
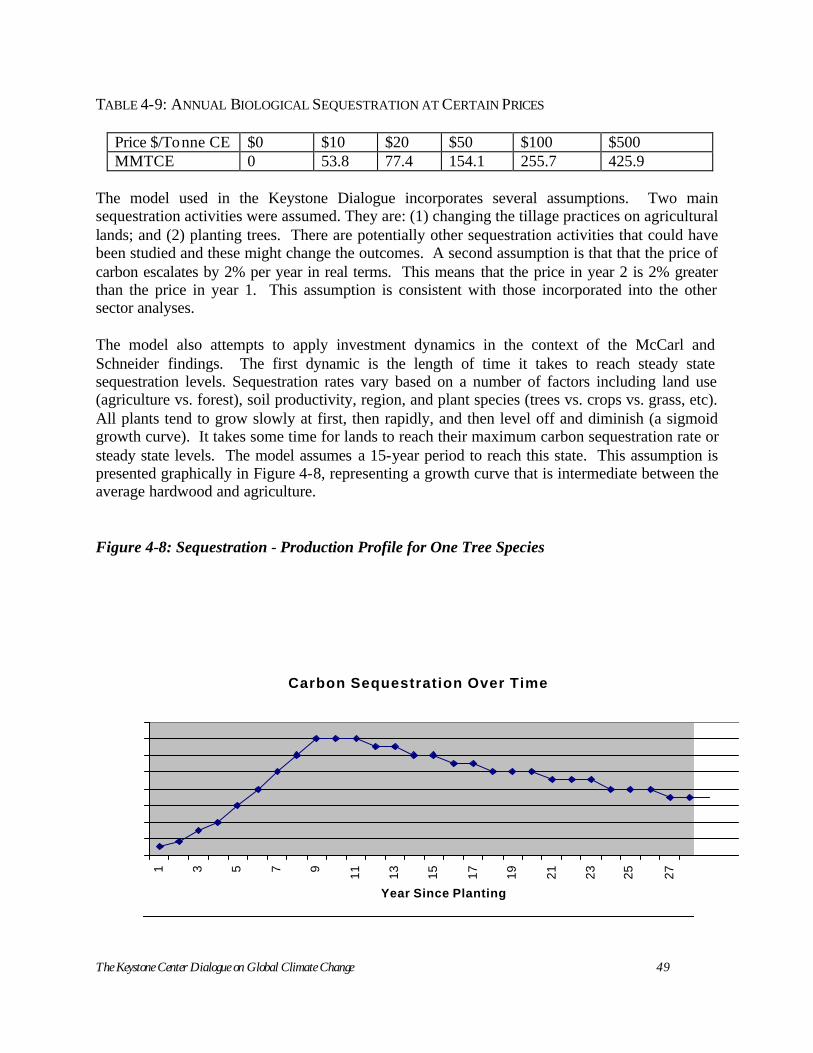
The Keystone Center Dialogue on Global Climate Change 49
TABLE 4-9: ANNUAL BIOLOGICAL SEQUESTRATION AT CERTAIN PRICES
Price $/Tonne CE $0 $10 $20 $50 $100 $500 MMTCE 0 53.8 77.4 154.1 255.7 425.9
The model used in the Keystone Dialogue incorporates several assumptions. Two main sequestration activities were assumed. They are: (1) changing the tillage practices on agricultural lands; and (2) planting trees. There are potentially other sequestration activities that could have been studied and these might change the outcomes. A second assumption is that that the price of carbon escalates by 2% per year in real terms. This means that the price in year 2 is 2% greater than the price in year 1. This assumption is consistent with those incorporated into the other sector analyses. The model also attempts to apply investment dynamics in the context of the McCarl and Schneider findings. The first dynamic is the length of time it takes to reach steady state sequestration levels. Sequestration rates vary based on a number of factors including land use (agriculture vs. forest), soil productivity, region, and plant species (trees vs. crops vs. grass, etc). All plants tend to grow slowly at first, then rapidly, and then level off and diminish (a sigmoid growth curve). It takes some time for lands to reach their maximum carbon sequestration rate or steady state levels. The model assumes a 15-year period to reach this state. This assumption is presented graphically in Figure 4-8, representing a growth curve that is intermediate between the average hardwood and agriculture. Figure 4-8: Sequestration - Production Profile for One Tree Species
Carbon Sequestration Over Time
1 3 5 7 9 11 13 15 17 19 21 23 25 27
Year Since Planting
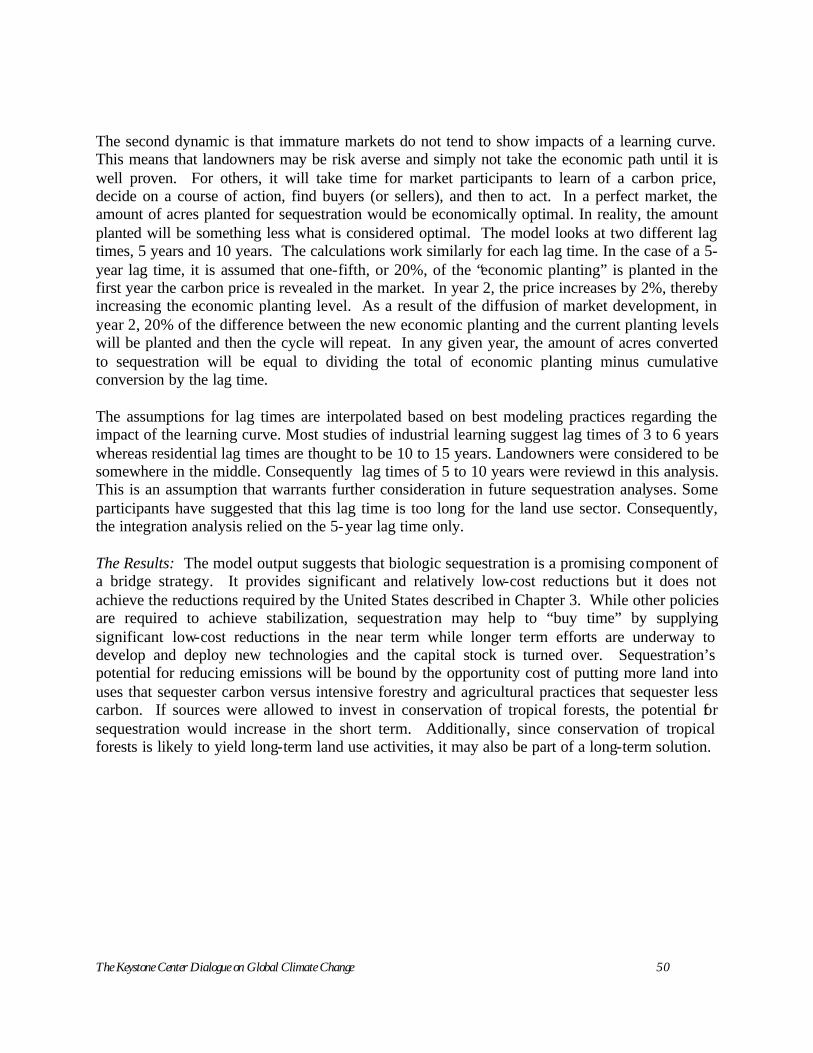
The Keystone Center Dialogue on Global Climate Change 50
The second dynamic is that immature markets do not tend to show impacts of a learning curve. This means that landowners may be risk averse and simply not take the economic path until it is well proven. For others, it will take time for market participants to learn of a carbon price, decide on a course of action, find buyers (or sellers), and then to act. In a perfect market, the amount of acres planted for sequestration would be economically optimal. In reality, the amount planted will be something less what is considered optimal. The model looks at two different lag times, 5 years and 10 years. The calculations work similarly for each lag time. In the case of a 5-year lag time, it is assumed that one-fifth, or 20%, of the “economic planting” is planted in the first year the carbon price is revealed in the market. In year 2, the price increases by 2%, thereby increasing the economic planting level. As a result of the diffusion of market development, in year 2, 20% of the difference between the new economic planting and the current planting levels will be planted and then the cycle will repeat. In any given year, the amount of acres converted to sequestration will be equal to dividing the total of economic planting minus cumulative conversion by the lag time. The assumptions for lag times are interpolated based on best modeling practices regarding the impact of the learning curve. Most studies of industrial learning suggest lag times of 3 to 6 years whereas residential lag times are thought to be 10 to 15 years. Landowners were considered to be somewhere in the middle. Consequently lag times of 5 to 10 years were reviewd in this analysis. This is an assumption that warrants further consideration in future sequestration analyses. Some participants have suggested that this lag time is too long for the land use sector. Consequently, the integration analysis relied on the 5-year lag time only. The Results: The model output suggests that biologic sequestration is a promising component of a bridge strategy. It provides significant and relatively low-cost reductions but it does not achieve the reductions required by the United States described in Chapter 3. While other policies are required to achieve stabilization, sequestration may help to “buy time” by supplying significant low-cost reductions in the near term while longer term efforts are underway to develop and deploy new technologies and the capital stock is turned over. Sequestration’s potential for reducing emissions will be bound by the opportunity cost of putting more land into uses that sequester carbon versus intensive forestry and agricultural practices that sequester less carbon. If sources were allowed to invest in conservation of tropical forests, the potential for sequestration would increase in the short term. Additionally, since conservation of tropical forests is likely to yield long-term land use activities, it may also be part of a long-term solution.
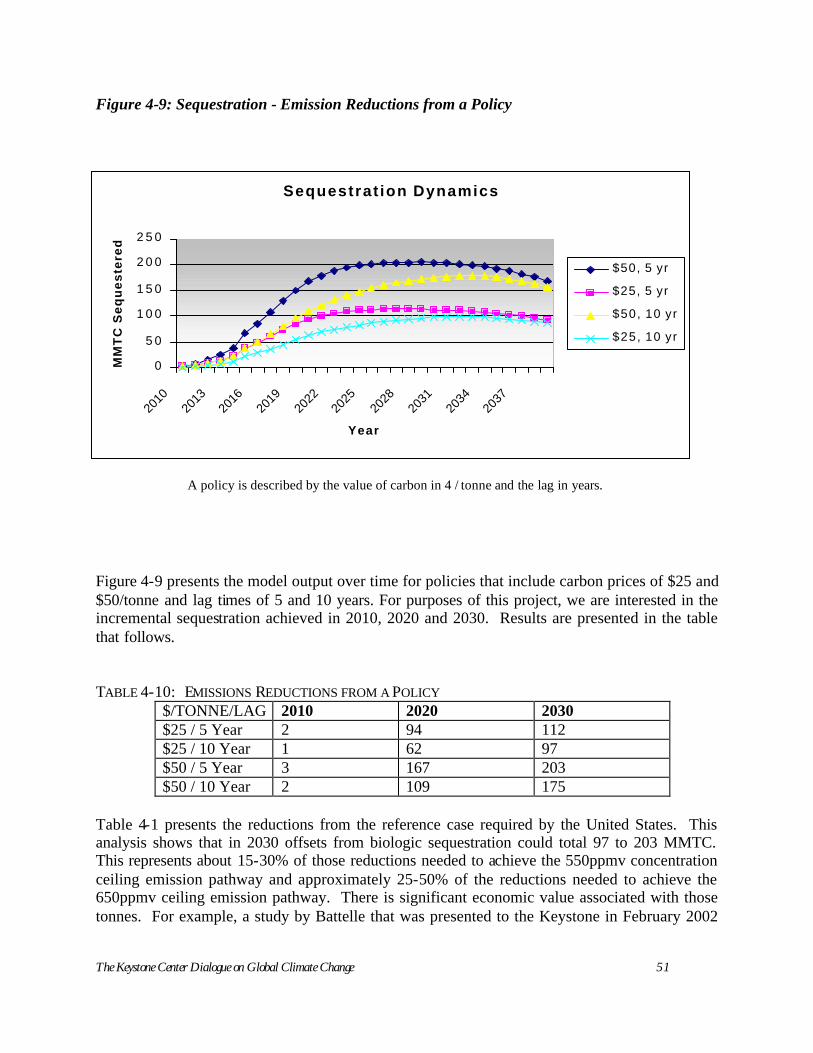
The Keystone Center Dialogue on Global Climate Change 51
Figure 4-9: Sequestration - Emission Reductions from a Policy
Figure 4-9 presents the model output over time for policies that include carbon prices of $25 and $50/tonne and lag times of 5 and 10 years. For purposes of this project, we are interested in the incremental sequestration achieved in 2010, 2020 and 2030. Results are presented in the table that follows. TABLE 4-10: EMISSIONS REDUCTIONS FROM A POLICY
$/TONNE/LAG 2010 2020 2030 $25 / 5 Year 2 94 112 $25 / 10 Year 1 62 97 $50 / 5 Year 3 167 203 $50 / 10 Year 2 109 175
Table 4-1 presents the reductions from the reference case required by the United States. This analysis shows that in 2030 offsets from biologic sequestration could total 97 to 203 MMTC. This represents about 15-30% of those reductions needed to achieve the 550ppmv concentration ceiling emission pathway and approximately 25-50% of the reductions needed to achieve the 650ppmv ceiling emission pathway. There is significant economic value associated with those tonnes. For example, a study by Battelle that was presented to the Keystone in February 2002
Sequestrat ion Dynamics
0
5 0
1 0 0
1 5 0
2 0 0
2 5 0
2010
2013
2016
2019
2022
2025
2028
2031
2034
2037
Year
MM
TC
Se
qu
es
tere
d
$50, 5 yr
$25, 5 yr
$50, 10 yr
$25, 10 yr
A policy is described by the value of carbon in 4 / tonne and the lag in years.
The Keystone Center Dialogue on Global Climate Change 52
concludes that biologic sequestration could reduce the present value costs of achieving various CO2 ppmv concentrations by the end of the century by about one-quarter. It is important to note that these results do not account for potential leakage and as a result may overestimate carbon reduction benefits. Further, opportunity costs for land use will impact the net amount of sequestration in ways that are not estimated here. Sequestration competes with development, agriculture and intensive forestry. Issues For Further Analysis: There are three important sequestration related issues that warrant further analysis. They include leakage, permanence, and transaction costs. Leakage, in this case, refers to carbon releases from substitution and other activities that would not have occurred but for the sequestration activities. However, it is important to note that leakage is important in all sectors of this project. The concern about leakage is that in a trading regime, participants could begin to trade reductions that did not occur and as a result net emissions could increase even as it appeared that emission reductions were being achieved. As a reduction sector becomes more complex, it becomes increasingly difficult to prevent leakage. When this happens, it may make sense to either segregate the credits from sources in sectors that may experience leakage or in some other way preserve the integrity of emissions reductions and emissions measurements. In terms of sequestration leakage, studies suggest that it is largely a function of activity. Certain sequestration activities are easier to monitor and therefore it is easier to prevent leakage in those activity areas. For example, regional surveys of acres planted in trees could be used to evaluate net acres planted in trees in any given year. Potentially, policies could be developed and put in place to ensure that reduction credits created through this activity were real. On the other hand, forest preservation raises several concerns. Chief among these is that forest conservation involves saving a forest that would otherwise have been harvested. Harvesting in other areas will eliminate the benefits of forgone production. However, in certain areas, such as old growth and tropical forests, there is a significant ecologic value for this activity in addition to the carbon benefits. Thus, there is great interest in developing policies incentives for this activity, but as of yet a standardized approach to leakage has not yet been developed. Permanence refers to the durability of sequestration once it is in place. All projects, sinks or not, incorporate a measure of risk. For sinks, one risk is reversibility. This means that the carbon can be re-released as a result of management change or natural event. This means that if the trees die or natural processes such as wildfires or mudslides occur significant amounts of carbon that were sequestered could end up back in the atmosphere. The work group explo red several policy options to address this concern. They include discounting carbon, and variations of a liquidated damages approach. This review was at the summary level. The work group saw value in the liquidated damages approach. Under this approach, the emphasis is on tracking sinks projects over time. If credited carbon is later lost, it must be replaced. Requiring this will result in the market creating tools such as insurance products and risk pooling to mitigate such risk. In carbon credit discounting, the amount of credit issued for each tonne of carbon sequestered would be discounted to reflect the potential for carbon to be released over time. In other words,
The Keystone Center Dialogue on Global Climate Change 53
a landowner might receive 0.4 credits for each tonne sequestered. The benefit of this approach is that it is relatively simple. The problem is that it is arbitrary, and does not create incentives for the development of tools to address permanence, and could appear to be punitive to good projects. Under a liquidated damages approach, the carbon seller (the landowner) would guarantee the reductions. If his forest burned down then he would be required to utilize the market to replace the amount of carbon that had been sold. In reality, it is unlikely that market participants will be eager to sign a “permanent” contract for sink credits. Instead, they may develop 10- or 20-year contracts with an option to renew. The value of these contracts will be the net present value of replacing the tons at some future time. This approach is similar to renting carbon with an option to renew. The price of tonnes will reflect the costs of activities such as monitoring, verification and insurance, which are required to gain access to tonnes over a fixed time period. If the sequestered carbon were released at some point in the future then the buyer would simply find a different source of reductions at that time. Another version of the liquidated damages approach is referred to as risk pooling. In this approach, one would develop a portfolio of projects and assign risk to various acres of land. A source wishing to buy reductions would then pay a risk-discounted rate for the reductions from the portfolio rather than being the sole investor in a project. This type of approach could also include an insurance component where the landowners would insure their land for the carbon value. It could be envisioned that multiple buyers might partner to manage some of the risk associated with an individual project. The two basic policy approaches vary fundamentally in how they view monitoring and accountability. In the liquidated damages approach, market rules require monitoring and full liability for carbon loss. As a result, pooling and insurance tools naturally develop in the market. Transactions costs are derived from the costs of measuring, monitoring and tracking carbon reductions resulting from sequestration activities. In general, the theory of economies of scale applies to carbon economics. In the sequestration arena, transaction costs tend to be higher than in other sectors. This is driven by the low carbon-to-acre ratio (compare the hypothetical case of a normal 3,000 MW coal-burning utility with the potential to generate 4 MMTCE/year versus 500 acres with the potential to generate 500 tonnes of carbon after 15 years). At this rate, aggregation of reductions is more difficult and expensive. The work group explored several policy options to reduce transactions costs associated with sequestration. These include policies that would help to identify the easiest and least expensive types of sequestration reductions, options for evaluating the net sequestration levels rather than requiring an individual project focus. Other Policy Considerations & Questions for Discussion: The Dialogue attempted to include a broad array of perspectives on the climate change issue. With respect to sequestration, the perspective of those critical of sequestration activities was not fully represented. It was acknowledged in the work groups and in the plenary sessions that those opposed to sequestration
The Keystone Center Dialogue on Global Climate Change 54
have expressed at least two main concerns. The first concern is that if poorly executed, sequestration activities could actually have adverse impacts on biodiversity. The primary concern seems to be that it is easier and less costly to plant monoculture plots or to otherwise avoid an optimum biodiversity planting. The group did not address this issue fully but did look for ways to encourage landowners to take advantage of “layering” in which multiple benefits in addition to carbon sequestration accrue to the landowner and to the public. Other concerns are that sequestration should not be viewed as an alternative to investment in the development of lower emitting technologies or the deployment of more efficient existing technologies that would reduce emissions before they occurred in lieu of sequestering them from the atmosphere once they have occurred. The work group did not address this concern directly but re-emphasizes the finding that sequestration is not a silver bullet to solving the climate issue. The data utilized for this analysis leads the Dialogue to conclude that sequestration can help reduce the overall costs of achieving concentration ceilings and be a part of a bridge strategy while new technologies are developed. D) Energy Intensive Manufacturing Sector Summary: This analysis used the AMIGA model to examine a subsector of the SIC Code manufacturing sector. This group, which is a subsector of the SIC Code industrial sector, aggregates seven sectors into the EIM sector: Petroleum Refining; Iron and Steel; Aluminum; Chemicals; Pulp and Paper; Chlorine and Chlorates; and, Stone, Clay and Glass. In the model, this sector achieved 40-52 MMTC reductions in 2020 and 58-71 MMTC reductions in 2030 under per-tonne carbon prices of $25 and $50. This amount is roughly 9-11% of the U.S. share of reductions to achieve a 550ppmv concentration ceiling emission pathway and roughly 14-18% of reductions to achieve a 650ppmv ceiling emission pathway in 2030. This sector was difficult to model in large part because of the diversity of economic activity. Yet, developing separate models for each segment would have been prohibitively expensive in terms of cost and time. Another challenge in reviewing this sector is in assessing the true impact of leakage. Several participants believe that leakage will occur when production of energy intensive goods in countries that have not imposed emissions limitations displaces production of goods in countries that have imposed emissions limitations, but the model results do not indicate a major impact from this kind of leakage.. Overview: The EIM Sector represents diverse industries engaged in several economic activities. The exact bounds of the sector are arbitrary, depending on the definition of “energy intensive.” At a minimum the group would include petroleum refining; iron and steel; aluminum; chemicals; pulp and paper; chlorine and chlorates; and stone, clay and glass. These sectors constitute a subset of the total manufacturing and industrial sectors. The EIM sector consumes a significant percentage of the total energy used by industry. Because of the analytical tools available, the Dialogue addressed the whole EIM sector in its analysis. Dialogue participants represented several key energy intensive sectors including petroleum refining, chemicals and aluminum.
The Keystone Center Dialogue on Global Climate Change 55
The total industrial sector emitted about 478 million tonnes of carbon in 2000. The EIM sector emitted about 300 million tonnes, representing approximately 20% of total U.S. emissions inventory (direct carbon emissions). In addition, approximately 200 million tonnes of emissions from the generation sector result from serving industrial electricity load (indirect carbon emissions). Combined direct and indirect EIM emissions represent approximately 30% of the U.S. total. The analysis showed that the sector could achieve roughly 58-71 MMTC reductions in 2030 at carbon values of $25 and $50/Tonne. This represents roughly 9-11% of the amount necessary to achieve the 550ppmv emission pathway and 14-18% of the amount to achieve the 650ppmv emission pathway. Adopting a policy that provides carbon emissions a value in the industrial sector increases the returns from investments in energy efficiency. However, the breadth of industrial processes undertaken by the EIM sector makes detailed analysis extremely difficult. The Model: The Keystone staff worked with a model that reported detailed sectoral patterns into an aggregate total in order to investigate the industry emission reductions that result from lower energy use. This model is known as the AMIGA model17, and it was developed by the Argonne National Laboratory. It is a detailed model of the U.S. economy and includes modeling of international trade. This model represents each industry with a curve of how companies will substitute capital and labor for energy as energy prices change. The model also passes on the resulting price increases to other industries or final consumers, who respond by adjusting their consumption. The capital/labor/energy tradeoff function is the key determinant of the emission reductions that result from the carbon price. While these curves are based on specific technical options, the model results do not indicate the exact process chosen. Another energy intensive manufacturing sector response to carbon prices would likely be DSM activities. The reductions ensuing from DSM in this sector are accounted for in the electric sector and are described earlier in this chapter. Model Results: Carbon emissions reductions achieved by reduced combustion of fossil fuels are zero, 17 million tonnes and 19 million tonnes in 2010, 2020, and 2030, respectively, in the $25 per tonne policy case. When prices are increased to $50 per tonne, the resulting reductions are one million tonnes, 37 million tonnes and 45 million tonnes in the three respective time horizons. The small amounts of emission reductions in 2010 reflect the requirement of adequate lead-time to make significant changes in production processes. However, actual experience by Dialogue participants show that there are likely to be a large number of smaller energy improvement activities that could result in appreciable emissions reductions over shorter time scales. The AMIGA model was used to investigate a second issue, policies that encourage new technology development. In the model the discount rate for making capital investments was reduced. This makes efficiency improvements more attractive. This change in assumptions
17 The AMIGA model tracks energy and economic output variables for more than 200 total sectors. Economic output is aggregated from 70 sectors for reporting purposes, including 44 industrial sectors. AMIGA’s energy and carbon emission reporting is aggregated from five sectors, including residential, commercial, transport, electric, and industrial. There was not sufficient time during the course of the project to write a new report providing the same level of detail for the components of the industrial sector.
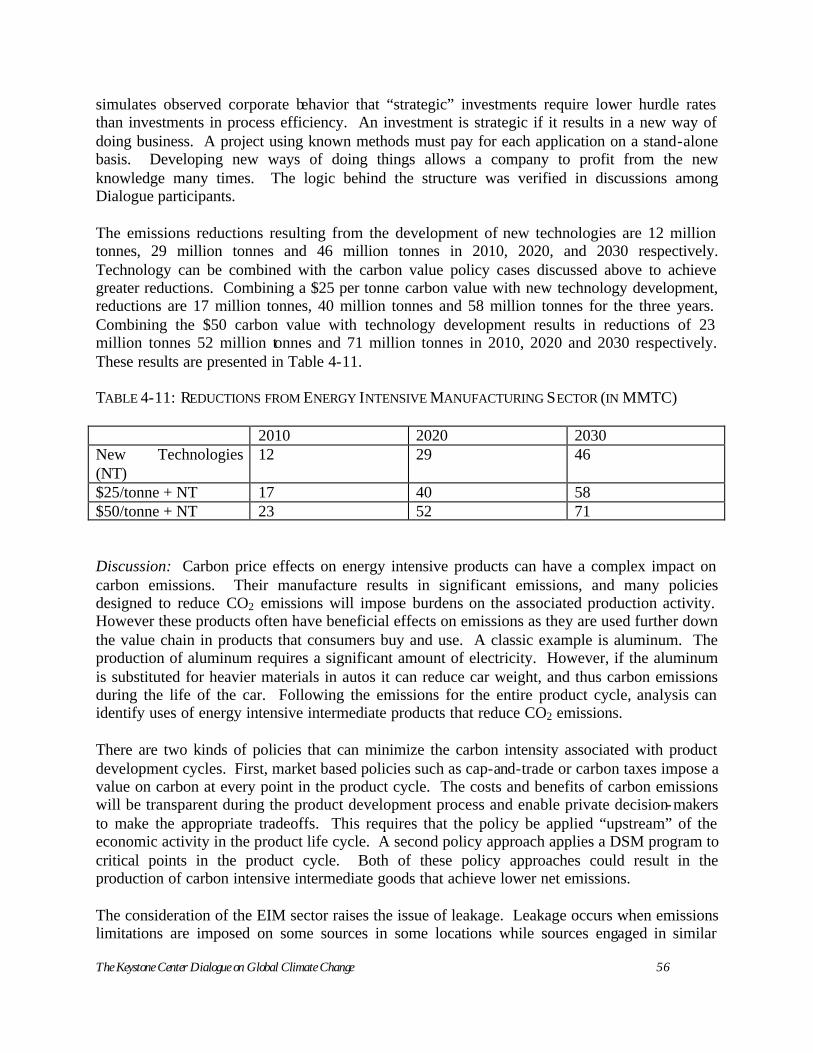
The Keystone Center Dialogue on Global Climate Change 56
simulates observed corporate behavior that “strategic” investments require lower hurdle rates than investments in process efficiency. An investment is strategic if it results in a new way of doing business. A project using known methods must pay for each application on a stand-alone basis. Developing new ways of doing things allows a company to profit from the new knowledge many times. The logic behind the structure was verified in discussions among Dialogue participants. The emissions reductions resulting from the development of new technologies are 12 million tonnes, 29 million tonnes and 46 million tonnes in 2010, 2020, and 2030 respectively. Technology can be combined with the carbon value policy cases discussed above to achieve greater reductions. Combining a $25 per tonne carbon value with new technology development, reductions are 17 million tonnes, 40 million tonnes and 58 million tonnes for the three years. Combining the $50 carbon value with technology development results in reductions of 23 million tonnes 52 million tonnes and 71 million tonnes in 2010, 2020 and 2030 respectively. These results are presented in Table 4-11. TABLE 4-11: REDUCTIONS FROM ENERGY INTENSIVE MANUFACTURING SECTOR (IN MMTC) 2010 2020 2030 New Technologies (NT)
12 29 46
$25/tonne + NT 17 40 58 $50/tonne + NT 23 52 71 Discussion: Carbon price effects on energy intensive products can have a complex impact on carbon emissions. Their manufacture results in significant emissions, and many policies designed to reduce CO2 emissions will impose burdens on the associated production activity. However these products often have beneficial effects on emissions as they are used further down the value chain in products that consumers buy and use. A classic example is aluminum. The production of aluminum requires a significant amount of electricity. However, if the aluminum is substituted for heavier materials in autos it can reduce car weight, and thus carbon emissions during the life of the car. Following the emissions for the entire product cycle, analysis can identify uses of energy intensive intermediate products that reduce CO2 emissions. There are two kinds of policies that can minimize the carbon intensity associated with product development cycles. First, market based policies such as cap-and-trade or carbon taxes impose a value on carbon at every point in the product cycle. The costs and benefits of carbon emissions will be transparent during the product development process and enable private decision-makers to make the appropriate tradeoffs. This requires that the policy be applied “upstream” of the economic activity in the product life cycle. A second policy approach applies a DSM program to critical points in the product cycle. Both of these policy approaches could result in the production of carbon intensive intermediate goods that achieve lower net emissions. The consideration of the EIM sector raises the issue of leakage. Leakage occurs when emissions limitations are imposed on some sources in some locations while sources engaged in similar
The Keystone Center Dialogue on Global Climate Change 57
activities in other locations are not controlled. The emission limitations that are imposed on sources increase the costs of carbon emitting activity relative to the cost of those sources that are not controlled. This discrepancy creates an economic incentive to shift carbon-emitting activity from countries that imposed emissions limits values to locations that have not imposed controls on economic activities. The resulting increase in emissions compared to a no policy world is called leakage. EIM is already migrating to lesser-developed economies for reasons having nothing to do with environmental controls. In a global economy it is reasonable to assume that leakage would increase to at least some extent, unless carbon emissions are controlled worldwide. Of all ghg-emitting sectors of the economy, EIM is the primary one where leakage could occur unless appropriate corrective policies such as carbon taxes on energy intensive imports were instituted. There are instances where leakage can be “good” in terms of ghg emissions reductions. In the first possibility, economic activity could shift from an inefficient plant in a controlled area to a more efficient plant in a non-controlled area. If the production of the sector remains constant across the world then the leakage has reduced global carbon emissions. In a second possibility, the economic activity could shift to a non-Annex 1 country. This stimulates economic activity, and increases developing country GDP, expediting the dates in which some countries can graduate to Annex I. This second possibility is more remote than the first one, both in its causality and its timing. The AMIGA model contains an international trade component. It tracks the dollar flows with trade, allowing the tracking of the trade deficit. In the model runs, the trade deficit increases $5 billion in 2020 and $20 billion in 2030 for the $50 dollar carbon value case. Against the background of a $20 trillion economy, the change is trivial. Several caveats need to be raised. First, modeling of international trade activity is extremely difficult and complex to perform, particularly for a model that contains significant detail on the energy sector. Additionally, since the measure of the activity is denominated in dollars rather than the energy intensity of the imports and exports the trade balance can mask leakage. Finally, even small impacts across all of EIM could be associated with devastating impacts in particular industries. The reader should note that the emissions trajectory that results from the international emission allowance sharing rules contains an estimate of the leakage from the United States and other Annex 1 countries to the non-Annex 1 part of the world.
The Keystone Center Dialogue on Global Climate Change 58
E) The Auto Sector Summary: The analysis used a market-driven model to establish a business as usual case for this sector and to explore the impact of carbon prices and various policies on consumer preferences for lower-emitting vehicles. In general, the model showed that carbon prices of $25 and $50/tonne carbon alone induced minimal reductions. However, the introduction of policies with larger incentives (including a fuel tax and subsidies designed to facilitate demand for hybrid electric vehicles (HEVs)) increased the level of reductions. Some dialogue participants suggested changes to the model that, short of changing the model’s underpinnings, would change the baseline case including: (1) baseline emissions; (2) the timing of reductions; and (3) the mix of available technology. Some participants believe that these changes would have resulted in greater reductions than those shown in the model that was utilized, although they would not have changed the basic finding that the carbon price signals considered were not sufficient alone to induce significant emission reductions. The Dialogue was unable to make these changes due to resource constraints on time and funding. Thus, technical staff did not undertake further work on the analysis. Because of the level of concern about the model inputs and results, and inability to undertake further analysis, the Dialogue is not including the emissions reductions for the passenger automobile sector study in the integrated policy analysis. Instead, it recognizes the potential for significant reductions from the automobile sector and believes that further work is necessary to determine the reductions that may be achieved. Introduction: The automotive sector that was assessed in this study was comprised of the full variety of passenger cars, sport utility vehicles (SUVs), trucks and vans. The purchase and operation of each of these vehicle types is motivated by a complex set of individual drivers’ needs and preferences. This study focuses on emissions resulting from the combustion of motor fuel. These emissions account for approximately 60% of the total transportation sector emissions or about 311 MMTC in 2001, according to the Energy Information Administration18 estimates. The transportation sector as a whole was responsible for 511.6 MMTC in 2001. This study of the automobile sector does not include other emissions resulting from the combustion of other transportation fuels including distillate fuels (diesel), jet fuel, and heavy oil. The Model: Keystone staff worked with some Dialogue participants to develop a model of the U.S. automotive industry designed to analyze the effect of various policies and measures on consumer purchases and thus on transportation sector emissions. This model was developed specifically for the Global Climate Change Dialogue, incorporating data from published studies and proprietary databases. Figure 4-10 shows the structure of the model. The model differs from many other published models in its attempt to describe the interactions between the automotive industry’s design of new vehicles and retail consumers’ purchase decisions based on their preferences for automotive transportation.
18 Emissions of Greenhouse Gases in the United States 2001, Energy Information Administration, U.S. Department of Energy, December 2002. Available at ftp://ftp.eia.doe.gov/pub/oiaf/1605/cdrom/pdf/ggrpt/057301.pdf
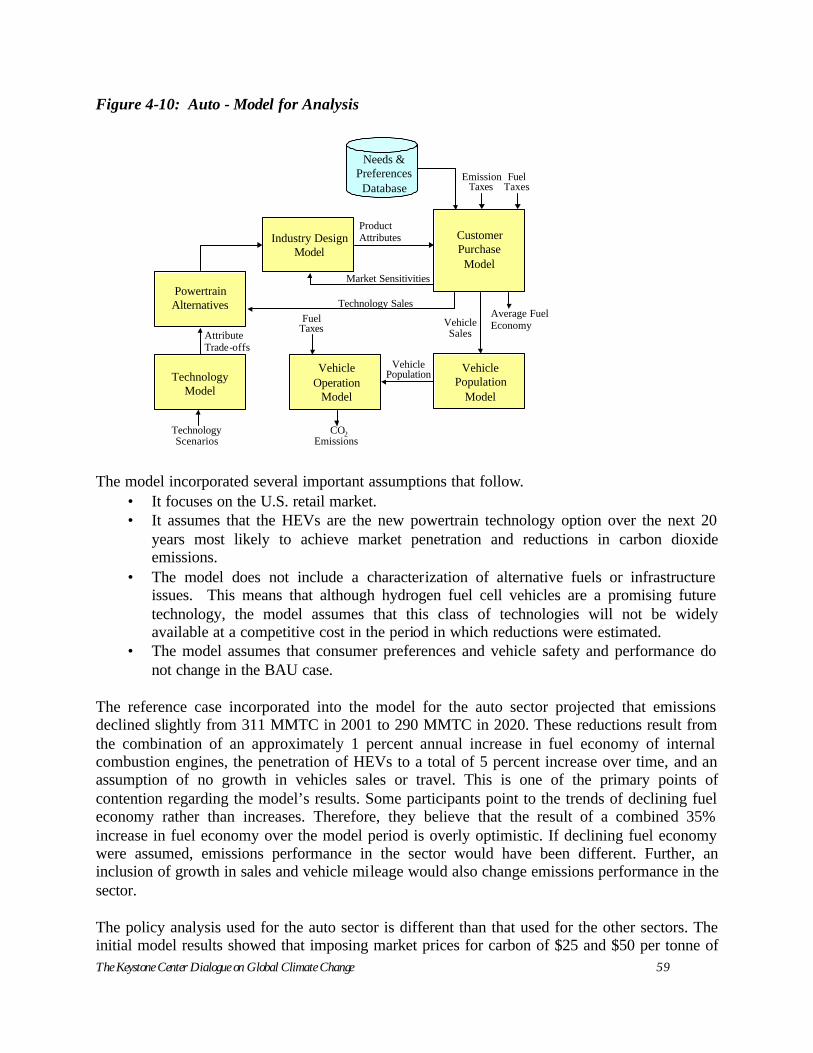
The Keystone Center Dialogue on Global Climate Change 59
Figure 4-10: Auto - Model for Analysis
Industry Design Model
Customer Purchase Model
Needs & Preferences Database
Fuel Taxes
Emission Taxes
ProductAttributes
Vehicle Operation
Model
Fuel Taxes
CO2 Emissions
Vehicle Population Vehicle
Population Model
Vehicle Sales
PowertrainAlternatives
Technology Model
TechnologyScenarios
Market Sensitivities
AttributeTrade-offs
Average Fuel Economy
Technology Sales
The model incorporated several important assumptions that follow.
• It focuses on the U.S. retail market. • It assumes that the HEVs are the new powertrain technology option over the next 20
years most likely to achieve market penetration and reductions in carbon dioxide emissions.
• The model does not include a characterization of alternative fuels or infrastructure issues. This means that although hydrogen fuel cell vehicles are a promising future technology, the model assumes that this class of technologies will not be widely available at a competitive cost in the period in which reductions were estimated.
• The model assumes that consumer preferences and vehicle safety and performance do not change in the BAU case.
The reference case incorporated into the model for the auto sector projected that emissions declined slightly from 311 MMTC in 2001 to 290 MMTC in 2020. These reductions result from the combination of an approximately 1 percent annual increase in fuel economy of internal combustion engines, the penetration of HEVs to a total of 5 percent increase over time, and an assumption of no growth in vehicles sales or travel. This is one of the primary points of contention regarding the model’s results. Some participants point to the trends of declining fuel economy rather than increases. Therefore, they believe that the result of a combined 35% increase in fuel economy over the model period is overly optimistic. If declining fuel economy were assumed, emissions performance in the sector would have been different. Further, an inclusion of growth in sales and vehicle mileage would also change emissions performance in the sector. The policy analysis used for the auto sector is different than that used for the other sectors. The initial model results showed that imposing market prices for carbon of $25 and $50 per tonne of
The Keystone Center Dialogue on Global Climate Change 60
carbon did not achieve significant reductions. The model suggests that consumers did not make significantly different purchase decisions when these two carbon prices were present in the market. This is due in part to the model structure and to an assumption, which is based on consumer surveys, that consumers significantly discount the benefit of avoiding the penalties for carbon emissions over the lifetime of the car. It is also due to the low value of the price relative to the cost of gasoline - a price of $25 per tonne of carbon increases the fuel price by the equivalent of $0.06/gallon. As a result, carbon prices of $25 and $50/tonne C translate into relatively small changes in predicted decisions, and the model predicts that these consumer decisions do not make buying decision changes that result in carbon reductions. These results are consistent with some other studies. Based on these initial results, the modelers explored various policies and measures that might have an effect on the consumer preferences model in order to gain an understanding of what it would take to achieve reductions from this sector. The policies and measures that were explored included: (1) significantly increasing fuel (gasoline) taxes; (2) implementing an emission tax or credit program (a “fee-bate”); (3) increasing consumer value for fuel economy (i.e., using environmental education to increase consumer value of fuel economy); (4) reducing consumer aversion to new powertrain technologies; (5) subsidies to encourage investment in HEVs; and (6) alternate technology tax credits. Each of these was tested in the model individually, and then in combinations. The Results and Discussion: The model first tested each policy and measure individually. The preliminary results of this simple policy analysis follow:
• A $250 or $500 tax credit for HEVs increases this technology’s market share, but does not have a large impact on overall average fuel economy.
• The model showed that the price of gasoline had to rise above $2.50 per gallon to achieve appreciable increases in average fuel economy and HEV market share. At $3.50/gallon, the model shows that both HEV market share and overall fuel economy begin to rise rapidly. Such prices could result from severe supply shortages or very large fuel tax increases.
• Similarly, policy that imposes fees on the purchase of low-efficiency vehicles, and provides rebates for high-efficiency vehicles (so-called “fee-bates”), which results in zero average price change across the fleet, has minimal impacts on average fuel economy. While this is true for the range of fee-bates reviewed in the model, some participants suggested that a wider range of fee-bates as well as manufacturer response be assessed in the future as has been done in some studies.19
• Sensitivity analyses of other variables find that powertrain development time can have large effects on increases in fuel economy and carbon reductions. Some participants point out that the base assumptions do not include significant HEV penetration and, as a result, a steep learning curve is imposed in the model. If, the model assumed a greater level of HEV penetration in the base case then the incremental technology change would not be
19 William B. Davis, Mark D. Levine, Kenneth Train, and K.G. Duleep. Effects of Feebates on Vehicle Fuel Economy, Carbon Dioxide Emissions, and Consumer Surplus DOE/PO--0031 (February 1995).
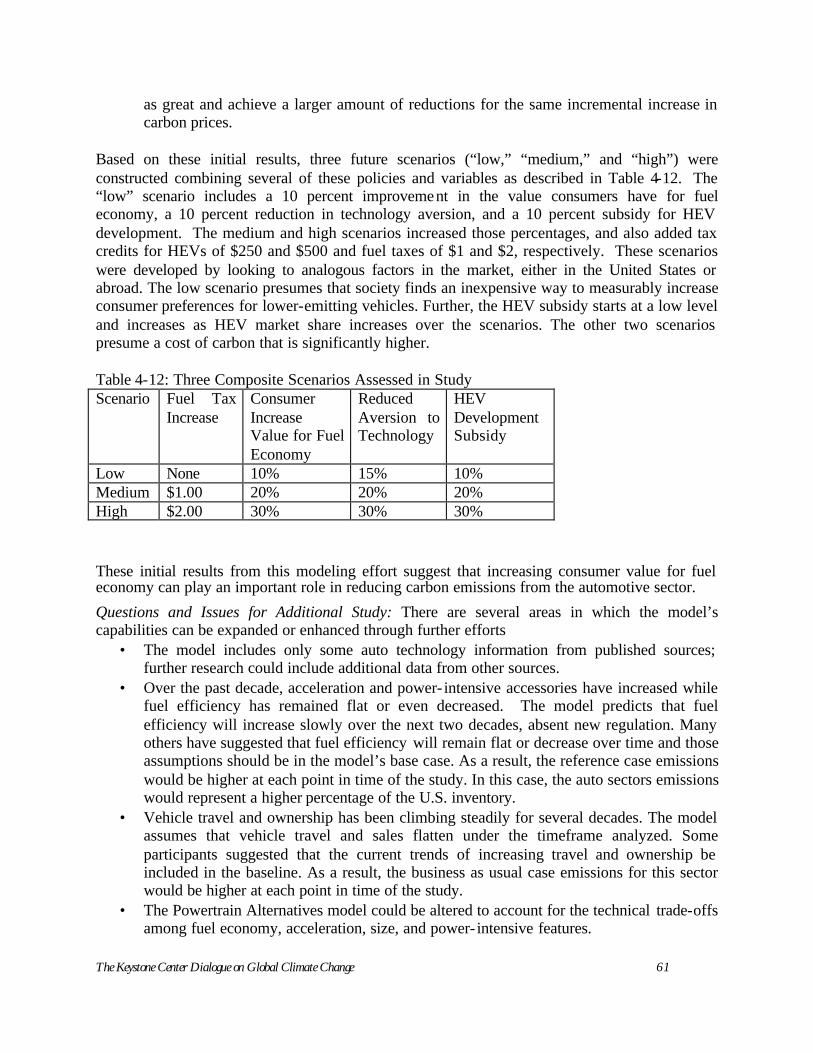
The Keystone Center Dialogue on Global Climate Change 61
as great and achieve a larger amount of reductions for the same incremental increase in carbon prices.
Based on these initial results, three future scenarios (“low,” “medium,” and “high”) were constructed combining several of these policies and variables as described in Table 4-12. The “low” scenario includes a 10 percent improvement in the value consumers have for fuel economy, a 10 percent reduction in technology aversion, and a 10 percent subsidy for HEV development. The medium and high scenarios increased those percentages, and also added tax credits for HEVs of $250 and $500 and fuel taxes of $1 and $2, respectively. These scenarios were developed by looking to analogous factors in the market, either in the United States or abroad. The low scenario presumes that society finds an inexpensive way to measurably increase consumer preferences for lower-emitting vehicles. Further, the HEV subsidy starts at a low level and increases as HEV market share increases over the scenarios. The other two scenarios presume a cost of carbon that is significantly higher. Table 4-12: Three Composite Scenarios Assessed in Study Scenario Fuel Tax
Increase Consumer Increase Value for Fuel Economy
Reduced Aversion to Technology
HEV Development Subsidy
Low None 10% 15% 10% Medium $1.00 20% 20% 20% High $2.00 30% 30% 30% These initial results from this modeling effort suggest that increasing consumer value for fuel economy can play an important role in reducing carbon emissions from the automotive sector.
Questions and Issues for Additional Study: There are several areas in which the model’s capabilities can be expanded or enhanced through further efforts
• The model includes only some auto technology information from published sources; further research could include additional data from other sources.
• Over the past decade, acceleration and power- intensive accessories have increased while fuel efficiency has remained flat or even decreased. The model predicts that fuel efficiency will increase slowly over the next two decades, absent new regulation. Many others have suggested that fuel efficiency will remain flat or decrease over time and those assumptions should be in the model’s base case. As a result, the reference case emissions would be higher at each point in time of the study. In this case, the auto sectors emissions would represent a higher percentage of the U.S. inventory.
• Vehicle travel and ownership has been climbing steadily for several decades. The model assumes that vehicle travel and sales flatten under the timeframe analyzed. Some participants suggested that the current trends of increasing travel and ownership be included in the baseline. As a result, the business as usual case emissions for this sector would be higher at each point in time of the study.
• The Powertrain Alternatives model could be altered to account for the technical trade-offs among fuel economy, acceleration, size, and power- intensive features.
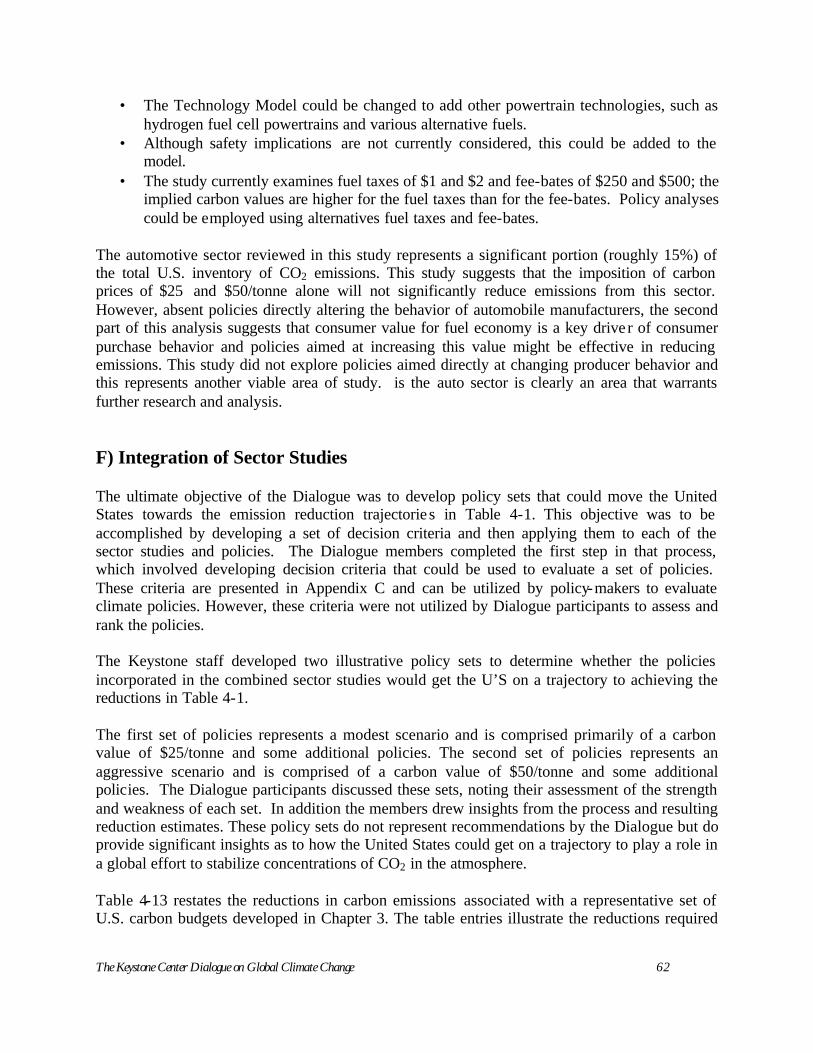
The Keystone Center Dialogue on Global Climate Change 62
• The Technology Model could be changed to add other powertrain technologies, such as hydrogen fuel cell powertrains and various alternative fuels.
• Although safety implications are not currently considered, this could be added to the model.
• The study currently examines fuel taxes of $1 and $2 and fee-bates of $250 and $500; the implied carbon values are higher for the fuel taxes than for the fee-bates. Policy analyses could be employed using alternatives fuel taxes and fee-bates.
The automotive sector reviewed in this study represents a significant portion (roughly 15%) of the total U.S. inventory of CO2 emissions. This study suggests that the imposition of carbon prices of $25 and $50/tonne alone will not significantly reduce emissions from this sector. However, absent policies directly altering the behavior of automobile manufacturers, the second part of this analysis suggests that consumer value for fuel economy is a key drive r of consumer purchase behavior and policies aimed at increasing this value might be effective in reducing emissions. This study did not explore policies aimed directly at changing producer behavior and this represents another viable area of study. is the auto sector is clearly an area that warrants further research and analysis.
F) Integration of Sector Studies The ultimate objective of the Dialogue was to develop policy sets that could move the United States towards the emission reduction trajectorie s in Table 4-1. This objective was to be accomplished by developing a set of decision criteria and then applying them to each of the sector studies and policies. The Dialogue members completed the first step in that process, which involved developing decision criteria that could be used to evaluate a set of policies. These criteria are presented in Appendix C and can be utilized by policy-makers to evaluate climate policies. However, these criteria were not utilized by Dialogue participants to assess and rank the policies. The Keystone staff developed two illustrative policy sets to determine whether the policies incorporated in the combined sector studies would get the U’S on a trajectory to achieving the reductions in Table 4-1. The first set of policies represents a modest scenario and is comprised primarily of a carbon value of $25/tonne and some additional policies. The second set of policies represents an aggressive scenario and is comprised of a carbon value of $50/tonne and some additional policies. The Dialogue participants discussed these sets, noting their assessment of the strength and weakness of each set. In addition the members drew insights from the process and resulting reduction estimates. These policy sets do not represent recommendations by the Dialogue but do provide significant insights as to how the United States could get on a trajectory to play a role in a global effort to stabilize concentrations of CO2 in the atmosphere. Table 4-13 restates the reductions in carbon emissions associated with a representative set of U.S. carbon budgets developed in Chapter 3. The table entries illustrate the reductions required
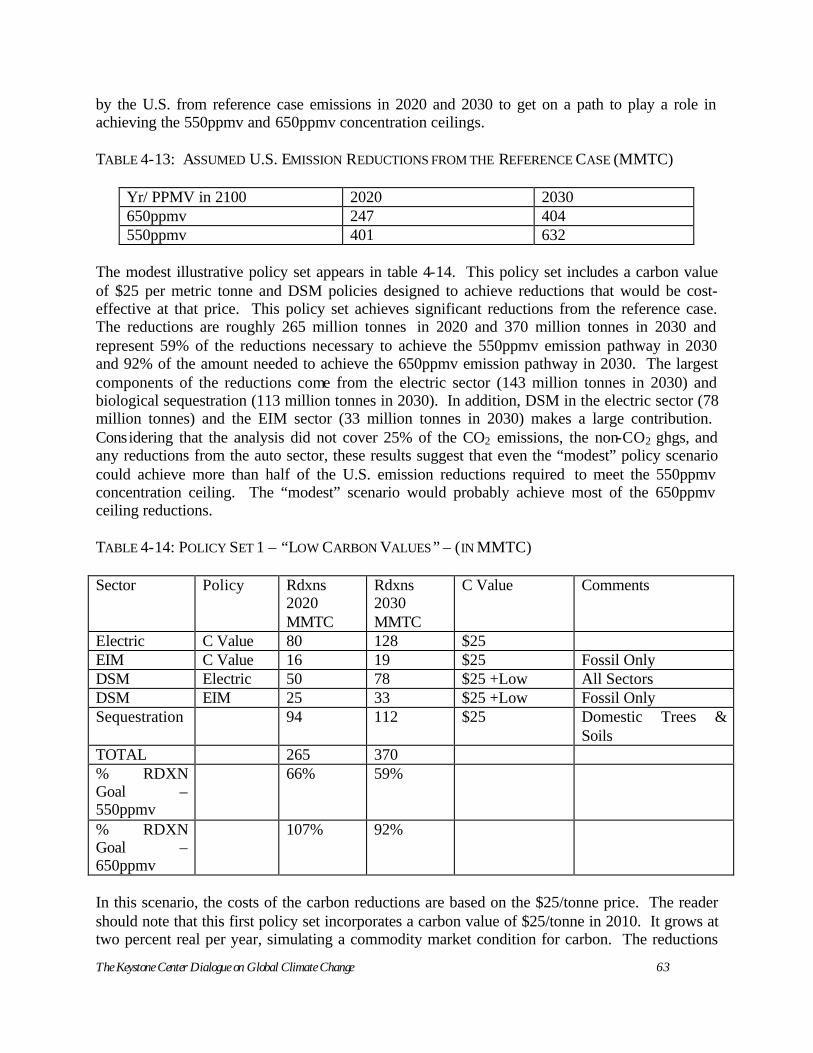
The Keystone Center Dialogue on Global Climate Change 63
by the U.S. from reference case emissions in 2020 and 2030 to get on a path to play a role in achieving the 550ppmv and 650ppmv concentration ceilings. TABLE 4-13: ASSUMED U.S. EMISSION REDUCTIONS FROM THE REFERENCE CASE (MMTC)
Yr/ PPMV in 2100 2020 2030 650ppmv 247 404 550ppmv 401 632
The modest illustrative policy set appears in table 4-14. This policy set includes a carbon value of $25 per metric tonne and DSM policies designed to achieve reductions that would be cost-effective at that price. This policy set achieves significant reductions from the reference case. The reductions are roughly 265 million tonnes in 2020 and 370 million tonnes in 2030 and represent 59% of the reductions necessary to achieve the 550ppmv emission pathway in 2030 and 92% of the amount needed to achieve the 650ppmv emission pathway in 2030. The largest components of the reductions come from the electric sector (143 million tonnes in 2030) and biological sequestration (113 million tonnes in 2030). In addition, DSM in the electric sector (78 million tonnes) and the EIM sector (33 million tonnes in 2030) makes a large contribution. Considering that the analysis did not cover 25% of the CO2 emissions, the non-CO2 ghgs, and any reductions from the auto sector, these results suggest that even the “modest” policy scenario could achieve more than half of the U.S. emission reductions required to meet the 550ppmv concentration ceiling. The “modest” scenario would probably achieve most of the 650ppmv ceiling reductions. TABLE 4-14: POLICY SET 1 – “LOW CARBON VALUES” – (IN MMTC) Sector Policy Rdxns
2020 MMTC
Rdxns 2030 MMTC
C Value Comments
Electric C Value 80 128 $25 EIM C Value 16 19 $25 Fossil Only DSM Electric 50 78 $25 +Low All Sectors DSM EIM 25 33 $25 +Low Fossil Only Sequestration 94 112 $25 Domestic Trees &
Soils TOTAL 265 370 % RDXN Goal – 550ppmv
66% 59%
% RDXN Goal – 650ppmv
107% 92%
In this scenario, the costs of the carbon reductions are based on the $25/tonne price. The reader should note that this first policy set incorporates a carbon value of $25/tonne in 2010. It grows at two percent real per year, simulating a commodity market condition for carbon. The reductions
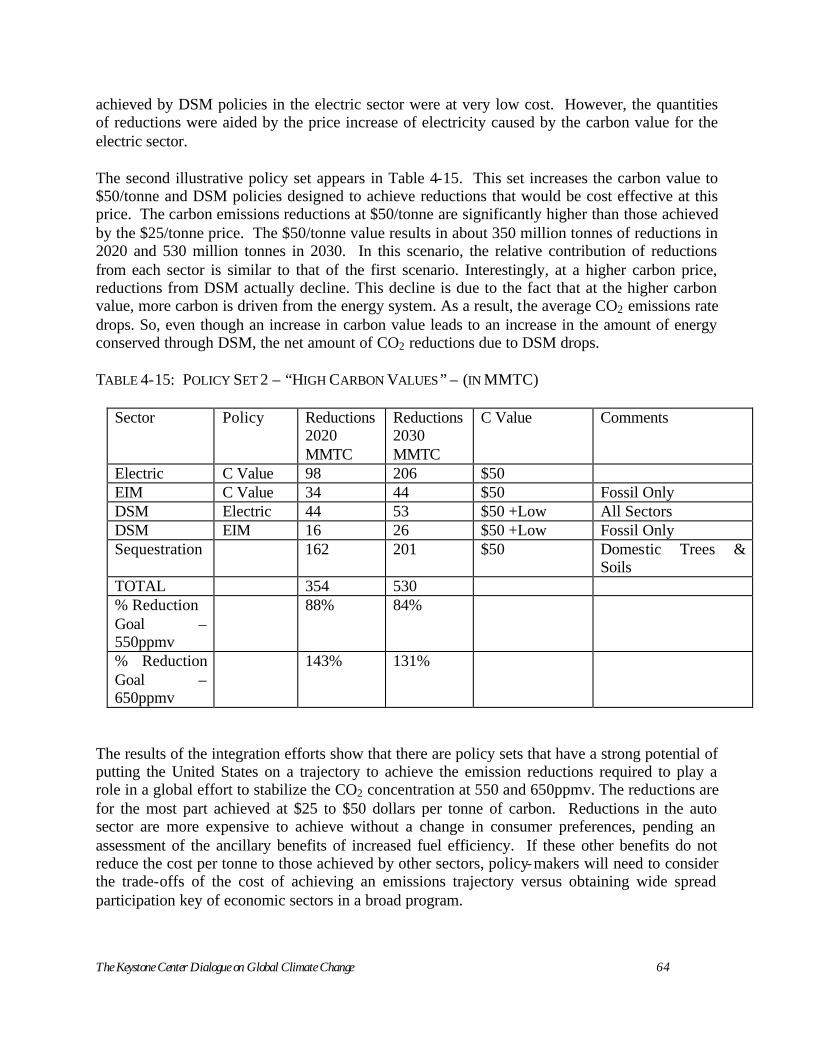
The Keystone Center Dialogue on Global Climate Change 64
achieved by DSM policies in the electric sector were at very low cost. However, the quantities of reductions were aided by the price increase of electricity caused by the carbon value for the electric sector. The second illustrative policy set appears in Table 4-15. This set increases the carbon value to $50/tonne and DSM policies designed to achieve reductions that would be cost effective at this price. The carbon emissions reductions at $50/tonne are significantly higher than those achieved by the $25/tonne price. The $50/tonne value results in about 350 million tonnes of reductions in 2020 and 530 million tonnes in 2030. In this scenario, the relative contribution of reductions from each sector is similar to that of the first scenario. Interestingly, at a higher carbon price, reductions from DSM actually decline. This decline is due to the fact that at the higher carbon value, more carbon is driven from the energy system. As a result, the average CO2 emissions rate drops. So, even though an increase in carbon value leads to an increase in the amount of energy conserved through DSM, the net amount of CO2 reductions due to DSM drops. TABLE 4-15: POLICY SET 2 – “HIGH CARBON VALUES” – (IN MMTC)
Sector Policy Reductions2020 MMTC
Reductions2030 MMTC
C Value Comments
Electric C Value 98 206 $50 EIM C Value 34 44 $50 Fossil Only DSM Electric 44 53 $50 +Low All Sectors DSM EIM 16 26 $50 +Low Fossil Only Sequestration 162 201 $50 Domestic Trees &
Soils TOTAL 354 530 % Reduction Goal – 550ppmv
88% 84%
% Reduction Goal – 650ppmv
143% 131%
The results of the integration efforts show that there are policy sets that have a strong potential of putting the United States on a trajectory to achieve the emission reductions required to play a role in a global effort to stabilize the CO2 concentration at 550 and 650ppmv. The reductions are for the most part achieved at $25 to $50 dollars per tonne of carbon. Reductions in the auto sector are more expensive to achieve without a change in consumer preferences, pending an assessment of the ancillary benefits of increased fuel efficiency. If these other benefits do not reduce the cost per tonne to those achieved by other sectors, policy-makers will need to consider the trade-offs of the cost of achieving an emissions trajectory versus obtaining wide spread participation key of economic sectors in a broad program.

The Keystone Center Dialogue on Global Climate Change 65
Issues to Consider: This analysis did not review the impact of inter-sector trading. There was agreement that to the extent trading is permitted between sectors that have emissions caps, such trading could help reveal a market price for CO2. Given the challenge in applying emission caps to the biologic sequestration “sector,” it is unclear how these reductions could be included in an inter-sector trading program.
The Keystone Center Dialogue on Global Climate Change 66
CHAPTER 5 CONCLUSIONS
ne can draw several primary conclusions from this study.
A. Significant emission reductions from the reference case are required globally and by the U.S. at key points in time during the 21st century in order to achieve virtually every concentration ceiling studied.
B. Reference case projections already incorporate aggressive efficiency and improvements in technological performance. Therefore, achieving the reference case assumptions with respect to technological improvement and associated emission reductions requires significant progress.
C. The results of this study show that by applying a carbon value of $25/tonne of carbon ($6.20/ton CO2), the United States can achieve approximately 65% of reductions required to achieve the U.S. share under 550ppmv concentration ceiling emission pathway in 2030 and about 90% of the reductions required for achieving the 650ppmv ceiling emission pathway in 2030.
D. The results of this study show that by applying a carbon value of $50/tonne of carbon ($12.40/ton CO2), the United States can achieve almost 85% of reductions required to achieve the U.S. share under 550ppmv concentration ceiling emission pathway in 2030 and more than 130% of the reductions required in achieving the 650ppmv emission pathway in 2030.
E. Companies need a signal that emissions will be limited before they will begin significant investment in new efforts to reduce emissions. If emissions growth needs to significantly slow and even decline by the 2020-2030 timeframe in order to achieve cost-effective stabilization, investments will need to begin in the near-term in order for the United States to realize the reductions in that timeframe.
F. Most of the emission reductions estimated in this study to occur by 2030 are the result of improvement in and deployment of existing technologies. However, achievement of the even larger reductions required after 2030 will require significant technology breakthroughs.
G. Both the electric sector and biologic sequestration could provide significant sources of reductions; other sectors could potentially provide measurable reductions and warrant further study.
There are also many important insights to be gleaned from the model’s results:
1. Time Value of Carbon: Concentration ceilings are driven by the accumulation of CO2 in the atmosphere over lengthy periods of time. Cost effective or lower cost emissions reductions beginning earlier can reduce the need for potentially more costly reductions later.
O
The Keystone Center Dialogue on Global Climate Change 67
2. Continued Emissions Growth Possibly Forecloses the Achievement of Alternative Concentration Ceilings: A related insight is that as accumulated emissions increase, the opportunity to stabilize at the lower concentration ceilings may become economically and technologically prohibitive. If emissions reductions are delayed and if policy-makers concluded that it was necessary to achieve a 450ppmv, or even a 550ppmv ceiling in order to avoid dangerous anthropogenic interference with the climate system, continued delays in actions to reduce emissions would make it difficult for the United States to play a constructive role in an effort to stabilize concentrations.
3. Coordinated Public and Private Strategies Will Be Needed To Achieve Reductions:
Developing and deploying new technologies to fill the gap between the reference case and the stabilization scenarios is a huge challenge. A significant amount of time is required to initiate major changes in the dominant fuels that drive the economy. In the late 1800’s, wood was the dominant fuel. Since then, shifts have been made from wood to coal, coal to oil, and oil to natural gas. These transitions have usually taken decades to effect. Some of the factors that effect the time it takes to develop new technologies include:
a. R&D takes time. Innovation and demonstration can take decades before new
technologies become widely accepted and economically competitive.
b. Energy capital stock is long-lived. Deployment of new technology can be slowed by the rate at which existing equipment is retired. Much of the technology and associated infrastructure that supplies the economy with energy services is long-lived. It is not unusual for a power plant to be in service for more than 50 years and the transmission and distribution infrastructure may be even longer lived. Retiring and replacing this capital equipment requires new capital expenditures.
c. It’s not just the technology; it’s also the infrastructure. If new technologies are
developed, the other key factor in achieving reductions is deploying those technologies. Deploying new technologies on a widespread basis requires necessary supporting infrastructure. For example, many studies have identified hydrogen-based transportation as a key technology, and indeed early prototypes have been developed. However, to deploy such vehicles throughout the economy requires establishing hydrogen production sources, delivery mechanisms, and storage options. Further, the existing prototype vehicles would have to be further developed and then accepted by consumers. The point is that there are major issues that must be addressed during each stage of the process to bring this promising idea to the market. Each potential production source and delivery and infrastructure option raises safety, cost and acceptability issues. These issues are separate from the issue of developing new efficient technology that can penetrate the economy on a widespread basis. Carbon capture, use and storage have also been identified as a potential technology. There are also complex issues associated with developing the necessary infrastructure to allow for the deployment of this set of technologies.
The Keystone Center Dialogue on Global Climate Change 68
d. Just because it’s developed, it doesn’t mean it will be deployed. As alluded to in the bullet above, technology development and deployment generally take place in the context of a competitive market setting. Investors invest in R&D because they believe that there will be a demand for the products they develop. That demand can be driven by consumers or by government. In the absence of clear signals, investors may be reluctant to adequately invest in new technology R&D.
e. In cases where broad changes in infrastructure are not required, the effect of
technological improvement can be much more rapid. Examples are changes in power plant dispatch that can occur rapidly because the same end-users receive the power, regardless of fuel source. Similar improvements have been made in end use efficiency.
4. Normal lag times between investment and reductions add additional delay. Dialogue
participants that were representatives from private firms indicated that with capital-intensive changes, it takes approximately 5 to 8 years from the time a company commits to spend capital to develop technologies and processes to reduce emissions until results are achieved. Participants from the private sector represented many of the key emitting sectors of the economy. This timing phenomenon is exacerbated because a signal has not yet been sent by the U.S. government that CO2 emissions have a value.
5. Although application of a carbon value would be an effective mechanism for achieving
reductions in price sensitive sectors such as utilities and industry, other measures will be required to achieve reductions from sectors that are less price sensitive such as residential and commercial buildings (DSM) and passenger autos.
The Keystone Center Dialogue on Global Climate Change 69
APPENDIX A LIST OF PARTICIPANTS AND PRESENTERS
Mr. Richard Ayres Partner Ayres Law Group Mr. Gil Bamford (retired) Vice President Governmental Affairs Toyota Ms. Frances Beinecke Executive Director Natural Resources Defense Council Mr. Robert Bonnie Economist Environmental Defense Ms. Corinne Boone Cantor Fitzgerald Mr. Bruce Braine, Vice President - Strategic Policy Analysis American Electric Power Mr. Mark Brownstein Manager Environmental Business Opportunities PSE&G Mr. Reid Detchon Director of Special Projects [Former Principal Deputy Assistant Secretary, Conservation and Renewable Energy, U.S. Department of Energy] The Turner Foundation Dr. James A. Edmonds Pacific Northwest National Laboratory University of Maryland
Mr. Dirk Forrister Managing Director Natsource, LLC. Mr. Robert M. Friedman Vice President for Research The H. John Heinz III Center for Science, Economics & the Environment Mr. Daniel Gagnier Senior Vice President, Corporate and External Affairs Alcan, Inc. F. Henry Habicht, II Chief Executive Officer [Former Deputy Administrator, U.S. Environmental Protection Agency] Global Environment and Technology Foundation Mr. Dave Hawkins Director, Climate Center Natural Resources Defense Council Mr. Tony Janetos The H. John Heinz III Center for Science, Economics, and the Environment Dr. W. Donald Johnson Group Vice President DuPont Ms. Donna L. Kraisinger Vice President, Health, Safety & Environment North America BP America, Inc.
The Keystone Center Dialogue on Global Climate Change 70
Mr. Stanley LaBruna Vice President Environment, Health and Safety PSE&G Mr. Dan Lashof Senior Scientist Natural Resources Defense Council Dr. Mack McFarland Principal Scientist Environmental Programs, Fluoroproducts DuPont Ms. Katie McGinty Formerly: Vice President Asset Management Natsource, LLC Mr. Kris McKinney Manager, Environmental Strategy Wisconsin Energy Mr. Alden Meyer Director, Government Relations Union of Concerned Scientists Ms. Denise Michelson, Director, Environmental Programs Health, Safety & Environment North America BP America, Inc. Mr. Richard Moss, Ph.D. Director, Office of the U.S. Global Change Research Program Mr. Robert Nordhaus Member, Van Ness Feldman, P.C. Mr. Jim Olson Senior Vice President External and Regulatory Affairs Toyota Mr. Jonathan Pershing International Energy Agency
Mr. Hugh Porteous Director of Research and Corporate Relations, Alcan, Inc. Dr. Walter Quanstrom, President Mostardi-Platt Environmental Mr. Robert Repetto Professor Stratus Consulting, Inc. Mr. Howard Ris Executive Director Union of Concerned Scientists Mr. Marcus Schneider Program Officer The Energy Foundation Dr. Paul V. Tebo Vice President DuPont Safety, Health and Environment DuPont Mr. Gus Tirado Senior Specialist Toyota Ms. Christine Vujovich Vice President Environmental Policy and Product Strategy Cummins, Inc. Mr. Tom Wilson Manager Global Climate Research EPRI Project Staff Ms. Stephanie Cheval Project Support Coordinator Science and Public Policy The Keystone Center

The Keystone Center Dialogue on Global Climate Change 71
Mr. Charles Clark President The Charles Clark Group Mr. Thomas Grumbly Project Co-Director/Private Sector Investment Specialist President The Keystone Center Ms. Mary Davis Hamlin Senior Associate The Keystone Center Mr. Rob Luenberger Onward, Inc. Mr. Rich Rosenzweig Project Director, Keystone Global Climate Change Dialogue Manging Director, Natsource, LLC Mr. Richard Smallwood Consultant Ms. Rebecca Turner Associate Science and Public Policy The Keystone Center Ms. Sarah Wade Director of Energy Program The Keystone Center
The Keystone Center Dialogue on Global Climate Change 72
APPENDIX B TECHNICAL NOTE ON MiniCAM MODEL
MiniCAM is a long-term, global, market equilibrium model of energy, agriculture, land-use, and economy interactions. MiniCAM is a geographically disaggregated model with 14 regions: 1. The United States, 2. Canada, 3. Western Europe, 4. Australia and New Zealand, 5. Japan, 6. Eastern Europe, 7. The Russian Federation and other countries of the former Soviet Union, 8. China, 9. the Mid-East, 10. Africa, 11. Latin America, 12. Korea, 13. Southeast Asia, and 14. India.20
The model is calibrated to 1990 and contains 15-year time steps to the year 2095. It takes inputs such as labor productivity growth, population, fossil and non-fossil fuel resources, energy technologies21 and productivity growth rates and generates outputs of energy supplies and demands by fuel (9 primary, 5 final), greenhouse gas emissions (CO2, CH4, N2O, SO2), and economic activity. The model has its roots in Edmonds and Reilly (1985), and has been continuously up graded and updated. See, Edmonds, Reilly, Gardner and Brenkert (1986); Edmonds, Wise, Pitcher, Wigley and MacCracken (1996). MiniCAM also incorporates a model of carbon cycle, atmospheric processes and climate change, see Hulme and Raper (1993); Wigley (1994a,b); Wigley and Raper (1987, 1992, 1993, 2001).
One interesting feature of MiniCAM is the integrated nature of energy and land-use markets. Land-use considerations are important in two determinants of greenhouse gas emissions: land-use change emissions and the production of biomass for energy use. Both are treated explicitly in the agriculture- land-use module of MiniCAM. MiniCAM handles two types of biomass: traditional and modern. For the purposes of this analysis it is assumed that per capita use of the former declines with increasing incomes, while the latter competes with other modern fuels on the basis of cost. In MiniCAM, commercial biomass must be grown as a crop, harvested, and refined before proceeding to end-use applications. To be planted in the first place it must compete for market share with other crops, livestock, forest products, and urban uses. As profitable opportunities increase, pressure to expand land applications to increasingly less attractive land categories grows, as does pressure to deforest unmanaged ecosystems. Changes in stocks of terrestrial carbon determine land-use change emissions. The agriculture-land-use module is discussed in greater detail in Edmonds et al. (1996). Several new elements have recently been added to the MiniCAM. These include a variety of new technologies—wind power, gas-to- liquids transformation, hydrogen production and consumption—and a new transportation sector. They are documented in Edmonds et al. (2003). Keystone Study Scenario: The “Keystone analysis” uses one of the new Special Report on Emissions Scenarios (SRES: Nakicenovic et al., 2000) A1G – as a point of reference, or the reference case, for emissions of greenhouse gases in the absence of policies to stabilize the
20 Three other regions are being disaggregated: Mexico, Argentina, and Brazil. 21 There are 69 energy technology options explicitly considered in MiniCAM version 2001.02.
The Keystone Center Dialogue on Global Climate Change 73
concentration of greenhouse gases in the atmosphere. This is only one of six possible SRES scenarios that could have been chosen. The SRES does not forecast the most likely scenario but describes each as internally consistent and a potential realization of the worked in the absence of policies to explicitly limit greenhouse gas emissions.
The SRES identifies four scenario families. They are labeled simply A1, A2, B1, and B2. The Keystone A1G scenario is derived from the A1 scenario “family”. Each scenario “family” has a different story line underlying it. Nakicenovic et al. 2000 summarizes these storyline as follows:
• The A1 storyline and scenario family describes a future world of very rapid economic growth, low population growth, and the rapid introduction of new and more efficient technologies. Major underlying themes are convergence among regions, capacity building and increased cultural and social interactions, with a substantial reduction in regional differences in per capita income. The A1 scenario family develops into four groups that describe alternative directions of technological change in the energy system.
• The A2 storyline and scenario family describes a very heterogeneous world. The underlying theme is self-reliance and preservation of local identities. Fertility patterns across regions converge very slowly, which results in high population growth. Economic development is primarily regionally oriented and per capita economic growth and technological change are more fragmented and slower than in other storylines.
• The B1 storyline and scenario family describes a convergent world with the same low population growth as in the A1 storyline, but with rapid changes in economic structures toward a service and information economy, with reductions in material intensity, and the introduction of clean and resource-efficient technologies. The emphasis is on global solutions to economic, social, and environmental sustainability, including improved equity, but without additional climate initiatives.
• The B2 storyline and scenario family describes a world in which the emphasis is on local solutions to economic, social, and environmental sustainability. It is a world with moderate population growth, intermediate levels of economic development, and less rapid and more diverse technological change than in the B1 and A1 storylines. While the scenario is also oriented toward environmental protection and social equity, it focuses on local and regional levels.
Nakicenovic et al. (2000) identify three important factors helping to shape the future global energy system and associated emissions of greenhouse gases: Technology, Population, and Economic Development Technology: The A1G scenario assumes that fossil fuel technologies will continue to evolve to address local and regional environmental concerns and that fossil fuels will remain the backbone of the global energy system. Table B-1 presents the energy consumption assumptions in the model.
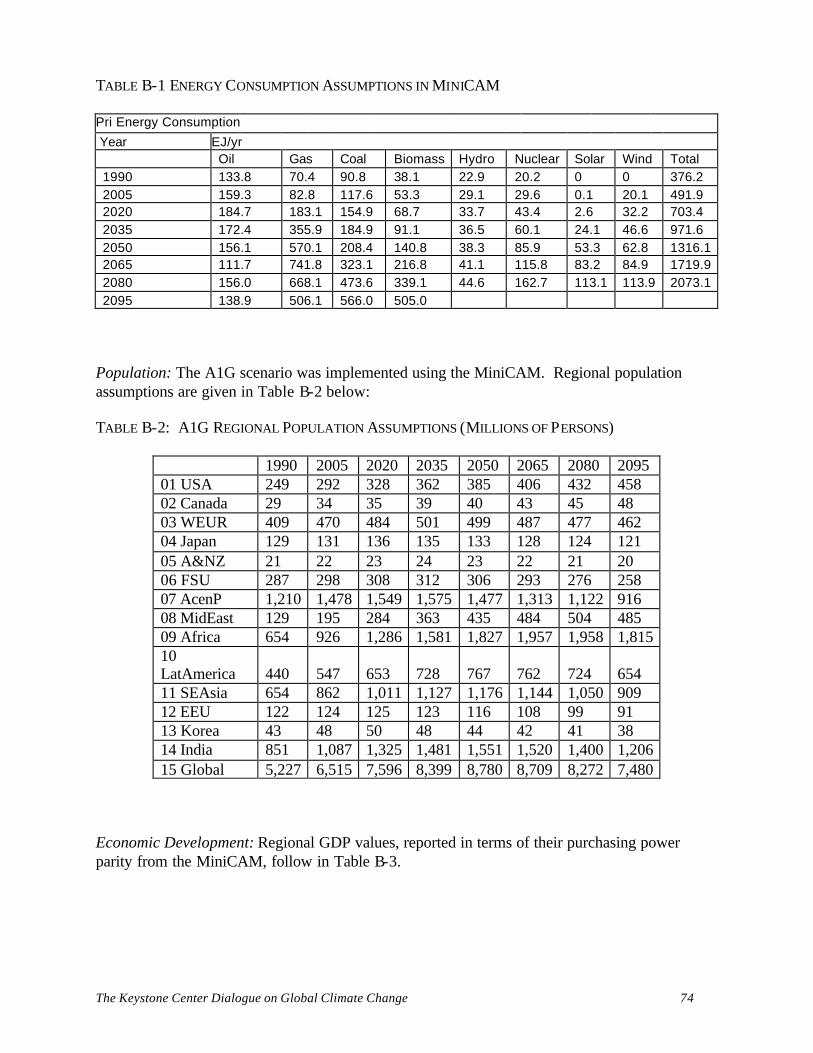
The Keystone Center Dialogue on Global Climate Change 74
TABLE B-1 ENERGY CONSUMPTION ASSUMPTIONS IN MINICAM Pri Energy Consumption Year EJ/yr Oil Gas Coal Biomass Hydro Nuclear Solar Wind Total 1990 133.8 70.4 90.8 38.1 22.9 20.2 0 0 376.2 2005 159.3 82.8 117.6 53.3 29.1 29.6 0.1 20.1 491.9 2020 184.7 183.1 154.9 68.7 33.7 43.4 2.6 32.2 703.4 2035 172.4 355.9 184.9 91.1 36.5 60.1 24.1 46.6 971.6 2050 156.1 570.1 208.4 140.8 38.3 85.9 53.3 62.8 1316.1 2065 111.7 741.8 323.1 216.8 41.1 115.8 83.2 84.9 1719.9 2080 156.0 668.1 473.6 339.1 44.6 162.7 113.1 113.9 2073.1 2095 138.9 506.1 566.0 505.0
Population: The A1G scenario was implemented using the MiniCAM. Regional population assumptions are given in Table B-2 below: TABLE B-2: A1G REGIONAL POPULATION ASSUMPTIONS (MILLIONS OF PERSONS)
1990 2005 2020 2035 2050 2065 2080 2095 01 USA 249 292 328 362 385 406 432 458 02 Canada 29 34 35 39 40 43 45 48 03 WEUR 409 470 484 501 499 487 477 462 04 Japan 129 131 136 135 133 128 124 121 05 A&NZ 21 22 23 24 23 22 21 20 06 FSU 287 298 308 312 306 293 276 258 07 AcenP 1,210 1,478 1,549 1,575 1,477 1,313 1,122 916 08 MidEast 129 195 284 363 435 484 504 485 09 Africa 654 926 1,286 1,581 1,827 1,957 1,958 1,815 10 LatAmerica 440 547 653 728 767 762 724 654 11 SEAsia 654 862 1,011 1,127 1,176 1,144 1,050 909 12 EEU 122 124 125 123 116 108 99 91 13 Korea 43 48 50 48 44 42 41 38 14 India 851 1,087 1,325 1,481 1,551 1,520 1,400 1,206 15 Global 5,227 6,515 7,596 8,399 8,780 8,709 8,272 7,480
Economic Development: Regional GDP values, reported in terms of their purchasing power parity from the MiniCAM, follow in Table B-3.
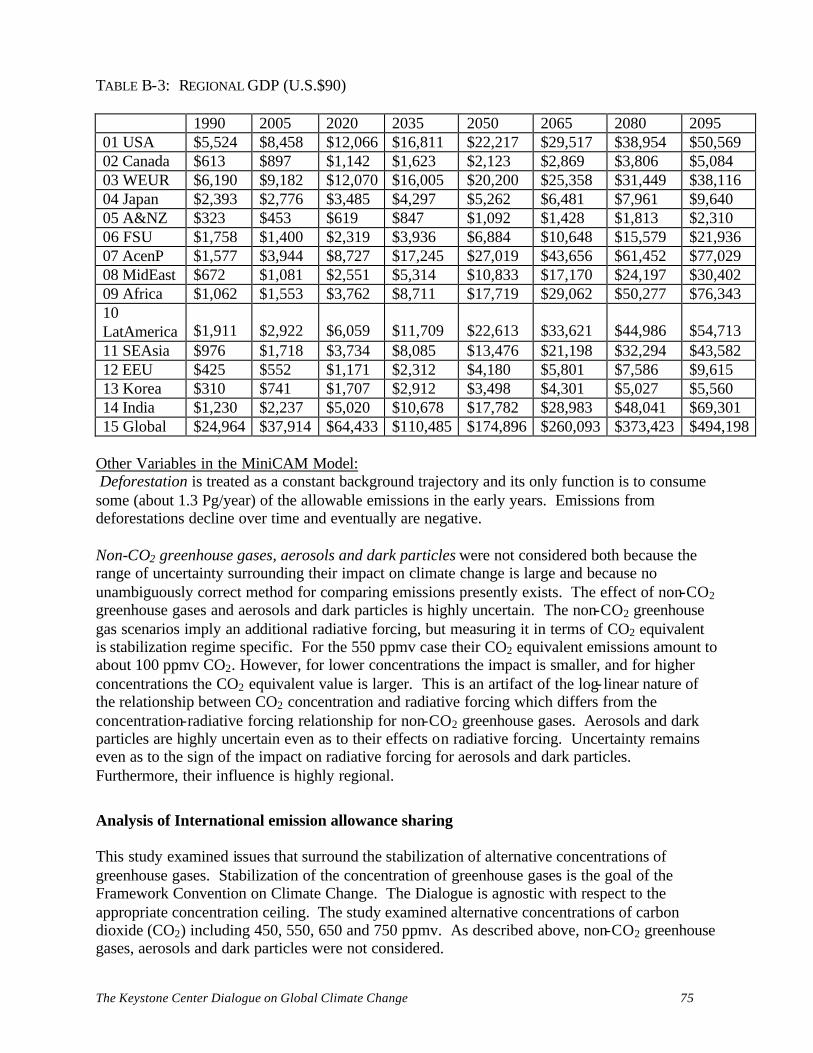
The Keystone Center Dialogue on Global Climate Change 75
TABLE B-3: REGIONAL GDP (U.S.$90) 1990 2005 2020 2035 2050 2065 2080 2095 01 USA $5,524 $8,458 $12,066 $16,811 $22,217 $29,517 $38,954 $50,569 02 Canada $613 $897 $1,142 $1,623 $2,123 $2,869 $3,806 $5,084 03 WEUR $6,190 $9,182 $12,070 $16,005 $20,200 $25,358 $31,449 $38,116 04 Japan $2,393 $2,776 $3,485 $4,297 $5,262 $6,481 $7,961 $9,640 05 A&NZ $323 $453 $619 $847 $1,092 $1,428 $1,813 $2,310 06 FSU $1,758 $1,400 $2,319 $3,936 $6,884 $10,648 $15,579 $21,936 07 AcenP $1,577 $3,944 $8,727 $17,245 $27,019 $43,656 $61,452 $77,029 08 MidEast $672 $1,081 $2,551 $5,314 $10,833 $17,170 $24,197 $30,402 09 Africa $1,062 $1,553 $3,762 $8,711 $17,719 $29,062 $50,277 $76,343 10 LatAmerica $1,911 $2,922 $6,059 $11,709 $22,613 $33,621 $44,986 $54,713 11 SEAsia $976 $1,718 $3,734 $8,085 $13,476 $21,198 $32,294 $43,582 12 EEU $425 $552 $1,171 $2,312 $4,180 $5,801 $7,586 $9,615 13 Korea $310 $741 $1,707 $2,912 $3,498 $4,301 $5,027 $5,560 14 India $1,230 $2,237 $5,020 $10,678 $17,782 $28,983 $48,041 $69,301 15 Global $24,964 $37,914 $64,433 $110,485 $174,896 $260,093 $373,423 $494,198
Other Variables in the MiniCAM Model: Deforestation is treated as a constant background trajectory and its only function is to consume some (about 1.3 Pg/year) of the allowable emissions in the early years. Emissions from deforestations decline over time and eventually are negative. Non-CO2 greenhouse gases, aerosols and dark particles were not considered both because the range of uncertainty surrounding their impact on climate change is large and because no unambiguously correct method for comparing emissions presently exists. The effect of non-CO2 greenhouse gases and aerosols and dark particles is highly uncertain. The non-CO2 greenhouse gas scenarios imply an additional radiative forcing, but measuring it in terms of CO2 equivalent is stabilization regime specific. For the 550 ppmv case their CO2 equivalent emissions amount to about 100 ppmv CO2. However, for lower concentrations the impact is smaller, and for higher concentrations the CO2 equivalent value is larger. This is an artifact of the log- linear nature of the relationship between CO2 concentration and radiative forcing which differs from the concentration-radiative forcing relationship for non-CO2 greenhouse gases. Aerosols and dark particles are highly uncertain even as to their effects on radiative forcing. Uncertainty remains even as to the sign of the impact on radiative forcing for aerosols and dark particles. Furthermore, their influence is highly regional.
Analysis of International emission allowance sharing This study examined issues that surround the stabilization of alternative concentrations of greenhouse gases. Stabilization of the concentration of greenhouse gases is the goal of the Framework Convention on Climate Change. The Dialogue is agnostic with respect to the appropriate concentration ceiling. The study examined alternative concentrations of carbon dioxide (CO2) including 450, 550, 650 and 750 ppmv. As described above, non-CO2 greenhouse gases, aerosols and dark particles were not considered.
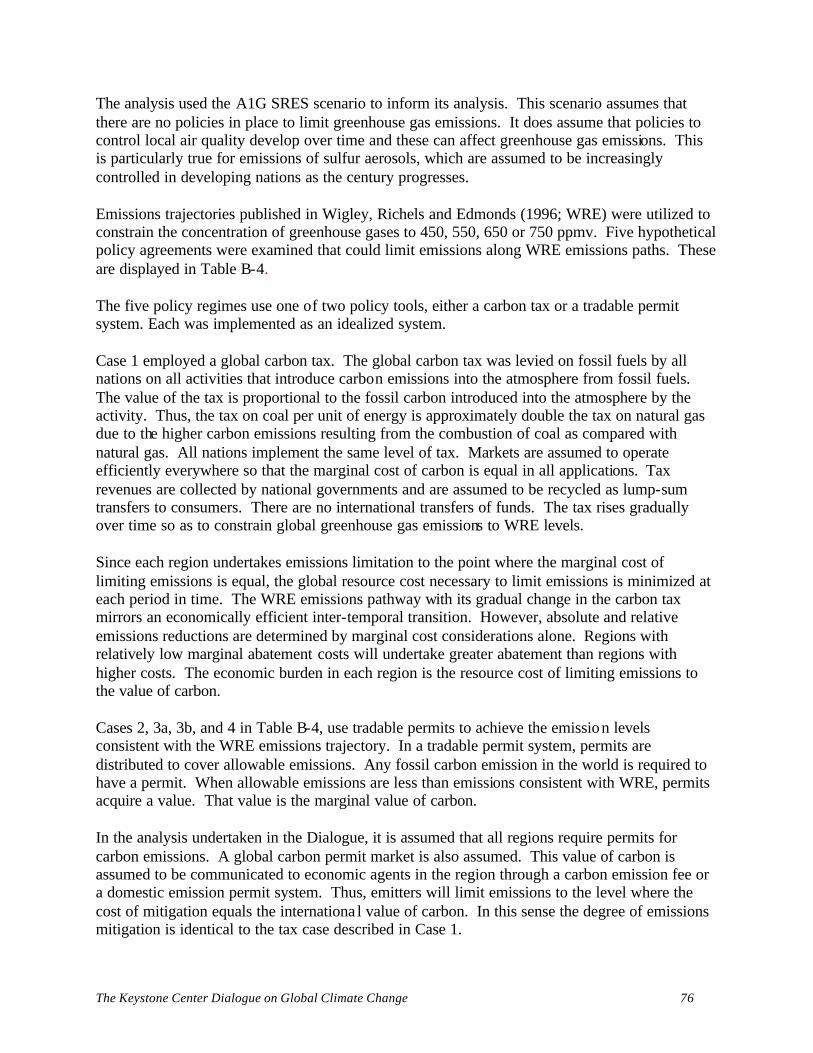
The Keystone Center Dialogue on Global Climate Change 76
The analysis used the A1G SRES scenario to inform its analysis. This scenario assumes that there are no policies in place to limit greenhouse gas emissions. It does assume that policies to control local air quality develop over time and these can affect greenhouse gas emissions. This is particularly true for emissions of sulfur aerosols, which are assumed to be increasingly controlled in developing nations as the century progresses. Emissions trajectories published in Wigley, Richels and Edmonds (1996; WRE) were utilized to constrain the concentration of greenhouse gases to 450, 550, 650 or 750 ppmv. Five hypothetical policy agreements were examined that could limit emissions along WRE emissions paths. These are displayed in Table B-4. The five policy regimes use one of two policy tools, either a carbon tax or a tradable permit system. Each was implemented as an idealized system. Case 1 employed a global carbon tax. The global carbon tax was levied on fossil fuels by all nations on all activities that introduce carbon emissions into the atmosphere from fossil fuels. The value of the tax is proportional to the fossil carbon introduced into the atmosphere by the activity. Thus, the tax on coal per unit of energy is approximately double the tax on natural gas due to the higher carbon emissions resulting from the combustion of coal as compared with natural gas. All nations implement the same level of tax. Markets are assumed to operate efficiently everywhere so that the marginal cost of carbon is equal in all applications. Tax revenues are collected by national governments and are assumed to be recycled as lump-sum transfers to consumers. There are no international transfers of funds. The tax rises gradually over time so as to constrain global greenhouse gas emissions to WRE levels. Since each region undertakes emissions limitation to the point where the marginal cost of limiting emissions is equal, the global resource cost necessary to limit emissions is minimized at each period in time. The WRE emissions pathway with its gradual change in the carbon tax mirrors an economically efficient inter-temporal transition. However, absolute and relative emissions reductions are determined by marginal cost considerations alone. Regions with relatively low marginal abatement costs will undertake greater abatement than regions with higher costs. The economic burden in each region is the resource cost of limiting emissions to the value of carbon. Cases 2, 3a, 3b, and 4 in Table B-4, use tradable permits to achieve the emission levels consistent with the WRE emissions trajectory. In a tradable permit system, permits are distributed to cover allowable emissions. Any fossil carbon emission in the world is required to have a permit. When allowable emissions are less than emissions consistent with WRE, permits acquire a value. That value is the marginal value of carbon. In the analysis undertaken in the Dialogue, it is assumed that all regions require permits for carbon emissions. A global carbon permit market is also assumed. This value of carbon is assumed to be communicated to economic agents in the region through a carbon emission fee or a domestic emission permit system. Thus, emitters will limit emissions to the level where the cost of mitigation equals the internationa l value of carbon. In this sense the degree of emissions mitigation is identical to the tax case described in Case 1.
The Keystone Center Dialogue on Global Climate Change 77
Tradable permit systems include one feature that the tax regime of Case 1 does not. It distributes permits. Because permits have an economic value when sold in the market, the permit distribution impacts wealth distribution. Those receiving permits are provided a salable asset. The economic cost burden to a region is equal to the sum of the cost of emissions mitigation, (which is the same as in Case 1) plus the net purchase of permits requires to achieve WRE emission trajectories. If net sales of permits occur in a region, the economic cost equals the cost of emissions mitigation less the value of net permit sales. The total value resulting from permit sales can be large relative to the cost of emissions mitigation. Cases 2, 3a, 3b and 4 examine implications of alternative global emissions permit distribution systems. The distribution system for case 4 is the simplest of the set. All regions are assumed to participate in the system beginning in the year 2005. Total global allowable emissions in any year are determined by the WRE trajectory. The fraction of that total assigned to each region is equal to that region’s fraction of world population. Regions with the largest population received the most emissions permits. Many populous nations also have low per capita income, and many high per capita regions have relatively high emissions. Where this is the case there will tend to be sales of permits from regions with high population and low emissions to regions with low populations and high emissions. Cases 2, 3a, and 3b are similar. They are variations on a theme. Case 2 establishes the paradigm. In this case, all nations participate in a tradable permit program beginning in the year 2005. Permits are distributed based on emissions intensity in the year 2000 and economic growth subsequent to the year 2000. The region’s share of emissions permits is equal to its share of expected emissions. A region’s expected emissions in turn are computed as the product of base year emissions intensity (emissions per unit of domestic GDP in the year 2000) and real GDP growth subsequent to the base year. This approach distributes permits to reflect initial patterns of emissions intensity, and then adjusts that distribution over time to reflect economic growth. A larger share of permits are distributed to faster growing regions and fewer to slower growing regions. As in all of the cases, global emissions are constrained to the WRE emissions paths. Cases 3a and 3b explore the implication of Case 2 when not all regions join initially. In Cases 3a and 3b a hypothetical timetable for developing countries to participate in an international greenhouse gas control program was established. In case 3a it is assumed that all Annex I nations are party to the hypothetical protocol beginning in year 2005. China enters the agreement in the year 2020. Other non-annex I regions enter the agreement when their real per capita GDP reaches the level of China’s in the year 2020. The share of emissions permits is determined by expected emissions, with expected emissions computed as in Case 2. The base year emission for countries entering the agreement after the year 2005 is emissions in the year of accession and these emissions are adjusted for economic growth subsequent to the year of accession. Case 3b varies from case 3a only in the fact that Chinese accession is delayed to the year 2035 with other non-Annex I nations joining when their real per capita GDP reaches that of China in the year 2035.
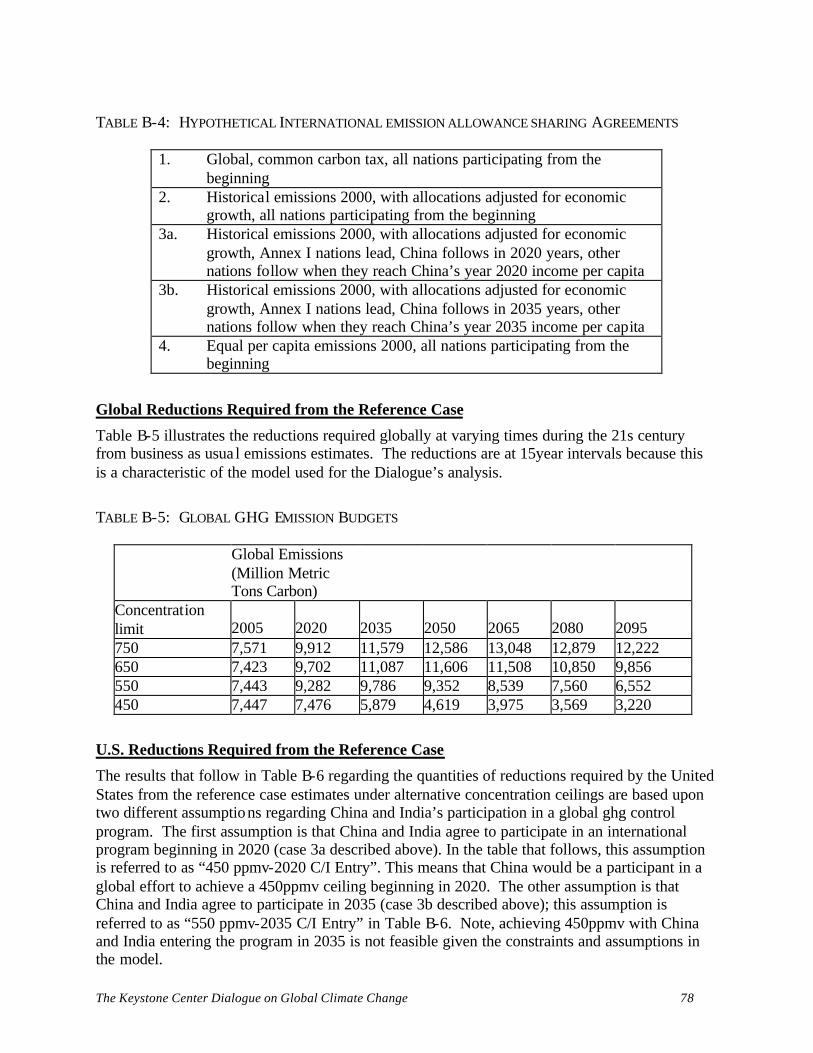
The Keystone Center Dialogue on Global Climate Change 78
TABLE B-4: HYPOTHETICAL INTERNATIONAL EMISSION ALLOWANCE SHARING AGREEMENTS
1. Global, common carbon tax, all nations participating from the beginning
2. Historical emissions 2000, with allocations adjusted for economic growth, all nations participating from the beginning
3a. Historical emissions 2000, with allocations adjusted for economic growth, Annex I nations lead, China follows in 2020 years, other nations follow when they reach China’s year 2020 income per capita
3b. Historical emissions 2000, with allocations adjusted for economic growth, Annex I nations lead, China follows in 2035 years, other nations follow when they reach China’s year 2035 income per capita
4. Equal per capita emissions 2000, all nations participating from the beginning
Global Reductions Required from the Reference Case
Table B-5 illustrates the reductions required globally at varying times during the 21s century from business as usua l emissions estimates. The reductions are at 15year intervals because this is a characteristic of the model used for the Dialogue’s analysis.
TABLE B-5: GLOBAL GHG EMISSION BUDGETS
Global Emissions (Million Metric Tons Carbon)
Concentration limit 2005 2020 2035 2050 2065 2080 2095 750 7,571 9,912 11,579 12,586 13,048 12,879 12,222 650 7,423 9,702 11,087 11,606 11,508 10,850 9,856 550 7,443 9,282 9,786 9,352 8,539 7,560 6,552 450 7,447 7,476 5,879 4,619 3,975 3,569 3,220
U.S. Reductions Required from the Reference Case
The results that follow in Table B-6 regarding the quantities of reductions required by the United States from the reference case estimates under alternative concentration ceilings are based upon two different assumptions regarding China and India’s participation in a global ghg control program. The first assumption is that China and India agree to participate in an international program beginning in 2020 (case 3a described above). In the table that follows, this assumption is referred to as “450 ppmv-2020 C/I Entry”. This means that China would be a participant in a global effort to achieve a 450ppmv ceiling beginning in 2020. The other assumption is that China and India agree to participate in 2035 (case 3b described above); this assumption is referred to as “550 ppmv-2035 C/I Entry” in Table B-6. Note, achieving 450ppmv with China and India entering the program in 2035 is not feasible given the constraints and assumptions in the model.
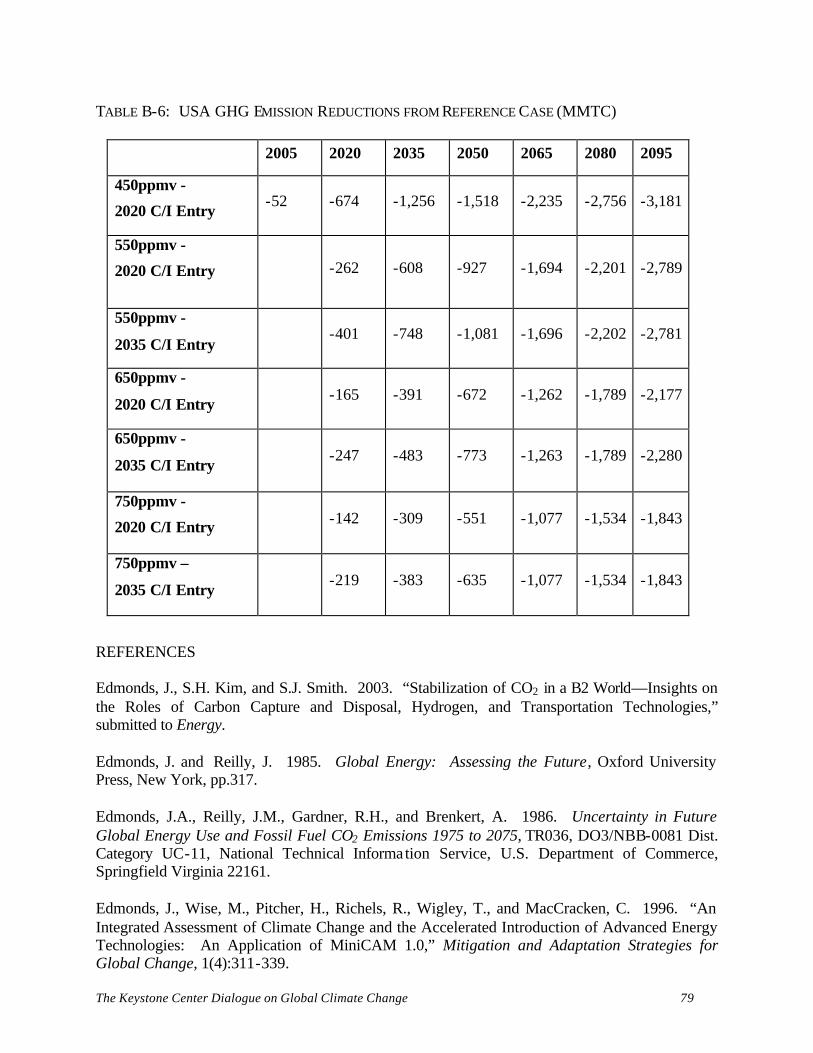
The Keystone Center Dialogue on Global Climate Change 79
TABLE B-6: USA GHG EMISSION REDUCTIONS FROM REFERENCE CASE (MMTC)
2005 2020 2035 2050 2065 2080 2095
450ppmv -
2020 C/I Entry -52 -674 -1,256 -1,518 -2,235 -2,756 -3,181
550ppmv -
2020 C/I Entry -262 -608 -927 -1,694 -2,201 -2,789
550ppmv -
2035 C/I Entry -401 -748 -1,081 -1,696 -2,202 -2,781
650ppmv -
2020 C/I Entry -165 -391 -672 -1,262 -1,789 -2,177
650ppmv -
2035 C/I Entry -247 -483 -773 -1,263 -1,789 -2,280
750ppmv -
2020 C/I Entry -142 -309 -551 -1,077 -1,534 -1,843
750ppmv –
2035 C/I Entry -219 -383 -635 -1,077 -1,534 -1,843
REFERENCES Edmonds, J., S.H. Kim, and S.J. Smith. 2003. “Stabilization of CO2 in a B2 World—Insights on the Roles of Carbon Capture and Disposal, Hydrogen, and Transportation Technologies,” submitted to Energy. Edmonds, J. and Reilly, J. 1985. Global Energy: Assessing the Future, Oxford University Press, New York, pp.317. Edmonds, J.A., Reilly, J.M., Gardner, R.H., and Brenkert, A. 1986. Uncertainty in Future Global Energy Use and Fossil Fuel CO2 Emissions 1975 to 2075, TR036, DO3/NBB-0081 Dist. Category UC-11, National Technical Information Service, U.S. Department of Commerce, Springfield Virginia 22161. Edmonds, J., Wise, M., Pitcher, H., Richels, R., Wigley, T., and MacCracken, C. 1996. “An Integrated Assessment of Climate Change and the Accelerated Introduction of Advanced Energy Technologies: An Application of MiniCAM 1.0,” Mitigation and Adaptation Strategies for Global Change, 1(4):311-339.
The Keystone Center Dialogue on Global Climate Change 80
Hulme, M. and S. Raper. 1993. "An Integrated Framework to Address Climate Change (ESCAPE) and Further Developments of the Global and Regional Climate Modules (MAGICC)." A paper prepared for the International Workshop on Integrative Assessment of Mitigation, Impacts and Adaptation to Climate Change, October 13-15, 1993, IIASA, Laxenburg, Austria. Nakicenovic, N., et al. 2000. Special Report on Emissions Scenarios. Cambridge University Press, Cambridge, United Kingdom. Wigley, T.M.L. 1994. A simple model for estimating methane concentration and lifetime variations. Climate Dynamics (9:181-193). Wigley, T.M.L. and Raper, S.C.B., 2001: Interpretation of high projections for global-mean warming. Science 293, 451-454. Wigley, T.M.L. and S.C.B. Raper. 1993. "Future Changes in Global-Mean Temperatue and Sea Level," in Climate and Sea Level Change: Observations, Projections and Implications, R.A. Warrick, E. Barrow, and T.M.L. Wigley (eds.), pp.111-133. Cambridge University Press, Cambridge, 424pp. Wigley, T.M.L. and S.C.B. Raper. May 28, 1992. "Implications for climate and sea level of revised IPCC emissions scenarios." Nature, 357, reprint. Wigley, T.M.L. and S.C.B. Raper. 1987. "Thermal expansion of seawater associated with global warming." Nature, 330:127-131. Wigley, T.M.L., R. Richels & J. A. Edmonds. 1996. "Economic and Environmental Choices in the Stabilization of Atmospheric CO2 Concentrations," Nature. 379(6562):240-243. Edmonds, J., S.H. Kim, and S.J. Smith. 2003. “Stabilization of CO2 in a B2 World—Insights on the Roles of Carbon Capture and Disposal, Hydrogen, and Transportation Technologies,” submitted to Energy. Edmonds, J. and Reilly, J. 1985. Global Energy: Assessing the Future, Oxford University Press, New York, pp.317. Edmonds, J.A., Reilly, J.M., Gardner, R.H., and Brenkert, A. 1986. Uncertainty in Future Global Energy Use and Fossil Fuel CO2 Emissions 1975 to 2075, TR036, DO3/NBB-0081 Dist. Category UC-11, National Technical Information Service, U.S. Department of Commerce, Springfield Virginia 22161. Edmonds, J., Wise, M., Pitcher, H., Richels, R., Wigley, T., and MacCracken, C. 1996. “An Integrated Assessment of Climate Change and the Accelerated Introduction of Advanced Energy Technologies: An Application of MiniCAM 1.0,” Mitigation and Adaptation Strategies for Global Change, 1(4):311-339.
The Keystone Center Dialogue on Global Climate Change 81
Hulme, M. and S. Raper. 1993. "An Integrated Framework to Address Climate Change (ESCAPE) and Further Developments of the Global and Regional Climate Modules (MAGICC)." A paper prepared for the International Workshop on Integrative Assessment of Mitigation, Impacts and Adaptation to Climate Change, October 13-15, 1993, IIASA, Laxenburg, Austria. Nakicenovic, N., et al. 2000. Special Report on Emissions Scenarios. Cambridge University Press, Cambridge, United Kingdom. Wigley, T.M.L. 1994. A simple model for estimating methane concentration and lifetime variations. Climate Dynamics (9:181-193). Wigley, T.M.L. and Raper, S.C.B., 2001: Interpretation of high projections for global-mean warming. Science 293, 451-454. Wigley, T.M.L. and S.C.B. Raper. 1993. "Future Changes in Global-Mean Temperatue and Sea Level," in Climate and Sea Level Change: Observations, Projections and Implications, R.A. Warrick, E. Barrow, and T.M.L. Wigley (eds.), pp.111-133. Cambridge University Press, Cambridge, 424pp. Wigley, T.M.L. and S.C.B. Raper. May 28, 1992. "Implications for climate and sea level of revised IPCC emissions scenarios." Nature, 357, reprint. Wigley, T.M.L. and S.C.B. Raper. 1987. "Thermal expansion of seawater associated with global warming." Nature, 330:127-131. Wigley, T.M.L., R. Richels & J. A. Edmonds. 1996. "Economic and Environmental Choices in the Stabilization of Atmospheric CO2 Concentrations," Nature. 379(6562): 240-243.
The Keystone Center Dialogue on Global Climate Change 82
APPENDIX C DECISION CRITERIA
he Keystone Dialogue on Global Climate Change is investigating policies that would reduce carbon emissions to achieve the objective of the United Framework Convention on Climate
Change (UNFCCC) - stabilizing atmospheric concentrations of greenhouse gases in the atmosphere to prevent dangerous anthropogenic interference with the climate system. This brief paper elaborates the guiding principles that the Dialogue participants will utilize to evaluate the policies and provides a basis for their decision-making regarding any group recommendations. Dialogue participants will consider four criteria when evaluating the policies: I. POLICY SHOULD ACHIEVE EMISSION REDUCTIONS CONSISTENT WITH LONG-TERM
TARGETS RELATED TO ATMOSPHERIC STABILIZATION. w Equitable Distribution of Concentration Levels and Burdens. U.S. policies should
achieve emission reductions consistent with an international climate regime to ensure burdens are equitable. It is essential for developing countries to reduce greenhouse gas emissions if concentration ceilings are to be achieved.
w Avoid Leakage. Policies designed to achieve national greenhouse gas reductions should
be evaluated based upon their impact on net global greenhouse gas reductions. w Involve All Sectors of the Economy in The Effort to Address Climate Change. It is
desirable to have many parts of the society take actions that reduce greenhouse gas emissions. Involving all segments of society in the effort to reduce national greenhouse gas emissions is valuable in managing the risk associated with climate change and in achieving other societal objectives. Initially, a sectoral approach may be used as a strategy on which to build future initiatives.
II. POLICY SHOULD MEET COST EFFECTIVENESS CRITERIA. (This is displayed in dollars per
tonne of carbon-equivalent emission reduction.) w Cost Effectiveness. Policies should be developed that achieve greenhouse gas reductions
at the lowest possible cost. w Value of Technology. Technology is the largest lever on cost of achieving alternative
concentration ceilings. w Deploy Existing Efficient Technologies. Policies are required that more effectively
deploy more existing efficient technology in the marketplace. w R & D Into Existing and New Technologies. Policies are required that will achieve base
case levels of technological improvement and reduce the costs of technologies vital to achieving alternative concentration ceilings.
T
The Keystone Center Dialogue on Global Climate Change 83
w Smooth Transition. Policies should be designed to provide the private sector with adequate lead times to determine the financial impacts of policy on existing assets and investments in new facilities.
w Clear Policy Direction. Policies that provide clear policy direction to decision-makers in
the private sector are desirable. This clarity reduces the risk and complexity of decision-making.
w Risk Reduction and Management. Policies should reduce risk that decision-makers face.
In addition, policies should provide decision-makers with the flexibility to manage risk. III. POLICY SHOULD ADDRESS EQUITY CONCERNS w Equity. There should be equitable burden sharing across and within the various sectors of
the economy and geographic regions of the country. w Avoid Disproportionate Impacts. Policies should be developed that minimize economic
dislocation on all sectors of society. w Ancillary Benefits. It is desirable to develop policies that produce other non-climate
economic, environmental, and social benefits. IV. POLICIES SHOULD BE A SIMPLE AS POSSIBLE w Implementation. Policies should be administrable technically feasible.

The Keystone Center Dialogue on Global Climate Change 84

The Keystone Center Dialogue on Global Climate Change 85