Embed Size (px)
Citation preview

.……………………………………………………………………………..…………
In this paper, we investigate how risk and risk aversion influence
the fertilisation behavior of farmers. We show analytically that a
decreasing variance of yield along with nitrogen inputs
encourages risk averse farmers to apply larger quantities of
fertilizers compared with risk neutral behavior. Then, we use
data concerning three departments in France (Deux-Sèvres,
Seine-Maritime and Eure-et-Loir) to determine (i) crop yield
response function to N fertilizers and (ii) risk aversion behavior of
farmers on the basis of their actual fertilizers applications. We
find that risk averse farmers represent 29,7% of farmers while risk
seeking ones represent 35,5%. Risk aversion behavior is
associated with an additional application of 29 kg/ha
compared with risk neutral behavior which represents an
average loss of 76 euros/ha. We show that the reduction of
abatement linked to risk aversion behavior should appear only
when crop yield variance is convex with respect to N fertilizers.
Lastly, our results show that an insurance covering yield
variability could be foreseen as an interesting tool to mitigate
emissions.---------------------------------------
…….…….…….…….…….…….…….………….…….…….…….…
Comments welcomed
JEL classification: D81, D92, Q58
KEYWORDS .
Risk aversion
.
Emissions Tax
.
Mitigation
Insurance
.
Fertilisation
.
Agriculture
.
RISK AS A LIMIT OR AN OPPORTUNITY
TO MITIGATE GHG EMISSIONS?
The case of fertilisation in agriculture
Benjamin DEQUIEDT1, Emmanuel SERVONNAT2
n° 2016-06 • September 2016
1. Corresponding author. [email protected]. Climate Economics Chaire – Paris France.
2. InVivo-Agrosolution.
WORKING PAPER
Chaire Economie
du Climat
Palais Brongniart,
4ième étage
28 place de la
bourse
75002 PARIS

Acknowledgment
Warm thanks go to Stéphane De Cara, Philipe Delacote, Antoine Poupart, Shahbano Soomro, Marielle
Brunette and Caroline Orset for their reading and advice.

1. Introduction
Nitrogen pollution is a significant environmental issue around the world and in Europe (Galloway et
al, 2008 ; European Commission, 2013). The carbon cycle usually receives more attention than the
nitrogen cycle, due to the central role of CO2 in global warming. However, the nitrogen cycle is also
deeply disordered by human activities especially through fertilisation of agricultural soils. This
disruption brings a range of impacts, from accelerating climate change to participating in water
pollution and generates high external costs (Von Blottnitz et al, 2006). In the European Union,
fertilisation from farm activities accounts for 38% of agricultural greenhouse gas (GHG) emissions
and represents 4% of the overall European emissions (in 2014 according to the UNFCCC, 2016)1.
France constitutes also a good example of the nitrogen over-application issue due to the importance of
the agricultural sector in French economy and since air and water pollution by nitrogen has been
highlighted by many studies (Dalmas, 2010).
In response to these environmental consequences, important regulations on fertilisation have been
undertaken. In the forefront, the Nitrate Directive limits nitrogen application on specific areas and
affects indirectly farming externalities, including GHG emission, but the ambitious national and
international commitments to cut global emissions2 strengthen the necessity to mitigate emissions in a
cost-efficient way.
To tackle the pressing problem of climate mitigation it is generally argued that the most efficient
instrument is emission pricing (Lamhauge and Cox, 2013; Ellerman et al., 2010). Many papers have
investigated the potential impact of setting up this instrument in agriculture even though this sector has
been set aside from European and national climate policies. To name a few, De Cara and Jayet (2011)
evaluated the impact of a tax on fertilisation and induced reductions of greenhouse gases. Bourgeois et
al. (2014) also simulated the impact of a tax on fertilizer application coupled with subsidies on
perennial crops such as miscanthus. Likewise, Dequiedt and Moran (2015) assessed the impact on
legume crops and the resulting impact on GHG emissions. These papers are all based on the
assumption of profit maximization or cost minimization but little attention has been paid to other
essential elements of the decision-making process of farmers. Among those elements, risk
management appears as a determining dimension in the production choice of farmers (Chavas and
Holt, 1990; Cook et al., 2013; Menapace et al., 2013) and could constitute a potential barrier to
mitigate emissions. Indeed, in a survey conducted on the behavior of farmers, Dury (2011) reveals for
1 In France, nitrogen fertilisation accounts for 44% of greenhouse emissions (GHG) from French agriculture and alone
represents 8 % of national emissions in 2014 (UNFCCC, 2016)
2 See for instance the European Council agreement in October 2014 aiming to reduce European greenhouse gas emissions by
40% by 2030 relative to 1990 levels

instance that less than 1% of farmers cite profit maximization as the sole decision criterion. 71% of
them seek instead a "good" profit associated with minimal risk. Besides, Berentsen et al. (2012) show
that the risks associated with organic dairy farms are more important than the risk of conventional
agriculture (both on the size of the production and agricultural prices) and therefore limits the change
of practices. Interested in the barriers associated with a fertilisation reduction program in the United
States, Stuart et al. (2014) have shown that the yield loss associated with reduced fertilisation is
considered as an important and immediate risk. For most of the interviewed farmers, applying an
additional amount of fertilizer is perceived as a way to reduce exposure to production risks. Therefore,
it is appropriate to study the impact of risk on the incentive effect of a emission price and also to
consider the potential role of insurance as a tool to reduce emissions from fertilisation.
This paper contributes to the literature on GHG mitigation cost assessment in agriculture by providing
some analytical and quantitative insights into the following three main questions:
- How risk aversion can explain all (or a part of) nitrogen over-application?
- To what extent risk aversion can limit the mitigation incentive created by a emission price on
GHG emissions?
- If farmers use fertilizers as self-insurance, what would be the emissions reduction triggered by
an insurance program to mitigate emissions?
For these purposes, we use an original data base, completed by InVivo-Agrosolution farming
cooperative, which allows us obtaining a large sample of farmers’data located in three departments in
France. We first use feasible generalized least square (FGLS) regression to determine the link between
yield variability and nitrogen application at the plot level. In a second step, we use these results to
derive risk aversion coefficient consistent with actual farmers’ fertilizers spreading. Then, these
coefficients are used to simulate the impact of emission price and also to simulate the impact of an
insurance system on emissions.
The next section presents the literature on risk and fertilisation. Section 3 details the model of farmers’
decision-making on nitrogen application. Data and econometric method are presented in Section 4.
Section 5 presents the results. Discussion is given in section 6.

2. Literature review on risk and fertilisation
Can nitrogen be used by farmers to reduce their exposure to risk? The answer to this question depends
on the link between inputs and yield variability (Lambert, 1990; Leather and Quiggin, 1991).
Although this topic has been widely studied in the literature, there is no clear consensus on this link.
First, an important stream of empirical studies concludes that fertilizers are a risk-increasing factor as
they have variance-increasing effect on yield (Just and Pope, 1979; Rajsic et al., 2009; Montjardino et
al., 2015). This statement depends on weather uncertainty, which implies high level of yield in good
growing years and low in bad growing years. This uncertainty has two possible effects depending on
the consideration of farmers risk aversion. On one hand, according to Babcock (1992), who takes into
account solely the expected profit in the farmer objective function, farmers should be tempted to apply
larger amount of nitrogen compared to the case where yield variability is not considered. Since
farmers do not know what the growing conditions will be before nitrogen application, it is optimal for
them to anticipate good conditions so that nitrogen will not limit potential profits in those years. On
the other hand, other studies concludes that in reason of their risk aversion, farmers tend to spread less
fertilizers so as to limit the probability of bad events (Montjardino et al., 2015; Broun, 2007; Finger,
2012). Second, an alternate stream concludes that fertilizers could conversely be a risk reducing factor.
Because unobservable processes (such as leaching, denitrification or nitrogen up-take in previous crop
in rotation) influence the availability of nitrogen in the soil this could results in reducing the variability
of yields as nitrogen amount increases (Gandorfer et al., 2011 ; Comifer, 2011) and then could favor
the over-application of fertilizers. This corresponds to studies focusing on risk perception of farmers,
who consider nitrogen as a risk-decreasing input (SriRamaratnam, 1987; Stuart et al, 2014). Third,
some studies argue that the link between fertilisation and variability can not be clearly established.
Regev and al. (1997) show no conclusive evidence to assert if nitrogen is either risk-reducing or risk-
increasing. Then, according to Antle (2010) empirical study on potato production, the conclusion on
this link depends on utility framework implemented: a risk-value model based on partial moments
implies that fertilizer is risk increasing, whereas an expected utility model based on full moments has
the opposite implications. One explanation for these seemingly contradictory conclusions is the
diverse climate and agricultural contexts of studies. Going forward, it seems necessary to assess the
role of nitrogen at each geographical level to see whether it is a risk-reducing factor or a risk-
increasing factor.
Some papers have addressed the question of the impact of insurance on chemical input use.
Theoretically, two different effects have been identified (Bougherara, 2011). The first effect is linked
to the above-discussed risk-reduction effect. As insurance increases income in bad states of nature,
while decreasing income in good states of nature by charging a premium, it thereby cause farmer to act
more like risk-neutral farmer (Sheriff, 2005). Hence, the impact on input use relies on the relationship

between fertilizer and risk. If chemical inputs are risk-reducing then they will reduce the amount
spread, with the opposite effect if they are risk increasing. The effect one is the moral hazard effect. It
occurs when producers take actions to increase the probability and size of losses, and provide
incentives for less intensive cultivation practices that result in reduction of inputs and average yields
(Coble et al., 1993). Which effect dominates has been examined by empirical papers. In a study
conducted on corn farmers, Horowitz and Lichtenberg (1993) conclude that insured farmers applied
significantly more nitrogen per acre (+19%) than uninsured one, thus supporting the view that
chemical inputs are a risk-increasing input. However these results were latter contradicted by Smith
and Goodwin (1996) who confirm the view that moral hazard incentivizes insured farmers to use
fewer chemical inputs.
As global warming is expected to cause an increase in the frequency of extreme climate events,
insurance is mainly foreseen as a tool to favor adaptation to climate change (Smit and Skinner, 2002).
However, as chemical input have been highlighted to play the role of a self-insurance when their risk-
reducing ability have been elicited (see for instance Bougherara, 2011 for pesticides), insurance could
also be considered as a possible tool to support the implementation of environmental measures3. This
potential is for instance developed by Huang et al. (2001) who, in a study of US agriculture,
analytically and empirically show that an insurance system can help to reduce the amounts of nitrogen
applied by the farmer. So far, to our knowledge it has not been used as a tool to limit agricultural
environmental externalities. Yet, an interesting example of the possible forthcoming role of
instruments that support the adoption of environmental measures , by tackling uncertainty and risk, is
provided by the 2015 framework convention between the Loire-Bretagne Water Agency and local
farming cooperatives (Agence de l’Eau – Loire Bretagne, 2015). The objective of this convention is to
favor the implication of farmers in improving the quality of water. Among the different incentives, the
convention plans to establish the reimbursement of losses due to the implementation of innovation
only in case of failure.
3 In France, the current agricultural insurance system is characterized by public and private intervention that help to cover
damages caused by frost, hail or drought. The public intervention is under the responsibility of the FNGRA (Le Fonds
national de gestion des risques en agriculture) and aims to cover farmers against uninsurable risk. Insurable risks are covered
by the private market, alongside government intervention: farmers receive a grant representing at most 65% of the insurance
premium.

3. Modelling fertilisation application and risk
3.1. Economic decision model
We consider farmers who grow different crops (indexed by i) and who have to choose fertilizers
amounts (𝑥𝑖) on these different crops. As we assume that the problem is intra-annual, the land
allocation among crops is already determined. It is assumed that the sole risk faced by farmers affects
crop yields. At the time of N application, yields of the current crops are not known to the farmer. They
are modeled as a random variable �̃�𝑖, where (�̃�𝑖(𝑥𝑖)) follows a Gaussian distribution, with mean
E[𝑦(𝑥𝑖)] and variance 𝑉[𝑦𝑖(𝑥𝑖)] are assumed to be known by the farmer. Absent any public regulation,
the profit of one farmer is thus:
�̃�(𝑥𝑖,..,𝑛) = ∑ 𝑙𝑖[�̃�𝑖(𝑥𝑖) 𝑝𝑖 − 𝑥𝑖𝑤]
𝑛
𝑖
(1)
where 𝑤 is the unit price of nitrogen fertilizer, 𝑝𝑖 the crop price received by the farmer and 𝑙𝑖 the field
area. In order to integrate risk in the farmers’ decision making, we assume that their preferences can be
fully characterized by a von Neumann and Morgenstern (1947) utility function. Our analysis is based
on expected utility-maximization. Then, the problem faced by any farmer is to choose input use
intensity per crop that maximizes his overall expected utility. The optimal amount 𝑥𝑖∗ per hectare is
thus the result of the following problem:
max𝑥𝑖,..,𝑛
{E[𝑢(�̃�(𝑥𝑖,..,𝑛))]}
(2)
where E denotes the expectation operator and �̃� the variable profit associated with crop production
depending on fertilizer amount spread. Two possible utility functions are examined : (i) a constant
absolute risk aversion (CARA) function (eq. 3) and (ii) a constant relative risk aversion (CRRA) (eq.
4). Both specifications have been commonly used in the literature examining expected utility based
decisions (Markowitz 1952; Pope et al, 2011; Monjardino et al, 2015; Polomé et al., 2006). CARA
function enables us to represent risk aversion behavior that remains constant with wealth; whereas
CRRA allows us to represent Arrow’s intuition implying that an individual's willingness to undertake
a certain risky measure is greater when he or she is wealthier. CARA function is an exponential
transformation of wealth:

𝑢(�̃�) = −𝑒−𝛼�̃�
(3)
where 𝛼 is the absolute risk aversion parameter (𝛼 > 0 for a risk averse agent; 𝛼 < 0 for a risk loving
agent). CRRA is a power function and is represented as follow:
𝑢(�̃�) =
�̃�(1−𝑟)
1 − 𝑟
(4)
Where r is the relative risk aversion coefficient. Relative risk aversion and relative risk loving
preferences are obtained respectively for r > 0 and 𝑟 < 0. As yields are assumed to follow a Gaussian
distribution, in both cases (CARA and CRRA), the expected utility can be written in function of the
expected profit and the variance profit (V) (see appendix 8.1 and 8.2 for details) as follow:
max𝑥𝑖,..,𝑛
{𝐸[𝑢(𝜋(̃𝑥𝑖,..,𝑛))] = 𝑎 + 𝑏. 𝐸 [∑ �̃�𝑖(𝑥𝑖)
𝑛
𝑖
] − 𝑐. 𝑉 [∑ �̃�𝑖(𝑥𝑖)
𝑛
𝑖
]} (5)
With a=𝜋0 for CARA preferences and a=𝑢(2𝜋0) + 𝑢′(2𝜋0)𝜋0 for CRRA preferences, 𝜋0 being the
initial wealth of a farmer. b=1 for CARA preferences and b= 𝑢′(2𝜋0) for CRRA preferences.
c=−𝑢′′(2𝜋0)
2=
𝑟(2𝜋0)−1−𝑟
2 for CRRA preferences and c=
𝛼
2 for CARA preferences.
We found no covariance between the different yield functions4. Then, the solutions of the overall
maximization program are equivalent to the solutions of individual field maximization program:
max𝑥𝑖
{𝐸[𝑢(�̃�𝑖(𝑥𝑖))] = 𝑏. 𝐸[�̃�𝑖(𝑥𝑖)] − 𝑐. 𝑉[�̃�𝑖(𝑥𝑖)]} (6)
This form of equation allows us to represent in the objective function both expected income and profit
variability, both of which are determined by nutrient input. The optimal input 𝑥𝑖∗ must satisfy the first
order condition given by:
𝑑𝐸[𝑢(𝜋�̃�(𝑥𝑖∗))]
𝑑𝑥𝑖
=𝑑𝐸[𝜋�̃�(𝑥𝑖
∗)]
𝑑𝑥𝑖
− 𝑘 𝑑𝑉[𝜋�̃�(𝑥𝑖
∗)]
𝑑𝑥𝑖
= 0
(7)
4 This finding is consistent for instance with Polomé et al. (2006) study on acreage allocation under
risk where no covariance was found between crops after examination of panels of yields.

With k = 𝛼
2 in for CARA preferences and k=
𝑟
4𝜋0 for CRRA preferences. The second order condition is
written as:
𝑑2𝐸[𝑢(𝜋�̃�(𝑥𝑖))]
𝑑𝑥𝑖2 =
𝑑2𝐸[�̃�(𝑥𝑖)]
𝑑𝑥𝑖2 − 𝑘
𝑑2𝑉[𝜋�̃�(𝑥𝑖)]
𝑑𝑥𝑖2 < 0
(8)
From equation 7, we find according to the implicit function theorem (see appendix 8.7-a for
demonstration):
𝜕𝑥𝑖∗
𝜕𝑘=
𝑑𝑉[𝜋�̃�(𝑥𝑖∗)]
𝑑𝑥𝑖
∗ (𝑑2𝐸[�̃�(𝑥𝑖)]
𝑑𝑥𝑖2 − 𝑘
𝑑2𝑉[𝜋�̃�(𝑥𝑖)]
𝑑𝑥𝑖2 )
−1
(9)
Proposition 1: Under CARA and CRRA utility functions, risk aversion increases the optimal amount
of fertilizers when the variance of profit is decreasing with 𝑥𝑖, convex or linear5.
This proposition illustrates the impact of attitude toward risk on optimal nitrogen application. It shows
that nitrogen can be used to manage risk production and is in line with some studies mentioned in the
literature review (Montjardino et al., 2015; Broun, 2007; Finger, 2012; Lambert, 1990). Hence, risk
averse farmers apply more nitrogen than risk neutral ones when fertilizers are a risk-decreasing factor.
3.2. Policy instruments
1. Taxation of N2O from fertilisation.
The solution to eq. 6 corresponds to a situation in which no policy instrument is in place on
greenhouse gas emissions. In particular, the social cost of fertilisation is not internalized by the farmer.
Consider now a situation where a price on GHG emission is introduced. The program becomes:
max𝑥𝑖
{E[𝑢(𝜋�̃�(𝑥𝑖) − 𝑥𝑖𝑓𝑡𝑙𝑖)]}
(10)
Where 𝑓 represents the emission factor of fertilizers (eg. in tCO2eq/kgN) and t denotes the level of the
emission price (tax) in euros/tCO2eq. The relation between the optimal fertilizer amount and the
emissions tax is:
5 Appendix 8.3 illustrates the different configurations of functions forms influencing optimal input 𝑥𝑖
∗

𝜕𝑥𝑖∗
𝜕𝑡= 𝑓𝑙𝑖 ∗ (
𝑑2𝐸[�̃�(𝑥𝑖)]
𝑑𝑥𝑖2 − 𝑘
𝑑2𝑉[𝜋�̃�(𝑥𝑖)]
𝑑𝑥𝑖2 )
−1
(11)
As the second order condition (eq. 8) implies the denominator to be negative then the emission price
always generates emission reductions. We then focus on the impact of risk aversion on emission
reductions triggered by emissions price (see appendix 8.4-b for demonstration):
𝜕2𝑥𝑖∗
𝜕𝑡 𝜕𝑘= − 𝑓𝑙𝑖
𝑑2𝑉[𝜋�̃�(𝑥𝑖)]
𝑑𝑥𝑖2 ∗ (
𝑑2𝐸[�̃�(𝑥𝑖)]
𝑑𝑥𝑖2 − 𝑘
𝑑2𝑉[𝜋�̃�(𝑥𝑖)]
𝑑𝑥𝑖2 )
−2
(12)
Proposition 2: Under CARA and CRRA behaviors, when the variance is convex with respect to 𝑥𝑖
then risk aversion reduces the marginal impact of emission price on fertilisation reductions.
This proposition illustrates the impact of attitude toward risk on the emissions price incentive to
reduce GHG emissions. We observe that the determining factor is the form of the variance function.
When the variance is linearly decreasing (𝑑2𝑉[𝜋�̃�(𝑥𝑖)]
𝑑𝑥𝑖2 = 0), risk aversion bears no influence on emissions
mitigation but when it is convex (𝑑2𝑉[𝜋�̃�(𝑥𝑖)]
𝑑𝑥𝑖2 > 0) then GHG abatement are decreasing under risk
aversion behavior. On the contrary, when the variance function is concave (𝑑2𝑉[𝜋�̃�(𝑥𝑖)]
𝑑𝑥𝑖2 < 0) then risk
aversion increases the abatement.
2. Insurance Program.
Proposition 1 indicates that risk averse farmers may use additional fertilizers as a self-insurance to
minimize their exposure to risk. We examine the possibility to substitute it by an external insurance
program aiming at reducing emission linked to risk aversion. First, farmers are free to subscribe to the
insurance program by comparing their initial level of utility when they completely support risk to the
utility associated with the insurance. Then, when they find that it is more interesting to participate in
the insurance program, an indemnity is triggered only when the actual yield falls below a specific
yield threshold noted 𝜏 (in % of the initial expected yield). When the realized yield is higher than this
threshold, the farmer is not compensated. When loss occurs beyond this threshold the producer
receives the yield shortfall valued at the crop price. In return, the farmer has to pay an insurance
premium 𝐼 in (euros/ha) whatever the amount of the realized yield. As we want to find the optimal
nitrogen application amount, the expected utility maximization program under insurance participation
can be written as:

max�̅�𝑖
{E[𝑢(𝜋�̃�(�̅�𝑖) − 𝐼)]} (13)
s.t 𝑥𝑖∗ ≥ �̅�𝑖 > 0
With �̅�𝑖 being the amount of nitrogen application under insurance. In a more detailed form eq.14
becomes :
E[𝑢(𝜋�̃�(𝑥_𝑖𝑛𝑠) − 𝐼)] = ∫ 𝑔 (�̃�𝑖(�̃�𝑖(𝑥_𝑖𝑛𝑠))) 𝑢(𝜋𝑖(𝜏) − 𝐼)𝑑𝑦
𝜏
0
+ ∫ 𝑔 (�̃�𝑖(�̃�𝑖(𝑥_𝑖𝑛𝑠))) 𝑢(𝜋𝑖(𝑦) − 𝐼)𝑑𝑦
+∞
𝜏
(14)
With 𝑔(�̃�𝑖) being the probability density function of a normal distribution. Participation in the
insurance program occurs when E[𝑢(𝜋�̃�(𝑥_𝑖𝑛𝑠𝑖∗) − 𝐼)] > E[𝑢(𝜋�̃�(𝑥𝑖
∗))] and emissions reductions occur
when the optimal �̅�𝑖∗ with insurance is lower than 𝑥i
∗ maximizing the initial expected utility with no
insurance. Appendix 8.5 illustrates 3 different cases of the impact of insurance on emission reductions.
4. Empirical Application
4.1. Data
The data used in this paper come from Epicles, a database compiled by InVivo-Agrosolution, a French
farming cooperative. It comprises the fertilisation practices of farmers who are members of the
cooperative, in particular the amount of nitrogen spread for each farmer, the amount prescribed by the
cooperative, the resulting crop yield, the soil type and the preceding crop in the rotation. This
information is available at the field level and is highly detailled in comparison to other data bases used
in the literature6.
We chose to restrict our attention to three departments (Deux-Sèvres, Seine-Maritime et Eure-et-Loir).
Foremost this is because those departments are well represented in Epicles database and, also because,
they represent a diversity of farming conditions. Deux-Sèvres department is mostly composed by
livestock and cropping systems and is characterized by relative low yield, Seine-Maritime comprises
also livestock and cropping systems, but with higher yields, and Eure-et-Loir which covers a part of
the Beauce region, is mainly characterized by the presence of cropping farms with high yields and
relatively low diversity in the crops composition. The Epicles database covers 22,5% of the Deux-
Sèvres cereals land use, 10,7% of Seine-Maritime land use and 20,0 % of Eure-et-Loir land use.
6 The European FADN (Farm accountancy Data Network) database, for instance, gathers data from representative farms of a
given territory but not the data of all farms. Besides, it does not give information on the amount of fertilizers but the cost
linked to fertilization.
We focus on 10 main crops : common wheat, oat, rape seed, durum wheat, fodder maize, grain maize,
spring barley, winter barley, sunflower and triticale. We use data for four harvest campaigns (2010,
2011, 2012 and 2013) to assess the parameters of the yield and variance functions. We remove from
the data set crop categories (characterized by a department location, a soil type, and a preceding crop
type) whose number is inferior to 30. To isolate the effect of nitrogen on yield we do not examine
plots having received any mineral element (K, S, G etc.) other than nitrogen. In addition, farmers who
do not report their nitrogen application are also eliminated from the study. In some cases, the
declaration is systematically the same as the amount advised by the cooperative or when the amount of
nitrogen applied is 0. These cases are also left out. Finally, a total of 24 729 observations are used in
the regressions (see table 1). The impact of a tax on GHG emissions and the implementation of an
insurance program are assessed using the initial fertilisation levels of the 2013 campaign which
represents 2 774 plots (appendix 8.6 gives a detailed overview of the different steps in the data base
treatment).
Table 1 - Description of the sample used in the regression (step 2 of the data base treatment)
As Epicles reports only fertilisation and yield variables, economic parameters are taken from public
databases. Prices are taken from the Eurostat database and correspond to the average price during the
period 2007-2011. This average is supposed to represent the anticipated price by farmers on the basis
Source Unit Deux-Sèvres
(79)
Seine-
Maritime
(76)
Eure-et-Loir
(28) Overall
Number of
observations Epicles 16 007 4 691 4 031 24 729
Land Area
(year 2013) Epicles ha 14 607 8 434 7 323 23 041
Number of
Farms
concerned
Epicles
1065 581 655 2 301
Average
Chemical
Fertilizer
application for
wheat
(year : 2011)
Epicles kg.ha-1 137 183 163 -
Agreste Crop
Survey
(Agreste,
2014)
kg.ha-1 138 158 160 -
Average Yield
for wheat
(year : 2011)
Epicles q/ha 68 85 79 -
Agreste Crop
Survey
(Agreste,
2014)
q/ha 60 62 78 -

of their value in the latter period. Fertilizer cost is based on a fertilizer price assumption of 1 €/kg
(RICA and Agreste7). We suppose that fertilizer management cost relates to storage, transport and
spreading is 2 €/kg (Agreste, 2011). To calculate 𝜋0 in the CRRA hypothesis we include the CAP
direct payment and fixed charges. Direct payment corresponds to the average subsidies found in the
Agreste public data base and is specific to each department. The other public subsidies are considered
negligible. Fixed charges are supposed to be 225 euros/ha following Agreste 2012. This cost
represents a national average of instalment amortization, contract work and financing expenses.
4.2. Estimation methodology and functional forms
As we want to depict an exhaustive description of the possible links between fertilisation and yield,
yields are regressed against fertilizer amounts for each crop category i characterized by a location
within a department, a specific crop, a ground type and a specific preceding crop in the rotation. All in
all, the 24 729 observations we have at our disposal before regression are classified into 213 crop
categories. For each of these crop categories, inputs are allowed in the specifications to influence the
mean but also the variability of crop yields. In the specification of the yield function, a quadratic
functional form (eq. 15) was found to be the most adequate. We follow here Cerrato and Blackmer
(1990) or Belanger et al. (2000). This functional form has the advantage of being easily implemented
and can potentially takes into account the decrease of yield after achieving the maximum yield.
𝐸[𝑦𝑖(𝑥𝑖)] = 𝛽1𝑖 + 𝛽2𝑖𝑥𝑖 + 𝛽3𝑖𝑥𝑖
2 (15)
Where 𝛽1, 𝛽2 and 𝛽3 are parameters of the yield response function. If 𝛽2 + 2𝛽3𝑥𝑖 < 0, the marginal
productivity of fertilizer is decreasing. Yield variance is determined by input use and is also specified
by a quadratic function (eq. 2) for each crop.
𝑉[𝑦𝑖(𝑥𝑖)] = 𝜌1𝑖 + 𝜌2𝑖𝑥𝑖 + 𝜌3𝑖𝑥𝑖
2 (16)
Where ρ1 is the yield variation solely determined by weather and soil conditions. ρ2 and ρ3 quantify
the influence of nitrogen on yield variation. Fertilizing is risk decreasing if 𝜌2 + 2𝜌3𝑥𝑖 < 0.
In order to estimate simultaneously the parameters of functions 15 and 16 feasible generalized least
squares (FGLS) regression is applied following Finger and Schmid (2008) methodology8.
7 Data extracted for the year 2011 to 2014.
8 The estimation is conducted with the MODEL procedure of the SAS statistical package (SAS
INSTITUTE, 2012)

4.3. Estimation methodology for risk aversion
Risk aversion is estimated for each farmer g. As the data base treatment eliminates some fields per
farm, we could not estimate robust aversion coefficient per farmer. Consequently, we used a pragmatic
approach of calibration which consists in selecting the level of aversion k minimizing the distance
between estimated fertilisation amounts 𝑥𝑖∗ and observed fertilisation 𝑥𝑖𝑜𝑏𝑠
.
min
𝑘𝑔
{∑|𝑥𝑖𝑜𝑏𝑠− 𝑥𝑖
∗|
𝑛
𝑖
}
(17)
In a more specified form, the minimization program can be also written as (see appendix 8.1 for a
detailed demonstration):
min
𝑘𝑓
{∑ |𝑥𝑖𝑜𝑏𝑠−
𝑘𝑓𝑝𝑖2𝑙𝑖𝜌2,�̂� + 𝑤 − 𝛽2,�̂�𝑝𝑖
(2𝛽3,�̂�𝑝𝑖 − 2𝜌3,�̂�𝑘𝑗𝑙𝑗,𝑖𝑝𝑖2)
|
𝑛
𝑖
} (18)
with 𝜌2,�̂�, 𝜌3,�̂�, 𝛽2,�̂� and 𝛽3,�̂� being the parameter estimates issued from the regression. This approach
has the drawback of producing aversion coefficients which are not checked as significantly different
from zero but has the advantage to depict a risk aversion distribution of farmers in the sample.
Considering this limit, we also explore the impact of other risk aversion coefficients assessed in the
economic literature on farmers. These are presented in the following table and will be uniformly
implemented for all farmers for emissions tax and insurance simulations.
Table 2 – Aversion coefficient taken in the literature for sensitivity analysis
Scenarii Aversion Coefficient Type of aversion
coefficient
Source
« CARA 1 » Estimation Absolute Eq. 16
« CARA 2 » Uniform* : 7,5.10-7 Absolute Pope et al, 2011
« CARA 3 » Uniform* : 0,0075 Absolute Saha et al., 1994
« CARA 4 » Uniform* : 0,04 Absolute Brunette et al, 2015
« CRRA 2 » Uniform* : 0,25 Relative Lansink., 1999
“Value in the range [0,31-0,2]”
« CRRA 3 » Uniform* : 1,12 Relative Brunette et al, 2015
« CRRA 4 » Uniform* : 5,4 Relative Saha et al., 1994
* The same aversion coefficient for every farmer.

5. Results
5.1. Regression
We keep all of the estimates of the yield function (eq.15) and variance function (eq.16) associated with
a p-value inferior to 5% and only in cases where heteroscedasticity is not detected9. Table presenting
the exhaustive results of the parameter estimates per crop type is available upon request or through the
link in the footnote10
. Over the 213 different crop categories, 160 have been consistently estimated and
53 have not been estimated, either because of failure in the convergence of the model, simultaneous
lack of significance in the parameter estimates or because of heteroscedasticity.
Table 3 presents a summary of the forms of the yield and variance functions derived from the
parameter estimates. Over the 160 crop types whose functions have been successfully estimated, 97 of
them follow a constant variance. For the others, the yield variance is influenced by nitrogen
application. Within the latter category, the majority of crops have a linear decreasing variance
function. Convex variance functions and concave variance functions come respectively second and
third. From these results we observe that cases where there is risk-decreasing significance of fertilizer
are relatively consistent and should not be neglected when assessing the emission tax impact.
9 Using the White and Breusch-Pagan tests.
10The following link gives access to the table presenting the results of the regression :
https://docs.google.com/spreadsheets/d/1qmaiz7boFxlZOJmesc7r9rDtYnIZ8hXJJMUpCzFLUSg/edit?
usp=sharing

Table 3 – Forms of variance and yield functions detected from the regression
Notes :
a Crop types where risk aversion implies additional nitrogen amounts application (see proposition 1)
b Crop types where risk aversion reduce the impact of emission price (see proposition 2)
Variance Function (eq.16)
Total
Types
Total
Obs.
𝜌2 > 0
𝜌3 < 0
Concave
𝜌2 = 0
𝜌3 = 0
Constant
𝜌3 > 0
Convex
𝜌2 > 0
𝜌3 = 0
Linear
Increasing
𝜌2 < 0
𝜌3 = 0
Linear
Decreasing
Types Obs. Types Obs. Types Obs. Types Obs. Types Obs.
Yield
Function
(eq.15)
𝛽3 < 0
Concave 1 361 52 5 132 5a,b 1240a,b 2 505 28a 4 587a 88 11 825
𝛽2 = 0
𝛽3 = 0
Constant
1 121 27 2 756 2a,b 153a,b
12a 2 083a 42 5 113
𝛽3 > 0
Convex
1 294
1 54 5 371 7 719
𝛽2 < 0
𝛽3 = 0
Linear
Increasing
1 147 17 1 824
5 396 23 2 367
Total 3 629 97 10 006 7 1 393 3 559 50 7 437 160 20 024

5.2. Aversion
The validity of the different risk attitude hypotheses (see section 4.3) can be estimated by comparing
the distance between actual and estimated nitrogen application per hectare (see the detailed results in
appendix 8.7 for each scenario). In the CARA case, we observe that on average estimated nitrogen
applications in ‘CARA 1’ scenario fit better actual observations than other scenarii : we find only a
-6,9% difference on average per ha while other CARA scenario such as ‘CARA 3’ and ‘CARA 4’
broadly overestimate nitrogen application since the differences are respectively 93,2% and 473,4%;
CARA 2 underestimates optimal applications by -11,7%. Regarding the CRRA case, we find that the
best scenario is ‘CRRA 2’ since the difference is only -4,3% between estimated and actual
observations. In addition, we decide to retain the ‘CRRA 4’ scenario, due to the good fit of nitrogen
applications for risk averse farmers. Within this category, ‘CRRA 4’ provides the smallest difference
of -20,5%.
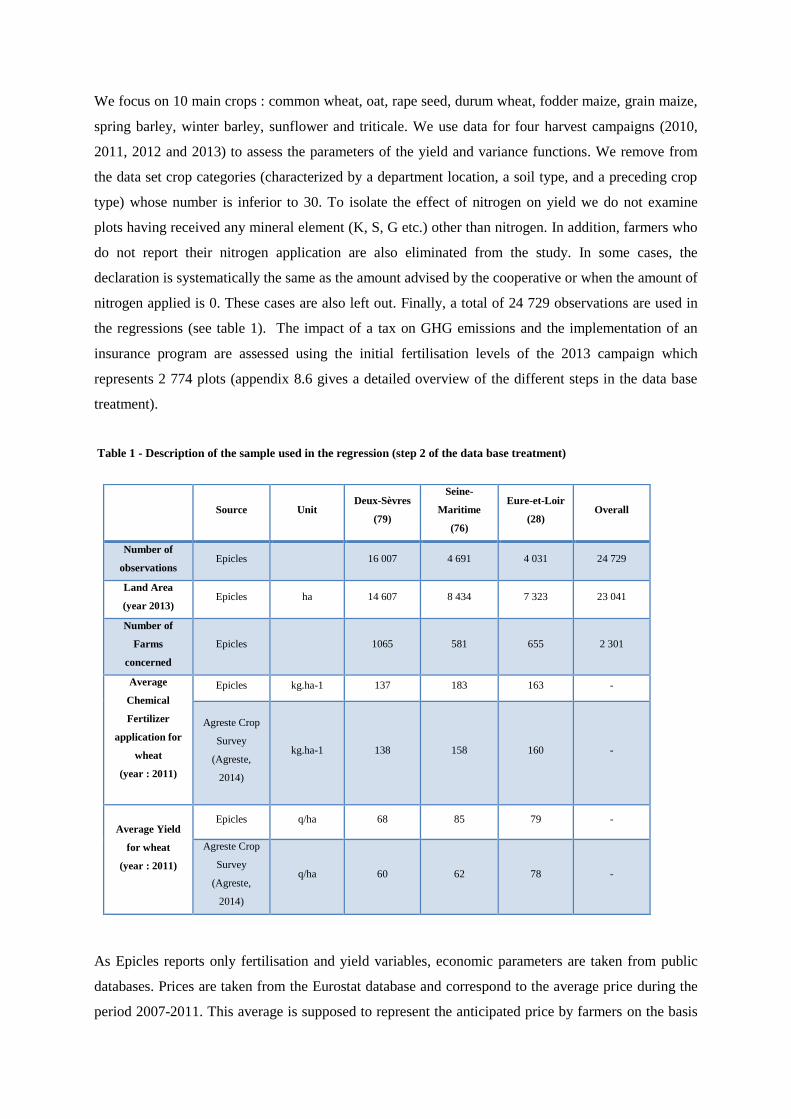
Under the ‘CARA 1’ hypothesis, 29,7% of farmers are risk-averse (see table 4). This proportion is
smaller than risk seeking farmers who represents 35,5% of the sample. Nevertheless the former set of
farmers account for most of the emissions (49%) because, first, they are associated with a higher
cultivated area and, second, they increase the amount of nitrogen application on crops presenting a
decreasing variance with fertilisation (see proposition 1). When comparing the optimal amount of
fertilizers under risk aversion behavior to risk neutral attitude we find that on average the surplus of
fertilisation amount is 29,4 kgN/ha which represents an average expected profit loss of 75,8 euros per
ha (see table 5). This surplus is particularly high on crop categories presenting a concave yield
function with a linear decreasing risk, a convex variance function or on constant yield function with a
linear decreasing variance. On these categories risk aversion is respectively associated with a surplus
of nitrogen of 34.2 kgN/ha, 34,8 kgN/ha and 80,4 kgN/ha.
Risk atitudes
Farmers
Land Use
Emissions
Number Share
(%)
Land
(ha)
Share
(%) tCO2eq
Share
(%)
Risk Averse 204 29,7 5502 39 3 758 49,0
Risk Seeking 244 35,5 4908 34 1 973 25,7
Risk Neutral 73 10,6 1170 8 593 7,7
Undetermined 166 24,2 2670 19 1 354 17,6
Total 687 100 14250 100 7678 100
Table 4 – Representativity of risk attitude in term of farmers, land use and emissions (scenario CARA 1)
Table 5 - Impact of risk aversion on nitrogen application and expected profit (scenario “CARA 1”)
a Difference of profit between risk averse behavior and risk neutral behavior
Form of
Expected
Yield
Form of
Variance
function
X*
X*
under risk neutral
behavior
Nitrogen
Application
linked to risk
aversion
Expected
Profit
Expected Profit
under risk neutral
behavior
Loss
linked to
risk
aversiona
kgN/ha kgN/ha kgN/ha euros/ha euros/ha euros/ha
Concave
Constant 161 161,0 0,0 841 841 0,0
Convexe 153 118,2 34,8 366 553,5 187,4
LinInc 25 43,8 -18,3 691 752,4 61,5
LinDecr 169 134,7 34,2 641 703,3 62,7
Constant Constan
LinDecr 80 0,0 80,4 577 818,4 241,1
Linear
Inc.
Constant 109 109,1 0,0 1008 1007,9 0,1
LinDecr 115 114,7 0,0 336 335,6 0,4
Overall 146 116,7 29,4 684 759,9 75,8
0
5
10
15
20
25
30
35
40
45
Freq
uen
cy
(%)
Risk Aversion Coefficient (k) - 0,001 Rounded
CARA 1
Figure 1 - Risk aversion distribution of farmers (including risk averse, risk seeking
and risk neutral attitudes) - scenario CARA 1

5.3. Impact of a price on N2O emissions
Results related to the impact of a price on GHG emissions are presented in figure 2. Figure 2-A shows
the absolute emissions for all scenarii and figure 2-B the emissions reductions according to increasing
tax on emissions. We observe that the price on emissions has to be quite high to trigger important
emission reductions. Indeed, below 100 euros/tCO2eq emission reduction are less than 5% in every
scenarii. This relatively low impact is due to the low greenhouse gas intensity of fertilisation per
hectare (around 0,05 to 0,65 tCO2eq/ha) which weakens the incentive created by the burden of
emission tax. Notably, in every case, the emission price incentive is associated with emissions
reductions but since risk aversion determines the initial amount of emissions the higher the risk
aversion the weaker the abatement. As CARA 1 scenario integrates both risk averse and risk seeking
behaviors a limited difference between trajectories exist with the ‘Neutral’ scenario. Additional
emissions from risk averse farmers are compensated by lower emissions from risk seeking ones.
Emissions reductions are associated with a slight decrease of yields mainly supported by the
contribution of fertilisation reduction on rapeseed, common wheat and winter barley (figure 2-F).
Focusing on emissions from risk averse individuals (figure 2-D), we observe that about 700 tCO2eq
(23% of emissions) are explained by risk aversion. This amount remains important as long as emission
price increases, implying that, regardless of the emission price, aversion still explains a part of
emissions. In figure 2-E, we observe the evolution of the economic burden of the emission price which
represents 51 euros/ha for a emission price of 100 euros/tCO2eq and which increases when emission
price increases.

A. Evolution of emissions under different risk scenarii B. Marginal abatement cost curves under different risk scenarii
C. Evolution of emissions according to risk attitude (scenario CARA 1) D. Impact of risk aversion of emissions (scenario CARA 1)
E. Economic Impact of Emissione Price (CARA 1) F. Yield evolution according to emissions reduction
(scenario CARA 1)
0
5 000
10 000
15 000
20 000
25 000
30 000
35 000
40 000
45 000
50 000
0 100 200 300 400 500
Em
issi
on
s (t
CO
2eq
)
Emission Price (euros/tCO2eq)
CARA1 CARA 3 CARA 4
CARA 2 CRRA 4 CRRA_3
CRRA 2 Neutral
0
50
100
150
200
250
300
350
400
450
0 5 10 15 20 25
Em
issi
on
s P
ric
e
(eu
ro
s/tC
O2
eq
)
Emissions Reduction (in %)
0
1000
2000
3000
4000
5000
6000
7000
8000
9000
0 100 200 300 400
Em
issi
on
s (t
CO
2eq
)
Emission Price (euros/tCO2eq)
Averse Neutral Risk Seeking Undetermined
0
500
1000
1500
2000
2500
3000
3500
4000
0 100 200 300 400 500
Em
issi
on
s (t
CO
2eq
)
Emission Price (euros/tCO2eq)
Risk Averse
(CARA_1)Neutral
0
100
200
300
400
500
600
700
0 100 200 300 400
Eu
ro
s/h
a
Emission Price (euros/tCO2eq)
Profit Carbon Burden
80
85
90
95
100
105
0 0,2 0,4 0,6 0,8
Yie
ld
(Em
issi
on
e P
ric
e -
Ba
se 1
00
)
Emissions (tCO2eq/ha)
Oats Durum Wheat
Common Wheat Rapeseed
Seed Maize Spring Barley
Winter Barley Sunflower
Tritical
Figure 1 - Impact of a tax on emissions from fertilisation

5.4. Insurance
Table 6 presents the results of insurance according to different possibilities of trigger threshold τ and
the different insurance premia in scenario CARA 1 (results on CRRA 4 scenario are exposed in
appendix 8.9). The simulation for insurance is made only for risk averse farmers as CARA utility
function is convex when the aversion coefficient is negative. In term of nitrogen application reduction,
participant farmers are encouraged to act more like risk neutral individual. Emission reductions occur
on crop types presenting a decreasing risk with nitrogen (see table 7). Consequently, nitrogen
application is reduced to 12,9 to 37kN/ha which causes a reduction of 8,2% to 20,5% of risk averse
individuals emissions. As expected, low insurance premiums and high trigger point τ involve higher
participation to the insurance program. To achieve similar reductions on risk averse agents through
emission price, tax has to achieve a range from 100 euros/tCO2eq to 400 euros/tCO2eq.
Table 6 - Impact of insurance on fertilizer application (in kgN/ha) and abatement (only on risk averse agents) –
scenario CARA 1
Insurance Trigger Threshold - τ
(in percentage of the expected yield)
10% 50% 90%
Insurance
Premium
(euros/ha)
25
Abatement % 11,5 % 15,2 % 20,5 %
Fertilisation Reduction kgN/ha 16,8 22,1 29,9
Participants % 100 % 100 % 100 %
Participants making reductions % 15% 37% 53%
Expected profit Euros/ha 727 738 799
50
Abatement % 11,5 % 15,2 % 20,5 %
Fertilisation Reduction kgN/ha 16,8 22,1 29,9
Participants % 100 % 100 % 100 %
Participants making reductions % 15 % 37 % 53 %
Expected profit Euros/ha 702 713 774
400
Abatement % 10,0 % 13,0 % 20,4 %
Fertilisation Reduction kgN/ha 14,6 19,0 29,7
Participants % 92 % 93 % 93 %
Participants making reductions % 12% 33% 53%
Expected profit Euros/ha 393 397 431
600
Abatement % 8,2 % 11,8 % 17,2 %
Fertilisation Reduction kgN/ha 12,0 17,2 25,1
Participants % 85 % 87 % 92 %
Participants making reductions % 10 % 30 % 47 %
Expected profit Euros/ha 260 255 279

Table 7 - Fertilisation reduction per type of crop (insurance premium 25 euros/ha and triggering threshold : 0,9)
Fertilisation reduction
(kgN/ha)
Form of expected Yield Variance function Form
Concave
Constant 0,0
Convexe -34,0
Linear Increasing 0,0
Linear Decreasing -32,2
Constant Linear Decreasing -76,5
Linear Increasing Constant 0,0
Linear Increasing -0,1
6. Discussion and conclusion
In this paper we investigate the role of risk aversion in nitrogen over-application, its potential impact
on emission price incentive and the potential of an insurance system to mitigate GHG emissions from
fertilisation. First, our results show that an important number of crop types present a risk decreasing
relationship with nitrogen application. It generally results in additional fertilizers applied by risk
averse individuals but does not represent a major obstacle to the impact of the emission price, as few
yield variance have been revealed to be convex (see table 3). Our study further illustrates the value of
insurance as an emission reduction tool. An interesting research opportunity to pursue would be to
lead similar investigations to other mitigation measures.
We are in the framework of expected utility originally developed by von Neumann and Morgenstern
(1947) which implies risk averse agents to favor, between two gains of equal expected income, the one
with the lowest variability. This approach has some limitations highlighted, for instance, by Ingersoll
(1987) who has given an example in which individuals prefer the situations in which variance is
stronger. More recently, and in one case directly applied to agriculture, Tanaka, Camerer and Nguyen
(2010) showed that the theory of expected utility does not fully represent the behavior of a panel of
Vietnamese farmers. Some have found that prospect theory provides a more realistic representation of
farmers surveyed (Kahneman and Tversky, 1979). The latter theory is echoed by Bocquého et al.
(2014) who estimate the risk aversion of French farmers and have for main implication to make
individuals more sensitive to losses as to gains and tend to make paying undue attention to unlikely
extreme outcomes. Despite the aforementioned criticisms, however, expected utility theory, is
relatively simple in its implementation and sufficient in explaining the contribution of additional doses
of fertilizers compared to a situation where uncertainty is not taken into account. On this basis, its use
is justified, but we take into account the other appropriate and divergent approaches in the literature.

Besides, we explore in this article risk aversion as a mean to explain the surplus of nitrogen
application but in three scenarii (CARA 1, CARA 2, CRRA 2) we find that risk aversion does not fully
explain all observed nitrogen amount (see appendix 8.7). This should attract our attention to additional
reasons for over-application nitrogen found within other articles of the literature. For instance, these
factors may include lack of trust in farm advisors or models (Stuart et al, 2014). The fact that we
elicited here the links between fertilisation and yield variability for different crop types in 3
departments does not mean that crop yield will follow these relationships at each individual farm level.
That lack of access to appropriate information or technological tools may inhibit the adoption of
practices to increase nitrogen use efficiency. Moreover, recent private-sector developments in
contracting have the potential to impact farming behavior as well. These contracts generally offer
higher levels of profitability compared to commercial crops. Most seed contracts also have a
competitive component: growers receive financial penalties or rewards based on how their production
compares to other growers of the same variety (Dubois, 2006; Stuart et al, 2014). Consequently
farmers concerned by contracts also act to achieve the optimal nitrogen to fit the best quality. All these
elements, explain why a large share of farmers prioritizes yields above economic return (Stuart et al,
2013).
Moreover, our findings suggest that insurance, as it is made on a voluntary basis, would be preferable
to a emission price. It is important to note however that, we only consider one option to mitigate
emission. If other alternatives to mitigate emissions, like changing crop allocation, were represented in
modelling, then we expect, from other results in the literature (De Cara and Jayet, 2011) that the
abatement cost would be lower. Moreover, we implicitly assume that the insurance program is
unaffected by the moral hazard effect. This effect is observed when farmers change their behavior
when they know that a part of their risk is covered, thus potentially leading to some fraudulent,
intentional losses. Among the conditions for the development of insurance, the insurer must be able to
estimate accurately both expected frequency and severity of loss (Barnett et al., 1999). Current
developments in insurance and farm advisement show that this latter point is bound to be improved.
Pacifica insurance company initiated for instance in 2015 an insurance contract dedicated one
grasslands implying surveillance by satellite to observe losses compared with a baseline built on an
historical production data (Crédit Agricole Assurance – Airbus Défense & Space, 2015). Morevover,
as farmers increasingly collect and report their economic gain and their production amount, used and
shared with farm Cooperatives, this could constitute a lever to identify and control loss at the farm
gate. Besides, if the implementation of insurance is conditioned by GHG mitigation, other techniques,
involved in precision farming, can help to improve measurement like static chambers measuring gas
fluxes between the soil ant the atmosphere (Collier et al., 2016) or organic emission assessment by
drone teledetection (Gilliot et al, 2014).

Together, these findings highlight further avenues for research, which ought to be pursued in future
works.

7. References
ADEME, 2012. Les émissions agricoles de particules dans l’air : état des lieux et levier d’action.
Agreste, 2014. Pratiques culturales sur les grandes cultures et prairies portant sur l’année 2011.
http://agreste.agriculture.gouv.fr/enquetes/pratiques-culturales/grandes-cultures-prairies/
Agreste, 2012. Charges de mécanisation et structure d’exploitation. Document de travail n°7 – Juillet
2012.
Agreste, 2011. Les Dossiers N° 12 - Juillet 2011
Agence de l’eau Loire-Bretagne, 2016. 10ième
programme de l’agence de l’eau Loire-Bretagne – 2016-
2018. Fiche 10. http://www.eau-loire-
bretagne.fr/nos_missions/programme_2013_2018/10prog_fiches-action111214.pdf
Antle, J. M. (2010). Asymmetry, partial moments, and production risk. American Journal of
Agricultural Economics, 92, 1294-1309.
Babcock, B. A. (1992). The effects of uncertainty on optimal nitrogen applications. Review of
Agricultural Economics, 271-280.
Barnett, B. J., Coble, K. H., & others. (1999). Understanding crop insurance principles: A primer for
farm leaders.
Bélanger, G., Walsh, J. R., Richards, J. E., Milburn, P. H., & Ziadi, N. (2000). Comparison of three
statistical models describing potato yield response to nitrogen fertilizer. Agronomy Journal,
92, 902-908.
Berentsen, P., Kovacs, K., & Asseldonk, M. V. (2012). Comparing risk in conventional and organic
dairy farming in the Netherlands: an empirical analysis. Journal of dairy science, 95, 3803-
3811.
Blottnitz, H. V., Rabl, A., Boiadjiev, D., Taylor, T., & Arnold, S. (2006). Damage costs of nitrogen
fertilizer in Europe and their internalization. Journal of environmental planning and
management, 49, 413-433.
Bocquého, G., Jacquet, F., & Reynaud, A. (2014). Expected utility or prospect theory maximisers?
Assessing farmers' risk behaviour from field-experiment data. European Review of
Agricultural Economics, 41, 135-172.
Bougherara, D. (2011). Rôle de l’aversion au risque des agriculteurs dans l’utilisation de pesticides et
implications pour la régulation.
Bourgeois, C., Fradj, N. B., & Jayet, P.-A. (2014). How Cost-Effective is a Mixed Policy Targeting
the Management of Three Agricultural N-pollutants? Environmental Modeling and
Assessment, 19, 389-405.
Broun, A. (2007). Assessing nitrogen application strategies for wheat production: a case study.

Brunette, M., Choumert, J., Couture, S., Montagne-Huck, C., & others. (2015). A Meta-analysis of the
Risk Aversion Coefficients of Natural Resource Managers Evaluated by Stated Preference
Methods.
Cayatte, J.-L. (2004). Introduction à l'économie de l'incertitude. De Boeck Supérieur.
Cerrato, M., & Blackmer, A. (1990). Comparison of models for describing; corn yield response to
nitrogen fertilizer. Agronomy Journal, 82, 138-143.
Chavas, J.-P., & Holt, M. T. (1996). Economic behavior under uncertainty: A joint analysis of risk
preferences and technology. The review of economics and statistics, 329-335.
Coble, K. H., Knight, T. O., Pope, R. D., & Williams, J. R. (1993). An empirical-test for moral hazard
and averse selection in multiple peril crop insurance. 75, 1296-1296.
Collier, S. M., Ruark, M. D., Oates, L. G., Jokela, W. E., & Dell, C. J. (2014). Measurement of
greenhouse gas flux from agricultural soils using static chambers. JoVE (Journal of Visualized
Experiments), e52110--e52110.
COMIFER. (2011). Calcul de la fertilisation azotée. Comifer.
Cooke, I. R., Mattison, E. H., Audsley, E., Bailey, A. P., Freckleton, R. P., Graves, A. R., et al. (2013).
Empirical Test of an Agricultural Landscape Model: the importance of farmer preference for
risk aversion and crop complexity. Sage Open, 3, 2158244013486491.
Dalmas, D., Moreau, R., Quévrremont, P., & Frey, V. (2010). Elaboration d'un plan de lutte contre les
algues vertes. Ministère de l'Ecologie, Ministère de l'Intérieur, Ministère de la Santé et des
Sports, Ministère de l'Agriculture.
De Cara, S., Jacquet, F., Reynaud, A., Goulevant, G., Jeuffroy, M.-H., Montfort, F., et al. (2011).
Economic Analysis of Summer Fallow Management to Reduce Take-All Disease and N
Leaching in a Wheat Crop Rotation. Environmental modeling \& assessment, 16, 91-105.
Dequiedt, B., & Moran, D. (2015). The cost of emission mitigation by legume crops in French
agriculture. Ecological Economics, 110, 51-60.
Dubois, P., & others. (2006). Efficacité des contrats agricoles: le cas de la production de blé en Midi-
Pyrénées. INRA Sciences Sociales.
Dury, J. (2011). The cropping-plan decision-making: a farm level modelling and simulation approach.
Institut National Polytechnique de Toulouse (INP Toulouse). INPT.
Ellerman, A. D., Convery, F. J., & Perthuis, C. D. (2010). Pricing emission: the European Union
emissions trading scheme. Cambridge University Press.
European Commission (2013). Rapport de la commission au conseil et au parlement européen relatif
à la mise en œuvre de la directive 91/676/CEE du Conseil concernant la protection des eaux
contre la pollution par les nitrates à partir de sources agricoles, sur la base des rapports
établis par les États membres pour la période 2008-2011. COM(2013) 683 final, European
Commission.
European Commission (2013). Nitrogen Pollution and the European Environment. In depth report.
European Union. (2009). Decision Number 406/2009/EC of the european parliament and of the
council of 23 April 2009 on the effort of Member States to reduce their greenhouse gas
emissions to meet the Community's greenhouse gas emission reduction commitments up
to 2020. Decision Number 406/2009/EC of the european parliament and of the council of
23 April 2009 on the effort of Member States to reduce their greenhouse gas emissions to
meet the Community's greenhouse gas emission reduction commitments up to 2020.
Finger, R. (2012). Nitrogen use and the effects of nitrogen taxation under consideration of production
and price risks. Agricultural Systems, 107, 13-20.
Finger, R., & Schmid, S. (2008). Modeling agricultural production risk and the adaptation to climate
change. Agricultural Finance Review, 68, 25-41.
Galloway, J. N., Townsend, A. R., Erisman, J. W., Bekunda, M., Cai, Z., Freney, J. R., et al. (2008).
Transformation of the nitrogen cycle: recent trends, questions, and potential solutions.
Science, 320, 889-892.
Gandorfer, M., Pannell, D., & Meyer-Aurich, A. (2011). Analyzing the effects of risk and uncertainty
on optimal tillage and nitrogen fertilizer intensity for field crops in Germany. Agricultural
Systems, 104, 615-622.
Gilliot, J.-M., Vaudour, E., Michelin, J., & Houot, S. (2014). Estimation des teneurs en emissione
organique des sols agricoles par télédétection par drone. 2--p.
Horowitz, J. K., & Lichtenberg, E. (1993). Insurance, moral hazard, and chemical use in agriculture.
American Journal of Agricultural Economics, 75, 926-935.
Huang, W.-Y., Heifner, R. G., Taylor, H., & Uri, N. D. (2001). Using insurance to enhance nitrogen
fertilizer application to reduce nitrogen losses to the environment. Environmental monitoring
and assessment, 68, 209-233.
Ingersoll, J. E. (1987). Theory of financial decision making (Vol. 3). Rowman \& Littlefield.
Just, R. E., & Pope, R. D. (1979). Production function estimation and related risk considerations.
American Journal of Agricultural Economics, 276-284.
Kahneman, D., & Tversky, A. (1979). Prospect theory: An analysis of decision under risk.
Econometrica: Journal of the Econometric Society, 263-291.
Lambert, D. K. (1990). Risk considerations in the reduction of nitrogen fertilizer use in agricultural
production. Western Journal of Agricultural Economics, 234-244.
Lansink, A. O. (1999). Area allocation under price uncertainty on Dutch arable farms. Journal of
Agricultural Economics, 50, 93-105.
Leathers, H. D., & Quiggin, J. C. (1991). Interactions between agricultural and resource policy: the
importance of attitudes toward risk. American Journal of Agricultural Economics, 73, 757-
764.
Markowitz, H. (1952). Harry M. Markowitz. Portfolio selection, Journal of Finance, 7, 77-91.

Menapace, L., Colson, G., & Raffaelli, R. (2013). Risk aversion, subjective beliefs, and farmer risk
management strategies. American Journal of Agricultural Economics, 95, 384-389.
Monjardino, M., McBeath, T., Ouzman, J., Llewellyn, R., & Jones, B. (2015). Farmer risk-aversion
limits closure of yield and profit gaps: A study of nitrogen management in the southern
Australian wheatbelt. Agricultural Systems, 137, 108-118.
Neumann, L. J., & Morgenstern, O. (1947). Theory of games and economic behavior. Princeton
University Press Princeton, NJ.
Polomé, P., Harmignie, O., & Frahan, B. d. (2006). Farm-level acreage allocation under risk.
Pope, R. D., LaFrance, J. T., & Just, R. E. (2011). Agricultural arbitrage and risk preferences. Journal
of econometrics, 162, 35-43.
Rajsic, P., Weersink, A., & Gandorfer, M. (2009). Risk and nitrogen application levels. Canadian
Journal of Agricultural Economics/Revue canadienne d'agroeconomie, 57, 223-239.
Regev, U., Gotsch, N., & Rieder, P. (1997). Are fungicides, nitrogen and plant growth regulators risk-
reducing? empirical evidence from swiss wheat production. Journal of Agricultural
Economics, 48, 167-178.
RICA. Réseau d'information agricole. http://agreste.agriculture.gouv.fr/page-d-accueil/article/donnees-
en-ligne
Saha, A., Shumway, C. R., & Talpaz, H. (1994). Joint estimation of risk preference structure and
technology using expo-power utility. American Journal of Agricultural Economics, 76, 173-
184.
Sheriff, G. (2005). Efficient waste? Why farmers over-apply nutrients and the implications for policy
design. Applied Economic Perspectives and Policy, 27, 542-557.
Smit, B., & Skinner, M. W. (2002). Adaptation options in agriculture to climate change: a typology.
Mitigation and adaptation strategies for global change, 7, 85-114.
Smith, V. H., & Goodwin, B. K. (1996). Crop insurance, moral hazard, and agricultural chemical use.
American Journal of Agricultural Economics, 78, 428-438.
SriRamaratnam, S., Bessler, D. A., Rister, M. E., Matocha, J. E., & Novak, J. (1987). Fertilisation
under uncertainty: an analysis based on producer yield expectations. American Journal of
Agricultural Economics, 69, 349-357.
Stuart, D., Schewe, R., & McDermott, M. (2014). Reducing nitrogen fertilizer application as a climate
change mitigation strategy: Understanding farmer decision-making and potential barriers to
change in the US. Land Use Policy, 36, 210-218.
Tanaka, T., Camerer, C. F., & Nguyen, Q. (2010). Risk and time preferences: linking experimental
and household survey data from Vietnam. The American Economic Review, 100, 557-571.


8. Appendix
8.1. CARA (Constant absolute risk aversion)
Let consider one farmer having a certain initial profit 𝜋0 and facing a risky wealth �̃�. Under CARA
attitude his utility function is defined as :
𝑢(�̃� + 𝜋0) = −𝑒−𝛼(�̃�+𝜋0)
With risky wealth �̃� corresponding to the sum of profit on its different crops:
�̃� = ∑ �̃�𝑖
𝑛
𝑖=1
Consequently :
𝑢(�̃� + 𝜋0) = −𝑒−𝛼(𝜋0+∑ �̃�𝑖𝑛𝑖=1 )
Since no covariance exists between crops, the yield distributions are independent. This assomption is
consistent for instance with Polomé et al. (2006) study on acreage allocation under risk where no
covariance was assumed between crop after examination of panels of yields. Then we can write:
𝑢(�̃�) = −𝑒−𝛼𝜋0−𝛼𝜋1̃−𝛼𝜋2̃−𝛼𝜋3̃−...−𝛼𝜋�̃�
𝑢(�̃�) = −𝑒−𝜋0−𝛼𝜋1̃𝑒−𝛼𝜋2̃𝑒−𝛼𝜋3̃ × … × 𝑒 −𝛼𝜋�̃�
Profits between the different fields are independent. Consequently the optimum in one field is not
influenced by the profit of another field. Besides, we know from the literature that the expected utility
of CARA preferences can be represented by a mean-variance Markowitz form as follow (see for
instance Cayatte, 2004 for demonstration):
𝐸[𝑢(𝜋�̃�)] = 𝐸[𝜋�̃�] −𝛼
2 𝑉[𝜋�̃�]
Hypothese : 𝜋�̃� → 𝑁 (𝑚, 𝜎2)
𝐸[𝑢(𝜋�̃�)] = 𝐸[𝜋�̃�] −𝛼
2 𝑉[𝜋�̃�]
Where expected profit follows:
𝐸[𝜋�̃�] = 𝑙𝑖(𝐸[�̃�𝑖]𝑃𝑖 − 𝑥𝑖𝑄)

With :
𝑙𝑖: area (ha)
𝑦𝑖: yield (q.ha-1
)
𝑃𝑖: crop price (€.q-1
)
𝑥𝑖: fertilizer applied (kgN.ha-1
)
Q: fertilizer price (€.kgN -1
)
Expected yield is specified as quadratic:
𝐸[𝑦𝑖] = 𝛽1 + 𝛽2𝑥𝑖 + 𝛽3𝑥𝑖2
Profit variance follows:
𝑉[𝜋�̃�] = 𝑉[𝑙𝑖(�̃�𝑖𝑝𝑖 − 𝑥𝑖𝑤)]
= 𝑙𝑖2𝑃𝑖
2𝑉[�̃�𝑖]
Yield Variance is specified as quadratic as well:
𝑉[𝑦𝑖] = 𝜌1 + 𝜌2𝑥𝑖 + 𝜌3𝑥𝑖2
The Expected Utility function can be written in the complete specified form as:
𝐸[𝑢(𝜋�̃�)] = 𝑙𝑖((𝛽1 + 𝛽2𝑥𝑖 + 𝛽3𝑥𝑖2)𝑝𝑖 − 𝑥𝑖𝑤) −
𝛼
2 𝑙𝑖
2𝑝𝑖2(𝜌1 + 𝜌2𝑥𝑖 + 𝜌3𝑥𝑖
2)
The first order condition to find the optimal nitrogen application amount is:
𝑑𝑈𝑖
𝑑𝑥𝑖= 0
0 = 𝑙𝑖((𝛽2 + 2𝛽3𝑥𝑖∗)𝑝𝑖 − 𝑤) −
𝛼
2 𝑙𝑖
2𝑝𝑖2(𝜌2 + 2𝜌3𝑥𝑖
∗)
𝑥𝑖∗:
0 = 𝑙𝑖((𝛽2 + 2𝛽3𝑥𝑖∗)𝑝𝑖 − 𝑤) −
𝛼
2 𝑙𝑖
2𝑝𝑖2(𝜌2 + 2𝜌3𝑥𝑖
∗)
𝑙𝑖((𝛽2 + 2𝛽3𝑥𝑖∗)𝑝𝑖 − 𝑤) =
𝛼
2 𝑙𝑖
2𝑝𝑖2(𝜌2 + 2𝜌3𝑥𝑖
∗)
𝑥𝑖∗ =
𝛼2 𝑝𝑖
2𝑙𝑖𝜌2 + 𝑤 − 𝛽2𝑝𝑖
(2𝛽3𝑝𝑖 − 2𝜌3𝛼2 𝑙𝑖𝑝𝑖
2)
Consequently we observe that the optimal fertilizer amount is determined by the risk aversion
coefficient. This finding is used in section 4.3 to determine risk aversion coefficients per farmer.

Let now study the impact of an emission price on the optimal amount of fertilizers:
Expected utility with a tax on emissions:
𝑈𝑖 = 𝑙𝑖((𝛽1 + 𝛽2𝑥𝑖 + 𝛽3𝑥𝑖2)𝑝𝑖 − 𝑥𝑖𝑤 − 𝑥𝑖𝑓𝑡) −
𝛼
2 𝑙𝑖
2𝑝𝑖2(𝜌1 + 𝜌2𝑥𝑖 + 𝜌3𝑥𝑖
2)
Where t is the emissions price and f the emission factor.
The First order condition becomes:
𝑑𝑈𝑖
𝑑𝑥𝑖= 𝑙𝑖((𝛽2 + 2𝛽3𝑥𝑖
∗)𝑝𝑖 − 𝑤 − 𝑓𝑡) −𝛼
2 𝑙𝑖
2𝑝𝑖2(𝜌2 + 2𝜌3𝑥𝑖
∗) = 0
𝑥𝑖∗ =
𝛼2
𝑝𝑖2𝑙𝑖𝜌2 + 𝑤 + 𝑓𝑡 − 𝛽2𝑝𝑖
(2𝛽3𝑃𝑖 − 2𝜌3𝛼2
𝑙𝑖𝑃𝑖2)
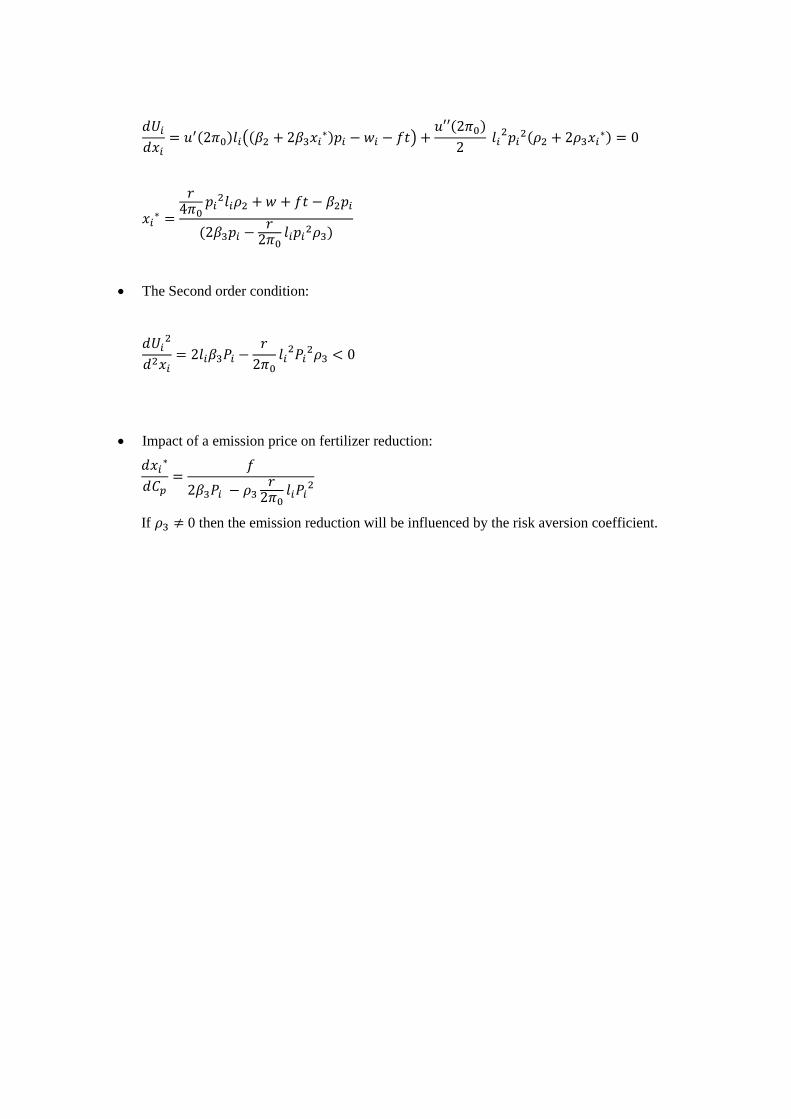
The Second order condition being:
𝑑𝑈𝑖2
𝑑2𝑥𝑖= 2𝑙𝑖𝛽3𝑝𝑖 − 𝛼𝑙𝑖
2𝑝𝑖2𝜌3 < 0
Impact of a emission price on fertilizer reduction:
𝑑𝑥𝑖∗
𝑑𝑡=
𝑓
2𝛽3𝑝𝑖 −2𝜌3𝛼
2𝑙𝑖𝑝𝑖
2 <=>
𝑑𝑥𝑖∗
𝑑𝑡=
𝑙𝑖𝑓
𝑑2𝐸[�̃�]
𝑑𝑥𝑖2 −𝑘
𝑑2𝑉[𝑤�̃�]
𝑑𝑥𝑖2
If 𝜌3 ≠ 0 then the emission reduction will be influenced by the risk aversion coefficient.

8.2. CRRA (Constant relative risk aversion)
Let consider consider now the problem with a CRRA function :
𝑢(𝜋0 + �̃�) =(𝜋0 + �̃�)(1−𝑟)
1 − 𝑟
With :
𝑢′(�̃�+𝜋0) = (𝜋0 + �̃�)−𝑟
𝑢′′(�̃� + 𝜋0) = −𝑟(�̃� + 𝜋0)−𝑟−1
Where r is the relative risk aversion.
By definition the absolute risk aversion coefficient is :
𝑎 = − 𝑢′′(�̃� + 𝜋0)
𝑢′(�̃� + 𝜋0)
𝑎 = 𝑟
(�̃� + 𝜋0)
According to the Taylor series:
𝑢(2𝜋0 + 𝜀̃) = 𝑢(2𝜋0) + 𝜀̃𝑢′(2𝜋0) + �̃�2
2𝑢′′(2𝜋0)
𝐸[𝑢(2𝜋0 + 𝜀̃)] = 𝑢(2𝜋0) + 𝑢′(2𝜋0)𝐸[𝜀]̃ + 𝑢′′(2𝜋0) 𝐸[�̃�2]
2
With
𝜀̃ = �̃� − 𝜋0
If we consider that 𝐸[𝜀̃2] ≈ V[𝜀̃], and no covariance then per field the first order condition is:
𝑑𝑈𝑖
𝑑𝑥𝑖= 𝑢′(2𝜋0)𝑙𝑖((𝛽2 + 2𝛽3𝑥𝑖
∗)𝑝𝑖 − 𝑤) +𝑢′′(2𝜋0)
2 𝑙𝑖
2𝑝𝑖2(𝜌2 + 2𝜌3𝑥𝑖
∗) = 0
Then 𝑥𝑖∗:
𝑥𝑖∗ =
𝑟4𝜋0
𝑝𝑖2𝑙𝑖𝜌2 + 𝑤 − 𝛽2𝑝𝑖
(2𝛽3𝑝𝑖 −𝑟
2𝜋0𝑙𝑖𝑝𝑖
2𝜌3)
Impact of a price on emissions:
The First order condition:
𝑑𝑈𝑖
𝑑𝑥𝑖= 𝑢′(2𝜋0)𝑙𝑖((𝛽2 + 2𝛽3𝑥𝑖
∗)𝑝𝑖 − 𝑤𝑖 − 𝑓𝑡) +𝑢′′(2𝜋0)
2 𝑙𝑖
2𝑝𝑖2(𝜌2 + 2𝜌3𝑥𝑖
∗) = 0
𝑥𝑖∗ =
𝑟4𝜋0
𝑝𝑖2𝑙𝑖𝜌2 + 𝑤 + 𝑓𝑡 − 𝛽2𝑝𝑖
(2𝛽3𝑝𝑖 −𝑟
2𝜋0𝑙𝑖𝑝𝑖
2𝜌3)
The Second order condition:
𝑑𝑈𝑖2
𝑑2𝑥𝑖= 2𝑙𝑖𝛽3𝑃𝑖 −
𝑟
2𝜋0𝑙𝑖
2𝑃𝑖2𝜌3 < 0
Impact of a emission price on fertilizer reduction:
𝑑𝑥𝑖∗
𝑑𝐶𝑝=
𝑓
2𝛽3𝑃𝑖 − 𝜌3𝑟
2𝜋0𝑙𝑖𝑃𝑖
2
If 𝜌3 ≠ 0 then the emission reduction will be influenced by the risk aversion coefficient.

8.3. Illustration of rish aversion impact on fertilizer spreading
Legend :
𝑑𝐸[𝜋�̃�(𝑥𝑖)]
𝑑𝑥𝑖
Optimal fertilizer amount for risk neutral farmers
𝑘 𝑑𝑉[𝜋�̃�(𝑥𝑖)]
𝑑𝑥𝑖 with k>0
Optimal fertilizer amount for risk averse farmers (k>0)
𝑘 𝑑𝑉[𝜋�̃�(𝑥𝑖)]
𝑑𝑥𝑖 with k<0
Optimal fertilizer amount for risk loving farmers (k<0)

Impact of risk aversion on fertilizer amount 𝑥𝑖
Profit function CONVAVE ( 𝑑2𝐸[𝜋�̃�(𝑥𝑖)]
𝑑𝑥𝑖2 <0 )
𝑑𝑉[𝜋�̃�(𝑥𝑖)]
𝑑𝑥𝑖
= 0
Constant
Risk aversion has no influence on
optimal fertilizer amount
𝑑𝑉[𝜋�̃�(𝑥𝑖)]
𝑑𝑥𝑖
< 0
𝑑2𝑉[𝜋�̃�(𝑥𝑖)]
𝑑𝑥𝑖2 = 0
Linear Decreasing
Risk aversion leads to an increase in
fertilizer amount
𝑑𝑉[𝜋�̃�(𝑥𝑖)]
𝑑𝑥𝑖
> 0
𝑑2𝑉[𝜋�̃�(𝑥𝑖)]
𝑑𝑥𝑖2 = 0
Linear Increasing
Risk aversion leads to a decrease in
fertilizer amount
𝑑2𝑉[𝜋�̃�(𝑥𝑖)]
𝑑𝑥𝑖2 < 0
Concave
Risk aversion leads to an additional
optimal fertilizer amount under 2
conditions :
- SOC has to be respected
- x leading to maximum variance <
x leading to maximum expected
profit
𝑑2𝑉[𝜋�̃�(𝑥𝑖)]
𝑑𝑥𝑖2 > 0
Convexe
Risk aversion leads to an increase in
fertilizer amount under the following
condition :
- x leading to minimum variance <
x leading to maximum expected
profit
𝑥𝑖
𝑥𝑖
𝑥𝑖
𝑥𝑖
𝑥𝑖

Impact of risk aversion on fertilizer amount 𝑥𝑖
Profit function Linear Decreasing ( 𝑑2𝐸[𝜋�̃�(𝑥𝑖)]
𝑑𝑥𝑖2 <0 )
𝑑𝑉[𝜋�̃�(𝑥𝑖)]
𝑑𝑥𝑖
= 0
Constant
SOC not respected
𝑑𝑉[𝜋�̃�(𝑥𝑖)]
𝑑𝑥𝑖
< 0
𝑑2𝑉[𝜋�̃�(𝑥𝑖)]
𝑑𝑥𝑖2 = 0
Linear Decreasing
SOC not respected
𝑑𝑉[𝜋�̃�(𝑥𝑖)]
𝑑𝑥𝑖
> 0
𝑑2𝑉[𝜋�̃�(𝑥𝑖)]
𝑑𝑥𝑖2 = 0
Linear Increasing
SOC not respected
𝑑2𝑉[𝜋�̃�(𝑥𝑖)]
𝑑𝑥𝑖2 < 0
Concave
SOC is not respected for risk averse
agents.
Risk loving preference leads to
fertilisation.
𝑑2𝑉[𝜋�̃�(𝑥𝑖)]
𝑑𝑥𝑖2 > 0
Convexe
SOC is not respected for risk loving
agents.
Risk avers preference leads to
fertilisation.
𝑥𝑖
𝑥𝑖
𝑥𝑖
𝑥𝑖
𝑥𝑖
Impact of risk aversion on fertilizer amount 𝑥𝑖
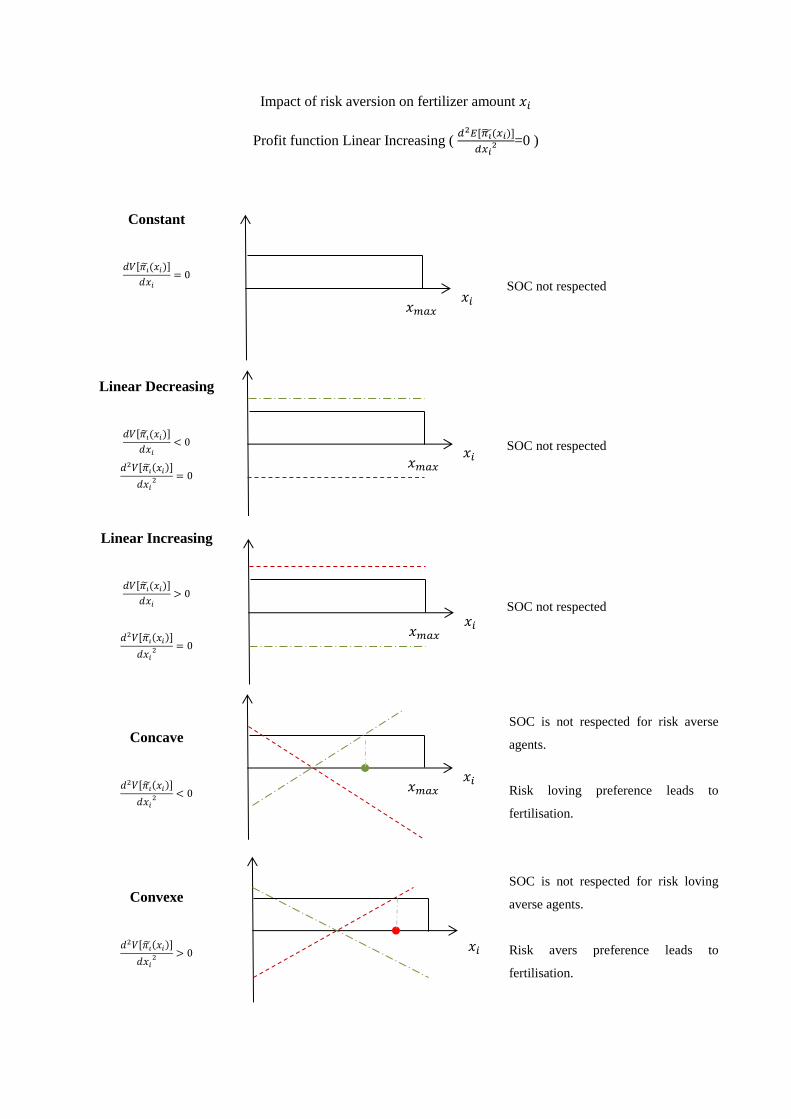
Profit function Linear Increasing ( 𝑑2𝐸[𝜋�̃�(𝑥𝑖)]
𝑑𝑥𝑖2 =0 )
𝑑𝑉[𝜋�̃�(𝑥𝑖)]
𝑑𝑥𝑖
= 0
Constant
SOC not respected
𝑑𝑉[𝜋�̃�(𝑥𝑖)]
𝑑𝑥𝑖
< 0
𝑑2𝑉[𝜋�̃�(𝑥𝑖)]
𝑑𝑥𝑖2 = 0
Linear Decreasing
SOC not respected
𝑑𝑉[𝜋�̃�(𝑥𝑖)]
𝑑𝑥𝑖
> 0
𝑑2𝑉[𝜋�̃�(𝑥𝑖)]
𝑑𝑥𝑖2 = 0
Linear Increasing
SOC not respected
𝑑2𝑉[𝜋�̃�(𝑥𝑖)]
𝑑𝑥𝑖2 < 0
Concave
SOC is not respected for risk averse
agents.
Risk loving preference leads to
fertilisation.
𝑑2𝑉[𝜋�̃�(𝑥𝑖)]
𝑑𝑥𝑖2 > 0
Convexe
SOC is not respected for risk loving
averse agents.
Risk avers preference leads to
fertilisation.
𝑥𝑖
𝑥𝑖 𝑥𝑚𝑎𝑥
𝑥𝑖 𝑥𝑚𝑎𝑥
𝑥𝑖 𝑥𝑚𝑎𝑥
𝑥𝑖 𝑥𝑚𝑎𝑥

Impact of risk aversion on fertilizer amount 𝑥𝑖
Profit function Convex ( 𝑑2𝐸[𝜋�̃�(𝑥𝑖)]
𝑑𝑥𝑖2 >0 )
𝑑𝑉[𝜋�̃�(𝑥𝑖)]
𝑑𝑥𝑖
= 0
Constant
SOC not respected
𝑑𝑉[𝜋�̃�(𝑥𝑖)]
𝑑𝑥𝑖
< 0
𝑑2𝑉[�̃�(𝑥𝑖)]
𝑑𝑥𝑖2 = 0
Linear Decreasing
SOC not respected
𝑑𝑉[𝜋�̃�(𝑥𝑖)]
𝑑𝑥𝑖
> 0
𝑑2𝑉[𝜋�̃�(𝑥𝑖)]
𝑑𝑥𝑖2 = 0
Linear Increasing
SOC not respected
𝑑2𝑉[𝑤�̃�(𝑥𝑖)]
𝑑𝑥𝑖2 < 0
Concave
𝑑2𝐸[�̃�(𝑥𝑖)]
𝑑𝑥𝑖2 < 𝑘
𝑑2𝑉[𝑤�̃�(𝑥𝑖)]
𝑑𝑥𝑖2
SOC is not respected for risk averse
agents.
For risk loving preferences, the
condition for solutions is:
𝑑2𝑉[𝑤�̃�(𝑥𝑖)]
𝑑𝑥𝑖2 > 0
Convexe
𝑑2𝐸[�̃�(𝑥𝑖)]
𝑑𝑥𝑖2 < 𝑘
𝑑2𝑉[𝑤�̃�(𝑥𝑖)]
𝑑𝑥𝑖2
SOC is not respected for risk loving
agents.
For risk loving preferences, the
condition for solutions is:
𝑥𝑖
𝑥𝑖
𝑥𝑖
𝑥𝑖
𝑥𝑖

8.4. Implicit function theorem
A. Impact of aversion on optimal fertilizer amount 𝒙𝒊∗
Let consider function (7):
𝑓(𝑥, 𝑘) =𝑑𝐸[𝜋�̃�(𝑥𝑖
∗)]
𝑑𝑥𝑖
− 𝑘 𝑑𝑉[𝜋�̃�(𝑥𝑖
∗)]
𝑑𝑥𝑖
= 0
And a point (𝑥𝑖∗, 𝑘) which satisfies 𝑓(𝑥𝑖
∗, 𝑘) = 0 then according to the implicit function theorem :
𝜕𝑥𝑖∗
𝜕𝑘= −
𝜕𝑓𝜕𝑘𝜕𝑓𝜕𝑥𝑖
∗
Or
𝜕𝑥𝑖∗
𝜕𝑘=
𝑑𝑉[𝜋�̃�(𝑥𝑖∗)]
𝑑𝑥𝑖
𝑑2𝐸[𝜋�̃�(𝑥𝑖∗)]
𝑑𝑥𝑖2 − 𝑘
𝑑2𝑉[𝜋�̃�(𝑥𝑖∗)]
𝑑𝑥𝑖2
B. Impact of aversion on emission tax incentive
Let consider function (7):
𝑓(𝑥, 𝑡) =𝑑𝐸[𝜋�̃�(𝑥𝑖
∗, 𝑡)]
𝑑𝑥𝑖
− 𝑘 𝑑𝑉[𝜋�̃�(𝑥𝑖
∗)]
𝑑𝑥𝑖
= 0
And a point (𝑥𝑖∗, 𝑡) which satisfies 𝑓(𝑥𝑖
∗, 𝑡) = 0 then according to the implicit function theorem :
𝜕𝑥𝑖∗
𝜕𝑡= −
𝜕𝑓𝜕𝑡𝜕𝑓𝜕𝑥𝑖
∗
Or

𝜕𝑥𝑖∗
𝜕𝑡=
− 𝜕2𝐸[𝜋�̃�(𝑥𝑖
∗, 𝑡)]𝜕𝑡 𝜕𝑥𝑖
𝜕2𝐸[𝜋�̃�(𝑥𝑖∗, 𝑡)]
𝜕𝑥𝑖2 − 𝑘
𝜕2𝑉[𝜋�̃�(𝑥𝑖∗)]
𝜕𝑥𝑖2
Or
𝜕𝑥𝑖∗
𝜕𝑡=
𝑓𝑙𝑖
𝜕2𝐸[𝜋�̃�(𝑥𝑖∗, 𝑡)]
𝜕𝑥𝑖2 − 𝑘
𝜕2𝑉[𝜋�̃�(𝑥𝑖∗)]
𝜕𝑥𝑖2
Then
𝜕2𝑥𝑖∗
𝜕𝑡 𝜕𝑘= − 𝑓𝑙𝑖
𝑑2𝑉[𝜋�̃�(𝑥𝑖)]
𝑑𝑥𝑖2 ∗ (
𝑑2𝐸[�̃�(𝑥𝑖)]
𝑑𝑥𝑖2 − 𝑘
𝑑2𝑉[𝜋�̃�(𝑥𝑖)]
𝑑𝑥𝑖2 )
−2

8.5. Illustration of the impact of insurance program on nitrogen amounts for one crop
-80
-70
-60
-50
-40
-30
-20
-10
0
0 50 100 150 200
Ex
pec
ted
uti
lity
(*1
0-3
)
x - Fertilisation (kgN/ha)
Participation and fertilisation reduction
�̅� maximizing
insurance utility
-80
-70
-60
-50
-40
-30
-20
-10
0
0 50 100 150 200
Ex
pec
ted
uti
lity
(*
10
-3)
x - Fertilisation (kgN/ha)
Participation and
no fertilisation reduction
�̅� maximizing
insurance utility
= x maximizing utility
with no insurance
-80
-70
-60
-50
-40
-30
-20
-10
0
0 50 100 150 200
Ex
pec
ted
uti
lity
(*
10
-3)
x - Fertilisation (kgN/ha)
No participation in insurance program
No Insurance
Insurance
�̅� maximizing
insurance utility
x
maximizing utility
with no insurance
x maximizing utility
with no insurance

8.6. Data base treatment
Step 1:
EPICLES
DATA BASE
(Period : 2010-2013)
Principle : focusing on the main crop activities and
deleting wrong nitrogen application declarations.
Removal of :
- plots corresponding to arboriculture and
horticulture
- minor crops and grasslands
- wrong reporting (negative yield, farms with 0
fertilizers spread)
- crops having received K, P, G (so as to not biaise
the regression)
- Removal of crops types representing less than 30
observations
6397 farms
(325 048 plots)
Step 2:
REGRESSION
(Period : 2010-2013)
2301 farms
(24 729 plots)
Principle : obtaining a continuously balanced sample to
estimation risk aversion coefficients.
Removal of :
- crops with no robust yield parameters
- plots corresponding to 2010 (for coherence between
CARA and CRRA scenario as CRRA coefficient needs
2009 revenue)
- farms ending or starting activities during the period
2011-2013
795 farms
(10 990 plots) Step 3:
AVERSION
ASSESSMENT
(Period : 2011-2013)
Principle : obtaining data to base simulations on 2013 year.
Removal of :
- crops corresponding to 2010-2012 period (simulations
are made for 2013)
- crops where SOC is not respected (second derivative
of utility >0)
- crops where x* is zero
684 farms
(2774 plots) Step 4:
SIMULATIONS
(Period: 2013)
Emission Price
Insurance : only for risk averse
farmers (1053 plots - 204 farms)

Cropland Allocation in the three departments (year 2013)
-
200 000
400 000
600 000
800 000
1 000 000
1 200 000
1 400 000
Public Data
La
nd
Use
Area
(h
a)
Grassland and
Other
Oats
Triticale
Sunflower
Durum Wheat
Spring Barley +
Winter Barley
Fodder Maize +
Grain Maize
Rapeseed
Common Wheat
-
20 000
40 000
60 000
80 000
100 000
120 000
140 000
160 000
180 000
200 000
Epicles (Step 1)
La
nd
Use
Area
(h
a)
-
2 000
4 000
6 000
8 000
10 000
12 000
14 000
16 000
Carbone Price Simulation (Step 4)
La
nd
Use
Area
(h
a)

8.7. Accuracy of risk aversion scenario with observed emissions.
Aversion
Coefficient
Type of
aversion
coefficient
Risk
Averse Neutral Risk Seeking Undetermined
All risk
attitudes
CARA 1 Distribution Absolute -7,0 -12,4 -6,9 1,3 -6,9
CARA 2 Uniform :
7,5.10-7
Absolute -25,9 -12,4 10,3 1,3 -11,7
CARA 3 Uniform :
0,0075
Absolute 93,4 85,9 129,3 14,3 93,2
CARA 4 Uniform :
0,04
Absolute 528,3 459,5 565,3 15,3 473,4
CRRA 2 Uniform :
0,25
Relative -25,7 -12,2 37,4 2,7 -4,3
CRRA 3 Uniform :
1,12
Relative -24,9 -11,5 130,8 2,7 20,6
CRRA 4 Uniform :
5,4
Relative -20,5 -5,5 589,9 5,8 144,5
Neutral Uniform :0 Relative -25,9 -12,4 10,3 1,3 -11,7
Average distance in % per ha between observed and estimated nitrogen application (The categorization of attitude toward risk is
based on scenario CARA 1)

8.8. Impact of risk aversion on crops associated to convex variance functions
Slopes
demissions
/
dEmissionprice
« CARA 1 » -0,061
« CRRA 4 » -0,062
« Neutral » -0,067
Note : This figure is an illustration of proposition 2 which shows the impact of risk aversion on
emissions reduction triggered by a tax on emissions. We focus here on crops having a convex variance
function. We observe that the reduction rate is lower when considering risk aversion. Focusing on
CARA 1 scenario, the reduction rate (-61 kgCO2eq/dtax) is by 8% lower than the reduction rate (-67
kgCO2eq/dtax) under Neutral behavior.
0
50
100
150
200
250
0 500 1000
emis
sion
s (t
CO
2eq
)
Emission price (euros/tCO2eq)
CARA_1
Neutral
CRRA_2
Emission reductions from risk averse farmers on crops
having a convex variance function

8.9. Insurance impact on emissions in the CRRA 4 scenario.
Emission Reduction for risk averse farmers in CRR4 4 scenario (in %)
Insurance Trigger Threshold - τ
(in percentage of the expected yield)
0,1 0,5 0,9
Insurance Premium
(euros/ha) 25 - 3,4 - 5,0 -8,2
50 - 3,3 - 5,0 - 8,2
400 - 2,2 - 4,4 - 8,1
600 - 2,1 - 3,9 - 8,0

Risk as a limit or an opportunity to mitigate GHG emissions?
The case of fertilisation
Benjamin DEQUIEDT, Emmanuel SERVONNAT
n°2016-06
The economic analysis of the forest transition
Edward B. BARBIER, Philippe DELACOTE, Julien WOLFERSBERGER
n°2016-05
Optimal intertemporal abatement decisions under ambiguity aversion
Simon QUEMIN
n°2016-04
Energy efficiency in french homes: how much does it cost ?
Edouard CIVEL, and Jérémy ELBEZE
n°2016-03
The private value of plant variety protection and the impact of
exemption rules
Marc BAUDRY, Adrien HERVOUET
n°2016-02
The energy-economic growth relationship:
A new insight from the EROI perspective
Florian FIZAINE, Victor COURT
n°2016-01
Paying smallholders not to cut down the amazon forest:
Impact evaluation of a REDD+ pilot project
Gabriela SIMONET, Julie SUBERVIE, Driss EZZINE-DE-BLAS, Marina
CROMBERG and Amy DUCHELLE
n°2015-14
Estimating the competitive storage model with trending commodity
prices
Christophe GOUEL, Nicolas LEGRAND
n°2015-13
WORKING PAPER n° 2016-06 • September 2016
Working Paper Publication Director: Philippe Delacote
Les opinions exposées ici n’engagent que les auteurs. Ceux-ci assument la responsabilité de
toute erreur ou omission
La Chaire Economie du Climat est une initiative de l’Université Paris-Dauphine, de la Caisse
des Dépôts et Consignations et de Total sous l’égide de la Fondation Institut Europlace de
Finance
LATTER ISSUES