Embed Size (px)
Citation preview
LETTER HOMEData About Us
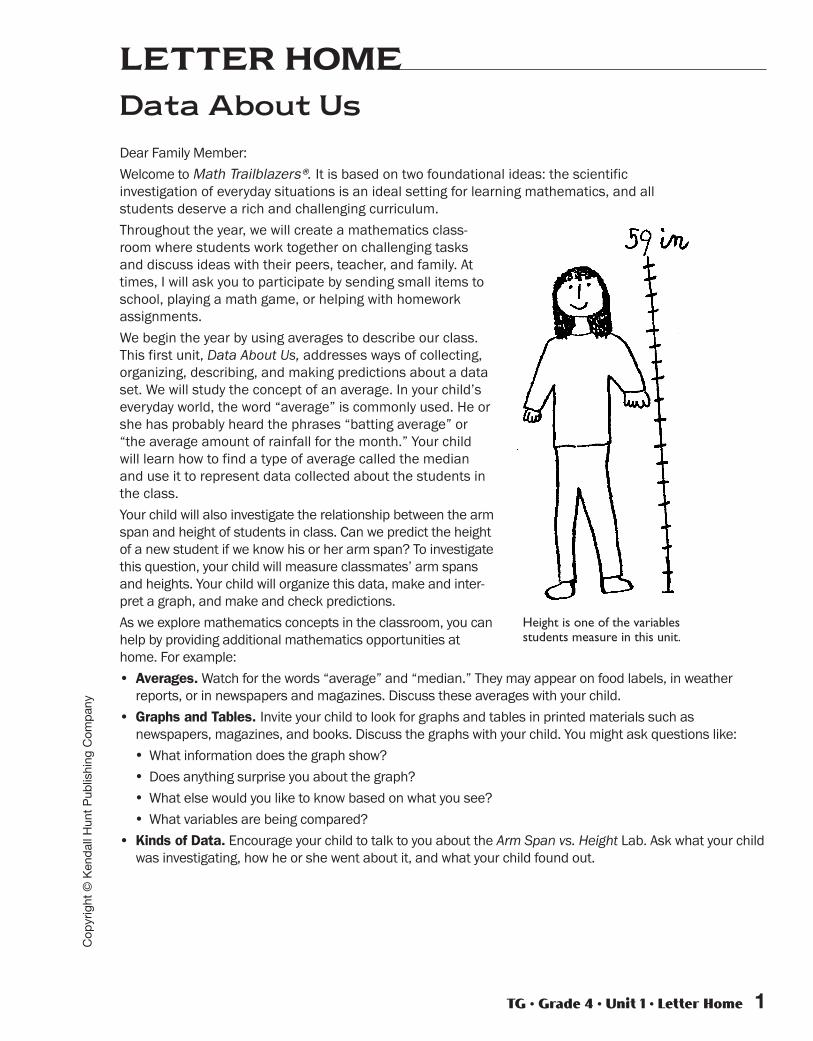
Dear Family Member:Welcome to Math Trailblazers®. It is based on two foundational ideas: the scientific investigation of everyday situations is an ideal setting for learning mathematics, and all students deserve a rich and challenging curriculum. Throughout the year, we will create a mathematics class-room where students work together on challenging tasksand discuss ideas with their peers, teacher, and family. Attimes, I will ask you to participate by sending small items toschool, playing a math game, or helping with homeworkassignments. We begin the year by using averages to describe our class.This first unit, Data About Us, addresses ways of collecting,organizing, describing, and making predictions about a dataset. We will study the concept of an average. In your child’severyday world, the word “average” is commonly used. He orshe has probably heard the phrases “batting average” or“the average amount of rainfall for the month.” Your childwill learn how to find a type of average called the medianand use it to represent data collected about the students inthe class.Your child will also investigate the relationship between the armspan and height of students in class. Can we predict the heightof a new student if we know his or her arm span? To investigatethis question, your child will measure classmates’ arm spansand heights. Your child will organize this data, make and inter-pret a graph, and make and check predictions.As we explore mathematics concepts in the classroom, you canhelp by providing additional mathematics opportunities athome. For example:• Averages.Watch for the words “average” and “median.” They may appear on food labels, in weatherreports, or in newspapers and magazines. Discuss these averages with your child.
• Graphs and Tables. Invite your child to look for graphs and tables in printed materials such asnewspapers, magazines, and books. Discuss the graphs with your child. You might ask questions like: What information does the graph show? Does anything surprise you about the graph? What else would you like to know based on what you see? What variables are being compared?
• Kinds of Data. Encourage your child to talk to you about the Arm Span vs. Height Lab. Ask what your childwas investigating, how he or she went about it, and what your child found out.
Height is one of the variablesstudents measure in this unit.
TG • Grade 4 • Unit 1 • Letter Home 1
Cop
yrig
ht ©
Ken
dal
l Hun
t P
ublis
hing
Com
pan
y
2 TG • Grade 4 • Unit 1 • Letter Home
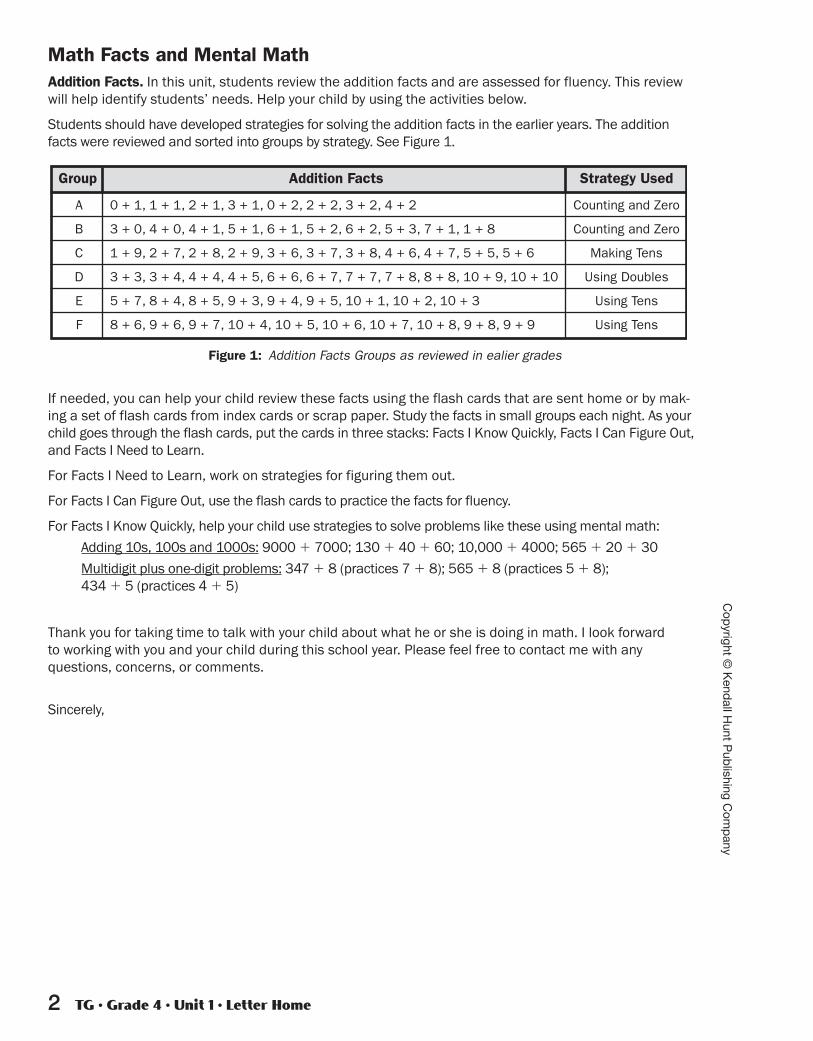
Math Facts and Mental MathAddition Facts. In this unit, students review the addition facts and are assessed for fluency. This reviewwill help identify students’ needs. Help your child by using the activities below.
Students should have developed strategies for solving the addition facts in the earlier years. The additionfacts were reviewed and sorted into groups by strategy. See Figure 1.
If needed, you can help your child review these facts using the flash cards that are sent home or by mak-ing a set of flash cards from index cards or scrap paper. Study the facts in small groups each night. As yourchild goes through the flash cards, put the cards in three stacks: Facts I Know Quickly, Facts I Can Figure Out,and Facts I Need to Learn.
For Facts I Need to Learn, work on strategies for figuring them out.
For Facts I Can Figure Out, use the flash cards to practice the facts for fluency.
For Facts I Know Quickly, help your child use strategies to solve problems like these using mental math:Adding 10s, 100s and 1000s: 9000 � 7000; 130 � 40 � 60; 10,000 � 4000; 565 � 20 � 30Multidigit plus one-digit problems: 347 � 8 (practices 7 � 8); 565 � 8 (practices 5 � 8);434 � 5 (practices 4 � 5)
Thank you for taking time to talk with your child about what he or she is doing in math. I look forward to working with you and your child during this school year. Please feel free to contact me with any questions, concerns, or comments.
Sincerely,
Figure 1: Addition Facts Groups as reviewed in ealier grades
Group Strategy UsedAddition Facts
A
B
C
D
E
F
Counting and Zero
Counting and Zero
Making Tens
Using Doubles
Using Tens
Using Tens
0 + 1, 1 + 1, 2 + 1, 3 + 1, 0 + 2, 2 + 2, 3 + 2, 4 + 2
3 + 0, 4 + 0, 4 + 1, 5 + 1, 6 + 1, 5 + 2, 6 + 2, 5 + 3, 7 + 1, 1 + 8
1 + 9, 2 + 7, 2 + 8, 2 + 9, 3 + 6, 3 + 7, 3 + 8, 4 + 6, 4 + 7, 5 + 5, 5 + 6
3 + 3, 3 + 4, 4 + 4, 4 + 5, 6 + 6, 6 + 7, 7 + 7, 7 + 8, 8 + 8, 10 + 9, 10 + 10
5 + 7, 8 + 4, 8 + 5, 9 + 3, 9 + 4, 9 + 5, 10 + 1, 10 + 2, 10 + 3
8 + 6, 9 + 6, 9 + 7, 10 + 4, 10 + 5, 10 + 6, 10 + 7, 10 + 8, 9 + 8, 9 + 9
Cop
yright © K
endall H
unt Pub
lishing Com
pany
Master TG • Grade 4 • Unit 1 • Lesson 1
Three-Column Data Table
Name Date
Cop
yrig
ht ©
Ken
dal
l Hun
t P
ublis
hing
Com
pan
y
TG • Grade 4 • Master
Cop
yright © K
endall H
unt Pub
lishing Com
pany
Name Date
Master TG • Grade 4 • Unit 1 • Lesson 1
Name Date
Cop
yrig
ht ©
Ken
dal
l Hun
t P
ublis
hing
Com
pan
y
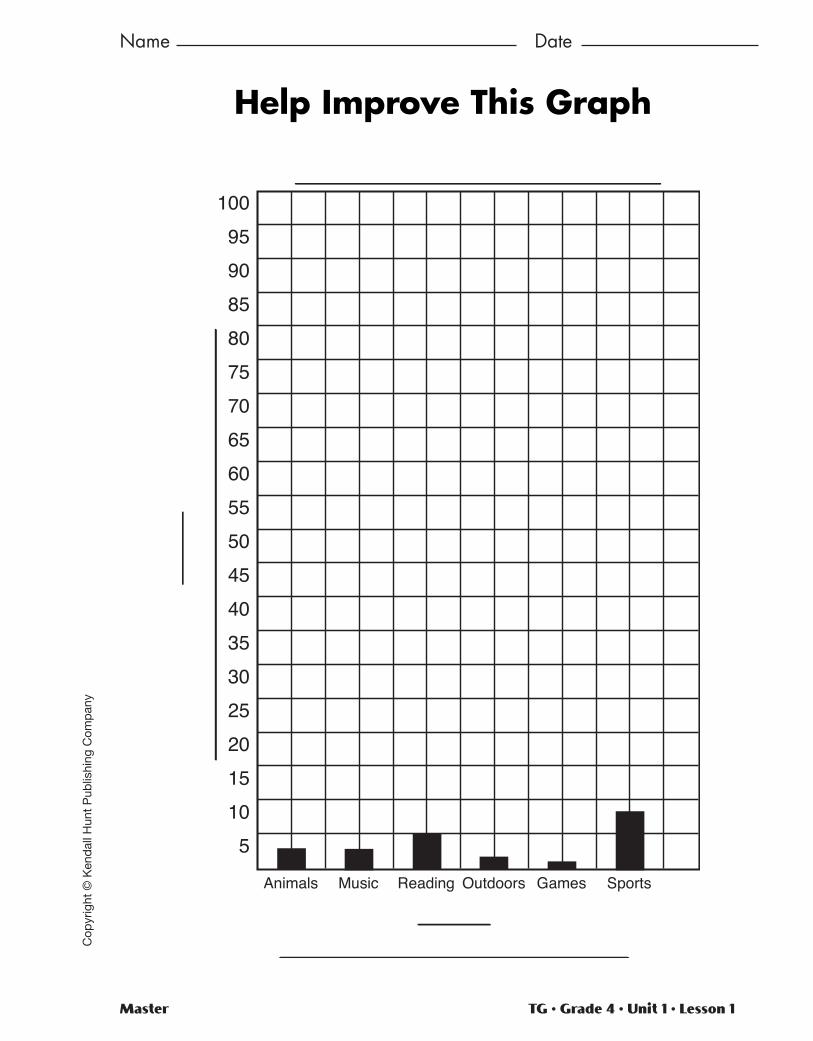
Animals Music Reading Outdoors Games Sports
5101520253035404550556065707580859095100
Help Improve This Graph
Cop
yrig
ht ©
Ken
dal
l Hun
t P
ublis
hing
Com
pan
y
Master TG • Grade 4 • Unit 1 • Lesson 2 1
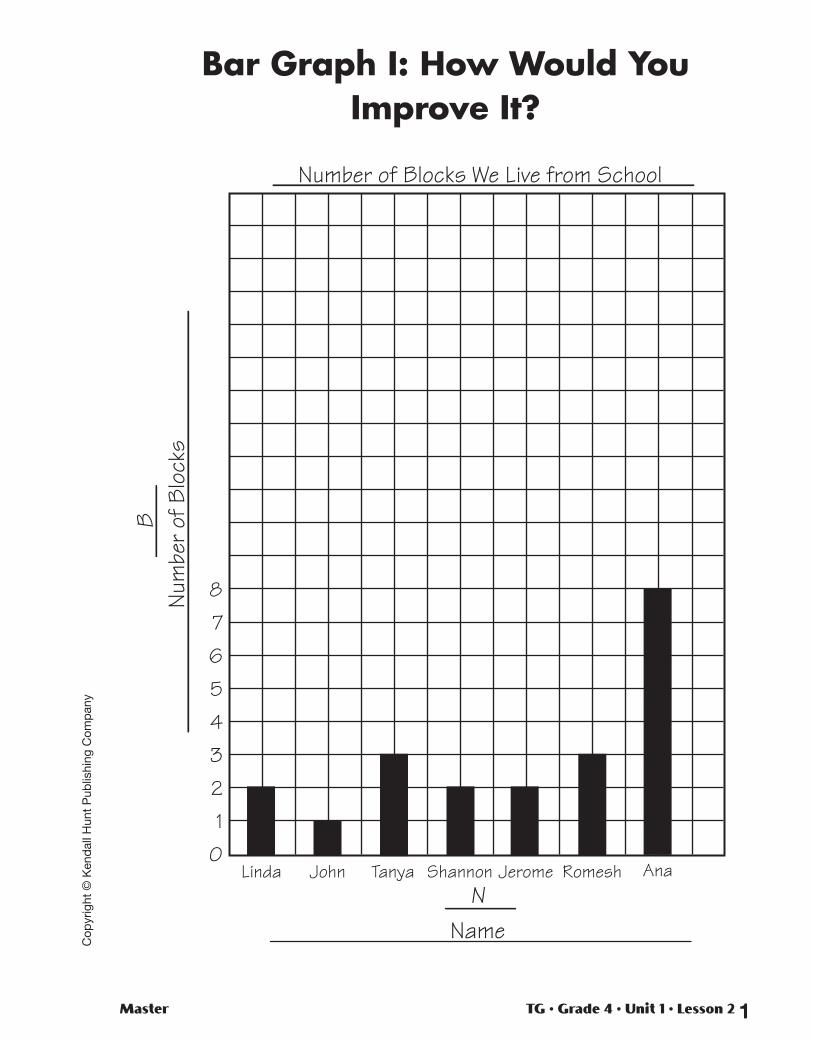
0 Linda John Tanya Shannon Jerome Ana Romesh
1 2 3 4 5 6 7 8
Name
BNu
mbe
r of B
lock
s Number of Blocks We Live from School
N
Bar Graph I: How Would You Improve It?
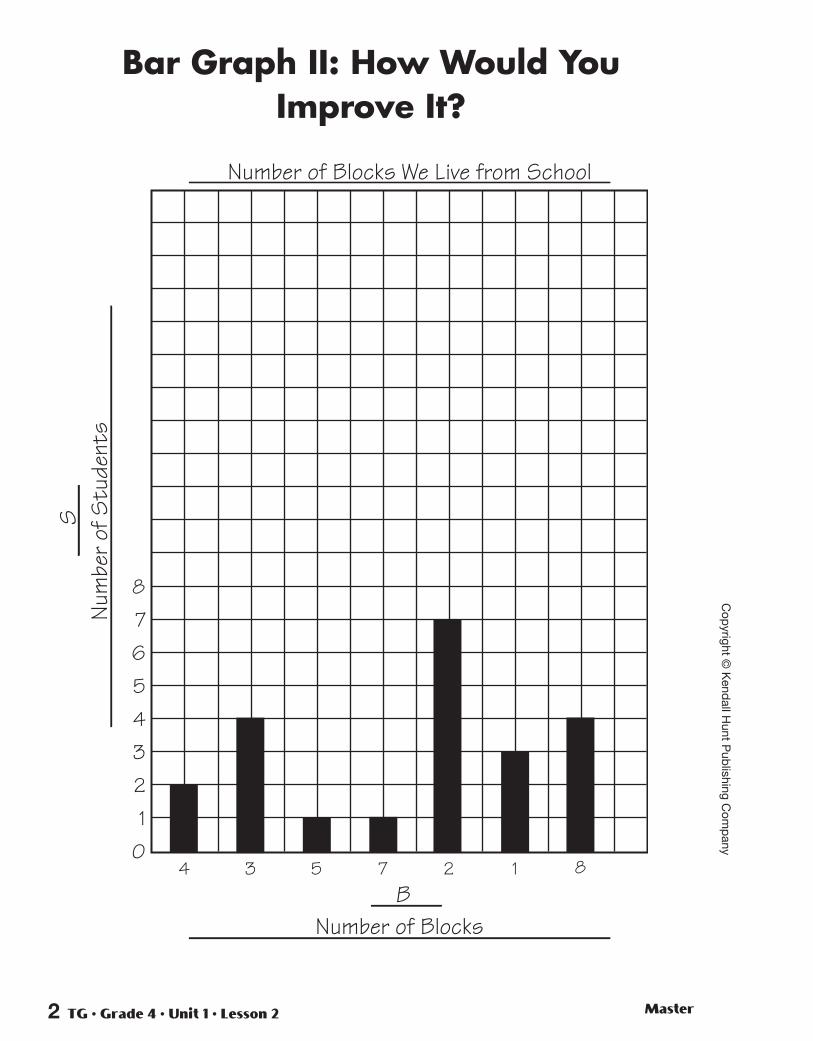
0 4 3 5 7 2 8 1
1 2 3 4 5 6 7 8
B Number of Blocks
SNu
mbe
r of S
tude
nts
Number of Blocks We Live from School
Bar Graph II: How Would YouImprove It?
2 TG • Grade 4 • Unit 1 • Lesson 2 Master
Cop
yright © K
endall H
unt Pub
lishing Com
pany
Assessm
ent M
asterT
G • G
rade 4
• Un
it 1 • Lesson
2
Copyright © Kendall Hunt Publishing Company
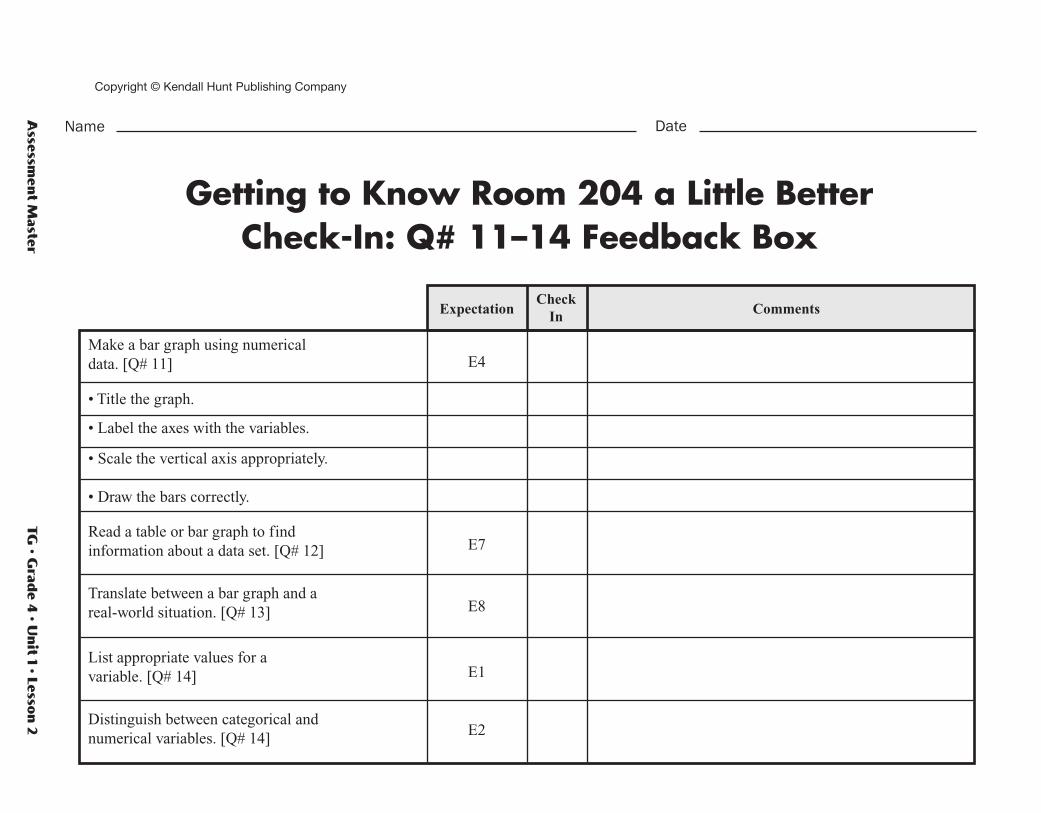
Name Date
CheckIn CommentsExpectation
Make a bar graph using numerical data. [Q# 11]
• Title the graph.
• Label the axes with the variables.
• Scale the vertical axis appropriately.
• Draw the bars correctly.
Read a table or bar graph to findinformation about a data set. [Q# 12]
Translate between a bar graph and areal-world situation. [Q# 13]
List appropriate values for avariable. [Q# 14]
Distinguish between categorical and numerical variables. [Q# 14]
E4
E7
E8
E1
E2
Getting to Know Room 204 a Little Better Check-In: Q# 11–14 Feedback Box
TG • Grade 4 • Unit 1 • Lesson 3 Assessment Master
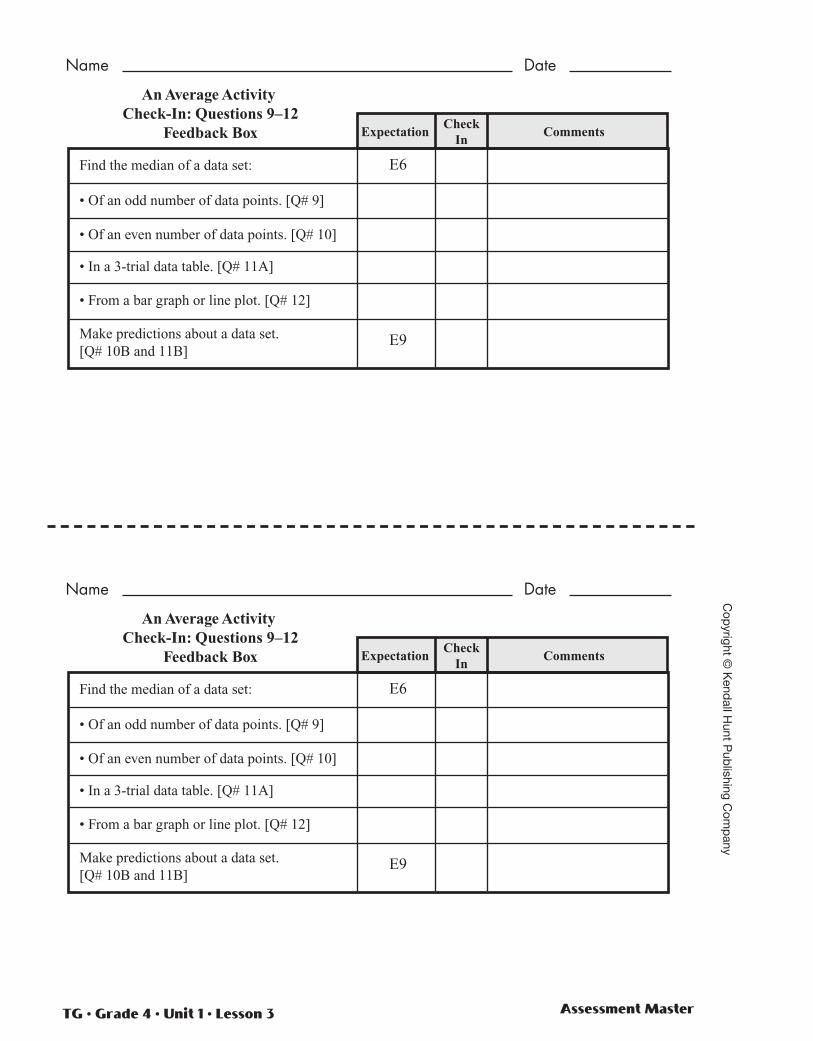
CheckIn
CommentsExpectation
Find the median of a data set:
• Of an odd number of data points. [Q# 9]
• Of an even number of data points. [Q# 10]
• In a 3-trial data table. [Q# 11A]
• From a bar graph or line plot. [Q# 12]
Make predictions about a data set.[Q# 10B and 11B]
E6
E9
An Average Activity Check-In: Questions 9–12
Feedback Box
Name Date
Cop
yright © K
endall H
unt Pub
lishing Com
pany
TG • Grade 4 • Master
Cop
yright © K
endall H
unt Pub
lishing Com
pany
Master TG • Grade 4 • Unit 1 • Lesson 5
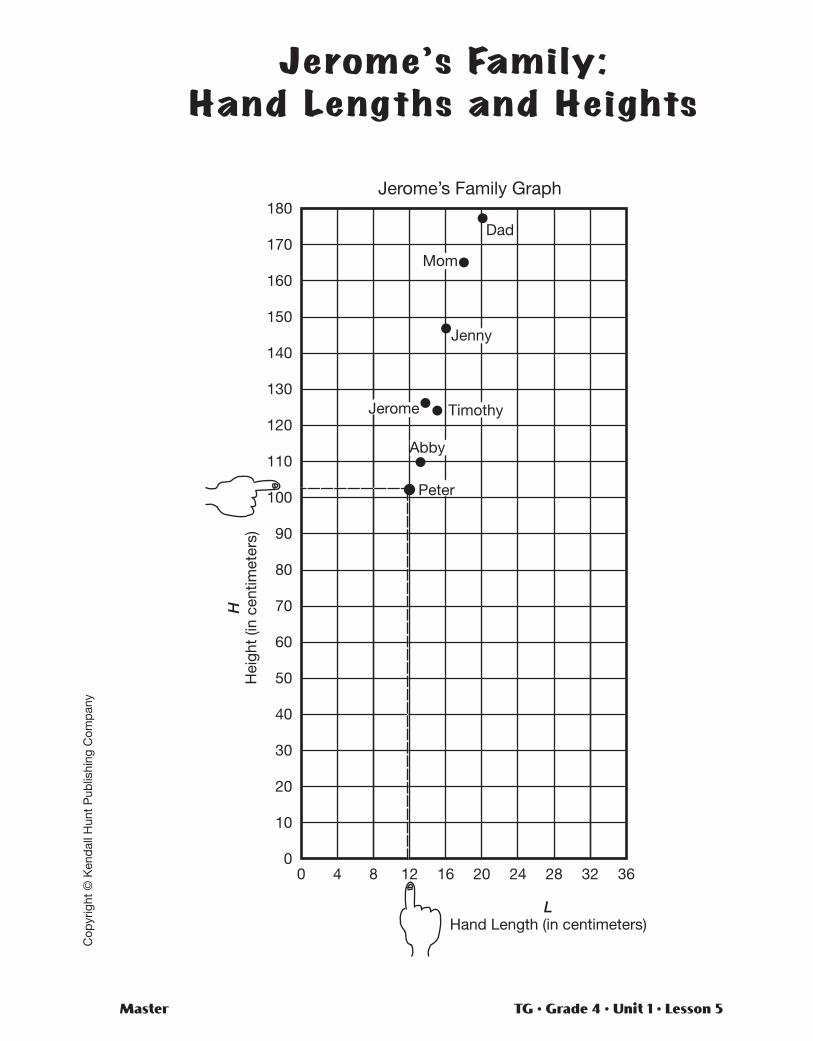
Jerome’s Family:Hand Lengths and Heights
0 0
10
20
30
40
50
60
70
80
90
4 8 12 16 20 24 28 32 36
Dad
Jerome’s Family Graph
100
110
120
130
140
150
160
170
180
Peter
Abby
Jenny
Jerome Timothy
Mom
L Hand Length (in centimeters)
H
Hei
ght
(in c
entim
eter
s)
Cop
yrig
ht ©
Ken
dal
l Hun
t P
ublis
hing
Com
pan
y
TG • Grade 4 • Unit 1 • Lesson 5 Master
Cop
yright © K
endall H
unt Pub
lishing Com
pany
Name Date
Master TG • Grade 4 • Unit 1 • Lesson 5
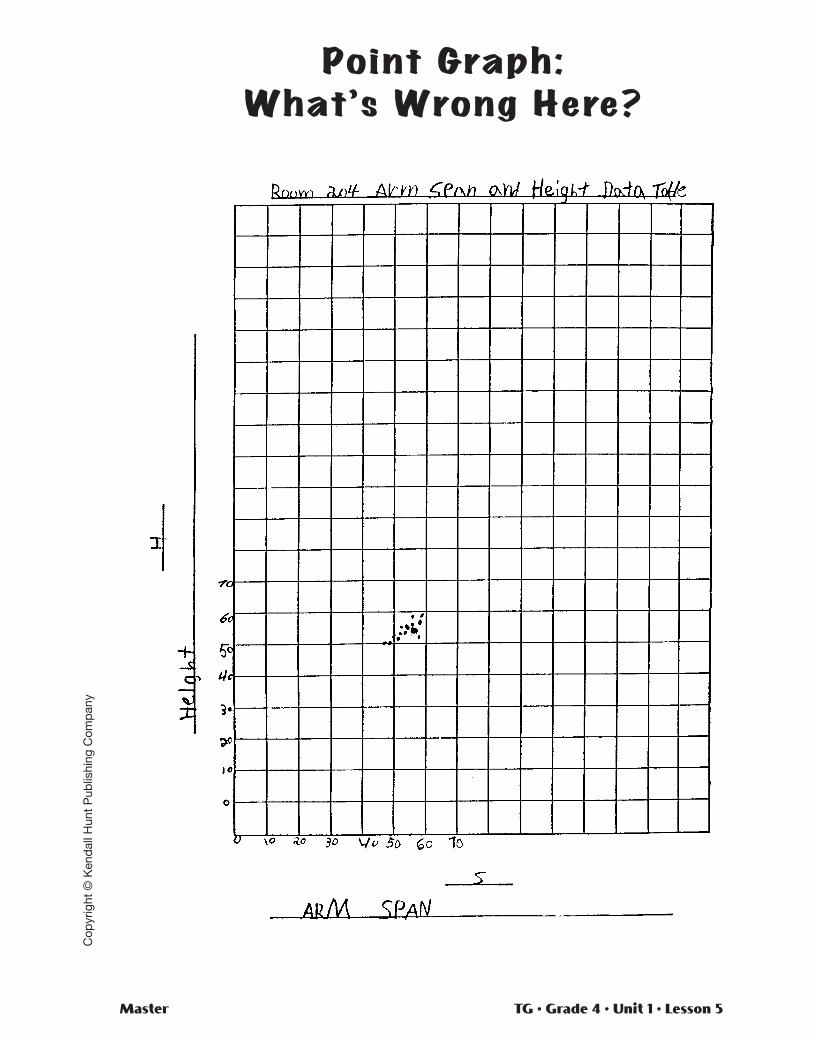
Point Graph:What’s Wrong Here?
Cop
yrig
ht ©
Ken
dal
l Hun
t P
ublis
hing
Com
pan
y
TG • Grade 4 • Unit 1 • Lesson 5 Assessment Master
Cop
yright © K
endall H
unt Pub
lishing Com
pany
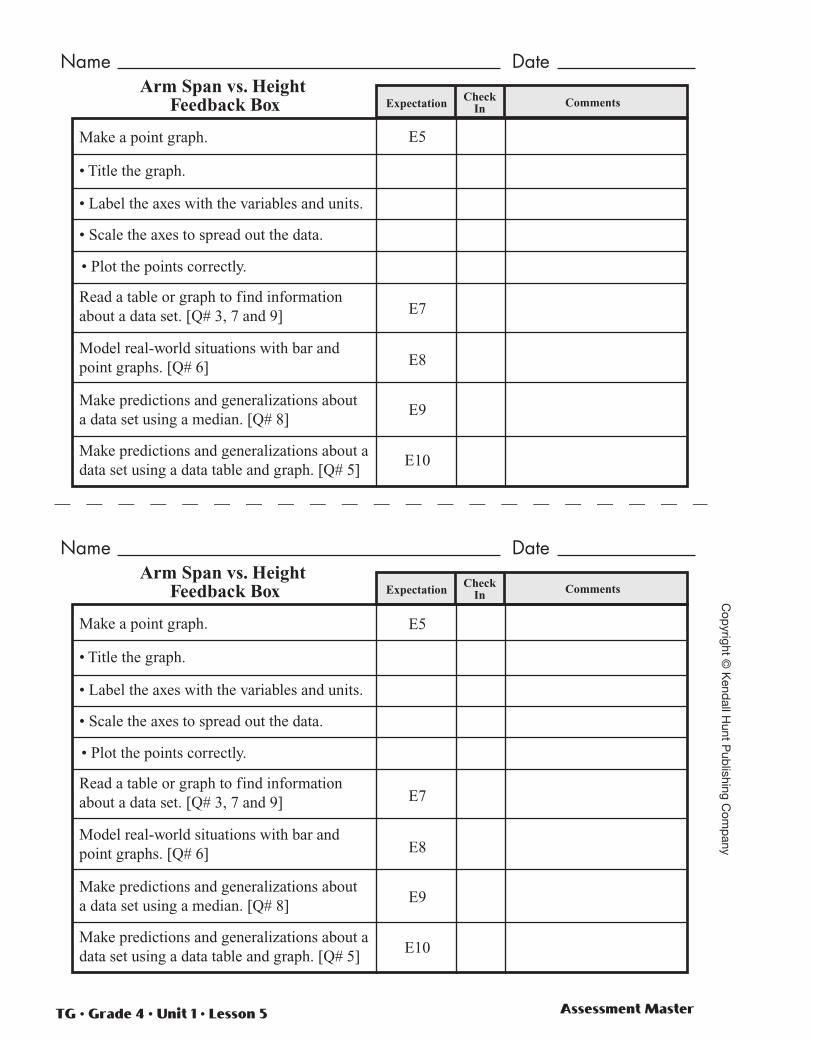
Arm Span vs. Height Feedback Box Check
InExpectation Comments
Make a point graph.
• Plot the points correctly.
• Title the graph.
• Label the axes with the variables and units.
• Scale the axes to spread out the data.
Read a table or graph to find informationabout a data set. [Q# 3, 7 and 9]
Make predictions and generalizations abouta data set using a median. [Q# 8]
Model real-world situations with bar and point graphs. [Q# 6]
Make predictions and generalizations about a data set using a data table and graph. [Q# 5]
E5
E7
E8
E9
E10
E5
E7
E8
E9
E10
Arm Span vs. Height Feedback Box Check
InExpectation Comments
Make a point graph.
• Plot the points correctly.
• Title the graph.
• Label the axes with the variables and units.
• Scale the axes to spread out the data.
Read a table or graph to find informationabout a data set. [Q# 3, 7 and 9]
Make predictions and generalizations abouta data set using a median. [Q# 8]
Model real-world situations with bar and point graphs. [Q# 6]
Make predictions and generalizations about a data set using a data table and graph. [Q# 5]
Name Date
Name Date
Assessment Master TG • Grade 4 • Unit 1 • Lesson 5 1
Cop
yrig
ht ©
Ken
dal
l Hun
t P
ublis
hing
Com
pan
y
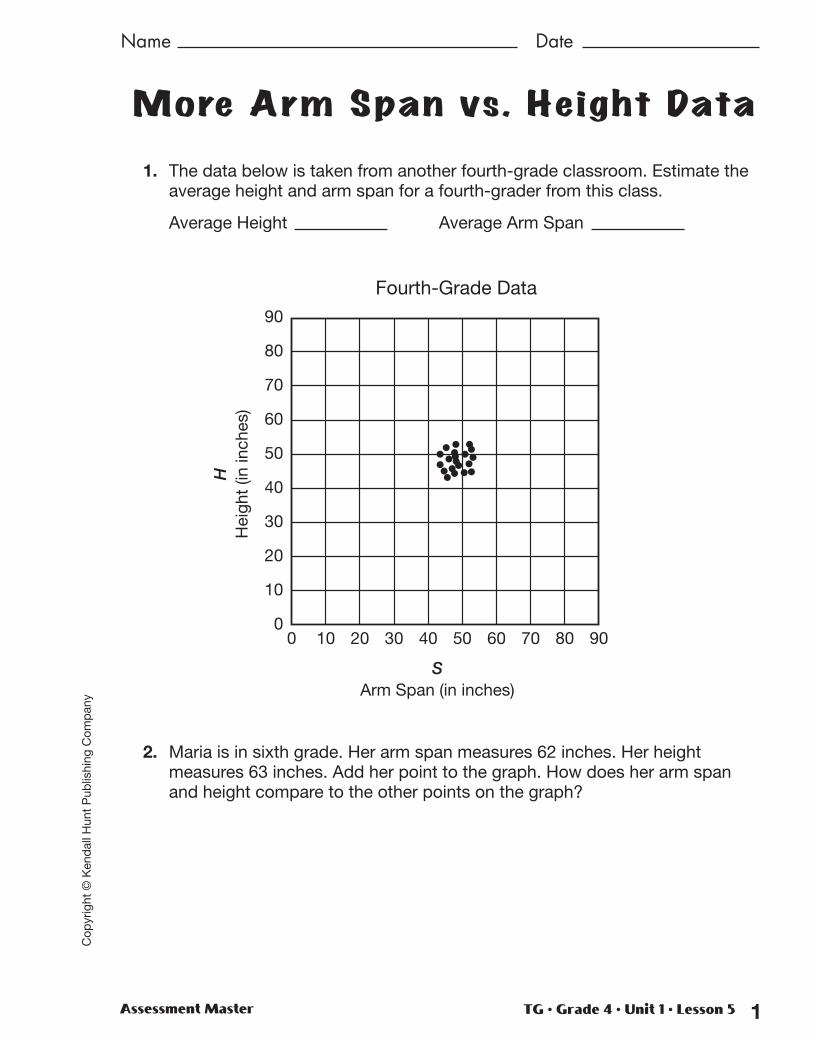
More Arm Span vs. Height Data
1. The data below is taken from another fourth-grade classroom. Estimate theaverage height and arm span for a fourth-grader from this class.
Average Height Average Arm Span
2. Maria is in sixth grade. Her arm span measures 62 inches. Her heightmeasures 63 inches. Add her point to the graph. How does her arm spanand height compare to the other points on the graph?
0 0
10
20
30
40
50
60
70
10 20 30 40 50 60 70
S Arm Span (in inches)
H
Hei
ght
(in in
ches
)
Fourth-Grade Data
80
90
80 90
Name Date
2 TG • Grade 4 • Unit 1 • Lesson 5 Assessment Master
Name Date
Cop
yright © K
endall H
unt Pub
lishing Com
pany
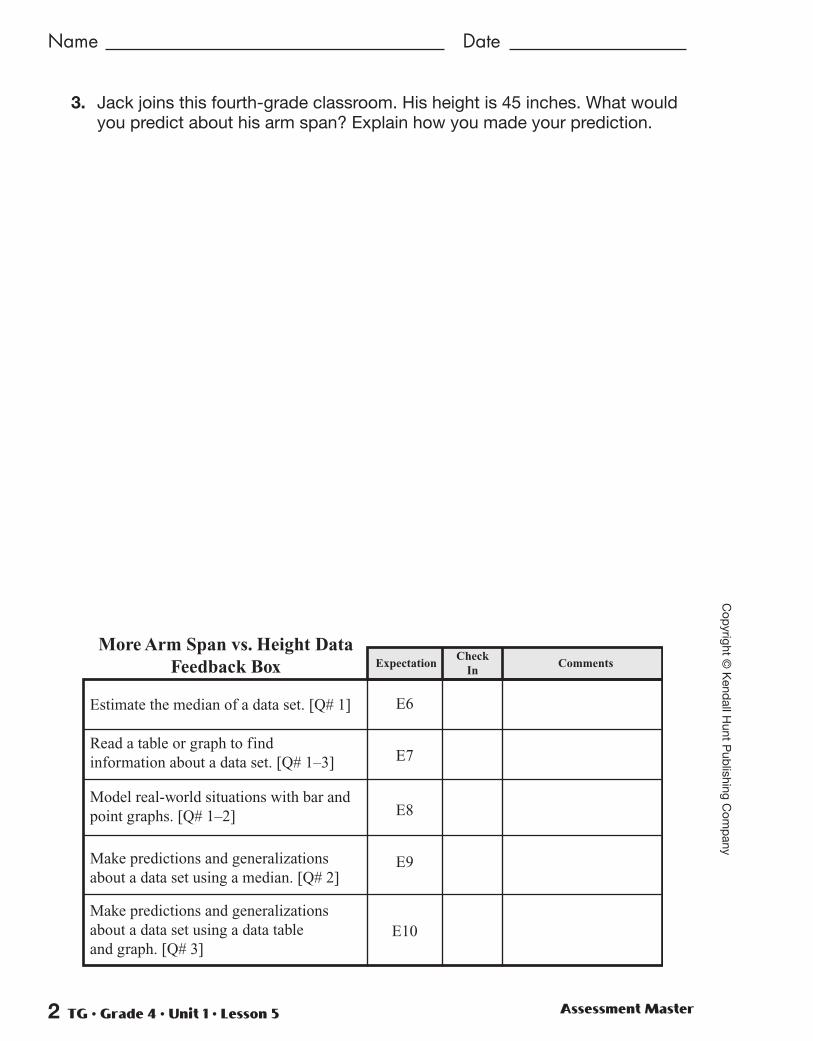
3. Jack joins this fourth-grade classroom. His height is 45 inches. What wouldyou predict about his arm span? Explain how you made your prediction.
CheckIn
CommentsExpectation
Estimate the median of a data set. [Q# 1]
Make predictions and generalizationsabout a data set using a median. [Q# 2]
Make predictions and generalizations about a data set using a data table and graph. [Q# 3]
Read a table or graph to find information about a data set. [Q# 1–3]
Model real-world situations with bar and point graphs. [Q# 1–2]
E6
E7
E8
E9
E10
More Arm Span vs. Height DataFeedback Box
Master
TG
• Grad
e 4 •
Copyright © Kendall Hunt Publishing Company
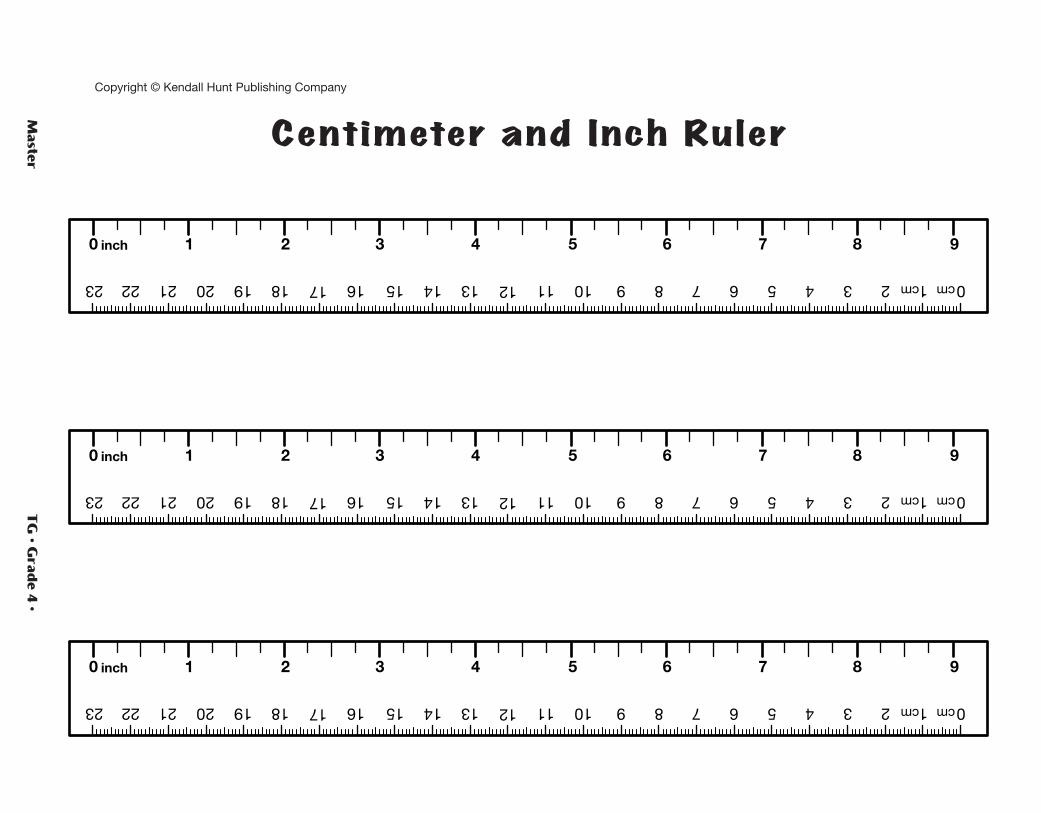
Centimeter and Inch Ruler
50 1 42 6 7 8 93
1011121314151617181920212223 4567 1 02389
inch
cm cm
50 1 42 6 7 8 93
1011121314151617181920212223 4567 1 02389
inch
cm cm
50 1 42 6 7 8 93
1011121314151617181920212223 4567 1 02389
inch
cm cm
Assessm
ent M
asterT
G • G
rade 4
• Un
it 1 • Lesson
6
Copyright © Kendall Hunt Publishing Company
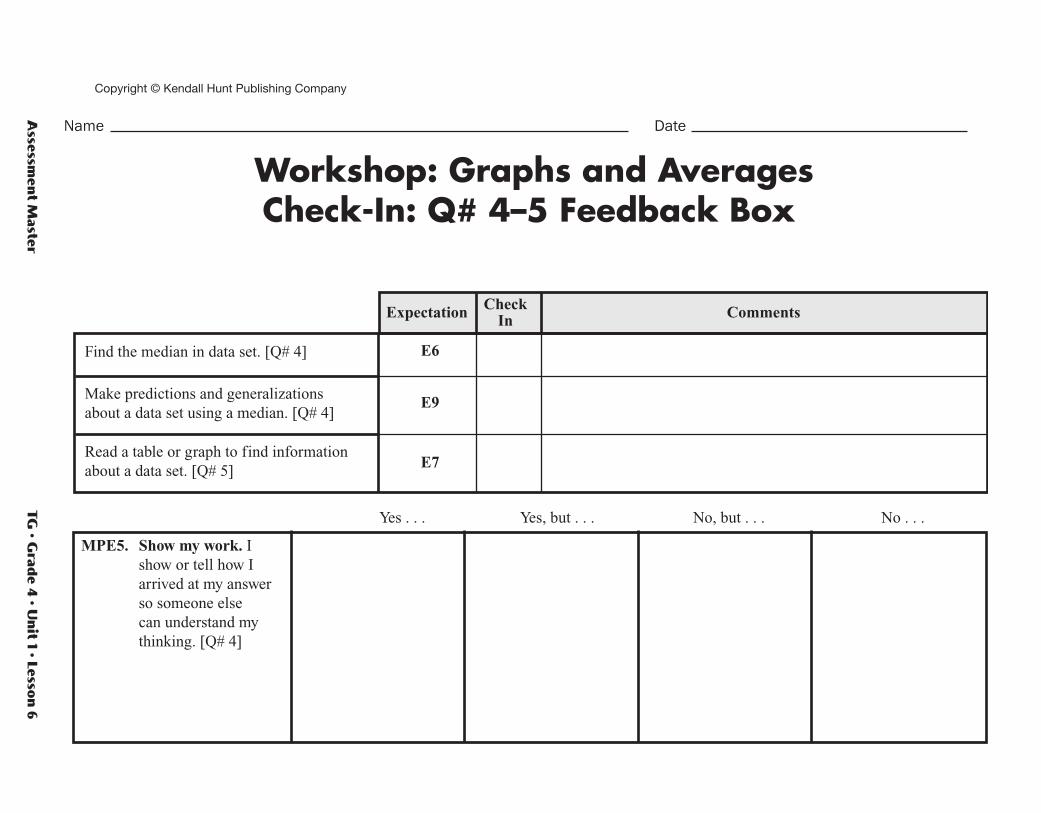
Name Date
CheckInExpectation Comments
Find the median in data set. [Q# 4]
Make predictions and generalizationsabout a data set using a median. [Q# 4]
Read a table or graph to find information about a data set. [Q# 5]
MPE5. Show my work. I show or tell how I arrived at my answer so someone else can understand my thinking. [Q# 4]
Yes . . . Yes, but . . . No, but . . . No . . .
E6
E9
E7
Workshop: Graphs and Averages Check-In: Q# 4–5 Feedback Box