Embed Size (px)
Citation preview
Kharif sorghum genotype SPV 1786 with excellent quality characters and high yield.
All India Coordinated Sorghum Improvement Project, Akola Centre
Sorghum Research Unit, Dr.Panjabrao Deshmukh Krishi Vidyapeeth, Akola (MS)
V. V.Kalpande ,R. B. Ghorade, S.A.Bhongle, S.N.Kale, Seema Nemade and V.U.Sonalkar
Sorghum Research Unit, Dr.Panjabrao Deshmukh Krishi Vidyapeeth, Akola (MS)
�Sorghum is an important cereal crop in India.
�Sorghum ranks fifth, among the world cereal food crops (Rice, Wheat, Maize, and Barley).
�Besides India, the sorghum is grown extensively in the countries like Africa, America, Brazil, China,
Russia and Peru.
�In India the sorghum is mainly cultivated in the states of Maharashtra, Karnataka, Madhya Pradesh,
Andhra Pradesh and Rajasthan.
�Sorghum is dual purpose crop giving the grains for human consumption and fodder for the livestock.
�From human and live stock nutrition point of view, the quality of grain as well as fodder is equally
important.
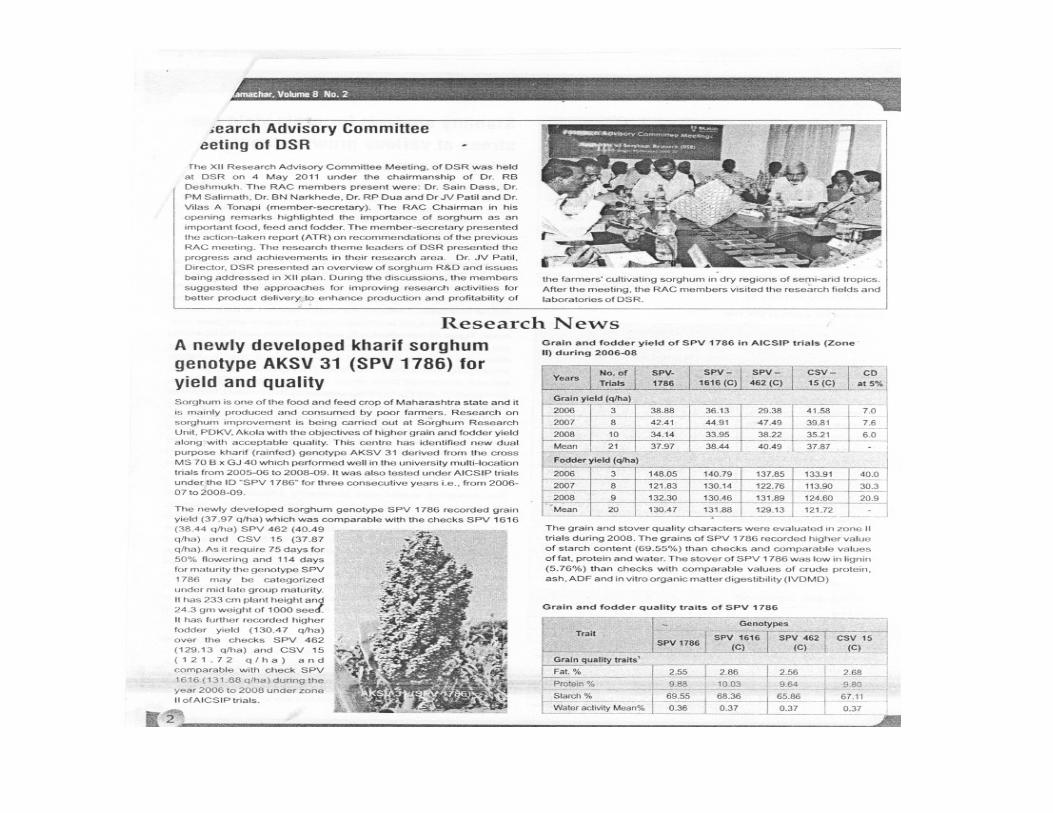
�Sorghum Research Unit, Dr.PDKV, Akola (MS) has developed one kharif sorghum genotype SPV-1786
with excellent dough and roti making quality.
�In the present era of nutritional security, development of such quality rich genotypes is of significance
Material and Methods
�SPV 1786 is developed from the cross ( Ms 70 B x GJ 40) 17.1 by selection method.
� Ms 70 B brought from ICRISAT in 1991 and reselected and stabilized at Akola .
�GJ 40 is Dual purpose state released variety in the year 1997.
�This genotype has been tested in All India Co-ordinated Sorghum Improvement Project (AICSIP)
multilocation trials-Zone-II during-
2006 (IVT- Initial Varietal Trial),
2007 (AVT Ist year- Advance Varietal Trial ) and
2008 (AVT IInd year- Advance Varietal Trial ) along with national released checks
�The genotype has been tested for grain yield, fodder yield, agronomic variables, reaction to major
pest and diseases. Similarly the grain and stover quality parameters as well as organoleptic
properties of the roti have also been assessed in the AICSIP trials.
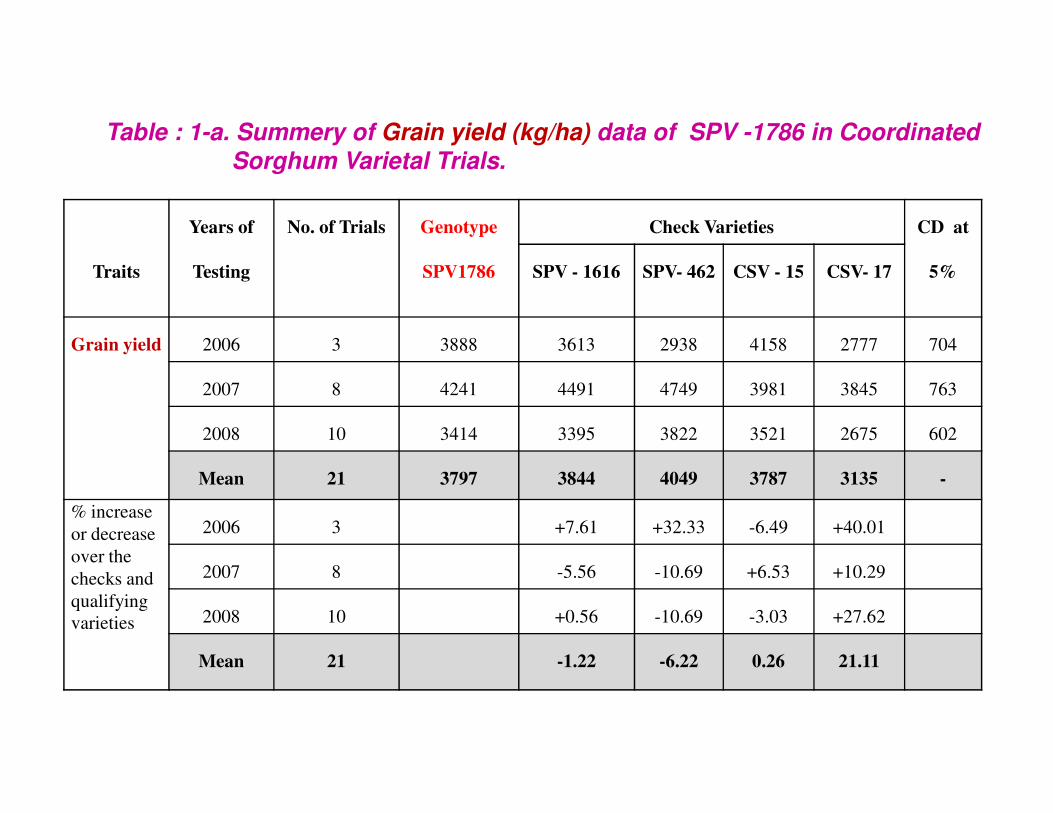
Table : 1-a. Summery of Grain yield (kg/ha) data of SPV -1786 in Coordinated
Sorghum Varietal Trials.
Traits
Years of
Testing
No. of Trials Genotype
SPV1786
Check Varieties CD at
5%SPV - 1616 SPV- 462 CSV - 15 CSV- 17
Grain yield 2006 3 3888 3613 2938 4158 2777 704
2007 8 4241 4491 4749 3981 3845 763
2008 10 3414 3395 3822 3521 2675 602
Mean 21 3797 3844 4049 3787 3135 -
% increase
or decrease
over the
checks and
qualifying
varieties
2006 3 +7.61 +32.33 -6.49 +40.01
2007 8 -5.56 -10.69 +6.53 +10.29
2008 10 +0.56 -10.69 -3.03 +27.62
Mean 21 -1.22 -6.22 0.26 21.11
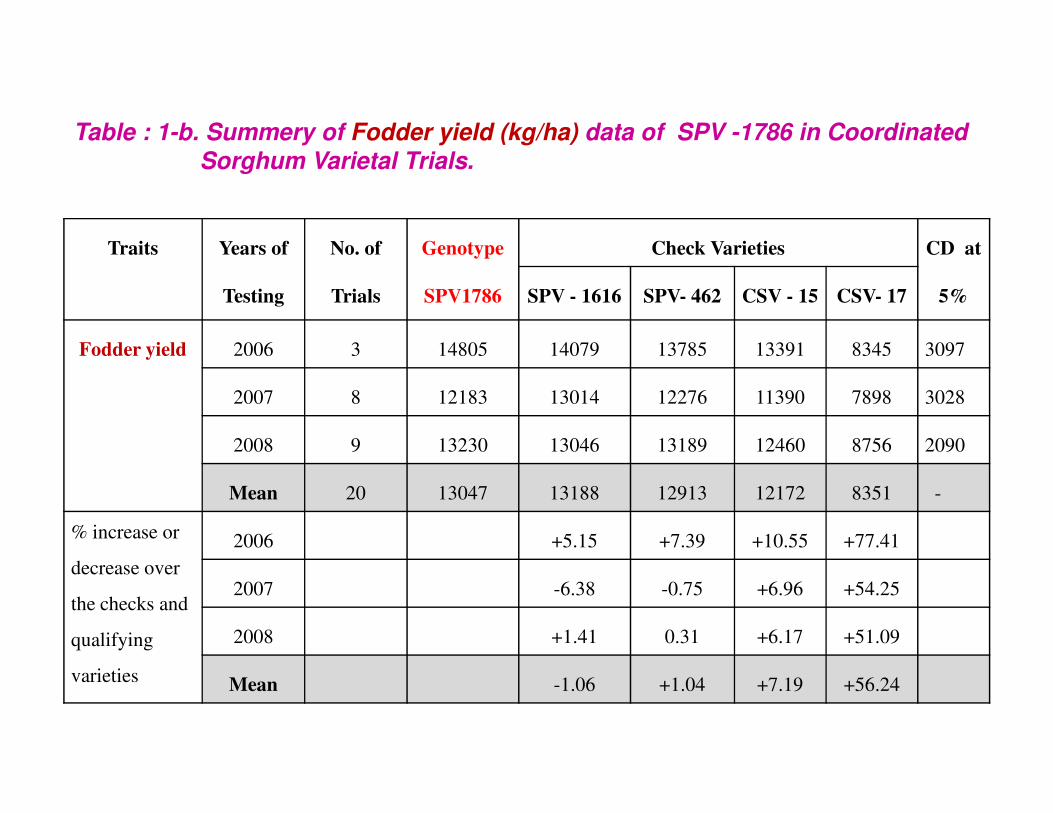
Table : 1-b. Summery of Fodder yield (kg/ha) data of SPV -1786 in Coordinated
Sorghum Varietal Trials.
Traits Years of
Testing
No. of
Trials
Genotype
SPV1786
Check Varieties CD at
5%SPV - 1616 SPV- 462 CSV - 15 CSV- 17
Fodder yield 2006 3 14805 14079 13785 13391 8345 3097
2007 8 12183 13014 12276 11390 7898 30282007 8 12183 13014 12276 11390 7898 3028
2008 9 13230 13046 13189 12460 8756 2090
Mean 20 13047 13188 12913 12172 8351 -
% increase or
decrease over
the checks and
qualifying
varieties
2006 +5.15 +7.39 +10.55 +77.41
2007 -6.38 -0.75 +6.96 +54.25
2008 +1.41 0.31 +6.17 +51.09
Mean -1.06 +1.04 +7.19 +56.24
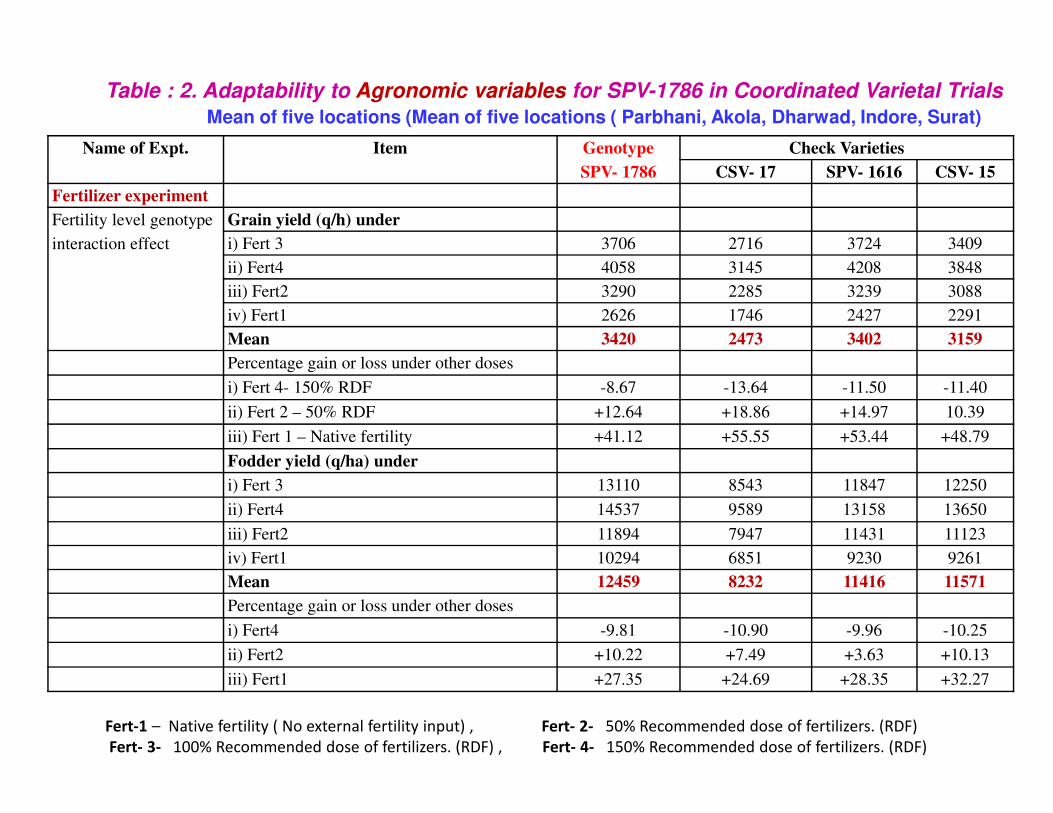
Table : 2. Adaptability to Agronomic variables for SPV-1786 in Coordinated Varietal Trials
Mean of five locations (Mean of five locations ( Parbhani, Akola, Dharwad, Indore, Surat)
Name of Expt. Item Genotype
SPV- 1786
Check Varieties
CSV- 17 SPV- 1616 CSV- 15
Fertilizer experiment
Fertility level genotype
interaction effect
Grain yield (q/h) under
i) Fert 3 3706 2716 3724 3409
ii) Fert4 4058 3145 4208 3848
iii) Fert2 3290 2285 3239 3088
iv) Fert1 2626 1746 2427 2291
Mean 3420 2473 3402 3159
Percentage gain or loss under other doses
i) Fert 4- 150% RDF -8.67 -13.64 -11.50 -11.40
ii) Fert 2 – 50% RDF +12.64 +18.86 +14.97 10.39ii) Fert 2 – 50% RDF +12.64 +18.86 +14.97 10.39
iii) Fert 1 – Native fertility +41.12 +55.55 +53.44 +48.79
Fodder yield (q/ha) under
i) Fert 3 13110 8543 11847 12250
ii) Fert4 14537 9589 13158 13650
iii) Fert2 11894 7947 11431 11123
iv) Fert1 10294 6851 9230 9261
Mean 12459 8232 11416 11571
Percentage gain or loss under other doses
i) Fert4 -9.81 -10.90 -9.96 -10.25
ii) Fert2 +10.22 +7.49 +3.63 +10.13
iii) Fert1 +27.35 +24.69 +28.35 +32.27
Fert-1 – Native fertility ( No external fertility input) , Fert- 2- 50% Recommended dose of fertilizers. (RDF)
Fert- 3- 100% Recommended dose of fertilizers. (RDF) , Fert- 4- 150% Recommended dose of fertilizers. (RDF)
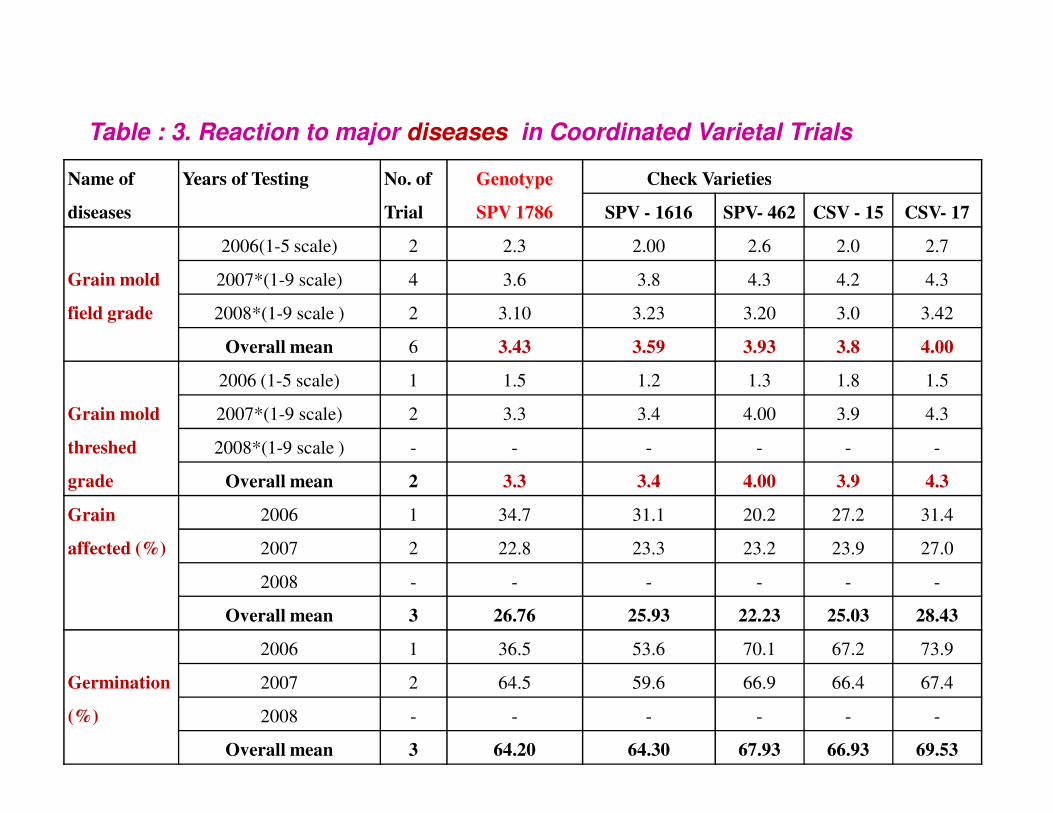
Table : 3. Reaction to major diseases in Coordinated Varietal Trials
Name of
diseases
Years of Testing No. of
Trial
Genotype
SPV 1786
Check Varieties
SPV - 1616 SPV- 462 CSV - 15 CSV- 17
Grain mold
field grade
2006(1-5 scale) 2 2.3 2.00 2.6 2.0 2.7
2007*(1-9 scale) 4 3.6 3.8 4.3 4.2 4.3
2008*(1-9 scale ) 2 3.10 3.23 3.20 3.0 3.42
Overall mean 6 3.43 3.59 3.93 3.8 4.00
Grain mold
2006 (1-5 scale) 1 1.5 1.2 1.3 1.8 1.5
2007*(1-9 scale) 2 3.3 3.4 4.00 3.9 4.3Grain mold
threshed
grade
2007*(1-9 scale) 2 3.3 3.4 4.00 3.9 4.3
2008*(1-9 scale ) - - - - - -
Overall mean 2 3.3 3.4 4.00 3.9 4.3
Grain
affected (%)
2006 1 34.7 31.1 20.2 27.2 31.4
2007 2 22.8 23.3 23.2 23.9 27.0
2008 - - - - - -
Overall mean 3 26.76 25.93 22.23 25.03 28.43
Germination
(%)
2006 1 36.5 53.6 70.1 67.2 73.9
2007 2 64.5 59.6 66.9 66.4 67.4
2008 - - - - - -
Overall mean 3 64.20 64.30 67.93 66.93 69.53
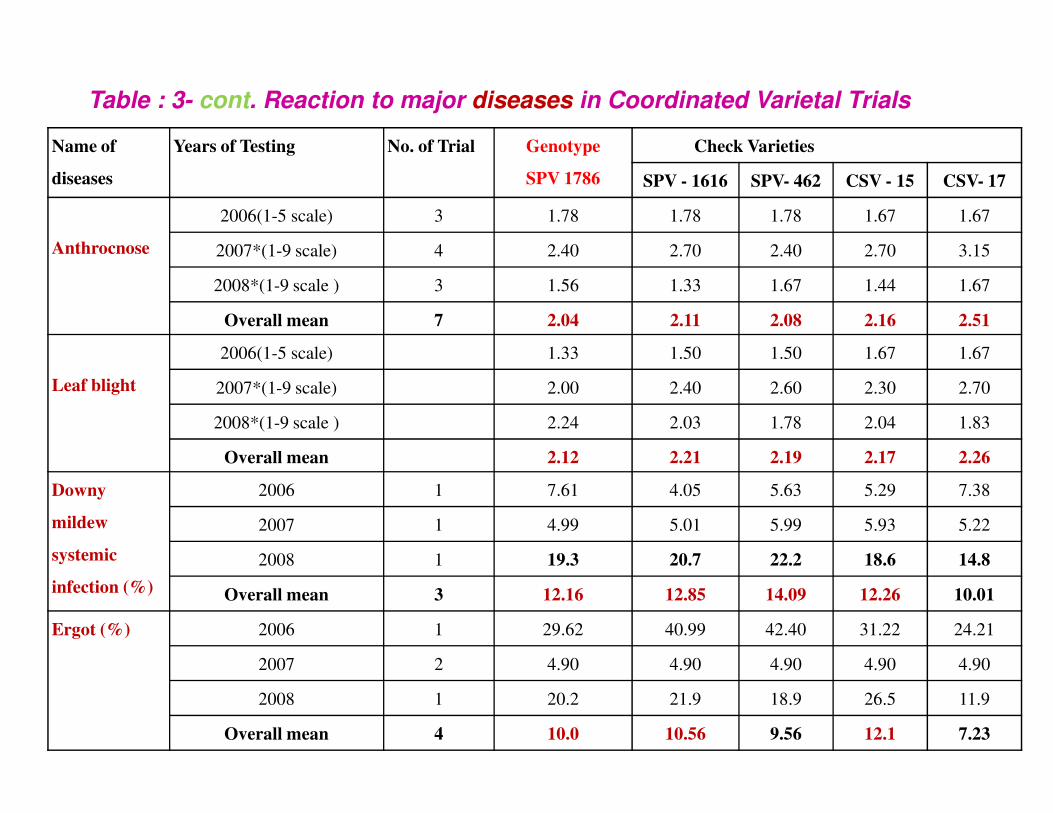
Table : 3- cont. Reaction to major diseases in Coordinated Varietal Trials
Name of
diseases
Years of Testing No. of Trial Genotype
SPV 1786
Check Varieties
SPV - 1616 SPV- 462 CSV - 15 CSV- 17
Anthrocnose
2006(1-5 scale) 3 1.78 1.78 1.78 1.67 1.67
2007*(1-9 scale) 4 2.40 2.70 2.40 2.70 3.15
2008*(1-9 scale ) 3 1.56 1.33 1.67 1.44 1.67
Overall mean 7 2.04 2.11 2.08 2.16 2.51
Leaf blight
2006(1-5 scale) 1.33 1.50 1.50 1.67 1.67
2007*(1-9 scale) 2.00 2.40 2.60 2.30 2.70
2008*(1-9 scale ) 2.24 2.03 1.78 2.04 1.83
Overall mean 2.12 2.21 2.19 2.17 2.26
Downy
mildew
systemic
infection (%)
2006 1 7.61 4.05 5.63 5.29 7.38
2007 1 4.99 5.01 5.99 5.93 5.22
2008 1 19.3 20.7 22.2 18.6 14.8
Overall mean 3 12.16 12.85 14.09 12.26 10.01
Ergot (%) 2006 1 29.62 40.99 42.40 31.22 24.21
2007 2 4.90 4.90 4.90 4.90 4.90
2008 1 20.2 21.9 18.9 26.5 11.9
Overall mean 4 10.0 10.56 9.56 12.1 7.23
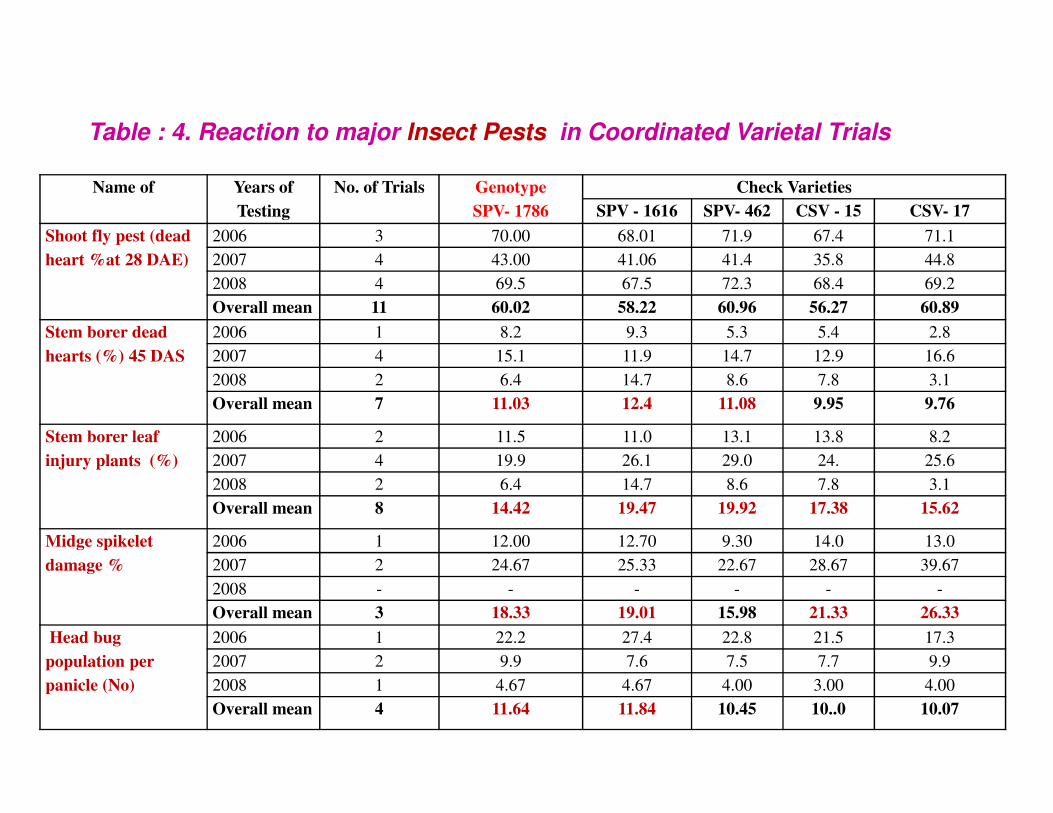
Table : 4. Reaction to major Insect Pests in Coordinated Varietal Trials
Name of Years of
Testing
No. of Trials Genotype
SPV- 1786
Check Varieties
SPV - 1616 SPV- 462 CSV - 15 CSV- 17
Shoot fly pest (dead
heart %at 28 DAE)
2006 3 70.00 68.01 71.9 67.4 71.1
2007 4 43.00 41.06 41.4 35.8 44.8
2008 4 69.5 67.5 72.3 68.4 69.2
Overall mean 11 60.02 58.22 60.96 56.27 60.89
Stem borer dead
hearts (%) 45 DAS
2006 1 8.2 9.3 5.3 5.4 2.8
2007 4 15.1 11.9 14.7 12.9 16.6
2008 2 6.4 14.7 8.6 7.8 3.1
Overall mean 7 11.03 12.4 11.08 9.95 9.76Overall mean 7 11.03 12.4 11.08 9.95 9.76
Stem borer leaf
injury plants (%)
2006 2 11.5 11.0 13.1 13.8 8.2
2007 4 19.9 26.1 29.0 24. 25.6
2008 2 6.4 14.7 8.6 7.8 3.1
Overall mean 8 14.42 19.47 19.92 17.38 15.62
Midge spikelet
damage %
2006 1 12.00 12.70 9.30 14.0 13.0
2007 2 24.67 25.33 22.67 28.67 39.67
2008 - - - - - -
Overall mean 3 18.33 19.01 15.98 21.33 26.33
Head bug
population per
panicle (No)
2006 1 22.2 27.4 22.8 21.5 17.3
2007 2 9.9 7.6 7.5 7.7 9.9
2008 1 4.67 4.67 4.00 3.00 4.00
Overall mean 4 11.64 11.84 10.45 10..0 10.07
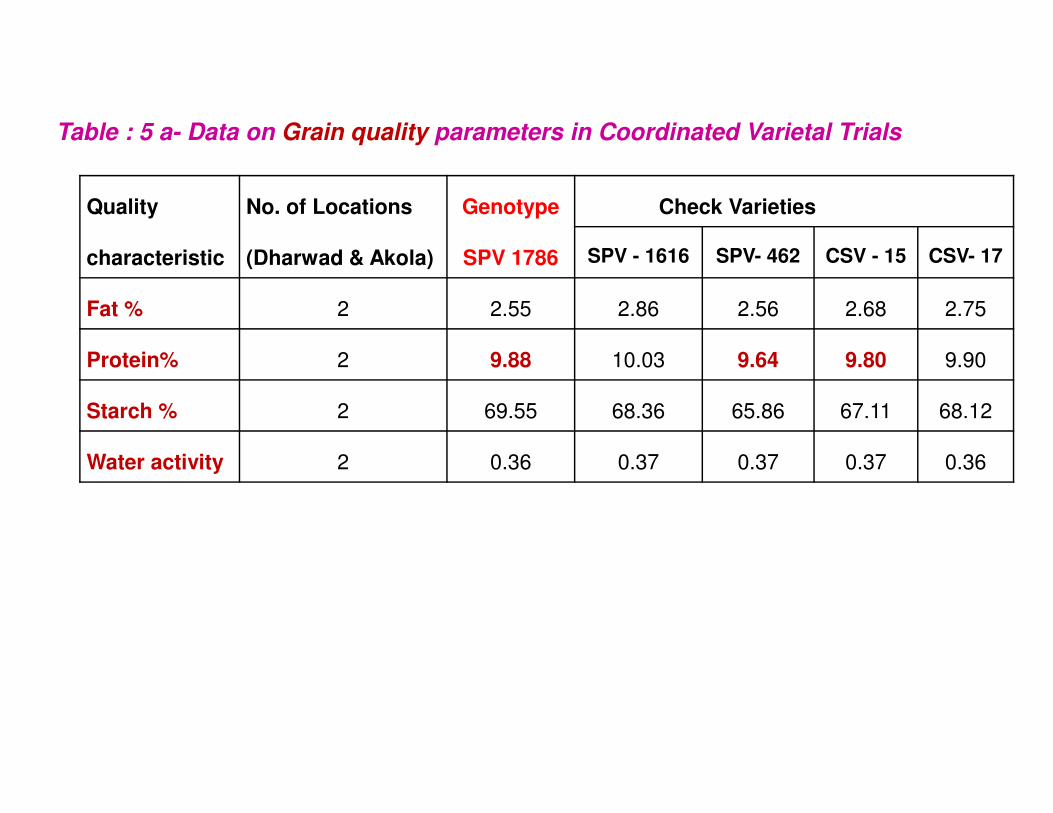
Table : 5 a- Data on Grain quality parameters in Coordinated Varietal Trials
Quality
characteristic
No. of Locations
(Dharwad & Akola)
Genotype
SPV 1786
Check Varieties
SPV - 1616 SPV- 462 CSV - 15 CSV- 17
Fat % 2 2.55 2.86 2.56 2.68 2.75
Protein% 2 9.88 10.03 9.64 9.80 9.90
Starch % 2 69.55 68.36 65.86 67.11 68.12Starch % 2 69.55 68.36 65.86 67.11 68.12
Water activity 2 0.36 0.37 0.37 0.37 0.36
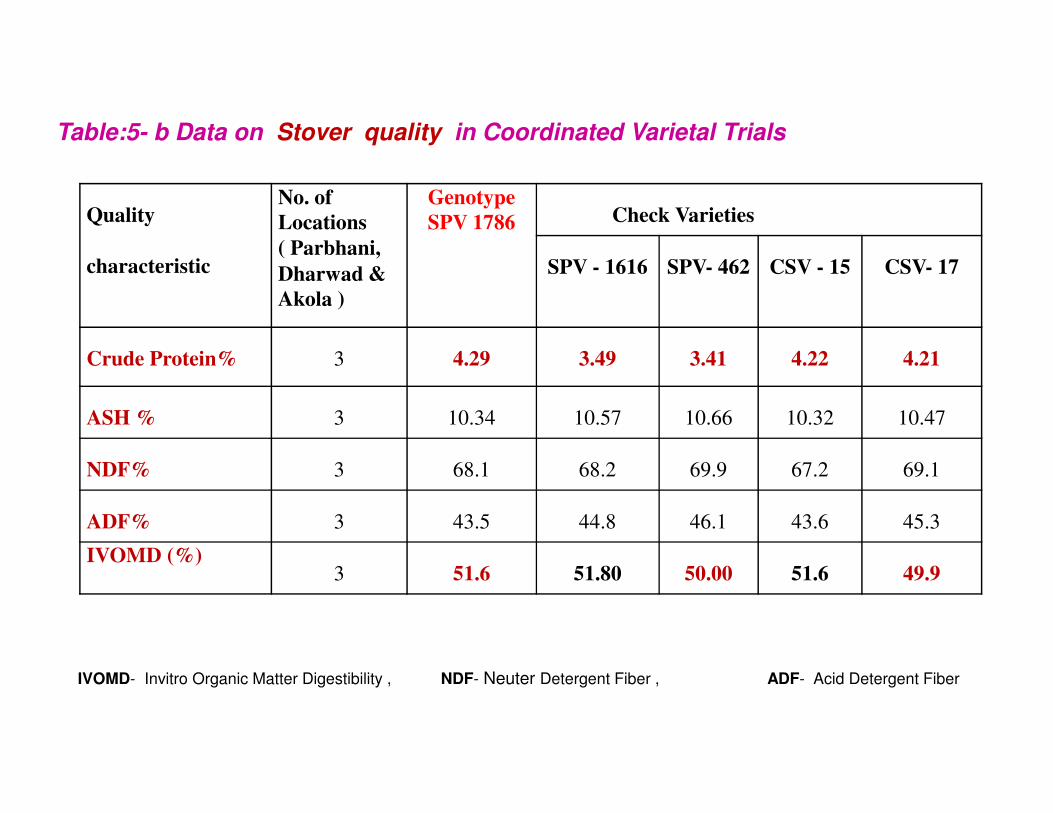
Table:5- b Data on Stover quality in Coordinated Varietal Trials
Quality
characteristic
No. of
Locations
( Parbhani,
Dharwad &
Akola )
Genotype
SPV 1786 Check Varieties
SPV - 1616 SPV- 462 CSV - 15 CSV- 17
Crude Protein% 3 4.29 3.49 3.41 4.22 4.21
ASH % 3 10.34 10.57 10.66 10.32 10.47
IVOMD- Invitro Organic Matter Digestibility , NDF- Neuter Detergent Fiber , ADF- Acid Detergent Fiber
ASH % 3 10.34 10.57 10.66 10.32 10.47
NDF% 3 68.1 68.2 69.9 67.2 69.1
ADF% 3 43.5 44.8 46.1 43.6 45.3
IVOMD (%) 3 51.6 51.80 50.00 51.6 49.9
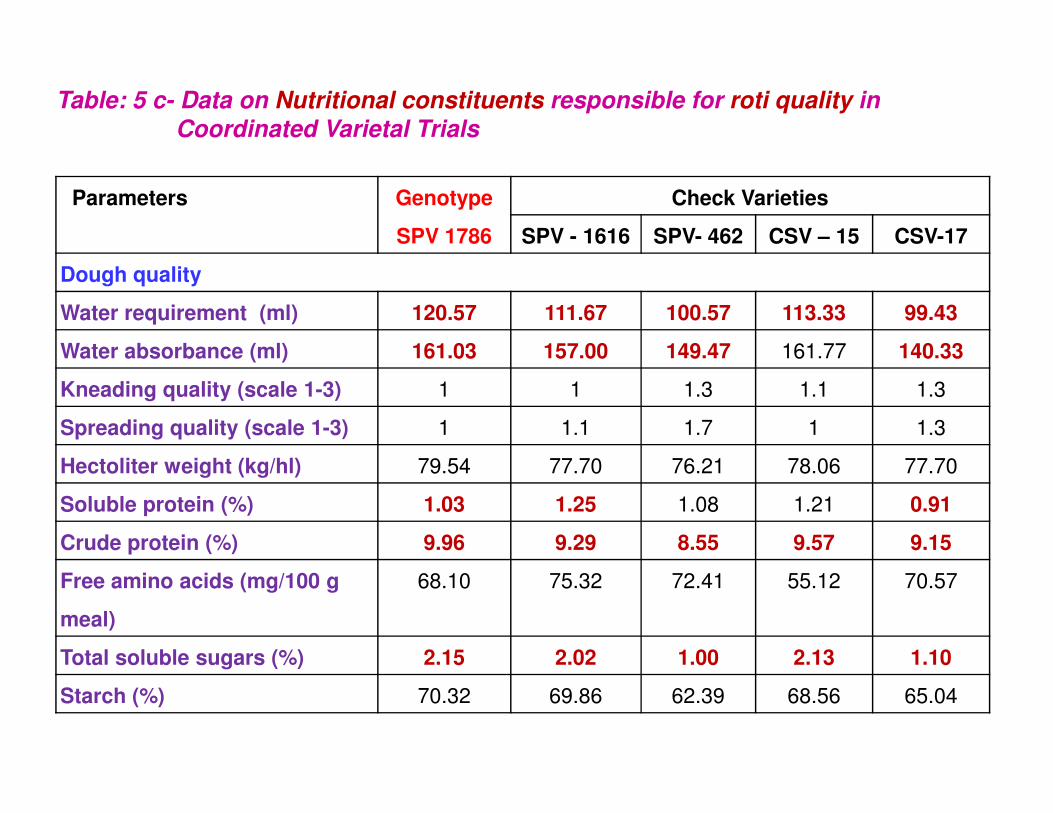
Table: 5 c- Data on Nutritional constituents responsible for roti quality inCoordinated Varietal Trials
Parameters Genotype
SPV 1786
Check Varieties
SPV - 1616 SPV- 462 CSV – 15 CSV-17
Dough quality
Water requirement (ml) 120.57 111.67 100.57 113.33 99.43
Water absorbance (ml) 161.03 157.00 149.47 161.77 140.33
Kneading quality (scale 1-3) 1 1 1.3 1.1 1.3
Spreading quality (scale 1-3) 1 1.1 1.7 1 1.3
Hectoliter weight (kg/hl) 79.54 77.70 76.21 78.06 77.70
Soluble protein (%) 1.03 1.25 1.08 1.21 0.91
Crude protein (%) 9.96 9.29 8.55 9.57 9.15
Free amino acids (mg/100 g
meal)
68.10 75.32 72.41 55.12 70.57
Total soluble sugars (%) 2.15 2.02 1.00 2.13 1.10
Starch (%) 70.32 69.86 62.39 68.56 65.04
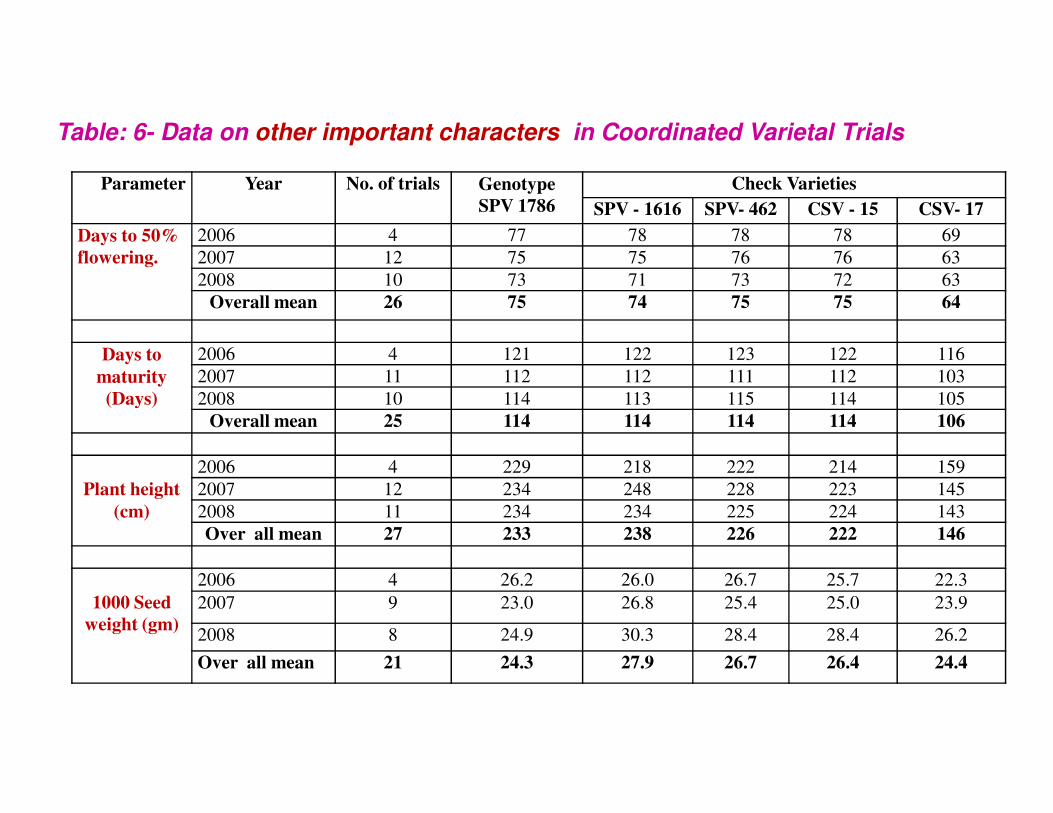
Table: 6- Data on other important characters in Coordinated Varietal Trials
Parameter Year No. of trials Genotype
SPV 1786
Check Varieties
SPV - 1616 SPV- 462 CSV - 15 CSV- 17
Days to 50%
flowering.
2006 4 77 78 78 78 69
2007 12 75 75 76 76 63
2008 10 73 71 73 72 63
Overall mean 26 75 74 75 75 64
Days to
maturity
(Days)
2006 4 121 122 123 122 116
2007 11 112 112 111 112 103
2008 10 114 113 115 114 105(Days) 2008 10 114 113 115 114 105
Overall mean 25 114 114 114 114 106
Plant height
(cm)
2006 4 229 218 222 214 159
2007 12 234 248 228 223 145
2008 11 234 234 225 224 143
Over all mean 27 233 238 226 222 146
1000 Seed
weight (gm)
2006 4 26.2 26.0 26.7 25.7 22.3
2007 9 23.0 26.8 25.4 25.0 23.9
2008 8 24.9 30.3 28.4 28.4 26.2
Over all mean 21 24.3 27.9 26.7 26.4 24.4