Embed Size (px)
Citation preview
Kili�
Cou
nty
ii
Exploring Kenya’s Inequality
A PUBLICATION OF KNBS AND SID
© 2013 Kenya National Bureau of Statistics (KNBS) and Society for International Development (SID)
ISBN – 978 - 9966 - 029 - 18 - 8
With funding from DANIDA through Drivers of Accountability Programme
The publication, however, remains the sole responsibility of the Kenya National Bureau of Statistics (KNBS) and the Society for International Development (SID).
Written by: Eston Ngugi
Data and tables generation: Samuel Kipruto
Paul Samoei
Maps generation: George Matheka Kamula
Technical Input and Editing: Katindi Sivi-Njonjo
Jason Lakin
Copy Editing: Ali Nadim Zaidi
Leonard Wanyama
Design, Print and Publishing: Ascent Limited
All rights reserved. No part of this publication may be reproduced, stored in a retrieval system or transmitted in any form, or by any means electronic, mechanical, photocopying, recording or otherwise, without the prior express and written permission of the publishers. Any part of this publication may be freely reviewed or quoted provided the source is duly acknowledged. It may not be sold or used for commercial purposes or for profit.
Kenya National Bureau of Statistics
P.O. Box 30266-00100 Nairobi, Kenya
Email: [email protected] Website: www.knbs.or.ke
Society for International Development – East Africa
P.O. Box 2404-00100 Nairobi, Kenya
Email: [email protected] | Website: www.sidint.net
Published by
iii
Pulling Apart or Pooling Together?
Table of contents Table of contents iii
Foreword iv
Acknowledgements v
Striking features on inter-county inequalities in Kenya vi
List of Figures viii
List Annex Tables ix
Abbreviations xi
Introduction 2
Kilifi County 9
iv
Exploring Kenya’s Inequality
A PUBLICATION OF KNBS AND SID
ForewordKenya, like all African countries, focused on poverty alleviation at independence, perhaps due to the level of
vulnerability of its populations but also as a result of the ‘trickle down’ economic discourses of the time, which
assumed that poverty rather than distribution mattered – in other words, that it was only necessary to concentrate
on economic growth because, as the country grew richer, this wealth would trickle down to benefit the poorest
sections of society. Inequality therefore had a very low profile in political, policy and scholarly discourses. In
recent years though, social dimensions such as levels of access to education, clean water and sanitation are
important in assessing people’s quality of life. Being deprived of these essential services deepens poverty and
reduces people’s well-being. Stark differences in accessing these essential services among different groups
make it difficult to reduce poverty even when economies are growing. According to the Economist (June 1, 2013),
a 1% increase in incomes in the most unequal countries produces a mere 0.6 percent reduction in poverty. In the
most equal countries, the same 1% growth yields a 4.3% reduction in poverty. Poverty and inequality are thus part
of the same problem, and there is a strong case to be made for both economic growth and redistributive policies.
From this perspective, Kenya’s quest in vision 2030 to grow by 10% per annum must also ensure that inequality
is reduced along the way and all people benefit equitably from development initiatives and resources allocated.
Since 2004, the Society for International Development (SID) and Kenya National Bureau of Statistics (KNBS) have
collaborated to spearhead inequality research in Kenya. Through their initial publications such as ‘Pulling Apart:
Facts and Figures on Inequality in Kenya,’ which sought to present simple facts about various manifestations
of inequality in Kenya, the understanding of Kenyans of the subject was deepened and a national debate on
the dynamics, causes and possible responses started. The report ‘Geographic Dimensions of Well-Being in
Kenya: Who and Where are the Poor?’ elevated the poverty and inequality discourse further while the publication
‘Readings on Inequality in Kenya: Sectoral Dynamics and Perspectives’ presented the causality, dynamics and
other technical aspects of inequality.
KNBS and SID in this publication go further to present monetary measures of inequality such as expenditure
patterns of groups and non-money metric measures of inequality in important livelihood parameters like
employment, education, energy, housing, water and sanitation to show the levels of vulnerability and patterns of
unequal access to essential social services at the national, county, constituency and ward levels.
We envisage that this work will be particularly helpful to county leaders who are tasked with the responsibility
of ensuring equitable social and economic development while addressing the needs of marginalized groups
and regions. We also hope that it will help in informing public engagement with the devolution process and
be instrumental in formulating strategies and actions to overcome exclusion of groups or individuals from the
benefits of growth and development in Kenya.
It is therefore our great pleasure to present ‘Exploring Kenya’s inequality: Pulling apart or pooling together?’ Ali Hersi Society for International Development (SID) Regional Director
v
Pulling Apart or Pooling Together?
AcknowledgementsKenya National Bureau of Statistics (KNBS) and Society for International Development (SID) are grateful
to all the individuals directly involved in the publication of ‘Exploring Kenya’s Inequality: Pulling Apart or
Pulling Together?’ books. Special mention goes to Zachary Mwangi (KNBS, Ag. Director General) and
Ali Hersi (SID, Regional Director) for their institutional leadership; Katindi Sivi-Njonjo (SID, Progrmme
Director) and Paul Samoei (KNBS) for the effective management of the project; Eston Ngugi; Tabitha
Wambui Mwangi; Joshua Musyimi; Samuel Kipruto; George Kamula; Jason Lakin; Ali Zaidi; Leonard
Wanyama; and Irene Omari for the different roles played in the completion of these publications.
KNBS and SID would like to thank Bernadette Wanjala (KIPPRA), Mwende Mwendwa (KIPPRA), Raphael
Munavu (CRA), Moses Sichei (CRA), Calvin Muga (TISA), Chrispine Oduor (IEA), John T. Mukui, Awuor
Ponge (IPAR, Kenya), Othieno Nyanjom, Mary Muyonga (SID), Prof. John Oucho (AMADPOC), Ms. Ada
Mwangola (Vision 2030 Secretariat), Kilian Nyambu (NCIC), Charles Warria (DAP), Wanjiru Gikonyo
(TISA) and Martin Napisa (NTA), for attending the peer review meetings held on 3rd October 2012 and
Thursday, 28th Feb 2013 and for making invaluable comments that went into the initial production and
the finalisation of the books. Special mention goes to Arthur Muliro, Wambui Gathathi, Con Omore,
Andiwo Obondoh, Peter Gunja, Calleb Okoyo, Dennis Mutabazi, Leah Thuku, Jackson Kitololo, Yvonne
Omwodo and Maureen Bwisa for their institutional support and administrative assistance throughout the
project. The support of DANIDA through the Drivers of Accountability Project in Kenya is also gratefully
acknowledged.
Stefano PratoManaging Director,SID
vi
Exploring Kenya’s Inequality
A PUBLICATION OF KNBS AND SID
Striking Features on Intra-County Inequality in Kenya Inequalities within counties in all the variables are extreme. In many cases, Kenyans living within a
single county have completely different lifestyles and access to services.
Income/expenditure inequalities1. The five counties with the worst income inequality (measured as a ratio of the top to the bottom
decile) are in Coast. The ratio of expenditure by the wealthiest to the poorest is 20 to one and above
in Lamu, Tana River, Kwale, and Kilifi. This means that those in the top decile have 20 times as much
expenditure as those in the bottom decile. This is compared to an average for the whole country of
nine to one.
2. Another way to look at income inequality is to compare the mean expenditure per adult across
wards within a county. In 44 of the 47 counties, the mean expenditure in the poorest wards is less
than 40 percent the mean expenditure in the wealthiest wards within the county. In both Kilifi and
Kwale, the mean expenditure in the poorest wards (Garashi and Ndavaya, respectively) is less than
13 percent of expenditure in the wealthiest ward in the county.
3. Of the five poorest counties in terms of mean expenditure, four are in the North (Mandera, Wajir,
Turkana and Marsabit) and the last is in Coast (Tana River). However, of the five most unequal
counties, only one (Marsabit County) is in the North (looking at ratio of mean expenditure in richest
to poorest ward). The other four most unequal counties by this measure are: Kilifi, Kwale, Kajiado
and Kitui.
4. If we look at Gini coefficients for the whole county, the most unequal counties are also in Coast:
Tana River (.631), Kwale (.604), and Kilifi (.570).
5. The most equal counties by income measure (ratio of top decile to bottom) are: Narok, West Pokot,
Bomet, Nandi and Nairobi. Using the ratio of average income in top to bottom ward, the five most
equal counties are: Kirinyaga, Samburu, Siaya, Nyandarua, Narok.
Access to Education6. Major urban areas in Kenya have high education levels but very large disparities. Mombasa, Nairobi
and Kisumu all have gaps between highest and lowest wards of nearly 50 percentage points in
share of residents with secondary school education or higher levels.
7. In the 5 most rural counties (Baringo, Siaya, Pokot, Narok and Tharaka Nithi), education levels
are lower but the gap, while still large, is somewhat lower than that espoused in urban areas. On
average, the gap in these 5 counties between wards with highest share of residents with secondary
school or higher and those with the lowest share is about 26 percentage points.
8. The most extreme difference in secondary school education and above is in Kajiado County where
the top ward (Ongata Rongai) has nearly 59 percent of the population with secondary education
plus, while the bottom ward (Mosiro) has only 2 percent.
9. One way to think about inequality in education is to compare the number of people with no education
vii
Pulling Apart or Pooling Together?
to those with some education. A more unequal county is one that has large numbers of both. Isiolo
is the most unequal county in Kenya by this measure, with 51 percent of the population having
no education, and 49 percent with some. This is followed by West Pokot at 55 percent with no
education and 45 percent with some, and Tana River at 56 percent with no education and 44 with
some.
Access to Improved Sanitation10. Kajiado County has the highest gap between wards with access to improved sanitation. The best
performing ward (Ongata Rongai) has 89 percent of residents with access to improved sanitation
while the worst performing ward (Mosiro) has 2 percent of residents with access to improved
sanitation, a gap of nearly 87 percentage points.
11. There are 9 counties where the gap in access to improved sanitation between the best and worst
performing wards is over 80 percentage points. These are Baringo, Garissa, Kajiado, Kericho, Kilifi,
Machakos, Marsabit, Nyandarua and West Pokot.
Access to Improved Sources of Water 12. In all of the 47 counties, the highest gap in access to improved water sources between the county
with the best access to improved water sources and the least is over 45 percentage points. The
most severe gaps are in Mandera, Garissa, Marsabit, (over 99 percentage points), Kilifi (over 98
percentage points) and Wajir (over 97 percentage points).
Access to Improved Sources of Lighting13. The gaps within counties in access to electricity for lighting are also enormous. In most counties
(29 out of 47), the gap between the ward with the most access to electricity and the least access
is more than 40 percentage points. The most severe disparities between wards are in Mombasa
(95 percentage point gap between highest and lowest ward), Garissa (92 percentage points), and
Nakuru (89 percentage points).
Access to Improved Housing14. The highest extreme in this variable is found in Baringo County where all residents in Silale ward live
in grass huts while no one in Ravine ward in the same county lives in grass huts.
Overall ranking of the variables15. Overall, the counties with the most income inequalities as measured by the gini coefficient are Tana
River, Kwale, Kilifi, Lamu, Migori and Busia. However, the counties that are consistently mentioned
among the most deprived hence have the lowest access to essential services compared to others
across the following nine variables i.e. poverty, mean household expenditure, education, work for
pay, water, sanitation, cooking fuel, access to electricity and improved housing are Mandera (8
variables), Wajir (8 variables), Turkana (7 variables) and Marsabit (7 variables).
xi
Pulling Apart or Pooling Together?
Abbreviations
AMADPOC African Migration and Development Policy Centre
CRA Commission on Revenue Allocation
DANIDA Danish International Development Agency
DAP Drivers of Accountability Programme
EAs Enumeration Areas
HDI Human Development Index
IBP International Budget Partnership
IEA Institute of Economic Affairs
IPAR Institute of Policy Analysis and Research
KIHBS Kenya Intergraded Household Budget Survey
KIPPRA Kenya Institute for Public Policy Research and Analysis
KNBS Kenya National Bureau of Statistics
LPG Liquefied Petroleum Gas
NCIC National Cohesion and Integration Commission
NTA National Taxpayers Association
PCA Principal Component Analysis
SAEs Small Area Estimation
SID Society for International Development
TISA The Institute for Social Accountability
VIP latrine Ventilated-Improved Pit latrine
VOCs Volatile Organic Carbons
WDR World Development Report
2
Exploring Kenya’s Inequality
A PUBLICATION OF KNBS AND SID
IntroductionBackgroundFor more than half a century many people in the development sector in Kenya have worked at alleviating
extreme poverty so that the poorest people can access basic goods and services for survival like food,
safe drinking water, sanitation, shelter and education. However when the current national averages are
disaggregated there are individuals and groups that still lag too behind. As a result, the gap between
the rich and the poor, urban and rural areas, among ethnic groups or between genders reveal huge
disparities between those who are well endowed and those who are deprived.
According to the world inequality statistics, Kenya was ranked 103 out of 169 countries making it the
66th most unequal country in the world. Kenya’s Inequality is rooted in its history, politics, economics
and social organization and manifests itself in the lack of access to services, resources, power, voice
and agency. Inequality continues to be driven by various factors such as: social norms, behaviours and
practices that fuel discrimination and obstruct access at the local level and/ or at the larger societal
level; the fact that services are not reaching those who are most in need of them due to intentional or
unintentional barriers; the governance, accountability, policy or legislative issues that do not favor equal
opportunities for the disadvantaged; and economic forces i.e. the unequal control of productive assets
by the different socio-economic groups.
According to the 2005 report on the World Social Situation, sustained poverty reduction cannot be
achieved unless equality of opportunity and access to basic services is ensured. Reducing inequality
must therefore be explicitly incorporated in policies and programmes aimed at poverty reduction. In
addition, specific interventions may be required, such as: affirmative action; targeted public investments
in underserved areas and sectors; access to resources that are not conditional; and a conscious effort
to ensure that policies and programmes implemented have to provide equitable opportunities for all.
This chapter presents the basic concepts on inequality and poverty, methods used for analysis,
justification and choice of variables on inequality. The analysis is based on the 2009 Kenya housing
and population census while the 2006 Kenya integrated household budget survey is combined with
census to estimate poverty and inequality measures from the national to the ward level. Tabulation of
both money metric measures of inequality such as mean expenditure and non-money metric measures
of inequality in important livelihood parameters like, employment, education, energy, housing, water
and sanitation are presented. These variables were selected from the census data and analyzed in
detail and form the core of the inequality reports. Other variables such as migration or health indicators
like mortality, fertility etc. are analyzed and presented in several monographs by Kenya National Bureau
of Statistics and were therefore left out of this report.
MethodologyGini-coefficient of inequalityThis is the most commonly used measure of inequality. The coefficient varies between ‘0’, which reflects
complete equality and ‘1’ which indicates complete inequality. Graphically, the Gini coefficient can be
3
Pulling Apart or Pooling Together?
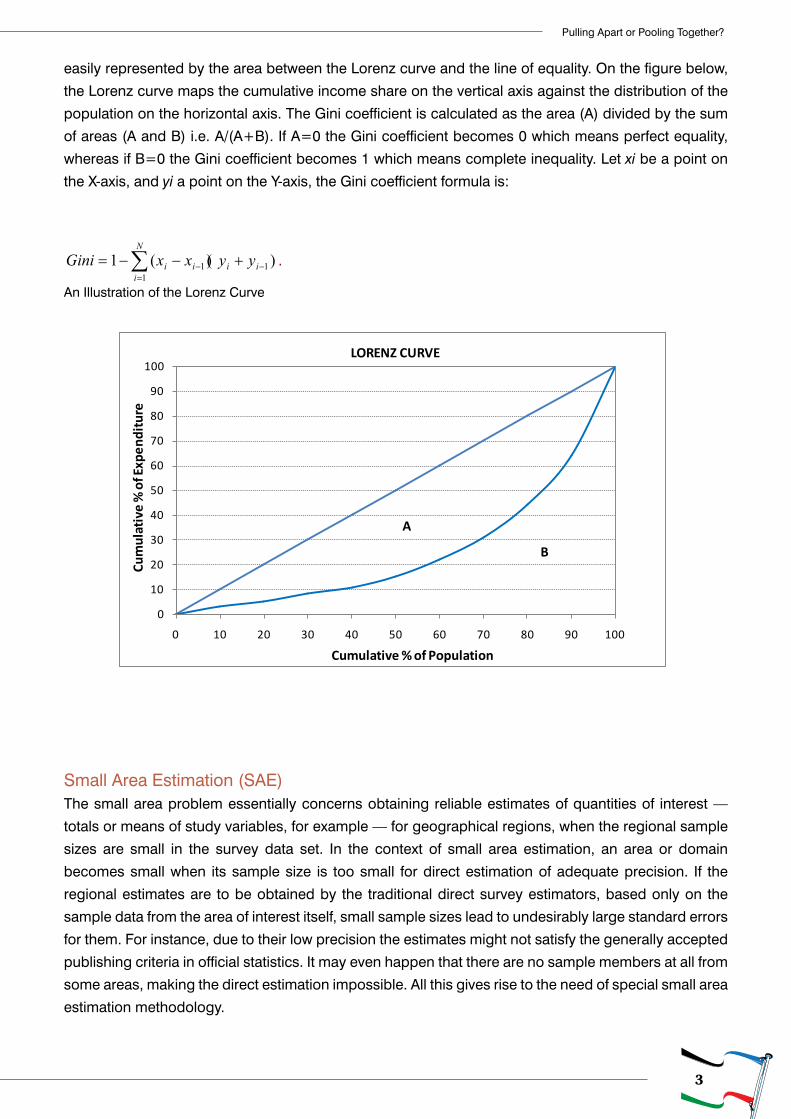
easily represented by the area between the Lorenz curve and the line of equality. On the figure below,
the Lorenz curve maps the cumulative income share on the vertical axis against the distribution of the
population on the horizontal axis. The Gini coefficient is calculated as the area (A) divided by the sum
of areas (A and B) i.e. A/(A+B). If A=0 the Gini coefficient becomes 0 which means perfect equality,
whereas if B=0 the Gini coefficient becomes 1 which means complete inequality. Let xi be a point on
the X-axis, and yi a point on the Y-axis, the Gini coefficient formula is:
∑=
−− +−−=N
iiiii yyxxGini
111 ))((1 .
An Illustration of the Lorenz Curve
0
10
20
30
40
50
60
70
80
90
100
0 10 20 30 40 50 60 70 80 90 100
LORENZ CURVE
Cum
ulat
ive
% o
f Exp
endi
ture
Cumulative % of Population
A
B
Small Area Estimation (SAE)The small area problem essentially concerns obtaining reliable estimates of quantities of interest —
totals or means of study variables, for example — for geographical regions, when the regional sample
sizes are small in the survey data set. In the context of small area estimation, an area or domain
becomes small when its sample size is too small for direct estimation of adequate precision. If the
regional estimates are to be obtained by the traditional direct survey estimators, based only on the
sample data from the area of interest itself, small sample sizes lead to undesirably large standard errors
for them. For instance, due to their low precision the estimates might not satisfy the generally accepted
publishing criteria in official statistics. It may even happen that there are no sample members at all from
some areas, making the direct estimation impossible. All this gives rise to the need of special small area
estimation methodology.
4
Exploring Kenya’s Inequality
A PUBLICATION OF KNBS AND SID
Most of KNBS surveys were designed to provide statistically reliable, design-based estimates only at
the national, provincial and district levels such as the Kenya Intergraded Household Budget Survey
of 2005/06 (KIHBS). The sheer practical difficulties and cost of implementing and conducting sample
surveys that would provide reliable estimates at levels finer than the district were generally prohibitive,
both in terms of the increased sample size required and in terms of the added burden on providers of
survey data (respondents). However through SAE and using the census and other survey datasets,
accurate small area poverty estimates for 2009 for all the counties are obtainable.
The sample in the 2005/06 KIHBS, which was a representative subset of the population, collected
detailed information regarding consumption expenditures. The survey gives poverty estimate of urban
and rural poverty at the national level, the provincial level and, albeit with less precision, at the district
level. However, the sample sizes of such household surveys preclude estimation of meaningful poverty
measures for smaller areas such as divisions, locations or wards. Data collected through censuses
are sufficiently large to provide representative measurements below the district level such as divisions,
locations and sub-locations. However, this data does not contain the detailed information on consumption
expenditures required to estimate poverty indicators. In small area estimation methodology, the first step
of the analysis involves exploring the relationship between a set of characteristics of households and
the welfare level of the same households, which has detailed information about household expenditure
and consumption. A regression equation is then estimated to explain daily per capita consumption
and expenditure of a household using a number of socio-economic variables such as household size,
education levels, housing characteristics and access to basic services.
While the census does not contain household expenditure data, it does contain these socio-economic
variables. Therefore, it will be possible to statistically impute household expenditures for the census
households by applying the socio-economic variables from the census data on the estimated
relationship based on the survey data. This will give estimates of the welfare level of all households
in the census, which in turn allows for estimation of the proportion of households that are poor and
other poverty measures for relatively small geographic areas. To determine how many people are
poor in each area, the study would then utilize the 2005/06 monetary poverty lines for rural and urban
households respectively. In terms of actual process, the following steps were undertaken:
Cluster Matching: Matching of the KIHBS clusters, which were created using the 1999 Population and
Housing Census Enumeration Areas (EA) to 2009 Population and Housing Census EAs. The purpose
was to trace the KIBHS 2005/06 clusters to the 2009 Enumeration Areas.
Zero Stage: The first step of the analysis involved finding out comparable variables from the survey
(Kenya Integrated Household Budget 2005/06) and the census (Kenya 2009 Population and Housing
Census). This required the use of the survey and census questionnaires as well as their manuals.
First Stage (Consumption Model): This stage involved the use of regression analysis to explore the
relationship between an agreed set of characteristics in the household and the consumption levels of
the same households from the survey data. The regression equation was then used to estimate and
explain daily per capita consumption and expenditure of households using socio-economic variables
5
Pulling Apart or Pooling Together?
such as household size, education levels, housing characteristics and access to basic services, and
other auxiliary variables. While the census did not contain household expenditure data, it did contain
these socio-economic variables.
Second Stage (Simulation): Analysis at this stage involved statistical imputation of household
expenditures for the census households, by applying the socio-economic variables from the census
data on the estimated relationship based on the survey data.
Identification of poor households Principal Component Analysis (PCA)In order to attain the objective of the poverty targeting in this study, the household needed to be
established. There are three principal indicators of welfare; household income; household consumption
expenditures; and household wealth. Household income is the theoretical indicator of choice of welfare/
economic status. However, it is extremely difficult to measure accurately due to the fact that many
people do not remember all the sources of their income or better still would not want to divulge this
information. Measuring consumption expenditures has many drawbacks such as the fact that household
consumption expenditures typically are obtained from recall method usually for a period of not more
than four weeks. In all cases a well planned and large scale survey is needed, which is time consuming
and costly to collect. The estimation of wealth is a difficult concept due to both the quantitative as well
as the qualitative aspects of it. It can also be difficult to compute especially when wealth is looked at as
both tangible and intangible.
Given that the three main indicators of welfare cannot be determined in a shorter time, an alternative
method that is quick is needed. The alternative approach then in measuring welfare is generally through
the asset index. In measuring the asset index, multivariate statistical procedures such the factor analysis,
discriminate analysis, cluster analysis or the principal component analysis methods are used. Principal
components analysis transforms the original set of variables into a smaller set of linear combinations
that account for most of the variance in the original set. The purpose of PCA is to determine factors (i.e.,
principal components) in order to explain as much of the total variation in the data as possible.
In this project the principal component analysis was utilized in order to generate the asset (wealth)
index for each household in the study area. The PCA can be used as an exploratory tool to investigate
patterns in the data; in identify natural groupings of the population for further analysis and; to reduce
several dimensionalities in the number of known dimensions. In generating this index information from
the datasets such as the tenure status of main dwelling units; roof, wall, and floor materials of main
dwelling; main source of water; means of human waste disposal; cooking and lighting fuels; household
items such radio TV, fridge etc was required. The recent available dataset that contains this information
for the project area is the Kenya Population and Housing Census 2009.
There are four main approaches to handling multivariate data for the construction of the asset index
in surveys and censuses. The first three may be regarded as exploratory techniques leading to index
construction. These are graphical procedures and summary measures. The two popular multivariate
procedures - cluster analysis and principal component analysis (PCA) - are two of the key procedures
that have a useful preliminary role to play in index construction and lastly regression modeling approach.
6
Exploring Kenya’s Inequality
A PUBLICATION OF KNBS AND SID
In the recent past there has been an increasing routine application of PCA to asset data in creating
welfare indices (Gwatkin et al. 2000, Filmer and Pritchett 2001 and McKenzie 2003).
Concepts and definitionsInequalityInequality is characterized by the existence of unequal opportunities or life chances and unequal
conditions such as incomes, goods and services. Inequality, usually structured and recurrent, results
into an unfair or unjust gap between individuals, groups or households relative to others within a
population. There are several methods of measuring inequality. In this study, we consider among
other methods, the Gini-coefficient, the difference in expenditure shares and access to important basic
services.
Equality and EquityAlthough the two terms are sometimes used interchangeably, they are different concepts. Equality
requires all to have same/ equal resources, while equity requires all to have the same opportunity to
access same resources, survive, develop, and reach their full potential, without discrimination, bias, or
favoritism. Equity also accepts differences that are earned fairly.
PovertyThe poverty line is a threshold below which people are deemed poor. Statistics summarizing the bottom
of the consumption distribution (i.e. those that fall below the poverty line) are therefore provided. In
2005/06, the poverty line was estimated at Ksh1,562 and Ksh2,913 per adult equivalent1 per month
for rural and urban households respectively. Nationally, 45.2 percent of the population lives below the
poverty line (2009 estimates) down from 46 percent in 2005/06.
Spatial DimensionsThe reason poverty can be considered a spatial issue is two-fold. People of a similar socio-economic
background tend to live in the same areas because the amount of money a person makes usually, but
not always, influences their decision as to where to purchase or rent a home. At the same time, the area
in which a person is born or lives can determine the level of access to opportunities like education and
employment because income and education can influence settlement patterns and also be influenced
by settlement patterns. They can therefore be considered causes and effects of spatial inequality and
poverty.
EmploymentAccess to jobs is essential for overcoming inequality and reducing poverty. People who cannot access
productive work are unable to generate an income sufficient to cover their basic needs and those of
their families, or to accumulate savings to protect their households from the vicissitudes of the economy. 1This is basically the idea that every person needs different levels of consumption because of their age, gender, height, weight, etc. and therefore we take this into account to create an adult equivalent based on the average needs of the different populations
7
Pulling Apart or Pooling Together?
The unemployed are therefore among the most vulnerable in society and are prone to poverty. Levels
and patterns of employment and wages are also significant in determining degrees of poverty and
inequality. Macroeconomic policy needs to emphasize the need for increasing regular good quality
‘work for pay’ that is covered by basic labour protection. The population and housing census 2009
included questions on labour and employment for the population aged 15-64.
The census, not being a labour survey, only had few categories of occupation which included work
for pay, family business, family agricultural holdings, intern/volunteer, retired/home maker, full time
student, incapacitated and no work. The tabulation was nested with education- for none, primary and
secondary level.
EducationEducation is typically seen as a means of improving people’s welfare. Studies indicate that inequality
declines as the average level of educational attainment increases, with secondary education producing
the greatest payoff, especially for women (Cornia and Court, 2001). There is considerable evidence
that even in settings where people are deprived of other essential services like sanitation or clean
water, children of educated mothers have much better prospects of survival than do the children of
uneducated mothers. Education is therefore typically viewed as a powerful factor in leveling the field of
opportunity as it provides individuals with the capacity to obtain a higher income and standard of living.
By learning to read and write and acquiring technical or professional skills, people increase their chances
of obtaining decent, better-paying jobs. Education however can also represent a medium through
which the worst forms of social stratification and segmentation are created. Inequalities in quality and
access to education often translate into differentials in employment, occupation, income, residence and
social class. These disparities are prevalent and tend to be determined by socio-economic and family
background. Because such disparities are typically transmitted from generation to generation, access
to educational and employment opportunities are to a certain degree inherited, with segments of the
population systematically suffering exclusion. The importance of equal access to a well-functioning
education system, particularly in relation to reducing inequalities, cannot be overemphasized.
WaterAccording to UNICEF (2008), over 1.1 billion people lack access to an improved water source and over
three million people, mostly children, die annually from water-related diseases. Water quality refers
to the basic and physical characteristics of water that determines its suitability for life or for human
uses. The quality of water has tremendous effects on human health both in the short term and in the
long term. As indicated in this report, slightly over half of Kenya’s population has access to improved
sources of water.
SanitationSanitation refers to the principles and practices relating to the collection, removal or disposal of human
excreta, household waste, water and refuse as they impact upon people and the environment. Decent
sanitation includes appropriate hygiene awareness and behavior as well as acceptable, affordable and
8
Exploring Kenya’s Inequality
A PUBLICATION OF KNBS AND SID
sustainable sanitation services which is crucial for the health and wellbeing of people. Lack of access
to safe human waste disposal facilities leads to higher costs to the community through pollution of
rivers, ground water and higher incidence of air and water borne diseases. Other costs include reduced
incomes as a result of disease and lower educational outcomes.
Nationally, 61 percent of the population has access to improved methods of waste disposal. A sizeable
population i.e. 39 percent of the population is disadvantaged. Investments made in the provision of
safe water supplies need to be commensurate with investments in safe waste disposal and hygiene
promotion to have significant impact.
Housing Conditions (Roof, Wall and Floor)Housing conditions are an indicator of the degree to which people live in humane conditions. Materials
used in the construction of the floor, roof and wall materials of a dwelling unit are also indicative of the
extent to which they protect occupants from the elements and other environmental hazards. Housing
conditions have implications for provision of other services such as connections to water supply,
electricity, and waste disposal. They also determine the safety, health and well being of the occupants.
Low provision of these essential services leads to higher incidence of diseases, fewer opportunities
for business services and lack of a conducive environment for learning. It is important to note that
availability of materials, costs, weather and cultural conditions have a major influence on the type of
materials used.
Energy fuel for cooking and lightingLack of access to clean sources of energy is a major impediment to development through health related
complications such as increased respiratory infections and air pollution. The type of cooking fuel or
lighting fuel used by households is related to the socio-economic status of households. High level
energy sources are cleaner but cost more and are used by households with higher levels of income
compared with primitive sources of fuel like firewood which are mainly used by households with a lower
socio-economic profile. Globally about 2.5 billion people rely on biomass such as fuel-wood, charcoal,
agricultural waste and animal dung to meet their energy needs for cooking.

9
Pulling Apart or Pooling Together?
Kilifi County
10
Exploring Kenya’s Inequality
A PUBLICATION OF KNBS AND SID
Kilifi County
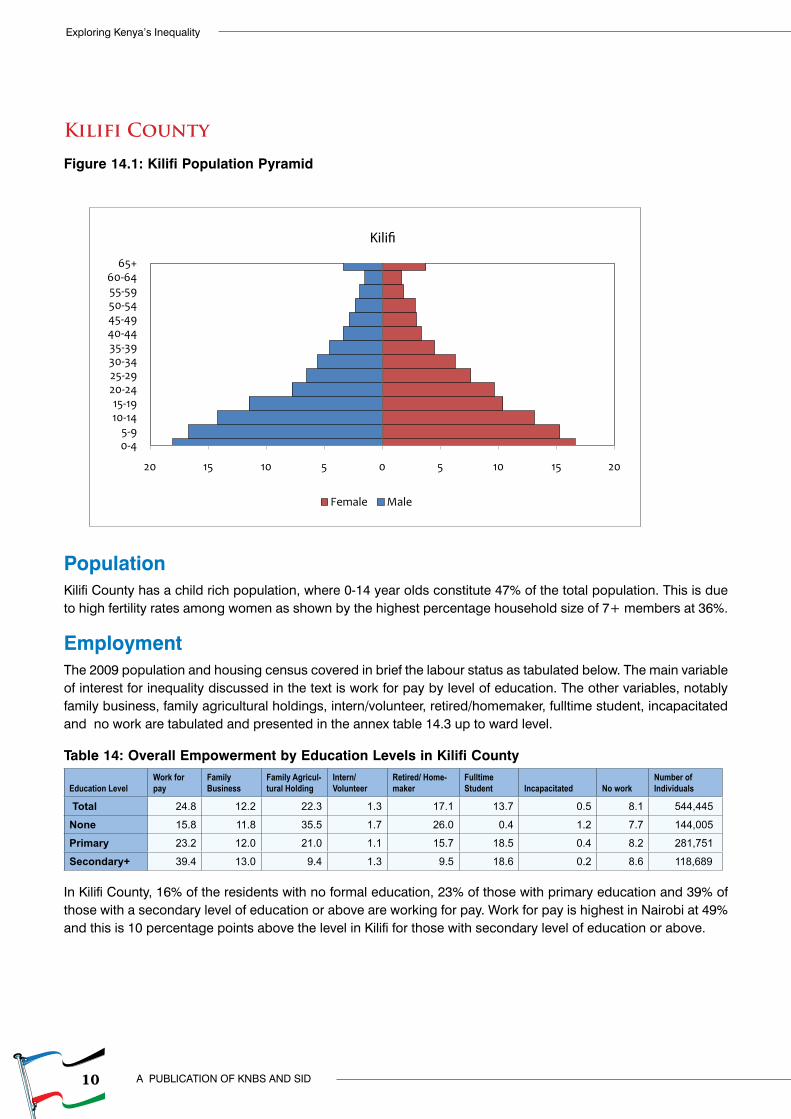
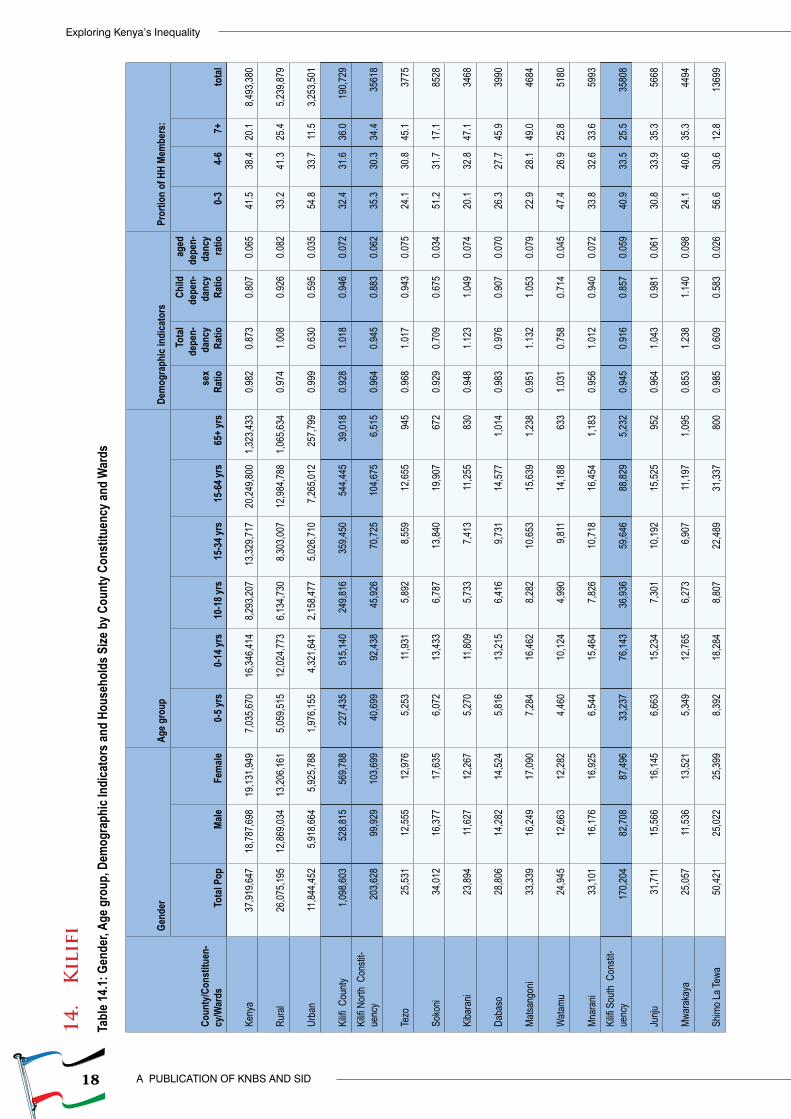
Figure 14.1: Kilifi Population Pyramid
PopulationKilifi County has a child rich population, where 0-14 year olds constitute 47% of the total population. This is due to high fertility rates among women as shown by the highest percentage household size of 7+ members at 36%.
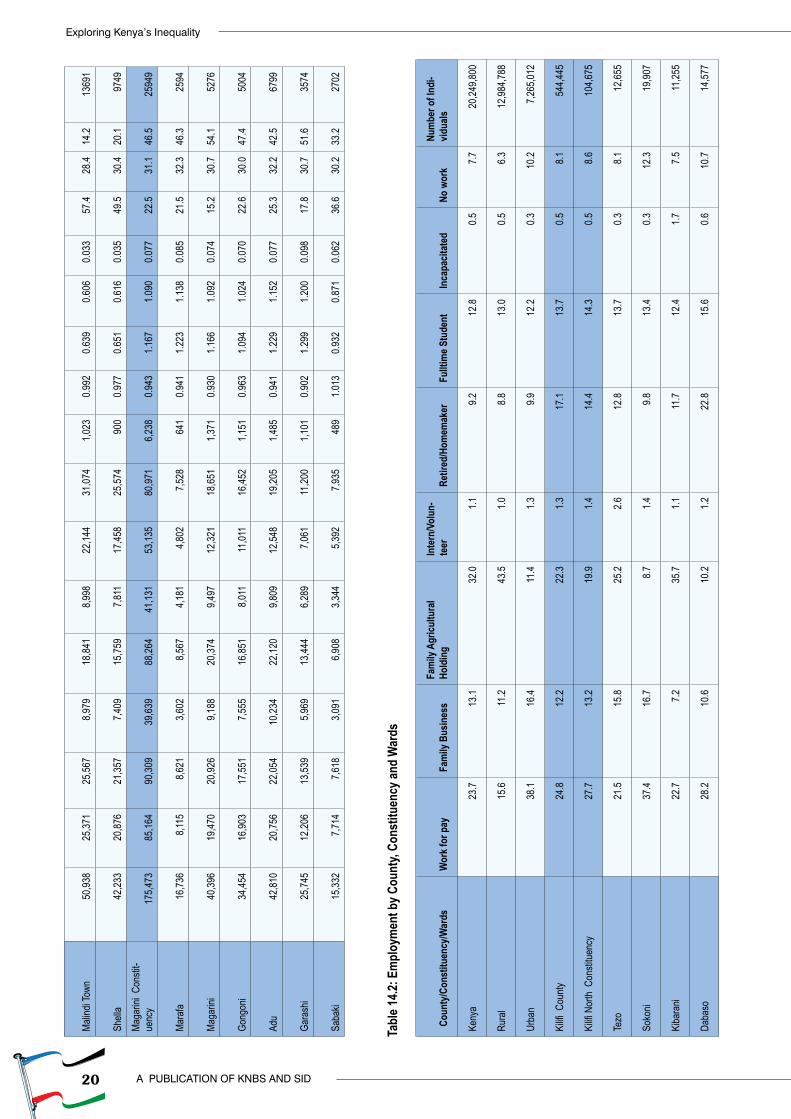
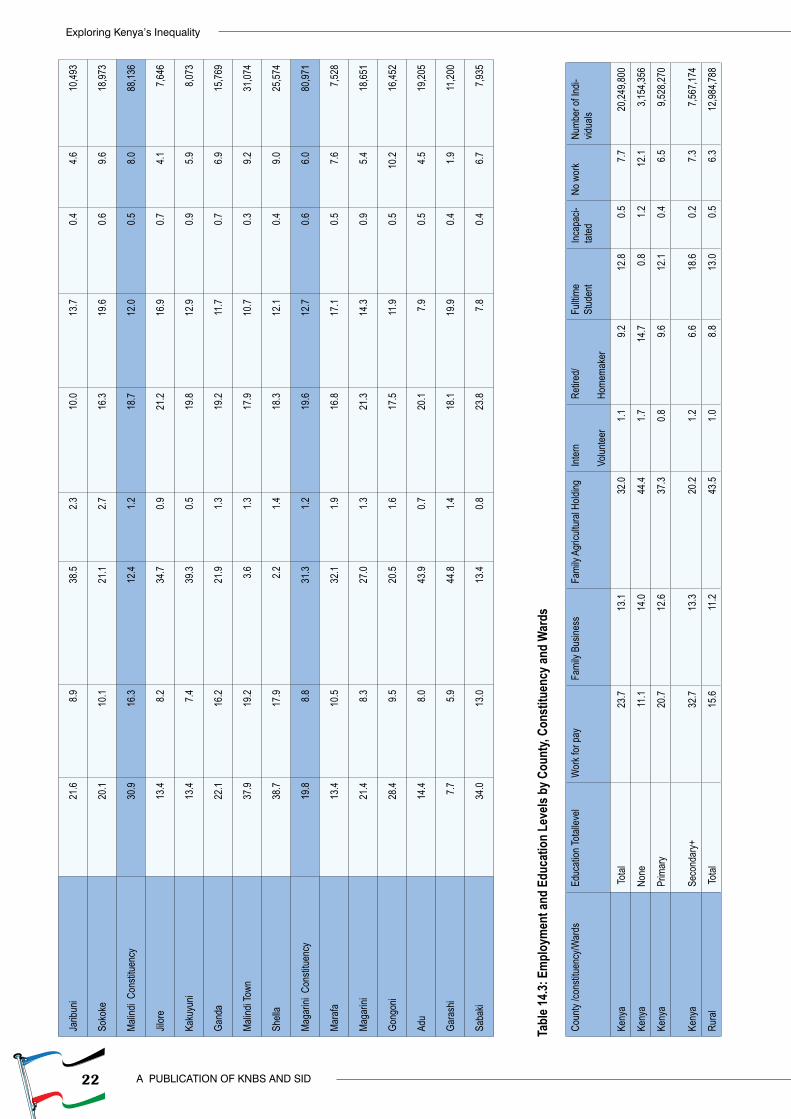
Employment The 2009 population and housing census covered in brief the labour status as tabulated below. The main variable of interest for inequality discussed in the text is work for pay by level of education. The other variables, notably family business, family agricultural holdings, intern/volunteer, retired/homemaker, fulltime student, incapacitated and no work are tabulated and presented in the annex table 14.3 up to ward level.
Table 14: Overall Empowerment by Education Levels in Kilifi County
Education LevelWork for pay
Family Business
Family Agricul-tural Holding
Intern/ Volunteer
Retired/ Home-maker
Fulltime Student Incapacitated No work
Number of Individuals
Total 24.8 12.2 22.3 1.3 17.1 13.7 0.5 8.1 544,445
None 15.8 11.8 35.5 1.7 26.0 0.4 1.2 7.7 144,005
Primary 23.2 12.0 21.0 1.1 15.7 18.5 0.4 8.2 281,751
Secondary+ 39.4 13.0 9.4 1.3 9.5 18.6 0.2 8.6 118,689
In Kilifi County, 16% of the residents with no formal education, 23% of those with primary education and 39% of those with a secondary level of education or above are working for pay. Work for pay is highest in Nairobi at 49% and this is 10 percentage points above the level in Kilifi for those with secondary level of education or above.
20 15 10 5 0 5 10 15 20
0-45-9
10-1415-19
20-2425-2930-3435-3940-4445-4950-5455-5960-64
65+
Female Male
Kilifi
11
Pulling Apart or Pooling Together?
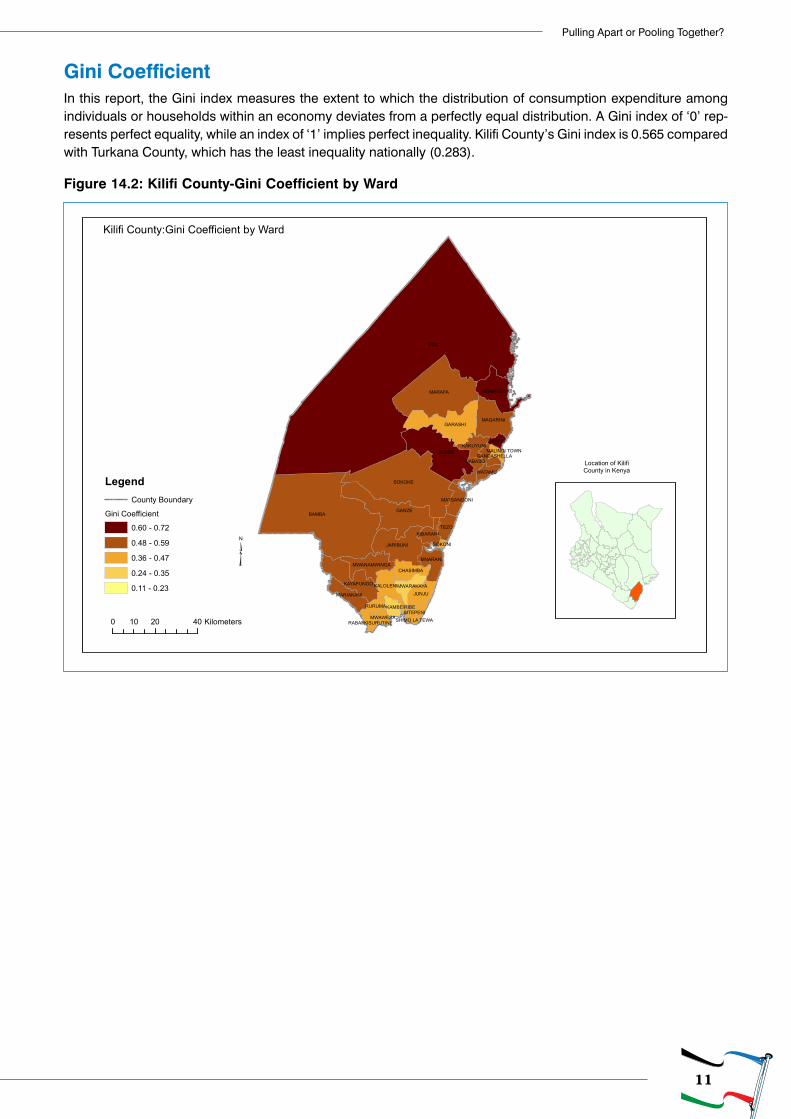
Gini Coefficient In this report, the Gini index measures the extent to which the distribution of consumption expenditure among individuals or households within an economy deviates from a perfectly equal distribution. A Gini index of ‘0’ rep-resents perfect equality, while an index of ‘1’ implies perfect inequality. Kilifi County’s Gini index is 0.565 compared with Turkana County, which has the least inequality nationally (0.283).
Figure 14.2: Kilifi County-Gini Coefficient by Ward
ADU
BAMBA
SOKOKE
MARAFA
JILORE
GANZE
GARASHI
JARIBUNI
MAGARINI
GONGONI
JUNJU
TEZO
MNARANIMWANAMWINGA
CHASIMBA
KAYAFUNGO KALOLENI
MARIAKANI
DABASO
KAKUYUNI
KIBARANI
GANDA
MTEPENI
MWARAKAYA
WATAMU
MATSANGONI
RURUMA
SABAKI
KAMBE/RIBE
MWAWESARABAI/KISURUTINI
SHELLA
SOKONI
MALINDI TOWN
SHIMO LA TEWA
³
0 20 4010 Kilometers
Location of KilifiCounty in Kenya
Kilifi County:Gini Coefficient by Ward
Legend
Gini Coefficient
0.60 - 0.72
0.48 - 0.59
0.36 - 0.47
0.24 - 0.35
0.11 - 0.23
County Boundary
12
Exploring Kenya’s Inequality
A PUBLICATION OF KNBS AND SID
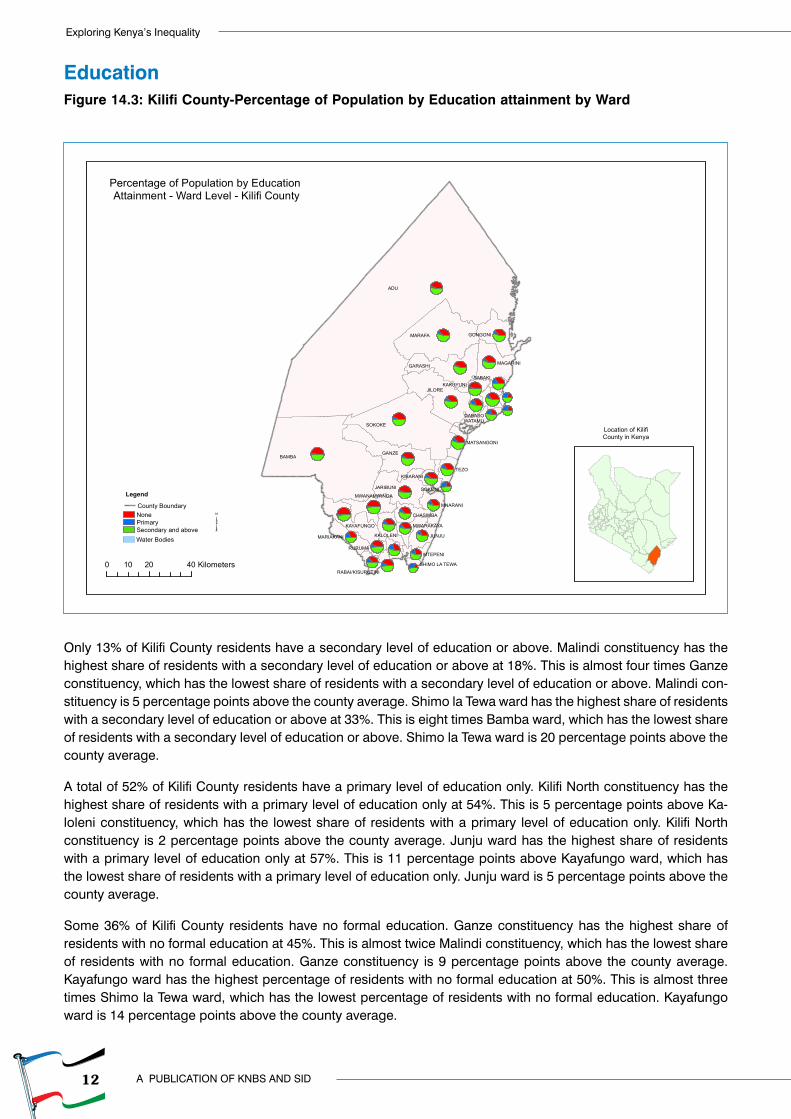
EducationFigure 14.3: Kilifi County-Percentage of Population by Education attainment by Ward
ADU
BAMBA
SOKOKE
MARAFA
JILORE
GANZE
GARASHI
JARIBUNI
MAGARINI
GONGONI
KAYAFUNGO
JUNJU
TEZO
MNARANI
KALOLENIMARIAKANI
MWANAMWINGA
CHASIMBA
DABASO
KAKUYUNI
KIBARANI
MTEPENI
MWARAKAYA
WATAMU
MATSANGONI
RURUMA
SABAKI
RABAI/KISURUTINI
SOKONI
SHIMO LA TEWA
³
Location of KilifiCounty in Kenya
Percentage of Population by Education Attainment - Ward Level - Kilifi County
Legend
NonePrimary
County Boundary
Secondary and aboveWater Bodies
0 20 4010 Kilometers
Only 13% of Kilifi County residents have a secondary level of education or above. Malindi constituency has the highest share of residents with a secondary level of education or above at 18%. This is almost four times Ganze constituency, which has the lowest share of residents with a secondary level of education or above. Malindi con-stituency is 5 percentage points above the county average. Shimo la Tewa ward has the highest share of residents with a secondary level of education or above at 33%. This is eight times Bamba ward, which has the lowest share of residents with a secondary level of education or above. Shimo la Tewa ward is 20 percentage points above the county average.
A total of 52% of Kilifi County residents have a primary level of education only. Kilifi North constituency has the highest share of residents with a primary level of education only at 54%. This is 5 percentage points above Ka-loleni constituency, which has the lowest share of residents with a primary level of education only. Kilifi North constituency is 2 percentage points above the county average. Junju ward has the highest share of residents with a primary level of education only at 57%. This is 11 percentage points above Kayafungo ward, which has the lowest share of residents with a primary level of education only. Junju ward is 5 percentage points above the county average.
Some 36% of Kilifi County residents have no formal education. Ganze constituency has the highest share of residents with no formal education at 45%. This is almost twice Malindi constituency, which has the lowest share of residents with no formal education. Ganze constituency is 9 percentage points above the county average. Kayafungo ward has the highest percentage of residents with no formal education at 50%. This is almost three times Shimo la Tewa ward, which has the lowest percentage of residents with no formal education. Kayafungo ward is 14 percentage points above the county average.
13
Pulling Apart or Pooling Together?
EnergyCooking Fuel
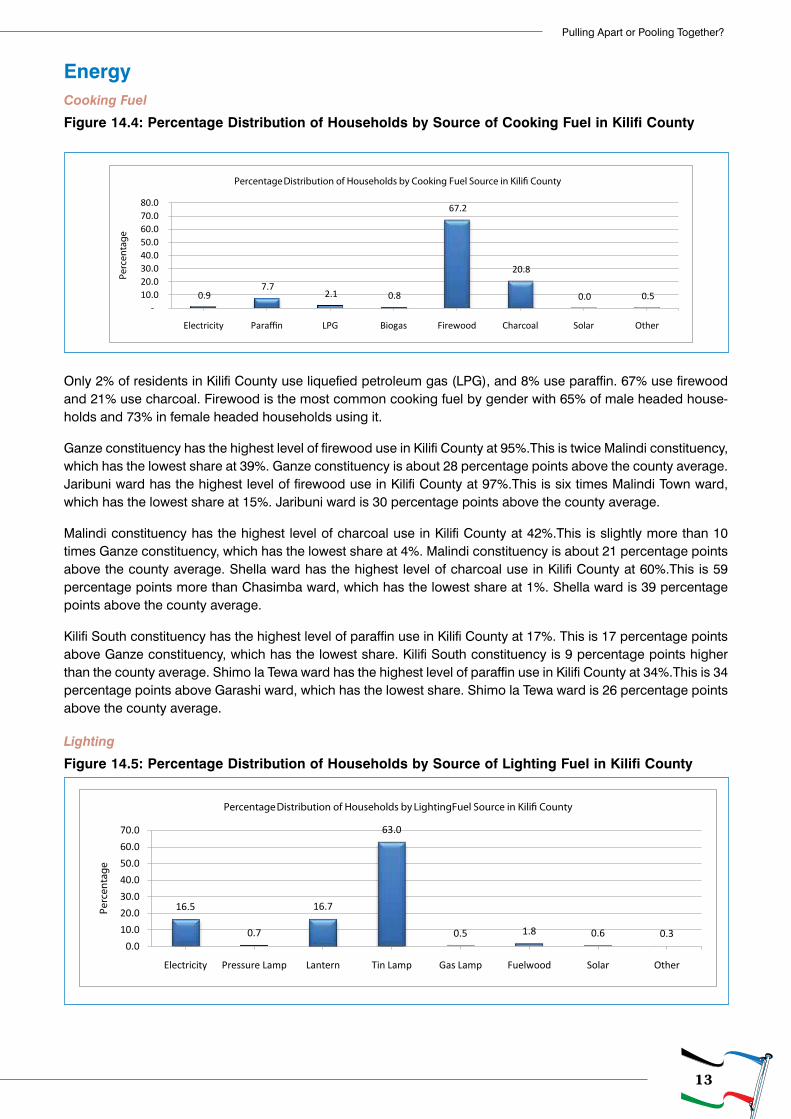
Figure 14.4: Percentage Distribution of Households by Source of Cooking Fuel in Kilifi County
Only 2% of residents in Kilifi County use liquefied petroleum gas (LPG), and 8% use paraffin. 67% use firewood and 21% use charcoal. Firewood is the most common cooking fuel by gender with 65% of male headed house-holds and 73% in female headed households using it.
Ganze constituency has the highest level of firewood use in Kilifi County at 95%.This is twice Malindi constituency, which has the lowest share at 39%. Ganze constituency is about 28 percentage points above the county average. Jaribuni ward has the highest level of firewood use in Kilifi County at 97%.This is six times Malindi Town ward, which has the lowest share at 15%. Jaribuni ward is 30 percentage points above the county average.
Malindi constituency has the highest level of charcoal use in Kilifi County at 42%.This is slightly more than 10 times Ganze constituency, which has the lowest share at 4%. Malindi constituency is about 21 percentage points above the county average. Shella ward has the highest level of charcoal use in Kilifi County at 60%.This is 59 percentage points more than Chasimba ward, which has the lowest share at 1%. Shella ward is 39 percentage points above the county average.
Kilifi South constituency has the highest level of paraffin use in Kilifi County at 17%. This is 17 percentage points above Ganze constituency, which has the lowest share. Kilifi South constituency is 9 percentage points higher than the county average. Shimo la Tewa ward has the highest level of paraffin use in Kilifi County at 34%.This is 34 percentage points above Garashi ward, which has the lowest share. Shimo la Tewa ward is 26 percentage points above the county average.
Lighting
Figure 14.5: Percentage Distribution of Households by Source of Lighting Fuel in Kilifi County
0.9 7.7
2.1 0.8
67.2
20.8
0.0 0.5 -
10.0 20.0 30.0 40.0 50.0 60.0 70.0 80.0
Electricity Paraffin LPG Biogas Firewood Charcoal Solar Other
Perc
enta
ge
Percentage Distribution of Households by Cooking Fuel Source in Kilifi County
16.5
0.7
16.7
63.0
0.5 1.8 0.6 0.30.0
10.020.030.040.050.060.070.0
Electricity Pressure Lamp Lantern Tin Lamp Gas Lamp Fuelwood Solar Other
Perc
enta
ge
Percentage Distribution of Households by LightingFuel Source in Kilifi County
14
Exploring Kenya’s Inequality
A PUBLICATION OF KNBS AND SID
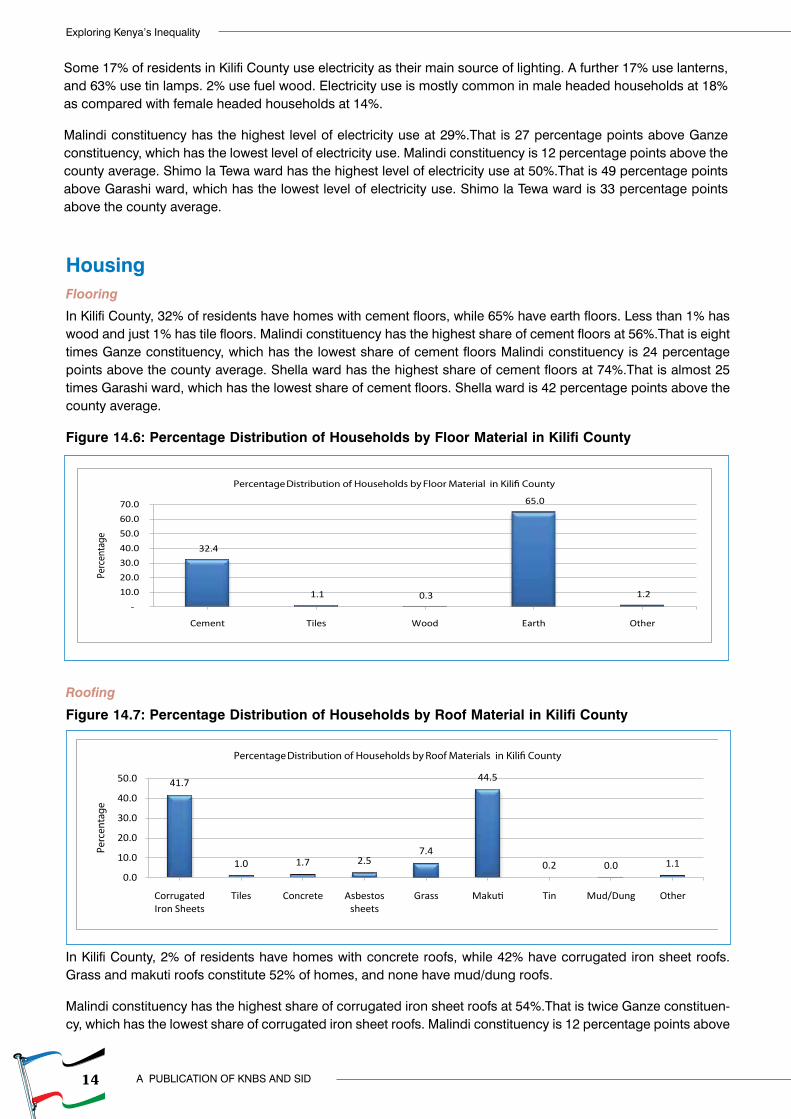
HousingFlooring
In Kilifi County, 32% of residents have homes with cement floors, while 65% have earth floors. Less than 1% has wood and just 1% has tile floors. Malindi constituency has the highest share of cement floors at 56%.That is eight times Ganze constituency, which has the lowest share of cement floors Malindi constituency is 24 percentage points above the county average. Shella ward has the highest share of cement floors at 74%.That is almost 25 times Garashi ward, which has the lowest share of cement floors. Shella ward is 42 percentage points above the county average.
Figure 14.6: Percentage Distribution of Households by Floor Material in Kilifi County
Roofing
Figure 14.7: Percentage Distribution of Households by Roof Material in Kilifi County
In Kilifi County, 2% of residents have homes with concrete roofs, while 42% have corrugated iron sheet roofs. Grass and makuti roofs constitute 52% of homes, and none have mud/dung roofs.
Malindi constituency has the highest share of corrugated iron sheet roofs at 54%.That is twice Ganze constituen-cy, which has the lowest share of corrugated iron sheet roofs. Malindi constituency is 12 percentage points above
41.7
1.0 1.7 2.57.4
44.5
0.2 0.0 1.10.0
10.0
20.0
30.0
40.0
50.0
Corrugated Iron Sheets
Tiles Concrete Asbestos sheets
Grass Makuti Tin Mud/Dung Other
Perc
enta
ge
Percentage Distribution of Households by Roof Materials in Kilifi County
Some 17% of residents in Kilifi County use electricity as their main source of lighting. A further 17% use lanterns, and 63% use tin lamps. 2% use fuel wood. Electricity use is mostly common in male headed households at 18% as compared with female headed households at 14%.
Malindi constituency has the highest level of electricity use at 29%.That is 27 percentage points above Ganze constituency, which has the lowest level of electricity use. Malindi constituency is 12 percentage points above the county average. Shimo la Tewa ward has the highest level of electricity use at 50%.That is 49 percentage points above Garashi ward, which has the lowest level of electricity use. Shimo la Tewa ward is 33 percentage points above the county average.
32.4
1.1 0.3
65.0
1.2 -
10.0 20.0 30.0 40.0 50.0 60.0 70.0
Cement Tiles Wood Earth Other
Perc
enta
ge
Percentage Distribution of Households by Floor Material in Kilifi County
15
Pulling Apart or Pooling Together?
the county average. Mariakani ward has the highest share of corrugated iron sheet roofs at 85%.That is almost six times Matsangoni ward, which has the lowest share of corrugated iron sheet roofs. Mariakani ward is 43 percent-age points above the county average.
Ganze constituency has the highest share of grass/makuti roofs at 74%.That is twice Malindi constituency, which has the lowest share of grass/makuti roofs. Ganze constituency is 22 percentage points above the county av-erage. Matsangoni ward has the highest share of grass/makuti roofs at 83%. This is nine times Mariakani ward, which has the lowest share. Matsangoni ward is 31 percentage points above the county average.
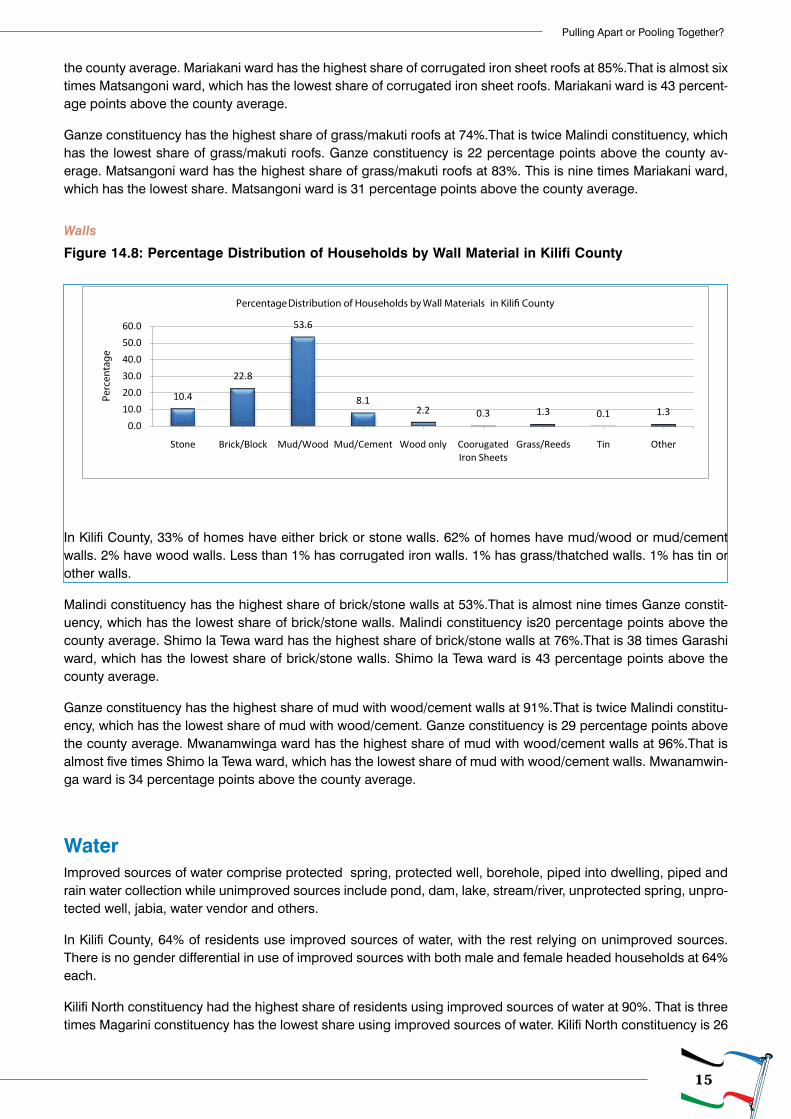
Walls
Figure 14.8: Percentage Distribution of Households by Wall Material in Kilifi County
In Kilifi County, 33% of homes have either brick or stone walls. 62% of homes have mud/wood or mud/cement walls. 2% have wood walls. Less than 1% has corrugated iron walls. 1% has grass/thatched walls. 1% has tin or other walls.
Malindi constituency has the highest share of brick/stone walls at 53%.That is almost nine times Ganze constit-uency, which has the lowest share of brick/stone walls. Malindi constituency is20 percentage points above the county average. Shimo la Tewa ward has the highest share of brick/stone walls at 76%.That is 38 times Garashi ward, which has the lowest share of brick/stone walls. Shimo la Tewa ward is 43 percentage points above the county average.
Ganze constituency has the highest share of mud with wood/cement walls at 91%.That is twice Malindi constitu-ency, which has the lowest share of mud with wood/cement. Ganze constituency is 29 percentage points above the county average. Mwanamwinga ward has the highest share of mud with wood/cement walls at 96%.That is almost five times Shimo la Tewa ward, which has the lowest share of mud with wood/cement walls. Mwanamwin-ga ward is 34 percentage points above the county average.
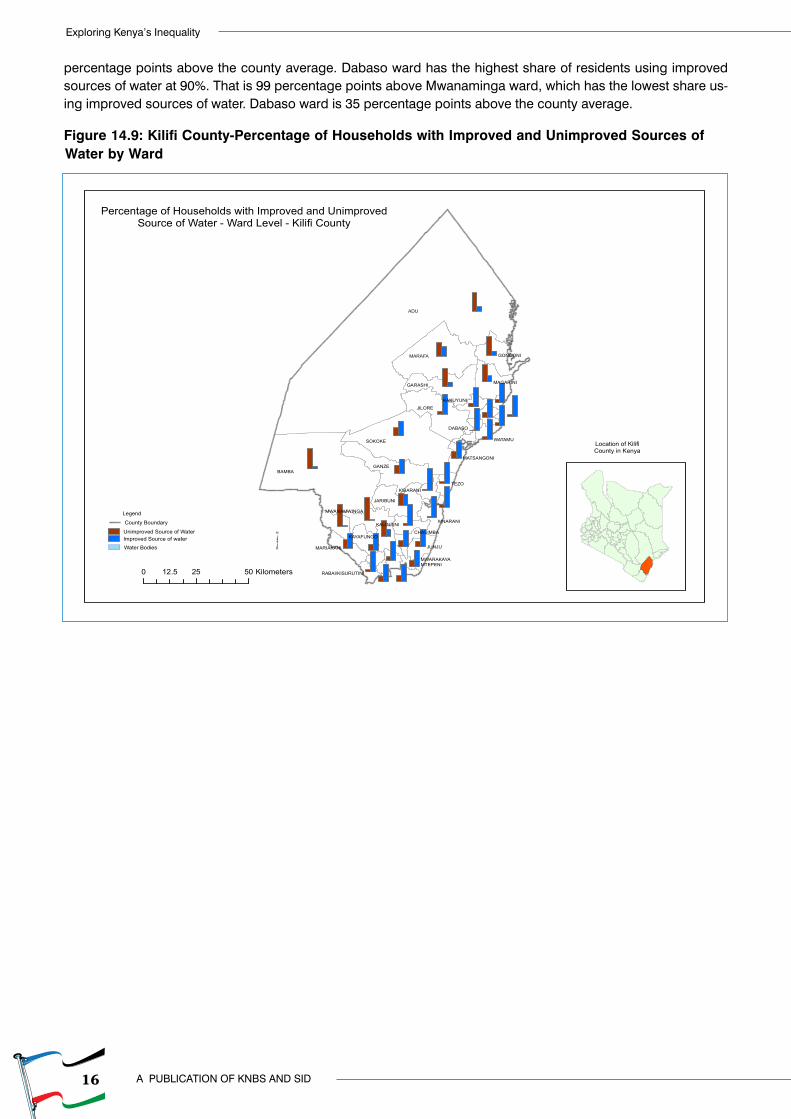
WaterImproved sources of water comprise protected spring, protected well, borehole, piped into dwelling, piped and rain water collection while unimproved sources include pond, dam, lake, stream/river, unprotected spring, unpro-tected well, jabia, water vendor and others.
In Kilifi County, 64% of residents use improved sources of water, with the rest relying on unimproved sources. There is no gender differential in use of improved sources with both male and female headed households at 64% each.
Kilifi North constituency had the highest share of residents using improved sources of water at 90%. That is three times Magarini constituency has the lowest share using improved sources of water. Kilifi North constituency is 26
10.4
22.8
53.6
8.12.2 0.3 1.3 0.1 1.3
0.010.020.030.040.050.060.0
Stone Brick/Block Mud/Wood Mud/Cement Wood only Coorugated Iron Sheets
Grass/Reeds Tin Other
Perc
enta
ge
Percentage Distribution of Households by Wall Materials in Kilifi County
16
Exploring Kenya’s Inequality
A PUBLICATION OF KNBS AND SID
ADU
BAMBA
SOKOKE
MARAFA
JILORE
GANZE
GARASHI
JARIBUNI
MAGARINI
GONGONI
KAYAFUNGO
JUNJU
TEZO
MNARANIKALOLENI
MARIAKANI
MWANAMWINGA
CHASIMBA
DABASO
KAKUYUNI
KIBARANI
MTEPENIMWARAKAYA
WATAMU
MATSANGONI
RABAI/KISURUTINI
³
Percentage of Households with Improved and UnimprovedSource of Water - Ward Level - Kilifi County
Location of KilifiCounty in Kenya
0 25 5012.5 Kilometers
Legend
Unimproved Source of WaterImproved Source of waterWater Bodies
County Boundary
percentage points above the county average. Dabaso ward has the highest share of residents using improved sources of water at 90%. That is 99 percentage points above Mwanaminga ward, which has the lowest share us-ing improved sources of water. Dabaso ward is 35 percentage points above the county average.
Figure 14.9: Kilifi County-Percentage of Households with Improved and Unimproved Sources of Water by Ward
17
Pulling Apart or Pooling Together?
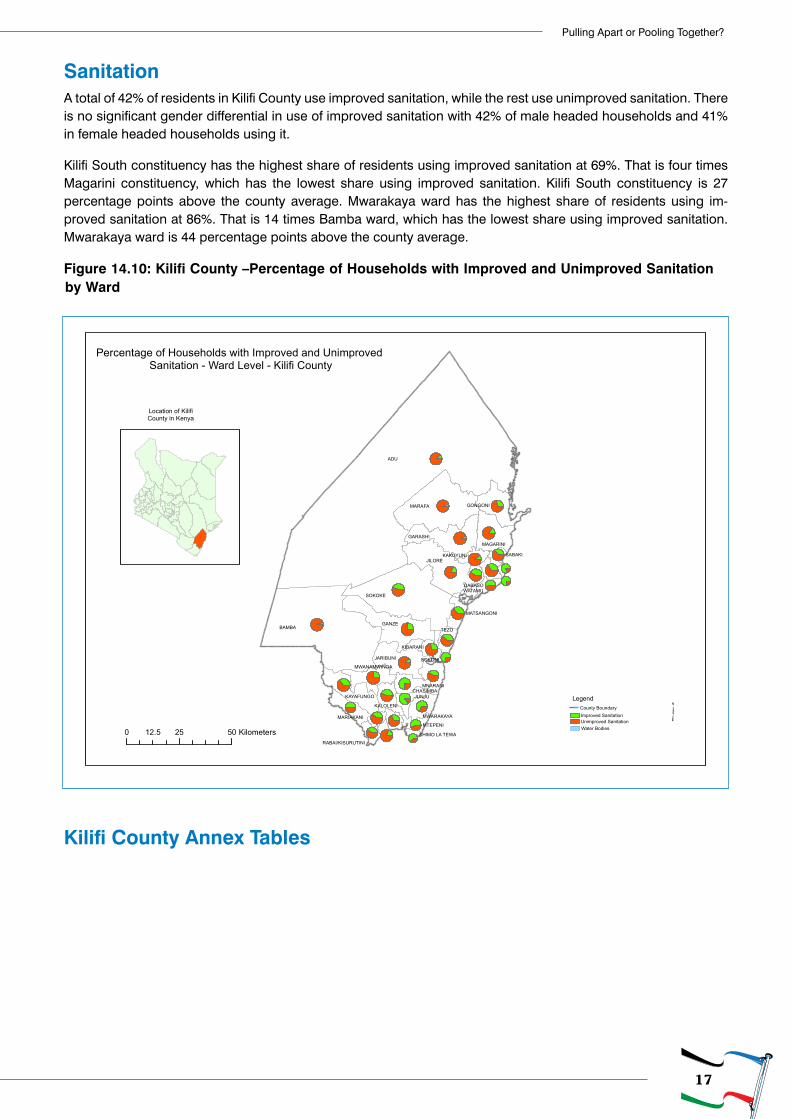
SanitationA total of 42% of residents in Kilifi County use improved sanitation, while the rest use unimproved sanitation. There is no significant gender differential in use of improved sanitation with 42% of male headed households and 41% in female headed households using it.
Kilifi South constituency has the highest share of residents using improved sanitation at 69%. That is four times Magarini constituency, which has the lowest share using improved sanitation. Kilifi South constituency is 27 percentage points above the county average. Mwarakaya ward has the highest share of residents using im-proved sanitation at 86%. That is 14 times Bamba ward, which has the lowest share using improved sanitation. Mwarakaya ward is 44 percentage points above the county average.
Figure 14.10: Kilifi County –Percentage of Households with Improved and Unimproved Sanitation by Ward
Kilifi County Annex Tables
ADU
BAMBA
SOKOKE
MARAFA
JILORE
GANZE
GARASHI
JARIBUNI
MAGARINI
GONGONI
KAYAFUNGO JUNJU
TEZO
MNARANI
KALOLENI
MARIAKANI
MWANAMWINGA
CHASIMBA
DABASO
KAKUYUNI
KIBARANI
MTEPENI
MWARAKAYA
WATAMU
MATSANGONI
SABAKI
RABAI/KISURUTINI
SOKONI
SHIMO LA TEWA
³
Percentage of Households with Improved and Unimproved Sanitation - Ward Level - Kilifi County
Legend
Improved SanitationUnimproved SanitationWater Bodies
County Boundary
Location of KilifiCounty in Kenya
0 25 5012.5 Kilometers
18
Exploring Kenya’s Inequality
A PUBLICATION OF KNBS AND SID
14.
Kil
ifi
Tabl
e 14.1
: Gen
der, A
ge g
roup
, Dem
ogra
phic
Indi
cato
rs an
d Ho
useh
olds
Size
by C
ount
y Con
stitu
ency
and
War
ds
Coun
ty/C
onst
ituen
-cy
/War
ds
Gend
erAg
e gro
upDe
mog
raph
ic in
dica
tors
Pror
tion
of H
H Me
mbe
rs:
Tota
l Pop
Male
Fem
ale0-
5 yrs
0-14
yrs
10-1
8 yrs
15-3
4 yrs
15-6
4 yrs
65+ y
rsse
x Ra
tio
Tota
l de
pen-
danc
y Ra
tio
Child
de
pen-
danc
y Ra
tio
aged
de
pen-
danc
y ra
tio0-
3 4-
6 7+
to
tal
Keny
a
37,91
9,647
18
,787,6
98
19,13
1,949
7,0
35,67
0
16,34
6,414
8,2
93,20
7
13
,329,7
17
20,24
9,800
1,3
23,43
3
0.982
0.873
0.807
0.065
41
.5
38.4
20
.1
8,4
93,38
0
Rura
l
26,07
5,195
12
,869,0
34
13,20
6,161
5,0
59,51
5
12,02
4,773
6,1
34,73
0
8,303
,007
12,98
4,788
1,0
65,63
4
0.974
1.008
0.926
0.082
33
.2
41.3
25
.4
5,2
39,87
9
Urba
n
11,84
4,452
5,9
18,66
4
5,9
25,78
8
1,9
76,15
5
4,3
21,64
1
2,1
58,47
7
5,026
,710
7,265
,012
257,7
99
0.9
99
0.6
30
0.5
95
0.0
35
54.8
33.7
11
.5
3,2
53,50
1
Kilifi
Cou
nty
1,098
,603
528,8
15
569,7
88
22
7,435
515
,140
249,8
16
35
9,450
54
4,445
39
,018
0.9
28
1.0
18
0.9
46
0.0
72
32.4
31
.6
36.0
19
0,729
Ki
lifi N
orth
Con
stit-
uenc
y
203
,628
99
,929
103,6
99
4
0,699
92
,438
45,92
6
70,72
5
10
4,675
6,5
15
0.9
64
0.9
45
0.8
83
0.0
62
35.3
30
.3
34.4
3561
8
Tezo
25,53
1
12,55
5
12,97
6
5,
253
11,93
1
5,892
8,5
59
12
,655
94
5
0.968
1.017
0.943
0.075
24
.1
30.8
45
.1 37
75
Soko
ni
34
,012
16
,377
17
,635
6,07
2
13
,433
6,7
87
13
,840
19
,907
67
2
0.929
0.709
0.675
0.034
51
.2
31.7
17
.1 85
28
Kiba
rani
23,89
4
11,62
7
12,26
7
5,
270
11,80
9
5,733
7,4
13
11
,255
83
0
0.948
1.123
1.049
0.074
20
.1
32.8
47
.1 34
68
Daba
so
28
,806
14
,282
14
,524
5,81
6
13
,215
6,4
16
9,731
14,57
7
1,0
14
0.9
83
0.9
76
0.9
07
0.0
70
26.3
27
.7
45.9
3990
Matsa
ngon
i
33
,339
16
,249
17
,090
7,28
4
16
,462
8,2
82
10
,653
15
,639
1,238
0.951
1.132
1.053
0.079
22
.9
28.1
49
.0 46
84
Wata
mu
24
,945
12
,663
12
,282
4,46
0
10
,124
4,9
90
9,811
14,18
8
633
1.0
31
0.7
58
0.7
14
0.0
45
47.4
26
.9
25.8
5180
Mnar
ani
33,10
1
16,17
6
16,92
5
6,
544
15,46
4
7,826
10,71
8
16,45
4
1,1
83
0.9
56
1.0
12
0.9
40
0.0
72
33.8
32
.6
33.6
5993
Kilifi
Sou
th C
onsti
t-ue
ncy
1
70,20
4
82,70
8
87,49
6
33,2
37
76,14
3
36
,936
59
,646
88
,829
5,232
0.945
0.916
0.857
0.059
40
.9
33.5
25
.5 35
808
Junju
31,71
1
15,56
6
16,14
5
6,
663
15,23
4
7,301
10,19
2
15,52
5
952
0.9
64
1.0
43
0.9
81
0.0
61
30.8
33
.9
35.3
5668
Mwar
akay
a
25
,057
11
,536
13
,521
5,34
9
12
,765
6,2
73
6,907
11,19
7
1,0
95
0.8
53
1.2
38
1.1
40
0.0
98
24.1
40
.6
35.3
4494
Shim
o La T
ewa
50,42
1
25,02
2
25,39
9
8,
392
18,28
4
8,807
22,48
9
31,33
7
800
0.9
85
0.6
09
0.5
83
0.0
26
56.6
30
.6
12.8
1369
9
19
Pulling Apart or Pooling Together?
Chas
imba
29,28
4
13,70
7
15,57
7
6,
395
15,13
7
7,338
7,8
64
12
,774
1,373
0.880
1.292
1.185
0.107
24
.3
36.3
39
.4 50
42
Mtep
eni
33,73
1
16,87
7
16,85
4
6,
438
14,72
3
7,217
12,19
4
17,99
6
1,0
12
1.0
01
0.8
74
0.8
18
0.0
56
41.3
32
.3
26.4
6905
Kalol
eni C
onsti
tu-en
cy
154
,285
72
,890
81
,395
3
3,226
74
,102
35,77
3
47,34
2
73,44
3
6,7
40
0.8
96
1.1
01
1.0
09
0.0
92
25.7
32
.2
42.1
2445
5
Maria
kani
42,28
8
20,76
0
21,52
8
8,
329
18,29
5
9,012
15,10
7
22,53
5
1,4
58
0.9
64
0.8
77
0.8
12
0.0
65
41.1
31
.1
27.8
8352
Kaya
fungo
34,70
7
15,87
3
18,83
4
8,
156
18,13
8
8,376
9,4
89
14
,967
1,602
0.843
1.319
1.212
0.107
14
.6
32.2
53
.1 46
69
Kalol
eni
55,82
1
26,45
2
29,36
9
11,7
09
26,32
7
13
,066
17
,115
26
,806
2,688
0.901
1.082
0.982
0.100
21
.4
33.5
45
.1 85
69
Mwan
amwi
nga
21,46
9
9,805
11,66
4
5,
032
11,34
2
5,319
5,6
31
9,1
35
99
2
0.841
1.350
1.242
0.109
11
.7
31.9
56
.3 28
65
Raba
i Con
stitue
ncy
96,65
8
46,12
1
50,53
7
18,9
48
43,23
8
21
,427
31
,650
49
,467
3,953
0.913
0.954
0.874
0.080
27
.3
33.0
39
.8 15
879
Mwaw
esa
14,83
8
6,901
7,937
2,
983
7,06
3
3,657
4,4
88
7,2
23
55
2
0.869
1.054
0.978
0.076
19
.3
37.3
43
.3 23
68
Ruru
ma
21
,702
10
,176
11
,526
4,27
9
10
,123
5,2
14
6,434
10,56
6
1,0
13
0.8
83
1.0
54
0.9
58
0.0
96
18.9
36
.3
44.8
3376
Kamb
e/Ribe
17,11
5
8,354
8,761
3,
141
7,25
7
3,826
5,4
93
8,8
62
99
6
0.954
0.931
0.819
0.112
24
.6
36.8
38
.7 28
59
Raba
i/Kisu
rutin
i
43
,003
20
,690
22
,313
8,54
5
18
,795
8,7
30
15
,235
22
,816
1,392
0.927
0.885
0.824
0.061
34
.8
28.5
36
.7 72
76
Ganz
e Co
nstitu
ency
1
37,38
5
62,86
8
74,51
7
31,0
47
72,69
8
35
,053
36
,895
58
,924
5,763
0.844
1.332
1.234
0.098
18
.0
32.3
49
.8 19
838
Ganz
e
31
,242
14
,143
17
,099
7,04
9
16
,534
8,2
64
8,350
13,37
7
1,3
31
0.8
27
1.3
36
1.2
36
0.0
99
18.1
31
.6
50.3
4462
Bamb
a
37
,695
17
,113
20
,582
8,54
9
19
,998
9,2
79
10
,009
16
,081
1,616
0.831
1.344
1.244
0.100
17
.3
32.7
50
.0 54
10
Jarib
uni
24,94
4
11,58
2
13,36
2
5,
841
13,37
4
6,072
6,4
24
10
,493
1,077
0.867
1.377
1.275
0.103
17
.4
33.4
49
.2 37
62
Soko
ke
43
,504
20
,030
23
,474
9,60
8
22
,792
11,43
8
12,11
2
18,97
3
1,7
39
0.8
53
1.2
93
1.2
01
0.0
92
18.8
31
.6
49.6
6204
Malin
di C
onsti
tuenc
y
160
,970
79
,135
81
,835
3
0,639
68
,257
33,57
0
60,05
7
88,13
6
4,5
77
0.9
67
0.8
26
0.7
74
0.0
52
44.1
29
.6
26.2
3318
2
Jilor
e
17
,434
8,1
93
9,2
41
3,76
7
9
,067
4,5
62
4,797
7,646
721
0.8
87
1.2
80
1.1
86
0.0
94
23.4
33
.1
43.5
2732
Kaku
yuni
17,95
4
8,602
9,352
3,
883
9,16
9
4,485
5,1
56
8,0
73
71
2
0.920
1.224
1.136
0.088
19
.1
29.8
51
.1 25
38
Gand
a
32
,411
16
,093
16
,318
6,60
1
15
,421
7,7
14
10
,502
15
,769
1,221
0.986
1.055
0.978
0.077
18
.6
29.4
51
.9 44
72
20
Exploring Kenya’s Inequality
A PUBLICATION OF KNBS AND SID
Malin
di To
wn
50
,938
25
,371
25
,567
8,97
9
18
,841
8,9
98
22
,144
31
,074
1,023
0.992
0.639
0.606
0.033
57
.4
28.4
14
.2 13
691
Shell
a
42
,233
20
,876
21
,357
7,40
9
15
,759
7,8
11
17
,458
25
,574
90
0
0.977
0.651
0.616
0.035
49
.5
30.4
20
.1 97
49Ma
garin
i Con
stit-
uenc
y
175
,473
85
,164
90
,309
3
9,639
88
,264
41,13
1
53,13
5
80,97
1
6,2
38
0.9
43
1.1
67
1.0
90
0.0
77
22.5
31
.1
46.5
2594
9
Mara
fa
16
,736
8,1
15
8,6
21
3,60
2
8
,567
4,1
81
4,802
7,528
641
0.9
41
1.2
23
1.1
38
0.0
85
21.5
32
.3
46.3
2594
Maga
rini
40,39
6
19,47
0
20,92
6
9,
188
20,37
4
9,497
12,32
1
18,65
1
1,3
71
0.9
30
1.1
66
1.0
92
0.0
74
15.2
30
.7
54.1
5276
Gong
oni
34,45
4
16,90
3
17,55
1
7,
555
16,85
1
8,011
11,01
1
16,45
2
1,1
51
0.9
63
1.0
94
1.0
24
0.0
70
22.6
30
.0
47.4
5004
Adu
42,81
0
20,75
6
22,05
4
10,2
34
22,12
0
9,809
12,54
8
19,20
5
1,4
85
0.9
41
1.2
29
1.1
52
0.0
77
25.3
32
.2
42.5
6799
Gara
shi
25,74
5
12,20
6
13,53
9
5,
969
13,44
4
6,289
7,0
61
11
,200
1,101
0.902
1.299
1.200
0.098
17
.8
30.7
51
.6 35
74
Saba
ki
15
,332
7,7
14
7,6
18
3,09
1
6
,908
3,3
44
5,392
7,935
489
1.0
13
0.9
32
0.8
71
0.0
62
36.6
30
.2
33.2
2702
Tabl
e 14.2
: Em
ploy
men
t by C
ount
y, Co
nstit
uenc
y and
War
ds
Cou
nty/C
onst
ituen
cy/W
ards
Wor
k for
pay
Fam
ily B
usin
ess
Fam
ily A
gricu
ltura
l Ho
ldin
gIn
tern
/Vol
un-
teer
Retir
ed/H
omem
aker
Fullt
ime S
tude
ntIn
capa
citat
edNo
wor
kNu
mbe
r of I
ndi-
vidua
ls
Keny
a23
.713
.132
.01.1
9.212
.80.5
7.7 2
0,249
,800
Rura
l15
.611
.243
.51.0
8.813
.00.5
6.3 1
2,984
,788
Urba
n38
.116
.411
.41.3
9.912
.20.3
10.2
7,
265,0
12
Kilifi
Cou
nty24
.812
.222
.31.3
17.1
13.7
0.58.1
5
44,44
5
Kilifi
Nor
th C
onsti
tuenc
y
27.7
13
.2
19.9
1
.4
14.4
14
.3
0.5
8
.6
104
,675
Tezo
21
.5
15.8
25
.2
2.6
12
.8
13.7
0
.3
8.1
12,65
5
Soko
ni
37.4
16
.7
8.7
1
.4
9.8
13
.4
0.3
12
.3
19
,907
Kiba
rani
22
.7
7.2
35
.7
1.1
11
.7
12.4
1
.7
7.5
11,25
5
Daba
so
28.2
10
.6
10.2
1
.2
22.8
15
.6
0.6
10
.7
14
,577
21
Pulling Apart or Pooling Together?
Matsa
ngon
i
19.5
15
.1
30.5
0
.8
7.8
20
.5
0.4
5
.4
15
,639
Wata
mu
33.1
15
.8
7.9
1
.4
18.3
13
.1
0.5
9
.8
14
,188
Mnar
ani
26
.8
9.0
27
.6
1.3
18
.8
10.9
0
.3
5.2
16,45
4
Kilifi
Sou
th C
onsti
tuenc
y
28.9
13
.0
24.7
1
.2
11.4
11
.3
0.5
9
.1
88
,829
Junju
26
.7
10.4
28
.9
1.2
11
.2
12.7
0
.6
8.4
15,52
5
Mwar
akay
a
9.7
6
.5
59.2
0
.6
4.0
12
.9
0.7
6
.5
11
,197
Shim
o La T
ewa
40
.5
16.8
4
.4
1.4
14
.9
9.2
0
.3
12.6
31,33
7
Chas
imba
8
.8
17.3
45
.1
1.0
9
.1
13.6
0
.6
4.5
12,77
4
Mtep
eni
37
.0
9.4
20
.4
1.4
11
.9
11.3
0
.5
8.3
17,99
6
Kalol
eni C
onsti
tuenc
y
19.1
10
.3
22.9
1
.0
22.7
15
.2
0.6
8
.2
73
,443
Maria
kani
30
.0
12.9
7
.2
1.6
23
.3
14.8
0
.5
9.8
22,53
5
Kaya
fungo
14
.5
9.5
28
.7
0.7
22
.7
15.6
1
.0
7.3
14,96
7
Kalol
eni
15
.2
10.1
31
.3
0.9
20
.5
13.3
0
.6
8.1
26,80
6
Mwan
amwi
nga
11
.2
5.4
27
.3
0.8
28
.0
20.8
0
.5
6.0
9,13
5
Raba
i Con
stitue
ncy
23
.3
10.6
18
.5
1.1
20
.8
16.1
0
.5
9.1
49,46
7
Mwaw
esa
18
.5
3.5
21
.0
0.8
27
.1
19.9
0
.5
8.7
7,22
3
Ruru
ma
12.7
18
.3
24.3
1
.2
15.4
19
.4
0.7
8
.2
10
,566
Kamb
e/Ribe
20
.1
8.4
35
.7
1.1
15
.0
13.7
0
.5
5.6
8,86
2
Raba
i/Kisu
rutin
i
30.9
10
.2
8.4
1
.2
23.6
14
.2
0.5
11
.0
22
,816
Ganz
e Co
nstitu
ency
19
.6
11.3
28
.0
2.0
14
.1
16.4
0
.5
8.1
58,92
4
Ganz
e
24.0
7
.6
34.7
1
.6
6.5
19
.4
0.5
5
.8
13
,377
Bamb
a
14.0
17
.5
23.8
1
.1
20.5
12
.0
0.6
10
.4
16
,081
22
Exploring Kenya’s Inequality
A PUBLICATION OF KNBS AND SID
Jarib
uni
21
.6
8.9
38
.5
2.3
10
.0
13.7
0
.4
4.6
10,49
3
Soko
ke
20.1
10
.1
21.1
2
.7
16.3
19
.6
0.6
9
.6
18
,973
Malin
di C
onsti
tuenc
y
30.9
16
.3
12.4
1
.2
18.7
12
.0
0.5
8
.0
88
,136
Jilor
e
13.4
8
.2
34.7
0
.9
21.2
16
.9
0.7
4
.1
7
,646
Kaku
yuni
13
.4
7.4
39
.3
0.5
19
.8
12.9
0
.9
5.9
8,07
3
Gand
a
22.1
16
.2
21.9
1
.3
19.2
11
.7
0.7
6
.9
15
,769
Malin
di To
wn
37.9
19
.2
3.6
1
.3
17.9
10
.7
0.3
9
.2
31
,074
Shell
a
38.7
17
.9
2.2
1
.4
18.3
12
.1
0.4
9
.0
25
,574
Maga
rini C
onsti
tuenc
y
19.8
8
.8
31.3
1
.2
19.6
12
.7
0.6
6
.0
80
,971
Mara
fa
13.4
10
.5
32.1
1
.9
16.8
17
.1
0.5
7
.6
7
,528
Maga
rini
21
.4
8.3
27
.0
1.3
21
.3
14.3
0
.9
5.4
18,65
1
Gong
oni
28
.4
9.5
20
.5
1.6
17
.5
11.9
0
.5
10.2
16,45
2
Adu
14
.4
8.0
43
.9
0.7
20
.1
7.9
0
.5
4.5
19,20
5
Gara
shi
7
.7
5.9
44
.8
1.4
18
.1
19.9
0
.4
1.9
11,20
0
Saba
ki
34.0
13
.0
13.4
0
.8
23.8
7
.8
0.4
6
.7
7
,935
Tabl
e 14.3
: Em
ploy
men
t and
Edu
catio
n Le
vels
by C
ount
y, Co
nstit
uenc
y and
War
ds
Coun
ty /co
nstitu
ency
/War
dsEd
ucati
on To
tallev
elW
ork f
or pa
yFa
mily
Busin
ess
Fami
ly Ag
ricult
ural
Holdi
ngInt
ern
Volun
teer
Retire
d/
Home
make
r
Fullti
me
Stud
ent
Incap
aci-
tated
No w
ork
Numb
er of
Indi-
vidua
ls
Keny
a To
tal23
.713
.132
.01.1
9.212
.80.5
7.7
20,24
9,800
Keny
a No
ne11
.114
.044
.41.7
14.7
0.81.2
12.1
3
,154,3
56
Keny
a Pr
imar
y20
.712
.637
.30.8
9.612
.10.4
6.5
9,52
8,270
Keny
a Se
cond
ary+
32.7
13.3
20.2
1.26.6
18.6
0.27.3
7
,567,1
74
Rura
l To
tal15
.611
.243
.51.0
8.813
.00.5
6.3
12,98
4,788
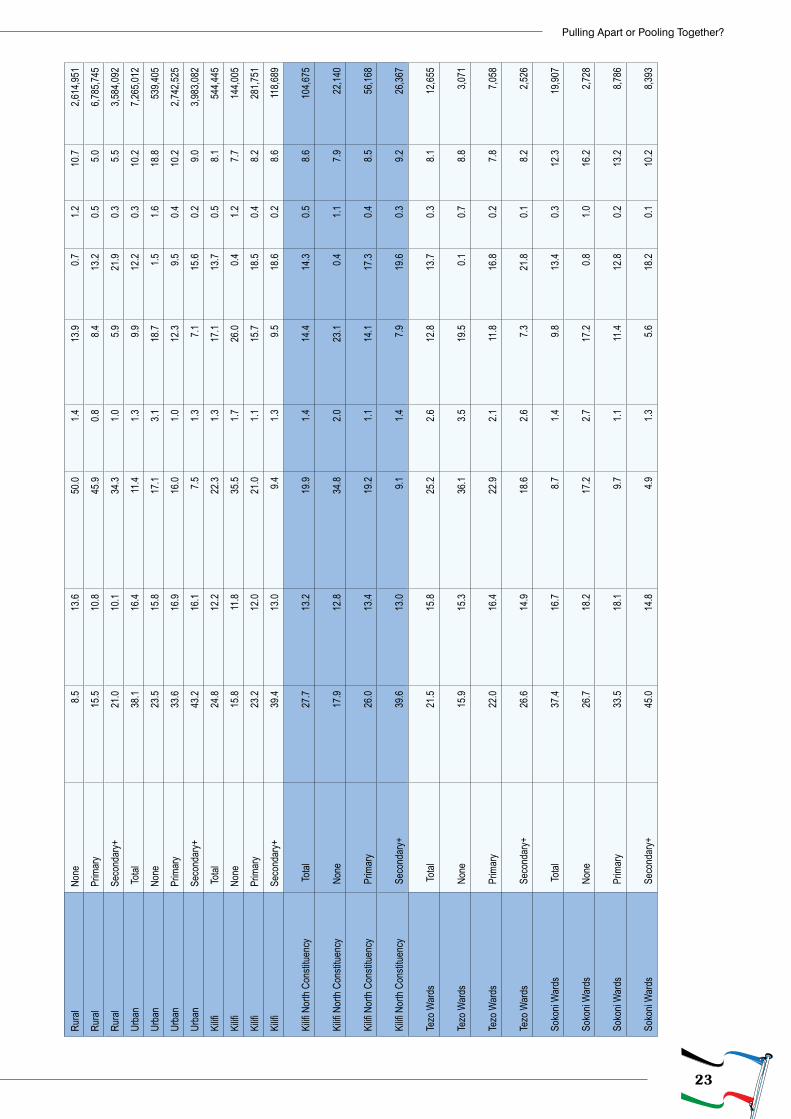
23
Pulling Apart or Pooling Together?
Rura
l No
ne8.5
13.6
50.0
1.413
.90.7
1.210
.7
2,61
4,951
Rura
l Pr
imar
y15
.510
.845
.90.8
8.413
.20.5
5.0
6,78
5,745
Rura
l Se
cond
ary+
21.0
10.1
34.3
1.05.9
21.9
0.35.5
3
,584,0
92
Urba
n To
tal38
.116
.411
.41.3
9.912
.20.3
10.2
7
,265,0
12
Urba
n No
ne23
.515
.817
.13.1
18.7
1.51.6
18.8
539
,405
Urba
n Pr
imar
y33
.616
.916
.01.0
12.3
9.50.4
10.2
2
,742,5
25
Urba
n Se
cond
ary+
43.2
16.1
7.51.3
7.115
.60.2
9.0
3,98
3,082
Kilifi
To
tal24
.812
.222
.31.3
17.1
13.7
0.58.1
544
,445
Kilifi
No
ne15
.811
.835
.51.7
26.0
0.41.2
7.7
1
44,00
5
Kilifi
Pr
imar
y23
.212
.021
.01.1
15.7
18.5
0.48.2
281
,751
Kilifi
Se
cond
ary+
39.4
13.0
9.41.3
9.518
.60.2
8.6
1
18,68
9
Kilifi
Nor
th Co
nstitu
ency
T
otal
27.7
1
3.2
19.9
1.4
14.4
1
4.3
0.5
8.
6
1
04,67
5
Kilifi
Nor
th Co
nstitu
ency
N
one
17.9
1
2.8
34.8
2.0
23.1
0.4
1.1
7.
9
22,14
0
Kilifi
Nor
th Co
nstitu
ency
P
rimar
y
2
6.0
13.4
1
9.2
1.
1
1
4.1
17.3
0.4
8.5
56
,168
Kilifi
Nor
th Co
nstitu
ency
S
econ
dary+
3
9.6
13.0
9.1
1.
4
7.9
19.6
0.3
9.2
26
,367
Tezo
War
ds T
otal
21.5
1
5.8
25.2
2.6
12.8
1
3.7
0.3
8.
1
12,65
5
Tezo
War
ds N
one
15.9
1
5.3
36.1
3.5
19.5
0.1
0.7
8.
8
3,07
1
Tezo
War
ds P
rimar
y
2
2.0
16.4
2
2.9
2.
1
1
1.8
16.8
0.2
7.8
7
,058
Tezo
War
ds S
econ
dary+
2
6.6
14.9
1
8.6
2.
6
7.3
21.8
0.1
8.2
2
,526
Soko
ni W
ards
Tota
l
3
7.4
16.7
8.7
1.
4
9.8
13.4
0.3
1
2.3
19
,907
Soko
ni W
ards
Non
e
2
6.7
18.2
1
7.2
2.
7
1
7.2
0.
8
1.0
1
6.2
2
,728
Soko
ni W
ards
Prim
ary
33.5
1
8.1
9.
7
1.1
11.4
1
2.8
0.2
13.2
8,78
6
Soko
ni W
ards
Sec
onda
ry+
45.0
1
4.8
4.
9
1.3
5.
6
1
8.2
0.1
10.2
8,39
3
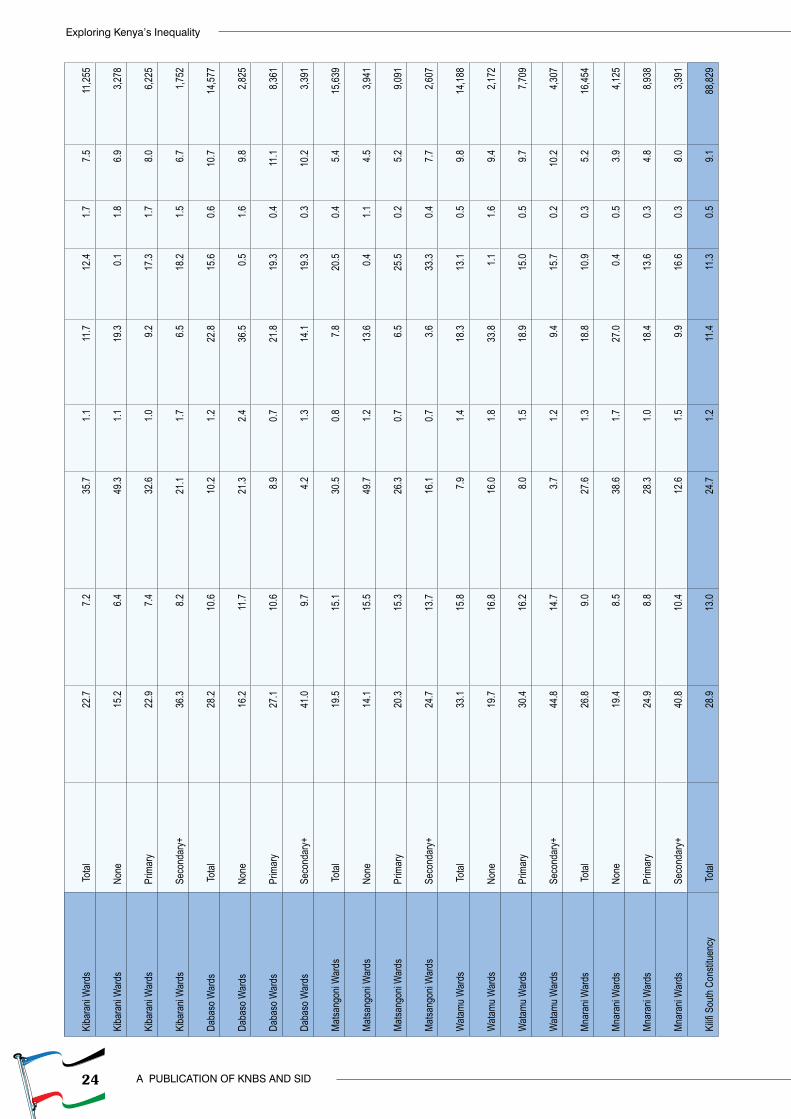
24
Exploring Kenya’s Inequality
A PUBLICATION OF KNBS AND SID
Kiba
rani
War
ds T
otal
22.7
7.2
35.7
1.1
11.7
1
2.4
1.7
7.
5
11,25
5
Kiba
rani
War
ds N
one
15.2
6.4
49.3
1.1
19.3
0.1
1.8
6.
9
3,27
8
Kiba
rani
War
ds P
rimar
y
2
2.9
7.
4
3
2.6
1.
0
9.2
17.3
1.7
8.0
6
,225
Kiba
rani
War
ds S
econ
dary+
3
6.3
8.
2
2
1.1
1.
7
6.5
18.2
1.5
6.7
1
,752
Daba
so W
ards
Tota
l
2
8.2
10.6
1
0.2
1.
2
2
2.8
15.6
0.6
1
0.7
14
,577
Daba
so W
ards
Non
e
1
6.2
11.7
2
1.3
2.
4
3
6.5
0.
5
1.6
9.8
2
,825
Daba
so W
ards
Prim
ary
27.1
1
0.6
8.
9
0.7
21.8
1
9.3
0.4
11.1
8,36
1
Daba
so W
ards
Sec
onda
ry+
41.0
9.7
4.
2
1.3
14.1
1
9.3
0.3
10.2
3,39
1
Matsa
ngon
i War
ds T
otal
19.5
1
5.1
30.5
0.8
7.
8
2
0.5
0.4
5.
4
15,63
9
Matsa
ngon
i War
ds N
one
14.1
1
5.5
49.7
1.2
13.6
0.4
1.1
4.
5
3,94
1
Matsa
ngon
i War
ds P
rimar
y
2
0.3
15.3
2
6.3
0.
7
6.5
25.5
0.2
5.2
9
,091
Matsa
ngon
i War
ds S
econ
dary+
2
4.7
13.7
1
6.1
0.
7
3.6
33.3
0.4
7.7
2
,607
Wata
mu W
ards
Tota
l
3
3.1
15.8
7.9
1.
4
1
8.3
13.1
0.5
9.8
14
,188
Wata
mu W
ards
Non
e
1
9.7
16.8
1
6.0
1.
8
3
3.8
1.
1
1.6
9.4
2
,172
Wata
mu W
ards
Prim
ary
30.4
1
6.2
8.
0
1.5
18.9
1
5.0
0.5
9.
7
7,70
9
Wata
mu W
ards
Sec
onda
ry+
44.8
1
4.7
3.
7
1.2
9.
4
1
5.7
0.2
10.2
4,30
7
Mnar
ani W
ards
Tota
l
2
6.8
9.
0
2
7.6
1.
3
1
8.8
10.9
0.3
5.2
16
,454
Mnar
ani W
ards
Non
e
1
9.4
8.
5
3
8.6
1.
7
2
7.0
0.
4
0.5
3.9
4
,125
Mnar
ani W
ards
Prim
ary
24.9
8.8
28.3
1.0
18.4
1
3.6
0.3
4.
8
8,93
8
Mnar
ani W
ards
Sec
onda
ry+
40.8
1
0.4
12.6
1.5
9.
9
1
6.6
0.3
8.
0
3,39
1
Kilifi
Sou
th Co
nstitu
ency
T
otal
28.9
1
3.0
24.7
1.2
11.4
1
1.3
0.5
9.
1
88,82
9
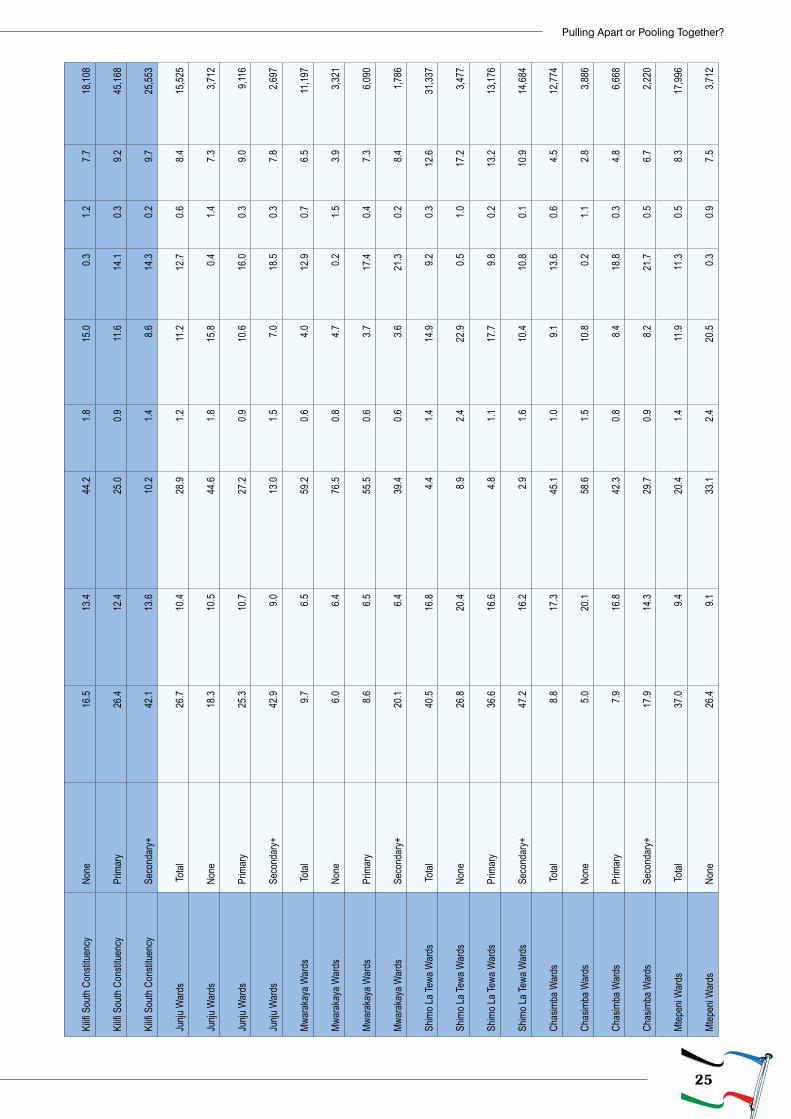
25
Pulling Apart or Pooling Together?
Kilifi
Sou
th Co
nstitu
ency
N
one
16.5
1
3.4
44.2
1.8
15.0
0.3
1.2
7.
7
18,10
8
Kilifi
Sou
th Co
nstitu
ency
P
rimar
y
2
6.4
12.4
2
5.0
0.
9
1
1.6
14.1
0.3
9.2
45
,168
Kilifi
Sou
th Co
nstitu
ency
S
econ
dary+
4
2.1
13.6
1
0.2
1.
4
8.6
14.3
0.2
9.7
25
,553
Junju
War
ds T
otal
26.7
1
0.4
28.9
1.2
11.2
1
2.7
0.6
8.
4
15,52
5
Junju
War
ds N
one
18.3
1
0.5
44.6
1.8
15.8
0.4
1.4
7.
3
3,71
2
Junju
War
ds P
rimar
y
2
5.3
10.7
2
7.2
0.
9
1
0.6
16.0
0.3
9.0
9
,116
Junju
War
ds S
econ
dary+
4
2.9
9.
0
1
3.0
1.
5
7.0
18.5
0.3
7.8
2
,697
Mwar
akay
a War
ds T
otal
9.
7
6.5
59.2
0.6
4.
0
1
2.9
0.7
6.
5
11,19
7
Mwar
akay
a War
ds N
one
6.
0
6.4
76.5
0.8
4.
7
0.2
1.5
3.
9
3,32
1
Mwar
akay
a War
ds P
rimar
y
8.6
6.
5
5
5.5
0.
6
3.7
17.4
0.4
7.3
6
,090
Mwar
akay
a War
ds S
econ
dary+
2
0.1
6.
4
3
9.4
0.
6
3.6
21.3
0.2
8.4
1
,786
Shim
o La T
ewa W
ards
Tota
l
4
0.5
16.8
4.4
1.
4
1
4.9
9.
2
0.3
1
2.6
31
,337
Shim
o La T
ewa W
ards
Non
e
2
6.8
20.4
8.9
2.
4
2
2.9
0.
5
1.0
1
7.2
3
,477
Shim
o La T
ewa W
ards
Prim
ary
36.6
1
6.6
4.
8
1.1
17.7
9.8
0.2
13.2
13,17
6
Shim
o La T
ewa W
ards
Sec
onda
ry+
47.2
1
6.2
2.
9
1.6
10.4
1
0.8
0.1
10.9
14,68
4
Chas
imba
War
ds T
otal
8.
8
1
7.3
45.1
1.0
9.
1
1
3.6
0.6
4.
5
12,77
4
Chas
imba
War
ds N
one
5.
0
2
0.1
58.6
1.5
10.8
0.2
1.1
2.
8
3,88
6
Chas
imba
War
ds P
rimar
y
7.9
16.8
4
2.3
0.
8
8.4
18.8
0.3
4.8
6
,668
Chas
imba
War
ds S
econ
dary+
1
7.9
14.3
2
9.7
0.
9
8.2
21.7
0.5
6.7
2
,220
Mtep
eni W
ards
Tota
l
3
7.0
9.
4
2
0.4
1.
4
1
1.9
11.3
0.5
8.3
17
,996
Mtep
eni W
ards
Non
e
2
6.4
9.
1
3
3.1
2.
4
2
0.5
0.
3
0.9
7.5
3
,712
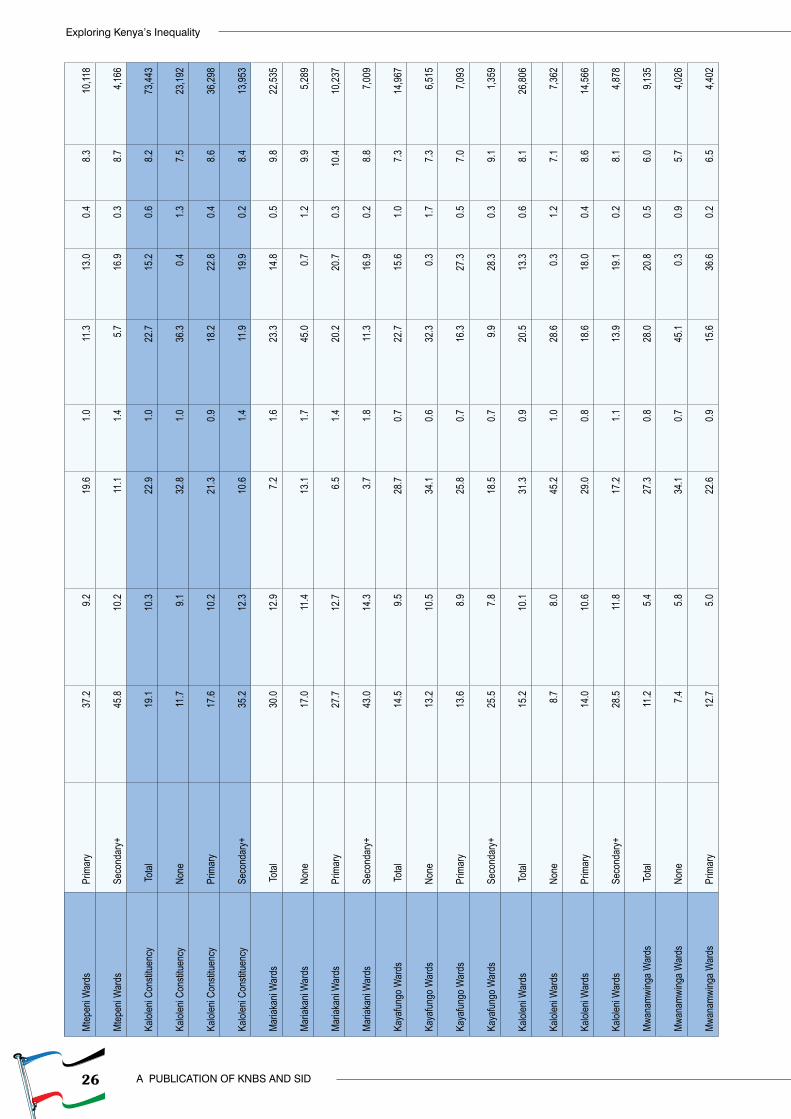
26
Exploring Kenya’s Inequality
A PUBLICATION OF KNBS AND SID
Mtep
eni W
ards
Prim
ary
37.2
9.2
19.6
1.0
11.3
1
3.0
0.4
8.
3
10,11
8
Mtep
eni W
ards
Sec
onda
ry+
45.8
1
0.2
11.1
1.4
5.
7
1
6.9
0.3
8.
7
4,16
6
Kalol
eni C
onsti
tuenc
y T
otal
19.1
1
0.3
22.9
1.0
22.7
1
5.2
0.6
8.
2
73,44
3
Kalol
eni C
onsti
tuenc
y N
one
11.7
9.1
32.8
1.0
36.3
0.4
1.3
7.
5
23,19
2
Kalol
eni C
onsti
tuenc
y P
rimar
y
1
7.6
10.2
2
1.3
0.
9
1
8.2
22.8
0.4
8.6
36
,298
Kalol
eni C
onsti
tuenc
y S
econ
dary+
3
5.2
12.3
1
0.6
1.
4
1
1.9
19.9
0.2
8.4
13
,953
Maria
kani
War
ds T
otal
30.0
1
2.9
7.
2
1.6
23.3
1
4.8
0.5
9.
8
22,53
5
Maria
kani
War
ds N
one
17.0
1
1.4
13.1
1.7
45.0
0.7
1.2
9.
9
5,28
9
Maria
kani
War
ds P
rimar
y
2
7.7
12.7
6.5
1.
4
2
0.2
20.7
0.3
1
0.4
10
,237
Maria
kani
War
ds S
econ
dary+
4
3.0
14.3
3.7
1.
8
1
1.3
16.9
0.2
8.8
7
,009
Kaya
fungo
War
ds T
otal
14.5
9.5
28.7
0.7
22.7
1
5.6
1.0
7.
3
14,96
7
Kaya
fungo
War
ds N
one
13.2
1
0.5
34.1
0.6
32.3
0.3
1.7
7.
3
6,51
5
Kaya
fungo
War
ds P
rimar
y
1
3.6
8.
9
2
5.8
0.
7
1
6.3
27.3
0.5
7.0
7
,093
Kaya
fungo
War
ds S
econ
dary+
2
5.5
7.
8
1
8.5
0.
7
9.9
28.3
0.3
9.1
1
,359
Kalol
eni W
ards
Tota
l
1
5.2
10.1
3
1.3
0.
9
2
0.5
13.3
0.6
8.1
26
,806
Kalol
eni W
ards
Non
e
8.7
8.
0
4
5.2
1.
0
2
8.6
0.
3
1.2
7.1
7
,362
Kalol
eni W
ards
Prim
ary
14.0
1
0.6
29.0
0.8
18.6
1
8.0
0.4
8.
6
14,56
6
Kalol
eni W
ards
Sec
onda
ry+
28.5
1
1.8
17.2
1.1
13.9
1
9.1
0.2
8.
1
4,87
8
Mwan
amwi
nga W
ards
Tota
l
1
1.2
5.
4
2
7.3
0.
8
2
8.0
20.8
0.5
6.0
9
,135
Mwan
amwi
nga W
ards
Non
e
7.4
5.
8
3
4.1
0.
7
4
5.1
0.
3
0.9
5.7
4
,026
Mwan
amwi
nga W
ards
Prim
ary
12.7
5.0
22.6
0.9
15.6
3
6.6
0.2
6.
5
4,40
2
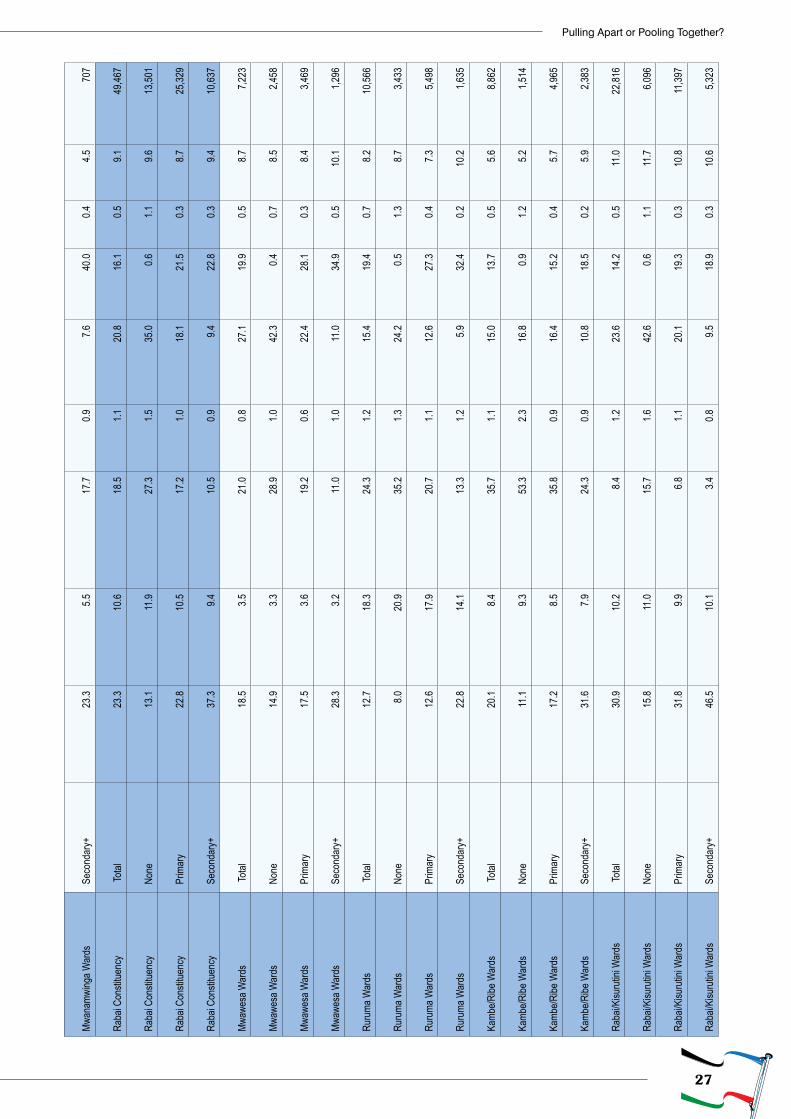
27
Pulling Apart or Pooling Together?
Mwan
amwi
nga W
ards
Sec
onda
ry+
23.3
5.5
17.7
0.9
7.
6
4
0.0
0.4
4.
5
70
7
Raba
i Con
stitue
ncy
Tota
l
2
3.3
10.6
1
8.5
1.
1
2
0.8
16.1
0.5
9.1
49
,467
Raba
i Con
stitue
ncy
Non
e
1
3.1
11.9
2
7.3
1.
5
3
5.0
0.
6
1.1
9.6
13
,501
Raba
i Con
stitue
ncy
Prim
ary
22.8
1
0.5
17.2
1.0
18.1
2
1.5
0.3
8.
7
25,32
9
Raba
i Con
stitue
ncy
Sec
onda
ry+
37.3
9.4
10.5
0.9
9.
4
2
2.8
0.3
9.
4
10,63
7
Mwaw
esa W
ards
Tota
l
1
8.5
3.
5
2
1.0
0.
8
2
7.1
19.9
0.5
8.7
7
,223
Mwaw
esa W
ards
Non
e
1
4.9
3.
3
2
8.9
1.
0
4
2.3
0.
4
0.7
8.5
2
,458
Mwaw
esa W
ards
Prim
ary
17.5
3.6
19.2
0.6
22.4
2
8.1
0.3
8.
4
3,46
9
Mwaw
esa W
ards
Sec
onda
ry+
28.3
3.2
11.0
1.0
11.0
3
4.9
0.5
10.1
1,29
6
Ruru
ma W
ards
Tota
l
1
2.7
18.3
2
4.3
1.
2
1
5.4
19.4
0.7
8.2
10
,566
Ruru
ma W
ards
Non
e
8.0
20.9
3
5.2
1.
3
2
4.2
0.
5
1.3
8.7
3
,433
Ruru
ma W
ards
Prim
ary
12.6
1
7.9
20.7
1.1
12.6
2
7.3
0.4
7.
3
5,49
8
Ruru
ma W
ards
Sec
onda
ry+
22.8
1
4.1
13.3
1.2
5.
9
3
2.4
0.2
10.2
1,63
5
Kamb
e/Ribe
War
ds T
otal
20.1
8.4
35.7
1.1
15.0
1
3.7
0.5
5.
6
8,86
2
Kamb
e/Ribe
War
ds N
one
11.1
9.3
53.3
2.3
16.8
0.9
1.2
5.
2
1,51
4
Kamb
e/Ribe
War
ds P
rimar
y
1
7.2
8.
5
3
5.8
0.
9
1
6.4
15.2
0.4
5.7
4
,965
Kamb
e/Ribe
War
ds S
econ
dary+
3
1.6
7.
9
2
4.3
0.
9
1
0.8
18.5
0.2
5.9
2
,383
Raba
i/Kisu
rutin
i War
ds T
otal
30.9
1
0.2
8.
4
1.2
23.6
1
4.2
0.5
11.0
22,81
6
Raba
i/Kisu
rutin
i War
ds N
one
15.8
1
1.0
15.7
1.6
42.6
0.6
1.1
11.7
6,09
6
Raba
i/Kisu
rutin
i War
ds P
rimar
y
3
1.8
9.
9
6.8
1.
1
2
0.1
19.3
0.3
1
0.8
11
,397
Raba
i/Kisu
rutin
i War
ds S
econ
dary+
4
6.5
10.1
3.4
0.
8
9.5
18.9
0.3
1
0.6
5
,323
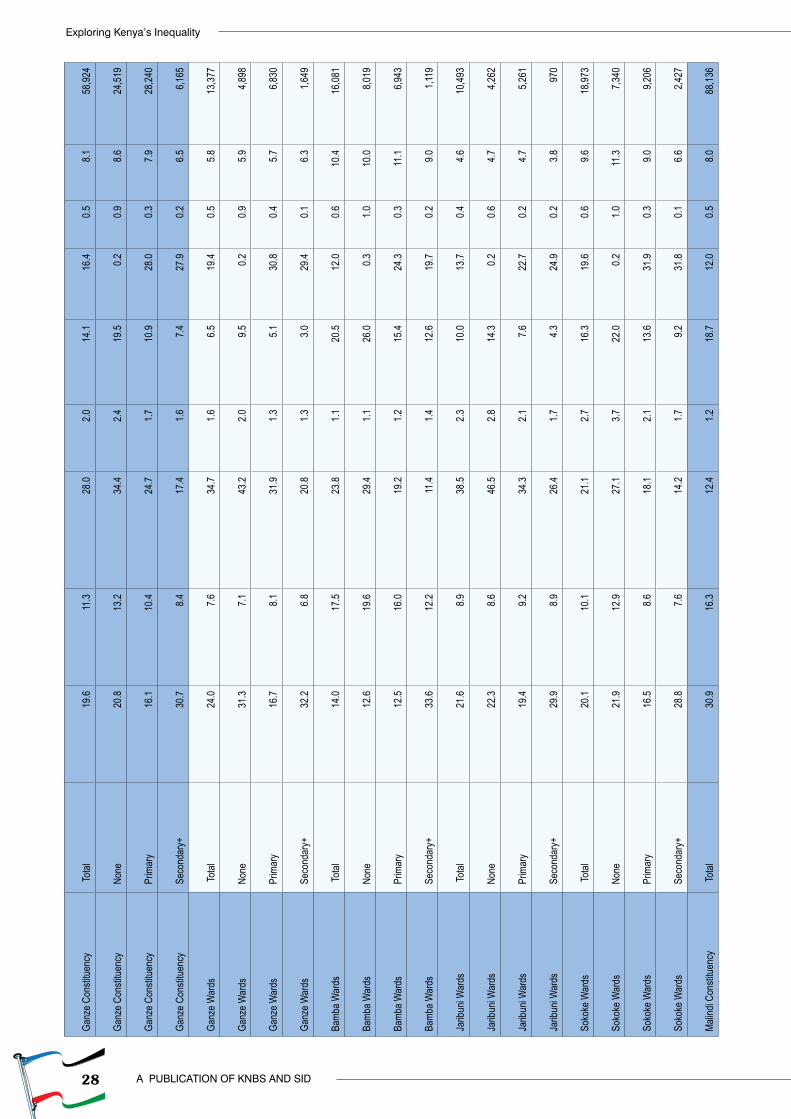
28
Exploring Kenya’s Inequality
A PUBLICATION OF KNBS AND SID
Ganz
e Con
stitue
ncy
Tota
l
1
9.6
11.3
2
8.0
2.
0
1
4.1
16.4
0.5
8.1
58
,924
Ganz
e Con
stitue
ncy
Non
e
2
0.8
13.2
3
4.4
2.
4
1
9.5
0.
2
0.9
8.6
24
,519
Ganz
e Con
stitue
ncy
Prim
ary
16.1
1
0.4
24.7
1.7
10.9
2
8.0
0.3
7.
9
28,24
0
Ganz
e Con
stitue
ncy
Sec
onda
ry+
30.7
8.4
17.4
1.6
7.
4
2
7.9
0.2
6.
5
6,16
5
Ganz
e War
ds T
otal
24.0
7.6
34.7
1.6
6.
5
1
9.4
0.5
5.
8
13,37
7
Ganz
e War
ds N
one
31.3
7.1
43.2
2.0
9.
5
0.2
0.9
5.
9
4,89
8
Ganz
e War
ds P
rimar
y
1
6.7
8.
1
3
1.9
1.
3
5.1
30.8
0.4
5.7
6
,830
Ganz
e War
ds S
econ
dary+
3
2.2
6.
8
2
0.8
1.
3
3.0
29.4
0.1
6.3
1
,649
Bamb
a War
ds T
otal
14.0
1
7.5
23.8
1.1
20.5
1
2.0
0.6
10.4
16,08
1
Bamb
a War
ds N
one
12.6
1
9.6
29.4
1.1
26.0
0.3
1.0
10.0
8,01
9
Bamb
a War
ds P
rimar
y
1
2.5
16.0
1
9.2
1.
2
1
5.4
24.3
0.3
1
1.1
6
,943
Bamb
a War
ds S
econ
dary+
3
3.6
12.2
1
1.4
1.
4
1
2.6
19.7
0.2
9.0
1
,119
Jarib
uni W
ards
Tota
l
2
1.6
8.
9
3
8.5
2.
3
1
0.0
13.7
0.4
4.6
10
,493
Jarib
uni W
ards
Non
e
2
2.3
8.
6
4
6.5
2.
8
1
4.3
0.
2
0.6
4.7
4
,262
Jarib
uni W
ards
Prim
ary
19.4
9.2
34.3
2.1
7.
6
2
2.7
0.2
4.
7
5,26
1
Jarib
uni W
ards
Sec
onda
ry+
29.9
8.9
26.4
1.7
4.
3
2
4.9
0.2
3.
8
97
0
Soko
ke W
ards
Tota
l
2
0.1
10.1
2
1.1
2.
7
1
6.3
19.6
0.6
9.6
18
,973
Soko
ke W
ards
Non
e
2
1.9
12.9
2
7.1
3.
7
2
2.0
0.
2
1.0
1
1.3
7
,340
Soko
ke W
ards
Prim
ary
16.5
8.6
18.1
2.1
13.6
3
1.9
0.3
9.
0
9,20
6
Soko
ke W
ards
Sec
onda
ry+
28.8
7.6
14.2
1.7
9.
2
3
1.8
0.1
6.
6
2,42
7
Malin
di Co
nstitu
ency
T
otal
30.9
1
6.3
12.4
1.2
18.7
1
2.0
0.5
8.
0
88,13
6
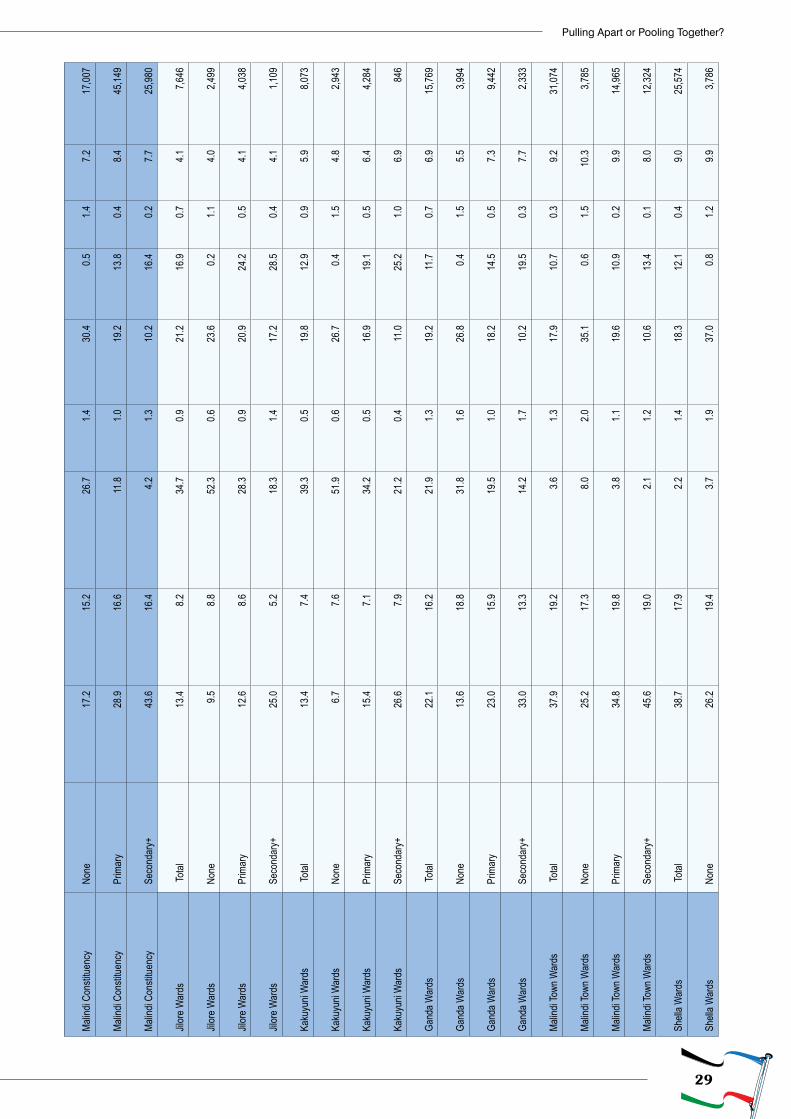
29
Pulling Apart or Pooling Together?
Malin
di Co
nstitu
ency
N
one
17.2
1
5.2
26.7
1.4
30.4
0.5
1.4
7.
2
17,00
7
Malin
di Co
nstitu
ency
P
rimar
y
2
8.9
16.6
1
1.8
1.
0
1
9.2
13.8
0.4
8.4
45
,149
Malin
di Co
nstitu
ency
S
econ
dary+
4
3.6
16.4
4.2
1.
3
1
0.2
16.4
0.2
7.7
25
,980
Jilor
e War
ds T
otal
13.4
8.2
34.7
0.9
21.2
1
6.9
0.7
4.
1
7,64
6
Jilor
e War
ds N
one
9.
5
8.8
52.3
0.6
23.6
0.2
1.1
4.
0
2,49
9
Jilor
e War
ds P
rimar
y
1
2.6
8.
6
2
8.3
0.
9
2
0.9
24.2
0.5
4.1
4
,038
Jilor
e War
ds S
econ
dary+
2
5.0
5.
2
1
8.3
1.
4
1
7.2
28.5
0.4
4.1
1
,109
Kaku
yuni
War
ds T
otal
13.4
7.4
39.3
0.5
19.8
1
2.9
0.9
5.
9
8,07
3
Kaku
yuni
War
ds N
one
6.
7
7.6
51.9
0.6
26.7
0.4
1.5
4.
8
2,94
3
Kaku
yuni
War
ds P
rimar
y
1
5.4
7.
1
3
4.2
0.
5
1
6.9
19.1
0.5
6.4
4
,284
Kaku
yuni
War
ds S
econ
dary+
2
6.6
7.
9
2
1.2
0.
4
1
1.0
25.2
1.0
6.9
846
Gand
a War
ds T
otal
22.1
1
6.2
21.9
1.3
19.2
1
1.7
0.7
6.
9
15,76
9
Gand
a War
ds N
one
13.6
1
8.8
31.8
1.6
26.8
0.4
1.5
5.
5
3,99
4
Gand
a War
ds P
rimar
y
2
3.0
15.9
1
9.5
1.
0
1
8.2
14.5
0.5
7.3
9
,442
Gand
a War
ds S
econ
dary+
3
3.0
13.3
1
4.2
1.
7
1
0.2
19.5
0.3
7.7
2
,333
Malin
di To
wn W
ards
Tota
l
3
7.9
19.2
3.6
1.
3
1
7.9
10.7
0.3
9.2
31
,074
Malin
di To
wn W
ards
Non
e
2
5.2
17.3
8.0
2.
0
3
5.1
0.
6
1.5
1
0.3
3
,785
Malin
di To
wn W
ards
Prim
ary
34.8
1
9.8
3.
8
1.1
19.6
1
0.9
0.2
9.
9
14,96
5
Malin
di To
wn W
ards
Sec
onda
ry+
45.6
1
9.0
2.
1
1.2
10.6
1
3.4
0.1
8.
0
12,32
4
Shell
a War
ds T
otal
38.7
1
7.9
2.
2
1.4
18.3
1
2.1
0.4
9.
0
25,57
4
Shell
a War
ds N
one
26.2
1
9.4
3.
7
1.9
37.0
0.8
1.2
9.
9
3,78
6

30
Exploring Kenya’s Inequality
A PUBLICATION OF KNBS AND SID
Shell
a War
ds P
rimar
y
3
6.1
19.2
2.4
1.
2
1
9.8
11.4
0.3
9.7
12
,420
Shell
a War
ds S
econ
dary+
4
7.2
15.8
1.4
1.
4
8.8
17.4
0.2
7.9
9
,368
Maga
rini C
onsti
tuenc
y T
otal
19.8
8.8
31.3
1.2
19.6
1
2.7
0.6
6.
0
80,97
1
Maga
rini C
onsti
tuenc
y N
one
13.2
8.5
43.8
1.7
25.6
0.4
1.2
5.
9
25,53
8
Maga
rini C
onsti
tuenc
y P
rimar
y
2
0.1
8.
7
2
8.0
1.
0
1
8.0
17.9
0.3
6.0
45
,399
Maga
rini C
onsti
tuenc
y S
econ
dary+
3
5.0
10.1
1
4.5
1.
4
1
1.8
20.2
0.3
6.7
10
,034
Mara
fa W
ards
Tota
l
1
3.4
10.5
3
2.1
1.
9
1
6.8
17.1
0.5
7.6
7
,528
Mara
fa W
ards
Non
e
9.1
11.8
4
5.1
2.
8
1
9.7
0.
3
1.1
1
0.2
2
,411
Mara
fa W
ards
Prim
ary
12.5
1
0.2
28.5
1.4
15.9
2
4.5
0.3
6.
8
4,20
0
Mara
fa W
ards
Sec
onda
ry+
29.1
8.0
14.9
2.1
13.3
2
7.5
0.4
4.
7
91
7
Maga
rini W
ards
Tota
l
2
1.4
8.
3
2
7.0
1.
3
2
1.3
14.3
0.9
5.4
18
,651
Maga
rini W
ards
Non
e
1
1.8
8.
5
3
8.2
2.
0
3
1.8
0.
4
2.0
5.3
5
,517
Maga
rini W
ards
Prim
ary
23.5
8.5
23.6
1.0
18.8
1
9.1
0.4
5.
2
10,88
6
Maga
rini W
ards
Sec
onda
ry+
35.0
7.5
16.2
0.9
7.
9
2
5.2
0.5
6.
9
2,24
8
Gong
oni W
ards
Tota
l
2
8.4
9.
5
2
0.5
1.
6
1
7.5
11.9
0.5
1
0.2
16
,452
Gong
oni W
ards
Non
e
2
3.3
9.
4
2
9.8
2.
2
2
4.9
0.
4
1.0
8.9
4
,961
Gong
oni W
ards
Prim
ary
28.5
9.2
18.2
1.4
15.6
1
5.9
0.3
11.0
9,13
9
Gong
oni W
ards
Sec
onda
ry+
39.0
1
0.4
9.
7
1.4
9.
2
2
0.4
0.2
9.
7
2,35
2
Adu W
ards
Tota
l
1
4.4
8.
0
4
3.9
0.
7
2
0.1
7.
9
0.5
4.5
19
,205
Adu W
ards
Non
e
1
0.8
7.
0
5
3.7
0.
9
2
1.5
0.
2
0.9
5.1
7
,003
Adu W
ards
Prim
ary
14.3
8.0
40.8
0.6
19.9
1
2.2
0.2
4.
1
10,48
7
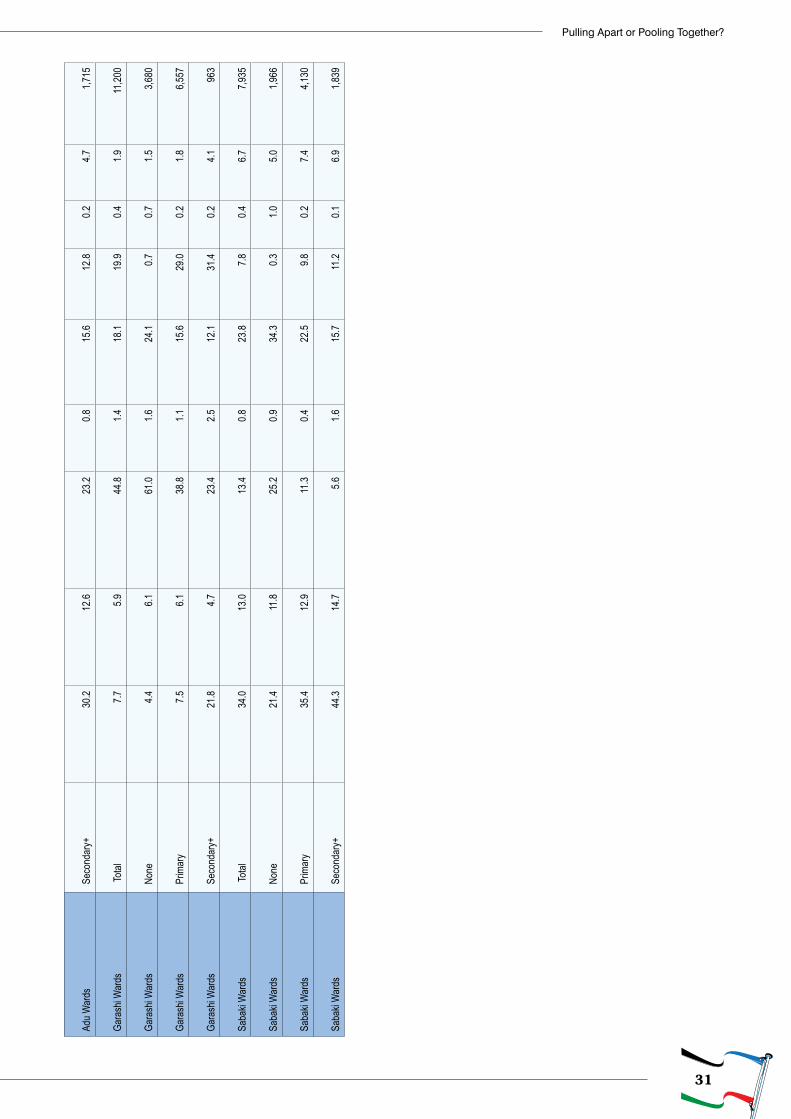
31
Pulling Apart or Pooling Together?
Adu W
ards
Sec
onda
ry+
30.2
1
2.6
23.2
0.8
15.6
1
2.8
0.2
4.
7
1,71
5
Gara
shi W
ards
Tota
l
7.7
5.
9
4
4.8
1.
4
1
8.1
19.9
0.4
1.9
11
,200
Gara
shi W
ards
Non
e
4.4
6.
1
6
1.0
1.
6
2
4.1
0.
7
0.7
1.5
3
,680
Gara
shi W
ards
Prim
ary
7.
5
6.1
38.8
1.1
15.6
2
9.0
0.2
1.
8
6,55
7
Gara
shi W
ards
Sec
onda
ry+
21.8
4.7
23.4
2.5
12.1
3
1.4
0.2
4.
1
96
3
Saba
ki W
ards
Tota
l
3
4.0
13.0
1
3.4
0.
8
2
3.8
7.
8
0.4
6.7
7
,935
Saba
ki W
ards
Non
e
2
1.4
11.8
2
5.2
0.
9
3
4.3
0.
3
1.0
5.0
1
,966
Saba
ki W
ards
Prim
ary
35.4
1
2.9
11.3
0.4
22.5
9.8
0.2
7.
4
4,13
0
Saba
ki W
ards
Sec
onda
ry+
44.3
1
4.7
5.
6
1.6
15.7
1
1.2
0.1
6.
9
1,83
9
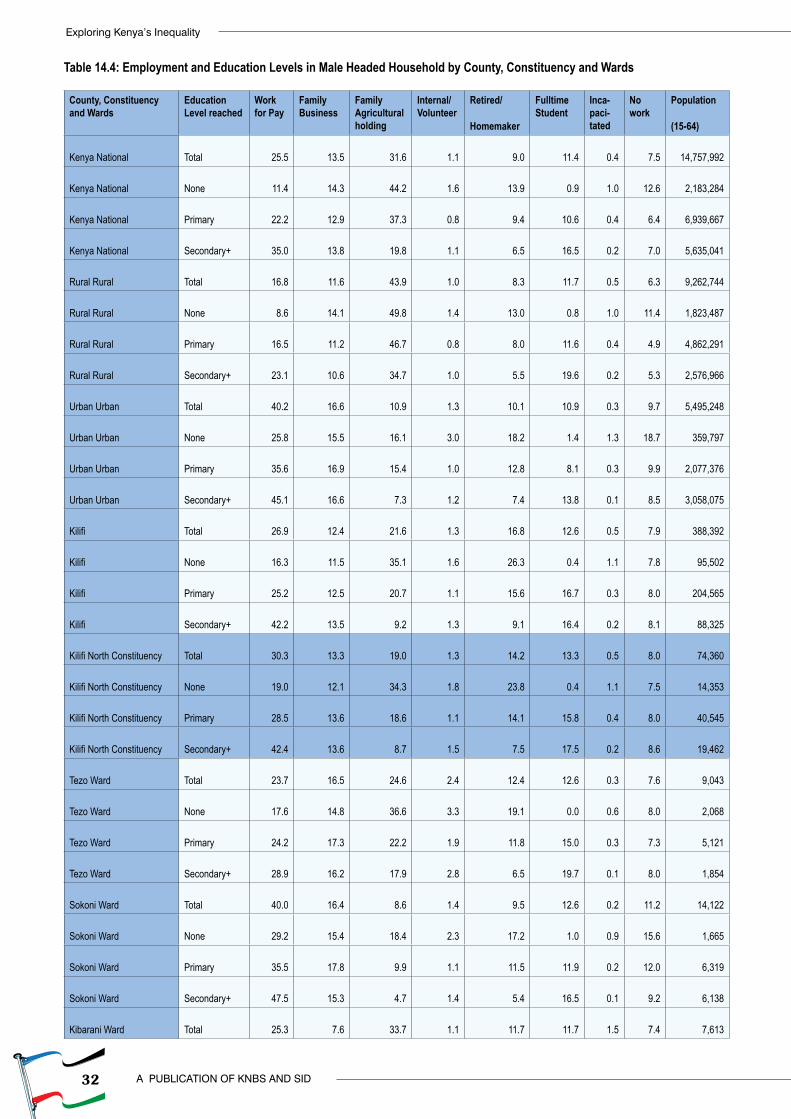
32
Exploring Kenya’s Inequality
A PUBLICATION OF KNBS AND SID
Table 14.4: Employment and Education Levels in Male Headed Household by County, Constituency and Wards
County, Constituency and Wards
Education Level reached
Work for Pay
Family Business
Family Agricultural holding
Internal/ Volunteer
Retired/
Homemaker
Fulltime Student
Inca-paci-tated
No work
Population
(15-64)
Kenya National Total
25.5 13.5 31.6
1.1 9.0 11.4
0.4
7.5
14,757,992
Kenya National None
11.4 14.3 44.2
1.6 13.9 0.9
1.0
12.6
2,183,284
Kenya National Primary
22.2 12.9 37.3
0.8 9.4 10.6
0.4
6.4
6,939,667
Kenya National Secondary+
35.0 13.8 19.8
1.1 6.5 16.5
0.2
7.0
5,635,041
Rural Rural Total
16.8 11.6 43.9
1.0 8.3 11.7
0.5
6.3
9,262,744
Rural Rural None
8.6 14.1 49.8
1.4 13.0 0.8
1.0
11.4
1,823,487
Rural Rural Primary
16.5 11.2 46.7
0.8 8.0 11.6
0.4
4.9
4,862,291
Rural Rural Secondary+
23.1 10.6 34.7
1.0 5.5 19.6
0.2
5.3
2,576,966
Urban Urban Total
40.2 16.6 10.9
1.3 10.1 10.9
0.3
9.7
5,495,248
Urban Urban None
25.8 15.5 16.1
3.0 18.2 1.4
1.3
18.7
359,797
Urban Urban Primary
35.6 16.9 15.4
1.0 12.8 8.1
0.3
9.9
2,077,376
Urban Urban Secondary+
45.1 16.6 7.3
1.2 7.4 13.8
0.1
8.5
3,058,075
Kilifi Total
26.9 12.4 21.6
1.3 16.8 12.6
0.5
7.9
388,392
Kilifi None
16.3 11.5 35.1
1.6 26.3 0.4
1.1
7.8 95,502
Kilifi Primary
25.2 12.5 20.7
1.1 15.6 16.7
0.3
8.0
204,565
Kilifi Secondary+
42.2 13.5 9.2
1.3 9.1 16.4
0.2
8.1 88,325
Kilifi North Constituency Total
30.3 13.3 19.0
1.3 14.2 13.3
0.5
8.0 74,360
Kilifi North Constituency None
19.0 12.1 34.3
1.8 23.8 0.4
1.1
7.5 14,353
Kilifi North Constituency Primary
28.5 13.6 18.6
1.1 14.1 15.8
0.4
8.0 40,545
Kilifi North Constituency Secondary+
42.4 13.6 8.7
1.5 7.5 17.5
0.2
8.6 19,462
Tezo Ward Total
23.7 16.5 24.6
2.4 12.4 12.6
0.3
7.6
9,043
Tezo Ward None
17.6 14.8 36.6
3.3 19.1 0.0
0.6
8.0
2,068
Tezo Ward Primary
24.2 17.3 22.2
1.9 11.8 15.0
0.3
7.3
5,121
Tezo Ward Secondary+
28.9 16.2 17.9
2.8 6.5 19.7
0.1
8.0
1,854
Sokoni Ward Total
40.0 16.4 8.6
1.4 9.5 12.6
0.2
11.2 14,122
Sokoni Ward None
29.2 15.4 18.4
2.3 17.2 1.0
0.9
15.6
1,665
Sokoni Ward Primary
35.5 17.8 9.9
1.1 11.5 11.9
0.2
12.0
6,319
Sokoni Ward Secondary+
47.5 15.3 4.7
1.4 5.4 16.5
0.1
9.2
6,138
Kibarani Ward Total
25.3 7.6 33.7
1.1 11.7 11.7
1.5
7.4
7,613
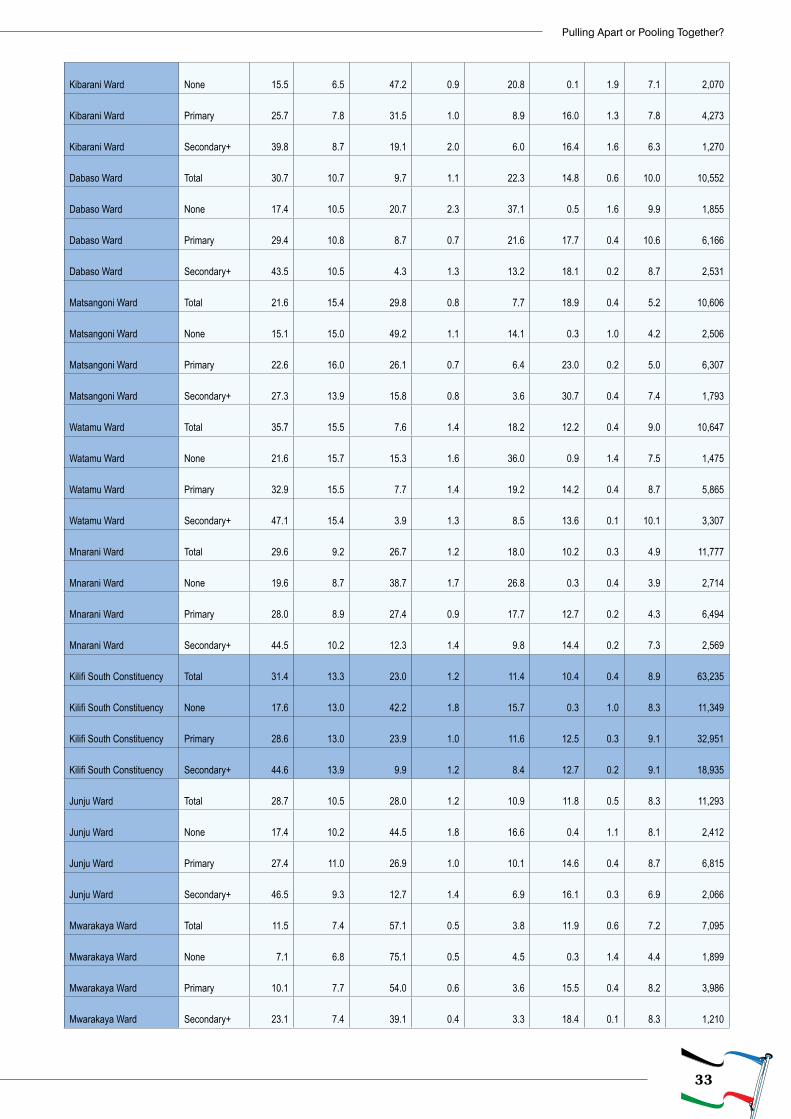
33
Pulling Apart or Pooling Together?
Kibarani Ward None
15.5 6.5 47.2
0.9 20.8 0.1
1.9
7.1
2,070
Kibarani Ward Primary
25.7 7.8 31.5
1.0 8.9 16.0
1.3
7.8
4,273
Kibarani Ward Secondary+
39.8 8.7 19.1
2.0 6.0 16.4
1.6
6.3
1,270
Dabaso Ward Total
30.7 10.7 9.7
1.1 22.3 14.8
0.6
10.0 10,552
Dabaso Ward None
17.4 10.5 20.7
2.3 37.1 0.5
1.6
9.9
1,855
Dabaso Ward Primary
29.4 10.8 8.7
0.7 21.6 17.7
0.4
10.6
6,166
Dabaso Ward Secondary+
43.5 10.5 4.3
1.3 13.2 18.1
0.2
8.7
2,531
Matsangoni Ward Total
21.6 15.4 29.8
0.8 7.7 18.9
0.4
5.2 10,606
Matsangoni Ward None
15.1 15.0 49.2
1.1 14.1 0.3
1.0
4.2
2,506
Matsangoni Ward Primary
22.6 16.0 26.1
0.7 6.4 23.0
0.2
5.0
6,307
Matsangoni Ward Secondary+
27.3 13.9 15.8
0.8 3.6 30.7
0.4
7.4
1,793
Watamu Ward Total
35.7 15.5 7.6
1.4 18.2 12.2
0.4
9.0 10,647
Watamu Ward None
21.6 15.7 15.3
1.6 36.0 0.9
1.4
7.5
1,475
Watamu Ward Primary
32.9 15.5 7.7
1.4 19.2 14.2
0.4
8.7
5,865
Watamu Ward Secondary+
47.1 15.4 3.9
1.3 8.5 13.6
0.1
10.1
3,307
Mnarani Ward Total
29.6 9.2 26.7
1.2 18.0 10.2
0.3
4.9 11,777
Mnarani Ward None
19.6 8.7 38.7
1.7 26.8 0.3
0.4
3.9
2,714
Mnarani Ward Primary
28.0 8.9 27.4
0.9 17.7 12.7
0.2
4.3
6,494
Mnarani Ward Secondary+
44.5 10.2 12.3
1.4 9.8 14.4
0.2
7.3
2,569
Kilifi South Constituency Total
31.4 13.3 23.0
1.2 11.4 10.4
0.4
8.9 63,235
Kilifi South Constituency None
17.6 13.0 42.2
1.8 15.7 0.3
1.0
8.3 11,349
Kilifi South Constituency Primary
28.6 13.0 23.9
1.0 11.6 12.5
0.3
9.1 32,951
Kilifi South Constituency Secondary+
44.6 13.9 9.9
1.2 8.4 12.7
0.2
9.1 18,935
Junju Ward Total
28.7 10.5 28.0
1.2 10.9 11.8
0.5
8.3 11,293
Junju Ward None
17.4 10.2 44.5
1.8 16.6 0.4
1.1
8.1
2,412
Junju Ward Primary
27.4 11.0 26.9
1.0 10.1 14.6
0.4
8.7
6,815
Junju Ward Secondary+
46.5 9.3 12.7
1.4 6.9 16.1
0.3
6.9
2,066
Mwarakaya Ward Total
11.5 7.4 57.1
0.5 3.8 11.9
0.6
7.2
7,095
Mwarakaya Ward None
7.1 6.8 75.1
0.5 4.5 0.3
1.4
4.4
1,899
Mwarakaya Ward Primary
10.1 7.7 54.0
0.6 3.6 15.5
0.4
8.2
3,986
Mwarakaya Ward Secondary+
23.1 7.4 39.1
0.4 3.3 18.4
0.1
8.3
1,210
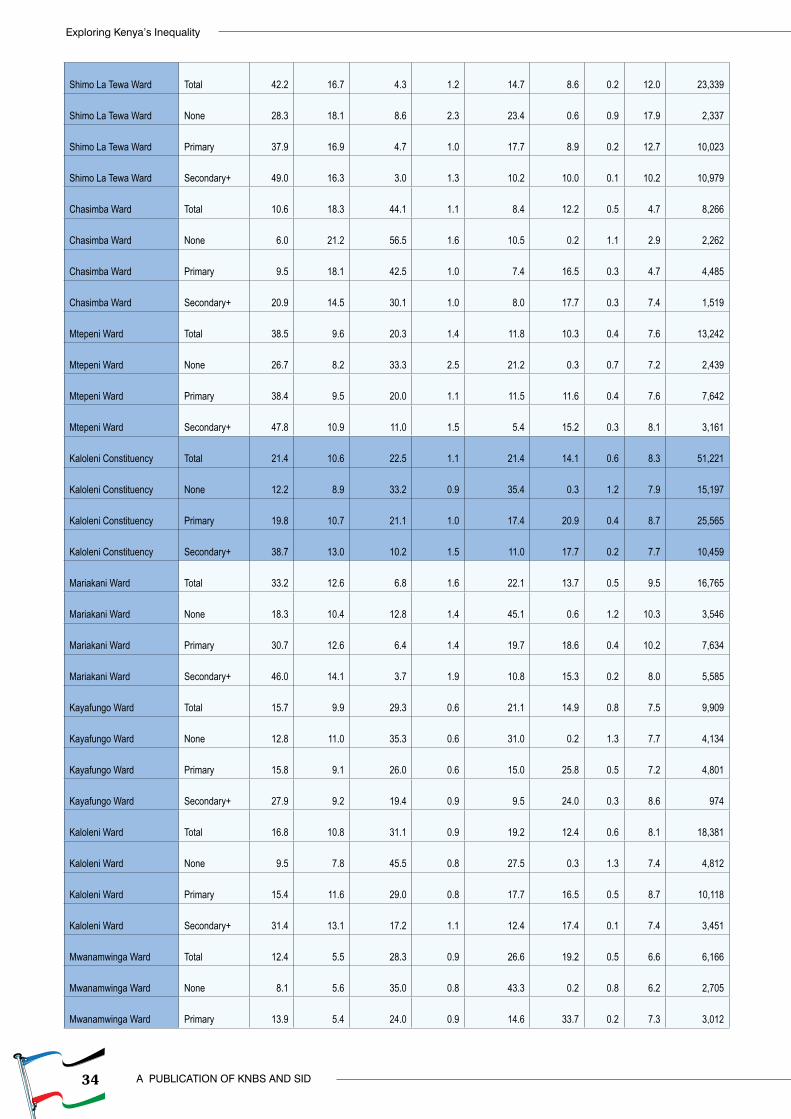
34
Exploring Kenya’s Inequality
A PUBLICATION OF KNBS AND SID
Shimo La Tewa Ward Total
42.2 16.7 4.3
1.2 14.7 8.6
0.2
12.0 23,339
Shimo La Tewa Ward None
28.3 18.1 8.6
2.3 23.4 0.6
0.9
17.9
2,337
Shimo La Tewa Ward Primary
37.9 16.9 4.7
1.0 17.7 8.9
0.2
12.7 10,023
Shimo La Tewa Ward Secondary+
49.0 16.3 3.0
1.3 10.2 10.0
0.1
10.2 10,979
Chasimba Ward Total
10.6 18.3 44.1
1.1 8.4 12.2
0.5
4.7
8,266
Chasimba Ward None
6.0 21.2 56.5
1.6 10.5 0.2
1.1
2.9
2,262
Chasimba Ward Primary
9.5 18.1 42.5
1.0 7.4 16.5
0.3
4.7
4,485
Chasimba Ward Secondary+
20.9 14.5 30.1
1.0 8.0 17.7
0.3
7.4
1,519
Mtepeni Ward Total
38.5 9.6 20.3
1.4 11.8 10.3
0.4
7.6 13,242
Mtepeni Ward None
26.7 8.2 33.3
2.5 21.2 0.3
0.7
7.2
2,439
Mtepeni Ward Primary
38.4 9.5 20.0
1.1 11.5 11.6
0.4
7.6
7,642
Mtepeni Ward Secondary+
47.8 10.9 11.0
1.5 5.4 15.2
0.3
8.1
3,161
Kaloleni Constituency Total
21.4 10.6 22.5
1.1 21.4 14.1
0.6
8.3 51,221
Kaloleni Constituency None
12.2 8.9 33.2
0.9 35.4 0.3
1.2
7.9 15,197
Kaloleni Constituency Primary
19.8 10.7 21.1
1.0 17.4 20.9
0.4
8.7 25,565
Kaloleni Constituency Secondary+
38.7 13.0 10.2
1.5 11.0 17.7
0.2
7.7 10,459
Mariakani Ward Total
33.2 12.6 6.8
1.6 22.1 13.7
0.5
9.5 16,765
Mariakani Ward None
18.3 10.4 12.8
1.4 45.1 0.6
1.2
10.3
3,546
Mariakani Ward Primary
30.7 12.6 6.4
1.4 19.7 18.6
0.4
10.2
7,634
Mariakani Ward Secondary+
46.0 14.1 3.7
1.9 10.8 15.3
0.2
8.0
5,585
Kayafungo Ward Total
15.7 9.9 29.3
0.6 21.1 14.9
0.8
7.5
9,909
Kayafungo Ward None
12.8 11.0 35.3
0.6 31.0 0.2
1.3
7.7
4,134
Kayafungo Ward Primary
15.8 9.1 26.0
0.6 15.0 25.8
0.5
7.2
4,801
Kayafungo Ward Secondary+
27.9 9.2 19.4
0.9 9.5 24.0
0.3
8.6
974
Kaloleni Ward Total
16.8 10.8 31.1
0.9 19.2 12.4
0.6
8.1 18,381
Kaloleni Ward None
9.5 7.8 45.5
0.8 27.5 0.3
1.3
7.4
4,812
Kaloleni Ward Primary
15.4 11.6 29.0
0.8 17.7 16.5
0.5
8.7 10,118
Kaloleni Ward Secondary+
31.4 13.1 17.2
1.1 12.4 17.4
0.1
7.4
3,451
Mwanamwinga Ward Total
12.4 5.5 28.3
0.9 26.6 19.2
0.5
6.6
6,166
Mwanamwinga Ward None
8.1 5.6 35.0
0.8 43.3 0.2
0.8
6.2
2,705
Mwanamwinga Ward Primary
13.9 5.4 24.0
0.9 14.6 33.7
0.2
7.3
3,012
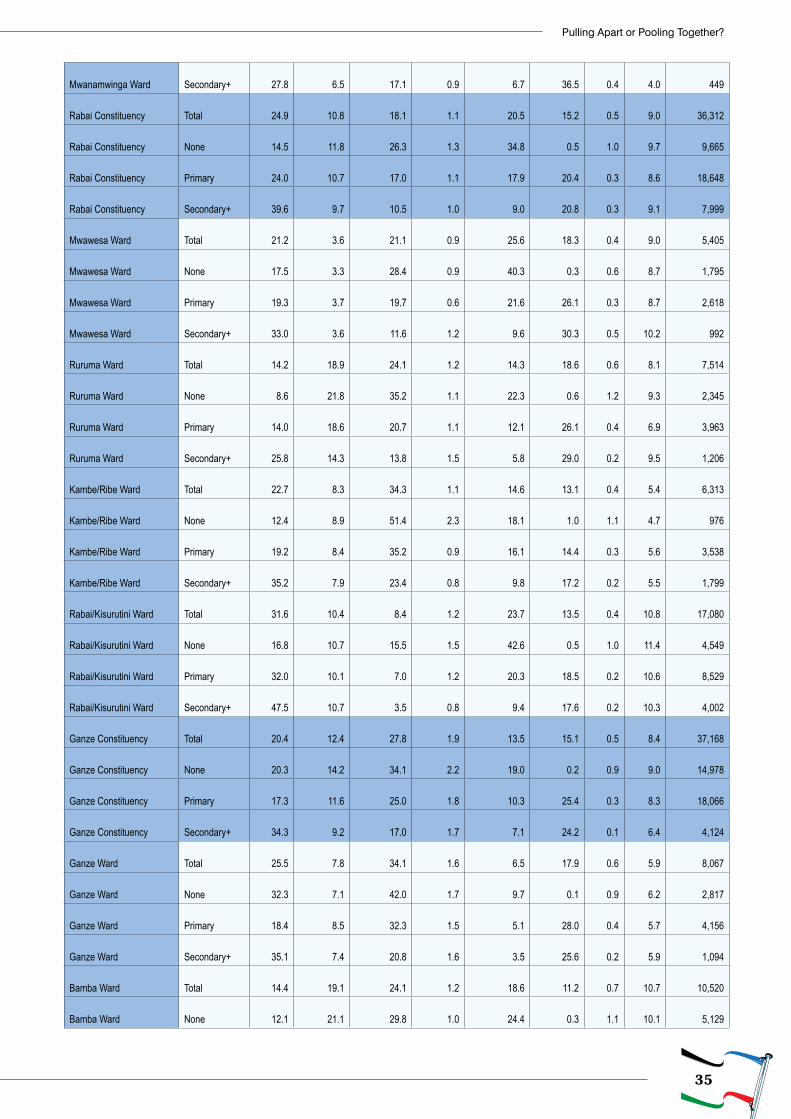
35
Pulling Apart or Pooling Together?
Mwanamwinga Ward Secondary+
27.8 6.5 17.1
0.9 6.7 36.5
0.4
4.0
449
Rabai Constituency Total
24.9 10.8 18.1
1.1 20.5 15.2
0.5
9.0 36,312
Rabai Constituency None
14.5 11.8 26.3
1.3 34.8 0.5
1.0
9.7
9,665
Rabai Constituency Primary
24.0 10.7 17.0
1.1 17.9 20.4
0.3
8.6 18,648
Rabai Constituency Secondary+
39.6 9.7 10.5
1.0 9.0 20.8
0.3
9.1
7,999
Mwawesa Ward Total
21.2 3.6 21.1
0.9 25.6 18.3
0.4
9.0
5,405
Mwawesa Ward None
17.5 3.3 28.4
0.9 40.3 0.3
0.6
8.7
1,795
Mwawesa Ward Primary
19.3 3.7 19.7
0.6 21.6 26.1
0.3
8.7
2,618
Mwawesa Ward Secondary+
33.0 3.6 11.6
1.2 9.6 30.3
0.5
10.2
992
Ruruma Ward Total
14.2 18.9 24.1
1.2 14.3 18.6
0.6
8.1
7,514
Ruruma Ward None
8.6 21.8 35.2
1.1 22.3 0.6
1.2
9.3
2,345
Ruruma Ward Primary
14.0 18.6 20.7
1.1 12.1 26.1
0.4
6.9
3,963
Ruruma Ward Secondary+
25.8 14.3 13.8
1.5 5.8 29.0
0.2
9.5
1,206
Kambe/Ribe Ward Total
22.7 8.3 34.3
1.1 14.6 13.1
0.4
5.4
6,313
Kambe/Ribe Ward None
12.4 8.9 51.4
2.3 18.1 1.0
1.1
4.7
976
Kambe/Ribe Ward Primary
19.2 8.4 35.2
0.9 16.1 14.4
0.3
5.6
3,538
Kambe/Ribe Ward Secondary+
35.2 7.9 23.4
0.8 9.8 17.2
0.2
5.5
1,799
Rabai/Kisurutini Ward Total
31.6 10.4 8.4
1.2 23.7 13.5
0.4
10.8 17,080
Rabai/Kisurutini Ward None
16.8 10.7 15.5
1.5 42.6 0.5
1.0
11.4
4,549
Rabai/Kisurutini Ward Primary
32.0 10.1 7.0
1.2 20.3 18.5
0.2
10.6
8,529
Rabai/Kisurutini Ward Secondary+
47.5 10.7 3.5
0.8 9.4 17.6
0.2
10.3
4,002
Ganze Constituency Total
20.4 12.4 27.8
1.9 13.5 15.1
0.5
8.4 37,168
Ganze Constituency None
20.3 14.2 34.1
2.2 19.0 0.2
0.9
9.0 14,978
Ganze Constituency Primary
17.3 11.6 25.0
1.8 10.3 25.4
0.3
8.3 18,066
Ganze Constituency Secondary+
34.3 9.2 17.0
1.7 7.1 24.2
0.1
6.4
4,124
Ganze Ward Total
25.5 7.8 34.1
1.6 6.5 17.9
0.6
5.9
8,067
Ganze Ward None
32.3 7.1 42.0
1.7 9.7 0.1
0.9
6.2
2,817
Ganze Ward Primary
18.4 8.5 32.3
1.5 5.1 28.0
0.4
5.7
4,156
Ganze Ward Secondary+
35.1 7.4 20.8
1.6 3.5 25.6
0.2
5.9
1,094
Bamba Ward Total
14.4 19.1 24.1
1.2 18.6 11.2
0.7
10.7 10,520
Bamba Ward None
12.1 21.1 29.8
1.0 24.4 0.3
1.1
10.1
5,129
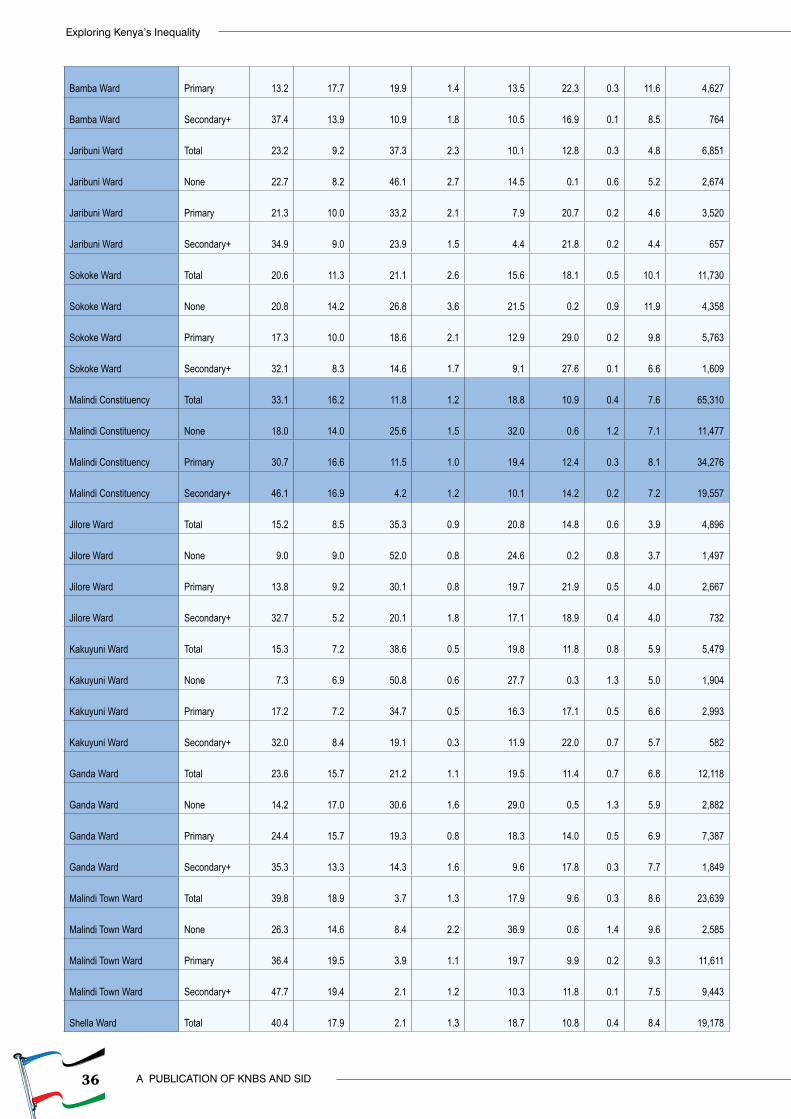
36
Exploring Kenya’s Inequality
A PUBLICATION OF KNBS AND SID
Bamba Ward Primary
13.2 17.7 19.9
1.4 13.5 22.3
0.3
11.6
4,627
Bamba Ward Secondary+
37.4 13.9 10.9
1.8 10.5 16.9
0.1
8.5
764
Jaribuni Ward Total
23.2 9.2 37.3
2.3 10.1 12.8
0.3
4.8
6,851
Jaribuni Ward None
22.7 8.2 46.1
2.7 14.5 0.1
0.6
5.2
2,674
Jaribuni Ward Primary
21.3 10.0 33.2
2.1 7.9 20.7
0.2
4.6
3,520
Jaribuni Ward Secondary+
34.9 9.0 23.9
1.5 4.4 21.8
0.2
4.4
657
Sokoke Ward Total
20.6 11.3 21.1
2.6 15.6 18.1
0.5
10.1 11,730
Sokoke Ward None
20.8 14.2 26.8
3.6 21.5 0.2
0.9
11.9
4,358
Sokoke Ward Primary
17.3 10.0 18.6
2.1 12.9 29.0
0.2
9.8
5,763
Sokoke Ward Secondary+
32.1 8.3 14.6
1.7 9.1 27.6
0.1
6.6
1,609
Malindi Constituency Total
33.1 16.2 11.8
1.2 18.8 10.9
0.4
7.6 65,310
Malindi Constituency None
18.0 14.0 25.6
1.5 32.0 0.6
1.2
7.1 11,477
Malindi Constituency Primary
30.7 16.6 11.5
1.0 19.4 12.4
0.3
8.1 34,276
Malindi Constituency Secondary+
46.1 16.9 4.2
1.2 10.1 14.2
0.2
7.2 19,557
Jilore Ward Total
15.2 8.5 35.3
0.9 20.8 14.8
0.6
3.9
4,896
Jilore Ward None
9.0 9.0 52.0
0.8 24.6 0.2
0.8
3.7
1,497
Jilore Ward Primary
13.8 9.2 30.1
0.8 19.7 21.9
0.5
4.0
2,667
Jilore Ward Secondary+
32.7 5.2 20.1
1.8 17.1 18.9
0.4
4.0
732
Kakuyuni Ward Total
15.3 7.2 38.6
0.5 19.8 11.8
0.8
5.9
5,479
Kakuyuni Ward None
7.3 6.9 50.8
0.6 27.7 0.3
1.3
5.0
1,904
Kakuyuni Ward Primary
17.2 7.2 34.7
0.5 16.3 17.1
0.5
6.6
2,993
Kakuyuni Ward Secondary+
32.0 8.4 19.1
0.3 11.9 22.0
0.7
5.7
582
Ganda Ward Total
23.6 15.7 21.2
1.1 19.5 11.4
0.7
6.8 12,118
Ganda Ward None
14.2 17.0 30.6
1.6 29.0 0.5
1.3
5.9
2,882
Ganda Ward Primary
24.4 15.7 19.3
0.8 18.3 14.0
0.5
6.9
7,387
Ganda Ward Secondary+
35.3 13.3 14.3
1.6 9.6 17.8
0.3
7.7
1,849
Malindi Town Ward Total
39.8 18.9 3.7
1.3 17.9 9.6
0.3
8.6 23,639
Malindi Town Ward None
26.3 14.6 8.4
2.2 36.9 0.6
1.4
9.6
2,585
Malindi Town Ward Primary
36.4 19.5 3.9
1.1 19.7 9.9
0.2
9.3 11,611
Malindi Town Ward Secondary+
47.7 19.4 2.1
1.2 10.3 11.8
0.1
7.5
9,443
Shella Ward Total
40.4 17.9 2.1
1.3 18.7 10.8
0.4
8.4 19,178
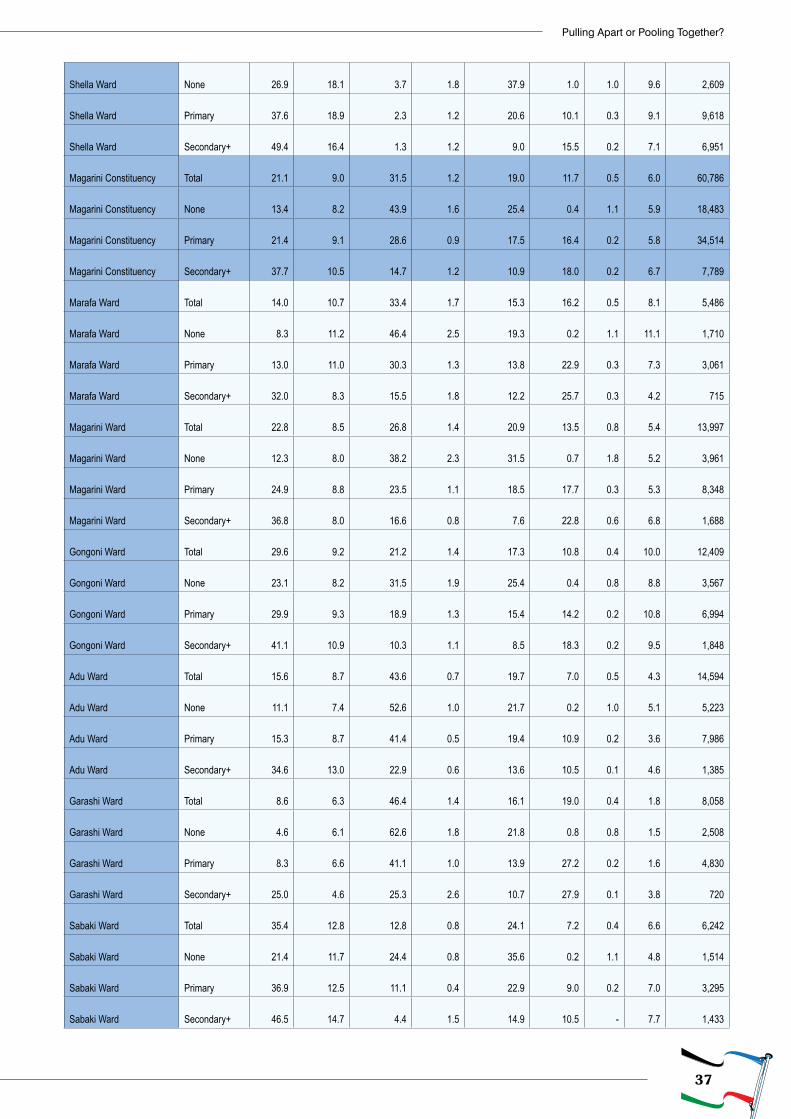
37
Pulling Apart or Pooling Together?
Shella Ward None
26.9 18.1 3.7
1.8 37.9 1.0
1.0
9.6
2,609
Shella Ward Primary
37.6 18.9 2.3
1.2 20.6 10.1
0.3
9.1
9,618
Shella Ward Secondary+
49.4 16.4 1.3
1.2 9.0 15.5
0.2
7.1
6,951
Magarini Constituency Total
21.1 9.0 31.5
1.2 19.0 11.7
0.5
6.0 60,786
Magarini Constituency None
13.4 8.2 43.9
1.6 25.4 0.4
1.1
5.9 18,483
Magarini Constituency Primary
21.4 9.1 28.6
0.9 17.5 16.4
0.2
5.8 34,514
Magarini Constituency Secondary+
37.7 10.5 14.7
1.2 10.9 18.0
0.2
6.7
7,789
Marafa Ward Total
14.0 10.7 33.4
1.7 15.3 16.2
0.5
8.1
5,486
Marafa Ward None
8.3 11.2 46.4
2.5 19.3 0.2
1.1
11.1
1,710
Marafa Ward Primary
13.0 11.0 30.3
1.3 13.8 22.9
0.3
7.3
3,061
Marafa Ward Secondary+
32.0 8.3 15.5
1.8 12.2 25.7
0.3
4.2
715
Magarini Ward Total
22.8 8.5 26.8
1.4 20.9 13.5
0.8
5.4 13,997
Magarini Ward None
12.3 8.0 38.2
2.3 31.5 0.7
1.8
5.2
3,961
Magarini Ward Primary
24.9 8.8 23.5
1.1 18.5 17.7
0.3
5.3
8,348
Magarini Ward Secondary+
36.8 8.0 16.6
0.8 7.6 22.8
0.6
6.8
1,688
Gongoni Ward Total
29.6 9.2 21.2
1.4 17.3 10.8
0.4
10.0 12,409
Gongoni Ward None
23.1 8.2 31.5
1.9 25.4 0.4
0.8
8.8
3,567
Gongoni Ward Primary
29.9 9.3 18.9
1.3 15.4 14.2
0.2
10.8
6,994
Gongoni Ward Secondary+
41.1 10.9 10.3
1.1 8.5 18.3
0.2
9.5
1,848
Adu Ward Total
15.6 8.7 43.6
0.7 19.7 7.0
0.5
4.3 14,594
Adu Ward None
11.1 7.4 52.6
1.0 21.7 0.2
1.0
5.1
5,223
Adu Ward Primary
15.3 8.7 41.4
0.5 19.4 10.9
0.2
3.6
7,986
Adu Ward Secondary+
34.6 13.0 22.9
0.6 13.6 10.5
0.1
4.6
1,385
Garashi Ward Total
8.6 6.3 46.4
1.4 16.1 19.0
0.4
1.8
8,058
Garashi Ward None
4.6 6.1 62.6
1.8 21.8 0.8
0.8
1.5
2,508
Garashi Ward Primary
8.3 6.6 41.1
1.0 13.9 27.2
0.2
1.6
4,830
Garashi Ward Secondary+
25.0 4.6 25.3
2.6 10.7 27.9
0.1
3.8
720
Sabaki Ward Total
35.4 12.8 12.8
0.8 24.1 7.2
0.4
6.6
6,242
Sabaki Ward None
21.4 11.7 24.4
0.8 35.6 0.2
1.1
4.8
1,514
Sabaki Ward Primary
36.9 12.5 11.1
0.4 22.9 9.0
0.2
7.0
3,295
Sabaki Ward Secondary+
46.5 14.7 4.4
1.5 14.9 10.5
-
7.7
1,433
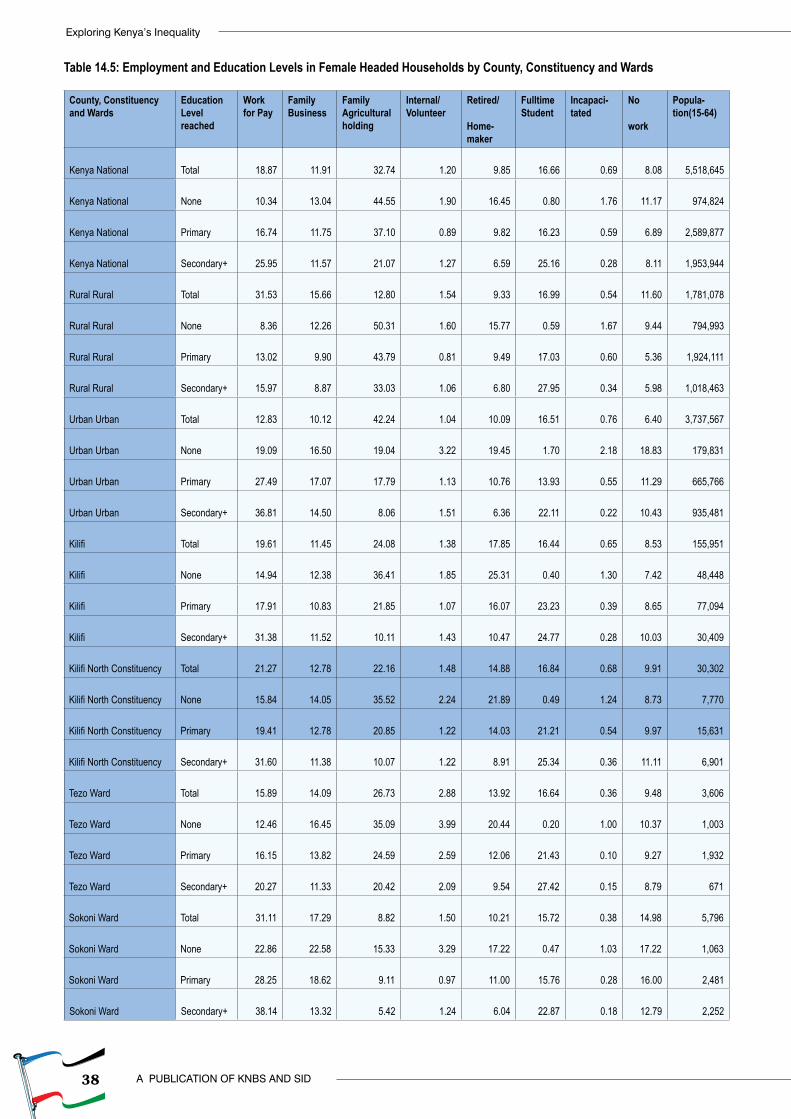
38
Exploring Kenya’s Inequality
A PUBLICATION OF KNBS AND SID
Table 14.5: Employment and Education Levels in Female Headed Households by County, Constituency and Wards
County, Constituency and Wards
Education Level reached
Work for Pay
Family Business
Family Agricultural holding
Internal/ Volunteer
Retired/
Home-maker
Fulltime Student
Incapaci-tated
No
work
Popula-tion(15-64)
Kenya National Total 18.87 11.91 32.74 1.20 9.85
16.66 0.69
8.08 5,518,645
Kenya National None 10.34 13.04 44.55 1.90 16.45
0.80 1.76
11.17 974,824
Kenya National Primary 16.74 11.75 37.10 0.89 9.82
16.23 0.59
6.89 2,589,877
Kenya National Secondary+ 25.95 11.57 21.07 1.27 6.59
25.16 0.28
8.11 1,953,944
Rural Rural Total 31.53 15.66 12.80 1.54 9.33
16.99 0.54
11.60 1,781,078
Rural Rural None
8.36 12.26 50.31 1.60 15.77
0.59 1.67
9.44 794,993
Rural Rural Primary 13.02 9.90 43.79 0.81 9.49
17.03 0.60
5.36 1,924,111
Rural Rural Secondary+ 15.97 8.87 33.03 1.06 6.80
27.95 0.34
5.98 1,018,463
Urban Urban Total 12.83 10.12 42.24 1.04 10.09
16.51 0.76
6.40 3,737,567
Urban Urban None 19.09 16.50 19.04 3.22 19.45
1.70 2.18
18.83 179,831
Urban Urban Primary 27.49 17.07 17.79 1.13 10.76
13.93 0.55
11.29 665,766
Urban Urban Secondary+ 36.81 14.50 8.06 1.51 6.36
22.11 0.22
10.43 935,481
Kilifi Total 19.61 11.45 24.08 1.38 17.85
16.44 0.65
8.53 155,951
Kilifi None 14.94 12.38 36.41 1.85 25.31
0.40 1.30
7.42 48,448
Kilifi Primary 17.91 10.83 21.85 1.07 16.07
23.23 0.39
8.65 77,094
Kilifi Secondary+ 31.38 11.52 10.11 1.43 10.47
24.77 0.28
10.03 30,409
Kilifi North Constituency Total 21.27 12.78 22.16 1.48 14.88
16.84 0.68
9.91 30,302
Kilifi North Constituency None 15.84 14.05 35.52 2.24 21.89
0.49 1.24
8.73 7,770
Kilifi North Constituency Primary 19.41 12.78 20.85 1.22 14.03
21.21 0.54
9.97 15,631
Kilifi North Constituency Secondary+ 31.60 11.38 10.07 1.22 8.91
25.34 0.36
11.11 6,901
Tezo Ward Total 15.89 14.09 26.73 2.88 13.92
16.64 0.36
9.48 3,606
Tezo Ward None 12.46 16.45 35.09 3.99 20.44
0.20 1.00
10.37 1,003
Tezo Ward Primary 16.15 13.82 24.59 2.59 12.06
21.43 0.10
9.27 1,932
Tezo Ward Secondary+ 20.27 11.33 20.42 2.09 9.54
27.42 0.15
8.79 671
Sokoni Ward Total 31.11 17.29 8.82 1.50 10.21
15.72 0.38
14.98 5,796
Sokoni Ward None 22.86 22.58 15.33 3.29 17.22
0.47 1.03
17.22 1,063
Sokoni Ward Primary 28.25 18.62 9.11 0.97 11.00
15.76 0.28
16.00 2,481
Sokoni Ward Secondary+ 38.14 13.32 5.42 1.24 6.04
22.87 0.18
12.79 2,252
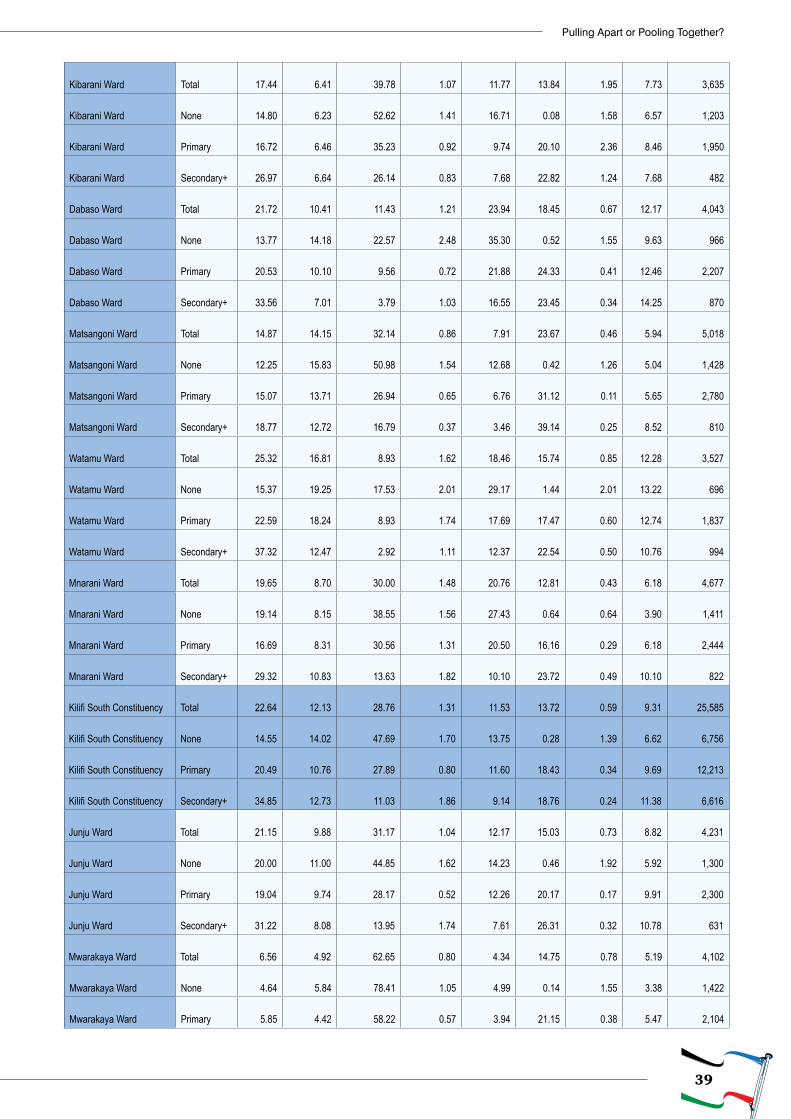
39
Pulling Apart or Pooling Together?
Kibarani Ward Total 17.44 6.41 39.78 1.07 11.77
13.84 1.95
7.73 3,635
Kibarani Ward None 14.80 6.23 52.62 1.41 16.71
0.08 1.58
6.57 1,203
Kibarani Ward Primary 16.72 6.46 35.23 0.92 9.74
20.10 2.36
8.46 1,950
Kibarani Ward Secondary+ 26.97 6.64 26.14 0.83 7.68
22.82 1.24
7.68 482
Dabaso Ward Total 21.72 10.41 11.43 1.21 23.94
18.45 0.67
12.17 4,043
Dabaso Ward None 13.77 14.18 22.57 2.48 35.30
0.52 1.55
9.63 966
Dabaso Ward Primary 20.53 10.10 9.56 0.72 21.88
24.33 0.41
12.46 2,207
Dabaso Ward Secondary+ 33.56 7.01 3.79 1.03 16.55
23.45 0.34
14.25 870
Matsangoni Ward Total 14.87 14.15 32.14 0.86 7.91
23.67 0.46
5.94 5,018
Matsangoni Ward None 12.25 15.83 50.98 1.54 12.68
0.42 1.26
5.04 1,428
Matsangoni Ward Primary 15.07 13.71 26.94 0.65 6.76
31.12 0.11
5.65 2,780
Matsangoni Ward Secondary+ 18.77 12.72 16.79 0.37 3.46
39.14 0.25
8.52 810
Watamu Ward Total 25.32 16.81 8.93 1.62 18.46
15.74 0.85
12.28 3,527
Watamu Ward None 15.37 19.25 17.53 2.01 29.17
1.44 2.01
13.22 696
Watamu Ward Primary 22.59 18.24 8.93 1.74 17.69
17.47 0.60
12.74 1,837
Watamu Ward Secondary+ 37.32 12.47 2.92 1.11 12.37
22.54 0.50
10.76 994
Mnarani Ward Total 19.65 8.70 30.00 1.48 20.76
12.81 0.43
6.18 4,677
Mnarani Ward None 19.14 8.15 38.55 1.56 27.43
0.64 0.64
3.90 1,411
Mnarani Ward Primary 16.69 8.31 30.56 1.31 20.50
16.16 0.29
6.18 2,444
Mnarani Ward Secondary+ 29.32 10.83 13.63 1.82 10.10
23.72 0.49
10.10 822
Kilifi South Constituency Total 22.64 12.13 28.76 1.31 11.53
13.72 0.59
9.31 25,585
Kilifi South Constituency None 14.55 14.02 47.69 1.70 13.75
0.28 1.39
6.62 6,756
Kilifi South Constituency Primary 20.49 10.76 27.89 0.80 11.60
18.43 0.34
9.69 12,213
Kilifi South Constituency Secondary+ 34.85 12.73 11.03 1.86 9.14
18.76 0.24
11.38 6,616
Junju Ward Total 21.15 9.88 31.17 1.04 12.17
15.03 0.73
8.82 4,231
Junju Ward None 20.00 11.00 44.85 1.62 14.23
0.46 1.92
5.92 1,300
Junju Ward Primary 19.04 9.74 28.17 0.52 12.26
20.17 0.17
9.91 2,300
Junju Ward Secondary+ 31.22 8.08 13.95 1.74 7.61
26.31 0.32
10.78 631
Mwarakaya Ward Total
6.56 4.92 62.65 0.80 4.34 14.75 0.78
5.19 4,102
Mwarakaya Ward None
4.64 5.84 78.41 1.05 4.99
0.14 1.55
3.38 1,422
Mwarakaya Ward Primary
5.85 4.42 58.22 0.57 3.94 21.15 0.38
5.47 2,104
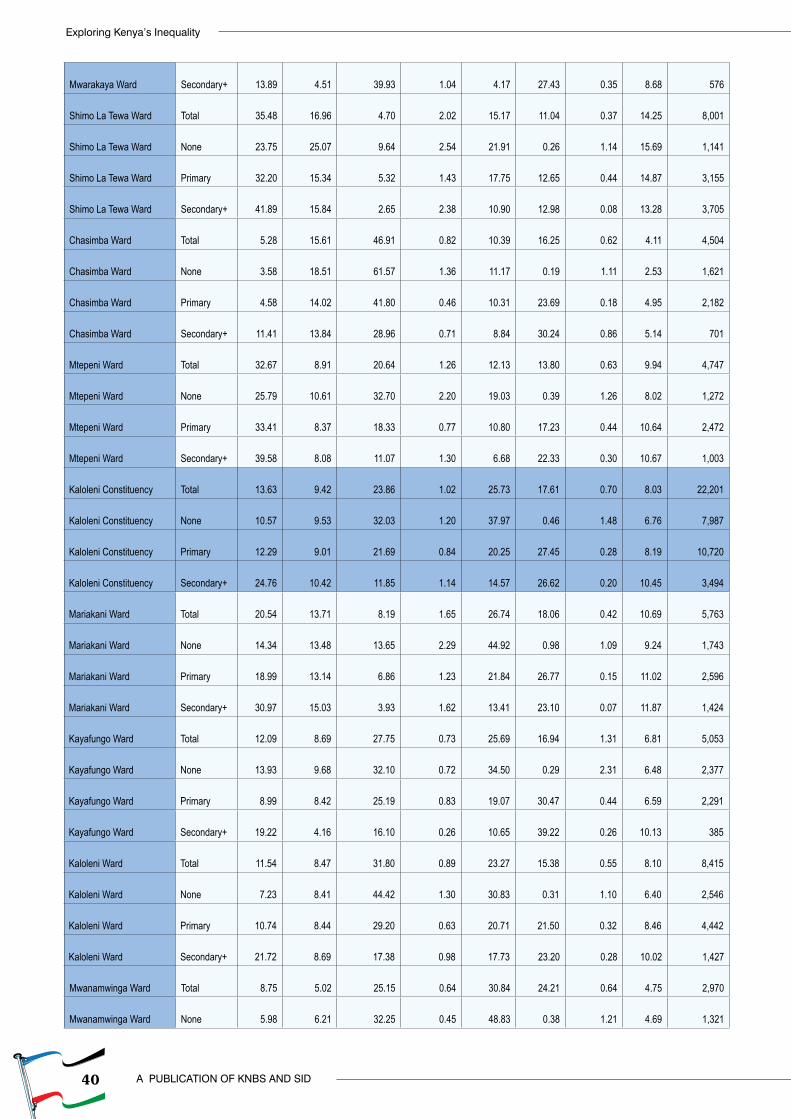
40
Exploring Kenya’s Inequality
A PUBLICATION OF KNBS AND SID
Mwarakaya Ward Secondary+ 13.89 4.51 39.93 1.04 4.17
27.43 0.35
8.68 576
Shimo La Tewa Ward Total 35.48 16.96 4.70 2.02 15.17
11.04 0.37
14.25 8,001
Shimo La Tewa Ward None 23.75 25.07 9.64 2.54 21.91
0.26 1.14
15.69 1,141
Shimo La Tewa Ward Primary 32.20 15.34 5.32 1.43 17.75
12.65 0.44
14.87 3,155
Shimo La Tewa Ward Secondary+ 41.89 15.84 2.65 2.38 10.90
12.98 0.08
13.28 3,705
Chasimba Ward Total
5.28 15.61 46.91 0.82 10.39 16.25 0.62
4.11 4,504
Chasimba Ward None
3.58 18.51 61.57 1.36 11.17
0.19 1.11
2.53 1,621
Chasimba Ward Primary
4.58 14.02 41.80 0.46 10.31 23.69 0.18
4.95 2,182
Chasimba Ward Secondary+ 11.41 13.84 28.96 0.71 8.84
30.24 0.86
5.14 701
Mtepeni Ward Total 32.67 8.91 20.64 1.26 12.13
13.80 0.63
9.94 4,747
Mtepeni Ward None 25.79 10.61 32.70 2.20 19.03
0.39 1.26
8.02 1,272
Mtepeni Ward Primary 33.41 8.37 18.33 0.77 10.80
17.23 0.44
10.64 2,472
Mtepeni Ward Secondary+ 39.58 8.08 11.07 1.30 6.68
22.33 0.30
10.67 1,003
Kaloleni Constituency Total 13.63 9.42 23.86 1.02 25.73
17.61 0.70
8.03 22,201
Kaloleni Constituency None 10.57 9.53 32.03 1.20 37.97
0.46 1.48
6.76 7,987
Kaloleni Constituency Primary 12.29 9.01 21.69 0.84 20.25
27.45 0.28
8.19 10,720
Kaloleni Constituency Secondary+ 24.76 10.42 11.85 1.14 14.57
26.62 0.20
10.45 3,494
Mariakani Ward Total 20.54 13.71 8.19 1.65 26.74
18.06 0.42
10.69 5,763
Mariakani Ward None 14.34 13.48 13.65 2.29 44.92
0.98 1.09
9.24 1,743
Mariakani Ward Primary 18.99 13.14 6.86 1.23 21.84
26.77 0.15
11.02 2,596
Mariakani Ward Secondary+ 30.97 15.03 3.93 1.62 13.41
23.10 0.07
11.87 1,424
Kayafungo Ward Total 12.09 8.69 27.75 0.73 25.69
16.94 1.31
6.81 5,053
Kayafungo Ward None 13.93 9.68 32.10 0.72 34.50
0.29 2.31
6.48 2,377
Kayafungo Ward Primary
8.99 8.42 25.19 0.83 19.07 30.47 0.44
6.59 2,291
Kayafungo Ward Secondary+ 19.22 4.16 16.10 0.26 10.65
39.22 0.26
10.13 385
Kaloleni Ward Total 11.54 8.47 31.80 0.89 23.27
15.38 0.55
8.10 8,415
Kaloleni Ward None
7.23 8.41 44.42 1.30 30.83
0.31 1.10
6.40 2,546
Kaloleni Ward Primary 10.74 8.44 29.20 0.63 20.71
21.50 0.32
8.46 4,442
Kaloleni Ward Secondary+ 21.72 8.69 17.38 0.98 17.73
23.20 0.28
10.02 1,427
Mwanamwinga Ward Total
8.75 5.02 25.15 0.64 30.84 24.21 0.64
4.75 2,970
Mwanamwinga Ward None
5.98 6.21 32.25 0.45 48.83
0.38 1.21
4.69 1,321
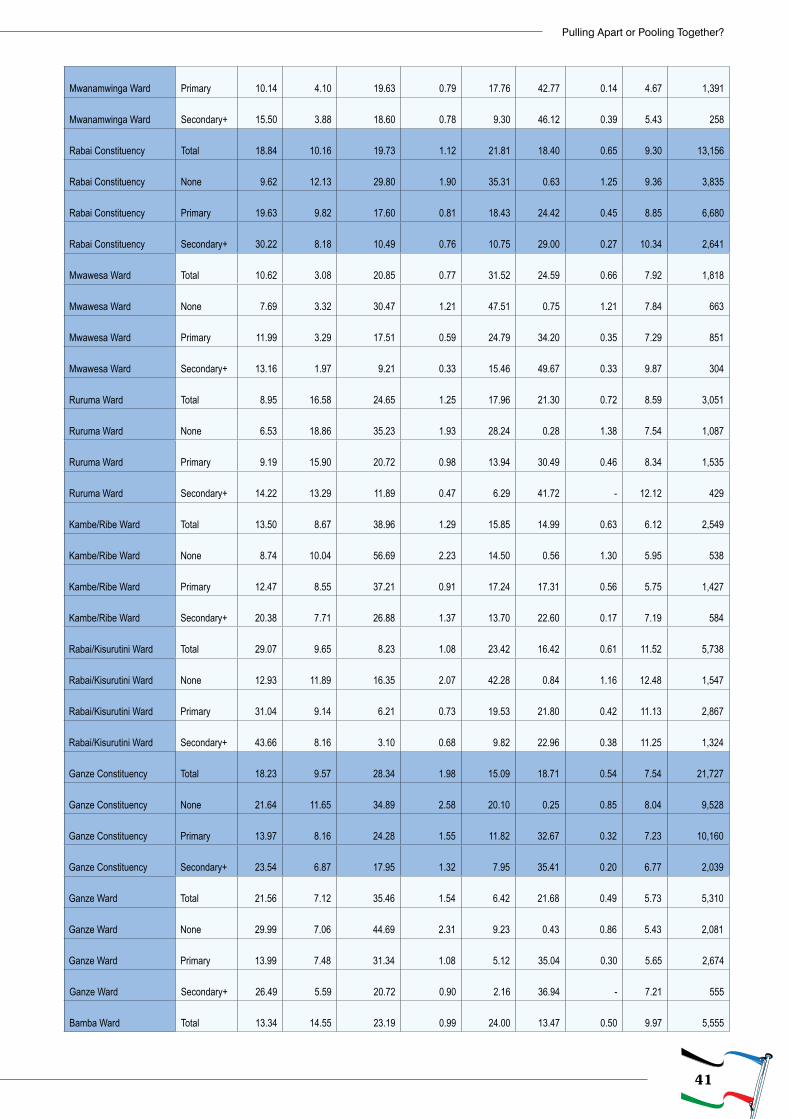
41
Pulling Apart or Pooling Together?
Mwanamwinga Ward Primary 10.14 4.10 19.63 0.79 17.76
42.77 0.14
4.67 1,391
Mwanamwinga Ward Secondary+ 15.50 3.88 18.60 0.78 9.30
46.12 0.39
5.43 258
Rabai Constituency Total 18.84 10.16 19.73 1.12 21.81
18.40 0.65
9.30 13,156
Rabai Constituency None
9.62 12.13 29.80 1.90 35.31
0.63 1.25
9.36 3,835
Rabai Constituency Primary 19.63 9.82 17.60 0.81 18.43
24.42 0.45
8.85 6,680
Rabai Constituency Secondary+ 30.22 8.18 10.49 0.76 10.75
29.00 0.27
10.34 2,641
Mwawesa Ward Total 10.62 3.08 20.85 0.77 31.52
24.59 0.66
7.92 1,818
Mwawesa Ward None
7.69 3.32 30.47 1.21 47.51
0.75 1.21
7.84 663
Mwawesa Ward Primary 11.99 3.29 17.51 0.59 24.79
34.20 0.35
7.29 851
Mwawesa Ward Secondary+ 13.16 1.97 9.21 0.33 15.46
49.67 0.33
9.87 304
Ruruma Ward Total
8.95 16.58 24.65 1.25 17.96 21.30 0.72
8.59 3,051
Ruruma Ward None
6.53 18.86 35.23 1.93 28.24
0.28 1.38
7.54 1,087
Ruruma Ward Primary
9.19 15.90 20.72 0.98 13.94 30.49 0.46
8.34 1,535
Ruruma Ward Secondary+ 14.22 13.29 11.89 0.47 6.29
41.72 -
12.12 429
Kambe/Ribe Ward Total 13.50 8.67 38.96 1.29 15.85
14.99 0.63
6.12 2,549
Kambe/Ribe Ward None
8.74 10.04 56.69 2.23 14.50
0.56 1.30
5.95 538
Kambe/Ribe Ward Primary 12.47 8.55 37.21 0.91 17.24
17.31 0.56
5.75 1,427
Kambe/Ribe Ward Secondary+ 20.38 7.71 26.88 1.37 13.70
22.60 0.17
7.19 584
Rabai/Kisurutini Ward Total 29.07 9.65 8.23 1.08 23.42
16.42 0.61
11.52 5,738
Rabai/Kisurutini Ward None 12.93 11.89 16.35 2.07 42.28
0.84 1.16
12.48 1,547
Rabai/Kisurutini Ward Primary 31.04 9.14 6.21 0.73 19.53
21.80 0.42
11.13 2,867
Rabai/Kisurutini Ward Secondary+ 43.66 8.16 3.10 0.68 9.82
22.96 0.38
11.25 1,324
Ganze Constituency Total 18.23 9.57 28.34 1.98 15.09
18.71 0.54
7.54 21,727
Ganze Constituency None 21.64 11.65 34.89 2.58 20.10
0.25 0.85
8.04 9,528
Ganze Constituency Primary 13.97 8.16 24.28 1.55 11.82
32.67 0.32
7.23 10,160
Ganze Constituency Secondary+ 23.54 6.87 17.95 1.32 7.95
35.41 0.20
6.77 2,039
Ganze Ward Total 21.56 7.12 35.46 1.54 6.42
21.68 0.49
5.73 5,310
Ganze Ward None 29.99 7.06 44.69 2.31 9.23
0.43 0.86
5.43 2,081
Ganze Ward Primary 13.99 7.48 31.34 1.08 5.12
35.04 0.30
5.65 2,674
Ganze Ward Secondary+ 26.49 5.59 20.72 0.90 2.16
36.94 -
7.21 555
Bamba Ward Total 13.34 14.55 23.19 0.99 24.00
13.47 0.50
9.97 5,555
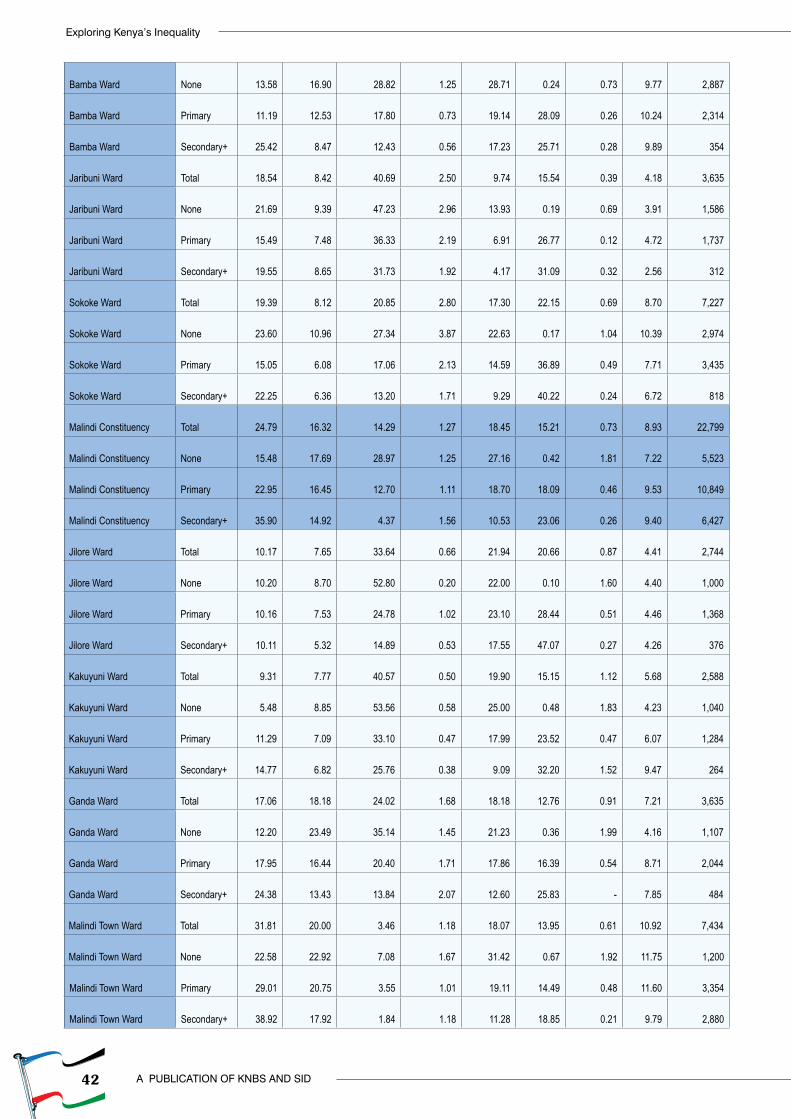
42
Exploring Kenya’s Inequality
A PUBLICATION OF KNBS AND SID
Bamba Ward None 13.58 16.90 28.82 1.25 28.71
0.24 0.73
9.77 2,887
Bamba Ward Primary 11.19 12.53 17.80 0.73 19.14
28.09 0.26
10.24 2,314
Bamba Ward Secondary+ 25.42 8.47 12.43 0.56 17.23
25.71 0.28
9.89 354
Jaribuni Ward Total 18.54 8.42 40.69 2.50 9.74
15.54 0.39
4.18 3,635
Jaribuni Ward None 21.69 9.39 47.23 2.96 13.93
0.19 0.69
3.91 1,586
Jaribuni Ward Primary 15.49 7.48 36.33 2.19 6.91
26.77 0.12
4.72 1,737
Jaribuni Ward Secondary+ 19.55 8.65 31.73 1.92 4.17
31.09 0.32
2.56 312
Sokoke Ward Total 19.39 8.12 20.85 2.80 17.30
22.15 0.69
8.70 7,227
Sokoke Ward None 23.60 10.96 27.34 3.87 22.63
0.17 1.04
10.39 2,974
Sokoke Ward Primary 15.05 6.08 17.06 2.13 14.59
36.89 0.49
7.71 3,435
Sokoke Ward Secondary+ 22.25 6.36 13.20 1.71 9.29
40.22 0.24
6.72 818
Malindi Constituency Total 24.79 16.32 14.29 1.27 18.45
15.21 0.73
8.93 22,799
Malindi Constituency None 15.48 17.69 28.97 1.25 27.16
0.42 1.81
7.22 5,523
Malindi Constituency Primary 22.95 16.45 12.70 1.11 18.70
18.09 0.46
9.53 10,849
Malindi Constituency Secondary+ 35.90 14.92 4.37 1.56 10.53
23.06 0.26
9.40 6,427
Jilore Ward Total 10.17 7.65 33.64 0.66 21.94
20.66 0.87
4.41 2,744
Jilore Ward None 10.20 8.70 52.80 0.20 22.00
0.10 1.60
4.40 1,000
Jilore Ward Primary 10.16 7.53 24.78 1.02 23.10
28.44 0.51
4.46 1,368
Jilore Ward Secondary+ 10.11 5.32 14.89 0.53 17.55
47.07 0.27
4.26 376
Kakuyuni Ward Total
9.31 7.77 40.57 0.50 19.90 15.15 1.12
5.68 2,588
Kakuyuni Ward None
5.48 8.85 53.56 0.58 25.00
0.48 1.83
4.23 1,040
Kakuyuni Ward Primary 11.29 7.09 33.10 0.47 17.99
23.52 0.47
6.07 1,284
Kakuyuni Ward Secondary+ 14.77 6.82 25.76 0.38 9.09
32.20 1.52
9.47 264
Ganda Ward Total 17.06 18.18 24.02 1.68 18.18
12.76 0.91
7.21 3,635
Ganda Ward None 12.20 23.49 35.14 1.45 21.23
0.36 1.99
4.16 1,107
Ganda Ward Primary 17.95 16.44 20.40 1.71 17.86
16.39 0.54
8.71 2,044
Ganda Ward Secondary+ 24.38 13.43 13.84 2.07 12.60
25.83 -
7.85 484
Malindi Town Ward Total 31.81 20.00 3.46 1.18 18.07
13.95 0.61
10.92 7,434
Malindi Town Ward None 22.58 22.92 7.08 1.67 31.42
0.67 1.92
11.75 1,200
Malindi Town Ward Primary 29.01 20.75 3.55 1.01 19.11
14.49 0.48
11.60 3,354
Malindi Town Ward Secondary+ 38.92 17.92 1.84 1.18 11.28
18.85 0.21
9.79 2,880
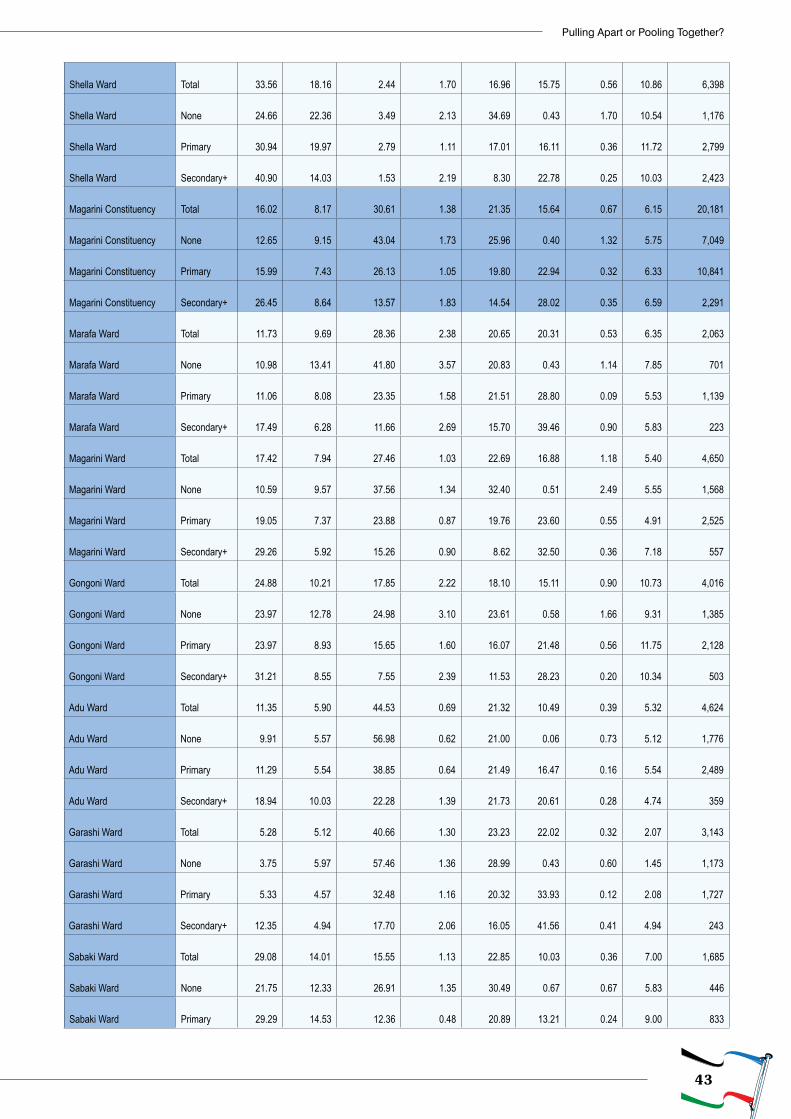
43
Pulling Apart or Pooling Together?
Shella Ward Total 33.56 18.16 2.44 1.70 16.96
15.75 0.56
10.86 6,398
Shella Ward None 24.66 22.36 3.49 2.13 34.69
0.43 1.70
10.54 1,176
Shella Ward Primary 30.94 19.97 2.79 1.11 17.01
16.11 0.36
11.72 2,799
Shella Ward Secondary+ 40.90 14.03 1.53 2.19 8.30
22.78 0.25
10.03 2,423
Magarini Constituency Total 16.02 8.17 30.61 1.38 21.35
15.64 0.67
6.15 20,181
Magarini Constituency None 12.65 9.15 43.04 1.73 25.96
0.40 1.32
5.75 7,049
Magarini Constituency Primary 15.99 7.43 26.13 1.05 19.80
22.94 0.32
6.33 10,841
Magarini Constituency Secondary+ 26.45 8.64 13.57 1.83 14.54
28.02 0.35
6.59 2,291
Marafa Ward Total 11.73 9.69 28.36 2.38 20.65
20.31 0.53
6.35 2,063
Marafa Ward None 10.98 13.41 41.80 3.57 20.83
0.43 1.14
7.85 701
Marafa Ward Primary 11.06 8.08 23.35 1.58 21.51
28.80 0.09
5.53 1,139
Marafa Ward Secondary+ 17.49 6.28 11.66 2.69 15.70
39.46 0.90
5.83 223
Magarini Ward Total 17.42 7.94 27.46 1.03 22.69
16.88 1.18
5.40 4,650
Magarini Ward None 10.59 9.57 37.56 1.34 32.40
0.51 2.49
5.55 1,568
Magarini Ward Primary 19.05 7.37 23.88 0.87 19.76
23.60 0.55
4.91 2,525
Magarini Ward Secondary+ 29.26 5.92 15.26 0.90 8.62
32.50 0.36
7.18 557
Gongoni Ward Total 24.88 10.21 17.85 2.22 18.10
15.11 0.90
10.73 4,016
Gongoni Ward None 23.97 12.78 24.98 3.10 23.61
0.58 1.66
9.31 1,385
Gongoni Ward Primary 23.97 8.93 15.65 1.60 16.07
21.48 0.56
11.75 2,128
Gongoni Ward Secondary+ 31.21 8.55 7.55 2.39 11.53
28.23 0.20
10.34 503
Adu Ward Total 11.35 5.90 44.53 0.69 21.32
10.49 0.39
5.32 4,624
Adu Ward None
9.91 5.57 56.98 0.62 21.00
0.06 0.73
5.12 1,776
Adu Ward Primary 11.29 5.54 38.85 0.64 21.49
16.47 0.16
5.54 2,489
Adu Ward Secondary+ 18.94 10.03 22.28 1.39 21.73
20.61 0.28
4.74 359
Garashi Ward Total
5.28 5.12 40.66 1.30 23.23 22.02 0.32
2.07 3,143
Garashi Ward None
3.75 5.97 57.46 1.36 28.99
0.43 0.60
1.45 1,173
Garashi Ward Primary
5.33 4.57 32.48 1.16 20.32 33.93 0.12
2.08 1,727
Garashi Ward Secondary+ 12.35 4.94 17.70 2.06 16.05
41.56 0.41
4.94 243
Sabaki Ward Total 29.08 14.01 15.55 1.13 22.85
10.03 0.36
7.00 1,685
Sabaki Ward None 21.75 12.33 26.91 1.35 30.49
0.67 0.67
5.83 446
Sabaki Ward Primary 29.29 14.53 12.36 0.48 20.89
13.21 0.24
9.00 833
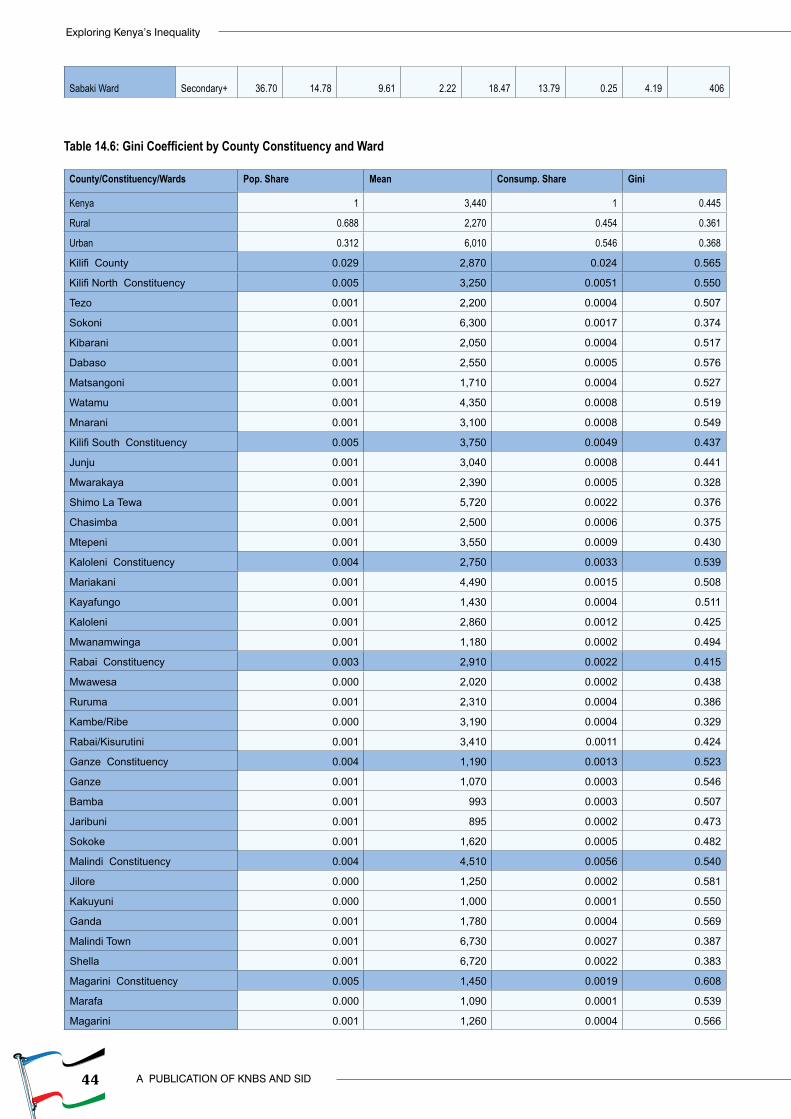
44
Exploring Kenya’s Inequality
A PUBLICATION OF KNBS AND SID
Sabaki Ward Secondary+ 36.70 14.78 9.61 2.22 18.47
13.79 0.25
4.19 406
Table 14.6: Gini Coefficient by County Constituency and Ward
County/Constituency/Wards Pop. Share Mean Consump. Share Gini
Kenya 1 3,440 1 0.445
Rural 0.688 2,270 0.454 0.361
Urban 0.312 6,010 0.546 0.368
Kilifi County 0.029 2,870 0.024 0.565
Kilifi North Constituency 0.005 3,250 0.0051 0.550
Tezo 0.001 2,200 0.0004 0.507
Sokoni 0.001 6,300 0.0017 0.374
Kibarani 0.001 2,050 0.0004 0.517
Dabaso 0.001 2,550 0.0005 0.576
Matsangoni 0.001 1,710 0.0004 0.527
Watamu 0.001 4,350 0.0008 0.519
Mnarani 0.001 3,100 0.0008 0.549
Kilifi South Constituency 0.005 3,750 0.0049 0.437
Junju 0.001 3,040 0.0008 0.441
Mwarakaya 0.001 2,390 0.0005 0.328
Shimo La Tewa 0.001 5,720 0.0022 0.376
Chasimba 0.001 2,500 0.0006 0.375
Mtepeni 0.001 3,550 0.0009 0.430
Kaloleni Constituency 0.004 2,750 0.0033 0.539
Mariakani 0.001 4,490 0.0015 0.508
Kayafungo 0.001 1,430 0.0004 0.511
Kaloleni 0.001 2,860 0.0012 0.425
Mwanamwinga 0.001 1,180 0.0002 0.494
Rabai Constituency 0.003 2,910 0.0022 0.415
Mwawesa 0.000 2,020 0.0002 0.438
Ruruma 0.001 2,310 0.0004 0.386
Kambe/Ribe 0.000 3,190 0.0004 0.329
Rabai/Kisurutini 0.001 3,410 0.0011 0.424
Ganze Constituency 0.004 1,190 0.0013 0.523
Ganze 0.001 1,070 0.0003 0.546
Bamba 0.001 993 0.0003 0.507
Jaribuni 0.001 895 0.0002 0.473
Sokoke 0.001 1,620 0.0005 0.482
Malindi Constituency 0.004 4,510 0.0056 0.540
Jilore 0.000 1,250 0.0002 0.581
Kakuyuni 0.000 1,000 0.0001 0.550
Ganda 0.001 1,780 0.0004 0.569
Malindi Town 0.001 6,730 0.0027 0.387
Shella 0.001 6,720 0.0022 0.383
Magarini Constituency 0.005 1,450 0.0019 0.608
Marafa 0.000 1,090 0.0001 0.539
Magarini 0.001 1,260 0.0004 0.566
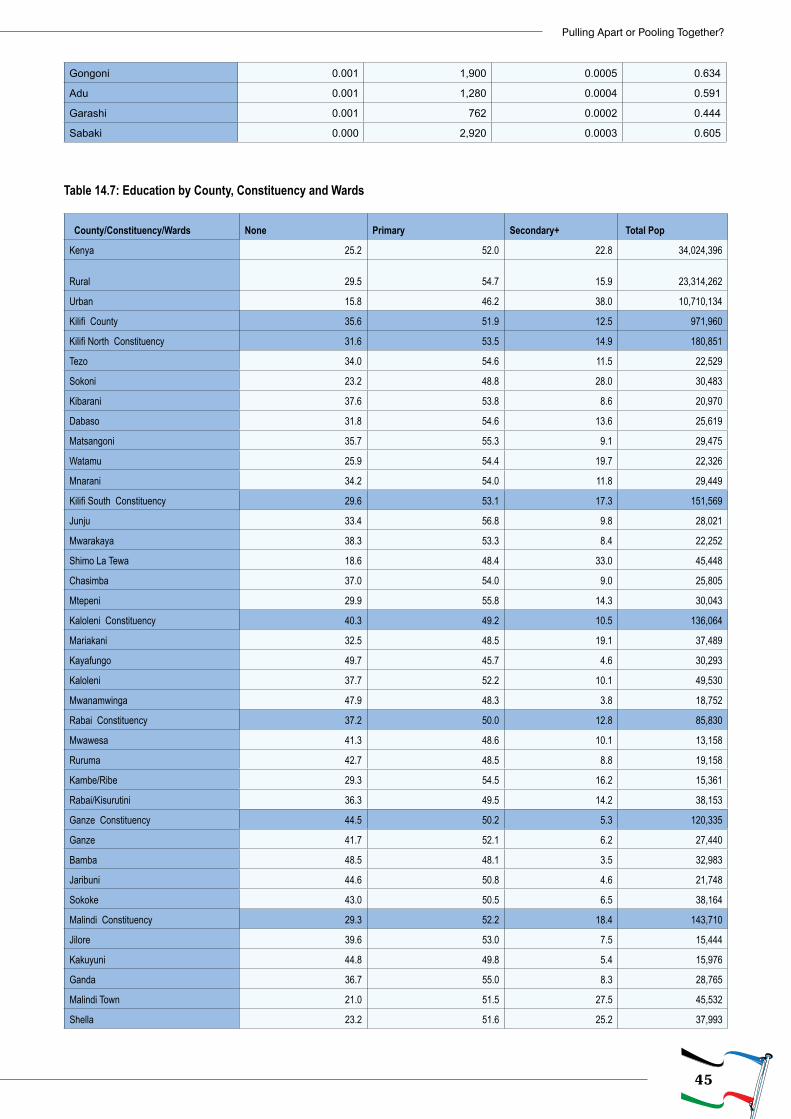
45
Pulling Apart or Pooling Together?
Gongoni 0.001 1,900 0.0005 0.634
Adu 0.001 1,280 0.0004 0.591
Garashi 0.001 762 0.0002 0.444
Sabaki 0.000 2,920 0.0003 0.605
Table 14.7: Education by County, Constituency and Wards
County/Constituency/Wards None Primary Secondary+ Total Pop
Kenya 25.2 52.0 22.8 34,024,396
Rural 29.5 54.7 15.9 23,314,262
Urban 15.8 46.2 38.0 10,710,134
Kilifi County 35.6 51.9 12.5 971,960
Kilifi North Constituency 31.6 53.5 14.9 180,851
Tezo 34.0 54.6 11.5 22,529
Sokoni 23.2 48.8 28.0 30,483
Kibarani 37.6 53.8 8.6 20,970
Dabaso 31.8 54.6 13.6 25,619
Matsangoni 35.7 55.3 9.1 29,475
Watamu 25.9 54.4 19.7 22,326
Mnarani 34.2 54.0 11.8 29,449
Kilifi South Constituency 29.6 53.1 17.3 151,569
Junju 33.4 56.8 9.8 28,021
Mwarakaya 38.3 53.3 8.4 22,252
Shimo La Tewa 18.6 48.4 33.0 45,448
Chasimba 37.0 54.0 9.0 25,805
Mtepeni 29.9 55.8 14.3 30,043
Kaloleni Constituency 40.3 49.2 10.5 136,064
Mariakani 32.5 48.5 19.1 37,489
Kayafungo 49.7 45.7 4.6 30,293
Kaloleni 37.7 52.2 10.1 49,530
Mwanamwinga 47.9 48.3 3.8 18,752
Rabai Constituency 37.2 50.0 12.8 85,830
Mwawesa 41.3 48.6 10.1 13,158
Ruruma 42.7 48.5 8.8 19,158
Kambe/Ribe 29.3 54.5 16.2 15,361
Rabai/Kisurutini 36.3 49.5 14.2 38,153
Ganze Constituency 44.5 50.2 5.3 120,335
Ganze 41.7 52.1 6.2 27,440
Bamba 48.5 48.1 3.5 32,983
Jaribuni 44.6 50.8 4.6 21,748
Sokoke 43.0 50.5 6.5 38,164
Malindi Constituency 29.3 52.2 18.4 143,710
Jilore 39.6 53.0 7.5 15,444
Kakuyuni 44.8 49.8 5.4 15,976
Ganda 36.7 55.0 8.3 28,765
Malindi Town 21.0 51.5 27.5 45,532
Shella 23.2 51.6 25.2 37,993
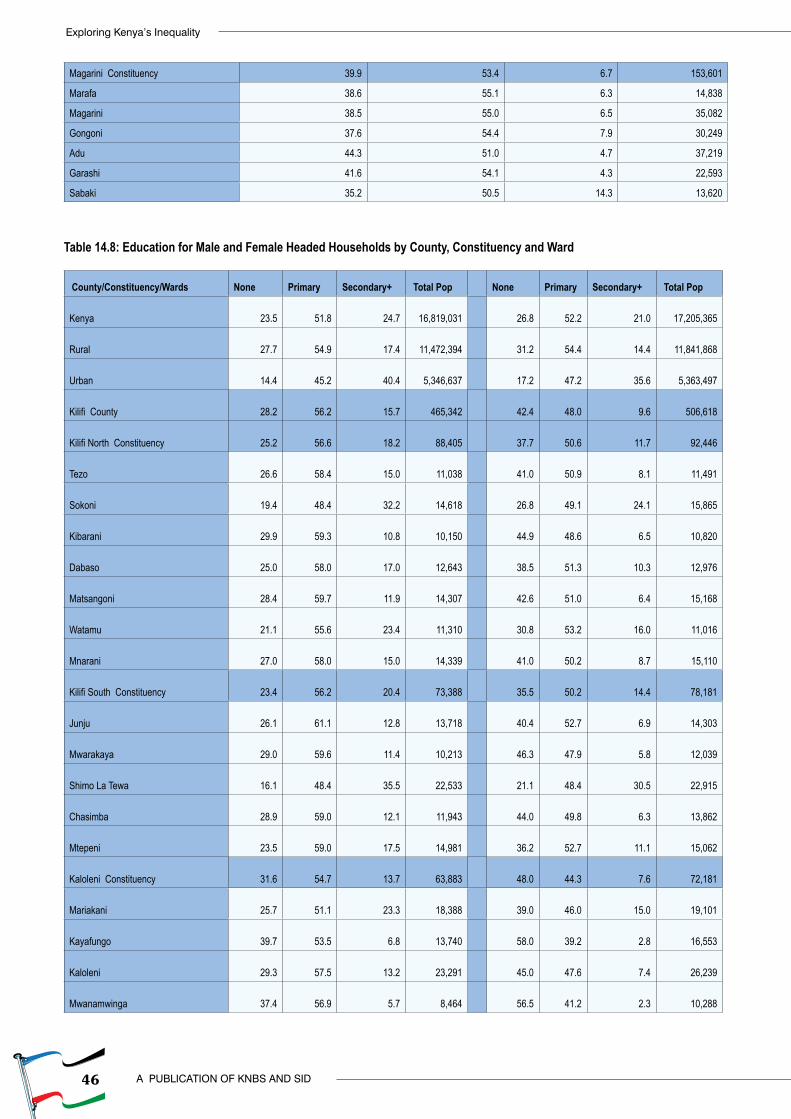
46
Exploring Kenya’s Inequality
A PUBLICATION OF KNBS AND SID
Magarini Constituency 39.9 53.4 6.7 153,601
Marafa 38.6 55.1 6.3 14,838
Magarini 38.5 55.0 6.5 35,082
Gongoni 37.6 54.4 7.9 30,249
Adu 44.3 51.0 4.7 37,219
Garashi 41.6 54.1 4.3 22,593
Sabaki 35.2 50.5 14.3 13,620
Table 14.8: Education for Male and Female Headed Households by County, Constituency and Ward
County/Constituency/Wards None Primary Secondary+ Total Pop None Primary Secondary+ Total Pop
Kenya 23.5 51.8 24.7
16,819,031 26.8 52.2 21.0
17,205,365
Rural 27.7 54.9 17.4
11,472,394 31.2 54.4 14.4
11,841,868
Urban 14.4 45.2 40.4
5,346,637 17.2 47.2 35.6
5,363,497
Kilifi County 28.2 56.2 15.7
465,342 42.4 48.0 9.6
506,618
Kilifi North Constituency 25.2 56.6 18.2
88,405 37.7 50.6 11.7
92,446
Tezo 26.6 58.4 15.0
11,038 41.0 50.9 8.1
11,491
Sokoni 19.4 48.4 32.2
14,618 26.8 49.1 24.1
15,865
Kibarani 29.9 59.3 10.8
10,150 44.9 48.6 6.5
10,820
Dabaso 25.0 58.0 17.0
12,643 38.5 51.3 10.3
12,976
Matsangoni 28.4 59.7 11.9
14,307 42.6 51.0 6.4
15,168
Watamu 21.1 55.6 23.4
11,310 30.8 53.2 16.0
11,016
Mnarani 27.0 58.0 15.0
14,339 41.0 50.2 8.7
15,110
Kilifi South Constituency 23.4 56.2 20.4
73,388 35.5 50.2 14.4
78,181
Junju 26.1 61.1 12.8
13,718 40.4 52.7 6.9
14,303
Mwarakaya 29.0 59.6 11.4
10,213 46.3 47.9 5.8
12,039
Shimo La Tewa 16.1 48.4 35.5
22,533 21.1 48.4 30.5
22,915
Chasimba 28.9 59.0 12.1
11,943 44.0 49.8 6.3
13,862
Mtepeni 23.5 59.0 17.5
14,981 36.2 52.7 11.1
15,062
Kaloleni Constituency 31.6 54.7 13.7
63,883 48.0 44.3 7.6
72,181
Mariakani 25.7 51.1 23.3
18,388 39.0 46.0 15.0
19,101
Kayafungo 39.7 53.5 6.8
13,740 58.0 39.2 2.8
16,553
Kaloleni 29.3 57.5 13.2
23,291 45.0 47.6 7.4
26,239
Mwanamwinga 37.4 56.9 5.7
8,464 56.5 41.2 2.3
10,288
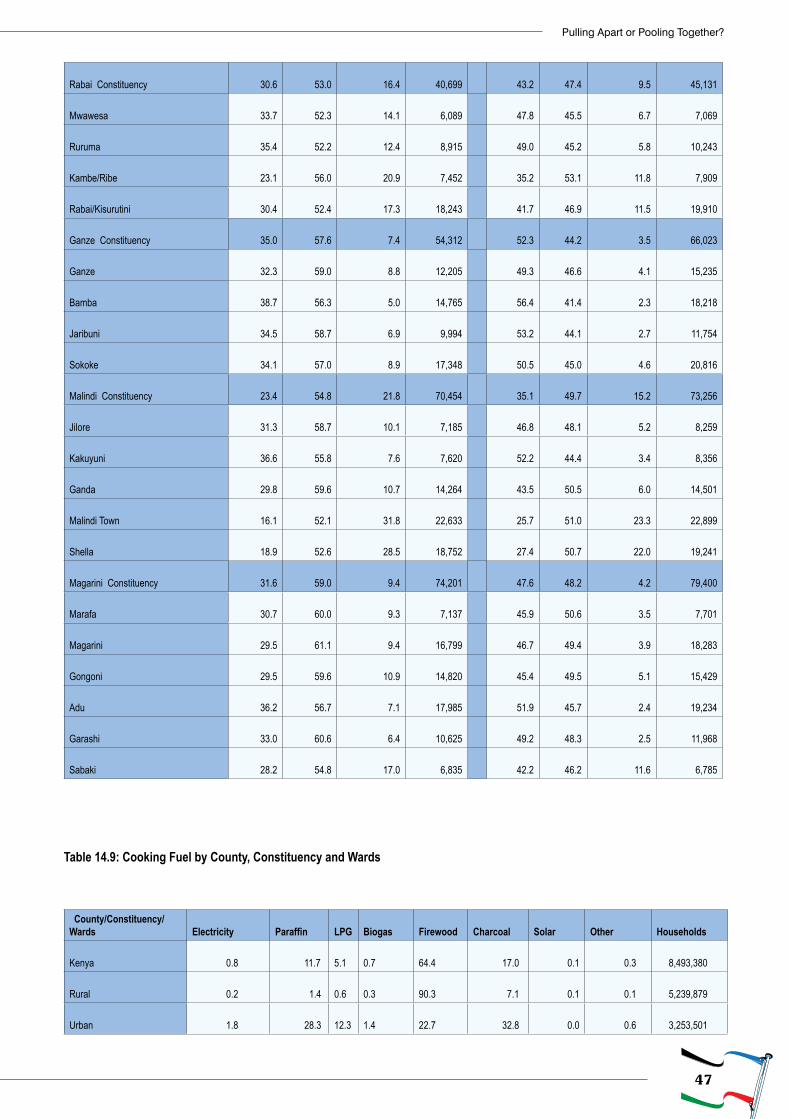
47
Pulling Apart or Pooling Together?
Rabai Constituency 30.6 53.0 16.4
40,699 43.2 47.4 9.5
45,131
Mwawesa 33.7 52.3 14.1
6,089 47.8 45.5 6.7
7,069
Ruruma 35.4 52.2 12.4
8,915 49.0 45.2 5.8
10,243
Kambe/Ribe 23.1 56.0 20.9
7,452 35.2 53.1 11.8
7,909
Rabai/Kisurutini 30.4 52.4 17.3
18,243 41.7 46.9 11.5
19,910
Ganze Constituency 35.0 57.6 7.4
54,312 52.3 44.2 3.5
66,023
Ganze 32.3 59.0 8.8
12,205 49.3 46.6 4.1
15,235
Bamba 38.7 56.3 5.0
14,765 56.4 41.4 2.3
18,218
Jaribuni 34.5 58.7 6.9
9,994 53.2 44.1 2.7
11,754
Sokoke 34.1 57.0 8.9
17,348 50.5 45.0 4.6
20,816
Malindi Constituency 23.4 54.8 21.8
70,454 35.1 49.7 15.2
73,256
Jilore 31.3 58.7 10.1
7,185 46.8 48.1 5.2
8,259
Kakuyuni 36.6 55.8 7.6
7,620 52.2 44.4 3.4
8,356
Ganda 29.8 59.6 10.7
14,264 43.5 50.5 6.0
14,501
Malindi Town 16.1 52.1 31.8
22,633 25.7 51.0 23.3
22,899
Shella 18.9 52.6 28.5
18,752 27.4 50.7 22.0
19,241
Magarini Constituency 31.6 59.0 9.4
74,201 47.6 48.2 4.2
79,400
Marafa 30.7 60.0 9.3
7,137 45.9 50.6 3.5
7,701
Magarini 29.5 61.1 9.4
16,799 46.7 49.4 3.9
18,283
Gongoni 29.5 59.6 10.9
14,820 45.4 49.5 5.1
15,429
Adu 36.2 56.7 7.1
17,985 51.9 45.7 2.4
19,234
Garashi 33.0 60.6 6.4
10,625 49.2 48.3 2.5
11,968
Sabaki 28.2 54.8 17.0
6,835 42.2 46.2 11.6
6,785
Table 14.9: Cooking Fuel by County, Constituency and Wards
County/Constituency/Wards Electricity Paraffin LPG Biogas Firewood Charcoal Solar Other Households
Kenya 0.8 11.7 5.1
0.7
64.4 17.0 0.1 0.3 8,493,380
Rural 0.2 1.4 0.6
0.3
90.3 7.1 0.1 0.1 5,239,879
Urban 1.8 28.3 12.3
1.4
22.7 32.8 0.0 0.6 3,253,501
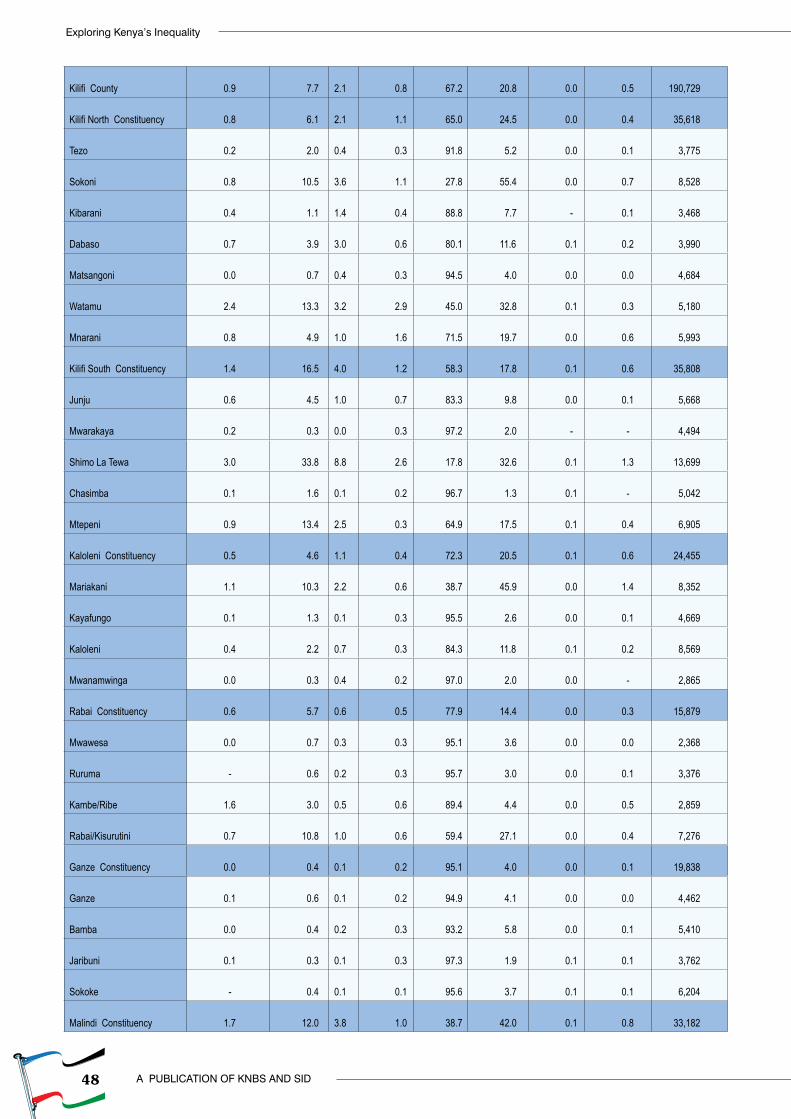
48
Exploring Kenya’s Inequality
A PUBLICATION OF KNBS AND SID
Kilifi County 0.9 7.7 2.1 0.8 67.2 20.8 0.0 0.5 190,729
Kilifi North Constituency 0.8 6.1 2.1 1.1 65.0 24.5 0.0 0.4 35,618
Tezo 0.2 2.0 0.4 0.3 91.8 5.2 0.0 0.1 3,775
Sokoni 0.8 10.5 3.6 1.1 27.8 55.4 0.0 0.7 8,528
Kibarani 0.4 1.1 1.4 0.4 88.8 7.7 - 0.1 3,468
Dabaso 0.7 3.9 3.0 0.6 80.1 11.6 0.1 0.2 3,990
Matsangoni 0.0 0.7 0.4 0.3 94.5 4.0 0.0 0.0 4,684
Watamu 2.4 13.3 3.2 2.9 45.0 32.8 0.1 0.3 5,180
Mnarani 0.8 4.9 1.0 1.6 71.5 19.7 0.0 0.6 5,993
Kilifi South Constituency 1.4 16.5 4.0 1.2 58.3 17.8 0.1 0.6 35,808
Junju 0.6 4.5 1.0 0.7 83.3 9.8 0.0 0.1 5,668
Mwarakaya 0.2 0.3 0.0 0.3 97.2 2.0 - - 4,494
Shimo La Tewa 3.0 33.8 8.8 2.6 17.8 32.6 0.1 1.3 13,699
Chasimba 0.1 1.6 0.1 0.2 96.7 1.3 0.1 - 5,042
Mtepeni 0.9 13.4 2.5 0.3 64.9 17.5 0.1 0.4 6,905
Kaloleni Constituency 0.5 4.6 1.1 0.4 72.3 20.5 0.1 0.6 24,455
Mariakani 1.1 10.3 2.2 0.6 38.7 45.9 0.0 1.4 8,352
Kayafungo 0.1 1.3 0.1 0.3 95.5 2.6 0.0 0.1 4,669
Kaloleni 0.4 2.2 0.7 0.3 84.3 11.8 0.1 0.2 8,569
Mwanamwinga 0.0 0.3 0.4 0.2 97.0 2.0 0.0 - 2,865
Rabai Constituency 0.6 5.7 0.6 0.5 77.9 14.4 0.0 0.3 15,879
Mwawesa 0.0 0.7 0.3 0.3 95.1 3.6 0.0 0.0 2,368
Ruruma - 0.6 0.2 0.3 95.7 3.0 0.0 0.1 3,376
Kambe/Ribe 1.6 3.0 0.5 0.6 89.4 4.4 0.0 0.5 2,859
Rabai/Kisurutini 0.7 10.8 1.0 0.6 59.4 27.1 0.0 0.4 7,276
Ganze Constituency 0.0 0.4 0.1 0.2 95.1 4.0 0.0 0.1 19,838
Ganze 0.1 0.6 0.1 0.2 94.9 4.1 0.0 0.0 4,462
Bamba 0.0 0.4 0.2 0.3 93.2 5.8 0.0 0.1 5,410
Jaribuni 0.1 0.3 0.1 0.3 97.3 1.9 0.1 0.1 3,762
Sokoke - 0.4 0.1 0.1 95.6 3.7 0.1 0.1 6,204
Malindi Constituency 1.7 12.0 3.8 1.0 38.7 42.0 0.1 0.8 33,182
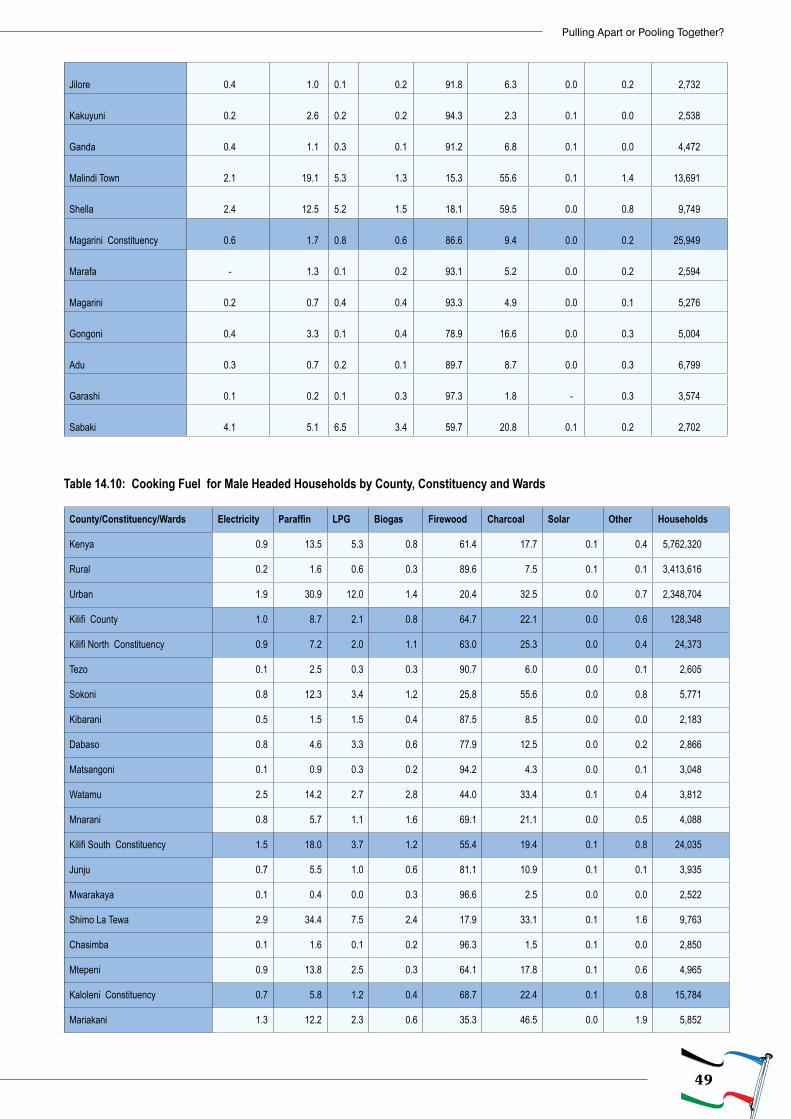
49
Pulling Apart or Pooling Together?
Jilore 0.4 1.0 0.1 0.2 91.8 6.3 0.0 0.2 2,732
Kakuyuni 0.2 2.6 0.2 0.2 94.3 2.3 0.1 0.0 2,538
Ganda 0.4 1.1 0.3 0.1 91.2 6.8 0.1 0.0 4,472
Malindi Town 2.1 19.1 5.3 1.3 15.3 55.6 0.1 1.4 13,691
Shella 2.4 12.5 5.2 1.5 18.1 59.5 0.0 0.8 9,749
Magarini Constituency 0.6 1.7 0.8 0.6 86.6 9.4 0.0 0.2 25,949
Marafa - 1.3 0.1 0.2 93.1 5.2 0.0 0.2 2,594
Magarini 0.2 0.7 0.4 0.4 93.3 4.9 0.0 0.1 5,276
Gongoni 0.4 3.3 0.1 0.4 78.9 16.6 0.0 0.3 5,004
Adu 0.3 0.7 0.2 0.1 89.7 8.7 0.0 0.3 6,799
Garashi 0.1 0.2 0.1 0.3 97.3 1.8 - 0.3 3,574
Sabaki 4.1 5.1 6.5 3.4 59.7 20.8 0.1 0.2 2,702
Table 14.10: Cooking Fuel for Male Headed Households by County, Constituency and Wards
County/Constituency/Wards Electricity Paraffin LPG Biogas Firewood Charcoal Solar Other Households
Kenya 0.9 13.5 5.3 0.8 61.4 17.7 0.1 0.4 5,762,320
Rural 0.2 1.6 0.6 0.3 89.6 7.5 0.1 0.1 3,413,616
Urban 1.9 30.9 12.0 1.4 20.4 32.5 0.0 0.7 2,348,704
Kilifi County 1.0 8.7 2.1 0.8 64.7 22.1 0.0 0.6 128,348
Kilifi North Constituency 0.9 7.2 2.0 1.1 63.0 25.3 0.0 0.4 24,373
Tezo 0.1 2.5 0.3 0.3 90.7 6.0 0.0 0.1 2,605
Sokoni 0.8 12.3 3.4 1.2 25.8 55.6 0.0 0.8 5,771
Kibarani 0.5 1.5 1.5 0.4 87.5 8.5 0.0 0.0 2,183
Dabaso 0.8 4.6 3.3 0.6 77.9 12.5 0.0 0.2 2,866
Matsangoni 0.1 0.9 0.3 0.2 94.2 4.3 0.0 0.1 3,048
Watamu 2.5 14.2 2.7 2.8 44.0 33.4 0.1 0.4 3,812
Mnarani 0.8 5.7 1.1 1.6 69.1 21.1 0.0 0.5 4,088
Kilifi South Constituency 1.5 18.0 3.7 1.2 55.4 19.4 0.1 0.8 24,035
Junju 0.7 5.5 1.0 0.6 81.1 10.9 0.1 0.1 3,935
Mwarakaya 0.1 0.4 0.0 0.3 96.6 2.5 0.0 0.0 2,522
Shimo La Tewa 2.9 34.4 7.5 2.4 17.9 33.1 0.1 1.6 9,763
Chasimba 0.1 1.6 0.1 0.2 96.3 1.5 0.1 0.0 2,850
Mtepeni 0.9 13.8 2.5 0.3 64.1 17.8 0.1 0.6 4,965
Kaloleni Constituency 0.7 5.8 1.2 0.4 68.7 22.4 0.1 0.8 15,784
Mariakani 1.3 12.2 2.3 0.6 35.3 46.5 0.0 1.9 5,852
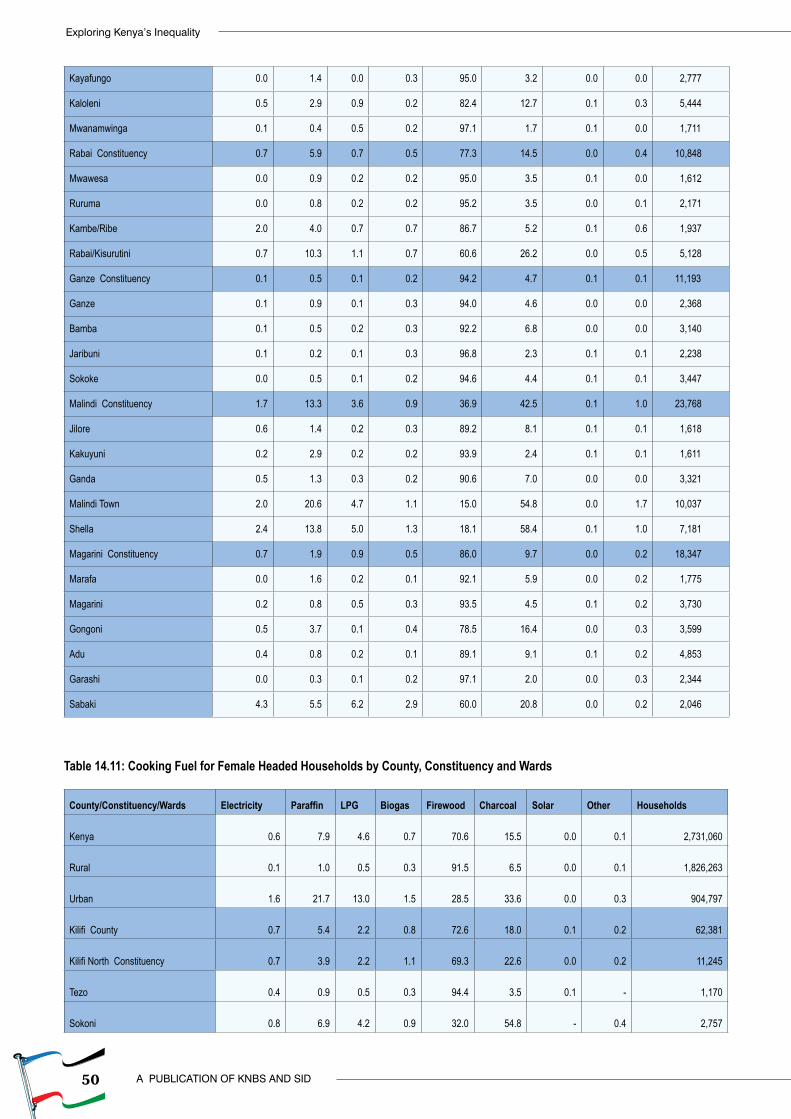
50
Exploring Kenya’s Inequality
A PUBLICATION OF KNBS AND SID
Kayafungo 0.0 1.4 0.0 0.3 95.0 3.2 0.0 0.0 2,777
Kaloleni 0.5 2.9 0.9 0.2 82.4 12.7 0.1 0.3 5,444
Mwanamwinga 0.1 0.4 0.5 0.2 97.1 1.7 0.1 0.0 1,711
Rabai Constituency 0.7 5.9 0.7 0.5 77.3 14.5 0.0 0.4 10,848
Mwawesa 0.0 0.9 0.2 0.2 95.0 3.5 0.1 0.0 1,612
Ruruma 0.0 0.8 0.2 0.2 95.2 3.5 0.0 0.1 2,171
Kambe/Ribe 2.0 4.0 0.7 0.7 86.7 5.2 0.1 0.6 1,937
Rabai/Kisurutini 0.7 10.3 1.1 0.7 60.6 26.2 0.0 0.5 5,128
Ganze Constituency 0.1 0.5 0.1 0.2 94.2 4.7 0.1 0.1 11,193
Ganze 0.1 0.9 0.1 0.3 94.0 4.6 0.0 0.0 2,368
Bamba 0.1 0.5 0.2 0.3 92.2 6.8 0.0 0.0 3,140
Jaribuni 0.1 0.2 0.1 0.3 96.8 2.3 0.1 0.1 2,238
Sokoke 0.0 0.5 0.1 0.2 94.6 4.4 0.1 0.1 3,447
Malindi Constituency 1.7 13.3 3.6 0.9 36.9 42.5 0.1 1.0 23,768
Jilore 0.6 1.4 0.2 0.3 89.2 8.1 0.1 0.1 1,618
Kakuyuni 0.2 2.9 0.2 0.2 93.9 2.4 0.1 0.1 1,611
Ganda 0.5 1.3 0.3 0.2 90.6 7.0 0.0 0.0 3,321
Malindi Town 2.0 20.6 4.7 1.1 15.0 54.8 0.0 1.7 10,037
Shella 2.4 13.8 5.0 1.3 18.1 58.4 0.1 1.0 7,181
Magarini Constituency 0.7 1.9 0.9 0.5 86.0 9.7 0.0 0.2 18,347
Marafa 0.0 1.6 0.2 0.1 92.1 5.9 0.0 0.2 1,775
Magarini 0.2 0.8 0.5 0.3 93.5 4.5 0.1 0.2 3,730
Gongoni 0.5 3.7 0.1 0.4 78.5 16.4 0.0 0.3 3,599
Adu 0.4 0.8 0.2 0.1 89.1 9.1 0.1 0.2 4,853
Garashi 0.0 0.3 0.1 0.2 97.1 2.0 0.0 0.3 2,344
Sabaki 4.3 5.5 6.2 2.9 60.0 20.8 0.0 0.2 2,046
Table 14.11: Cooking Fuel for Female Headed Households by County, Constituency and Wards
County/Constituency/Wards Electricity Paraffin LPG Biogas Firewood Charcoal Solar Other Households
Kenya 0.6
7.9
4.6
0.7
70.6
15.5 0.0
0.1 2,731,060
Rural 0.1
1.0
0.5
0.3
91.5
6.5 0.0
0.1 1,826,263
Urban 1.6
21.7
13.0
1.5
28.5
33.6 0.0
0.3 904,797
Kilifi County 0.7
5.4
2.2
0.8
72.6
18.0 0.1
0.2 62,381
Kilifi North Constituency 0.7
3.9
2.2
1.1
69.3
22.6 0.0
0.2 11,245
Tezo 0.4
0.9
0.5
0.3
94.4
3.5 0.1 - 1,170
Sokoni 0.8
6.9
4.2
0.9
32.0
54.8 -
0.4 2,757
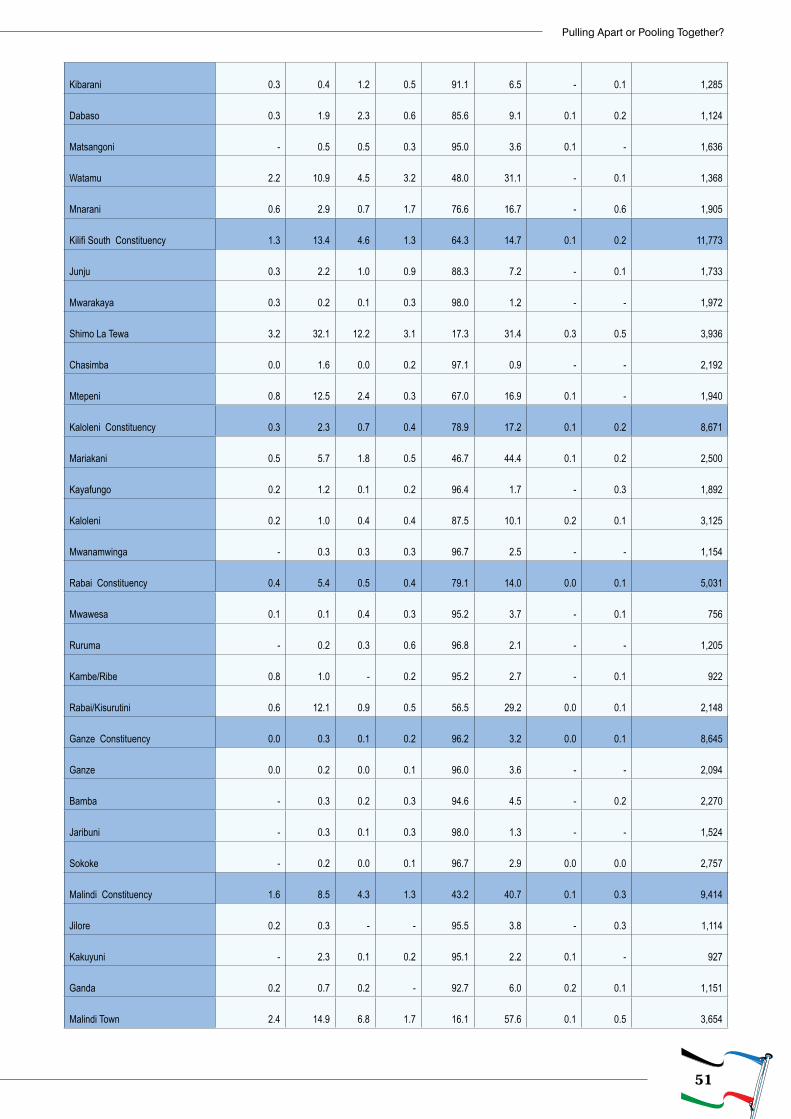
51
Pulling Apart or Pooling Together?
Kibarani 0.3
0.4
1.2
0.5
91.1
6.5 -
0.1 1,285
Dabaso 0.3
1.9
2.3
0.6
85.6
9.1 0.1
0.2 1,124
Matsangoni -
0.5
0.5
0.3
95.0
3.6 0.1 - 1,636
Watamu 2.2
10.9
4.5
3.2
48.0
31.1 -
0.1 1,368
Mnarani 0.6
2.9
0.7
1.7
76.6
16.7 -
0.6 1,905
Kilifi South Constituency 1.3
13.4
4.6
1.3
64.3
14.7 0.1
0.2 11,773
Junju 0.3
2.2
1.0
0.9
88.3
7.2 -
0.1 1,733
Mwarakaya 0.3
0.2
0.1
0.3
98.0
1.2 - - 1,972
Shimo La Tewa 3.2
32.1
12.2
3.1
17.3
31.4 0.3
0.5 3,936
Chasimba 0.0
1.6
0.0
0.2
97.1
0.9 - - 2,192
Mtepeni 0.8
12.5
2.4
0.3
67.0
16.9 0.1 - 1,940
Kaloleni Constituency 0.3
2.3
0.7
0.4
78.9
17.2 0.1
0.2 8,671
Mariakani 0.5
5.7
1.8
0.5
46.7
44.4 0.1
0.2 2,500
Kayafungo 0.2
1.2
0.1
0.2
96.4
1.7 -
0.3 1,892
Kaloleni 0.2
1.0
0.4
0.4
87.5
10.1 0.2
0.1 3,125
Mwanamwinga -
0.3
0.3
0.3
96.7
2.5 - - 1,154
Rabai Constituency 0.4
5.4
0.5
0.4
79.1
14.0 0.0
0.1 5,031
Mwawesa 0.1
0.1
0.4
0.3
95.2
3.7 -
0.1 756
Ruruma -
0.2
0.3
0.6
96.8
2.1 - - 1,205
Kambe/Ribe 0.8
1.0
-
0.2
95.2
2.7 -
0.1 922
Rabai/Kisurutini 0.6
12.1
0.9
0.5
56.5
29.2 0.0
0.1 2,148
Ganze Constituency 0.0
0.3
0.1
0.2
96.2
3.2 0.0
0.1 8,645
Ganze 0.0
0.2
0.0
0.1
96.0
3.6 - - 2,094
Bamba -
0.3
0.2
0.3
94.6
4.5 -
0.2 2,270
Jaribuni -
0.3
0.1
0.3
98.0
1.3 - - 1,524
Sokoke -
0.2
0.0
0.1
96.7
2.9 0.0
0.0 2,757
Malindi Constituency 1.6
8.5
4.3
1.3
43.2
40.7 0.1
0.3 9,414
Jilore 0.2
0.3
-
-
95.5
3.8 -
0.3 1,114
Kakuyuni -
2.3
0.1
0.2
95.1
2.2 0.1 - 927
Ganda 0.2
0.7
0.2
-
92.7
6.0 0.2
0.1 1,151
Malindi Town 2.4
14.9
6.8
1.7
16.1
57.6 0.1
0.5 3,654
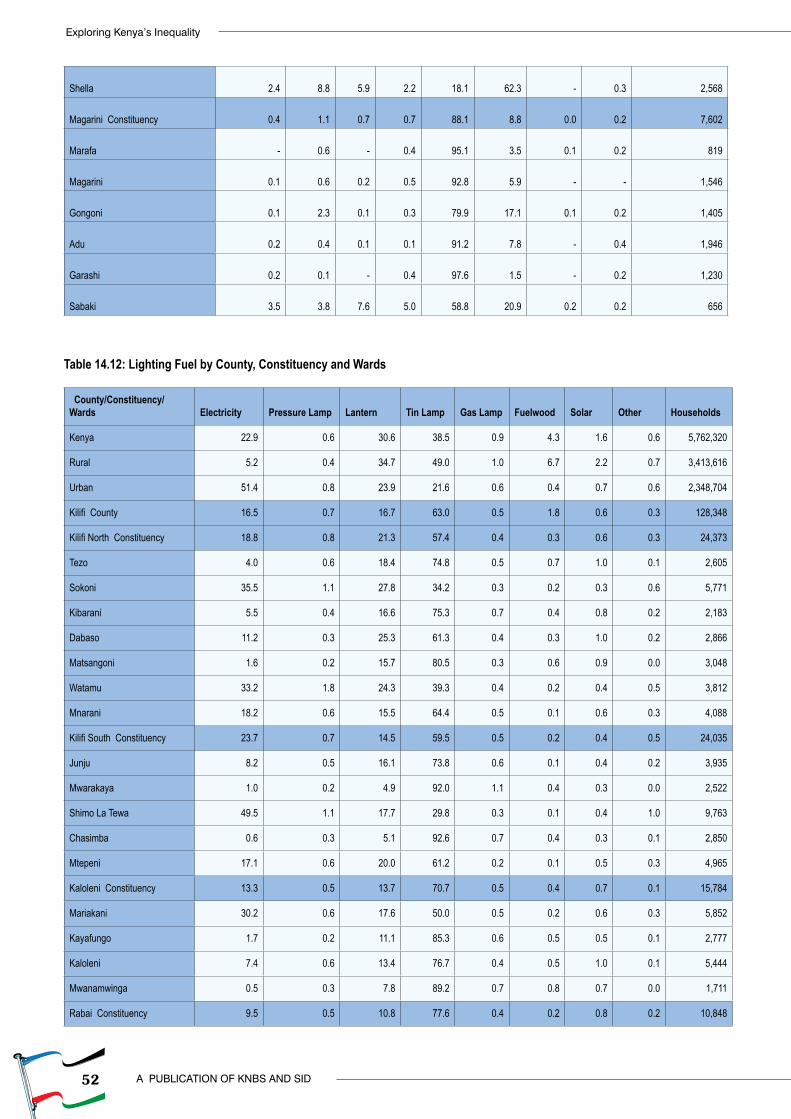
52
Exploring Kenya’s Inequality
A PUBLICATION OF KNBS AND SID
Shella 2.4
8.8
5.9
2.2
18.1
62.3 -
0.3 2,568
Magarini Constituency 0.4
1.1
0.7
0.7
88.1
8.8 0.0
0.2 7,602
Marafa -
0.6
-
0.4
95.1
3.5 0.1
0.2 819
Magarini 0.1
0.6
0.2
0.5
92.8
5.9 - - 1,546
Gongoni 0.1
2.3
0.1
0.3
79.9
17.1 0.1
0.2 1,405
Adu 0.2
0.4
0.1
0.1
91.2
7.8 -
0.4 1,946
Garashi 0.2
0.1
-
0.4
97.6
1.5 -
0.2 1,230
Sabaki 3.5
3.8
7.6
5.0
58.8
20.9 0.2
0.2 656
Table 14.12: Lighting Fuel by County, Constituency and Wards
County/Constituency/Wards Electricity Pressure Lamp Lantern Tin Lamp Gas Lamp Fuelwood Solar Other Households
Kenya 22.9 0.6 30.6 38.5 0.9 4.3 1.6 0.6 5,762,320
Rural 5.2 0.4 34.7 49.0 1.0 6.7 2.2 0.7 3,413,616
Urban 51.4 0.8 23.9 21.6 0.6 0.4 0.7 0.6 2,348,704
Kilifi County 16.5 0.7 16.7 63.0 0.5 1.8 0.6 0.3 128,348
Kilifi North Constituency 18.8 0.8 21.3 57.4 0.4 0.3 0.6 0.3 24,373
Tezo 4.0 0.6 18.4 74.8 0.5 0.7 1.0 0.1 2,605
Sokoni 35.5 1.1 27.8 34.2 0.3 0.2 0.3 0.6 5,771
Kibarani 5.5 0.4 16.6 75.3 0.7 0.4 0.8 0.2 2,183
Dabaso 11.2 0.3 25.3 61.3 0.4 0.3 1.0 0.2 2,866
Matsangoni 1.6 0.2 15.7 80.5 0.3 0.6 0.9 0.0 3,048
Watamu 33.2 1.8 24.3 39.3 0.4 0.2 0.4 0.5 3,812
Mnarani 18.2 0.6 15.5 64.4 0.5 0.1 0.6 0.3 4,088
Kilifi South Constituency 23.7 0.7 14.5 59.5 0.5 0.2 0.4 0.5 24,035
Junju 8.2 0.5 16.1 73.8 0.6 0.1 0.4 0.2 3,935
Mwarakaya 1.0 0.2 4.9 92.0 1.1 0.4 0.3 0.0 2,522
Shimo La Tewa 49.5 1.1 17.7 29.8 0.3 0.1 0.4 1.0 9,763
Chasimba 0.6 0.3 5.1 92.6 0.7 0.4 0.3 0.1 2,850
Mtepeni 17.1 0.6 20.0 61.2 0.2 0.1 0.5 0.3 4,965
Kaloleni Constituency 13.3 0.5 13.7 70.7 0.5 0.4 0.7 0.1 15,784
Mariakani 30.2 0.6 17.6 50.0 0.5 0.2 0.6 0.3 5,852
Kayafungo 1.7 0.2 11.1 85.3 0.6 0.5 0.5 0.1 2,777
Kaloleni 7.4 0.6 13.4 76.7 0.4 0.5 1.0 0.1 5,444
Mwanamwinga 0.5 0.3 7.8 89.2 0.7 0.8 0.7 0.0 1,711
Rabai Constituency 9.5 0.5 10.8 77.6 0.4 0.2 0.8 0.2 10,848
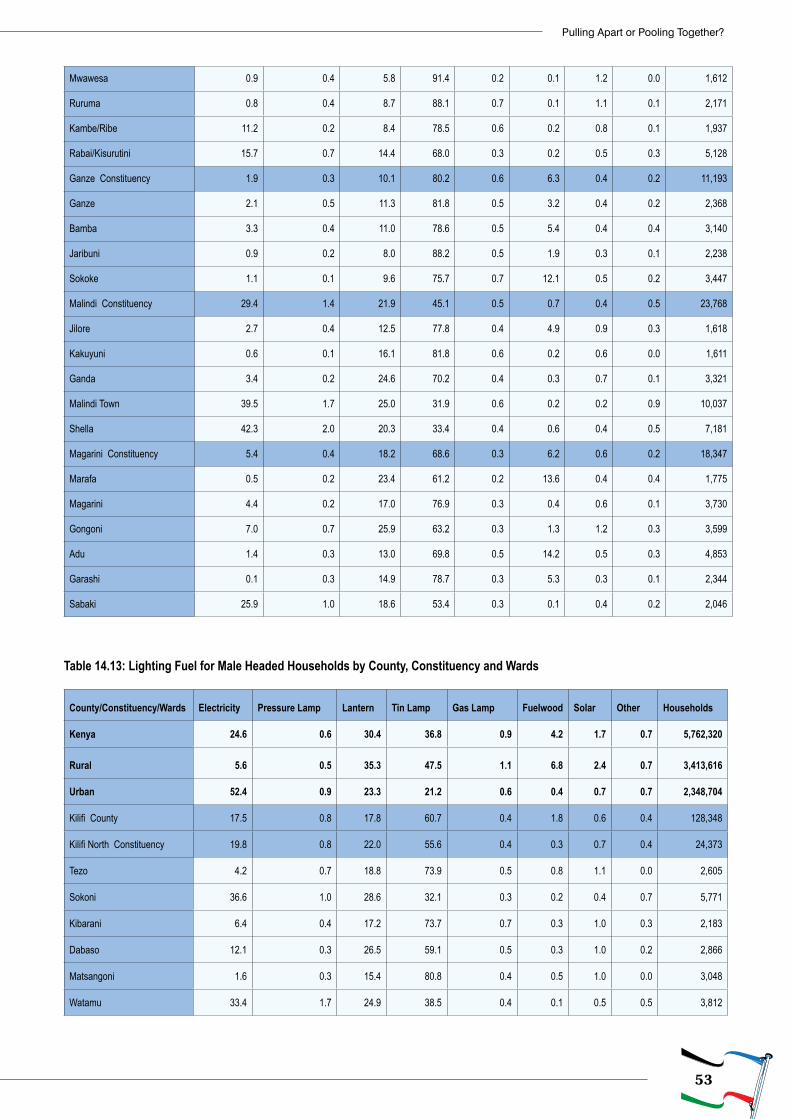
53
Pulling Apart or Pooling Together?
Mwawesa 0.9 0.4 5.8 91.4 0.2 0.1 1.2 0.0 1,612
Ruruma 0.8 0.4 8.7 88.1 0.7 0.1 1.1 0.1 2,171
Kambe/Ribe 11.2 0.2 8.4 78.5 0.6 0.2 0.8 0.1 1,937
Rabai/Kisurutini 15.7 0.7 14.4 68.0 0.3 0.2 0.5 0.3 5,128
Ganze Constituency 1.9 0.3 10.1 80.2 0.6 6.3 0.4 0.2 11,193
Ganze 2.1 0.5 11.3 81.8 0.5 3.2 0.4 0.2 2,368
Bamba 3.3 0.4 11.0 78.6 0.5 5.4 0.4 0.4 3,140
Jaribuni 0.9 0.2 8.0 88.2 0.5 1.9 0.3 0.1 2,238
Sokoke 1.1 0.1 9.6 75.7 0.7 12.1 0.5 0.2 3,447
Malindi Constituency 29.4 1.4 21.9 45.1 0.5 0.7 0.4 0.5 23,768
Jilore 2.7 0.4 12.5 77.8 0.4 4.9 0.9 0.3 1,618
Kakuyuni 0.6 0.1 16.1 81.8 0.6 0.2 0.6 0.0 1,611
Ganda 3.4 0.2 24.6 70.2 0.4 0.3 0.7 0.1 3,321
Malindi Town 39.5 1.7 25.0 31.9 0.6 0.2 0.2 0.9 10,037
Shella 42.3 2.0 20.3 33.4 0.4 0.6 0.4 0.5 7,181
Magarini Constituency 5.4 0.4 18.2 68.6 0.3 6.2 0.6 0.2 18,347
Marafa 0.5 0.2 23.4 61.2 0.2 13.6 0.4 0.4 1,775
Magarini 4.4 0.2 17.0 76.9 0.3 0.4 0.6 0.1 3,730
Gongoni 7.0 0.7 25.9 63.2 0.3 1.3 1.2 0.3 3,599
Adu 1.4 0.3 13.0 69.8 0.5 14.2 0.5 0.3 4,853
Garashi 0.1 0.3 14.9 78.7 0.3 5.3 0.3 0.1 2,344
Sabaki 25.9 1.0 18.6 53.4 0.3 0.1 0.4 0.2 2,046
Table 14.13: Lighting Fuel for Male Headed Households by County, Constituency and Wards
County/Constituency/Wards Electricity Pressure Lamp Lantern Tin Lamp Gas Lamp Fuelwood Solar Other Households
Kenya 24.6 0.6 30.4 36.8 0.9 4.2 1.7 0.7 5,762,320
Rural 5.6 0.5 35.3 47.5 1.1 6.8 2.4 0.7 3,413,616
Urban 52.4 0.9 23.3 21.2 0.6 0.4 0.7 0.7 2,348,704
Kilifi County 17.5 0.8 17.8 60.7 0.4 1.8 0.6 0.4 128,348
Kilifi North Constituency 19.8 0.8 22.0 55.6 0.4 0.3 0.7 0.4 24,373
Tezo 4.2 0.7 18.8 73.9 0.5 0.8 1.1 0.0 2,605
Sokoni 36.6 1.0 28.6 32.1 0.3 0.2 0.4 0.7 5,771
Kibarani 6.4 0.4 17.2 73.7 0.7 0.3 1.0 0.3 2,183
Dabaso 12.1 0.3 26.5 59.1 0.5 0.3 1.0 0.2 2,866
Matsangoni 1.6 0.3 15.4 80.8 0.4 0.5 1.0 0.0 3,048
Watamu 33.4 1.7 24.9 38.5 0.4 0.1 0.5 0.5 3,812
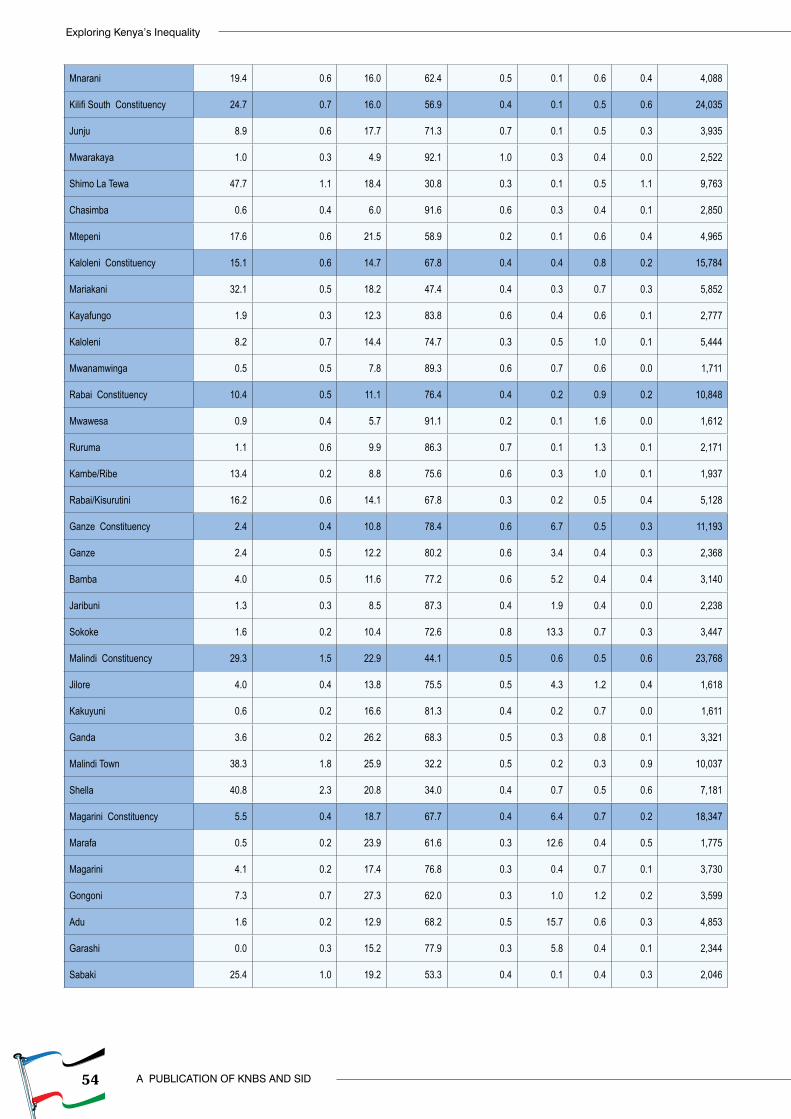
54
Exploring Kenya’s Inequality
A PUBLICATION OF KNBS AND SID
Mnarani 19.4 0.6 16.0 62.4 0.5 0.1 0.6 0.4 4,088
Kilifi South Constituency 24.7 0.7 16.0 56.9 0.4 0.1 0.5 0.6 24,035
Junju 8.9 0.6 17.7 71.3 0.7 0.1 0.5 0.3 3,935
Mwarakaya 1.0 0.3 4.9 92.1 1.0 0.3 0.4 0.0 2,522
Shimo La Tewa 47.7 1.1 18.4 30.8 0.3 0.1 0.5 1.1 9,763
Chasimba 0.6 0.4 6.0 91.6 0.6 0.3 0.4 0.1 2,850
Mtepeni 17.6 0.6 21.5 58.9 0.2 0.1 0.6 0.4 4,965
Kaloleni Constituency 15.1 0.6 14.7 67.8 0.4 0.4 0.8 0.2 15,784
Mariakani 32.1 0.5 18.2 47.4 0.4 0.3 0.7 0.3 5,852
Kayafungo 1.9 0.3 12.3 83.8 0.6 0.4 0.6 0.1 2,777
Kaloleni 8.2 0.7 14.4 74.7 0.3 0.5 1.0 0.1 5,444
Mwanamwinga 0.5 0.5 7.8 89.3 0.6 0.7 0.6 0.0 1,711
Rabai Constituency 10.4 0.5 11.1 76.4 0.4 0.2 0.9 0.2 10,848
Mwawesa 0.9 0.4 5.7 91.1 0.2 0.1 1.6 0.0 1,612
Ruruma 1.1 0.6 9.9 86.3 0.7 0.1 1.3 0.1 2,171
Kambe/Ribe 13.4 0.2 8.8 75.6 0.6 0.3 1.0 0.1 1,937
Rabai/Kisurutini 16.2 0.6 14.1 67.8 0.3 0.2 0.5 0.4 5,128
Ganze Constituency 2.4 0.4 10.8 78.4 0.6 6.7 0.5 0.3 11,193
Ganze 2.4 0.5 12.2 80.2 0.6 3.4 0.4 0.3 2,368
Bamba 4.0 0.5 11.6 77.2 0.6 5.2 0.4 0.4 3,140
Jaribuni 1.3 0.3 8.5 87.3 0.4 1.9 0.4 0.0 2,238
Sokoke 1.6 0.2 10.4 72.6 0.8 13.3 0.7 0.3 3,447
Malindi Constituency 29.3 1.5 22.9 44.1 0.5 0.6 0.5 0.6 23,768
Jilore 4.0 0.4 13.8 75.5 0.5 4.3 1.2 0.4 1,618
Kakuyuni 0.6 0.2 16.6 81.3 0.4 0.2 0.7 0.0 1,611
Ganda 3.6 0.2 26.2 68.3 0.5 0.3 0.8 0.1 3,321
Malindi Town 38.3 1.8 25.9 32.2 0.5 0.2 0.3 0.9 10,037
Shella 40.8 2.3 20.8 34.0 0.4 0.7 0.5 0.6 7,181
Magarini Constituency 5.5 0.4 18.7 67.7 0.4 6.4 0.7 0.2 18,347
Marafa 0.5 0.2 23.9 61.6 0.3 12.6 0.4 0.5 1,775
Magarini 4.1 0.2 17.4 76.8 0.3 0.4 0.7 0.1 3,730
Gongoni 7.3 0.7 27.3 62.0 0.3 1.0 1.2 0.2 3,599
Adu 1.6 0.2 12.9 68.2 0.5 15.7 0.6 0.3 4,853
Garashi 0.0 0.3 15.2 77.9 0.3 5.8 0.4 0.1 2,344
Sabaki 25.4 1.0 19.2 53.3 0.4 0.1 0.4 0.3 2,046
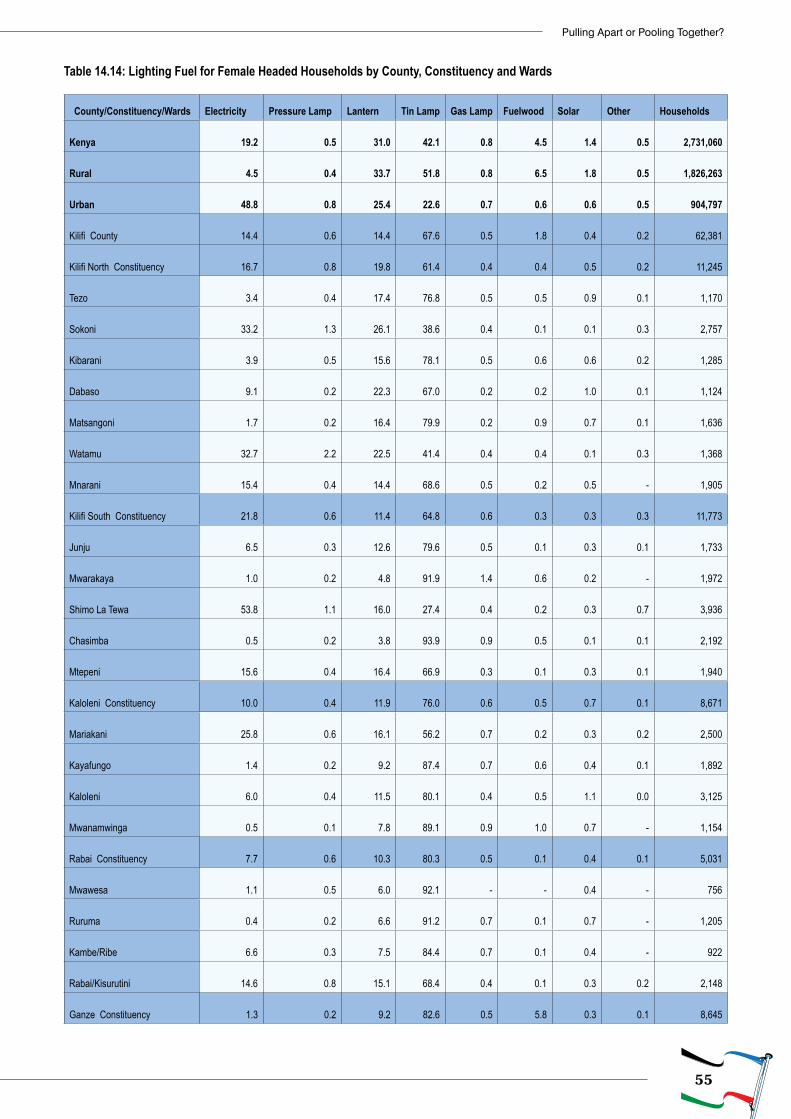
55
Pulling Apart or Pooling Together?
Table 14.14: Lighting Fuel for Female Headed Households by County, Constituency and Wards
County/Constituency/Wards Electricity Pressure Lamp Lantern Tin Lamp Gas Lamp Fuelwood Solar Other Households
Kenya 19.2 0.5
31.0
42.1
0.8
4.5
1.4
0.5 2,731,060
Rural 4.5 0.4
33.7
51.8
0.8
6.5
1.8
0.5 1,826,263
Urban 48.8 0.8
25.4
22.6
0.7
0.6
0.6
0.5 904,797
Kilifi County 14.4 0.6 14.4
67.6
0.5 1.8
0.4
0.2 62,381
Kilifi North Constituency 16.7 0.8 19.8
61.4
0.4 0.4
0.5
0.2 11,245
Tezo 3.4 0.4 17.4
76.8
0.5 0.5
0.9
0.1 1,170
Sokoni 33.2 1.3 26.1
38.6
0.4 0.1
0.1
0.3 2,757
Kibarani 3.9 0.5 15.6
78.1
0.5 0.6
0.6
0.2 1,285
Dabaso 9.1 0.2 22.3
67.0
0.2 0.2
1.0
0.1 1,124
Matsangoni 1.7 0.2 16.4
79.9
0.2 0.9
0.7
0.1 1,636
Watamu 32.7 2.2 22.5
41.4
0.4 0.4
0.1
0.3 1,368
Mnarani 15.4 0.4 14.4
68.6
0.5 0.2
0.5 - 1,905
Kilifi South Constituency 21.8 0.6 11.4
64.8
0.6 0.3
0.3
0.3 11,773
Junju 6.5 0.3 12.6
79.6
0.5 0.1
0.3
0.1 1,733
Mwarakaya 1.0 0.2 4.8
91.9
1.4 0.6
0.2 - 1,972
Shimo La Tewa 53.8 1.1 16.0
27.4
0.4 0.2
0.3
0.7 3,936
Chasimba 0.5 0.2 3.8
93.9
0.9 0.5
0.1
0.1 2,192
Mtepeni 15.6 0.4 16.4
66.9
0.3 0.1
0.3
0.1 1,940
Kaloleni Constituency 10.0 0.4 11.9
76.0
0.6 0.5
0.7
0.1 8,671
Mariakani 25.8 0.6 16.1
56.2
0.7 0.2
0.3
0.2 2,500
Kayafungo 1.4 0.2 9.2
87.4
0.7 0.6
0.4
0.1 1,892
Kaloleni 6.0 0.4 11.5
80.1
0.4 0.5
1.1
0.0 3,125
Mwanamwinga 0.5 0.1 7.8
89.1
0.9 1.0
0.7 - 1,154
Rabai Constituency 7.7 0.6 10.3
80.3
0.5 0.1
0.4
0.1 5,031
Mwawesa 1.1 0.5 6.0
92.1 - -
0.4 - 756
Ruruma 0.4 0.2 6.6
91.2
0.7 0.1
0.7 - 1,205
Kambe/Ribe 6.6 0.3 7.5
84.4
0.7 0.1
0.4 - 922
Rabai/Kisurutini 14.6 0.8 15.1
68.4
0.4 0.1
0.3
0.2 2,148
Ganze Constituency 1.3 0.2 9.2
82.6
0.5 5.8
0.3
0.1 8,645
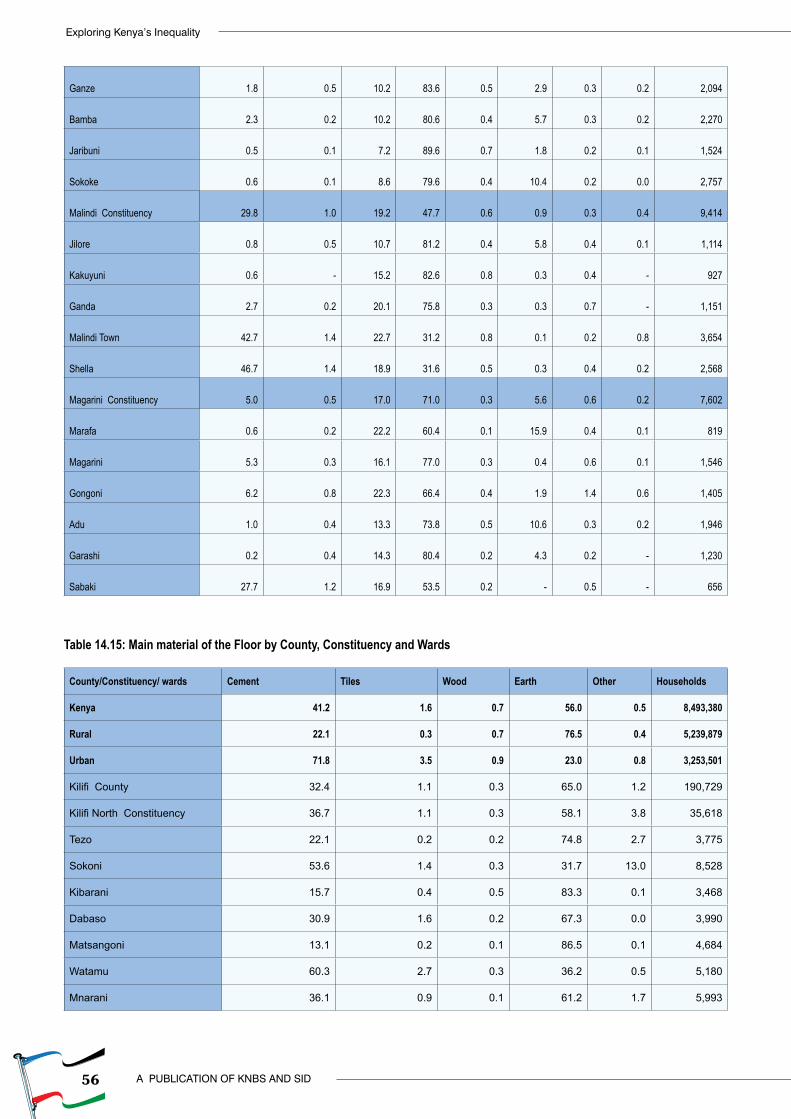
56
Exploring Kenya’s Inequality
A PUBLICATION OF KNBS AND SID
Ganze 1.8 0.5 10.2
83.6
0.5 2.9
0.3
0.2 2,094
Bamba 2.3 0.2 10.2
80.6
0.4 5.7
0.3
0.2 2,270
Jaribuni 0.5 0.1 7.2
89.6
0.7 1.8
0.2
0.1 1,524
Sokoke 0.6 0.1 8.6
79.6
0.4 10.4
0.2
0.0 2,757
Malindi Constituency 29.8 1.0 19.2
47.7
0.6 0.9
0.3
0.4 9,414
Jilore 0.8 0.5 10.7
81.2
0.4 5.8
0.4
0.1 1,114
Kakuyuni 0.6 - 15.2
82.6
0.8 0.3
0.4 - 927
Ganda 2.7 0.2 20.1
75.8
0.3 0.3
0.7 - 1,151
Malindi Town 42.7 1.4 22.7
31.2
0.8 0.1
0.2
0.8 3,654
Shella 46.7 1.4 18.9
31.6
0.5 0.3
0.4
0.2 2,568
Magarini Constituency 5.0 0.5 17.0
71.0
0.3 5.6
0.6
0.2 7,602
Marafa 0.6 0.2 22.2
60.4
0.1 15.9
0.4
0.1 819
Magarini 5.3 0.3 16.1
77.0
0.3 0.4
0.6
0.1 1,546
Gongoni 6.2 0.8 22.3
66.4
0.4 1.9
1.4
0.6 1,405
Adu 1.0 0.4 13.3
73.8
0.5 10.6
0.3
0.2 1,946
Garashi 0.2 0.4 14.3
80.4
0.2 4.3
0.2 - 1,230
Sabaki 27.7 1.2 16.9
53.5
0.2 -
0.5 - 656
Table 14.15: Main material of the Floor by County, Constituency and Wards
County/Constituency/ wards Cement Tiles Wood Earth Other Households
Kenya 41.2 1.6 0.7 56.0 0.5 8,493,380
Rural 22.1 0.3 0.7 76.5 0.4 5,239,879
Urban 71.8 3.5 0.9 23.0 0.8 3,253,501
Kilifi County 32.4 1.1 0.3 65.0 1.2 190,729
Kilifi North Constituency 36.7 1.1 0.3 58.1 3.8 35,618
Tezo 22.1 0.2 0.2 74.8 2.7 3,775
Sokoni 53.6 1.4 0.3 31.7 13.0 8,528
Kibarani 15.7 0.4 0.5 83.3 0.1 3,468
Dabaso 30.9 1.6 0.2 67.3 0.0 3,990
Matsangoni 13.1 0.2 0.1 86.5 0.1 4,684
Watamu 60.3 2.7 0.3 36.2 0.5 5,180
Mnarani 36.1 0.9 0.1 61.2 1.7 5,993
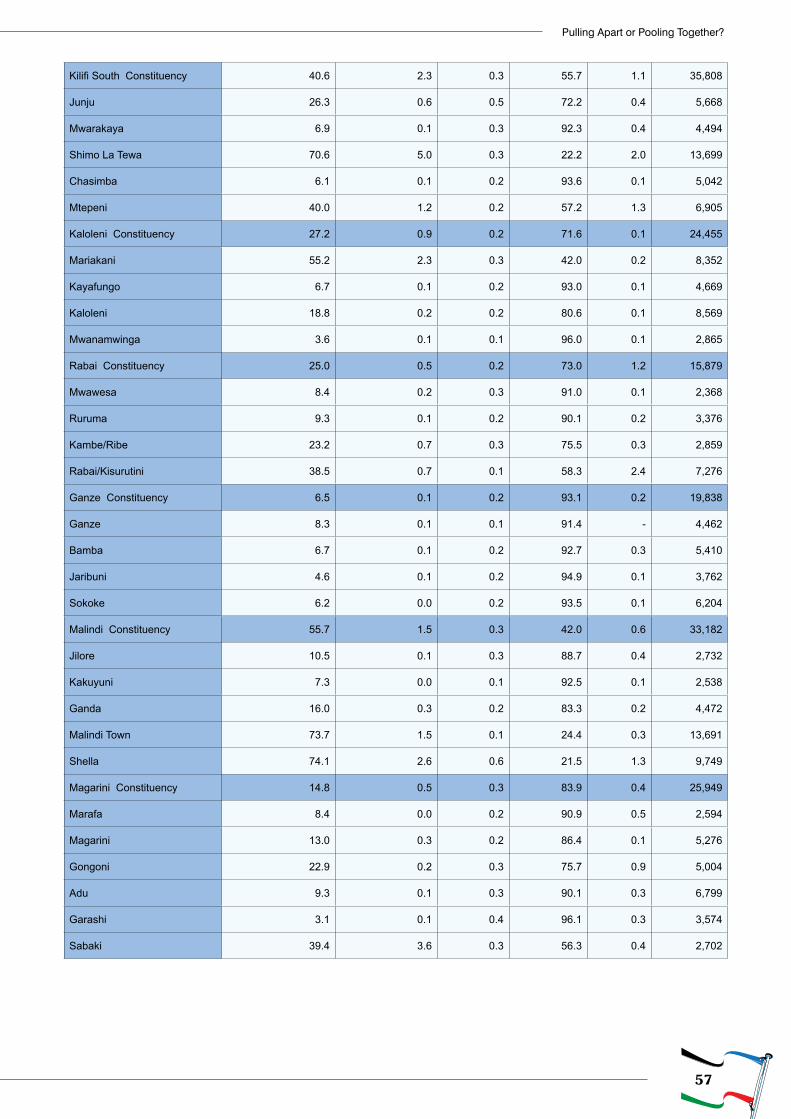
57
Pulling Apart or Pooling Together?
Kilifi South Constituency 40.6 2.3 0.3 55.7 1.1 35,808
Junju 26.3 0.6 0.5 72.2 0.4 5,668
Mwarakaya 6.9 0.1 0.3 92.3 0.4 4,494
Shimo La Tewa 70.6 5.0 0.3 22.2 2.0 13,699
Chasimba 6.1 0.1 0.2 93.6 0.1 5,042
Mtepeni 40.0 1.2 0.2 57.2 1.3 6,905
Kaloleni Constituency 27.2 0.9 0.2 71.6 0.1 24,455
Mariakani 55.2 2.3 0.3 42.0 0.2 8,352
Kayafungo 6.7 0.1 0.2 93.0 0.1 4,669
Kaloleni 18.8 0.2 0.2 80.6 0.1 8,569
Mwanamwinga 3.6 0.1 0.1 96.0 0.1 2,865
Rabai Constituency 25.0 0.5 0.2 73.0 1.2 15,879
Mwawesa 8.4 0.2 0.3 91.0 0.1 2,368
Ruruma 9.3 0.1 0.2 90.1 0.2 3,376
Kambe/Ribe 23.2 0.7 0.3 75.5 0.3 2,859
Rabai/Kisurutini 38.5 0.7 0.1 58.3 2.4 7,276
Ganze Constituency 6.5 0.1 0.2 93.1 0.2 19,838
Ganze 8.3 0.1 0.1 91.4 - 4,462
Bamba 6.7 0.1 0.2 92.7 0.3 5,410
Jaribuni 4.6 0.1 0.2 94.9 0.1 3,762
Sokoke 6.2 0.0 0.2 93.5 0.1 6,204
Malindi Constituency 55.7 1.5 0.3 42.0 0.6 33,182
Jilore 10.5 0.1 0.3 88.7 0.4 2,732
Kakuyuni 7.3 0.0 0.1 92.5 0.1 2,538
Ganda 16.0 0.3 0.2 83.3 0.2 4,472
Malindi Town 73.7 1.5 0.1 24.4 0.3 13,691
Shella 74.1 2.6 0.6 21.5 1.3 9,749
Magarini Constituency 14.8 0.5 0.3 83.9 0.4 25,949
Marafa 8.4 0.0 0.2 90.9 0.5 2,594
Magarini 13.0 0.3 0.2 86.4 0.1 5,276
Gongoni 22.9 0.2 0.3 75.7 0.9 5,004
Adu 9.3 0.1 0.3 90.1 0.3 6,799
Garashi 3.1 0.1 0.4 96.1 0.3 3,574
Sabaki 39.4 3.6 0.3 56.3 0.4 2,702
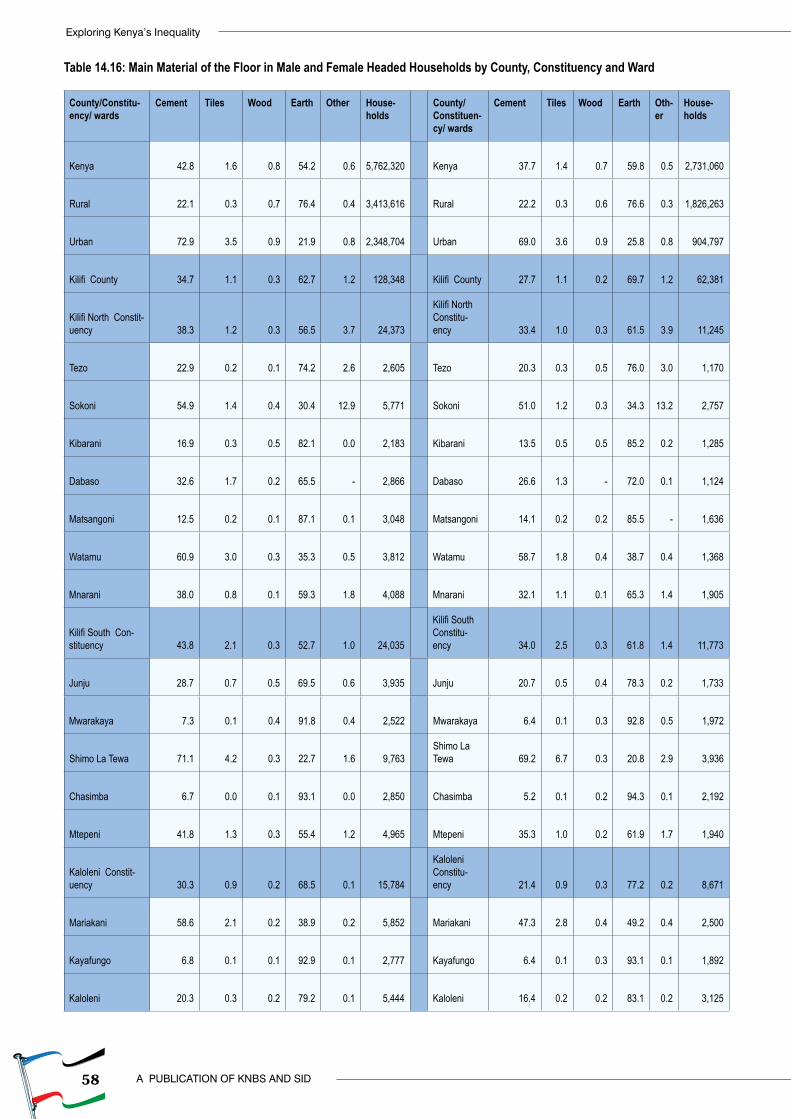
58
Exploring Kenya’s Inequality
A PUBLICATION OF KNBS AND SID
Table 14.16: Main Material of the Floor in Male and Female Headed Households by County, Constituency and Ward
County/Constitu-ency/ wards
Cement Tiles Wood Earth Other House-holds
County/Constituen-cy/ wards
Cement Tiles Wood Earth Oth-er
House-holds
Kenya
42.8
1.6
0.8
54.2
0.6
5,762,320 Kenya
37.7
1.4
0.7
59.8
0.5
2,731,060
Rural
22.1
0.3
0.7
76.4
0.4
3,413,616 Rural
22.2
0.3
0.6
76.6
0.3
1,826,263
Urban
72.9
3.5
0.9
21.9
0.8
2,348,704 Urban
69.0
3.6
0.9
25.8
0.8
904,797
Kilifi County
34.7
1.1
0.3
62.7
1.2
128,348 Kilifi County
27.7
1.1
0.2
69.7
1.2
62,381
Kilifi North Constit-uency
38.3
1.2
0.3
56.5
3.7
24,373
Kilifi North Constitu-ency
33.4
1.0
0.3
61.5
3.9
11,245
Tezo
22.9
0.2
0.1
74.2
2.6 2,605 Tezo
20.3
0.3
0.5
76.0
3.0
1,170
Sokoni
54.9
1.4
0.4
30.4
12.9 5,771 Sokoni
51.0
1.2
0.3
34.3
13.2
2,757
Kibarani
16.9
0.3
0.5
82.1
0.0 2,183 Kibarani
13.5
0.5
0.5
85.2
0.2
1,285
Dabaso
32.6
1.7
0.2
65.5
- 2,866 Dabaso
26.6
1.3
-
72.0
0.1
1,124
Matsangoni
12.5
0.2
0.1
87.1
0.1 3,048 Matsangoni
14.1
0.2
0.2
85.5
-
1,636
Watamu
60.9
3.0
0.3
35.3
0.5 3,812 Watamu
58.7
1.8
0.4
38.7
0.4
1,368
Mnarani
38.0
0.8
0.1
59.3
1.8 4,088 Mnarani
32.1
1.1
0.1
65.3
1.4
1,905
Kilifi South Con-stituency
43.8
2.1
0.3
52.7
1.0
24,035
Kilifi South Constitu-ency
34.0
2.5
0.3
61.8
1.4
11,773
Junju
28.7
0.7
0.5
69.5
0.6 3,935 Junju
20.7
0.5
0.4
78.3
0.2
1,733
Mwarakaya
7.3
0.1
0.4
91.8
0.4 2,522 Mwarakaya
6.4
0.1
0.3
92.8
0.5
1,972
Shimo La Tewa
71.1
4.2
0.3
22.7
1.6 9,763
Shimo La Tewa
69.2
6.7
0.3
20.8
2.9
3,936
Chasimba
6.7
0.0
0.1
93.1
0.0 2,850 Chasimba
5.2
0.1
0.2
94.3
0.1
2,192
Mtepeni
41.8
1.3
0.3
55.4
1.2 4,965 Mtepeni
35.3
1.0
0.2
61.9
1.7
1,940
Kaloleni Constit-uency
30.3
0.9
0.2
68.5
0.1
15,784
Kaloleni Constitu-ency
21.4
0.9
0.3
77.2
0.2
8,671
Mariakani
58.6
2.1
0.2
38.9
0.2 5,852 Mariakani
47.3
2.8
0.4
49.2
0.4
2,500
Kayafungo
6.8
0.1
0.1
92.9
0.1 2,777 Kayafungo
6.4
0.1
0.3
93.1
0.1
1,892
Kaloleni
20.3
0.3
0.2
79.2
0.1 5,444 Kaloleni
16.4
0.2
0.2
83.1
0.2
3,125
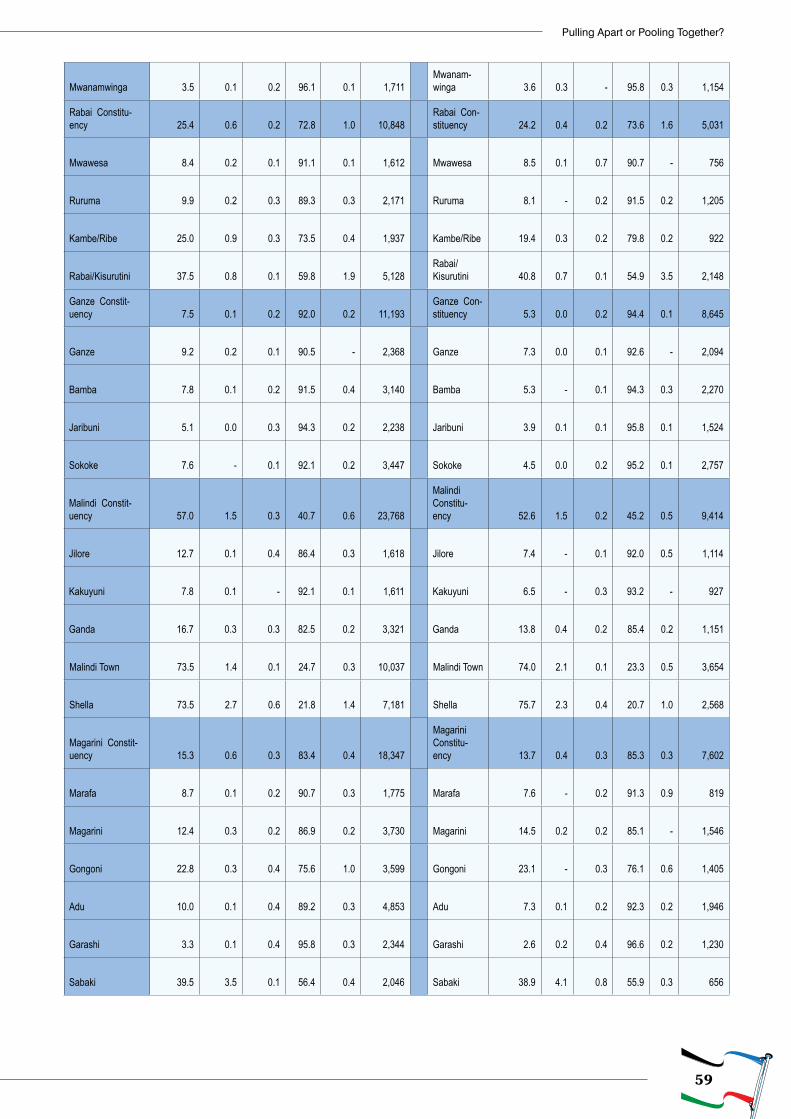
59
Pulling Apart or Pooling Together?
Mwanamwinga
3.5
0.1
0.2
96.1
0.1 1,711
Mwanam-winga
3.6
0.3
-
95.8
0.3
1,154
Rabai Constitu-ency
25.4
0.6
0.2
72.8
1.0
10,848
Rabai Con-stituency
24.2
0.4
0.2
73.6
1.6
5,031
Mwawesa
8.4
0.2
0.1
91.1
0.1 1,612 Mwawesa
8.5
0.1
0.7
90.7
-
756
Ruruma
9.9
0.2
0.3
89.3
0.3 2,171 Ruruma
8.1
-
0.2
91.5
0.2
1,205
Kambe/Ribe
25.0
0.9
0.3
73.5
0.4 1,937 Kambe/Ribe
19.4
0.3
0.2
79.8
0.2
922
Rabai/Kisurutini
37.5
0.8
0.1
59.8
1.9 5,128
Rabai/Kisurutini
40.8
0.7
0.1
54.9
3.5
2,148
Ganze Constit-uency
7.5
0.1
0.2
92.0
0.2
11,193
Ganze Con-stituency
5.3
0.0
0.2
94.4
0.1
8,645
Ganze
9.2
0.2
0.1
90.5
- 2,368 Ganze
7.3
0.0
0.1
92.6
-
2,094
Bamba
7.8
0.1
0.2
91.5
0.4 3,140 Bamba
5.3
-
0.1
94.3
0.3
2,270
Jaribuni
5.1
0.0
0.3
94.3
0.2 2,238 Jaribuni
3.9
0.1
0.1
95.8
0.1
1,524
Sokoke
7.6
-
0.1
92.1
0.2 3,447 Sokoke
4.5
0.0
0.2
95.2
0.1
2,757
Malindi Constit-uency
57.0
1.5
0.3
40.7
0.6
23,768
Malindi Constitu-ency
52.6
1.5
0.2
45.2
0.5
9,414
Jilore
12.7
0.1
0.4
86.4
0.3 1,618 Jilore
7.4
-
0.1
92.0
0.5
1,114
Kakuyuni
7.8
0.1
-
92.1
0.1 1,611 Kakuyuni
6.5
-
0.3
93.2
-
927
Ganda
16.7
0.3
0.3
82.5
0.2 3,321 Ganda
13.8
0.4
0.2
85.4
0.2
1,151
Malindi Town
73.5
1.4
0.1
24.7
0.3
10,037 Malindi Town
74.0
2.1
0.1
23.3
0.5 3,654
Shella
73.5
2.7
0.6
21.8
1.4 7,181 Shella
75.7
2.3
0.4
20.7
1.0
2,568
Magarini Constit-uency
15.3
0.6
0.3
83.4
0.4
18,347
Magarini Constitu-ency
13.7
0.4
0.3
85.3
0.3
7,602
Marafa
8.7
0.1
0.2
90.7
0.3 1,775 Marafa
7.6
-
0.2
91.3
0.9
819
Magarini
12.4
0.3
0.2
86.9
0.2 3,730 Magarini
14.5
0.2
0.2
85.1
-
1,546
Gongoni
22.8
0.3
0.4
75.6
1.0 3,599 Gongoni
23.1
-
0.3
76.1
0.6
1,405
Adu
10.0
0.1
0.4
89.2
0.3 4,853 Adu
7.3
0.1
0.2
92.3
0.2
1,946
Garashi
3.3
0.1
0.4
95.8
0.3 2,344 Garashi
2.6
0.2
0.4
96.6
0.2
1,230
Sabaki
39.5
3.5
0.1
56.4
0.4 2,046 Sabaki
38.9
4.1
0.8
55.9
0.3
656
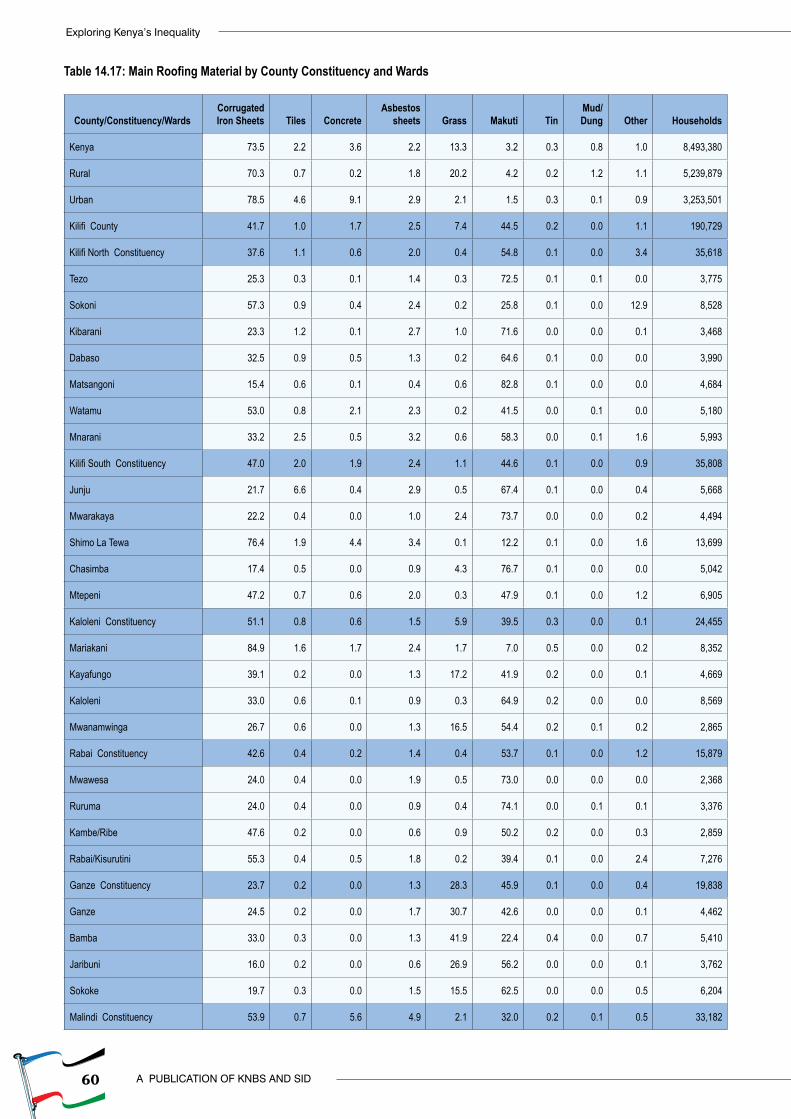
60
Exploring Kenya’s Inequality
A PUBLICATION OF KNBS AND SID
Table 14.17: Main Roofing Material by County Constituency and Wards
County/Constituency/WardsCorrugated Iron Sheets Tiles Concrete
Asbestos sheets Grass Makuti Tin
Mud/Dung Other Households
Kenya 73.5 2.2 3.6 2.2 13.3 3.2 0.3 0.8 1.0 8,493,380
Rural 70.3 0.7 0.2 1.8 20.2 4.2 0.2 1.2 1.1 5,239,879
Urban 78.5 4.6 9.1 2.9 2.1 1.5 0.3 0.1 0.9 3,253,501
Kilifi County 41.7 1.0 1.7 2.5 7.4 44.5 0.2 0.0 1.1 190,729
Kilifi North Constituency 37.6 1.1 0.6 2.0 0.4 54.8 0.1 0.0 3.4 35,618
Tezo 25.3 0.3 0.1 1.4 0.3 72.5 0.1 0.1 0.0 3,775
Sokoni 57.3 0.9 0.4 2.4 0.2 25.8 0.1 0.0 12.9 8,528
Kibarani 23.3 1.2 0.1 2.7 1.0 71.6 0.0 0.0 0.1 3,468
Dabaso 32.5 0.9 0.5 1.3 0.2 64.6 0.1 0.0 0.0 3,990
Matsangoni 15.4 0.6 0.1 0.4 0.6 82.8 0.1 0.0 0.0 4,684
Watamu 53.0 0.8 2.1 2.3 0.2 41.5 0.0 0.1 0.0 5,180
Mnarani 33.2 2.5 0.5 3.2 0.6 58.3 0.0 0.1 1.6 5,993
Kilifi South Constituency 47.0 2.0 1.9 2.4 1.1 44.6 0.1 0.0 0.9 35,808
Junju 21.7 6.6 0.4 2.9 0.5 67.4 0.1 0.0 0.4 5,668
Mwarakaya 22.2 0.4 0.0 1.0 2.4 73.7 0.0 0.0 0.2 4,494
Shimo La Tewa 76.4 1.9 4.4 3.4 0.1 12.2 0.1 0.0 1.6 13,699
Chasimba 17.4 0.5 0.0 0.9 4.3 76.7 0.1 0.0 0.0 5,042
Mtepeni 47.2 0.7 0.6 2.0 0.3 47.9 0.1 0.0 1.2 6,905
Kaloleni Constituency 51.1 0.8 0.6 1.5 5.9 39.5 0.3 0.0 0.1 24,455
Mariakani 84.9 1.6 1.7 2.4 1.7 7.0 0.5 0.0 0.2 8,352
Kayafungo 39.1 0.2 0.0 1.3 17.2 41.9 0.2 0.0 0.1 4,669
Kaloleni 33.0 0.6 0.1 0.9 0.3 64.9 0.2 0.0 0.0 8,569
Mwanamwinga 26.7 0.6 0.0 1.3 16.5 54.4 0.2 0.1 0.2 2,865
Rabai Constituency 42.6 0.4 0.2 1.4 0.4 53.7 0.1 0.0 1.2 15,879
Mwawesa 24.0 0.4 0.0 1.9 0.5 73.0 0.0 0.0 0.0 2,368
Ruruma 24.0 0.4 0.0 0.9 0.4 74.1 0.0 0.1 0.1 3,376
Kambe/Ribe 47.6 0.2 0.0 0.6 0.9 50.2 0.2 0.0 0.3 2,859
Rabai/Kisurutini 55.3 0.4 0.5 1.8 0.2 39.4 0.1 0.0 2.4 7,276
Ganze Constituency 23.7 0.2 0.0 1.3 28.3 45.9 0.1 0.0 0.4 19,838
Ganze 24.5 0.2 0.0 1.7 30.7 42.6 0.0 0.0 0.1 4,462
Bamba 33.0 0.3 0.0 1.3 41.9 22.4 0.4 0.0 0.7 5,410
Jaribuni 16.0 0.2 0.0 0.6 26.9 56.2 0.0 0.0 0.1 3,762
Sokoke 19.7 0.3 0.0 1.5 15.5 62.5 0.0 0.0 0.5 6,204
Malindi Constituency 53.9 0.7 5.6 4.9 2.1 32.0 0.2 0.1 0.5 33,182
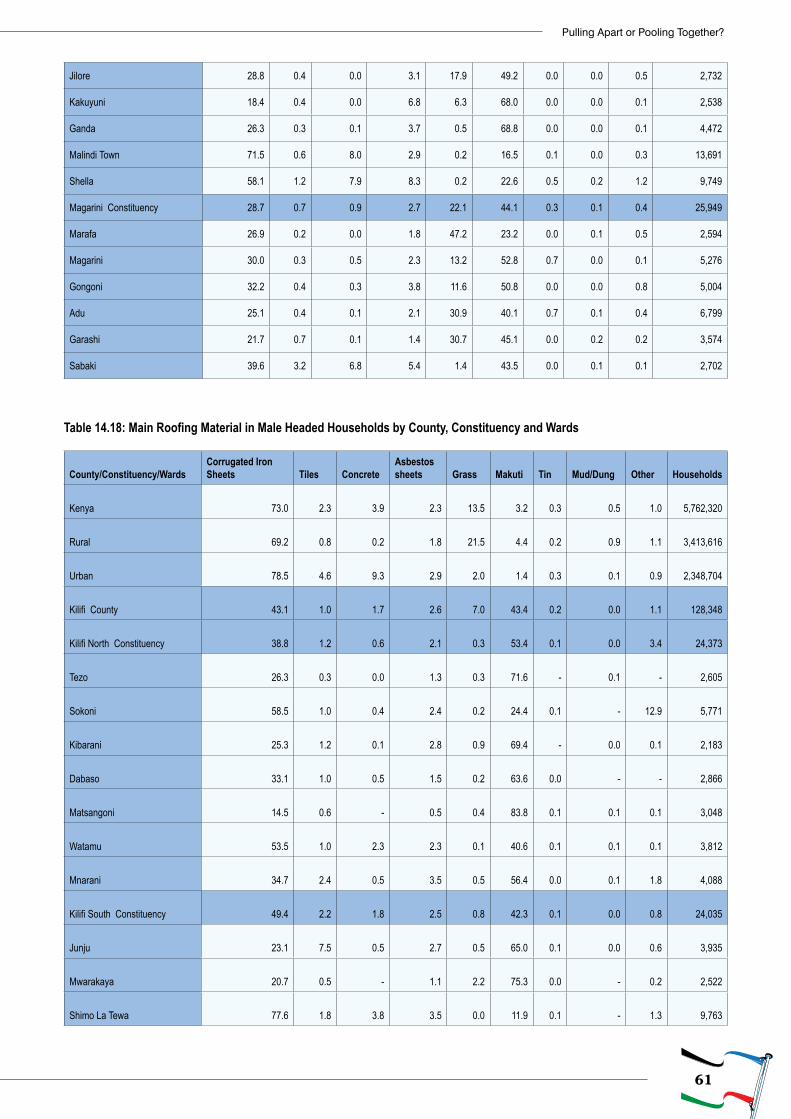
61
Pulling Apart or Pooling Together?
Jilore 28.8 0.4 0.0 3.1 17.9 49.2 0.0 0.0 0.5 2,732
Kakuyuni 18.4 0.4 0.0 6.8 6.3 68.0 0.0 0.0 0.1 2,538
Ganda 26.3 0.3 0.1 3.7 0.5 68.8 0.0 0.0 0.1 4,472
Malindi Town 71.5 0.6 8.0 2.9 0.2 16.5 0.1 0.0 0.3 13,691
Shella 58.1 1.2 7.9 8.3 0.2 22.6 0.5 0.2 1.2 9,749
Magarini Constituency 28.7 0.7 0.9 2.7 22.1 44.1 0.3 0.1 0.4 25,949
Marafa 26.9 0.2 0.0 1.8 47.2 23.2 0.0 0.1 0.5 2,594
Magarini 30.0 0.3 0.5 2.3 13.2 52.8 0.7 0.0 0.1 5,276
Gongoni 32.2 0.4 0.3 3.8 11.6 50.8 0.0 0.0 0.8 5,004
Adu 25.1 0.4 0.1 2.1 30.9 40.1 0.7 0.1 0.4 6,799
Garashi 21.7 0.7 0.1 1.4 30.7 45.1 0.0 0.2 0.2 3,574
Sabaki 39.6 3.2 6.8 5.4 1.4 43.5 0.0 0.1 0.1 2,702
Table 14.18: Main Roofing Material in Male Headed Households by County, Constituency and Wards
County/Constituency/WardsCorrugated Iron Sheets Tiles Concrete
Asbestos sheets Grass Makuti Tin Mud/Dung Other Households
Kenya 73.0
2.3
3.9 2.3
13.5
3.2
0.3 0.5
1.0
5,762,320
Rural 69.2
0.8
0.2 1.8
21.5
4.4
0.2 0.9
1.1
3,413,616
Urban 78.5
4.6
9.3 2.9
2.0
1.4
0.3 0.1
0.9
2,348,704
Kilifi County 43.1
1.0
1.7 2.6
7.0
43.4
0.2 0.0
1.1 128,348
Kilifi North Constituency 38.8
1.2
0.6 2.1
0.3
53.4
0.1 0.0
3.4 24,373
Tezo 26.3
0.3
0.0 1.3
0.3
71.6
- 0.1
- 2,605
Sokoni 58.5
1.0
0.4 2.4
0.2
24.4
0.1 -
12.9 5,771
Kibarani 25.3
1.2
0.1 2.8
0.9
69.4
- 0.0
0.1 2,183
Dabaso 33.1
1.0
0.5 1.5
0.2
63.6
0.0 -
- 2,866
Matsangoni 14.5
0.6 - 0.5
0.4
83.8
0.1 0.1
0.1 3,048
Watamu 53.5
1.0
2.3 2.3
0.1
40.6
0.1 0.1
0.1 3,812
Mnarani 34.7
2.4
0.5 3.5
0.5
56.4
0.0 0.1
1.8 4,088
Kilifi South Constituency 49.4
2.2
1.8 2.5
0.8
42.3
0.1 0.0
0.8 24,035
Junju 23.1
7.5
0.5 2.7
0.5
65.0
0.1 0.0
0.6 3,935
Mwarakaya 20.7
0.5 - 1.1
2.2
75.3
0.0 -
0.2 2,522
Shimo La Tewa 77.6
1.8
3.8 3.5
0.0
11.9
0.1 -
1.3 9,763
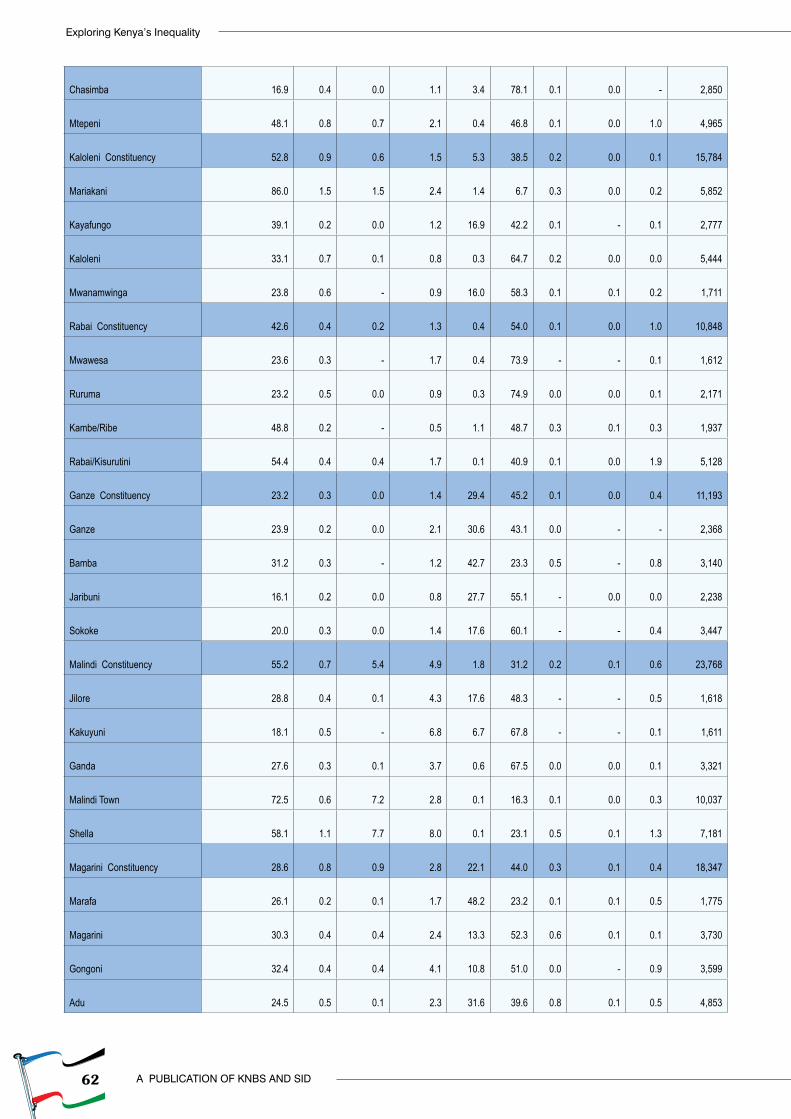
62
Exploring Kenya’s Inequality
A PUBLICATION OF KNBS AND SID
Chasimba 16.9
0.4
0.0 1.1
3.4
78.1
0.1 0.0
- 2,850
Mtepeni 48.1
0.8
0.7 2.1
0.4
46.8
0.1 0.0
1.0 4,965
Kaloleni Constituency 52.8
0.9
0.6 1.5
5.3
38.5
0.2 0.0
0.1 15,784
Mariakani 86.0
1.5
1.5 2.4
1.4
6.7
0.3 0.0
0.2 5,852
Kayafungo 39.1
0.2
0.0 1.2
16.9
42.2
0.1 -
0.1 2,777
Kaloleni 33.1
0.7
0.1 0.8
0.3
64.7
0.2 0.0
0.0 5,444
Mwanamwinga 23.8
0.6 - 0.9
16.0
58.3
0.1 0.1
0.2 1,711
Rabai Constituency 42.6
0.4
0.2 1.3
0.4
54.0
0.1 0.0
1.0 10,848
Mwawesa 23.6
0.3 - 1.7
0.4
73.9
- -
0.1 1,612
Ruruma 23.2
0.5
0.0 0.9
0.3
74.9
0.0 0.0
0.1 2,171
Kambe/Ribe 48.8
0.2 - 0.5
1.1
48.7
0.3 0.1
0.3 1,937
Rabai/Kisurutini 54.4
0.4
0.4 1.7
0.1
40.9
0.1 0.0
1.9 5,128
Ganze Constituency 23.2
0.3
0.0 1.4
29.4
45.2
0.1 0.0
0.4 11,193
Ganze 23.9
0.2
0.0 2.1
30.6
43.1
0.0 -
- 2,368
Bamba 31.2
0.3 - 1.2
42.7
23.3
0.5 -
0.8 3,140
Jaribuni 16.1
0.2
0.0 0.8
27.7
55.1
- 0.0
0.0 2,238
Sokoke 20.0
0.3
0.0 1.4
17.6
60.1
- -
0.4 3,447
Malindi Constituency 55.2
0.7
5.4 4.9
1.8
31.2
0.2 0.1
0.6 23,768
Jilore 28.8
0.4
0.1 4.3
17.6
48.3
- -
0.5 1,618
Kakuyuni 18.1
0.5 - 6.8
6.7
67.8
- -
0.1 1,611
Ganda 27.6
0.3
0.1 3.7
0.6
67.5
0.0 0.0
0.1 3,321
Malindi Town 72.5
0.6
7.2 2.8
0.1
16.3
0.1 0.0
0.3 10,037
Shella 58.1
1.1
7.7 8.0
0.1
23.1
0.5 0.1
1.3 7,181
Magarini Constituency 28.6
0.8
0.9 2.8
22.1
44.0
0.3 0.1
0.4 18,347
Marafa 26.1
0.2
0.1 1.7
48.2
23.2
0.1 0.1
0.5 1,775
Magarini 30.3
0.4
0.4 2.4
13.3
52.3
0.6 0.1
0.1 3,730
Gongoni 32.4
0.4
0.4 4.1
10.8
51.0
0.0 -
0.9 3,599
Adu 24.5
0.5
0.1 2.3
31.6
39.6
0.8 0.1
0.5 4,853
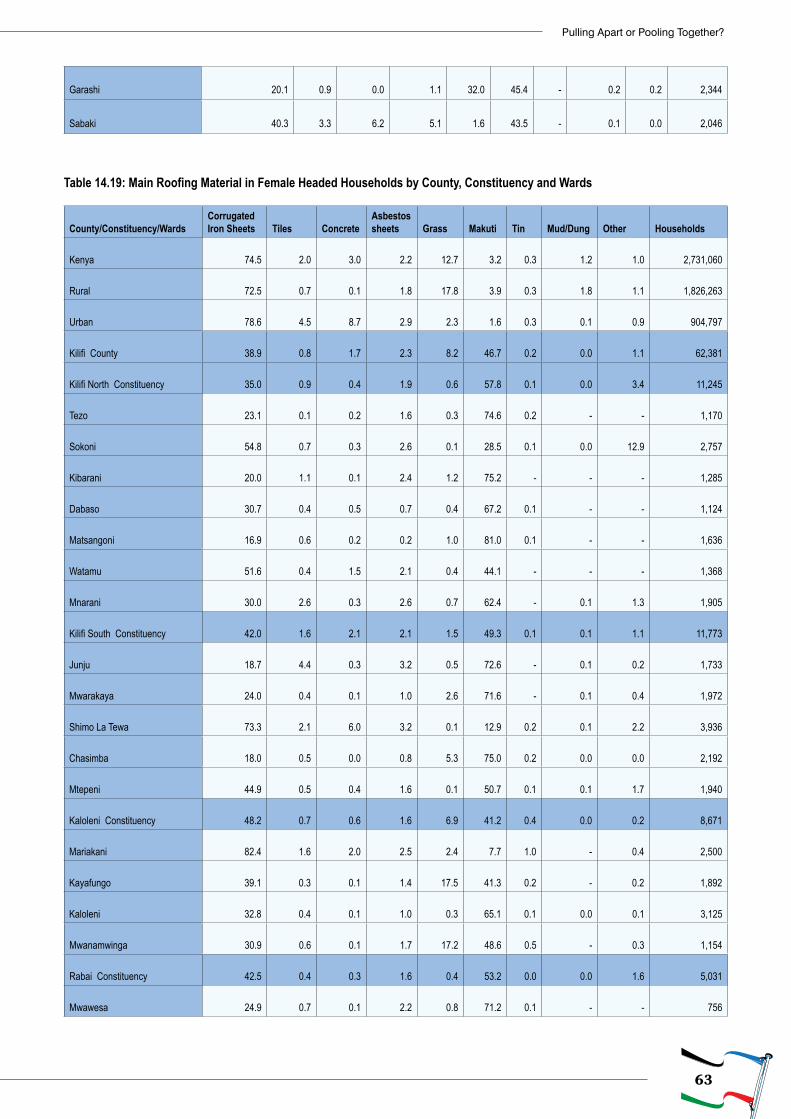
63
Pulling Apart or Pooling Together?
Garashi 20.1
0.9
0.0 1.1
32.0
45.4
- 0.2
0.2 2,344
Sabaki 40.3
3.3
6.2 5.1
1.6
43.5
- 0.1
0.0 2,046
Table 14.19: Main Roofing Material in Female Headed Households by County, Constituency and Wards
County/Constituency/WardsCorrugated Iron Sheets Tiles Concrete
Asbestos sheets Grass Makuti Tin Mud/Dung Other Households
Kenya 74.5
2.0
3.0
2.2
12.7
3.2
0.3 1.2
1.0 2,731,060
Rural 72.5
0.7
0.1
1.8
17.8
3.9
0.3 1.8
1.1 1,826,263
Urban 78.6
4.5
8.7
2.9
2.3
1.6
0.3 0.1
0.9 904,797
Kilifi County 38.9
0.8
1.7
2.3
8.2
46.7
0.2 0.0
1.1 62,381
Kilifi North Constituency 35.0
0.9
0.4
1.9
0.6
57.8
0.1 0.0
3.4 11,245
Tezo 23.1
0.1
0.2
1.6
0.3
74.6
0.2 - - 1,170
Sokoni 54.8
0.7
0.3
2.6
0.1
28.5
0.1 0.0
12.9 2,757
Kibarani 20.0
1.1
0.1
2.4
1.2
75.2
- - - 1,285
Dabaso 30.7
0.4
0.5
0.7
0.4
67.2
0.1 - - 1,124
Matsangoni 16.9
0.6
0.2
0.2
1.0
81.0
0.1 - - 1,636
Watamu 51.6
0.4
1.5
2.1
0.4
44.1
- - - 1,368
Mnarani 30.0
2.6
0.3
2.6
0.7
62.4
- 0.1
1.3 1,905
Kilifi South Constituency 42.0
1.6
2.1
2.1
1.5
49.3
0.1 0.1
1.1 11,773
Junju 18.7
4.4
0.3
3.2
0.5
72.6
- 0.1
0.2 1,733
Mwarakaya 24.0
0.4
0.1
1.0
2.6
71.6
- 0.1
0.4 1,972
Shimo La Tewa 73.3
2.1
6.0
3.2
0.1
12.9
0.2 0.1
2.2 3,936
Chasimba 18.0
0.5
0.0
0.8
5.3
75.0
0.2 0.0
0.0 2,192
Mtepeni 44.9
0.5
0.4
1.6
0.1
50.7
0.1 0.1
1.7 1,940
Kaloleni Constituency 48.2
0.7
0.6
1.6
6.9
41.2
0.4 0.0
0.2 8,671
Mariakani 82.4
1.6
2.0
2.5
2.4
7.7
1.0 -
0.4 2,500
Kayafungo 39.1
0.3
0.1
1.4
17.5
41.3
0.2 -
0.2 1,892
Kaloleni 32.8
0.4
0.1
1.0
0.3
65.1
0.1 0.0
0.1 3,125
Mwanamwinga 30.9
0.6
0.1
1.7
17.2
48.6
0.5 -
0.3 1,154
Rabai Constituency 42.5
0.4
0.3
1.6
0.4
53.2
0.0 0.0
1.6 5,031
Mwawesa 24.9
0.7
0.1
2.2
0.8
71.2
0.1 - - 756
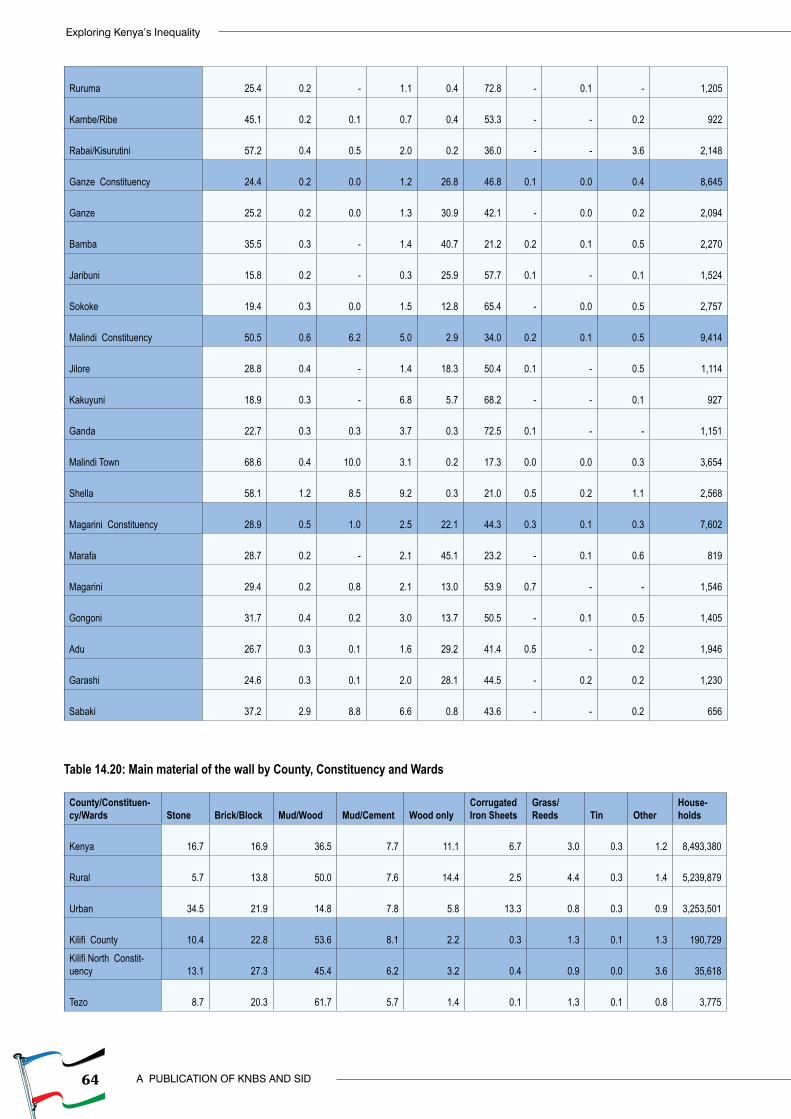
64
Exploring Kenya’s Inequality
A PUBLICATION OF KNBS AND SID
Ruruma 25.4
0.2 -
1.1
0.4
72.8
- 0.1 - 1,205
Kambe/Ribe 45.1
0.2
0.1
0.7
0.4
53.3
- -
0.2 922
Rabai/Kisurutini 57.2
0.4
0.5
2.0
0.2
36.0
- -
3.6 2,148
Ganze Constituency 24.4
0.2
0.0
1.2
26.8
46.8
0.1 0.0
0.4 8,645
Ganze 25.2
0.2
0.0
1.3
30.9
42.1
- 0.0
0.2 2,094
Bamba 35.5
0.3 -
1.4
40.7
21.2
0.2 0.1
0.5 2,270
Jaribuni 15.8
0.2 -
0.3
25.9
57.7
0.1 -
0.1 1,524
Sokoke 19.4
0.3
0.0
1.5
12.8
65.4
- 0.0
0.5 2,757
Malindi Constituency 50.5
0.6
6.2
5.0
2.9
34.0
0.2 0.1
0.5 9,414
Jilore 28.8
0.4 -
1.4
18.3
50.4
0.1 -
0.5 1,114
Kakuyuni 18.9
0.3 -
6.8
5.7
68.2
- -
0.1 927
Ganda 22.7
0.3
0.3
3.7
0.3
72.5
0.1 - - 1,151
Malindi Town 68.6
0.4
10.0
3.1
0.2
17.3
0.0 0.0
0.3 3,654
Shella 58.1
1.2
8.5
9.2
0.3
21.0
0.5 0.2
1.1 2,568
Magarini Constituency 28.9
0.5
1.0
2.5
22.1
44.3
0.3 0.1
0.3 7,602
Marafa 28.7
0.2 -
2.1
45.1
23.2
- 0.1
0.6 819
Magarini 29.4
0.2
0.8
2.1
13.0
53.9
0.7 - - 1,546
Gongoni 31.7
0.4
0.2
3.0
13.7
50.5
- 0.1
0.5 1,405
Adu 26.7
0.3
0.1
1.6
29.2
41.4
0.5 -
0.2 1,946
Garashi 24.6
0.3
0.1
2.0
28.1
44.5
- 0.2
0.2 1,230
Sabaki 37.2
2.9
8.8
6.6
0.8
43.6
- -
0.2 656
Table 14.20: Main material of the wall by County, Constituency and Wards
County/Constituen-cy/Wards Stone Brick/Block Mud/Wood Mud/Cement Wood only
Corrugated Iron Sheets
Grass/Reeds Tin Other
House-holds
Kenya 16.7 16.9 36.5 7.7 11.1 6.7 3.0 0.3 1.2
8,493,380
Rural 5.7 13.8 50.0 7.6 14.4 2.5 4.4 0.3 1.4
5,239,879
Urban 34.5 21.9 14.8 7.8 5.8 13.3 0.8 0.3 0.9
3,253,501
Kilifi County 10.4 22.8 53.6 8.1 2.2 0.3 1.3 0.1 1.3
190,729 Kilifi North Constit-uency 13.1 27.3 45.4 6.2 3.2 0.4 0.9 0.0 3.6
35,618
Tezo 8.7 20.3 61.7 5.7 1.4 0.1 1.3 0.1 0.8
3,775
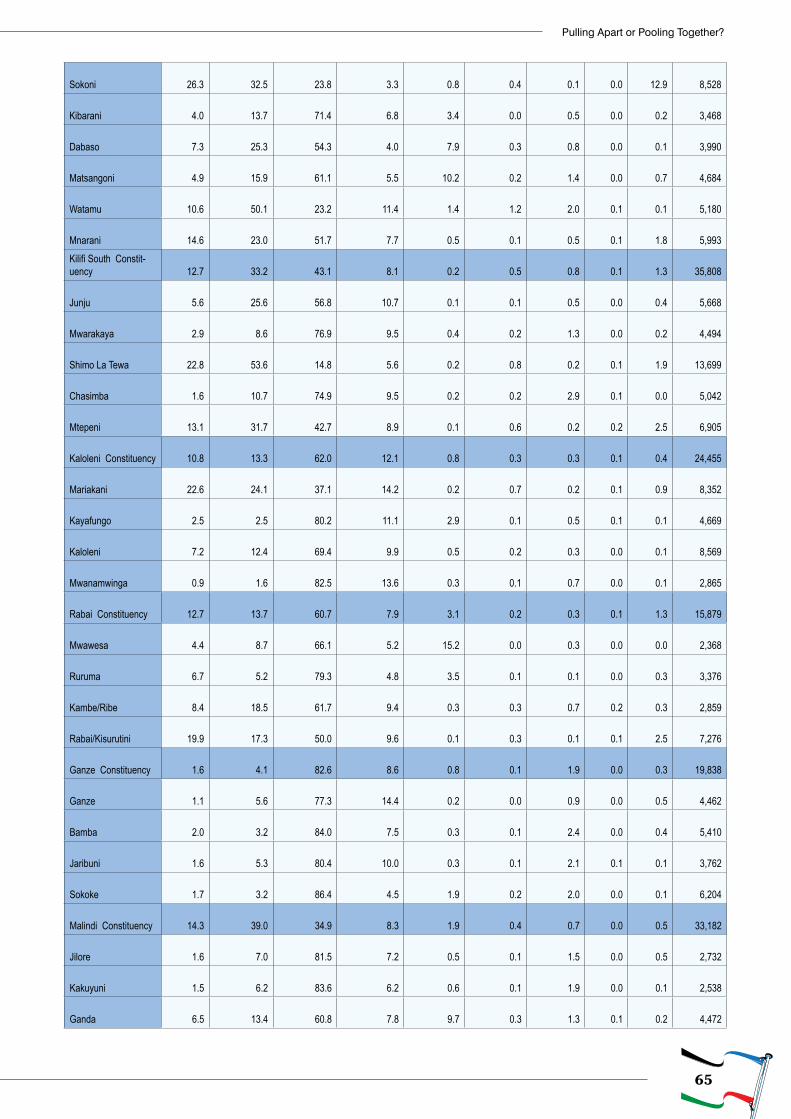
65
Pulling Apart or Pooling Together?
Sokoni 26.3 32.5 23.8 3.3 0.8 0.4 0.1 0.0 12.9
8,528
Kibarani 4.0 13.7 71.4 6.8 3.4 0.0 0.5 0.0 0.2
3,468
Dabaso 7.3 25.3 54.3 4.0 7.9 0.3 0.8 0.0 0.1
3,990
Matsangoni 4.9 15.9 61.1 5.5 10.2 0.2 1.4 0.0 0.7
4,684
Watamu 10.6 50.1 23.2 11.4 1.4 1.2 2.0 0.1 0.1
5,180
Mnarani 14.6 23.0 51.7 7.7 0.5 0.1 0.5 0.1 1.8
5,993 Kilifi South Constit-uency 12.7 33.2 43.1 8.1 0.2 0.5 0.8 0.1 1.3
35,808
Junju 5.6 25.6 56.8 10.7 0.1 0.1 0.5 0.0 0.4
5,668
Mwarakaya 2.9 8.6 76.9 9.5 0.4 0.2 1.3 0.0 0.2
4,494
Shimo La Tewa 22.8 53.6 14.8 5.6 0.2 0.8 0.2 0.1 1.9 13,699
Chasimba 1.6 10.7 74.9 9.5 0.2 0.2 2.9 0.1 0.0
5,042
Mtepeni 13.1 31.7 42.7 8.9 0.1 0.6 0.2 0.2 2.5
6,905
Kaloleni Constituency 10.8 13.3 62.0 12.1 0.8 0.3 0.3 0.1 0.4 24,455
Mariakani 22.6 24.1 37.1 14.2 0.2 0.7 0.2 0.1 0.9
8,352
Kayafungo 2.5 2.5 80.2 11.1 2.9 0.1 0.5 0.1 0.1
4,669
Kaloleni 7.2 12.4 69.4 9.9 0.5 0.2 0.3 0.0 0.1
8,569
Mwanamwinga 0.9 1.6 82.5 13.6 0.3 0.1 0.7 0.0 0.1
2,865
Rabai Constituency 12.7 13.7 60.7 7.9 3.1 0.2 0.3 0.1 1.3 15,879
Mwawesa 4.4 8.7 66.1 5.2 15.2 0.0 0.3 0.0 0.0
2,368
Ruruma 6.7 5.2 79.3 4.8 3.5 0.1 0.1 0.0 0.3
3,376
Kambe/Ribe 8.4 18.5 61.7 9.4 0.3 0.3 0.7 0.2 0.3
2,859
Rabai/Kisurutini 19.9 17.3 50.0 9.6 0.1 0.3 0.1 0.1 2.5
7,276
Ganze Constituency 1.6 4.1 82.6 8.6 0.8 0.1 1.9 0.0 0.3 19,838
Ganze 1.1 5.6 77.3 14.4 0.2 0.0 0.9 0.0 0.5
4,462
Bamba 2.0 3.2 84.0 7.5 0.3 0.1 2.4 0.0 0.4
5,410
Jaribuni 1.6 5.3 80.4 10.0 0.3 0.1 2.1 0.1 0.1
3,762
Sokoke 1.7 3.2 86.4 4.5 1.9 0.2 2.0 0.0 0.1
6,204
Malindi Constituency 14.3 39.0 34.9 8.3 1.9 0.4 0.7 0.0 0.5 33,182
Jilore 1.6 7.0 81.5 7.2 0.5 0.1 1.5 0.0 0.5
2,732
Kakuyuni 1.5 6.2 83.6 6.2 0.6 0.1 1.9 0.0 0.1
2,538
Ganda 6.5 13.4 60.8 7.8 9.7 0.3 1.3 0.1 0.2
4,472
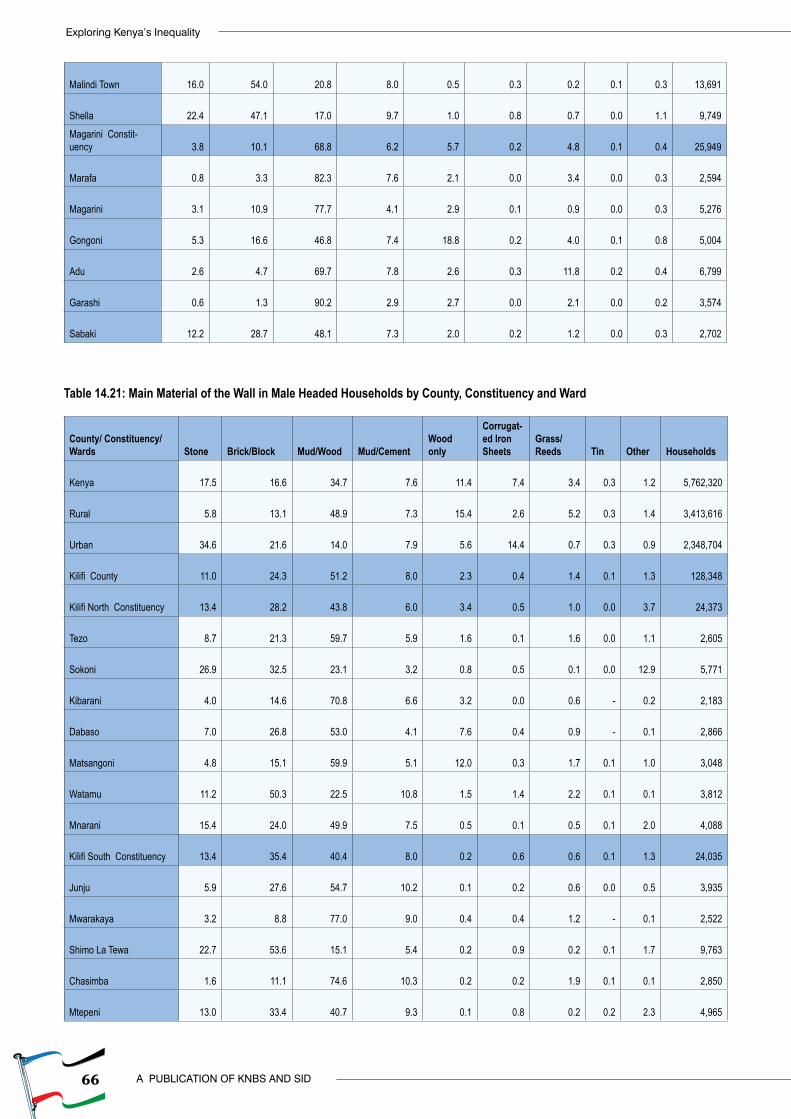
66
Exploring Kenya’s Inequality
A PUBLICATION OF KNBS AND SID
Malindi Town 16.0 54.0 20.8 8.0 0.5 0.3 0.2 0.1 0.3 13,691
Shella 22.4 47.1 17.0 9.7 1.0 0.8 0.7 0.0 1.1
9,749 Magarini Constit-uency 3.8 10.1 68.8 6.2 5.7 0.2 4.8 0.1 0.4
25,949
Marafa 0.8 3.3 82.3 7.6 2.1 0.0 3.4 0.0 0.3
2,594
Magarini 3.1 10.9 77.7 4.1 2.9 0.1 0.9 0.0 0.3
5,276
Gongoni 5.3 16.6 46.8 7.4 18.8 0.2 4.0 0.1 0.8
5,004
Adu 2.6 4.7 69.7 7.8 2.6 0.3 11.8 0.2 0.4
6,799
Garashi 0.6 1.3 90.2 2.9 2.7 0.0 2.1 0.0 0.2
3,574
Sabaki 12.2 28.7 48.1 7.3 2.0 0.2 1.2 0.0 0.3
2,702
Table 14.21: Main Material of the Wall in Male Headed Households by County, Constituency and Ward
County/ Constituency/ Wards Stone Brick/Block Mud/Wood Mud/Cement
Wood only
Corrugat-ed Iron Sheets
Grass/Reeds Tin Other Households
Kenya
17.5 16.6 34.7 7.6 11.4
7.4 3.4
0.3
1.2 5,762,320
Rural
5.8 13.1 48.9 7.3 15.4
2.6 5.2
0.3
1.4 3,413,616
Urban
34.6 21.6 14.0 7.9 5.6
14.4 0.7
0.3
0.9 2,348,704
Kilifi County
11.0 24.3 51.2 8.0 2.3
0.4 1.4
0.1
1.3 128,348
Kilifi North Constituency
13.4 28.2 43.8 6.0 3.4
0.5 1.0
0.0
3.7 24,373
Tezo
8.7 21.3 59.7 5.9 1.6
0.1 1.6
0.0
1.1 2,605
Sokoni
26.9 32.5 23.1 3.2 0.8
0.5 0.1
0.0
12.9 5,771
Kibarani
4.0 14.6 70.8 6.6 3.2
0.0 0.6
-
0.2 2,183
Dabaso
7.0 26.8 53.0 4.1 7.6
0.4 0.9
-
0.1 2,866
Matsangoni
4.8 15.1 59.9 5.1 12.0
0.3 1.7
0.1
1.0 3,048
Watamu
11.2 50.3 22.5 10.8 1.5
1.4 2.2
0.1
0.1 3,812
Mnarani
15.4 24.0 49.9 7.5 0.5
0.1 0.5
0.1
2.0 4,088
Kilifi South Constituency
13.4 35.4 40.4 8.0 0.2
0.6 0.6
0.1
1.3 24,035
Junju
5.9 27.6 54.7 10.2 0.1
0.2 0.6
0.0
0.5 3,935
Mwarakaya
3.2 8.8 77.0 9.0 0.4
0.4 1.2
-
0.1 2,522
Shimo La Tewa
22.7 53.6 15.1 5.4 0.2
0.9 0.2
0.1
1.7 9,763
Chasimba
1.6 11.1 74.6 10.3 0.2
0.2 1.9
0.1
0.1 2,850
Mtepeni
13.0 33.4 40.7 9.3 0.1
0.8 0.2
0.2
2.3 4,965
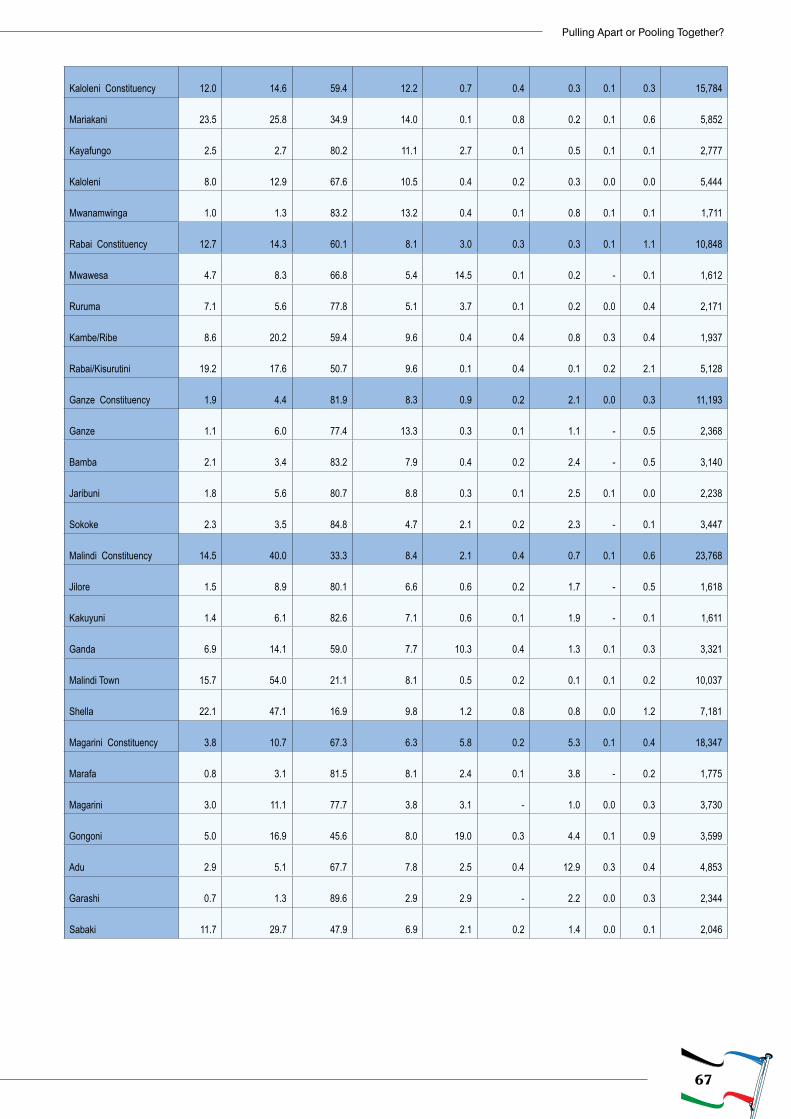
67
Pulling Apart or Pooling Together?
Kaloleni Constituency
12.0 14.6 59.4 12.2 0.7
0.4 0.3
0.1
0.3 15,784
Mariakani
23.5 25.8 34.9 14.0 0.1
0.8 0.2
0.1
0.6 5,852
Kayafungo
2.5 2.7 80.2 11.1 2.7
0.1 0.5
0.1
0.1 2,777
Kaloleni
8.0 12.9 67.6 10.5 0.4
0.2 0.3
0.0
0.0 5,444
Mwanamwinga
1.0 1.3 83.2 13.2 0.4
0.1 0.8
0.1
0.1 1,711
Rabai Constituency
12.7 14.3 60.1 8.1 3.0
0.3 0.3
0.1
1.1 10,848
Mwawesa
4.7 8.3 66.8 5.4 14.5
0.1 0.2
-
0.1 1,612
Ruruma
7.1 5.6 77.8 5.1 3.7
0.1 0.2
0.0
0.4 2,171
Kambe/Ribe
8.6 20.2 59.4 9.6 0.4
0.4 0.8
0.3
0.4 1,937
Rabai/Kisurutini
19.2 17.6 50.7 9.6 0.1
0.4 0.1
0.2
2.1 5,128
Ganze Constituency
1.9 4.4 81.9 8.3 0.9
0.2 2.1
0.0
0.3 11,193
Ganze
1.1 6.0 77.4 13.3 0.3
0.1 1.1
-
0.5 2,368
Bamba
2.1 3.4 83.2 7.9 0.4
0.2 2.4
-
0.5 3,140
Jaribuni
1.8 5.6 80.7 8.8 0.3
0.1 2.5
0.1
0.0 2,238
Sokoke
2.3 3.5 84.8 4.7 2.1
0.2 2.3
-
0.1 3,447
Malindi Constituency
14.5 40.0 33.3 8.4 2.1
0.4 0.7
0.1
0.6 23,768
Jilore
1.5 8.9 80.1 6.6 0.6
0.2 1.7
-
0.5 1,618
Kakuyuni
1.4 6.1 82.6 7.1 0.6
0.1 1.9
-
0.1 1,611
Ganda
6.9 14.1 59.0 7.7 10.3
0.4 1.3
0.1
0.3 3,321
Malindi Town
15.7 54.0 21.1 8.1 0.5
0.2 0.1
0.1
0.2 10,037
Shella
22.1 47.1 16.9 9.8 1.2
0.8 0.8
0.0
1.2 7,181
Magarini Constituency
3.8 10.7 67.3 6.3 5.8
0.2 5.3
0.1
0.4 18,347
Marafa
0.8 3.1 81.5 8.1 2.4
0.1 3.8
-
0.2 1,775
Magarini
3.0 11.1 77.7 3.8 3.1 - 1.0
0.0
0.3 3,730
Gongoni
5.0 16.9 45.6 8.0 19.0
0.3 4.4
0.1
0.9 3,599
Adu
2.9 5.1 67.7 7.8 2.5
0.4 12.9
0.3
0.4 4,853
Garashi
0.7 1.3 89.6 2.9 2.9 - 2.2
0.0
0.3 2,344
Sabaki
11.7 29.7 47.9 6.9 2.1
0.2 1.4
0.0
0.1 2,046
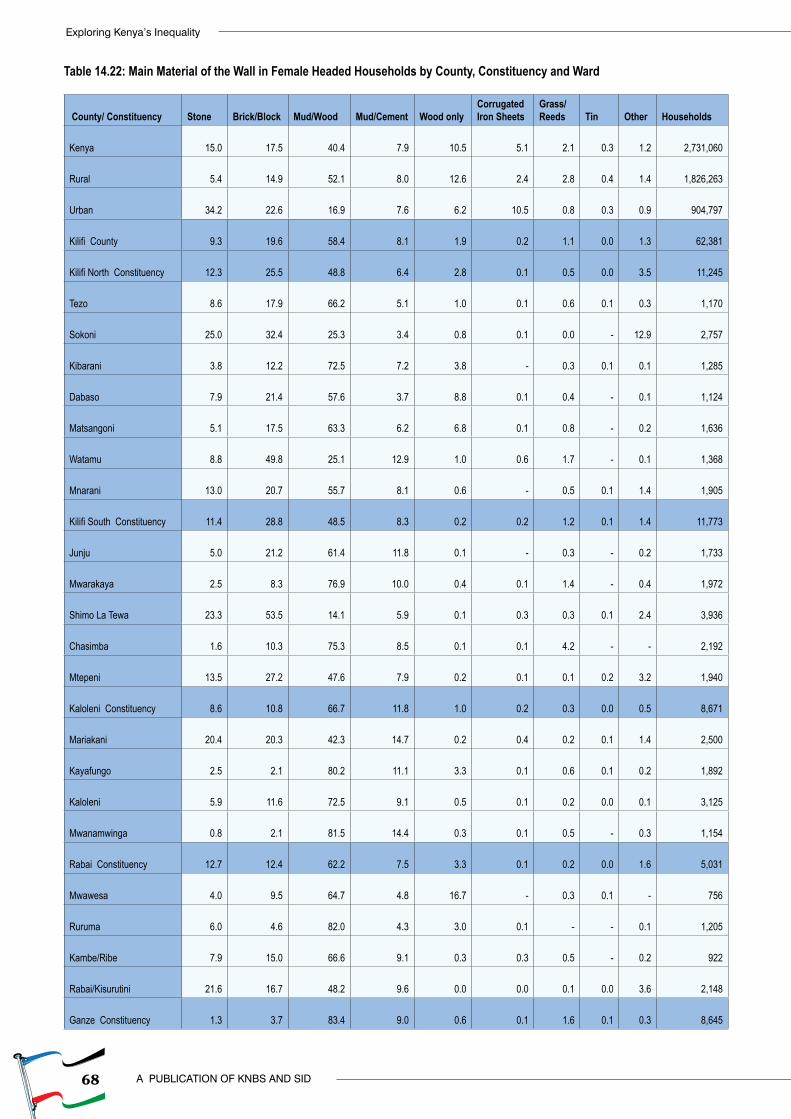
68
Exploring Kenya’s Inequality
A PUBLICATION OF KNBS AND SID
Table 14.22: Main Material of the Wall in Female Headed Households by County, Constituency and Ward
County/ Constituency Stone Brick/Block Mud/Wood Mud/Cement Wood onlyCorrugated Iron Sheets
Grass/Reeds Tin Other Households
Kenya
15.0 17.5 40.4 7.9 10.5 5.1
2.1
0.3
1.2 2,731,060
Rural
5.4 14.9 52.1 8.0 12.6 2.4
2.8
0.4
1.4 1,826,263
Urban
34.2 22.6 16.9 7.6 6.2 10.5
0.8
0.3
0.9 904,797
Kilifi County
9.3 19.6 58.4 8.1 1.9 0.2
1.1
0.0
1.3 62,381
Kilifi North Constituency
12.3 25.5 48.8 6.4 2.8 0.1
0.5
0.0
3.5 11,245
Tezo
8.6 17.9 66.2 5.1 1.0 0.1
0.6
0.1
0.3 1,170
Sokoni
25.0 32.4 25.3 3.4 0.8 0.1
0.0
-
12.9 2,757
Kibarani
3.8 12.2 72.5 7.2 3.8 -
0.3
0.1
0.1 1,285
Dabaso
7.9 21.4 57.6 3.7 8.8 0.1
0.4
-
0.1 1,124
Matsangoni
5.1 17.5 63.3 6.2 6.8 0.1
0.8
-
0.2 1,636
Watamu
8.8 49.8 25.1 12.9 1.0 0.6
1.7
-
0.1 1,368
Mnarani
13.0 20.7 55.7 8.1 0.6 -
0.5
0.1
1.4 1,905
Kilifi South Constituency
11.4 28.8 48.5 8.3 0.2 0.2
1.2
0.1
1.4 11,773
Junju
5.0 21.2 61.4 11.8 0.1 -
0.3
-
0.2 1,733
Mwarakaya
2.5 8.3 76.9 10.0 0.4 0.1
1.4
-
0.4 1,972
Shimo La Tewa
23.3 53.5 14.1 5.9 0.1 0.3
0.3
0.1
2.4 3,936
Chasimba
1.6 10.3 75.3 8.5 0.1 0.1
4.2
-
- 2,192
Mtepeni
13.5 27.2 47.6 7.9 0.2 0.1
0.1
0.2
3.2 1,940
Kaloleni Constituency
8.6 10.8 66.7 11.8 1.0 0.2
0.3
0.0
0.5 8,671
Mariakani
20.4 20.3 42.3 14.7 0.2 0.4
0.2
0.1
1.4 2,500
Kayafungo
2.5 2.1 80.2 11.1 3.3 0.1
0.6
0.1
0.2 1,892
Kaloleni
5.9 11.6 72.5 9.1 0.5 0.1
0.2
0.0
0.1 3,125
Mwanamwinga
0.8 2.1 81.5 14.4 0.3 0.1
0.5
-
0.3 1,154
Rabai Constituency
12.7 12.4 62.2 7.5 3.3 0.1
0.2
0.0
1.6 5,031
Mwawesa
4.0 9.5 64.7 4.8 16.7 -
0.3
0.1
- 756
Ruruma
6.0 4.6 82.0 4.3 3.0 0.1
-
-
0.1 1,205
Kambe/Ribe
7.9 15.0 66.6 9.1 0.3 0.3
0.5
-
0.2 922
Rabai/Kisurutini
21.6 16.7 48.2 9.6 0.0 0.0
0.1
0.0
3.6 2,148
Ganze Constituency
1.3 3.7 83.4 9.0 0.6 0.1
1.6
0.1
0.3 8,645
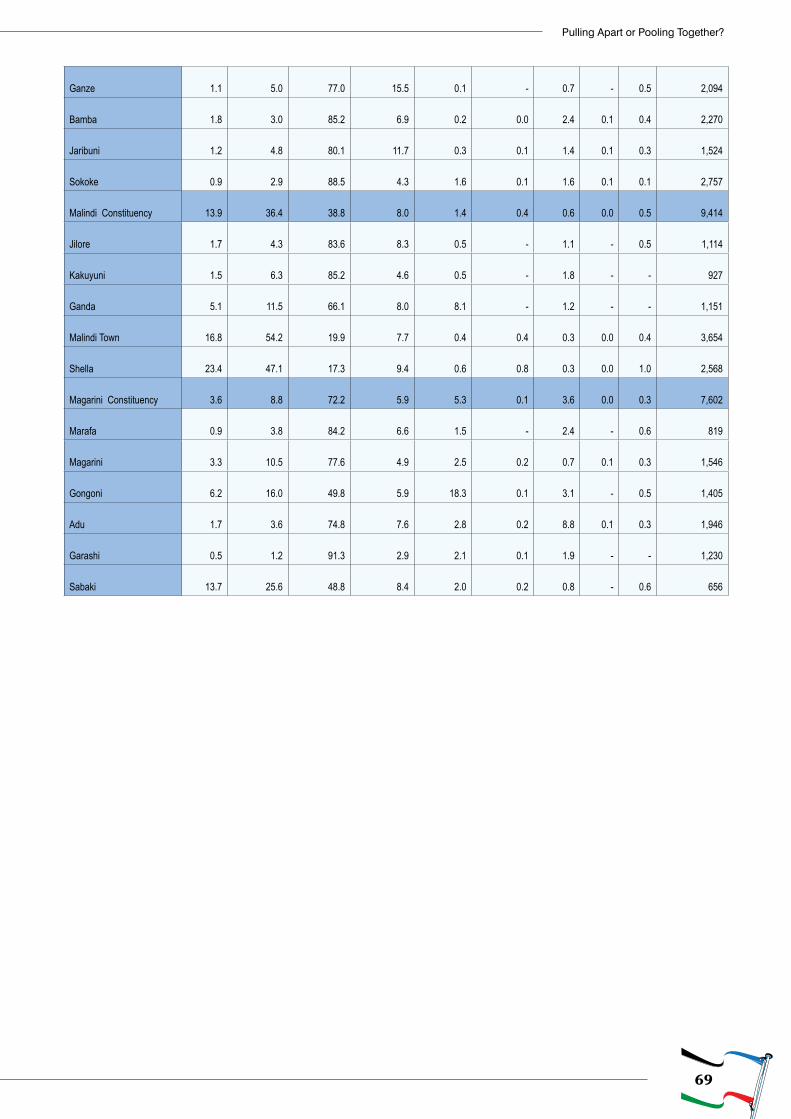
69
Pulling Apart or Pooling Together?
Ganze
1.1 5.0 77.0 15.5 0.1 -
0.7
-
0.5 2,094
Bamba
1.8 3.0 85.2 6.9 0.2 0.0
2.4
0.1
0.4 2,270
Jaribuni
1.2 4.8 80.1 11.7 0.3 0.1
1.4
0.1
0.3 1,524
Sokoke
0.9 2.9 88.5 4.3 1.6 0.1
1.6
0.1
0.1 2,757
Malindi Constituency
13.9 36.4 38.8 8.0 1.4 0.4
0.6
0.0
0.5 9,414
Jilore
1.7 4.3 83.6 8.3 0.5 -
1.1
-
0.5 1,114
Kakuyuni
1.5 6.3 85.2 4.6 0.5 -
1.8
-
- 927
Ganda
5.1 11.5 66.1 8.0 8.1 -
1.2
-
- 1,151
Malindi Town
16.8 54.2 19.9 7.7 0.4 0.4
0.3
0.0
0.4 3,654
Shella
23.4 47.1 17.3 9.4 0.6 0.8
0.3
0.0
1.0 2,568
Magarini Constituency
3.6 8.8 72.2 5.9 5.3 0.1
3.6
0.0
0.3 7,602
Marafa
0.9 3.8 84.2 6.6 1.5 -
2.4
-
0.6 819
Magarini
3.3 10.5 77.6 4.9 2.5 0.2
0.7
0.1
0.3 1,546
Gongoni
6.2 16.0 49.8 5.9 18.3 0.1
3.1
-
0.5 1,405
Adu
1.7 3.6 74.8 7.6 2.8 0.2
8.8
0.1
0.3 1,946
Garashi
0.5 1.2 91.3 2.9 2.1 0.1
1.9
-
- 1,230
Sabaki
13.7 25.6 48.8 8.4 2.0 0.2
0.8
-
0.6 656
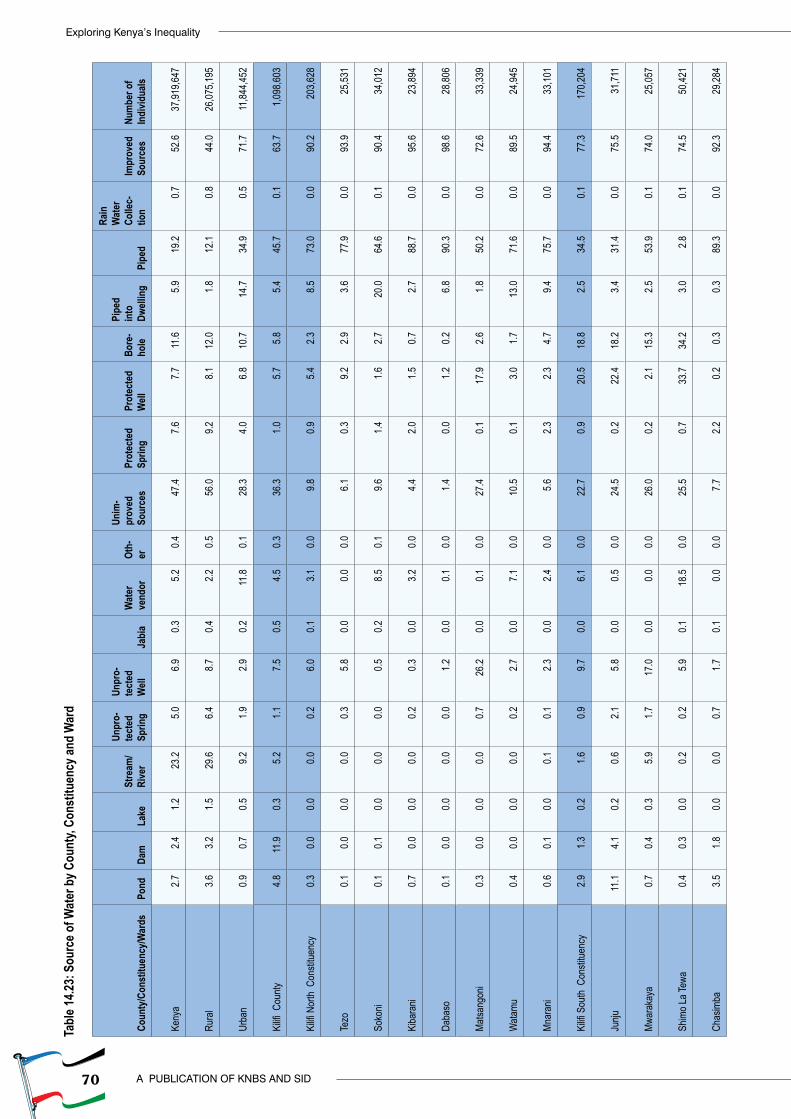
70
Exploring Kenya’s Inequality
A PUBLICATION OF KNBS AND SID
Tabl
e 14.2
3: S
ourc
e of W
ater
by C
ount
y, Co
nstit
uenc
y and
War
d
Coun
ty/C
onst
ituen
cy/W
ards
Pond
Dam
Lake
Stre
am/
Rive
r
Unpr
o-te
cted
Sp
ring
Unpr
o-te
cted
W
ellJa
bia
Wat
er
vend
orOt
h-er
Unim
-pr
oved
So
urce
sPr
otec
ted
Sprin
gPr
otec
ted
Well
Bore
-ho
le
Pipe
d in
to
Dwell
ing
Pipe
d
Rain
W
ater
Co
llec-
tion
Impr
oved
So
urce
sNu
mbe
r of
Indi
vidua
ls
Keny
a2.7
2.41.2
23.2
5.06.9
0.35.2
0.447
.47.6
7.711
.65.9
19.2
0.752
.6
37
,919,6
47
Rura
l3.6
3.21.5
29.6
6.48.7
0.42.2
0.556
.09.2
8.112
.01.8
12.1
0.844
.0
26
,075,1
95
Urba
n0.9
0.70.5
9.21.9
2.90.2
11.8
0.128
.34.0
6.810
.714
.734
.90.5
71.7
11,84
4,452
Kilifi
Cou
nty4.8
11.9
0.35.2
1.17.5
0.54.5
0.336
.31.0
5.75.8
5.445
.70.1
63.7
1,0
98,60
3
Kilifi
Nor
th C
onsti
tuenc
y0.3
0.00.0
0.00.2
6.00.1
3.10.0
9.80.9
5.42.3
8.573
.00.0
90.2
20
3,628
Tezo
0.10.0
0.00.0
0.35.8
0.00.0
0.06.1
0.39.2
2.93.6
77.9
0.093
.9
25
,531
Soko
ni0.1
0.10.0
0.00.0
0.50.2
8.50.1
9.61.4
1.62.7
20.0
64.6
0.190
.4
34
,012
Kiba
rani
0.70.0
0.00.0
0.20.3
0.03.2
0.04.4
2.01.5
0.72.7
88.7
0.095
.6
23
,894
Daba
so0.1
0.00.0
0.00.0
1.20.0
0.10.0
1.40.0
1.20.2
6.890
.30.0
98.6
28,80
6
Matsa
ngon
i0.3
0.00.0
0.00.7
26.2
0.00.1
0.027
.40.1
17.9
2.61.8
50.2
0.072
.6
33
,339
Wata
mu0.4
0.00.0
0.00.2
2.70.0
7.10.0
10.5
0.13.0
1.713
.071
.60.0
89.5
24,94
5
Mnar
ani
0.60.1
0.00.1
0.12.3
0.02.4
0.05.6
2.32.3
4.79.4
75.7
0.094
.4
33
,101
Kilifi
Sou
th C
onsti
tuenc
y2.9
1.30.2
1.60.9
9.70.0
6.10.0
22.7
0.920
.518
.82.5
34.5
0.177
.3
170,2
04
Junju
11.1
4.10.2
0.62.1
5.80.0
0.50.0
24.5
0.222
.418
.23.4
31.4
0.075
.5
31
,711
Mwar
akay
a0.7
0.40.3
5.91.7
17.0
0.00.0
0.026
.00.2
2.115
.32.5
53.9
0.174
.0
25
,057
Shim
o La T
ewa
0.40.3
0.00.2
0.25.9
0.118
.50.0
25.5
0.733
.734
.23.0
2.80.1
74.5
50,42
1
Chas
imba
3.51.8
0.00.0
0.71.7
0.10.0
0.07.7
2.20.2
0.30.3
89.3
0.092
.3
29
,284
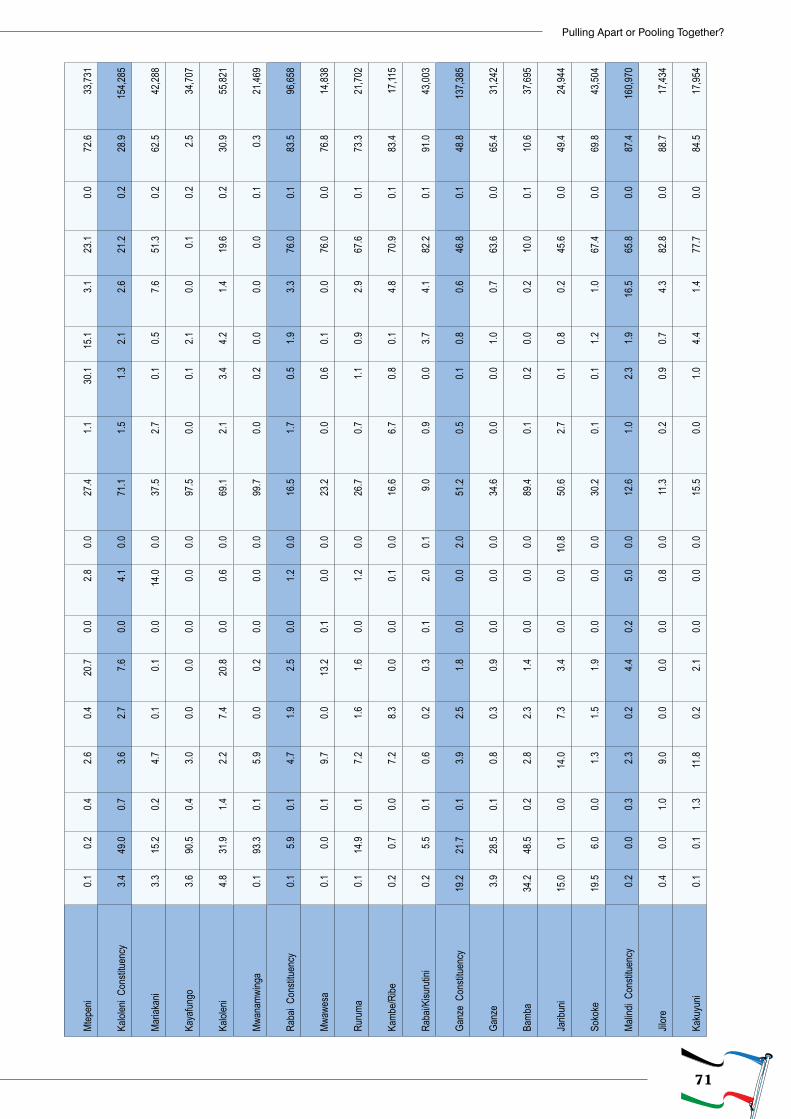
71
Pulling Apart or Pooling Together?
Mtep
eni
0.10.2
0.42.6
0.420
.70.0
2.80.0
27.4
1.130
.115
.13.1
23.1
0.072
.6
33
,731
Kalol
eni C
onsti
tuenc
y3.4
49.0
0.73.6
2.77.6
0.04.1
0.071
.11.5
1.32.1
2.621
.20.2
28.9
15
4,285
Maria
kani
3.315
.20.2
4.70.1
0.10.0
14.0
0.037
.52.7
0.10.5
7.651
.30.2
62.5
42,28
8
Kaya
fungo
3.690
.50.4
3.00.0
0.00.0
0.00.0
97.5
0.00.1
2.10.0
0.10.2
2.5
34
,707
Kalol
eni
4.831
.91.4
2.27.4
20.8
0.00.6
0.069
.12.1
3.44.2
1.419
.60.2
30.9
55,82
1
Mwan
amwi
nga
0.193
.30.1
5.90.0
0.20.0
0.00.0
99.7
0.00.2
0.00.0
0.00.1
0.3
21
,469
Raba
i Con
stitue
ncy
0.15.9
0.14.7
1.92.5
0.01.2
0.016
.51.7
0.51.9
3.376
.00.1
83.5
96,65
8
Mwaw
esa
0.10.0
0.19.7
0.013
.20.1
0.00.0
23.2
0.00.6
0.10.0
76.0
0.076
.8
14
,838
Ruru
ma0.1
14.9
0.17.2
1.61.6
0.01.2
0.026
.70.7
1.10.9
2.967
.60.1
73.3
21,70
2
Kamb
e/Ribe
0.20.7
0.07.2
8.30.0
0.00.1
0.016
.66.7
0.80.1
4.870
.90.1
83.4
17,11
5
Raba
i/Kisu
rutin
i0.2
5.50.1
0.60.2
0.30.1
2.00.1
9.00.9
0.03.7
4.182
.20.1
91.0
43,00
3
Ganz
e Co
nstitu
ency
19.2
21.7
0.13.9
2.51.8
0.00.0
2.051
.20.5
0.10.8
0.646
.80.1
48.8
13
7,385
Ganz
e3.9
28.5
0.10.8
0.30.9
0.00.0
0.034
.60.0
0.01.0
0.763
.60.0
65.4
31,24
2
Bamb
a34
.248
.50.2
2.82.3
1.40.0
0.00.0
89.4
0.10.2
0.00.2
10.0
0.110
.6
37
,695
Jarib
uni
15.0
0.10.0
14.0
7.33.4
0.00.0
10.8
50.6
2.70.1
0.80.2
45.6
0.049
.4
24
,944
Soko
ke19
.56.0
0.01.3
1.51.9
0.00.0
0.030
.20.1
0.11.2
1.067
.40.0
69.8
43,50
4
Malin
di C
onsti
tuenc
y0.2
0.00.3
2.30.2
4.40.2
5.00.0
12.6
1.02.3
1.916
.565
.80.0
87.4
16
0,970
Jilor
e0.4
0.01.0
9.00.0
0.00.0
0.80.0
11.3
0.20.9
0.74.3
82.8
0.088
.7
17
,434
Kaku
yuni
0.10.1
1.311
.80.2
2.10.0
0.00.0
15.5
0.01.0
4.41.4
77.7
0.084
.5
17
,954
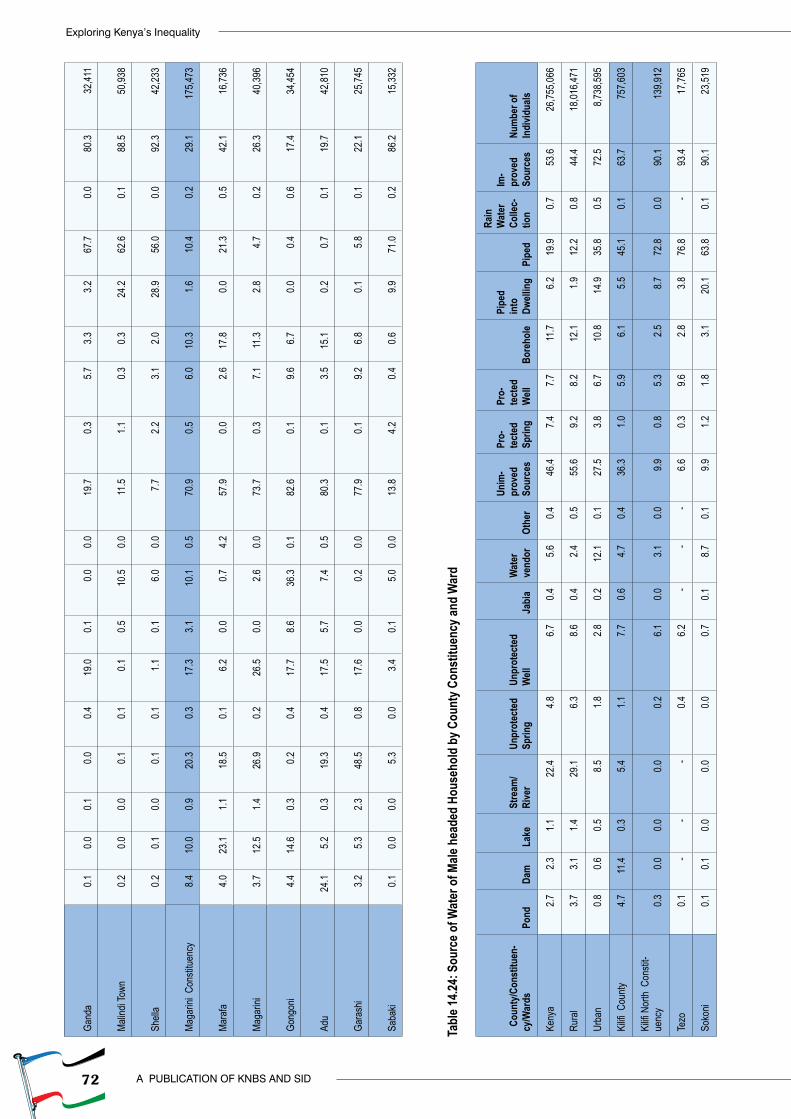
72
Exploring Kenya’s Inequality
A PUBLICATION OF KNBS AND SID
Gand
a0.1
0.00.1
0.00.4
19.0
0.10.0
0.019
.70.3
5.73.3
3.267
.70.0
80.3
32,41
1
Malin
di To
wn0.2
0.00.0
0.10.1
0.10.5
10.5
0.011
.51.1
0.30.3
24.2
62.6
0.188
.5
50
,938
Shell
a0.2
0.10.0
0.10.1
1.10.1
6.00.0
7.72.2
3.12.0
28.9
56.0
0.092
.3
42
,233
Maga
rini C
onsti
tuenc
y8.4
10.0
0.920
.30.3
17.3
3.110
.10.5
70.9
0.56.0
10.3
1.610
.40.2
29.1
17
5,473
Mara
fa4.0
23.1
1.118
.50.1
6.20.0
0.74.2
57.9
0.02.6
17.8
0.021
.30.5
42.1
16,73
6
Maga
rini
3.712
.51.4
26.9
0.226
.50.0
2.60.0
73.7
0.37.1
11.3
2.84.7
0.226
.3
40
,396
Gong
oni
4.414
.60.3
0.20.4
17.7
8.636
.30.1
82.6
0.19.6
6.70.0
0.40.6
17.4
34,45
4
Adu
24.1
5.20.3
19.3
0.417
.55.7
7.40.5
80.3
0.13.5
15.1
0.20.7
0.119
.7
42
,810
Gara
shi
3.25.3
2.348
.50.8
17.6
0.00.2
0.077
.90.1
9.26.8
0.15.8
0.122
.1
25
,745
Saba
ki0.1
0.00.0
5.30.0
3.40.1
5.00.0
13.8
4.20.4
0.69.9
71.0
0.286
.2
15
,332
Tabl
e 14.2
4: S
ourc
e of W
ater
of M
ale h
eade
d Ho
useh
old
by C
ount
y Con
stitu
ency
and
War
d
Cou
nty/C
onst
ituen
-cy
/War
dsPo
ndDa
mLa
keSt
ream
/Ri
ver
Unpr
otec
ted
Sprin
gUn
prot
ecte
d W
ellJa
bia
Wat
er
vend
orOt
her
Unim
-pr
oved
So
urce
s
Pro-
tect
ed
Sprin
g
Pro-
tect
ed
Well
Bore
hole
Pipe
d in
to
Dwell
ing
Pipe
d
Rain
W
ater
Co
llec-
tion
Im-
prov
ed
Sour
ces
Num
ber o
f In
divid
uals
Keny
a2.7
2.31.1
22.4
4.86.7
0.45.6
0.446
.47.4
7.711
.76.2
19.9
0.753
.626
,755,0
66
Rura
l3.7
3.11.4
29.1
6.38.6
0.42.4
0.555
.69.2
8.212
.11.9
12.2
0.844
.418
,016,4
71
Urba
n0.8
0.60.5
8.51.8
2.80.2
12.1
0.127
.53.8
6.710
.814
.935
.80.5
72.5
8,738
,595
Kilifi
Cou
nty4.7
11.4
0.35.4
1.17.7
0.64.7
0.436
.31.0
5.96.1
5.545
.10.1
63.7
757,6
03
Kilifi
Nor
th C
onsti
t-ue
ncy
0.30.0
0.00.0
0.26.1
0.03.1
0.09.9
0.85.3
2.58.7
72.8
0.090
.113
9,912
Tezo
0.1-
--
0.46.2
--
-6.6
0.39.6
2.83.8
76.8
-93
.417
,765
Soko
ni0.1
0.10.0
0.00.0
0.70.1
8.70.1
9.91.2
1.83.1
20.1
63.8
0.190
.123
,519
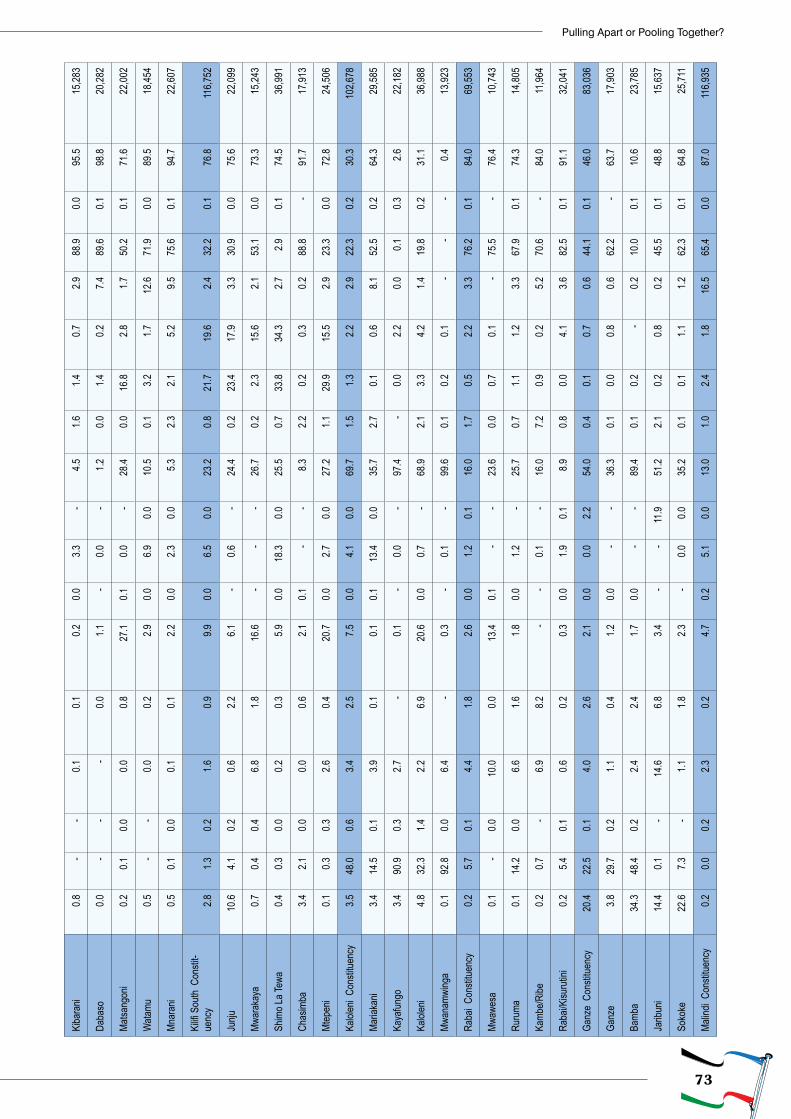
73
Pulling Apart or Pooling Together?
Kiba
rani
0.8-
-0.1
0.10.2
0.03.3
-4.5
1.61.4
0.72.9
88.9
0.095
.515
,283
Daba
so0.0
--
-0.0
1.1-
0.0-
1.20.0
1.40.2
7.489
.60.1
98.8
20,28
2
Matsa
ngon
i0.2
0.10.0
0.00.8
27.1
0.10.0
-28
.40.0
16.8
2.81.7
50.2
0.171
.622
,002
Wata
mu0.5
--
0.00.2
2.90.0
6.90.0
10.5
0.13.2
1.712
.671
.90.0
89.5
18,45
4
Mnar
ani
0.50.1
0.00.1
0.12.2
0.02.3
0.05.3
2.32.1
5.29.5
75.6
0.194
.722
,607
Kilifi
Sou
th C
onsti
t-ue
ncy
2.81.3
0.21.6
0.99.9
0.06.5
0.023
.20.8
21.7
19.6
2.432
.20.1
76.8
116,7
52
Junju
10.6
4.10.2
0.62.2
6.1-
0.6-
24.4
0.223
.417
.93.3
30.9
0.075
.622
,099
Mwar
akay
a0.7
0.40.4
6.81.8
16.6
--
-26
.70.2
2.315
.62.1
53.1
0.073
.315
,243
Shim
o La T
ewa
0.40.3
0.00.2
0.35.9
0.018
.30.0
25.5
0.733
.834
.32.7
2.90.1
74.5
36,99
1
Chas
imba
3.42.1
0.00.0
0.62.1
0.1-
-8.3
2.20.2
0.30.2
88.8
-91
.717
,913
Mtep
eni
0.10.3
0.32.6
0.420
.70.0
2.70.0
27.2
1.129
.915
.52.9
23.3
0.072
.824
,506
Kalol
eni C
onsti
tuenc
y3.5
48.0
0.63.4
2.57.5
0.04.1
0.069
.71.5
1.32.2
2.922
.30.2
30.3
102,6
78
Maria
kani
3.414
.50.1
3.90.1
0.10.1
13.4
0.035
.72.7
0.10.6
8.152
.50.2
64.3
29,58
5
Kaya
fungo
3.490
.90.3
2.7-
0.1-
0.0-
97.4
-0.0
2.20.0
0.10.3
2.622
,182
Kalol
eni
4.832
.31.4
2.26.9
20.6
0.00.7
-68
.92.1
3.34.2
1.419
.80.2
31.1
36,98
8
Mwan
amwi
nga
0.192
.80.0
6.4-
0.3-
0.1-
99.6
0.10.2
0.1-
--
0.413
,923
Raba
i Con
stitue
ncy
0.25.7
0.14.4
1.82.6
0.01.2
0.116
.01.7
0.52.2
3.376
.20.1
84.0
69,55
3
Mwaw
esa
0.1-
0.010
.00.0
13.4
0.1-
-23
.60.0
0.70.1
-75
.5-
76.4
10,74
3
Ruru
ma0.1
14.2
0.06.6
1.61.8
0.01.2
-25
.70.7
1.11.2
3.367
.90.1
74.3
14,80
5
Kamb
e/Ribe
0.20.7
-6.9
8.2-
-0.1
-16
.07.2
0.90.2
5.270
.6-
84.0
11,96
4
Raba
i/Kisu
rutin
i0.2
5.40.1
0.60.2
0.30.0
1.90.1
8.90.8
0.04.1
3.682
.50.1
91.1
32,04
1
Ganz
e Co
nstitu
ency
20.4
22.5
0.14.0
2.62.1
0.00.0
2.254
.00.4
0.10.7
0.644
.10.1
46.0
83,03
6
Ganz
e3.8
29.7
0.21.1
0.41.2
0.0-
-36
.30.1
0.00.8
0.662
.2-
63.7
17,90
3
Bamb
a34
.348
.40.2
2.42.4
1.70.0
--
89.4
0.10.2
-0.2
10.0
0.110
.623
,785
Jarib
uni
14.4
0.1-
14.6
6.83.4
--
11.9
51.2
2.10.2
0.80.2
45.5
0.148
.815
,637
Soko
ke22
.67.3
-1.1
1.82.3
-0.0
0.035
.20.1
0.11.1
1.262
.30.1
64.8
25,71
1
Malin
di C
onsti
tuenc
y0.2
0.00.2
2.30.2
4.70.2
5.10.0
13.0
1.02.4
1.816
.565
.40.0
87.0
116,9
35
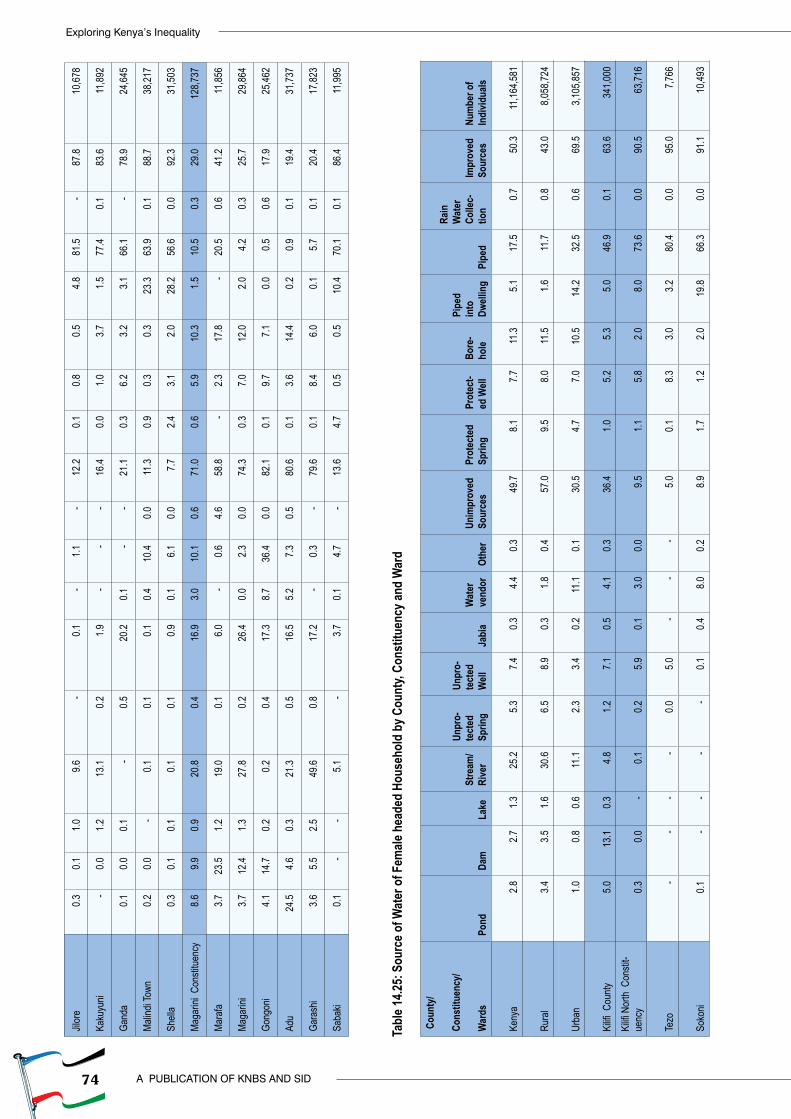
74
Exploring Kenya’s Inequality
A PUBLICATION OF KNBS AND SID
Jilor
e0.3
0.11.0
9.6-
0.1-
1.1-
12.2
0.10.8
0.54.8
81.5
-87
.810
,678
Kaku
yuni
-0.0
1.213
.10.2
1.9-
--
16.4
0.01.0
3.71.5
77.4
0.183
.611
,892
Gand
a0.1
0.00.1
-0.5
20.2
0.1-
-21
.10.3
6.23.2
3.166
.1-
78.9
24,64
5
Malin
di To
wn0.2
0.0-
0.10.1
0.10.4
10.4
0.011
.30.9
0.30.3
23.3
63.9
0.188
.738
,217
Shell
a0.3
0.10.1
0.10.1
0.90.1
6.10.0
7.72.4
3.12.0
28.2
56.6
0.092
.331
,503
Maga
rini C
onsti
tuenc
y8.6
9.90.9
20.8
0.416
.93.0
10.1
0.671
.00.6
5.910
.31.5
10.5
0.329
.012
8,737
Mara
fa3.7
23.5
1.219
.00.1
6.0-
0.64.6
58.8
-2.3
17.8
-20
.50.6
41.2
11,85
6
Maga
rini
3.712
.41.3
27.8
0.226
.40.0
2.30.0
74.3
0.37.0
12.0
2.04.2
0.325
.729
,864
Gong
oni
4.114
.70.2
0.20.4
17.3
8.736
.40.0
82.1
0.19.7
7.10.0
0.50.6
17.9
25,46
2
Adu
24.5
4.60.3
21.3
0.516
.55.2
7.30.5
80.6
0.13.6
14.4
0.20.9
0.119
.431
,737
Gara
shi
3.65.5
2.549
.60.8
17.2
-0.3
-79
.60.1
8.46.0
0.15.7
0.120
.417
,823
Saba
ki0.1
--
5.1-
3.70.1
4.7-
13.6
4.70.5
0.510
.470
.10.1
86.4
11,99
5
Tabl
e 14.2
5: S
ourc
e of W
ater
of F
emale
hea
ded
Hous
ehol
d by
Cou
nty,
Cons
titue
ncy a
nd W
ard
Cou
nty/
Cons
titue
ncy/
War
dsPo
ndDa
mLa
keSt
ream
/Ri
ver
Unpr
o-te
cted
Sp
ring
Unpr
o-te
cted
W
ellJa
bia
Wat
er
vend
orOt
her
Unim
prov
ed
Sour
ces
Prot
ecte
d Sp
ring
Prot
ect-
ed W
ellBo
re-
hole
Pipe
d in
to
Dwell
ing
Pipe
d
Rain
W
ater
Co
llec-
tion
Impr
oved
So
urce
sNu
mbe
r of
Indi
vidua
ls
Keny
a
2.8
2.7
1.3
25.2
5.3
7.4
0.3
4.4
0.3
49
.7
8.1
7.7
11.3
5.1
17.5
0.7
50.3
1
1,164
,581
Rura
l
3.4
3.5
1.6
30.6
6.5
8.9
0.3
1.8
0.4
57
.0
9.5
8.0
11.5
1.6
11.7
0.8
43.0
8
,058,7
24
Urba
n
1.0
0.8
0.6
11.1
2.3
3.4
0.2
11.1
0.1
30
.5
4.7
7.0
10.5
14.2
32.5
0.6
69.5
3
,105,8
57
Kilifi
Cou
nty
5.0
13
.1
0.3
4.8
1.2
7.1
0.5
4.1
0.3
36.4
1.0
5.2
5.3
5.0
46.9
0.1
63.6
341,0
00
Kilifi
Nor
th C
onsti
t-ue
ncy
0.
3
0.0
-
0.1
0.2
5.9
0.1
3.0
0.0
9.5
1.1
5.8
2.0
8.0
73.6
0.0
90.5
63,71
6
Tezo
-
-
-
-
0.0
5.0
-
-
-
5.0
0.1
8.3
3.0
3.2
80
.4
0.0
95
.0
7,766
Soko
ni
0.1
-
-
-
-
0.1
0.4
8.0
0.2
8.9
1.7
1.2
2.0
19.8
66
.3
0.0
91
.1
10
,493
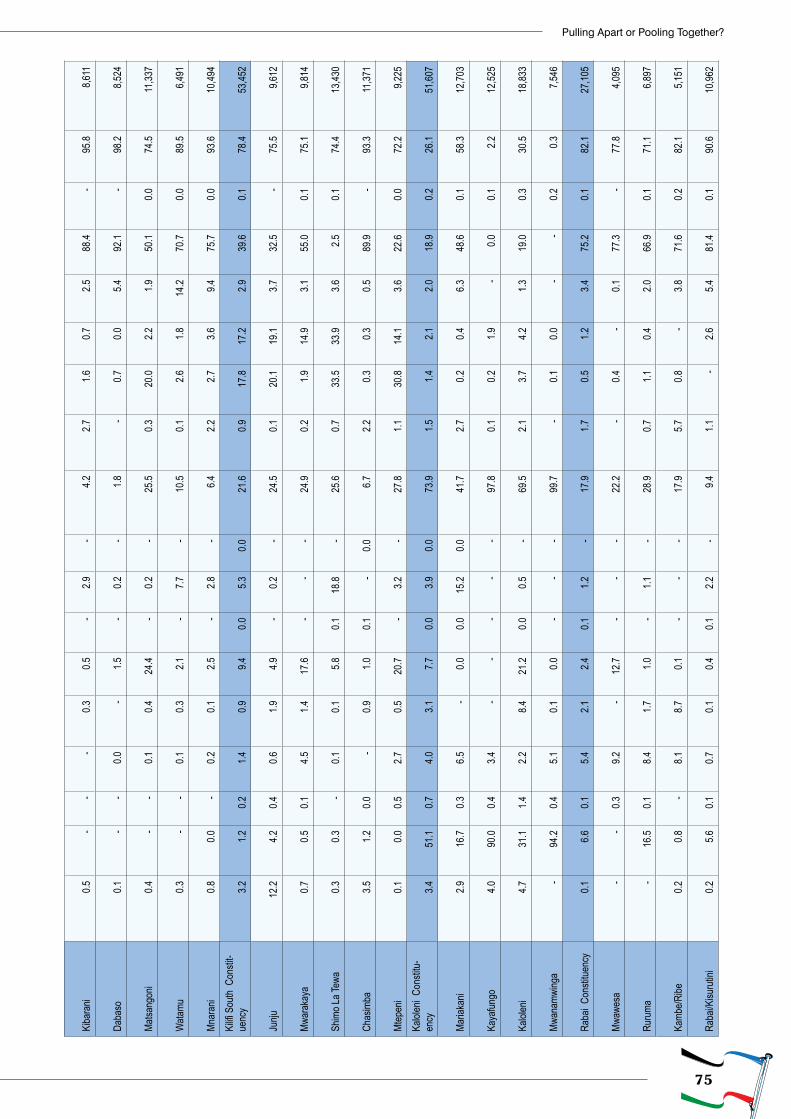
75
Pulling Apart or Pooling Together?
Kiba
rani
0.
5
-
-
-
0.3
0.5
-
2.9
-
4.2
2.7
1.6
0.7
2.5
88
.4
-
95
.8
8,611
Daba
so
0.1
-
-
0.0
-
1.5
-
0.2
-
1.8
-
0.7
0.0
5.4
92.1
-
98.2
8,5
24
Matsa
ngon
i
0.4
-
-
0.1
0.4
24
.4
-
0.2
-
25.5
0.3
20
.0
2.2
1.9
50.1
0.0
74.5
11,33
7
Wata
mu
0.3
-
-
0.1
0.3
2.1
-
7.7
-
10
.5
0.1
2.6
1.8
14.2
70
.7
0.0
89
.5
6,491
Mnar
ani
0.
8
0.0
-
0.2
0.1
2.5
-
2.8
-
6.4
2.2
2.7
3.6
9.4
75.7
0.0
93.6
10,49
4 Ki
lifi S
outh
Con
stit-
uenc
y
3.2
1.2
0.2
1.4
0.9
9.4
0.0
5.3
0.0
21
.6
0.9
17.8
17.2
2.9
39.6
0.1
78.4
53,45
2
Junju
12.2
4.2
0.4
0.6
1.9
4.9
-
0.2
-
24.5
0.1
20
.1
19
.1
3.7
32
.5
-
75
.5
9,612
Mwar
akay
a
0.7
0.5
0.1
4.5
1.4
17
.6
-
-
-
24.9
0.2
1.9
14
.9
3.1
55
.0
0.1
75
.1
9,814
Shim
o La T
ewa
0.
3
0.3
-
0.1
0.1
5.8
0.1
18.8
-
25
.6
0.7
33.5
33.9
3.6
2.5
0.1
74.4
13,43
0
Chas
imba
3.
5
1.2
0.0
-
0.9
1.0
0.1
-
0.0
6.7
2.2
0.3
0.3
0.5
89
.9
-
93
.3
11
,371
Mtep
eni
0.
1
0.0
0.5
2.7
0.5
20.7
-
3.2
-
27
.8
1.1
30.8
14.1
3.6
22.6
0.0
72.2
9,2
25
Kalol
eni C
onsti
tu-en
cy
3.4
51
.1
0.7
4.0
3.1
7.7
0.0
3.9
0.0
73.9
1.5
1.4
2.1
2.0
18.9
0.2
26.1
51,60
7
Maria
kani
2.
9
16.7
0.3
6.5
-
0.0
0.0
15
.2
0.0
41.7
2.7
0.2
0.4
6.3
48.6
0.1
58.3
12,70
3
Kaya
fungo
4.
0
90.0
0.4
3.4
-
-
-
-
-
97.8
0.1
0.2
1.9
-
0.0
0.1
2.2
12
,525
Kalol
eni
4.
7
31.1
1.4
2.2
8.4
21
.2
0.0
0.5
-
69.5
2.1
3.7
4.2
1.3
19.0
0.3
30.5
18,83
3
Mwan
amwi
nga
-
94.2
0.4
5.1
0.1
0.0
-
-
-
99
.7
-
0.1
0.0
-
-
0.2
0.3
7,546
Raba
i Con
stitue
ncy
0.
1
6.6
0.1
5.4
2.1
2.4
0.1
1.2
-
17.9
1.7
0.5
1.2
3.4
75.2
0.1
82.1
27,10
5
Mwaw
esa
-
-
0.3
9.2
-
12.7
-
-
-
22
.2
-
0.4
-
0.1
77.3
-
77.8
4,0
95
Ruru
ma
-
16
.5
0.1
8.4
1.7
1.0
-
1.1
-
28.9
0.7
1.1
0.4
2.0
66.9
0.1
71.1
6,8
97
Kamb
e/Ribe
0.
2
0.8
-
8.1
8.7
0.1
-
-
-
17
.9
5.7
0.8
-
3.8
71
.6
0.2
82
.1
5,151
Raba
i/Kisu
rutin
i
0.2
5.6
0.1
0.7
0.1
0.4
0.1
2.2
-
9.4
1.1
-
2.6
5.4
81.4
0.1
90.6
10,96
2
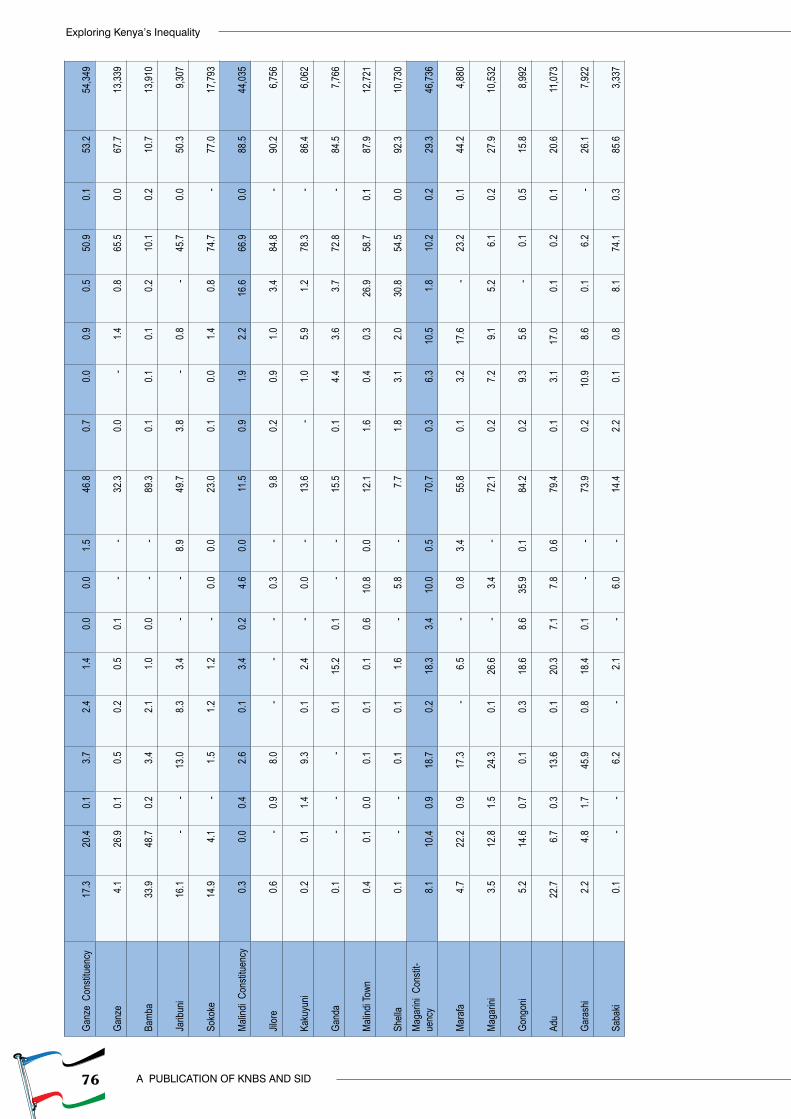
76
Exploring Kenya’s Inequality
A PUBLICATION OF KNBS AND SID
Ganz
e Co
nstitu
ency
17.3
20.4
0.1
3.7
2.4
1.4
0.0
0.0
1.5
46
.8
0.7
0.0
0.9
0.5
50
.9
0.1
53
.2
54
,349
Ganz
e
4.1
26
.9
0.1
0.5
0.2
0.5
0.1
-
-
32.3
0.0
-
1.4
0.8
65.5
0.0
67.7
13,33
9
Bamb
a
3
3.9
48
.7
0.2
3.4
2.1
1.0
0.0
-
-
89.3
0.1
0.1
0.1
0.2
10.1
0.2
10.7
13,91
0
Jarib
uni
16.1
-
-
13.0
8.3
3.4
-
-
8.9
49
.7
3.8
-
0.8
-
45
.7
0.0
50
.3
9,307
Soko
ke
1
4.9
4.1
-
1.5
1.2
1.2
-
0.0
0.0
23.0
0.1
0.0
1.4
0.8
74.7
-
77.0
17,79
3
Malin
di C
onsti
tuenc
y
0.3
0.0
0.4
2.6
0.1
3.4
0.2
4.6
0.0
11
.5
0.9
1.9
2.2
16.6
66
.9
0.0
88
.5
44
,035
Jilor
e
0.6
-
0.9
8.0
-
-
-
0.3
-
9.8
0.2
0.9
1.0
3.4
84.8
-
90.2
6,7
56
Kaku
yuni
0.
2
0.1
1.4
9.3
0.1
2.4
-
0.0
-
13.6
-
1.0
5.9
1.2
78
.3
-
86
.4
6,062
Gand
a
0.1
-
-
-
0.1
15
.2
0.1
-
-
15.5
0.1
4.4
3.6
3.7
72.8
-
84.5
7,7
66
Malin
di To
wn
0.4
0.1
0.0
0.1
0.1
0.1
0.6
10.8
0.0
12
.1
1.6
0.4
0.3
26.9
58
.7
0.1
87
.9
12
,721
Shell
a
0.1
-
-
0.1
0.1
1.6
-
5.8
-
7.7
1.8
3.1
2.0
30
.8
54.5
0.0
92.3
10,73
0 Ma
garin
i Con
stit-
uenc
y
8.1
10
.4
0.9
18.7
0.2
18
.3
3.4
10
.0
0.5
70.7
0.3
6.3
10
.5
1.8
10
.2
0.2
29
.3
46
,736
Mara
fa
4.7
22
.2
0.9
17.3
-
6.5
-
0.8
3.4
55.8
0.1
3.2
17
.6
-
23
.2
0.1
44
.2
4,880
Maga
rini
3.
5
12.8
1.5
24
.3
0.1
26.6
-
3.4
-
72
.1
0.2
7.2
9.1
5.2
6.1
0.2
27
.9
10
,532
Gong
oni
5.
2
14.6
0.7
0.1
0.3
18
.6
8.6
35
.9
0.1
84.2
0.2
9.3
5.6
-
0.1
0.5
15.8
8,9
92
Adu
22.7
6.7
0.3
13.6
0.1
20
.3
7.1
7.8
0.6
79.4
0.1
3.1
17
.0
0.1
0.2
0.1
20
.6
11
,073
Gara
shi
2.
2
4.8
1.7
45.9
0.8
18
.4
0.1
-
-
73.9
0.2
10
.9
8.6
0.1
6.2
-
26.1
7,9
22
Saba
ki
0.1
-
-
6.2
-
2.1
-
6.0
-
14.4
2.2
0.1
0.8
8.1
74.1
0.3
85.6
3,3
37
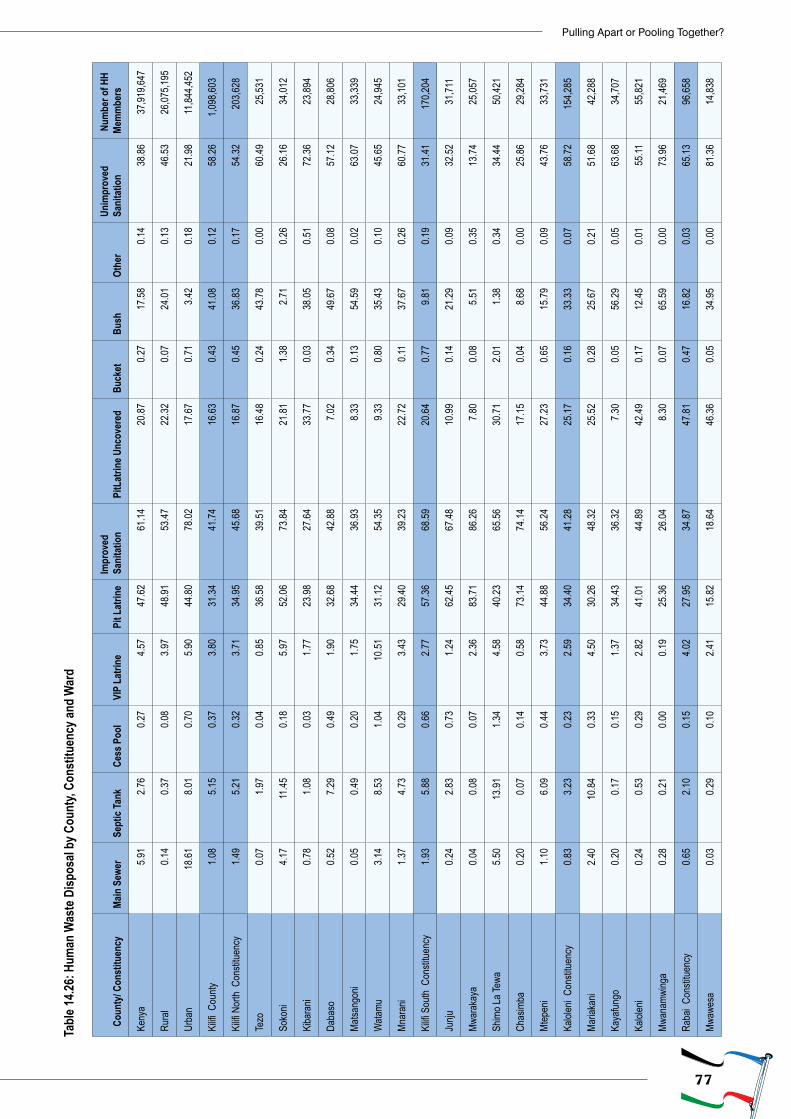
77
Pulling Apart or Pooling Together?
Tabl
e 14.2
6: H
uman
Was
te D
ispos
al by
Cou
nty,
Cons
titue
ncy a
nd W
ard
Cou
nty/
Cons
titue
ncy
Main
Sew
erSe
ptic
Tank
Cess
Poo
lVI
P La
trine
Pit L
atrin
eIm
prov
ed
Sani
tatio
nPi
tLat
rine U
ncov
ered
Buck
etBu
shOt
her
Unim
prov
ed
Sani
tatio
n N
umbe
r of H
H Me
mm
bers
Keny
a5.9
12.7
60.2
74.5
747
.6261
.1420
.870.2
717
.580.1
438
.86
37
,919,6
47
Rura
l0.1
40.3
70.0
83.9
748
.9153
.4722
.320.0
724
.010.1
346
.53
26
,075,1
95
Urba
n18
.618.0
10.7
05.9
044
.8078
.0217
.670.7
13.4
20.1
821
.98
11
,844,4
52
Kilifi
Cou
nty1.0
85.1
50.3
73.8
031
.3441
.7416
.630.4
341
.080.1
258
.26
1,09
8,603
Kilifi
Nor
th C
onsti
tuenc
y1.4
95.2
10.3
23.7
134
.9545
.6816
.870.4
536
.830.1
754
.32
2
03,62
8
Tezo
0.07
1.97
0.04
0.85
36.58
39.51
16.48
0.24
43.78
0.00
60.49
25
,531
Soko
ni4.1
711
.450.1
85.9
752
.0673
.8421
.811.3
82.7
10.2
626
.16
34,01
2
Kiba
rani
0.78
1.08
0.03
1.77
23.98
27.64
33.77
0.03
38.05
0.51
72.36
23
,894
Daba
so0.5
27.2
90.4
91.9
032
.6842
.887.0
20.3
449
.670.0
857
.12
28,80
6
Matsa
ngon
i0.0
50.4
90.2
01.7
534
.4436
.938.3
30.1
354
.590.0
263
.07
33,33
9
Wata
mu3.1
48.5
31.0
410
.5131
.1254
.359.3
30.8
035
.430.1
045
.65
24,94
5
Mnar
ani
1.37
4.73
0.29
3.43
29.40
39.23
22.72
0.11
37.67
0.26
60.77
33
,101
Kilifi
Sou
th C
onsti
tuenc
y1.9
35.8
80.6
62.7
757
.3668
.5920
.640.7
79.8
10.1
931
.41
1
70,20
4
Junju
0.24
2.83
0.73
1.24
62.45
67.48
10.99
0.14
21.29
0.09
32.52
31
,711
Mwar
akay
a0.0
40.0
80.0
72.3
683
.7186
.267.8
00.0
85.5
10.3
513
.74
25,05
7
Shim
o La T
ewa
5.50
13.91
1.34
4.58
40.23
65.56
30.71
2.01
1.38
0.34
34.44
50
,421
Chas
imba
0.20
0.07
0.14
0.58
73.14
74.14
17.15
0.04
8.68
0.00
25.86
29
,284
Mtep
eni
1.10
6.09
0.44
3.73
44.88
56.24
27.23
0.65
15.79
0.09
43.76
33
,731
Kalol
eni C
onsti
tuenc
y0.8
33.2
30.2
32.5
934
.4041
.2825
.170.1
633
.330.0
758
.72
1
54,28
5
Maria
kani
2.40
10.84
0.33
4.50
30.26
48.32
25.52
0.28
25.67
0.21
51.68
42
,288
Kaya
fungo
0.20
0.17
0.15
1.37
34.43
36.32
7.30
0.05
56.29
0.05
63.68
34
,707
Kalol
eni
0.24
0.53
0.29
2.82
41.01
44.89
42.49
0.17
12.45
0.01
55.11
55
,821
Mwan
amwi
nga
0.28
0.21
0.00
0.19
25.36
26.04
8.30
0.07
65.59
0.00
73.96
21
,469
Raba
i Con
stitue
ncy
0.65
2.10
0.15
4.02
27.95
34.87
47.81
0.47
16.82
0.03
65.13
96
,658
Mwaw
esa
0.03
0.29
0.10
2.41
15.82
18.64
46.36
0.05
34.95
0.00
81.36
14
,838
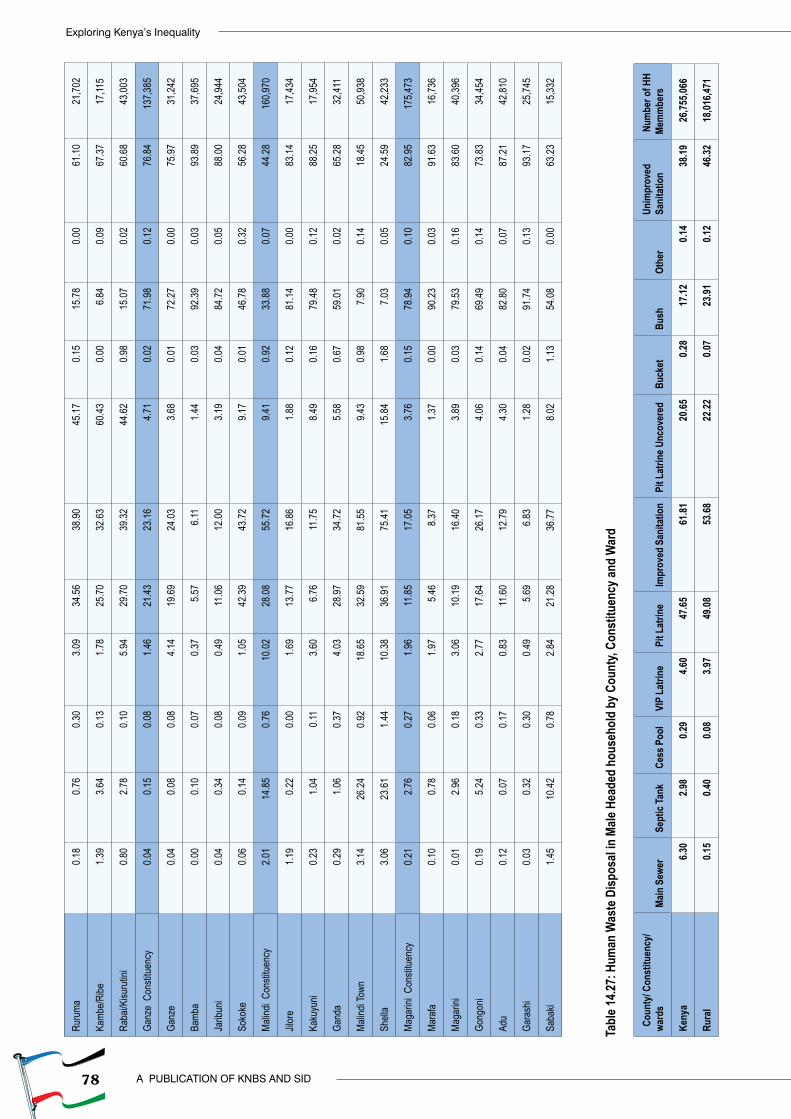
78
Exploring Kenya’s Inequality
A PUBLICATION OF KNBS AND SID
Ruru
ma0.1
80.7
60.3
03.0
934
.5638
.9045
.170.1
515
.780.0
061
.10
21,70
2
Kamb
e/Ribe
1.39
3.64
0.13
1.78
25.70
32.63
60.43
0.00
6.84
0.09
67.37
17
,115
Raba
i/Kisu
rutin
i0.8
02.7
80.1
05.9
429
.7039
.3244
.620.9
815
.070.0
260
.68
43,00
3
Ganz
e Co
nstitu
ency
0.04
0.15
0.08
1.46
21.43
23.16
4.71
0.02
71.98
0.12
76.84
137
,385
Ganz
e0.0
40.0
80.0
84.1
419
.6924
.033.6
80.0
172
.270.0
075
.97
31,24
2
Bamb
a0.0
00.1
00.0
70.3
75.5
76.1
11.4
40.0
392
.390.0
393
.89
37,69
5
Jarib
uni
0.04
0.34
0.08
0.49
11.06
12.00
3.19
0.04
84.72
0.05
88.00
24
,944
Soko
ke0.0
60.1
40.0
91.0
542
.3943
.729.1
70.0
146
.780.3
256
.28
43,50
4
Malin
di C
onsti
tuenc
y2.0
114
.850.7
610
.0228
.0855
.729.4
10.9
233
.880.0
744
.28
1
60,97
0
Jilor
e1.1
90.2
20.0
01.6
913
.7716
.861.8
80.1
281
.140.0
083
.14
17,43
4
Kaku
yuni
0.23
1.04
0.11
3.60
6.76
11.75
8.49
0.16
79.48
0.12
88.25
17
,954
Gand
a0.2
91.0
60.3
74.0
328
.9734
.725.5
80.6
759
.010.0
265
.28
32,41
1
Malin
di To
wn3.1
426
.240.9
218
.6532
.5981
.559.4
30.9
87.9
00.1
418
.45
50,93
8
Shell
a3.0
623
.611.4
410
.3836
.9175
.4115
.841.6
87.0
30.0
524
.59
42,23
3
Maga
rini C
onsti
tuenc
y0.2
12.7
60.2
71.9
611
.8517
.053.7
60.1
578
.940.1
082
.95
1
75,47
3
Mara
fa0.1
00.7
80.0
61.9
75.4
68.3
71.3
70.0
090
.230.0
391
.63
16,73
6
Maga
rini
0.01
2.96
0.18
3.06
10.19
16.40
3.89
0.03
79.53
0.16
83.60
40
,396
Gong
oni
0.19
5.24
0.33
2.77
17.64
26.17
4.06
0.14
69.49
0.14
73.83
34
,454
Adu
0.12
0.07
0.17
0.83
11.60
12.79
4.30
0.04
82.80
0.07
87.21
42
,810
Gara
shi
0.03
0.32
0.30
0.49
5.69
6.83
1.28
0.02
91.74
0.13
93.17
25
,745
Saba
ki1.4
510
.420.7
82.8
421
.2836
.778.0
21.1
354
.080.0
063
.23
15,33
2
Tabl
e 14.2
7: H
uman
Was
te D
ispos
al in
Male
Hea
ded
hous
ehol
d by
Cou
nty,
Cons
titue
ncy a
nd W
ard
Cou
nty/
Cons
titue
ncy/
ward
sMa
in S
ewer
Sept
ic Ta
nkCe
ss P
ool
VIP
Latri
nePi
t Lat
rine
Impr
oved
San
itatio
nPi
t Lat
rine U
ncov
ered
Buck
etBu
shOt
her
Unim
prov
ed
Sani
tatio
n N
umbe
r of H
H Me
mm
bers
Keny
a6.3
02.9
80.2
94.6
047
.6561
.8120
.650.2
817
.120.1
438
.19
26,75
5,066
Rura
l0.1
50.4
00.0
83.9
749
.0853
.6822
.220.0
723
.910.1
246
.32
18,01
6,471
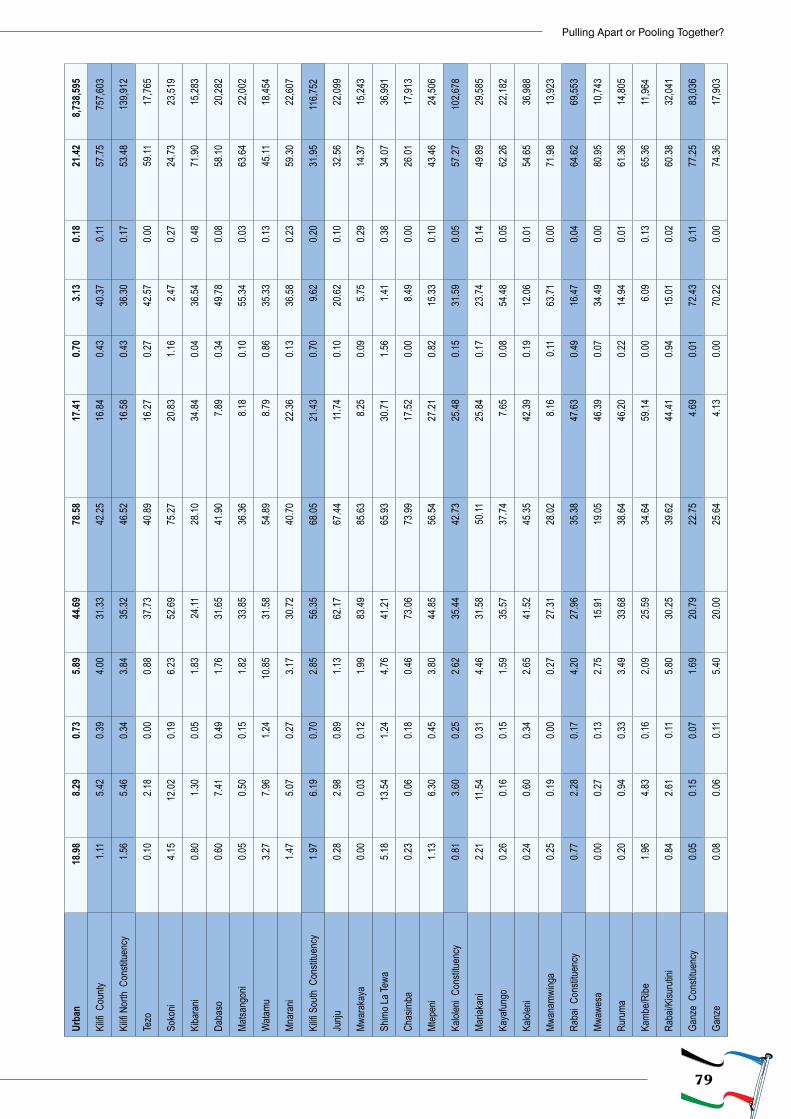
79
Pulling Apart or Pooling Together?
Urba
n18
.988.2
90.7
35.8
944
.6978
.5817
.410.7
03.1
30.1
821
.42
8,73
8,595
Kilifi
Cou
nty1.1
15.4
20.3
94.0
031
.3342
.2516
.840.4
340
.370.1
157
.75
7
57,60
3
Kilifi
Nor
th C
onsti
tuenc
y1.5
65.4
60.3
43.8
435
.3246
.5216
.580.4
336
.300.1
753
.48
1
39,91
2
Tezo
0.10
2.18
0.00
0.88
37.73
40.89
16.27
0.27
42.57
0.00
59.11
17
,765
Soko
ni4.1
512
.020.1
96.2
352
.6975
.2720
.831.1
62.4
70.2
724
.73
23,51
9
Kiba
rani
0.80
1.30
0.05
1.83
24.11
28.10
34.84
0.04
36.54
0.48
71.90
15
,283
Daba
so0.6
07.4
10.4
91.7
631
.6541
.907.8
90.3
449
.780.0
858
.10
20,28
2
Matsa
ngon
i0.0
50.5
00.1
51.8
233
.8536
.368.1
80.1
055
.340.0
363
.64
22,00
2
Wata
mu3.2
77.9
61.2
410
.8531
.5854
.898.7
90.8
635
.330.1
345
.11
18,45
4
Mnar
ani
1.47
5.07
0.27
3.17
30.72
40.70
22.36
0.13
36.58
0.23
59.30
22
,607
Kilifi
Sou
th C
onsti
tuenc
y1.9
76.1
90.7
02.8
556
.3568
.0521
.430.7
09.6
20.2
031
.95
1
16,75
2
Junju
0.28
2.98
0.89
1.13
62.17
67.44
11.74
0.10
20.62
0.10
32.56
22
,099
Mwar
akay
a0.0
00.0
30.1
21.9
983
.4985
.638.2
50.0
95.7
50.2
914
.37
15,24
3
Shim
o La T
ewa
5.18
13.54
1.24
4.76
41.21
65.93
30.71
1.56
1.41
0.38
34.07
36
,991
Chas
imba
0.23
0.06
0.18
0.46
73.06
73.99
17.52
0.00
8.49
0.00
26.01
17
,913
Mtep
eni
1.13
6.30
0.45
3.80
44.85
56.54
27.21
0.82
15.33
0.10
43.46
24
,506
Kalol
eni C
onsti
tuenc
y0.8
13.6
00.2
52.6
235
.4442
.7325
.480.1
531
.590.0
557
.27
1
02,67
8
Maria
kani
2.21
11.54
0.31
4.46
31.58
50.11
25.84
0.17
23.74
0.14
49.89
29
,585
Kaya
fungo
0.26
0.16
0.15
1.59
35.57
37.74
7.65
0.08
54.48
0.05
62.26
22
,182
Kalol
eni
0.24
0.60
0.34
2.65
41.52
45.35
42.39
0.19
12.06
0.01
54.65
36
,988
Mwan
amwi
nga
0.25
0.19
0.00
0.27
27.31
28.02
8.16
0.11
63.71
0.00
71.98
13
,923
Raba
i Con
stitue
ncy
0.77
2.28
0.17
4.20
27.96
35.38
47.63
0.49
16.47
0.04
64.62
69
,553
Mwaw
esa
0.00
0.27
0.13
2.75
15.91
19.05
46.39
0.07
34.49
0.00
80.95
10
,743
Ruru
ma0.2
00.9
40.3
33.4
933
.6838
.6446
.200.2
214
.940.0
161
.36
14,80
5
Kamb
e/Ribe
1.96
4.83
0.16
2.09
25.59
34.64
59.14
0.00
6.09
0.13
65.36
11
,964
Raba
i/Kisu
rutin
i0.8
42.6
10.1
15.8
030
.2539
.6244
.410.9
415
.010.0
260
.38
32,04
1
Ganz
e Co
nstitu
ency
0.05
0.15
0.07
1.69
20.79
22.75
4.69
0.01
72.43
0.11
77.25
83
,036
Ganz
e0.0
80.0
60.1
15.4
020
.0025
.644.1
30.0
070
.220.0
074
.36
17,90
3
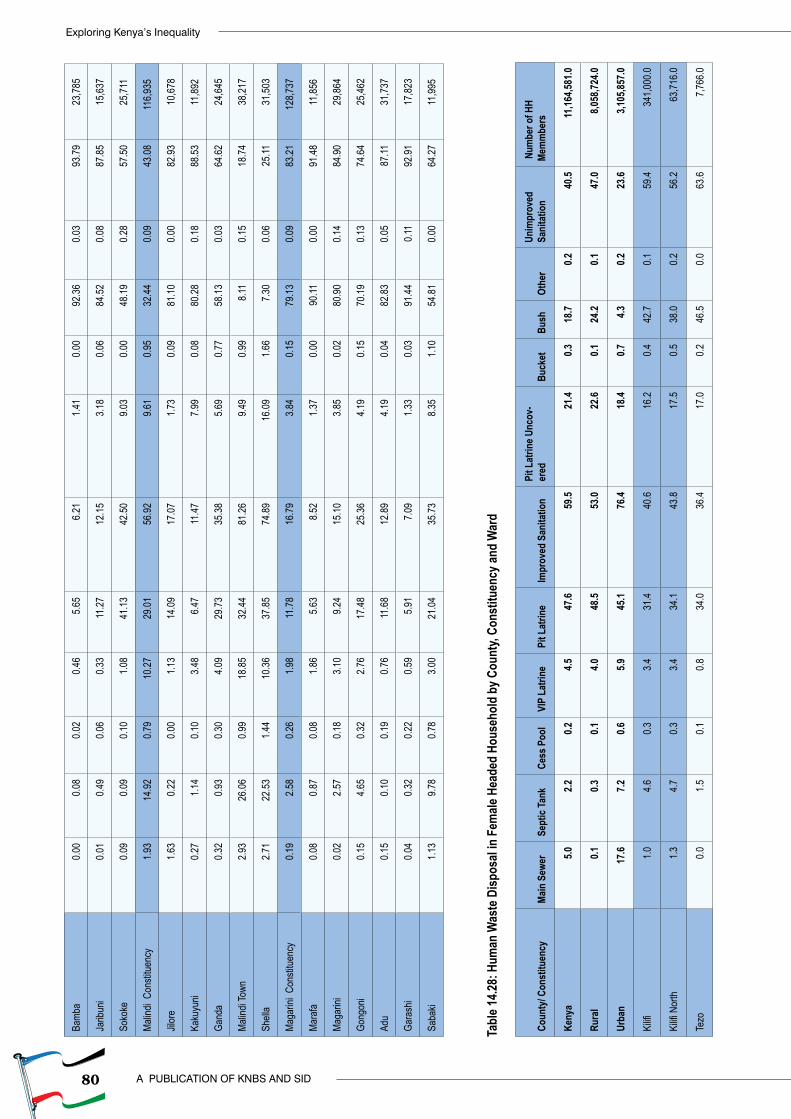
80
Exploring Kenya’s Inequality
A PUBLICATION OF KNBS AND SID
Bamb
a0.0
00.0
80.0
20.4
65.6
56.2
11.4
10.0
092
.360.0
393
.79
23,78
5
Jarib
uni
0.01
0.49
0.06
0.33
11.27
12.15
3.18
0.06
84.52
0.08
87.85
15
,637
Soko
ke0.0
90.0
90.1
01.0
841
.1342
.509.0
30.0
048
.190.2
857
.50
25,71
1
Malin
di C
onsti
tuenc
y1.9
314
.920.7
910
.2729
.0156
.929.6
10.9
532
.440.0
943
.08
1
16,93
5
Jilor
e1.6
30.2
20.0
01.1
314
.0917
.071.7
30.0
981
.100.0
082
.93
10,67
8
Kaku
yuni
0.27
1.14
0.10
3.48
6.47
11.47
7.99
0.08
80.28
0.18
88.53
11
,892
Gand
a0.3
20.9
30.3
04.0
929
.7335
.385.6
90.7
758
.130.0
364
.62
24,64
5
Malin
di To
wn2.9
326
.060.9
918
.8532
.4481
.269.4
90.9
98.1
10.1
518
.74
38,21
7
Shell
a2.7
122
.531.4
410
.3637
.8574
.8916
.091.6
67.3
00.0
625
.11
31,50
3
Maga
rini C
onsti
tuenc
y0.1
92.5
80.2
61.9
811
.7816
.793.8
40.1
579
.130.0
983
.21
1
28,73
7
Mara
fa0.0
80.8
70.0
81.8
65.6
38.5
21.3
70.0
090
.110.0
091
.48
11,85
6
Maga
rini
0.02
2.57
0.18
3.10
9.24
15.10
3.85
0.02
80.90
0.14
84.90
29
,864
Gong
oni
0.15
4.65
0.32
2.76
17.48
25.36
4.19
0.15
70.19
0.13
74.64
25
,462
Adu
0.15
0.10
0.19
0.76
11.68
12.89
4.19
0.04
82.83
0.05
87.11
31
,737
Gara
shi
0.04
0.32
0.22
0.59
5.91
7.09
1.33
0.03
91.44
0.11
92.91
17
,823
Saba
ki1.1
39.7
80.7
83.0
021
.0435
.738.3
51.1
054
.810.0
064
.27
11,99
5
Tabl
e 14.2
8: H
uman
Was
te D
ispos
al in
Fem
ale H
eade
d Ho
useh
old
by C
ount
y, Co
nstit
uenc
y and
War
d
Coun
ty/ C
onst
ituen
cyMa
in S
ewer
Sept
ic Ta
nkCe
ss P
ool
VIP
Latri
nePi
t Lat
rine
Impr
oved
San
itatio
nPi
t Lat
rine U
ncov
-er
edBu
cket
Bush
Othe
rUn
impr
oved
Sa
nita
tion
Num
ber o
f HH
Mem
mbe
rs
Keny
a5.0
2.20.2
4.547
.659
.521
.40.3
18.7
0.240
.511
,164,5
81.0
Rura
l0.1
0.30.1
4.048
.553
.022
.60.1
24.2
0.147
.08,0
58,72
4.0
Urba
n17
.67.2
0.65.9
45.1
76.4
18.4
0.74.3
0.223
.63,1
05,85
7.0
Kilifi
1.04.6
0.33.4
31.4
40.6
16.2
0.442
.70.1
59.4
341,0
00.0
Kilifi
Nor
th1.3
4.70.3
3.434
.143
.817
.50.5
38.0
0.256
.263
,716.0
Tezo
0.01.5
0.10.8
34.0
36.4
17.0
0.246
.50.0
63.6
7,766
.0
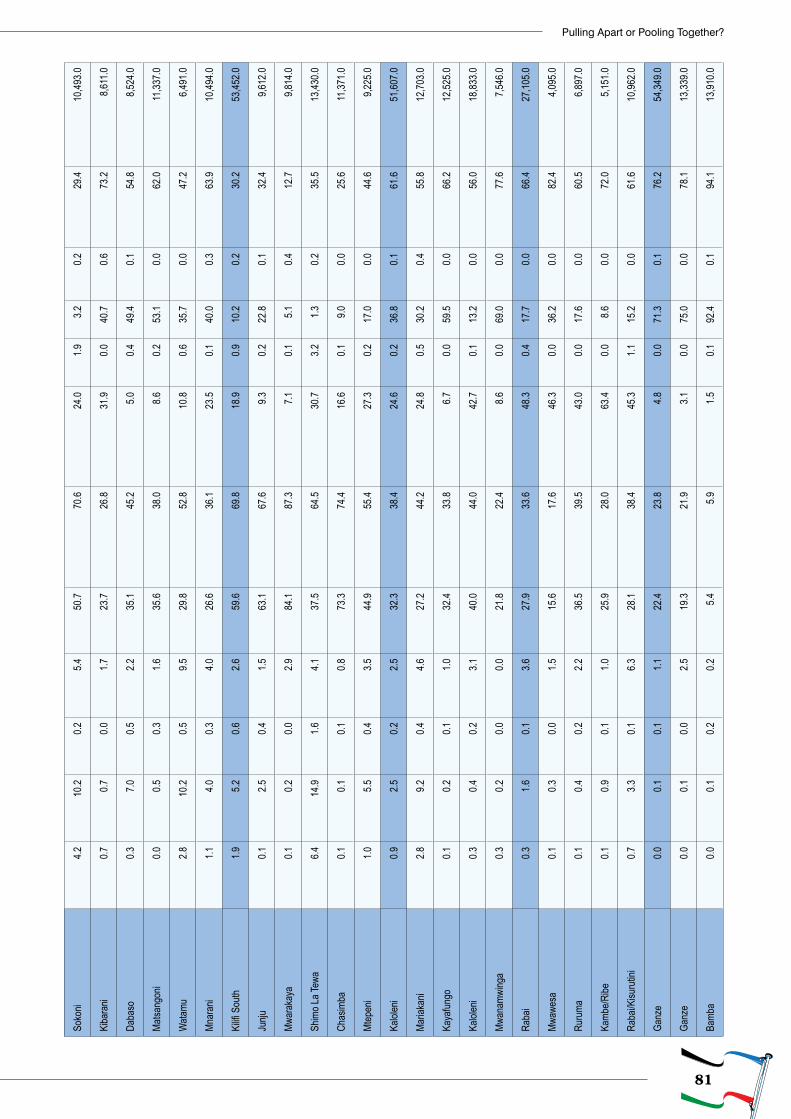
81
Pulling Apart or Pooling Together?
Soko
ni4.2
10.2
0.25.4
50.7
70.6
24.0
1.93.2
0.229
.410
,493.0
Kiba
rani
0.70.7
0.01.7
23.7
26.8
31.9
0.040
.70.6
73.2
8,611
.0
Daba
so0.3
7.00.5
2.235
.145
.25.0
0.449
.40.1
54.8
8,524
.0
Matsa
ngon
i0.0
0.50.3
1.635
.638
.08.6
0.253
.10.0
62.0
11,33
7.0
Wata
mu2.8
10.2
0.59.5
29.8
52.8
10.8
0.635
.70.0
47.2
6,491
.0
Mnar
ani
1.14.0
0.34.0
26.6
36.1
23.5
0.140
.00.3
63.9
10,49
4.0
Kilifi
Sou
th1.9
5.20.6
2.659
.669
.818
.90.9
10.2
0.230
.253
,452.0
Junju
0.12.5
0.41.5
63.1
67.6
9.30.2
22.8
0.132
.49,6
12.0
Mwar
akay
a0.1
0.20.0
2.984
.187
.37.1
0.15.1
0.412
.79,8
14.0
Shim
o La T
ewa
6.414
.91.6
4.137
.564
.530
.73.2
1.30.2
35.5
13,43
0.0
Chas
imba
0.10.1
0.10.8
73.3
74.4
16.6
0.19.0
0.025
.611
,371.0
Mtep
eni
1.05.5
0.43.5
44.9
55.4
27.3
0.217
.00.0
44.6
9,225
.0
Kalol
eni
0.92.5
0.22.5
32.3
38.4
24.6
0.236
.80.1
61.6
51,60
7.0
Maria
kani
2.89.2
0.44.6
27.2
44.2
24.8
0.530
.20.4
55.8
12,70
3.0
Kaya
fungo
0.10.2
0.11.0
32.4
33.8
6.70.0
59.5
0.066
.212
,525.0
Kalol
eni
0.30.4
0.23.1
40.0
44.0
42.7
0.113
.20.0
56.0
18,83
3.0
Mwan
amwi
nga
0.30.2
0.00.0
21.8
22.4
8.60.0
69.0
0.077
.67,5
46.0
Raba
i0.3
1.60.1
3.627
.933
.648
.30.4
17.7
0.066
.427
,105.0
Mwaw
esa
0.10.3
0.01.5
15.6
17.6
46.3
0.036
.20.0
82.4
4,095
.0
Ruru
ma0.1
0.40.2
2.236
.539
.543
.00.0
17.6
0.060
.56,8
97.0
Kamb
e/Ribe
0.10.9
0.11.0
25.9
28.0
63.4
0.08.6
0.072
.05,1
51.0
Raba
i/Kisu
rutin
i0.7
3.30.1
6.328
.138
.445
.31.1
15.2
0.061
.610
,962.0
Ganz
e0.0
0.10.1
1.122
.423
.84.8
0.071
.30.1
76.2
54,34
9.0
Ganz
e0.0
0.10.0
2.519
.321
.93.1
0.075
.00.0
78.1
13,33
9.0
Bamb
a0.0
0.10.2
0.25.4
5.91.5
0.192
.40.1
94.1
13,91
0.0
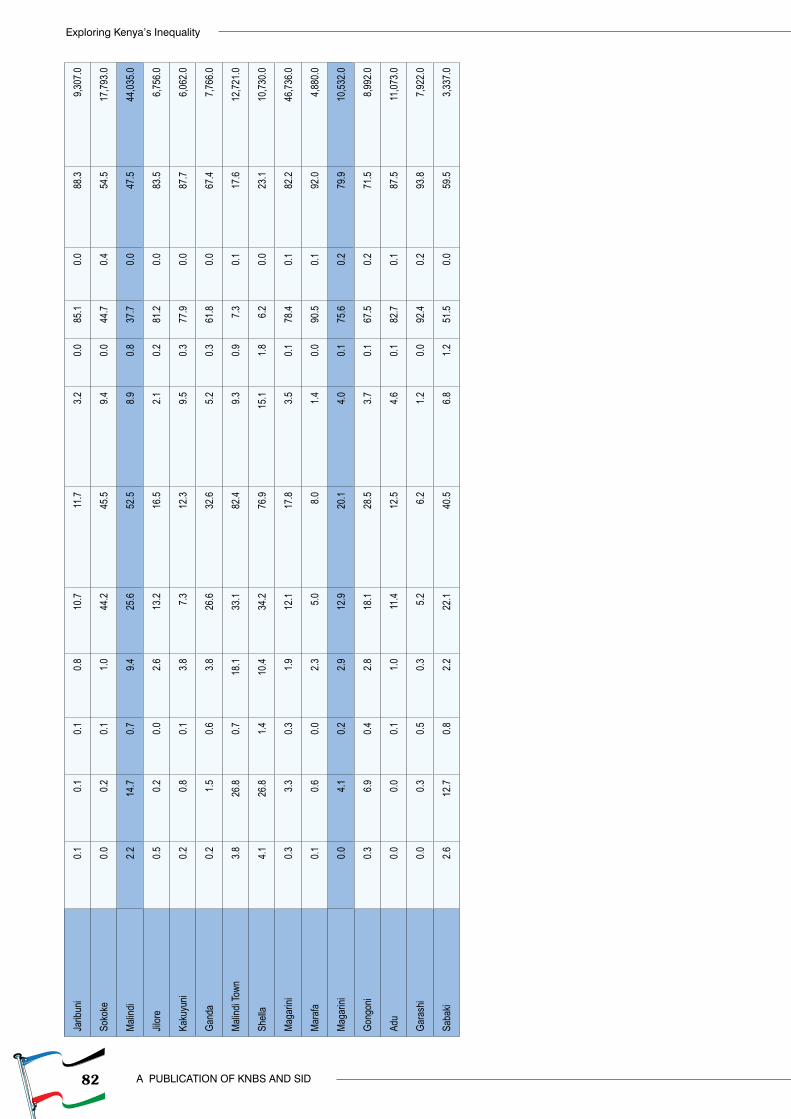
82
Exploring Kenya’s Inequality
A PUBLICATION OF KNBS AND SID
Jarib
uni
0.10.1
0.10.8
10.7
11.7
3.20.0
85.1
0.088
.39,3
07.0
Soko
ke0.0
0.20.1
1.044
.245
.59.4
0.044
.70.4
54.5
17,79
3.0
Malin
di2.2
14.7
0.79.4
25.6
52.5
8.90.8
37.7
0.047
.544
,035.0
Jilor
e0.5
0.20.0
2.613
.216
.52.1
0.281
.20.0
83.5
6,756
.0
Kaku
yuni
0.20.8
0.13.8
7.312
.39.5
0.377
.90.0
87.7
6,062
.0
Gand
a0.2
1.50.6
3.826
.632
.65.2
0.361
.80.0
67.4
7,766
.0
Malin
di To
wn3.8
26.8
0.718
.133
.182
.49.3
0.97.3
0.117
.612
,721.0
Shell
a4.1
26.8
1.410
.434
.276
.915
.11.8
6.20.0
23.1
10,73
0.0
Maga
rini
0.33.3
0.31.9
12.1
17.8
3.50.1
78.4
0.182
.246
,736.0
Mara
fa0.1
0.60.0
2.35.0
8.01.4
0.090
.50.1
92.0
4,880
.0
Maga
rini
0.04.1
0.22.9
12.9
20.1
4.00.1
75.6
0.279
.910
,532.0
Gong
oni
0.36.9
0.42.8
18.1
28.5
3.70.1
67.5
0.271
.58,9
92.0
Adu
0.00.0
0.11.0
11.4
12.5
4.60.1
82.7
0.187
.511
,073.0
Gara
shi
0.00.3
0.50.3
5.26.2
1.20.0
92.4
0.293
.87,9
22.0
Saba
ki2.6
12.7
0.82.2
22.1
40.5
6.81.2
51.5
0.059
.53,3
37.0
83
Pulling Apart or Pooling Together?
C
M
Y
CM
MY
CY
CMY
K