Embed Size (px)
Citation preview
Kilian et al. Malaria Journal 2013, 12:259http://www.malariajournal.com/content/12/1/259
RESEARCH Open Access
Estimating population access to insecticide-treatednets from administrative data: correction factor isneededAlbert Kilian1*, Hannah Koenker2 and Lucy Paintain3
Abstract
Background: Population access to insecticide-treated nets (ITN) is usually determined from survey data. However,for planning purposes it is necessary to estimate this indicator between surveys. Two different approaches arecurrently recommended for such estimates from administrative data, multiplying the number of ITN delivered eitherby 2.0 or 1.8 before dividing by the population. However, the validity of such estimates has not previously beeninvestigated.
Methods: Thirty-five datasets from household surveys in sub-Saharan Africa were selected from ten differentcountries. The number of ITN and de-facto population from the samples was used as proxy administrative data andestimates of population access to ITN were calculated using the recommended formulae. Administrative estimateswere compared to the access indicator from the survey data. Regression analysis was used to further define therelationship between administrative and survey population access. Mean number of ITN users was determined foreach data set separately for households with and without enough ITN.
Results: Analysis of users per ITN showed that the assumption of two users per net is valid overall (median 2.00)but that it was consistently lower in households with at least one ITN for every two people (median 1.66). Usingthe formula number of ITN times 2.0 divided by the population to estimate population access to ITN fromadministrative data generally overestimated the survey access indicator. This was particularly the case at highercoverage levels, resulting in a 30 percentage-point overestimate at survey access above 80%. Using 1.8 as themultiplier for the number of ITN from administrative data improved the results but still showed a 19 percentage-point overestimate at access coverage above 80%. Regression analysis found that a factor of 1.64 provides the bestprediction of the access indicator with slight underestimation at low access levels but good fit at levels above 55%.
Conclusions: A factor of 1.6 rather than 2.0 or 1.8 as the mean number of users per ITN provides a more accurateestimation of population access to ITN from administrative data accounting for discordant ITN-person pairs and areduced number of ITN users when sufficient ITN are available.
BackgroundWith the renewed focus on the possibility of malaria eli-mination, vector control through universal coverage withinsecticide-treated nets (ITN) has become one of the coreelements of the Global Malaria Action Plan [1] and meas-uring its progress is crucial. The World Malaria Report2012 [2] uses the indicator of “access to long-lasting in-secticidal nets (LLIN) within the household” as one of thekey metrics in line with recent recommendations by the
* Correspondence: [email protected] Health LLP, Montagut, Girona, SpainFull list of author information is available at the end of the article
© 2013 Kilian et al.; licensee BioMed Central LCommons Attribution License (http://creativecreproduction in any medium, provided the or
Roll Back Malaria Monitoring and Evaluation ReferenceGroup (MERG) [3]. Access is defined as the number ofpotential net users in the household, assuming that eachnet protects two people, and that nets cannot protectmore people than currently live in a household [4]. ThisITN access indicator not only assesses the level of popula-tion coverage but also provides a way to directly comparethe percentage of actual net users the previous nightagainst the percentage of people who could have used anet, allowing a more accurate measure of the ‘net use gap’by eliminating those who are not using nets because theydo not have access to them.
td. This is an Open Access article distributed under the terms of the Creativeommons.org/licenses/by/2.0), which permits unrestricted use, distribution, andiginal work is properly cited.
Kilian et al. Malaria Journal 2013, 12:259 Page 2 of 10http://www.malariajournal.com/content/12/1/259
Data on ITN coverage and use is generally obtainedfrom large household surveys such as demographic andhealth surveys (DHS), multiple indicator cluster surveys(MICS) or malaria indicator surveys (MIS). However,these surveys usually only take place every two to threeyears and often malaria programme managers need tomonitor coverage in a more continuous fashion or atlower administrative levels not covered by the surveys.In addition, estimates of population coverage with ITNare needed for planning of continuous distribution strat-egies or to plan the timing of a “top-up” campaign. Oneway of obtaining such interim estimates is to use admin-istrative data, namely the number of ITN distributedand the target population from census or other sources.A number of Roll Back Malaria partnership documents
provide suggestions on how to calculate such admi-nistrative coverage: the Alliance for Malaria Preventiontoolkit [5] recommends estimating ITN access followinga mass distribution campaign in the absence of a house-hold survey by multiplying the total number of ITNdelivered during a campaign by a factor of 2.0 and thendividing by the total population. This is based on thegeneral assumption that on average two people share anet. The Harmonization Working Group Country Briefingfor Global Fund Round 11 [6] recommends multiplyingthe number of ITN distributed or assumed still to bepresent at time X by the factor 1.8 to estimate administra-tive population coverage. The factor of 1.8 as opposed to2.0 is based on the recommendation by Kilian and others[7] to use this factor when planning macro-quantificationfor LLIN needs for universal coverage. This adjustmentincreases the number of nets needed for full universalcoverage by accounting for odd-numbered householdswhere two individuals cannot share a net because theyreside in different households, which is referred to as a‘discordant net-person pair’ in this paper.Neither of these approaches has previously been vali-
dated to show how accurate they are compared to surveyestimates of population access to ITN within the house-hold. However, there is theoretical ground to suspect thatneither of them would be accurate. The 1.8 factor is basedon the proportion of odd-numbered households and onlyrefers to 100% coverage; in contrast, the access estimationrefers to the population and here the proportion of dis-cordant net-person pairs may differ and vary dependingon level of coverage. One way of validating these formulaeis to use the number of ITN and population from repre-sentative surveys as a proxy for administrative data andcompare estimates of administrative access using differentformulae to the access metric obtained from the original,individual level survey data. Because real life administra-tive data have additional sources of bias such as inaccuratecensus data and incorrect estimation of the true numberof ITN in the population, use of such proxy administrative
data is a conservative approach and it can be expectedthat discrepancies between survey results and administra-tive estimates will differ even more in real life situations.However, as the level of error in the administrative data isusually not known, the approximation with survey dataseems the best way to explore the systematic relationshipbetween these measures.This paper explores the ways in which existing recom-
mendations on use of administrative data to estimatepopulation ITN access relate to results from survey dataand how they could be improved. The strength and weak-nesses of such recommendations are discussed from bothscientific and pragmatic, managerial perspectives.
MethodsSurvey datasetsA total of 35 survey datasets from sub-Saharan Africawere purposively selected for analysis. To be included,surveys had to be standard, cluster-sampling householdsurveys, representative nationally or for a well-definedsubnational administrative unit (region, state, province,etc.), use of the standard questionnaire modules for mal-aria as recommended by MERG [4] or equivalent, andthe original data had to be accessible in order to obtainall necessary indicators for analysis. Attempts were madeto include the whole spectrum of access coverage fromvery low to very high values as well as to cover differentareas of Africa (Table 1). This implied that all recent sur-veys with likely high access results were included andthose left out were those from the earlier years whenITN coverage was low. All national survey datasets weredownloaded with permission from the Measure DHSwebsite except for the Mozambique MIS (obtained fromMalaria Consortium). Additional subnational survey datawere provided by Malaria Consortium except for threeGhana surveys (Brong Ahafo, Central and Western re-gions) which were implemented by the London School ofTropical Medicine and Hygiene (LSTMH) and DodowaHealth Research Centre on behalf of UNICEF.
Data definition and analysisAll data management and analysis was done using STATAversion 11.2 (STATA Corporation, College Station, Texas,USA) or Excel 2010 (Microsoft Corporation, Seattle,Washington, USA). All analyses accounted for surveydesign including sampling weights where applicable usingthe “svy” command family in STATA.As a proxy for administrative data two metrics were
used: i) the total number of ITN owned by householdsin the survey defined as either an LLIN identified by thebrand label or a net treated with insecticide within theprevious 12 months; ii) the de-facto population in thesample, i e, all people present in the household the nightbefore the survey irrespective of whether they were usual
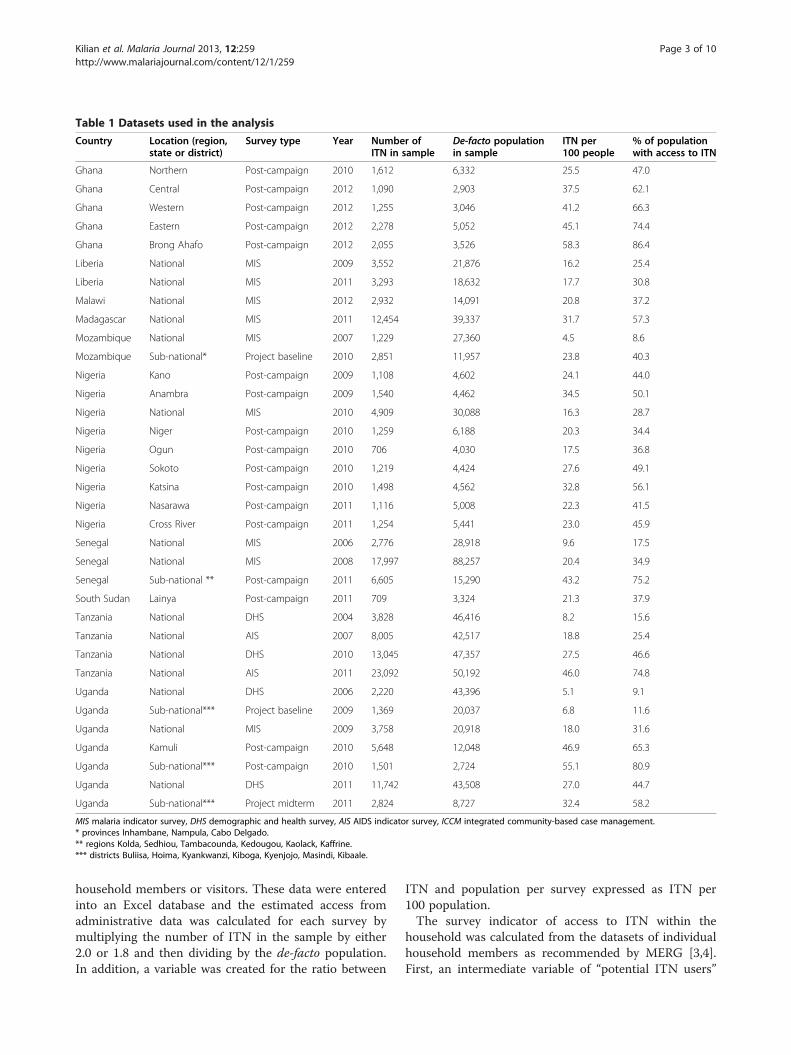
Table 1 Datasets used in the analysis
Country Location (region,state or district)
Survey type Year Number ofITN in sample
De-facto populationin sample
ITN per100 people
% of populationwith access to ITN
Ghana Northern Post-campaign 2010 1,612 6,332 25.5 47.0
Ghana Central Post-campaign 2012 1,090 2,903 37.5 62.1
Ghana Western Post-campaign 2012 1,255 3,046 41.2 66.3
Ghana Eastern Post-campaign 2012 2,278 5,052 45.1 74.4
Ghana Brong Ahafo Post-campaign 2012 2,055 3,526 58.3 86.4
Liberia National MIS 2009 3,552 21,876 16.2 25.4
Liberia National MIS 2011 3,293 18,632 17.7 30.8
Malawi National MIS 2012 2,932 14,091 20.8 37.2
Madagascar National MIS 2011 12,454 39,337 31.7 57.3
Mozambique National MIS 2007 1,229 27,360 4.5 8.6
Mozambique Sub-national* Project baseline 2010 2,851 11,957 23.8 40.3
Nigeria Kano Post-campaign 2009 1,108 4,602 24.1 44.0
Nigeria Anambra Post-campaign 2009 1,540 4,462 34.5 50.1
Nigeria National MIS 2010 4,909 30,088 16.3 28.7
Nigeria Niger Post-campaign 2010 1,259 6,188 20.3 34.4
Nigeria Ogun Post-campaign 2010 706 4,030 17.5 36.8
Nigeria Sokoto Post-campaign 2010 1,219 4,424 27.6 49.1
Nigeria Katsina Post-campaign 2010 1,498 4,562 32.8 56.1
Nigeria Nasarawa Post-campaign 2011 1,116 5,008 22.3 41.5
Nigeria Cross River Post-campaign 2011 1,254 5,441 23.0 45.9
Senegal National MIS 2006 2,776 28,918 9.6 17.5
Senegal National MIS 2008 17,997 88,257 20.4 34.9
Senegal Sub-national ** Post-campaign 2011 6,605 15,290 43.2 75.2
South Sudan Lainya Post-campaign 2011 709 3,324 21.3 37.9
Tanzania National DHS 2004 3,828 46,416 8.2 15.6
Tanzania National AIS 2007 8,005 42,517 18.8 25.4
Tanzania National DHS 2010 13,045 47,357 27.5 46.6
Tanzania National AIS 2011 23,092 50,192 46.0 74.8
Uganda National DHS 2006 2,220 43,396 5.1 9.1
Uganda Sub-national*** Project baseline 2009 1,369 20,037 6.8 11.6
Uganda National MIS 2009 3,758 20,918 18.0 31.6
Uganda Kamuli Post-campaign 2010 5,648 12,048 46.9 65.3
Uganda Sub-national*** Post-campaign 2010 1,501 2,724 55.1 80.9
Uganda National DHS 2011 11,742 43,508 27.0 44.7
Uganda Sub-national*** Project midterm 2011 2,824 8,727 32.4 58.2
MIS malaria indicator survey, DHS demographic and health survey, AIS AIDS indicator survey, ICCM integrated community-based case management.* provinces Inhambane, Nampula, Cabo Delgado.** regions Kolda, Sedhiou, Tambacounda, Kedougou, Kaolack, Kaffrine.*** districts Buliisa, Hoima, Kyankwanzi, Kiboga, Kyenjojo, Masindi, Kibaale.
Kilian et al. Malaria Journal 2013, 12:259 Page 3 of 10http://www.malariajournal.com/content/12/1/259
household members or visitors. These data were enteredinto an Excel database and the estimated access fromadministrative data was calculated for each survey bymultiplying the number of ITN in the sample by either2.0 or 1.8 and then dividing by the de-facto population.In addition, a variable was created for the ratio between
ITN and population per survey expressed as ITN per100 population.The survey indicator of access to ITN within the
household was calculated from the datasets of individualhousehold members as recommended by MERG [3,4].First, an intermediate variable of “potential ITN users”
Kilian et al. Malaria Journal 2013, 12:259 Page 4 of 10http://www.malariajournal.com/content/12/1/259
was created by multiplying the number of ITN in eachhousehold by a factor 2.0. In order to adjust for house-holds with more than one net for every two people thepotential ITN users were set equal to the de-factopopulation in that household if the potential usersexceeded the number of people in the household. Sec-ond, the access indicator was calculated by dividing thepotential ITN users by the number of de-facto membersfor each household and determining the overall samplemean of that fraction.Mean number of users per used ITN was determined
by first creating a dataset with nets found in the house-hold as the unit of observation where it did not yet exist.For each net user listed by line number from the house-hold register a dichotomous variable was created indicat-ing 1 if any person was listed as user and 0 if not andthe sum of these user variables for each net was calcu-lated to obtain the total number of users per net. Themean users for those nets identified as ITN and used byanyone the previous night were obtained using samplingweights where appropriate and taking account of the de-sign effect using the “svy” command family in STATA.The same analysis was done for the subgroups of popu-lation living in households that did or did not have atleast one ITN for every two people.The relationship between the estimated administrative
access to ITN with the factor 2.0 or 1.8 and the surveyaccess indicator was explored using linear and fractionalpolynomial regression analysis (“fracpoly” command inStata). Similarly, linear regression analysis using ITN/100 people as the predictor of the survey access resultwas applied to identify the optimal correction factor forthe administrative data.
ResultsDetails of the 35 datasets used are given in Table 1. Theyear of implementation ranged from 2004 to 2012 withthe majority (83%) from 2009 or later. Ten countries wereincluded from west (Senegal, Liberia, Ghana, Nigeria), east(South Sudan, Uganda, Tanzania) and southern Africa(Malawi, Mozambique, Madagascar) with the largestnumber of surveys being from Nigeria (nine), Uganda(seven) and Ghana (five). Seventeen surveys (49%) werepost-campaign evaluation surveys, 15 surveys (43%) werenational-level DHS, MIS or AIDS indicator surveys (AIS),and the remaining three were project baseline or midtermevaluation surveys. Five surveys (14%) were subnational,13 (37%) covered a single state, province or region andtwo (6%) a single district (Kamuli District in Uganda,Lainya County in South Sudan).The median de-facto population per survey was 12,048
with range from 2,724 (post-campaign survey WesternUganda 2010) to 88,257 (Senegal MIS 2008); the mediannumber of ITN per survey was 2,278 with range from
706 (post-campaign survey Ogun State, Nigeria 2010) to22,663 (AIS Tanzania 2011); and the ratio between thetwo expressed as ITN/100 people ranged from 4.5 to58.3 with a median of 23.4.Median proportion of the de-facto population with ac-
cess to an ITN within the household from survey datawas 44.0% with a range from 8.6% (MIS Mozambique2007) to 86.4% (Brong Ahafo Region, Ghana 2012) witha reasonable distribution between these points (Table 1).
Number of users per ITN usedGiven that the primary outcome variable of “access toITN within the household” is based on the assumptionthat an ITN is on average shared by two people, the firststep in the analysis was to explore to what extent this as-sumption holds. The mean number of users per ITN forall used ITN varied between 1.71 and 2.47 (Figure 1 andAdditional file 1). The mean across the 35 datasets was1.99 (95% confidence interval (CI): 1.93, 2.05), and therespective median was 1.99 (inter-quartile range (IQR)1.83, 2.09). Using ±0.10 ITN users as acceptable vari-ation, i e, 1.90 to 2.10 users/used ITN, 16 datasets (46%)were within these limits rising to 25 (71%) if the criter-ion was that the 95% CI of the survey results includedthe acceptable range of variation (1.90 to 2.10 usersper ITN used). When the acceptable variation was setto ±0.25 users/ITN, i e, 1.75 to 2.25, 30 datasets (86%)were within these limits and 33 (94%) if inclusion withinthe 95% CI was considered. As shown in Figure 1, theresults within the same country seemed to be quite simi-lar except for Ghana and Nigeria where the data camefrom different parts of the country and a considerablevariation was seen.Plotting the mean number of ITN users per net against
the population access to ITN from the survey data did notoverall show any trend (Figure 2) and regression analysisconfirmed this with a co-efficient of −0.001 (p=0.3, R-squared 0.002). However, when only surveys with a popu-lation access to ITN of 55% or more were considered amoderate linear decline was evident with a co-efficientof −0.13 (p=0.03, R-squared 0.37) suggesting a decliningnumber of ITN users per net at higher levels of access. Inorder to further explore this aspect, survey data on meanusers per used ITN was calculated separately for those liv-ing in households with at least one ITN for every twopeople, i.e, enough ITN to cover all household membersand those with an insufficient number of ITN. This re-vealed a systematically and significantly lower number ofITN users when enough ITN were available (Figure 3 andAdditional file 1) with a mean of 1.68 (95% CI 1.63, 1.71)and a median of 1.66 (IQR 1.61, 1.75) compared to mean2.27 ITN users (95% CI 2.20, 2.36) and median 2.21 (IQR2.11, 2.44) if the household did not have enough ITN. Thetwo-sample t-test for comparison of the means was highly
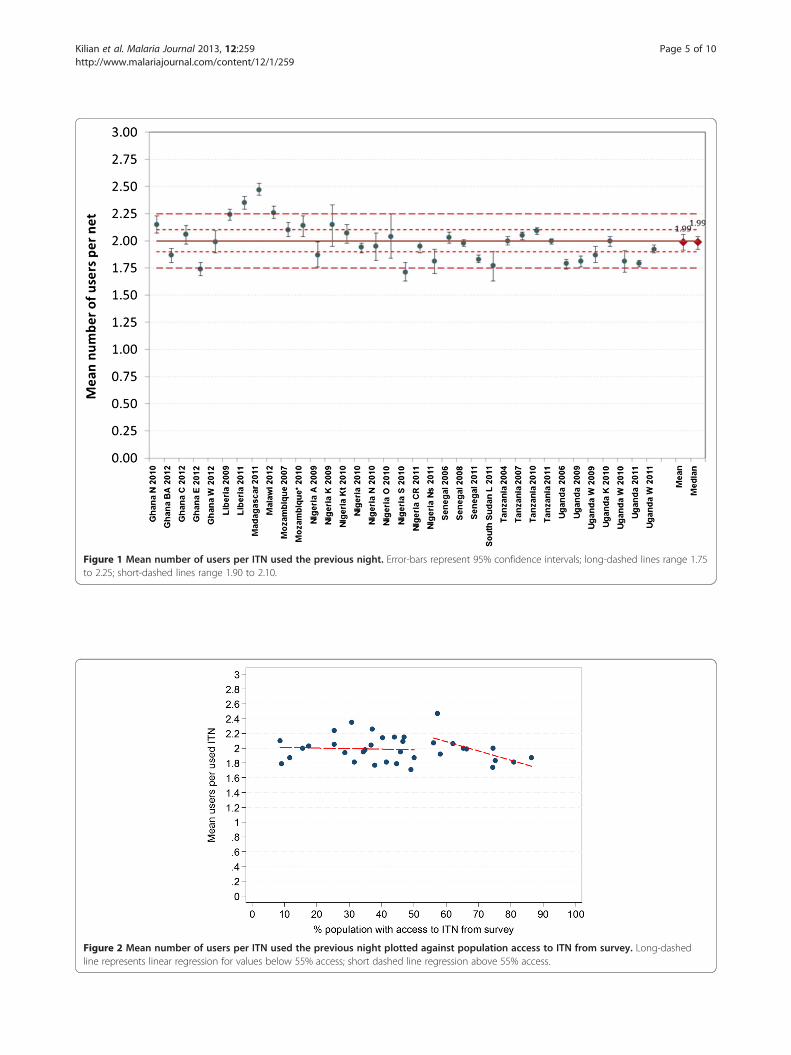
Figure 1 Mean number of users per ITN used the previous night. Error-bars represent 95% confidence intervals; long-dashed lines range 1.75to 2.25; short-dashed lines range 1.90 to 2.10.
Figure 2 Mean number of users per ITN used the previous night plotted against population access to ITN from survey. Long-dashedline represents linear regression for values below 55% access; short dashed line regression above 55% access.
Kilian et al. Malaria Journal 2013, 12:259 Page 5 of 10http://www.malariajournal.com/content/12/1/259
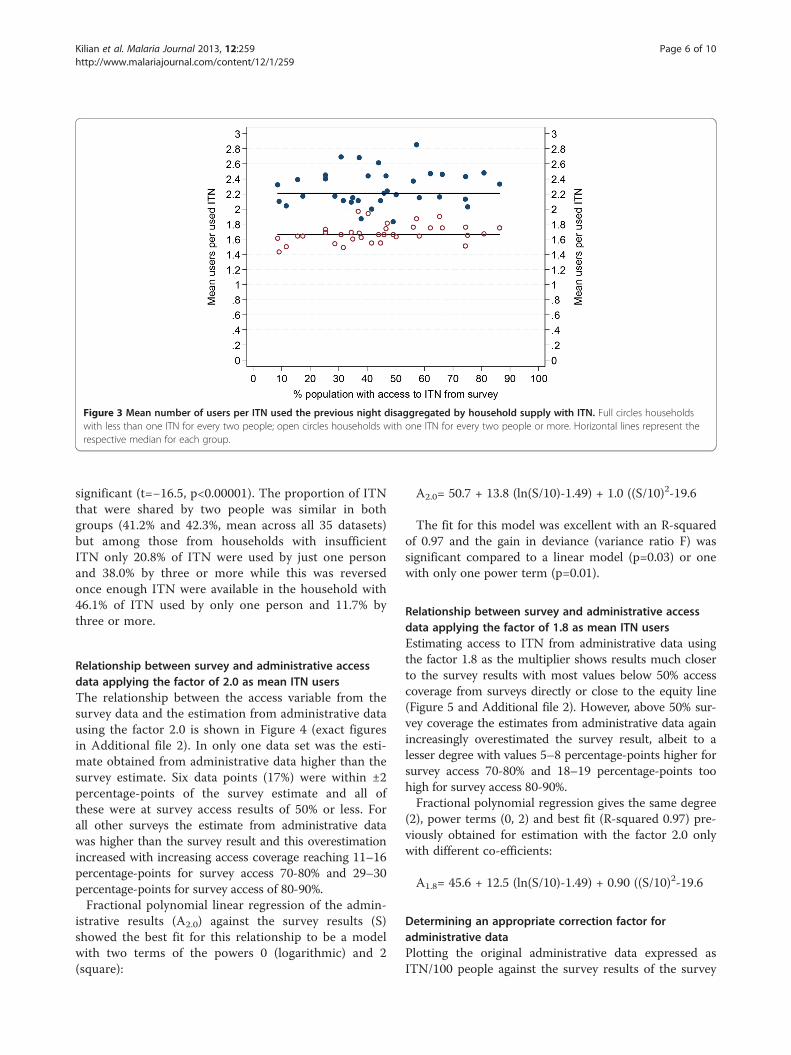
Figure 3 Mean number of users per ITN used the previous night disaggregated by household supply with ITN. Full circles householdswith less than one ITN for every two people; open circles households with one ITN for every two people or more. Horizontal lines represent therespective median for each group.
Kilian et al. Malaria Journal 2013, 12:259 Page 6 of 10http://www.malariajournal.com/content/12/1/259
significant (t=−16.5, p<0.00001). The proportion of ITNthat were shared by two people was similar in bothgroups (41.2% and 42.3%, mean across all 35 datasets)but among those from households with insufficientITN only 20.8% of ITN were used by just one personand 38.0% by three or more while this was reversedonce enough ITN were available in the household with46.1% of ITN used by only one person and 11.7% bythree or more.
Relationship between survey and administrative accessdata applying the factor of 2.0 as mean ITN usersThe relationship between the access variable from thesurvey data and the estimation from administrative datausing the factor 2.0 is shown in Figure 4 (exact figuresin Additional file 2). In only one data set was the esti-mate obtained from administrative data higher than thesurvey estimate. Six data points (17%) were within ±2percentage-points of the survey estimate and all ofthese were at survey access results of 50% or less. Forall other surveys the estimate from administrative datawas higher than the survey result and this overestimationincreased with increasing access coverage reaching 11–16percentage-points for survey access 70-80% and 29–30percentage-points for survey access of 80-90%.Fractional polynomial linear regression of the admin-
istrative results (A2.0) against the survey results (S)showed the best fit for this relationship to be a modelwith two terms of the powers 0 (logarithmic) and 2(square):
A2.0= 50.7 + 13.8 (ln(S/10)-1.49) + 1.0 ((S/10)2-19.6
The fit for this model was excellent with an R-squaredof 0.97 and the gain in deviance (variance ratio F) wassignificant compared to a linear model (p=0.03) or onewith only one power term (p=0.01).
Relationship between survey and administrative accessdata applying the factor of 1.8 as mean ITN usersEstimating access to ITN from administrative data usingthe factor 1.8 as the multiplier shows results much closerto the survey results with most values below 50% accesscoverage from surveys directly or close to the equity line(Figure 5 and Additional file 2). However, above 50% sur-vey coverage the estimates from administrative data againincreasingly overestimated the survey result, albeit to alesser degree with values 5–8 percentage-points higher forsurvey access 70-80% and 18–19 percentage-points toohigh for survey access 80-90%.Fractional polynomial regression gives the same degree
(2), power terms (0, 2) and best fit (R-squared 0.97) pre-viously obtained for estimation with the factor 2.0 onlywith different co-efficients:
A1.8= 45.6 + 12.5 (ln(S/10)-1.49) + 0.90 ((S/10)2-19.6
Determining an appropriate correction factor foradministrative dataPlotting the original administrative data expressed asITN/100 people against the survey results of the survey
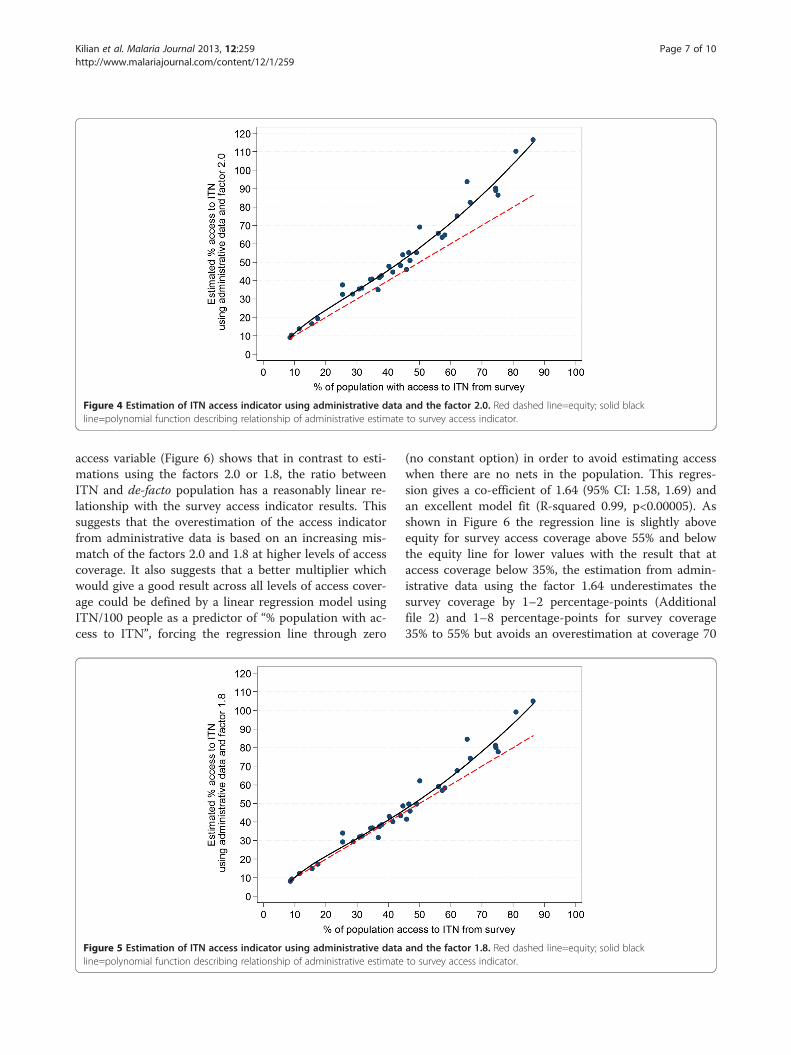
Figure 4 Estimation of ITN access indicator using administrative data and the factor 2.0. Red dashed line=equity; solid blackline=polynomial function describing relationship of administrative estimate to survey access indicator.
Kilian et al. Malaria Journal 2013, 12:259 Page 7 of 10http://www.malariajournal.com/content/12/1/259
access variable (Figure 6) shows that in contrast to esti-mations using the factors 2.0 or 1.8, the ratio betweenITN and de-facto population has a reasonably linear re-lationship with the survey access indicator results. Thissuggests that the overestimation of the access indicatorfrom administrative data is based on an increasing mis-match of the factors 2.0 and 1.8 at higher levels of accesscoverage. It also suggests that a better multiplier whichwould give a good result across all levels of access cover-age could be defined by a linear regression model usingITN/100 people as a predictor of “% population with ac-cess to ITN”, forcing the regression line through zero
Figure 5 Estimation of ITN access indicator using administrative dataline=polynomial function describing relationship of administrative estimate
(no constant option) in order to avoid estimating accesswhen there are no nets in the population. This regres-sion gives a co-efficient of 1.64 (95% CI: 1.58, 1.69) andan excellent model fit (R-squared 0.99, p<0.00005). Asshown in Figure 6 the regression line is slightly aboveequity for survey access coverage above 55% and belowthe equity line for lower values with the result that ataccess coverage below 35%, the estimation from admin-istrative data using the factor 1.64 underestimates thesurvey coverage by 1–2 percentage-points (Additionalfile 2) and 1–8 percentage-points for survey coverage35% to 55% but avoids an overestimation at coverage 70
and the factor 1.8. Red dashed line=equity; solid blackto survey access indicator.
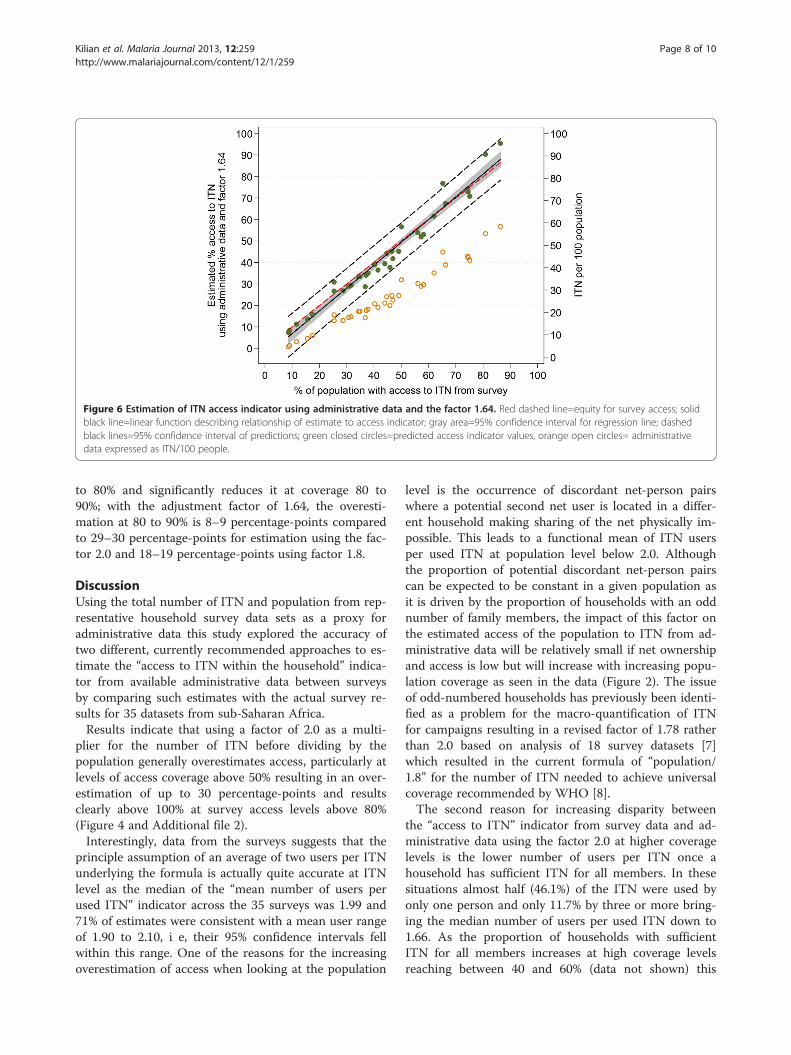
Figure 6 Estimation of ITN access indicator using administrative data and the factor 1.64. Red dashed line=equity for survey access; solidblack line=linear function describing relationship of estimate to access indicator; gray area=95% confidence interval for regression line; dashedblack lines=95% confidence interval of predictions; green closed circles=predicted access indicator values, orange open circles= administrativedata expressed as ITN/100 people.
Kilian et al. Malaria Journal 2013, 12:259 Page 8 of 10http://www.malariajournal.com/content/12/1/259
to 80% and significantly reduces it at coverage 80 to90%; with the adjustment factor of 1.64, the overesti-mation at 80 to 90% is 8–9 percentage-points comparedto 29–30 percentage-points for estimation using the fac-tor 2.0 and 18–19 percentage-points using factor 1.8.
DiscussionUsing the total number of ITN and population from rep-resentative household survey data sets as a proxy foradministrative data this study explored the accuracy oftwo different, currently recommended approaches to es-timate the “access to ITN within the household” indica-tor from available administrative data between surveysby comparing such estimates with the actual survey re-sults for 35 datasets from sub-Saharan Africa.Results indicate that using a factor of 2.0 as a multi-
plier for the number of ITN before dividing by thepopulation generally overestimates access, particularly atlevels of access coverage above 50% resulting in an over-estimation of up to 30 percentage-points and resultsclearly above 100% at survey access levels above 80%(Figure 4 and Additional file 2).Interestingly, data from the surveys suggests that the
principle assumption of an average of two users per ITNunderlying the formula is actually quite accurate at ITNlevel as the median of the “mean number of users perused ITN” indicator across the 35 surveys was 1.99 and71% of estimates were consistent with a mean user rangeof 1.90 to 2.10, i e, their 95% confidence intervals fellwithin this range. One of the reasons for the increasingoverestimation of access when looking at the population
level is the occurrence of discordant net-person pairswhere a potential second net user is located in a differ-ent household making sharing of the net physically im-possible. This leads to a functional mean of ITN usersper used ITN at population level below 2.0. Althoughthe proportion of potential discordant net-person pairscan be expected to be constant in a given population asit is driven by the proportion of households with an oddnumber of family members, the impact of this factor onthe estimated access of the population to ITN from ad-ministrative data will be relatively small if net ownershipand access is low but will increase with increasing popu-lation coverage as seen in the data (Figure 2). The issueof odd-numbered households has previously been identi-fied as a problem for the macro-quantification of ITNfor campaigns resulting in a revised factor of 1.78 ratherthan 2.0 based on analysis of 18 survey datasets [7]which resulted in the current formula of “population/1.8” for the number of ITN needed to achieve universalcoverage recommended by WHO [8].The second reason for increasing disparity between
the “access to ITN” indicator from survey data and ad-ministrative data using the factor 2.0 at higher coveragelevels is the lower number of users per ITN once ahousehold has sufficient ITN for all members. In thesesituations almost half (46.1%) of the ITN were used byonly one person and only 11.7% by three or more bring-ing the median number of users per used ITN down to1.66. As the proportion of households with sufficientITN for all members increases at high coverage levelsreaching between 40 and 60% (data not shown) this
Kilian et al. Malaria Journal 2013, 12:259 Page 9 of 10http://www.malariajournal.com/content/12/1/259
contributes to the observed moderate decline of themean ITN users at access levels above 55% (Figure 2). Ahigher proportion of single ITN users once sufficientITN are available within the household is very plausibleconsidering that older/oldest members of the householdand children over age five are more likely to have theirown sleeping spaces and also have been shown to beleast likely to be sleeping under a net when there are notenough nets [9]. As these family members, who gener-ally use single bed sleeping arrangements, are added tothe users, the overall average of users per net decreases.Using the factor 1.8 to estimate the proportion of
people with access to ITN from administrative data [6]leads to a much better fit compared to a factor of 2.0with good results for access coverage below 50%; how-ever, there is still increasing overestimation at higheraccess coverage of up to 19 percentage-points (Figure 3).The factor 1.8 was based on a simulated allocation of“enough” nets to all households and an estimation of theresulting ratio between population and ITN neededwhen 100% of households had “one ITN for every twopeople”. In the case of the access indicator estimation,however, the reference is the population, not householdsand it appears that the proportion of people living inodd-numbered households is slightly higher than theproportion of households with an odd number of mem-bers leading – in conjunction with the lower mean uservalue at full coverage – to the observed overestimateeven when the factor 1.8 was used.The regression analysis of the ratio of ITN and popu-
lation found in the surveys against the survey-derivedaccess indicator provides the figure of 1.64 as the opti-mal compromise to predict population ITN access fromadministrative data avoiding significant overestimationat high coverage rates, although at the price of slightunderestimation at levels below 60% access coverage(Figure 4). Given that most countries in sub-SaharanAfrica now approach access coverage of 40 to 60% [2] aslight underestimation at lower coverage levels seemsjustified if it leads to more accuracy at higher coveragelevels which are the most critical for planning purposesfor continuous distributions or follow-up distributionscampaigns.In this study the number of ITN found in the survey
sample and the de-facto survey populations have beenused as a proxy for administrative data. This is not real-istic, as usually the ITN numbers would be obtainedfrom records of previous distributions discounted byestimated losses due to wear and tear [6] and a popu-lation estimate from previous census data or othersources such as immunization records. Both of thesedata sources are prone to considerable inaccuracies, forexample, if net durability differs from the assumed ratesor if significant changes such as in- or out-migration or
reduction in population growth rates have occurredsince the last census. In general it can be assumed thatreal life administrative data tend to further overestimatethe true ITN access of the population, but in each indi-vidual case a prediction is difficult to make as the mag-nitude and direction of the bias is not known. Incontrast, the figures used in this study are much moreaccurate reflecting the exact number of ITNs and peopleon the day of the survey. This means that the relation-ship between administrative data and survey results inthis analysis is more exact than if true administrativedata were used and the variations seen in the resultsshould be considered conservative compared to a real-life situation. One way to address this issue would be amodelling exercise that allows a sensitivity analysis ofthe impact of various degrees of over- and underestima-tion of the real life administrative data on the access in-dicator estimation. Such modelling, however is beyondthe scope of this study and can be suggested for futureresearch.There is little doubt that there is a great need to esti-
mate progress towards universal coverage with ITN fromadministrative data between surveys or following distri-bution campaigns either by project and programmemanagers or in the context of projections of globalprogress [2]. Using a formula that significantly overesti-mates the true, survey-derived access indicator couldhave negative effects by suggesting a coverage level thatactually does not exist, leading to discrepancies betweenexpected and actual survey results, thereby discreditingthe efforts of malaria control. On the other hand, anychange in current practices must be simple enough to bebroadly applied and it is therefore suggested that a for-mula for the interim estimation of access of populationto ITN is used as follows:
% population with ITN access= number of ITN * (1.6/target population)*100
This revised formula will still be sufficiently accurateconsidering the previously discussed potential variationsin true administrative data and should be considered bythe relevant structures of WHO as a recommendation tomalaria programmes and the international community atlarge.This study has several limitations. First, the selection
of surveys to be included was purposive even though allrecent surveys were included and it cannot be excludedthat the variations in results would be somewhat largerhad all available data sets from the past years be in-cluded. It is, however, very unlikely that this would havea significant impact on the regression co-efficient andhence would not have altered the resulting recommen-dation. Second, only five datasets at access coverage
Kilian et al. Malaria Journal 2013, 12:259 Page 10 of 10http://www.malariajournal.com/content/12/1/259
above 70% were available and only two above 80%,which proved to be the critical area of overestimation.While it clearly would be desirable to have more datapoints at high access coverage levels, such data currentlydo not exist and a re-analysis of the situation may beneeded at a later point in time. But again, it is not verylikely that this would dramatically alter the current esti-mate of 1.6 being the best compromise as the multiplier.
ConclusionsTo estimate administrative population coverage of ITNafter or between household surveys based on number ofavailable or distributed ITN and the target population, afactor of 1.6 mean users per ITN provides a more accurateprediction of population access to ITN accounting for thepresence of discordant ITN-person pairs at householdlevel and a reduced number of users per ITN when suffi-cient ITN are available for all household members.
Additional files
Additional file 1: Table 2. Results for mean number of ITN users.
Additional file 2: Table 3. Results from estimations for each data setsorted by the survey access variable.
Competing interestsThe authors declare that they have no competing interests.
Authors’ contributionsAK designed the study; AK, HK and LP participated in the data analysis andinterpretation. All authors contributed to the final version of the text andhave read and approved the manuscript.
AcknowledgementsWe would like to thank UNICEF Ghana (Anirban Chatterjee) for permission touse their data from three regions in Ghana and Malaria Consortium (SylviaMeek) for providing data sets for Senegal, Nigeria, Uganda, South Sudan andMozambique. This study was made possible by the generous support of theAmerican people through the Unites States Agency for InternationalDevelopment (USAID) under the terms of USAID/JHU CooperativeAgreement No. GHS-A-00-09-00014-00 for the NetWorks Project. Thecontents are the responsibility of the authors and do not necessarily reflectthe views of USAID or the United States Government.
Author details1Tropical Health LLP, Montagut, Girona, Spain. 2Johns Hopkins BloombergSchool of Public Health Center for Communication Programs, Baltimore, MD,USA. 3Department of Disease Control, London School of Hygiene & TropicalMedicine London, London, UK.
Received: 14 May 2013 Accepted: 13 July 2013Published: 26 July 2013
References1. Roll Back Malaria Partnership: Global Malaria Action Plan. Geneva; 2008.
http://www.rollbackmalaria.org/gmap/gmap.pdf2. Global Malaria Programme: World Malaria Report 2012. Geneva: WHO; 2012.
http://www.who.int/malaria/publications/world_malaria_report_2012/report/en/index.html
3. Roll Back Malaria Partnership: Changes to guidance for vector controlindicators. New York, USA: Meeting report of the 17th MERG meeting; 2013.http://www.rbm.who.int/partnership/wg/wg_monitoring/docs/17merg_meeting_report.pdf
4. Measure DHS: Malaria indicator survey: tabulations for key malaria indicators.Maryland, USA: Calverton; 2012. http://malariasurveys.org/toolkitfiles/10%20Tabulations%20for%20Key%20Malaria%20Indicators.pdf
5. Alliance for Malaria Prevention: A toolkit for mass distribution campaigns toincrease coverage and use of long-lasting insecticide-treated nets; 2012.http://www.allianceformalariaprevention.com/resources/AMP%20Toolkit%202.0%20English%20FINAL.pdf
6. Roll Back Malaria Partnership: Country briefing document for Global FundRound 11 Malaria Proposals (sub-Saharan Africa). RBM HarmonizationWorking Group; 2011. http://www.rbm.who.int/partnership/wg/wg_harmonization/docs/ws4/HWGcountryBriefingNoteForGFround11.pdf
7. Kilian A, Boulay M, Koenker H, Lynch M: How many mosquito nets areneeded to achieve universal coverage? Recommendations for thequantification and allocation of long-lasting insecticidal nets for masscampaigns. Malar J 2010, 9:330.
8. Global Malaria Programme: Malaria: Global fund proposal development –WHO policy brief. Geneva: WHO; 2011. http://www.who.int/malaria/publications/atoz/malaria_gf_proposal_dev_who_policy_brief_201106.pdf
9. Bennet A, Smith SJ, Yambasu S, Jambai A, Alemu W, Kabano A, Eisele TP:Household possession and use of insecticide-treated mosquito nets inSierra Leone 6 months after a national mass-distribution campaign.PLoS One 2012, 7:e37927.
doi:10.1186/1475-2875-12-259Cite this article as: Kilian et al.: Estimating population access toinsecticide-treated nets from administrative data: correction factor isneeded. Malaria Journal 2013 12:259.
Submit your next manuscript to BioMed Centraland take full advantage of:
• Convenient online submission
• Thorough peer review
• No space constraints or color figure charges
• Immediate publication on acceptance
• Inclusion in PubMed, CAS, Scopus and Google Scholar
• Research which is freely available for redistribution
Submit your manuscript at www.biomedcentral.com/submit