Embed Size (px)
Citation preview
Kimberley Aquaculture Development Zone
Environmental Monitoring & Management Plan
Version 1, January 2014
2
Table of Contents
1 Background ................................................................................................................. 4 Project description ......................................................................................................................... 4 1.1
EMMP objectives ........................................................................................................................... 5 1.2
EMMP context ............................................................................................................................... 5 1.3
1.3.1 Environmental factors .................................................................................................................... 9 1.3.2 Environmental quality criteria ........................................................................................................ 9 1.3.3 Environmental quality guidelines and standards ......................................................................... 10
2 Environmental monitoring program ......................................................................... 12 Environmental management plan implementation ...................................................................... 12 2.1
Water and sediment quality – data handling and calculations .................................................... 13 2.2
Infauna – data handling and calculations .................................................................................... 14 2.3
Water quality monitoring .............................................................................................................. 14 2.4
2.4.1 Objectives .................................................................................................................................... 14 2.4.2 Indicators to be monitored ........................................................................................................... 14 2.4.3 Timing .......................................................................................................................................... 15 2.4.4 Sampling regime and sites .......................................................................................................... 16 2.4.5 Methods ....................................................................................................................................... 18 2.4.6 Environmental water quality guidelines and standards ............................................................... 19
Sediment quality monitoring ........................................................................................................ 22 2.5
2.5.1 Objectives .................................................................................................................................... 22 2.5.2 Indicators to be monitored ........................................................................................................... 22 2.5.3 Timing .......................................................................................................................................... 23 2.5.4 Sampling regime and sites .......................................................................................................... 23 2.5.5 Methods ....................................................................................................................................... 23 2.5.6 Environmental sediment quality guidelines and standards ......................................................... 24
Sediment infauna monitoring ....................................................................................................... 27 2.6
2.6.1 Objectives .................................................................................................................................... 27 2.6.2 Timing .......................................................................................................................................... 27 2.6.3 Sampling regime and sites .......................................................................................................... 27 2.6.4 Methods ....................................................................................................................................... 27
3 Reporting ................................................................................................................... 27 Annual reporting structure ........................................................................................................... 27 3.1
Exceedance reporting structure .................................................................................................. 28 3.2
4 Adaptive management and monitoring – the feedback loop .................................. 28
5 Mitigation measures .................................................................................................. 28 Fallowing of sea-cages ................................................................................................................ 28 5.1
Movement of stock ...................................................................................................................... 29 5.2
Reduction of stocking densities ................................................................................................... 29 5.3
Reduction of feed input rates ...................................................................................................... 29 5.4
6 Decommissioning plan ............................................................................................. 29
7 Marine fauna interaction plan. .................................................................................. 29 Marine fauna monitoring .............................................................................................................. 30 7.1
Interactions with protected species ............................................................................................. 30 7.2
Management strategies to reduce interactions ........................................................................... 30 7.3
8 References ................................................................................................................. 31
3
List of Figures Figure 1-1 Location of Cone Bay, Western Australia. .................................................................................... 5 Figure 1-2 Conceptual diagram showing the spatial extent of ecological protection zones in
Cone Bay at maximum production of 20,000 tonnes per annum. ................................................. 8 Figure 1-3 Management response protocol from EPA (2005a). ................................................................... 10 Figure 1-4 Stressor-response model for the proposed finfish production .................................................... 11 Figure 2-1 Conceptual diagram of water quality and sediment quality monitoring sites
including references sites for production up to 20,000 tonnes per annum. ................................ 17
List of Tables
Table 1-1 Environmental Values and Environmental Quality Objectives for WA’s coastal waters
(EPA 2005a) 6
Table 1-2 Levels of Ecological Protection for EQ01: Maintenance of ecosystem integrity (EPA 2000,
2005a) 7
Table 1-3 Overview of environmental factors and objectives associated with the Zone (EPA 2013) 9
Table 2-1 Water quality indicators to be measured 15
Table 2-2 Sampling regime for water and sediment quality indicators for various scales of
production) 16
Table 2-3 Geographical location of the fixed Reference Sites 17
Table 2-4 EQG for water quality 20
Table 2-5 EQS for water quality 21
Table 2-6 Sediment quality indicators to be measured 22
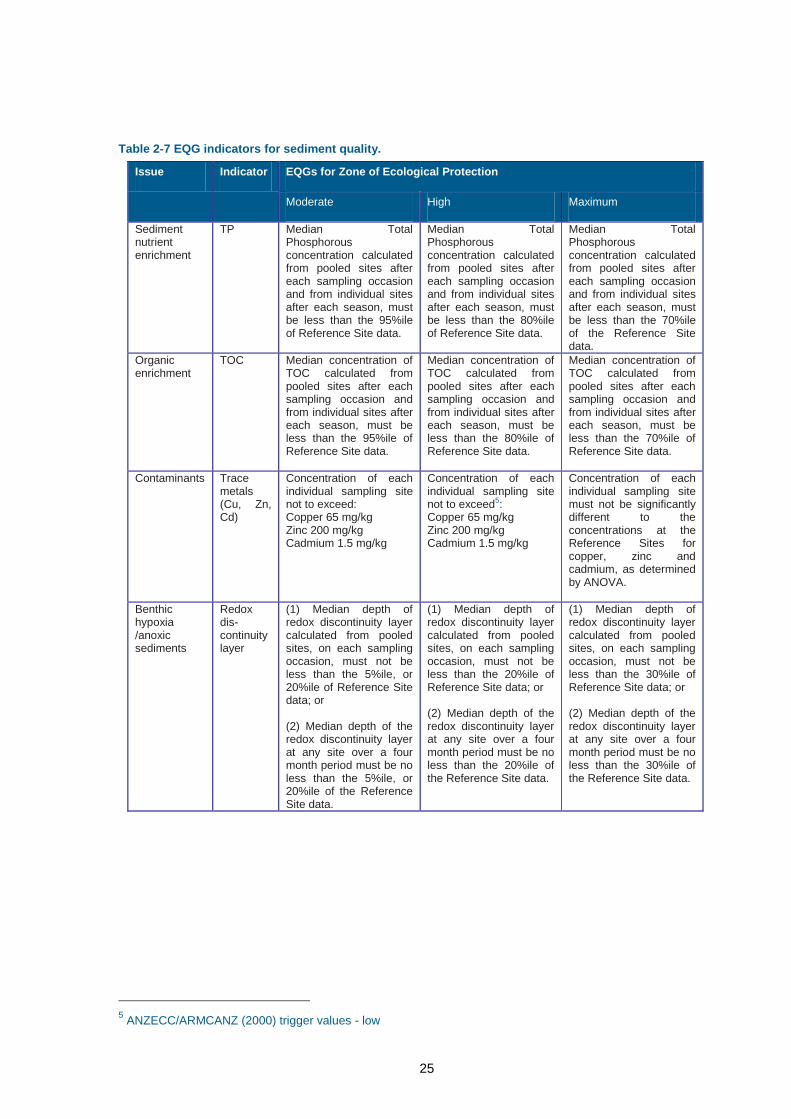
Table 2-7 EQG indicators for sediment quality 24
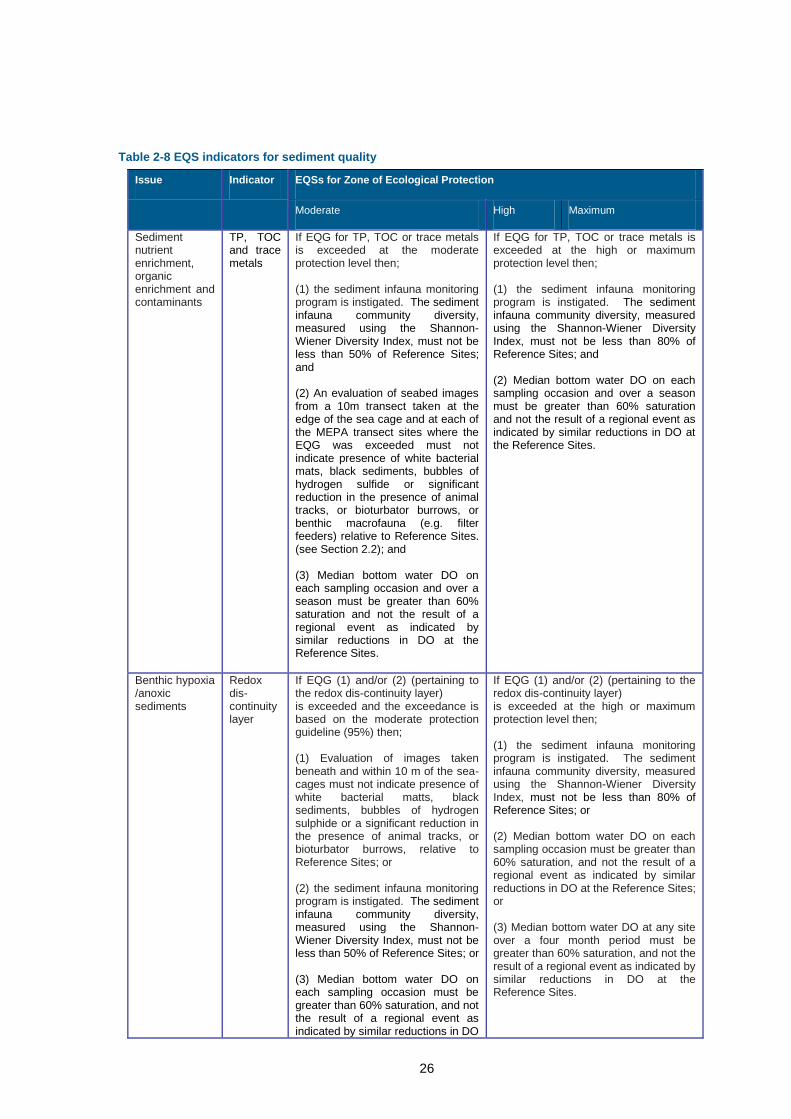
Table 2-8 EQS indicators for sediment quality 25
4
1 Background
The proposal to establish a Kimberley Aquaculture Development Zone (Zone) has
been referred to the Western Australian Environmental Protection Authority (EPA) by
the Western Australian Department of Fisheries (DoF) for strategic environmental
impact assessment under Part IV, Division 1 of the WA Environmental Protection Act
1986 (EP Act). In the event the proposal is determined environmentally acceptable,
future aquaculture proposals within the Zone will be subject to strategic approval
conditions and referred to the EPA as derived proposals.
The EPA has indicated that a condition for environmental approval of the Zone is the
preparation of an Environmental Monitoring & Management Plan (EMMP) for up to
20,000 tonnes of finfish production per annum in Cone Bay, which includes the
practical implementation of the Environmental Quality Management Framework
(EQMF) (EPA 2005a). The EMMP needs to ensure environmental quality and
ecological integrity are maintained within acceptable limits when the total fish
production reaches maximum capacity.
This EMMP document has been developed to meet EPA’s requirements and ensure
appropriate environmental management practices are followed by aquaculture
operators in the Zone. Adherence to the EMMP will ensure commitments given at the
project’s planning and assessment stage are carried out during the operational stage.
In addition, it is acknowledged that any EMMP should be flexible in that the amount of
sampling and reporting reflects the potential impact on the environment and that this
impact relates to the magnitude and the location of future finfish production units. This
EMMP has been designed specifically for the Zone location and takes into account
monitoring data from an existing operation and the results from the extensive
hydrodynamic and ecological modelling. A comprehensive baseline water and
sediment quality analysis has been completed to inform this strategic proposal and
future management measures for the Zone.
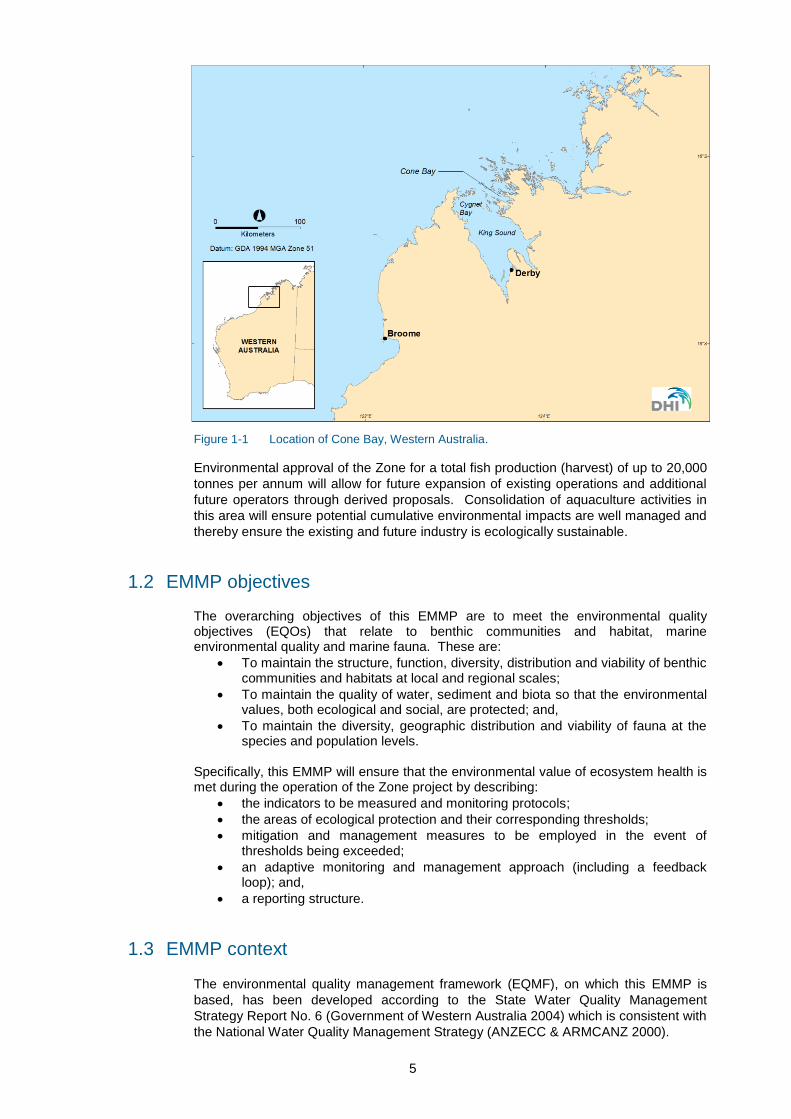
Project description 1.1
The Zone proposal involves marine finfish aquaculture in sea cages in Cone Bay,
which is located approximately 215 kilometres north-north-east of Broome in Western
Australia (Figure 1-1). The waters of Cone Bay are typical of the Kimberley region with
high turbidity, low wave energy and a macrotidal regime that creates high current
velocities.
5
Figure 1-1 Location of Cone Bay, Western Australia.
Environmental approval of the Zone for a total fish production (harvest) of up to 20,000
tonnes per annum will allow for future expansion of existing operations and additional
future operators through derived proposals. Consolidation of aquaculture activities in
this area will ensure potential cumulative environmental impacts are well managed and
thereby ensure the existing and future industry is ecologically sustainable.
EMMP objectives 1.2
The overarching objectives of this EMMP are to meet the environmental quality objectives (EQOs) that relate to benthic communities and habitat, marine environmental quality and marine fauna. These are:
To maintain the structure, function, diversity, distribution and viability of benthic communities and habitats at local and regional scales;
To maintain the quality of water, sediment and biota so that the environmental values, both ecological and social, are protected; and,
To maintain the diversity, geographic distribution and viability of fauna at the species and population levels.
Specifically, this EMMP will ensure that the environmental value of ecosystem health is met during the operation of the Zone project by describing:
the indicators to be measured and monitoring protocols;
the areas of ecological protection and their corresponding thresholds;
mitigation and management measures to be employed in the event of thresholds being exceeded;
an adaptive monitoring and management approach (including a feedback loop); and,
a reporting structure.
EMMP context 1.3
The environmental quality management framework (EQMF), on which this EMMP is
based, has been developed according to the State Water Quality Management
Strategy Report No. 6 (Government of Western Australia 2004) which is consistent with
the National Water Quality Management Strategy (ANZECC & ARMCANZ 2000).
6
The Environmental Values (EV) and Environmental Quality Objectives (EQO), as
outlined by the Government of Western Australia (2004) and the EPA (2005a, 2005b)
that apply to WA’s coastal waters are provided in Table 1-1.
The EVs are “particular values or uses of the environment that are important for a
healthy ecosystem or for public benefit, welfare, safety or health, and which require
protection from the effects of pollution, waste discharges and deposits”. The EQOs
represent the primary management goals that need to be achieved to protect the EVs.
Table 1-1 Environmental Values and Environmental Quality Objectives for WA’s coastal waters (EPA
2005a).
Environmental Value Environmental Quality Objective
Ecosystem Health EQ01 Maintenance of ecosystem integrity (naturally diverse and
healthy ecosystems)
Fishing and Aquaculture EQ02 Maintenance of aquatic life for human consumption (seafood
safe to eat)
Recreation and Aesthetics
EQ03 Maintenance of primary contact recreation values (waters safe
for swimming)
EQ04 Maintenance of secondary contact recreation values (waters
safe for boating)
EQ05 Maintenance of aesthetic values (pleasant, attractive
environment)
Industrial Water Supply EQ06 Maintenance of water suitable for industry use (water suitable
for industry use)
Cultural and Spiritual Values EQ07 Maintenance of cultural and spiritual value (environmental
amenities of cultural importance)
All the EVs and EQOs listed in Table1-1 need to be protected and achieved within
Cone Bay and surrounding environment.
This EMMP has been designed to protect Ecosystem Health as described by EQO1:
maintenance of ecosystem integrity. Ecosystem integrity is defined as a naturally
diverse and healthy ecosystem. The Environmental Quality Criteria (EQC) for this
environmental value, are especially conservative. Thus by meeting the EQC it is
considered that all five environmental values above are protected.
The environmental requirements for EQO1 vary spatially according to the level of ecological protection assigned to an area (EPA 2000; EPA 2005a). Three levels of ecological protection relevant to this EMMP are described in Table 1-2.
7
Table 1-2 Levels of Ecological Protection for EQ01: Maintenance of ecosystem integrity (EPA 2000,
2005a).
Level of ecological
protection
Contaminant
concentration indicators
Limit of acceptable change
Maximum protection No contaminants – pristine No detectable changes from natural
variation
High protection Very low levels of
contaminants
Some small changes in the quality of
water, sediment or biota but no detectable
changes (beyond natural variation) in the
diversity of species and biological
communities, ecosystem processes and
abundance/biomass of marine life.
Moderate protection Elevated levels of
contaminants
Moderate changes in the quality of water,
sediment and biota that cause small
changes in ecosystem processes and
abundance/biomass of marine life, but no
detectable changes from the natural
diversity of species and biological
communities.
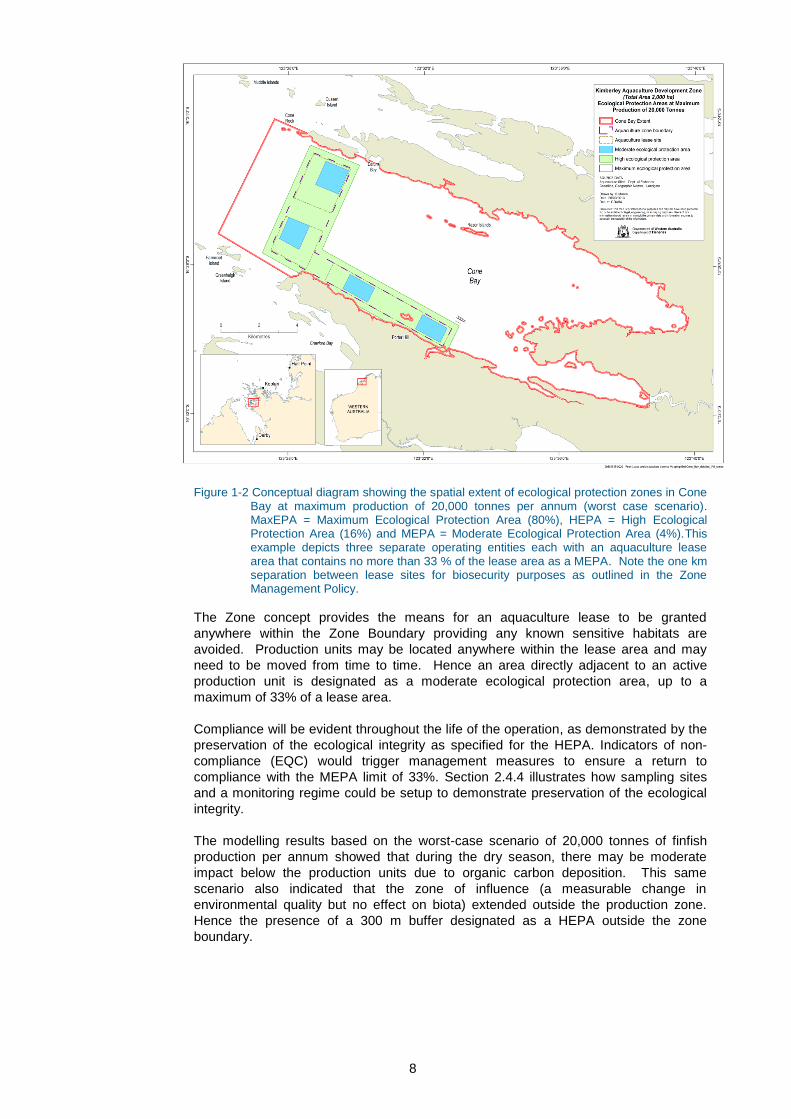
EQO1 will apply throughout Cone Bay. Cone Bay has been defined as an area of
14,859 hectares with a proposed aquaculture production zone of 2000 ha occupying
13% of the Bay. To meet this objective and maintain a healthy and diverse ecosystem,
80% of Cone Bay has been designated a maximum ecological protection zone. The
areas both immediately outside the aquaculture zone boundary and inside the zone
boundary that are not directly adjacent to the production units have been assigned as a
high ecological protection area. At maximum production capacity of 20,000 tonnes per
annum the high protection area will occupy 16% of Cone Bay. Within the future lease
boundaries, a maximum of 33% of the actual lease area has been designated a
moderate level of ecological protection, and with the entire Zone under production will
equate to a maximum of 4% of Cone Bay. Figure 1-2 provides a diagrammatic
representation of the ecological protection areas that will apply when zone production
reaches 20,000 tonnes per annum which is the worst case scenario in terms of
potential environmental impact.
8
Figure 1-2 Conceptual diagram showing the spatial extent of ecological protection zones in Cone Bay at maximum production of 20,000 tonnes per annum (worst case scenario). MaxEPA = Maximum Ecological Protection Area (80%), HEPA = High Ecological Protection Area (16%) and MEPA = Moderate Ecological Protection Area (4%).This example depicts three separate operating entities each with an aquaculture lease area that contains no more than 33 % of the lease area as a MEPA. Note the one km separation between lease sites for biosecurity purposes as outlined in the Zone Management Policy.
The Zone concept provides the means for an aquaculture lease to be granted
anywhere within the Zone Boundary providing any known sensitive habitats are
avoided. Production units may be located anywhere within the lease area and may
need to be moved from time to time. Hence an area directly adjacent to an active
production unit is designated as a moderate ecological protection area, up to a
maximum of 33% of a lease area.
Compliance will be evident throughout the life of the operation, as demonstrated by the
preservation of the ecological integrity as specified for the HEPA. Indicators of non-
compliance (EQC) would trigger management measures to ensure a return to
compliance with the MEPA limit of 33%. Section 2.4.4 illustrates how sampling sites
and a monitoring regime could be setup to demonstrate preservation of the ecological
integrity.
The modelling results based on the worst-case scenario of 20,000 tonnes of finfish
production per annum showed that during the dry season, there may be moderate
impact below the production units due to organic carbon deposition. This same
scenario also indicated that the zone of influence (a measurable change in
environmental quality but no effect on biota) extended outside the production zone.
Hence the presence of a 300 m buffer designated as a HEPA outside the zone
boundary.
9
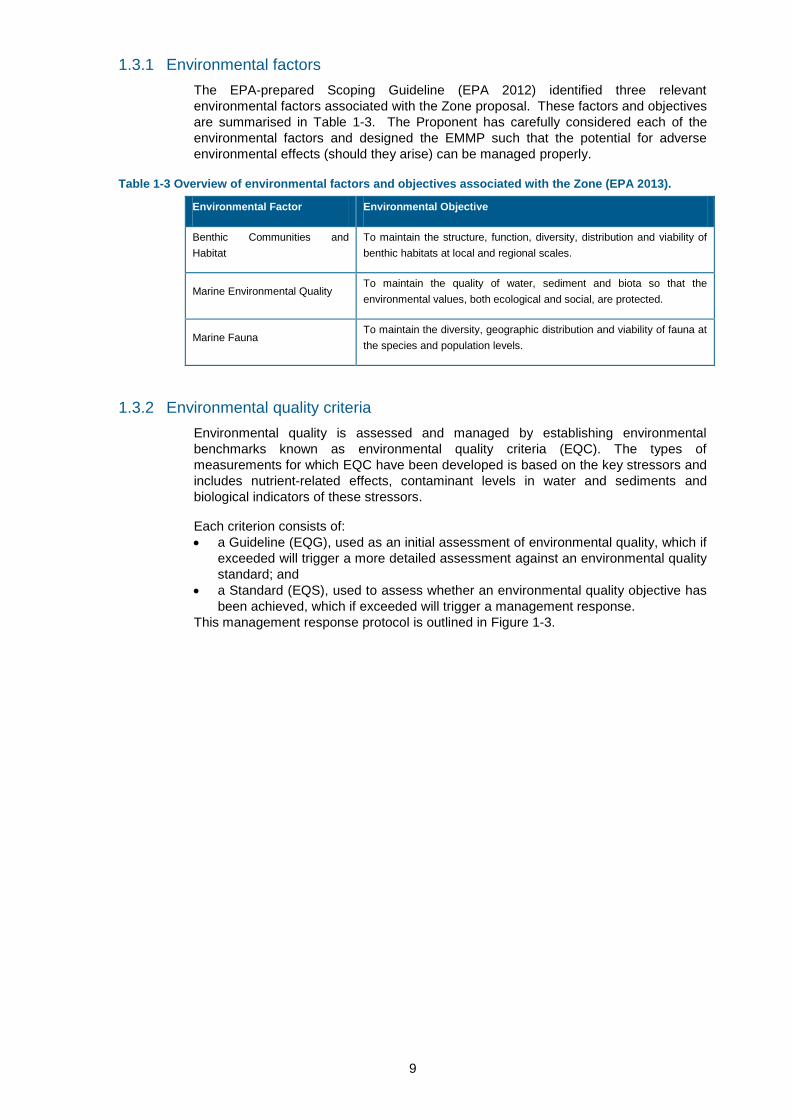
1.3.1 Environmental factors
The EPA-prepared Scoping Guideline (EPA 2012) identified three relevant
environmental factors associated with the Zone proposal. These factors and objectives
are summarised in Table 1-3. The Proponent has carefully considered each of the
environmental factors and designed the EMMP such that the potential for adverse
environmental effects (should they arise) can be managed properly.
Table 1-3 Overview of environmental factors and objectives associated with the Zone (EPA 2013).
Environmental Factor Environmental Objective
Benthic Communities and
Habitat
To maintain the structure, function, diversity, distribution and viability of
benthic habitats at local and regional scales.
Marine Environmental Quality To maintain the quality of water, sediment and biota so that the
environmental values, both ecological and social, are protected.
Marine Fauna To maintain the diversity, geographic distribution and viability of fauna at
the species and population levels.
1.3.2 Environmental quality criteria
Environmental quality is assessed and managed by establishing environmental
benchmarks known as environmental quality criteria (EQC). The types of
measurements for which EQC have been developed is based on the key stressors and
includes nutrient-related effects, contaminant levels in water and sediments and
biological indicators of these stressors.
Each criterion consists of:
a Guideline (EQG), used as an initial assessment of environmental quality, which if
exceeded will trigger a more detailed assessment against an environmental quality
standard; and
a Standard (EQS), used to assess whether an environmental quality objective has
been achieved, which if exceeded will trigger a management response.
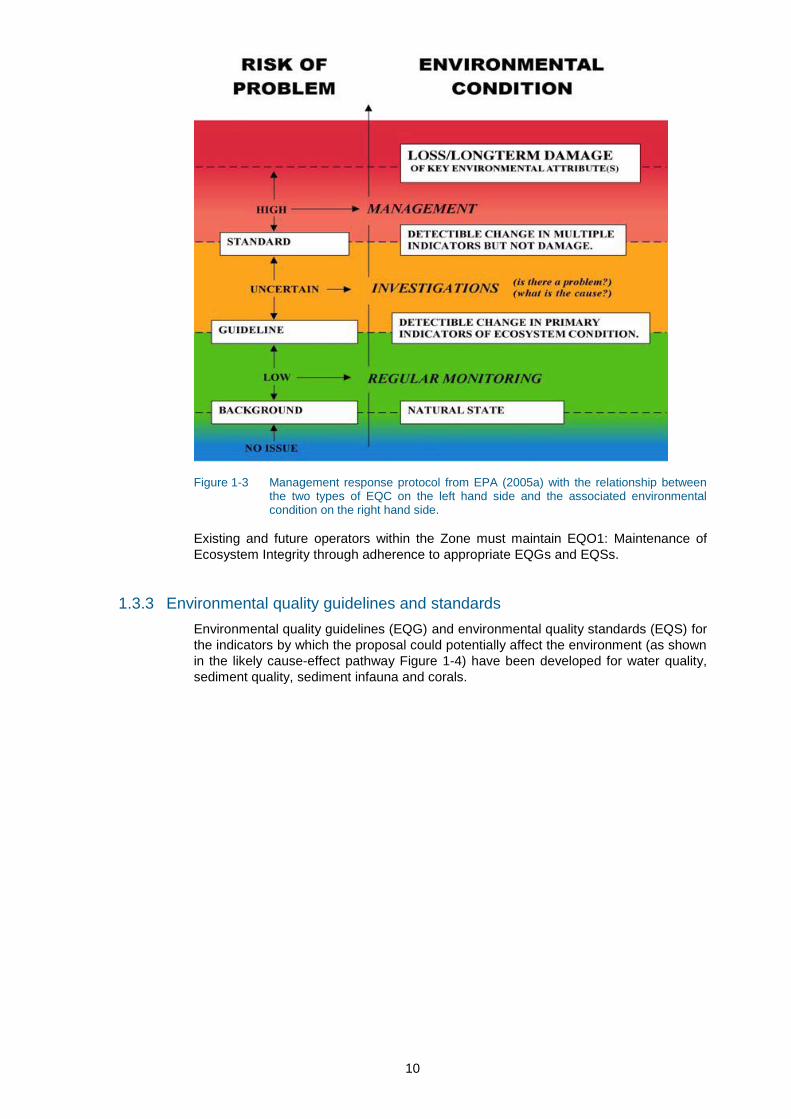
This management response protocol is outlined in Figure 1-3.
10
Figure 1-3 Management response protocol from EPA (2005a) with the relationship between the two types of EQC on the left hand side and the associated environmental condition on the right hand side.
Existing and future operators within the Zone must maintain EQO1: Maintenance of
Ecosystem Integrity through adherence to appropriate EQGs and EQSs.
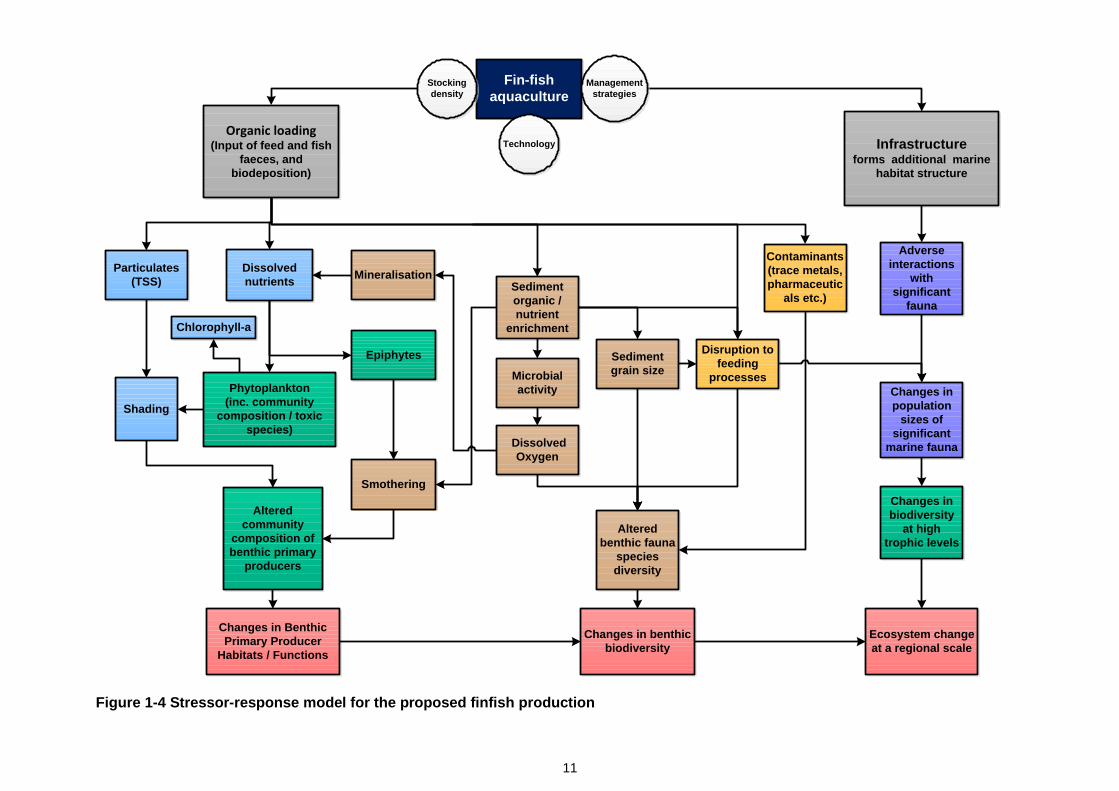
1.3.3 Environmental quality guidelines and standards
Environmental quality guidelines (EQG) and environmental quality standards (EQS) for
the indicators by which the proposal could potentially affect the environment (as shown
in the likely cause-effect pathway Figure 1-4) have been developed for water quality,
sediment quality, sediment infauna and corals.
11
Figure 1-4 Stressor-response model for the proposed finfish production
Fin-fish
aquaculture
Dissolved
nutrients
Particulates
(TSS) Sediment
organic /
nutrient
enrichment
Microbial
activity
Dissolved
Oxygen
Shading
Phytoplankton
(inc. community
composition / toxic
species)
Epiphytes
Smothering
Mineralisation
Disruption to
feeding
processes
Altered
benthic fauna
species
diversity
Sediment
grain size
Altered
community
composition of
benthic primary
producers
Changes in benthic
biodiversity
Organic loading(Input of feed and fish
faeces, and
biodeposition)
Changes in Benthic
Primary Producer
Habitats / Functions
Changes in
population
sizes of
significant
marine fauna
Infrastructure
forms additional marine
habitat structure
Adverse
interactions
with
significant
fauna
Changes in
biodiversity
at high
trophic levels
Ecosystem change
at a regional scale
Technology
Management
strategies
Contaminants
(trace metals,
pharmaceutic
als etc.)
Chlorophyll-a
Stocking
density
12
EQGs were selected to reflect early warning stressors and effects of the proposed
aquaculture production, whereas EQS were selected to assess changes and impacts on
relevant habitats and receptors; for example, sediment infauna and corals. The selection of
EQGs was guided by the impact prediction conducted in connection with the EIS (DHI
2013) and an assessment of monitoring data from an existing aquaculture operation.
This monitoring design considers the nature of the expected impact in the Cone Bay
location and was guided by the principles outlined in the Manual of Standard Operating
Procedures for Environmental Monitoring against the Cockburn Sound Environmental
Quality Criteria (EPA, 2005b). The monitoring program has also taken into account advice
from the OEPA and research scientists from the DoF research division.
The monitoring program presented here is a BACI design which is commonly used for
impact studies to determine potential changes brought about by a specific activity or
stressor. Data are collected on multiple occasions from both before (extensive baseline
data) and after impact with both impact and control sites.
2 Environmental monitoring program
The EMMP’s marine monitoring program is designed to deal with a total fish production of
up to 20,000 tonnes per annum, with production units (cage farms) deployed across the
Zone. It is unlikely the production area will be utilized to full capacity in the short to medium
term; accordingly, the monitoring program has been designed to allow for a level of
monitoring commensurate with various scales of production.
The monitoring program in this EMMP addresses:
water quality
sediment quality
sediment in-fauna community monitoring and
marine fauna interactions.
This monitoring program does not include monitoring of pharmaceuticals as they are
currently not being used for finfish in the existing operation. It is highly unlikely
pharmaceuticals will be used in the sea cages; in the event they are used in the future, they
will be monitored through the cause and effect pathways through the development and
introduction of a monitoring program for this potential stressor. Under the Zone
Management Policy, any future use of pharmaceuticals must be prescribed by a
veterinarian or approved by the Australian Pesticides and Veterinary Medicines Authority
and administered in accordance with the recommended dosage.
Filter feeders are present in the south west portion of the zone. If the EQG for some
indicators is exceeded, images of the seafloor will be taken and an assessment can be
done on potential impacts to these benthic macrofauna. It is considered highly unlikely that
filter feeders will be impacted, even in the event an aquaculture operation is approved over
this area, given the water depth and strong currents in this part of the Zone.
Environmental management plan implementation 2.1
Following strategic environmental approval by the EPA, the monitoring program described
in this EMMP should be initiated and/or changed when:
Proponents have received environmental approval as a derived proposal: and,
When the biomass reaches the levels described in this EMMP (ie. 5,000, 10,000,
and 20,000 tonnes).
13
The EMMP has been developed to monitor the EQG and EQS for the moderate (MEPA),
high (HEPA) and maximum (MaxEPA) ecological protection areas. The approach has two
purposes: to provide relevant data for assessment of the EQG and EQS in the relevant
ecological protection area; and to measure the extent of the stressor and impact gradient
downstream of the production units.
Water and sediment quality – data handling and calculations 2.2
Sample medians will be calculated after each sampling occasion and at the completion of each season’s sampling (ie. on completion of the four month sampling period). Assessment of the EQG at the completion of each sampling occasion allows for reactive management in response to ambient effects, whereas, assessment of the EQG after each season allows for management of site specific effects.
Calculation after each sampling occasion For sites positioned in the MEPA, HEPA and MaxEPA, the values obtained from the respective ecological protection areas will be pooled and sample medians calculated. EQG and relevant percentiles must be calculated after each sampling occasion. In the event the EQG is exceeded, replicate samples (where practical for some indicators) will be analysed. If the EQG is still exceeded following re-analysis, then monitoring must be undertaken against the relevant EQS.
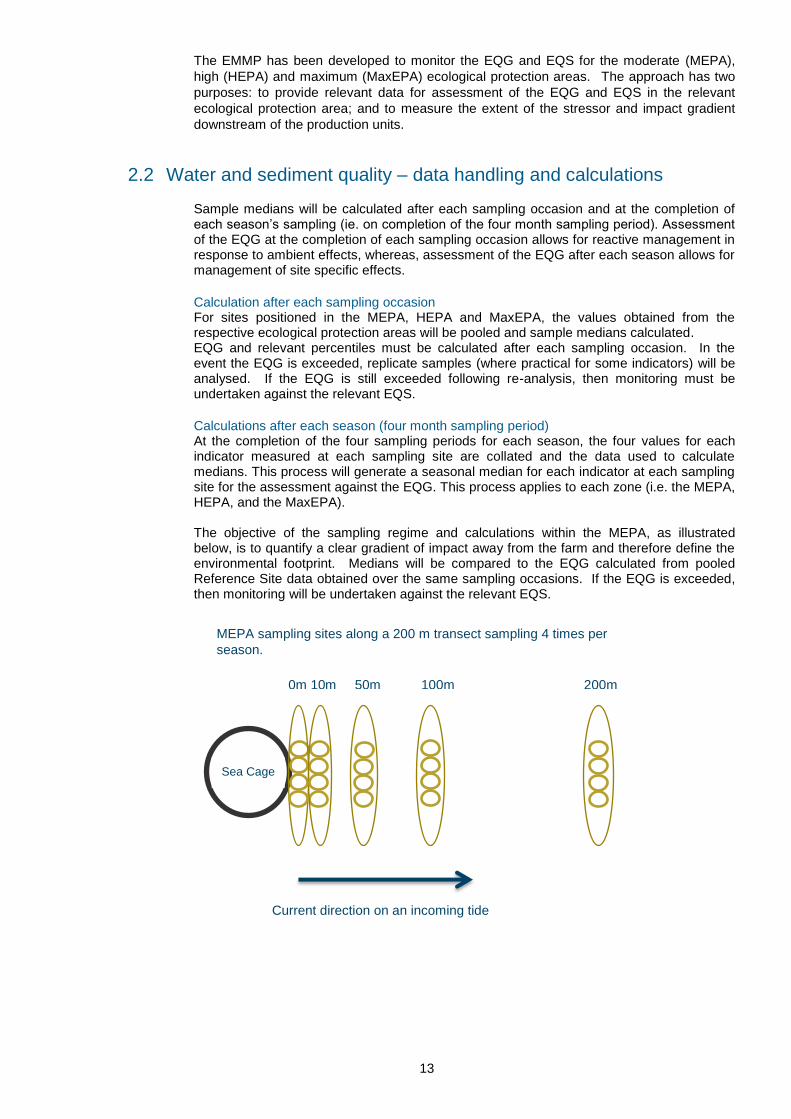
Calculations after each season (four month sampling period) At the completion of the four sampling periods for each season, the four values for each indicator measured at each sampling site are collated and the data used to calculate medians. This process will generate a seasonal median for each indicator at each sampling site for the assessment against the EQG. This process applies to each zone (i.e. the MEPA, HEPA, and the MaxEPA). The objective of the sampling regime and calculations within the MEPA, as illustrated below, is to quantify a clear gradient of impact away from the farm and therefore define the environmental footprint. Medians will be compared to the EQG calculated from pooled Reference Site data obtained over the same sampling occasions. If the EQG is exceeded, then monitoring will be undertaken against the relevant EQS.
Sea Cage
0m 10m 50m 100m 200m
Current direction on an incoming tide
MEPA sampling sites along a 200 m transect sampling 4 times per
season.
(vertical ovals show which sites are to be pooled for data calculations)
14
Infauna – data handling and calculations 2.3
Upon exceeding an EQG for TSS (LOI), DIN, TP, TOC or trace metals, the operators will
undertake sediment infauna sampling.
Results from the laboratory should include a list of all identified taxa and their abundance at
each sampling site. To enable assessment and reporting on any changes in infauna
diversity, including loss of species between the impacted sites and Reference Sites, a
presence or absence of species summary must be conducted and the Shannon-Wiener
diversity index calculated.
The Shannon-Wiener diversity index provides more information about community
composition than simply species richness (ie. number of species present); it also takes the
relative abundances of different species into account. For example, a halving of the
Shannon-Wiener Index relative to the Reference Sites is considered to be indicative of
moderate effects. In the HEPA and MaxEPA, however, the objective is that there will be no
detectable changes (beyond natural variation) in the diversity of biological communities and
the diversity index must therefore be within 20% of the Reference Sites to allow for natural
variation and standard error.
To calculate the Shannon-Wiener Diversity Index, the proportion of species (i) relative to the
total number of species (pi) is calculated, then multiplied by the natural logarithm of this
proportion (lnpi). The resulting product is summed across species and multiplied by -1:
Shannon-Wiener Diversity Index = - Σ (pi x lnpi)
A high index value represents a diverse and equally distributed infauna community and
lower values represent a less diverse community (e.g. a value of 0 would represent a
community with just one species). The DoF has developed a template for these
calculations should operators need assistance.
Water quality monitoring 2.4
2.4.1 Objectives
The objective of the water quality monitoring program is to ensure water quality is
maintained to acceptable standards and thus whether the EQC have been met in the MEPA
and at the boundaries of the HEPA and the MaxEPA. EQGs and EQSs have been
developed for each indicator (see Tables 2.4 and 2.5).
2.4.2 Indicators to be monitored
Fish farms discharge both soluble wastes and particulate wastes which may affect water
quality and therefore the water quality monitoring program includes the following indicators:
total suspended solids (TSS) (LOI), dissolved oxygen (DO), dissolved inorganic nitrogen
(DIN) (comprising ammonia, nitrite and nitrate) and chlorophyll-a to be measured on each
sampling occasion (Table 2-1).
15
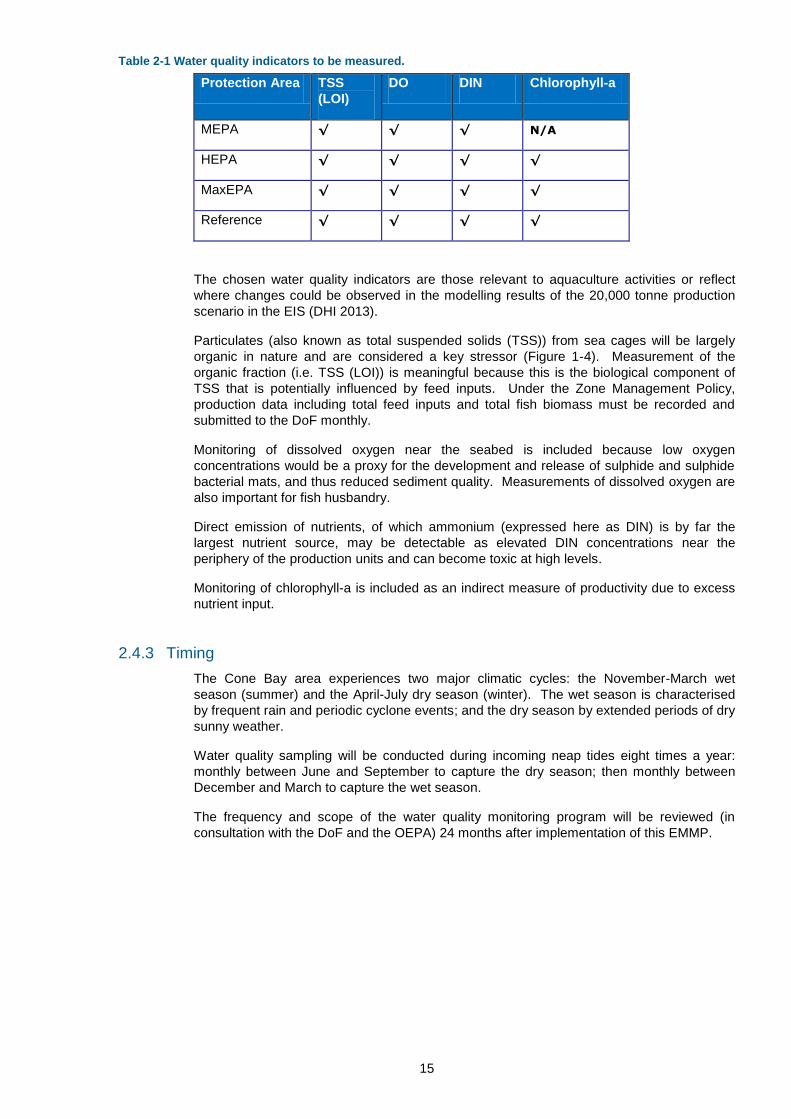
Table 2-1 Water quality indicators to be measured.
Protection Area TSS
(LOI)
DO DIN Chlorophyll-a
MEPA √ √ √ N/A
HEPA √ √ √ √
MaxEPA √ √ √ √
Reference √ √ √ √
The chosen water quality indicators are those relevant to aquaculture activities or reflect
where changes could be observed in the modelling results of the 20,000 tonne production
scenario in the EIS (DHI 2013).
Particulates (also known as total suspended solids (TSS)) from sea cages will be largely
organic in nature and are considered a key stressor (Figure 1-4). Measurement of the
organic fraction (i.e. TSS (LOI)) is meaningful because this is the biological component of
TSS that is potentially influenced by feed inputs. Under the Zone Management Policy,
production data including total feed inputs and total fish biomass must be recorded and
submitted to the DoF monthly.
Monitoring of dissolved oxygen near the seabed is included because low oxygen
concentrations would be a proxy for the development and release of sulphide and sulphide
bacterial mats, and thus reduced sediment quality. Measurements of dissolved oxygen are
also important for fish husbandry.
Direct emission of nutrients, of which ammonium (expressed here as DIN) is by far the
largest nutrient source, may be detectable as elevated DIN concentrations near the
periphery of the production units and can become toxic at high levels.
Monitoring of chlorophyll-a is included as an indirect measure of productivity due to excess
nutrient input.
2.4.3 Timing
The Cone Bay area experiences two major climatic cycles: the November-March wet
season (summer) and the April-July dry season (winter). The wet season is characterised
by frequent rain and periodic cyclone events; and the dry season by extended periods of dry
sunny weather.
Water quality sampling will be conducted during incoming neap tides eight times a year:
monthly between June and September to capture the dry season; then monthly between
December and March to capture the wet season.
The frequency and scope of the water quality monitoring program will be reviewed (in
consultation with the DoF and the OEPA) 24 months after implementation of this EMMP.
16
2.4.4 Sampling regime and sites
The water quality sampling regime per sampling occasion1 for various scales of production
up to 20,000 tonnes is shown in Table 2-2.
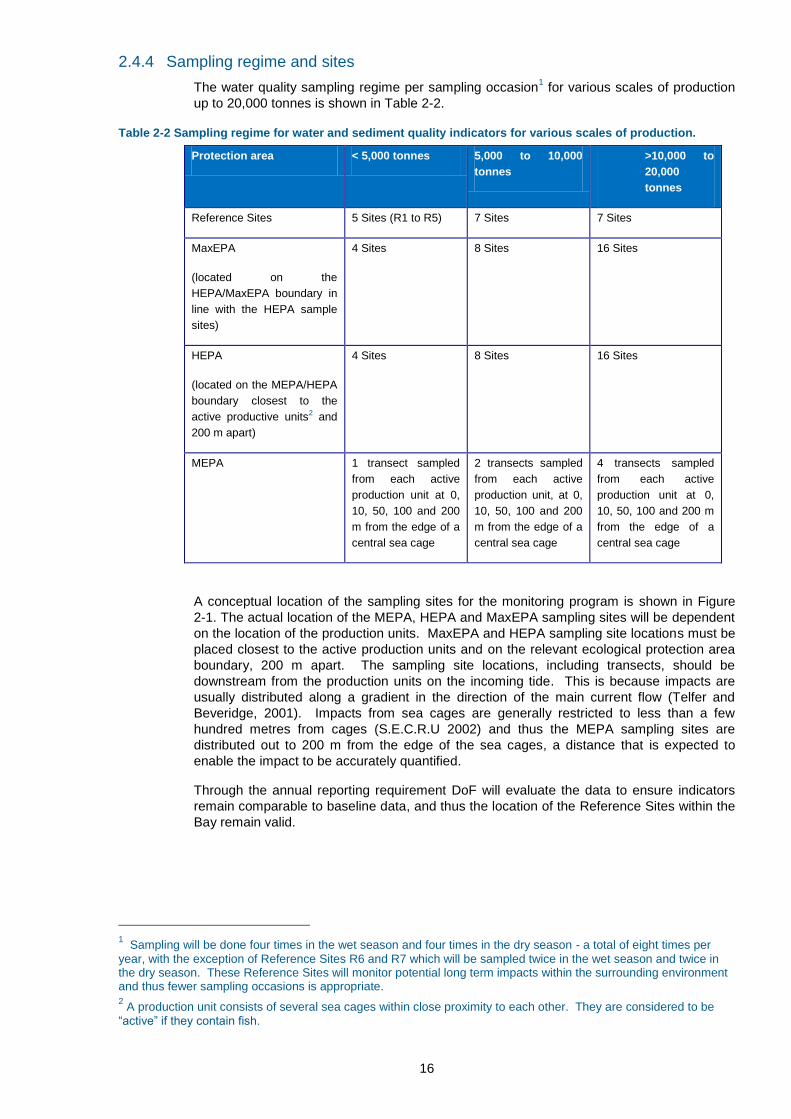
Table 2-2 Sampling regime for water and sediment quality indicators for various scales of production.
Protection area < 5,000 tonnes 5,000 to 10,000
tonnes
>10,000 to
20,000
tonnes
Reference Sites 5 Sites (R1 to R5) 7 Sites 7 Sites
MaxEPA
(located on the
HEPA/MaxEPA boundary in
line with the HEPA sample
sites)
4 Sites 8 Sites 16 Sites
HEPA
(located on the MEPA/HEPA
boundary closest to the
active productive units2 and
200 m apart)
4 Sites 8 Sites 16 Sites
MEPA 1 transect sampled
from each active
production unit at 0,
10, 50, 100 and 200
m from the edge of a
central sea cage
2 transects sampled
from each active
production unit, at 0,
10, 50, 100 and 200
m from the edge of a
central sea cage
4 transects sampled
from each active
production unit at 0,
10, 50, 100 and 200 m
from the edge of a
central sea cage
A conceptual location of the sampling sites for the monitoring program is shown in Figure
2-1. The actual location of the MEPA, HEPA and MaxEPA sampling sites will be dependent
on the location of the production units. MaxEPA and HEPA sampling site locations must be
placed closest to the active production units and on the relevant ecological protection area
boundary, 200 m apart. The sampling site locations, including transects, should be
downstream from the production units on the incoming tide. This is because impacts are
usually distributed along a gradient in the direction of the main current flow (Telfer and
Beveridge, 2001). Impacts from sea cages are generally restricted to less than a few
hundred metres from cages (S.E.C.R.U 2002) and thus the MEPA sampling sites are
distributed out to 200 m from the edge of the sea cages, a distance that is expected to
enable the impact to be accurately quantified.
Through the annual reporting requirement DoF will evaluate the data to ensure indicators
remain comparable to baseline data, and thus the location of the Reference Sites within the
Bay remain valid.
1 Sampling will be done four times in the wet season and four times in the dry season - a total of eight times per
year, with the exception of Reference Sites R6 and R7 which will be sampled twice in the wet season and twice in the dry season. These Reference Sites will monitor potential long term impacts within the surrounding environment and thus fewer sampling occasions is appropriate. 2 A production unit consists of several sea cages within close proximity to each other. They are considered to be
“active” if they contain fish.
17
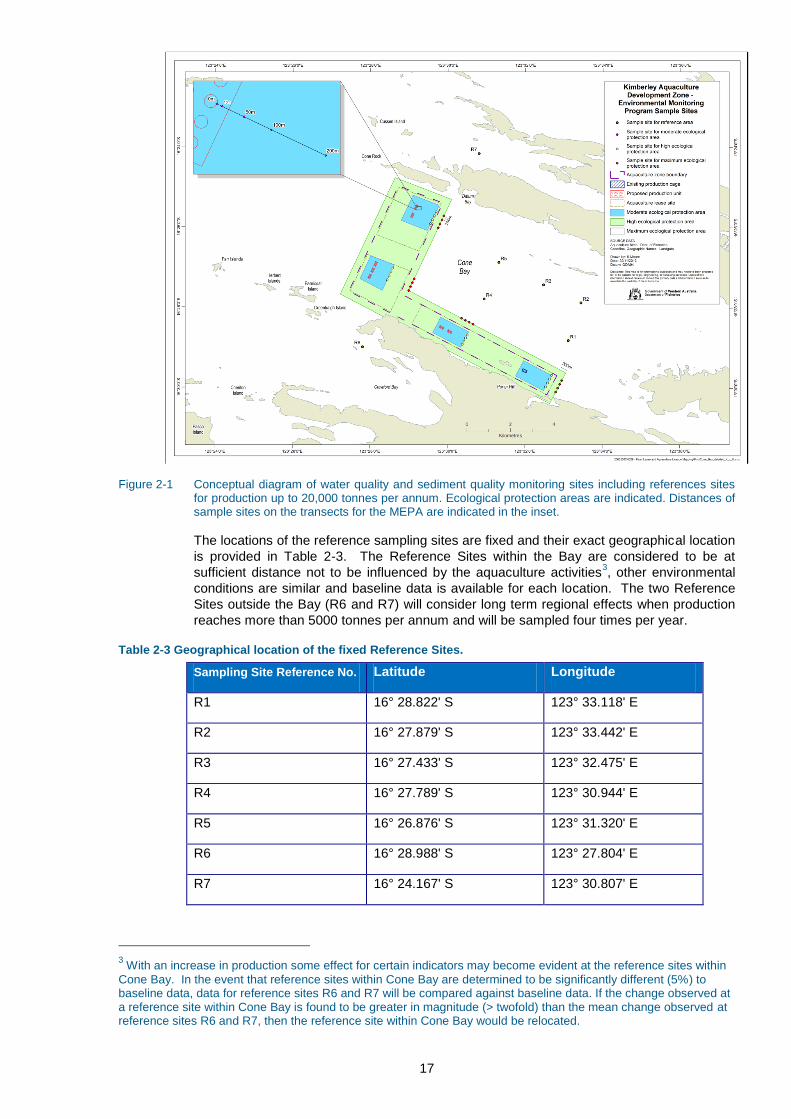
Figure 2-1 Conceptual diagram of water quality and sediment quality monitoring sites including references sites for production up to 20,000 tonnes per annum. Ecological protection areas are indicated. Distances of sample sites on the transects for the MEPA are indicated in the inset.
The locations of the reference sampling sites are fixed and their exact geographical location
is provided in Table 2-3. The Reference Sites within the Bay are considered to be at
sufficient distance not to be influenced by the aquaculture activities3, other environmental
conditions are similar and baseline data is available for each location. The two Reference
Sites outside the Bay (R6 and R7) will consider long term regional effects when production
reaches more than 5000 tonnes per annum and will be sampled four times per year.
Table 2-3 Geographical location of the fixed Reference Sites.
Sampling Site Reference No. Latitude Longitude
R1 16° 28.822' S 123° 33.118' E
R2 16° 27.879' S 123° 33.442' E
R3 16° 27.433' S 123° 32.475' E
R4 16° 27.789' S 123° 30.944' E
R5 16° 26.876' S 123° 31.320' E
R6 16° 28.988' S 123° 27.804' E
R7 16° 24.167' S 123° 30.807' E
3 With an increase in production some effect for certain indicators may become evident at the reference sites within
Cone Bay. In the event that reference sites within Cone Bay are determined to be significantly different (5%) to baseline data, data for reference sites R6 and R7 will be compared against baseline data. If the change observed at a reference site within Cone Bay is found to be greater in magnitude (> twofold) than the mean change observed at reference sites R6 and R7, then the reference site within Cone Bay would be relocated.
18
2.4.5 Methods
Analyses will be undertaken by NATA-accredited laboratories and must take into account
the limit of reporting as defined by the laboratory, including the detection limit (minimum
concentration of an analyte that can be measured above the test background noise) and/or
the quantification limit (minimum concentration of an analyte that can be measured within
specified limits of precision and accuracy). Sample analysis will achieve limit of reporting
(LOR) values equal to or less than the ANZECC/ARMCANZ (2000) water quality guidelines.
Where concentrations are less than the LOR, the LOR will be used in the calculations.
For the purpose of ensuring that water quality sampling is consistent and valid, each
operator must use standard methods advised by the NATA-accredited laboratory that will be
conducting the analysis. For each parameter the operator must seek advice on the method
of sampling; the type of container, filling technique, required quantity, preservation and
holding time. Specifications of each method may be amended over time; however, must be
acceptable to the NATA-accredited laboratory. Importantly, the method of sampling or
analysis must not be modified unless the NATA-accredited laboratory has confirmed that
data generated by the modified method is comparable to historical data.
Dissolved oxygen sampling method Dissolved oxygen measurements will be taken at the seafloor (< 0.2 m above the seafloor)
using an oxygen electrode and recorded as per cent saturation. Five readings should be
taken at each site and the median DO in bottom waters calculated for each site. The
instrument must be calibrated and maintained in accordance with the manufacturer’s
requirements and the procedures documented for future reference and verification.
TSS (LOI), DIN and chlorophyll-a sampling methods Water samples for TSS (LOI), DIN and chlorophyll-a will be collected using Niskin bottles approximately 0.5 m below the sea surface (at the time of sampling) and above the seafloor (<0.5 m above seafloor). Duplicate water sub-samples must also be taken. Sampling bottles must be free of contaminants prior to sampling.
Imagery of the seafloor Prior to stocking sea cages, underwater images of the seafloor and out to 10 m from the
edge of the sea cage along the MEPA transect should be undertaken to provide baseline
data should the EQG for TSS (LOI) or ammonia toxicity be exceeded. If exceeded,
underwater camera or video must be used to capture images, which clearly show the
presence or absence of:
white bacterial mats;
black sediments;
gas bubbles (indicates production of hydrogen sulphide);
animals tracks, bioturbator burrows and, or, benthic macrofauna e.g. filter feeders.
Clear images must be taken along the MEPA transect from the edge of the sea cage and
out to 10 m and at each site (50 m, 100 m and, or, 200 m) where the EQG was exceeded.
At least five minutes of footage and, or, 10 still shots at each sea cage where the EQG was
exceeded is required.
LAC sampling method If the chlorophyll-a EQG is exceeded in the HEPA or MaxEPA, light attenuation
measurements will be conducted simultaneously at two depths with one sensor positioned 1
metre below the surface and the second approximately 7 m below the surface. The light
attenuation coefficient (LAC) will be calculated as the difference between the logarithim10 of
irradiance values at each depth according to the equation:
Light attenuation coefficient (LAC) = (log10I1 – log10I7) /6
19
2.4.6 Environmental water quality guidelines and standards
The EQG indicators for water quality are provided in Table 2.4 and will provide an early
warning of the potential change in the water quality. The EQGs were developed in the
context of the likely cause-effect-pathway shown in Figure 1-4. Monitoring against the EQG
will be undertaken on eight sampling occasions throughout the year and after each seasons
sampling. If the EQG is met, there is a high degree of certainty that the water quality
objective is being achieved. If the guideline is not met there is uncertainty as to whether the
environmental water quality objective has been achieved and a more detailed assessment
against the EQS is required. Thus, monitoring associated with the EQS will proceed only
upon exceeding the EQG.
If any one of the EQS thresholds is exceeded, this indicates that there is a significant risk
that the environmental quality objective is not being achieved and a management response
(as outlined in section 5) to mitigate the impact must be triggered.
If the situation arises where a cage or cages are located within 200 m of the Zone boundary, individual site medians calculated at the end of each season for the MEPA transect sites must also be compared against the HEPA EQG to determine whether the EQGs are likely to be met in the adjacent HEPA.
20
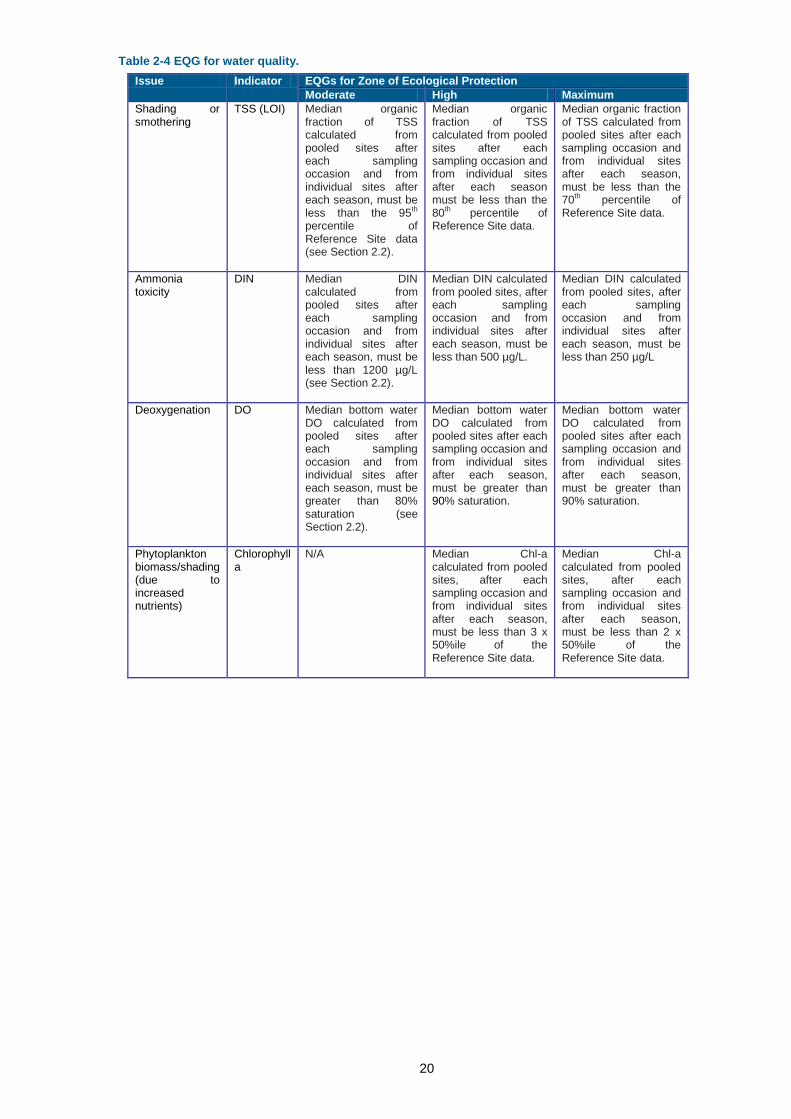
Table 2-4 EQG for water quality.
Issue Indicator EQGs for Zone of Ecological Protection
Moderate High Maximum
Shading or smothering
TSS (LOI) Median organic fraction of TSS calculated from pooled sites after each sampling occasion and from individual sites after each season, must be less than the 95th percentile of Reference Site data (see Section 2.2).
Median organic fraction of TSS calculated from pooled sites after each sampling occasion and from individual sites after each season must be less than the 80th percentile of Reference Site data.
Median organic fraction of TSS calculated from pooled sites after each sampling occasion and from individual sites after each season, must be less than the 70th percentile of Reference Site data.
Ammonia toxicity
DIN Median DIN calculated from pooled sites after each sampling occasion and from individual sites after each season, must be less than 1200 µg/L (see Section 2.2).
Median DIN calculated from pooled sites, after each sampling occasion and from individual sites after each season, must be less than 500 µg/L.
Median DIN calculated from pooled sites, after each sampling occasion and from individual sites after each season, must be less than 250 µg/L
Deoxygenation DO Median bottom water DO calculated from pooled sites after each sampling occasion and from individual sites after each season, must be greater than 80% saturation (see Section 2.2).
Median bottom water DO calculated from pooled sites after each sampling occasion and from individual sites after each season, must be greater than 90% saturation.
Median bottom water DO calculated from pooled sites after each sampling occasion and from individual sites after each season, must be greater than 90% saturation.
Phytoplankton biomass/shading (due to increased nutrients)
Chlorophyll a
N/A Median Chl-a calculated from pooled sites, after each sampling occasion and from individual sites after each season, must be less than 3 x 50%ile of the Reference Site data.
Median Chl-a calculated from pooled sites, after each sampling occasion and from individual sites after each season, must be less than 2 x 50%ile of the Reference Site data.
21
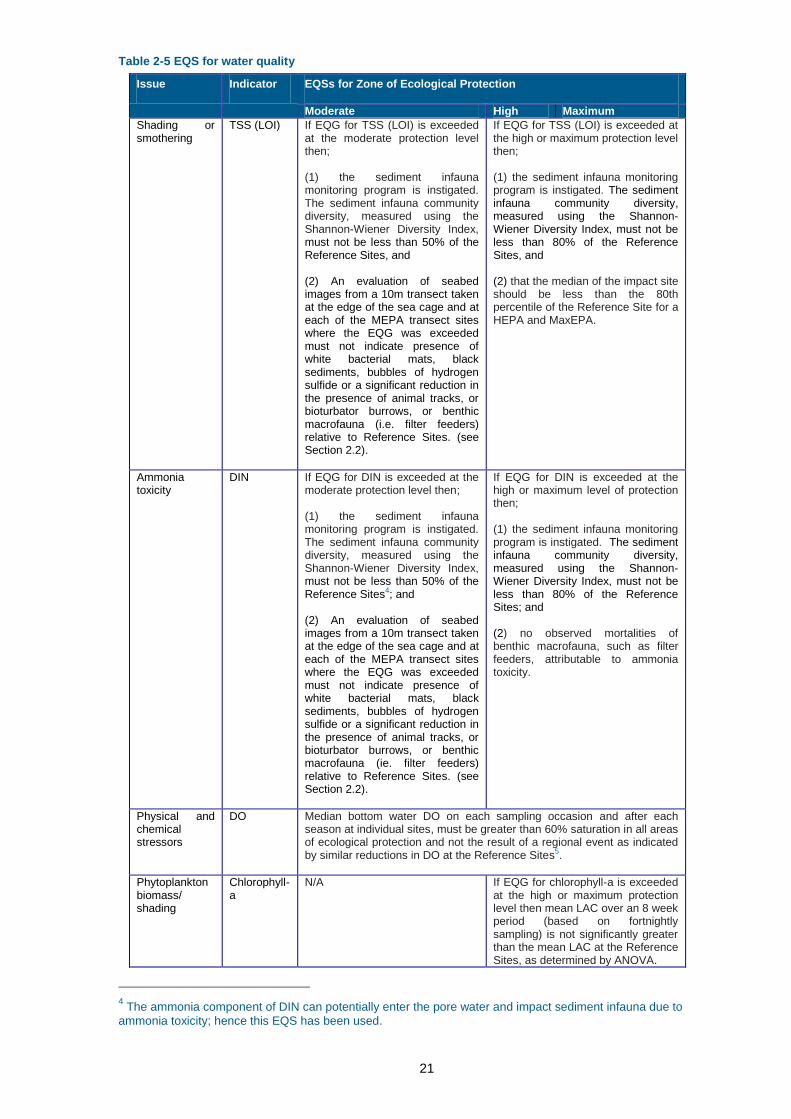
Table 2-5 EQS for water quality
Issue Indicator EQSs for Zone of Ecological Protection
Moderate High Maximum
Shading or smothering
TSS (LOI) If EQG for TSS (LOI) is exceeded at the moderate protection level then; (1) the sediment infauna monitoring program is instigated. The sediment infauna community diversity, measured using the Shannon-Wiener Diversity Index, must not be less than 50% of the Reference Sites, and (2) An evaluation of seabed images from a 10m transect taken at the edge of the sea cage and at each of the MEPA transect sites where the EQG was exceeded must not indicate presence of white bacterial mats, black sediments, bubbles of hydrogen sulfide or a significant reduction in the presence of animal tracks, or bioturbator burrows, or benthic macrofauna (i.e. filter feeders) relative to Reference Sites. (see Section 2.2).
If EQG for TSS (LOI) is exceeded at the high or maximum protection level then; (1) the sediment infauna monitoring program is instigated. The sediment infauna community diversity, measured using the Shannon-Wiener Diversity Index, must not be less than 80% of the Reference Sites, and (2) that the median of the impact site should be less than the 80th percentile of the Reference Site for a HEPA and MaxEPA.
Ammonia toxicity
DIN If EQG for DIN is exceeded at the moderate protection level then; (1) the sediment infauna monitoring program is instigated. The sediment infauna community diversity, measured using the Shannon-Wiener Diversity Index, must not be less than 50% of the Reference Sites4; and (2) An evaluation of seabed images from a 10m transect taken at the edge of the sea cage and at each of the MEPA transect sites where the EQG was exceeded must not indicate presence of white bacterial mats, black sediments, bubbles of hydrogen sulfide or a significant reduction in the presence of animal tracks, or bioturbator burrows, or benthic macrofauna (ie. filter feeders) relative to Reference Sites. (see Section 2.2).
If EQG for DIN is exceeded at the high or maximum level of protection then; (1) the sediment infauna monitoring program is instigated. The sediment infauna community diversity, measured using the Shannon-Wiener Diversity Index, must not be less than 80% of the Reference Sites; and (2) no observed mortalities of benthic macrofauna, such as filter feeders, attributable to ammonia toxicity.
Physical and chemical stressors
DO Median bottom water DO on each sampling occasion and after each season at individual sites, must be greater than 60% saturation in all areas of ecological protection and not the result of a regional event as indicated by similar reductions in DO at the Reference Sites5.
Phytoplankton biomass/ shading
Chlorophyll-a
N/A If EQG for chlorophyll-a is exceeded at the high or maximum protection level then mean LAC over an 8 week period (based on fortnightly sampling) is not significantly greater than the mean LAC at the Reference Sites, as determined by ANOVA.
4 The ammonia component of DIN can potentially enter the pore water and impact sediment infauna due to
ammonia toxicity; hence this EQS has been used.
22
Sediment quality monitoring 2.5
2.5.1 Objectives
The objective of the monitoring is to ensure sediment quality is maintained to acceptable
standards and thus assess whether the EQCs have been met within the ecological
protection zones.
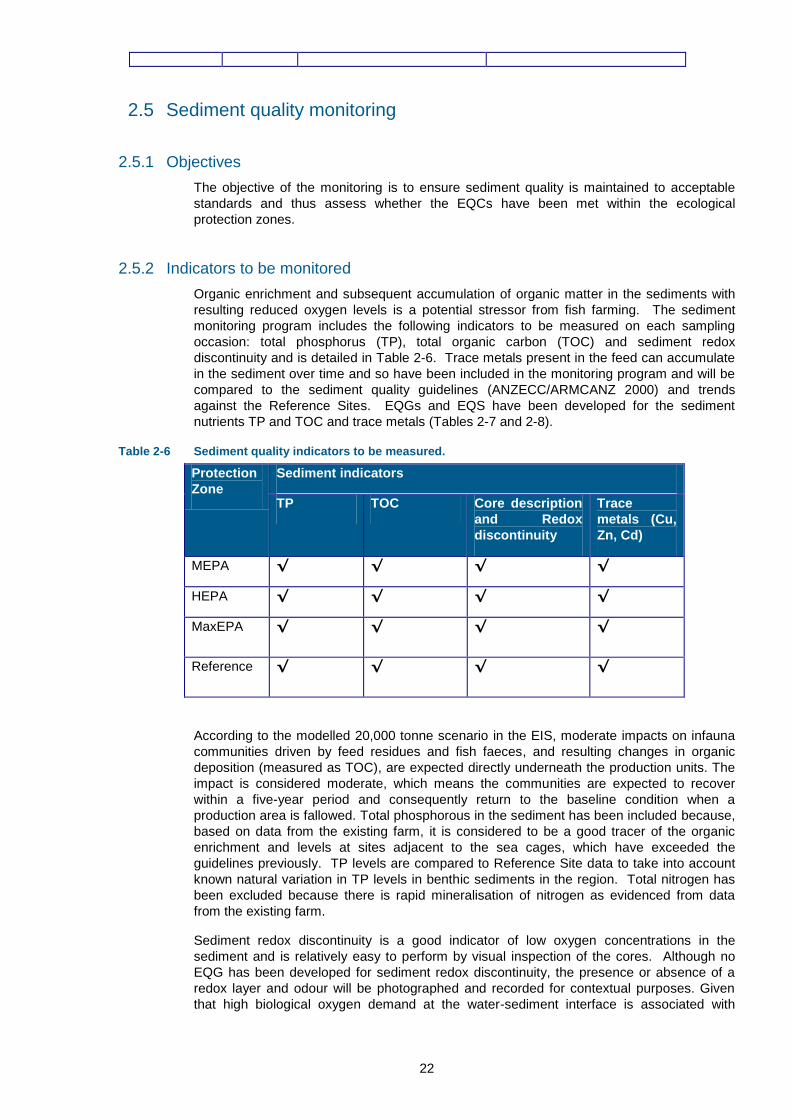
2.5.2 Indicators to be monitored
Organic enrichment and subsequent accumulation of organic matter in the sediments with
resulting reduced oxygen levels is a potential stressor from fish farming. The sediment
monitoring program includes the following indicators to be measured on each sampling
occasion: total phosphorus (TP), total organic carbon (TOC) and sediment redox
discontinuity and is detailed in Table 2-6. Trace metals present in the feed can accumulate
in the sediment over time and so have been included in the monitoring program and will be
compared to the sediment quality guidelines (ANZECC/ARMCANZ 2000) and trends
against the Reference Sites. EQGs and EQS have been developed for the sediment
nutrients TP and TOC and trace metals (Tables 2-7 and 2-8).
Table 2-6 Sediment quality indicators to be measured.
Protection
Zone
Sediment indicators
TP TOC Core description
and Redox
discontinuity
Trace
metals (Cu,
Zn, Cd)
MEPA √ √ √ √
HEPA √ √ √ √
MaxEPA √ √ √ √
Reference √ √ √ √
According to the modelled 20,000 tonne scenario in the EIS, moderate impacts on infauna
communities driven by feed residues and fish faeces, and resulting changes in organic
deposition (measured as TOC), are expected directly underneath the production units. The
impact is considered moderate, which means the communities are expected to recover
within a five-year period and consequently return to the baseline condition when a
production area is fallowed. Total phosphorous in the sediment has been included because,
based on data from the existing farm, it is considered to be a good tracer of the organic
enrichment and levels at sites adjacent to the sea cages, which have exceeded the
guidelines previously. TP levels are compared to Reference Site data to take into account
known natural variation in TP levels in benthic sediments in the region. Total nitrogen has
been excluded because there is rapid mineralisation of nitrogen as evidenced from data
from the existing farm.
Sediment redox discontinuity is a good indicator of low oxygen concentrations in the
sediment and is relatively easy to perform by visual inspection of the cores. Although no
EQG has been developed for sediment redox discontinuity, the presence or absence of a
redox layer and odour will be photographed and recorded for contextual purposes. Given
that high biological oxygen demand at the water-sediment interface is associated with
23
anoxic sediments, depleted oxygen at the benthos will be assessed directly by the EQG for
dissolved oxygen at the bottom of the water column.
Zinc and copper exist in feed pellets as essential elements in fish diets (Sutherland et al.
2001) and increased concentrations of these trace metals in sediments within the vicinity of
fish farms have been reported (Chou et al. 2004). Cadmium is also often present in fish
meal and feed pellets. In addition, baseline concentrations at various locations in Cone Bay
exist for these trace metals and thus they have been chosen as indicators of the
accumulation of trace metals from aquaculture feed.
2.5.3 Timing
Sediments will be sampled at the same time as water quality, during incoming neap tides
eight times per year: four times between June and September to capture the dry season;
and four times between December and March to capture the wet season.
For monitoring of trace metals, extra sediment samples will be collected during the dry
season annually because there are additional baseline data for this time. The baseline
analysis found, however, that there were no significant differences in trace metal
concentrations between seasons.
The frequency and scope of the sediment quality monitoring program will be reviewed (in
consultation with the DoF and the OEPA) 24 months after implementation of this EMMP.
For example, if after two years of annual sampling there is no increase in trace metals, this
indicator may be measured every three years. Alternatively, if the concentration of
monitored trace metals is increasing, consideration will be given to monitoring additional
trace metals that are known to be present in the feed.
2.5.4 Sampling regime and sites
Sampling for sediment quality will take place at the same sites for water monitoring and in
accordance with the level of production outlined in Table 3.2.
2.5.5 Methods
Analyses will be undertaken by NATA-accredited laboratories and must take into account
the limit of reporting as defined by the laboratory, including the detection limit (minimum
concentration of an analyte that can be measured above the test background noise) and, or,
the quantification limit (minimum concentration of an analyte that can be measured within
specified limits of precision and accuracy). Sample analysis will achieve LOR values equal
to or less than the ANZECC/ARMCANZ (2000) sediment quality guidelines. Where
concentrations are less than the LOR, the LOR will be used in the calculations.
For the purpose of ensuring that sediment quality sampling is consistent and valid, each
operator must use standard methods advised by the NATA-accredited laboratory that will be
conducting the analysis. For each parameter the operator must seek advice on the method
of sampling; the type of container, filling technique, required quantity, preservation and
holding time. Specifications of each method may be amended over time; however, must be
acceptable to the NATA-accredited laboratory. Importantly, the method of sampling or
analysis must not be modified unless the NATA-accredited laboratory has confirmed that
data generated by the modified method is comparable to historical data.
At least five core samples incorporating the upper 2 cm of sediment will be taken at each
site. Each of the five (or more) cores will be amalgamated and thoroughly mixed to form one
sample. The number of cores taken to produce a sample should be constant across all
sites and reported. The operator should be aware that a greater number of cores is likely to
be more representative of a site, thereby reducing the risk of sampling extremes in
environmental variability. The operator is strongly encouraged to undertake a pilot study to
determine the optimum number of cores needed to capture the natural variability of the site
and hence ensure the ongoing monitoring program is fit-for-purpose and cost effective.
24
Some of the sediment from the sample will be placed in a separate container as a duplicate
sample. While both samples will be frozen for transport to the laboratory, only one will be
analysed immediately; the other will be analysed in the event that the EQG is exceeded.
The core sampler must include a mechanism, such as a small rubber ball that can be pulled
into the end of the corer, to prevent the core falling out.
Redox discontinuity methods All cores will be inspected for a redox discontinuity layer and the depth recorded.
Photographs of the core structure (including the redox layer if present) should be taken.
Any sediment odour indicating the presence of hydrogen sulphide will be noted. Sediment
redox discontinuity (fine black sediment and hydrogen sulphide in the upper 2 cm of
sediment) can be considered as an early indicator of the potential for depleted oxygen
levels in the lower water column. An EQG has been developed for redox discontinuity and
also for dissolved oxygen at the bottom of the water column.
Imagery of the seafloor Prior to stocking sea cages, underwater images of the seafloor and out to 10 m from the
edge of the sea cage along the MEPA transect should be undertaken to provide baseline
data should the EQG for TP, TOC or trace metals be exceeded. If exceeded, underwater
camera or video must be used to capture images, which clearly show the presence or
absence of:
white bacterial mats;
black sediments;
gas bubbles (indicates production of hydrogen sulphide);
animals tracks, bioturbator burrows and, or, benthic macrofauna e.g. filter feeders.
Clear images must be taken along the MEPA transect from the edge of the sea cage and
out to 10 m and at each site (50 m, 100 m and/or 200 m) where the EQG was exceeded. At
least five minutes of footage and, or, 10 still shots at each sea cage where the EQG was
exceeded is required.
Dissolved oxygen sampling method Dissolved oxygen measurements will be taken at the seafloor (< 0.2 m above the seafloor)
using an oxygen electrode and recorded as per cent saturation. Five readings should be
taken at each site and the median DO in bottom waters calculated for each site. The
instrument must be calibrated and maintained in accordance with the manufacturer’s
requirements and the procedures documented for future reference and verification.
2.5.6 Environmental sediment quality guidelines and standards
The EQG and EQS provided in Table 2-7 and Table 2-8 respectively have been developed
to provide early warning of the potential for adverse effects relating to sediment nutrients.
The EQG were developed in the context of the likely cause-effect-pathway shown in Figure
1-4 and in accordance with the ANZECC/ARMCANZ (2000) guidelines. Monitoring against
the EQG will be undertaken on eight sampling occasions throughout the year, except for the
trace metals which will be monitored once per year. Monitoring associated with the EQS will
proceed only upon exceedance of the EQG. If the exceeded EQG relates to TP, TOC or
trace metals, the sediment infauna monitoring program is instigated as outlined in section
2.5. If any one of the EQS is exceeded in any ecological protection zone, the EQS has
been exceeded and control measures such as those outlined in section 5 must be
implemented.
If the situation arises where a cage or cages are located within 200 m of the Zone
boundary, individual site medians calculated at the end of each season for the MEPA
transect sites must also be compared against the HEPA EQG to determine whether the
EQGs are likely to be met in the adjacent HEPA.
25
Table 2-7 EQG indicators for sediment quality.
Issue Indicator EQGs for Zone of Ecological Protection
Moderate High Maximum
Sediment nutrient enrichment
TP
Median Total Phosphorous concentration calculated from pooled sites after each sampling occasion and from individual sites after each season, must be less than the 95%ile of Reference Site data.
Median Total Phosphorous concentration calculated from pooled sites after each sampling occasion and from individual sites after each season, must be less than the 80%ile of Reference Site data.
Median Total Phosphorous concentration calculated from pooled sites after each sampling occasion and from individual sites after each season, must be less than the 70%ile of the Reference Site data.
Organic enrichment
TOC Median concentration of TOC calculated from pooled sites after each sampling occasion and from individual sites after each season, must be less than the 95%ile of Reference Site data.
Median concentration of TOC calculated from pooled sites after each sampling occasion and from individual sites after each season, must be less than the 80%ile of Reference Site data.
Median concentration of TOC calculated from pooled sites after each sampling occasion and from individual sites after each season, must be less than the 70%ile of Reference Site data.
Contaminants Trace metals (Cu, Zn, Cd)
Concentration of each individual sampling site not to exceed: Copper 65 mg/kg Zinc 200 mg/kg Cadmium 1.5 mg/kg
Concentration of each individual sampling site not to exceed5: Copper 65 mg/kg Zinc 200 mg/kg Cadmium 1.5 mg/kg
Concentration of each individual sampling site must not be significantly different to the concentrations at the Reference Sites for copper, zinc and cadmium, as determined by ANOVA.
Benthic hypoxia /anoxic sediments
Redox dis-continuity layer
(1) Median depth of redox discontinuity layer calculated from pooled sites, on each sampling occasion, must not be less than the 5%ile, or 20%ile of Reference Site data; or (2) Median depth of the redox discontinuity layer at any site over a four month period must be no less than the 5%ile, or 20%ile of the Reference Site data.
(1) Median depth of redox discontinuity layer calculated from pooled sites, on each sampling occasion, must not be less than the 20%ile of Reference Site data; or (2) Median depth of the redox discontinuity layer at any site over a four month period must be no less than the 20%ile of the Reference Site data.
(1) Median depth of redox discontinuity layer calculated from pooled sites, on each sampling occasion, must not be less than the 30%ile of Reference Site data; or (2) Median depth of the redox discontinuity layer at any site over a four month period must be no less than the 30%ile of the Reference Site data.
5 ANZECC/ARMCANZ (2000) trigger values - low
26
Table 2-8 EQS indicators for sediment quality
Issue Indicator EQSs for Zone of Ecological Protection
Moderate High Maximum
Sediment nutrient enrichment, organic enrichment and contaminants
TP, TOC and trace metals
If EQG for TP, TOC or trace metals is exceeded at the moderate protection level then; (1) the sediment infauna monitoring program is instigated. The sediment infauna community diversity, measured using the Shannon-Wiener Diversity Index, must not be less than 50% of Reference Sites; and (2) An evaluation of seabed images from a 10m transect taken at the edge of the sea cage and at each of the MEPA transect sites where the EQG was exceeded must not indicate presence of white bacterial mats, black sediments, bubbles of hydrogen sulfide or significant reduction in the presence of animal tracks, or bioturbator burrows, or benthic macrofauna (e.g. filter feeders) relative to Reference Sites. (see Section 2.2); and (3) Median bottom water DO on each sampling occasion and over a season must be greater than 60% saturation and not the result of a regional event as indicated by similar reductions in DO at the Reference Sites.
If EQG for TP, TOC or trace metals is exceeded at the high or maximum protection level then; (1) the sediment infauna monitoring program is instigated. The sediment infauna community diversity, measured using the Shannon-Wiener Diversity Index, must not be less than 80% of Reference Sites; and (2) Median bottom water DO on each sampling occasion and over a season must be greater than 60% saturation and not the result of a regional event as indicated by similar reductions in DO at the Reference Sites.
Benthic hypoxia /anoxic sediments
Redox dis-continuity layer
If EQG (1) and/or (2) (pertaining to the redox dis-continuity layer) is exceeded and the exceedance is based on the moderate protection guideline (95%) then; (1) Evaluation of images taken beneath and within 10 m of the sea-cages must not indicate presence of white bacterial matts, black sediments, bubbles of hydrogen sulphide or a significant reduction in the presence of animal tracks, or bioturbator burrows, relative to Reference Sites; or (2) the sediment infauna monitoring program is instigated. The sediment infauna community diversity, measured using the Shannon-Wiener Diversity Index, must not be less than 50% of Reference Sites; or (3) Median bottom water DO on each sampling occasion must be greater than 60% saturation, and not the result of a regional event as indicated by similar reductions in DO
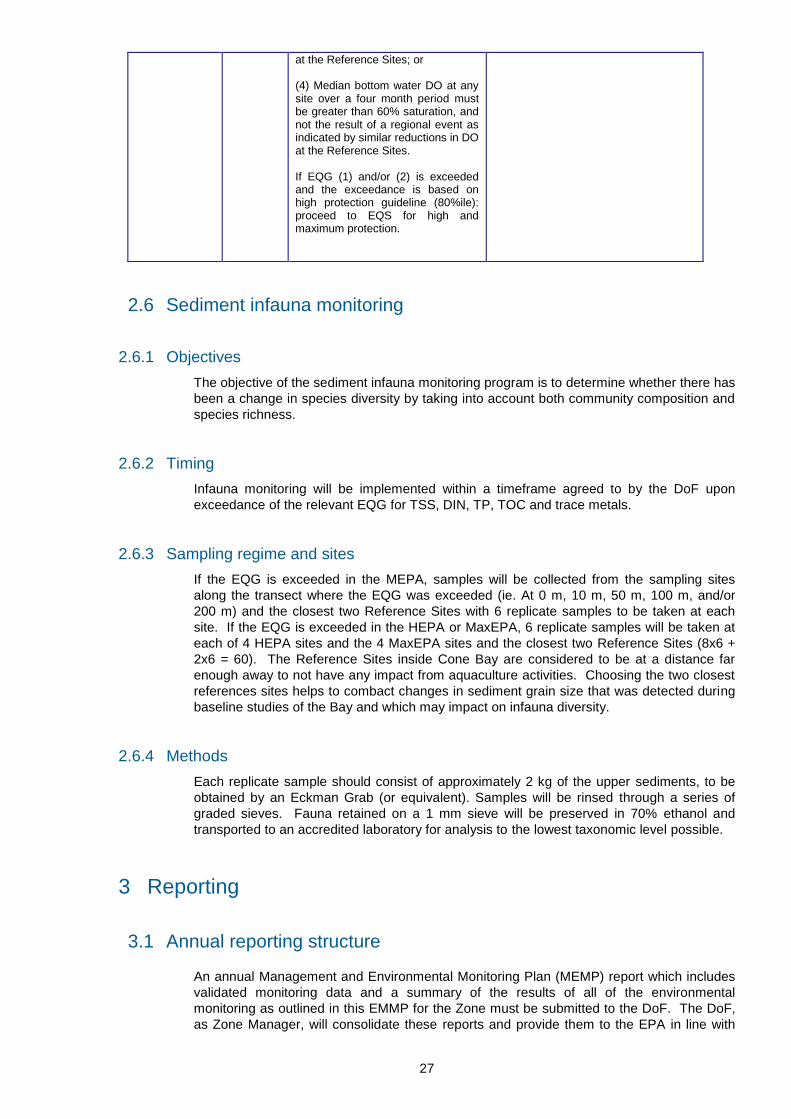
If EQG (1) and/or (2) (pertaining to the redox dis-continuity layer) is exceeded at the high or maximum protection level then; (1) the sediment infauna monitoring program is instigated. The sediment infauna community diversity, measured using the Shannon-Wiener Diversity Index, must not be less than 80% of Reference Sites; or (2) Median bottom water DO on each sampling occasion must be greater than 60% saturation, and not the result of a regional event as indicated by similar reductions in DO at the Reference Sites; or (3) Median bottom water DO at any site over a four month period must be greater than 60% saturation, and not the result of a regional event as indicated by similar reductions in DO at the Reference Sites.
27
at the Reference Sites; or (4) Median bottom water DO at any site over a four month period must be greater than 60% saturation, and not the result of a regional event as indicated by similar reductions in DO at the Reference Sites. If EQG (1) and/or (2) is exceeded and the exceedance is based on high protection guideline (80%ile): proceed to EQS for high and maximum protection.
Sediment infauna monitoring 2.6
2.6.1 Objectives
The objective of the sediment infauna monitoring program is to determine whether there has
been a change in species diversity by taking into account both community composition and
species richness.
2.6.2 Timing
Infauna monitoring will be implemented within a timeframe agreed to by the DoF upon
exceedance of the relevant EQG for TSS, DIN, TP, TOC and trace metals.
2.6.3 Sampling regime and sites
If the EQG is exceeded in the MEPA, samples will be collected from the sampling sites
along the transect where the EQG was exceeded (ie. At 0 m, 10 m, 50 m, 100 m, and/or
200 m) and the closest two Reference Sites with 6 replicate samples to be taken at each
site. If the EQG is exceeded in the HEPA or MaxEPA, 6 replicate samples will be taken at
each of 4 HEPA sites and the 4 MaxEPA sites and the closest two Reference Sites (8x6 +
2x6 = 60). The Reference Sites inside Cone Bay are considered to be at a distance far
enough away to not have any impact from aquaculture activities. Choosing the two closest
references sites helps to combact changes in sediment grain size that was detected during
baseline studies of the Bay and which may impact on infauna diversity.
2.6.4 Methods
Each replicate sample should consist of approximately 2 kg of the upper sediments, to be
obtained by an Eckman Grab (or equivalent). Samples will be rinsed through a series of
graded sieves. Fauna retained on a 1 mm sieve will be preserved in 70% ethanol and
transported to an accredited laboratory for analysis to the lowest taxonomic level possible.
3 Reporting
Annual reporting structure 3.1
An annual Management and Environmental Monitoring Plan (MEMP) report which includes
validated monitoring data and a summary of the results of all of the environmental
monitoring as outlined in this EMMP for the Zone must be submitted to the DoF. The DoF,
as Zone Manager, will consolidate these reports and provide them to the EPA in line with
28
conditions defined in EPAs Ministerial Statement. The DoF will ensure that all MEMP
reports will be made publicly available through the DoF website at www.fish.wa.gov.au
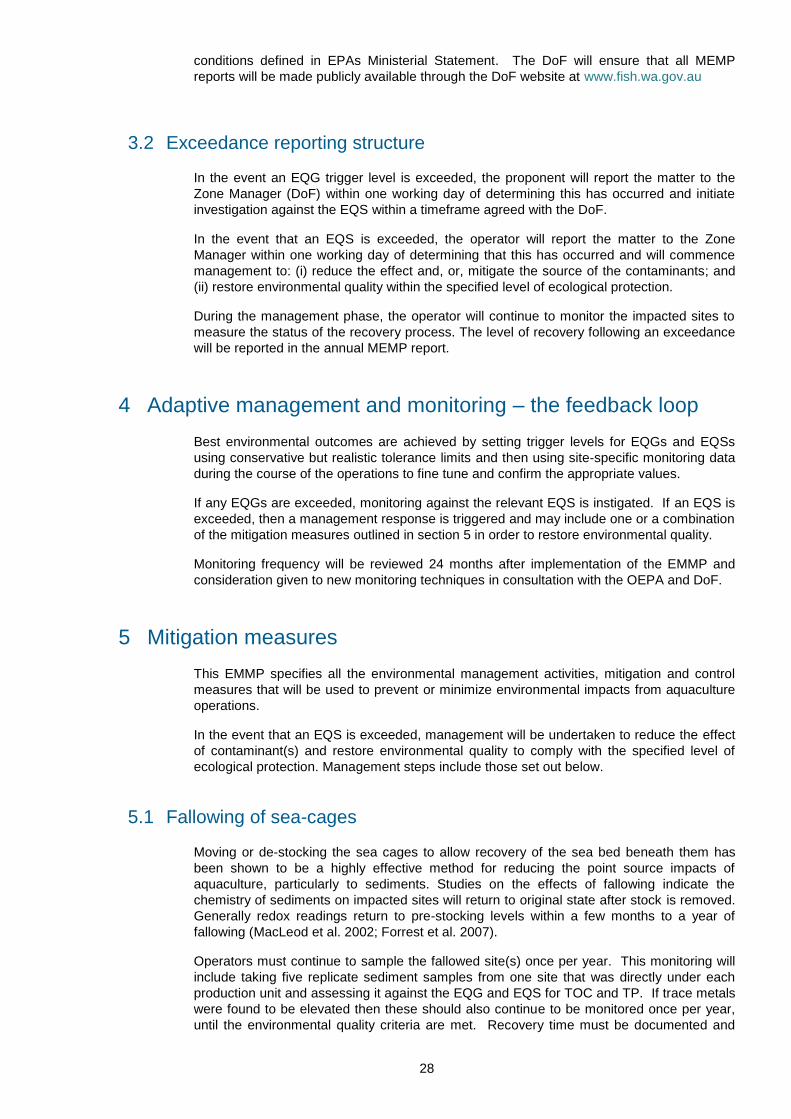
Exceedance reporting structure 3.2
In the event an EQG trigger level is exceeded, the proponent will report the matter to the
Zone Manager (DoF) within one working day of determining this has occurred and initiate
investigation against the EQS within a timeframe agreed with the DoF.
In the event that an EQS is exceeded, the operator will report the matter to the Zone
Manager within one working day of determining that this has occurred and will commence
management to: (i) reduce the effect and, or, mitigate the source of the contaminants; and
(ii) restore environmental quality within the specified level of ecological protection.
During the management phase, the operator will continue to monitor the impacted sites to
measure the status of the recovery process. The level of recovery following an exceedance
will be reported in the annual MEMP report.
4 Adaptive management and monitoring – the feedback loop
Best environmental outcomes are achieved by setting trigger levels for EQGs and EQSs
using conservative but realistic tolerance limits and then using site-specific monitoring data
during the course of the operations to fine tune and confirm the appropriate values.
If any EQGs are exceeded, monitoring against the relevant EQS is instigated. If an EQS is
exceeded, then a management response is triggered and may include one or a combination
of the mitigation measures outlined in section 5 in order to restore environmental quality.
Monitoring frequency will be reviewed 24 months after implementation of the EMMP and
consideration given to new monitoring techniques in consultation with the OEPA and DoF.
5 Mitigation measures
This EMMP specifies all the environmental management activities, mitigation and control
measures that will be used to prevent or minimize environmental impacts from aquaculture
operations.
In the event that an EQS is exceeded, management will be undertaken to reduce the effect
of contaminant(s) and restore environmental quality to comply with the specified level of
ecological protection. Management steps include those set out below.
Fallowing of sea-cages 5.1
Moving or de-stocking the sea cages to allow recovery of the sea bed beneath them has
been shown to be a highly effective method for reducing the point source impacts of
aquaculture, particularly to sediments. Studies on the effects of fallowing indicate the
chemistry of sediments on impacted sites will return to original state after stock is removed.
Generally redox readings return to pre-stocking levels within a few months to a year of
fallowing (MacLeod et al. 2002; Forrest et al. 2007).
Operators must continue to sample the fallowed site(s) once per year. This monitoring will
include taking five replicate sediment samples from one site that was directly under each
production unit and assessing it against the EQG and EQS for TOC and TP. If trace metals
were found to be elevated then these should also continue to be monitored once per year,
until the environmental quality criteria are met. Recovery time must be documented and
29
reported on in the annual report submitted to DoF. Until it is demonstrated that the seabed
has recovered to a high level of ecological protection, fallowed sites are included as part of
the MEPA (33% of the Zone).
Movement of stock 5.2
The movement or partial harvesting of stock may be considered as a temporary measure to
reduce pressures on water or sediment quality and allow time for the relevant indicators to
comply with the specified levels of ecological protection.
Reduction of stocking densities 5.3
Reduction of stocking density through splitting cages and selective harvest may be
implemented as a temporary measure to reduce pressures on water or sediment quality,
and to allow time for the relevant indicators to comply with the specified levels of ecological
protection.
Reduction of feed input rates 5.4
Reduction of feed input rates may be implemented to reduce nutrient inputs that may impact
on water or sediment quality. Reduction of feed will be ongoing until the relevant indicators
comply with the specified levels of ecological protection.
6 Decommissioning plan
Should the operation be discontinued the aquaculture gear will be removed from the site. To
achieve this, the following operations will be carried out.
All fish will be harvested.
Fish nets will be stripped from the cages and taken to Derby.
Cages will be towed back to Derby and dismantled.
Moorings will be removed and transported back to Derby.
Decommissioning of aquaculture sites, if not undertaken by the lease holder, is completed
by DoF, with any costs incurred recouped through legal means if necessary (pursuant to the
relevant provisions of the FRMA and the Fish Resources Management Regulations 1995
(FRMR)). Aquaculture leases issued for sites within the Zone will include provision for the
payment of a bond or other security for this purpose.
7 Marine fauna interaction plan.
The licence holder is responsible for ensuring that potential impacts on other aquatic fauna
are managed and minimised by adhering to the requirements and procedures set out in this
section. Licence holders must also adhere to the Kimberley Aquaculture Development
Zone Management Policy which, among other things, requires the use of predator nets and
includes a waste management plan to ensure adverse effects on marine fauna is
minimised.
On-site staff and contractors must undertake induction and awareness training (by the
employer and/or Department of Parks and Wildlife (DPaW)) to ensure consistency in
identification of protected and endangered species, crocodile management and safety,
30
incident procedures and reporting documentation. Adequate training in correct vessel
handling, marine safety procedures and relevant maritime regulations is mandatory.
Marine fauna monitoring 7.1
Farm staff must keep a logbook of interactions between fauna and aquaculture gear
(including vessels) and staff. All incidents including predation on fish stock, fish stock
escapes, fauna mortalities, wildlife entanglements and all actions taken, must be recorded
and reported.
Interactions with protected species 7.2
Protected species include crocodiles, marine turtles, marine mammals and seabirds.
Licence holders must immediately report any interactions between any aquaculture gear
and protected species, including entangled or stranded animals, to the DPaW Wildcare
Helpline on (08) 9474 9055 (24-hour emergency number), the DPaW Derby Ranger on (08)
9193 1411 and the Broome DPaW District Office on (08) 9195 5500.
DPaW will report these interactions directly to the Commonwealth Department of
Sustainability, Environment, Water, Populations and Communities (SEWPaC).
Species identification guides are available from DPaW to assist with reporting requirements.
These guides and contact numbers should be easily accessible at all times while on site.
Management strategies to reduce interactions 7.3
Predator exclusion systems are mandatory on sea cages. These may include sub-
surface external predator nets to avoid predation by sharks (particularly sleepy
sharks), crocodiles and dolphins.
Dead fish must be removed from sea cages daily to discourage scavenging or
predation by other marine fauna.
Sea cage nets must be inspected daily to ensure net integrity has not been
compromised, kept taut and free from debris and maintained to a standard that will
minimise entanglement.
Feeding protocols must be observed to minimise the amount of uneaten feed
entering the surrounding water. Excessive feed can reduce water quality in the
vicinity of the sea cages and attract wildlife to the operation.
Feeding, touching or swimming with marine fauna is not permitted.
A dedicated marine fauna watch person/observer should be appointed during
vessel trips and whilst working on the outside of the sea cages to search for marine
fauna to ensure staff safety (from crocodiles) and avoid collisions.
Vessel activity should be limited to essential business activities at all times to avoid
excessive noise and pollution.
Preferred routes to various utility points must be documented and adhered to.
Vessel speeds must be reduced to avoid collisions with marine fauna.
Vessel engines must be well maintained and protective bunds used to prevent oil
and fuel leaks.
31
Movement of vessels within the vicinity of a whale must comply with relevant
restrictions (eg. Wildlife Conservation Act 1950). A vessel must not approach a
whale within a distance of 100 m.
Compliance checks to ensure operations have these strategies in place may be conducted
at any time.
8 References
ANZECC/ARMCANZ (2000) Australian and New Zealand Guidelines for Fresh and Marine Water Quality. Australian and New Zealand Environment and Conservation Council & Agriculture and Resource Management Council of Australia and New Zealand, National Water Quality Management Strategy No. 4 & 7. Chou CL, Haya K, Paon LA, & Moffatt JD (2004) A regression model using sediment chemistry for the evaluation of marine environmental impacts associated with salmon aquaculture cage wastes. Marine Pollution Bulletin 49, 465-472. DHI (2013) Kimberley Aquaculture Development Zone. Environmental Field Studies and Numerical Modelling in support of an EIS. Prepared for the Department of Fisheries by DHI Water & Environment Pty Ltd, Perth Western Australia, May 2013. EPA (2000) Perth’s Coastal Waters. Environmental Values and Objectives. EPA (2005a) Environmental Quality Criteria Reference Document for Cockburn Sound (2003-2004) - A supporting document to the State Environmental (Cockburn Sound) Policy 2005, Prepared by Environmental Protection Authority, Report no. 20, Perth, Western Australia. EPA (2005b) Manual of Standard Operating Procedures - For Environmental Monitoring against the Cockburn Sound Environmental Quality Criteria (2003 - 2004) – A supporting document to the State Environmental (Cockburn Sound) Policy 2005, Prepared by Environmental Protection Authority, Report no. 21, Perth, Western Australia, January 2005. EPA (2012) Environmental Scoping Guideline for the Cone Bay Aquaculture Zone. EPA (2013) Environmental factors and objectives, Environmental Protection Guideline No. 8. Forrest B, Keeley N, Gillespie P, Hopkins G, Knight B, & Govier D (2007) Review of the Ecological Effects of Marine Finfish Aquaculture, Final report prepared for Ministry of Fisheries. Cawthron Report No. 1285. 71pp. Government of Western Australia (2004) State Water Quality Management Strategy No 6- Implementation framework for Western Australia for the Australian and New Zealand Guidelines for Fresh and Marine Water Quality and Water Quality Monitoring and Reporting (Guidelines Nos 4 & 7; National Water Quality Management Strategy), Prepared by the Government of WA, Report No. SWQ 6, Perth, WA. Macleod C, Forbes S, Bisset A, Burke C, Crawford C, Holdsworth D, Nichols P, Revill A, & Volkman J (2004) Guide to the assessment of sediment condition at marine finfish farms, Aquafin CRC Project 4.1 Extension report to FRDC. Tasmanian Aquaculture & Fisheries Institute.
32
S.E.C.R.U. (2002) Review and synthesis of the environmental impacts of aquaculture. Scottish Executive Central Research Unit, Napier University. Edinburgh. Sutherland TF, Martin AJ & Levings CD (2001). Characterisation of suspended particulate matter surrounding a salmonid net-pen in the Broughton Archipelago, British Columbia. ICES J. Marine Science 58, 404-410. Telfer TC & Beveridge MCM (2001) Monitoring environmental effects of marine fish aquaculture. In Uriarte A (ed) & Basurco B (ed) Environmental impact assessment of Mediterranean aquaculture farms pp 75-83.