Embed Size (px)
Citation preview

Volume 4 • Issue 8 • 1000176J Chem Eng Process Technol ISSN: 2157-7048 JCEPT, an open access journal
Research Article Open Access
Asiedu et al., J Chem Eng Process Technol 2013, 4:8 DOI: 10.4172/2157-7048.1000176
Research Article Open Access
Kinetic Modeling of the Hydrolysis of Acetic Anhydride at Higher Temperatures using Adiabatic Batch Reactor (Thermos-Flask)Asiedu N*, Hildebrandt D and Glasser DCentre of Material and Process Synthesis, School of Chemical and Metallurgical Engineering, University of Witwatersrand, Johannesburg, South Africa
*Corresponding author: Nana Yaw Asiedu, Centre of Material and ProcessSynthesis, School of Chemical and Metallurgical Engineering, University ofWitwatersrand, Private mail Bag X3, Wits 2050, Johannesburg, South Africa,E-mail: [email protected]
Received September 03, 2013; Accepted October 10, 2013; Published October 14, 2013
Citation: Asiedu N, Hildebrandt D, Glasser D (2013) Kinetic Modeling of the Hydrolysis of Acetic Anhydride at Higher Temperatures using Adiabatic Batch Reactor (Thermos-Flask). J Chem Eng Process Technol 4: 176. doi: 10.4172/2157-7048.1000176
Copyright: © 2013 Asiedu N, et al. This is an open-access article distributed under the terms of the Creative Commons Attribution License, which permits unrestricted use, distribution, and reproduction in any medium, provided the original author and source are credited.
AbstractThe kinetics of the reactions of acetic anhydride-excess water has been studied at higher temperatures up to
366K under adiabatic conditions in a thermos-flask fitted with a negative coefficient thermistor and kinetic data report-ed in this work. The same techniques were applied for the kinetic studies of excess acetic anhydride-water reactions at higher temperature up to 368 K. The reaction kinetics of excess acetic anhydride-water reactions which has not been determined previously was modeled using the same adiabatic analysis and the average activation energy, heat of reaction, pre-exponential factor and the order of reaction with respect to water has been determined. The studies have shown that the two processes appear to be completely different and might proceed through different reaction mechanisms pathways for the production of acetic acid.
Keywords: Kinetic modeling; Thermos flask; Hydrolysis;Esterification; Exothermic reactions; Temperature
IntroductionClassical techniques for modeling reaction kinetics have been
depended on measuring or monitoring concentration-time profiles of liquid phase reactions. This method requires that at some time the researcher must have means of arresting the reaction and take measurement rapidly and continuo the process. With this approach some continuous measuring techniques are possible, pH, conductivity, Kralj [1], Fourier transfer infrared Haji et al. [2]. These methods actually require different approach when it comes to the analysis of the experimental results, and one is always at the disadvantage when reaction rates are extremely fast. Temperature-time profiles of exothermic reaction are used instead of concentration-time profiles for the determination of the kinetic parameters. This method is now used in modern laboratories and can be done with a high degree of accuracy. Most reactions have reasonable amount of heat of reaction and measuring dices such as thermistor can be used to measure temperature changes up to accuracy on 0.0001°C. It follows that in principle an adiabatic reaction covering only 10°C should be measureable to one part in 105, which compares very well with the accuracy of chemical titration used in isothermal experiments. Thus reactions with very small heat of reactions could be handled easily. If one is to model an exothermic reaction by estimating the kinetic parameters of a process when concentration and temperature vary simultaneously, one need to perform regression analysis directly on the differential equations describing the process [3]. Recently this regression analysis is easily performed by high speed digital computers. Previous researchers have been confined to the case where reactions occur under adiabatic conditions [4]. Bell and Clunie [5] used flow reactors and it has generally been used for fast reactions. The temperature-time profiles have been converted directly concentration-time profiles and then been analyzed by the classical methods. The method of Schmidt et al. [6] requires numerical evaluations of the first and second derivativesfunctions of concentration.
The current technique applied for the analysis of the results in this paper is not subject to any limitations and does not require prior knowledge of the heat of reaction. Some studies have been reported in elsewhere in the literature on the kinetic parameters of acetic anhydride hydrolysis. Eldridge and Pirect [7] obtained the pseudo-first order reaction rate constant using a batch reactor. It is well-known
that the reaction rate increases with temperature increase. The rate of temperature rise can be represented as a slope of the temperature-time curve. Some studies has been reported in the past using temperature-time profiles to predict the kinetics of the hydrolysis of acetic anhydride in excess distilled water. Williams [8] reported the kinetics and stoichiometry of the reaction between hydrogen peroxide and sodium thiosulphate. An adiabatic reactor was used with a thermocouple and a strip-chart recorder to determine the kinetic parameters of the hydrolysis of acetic anhydride in dilute aqueous solutions Glasser and Williams [9]. A vessel was placed in a constant temperature bath and the heat lost from the reactor was described mathematically. A thermistor was used for the temperature readings. King and Glasser [10] studied the kinetic parameters of the hydrolysis of acetic anhydride in dilute solutions. An adiabatic reactor was used in the experiments. The walls of the reactor were kept at the same temperature as the fluid by passing a high current through the reactor walls. Temperature readings were taken by the use of thermocouples. In this work hydrolysis of acetic anhydride in excess distilled water (dilute solution) was studied and compared with hydrolysis in excess anhydride solution in adiabatic conditions. It is known that not much work has been done on the case where hydrolysis is carried out in excess acetic anhydride solution using adiabatic batch reactor. Moreover this work is also to test the current model of the hydrolysis of excess acetic anhydride under adiabatic conditions. It is claimed that the hydrolysis follows a first order kinetic model. The same method is also used to elucidate the kinetic parameters of the reaction between acetic anhydride and methanol. This process has not been studied in this manner as known to the authors.
Journal of Chemical Engineering & Process TechnologyJournal
of C
hem
ical E
ngineering & Process Technology
ISSN: 2157-7048

Page 2 of 8
Citation: Asiedu N, Hildebrandt D, Glasser D (2013) Kinetic Modeling of the Hydrolysis of Acetic Anhydride at Higher Temperatures using Adiabatic Batch Reactor (Thermos-Flask). J Chem Eng Process Technol 4: 176. doi: 10.4172/2157-7048.1000176
Volume 4 • Issue 8 • 1000176J Chem Eng Process Technol ISSN: 2157-7048 JCEPT, an open access journal
The Mathematical Model of the Reacting System-Thermos-Flask
Given an adiabatic batch reactor (thermos-flask) the mathematical model is made up of a set of differential equations resulting from the mass and energy balances referred only to the reaction mixture because there is no heat transfer.
The stoichiometry of the reactions studied is given below:
(CH3CO)2O + H2O → 2CH3COOH ∆H (298K) = -56kJ/mol (1)
For a constant –volume batch reactor one can write:1
− = = −A AA
dN dCrV dt dt
(2)
The energy balance equation can be established as:
Heat generated = Heat absorbed by reactor contents + Heat transferred through reactor walls (3)
(-∆H)(-rA )Vdt+ Qstirrer dt = mCp dT +UA (∆T)dt (4)
Given ε− =A
d( r )dt
(5)
where (ε) is the extent of reaction, we can rearrange eq 4 to give eq 6 below:
ε∆ + = −∆p
dUA( T )dt mC ( H )dt
(6)
Assume that heat given by stirrer speed (Qstrirrer) is negligible. Integrating eq 6 gives
( ) ( )0
( )∞ −∆− + − = ∆∫o O
p p
UA HT T T T dt εmC mC
(7)
The left hand side of eq 7 can be used to correct experimental data to adiabatic conditions. It is assumed that the reaction is independent of temperature, hence correcting the experimental data the adiabatic temperature rise parameter (∆Tad) can be obtained from the experimental result for the process. This adiabatic temperature rise is equal to the right hand side of eq 7 or we can write;
−∆ ε∆ =ad
p
( H )TmC (8)
From eq 8 one can easily show that the energy balance equation of an adiabatic batch reactor reduces to a linear form given by eq 9 as:
T = T0 + ΔTadε (9)
where (ε) is the extent of reaction with respect to the reactant of interest and its value can be computed in advance from the initial conditions (temperature and heat capacities) of the reacting species. Equation 9, also allows one to find conversion at any instant under adiabatic conditions by using only one measure of temperature. Then from the initial concentrations of the reactants the concentrations products can be monitored at any instant in the reactor.
The Experimental Set UpThe experimental set- up as shown in Figure 1 was used in all the
reactions studied. The adiabatic batch reactor used in the experiments is 18/8 stainless steel thermos-flask of total volume of 500 mL equipped with a removable magnetic stirrer. The flask is provided with a negative temperature coefficient thermistor connected on-line with a data-logging system. The signal from the sensor (thermistor) is fed to a measuring and a control unit amplifier and a power interface. The acquisition units are connected to a data processor. A process control engineering support data management.
The data acquisition system called Clarity has the following part numbers: C50 Clarity Chromatography SW, single instrument, 3 x 55 Clarity Add-on instrument SW, 194 (INT9 quad channel A/D converter card). The hardware is INT9 PCI A/D 24 bit converter. The properties: Input signal range 100mV -10V, Acquisition frequency 10-100Hz, Internal A/D converter (INT9-1 to 4 channel PCI A/Dconverter). All physically available analog inputs and outputs as wellas virtual channel are all automatically monitored and the processvalues are stored. The process values are transmitted in such a waythat the computer screen displays profiles of voltage-time curves. Dataacquisition software was used to convert the compressed data form ofthe history file on the hard disk into text file format. The text files areconverted to excel spreadsheet and the data are then transported intoMatLab 2010a for analysis.
The Thermistor CalibrationThe thermistor used in the experiments was negative temperature
coefficient with unknown thermistor constants. The calibrations involve the determination of the thermistor constants and establish the relationship between the thermistor’s resistance and temperature. This was done by fitting both the thermistor and an electronic digital temperature measuring device in a sealed vessel and the system was slowly warmed until the voltage reaches it asymptotic state. The thermistor was connected to a computer with data acquisition software to provide data of voltage-time real-time plot. The voltage-time data was used to match the temperature-time data obtained from the electronic digital temperature device. Thermistor resistance (RTH) and Temperature (T) in Kelvin was modeled using the empirical equation given developed by Considine [11].
= +
THBR exp CT
(10)
or
THBln(R ) CT
= + (11)
Where the parameters (B) and (C) are the thermistor constants. The constants were determined by fitting the “best” least square straight line plot of ln(RTH) against 1/T, giving the thermistor equation as:
TH1773.8ln(R ) 18.178
T= + (12)
PROCESS
SENSOR
POWER
PC & SOFTWARE
AGITATOR
Figure 1: Block diagram of experimental set-up.

Page 3 of 8
Citation: Asiedu N, Hildebrandt D, Glasser D (2013) Kinetic Modeling of the Hydrolysis of Acetic Anhydride at Higher Temperatures using Adiabatic Batch Reactor (Thermos-Flask). J Chem Eng Process Technol 4: 176. doi: 10.4172/2157-7048.1000176
Volume 4 • Issue 8 • 1000176J Chem Eng Process Technol ISSN: 2157-7048 JCEPT, an open access journal
Experimental Procedures and ResultsExcess water-acetic anhydride reactions-hydrolysis-A
Analytical reagent grade acetic anhydride and distilled water was used in all experiments. In all experiments 1 mol of acetic anhydride was injected into the reaction vessel followed by 10 mols of distilled water. These quantities (volumes) were used so that at least 60% of the length of the sensor (thermistor) would be submerged in the resulting initial reacting mixture. Reactants were brought to a steady- state temperature before starting the stirrer to initiate the reaction. In course of the reaction, the stirrer speed was set at 1000 rev/min, the resulting voltage-time profiles were captured and the corresponding temperature-time curve was determined using the thermistor equation derived above. Runs were carried out adiabatically at the following initial temperatures: 305K, 310K and 328K.
Experimental determination of heat transfer coefficient of the process
For a given system (reaction vessel and content) one can write:
p p p
system water vessel
mC mC mCUA UA UA
= +
(13)
In this experiment different amount of water (mw) (200 g, 300 g and 400 g) was injected into the reaction flask at 343.08K, 347.77K and 347.85K and allowed to cool until the temperature reaches a steady-state temperature (TS). The cooling process thus follows equation 14. A nonlinear least-square regression analysis was performed on all the three experimental curves and the value of UA/mCP for each cooling curve was determined.
s 0 sp
UAT T (T T )exp tmC
= + − −
(14)
From Table 1, a plot of mass of water (m) against (mCp/UA) is shown.
Determination of UA/mCp for the reaction mixture
Table 2 consists of some of the physical constants of the reacting species which was used in the determination of the quantity UA/mCP.
Equation 23 was used to determine specific heat of the reacting mixture (CP.mix) and the quantity MTCP.mix.
WAAP.mix P.AA P.W
mmC C CMT MT
= + (15)
MT, is the total mass of the reacting mixture and MTCP.mix was calculated to be 943.64 J/K. Since the reaction is not pure water we therefore determined its equivalent mass of water by dividing 943.64 J/K by the specific heat of water:
225 5= =T P mixeqv
P.water
( M C )m water . g waterC
(16)
From Figure 2 the value of the quantity (UA/mCP)mix was determined to be 0.00209/min. This value was plugged in eq 7 above and the correction of the experimental results to adiabatic conditions was performed. The Figures 3-5 shows the experimental and the corrected temperature profiles for all the three runs.
From eq 9 the variation of acetic anhydride concentration with temperature/time was deduces as:
CAA = 3.64 – a (T-To) (17)
The constant (α) in eq 17 was calculated using the initial concentration of the acetic anhydride, 3.64 mol/L and the adiabatic temperature change (∆T)adiabatic values provided in Table 3.
Variation of rate of reaction with concentration change
The average rate of a reaction (-rA) which is a function of
Mass of water(g) Initial Temperature(K)(TO)
Final Temperature(K)(TS) UA/mCp (min-1)
200 343.08 292.13 0.00215300 347.77 293.00 0.00189400 347.84 293.38 0.00178
Table 1: Summary of characteristics of the cooling curves.
Species Moles Molar mass(g/mol) CP (J/mol.K)Acetic anhydride 1.0 102.9 189.7
Water 10.0 18.01 75.4
Table 2: Some constants of reacting species.
y = 0.467x + 372.7R² = 0.998
0
100
200
300
400
500
600
0 50 100 150 200 250 300 350 400 450
mCp
/UA(
min
)
Mass of water (g)
Figure 2: A plot of mass of water (m) against (mCp/UA).
0 5 10 15 20 25 30 35 40 45305
310
315
320
325
330
335
340
345
350
355
360
Time(min)
Teme
rature
(K)
Temperature-Time profiles-Hydrolysis-1
Experimental curveAdiabatic curve
Figure 3: Temperature-time plots of acetic anhydride-excess water reaction at 305K.
0 10 20 30 40 50310
315
320
325
330
335
340
345
350
355
360
Time(min)
Tem
pera
ture
(K)
Experimental curveAdiabatic curve
Figure 4: Temperature-time plots of acetic anhydride-excess water reaction at 310K.

Page 4 of 8
Citation: Asiedu N, Hildebrandt D, Glasser D (2013) Kinetic Modeling of the Hydrolysis of Acetic Anhydride at Higher Temperatures using Adiabatic Batch Reactor (Thermos-Flask). J Chem Eng Process Technol 4: 176. doi: 10.4172/2157-7048.1000176
Volume 4 • Issue 8 • 1000176J Chem Eng Process Technol ISSN: 2157-7048 JCEPT, an open access journal
temperature and concentration and for a pseudo-first process such acetic anhydride reacting in excess water, at a particular temperature the specific rate constant value should be the same in all three cases of the processes considered (Figures 6-8).
Recall that k(T) = − A
A
r (T )C
(18)
The average rate of reaction at a particular time was determined from the concentration time-time plots by determining the first derivatives at different time intervals numerically using the concentration-time data of the runs (Tables 4-6).
Kinetics and thermodynamic analysis of the experiments
The rate information obtained from the concentration-time plot enabled one to calculated specific rate constant k(T) of the processes at any time (t) and temperature (T). Arrhenius plots was thus generated from which kinetic parameters of runs was extracted (Figures 9-11).
The values obtained for the specific rate constants as a function of temperature are given in equations 27, 28 and 29 below:
71
6078 71 68 10 = ∗ −
.k (T ) . expT
(19)
( ) 72
6108 31 78 10 = −
* .k T . expT
(20)
73
6062 21 22 10 = ∗ −
.k (T ) . expT
(21)
The thermodynamic information extracted from the experiments was the heat of the reaction (∆Hrxn). This was assumed to be independent of temperature and was determined by using equation 10. Table 7 shows ∆Hr values of the various experiments.
Experimental Procedures and ResultsExcess acetic anhydride-water reactions-hydrolysis-B
Analytical reagent grade acetic anhydride and distilled water was used in all experiments. In these experiments 2.645 mols of acetic anhydride was injected into the reaction vessel followed by 0.556 mols
of distilled water. These quantities (volumes) were used so that at least 60% of the length of the sensor (thermistor) would be submerged in the
0 5 10 15 20 25 30
330
335
340
345
350
355
360
365
370
Time(min)
Temp
eratur
e(K)
Experimental curveAdiabatic curve
Figure 5: Temperature-time plots of acetic anhydride-excess water reaction at 328K.
Experiment T(o)(K) T(max adiabatic)(K) (∆T)adiabatic(K)1 305.10 358.50 52.672 310.10 358.70 56.403 328.40 366.40 38.00
Table 3: Summary of the characteristics of the above temperature-time plots of figures (3-5).
T=345KExperiment Concentration Rate Rate constant (k)
1 1.0637 0.2965 0.27872 1.3848 0.4160 0.30043 2.633 0.7300 0.2772
Average (k) 0.2854 Standard deviation (k) 0.0013
Table 4: Variations of temperature, rate and concentration at T =345K.
T=350KExperiment Concentration Rate Rate constant (k)
1 0.7403 0.3005 0.40592 1.0623 0.3913 0.36843 2.3109 0.8391 0.3613
Average (k) 0.3785 Standard deviation (k) 0.024
Table 5: Variations of temperature, rate and concentration at T=350K.
00.10.20.30.40.50.60.70.80.9
0 0.5 1 1.5 2 2.5
Rtae
Concentration
Concentration-rate plot @ 355K
Figure 8: Concentration-rate plot @ 355K.
0
0.1
0.2
0.3
0.4
0.5
0.6
0.7
0.8
0.9
0 0.5 1 1.5 2 2.5
Rate
Concentration
Concentratio-rate plot @350K
Figure 7: Concentration-rate plot @ 350K.
00.10.20.30.40.50.60.70.8
0 0.5 1 1.5 2 2.5 3
Rate
Concentration
Concentration-rate plot @ 345K
Figure 6: Concentration-rate plot at 345K.

Page 5 of 8
Citation: Asiedu N, Hildebrandt D, Glasser D (2013) Kinetic Modeling of the Hydrolysis of Acetic Anhydride at Higher Temperatures using Adiabatic Batch Reactor (Thermos-Flask). J Chem Eng Process Technol 4: 176. doi: 10.4172/2157-7048.1000176
Volume 4 • Issue 8 • 1000176J Chem Eng Process Technol ISSN: 2157-7048 JCEPT, an open access journal
resulting initial reacting mixture. Reactants were brought to a steady- state temperature before starting the stirrer to initiate the reaction.
The stirrer speed was set at 1000 rev/min, the resulting voltage -time profiles were captured and the corresponding temperature-time curve was determined using the thermistor equation derived above. Runs were carried out adiabatically at the following initial temperatures: 286.8K, 293.6K and 304.5K.
Determination of UA/mCp for the reaction mixture
The quantity UA/mCP was determined for each of the runs using the
cooling parts of the experimental curves. It is noticed from the cooling parts of the runs were similar to the curve cooling water experiments described in section above. It was an indication the cooling part of the experimental runs was real cooling process and no reaction took place during that process. The cooling parts thus follow eq 14 above. A nonlinear regression analysis was performed on all the cooling parts and the value of UA/mCP was determined for all the experimental runs. The steady-state temperature (TS) for the experiments was 293K. The regressed lines of the experiments cooling sections and their UA/mCP was obtained and used for the corrections of the experimental curves, corresponding experimental and adiabatic curves are shown in Figures 12-14. The adiabatic curve was determined using equation 7 above.
Table 8 shows initial temperatures and the corresponding values of the UA/mCP of the runs.
From eq 11 the variation of water concentration with temperature/time was deduces as:
CH20=2.13 – a (T-To) (22)
The constant (α) in eq 22 was calculated using the initial
T=355KExperiment Concentration Rate Rate constant (k)
1 0.4177 0.1746 0.41992 0.8256 0.3590 0.43483 1.9893 0.8283 0.4164
Average (k) 0.4237 Standard deviation (k) 0.0098
Table 6: Variations of temperature, rate and concentration at T=355K.
0 200 400 600 800 1000 1200 1400280
290
300
310
320
330
340
350
Time(min)
Tem
pera
ture
(K)
Experimental cuveAdiabatic curve
Figure 12: Experimental and Adiabatic curves of experiment-4.
Figure 13: Experimental and Adiabatic curves of experiment-5.
ln (k) = -6108.3/T + 16.696R² = 0.998
-3.5
-3
-2.5
-2
-1.5
-1
-0.5
0
0.00285 0.0029 0.00295 0.003 0.00305 0.0031 0.00315 0.0032 0.00325
ln (k
)
1/T (1/K)
Arrhenius plot-2
Figure 10: Arrhenius plot of experiment-2.
ln (k)= -6078.7/T + 16.634R² = 0.994
-3.5
-3
-2.5
-2
-1.5
-1
-0.5
0
0.0028 0.00285 0.0029 0.00295 0.003 0.00305 0.0031 0.00315 0.0032 0.00325 0.0033
ln (k
)
1/T (1/K)
Arrhenius plot-1
Figure 9: Arrhenius plot of experiment-1.
ln (k) = -6062.2/T + 16.313R² = 0.998
-2.5
-2
-1.5
-1
-0.5
0
0.0028 0.00285 0.0029 0.00295 0.003 0.00305
ln (k
)
1/T (1/K)
Arrhenius plot
Figure 11: Arrhenius plot of experiment-3.
Experiment 1 2 3∆Hrxn(kJ/mol) -53.36 -53.44 -53.51
Table 7: Thermodynamic information of the experiments.
Page 6 of 8
Citation: Asiedu N, Hildebrandt D, Glasser D (2013) Kinetic Modeling of the Hydrolysis of Acetic Anhydride at Higher Temperatures using Adiabatic Batch Reactor (Thermos-Flask). J Chem Eng Process Technol 4: 176. doi: 10.4172/2157-7048.1000176
Volume 4 • Issue 8 • 1000176J Chem Eng Process Technol ISSN: 2157-7048 JCEPT, an open access journal
concentration of the water 2.13 mol/L and the adiabatic theoretical temperature change (∆T)adiabatic (Table 9).
Variation of rate of reaction with concentration change
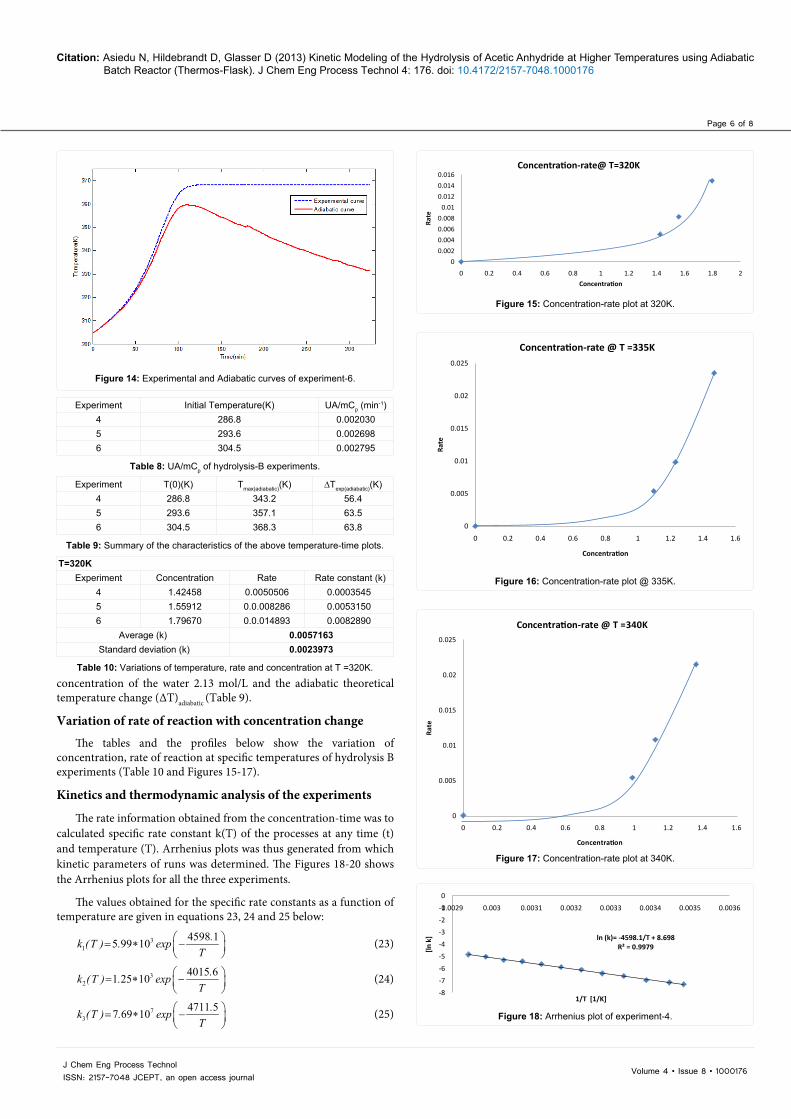
The tables and the profiles below show the variation of concentration, rate of reaction at specific temperatures of hydrolysis B experiments (Table 10 and Figures 15-17).
Kinetics and thermodynamic analysis of the experiments
The rate information obtained from the concentration-time was to calculated specific rate constant k(T) of the processes at any time (t) and temperature (T). Arrhenius plots was thus generated from which kinetic parameters of runs was determined. The Figures 18-20 shows the Arrhenius plots for all the three experiments.
The values obtained for the specific rate constants as a function of temperature are given in equations 23, 24 and 25 below:
31
4598 15 99 10 = ∗ −
.k (T ) . expT
(23)
32
4015 61 25 10 = ∗ −
.k (T ) . expT
(24)
73
4711 57 69 10 = ∗ −
.k (T ) . expT
(25)
Figure 14: Experimental and Adiabatic curves of experiment-6.
Experiment Initial Temperature(K) UA/mCp (min-1)4 286.8 0.0020305 293.6 0.0026986 304.5 0.002795
Table 8: UA/mCp of hydrolysis-B experiments.
Experiment T(0)(K) Tmax(adiabatic)(K) ∆Texp(adiabatic)(K)4 286.8 343.2 56.45 293.6 357.1 63.56 304.5 368.3 63.8
Table 9: Summary of the characteristics of the above temperature-time plots.
T=320KExperiment Concentration Rate Rate constant (k)
4 1.42458 0.0050506 0.00035455 1.55912 0.0.008286 0.00531506 1.79670 0.0.014893 0.0082890
Average (k) 0.0057163 Standard deviation (k) 0.0023973
Table 10: Variations of temperature, rate and concentration at T =320K.
00.0020.0040.0060.008
0.010.0120.0140.016
0 0.2 0.4 0.6 0.8 1 1.2 1.4 1.6 1.8 2
Rate
Concentration
Concentration-rate@ T=320K
Figure 15: Concentration-rate plot at 320K.
ln (k)= -4598.1/T + 8.698R² = 0.9979
-8
-7
-6
-5
-4
-3
-2
-1
0
0.0029 0.003 0.0031 0.0032 0.0033 0.0034 0.0035 0.0036
[ln k
]
1/T [1/K]
Figure 18: Arrhenius plot of experiment-4.
0
0.005
0.01
0.015
0.02
0.025
0 0.2 0.4 0.6 0.8 1 1.2 1.4 1.6
Rate
Concentration
Concentration-rate @ T =340K
Figure 17: Concentration-rate plot at 340K.
0
0.005
0.01
0.015
0.02
0.025
0 0.2 0.4 0.6 0.8 1 1.2 1.4 1.6
Rate
Concentration
Concentration-rate @ T =335K
Figure 16: Concentration-rate plot @ 335K.

Page 7 of 8
Citation: Asiedu N, Hildebrandt D, Glasser D (2013) Kinetic Modeling of the Hydrolysis of Acetic Anhydride at Higher Temperatures using Adiabatic Batch Reactor (Thermos-Flask). J Chem Eng Process Technol 4: 176. doi: 10.4172/2157-7048.1000176
Volume 4 • Issue 8 • 1000176J Chem Eng Process Technol ISSN: 2157-7048 JCEPT, an open access journal
The thermodynamic information extracted from the experiments was the heat of the reaction (∆Hrxn). This was assumed to be independent of temperature and was determined by using eq 8. Tables 11-13 shows ∆Hr values of the various experiments.
Discussion of ResultsThe experimental results in all the processes studied showed that
a strong relationship exists between reaction rates and changes in temperature for exothermic reactions as stated in the literature [9,10]. The reactions between excess water (10 mols) and acetic anhydride (1 mol) thus hydrolysis reactions-(A) were carried out at 305K-366K. The extent of the reactions was followed by monitoring the changes in temperature in the reaction vessel (thermos-flask). The experimental and the adiabatic curves are shown in Figures 3-5. The reactions between excess acetic anhydride (2.65 mols) and water (0.55 mol) thus hydrolysis reactions-(B) were carried out at 286 K-368 K. The profiles of experimental and adiabatic curves are shown in Figures 12-14 respectively. The experimental reaction profiles (Hydrolysis process-A and Hydrolysis process-B) of this study shows that hydrolysis process-A and hydrolysis process-B are completely two different processes. One unanticipated finding was the nature of the hydrolysis-B profiles compared with the hydrolysis-A profiles. On the other hand, another interesting finding was the cooling parts of the processes. Hydrolysis-A, showed very gradual cooling process as compared with Hydrolysis-B which showed a cooling process similar to the cooling process of the experimental determination of heat transfer coefficient of the of the reaction vessel (thermos-flask). There may be several possible explanations to these observations. A possible explanation for this might be that the rate of heat loss during the cooling processes is higher for hydrolysis-B than that of hydrolysis-A under the same experimental conditions these parts thus suggests real cooling process. On the other hand, the rate of cooling of the hydrolysis-A processes, although very slow there might be some amount of hydrolysis reactions taking place. It is also interesting to note that, the processes (hydrolysis
ln (k) = -4711.5/T + 11.250R² = 0.9942
-9
-8
-7
-6
-5
-4
-3
-2
-1
0
0.0027 0.0028 0.0029 0.003 0.0031 0.0032 0.0033 0.0034
ln (k
)
1/T (1/K)
Figure 20: Arrhenius plot of experiment-6.
ln (k) = -4015.6/T + 7.1346R² = 0.9984
-7
-6
-5
-4
-3
-2
-1
0
0.0028 0.0029 0.003 0.0031 0.0032 0.0033 0.0034 0.0035
ln (k
)
1/T (1/K)
Figure 19: Arrhenius plot of experiment-5.
T=335KExperiment Concentration Rate Rate constant (k)
4 1.0972539 0.0053749 0.00489855 1.2317951 0.0098262 0.00797716 1.4693163 0.0235028 0.0159953
Average (k) 0.0096236 Standard deviation (k) 0.0057287
Table 11: Variations of temperature, rate and concentration at T =335K.
T=340KExperiment Concentration Rate Rate constant (k)
4 0.9881278 0.0053892 0.00545395 1.1226940 0.01079109 0.00961166 1.3602177 0.0214770 0.0157889
Average (k) 0.0125524 Standard deviation (k) 0.0081873
Table 12: Variations of temperature, rate and concentration at T =340K.
Experiment 4 5 6∆Hrxn(kJ/mol) -53.92 -60.71 -60.99
Table 13: Thermodynamic information of the experiments..
A and B) showed different reaction times for the processes to reach their maximum temperatures during their reactions. This finding was somewhat not surprising. The observed differences discussed is however very significant. The reaction order for all the hydrolysis-A experiments were first order with respect to the acetic anhydride. This is shown in the rate-concentration plots in the Figures 6-8. This result is consistent with other researchers Kralj [2] and Haji et al. [1].
However, contrary to our expectations the rate -concentration plots of the hydrolysis-B was very surprising as the profiles appeared to be part of a parabola suggesting a second other process. This finding is unexpected and has not previously been reported. The rate law temperature dependence were satisfactorily correlated by means of the Arrhenius function for the hydrolysis-A. Figures 9 -11 shows the Arrhenius plots of the hydrolysis-A. From the plots the values of the activation energies and pre-exponential factors were determined as shown in the equations 19-21. Similarities of the activation energies (50.54 kJ/mol, 50.78 kJ/mol, 50.40 kJ/mol) which agrees very well with what is reported by Haji [1] and Kralj [2]. The average activation energy reported in the literature is 50.24 kJ/mol, Haji [1] which differs by +0.65% from the average value reported in this work. For the hydrolysis-B processes, Arrhenius functions for the hydrolysis-B are shown in Figures 18-20. From the plots, the values of the activation energies and pre-exponential factors were determined as shown in the equations 23-25. The activation energies (38.23 kJ/mol, 33.89 kJ/mol, 39.19 kJ/mol) are however smaller than that of the hydrolysis-A, this is not surprising since the studies has shown that the kinetics of the hydrolysis-A and hydrolysis-B appears very different processes. These activation energies of the hydrolysis-B reactions have not been reported in the literature. The heat of the reactions determined from the experiments was assumed to be independent of temperature. The values obtained for hydrolysis-A is shown in Table 7. The average value compared well with what was obtained by Glasser and Williams [9]. The values determined for the hydrolysis-B are shown in the Table 13.
ConclusionsThe kinetics of the reactions acetic anhydride-excess water, excess
acetic anhydride-water has been modeled as a function of temperature in an adiabatic batch reactor (thermos-flask) using a negative coefficient

Page 8 of 8
Citation: Asiedu N, Hildebrandt D, Glasser D (2013) Kinetic Modeling of the Hydrolysis of Acetic Anhydride at Higher Temperatures using Adiabatic Batch Reactor (Thermos-Flask). J Chem Eng Process Technol 4: 176. doi: 10.4172/2157-7048.1000176
Volume 4 • Issue 8 • 1000176J Chem Eng Process Technol ISSN: 2157-7048 JCEPT, an open access journal
thermistor as a measuring device. The results has shown that the acetic anhydride-excess water process at 1: 10 mole ratio the process remains first order at higher temperatures up about 366K with the activation energy similar to that reported at 298K.
Excess acetic anhydride-water reactions which have no literature information on its kinetics were shown to follow a second order kinetics with respect to the water. The activation energy is approximately 37.1 ± 2.8 kJ/mol. The heat of reaction which was assumed to be independent of temperature for the excess acetic anhydride/water is approximately 58.5 ± 4.0 kJ/mol. The heat of mixing was assumed negligible and was not considered in the heat of reaction calculations. This studied has shown that the two processes studied appears to be completely different processes and may have completely different reaction mechanisms pathways for the acetic acid production.
Acknowledgement
Nana Asiedu would like to thank the National Research Fund (NRF) of South Africa, Directors of Centre of Material Processing and Synthesis (COMPS), Prof. David Glasser and Prof Diane Hildebrandt, University of Witwatersrand, Johannesburg, South Africa for financial support of this work.
Nomenclature
∆Hrxn- heat of reaction (KJ/mol)
∆T (ad) – adiabatic temperature change (K)
∆ε – extent of reaction
A – preexponential factor
B,C – thermistor constants
CA - concentration of A (mol/L)
CP – specific heat capacity
CP,AA – specific heat capacity of acetic anhydride
CP,mix - constant heat capacity of reaction mixture (kJ/mol.K)
CP,W – specific heat capacity of water
Ea – activation energy
Itotal – total current of the circuit
k1, k2, k3 - specific rate constant
m – mass
MAA – Mass of acetic anhydride
MAA – Mass of water
Meqv – Equivalent amount of water
MT - mass of reaction mixture(Kg)
NA – mole of A (mol)
p - probability factor
Q - heat produced by stirrer
R – molar gas constant
R2 – known resistance in the circuit
rA – rate of reaction of (A)
RTH – Thermistor resistance
t – time
T – absolute temperature
Tmax – maximum temperature (K)
To – initial temperature
T - reactor temperature (K)
TS – steady state temperature (K)
Ts – steady-state temperature
U – heat transfer coefficient (J/m2 s.K)
v – total voltage of the circuit
V -volume
Vout – voltage measured by thermistor
VTH – voltage across thermistor resistance
Z - collission frequency
α, β - constants
References
1. Kraji AK (2007) Checking the Kinetics of Acetic Acid production by Measuringthe conductivity. J Ind Eng 13: 631-636.
2. Haji S, Erkey C (2005) Kinetics of hydrolysis of acetic anhydride by in situ FTIR spectroscopy. Chemical Engineering Education 56-61.
3. King RP (1967) Estimation of parameters in systems Defined by Differential Equations. S Afr J Sci 91-96.
4. Livingstone R (1961) Technique of organic chemistry. Weissberger edn, VII,2nd edn, Intersicience NY.
5. Bell RP, Clunie JC (1952) A Thermal Method of Following Fast Reactions inSolution. Proc Roy Soc Lond A 212: 16-32.
6. Schmidt JP, Mickley HS, Grotch SL (1964) Use of adiabatic experiments forkinetic studies in fixed catalyst beds. AIChE 10: 149-154.
7. Eldridge JW, Piret EL (1950) Continuous-flow stirred-tank reactor system I. Design equations for homogeneous liquid phase reactions, Experimental data. Chem Eng Prog 46-290.
8. Williams RD (1974) Indirect Measurement of Reaction Rate. Chem Eng EducWinter 23-30.
9. Glasser D, Williams DF (1971) The study of liquid-phase kinetics usingtemperature as a measured variable. Ind Eng Chem Fundam 10: 516-519.
10. King RP, Glasser D (1967) The use of Adiabatic Calorimeter for Reaction Rate Studies. S Afr Ind Chem 12-15.
11. Considine DM (1957) Process Instruments and Controls Hand book. MCgraw-Hill Book Co., Inc., New York, 2-60.