Embed Size (px)
Citation preview

Accepted Manuscript
Kinetic Modeling of the Oxidative Dehydrogenation of Ethane to Ethylene overa MoVTeNbO Catalytic System
Gamaliel Che-Galicia, Roberto Quintana-Solórzano, Richard S. Ruiz-Martínez,Jaime S. Valente, Carlos O. Castillo-Araiza
PII: S1385-8947(14)00474-4DOI: http://dx.doi.org/10.1016/j.cej.2014.04.042Reference: CEJ 12021
To appear in: Chemical Engineering Journal
Received Date: 5 February 2014Revised Date: 7 April 2014Accepted Date: 11 April 2014
Please cite this article as: G. Che-Galicia, R. Quintana-Solórzano, R.S. Ruiz-Martínez, J.S. Valente, C.O. Castillo-Araiza, Kinetic Modeling of the Oxidative Dehydrogenation of Ethane to Ethylene over a MoVTeNbO CatalyticSystem, Chemical Engineering Journal (2014), doi: http://dx.doi.org/10.1016/j.cej.2014.04.042
This is a PDF file of an unedited manuscript that has been accepted for publication. As a service to our customerswe are providing this early version of the manuscript. The manuscript will undergo copyediting, typesetting, andreview of the resulting proof before it is published in its final form. Please note that during the production processerrors may be discovered which could affect the content, and all legal disclaimers that apply to the journal pertain.
Kinetic Modeling of the Oxidative Dehydrogenation of Ethane to
Ethylene over a MoVTeNbO Catalytic System
Gamaliel Che-Galiciaa, Roberto Quintana-Solórzanob,*, Richard S. Ruiz-Martíneza, Jaime S.
Valenteb, Carlos O. Castillo-Araizaa,*
a Grupo de Procesos de Transporte y Reacción en Sistemas Multifásicos, Depto. de IPH, Universidad
Autónoma Metropolitana - Iztapalapa, Av. San Rafael Atlixco No. 186, C.P. 09340, México D.F.,
MÉXICO
b Instituto Mexicano del Petróleo, Eje Central Lázaro Cárdenas Norte No. 152, C.P. 07730, México D.F.,
MÉXICO
*To whom correspondence should be addressed:
E-mail, corresponding author I: [email protected] (C.O.C.A.)
E-mail, corresponding author II: [email protected] (R.Q.S.)
Tels: + 52 55 5804 4648 (C.O.C.A), + 52 55 9175 8530 (R.Q.S.)

Abstract
The oxidative dehydrogenation of ethane to ethylene (ODH-Et) is investigated over a high
activity-selectivity MoVTeNb mixed oxide. Experiments are performed using a mixture of
ethane, oxygen and nitrogen as feedstock, at temperatures from 400 to 480 °C, inlet partial
pressures of oxygen and ethane from 5.0 to 24.2 kPa, and space-times from 10 to 140
gcat·h·molethane-1. Ethylene selectivity varies from 76 to 96 %, for an ethane conversion range 17 -
85 %. In a set of experiments at 440 °C feeding ethylene instead of ethane, ethylene conversion is
from 3 to 14 % and COx are the only reaction products, the CO being the dominant species with a
selectivity range 73 - 79 %. Kinetic models based on Langmuir-Hinshelwood-Hougen-Watson
(LHHW) and Mars-van Krevelen (MvK) formalisms, and combinations of them are developed to
describe the ODH-Et. Physicochemical and statistical criteria are employed to contrast the
performance of these kinetic approaches. The LHHW kinetics exhibits the best capacity to
represent the observations, being a potential model for the conceptual design of ODH-Et reactors
in future investigations. Kinetic parameters indicate: (i) ethylene formation is the reaction
demanding the lowest activation energy; (ii) total oxidations of ethane are the reactions
demanding the largest activation energies; (iii) reaction rates, including that of catalyst oxidation,
are weakly affected by changes in the oxygen partial pressure, explaining the high selectivity to
ethylene of MoVTeNbO; and (iv) water is the component with the highest affinity to be adsorbed
on active sites affecting negatively reaction rates.
Key words: Oxidative dehydrogenation reaction; MoVTeNbO catalyst; ethylene; kinetic
modeling; Langmuir-Hinshelwood-Hougen-Watson; Mars-van Krevelen.
Abbreviations: ER: Eley-Rideal; FID: flame ionization detector; GC: gas chromatograph;
LHHW: Langmuir-Hinshelwood-Hougen-Watson; MvK: Mars-van Krevelen; MvK-LHHW:

Mars-van Krevelen and Langmuir-Hinshelwood-Hougen-Watson; ODEs: ordinary differential
equations; ODH-Et: oxidative dehydrogenation of ethane to ethylene; RDS: rate-determining
steps; TCD: thermal conductivity detector.
1 Introduction
Ethylene is a basic material for the world's Petrochemical Industry. This olefin is the main
raw material for the production of polyethylene, ethylene oxide and ethylene dichloride, among
others important chemical products. In 2012, it is reported that the global ethylene demand nearly
reached 141 million tons and is expected to increase to more than 150 million tons in 2015 [1].
Presently, ethylene is mainly produced via the steam cracking of diverse hydrocarbon streams,
particularly gas oils, naphtha, LPG as well as natural gas and, in a minor grade, via the direct
(catalytic) dehydrogenation of ethane along with the fluid-catalytic-cracking of gas oils [2]. All
the current conventional processes to produce ethylene, however, exhibit a set of drawbacks
related to thermodynamics, energy requirements, catalyst deactivation by coke deposition, control
of conversion/selectivity and products separation [3-5]. By reason of all these limitations and
considering the continuous increase in the worldwide demand of ethylene, the design of new
processes to cope with these industrial deficiencies is clearly mandatory.
The catalytic oxidative dehydrogenation of ethane to ethylene (ODH-Et) appears as an
attractive alternative to complement and even gradually replace the current commercial processes
for ethylene production. Nevertheless, there are still some important issues to be dealt with by
academy and industry in order to extend the ODH-Et to a commercial scale, the development of a
highly active and selective catalyst being one of the most crucial matters. Even though several
catalytic systems have been reported in the literature to be active for the ODH-Et [6-12], a
multimetallic mixed oxide containing Mo, V, Te and Nb (MoVTeNbO) corresponds to one of the
most promising materials in view of its high of conversion of ethane and selectivity to ethylene,

attributed to the presence of two crystalline phases designated M1 and M2, the former having the
most important contribution to the catalytic performance [13-22]. Specifically, for MoVTeNbO
catalysts, it has been proposed that V species are the active sites in ethane activation, the presence
of Mo species enhance the catalytic activity of V atoms, the role of Te species is directly
associated with the formation of an active and selective crystalline phase M1 and the Nb species
seem to have a promoter effect enhancing the selectivity to ethylene [13,14,23-26]. It is also
noteworthy that the MoVTeNbO system starts to be active for the ODH-Et at temperatures below
400 ºC, a value substantially lower compared with the one required by the existing commercial
thermal processes. Evidently, decreasing the operating temperature not only leads to a substantial
energy saving but also decreases the number of side reactions. Also, during the ODH-Et,
advantageously, a limited number of reaction products (ethylene, carbon dioxide, carbon
monoxide and water) are observed, while the catalyst does not undergo deactivation by coke due
to the presence of molecular oxygen in the reaction mixture [27-29]. The aforementioned
MoVTeNbO catalytic system is a high efficiency novel material for the ODH-Et that presents
remarkably high values of selectivity to ethylene (>90 %) at levels of ethane conversion ca. 60 %,
as reported elsewhere [13,14,22]. Therefore, envisaging a possible future application of this
material formulation on the conceptual design of catalytic reactors, it is necessary to develop its
own kinetics.
The number of papers addressing kinetic aspects related to the ODH-Et is not large
[6,22,30-40]. Some reported kinetics are based on macroscopic mechanisms such as Langmuir-
Hinshelwood-Hougen-Watson (LHHW) [30-35], Eley-Rideal (ER) [36,37], Mars-van Krevelen
(MvK) [38,39] or a combination of MvK and LHHW (MvK-LHHW) [40]. Other models based
on Power Law (PL) empiricisms have been also reported [22,38]. Even though all these models
are specific for each catalyst formulation and do not take into consideration elementary steps,
some aspects about the macro mechanism can be deduced from them. In fact, concerning
mechanistic issues, there is no unanimity yet about the macroscopic mechanisms involved in the
ODH-Et [6,30-40]. The discussion has been mainly focused on defining the “type of oxygen”,
i.e., lattice oxygen or superficial oxygen adsorbed from the gas phase on the active site is
responsible for the ODH-Et leading to ethylene and total oxidation products. Additionally, it is
still on debate whether the fed ethane reacts in the gas phase or as an adsorbed species on the
catalyst surface, and whether the reaction products have an influence on the catalyst performance
or not. On the basis of a LHHW kinetics over a V2O5/SiO2 reported elsewhere [30], it was
concluded that water has a strong influence on the rate of ethylene formation and that
intermediate oxygenated species contribute substantially to the formation of carbon oxides.
Another LHHW kinetics obtained over a VOx/c-Al2O3 catalyst in the absence of gas phase
oxygen [35], demonstrated that the competitive adsorption of ethane, ethylene and carbon oxides
occurred and had a positive effect on the formation of active sites selective to ethylene
production. Besides, an ER formalism, which considers that gas phase ethane reacts with
adsorbed oxygen over a (K-doped) V2O5/SiO2 [36], suggested that water adsorbed on the catalyst
surface impacted negatively on both ethane conversion and ethylene selectivity. Likewise, MvK
kinetics on a mixed Ni-Nb oxide [38] suggested that oxygen in the catalyst lattice produced two
types of active sites, one responsible for the ethylene formation and ethylene total oxidation, and
the other involved in the ethane total oxidation. Finally, a combination of MvK-LHHW
formalisms over a VOx/γ-Al2O3 catalyst [40] indicated that the MvK mechanism governs
ethylene formation, whereas ethane and ethylene total oxidations occur in accordance with a
LHHW mechanism.
The purpose of this work is, thus, to develop a series of kinetic models based upon LHHW
and MvK formalisms, and combinations of them, to describe the catalytic ODH-Et. The kinetics
are novel as they characterize the performance of a high activity-selectivity MoVTeNb mixed
oxide on the aforementioned reaction. The parameters associated to the kinetics models are
obtained via a nonisothermal regression of steady-state catalytic experimental data obtained in a
laboratory scale fixed-bed reactor. Both physicochemical and statistical criteria are used to
contrast the developed models and then select the most suitable one. Apart from obtaining rate
equations that can be readily used for the reactor design and scale-up, the combination of
experimental issues with kinetic information can contribute to a better understanding of the
macroscopic mechanism involved in the ODH-Et.
2 Experimental procedures
2.1 Catalyst preparation
A multimetallic mixed oxide with a nominal atomic ratio of Mo:V:Te:Nb equal to
1:0.24:0.24:0.18 was synthesized. The preparation procedure comprised a set of steps which are
briefly described herein; (i) preparing at 80 °C and continuous stirring an aqueous solution
containing tetra-hydrated ammonium hepta-molybdate (Merck, 99 %), telluric acid (Aldrich, 98
%), and ammonium meta-vanadate (Sigma-Aldrich, 99.5 %); (ii) separately preparing at 80 °C a
second aqueous solution containing niobium oxalate (ABCR Lab. 99 %) and oxalic acid
(Aldrich, 98 %). Solution of step (ii) was added to the solution of stage (i) keeping a vigorous and
continuous stirring to yield a slurry, which was then cooled to room temperature. Next, the pH of
the aforementioned slurry was adjusted to 2.5 with the addition of 1 M nitric acid. The acidified
slurry was later placed in a rotary evaporator operated at 50 °C and 27 kPa to gradually eliminate
the water. The resultant powder was dried overnight at 100 °C and finally activated by means of a
thermal treatment at 600 °C for 2 h under nitrogen flow. Some additional details about the
catalyst preparation procedure along with a set of important physicochemical properties of the
resulting solid were reported previously [22].
2.2 Kinetic experiments
2.2.1 Experimental Setup
Measurements of the catalytic performance were carried out in a tubular fixed-bed reactor
made of quartz with an internal diameter of 1.0×10⁻² m and length of 4.0×10⁻² m, which was
operated isothermally and at atmospheric pressure (ca. 80 kPa). All tests were performed over a
bed consisting of 0.60 g of catalyst, sieved for an average particle size equal to 150 µm prior to
be loaded into the reactor. The reaction feedstock was composed of a mixture of ethane (or
ethylene), oxygen and nitrogen with a varying composition depending on the experiment. In
order to obtain the data required to calibrate the aforementioned kinetic models, three sets of
experiments were effectuated. In the first set both temperature and space-time (Wcat·Fethane,o-1)
were varied within the ranges 400 - 480 ºC for the former, and 23 - 70 gcat·h·molethane-1, keeping
constant the inlet partial pressure of ethane, oxygen, and nitrogen at 7.0, 5.5, and 65.5 kPa,
respectively. The second set of experiments was performed at 440 ºC varying the inlet partial
pressure of ethane (2 6
oC Hp ) at constant inlet partial pressure of oxygen (
2
oOp ), and vice versa; thus,
the inlet partial pressure of each reactant was spanned from 5.1 to 22.3 kPa resulting in a
Wcat·Fethane,o-1 range from 10 to 140 gcat·h·molethane
-1. The third set of experiments was carried out
feeding into the reactor ethylene instead of ethane at the operating conditions used in the second
set of experiments. In the absence of catalyst, no reaction between ethane and oxygen occurred in
a test performed at 480 °C.
An assessment of the mass and heat disguises at pellet scale was performed in accordance
with the procedure and criteria outlined elsewhere [41]. Deviations to the ideal flow pattern of the
reactor were also evaluated. Some of the basic parameters used to assess the referred criteria were
the following: catalyst bed length of 8.5×10⁻³ m, bed porosity of 0.3 m3·m-3; effective diffusion
coefficient of 2.75 × 10⁻⁵ m2·s-1; catalysts tortuosity of 5.0 m·m-1, specific reaction rate of ethane
of 3.44 × 10⁻⁶ mol·(gcat·s)-1, reaction temperature of 480 ºC, ethane conversion of 0.85 mol·mol-1;

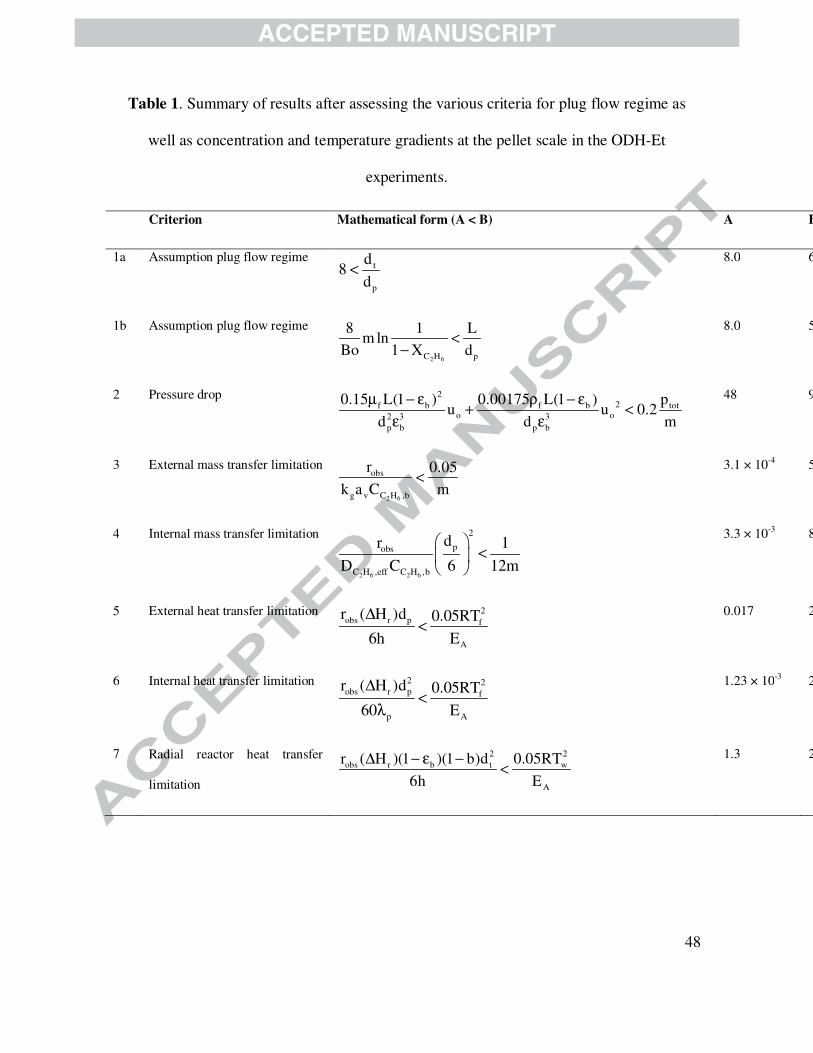
and activation energy for ethane oxidative dehydrogenation equal to 90.0 kJ·mol-1. Table 1
displays a summary of the assessed kinetic criteria for an experiment performed at the most
severe conditions, i.e., those leading to the maximum specific reaction rate of ethane, which
indicate that experimental observations were obtained under plug flow conditions and in absence
of internal and external, heat and mass transfer resistances.
Table 1 is shown here.
2.2.2 Analysis of reaction products
The compositions of the reactor by-pass and the reactor effluent were analyzed online in an
Agilent 7890A Gas Chromatograph (GC). GC’s configuration includes two detectors, a flame
ionization detector (FID) and a thermal conductivity detector (TCD), as well as an array of three
columns, namely, a 30 m × 0.53 mm × 40 µm HP Plot Q, a 30 m × 0.25 mm × 5 µm HP Plot
Al2O3/S and a 30 m × 0.53 mm × 50 µm molecular sieve. Hydrocarbons were quantified in the
FID whereas non hydrocarbons (COx, nitrogen, oxygen, etc.) in the TCD. By applying Eq. (1),
the molar outlet flow rate of any component n was calculated by means of the internal standard
method employing chromatographic information:
i.s. i.s n nn
i.s. i.s. n
F M A dF
A d M= × (1)
Fn is outlet molar flow rate, Mn corresponds to the molecular mass An denotes the
chromatographic surface area, and dn is the chromatographic calibration factor. The subscript i.s.
is used to denote the internal standard, nitrogen being utilized.
The conversion of hydrocarbons (ethane or ethylene) denoted by XHC (Eq. (2)) as well as
the selectivity to a n product referred to as Sn (Eq. (3)) were based on a carbon mass balance
and computed as follows:
HC,in HC,outHC
HC,in
F FX 100
F
−= × (2)
nn
HC,in HC,out
F CS 100
2 (F F )= ×
−
(3)
where FHC is molar flow rate of the hydrocarbon used as reactant, Fn is outlet molar flow rate of
the product n and C is the carbon number of species n.
3 Kinetic Modeling
As a first step in the construction of a kinetic model, a global reaction network based on the
experimental observations is proposed, vide Fig. 1. This reaction network includes the species
detected by gases chromatography, namely, ethane, ethylene, carbon monoxide and carbon
dioxide. As also indicated in Fig. 1, oxygen is present as a second reagent while water is
invariably a reaction product in all reactions. Both parallel and consecutive reactions are
accounted for in which ethylene is produced from ethane (r1), carbon oxides (COx) are formed
out of the combustion of ethane corresponding to r2 and r3, and from the secondary combustion of
ethylene, vide r4 and r5.
Figure 1 is shown here.
Four kinetic models based on different macroscopic mechanistic approaches are developed
to characterize the ODH-Et over MoVTeNbO catalyst. Specifically, the first model is based on a
LHHW formalism, the second model is supported on a MvK formalism, while the third and
fourth models are constructed on a combination of MvK and LHHW, as will be discussed in
detail in Sections 3.1 to 3.3. It is important to point out that in the development of all these
models, the effect of the products on catalysts is captured indirectly by the estimated effective
parameters since for all studied operating conditions products accumulation (ethylene, COx and
water) was observed at different levels and, hence, the parameter estimation made use of total
products that were collected at the outlet of the steady-state reactor.
3.1 Langmuir-Hinshelwood-Hougen-Watson model
The kinetic model based on the LHHW formalism is constructed taking into consideration
the next assumptions: (i) there is a single type of active sites over the whole catalyst surface, (ii)
there is competitive adsorption of reactants (ethane and oxygen) and products (ethylene, carbon
oxides and water) for the active sites, (iii) oxygen adsorption is dissociative while that of the
other species is associative, (iv) surface reaction steps are considered fast taking place over a
finite number of active sites, (v) surface reactions are rate-determining steps (RDS), (v) all
products are susceptible to be re-adsorbed over the active sites, (vi) adsorption and desorption
steps are quasi-equilibrated. In a previous publication [22], apparent reaction orders for both
hydrocarbons and oxygen were found to be positive out of experiments over the MoVTeNbO
catalyst and, therefore, the adsorption of reagents is discarded as RDS.
Table 2 includes the reaction steps considered for building the kinetics (S represents the
active sites); namely, steps A and B denotes the adsorption of main reagents (oxygen and ethane),
steps 1 to 5 corresponds to the surface reactions, and steps C to F represent the desorption of
products. In Table 2, σj is the so-called Horiuti stoichiometric number used for describing the
times that each adsorption, desorption and reaction steps has to occur in order to complete a
single catalytic cycle comprising the overall reactions, the latter represented by steps I to V.
Notice that the adsorption of molecular O2 (step A) is a crucial stage for the surface reactions to
take place (steps 1-5).
Table 2 is shown here.
The rate of the five reactions (ri), accounted for in the reaction network of Fig. 1, are
expressed by eqs. (4) to (8). Notice that the calculation of ri involves a rate coefficient denoted by
ki, an adsorption equilibrium coefficient for the n-th component represented by Kn, the fraction
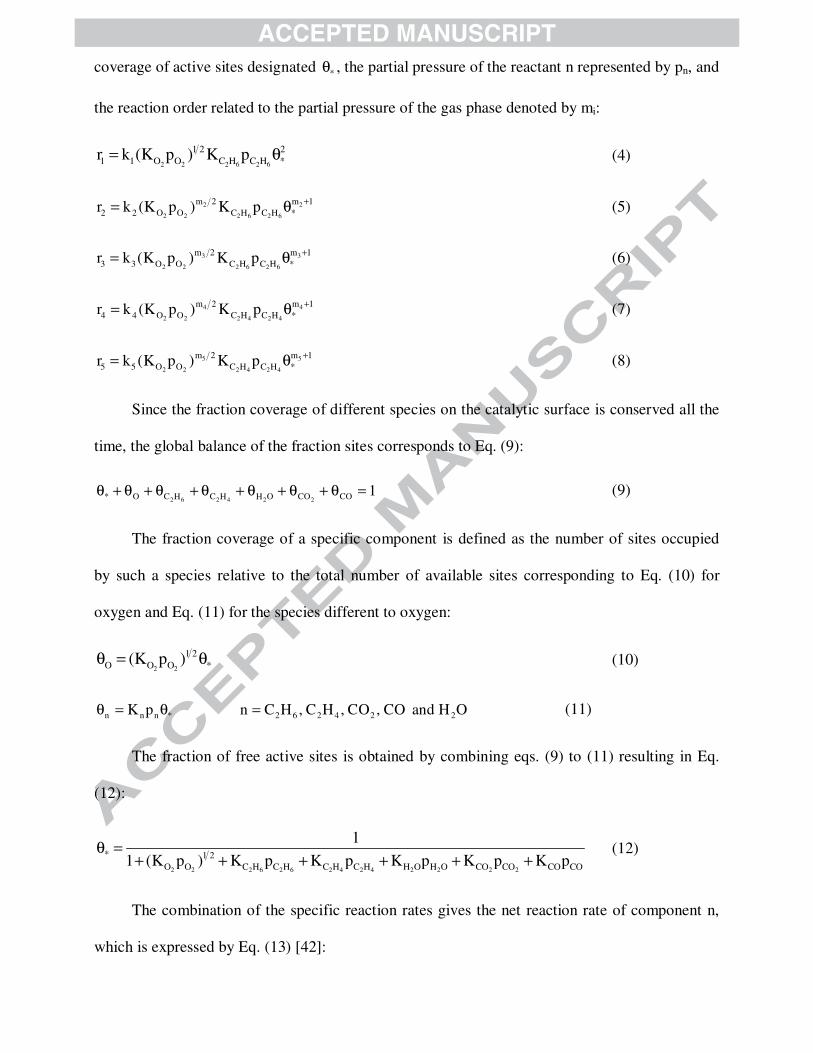
coverage of active sites designated *θ , the partial pressure of the reactant n represented by pn, and
the reaction order related to the partial pressure of the gas phase denoted by mi:
2 2 2 6 2 6
1 2 21 1 O O C H C H *r k (K p ) K p= θ (4)
2 2
2 2 2 6 2 6
m 2 m 12 2 O O C H C H *r k (K p ) K p += θ (5)
3 3
2 2 2 6 2 6
m 2 m 13 3 O O C H C H *r k (K p ) K p += θ (6)
4 4
2 2 2 4 2 4
m 2 m 14 4 O O C H C H *r k (K p ) K p += θ (7)
5 5
2 2 2 4 2 4
m 2 m 15 5 O O C H C H *r k (K p ) K p += θ (8)
Since the fraction coverage of different species on the catalytic surface is conserved all the
time, the global balance of the fraction sites corresponds to Eq. (9):
2 6 2 4 2 2* O C H C H H O CO CO 1θ + θ + θ + θ + θ + θ + θ = (9)
The fraction coverage of a specific component is defined as the number of sites occupied
by such a species relative to the total number of available sites corresponding to Eq. (10) for
oxygen and Eq. (11) for the species different to oxygen:
2 2
1 2O O O *(K p )θ = θ
(10)
n n n * 2 6 2 4 2 2K p n C H , C H , CO , CO and H Oθ = θ = (11)
The fraction of free active sites is obtained by combining eqs. (9) to (11) resulting in Eq.
(12):
2 2 2 6 2 6 2 4 2 4 2 2 2 2
* 1 2O O C H C H C H C H H O H O CO CO CO CO
1
1 (K p ) K p K p K p K p K pθ =
+ + + + + + (12)
The combination of the specific reaction rates gives the net reaction rate of component n,
which is expressed by Eq. (13) [42]:
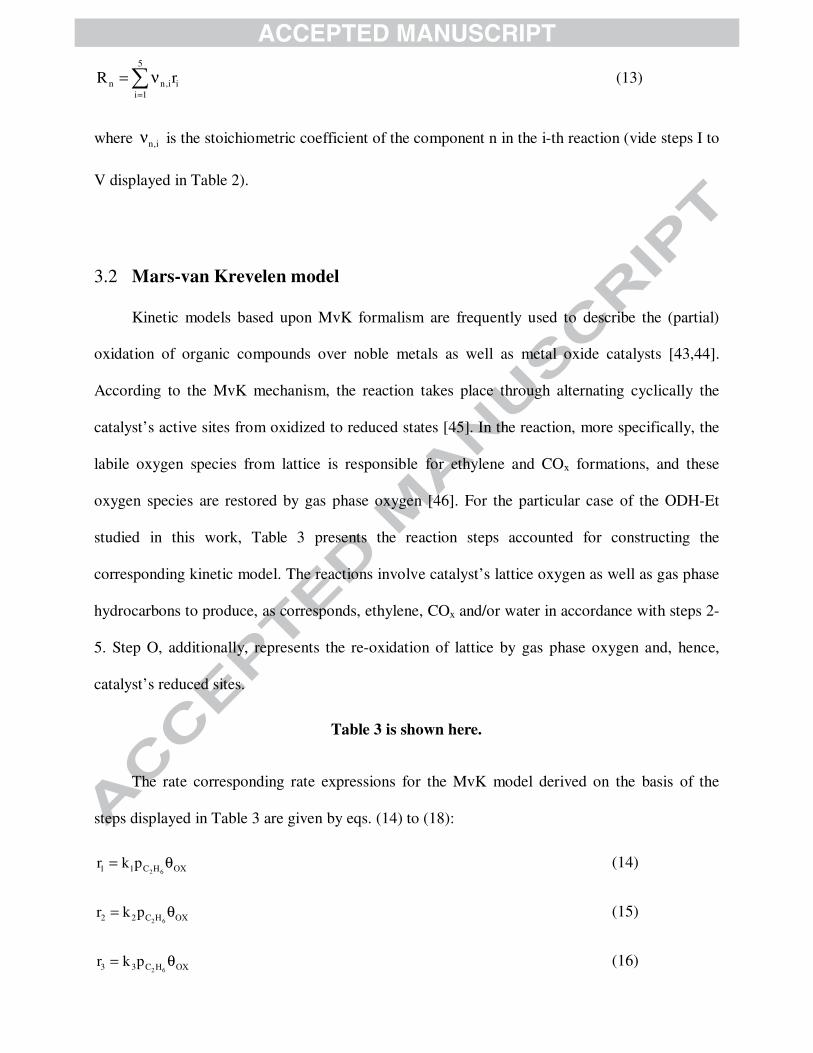
5
n n,i ii 1
R r=
= ν∑ (13)
where n,iν is the stoichiometric coefficient of the component n in the i-th reaction (vide steps I to
V displayed in Table 2).
3.2 Mars-van Krevelen model
Kinetic models based upon MvK formalism are frequently used to describe the (partial)
oxidation of organic compounds over noble metals as well as metal oxide catalysts [43,44].
According to the MvK mechanism, the reaction takes place through alternating cyclically the
catalyst’s active sites from oxidized to reduced states [45]. In the reaction, more specifically, the
labile oxygen species from lattice is responsible for ethylene and COx formations, and these
oxygen species are restored by gas phase oxygen [46]. For the particular case of the ODH-Et
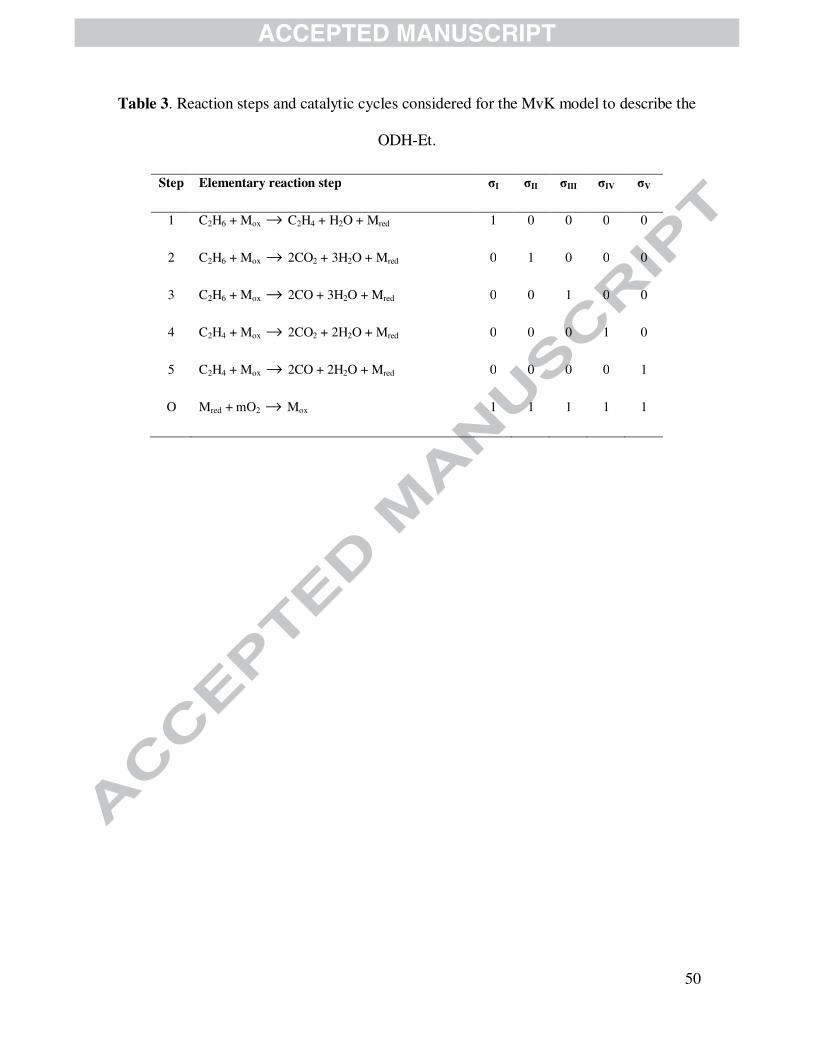
studied in this work, Table 3 presents the reaction steps accounted for constructing the
corresponding kinetic model. The reactions involve catalyst’s lattice oxygen as well as gas phase
hydrocarbons to produce, as corresponds, ethylene, COx and/or water in accordance with steps 2-
5. Step O, additionally, represents the re-oxidation of lattice by gas phase oxygen and, hence,
catalyst’s reduced sites.
Table 3 is shown here.
The rate corresponding rate expressions for the MvK model derived on the basis of the
steps displayed in Table 3 are given by eqs. (14) to (18):
2 61 1 C H OXr k p= θ (14)
2 62 2 C H OXr k p= θ (15)
2 63 3 C H OXr k p= θ (16)
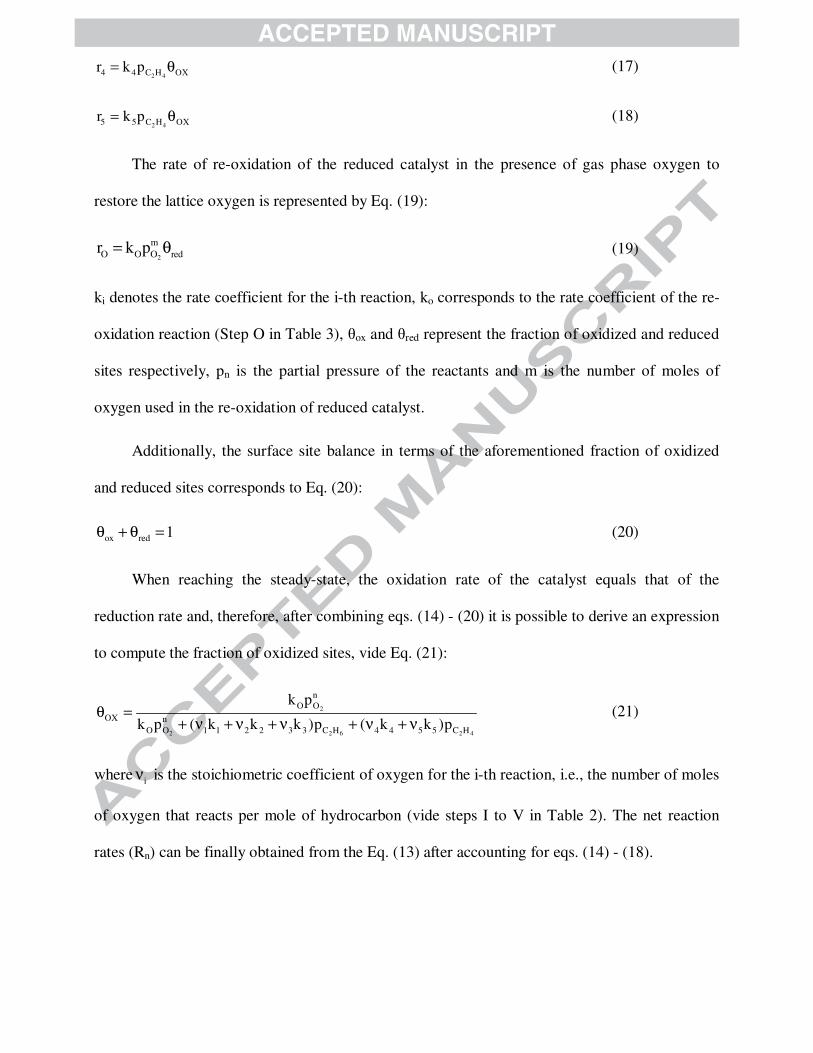
2 44 4 C H OXr k p= θ (17)
2 45 5 C H OXr k p= θ (18)
The rate of re-oxidation of the reduced catalyst in the presence of gas phase oxygen to
restore the lattice oxygen is represented by Eq. (19):
2
mO O O redr k p= θ (19)
ki denotes the rate coefficient for the i-th reaction, ko corresponds to the rate coefficient of the re-
oxidation reaction (Step O in Table 3), θox and θred represent the fraction of oxidized and reduced
sites respectively, pn is the partial pressure of the reactants and m is the number of moles of
oxygen used in the re-oxidation of reduced catalyst.
Additionally, the surface site balance in terms of the aforementioned fraction of oxidized
and reduced sites corresponds to Eq. (20):
ox red 1θ + θ = (20)
When reaching the steady-state, the oxidation rate of the catalyst equals that of the
reduction rate and, therefore, after combining eqs. (14) - (20) it is possible to derive an expression
to compute the fraction of oxidized sites, vide Eq. (21):
2
2 2 6 2 4
nO O
OX nO O 1 1 2 2 3 3 C H 4 4 5 5 C H
k p
k p ( k k k )p ( k k )pθ =
+ ν + ν + ν + ν + ν (21)
where iν is the stoichiometric coefficient of oxygen for the i-th reaction, i.e., the number of moles
of oxygen that reacts per mole of hydrocarbon (vide steps I to V in Table 2). The net reaction
rates (Rn) can be finally obtained from the Eq. (13) after accounting for eqs. (14) - (18).

3.3 Combined Mars-van Krevelen and Langmuir-Hinshelwood-Hougen-
Watson models
As stated above MoVTeNbO catalysts mostly consist of two crystalline phases designated
M1 and M2. It has been suggested that terminating [001] planes of the M1 phase contain the most
active and selective surface sites for ODH-Et, and hence phase M2 seems to be active for the
deep oxidation reactions leading to COx species and water [13]. Based on this, two additional
kinetic models named MvK-LHHW-1 and MvK-LHHW-2, obtained as a result of combining the
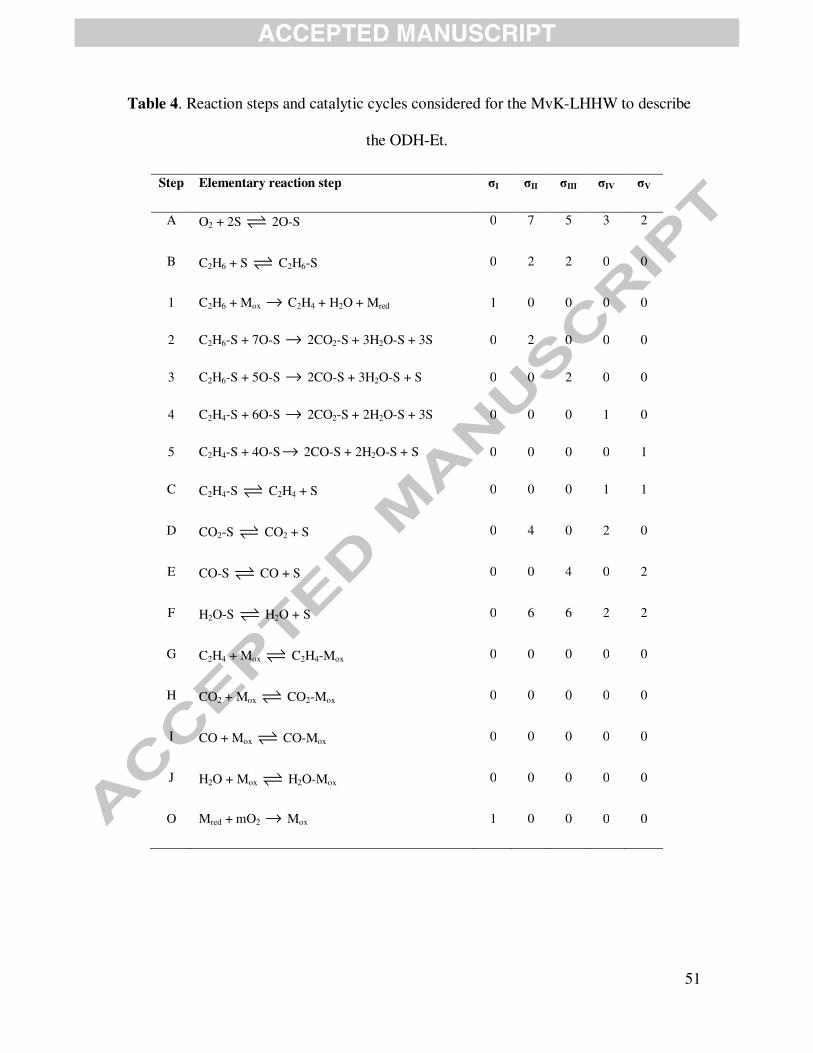
MvK and the LHHW formalisms, are constructed. Table 4 includes all the reaction steps
accounted for building them. In these two kinetic approaches it is assumed the catalyst consists of
two types of active sites, viz., (i) one type denoted as “M”, which is responsible for the ethylene
formation via the ODH-Et reaction (steps 1 and O in Table 4) via a redox mechanism and, (ii) a
second type designated “S” over which the adsorption of both oxygen and ethane occurs leading
to the formation of carbon oxides and water (steps 2 - 5 in Table 4). Notice that the products
formed out of reactions 2 to 5 are susceptible to be re-adsorbed over the sites S corresponding
specifically to the steps C - F included in Table 4. The main difference between MvK-LHHW-1
and MvK-LHHW-2 is that the later model considers that the re-adsorption of all reaction
products on the active sites responsible of ethylene formation (vide steps G to I) can occur, a
scenario that the former model neglects.
Table 4 is shown here.
The MvK-LHHW-1 model is represented by eqs. (5) - (8), (12), (14), (19), (20) and (22).
Particularly, Eq. (14) expresses the rate of reaction 1 corresponding to the formation of ethylene
out of ethane (step 1 in Table 4), and Eq. (19) denotes the re-oxidation of reduced sites (step O in
Table 4). The reaction rate expressions for reactions 2 - 5 (steps 2 - 5 in Table 4) are represented
by eqs. (5) - (8) respectively; whereas the fractional coverage for the free active sites is given by
Eq. (12). After combining the corresponding steady-state of reaction rates represented by eqs.
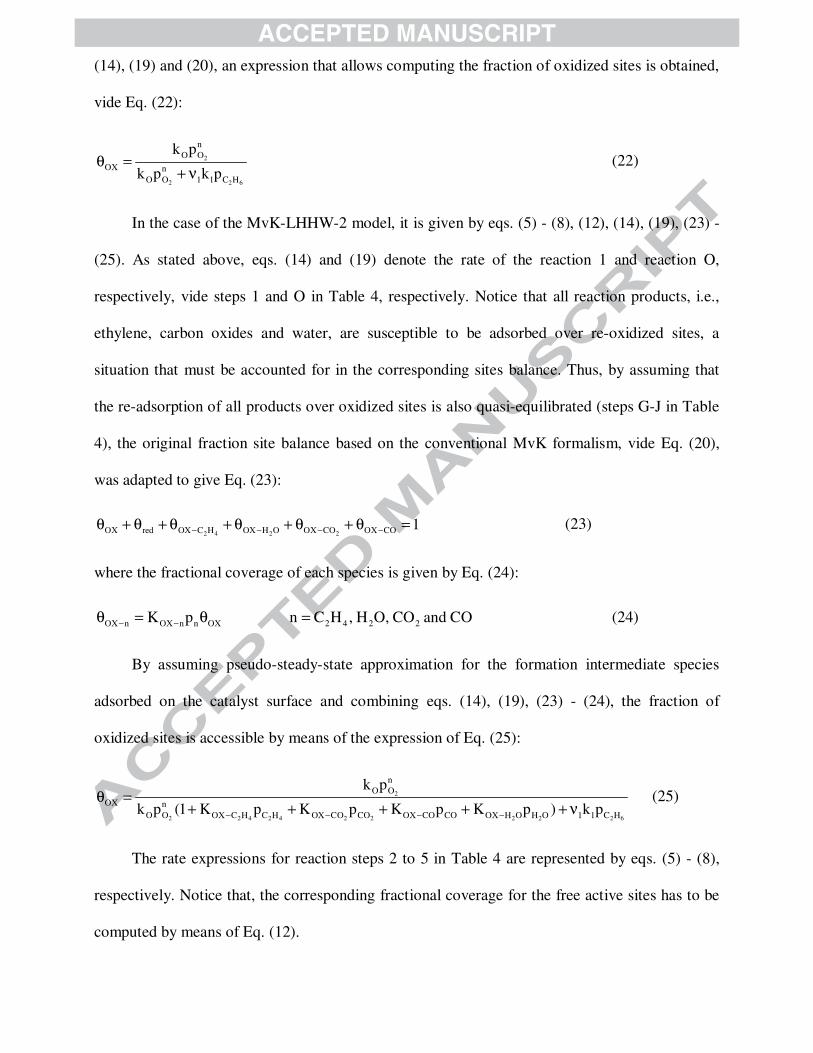
(14), (19) and (20), an expression that allows computing the fraction of oxidized sites is obtained,
vide Eq. (22):
2
2 2 6
nO O
OX nO O 1 1 C H
k p
k p k pθ =
+ ν (22)
In the case of the MvK-LHHW-2 model, it is given by eqs. (5) - (8), (12), (14), (19), (23) -
(25). As stated above, eqs. (14) and (19) denote the rate of the reaction 1 and reaction O,
respectively, vide steps 1 and O in Table 4, respectively. Notice that all reaction products, i.e.,
ethylene, carbon oxides and water, are susceptible to be adsorbed over re-oxidized sites, a
situation that must be accounted for in the corresponding sites balance. Thus, by assuming that
the re-adsorption of all products over oxidized sites is also quasi-equilibrated (steps G-J in Table
4), the original fraction site balance based on the conventional MvK formalism, vide Eq. (20),
was adapted to give Eq. (23):
2 4 2 2OX red OX C H OX H O OX CO OX CO 1− − − −θ + θ + θ + θ + θ + θ = (23)
where the fractional coverage of each species is given by Eq. (24):
OX n OX n n OX 2 4 2 2K p n C H , H O, CO and CO− −θ = θ = (24)
By assuming pseudo-steady-state approximation for the formation intermediate species
adsorbed on the catalyst surface and combining eqs. (14), (19), (23) - (24), the fraction of
oxidized sites is accessible by means of the expression of Eq. (25):
2
2 2 4 2 4 2 2 2 2 2 6
nO O
OX nO O OX C H C H OX CO CO OX CO CO OX H O H O 1 1 C H
k p
k p (1 K p K p K p K p ) k p− − − −
θ =+ + + + + ν
(25)
The rate expressions for reaction steps 2 to 5 in Table 4 are represented by eqs. (5) - (8),
respectively. Notice that, the corresponding fractional coverage for the free active sites has to be
computed by means of Eq. (12).
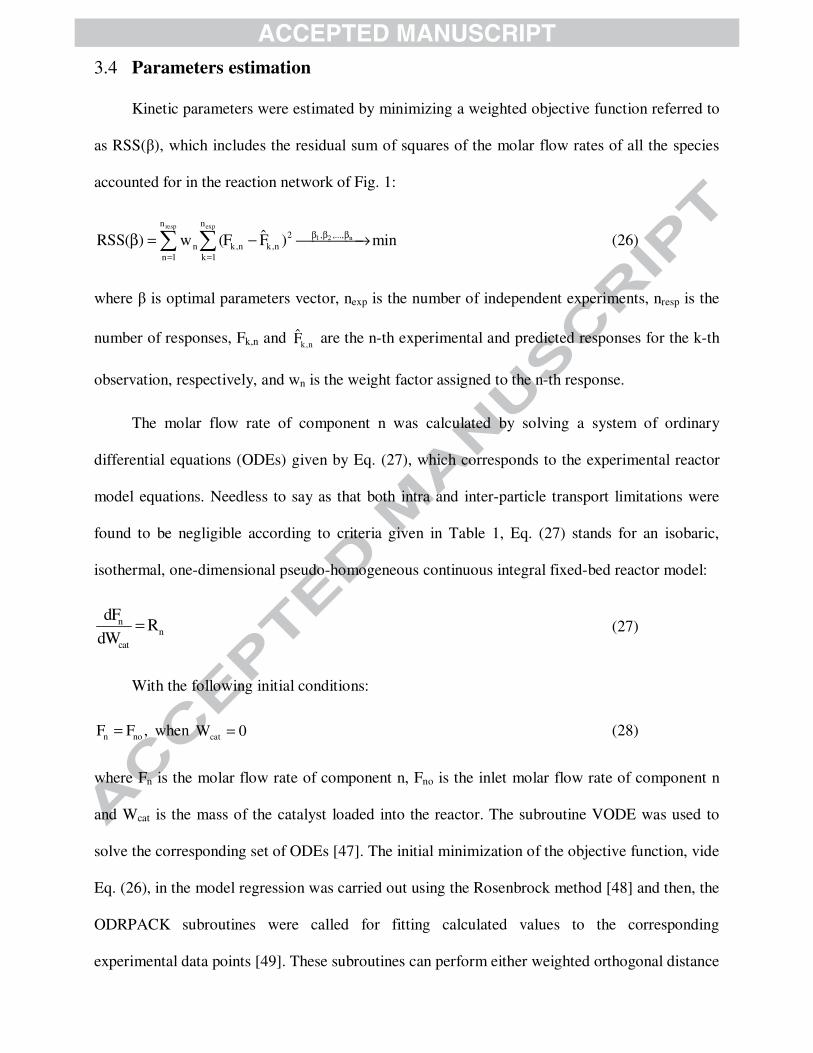
3.4 Parameters estimation
Kinetic parameters were estimated by minimizing a weighted objective function referred to
as RSS(β), which includes the residual sum of squares of the molar flow rates of all the species
accounted for in the reaction network of Fig. 1:
resp exp
1 2 n
n n, ,...,2
n k,n k,nn 1 k 1
ˆRSS( ) w (F F ) minβ β β
= =
β = − →∑ ∑ (26)
where β is optimal parameters vector, nexp is the number of independent experiments, nresp is the
number of responses, Fk,n and k,nF̂ are the n-th experimental and predicted responses for the k-th
observation, respectively, and wn is the weight factor assigned to the n-th response.
The molar flow rate of component n was calculated by solving a system of ordinary
differential equations (ODEs) given by Eq. (27), which corresponds to the experimental reactor
model equations. Needless to say as that both intra and inter-particle transport limitations were
found to be negligible according to criteria given in Table 1, Eq. (27) stands for an isobaric,
isothermal, one-dimensional pseudo-homogeneous continuous integral fixed-bed reactor model:
nn
cat
dFR
dW= (27)
With the following initial conditions:
n noF F ,= when catW 0= (28)
where Fn is the molar flow rate of component n, Fno is the inlet molar flow rate of component n
and Wcat is the mass of the catalyst loaded into the reactor. The subroutine VODE was used to
solve the corresponding set of ODEs [47]. The initial minimization of the objective function, vide
Eq. (26), in the model regression was carried out using the Rosenbrock method [48] and then, the
ODRPACK subroutines were called for fitting calculated values to the corresponding
experimental data points [49]. These subroutines can perform either weighted orthogonal distance
regression or nonlinear least square problems for explicit and implicit models using multi-
response data with an implementation of the Levenberg-Marquardt method, as documented
elsewhere [50].
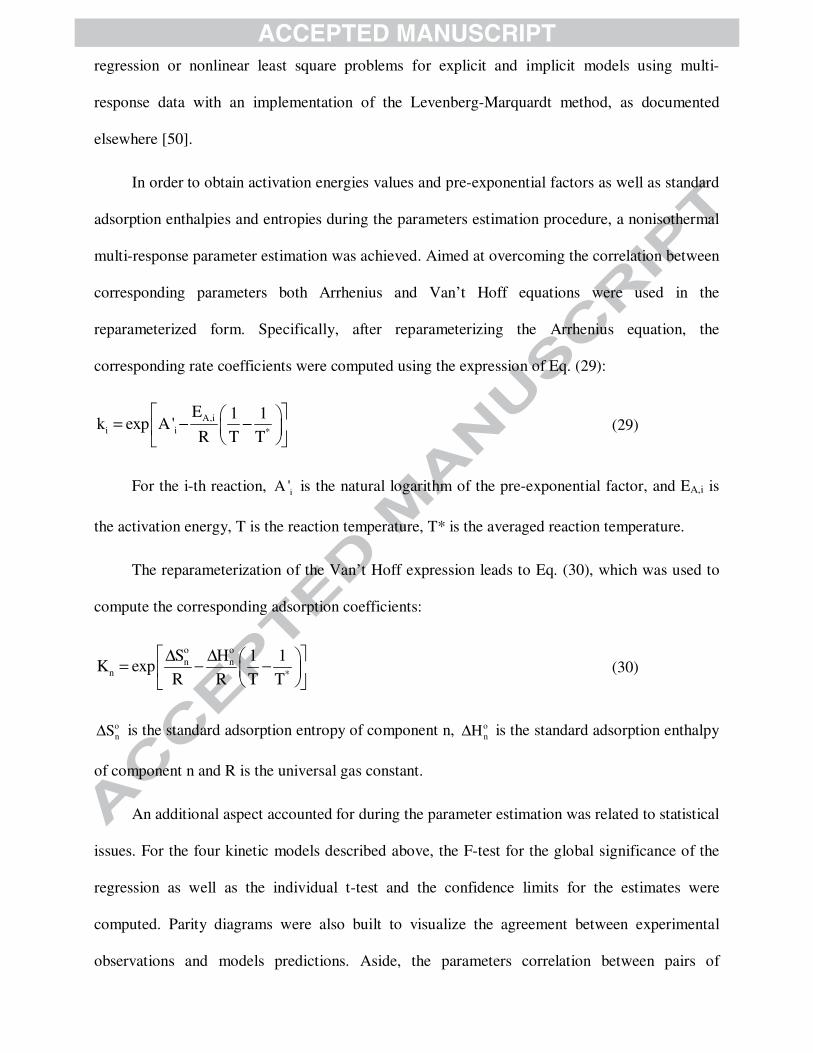
In order to obtain activation energies values and pre-exponential factors as well as standard
adsorption enthalpies and entropies during the parameters estimation procedure, a nonisothermal
multi-response parameter estimation was achieved. Aimed at overcoming the correlation between
corresponding parameters both Arrhenius and Van’t Hoff equations were used in the
reparameterized form. Specifically, after reparameterizing the Arrhenius equation, the
corresponding rate coefficients were computed using the expression of Eq. (29):
A,ii i *
E 1 1k exp A'
R T T
= − −
(29)
For the i-th reaction, iA ' is the natural logarithm of the pre-exponential factor, and EA,i is
the activation energy, T is the reaction temperature, T* is the averaged reaction temperature.
The reparameterization of the Van’t Hoff expression leads to Eq. (30), which was used to
compute the corresponding adsorption coefficients:
o on n
n *
S H 1 1K exp
R R T T
∆ ∆ = − −
(30)
onS∆ is the standard adsorption entropy of component n, o
nH∆ is the standard adsorption enthalpy
of component n and R is the universal gas constant.
An additional aspect accounted for during the parameter estimation was related to statistical
issues. For the four kinetic models described above, the F-test for the global significance of the
regression as well as the individual t-test and the confidence limits for the estimates were
computed. Parity diagrams were also built to visualize the agreement between experimental
observations and models predictions. Aside, the parameters correlation between pairs of
estimated parameters was accounted for by computing the so-called binary linear correlation
coefficients (ρij). When the value of ρij is close to ±1 a strong linear relationship between the
estimated parameters i and j occurs.
4 Results and discussion
4.1 Experiments
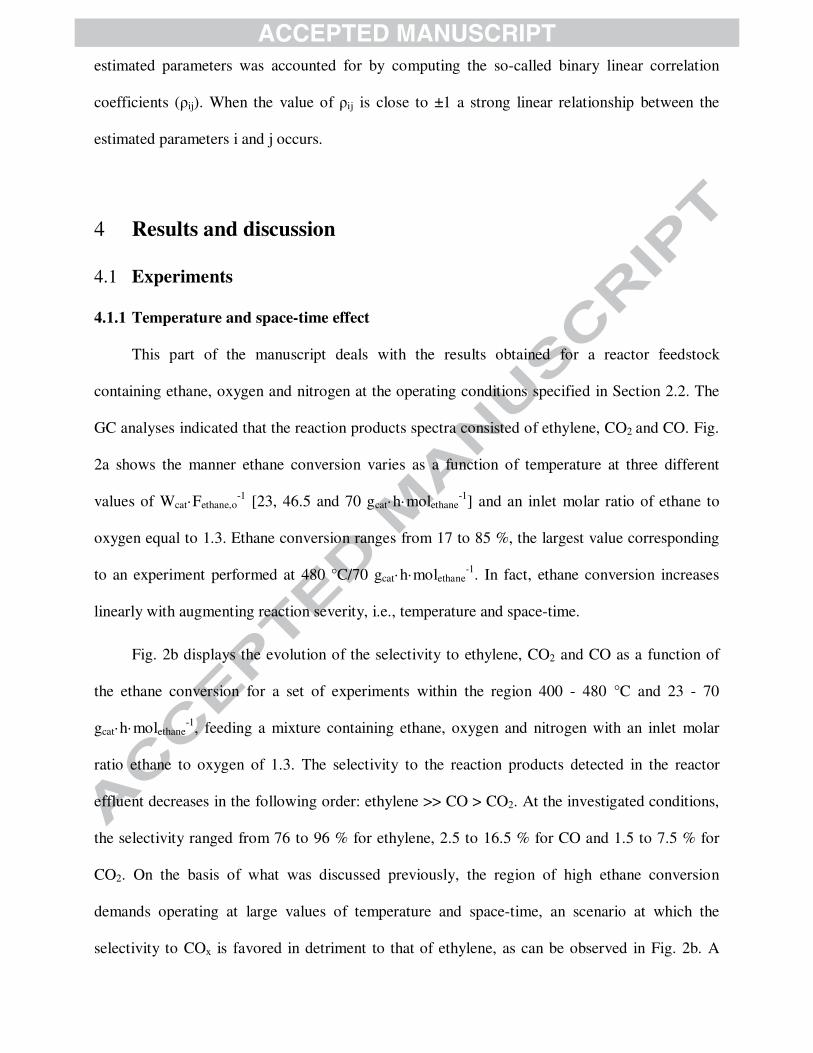
4.1.1 Temperature and space-time effect
This part of the manuscript deals with the results obtained for a reactor feedstock
containing ethane, oxygen and nitrogen at the operating conditions specified in Section 2.2. The
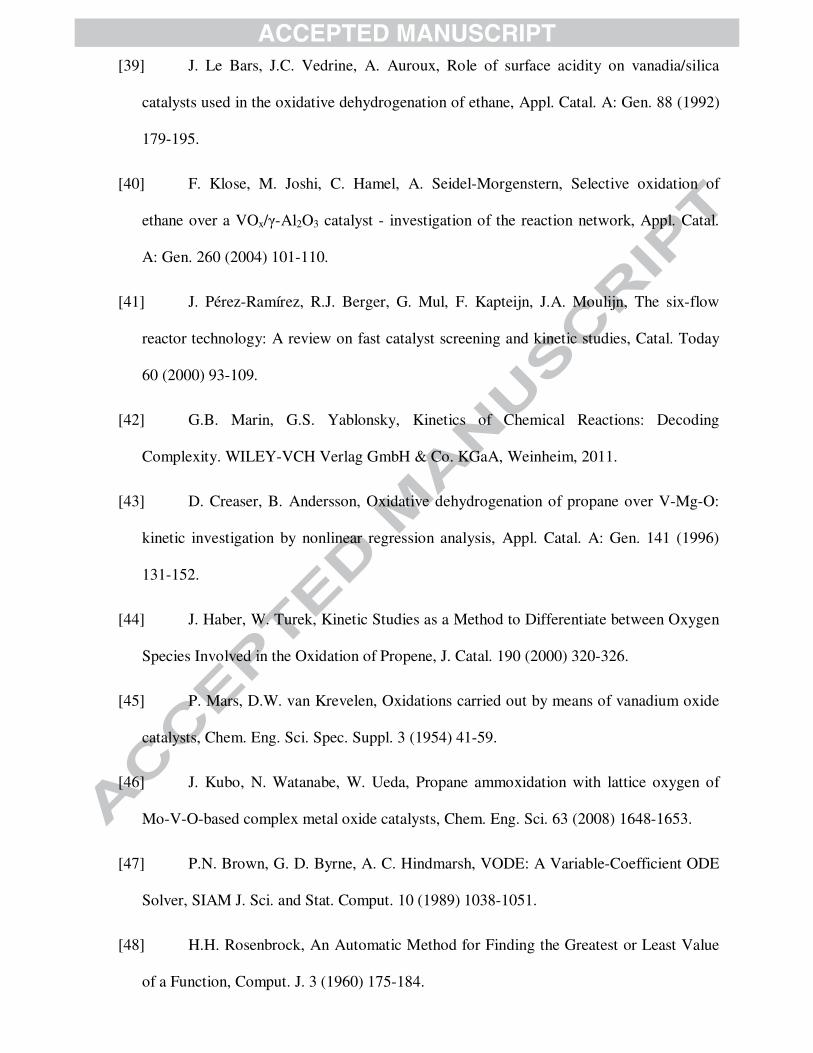
GC analyses indicated that the reaction products spectra consisted of ethylene, CO2 and CO. Fig.
2a shows the manner ethane conversion varies as a function of temperature at three different
values of Wcat·Fethane,o-1 [23, 46.5 and 70 gcat·h·molethane
-1] and an inlet molar ratio of ethane to
oxygen equal to 1.3. Ethane conversion ranges from 17 to 85 %, the largest value corresponding
to an experiment performed at 480 °C/70 gcat·h·molethane-1. In fact, ethane conversion increases
linearly with augmenting reaction severity, i.e., temperature and space-time.
Fig. 2b displays the evolution of the selectivity to ethylene, CO2 and CO as a function of
the ethane conversion for a set of experiments within the region 400 - 480 °C and 23 - 70
gcat·h·molethane-1, feeding a mixture containing ethane, oxygen and nitrogen with an inlet molar
ratio ethane to oxygen of 1.3. The selectivity to the reaction products detected in the reactor
effluent decreases in the following order: ethylene >> CO > CO2. At the investigated conditions,
the selectivity ranged from 76 to 96 % for ethylene, 2.5 to 16.5 % for CO and 1.5 to 7.5 % for
CO2. On the basis of what was discussed previously, the region of high ethane conversion
demands operating at large values of temperature and space-time, an scenario at which the
selectivity to COx is favored in detriment to that of ethylene, as can be observed in Fig. 2b. A
previous publication [22] was devoted to study systematically the combined effect of temperature
and space-time on a set of catalytic responses over the same catalyst formulation.
Figure 2 is shown here.
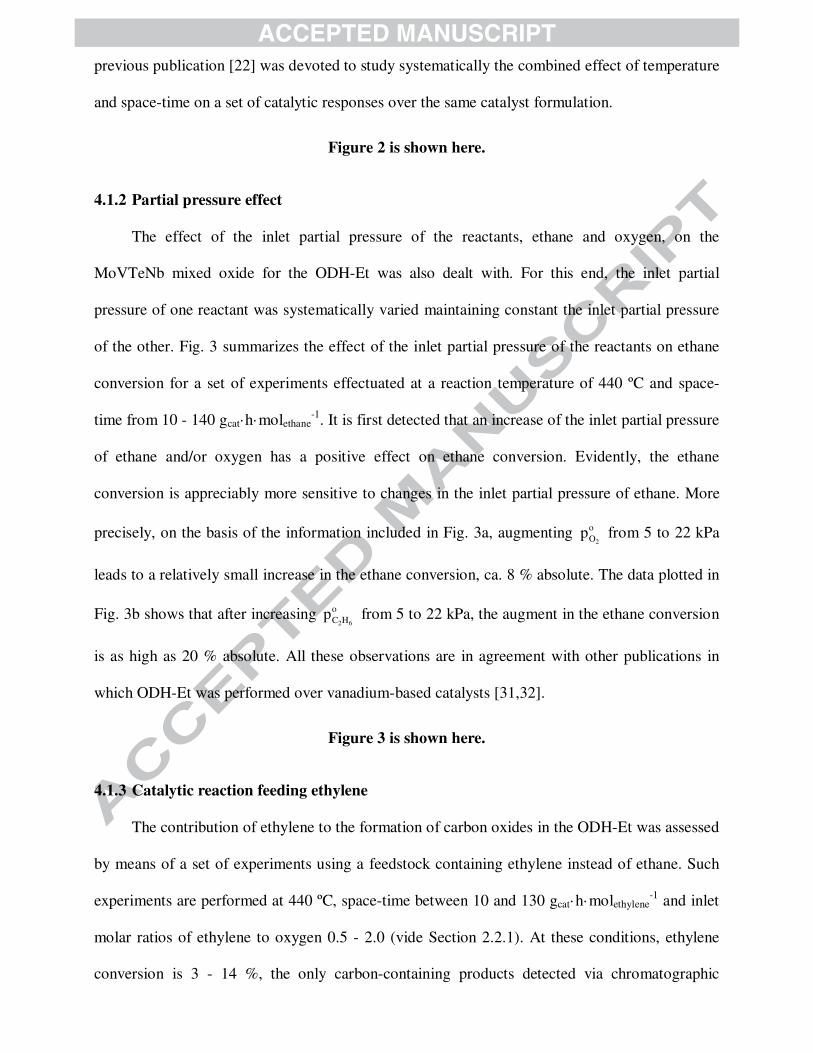
4.1.2 Partial pressure effect
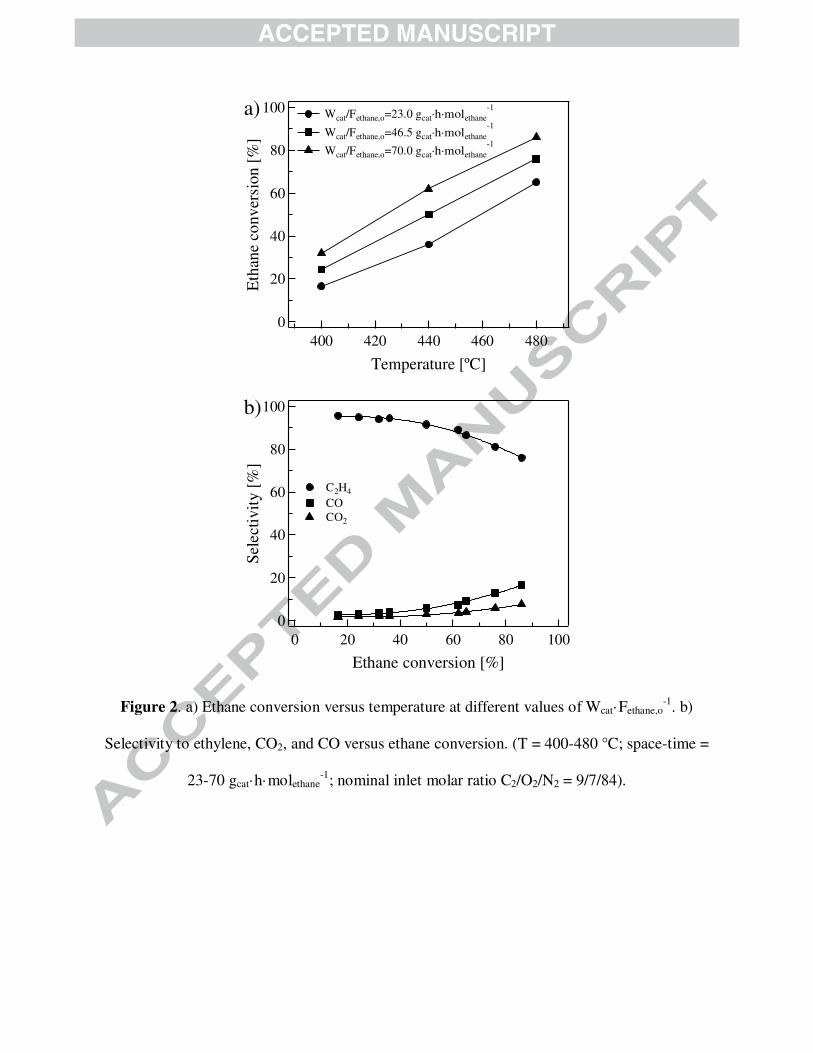
The effect of the inlet partial pressure of the reactants, ethane and oxygen, on the
MoVTeNb mixed oxide for the ODH-Et was also dealt with. For this end, the inlet partial
pressure of one reactant was systematically varied maintaining constant the inlet partial pressure
of the other. Fig. 3 summarizes the effect of the inlet partial pressure of the reactants on ethane
conversion for a set of experiments effectuated at a reaction temperature of 440 ºC and space-
time from 10 - 140 gcat·h·molethane-1. It is first detected that an increase of the inlet partial pressure
of ethane and/or oxygen has a positive effect on ethane conversion. Evidently, the ethane
conversion is appreciably more sensitive to changes in the inlet partial pressure of ethane. More
precisely, on the basis of the information included in Fig. 3a, augmenting 2
oOp from 5 to 22 kPa
leads to a relatively small increase in the ethane conversion, ca. 8 % absolute. The data plotted in
Fig. 3b shows that after increasing 2 6
oC Hp from 5 to 22 kPa, the augment in the ethane conversion
is as high as 20 % absolute. All these observations are in agreement with other publications in
which ODH-Et was performed over vanadium-based catalysts [31,32].
Figure 3 is shown here.
4.1.3 Catalytic reaction feeding ethylene
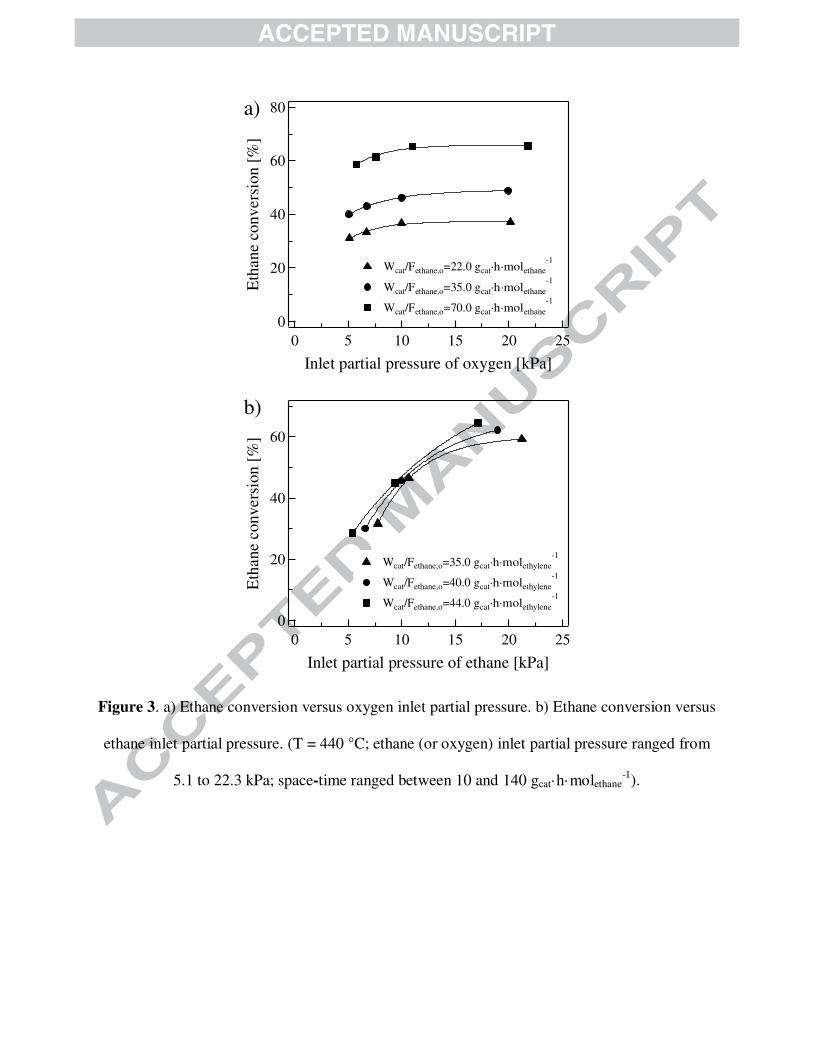
The contribution of ethylene to the formation of carbon oxides in the ODH-Et was assessed
by means of a set of experiments using a feedstock containing ethylene instead of ethane. Such
experiments are performed at 440 ºC, space-time between 10 and 130 gcat·h·molethylene-1 and inlet
molar ratios of ethylene to oxygen 0.5 - 2.0 (vide Section 2.2.1). At these conditions, ethylene
conversion is 3 - 14 %, the only carbon-containing products detected via chromatographic
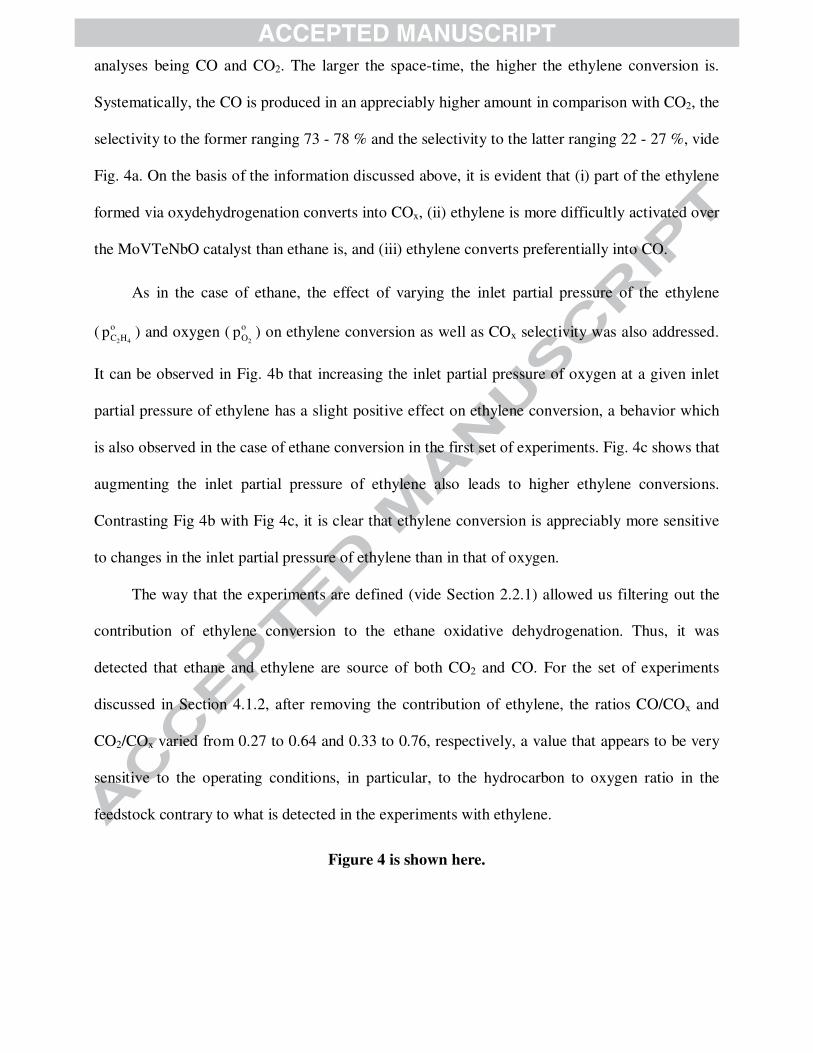
analyses being CO and CO2. The larger the space-time, the higher the ethylene conversion is.
Systematically, the CO is produced in an appreciably higher amount in comparison with CO2, the
selectivity to the former ranging 73 - 78 % and the selectivity to the latter ranging 22 - 27 %, vide
Fig. 4a. On the basis of the information discussed above, it is evident that (i) part of the ethylene
formed via oxydehydrogenation converts into COx, (ii) ethylene is more difficultly activated over
the MoVTeNbO catalyst than ethane is, and (iii) ethylene converts preferentially into CO.
As in the case of ethane, the effect of varying the inlet partial pressure of the ethylene
(2 4
oC Hp ) and oxygen (
2
oOp ) on ethylene conversion as well as COx selectivity was also addressed.
It can be observed in Fig. 4b that increasing the inlet partial pressure of oxygen at a given inlet
partial pressure of ethylene has a slight positive effect on ethylene conversion, a behavior which
is also observed in the case of ethane conversion in the first set of experiments. Fig. 4c shows that
augmenting the inlet partial pressure of ethylene also leads to higher ethylene conversions.
Contrasting Fig 4b with Fig 4c, it is clear that ethylene conversion is appreciably more sensitive
to changes in the inlet partial pressure of ethylene than in that of oxygen.
The way that the experiments are defined (vide Section 2.2.1) allowed us filtering out the
contribution of ethylene conversion to the ethane oxidative dehydrogenation. Thus, it was
detected that ethane and ethylene are source of both CO2 and CO. For the set of experiments
discussed in Section 4.1.2, after removing the contribution of ethylene, the ratios CO/COx and
CO2/COx varied from 0.27 to 0.64 and 0.33 to 0.76, respectively, a value that appears to be very
sensitive to the operating conditions, in particular, to the hydrocarbon to oxygen ratio in the
feedstock contrary to what is detected in the experiments with ethylene.
Figure 4 is shown here.
4.2 Kinetic modeling
The mathematical procedure for the estimation of the kinetic parameters is a crucial step in
the construction of kinetic models, which has to be invariably accompanied by a careful
assessment of the model parameters from a physicochemical perspective and a statistical point of
view. Kinetic parameters should be not only capable to represent adequately the occurred
physicochemical phenomena but also exhibit thermodynamic consistency. Besides, regression
results must be statistically tested to verify the model adequacy and estimate confidence limits.
When confronting a set of kinetic models, all this information is of a great utility to define the
best candidate.
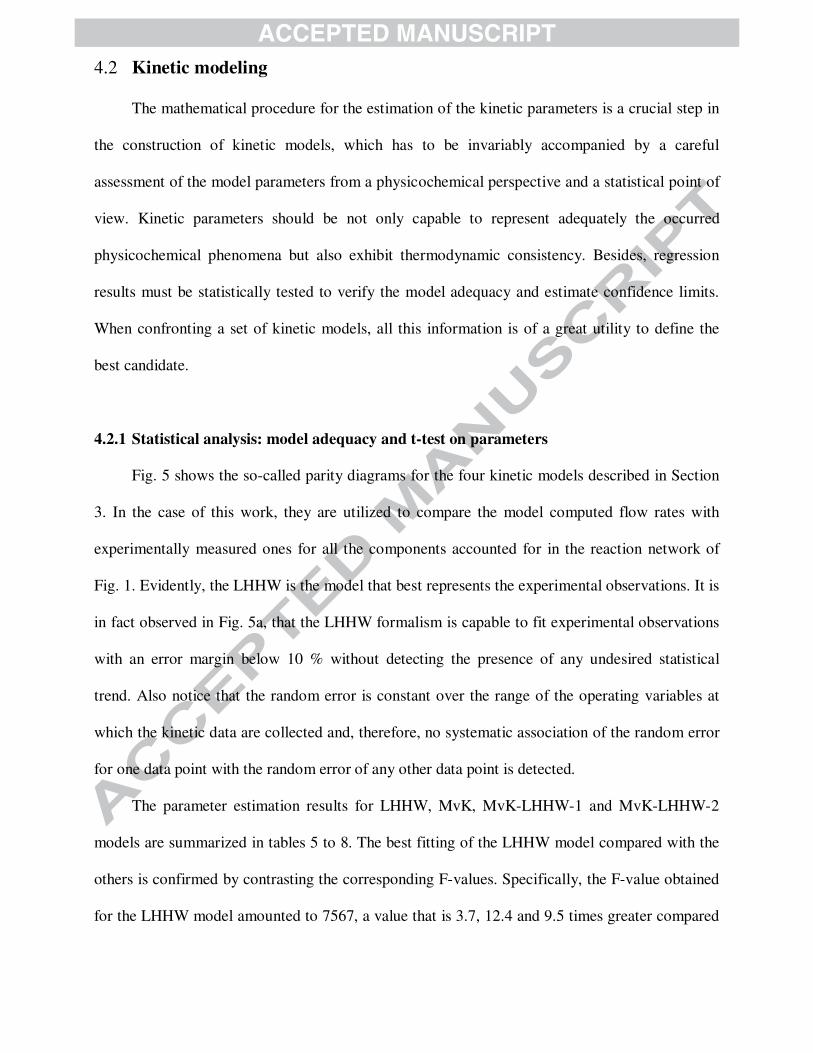
4.2.1 Statistical analysis: model adequacy and t-test on parameters
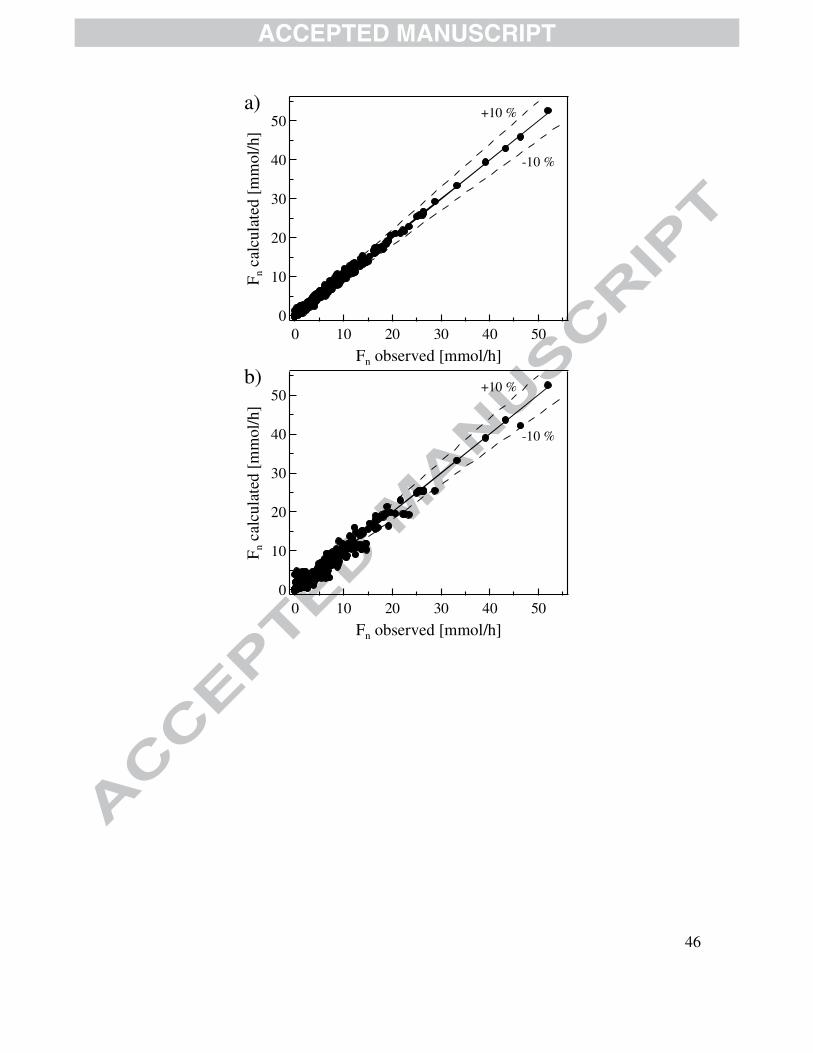
Fig. 5 shows the so-called parity diagrams for the four kinetic models described in Section
3. In the case of this work, they are utilized to compare the model computed flow rates with
experimentally measured ones for all the components accounted for in the reaction network of
Fig. 1. Evidently, the LHHW is the model that best represents the experimental observations. It is
in fact observed in Fig. 5a, that the LHHW formalism is capable to fit experimental observations
with an error margin below 10 % without detecting the presence of any undesired statistical
trend. Also notice that the random error is constant over the range of the operating variables at
which the kinetic data are collected and, therefore, no systematic association of the random error
for one data point with the random error of any other data point is detected.
The parameter estimation results for LHHW, MvK, MvK-LHHW-1 and MvK-LHHW-2
models are summarized in tables 5 to 8. The best fitting of the LHHW model compared with the
others is confirmed by contrasting the corresponding F-values. Specifically, the F-value obtained
for the LHHW model amounted to 7567, a value that is 3.7, 12.4 and 9.5 times greater compared
with that achieved for model MvK (2038), MvK-LHHW-1 (609) and LHHW-2 (796),
respectively.
The LHHW kinetic model also exhibits the best statistics related to the significance of the
parameters estimates, i.e., t-value as well as confidence intervals, in accordance with the
information included in tables 5 to 8. As a matter of fact, most of the computed t-values of
individual parameters for the LHHW are two orders of magnitude higher than the tabulated t-
value for a 95 % probability level. Regarding the binary linear correlation coefficients (ρij),
values exhibited by the model LHHW model are mostly below 0.6, whereas models MvK, MvK-
LHHW-1 and MvK-LHHW-2 displayed higher values, closer to 1.0. On the basis of the set of
statistical criteria outlined above, it is clear that the LHHW model, which is based on an
adsorption-surface reaction-desorption mechanism, exhibits the best behavior.
Figure 5 is shown here.
4.2.2 Physicochemical assessment of model parameters
After verifying the statistical consistency of the model parameters, they have to be
contrasted with a series of thermodynamic criteria in order to determine whether they are
physically meaningful or not. Where the Vant’t Hoff equation parameters (standard adsorption
enthalpy and entropy) are concerned, estimated values are to be confronted with a set of criteria
defined by Boudart [51]. Since adsorption is an exothermic process, the adsorption enthalpy has
to satisfy the inequality:
oH 0−∆ > (31)
the adsorption entropy must be higher than zero and lower than the corresponding standard
entropy of the gas phase specie ( on,gS ), namely:
o on n,g0 S S< −∆ < (32)
where onS∆ is the standard entropy of adsorption.
The entropy in fact decreases when a gaseous molecule is transferred from a three-
dimensional phase, i.e, the gas phase, to a two-dimensional phase, i.e, the catalyst surface. The
gas phase standard entropy values of ethane, oxygen, ethylene, CO, CO2 and water are computed
at 440 ºC amounting to 275, 231, 257, 223, 246 and 218 J·(mol·K)-1, respectively, based on
reference [52].
An additional criterion to be satisfied during the nonisothermal parameter estimation
related to adsorption reaction, relates to the change in volume that occurs when a gaseous
molecule is adsorbed over the surface of a solid. This is specifically expressed in the following
form:
o o41.8 S 51.04 1.4 H< −∆ < − ∆ (33)
Related to the Arrhenius equation parameters, the activation energy should be lower to 210
kJ·mol-1 [53] since larger values indicate the presence of catalyst deactivation, for instance, by
sintering [54]. Besides, the activation energy of the reactions of total oxidation is expected to be
larger than that of the ethylene formation from ethane.
4.2.3 Kinetic parameters assessment
4.2.3.1 Langmuir-Hinshelwood-Hougen-Watson model
As discussed above in Section 4.2.1 and considering the information included in Fig. 5 and
Table 5, the LHHW model, which is represented by eqs. (4) - (8), (29) and (30), exhibited the
best statistical results among the developed kinetics. Notwithstanding, a physical analysis of the
estimated parameters is also compulsory in order to evaluate the absolute adequacy of this model.
It is noted in Table 5 that activation energy values of the five reactions accounted for in the
network of Fig. 1 are within the range 76 - 149 kJ·mol-1. In particular, the main reaction
responsible for ethylene formation out of ethane (r1) is the one demanding the lowest activation
energy, i.e., 76.6 kJ·mol-1. Total oxidation reaction producing CO2 and CO from ethane (r2 and
r3), in contrast, are the reactions with the largest activation energy amounting to 149.6 and 132.0
kJ·mol-1, respectively. These results also indicate that reaction of COx formation out of ethane are
particularly sensitive to temperature changes, namely, their relative importance increases at
relatively high temperature operation as observed in Fig. 2. Concerning the reactions of COx out
of ethylene, they are less energetically demanding compared with total oxidations involving
ethane. Ethylene would be, in principle, more easily activated than ethane to yield total oxidation
products. Because kinetic studies for the ODH-Et over MoVTeNbO based catalysts are scarce in
open literature, the results reported here in are relevant for academy and industry. Additionally,
values of activation energy obtained in this work (76 - 150 kJ·mol-1) are in a good agreement
with previous reports (50 - 140 kJ·mol-1) [36,55,56]. Besides, pre-exponential factors associated
to the total oxidations of ethane to produce COx are lower than those of total oxidations of
ethylene, indicating that active sites kinetically favor total the oxidation of ethylene which is in
agreement with observations presented in Fig. 4. It is also observed in Table 5 that reaction
orders related to the fraction of sites occupied by oxygen are positive and below 1.0, specifically,
between 0.13 and 0.55. This is in agreement with experimental evidences concerning the lower
dependency of ethane conversion to the inlet partial pressure of oxygen compared with that of
hydrocarbons.
Table 5 is shown here.
With respect to the parameters of the Van’t Hoff’s equation, vide Eq. (30), both standard
adsorption enthalpy and entropy are physically consistent according to the criteria given by
Boudart et al. [51], vide eqs. (31) and (33). More specifically, standard adsorption enthalpies are
systematically negative while the values of standard adsorption entropies are between 41.8
J·(mol·K)-1 and the corresponding gas phase molecular standard entropy, vide Section 4.2.2.
Notice that the lowest standard adsorption enthalpy stands for water, - 90.0 kJ·mol-1, while the
largest values are exhibited by oxygen and ethane, - 42.5 and - 42.7 kJ·mol-1, respectively. For
CO2 the standard adsorption enthalpy amounted to -72.6 kJ·mol-1. The order of magnitude of the
adsorption enthalpies estimated is, in fact, similar to values reported in the literature [57-60];
namely, the standard adsorption enthalpy of oxygen ranged from -19 to -98 kJ·mol-1 [57], that of
water on metal oxides are from -36 to -113 kJ·mol-1 [58,60] and that of CO2 from -54 to -95
kJ·mol-1 [60]. From this end, the fractional coverage of water at the outlet of the laboratory-scale
reactor varied from 38.6 to 73.3 %, ethane and oxygen fractional coverage oscillated from 7.5 to
38.0 % and 6.5 to 25.2 % respectively, and the fractional coverage of carbon oxides and ethylene
never exceeded 1 %. Adsorption phenomena involved in LHHW formalism indicated that ethane
and oxygen are two of the main components along with water to be strongly adsorbed on catalyst
surface. Nevertheless, water, being one of the main reaction products in ODH-Et, is, therefore,
the main component impacting negatively on reaction rates.
The presence of oxygen is crucial for the oxidative dehydrogenation of ethane and total
oxidations of ethane and ethylene to occur. Catalytic studies over MoVTeNbO materials suggest
that lattice oxygen participates in the reaction, particularly, oxygen coming from the first layers.
Thus the catalyst’s activity strongly depends on the oxygen’s lability, which is intimately related
to its chemical composition and crystalline structure [20,21,61]. In this respect, MoVTeNbO
catalysts which mainly consist of M1 crystalline phase, show a relatively large capacity of
oxygen recombination, in other words, the oxygen is rapidly released from the first layers and
took from the gas phase. In fact, this may be the reason why the LHHW mechanism adequately
represents such a kinetic phenomenon instead of the MvK mechanism. Recall that reaction orders
associated to the partial pressure of oxygen were found to be far below 1.0. This indicates that
reaction rates are only weakly affected by changes in the oxygen partial pressure, explaining the
high selectivity to ethylene of MoVTeNb mixed oxide catalyst [20, 21, 61].

4.2.3.2 Mars-van Krevelen model
Table 6 displays the main values of activation energies as well as reparameterized pre-
exponential factors with corresponding t-values and 95 % probability confidence intervals for the
kinetic model denoted as MvK. Being given by eqs. (14) - (19) and Eq. (29), this model exhibits
an appreciably lower F-value compared with that of the LHHW model discussed above.
Activation energies, however, also exhibited a good physicochemical and, in agreement with the
LHHW model estimates, indicate that the formation of CO2 and CO out of ethane requires the
highest activation energies 145.0 and 131.2 kJ·mol-1, respectively. The activation energy of the
ethylene oxidation to produce CO2 and CO from ethylene corresponds to 122.0 and 107.4 kJ·mol-
1, respectively. Besides, ethylene formation requires the lowest activation energy to occur, i.e.,
77.6 kJ·mol-1. Evidently, the values of the activation energy of MvK model for corresponding
reactions are very similar to those reported for the LHHW model above and, consequently, online
with values reported by others [62,63]. Additionally, the activation energy of active site
reoxidation is, in turn, as high as 100 kJ·mol-1, a value that is larger than the activation energy of
the ethylene formation from ethane and lower than total oxidations. The reaction order of the re-
oxidation reaction is also low, amounting to 0.211. As stated above, this order reaction suggests
that oxygen is rapidly released from the first layers of the catalyst and rapidly took from the gas
phase. On the basis of this value, the MvK formalism appears to be questionable at the studied
kinetic conditions [64-67]. However, future studies are necessary to confirm this model-based
conclusion.
Table 6 is shown here.
4.2.3.3 Mars-van Krevelen – Langmuir-Hinshelwood-Hougen-Watson models
Tables 7 and 8 contains the main values of Arrhenius and Van’t Hoff parameters as well as
corresponding 95 % probability t-values and confidence limits for kinetic models designated
MvK-LHHW-1 and MvK-LHHW-2. As indicated above, models MvK-LHHW-1 and MvK-
LHHW-2 displayed a relatively low capacity to represent the available experimental data
compared with the LHHW model on the basis of the corresponding F-values and parity plots.
Activation energies and Boudart’s criteria exhibited, however, kinetic and thermodynamic
consistency with results that are close to those found for both LHHW and MvK models.
Since MvK-LHHW-1 and MvK-LHHW-2 models are less significant than LHHW and
MvK models from a statistical point of view, they cannot be considered at this stage as suitable
models for the studied catalytic system. Nevertheless, a physicochemical revision of the kinetic
parameters estimated from MvK-LHHW-1, vide Table 7, and MvK-LHHW-2, vide Table 8,
confirms the results obtained with the LHHW model. Namely, oxydehydrogenation ethylene is
the least energetically demanding reaction; the total oxidation products (COx) are more easily
formed out of ethylene than out of ethane; and reaction rates, even that of catalyst re-oxidation,
are weakly affected by changes in the oxygen partial pressure.
Table 7 is shown here.
Table 8 is shown here.
5 Conclusions
Four kinetics models based on macroscopic LHHW and MvK formalisms are built to
describe the ODH-Et. For a reaction network including four carbon-content species as well as
five reactions, the corresponding rate equations are derived and then used to fit via a nonlinear
regression laboratory scale observations obtained over a high activity-selectivity MoVTeNb
mixed oxide. Experimental results, which demonstrated that ethylene is a primary nonstable
product and that COx are formed out of both ethane and ethylene, are used to define a consistent
reaction network. Reaction rates over the MoVTeNbO catalyst are found to be fairly less
sensitive to changes in the partial pressure of oxygen than it is to changes in the partial pressure
of hydrocarbons (ethane and ethylene). This partially justifies the remarkably high activity and
selectivity of this catalytic system. The resulting kinetic information is used to better
understanding of some aspect of the macro reaction mechanism involved in the ODH-Et. Both
physicochemical and statistical criteria are employed to compare the performance of the
constructed kinetic models and to define the most suitable one. Although the four models
reported, in general, physical meaningful parameters and consistent statistics, the LHHW model
is found to exhibit the best capacity to reproduce the referred the experimental information. An
assessment of reaction rate and corresponding parameters indicates that: ethylene formation from
ethane is the reaction demanding the lowest amount of energy to proceed while the formation of
COx and water products is more difficult departing from ethane than out of ethylene; and ethane,
water and oxygen are the main components adsorbing on catalyst surface. Furthermore, since
water is the main reaction product adsorbed on catalyst active sites according to its fraction
coverage, this compound seems the main factor affecting reaction rates.
Acknowledgments
Consejo Nacional de Ciencia y Tecnología (CONACYT) under project No. 181104 and
Instituto Mexicano del Petróleo. Gamaliel Che-Galicia also thanks CONACYT for providing a
postgraduate fellowship.
Nomenclature
Roman letters
av specific external surface area, m2·m-3
An chromatographic area of the component n
A i'
natural logorithm of pre-exponential factor, mmol· (g·h)-1
Bo Bodenstein number
Cn concentration of component n, mol·kg-1
C carbon number
d diameter, m
dn calibration factor of the component n
Dn diffusion coefficient for component n, m2·s-1
EA activation energy, kJ·mol-1
Fno inlet molar flow rate of the component n, mmol·h-1
Fn molar flow rate of the component n, mmol·h-1
h heat transfer coefficient between pellet and gas phase, kJ·m-2· (K·s)-1
kg mass transfer coefficient, m·s-1
kn reaction rate coefficient, dep.
Kn adsorption equilibrium coefficient for component n, Pa-1
L catalyst bed length, m
m partial reaction order for oxygen, model number
M active sites for MvK mechanism
Mn molecular mass of the component n, g·mmol-1
pn partial pressure of component n, Pa
rn specific reaction rate of reaction n, mmol·(g·h)-1
R universal gas constant, kJ·(mol·K)-1
Rn net reaction rate of the component n, mmol·(g·h)-1
RSS objective function
S active sites for LHHW mechanism
S
g standard entropy of gas phase molecule, J·(mol·K)-1
Sn selectivity of component n on carbon basis, %
T temperature, K
u velocity, m·s-1
wn objective function weight factor of each response
W mass of catalyst, g
XHC hydrocarbon conversion on carbon basis, %
Greek letters
α
vector of parameters accounted for in the objective function
β
vector of parameters accounted for in the objective function
onH∆ standard enthalpy of adsorption for component n, kJ·(mol·K)-1
rH∆ reaction enthalpy, kJ·mol-1
onS∆
Standard entropy of adsorption for component n used in Eq. (30), kJ·(mol·K)-1
onS∆
Standard entropy of adsorption for component n, J·(mol·K)-1
ε
void fraction
*θ fraction coverage of vacant sites
nθ fraction coverage of component n
OXθ fraction coverage of oxidized sites
OX n−θ fraction coverage of component n on oxidized sites
redθ fraction coverage of reduced sites
pλ particle conductivity, J·(m·s·K)-1
µ viscosity, Pa·s
iν stoichiometric number
ρ density, kg·m3
σj Horiuti number
Subscripts
b bed, bulk
cat catalyst
eff effective
exp experiment
f fluid
g gas phase
HC hydrocarbon
i.s. internal standard
n component n
o inlet, superficial
obs observed
p particle
r response
s surface
t tube
tab tabulated
tot total
w wall
Superscripts
^ calculated
o inlet, standard
* reference
References
[1] W.R. True, Global ethylene capacity continues advance in 2011, Oil Gas J.110 (2012) 78-
84.
[2] K. Weissermel, H-J. Arpe, Industrial Organic Chemistry, WILEY-VCH Verlag GmbH &
Co. KGaA, Weinheim, 2003.
[3] S. Albonetti, F. Cavani, F. Trifirò, Key Aspects of Catalyst Design for the Selective
Oxidation of Paraffins, Catal. Rev. 38 (1996) 413-438.
[4] T. Blasco, J.M. López Nieto, Oxidative dehydrogenation of short chain alkanes on
supported vanadium oxide catalysts, Appl. Catal. A: Gen. 157 (1997) 117-142.
[5] F. Cavani, N. Ballarini, A. Cericola, Oxidative dehydrogenation of ethane and propane:
How far from commercial implementation?, Catal. Today 127 (2007) 113-131.
[6] E.M. Thorsteinson, T.P. Wilson, F.G. Young, P.H. Kasai, The Oxidative
Dehydrogenation of Ethane over Catalysts Containing Mixed Oxides of Molybdenum and
Vanadium, J. Catal. 52 (1978) 116-132.
[7] E. Morales, J. H. Lunsford, Oxidative dehydrogenation of ethane over a lithium-
promoted magnesium oxide catalyst, J. Catal. 118 (1989) 255-265.
[8] M. Panizza, C. Resini, F. Raccoli, G. Busca, R. Catani, S. Rossini, Oxidation of ethane
over vanadia-alumina-based catalysts: co-feed and redox experiments, Chem. Eng. J. 93
(2003) 181-189.
[9] E. Heracleous, A. A. Lemonidou, Ni-Nb-O mixed oxides as highly active and selective
catalysts for ethene production via ethane oxidative dehydrogenation. Part I:
Characterization and catalytic, J. Catal. 237 (2006) 162-174.
[10] Y.B. Zhao, W.W. Tan, H. Li, X.H. Jia, H.L. Wan, Oxidative dehydrogenation of
ethane to ethene over a superbase supported LiCl system, Chinese Chem. Lett. 21 (2010)
1366-1369.
[11] X. Lin, K.R. Poeppelmeier, E. Weitz, Oxidative dehydrogenation of ethane with
oxygen catalyzed by K-Y zeolite supported first-row transition metals, Appl. Catal. A:
Gen. 381 (2010) 114-120.
[12] S. Al-Ghamdi, M. Volpe, M.M. Hossain, H. de Lasa, VOx/c-Al2O3 catalyst for
oxidative dehydrogenation of ethane to ethylene: Desorption kinetics and catalytic
activity, Appl. Catal. A: Gen. 450 (2013) 120-130.
[13] P. Botella, E. García-González, A. Dejoz, J.M. López Nieto, M.I. Vázquez, J.
González-García, Selective oxidative dehydrogenation of ethane on MoVTeNbO mixed
metal oxide catalysts, J. Catal. 225 (2004) 428-438.
[14] J.M. López Nieto, P. Botella, M.I. Vázquez, A. Dejoz, The selective oxidative
dehydrogenation of ethane over hydrothermally synthesized MoVTeNb catalysts, Chem.
Commun. (2002) 1906-1907.
[15] M. Hatano, A. Kayo, Catalytic conversion of alkanes to nitriles, and a catalyst
therefor, US Patent 5049692 (1991) assigned to Mitsubishi Kasei Co.
[16] J.M. López Nieto, P. Botella, M.I. Vázquez, A. Dejoz,Method for the oxidative
dehydrogenation of ethane, US Patent 7319179 B2 (2008) assigned to CSIC-UPV.
[17] B. Solsona, M.I. Vázquez, F. Ivars, A. Dejoz, P. Concepción, J.M. López Nieto,
Selective oxidation of propane and ethane on diluted Mo-V-Nb-Te mixed-oxide catalysts,
J. Catal. 252 (2007) 271-280.
[18] B. Deniau, J.M.M. Millet, S. Loridanta, N. Christin, J.L. Dubois, Effect of several
cationic substitutions in the M1 active phase of the MoVTeNbO catalysts used for the
oxidation of propane to acrylic acid, J. Catal. 260 (2008) 30-36.
[19] P. DeSanto, D.J.Buttrey, R.K. Grasselli, C.G. Lugmair, A.F. Volpe, B.H. Toby,
Structural Characterization of the Orthorhombic Phase M1 in MoVNbTeO Propane
Ammoxidation Catalyst, Top. Catal. 23 (2003) 23-38.
[20] M. Aouine, J.L. Dubois, J.M.M. Millet, Crystal chemistry and phase composition
of the MoVTeNbO catalysts for the ammoxidation of propane, Chem. Commun. 13
(2001) 1180-1181.
[21] P. Botella, E. García-González, J.M. López Nieto, J.M. González-Calbet,
MoVTeNbO multifunctional catalysts: Correlation between constituent crystalline phases
and catalytic performance, Solid State Sci. 7 (2005) 507-519.
[22] J.S. Valente, R. Quintana-Solórzano, H. Armendáriz-Herrera, G. Barragán-
Rodríguez, J.M. López-Nieto, Kinetic Study of Oxidative Dehydrogenation of Ethane
over MoVTeNb Mixed-Oxide Catalyst, Ind. Eng. Chem. Res. 53 (2014) 1775-1786.
[23] J.M. López Nieto, P. Botella, B. Solsona, J.M. Oliver, The selective oxidation of
propane on Mo-V-Te-Nb-O catalysts: The influence of Te-precursor, Catal. Today 81
(2003) 87-94.
[24] P. Concepción, P. Botella, J.M. López Nieto, Catalytic and FT-IR study on the
reaction pathway for oxidation of propane and propylene on V- or Mo–V-based catalysts,
Appl. Catal. A: Gen. 278 (2004) 45-56.
[25] B. Solsona, F. Ivars, P. Concepción, J.M. López Nieto, Selective oxidation of n-
butane over MoV-containing oxidic bronze catalysts, 250 (2007) 128-138.
[26] J.S. Valente, H. Armendáriz-Herrera, R. Quintana-Solórzano, P. del Ángel, N.
Nava, A. Massó, J.M. López Nieto, Chemical, Structural, and Morphological Changes of
a MoVTeNb Catalyst during Oxidative Dehydrogenation of Ethane, ACS Catal. 4 (2014)
1292-1301.
[27] F. Cavani, F. Trifirò, The oxidative dehydrogenation of ethane and propane as an
alternative way for the production of light olefins, Catal. Today 24 (1995) 307-312.
[28] M.M. Bhasin, J.H. McCain, B.V. Vora, T. Imai, P.R. Pujado, Dehydrogenation
and oxydehydrogenation of paraffins to olefins, Appl. Catal. A: Gen. 221 (2001) 397-419.
[29] M.P. Woods, B. Mirkelamoglu, U.S. Ozkan, Oxygen and Nitrous Oxide as
Oxidants: Implications for Ethane Oxidative Dehydrogenation over Silica - Titania-
Supported Molybdenum, J. Phys. Chem. C 113 (2009) 10112-10119.
[30] S.T. Oyama, A.A. Middlebrook, G.A. Somorjai, Kinetics of Ethane Oxidation on
Vanadium Oxide, J. Phys. Chem. 94 (1990) 5029-5033.
[31] C-Y. Kao, K-T. Huang, B-Z. Wan, Ethane Oxydehydrogenation over Supported
Vanadium Oxides, Ind. Eng. Chem. Res. 33 (1994) 2066-2072.
[32] M.D. Argyle, K. Chen, At.T Bell, E. Iglesia, Ethane Oxidative Dehydrogenation
Pathways on Vanadium Oxide Catalysts, J. Phys. Chem. B 106 (2002) 5421-5427.
[33] D. Linke, D. Wolf, M. Baerns, S. Zeyß, U. Dingerdissen, Catalytic Partial
Oxidation of Ethane to Acetic Acid over Mo1V0.25Nb0.12Pd0.0005Ox: II. Kinetic Modelling,
J. Catal. 205 (2002) 32-43.
[34] S. Gaab, J. Find, T.E. Müller, J.A. Lercher, Kinetics and Mechanism of the
Oxidative Dehydrogenation of Ethane over Li/Dy/Mg/O/(Cl) Mixed-Oxide Catalysts,
Top. Catal. 46 (2007) 101-110.
[35] S.A. Al-Ghamdi, M.M. Hossain, H.I. de Lasa, Kinetic Modeling of Ethane
Oxidative Dehydrogenation over VOx/Al2O3 Catalyst in a Fluidized-Bed Riser Simulator,
Ind. Eng. Chem. Res. 52 (2013) 5235-5244.
[36] R. Grabowski, J. Słoczyński, Kinetics of oxidative dehydrogenation of propane
and ethane on VOx/SiO2 pure and with potassium additive, Chem. Eng. Process. 44
(2005) 1082-1093.
[37] F. Rahman, K.F. Loughlin, M.A. Al-Saleh, M.R. Saeed, N.M. Tukur, M.M.
Hossain, K. Karim, A. Mamedov, Kinetics and mechanism of partial oxidation of ethane
to ethylene and acetic acid over MoV type catalysts, Appl. Catal. A: Gen. 375 (2010) 17-
25.
[38] E. Heracleous, A. A. Lemonidou, Ni-Nb-O mixed oxides as highly active and
selective catalysts for ethene production via ethane oxidative dehydrogenation. Part II:
Mechanistic aspects and kinetic modeling, J. Catal. 237 (2006) 175-189.
[39] J. Le Bars, J.C. Vedrine, A. Auroux, Role of surface acidity on vanadia/silica
catalysts used in the oxidative dehydrogenation of ethane, Appl. Catal. A: Gen. 88 (1992)
179-195.
[40] F. Klose, M. Joshi, C. Hamel, A. Seidel-Morgenstern, Selective oxidation of
ethane over a VOx/γ-Al2O3 catalyst - investigation of the reaction network, Appl. Catal.
A: Gen. 260 (2004) 101-110.
[41] J. Pérez-Ramírez, R.J. Berger, G. Mul, F. Kapteijn, J.A. Moulijn, The six-flow
reactor technology: A review on fast catalyst screening and kinetic studies, Catal. Today
60 (2000) 93-109.
[42] G.B. Marin, G.S. Yablonsky, Kinetics of Chemical Reactions: Decoding
Complexity. WILEY-VCH Verlag GmbH & Co. KGaA, Weinheim, 2011.
[43] D. Creaser, B. Andersson, Oxidative dehydrogenation of propane over V-Mg-O:
kinetic investigation by nonlinear regression analysis, Appl. Catal. A: Gen. 141 (1996)
131-152.
[44] J. Haber, W. Turek, Kinetic Studies as a Method to Differentiate between Oxygen
Species Involved in the Oxidation of Propene, J. Catal. 190 (2000) 320-326.
[45] P. Mars, D.W. van Krevelen, Oxidations carried out by means of vanadium oxide
catalysts, Chem. Eng. Sci. Spec. Suppl. 3 (1954) 41-59.
[46] J. Kubo, N. Watanabe, W. Ueda, Propane ammoxidation with lattice oxygen of
Mo-V-O-based complex metal oxide catalysts, Chem. Eng. Sci. 63 (2008) 1648-1653.
[47] P.N. Brown, G. D. Byrne, A. C. Hindmarsh, VODE: A Variable-Coefficient ODE
Solver, SIAM J. Sci. and Stat. Comput. 10 (1989) 1038-1051.
[48] H.H. Rosenbrock, An Automatic Method for Finding the Greatest or Least Value
of a Function, Comput. J. 3 (1960) 175-184.

[49] P. T. Boggs, J.R. Donaldson, R.H. Byrd, R.B. Schnabel, Algorithm 676
ODRPACK: Software for Weighted Orthogonal Distance Regression, ACM T. Math.
Software 15 (1989) 348-364.
[50] D.W. Marquardt, An Algorithm for Least-Squares Estimation of Nonlinear
Parameters J. Soc. Ind. Appl. Math. 11 (1963) 431-441.
[51] M. Boudart, D.E. Mears, M.A. Vannice, Kinetics of heterogeneous catalytic
reactions, Ind. Chim. Belg. 32(1967) 281-284.
[52] http://cccbdb.nist.gov
[53] E. Santacesaria, Kinetics and transport phenomena, Catal. Today 34 (1997) 393-
400.
[54] C.H. Bartholomew, Mechanisms of catalyst deactivation, Appl. Catal. A: Gen. 212
(2001) 17-60.
[55] R. Grabowski, K. Samson, Potassium Effect on Kinetics of Propane
Oxydehydrogenation on Vanadia-Titania Catalyst, Pol. J. Chem. 77 (2003) 459-470.
[56] D. Wolf, N. Dropka, Q. Smejkal, O. Buyevskaya, Oxidative dehydrogenation of
propane for propylene production-comparison of catalytic processes, Chem. Eng. Sci. 56
(2001) 713-719.
[57] G. Saracco, F. Geobaldo, G. Baldi, Methane combustion on Mg-doped LaMnO3
perovskite catalysts, Appl. Catal. B: Environ. 20 (1999) 277-288.
[58] M. Egashira, S. Kawasumi, S. Kagawa, T. Seiyama, Temperature Programmed
Desorption Study of Water Adsorbed on Metal Oxides. I. Anatase and Rutile, Bull. Chem.
Soc. Jpn. 51 (1978) 3144-3149.

[59] O. Thinon, K. Rachedi, F. Diehl, P. Avenier. Y. Schuurman, Kinetics and
Mechanism of the Water-Gas Shift Reaction Over Platinum Supported Catalysts, Top.
Catal. 52 (2009) 1940-1945.
[60] M.P. Heynderickx, J.W. Thybaut, H. Poelman, D. Poelman, G.B. Marin, Kinetic
modeling of the total oxidation of propane over CuO-CeO2/γ-Al2O3, Appl. Catal. B:
Environ. 95 (2010) 26-38.
[61] M. Hävecker, S. Wrabetz, J. Kröhnert, L-I. Csepei, R. Naumann d’Alnoncourt,
Y.V. Kolen’ko, F. Girgsdies, R. Schlögl, A. Trunschke, Surface chemistry of phase-pure
M1 MoVTeNb oxide during operation in selective oxidation of propane to acrylic acid, J.
Catal. 285 (2012) 48-60.
[62] M.D. Putra, S.M. Al-Zahrani, A.E. Abasaeed, Kinetics of oxydehydrogenation of
propane over alumina-supported Sr-V-Mo catalysts, Catal. Commun. 26 (2012) 98-102.
[63] R. Grabowski, Kinetics of the oxidative dehydrogenation of propane on
vanadia/titania catalysts, pure and doped with rubidium, Appl. Catal. A: Gen. 270 (2004)
37-47.
[64] D. Shee, T.V.M. Rao, G. Deo, Kinetic parameter estimation for supported
vanadium oxide catalysts for propane ODH reaction: Effect of loading and support, Catal.
Today 118 (2006) 288-297.
[65] R. Singh, M.A. Bañares, G. Deo, Effect of phosphorous modifier on V2O5/TiO2
catalyst: ODH of propane, J. Catal. 233 (2005) 388-398.
[66] K. Routray, K.R.S.K. Reddy, G. Deo, Oxidative dehydrogenation of propane on
V2O5/Al2O3 and V2O5/TiO2 catalysts: understanding the effect of support by parameter
estimation, Appl. Catal. A: Gen. 265 (2004) 103-113.

[67] A. Bottino, G. Capannelli, A. Comite, S. Storace, R. Di Felice, Kinetic
investigations on the oxidehydrogenation of propane over vanadium supported on γ-
Al2O3, Chem. Eng. J. 94 (2003) 11-18.

r r
rr
r
2
1
4
53
C
C
C
2CO
H
O
2
2
6H O2O2
12
O 272
2
3HO2
C H2 4
2HO
2
2O2
3HO2
2HO2
3O
2
O
2
52
Figure 1. Reaction network describing the ODH-Et.
100
80
60
40
20
0
Eth
ane
conv
ersi
on [
%]
480460440420400
Temperature [ºC]
a) Wcat/Fethane,o=23.0 gcat·h·molethane-1
Wcat/Fethane,o=46.5 gcat·h·molethane-1
Wcat/Fethane,o=70.0 gcat·h·molethane-1
100
80
60
40
20
0
Sel
ecti
vity
[%
]
100806040200
Ethane conversion [%]
b)
C2H4
CO CO2
Figure 2. a) Ethane conversion versus temperature at different values of Wcat·Fethane,o-1. b)
Selectivity to ethylene, CO2, and CO versus ethane conversion. (T = 400-480 °C; space-time =
23-70 gcat·h·molethane-1; nominal inlet molar ratio C2/O2/N2 = 9/7/84).
80
60
40
20
0
Eth
ane
conv
ersi
on [
%]
2520151050
Inlet partial pressure of oxygen [kPa]
a)
Wcat/Fethane,o=22.0 gcat·h·molethane-1
Wcat/Fethane,o=35.0 gcat·h·molethane-1
Wcat/Fethane,o=70.0 gcat·h·molethane-1
60
40
20
0
Eth
ane
conv
ersi
on [
%]
2520151050
Inlet partial pressure of ethane [kPa]
b)
Wcat/Fethane,o=35.0 gcat·h·molethylene-1
Wcat/Fethane,o=40.0 gcat·h·molethylene-1
Wcat/Fethane,o=44.0 gcat·h·molethylene-1
Figure 3. a) Ethane conversion versus oxygen inlet partial pressure. b) Ethane conversion versus
ethane inlet partial pressure. (T = 440 °C; ethane (or oxygen) inlet partial pressure ranged from
5.1 to 22.3 kPa; space-time ranged between 10 and 140 gcat·h·molethane-1).
100
80
60
40
20
0
Sel
ecti
vity
[%
]
1614121086420
Ethylene conversion [%]
a)
CO CO2
20
15
10
5
0
Eth
ylen
e co
nver
sion
[%
]
2520151050
Inlet partial pressure of oxygen [kPa]
b) Wcat/Fethylene,o=22.0 gcat·h·molethylene-1
Wcat/Fethylene,o=35.0 gcat·h·molethylene-1
Wcat/Fethylene,o=70.0 gcat·h·molethylene-1
10
8
6
4
2
0
Eth
ylen
e co
nver
sion
[%
]
2520151050
Inlet partial pressure of ethylene [kPa]
c)
Wcat/Fethylene,o=35.0 gcat·h·molethylene-1
Wcat/Fethylene,o=40.0 gcat·h·molethylene-1
Wcat/Fethylene,o=44.0 gcat·h·molethylene-1
Figure 4. a) Selectivity of CO and CO2 versus ethylene. b) Ethylene conversion versus oxygen
inlet partial pressure. c) Ethylene conversion versus ethylene inlet partial pressure. (T = 440 °C;
ethylene (or oxygen) inlet partial pressure ranged from 5.0 to 24.2 kPa; space-time ranged
between 10 and 130 gcat·h·molethylene-1).
46
50
40
30
20
10
0
Fn
calc
ulat
ed [
mm
ol/h
]
50403020100
Fn observed [mmol/h]
+10 %
-10 %
a)
50
40
30
20
10
0
Fn
calc
ulat
ed [
mm
ol/h
]
50403020100
Fn observed [mmol/h]
+10 %
-10 %
b)

47
50
40
30
20
10
0
Fn
calc
ulat
ed [
mm
ol/h
]
50403020100
Fn observed [mmol/h]
+10 %
-10 %
c)
50
40
30
20
10
0
Fn
calc
ulat
ed [
mm
ol/h
]
50403020100
Fn observed [mmol/h]
+10 %
-10 %
d)
Figure 5. Parity plots comparing experimental with calculated reactor outlet molar flow rates for the four kinetic models: a) LHHW. b) MvK. c) MvK-LHHW-1 and d) MvK-
LHHW-2. The full lines are the first bisector and the dashed lines represent a deviation of 10 %.
48
Table 1. Summary of results after assessing the various criteria for plug flow regime as
well as concentration and temperature gradients at the pellet scale in the ODH-Et
experiments.
Criterion Mathematical form (A < B) A B
1a Assumption plug flow regime t
p
d8
d<
8.0 66
1b Assumption plug flow regime
2 6C H p
8 1 Lm ln
Bo 1 X d<
−
8.0 56
2 Pressure drop 22f b f b tot
o o2 3 3p b p b
0.15 L(1 ) 0.00175 L(1 ) pu u 0.2
d d m
µ − ε ρ − ε+ <
ε ε
48 95
3 External mass transfer limitation
2 6
obs
g v C H ,b
r 0.05
k a C m<
3.1 × 10⁻⁴ 5.0
4 Internal mass transfer limitation
2 6 2 6
2
pobs
C H ,eff C H ,b
dr 1
D C 6 12m
<
3.3 × 10⁻³ 8.0
5 External heat transfer limitation 2obs r p f
A
r ( H )d 0.05RT
6h E
∆<
0.017 2.35
6 Internal heat transfer limitation 2 2obs r p f
p A
r ( H )d 0.05RT
60 E
∆<
λ
1.23 × 10⁻³ 2.35
7 Radial reactor heat transfer
limitation
2 2obs r b t w
A
r ( H )(1 )(1 b)d 0.05RT
6h E
∆ − ε −<
1.3 2.35

49
Table 2. Reaction steps and catalytic cycles considered for the LHHW model to describe
the ODH-Et.
Step Elementary reaction step σI σII σIII σIV σV
A O2 + 2S � 2O-S 1 7 5 3 2
B C2H6 + S � C2H6-S 2 2 2 0 0
1 C2H6-S + O-S → C2H4-S + H2O-S 2 0 0 0 0
2 C2H6-S + 7O-S → 2CO2-S + 3H2O-S + 3S 0 2 0 0 0
3 C2H6-S + 5O-S → 2CO-S + 3H2O-S + S 0 0 2 0 0
4 C2H4-S + 6O-S → 2CO2-S + 2H2O-S + 3S 0 0 0 1 0
5 C2H4-S + 4O-S→ 2CO-S + 2H2O-S + S 0 0 0 0 1
C C2H4-S � C2H4 + S 2 0 0 1 1
D CO2-S � CO2 + S 0 4 0 2 0
E CO-S � CO + S 0 0 4 0 2
F H2O-S � H2O + S 2 6 6 2 2
I C2H6 + 0.5O2 → C2H4 + H2O
II C2H6 + 3.5O2 → 2CO2 + 3H2O
III C2H6 + 2.5O2 → 2CO + 3H2O
IV C2H4 + 3.5O2 → 2CO2 + 2H2O
V C2H4 + 2.5O2 → 2CO + 2H2O
50
Table 3. Reaction steps and catalytic cycles considered for the MvK model to describe the
ODH-Et.
Step Elementary reaction step σI σII σIII σIV σV
1 C2H6 + Mox → C2H4 + H2O + Mred 1 0 0 0 0
2 C2H6 + Mox → 2CO2 + 3H2O + Mred 0 1 0 0 0
3 C2H6 + Mox → 2CO + 3H2O + Mred 0 0 1 0 0
4 C2H4 + Mox → 2CO2 + 2H2O + Mred 0 0 0 1 0
5 C2H4 + Mox → 2CO + 2H2O + Mred 0 0 0 0 1
O Mred + mO2 → Mox 1 1 1 1 1
51
Table 4. Reaction steps and catalytic cycles considered for the MvK-LHHW to describe
the ODH-Et.
Step Elementary reaction step σI σII σIII σIV σV
A O2 + 2S � 2O-S 0 7 5 3 2
B C2H6 + S � C2H6-S 0 2 2 0 0
1 C2H6 + Mox → C2H4 + H2O + Mred 1 0 0 0 0
2 C2H6-S + 7O-S → 2CO2-S + 3H2O-S + 3S 0 2 0 0 0
3 C2H6-S + 5O-S → 2CO-S + 3H2O-S + S 0 0 2 0 0
4 C2H4-S + 6O-S → 2CO2-S + 2H2O-S + 3S 0 0 0 1 0
5 C2H4-S + 4O-S→ 2CO-S + 2H2O-S + S 0 0 0 0 1
C C2H4-S � C2H4 + S 0 0 0 1 1
D CO2-S � CO2 + S 0 4 0 2 0
E CO-S � CO + S 0 0 4 0 2
F H2O-S � H2O + S 0 6 6 2 2
G C2H4 + Mox � C2H4-Mox 0 0 0 0 0
H CO2 + Mox � CO2-Mox 0 0 0 0 0
I CO + Mox � CO-Mox 0 0 0 0 0
J H2O + Mox � H2O-Mox 0 0 0 0 0
O Mred + mO2 → Mox 1 0 0 0 0
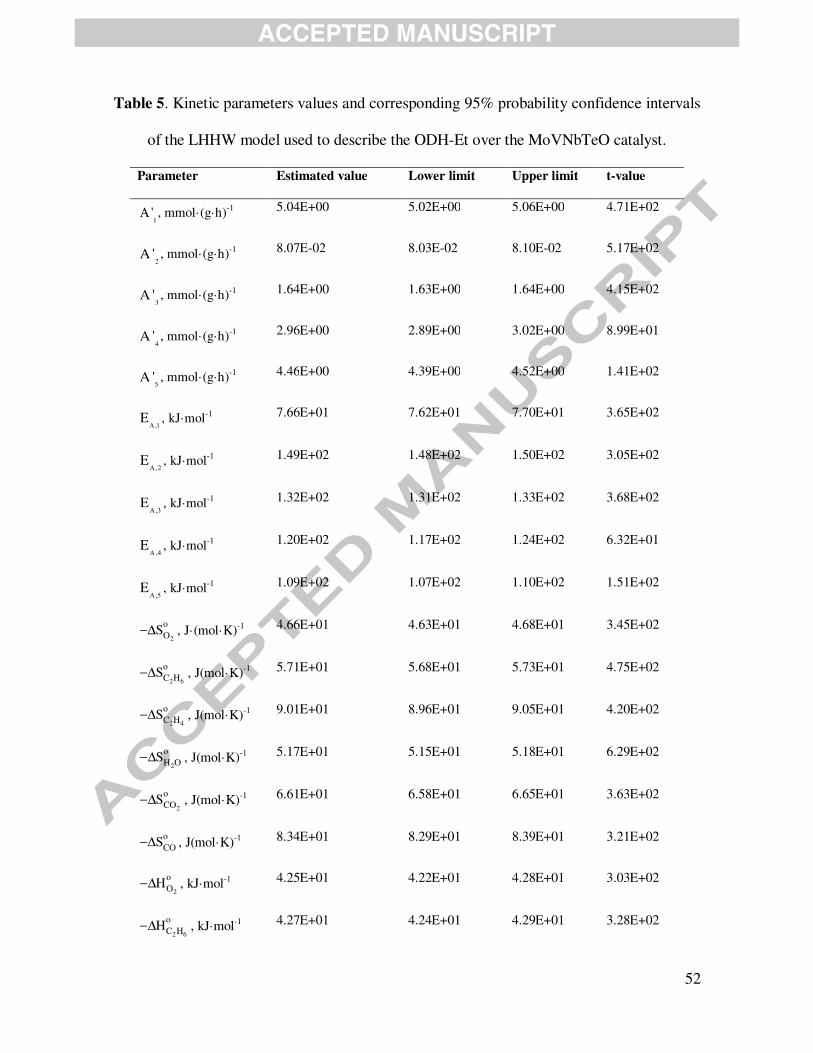
52
Table 5. Kinetic parameters values and corresponding 95% probability confidence intervals
of the LHHW model used to describe the ODH-Et over the MoVNbTeO catalyst.
Parameter Estimated value Lower limit Upper limit t-value
A'1, mmol·(g·h)-1 5.04E+00 5.02E+00 5.06E+00 4.71E+02
A '2, mmol·(g·h)-1 8.07E-02 8.03E-02 8.10E-02 5.17E+02
A '3, mmol·(g·h)-1 1.64E+00 1.63E+00 1.64E+00 4.15E+02
A '4, mmol·(g·h)-1 2.96E+00 2.89E+00 3.02E+00 8.99E+01
A '5, mmol·(g·h)-1 4.46E+00 4.39E+00 4.52E+00 1.41E+02
E
A ,1, kJ·mol-1 7.66E+01 7.62E+01 7.70E+01 3.65E+02
E
A ,2, kJ·mol-1 1.49E+02 1.48E+02 1.50E+02 3.05E+02
E
A ,3, kJ·mol-1 1.32E+02 1.31E+02 1.33E+02 3.68E+02
E
A ,4, kJ·mol-1 1.20E+02 1.17E+02 1.24E+02 6.32E+01
E
A ,5, kJ·mol-1 1.09E+02 1.07E+02 1.10E+02 1.51E+02
2
oOS−∆ , J·(mol·K)-1 4.66E+01 4.63E+01 4.68E+01 3.45E+02
2 6
oC HS−∆ , J(mol·K)-1 5.71E+01 5.68E+01 5.73E+01 4.75E+02
2 4
oC HS−∆ , J(mol·K)-1 9.01E+01 8.96E+01 9.05E+01 4.20E+02
2
oH OS−∆ , J(mol·K)-1 5.17E+01 5.15E+01 5.18E+01 6.29E+02
2
oCOS−∆ , J(mol·K)-1 6.61E+01 6.58E+01 6.65E+01 3.63E+02
oCOS−∆ , J(mol·K)-1 8.34E+01 8.29E+01 8.39E+01 3.21E+02
2
oOH−∆ , kJ·mol-1 4.25E+01 4.22E+01 4.28E+01 3.03E+02
2 6
oC HH−∆ , kJ·mol-1 4.27E+01 4.24E+01 4.29E+01 3.28E+02
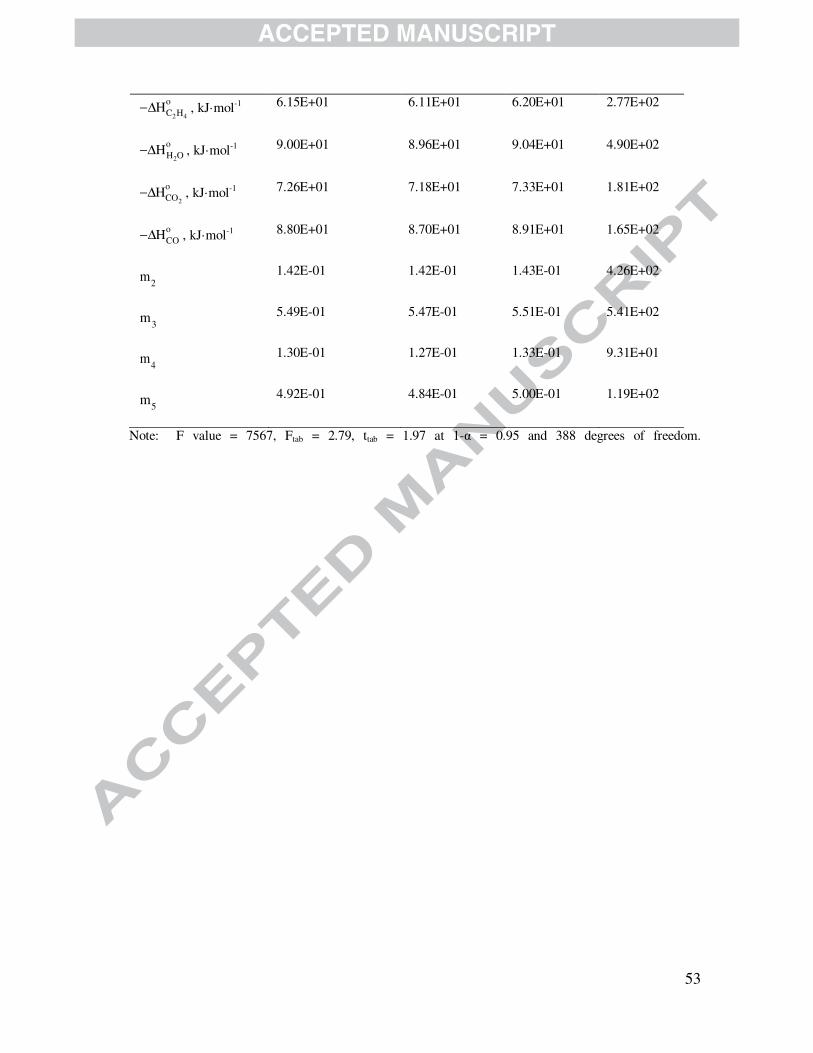
53
2 4
oC HH−∆ , kJ·mol-1 6.15E+01 6.11E+01 6.20E+01 2.77E+02
2
oH OH−∆ , kJ·mol-1 9.00E+01 8.96E+01 9.04E+01 4.90E+02
2
oCOH−∆ , kJ·mol-1 7.26E+01 7.18E+01 7.33E+01 1.81E+02
oCOH−∆ , kJ·mol-1 8.80E+01 8.70E+01 8.91E+01 1.65E+02
m2 1.42E-01 1.42E-01 1.43E-01 4.26E+02
m3 5.49E-01 5.47E-01 5.51E-01 5.41E+02
m4 1.30E-01 1.27E-01 1.33E-01 9.31E+01
m5 4.92E-01 4.84E-01 5.00E-01 1.19E+02
Note: F value = 7567, Ftab = 2.79, ttab = 1.97 at 1-α = 0.95 and 388 degrees of freedom.
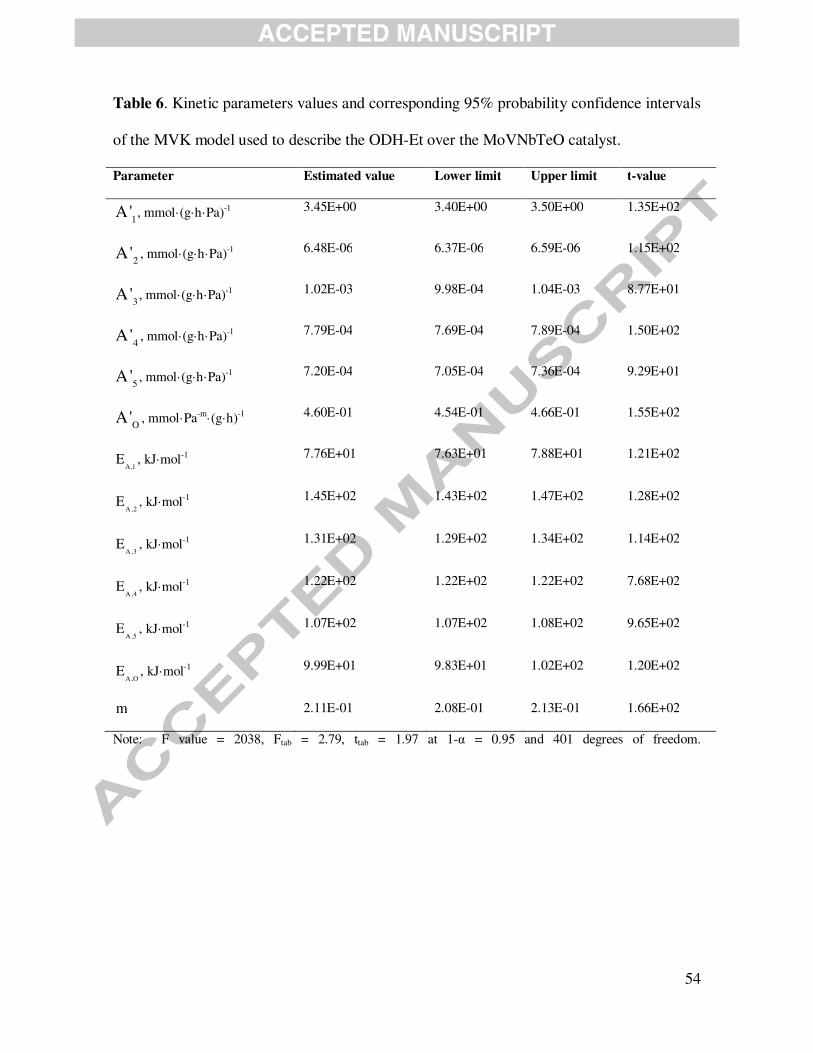
54
Table 6. Kinetic parameters values and corresponding 95% probability confidence intervals
of the MVK model used to describe the ODH-Et over the MoVNbTeO catalyst.
Parameter Estimated value Lower limit Upper limit t-value
A '1, mmol·(g·h·Pa)-1 3.45E+00 3.40E+00 3.50E+00 1.35E+02
A'2 , mmol·(g·h·Pa)-1 6.48E-06 6.37E-06 6.59E-06 1.15E+02
A'3 , mmol·(g·h·Pa)-1 1.02E-03 9.98E-04 1.04E-03 8.77E+01
A'4 , mmol·(g·h·Pa)-1 7.79E-04 7.69E-04 7.89E-04 1.50E+02
A'5 , mmol·(g·h·Pa)-1 7.20E-04 7.05E-04 7.36E-04 9.29E+01
A'O , mmol·Pa-m·(g·h)-1 4.60E-01 4.54E-01 4.66E-01 1.55E+02
E
A,1, kJ·mol-1 7.76E+01 7.63E+01 7.88E+01 1.21E+02
E
A ,2, kJ·mol-1 1.45E+02 1.43E+02 1.47E+02 1.28E+02
E
A ,3, kJ·mol-1 1.31E+02 1.29E+02 1.34E+02 1.14E+02
E
A ,4, kJ·mol-1 1.22E+02 1.22E+02 1.22E+02 7.68E+02
E
A ,5, kJ·mol-1 1.07E+02 1.07E+02 1.08E+02 9.65E+02
E
A ,O, kJ·mol-1 9.99E+01 9.83E+01 1.02E+02 1.20E+02
m 2.11E-01 2.08E-01 2.13E-01 1.66E+02
Note: F value = 2038, Ftab = 2.79, ttab = 1.97 at 1-α = 0.95 and 401 degrees of freedom.
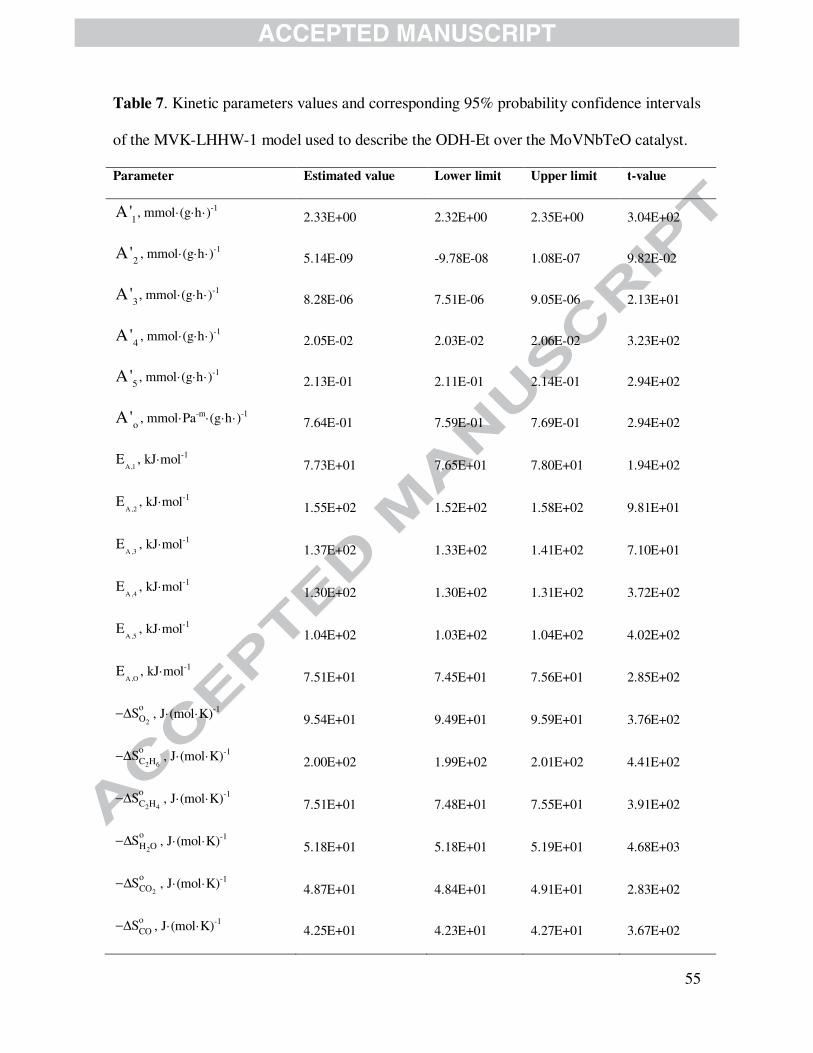
55
Table 7. Kinetic parameters values and corresponding 95% probability confidence intervals
of the MVK-LHHW-1 model used to describe the ODH-Et over the MoVNbTeO catalyst.
Parameter Estimated value Lower limit Upper limit t-value
A'1, mmol·(g·h·)-1 2.33E+00 2.32E+00 2.35E+00 3.04E+02
A'2 , mmol·(g·h·)-1 5.14E-09 -9.78E-08 1.08E-07 9.82E-02
A'3 , mmol·(g·h·)-1 8.28E-06 7.51E-06 9.05E-06 2.13E+01
A'4 , mmol·(g·h·)-1 2.05E-02 2.03E-02 2.06E-02 3.23E+02
A'5 , mmol·(g·h·)-1 2.13E-01 2.11E-01 2.14E-01 2.94E+02
A'o , mmol·Pa-m·(g·h·)-1 7.64E-01 7.59E-01 7.69E-01 2.94E+02
E
A,1, kJ·mol-1 7.73E+01 7.65E+01 7.80E+01 1.94E+02
E
A ,2, kJ·mol-1 1.55E+02 1.52E+02 1.58E+02 9.81E+01
E
A ,3, kJ·mol-1 1.37E+02 1.33E+02 1.41E+02 7.10E+01
E
A ,4, kJ·mol-1 1.30E+02 1.30E+02 1.31E+02 3.72E+02
E
A ,5, kJ·mol-1 1.04E+02 1.03E+02 1.04E+02 4.02E+02
E
A ,O, kJ·mol-1 7.51E+01 7.45E+01 7.56E+01 2.85E+02
2
oOS−∆ , J·(mol·K)-1 9.54E+01 9.49E+01 9.59E+01 3.76E+02
2 6
oC HS−∆ , J·(mol·K)-1 2.00E+02 1.99E+02 2.01E+02 4.41E+02
2 4
oC HS−∆ , J·(mol·K)-1 7.51E+01 7.48E+01 7.55E+01 3.91E+02
2
oH OS−∆ , J·(mol·K)-1 5.18E+01 5.18E+01 5.19E+01 4.68E+03
2
oCOS−∆ , J·(mol·K)-1 4.87E+01 4.84E+01 4.91E+01 2.83E+02
oCOS−∆ , J·(mol·K)-1 4.25E+01 4.23E+01 4.27E+01 3.67E+02
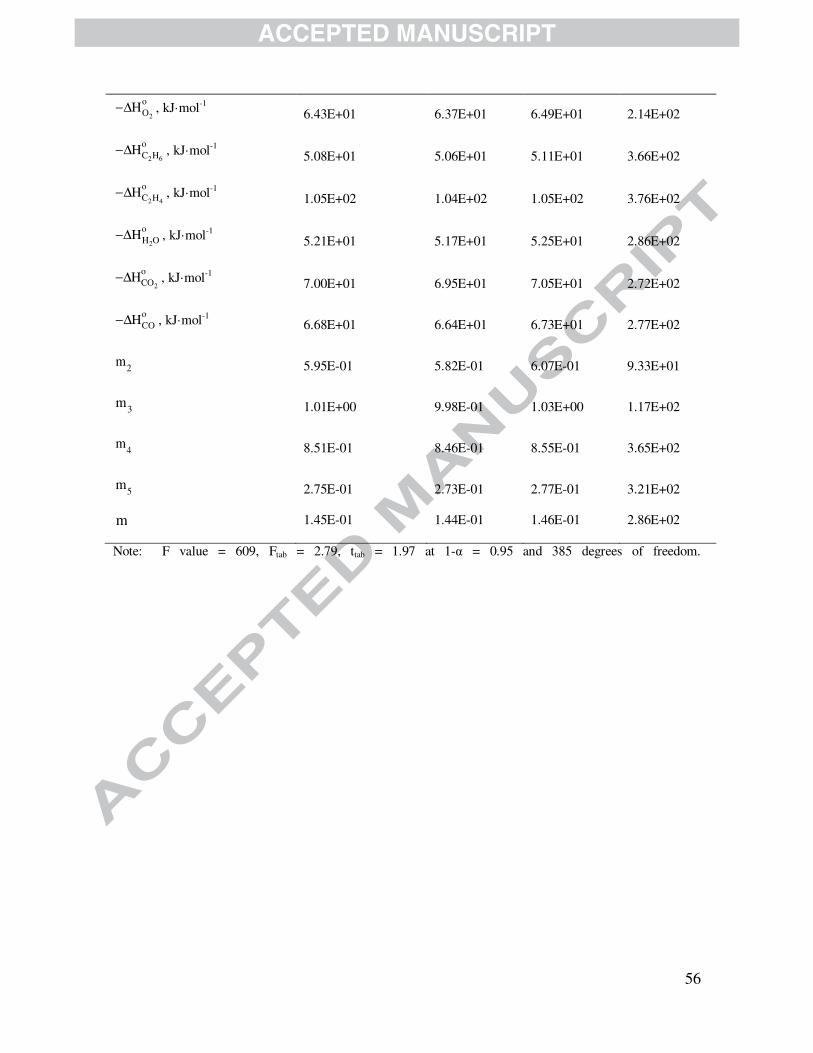
56
2
oOH−∆ , kJ·mol-1 6.43E+01 6.37E+01 6.49E+01 2.14E+02
2 6
oC HH−∆ , kJ·mol-1 5.08E+01 5.06E+01 5.11E+01 3.66E+02
2 4
oC HH−∆ , kJ·mol-1 1.05E+02 1.04E+02 1.05E+02 3.76E+02
2
oH OH−∆ , kJ·mol-1 5.21E+01 5.17E+01 5.25E+01 2.86E+02
2
oCOH−∆ , kJ·mol-1 7.00E+01 6.95E+01 7.05E+01 2.72E+02
oCOH−∆ , kJ·mol-1 6.68E+01 6.64E+01 6.73E+01 2.77E+02
m2 5.95E-01 5.82E-01 6.07E-01 9.33E+01
m3 1.01E+00 9.98E-01 1.03E+00 1.17E+02
m4 8.51E-01 8.46E-01 8.55E-01 3.65E+02
m5 2.75E-01 2.73E-01 2.77E-01 3.21E+02
m 1.45E-01 1.44E-01 1.46E-01 2.86E+02
Note: F value = 609, Ftab = 2.79, ttab = 1.97 at 1-α = 0.95 and 385 degrees of freedom.

57
Table 8. Kinetic parameters values and corresponding 95% probability confidence intervals
of the MVK-LHHW-2 model used to describe the ODH-Et over the MoVNbTeO catalyst.
Parameter Estimated value Lower limit Upper limit t-value
A'1, mmol·(g·h)-1 2.32E+00 2.29E+00 2.35E+00 1.37E+02
A'2 , mmol·(g·h)-1 5.12E-09 5.06E-09 5.19E-09 1.65E+02
A'3 , mmol·(g·h)-1 8.29E-06 8.19E-06 8.39E-06 1.64E+02
A'4 , mmol·(g·h)-1 2.04E-02 2.01E-02 2.07E-02 1.36E+02
A'5 , mmol·(g·h)-1 2.13E-01 2.10E-01 2.15E-01 1.72E+02
A'o , mmol·Pa-m·(g·h)-1· 7.66E-01 7.58E-01 7.74E-01 1.88E+02
E
A,1, kJ·mol-1 7.34E+01 7.29E+01 7.40E+01 2.57E+02
E
A ,2, kJ·mol-1 1.66E+02 1.64E+02 1.68E+02 1.71E+02
E
A ,3, kJ·mol-1 1.47E+02 1.44E+02 1.49E+02 1.28E+02
E
A ,4, kJ·mol-1 1.31E+02 1.29E+02 1.32E+02 1.40E+02
E
A ,5, kJ·mol-1 1.04E+02 1.03E+02 1.05E+02 1.75E+02
E
A ,O, kJ·mol-1 7.50E+01 7.43E+01 7.57E+01 2.15E+02
2
oOS−∆ , J·(mol·K)-1 9.54E+01 9.44E+01 9.63E+01 1.98E+02
2 6
oC HS−∆ , J··(mol·K)-1 1.08E+01 1.06E+01 1.10E+01 1.22E+02
2 4
oC HS−∆ , J··(mol·K)-1 7.53E+01 7.45E+01 7.60E+01 2.03E+02
2
oH OS−∆ , J··(mol·K)-1 4.19E+01 4.15E+01 4.23E+01 2.04E+02
2
oCOS−∆ , J·(mol·K)-1 4.88E+01 4.83E+01 4.93E+01 2.01E+02
oCOS−∆ , J·(mol·K)-1 4.25E+01 4.20E+01 4.31E+01 1.58E+02
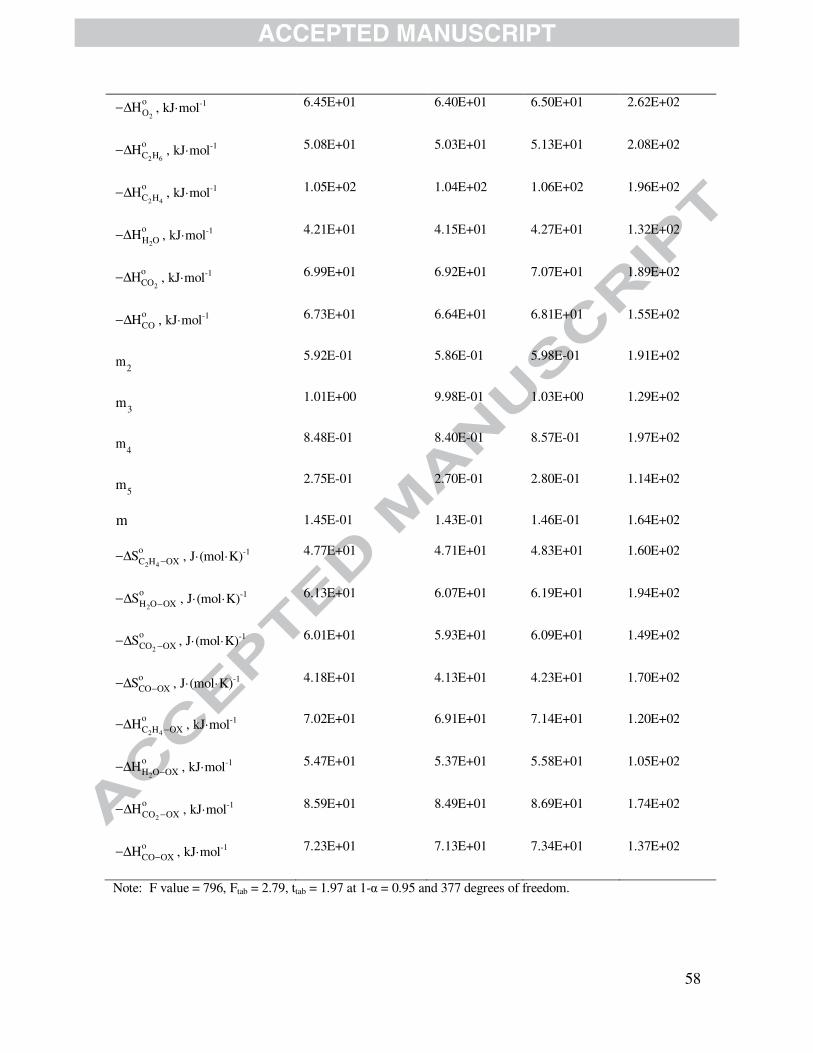
58
2
oOH−∆ , kJ·mol-1 6.45E+01 6.40E+01 6.50E+01 2.62E+02
2 6
oC HH−∆ , kJ·mol-1 5.08E+01 5.03E+01 5.13E+01 2.08E+02
2 4
oC HH−∆ , kJ·mol-1 1.05E+02 1.04E+02 1.06E+02 1.96E+02
2
oH OH−∆ , kJ·mol-1 4.21E+01 4.15E+01 4.27E+01 1.32E+02
2
oCOH−∆ , kJ·mol-1 6.99E+01 6.92E+01 7.07E+01 1.89E+02
oCOH−∆ , kJ·mol-1 6.73E+01 6.64E+01 6.81E+01 1.55E+02
m2 5.92E-01 5.86E-01 5.98E-01 1.91E+02
m3 1.01E+00 9.98E-01 1.03E+00 1.29E+02
m4 8.48E-01 8.40E-01 8.57E-01 1.97E+02
m5 2.75E-01 2.70E-01 2.80E-01 1.14E+02
m 1.45E-01 1.43E-01 1.46E-01 1.64E+02
2 4
oC H OXS −−∆ , J·(mol·K)-1 4.77E+01 4.71E+01 4.83E+01 1.60E+02
2
oH O OXS −−∆ , J·(mol·K)-1 6.13E+01 6.07E+01 6.19E+01 1.94E+02
2
oCO OXS −−∆ , J·(mol·K)-1 6.01E+01 5.93E+01 6.09E+01 1.49E+02
oCO OXS −−∆ , J·(mol·K)-1 4.18E+01 4.13E+01 4.23E+01 1.70E+02
2 4
oC H OXH −−∆ , kJ·mol-1 7.02E+01 6.91E+01 7.14E+01 1.20E+02
2
oH O OXH −−∆ , kJ·mol-1 5.47E+01 5.37E+01 5.58E+01 1.05E+02
2
oCO OXH −−∆ , kJ·mol-1 8.59E+01 8.49E+01 8.69E+01 1.74E+02
oCO OXH −−∆ , kJ·mol-1 7.23E+01 7.13E+01 7.34E+01 1.37E+02
Note: F value = 796, Ftab = 2.79, ttab = 1.97 at 1-α = 0.95 and 377 degrees of freedom.
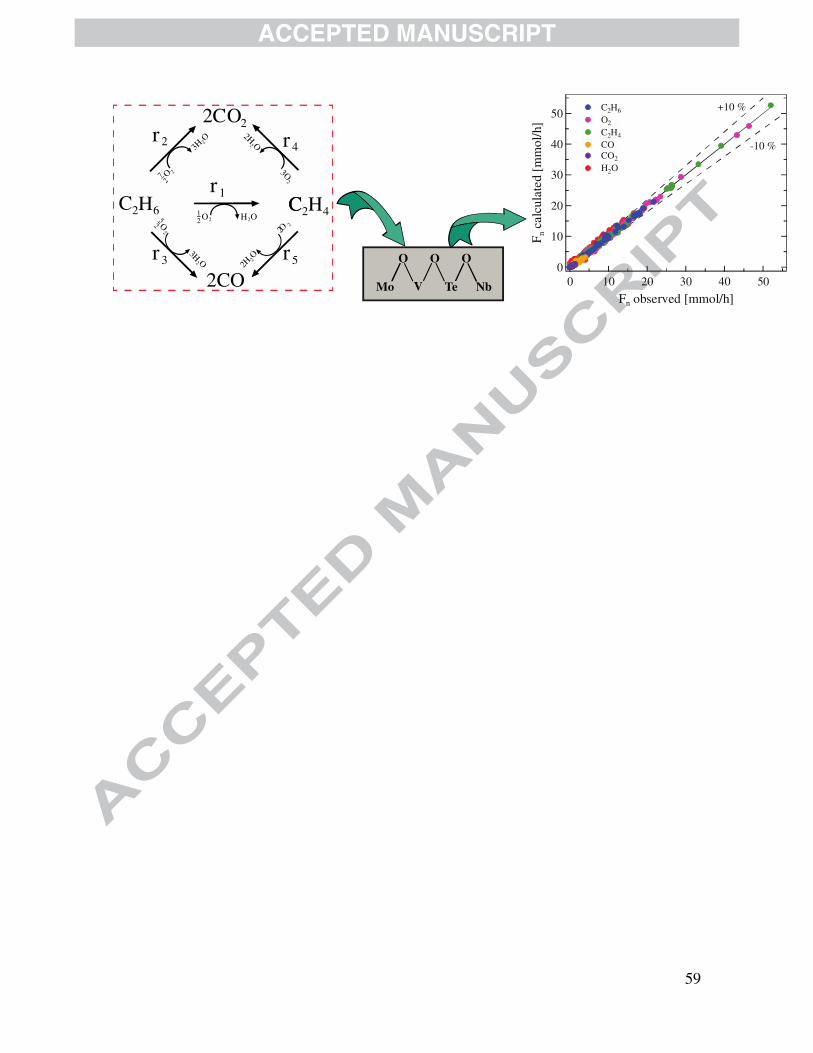
59
Mo V Te Nb
O O O
50
40
30
20
10
0
Fn
calc
ulat
ed [
mm
ol/h
]
50403020100
Fn observed [mmol/h]
+10 %
-10 %
C2H6
O2
C2H4
CO CO2
H2O
r r
rr
r
2
1
4
53
C
C
C
2CO
H
O
2
2
6H O2O2
12
O 2
72
2
3HO2
C H2 4
2HO
2
2O2
3HO2
2HO2
3O
2
O
2
52
60
Highlights:
• We study the kinetics for oxidative dehydrogenation reaction of ethane on
MoVNbTeO.
• We develop four kinetic models based on LHHW and MvK mechanisms.
• The LHHW mechanism provides the best statistical description of experimental data.
• Reaction rates are weakly affected by changes in the oxygen partial pressure.
• COx are formed out of both ethane and ethylene.