Embed Size (px)
Citation preview
Technological University Dublin Technological University Dublin
ARROW@TU Dublin ARROW@TU Dublin
Articles School of Food Science and Environmental Health
2013-08-01
Kinetic Studies for the Preparation of Probiotic Cabbage Juice: Kinetic Studies for the Preparation of Probiotic Cabbage Juice:
Impact on Phytochemicals and Bioactivity Impact on Phytochemicals and Bioactivity
Amit Jaiswal Technological University Dublin, [email protected]
Nissreen Abu-Ghannam Technological University Dublin, [email protected]
Follow this and additional works at: https://arrow.tudublin.ie/schfsehart
Part of the Food Biotechnology Commons, Food Chemistry Commons, Food Microbiology Commons,
and the Food Processing Commons
Recommended Citation Recommended Citation Jaiswal, A. K. & Abu-Ghannam, N. (2013). Kinetic studies for the preparation of probiotic cabbage juice: Impact on phytochemicals and bioactivity. Industrial Crops & Products, 50(0), 212-218. Doi : 10.1016/j.indcrop. 2013.07.128
This Article is brought to you for free and open access by the School of Food Science and Environmental Health at ARROW@TU Dublin. It has been accepted for inclusion in Articles by an authorized administrator of ARROW@TU Dublin. For more information, please contact [email protected], [email protected].
This work is licensed under a Creative Commons Attribution-Noncommercial-Share Alike 4.0 License Funder: Irish Government under the Technological Sector Research Scheme (Strand III) of the National Development Plan.
Highlights
− Kinetic studies for the preparation of probiotic cabbage juice were carried out.
− Significant growth in LAB was observed in white cabbage juice.
− The Gompertz model was applied to predict probiotic growth in white cabbage juice.
− Lactic acid was the major end product of the fermented cabbage juice.
− LAB fermented cabbage juice retains more than 75% of phytochemicals and bioactivity.
1
Kinetic studies for the preparation of probiotic cabbage juice: Impact on phytochemicals
and bioactivity
Amit Kumar Jaiswal & Nissreen Abu-Ghannam*
School of Food Science and Environmental Health, College of Sciences and Health, Dublin
Institute of Technology, Cathal Brugha Street, Dublin 1, Ireland
Short running head: Kinetic studies on probiotic cabbage juice preparation
*Corresponding author: Tel: +353-1-402-7570; Fax: +353-1-878-8978
E-mail: [email protected] (Nissreen Abu-Ghannam);
[email protected] (Amit Kumar Jaiswal)
2
Abstract
A kinetic study for the production of probiotic cabbage juice was carried out under controlled pH
and dissolved oxygen using several strains of Lactic acid bacteria (LAB). Furthermore, effect of
probiotic fermentation on polyphenolic content and antioxidant capacity was investigated.
Results showed significant growth in Lactobacillus brevis, Lactobacillus plantarum and
Lactobacillus rhamnosus corresponding to 9.19, 9.47 and 10.6 log CFU/ml after 24 h of
fermentation, which is satisfying criteria for a food product to be characterized as probiotic.
Lactic acid (LA) was the major end product of the fermented cabbage juice attaining the
concentrations of 6.97, 9.69 and 12.2 g/l LA for L. plantarum, L. rhamnosus and L. brevis,
respectively. LAB fermentation retains more than 75% of total phenolic content (TPC) and total
flavonoid content (TFC) of the initial raw material, and similar set of results were observed for
antioxidant capacity. First-order kinetics model fitted well with the experimental data with R2
value ranging from 0.92-0.96, 0.96-0.98 and 82.2-97.2 for TPC, TFC and antioxidant capacity,
respectively. During refrigerated storage (4°C), all the probiotic cultures met the criterion of
maintaining counts greater than 8 log CFU/ml; in addition to maintaining bioactive components
and antioxidant capacity.
Keywords: Antioxidant capacity; Kinetic study; Lactic acid; Polyphenols; Probiotics; cabbage
juice
3
1 Introduction
Foods which promote health beyond providing basic nutrition are termed as ‘functional foods’.
These foods have the potential to promote health in ways not anticipated by traditional
nutritional science (Beganović et al., 2011). Modern consumers are showing continuously a
remarkable interest in functional foods with more emphasis in recent times on probiotic types of
products. The main motive for purchasing functional foods is the growing desire to use foods
either to help prevent chronic illnesses or to optimize health. During the past two decades there
has been a large increase in the worldwide sales of functional products containing probiotic
bacteria which led to one of the fastest growing food sectors, with a compound annual growth
rate of 8.6% in the 10 years to 2012 (Khan et al., 2013).
Available literature confirms that the addition of probiotics to food provides several health
benefits, including reduction in the level of serum cholesterol, improved gastrointestinal
function, enhanced immune system, antimutagenic property, anti-carcinogenic property, anti-
diarrheal property, improvement in inflammatory bowel disease and suppression of Helicobacter
pylori infection by the addition of selected strains to food products (Agerholm-Larsen et al.,
2000; Gotcheva et al., 2002; Nomoto, 2005; Sindhu and Khetarpaul, 2003).
Probiotics have successfully been added to a wide range of dairy based food products. However,
the problem of lactose intolerance and cholesterol content has increased the demand for non-
dairy based probiotic products. About 5 to 15% of the Europe population is lactose intolerant
and this number increased up to 80% in some part of the world such as central Asia and Africa
(de Vrese et al., 2001). Dairy products with probiotic bacteria are unsuitable for this group of
population because of its health condition. Additionally, with growing awareness of gut health,
4
consumers demand a wider variety of probiotic products beyond dairy based food products. This
work is part of an on-going project to evaluate the potential of Brassica vegetables for the
development of a probiotic-based product. Fermentation is widely used in the food industry to
improve the sensory characteristics of a product as well as to eliminate certain undesirable
constituents, make nutrients more accessible while preserving and even improving the nutritional
properties. In a previous study, it was reported that cabbage juice is a good medium for the
growth of probiotics (Yoon et al., 2006). It was also observed that natural fermentation of
cabbage in the production of sauerkraut increased the initial antioxidant (AO) activity which
could have resulted from the combined effects of wounding and chemical processes incurred by
lactic acid bacteria (LAB) (Kusznierewicz et al., 2008).
Furthermore, there is now an increasing interest in modelling the kinetics of beneficial
microorganisms in food systems leading to a better understanding of the fermentation process.
Mathematical models can help to predict the influence of fermentation operating parameters on
the rate of substrate utilization, cell growth and lactic acid (LA) production (Biazar et al., 2003).
The use of these models may lead to the development of better strategies for the optimization of
the fermentation process to ensure its economical viability. Therefore, in the present report, a
kinetic study for the production of probiotic cabbage juice was carried out using several strains
of LAB in order to achieve maximum LAB in cabbage juice. At the same time, the effect of
fermentation on inherent total phenolic content (TPC), total flavonoid content (TFC), and AO
capacity of cabbage juice was also studied. Furthermore, shelf life of fermented probiotic
cabbage juice was undertaken by evaluating the cell viability, lactic acid content, pH and
phytochemical constituents.
5
2 Materials and methods
2.1 LAB strains and inoculum preparation
L. plantarum ATCC 8014; Lactobacillus rhamnosus ATCC 9595 and Lactobacillus brevis
ATCC 8287 were purchased from Medical Supply Company, Dublin, Ireland. The culture was
maintained at −70°C in 20% glycerol stocks and grown in de Man, Rogosa and Sharp (MRS)
broth (Scharlau Chemie, Barcelona, Spain) at 37°C. For the preparation of inoculum, 25 ml of
sterile MRS broth was inoculated with 1 ml of thawed stock culture and incubated at 37°C for
12-14 h. This was then serially diluted 100 times to obtain working culture containing 5-6 log
colony-forming unit (CFU)/ml cells as determined by plate counts.
2.2 Plant materials and preparation of juice
Fresh white cabbage (Brassica oleracea var. capitata) was purchased from a local supermarket
in Dublin. Twenty five to thirty white cabbage heads (45-50 kg) were randomly selected and
trimmed of their outer leaves and the stem. The heads were then divided into four segments, and
the central core was removed. The segments were chopped into small pieces using an ordinary
knife. The part of shredded cabbage was blended with the addition of water (1:1 w/v), and the
juices were squeezed out from the pulps and sterilized for 15 min at 121°C in an autoclave
(Tomy SS-325, Tomy Seiko Co. Ltd, Tokyo, Japan) and stored under dark refrigerated
conditions (4°C). The sterilized juice was filtered through sterilized muslin cloth and further
diluted with sterile double distilled water (2:1 v/v) (hereafter the diluted cabbage juice was called
WCJ ) and five litre of WCJ was used for each batch of fermentation.
6
2.3 Preliminary LAB fermentation
In order to check the applicability of WCJ as a substrate for LAB growth and to compare the
growth pattern in WCJ with typical medium for LAB cultures, preliminary experiments involved
screening of WCJ (diluted with water, 2:1) and MRS broth. The preliminary LAB fermentation
was performed in a 96-well round-bottom microplate (Sarstedt, Inc, USA). The sterilized WCJ
was inoculated with various LAB strains (5% v/v), and MRS was inoculated in similar fashion
and 200 µl dispensed in each microtiter well. Wells containing sterile MRS or WCJ (200 µl)
were treated as blanks to check for contamination. The LAB growth was monitored at 600 nm
using the micro plate spectrophotometer (Powerwave, Biotek, VT, USA) (preceded with 30 sec
agitation) over 24 h at 30 min intervals. Growth curves of the test organisms were analyzed
graphically as a plot of OD600 versus time. Maximum OD600 (ODmax) obtained and lag time (λ)
for each growth curve were calculated using Gen5 reader data analysis software.
2.4 Fermentation in 7 L bioreactor under controlled pH
Seed culture (200 ml) was prepared as mentioned in section 2.1 (LAB strains and inoculum
preparation). Cultivation was carried out at 37°C at the agitation speed of 200 rpm, in a 7 litre
Bioflo 415 bioreactor (New Brunswick Scientific Ltd.) containing 5 litre of WCJ under aseptic
conditions. The bioreactor was sterilized in situ, cooled and then inoculated with 5% inoculum
(v/v). Culture pH was maintained at 7.0 by the automated control system of bioreactor with the
addition of acid or base. Samples were withdrawn at 3-4 h interval and analyzed for viable cell
count, lactic acid (LA) production, phytochemical constituents and AO capacity.
7
2.5 Viable cell counts
Viable cell counts in the fermented WCJ (log CFU/ml) were determined by the standard plate
method with MRS medium. Dilution of 1 ml broth was carried out in 9 ml maximal recovery
diluent (MRD) to plate the suitable dilution. The plates were incubated at 37°C for 36-48 h, for
cell enumeration.
2.6 Effect of cold storage on probiotic WCJ
After 24 h of fermentation at 37°C, the fermented WCJ was stored at 4°C for four weeks.
Samples were taken at three-day intervals, and pH, lactic acid, viable cell count, phytochemical
content and AO capacity were estimated.
2.7 Analytical procedure
Each sample of the fermented broth was centrifuged at 10,000 rpm for 15 min at 4°C. The
supernatant was used for the analysis.
2.7.1 Total phenolic and flavonoid contents
TPC and TFC of samples were estimated according to our earlier report (Jaiswal et al., 2012b).
In brief, for the TPC estimation, 100 ml aliquot of sample in deionized water were mixed with 2
ml of 2% Na2CO3 and were allowed to stand for 2 min at room temperature. After incubation,
100 ml of 1N Folin-Ciocalteau’s phenol reagent was added. Reaction mixture was allowed to
stand for 30 min at room temperature in the dark. Absorbance of all the sample solutions was
measured at 720 nm using spectrophotometer (Genesys 20; Thermo Spectronic, Madison, WI).
Results were expressed as µg gallic acid equivalents (GAE) per ml of sample.
For the TFC estimation, 250 ml of sample was mixed with 1.25 ml of deionized water and 75 ml
of 5% NaNO2 solution. After 6 min, 150 ml of 10% AlCl3·H2O solution was added. Finally, 0.5
8
ml of NaOH (1M) solution was added and the total volume was made up to 2.5 ml with
deionized water. Absorbance against blank was taken at 510 nm using a spectrophotometer.
Results were expressed as µg quercetin equivalents (QE) per ml of sample.
2.7.2 Determination of sugar, organic acids and protein contents
Determination of individual sugar content and organic acids was carried out as described in our
earlier report (Jaiswal et al., 2012a). Standards for the organic acids such as lactic, propionic,
citric, oxalic and acetic acid; sugars such as glucose, fructose and arabinose were used to identify
and quantify the contents in the samples. Protein concentration of probiotic cabbage juice was
estimated using Bradford's method (Bradford, 1976). In brief, 200 µl aliquot of sample was
mixed with 800 µl of Bradford's reagent (Sigma-Aldrich, Germany) and allowed to stand for 5
min at room temperature. Absorbance of all the sample solutions was measured at 595 nm using
a spectrophotometer (Genesys 20; Thermo Spectronic, Madison, WI). Results were expressed as
µg bovine serum albumin equivalents (BSAE) per ml of sample.
2.7.3 Antioxidant capacity
Two different methods [2,2-Diphenyl-1-picrylhydrazyl radical scavenging capacity (DPPH) and
Ferric reducing AO potential (FRAP) assay were used for the estimation of AO capacity of the
sample (Rajauria et al., 2012). DPPH scavenging capacity assay was performed in a 96-well
round-bottom microplate with 1:1 ratio of 100 µl of 2,2-Diphenyl-1-picrylhydrazyl (DPPH)
(Sigma-Aldrich, Germany) radical solution (165 µM) and 100 µl of test sample. The DPPH
solution was freshly prepared in methanol . The reaction mixtures were incubated for 30 min at
25°C in dark conditions, and absorbance measured at 517 nm in a microplate reader (Biotek
9
EL808 Microplate Reader, BioTek Instruments, Inc., VT 05404, USA). Results were expressed
as µg ascorbic acid equivalents (AscE) per ml of sample.
For FRAP analysis, reagent was freshly prepared by mixing 10 volumes of 300 mM acetate
buffer, pH 3.6, with 1 volume of 10 mM TPTZ (2,4,6-tri(2-pyridyl)-s-triazine) (Sigma-Aldrich,
Germany) in 40 mM hydrochloric acid and with 1 volume of 20 mM ferric chloride (Sigma-
Aldrich, Germany). All solutions were used on the day of preparation. The reaction was
performed in a microplate reader with 96-well plates (Sarstedt, Inc, USA) at a temperature of
37°C. Preheated 100 µl FRAP reagent at 37°C was dispensed in each well with 50 µl of sample
or standard. The reagent blank assay was performed by using 100 µl FRAP reagent and 50 µl of
water. The absorbance was read after 10 min at 593 nm with the help of microplate
spectrophotometer. Trolox (Sigma-Aldrich, Germany) was used as a standard and the results
were expressed as µg trolox equivalents (TE) per ml of sample.
2.8 Mathematical modelling
Modified Gompertz equation (Zwietering et al., 1990) was fitted to the logarithm of the cell
concentration in order to estimate the maximum specific growth rates of L. plantarum, L.
rhamnosus and L. brevis. The model is described by the equation (Eq. 1):
( )
+−
×
−×=
1expexplog
0
tA
eA
N
Nλ
µ
(Eq. 1)
where µmax is the maximum specific growth rate of cell population, A is the log increase in
population and λ is a delayed time variable (lag phase), N is the CFU/ml at any time t, N0 is the
initial CFU/ml.
10
The fermentative production of LA was described by the following equation (Eq. 2) (Mercier et
al., 1992).
−×=
m
rP
PPP
dt
dP1 (Eq. 2)
Where t is time, P is LA concentration (g/l), Pm is the maximum concentration of lactic acid
(g/l), Pr (h-1
) is the ratio between the initial volumetric rate of product formation (rp) and the
initial product concentration P0. Eq. (2) can be solved to give the following expression:
tP
m
tP
m
r
r
ePPP
ePPP
00
0
+−
= (Eq. 3)
The value of model parameters for (A, µ, λ. P0, Pm and Pr) were fitted by with a Marquardt
algorithm, using the STATGRAPHICS Centurion XV (StatPoint Technologies, Inc., Warrenton,
VA) statistical software.
The kinetics of WCJ phenolic content, flavonoid content and different AO capacity were
described by fitting a zero order (Eq. 4), first-order (Eq. 5) or a the second order kinetic model
(Eq. 6) to the experimental data
(Eq. 4)
(Eq. 5)
(Eq. 6)
Where, A is the parameter to be estimated, the sub index 0 indicates the initial value of the
parameter, t is the fermentation time, and k is the rate constant at temperature T. For the
11
parameter estimation, the individual measured concentrations were used instead of mean values
of duplicate or triplicate experiments, thus taking into account variability within the samples.
2.9 Statistical analysis
Fermentation was carried out in duplicate whereas all the other analysis were carried out in
triplicate and replicated twice unless otherwise stated. Results were expressed as mean values ±
standard deviation. The regression analysis and analysis of variance (ANOVA) were carried out
using the STATGRAPHICS Centurion XV software. Values of P < 0.05 were considered as
statistically significant. The coefficient of determination (R2) and mean square error (MSE) were
used as criteria for adequacy of fit.
3 Results and discussion
3.1 Initial fermentation studies with microtiter plate reader
Prior to the application of bioreactor fermentation using 5 litre of WCJ, preliminary fermentation
was carried out to check the applicability of WCJ as a substrate for LAB growth. LAB strains
have complex nutritive requirements, and therefore, they are usually associated with nutrient-rich
environments such as animal bodies, plants, and foodstuffs. LAB grew well in the WCJ without
additional supplements, suggesting that WCJ comprises a good medium for the growth of LAB
strains.
The ODmax obtained by the studied LAB strain in WCJ were in the range of 1.05 to 1.67, these
values are higher than those reported in other studies for cabbage and other vegetable juice
(Champagne et al., 2009; Savard et al., 2003). The higher growth of LAB observed in this study
could be related to the nutritional content of Irish white cabbage. Among the LAB strains L.
rhamnosus attained highest growth level (ODmax 1.67) followed by L. plantarum (ODmax 1.48)
12
and L. brevis (ODmax 1.05). Though, ODmax values were always lower in WCJ compared to
MRS.
Generally, MRS medium has phosphate buffers, which are not available to WCJ, however, it is
anticipated that higher ODmax readings observed in MRS are due to a higher buffering capacity of
MRS, rather than a nutrient deficiency of WCJ. Nonetheless, the results obtained in this study
were encouraging as LAB grew satisfactory in the WCJ. Published literature shows that
controlling the pH is critical in obtaining high biomass yields (Cerning et al., 1994). Therefore,
in order to produce large volume (5 litre) of WCJ with high biomass, a further study was carried
out in the bioreactor under controlled pH and dissolved oxygen.
3.2 Fermentation under controlled conditions using 7 litre bioreactor
3.2.1 Growth of LAB during fermentation
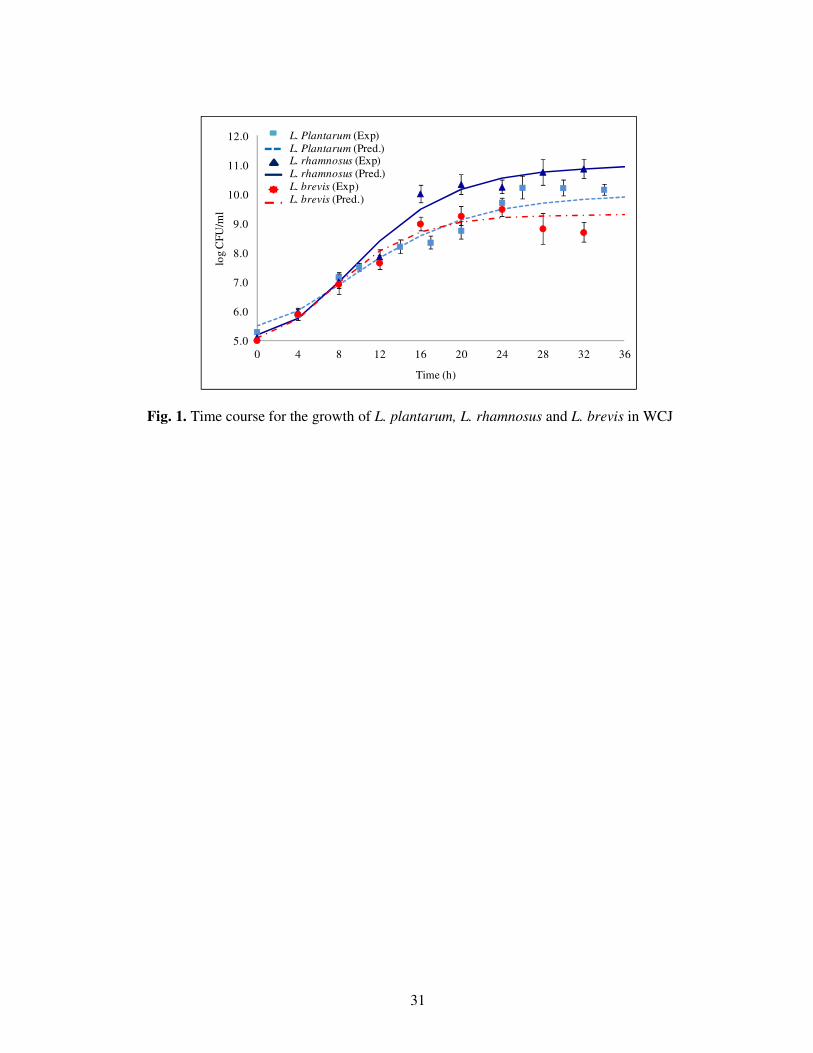
The time course for the growth of L. plantarum, L. rhamnosus and L. brevis is presented in Fig.
1. Total fermentation time ranged from 32-36 h and was dependent on the time of entering the
decline phase for the LAB strains under study. However, all of the LAB strains showed different
growth characteristics but reached the stationary phase within 24 h after which there was no
significant increment observed in LAB growth. Initially, the concentration of probiotic bacteria
was approximately 5 log CFU/ml; after 24 h of fermentation it increased to 9.19, 9.47 and 10.6
log CFU/ml for L. brevis, L. plantarum and L. rhamnosus, respectively. These results were in
agreement with ODmax data in the preliminary studies. It is anticipated that WCJ sustains the
growth of probiotic bacteria due to protein content, total available sugars and micronutrients. In a
previous report, it was found that cabbage is among the nutritionally well-balanced vegetables; it
is rich in proteins, vitamins, carbohydrates, sugars (including fructose, glucose, sucrose and
13
raffinose), essential n-3 fatty acid and linolenic acid (Batista et al., 2011). Thus, it is presumed
that the bacteria utilized these nutrients as an energy source without additional nutrient
supplementation. Growth of Lactobacillus in vegetable juices, including cabbage juice have been
studied by various authors (Champagne et al., 2009; Gardner et al., 2001; Tolonen et al., 2004;
Yoon et al., 2006) and maximum cell concentration has been reported to vary from log 7 to 8
CFU/ml.
In a previous study, it was found that L. plantarum, L. casei and L. delbrueckii grew rapidly in
sterilized cabbage juice without nutrient supplementation reaching nearly 8 log CFU/ml after 48
h of fermentation at 30°C (Yoon et al., 2006). Similarly, some other authors investigated the
possibility of producing a functional carrot juice using L. rhamnosus and L. bulgaricus and a
growth of 5×10⁹
CFU/ml after 48 h was reported (Nazzaro et al., 2008). However, the results of
the present study were encouraging as the time required to reach more than 9 log CFU/ml viable
cell count was shorter (24 h).
There are several models, which have been used to describe the sigmoid growth curve of a
microorganism such as the Baranyi, Gompertz or Logistic models (Zwietering et al., 1990).
Gompertz model is regarded as the most suitable to describe such microbial growth curves due to
its simplicity and the low correlation, or interdependence, of the characteristic parameters. In this
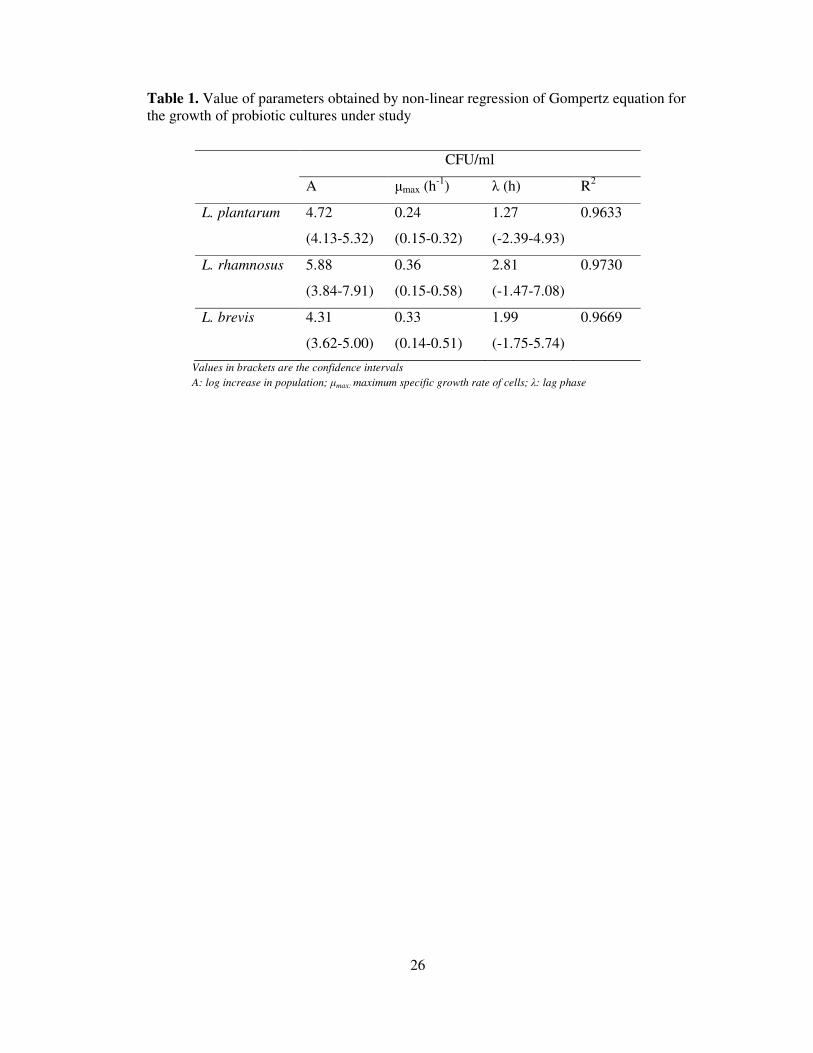
study, the lag phase duration as obtained from the Gompertz equation was minimal (less than 3
h) and was the magnitude of 1.27, 1.99 and 2.81 for L. plantarum L. brevis, and L. rhamnosus,
respectively (Table 1). Among the probiotic cultures, L. rhamnosus and L. brevis grow at a
significantly faster rate than L. plantarum (Table 1). The specific growth rate (µmax) of L.
rhamnosus and L. brevis was 1.5 times higher as compared to L. plantarum. The high growth
14
rate resulted in a faster consumption of nutrients and thus the stationary phase for L. rhamnosus
was attained in a total fermentation time of 16 h. L. brevis and L. rhamnosus showed 1.4 times
higher specific growth rate (µmax) value as compared to L. plantarum.
Glucose was the main sugar present, accounting for ≈55% of the total sugar while fructose
accounted for almost 45%. This result is in line with previous findings, demonstrating that
glucose and fructose are the main sugars present in white cabbage (Rosa et al., 2001). It is worth
remarking that the sugar content reduced continuously as the bacterial population increased
throughout the fermentation time. It was observed that fermentation led to a sharp depletion in
the glucose and fructose levels in WCJ. Both the glucose and fructose were simultaneously
consumed by the LAB strains during the fermentation process, but the rate of depletion was
higher for glucose and more intense, which is usually because of the glucophilic nature of LAB.
In the case of L. plantarum, after 24 h of fermentation only 33% residual glucose was left, while
in the case of L. brevis it was 37% and for L. rhamnosus there was 10% remaining. A similar
trend was also shown by fructose; however, the consumption was lower than glucose as after 24
h of fermentation only 76, 50 and 43% of fructose was consumed by L. plantarum L. brevis, and
L. rhamnosus, respectively. As a result, the residual fructose concentrations were considerably
higher than the residual glucose concentrations after fermentation.
3.2.2 pH and organic acid production during fermentation
Initially, the pH of the WCJ was 6.2, which was adjusted to 7.0 before inoculation. As the
fermentation was carried out under controlled pH conditions, further pH was adjusted by adding
1M HCL or 4M KOH. The pH decreased slowly for the first 4 to 6 h of fermentation, and then
dropped more quickly until LAB was in the decline phase. The drop in pH is due to the
15
production of organic acids. Theoretically, the fermentation of 2 mol of glucose by LAB
produces 3 mol of acetate and 2 mol of lactate via the fructose-6-phosphate shunt. The
proportions of each metabolite depend on the carbon source; the strain used or the fermentation
conditions. The presence of lactic and acetic acids in fermented foods is advantageous due to
their antimicrobial property, thus preventing spoilage by other microorganisms.
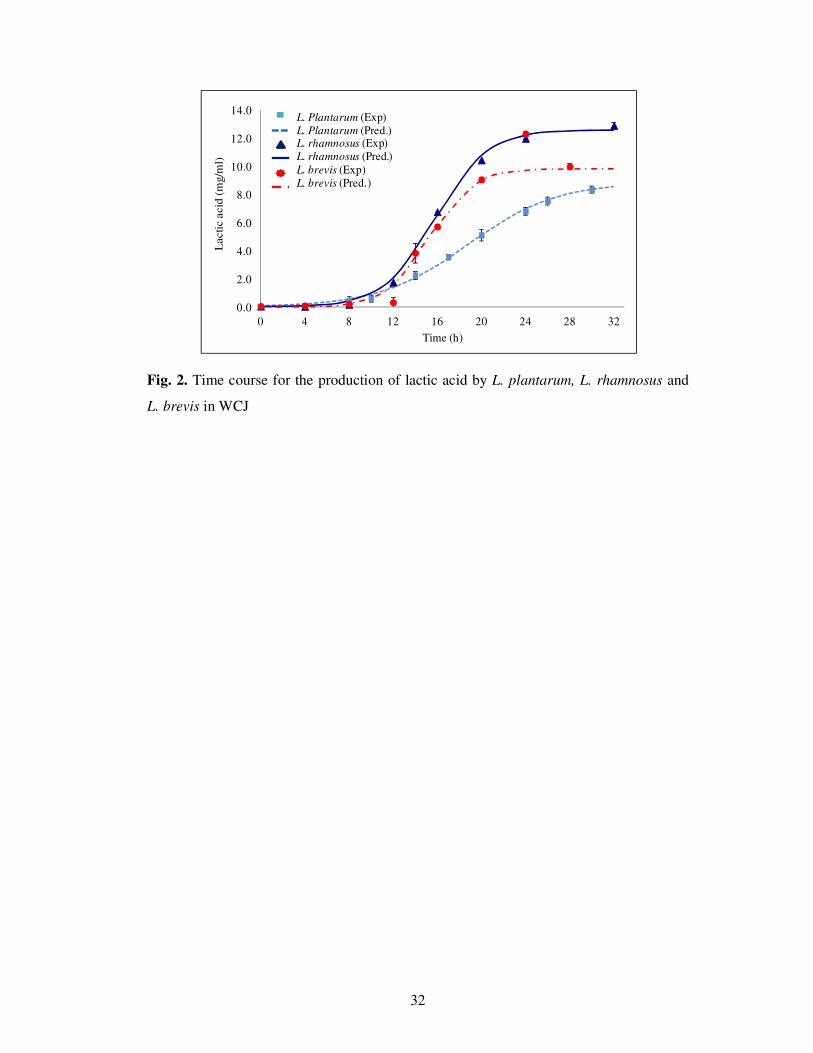
Significant increment in acid concentration started after 8 h of fermentation and increased
linearly until 24 h, after which the production of acids was constant during the entire stationary
phase. Lactic acid was the major end product of the WCJ fermentation followed by acetic acid,
attaining the concentrations of 6.97, 9.69 and 12.2 g/l lactic acid, while 0.45, 0.59 and 1.15 g/l
acetic acid were obtained for L. plantarum, L. rhamnosus and L. brevis, respectively. Absence of
acetic acid results in a unilaterally sour taste with a flat and unusual aroma whereas its presence
has a favourable effect on preservation. The presence of 0.51 g/l citric acid was noted at the
beginning of fermentation and its concentration reduced as the fermentation progressed. At the
end of 24 h fermentation only 0.16, 0.30 and 0.45 g/l citric acid was recorded for L. rhamnosus,
L. plantarum and L. brevis, respectively.
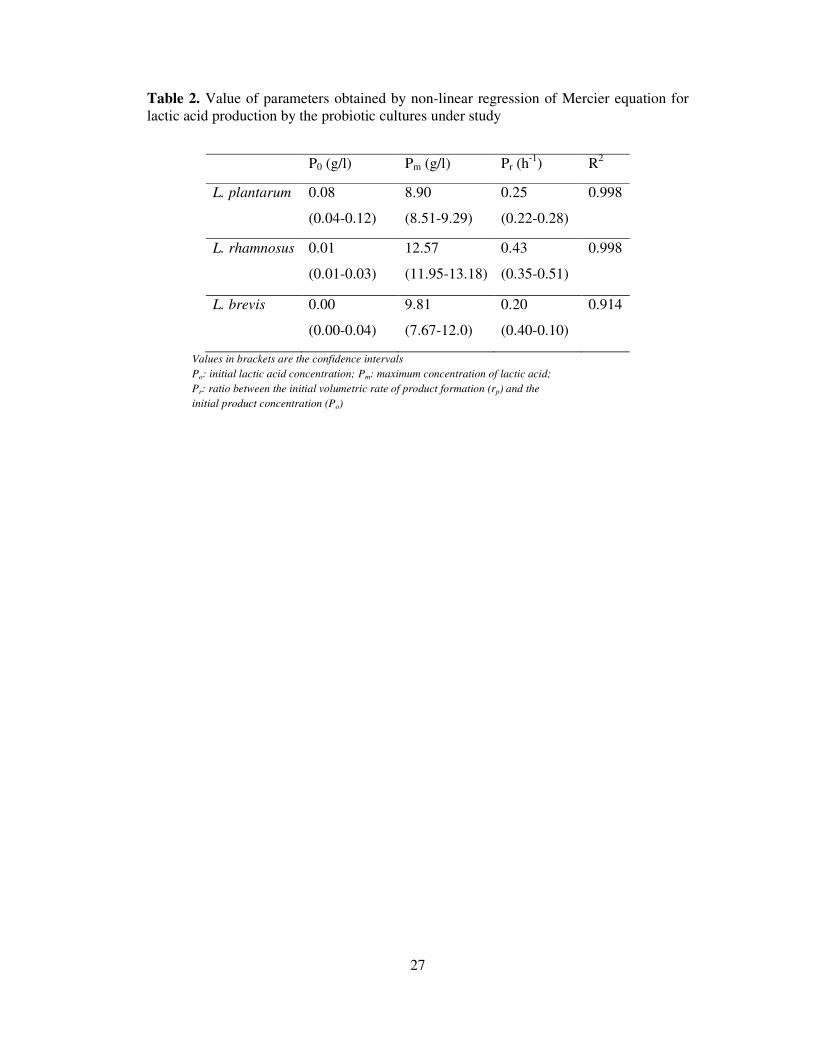
The kinetic of lactic acid production was reasonably described by Mercier equation (Mercier et
al., 1992) (Fig. 2) with a high coefficient of determination (Table 2). In the case of L. rhamnosus,
the rate of production of lactic acid (Pr) was 0.43 h-1
, which was 1.72 and 2.15 times higher than
that produced by L. brevis and L. rhamnosus, respectively. The numerical values of the
parameter ‘P0’ were found to be close to zero, which is well in agreement with the obtained
results. Similar results were also obtained for L. plantarum and L. brevis, but the rate of
production of lactic acid was lower (41.7 and 53.5% for L. plantarum and L. brevis) than L.
16
rhamnosus (Table 2). Some traces of citric and propionic acid was also observed although their
concentration was not significant.
3.2.3 The impact of fermentation on polyphenol content
The major contribution to the AO capacity of plant foods is related to their content of
polyphenols. Thus, it is important to consider the effect of fermentation on the TPC and TFC of
the WCJ. Initially, the TPC of WCJ was in the range of 172.5 to 235.5 µg GAE/ml. Fermentation
seemed to have a negative effect on the polyphenols content. In the case of L. plantarum and L.
brevis, after 24 h of fermentation there was approx 15% reduction in TPC, while in the case of L.
rhamnosus the loss was more prominent (24%). The TFC of the fermented WCJ at the beginning
of the fermentation existed in the range of 41.9-55.6 µg QE/ml. A significant decrease in the
TFC was seen as a result of LAB fermentation and approx 15.7, 21.7 and 23.9% losses in the
TFC were recorded for L. brevis, L. plantarum and L. rhamnosus after 24 h of fermentation.
These results were in agreement with the previously reported studies. Othman et al. (2009)
reported a loss of 32-58% in the polyphenols during spontaneous and controlled fermentations of
“Chétoui” cultivar olives. Oseni and Akindahunsi (2011) also reported a 64% reduction in the
TPC during fermentation of Jatropha curcas and a similar trend was observed by Towo et al.
(2006); these authors reported that LAB fermentation of cereal products leads to the reduction of
phenolic compounds. LAB has a range of enzymes such as β-glucosidase, p-coumaric acid
decarboxylase, decarboxylase which may help in degrading certain phenolic compounds.
However, results obtained in the present study were encouraging as LAB fermentation retained
more than 75% of the initial polyphenols in the fermented WCJ.
17
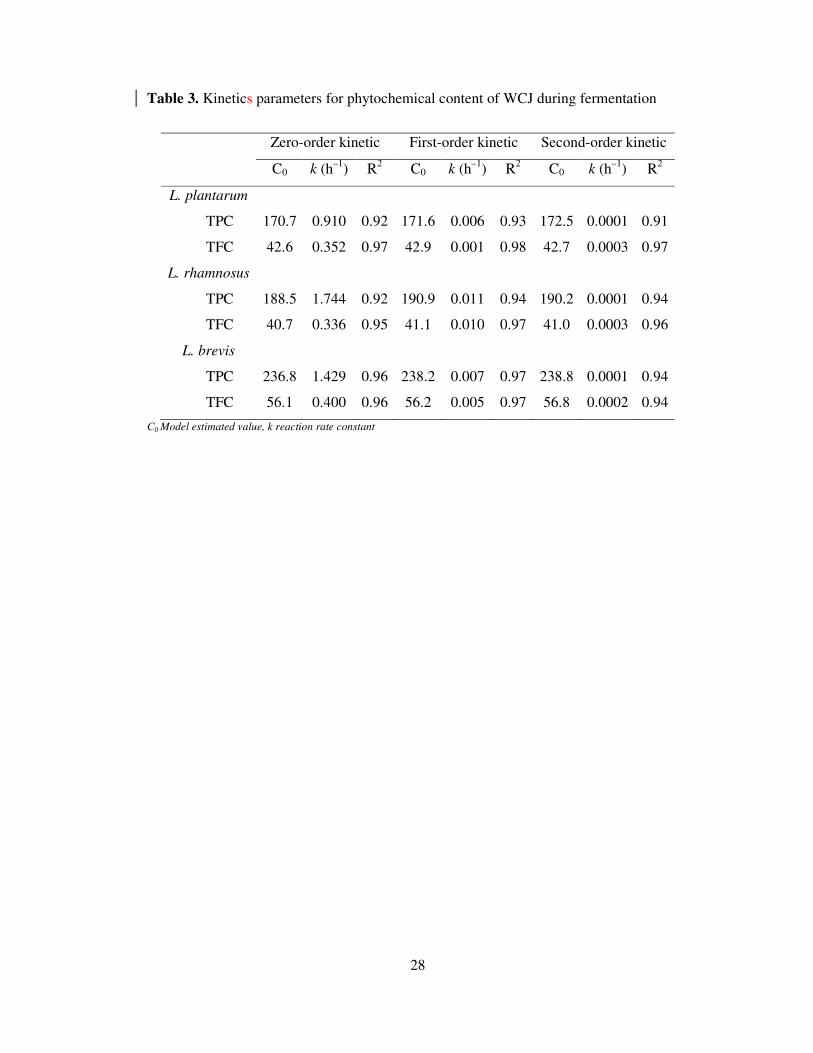
Degradation kinetics of the phytochemical content was modelled using zero-order (Eq. 4), first-
order (Eq. 5) and second-order kinetics model (Eq. 6). Coefficient of determination (R2) was
used as statistical measures for comparison of the experimental and model simulated values.
First-order kinetics model fitted the experimental data with higher R2 value, ranging from 0.92-
0.96 and 0.96-0.98 (Table 3) with a rate constant corresponding to 0.006-0.011 and 0.001-0.010
h-1
for TPC and TFC, respectively. The rate of TPC degradation was highest in L. rhamnosus
fermented WCJ, which was 1.8 and 1.6 times higher than L. plantarum and L. brevis,
respectively and a similar trend was observed for TFC where the rate of degradation was 1.7 and
2 times higher than L. plantarum and L. brevis, respectively.
3.2.4 The impact of fermentation on antioxidant capacity
The DPPH free radical scavenging capacity of the unfermented WCJ was in the range of 58.7-
59.1 µg AscE/ml. In the case of WCJ fermented with L. plantarum, the loss of the DPPH radical
scavenging was ≈ 13%, while in the case of L. brevis and L. rhamnosus losses were 12 and 5%,
respectively, after 24 h of fermentation.
The ferric reducing AO potential of the fermented WCJ was evaluated for each strain as a
function of incubation time. All the three LAB strain had similar trends during the fermentation
period. The initial ferric reducing power WCJ expressed as an equivalent amount of trolox,
decreased by the end of fermentation. After 24 h of fermentation, the reducing power decreased
from 21.7 to 17.0 µg TE/ml when WCJ was incubated with L. plantarum; from 15.8 to 13.9 µg
TE/ml with L. brevis, and from 15.0 to 13.7 µg TE/ml when inoculated with L. rhamnosus. AO
capacity depends on the structural conformation of phenolic compounds, and a similar trend was
18
evident in this study. Thus, AO capacity is greatly influenced by the phenolic composition of the
sample.
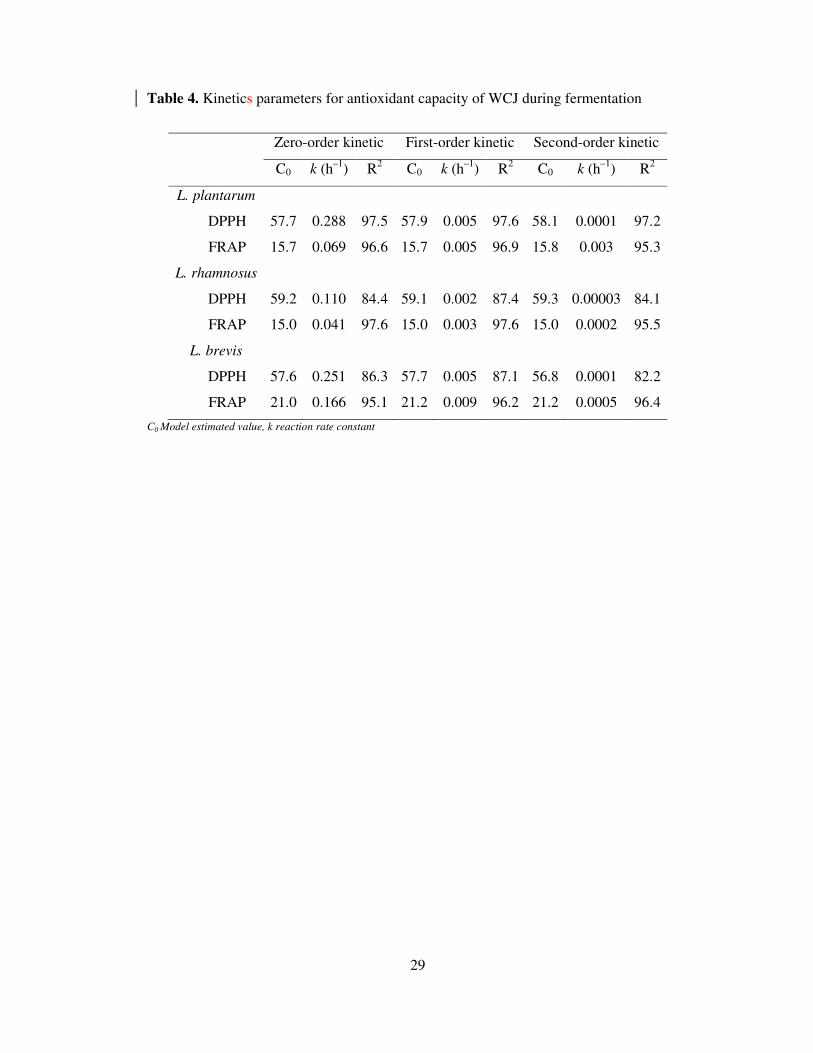
Degradation kinetics of the AO capacity was modelled by the application of zero-order (Eq. 4),
first-order (Eq. 5) and second-order kinetics models (Eq. 6). The first-order kinetics model fitted
the experimental data with a higher R2 value, ranging from 0.87-0.98 and 0.96-0.98 for DPPH
radical scavenging capacity and FRAP, respectively (Table 4) with a rate constant corresponding
to 0.002-0.005 and 0.003-0.009 h-1
for DPPH radical scavenging capacity and FRAP,
respectively. A different trend was observed in the case of AO capacity reduction, the maximum
rate of reduction in DPPH scavenging capacity was evident in L. brevis and L. plantarum
fermented WCJ which was 2.5 times higher than L. rhamnosus; however, no significant
difference (P > 0.05) was observed between the rate of DPPH scavenging capacity reduction in
L. brevis and L. plantarum fermented WCJ.
A similar pattern was observed for reduction in FRAP values, where L. brevis fermented WCJ
showed 1.8 and 2.5 times higher rate of reduction for FRAP value. The differences in the trends
between polyphenols and AO capacity could be understood by the fact that AO capacity of the
food depends on the synergistic and redox interactions among the different compounds present in
the vegetable. The reduction in one group of compounds may lead to the loss in functionality
against certain type of free radicals without changing its functionality toward other radicals.
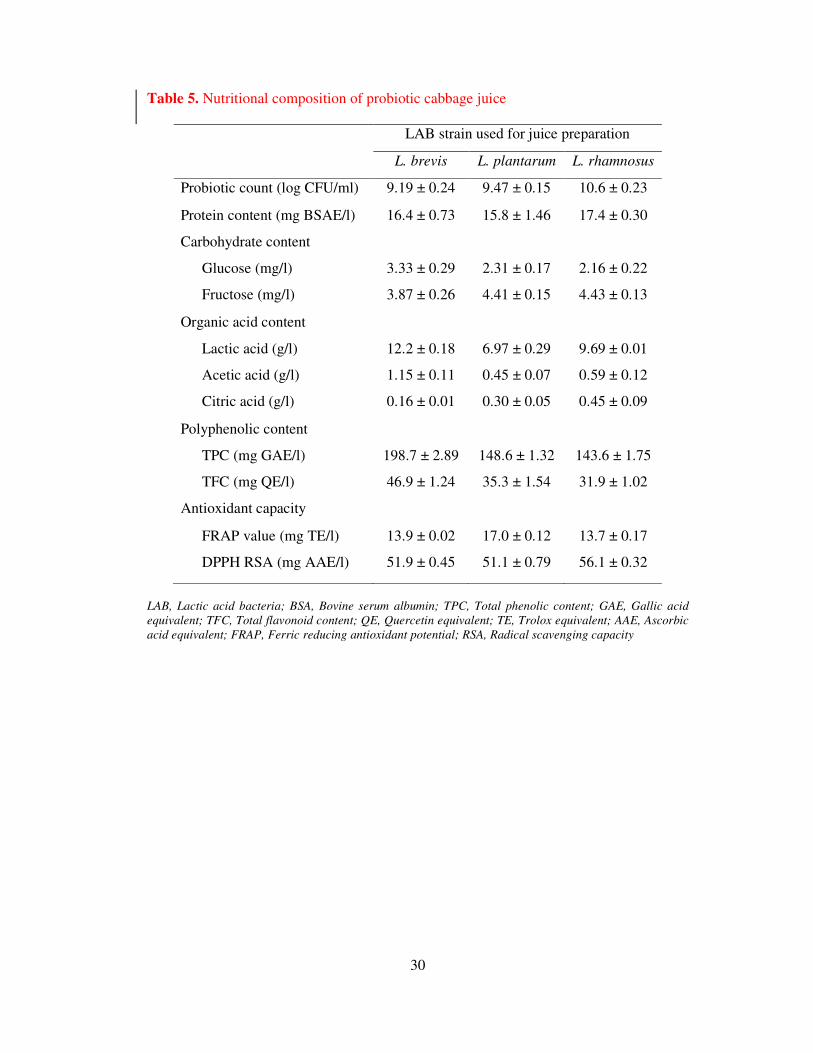
3.2.5 Composition of probiotic cabbage juice
The composition of food materials has an important role in maintaining prosperous health. Table
5 shows the nutritional composition of probiotic white cabbage juice. The fermented WCJ
exhibited probiotic count in the range of 9.19 to 10.6 log CFU/ml. Protein concentration ranges
19
from 15.8 to 17.4 mg BSAE/ l while carbohydrate content in terms of glucose is 2.16 to 3.33
mg/l and fructose content ranges from 3.87 to 4.43. Among the organic acids, LA content ranged
from 6.97 to 12.2 g/l while acetic acid content ranged from 0.45 to 1.15 g/l. Traces of citric acid
was also noted; however, content was very low in the range of 0.16 to 0.45 g/l. Significant
concentration of polyphenolic content was detected in the probiotic WCJ; which was in the range
of 143.6 to 198.7 mg GAE/l.
3.2.6 Shelf life analysis
The probiotic WCJ was produced under the following conditions: an initial pH of 7.0,
fermentation temperature at 37°C, inoculated with 5% (v/v) of inoculums size (≈5 log CFU/ml)
and fermented for a 24 h time period. There was a complete absence of any Enterobacteria or
moulds in the fermented broth during the 30 days of storage at 4ºC. LAB counts in the probiotic
WCJ were 9.19, 9.47 and 10.6 log CFU/ml upon fermentation with L. brevis, L. plantarum and
L. rhamnosus, respectively; similarly, ≈ 12.2, 6.97 and 9.69 g/l LA content were produced upon
fermentation with L. brevis, L. plantarum and L. rhamnosus, respectively. The stability of the
probiotic bacteria during storage was monitored and a slight increase (≈ 1 log CFU/ml) in the
bacterial growth and lactic acid (1-2 g/l) was seen at the end of the 30 days of storage. The
increase in LAB count could be due to the presence of residual glucose and fructose which was
left after fermentation; thus, providing some essential growth nutrients. Pereira et al. (2011)
observed in fermented cashew apple juice that up to 28 days of storage at 4°C, there was slight
increment in L. casei count and contentious decrease in pH which could be due to acid
production.
20
In order to exert the beneficial effects of probiotic foods, a minimum probiotic therapeutic daily
dose of 8 to 9 log CFU has been proposed, which corresponds to a daily intake of 100 g of a food
product containing 6 log up to 7 log CFU/g (Lee and Salminen, 1995), which this product meets.
Guo et al. (2009) reported that the pH of L. casei fermented milk was initially 5.59 and reduced
to 4.60 during storage. In addition, L. casei was capable in producing acid even at refrigerated
temperatures which in line with that observed in this study. However, no significant changes in
the TPC, TFC value and AO capacity were observed during storage.
4 Conclusion
WCJ was used as a sole source of nutrition for probiotic fermentation and was found to support
prolific growth of L. brevis, L. plantarum and L. rhamnosus. The model equations used herein
allowed accurate description of the microbial kinetics and characterization of the main products.
Furthermore, the change in the response of a variable with respect to time was described. The
parameters thus obtained were very useful for understanding the culture dynamics such as the
rate by which a particular variable was increased/reduced or produced. All of the LAB cultures
survived throughout the 30 days of refrigerated storage without substantial viability losses,
phytochemical content or AO capacity loss. From the results of this study, it is concluded that
probiotic WCJ could be served as a good healthy substitute of functional foods containing
probiotics for vegetarians and consumers who have allergies to dairy products. Furthermore,
vegetables based probiotic products would offer bioactive characteristics which are lacking in
typical dairy based probiotic products. Complementary studies on the impact of the fermentation
process on sensory acceptance, aroma and on the nutritional value such as vitamins and other
functional properties are considered as a relevant avenue for further studies.
21
Acknowledgment
The authors would like to gratefully acknowledge Dr. Shilpi Gupta for technical assistance and
funding from the Irish Government under the Technological Sector Research Scheme (Strand III)
of the National Development Plan.
References
Agerholm-Larsen, L., Raben, A., Haulrik, N., Hansen, A., Manders, M., Astrup, A., 2000. Effect
of 8 week intake of probiotic milk products on risk factors for cardiovascular diseases. Eur. J.
Clin. Nutr. 54, 288.
Batista, C., Barros, L., Carvalho, A.M., Ferreira, I.C.F.R., 2011. Nutritional and nutraceutical
potential of rape (Brassica napus var napus) and" tronchuda" cabbage (Brassica oleraceae
var costata) inflorescences. Food Chem. Toxicol. 49, 1208–1214
Beganović, J., Pavunc, A.L., Gjuračić, K., Špoljarec, M., Šušković, J., Kos, B., 2011. Improved
sauerkraut production with probiotic strain Lactobacillus plantarum L4 and Leuconostoc
mesenteroides LMG 7954. J. Food Sci. 76, M124–M129.
Bradford, M.M., 1976. A rapid and sensitive method for the quantitation of microgram quantities
of protein utilizing the principle of protein-dye binding. Anal. Biochem. 72, 248-254.
Biazar, J., Tango, M., Babolian, E., Islam, R., 2003. Solution of the kinetic modeling of lactic
acid fermentation using Adomian decomposition method. Appl. Math. Comput. 144, 433–
439.
Cerning, J., Renard, C., Thibault, J., Bouillanne, C., Landon, M., Desmazeaud, M., Topisirovic,
L., 1994. Carbon source requirements for exopolysaccharide production by Lactobacillus
casei CG11 and partial structure analysis of the polymer. Appl. Environ. Microbiol. 60, 3914–
3919.
22
Champagne, C.P., Savard, T., Barrette, J., 2009. Production of lactic acid bacteria on spent
cabbage juice. Int. J. Food Agric. Environ. 7, 82–87.
de Vrese, M., Stegelmann, A., Richter, B., Fenselau, S., Laue, C., Schrezenmeir, J., 2001.
Probiotics-compensation for lactase insufficiency. Am. J. Clin. Nutr. 73, 421S–429S.
Gardner, N.J., Savard, T., Obermeier, P., Caldwell, G., Champagne, C.P., 2001. Selection and
characterization of mixed starter cultures for lactic acid fermentation of carrot, cabbage, beet
and onion vegetable mixtures. Int. J. Food Microbiol. 64, 261–275.
Gotcheva, V., Hristozova, E., Hristozova, T., Guo, M., Roshkova, Z., Angelov, A., 2002.
Assessment of potential probiotic properties of lactic acid bacteria and yeast strains. Food
Biotechnol. 16, 211–225.
Guo, Z., Wang, J., Yan, L., Chen, W., Liu, X., Zhang, H., 2009. In vitro comparison of probiotic
properties of Lactobacillus casei Zhang, a potential new probiotic, with selected probiotic
strains. LWT-Food Sci. Technol. 42, 1640–1646.
Jaiswal, A.K., Gupta, S., Abu-Ghannam, N., 2012a. Optimisation of lactic acid fermentation of
York cabbage for the development of potential probiotic products. Int. J. Food Sci. Technol.
47, 1605–1612.
Jaiswal, A.K., Rajauria, G., Abu-Ghannam, N., Gupta, S., 2012b. Effect of different solvents on
polyphenolic content, antioxidant capacity and antibacterial activity of Irish York cabbage. J.
Food Biochem. 36, 344–358.
Khan, R.S., Grigor, J., Winger, R., Win, A., 2013. Functional food product development –
Opportunities and challenges for food manufacturers. Trends Food Sci. Technol. 30, 27–37.
Kusznierewicz, B., Smiechowska, A., Bartoszek, A., Namiesnik, J., 2008. The effect of heating
and fermenting on antioxidant properties of white cabbage. Food Chem. 108, 853-861.
23
Lee, Y.K., Salminen, S., 1995. The coming of age of probiotics. Trends Food Sci. Technol. 6,
241–245.
Mercier, P., Yerushalmi, L., Rouleau, D., Dochain, D., 1992. Kinetics of lactic acid fermentation
on glucose and corn by Lactobacillus amylophilus. J. Chem. Technol. Biot. 55, 111–121.
Nazzaro, F., Fratianni, F., Sada, A., Orlando, P., 2008. Synbiotic potential of carrot juice
supplemented with Lactobacillus spp. and inulin or fructooligosaccharides. J. Sci. Food Agr.
88, 2271–2276.
Nomoto, K., 2005. Prevention of infections by probiotics. J. Biosci. Bioeng. 100, 583–592.
Oseni, O., Akindahunsi, A., 2011. Some phytochemical properties and effect of fermentation on
the seed of Jatropha curcas L. Am. J. Food Technol. 6, 158–165.
Othman, N.B., Roblain, D., Chammen, N., Thonart, P., Hamdi, M., 2009. Antioxidant phenolic
compounds loss during the fermentation of Chétoui olives. Food Chem. 116, 662–669.
Pereira, A.L.F., Maciel, T.C., Rodrigues, S., 2011. Probiotic beverage from cashew apple juice
fermented with Lactobacillus casei. Food Res. Int. 44, 1276–1283.
Rajauria, G., Jaiswal, A.K., Abu-Gannam, N., Gupta, S., 2012. Antimicrobial, antioxidant and
free radical-scavenging capacity of brown seaweed Himanthalia elongata from western coast
of Ireland. J. Food Biochem. 37, 322–335.
Rosa, E., David, M., Gomes, M.H., 2001. Glucose, fructose and sucrose content in broccoli,
white cabbage and Portuguese cabbage grown in early and late seasons. J. Sci. Food Agric.
81, 1145–1149.
Savard, T., Gardner, N., Champagne, C., 2003. Growth of Lactobacillus and Bifidobacterium
cultures in a vegetable juice medium, and their stability during storage in a fermented
vegetable juice. Sci. Des. Alim. 23, 273–283.
24
Sindhu, S.C., Khetarpaul, N., 2003. Effect of feeding probiotic fermented indigenous food
mixture on serum cholesterol levels in mice. Nutr. Res. 23, 1071–1080.
Tolonen, M., Rajaniemi, S., Pihlava, J.M., Johansson, T., Saris, P., Ryhänen, E.L., 2004.
Formation of nisin, plant-derived biomolecules and antimicrobial activity in starter culture
fermentations of sauerkraut. Food Microbiol. 21, 167–179.
Towo, E., Matuschek, E., Svanberg, U., 2006. Fermentation and enzyme treatment of tannin
sorghum gruels: effects on phenolic compounds, phytate and in vitro accessible iron. Food
Chem. 94, 369–376.
Yoon, K.Y., Woodams, E.E., Hang, Y.D., 2006. Production of probiotic cabbage juice by lactic
acid bacteria. Bioresource Technol. 97, 1427–1430.
Zwietering, M., Jongenburger, I., Rombouts, F., Van't Riet, K., 1990. Modeling of the bacterial
growth curve. Appl. Environ. Microbiol. 56, 1875–1881.
25
Figure Captions
Fig. 1. Time course for the growth of L. plantarum, L. rhamnosus and L. brevis in WCJ
Fig. 2. Time course for the production of lactic acid by L. plantarum, L. rhamnosus and L. brevis
in WCJ
26
Table 1. Value of parameters obtained by non-linear regression of Gompertz equation for
the growth of probiotic cultures under study
CFU/ml
A µmax (h-1
) λ (h) R2
L. plantarum 4.72
(4.13-5.32)
0.24
(0.15-0.32)
1.27
(-2.39-4.93)
0.9633
L. rhamnosus 5.88
(3.84-7.91)
0.36
(0.15-0.58)
2.81
(-1.47-7.08)
0.9730
L. brevis 4.31
(3.62-5.00)
0.33
(0.14-0.51)
1.99
(-1.75-5.74)
0.9669
Values in brackets are the confidence intervals
A: log increase in population; µmax: maximum specific growth rate of cells; λ: lag phase
27
Table 2. Value of parameters obtained by non-linear regression of Mercier equation for
lactic acid production by the probiotic cultures under study
P0 (g/l) Pm (g/l) Pr (h-1
) R2
L. plantarum 0.08
(0.04-0.12)
8.90
(8.51-9.29)
0.25
(0.22-0.28)
0.998
L. rhamnosus 0.01
(0.01-0.03)
12.57
(11.95-13.18)
0.43
(0.35-0.51)
0.998
L. brevis 0.00
(0.00-0.04)
9.81
(7.67-12.0)
0.20
(0.40-0.10)
0.914
Values in brackets are the confidence intervals
Po: initial lactic acid concentration; Pm: maximum concentration of lactic acid;
Pr: ratio between the initial volumetric rate of product formation (rp) and the
initial product concentration (Po)
28
Table 3. Kinetics parameters for phytochemical content of WCJ during fermentation
Zero-order kinetic First-order kinetic Second-order kinetic
C0 k (h–1
) R2 C0 k (h
–1) R
2 C0 k (h
–1) R
2
L. plantarum
TPC 170.7 0.910 0.92 171.6 0.006 0.93 172.5 0.0001 0.91
TFC 42.6 0.352 0.97 42.9 0.001 0.98 42.7 0.0003 0.97
L. rhamnosus
TPC 188.5 1.744 0.92 190.9 0.011 0.94 190.2 0.0001 0.94
TFC 40.7 0.336 0.95 41.1 0.010 0.97 41.0 0.0003 0.96
L. brevis
TPC 236.8 1.429 0.96 238.2 0.007 0.97 238.8 0.0001 0.94
TFC 56.1 0.400 0.96 56.2 0.005 0.97 56.8 0.0002 0.94
C0 Model estimated value, k reaction rate constant
29
Table 4. Kinetics parameters for antioxidant capacity of WCJ during fermentation
Zero-order kinetic First-order kinetic Second-order kinetic
C0 k (h–1
) R2 C0 k (h
–1) R
2 C0 k (h
–1) R
2
L. plantarum
DPPH 57.7 0.288 97.5 57.9 0.005 97.6 58.1 0.0001 97.2
FRAP 15.7 0.069 96.6 15.7 0.005 96.9 15.8 0.003 95.3
L. rhamnosus
DPPH 59.2 0.110 84.4 59.1 0.002 87.4 59.3 0.00003 84.1
FRAP 15.0 0.041 97.6 15.0 0.003 97.6 15.0 0.0002 95.5
L. brevis
DPPH 57.6 0.251 86.3 57.7 0.005 87.1 56.8 0.0001 82.2
FRAP 21.0 0.166 95.1 21.2 0.009 96.2 21.2 0.0005 96.4
C0 Model estimated value, k reaction rate constant
30
Table 5. Nutritional composition of probiotic cabbage juice
LAB strain used for juice preparation
L. brevis L. plantarum L. rhamnosus
Probiotic count (log CFU/ml) 9.19 ± 0.24 9.47 ± 0.15 10.6 ± 0.23
Protein content (mg BSAE/l) 16.4 ± 0.73 15.8 ± 1.46 17.4 ± 0.30
Carbohydrate content
Glucose (mg/l) 3.33 ± 0.29 2.31 ± 0.17 2.16 ± 0.22
Fructose (mg/l) 3.87 ± 0.26 4.41 ± 0.15 4.43 ± 0.13
Organic acid content
Lactic acid (g/l) 12.2 ± 0.18 6.97 ± 0.29 9.69 ± 0.01
Acetic acid (g/l) 1.15 ± 0.11 0.45 ± 0.07 0.59 ± 0.12
Citric acid (g/l) 0.16 ± 0.01 0.30 ± 0.05 0.45 ± 0.09
Polyphenolic content
TPC (mg GAE/l) 198.7 ± 2.89 148.6 ± 1.32 143.6 ± 1.75
TFC (mg QE/l) 46.9 ± 1.24 35.3 ± 1.54 31.9 ± 1.02
Antioxidant capacity
FRAP value (mg TE/l) 13.9 ± 0.02 17.0 ± 0.12 13.7 ± 0.17
DPPH RSA (mg AAE/l) 51.9 ± 0.45 51.1 ± 0.79 56.1 ± 0.32
LAB, Lactic acid bacteria; BSA, Bovine serum albumin; TPC, Total phenolic content; GAE, Gallic acid
equivalent; TFC, Total flavonoid content; QE, Quercetin equivalent; TE, Trolox equivalent; AAE, Ascorbic
acid equivalent; FRAP, Ferric reducing antioxidant potential; RSA, Radical scavenging capacity
31
Fig. 1. Time course for the growth of L. plantarum, L. rhamnosus and L. brevis in WCJ
5.0
6.0
7.0
8.0
9.0
10.0
11.0
12.0
0 4 8 12 16 20 24 28 32 36
log C
FU
/ml
Time (h)
L. Plantarum (Exp)
L. Plantarum (Pred.)L. rhamnosus (Exp)
L. rhamnosus (Pred.)
L. brevis (Exp)L. brevis (Pred.)
32
Fig. 2. Time course for the production of lactic acid by L. plantarum, L. rhamnosus and
L. brevis in WCJ
0.0
2.0
4.0
6.0
8.0
10.0
12.0
14.0
0 4 8 12 16 20 24 28 32
Lacti
c a
cid
(m
g/m
l)
Time (h)
L. Plantarum (Exp)L. Plantarum (Pred.)L. rhamnosus (Exp)L. rhamnosus (Pred.)
L. brevis (Exp)L. brevis (Pred.)