Embed Size (px)
Citation preview
Durham E-Theses
Kinetic studies on the reaction of formaldehyde with
amines in the presence of sul�te
Brown, Kathryn Helen
How to cite:
Brown, Kathryn Helen (1999) Kinetic studies on the reaction of formaldehyde with amines in the presence
of sul�te, Durham theses, Durham University. Available at Durham E-Theses Online:http://etheses.dur.ac.uk/4972/
Use policy
The full-text may be used and/or reproduced, and given to third parties in any format or medium, without prior permission orcharge, for personal research or study, educational, or not-for-pro�t purposes provided that:
• a full bibliographic reference is made to the original source
• a link is made to the metadata record in Durham E-Theses
• the full-text is not changed in any way
The full-text must not be sold in any format or medium without the formal permission of the copyright holders.
Please consult the full Durham E-Theses policy for further details.

Academic Support O�ce, Durham University, University O�ce, Old Elvet, Durham DH1 3HPe-mail: [email protected] Tel: +44 0191 334 6107
http://etheses.dur.ac.uk
2
Kinetic Studies on the Reaction of
Formaldehyde with Amines in
the Presence of Sulfite
Kathryn Helen Brown Tlie copyright of tliis thesis rests with tlie author. No quotation from it should be published without the written consent of the author and information derived from it should be acknowledged.
Thesis submitted for the quaUfication Doctor of Philosophy
University of Durham, Chemistry Department
October 1999
' 1^ ^ /^l -
A B S T R A C T
The reaction of formaldehyde with amines with and without sulfite has been studied
using anilines (RC6H4NH2) and benzylamines (RC6H4CH2NH2). Reaction with anilines
is known to produce aminomethanesulfonates, RC6H4NHCH2SO3', which are
industrially important in the azo dye industry. The kinetics and mechanism of formation
of RC6H4NHCH2SO3" and RC6H4CH2NHCH2SO3' have been studied: rate constants are
quoted for the individual reaction steps in addition to the overall reaction.
The reaction of formaldehyde, HCHO, with the amine, RNH2, gives an
7V-(hydroxymethyl)amine, RNHCH2OH, via a zwitterionic intermediate. Rate constants
of 8.0 X 10 to 4.3 X 10 dm^ mol"^ s' have been obtained. RNHCH2OH then dehydrates
in acidic conditions or loses hydroxyl ion to form an iminium ion, [RNH=CH2]^. This
then reacts rapidly with sulfite ions to yield the product. The rate determining step was
found to depend on the pH of the reaction. At low and neutral pH the reaction of HCHO
with RNH2 is the rate determining step. At high pH the rate determining step becomes
dehydration of RNHCH2OH to give [R]SIH=CH2]^
Hydroxymethanesulfonate, CH2(OH)(S03Na), was used to introduce HCHO and sulfite,
S03 ', into the system. This must undergo decomposition initially to yield reactive free
HCHO. Above pH 3 decomposition occurs mainly through the dianion, CH2(0')(S03').
Below pH 3, decomposition through the monoanion, CH2(OH)(S03') forms the major
pathway: this may become the rate determining step in the overall reaction at low pH.
Rate constants for decomposition equal to 24 ± 5 s" and 2.3 x 10" s' have been
obtained for the dianion and monoanion respectively.
pKa values in the range 4.9 to 5.6 have been measured for protonated adducts,
RISrH2CH2S03', formed from benzylamines. With benzylamines, reaction with another
molecule of CH2(0H)(S03Na) can occur to produce RN(CH2S03")2 in addition to
RNHCH2SO3".
Polymerisation of imines has also been studied: cyclic trimers and 1 : 2 HCHO : RNH2
adducts have been synthesised.
C O N T E N T S
page
T I T L E i
A B S T R A C T ii
C O N T E N T S iii
A C K N O W L E D G E M E N T S , D E C L A R A T I O N AND C O P Y R I G H T xii
D E F I N I T I O N S xiii
C H A P T E R 1: Introduction 1
1.1 BACKGROUND 2
1.2 REACTIONS OF CARBONYL COMPOUNDS WITH AMINES 2
1.2.1 Primary amines 3
1.2.2 Secondary amines 4
1.2.3 Tertiary amines 4
1.3 IMEVES 4
1.3.1 Nomenclature 4
1.3.2 Formation of imines 5
1.3.2.1 pH dependence 6
1.3.2.2 General acid and base catalysis 9
1.3.3 Stability 10
1.3.4 Reactions of imines 11
1.3.4.1 Hydrolysis 11
1.3.4.2 Mannich Reaction 13
1.3.4.3 Strecker Synthesis 14
1.3.4.4 Reaction with amines 16
1.4 1,3,5-HEXAHYDROTRIAZINES 17
1.5 INTRODUCTION TO FORMALDEHYDE AND S U L F I T E 18 C H E M I S T R Y
1.6 F O R M A L D E H Y D E 18
111
1.6.1 Formaldehyde solution composition 18
1.6.1.1 Linear polymers, or polyoxymethylene glycols, H0(CH20)nH 19
1.6.1.2 Cyclic polymers 21
1.6.1.3 Other reactions that can occur in formaldehyde solution 22
1.6.2 Equilibrium between methylene glycol and formaldehyde 23
1.6.3 Detection of formaldehyde 24
1.7 HYDROXYMETHANESULFONATE, CH2(OH)(S03H) 25
1.7.1 Introduction 25
1.7.2 Reaction with ammonia 25
1.7.3 Occurrence 26
1.7.4 Formaldehyde clock reaction 27
1.8 AIMS 29
1.9 R E F E R E N C E S 30
C H A P T E R 2: Reaction of formaldehyde with aniline and aniline 39
derivatives
2.1 INTRODUCTION 40
2.2 R E S U L T S AND DISCUSSION 48
2.2.1 Reaction of aqueous formaldehyde with aniline, C6H5NH2 48
2.2.1.1 Absorbance against wavelength spectra and absorbance 48 against time plots
2.2.1.2 General acid and base catalysis 51
2.2.2 Reaction of aqueous formaldehyde with 4-methylaniline 56
2.2.2.1 Absorbance against wavelength spectra and absorbance 56 against time plots
2.2.2.2 General acid and base catalysis 58
2.2.3 Reaction of aqueous formaldehyde with 4-dimethylaminoaniline 60
2.2.4 Reaction of aqueous formaldehyde with 4-chloroaniline 62
2.2.5 Reaction of aqueous formaldehyde with 3-chloroaniline 64
2.2.6 Reaction of aqueous formaldehyde with 3-cyanoaniline 66
2.2.7 Reaction of aqueous formaldehyde with 3-nitroaniline 68
2.2.8 Reaction of aqueous formaldehyde with A^-methylaniline 70
IV
2.2.9 Comparison of resuhs: Hammett plot 72
2.3 CONCLUSION 78
2.4 E X P E R I M E N T A L 81
2.4.1 Absorbance against wavelength spectra of formaldehyde with aniline 81 and aniline derivatives
2.4.2 Absorbance against time plots 81
2.4.3 Aqueous formaldehyde solution 86
2.5 R E F E R E N C E S 88
C H A P T E R 3: Polymerisation of RC6H4N=CH2 imines 90
3.1 INTRODUCTION 91
3.2 R E S U L T S AND DISCUSSION 93
3.2.1 Preparation of 4-RC6H4N=CH2 imine polymers 93
3.2.1.1 Preparation of l,3,5-triphenyl-l,3,5-hexahydrotriazine 93
3.2.1.2 Synthesis using 4-dimethylaminoaniline 95
3.2.1.3 Synthesis using 4-aminobenzoic 99
3.2.1.4 Synthesis using 4-nitroaniline 101
3.2.1.5 Synthesis using sulfanilic acid 104
3.2.1.6 Summary 107
3.2.1.7 Mechanisms 107
3.2.2 l,3,5-Triphenyl-l,3,5-hexahydrotriazine, the C6H5N=CH2 trimer 109
3.2.2.1 Stability of the trimer 109
3.2.2.1.1 Effect of solvent composition 109
3.2.2.1.2 pHeffects 112
3.2.2.2 Formation of the trimer 115
3.2.2.2.1 ^HNMR studies 115
3.2.2.2.2 Uv / vis spectroscopy studies 121
3.3 CONCLUSION 122
3.4 E X P E R I M E N T A L 124
3.4.1 Preparation of 4-RC6H4N=CH2 imine polymers 124
3.4.2 Stability of 1,3,5-triphenyl-l,3,5-hexahydrotriazine 125
3.4.2.1 Conventional uv / vis spectroscopy studies 125
3.4.2.2 Stopped flow spectrophotometry studies 127
3.4.2.3 ^HNMR studies 128
3.5 R E F E R E N C E S 130
C H A P T E R 4: Decomposition of hydroxymethanesulfonate, 131
CH2(OH)(S03Na)
4.1 INTRODUCTION 132
4.2 R E S U L T S AND DISCUSSION 137
4.2.1 Reaction of aqueous sulfite solution with aqueous iodine solution 137
4.2.2 Decomposition of hydroxymethanesulfonate, CH2(OH)(S03Na) 138
4.3 CONCLUSION 151
4.4 E X P E R I M E N T A L 153
4.4.1 Reaction of aqueous sulfite solution with aqueous iodine solution 153
4.4.2 Decomposition of hydroxymethanesulfonate, CH2(OH)(S03Na) 153
4.5 R E F E R E N C E S 156
C H A P T E R 5: Reaction of hydroxymethanesulfonate, 157
CH2(OH)(S03Na), with aniline and aniline derivatives
5.1 INTRODUCTION 158
5.2 R E S U L T S AND DISCUSSION 160
5.2.1 Reaction of CH2(OH)(S03Na) with aniline 160
5.2.1.1 ^HNMR studies 160
5.2.1.1.1 Equimolar aniline and CH2(OH)(S03Na) 162
5.2.1.1.2 CH2(OH)(S03Na) in excess 165
5.2.1.1.3 Aniline in excess 166
5.2.1.2 Uv / visible kinetic studies 167
5.2.1.2.1 Absorbance against wavelength spectra and 167 absorbance against time plots
VI
5.2.1.2.2 Reaction in the presence of added sulfite ions 171
5.2.2 Reaction of CH2(OH)(S03Na) with 4-methylaniline 173
5.2.2.1 ^HNMR studies 173
5.2.2.1.1 Equimolar 4-methylaniline and CH2(OH)(S03Na) 175
5.2.2.1.2 CH2(OH)(S03Na) in excess 177
5.2.2.1.3 4-Methylaniline in excess 178
5.2.2.2 Uv / visible kinetic studies 179
5.2.2.2.1 Absorbance against wavelength spectra and 179 absorbance against time plots
5.2.2.2.2 Reaction in the presence of added sulfite ions 181
5.2.3 Reaction of CH2(OH)(S03Na) with 4-dimethylaminoaniline 185
5.2.3.1 Uv / visible kinetic studies 185
5.2.3.1.1 Absorbance against wavelength spectra and 185 absorbance against time plots
5.2.3.1.2 Reaction in the presence of added sulfite ions 187
5.2.4 Decomposition on C6H5NHCH2SO3" 189
5.2.4.1 Reaction of aniline with aqueous iodine solution 189
5.2.4.2 Reaction of C6H5NHCH2SO3" with aqueous iodine solution 192
5.3 CONCLUSION 197
5.3.1 Summary 197
5.3.2 Mechanism 200
5.4 E X P E R I M E N T A L 206
5.4.1 ^H NMR experiments 206
5.4.2 Uv/v i s experiments 207
5.4.3 Decomposition of C6H5NHCH2SO3" 210
5.5 R E F E R E N C E S 212
C H A P T E R 6: Reaction of hydroxymethanesulfonate, 213
CH2(OH)(S03Na), with benzylamine and benzylamine
derivatives
6.1 INTRODUCTION 214
6.2 R E S U L T S AND DISCUSSION 217
vu
6.2.1 Reaction of CH2(OH)(S03Na) with benzylamine 217
6.2.1.1 ^HNMR studies 217
6.2.1.1.1 Equimolar benzylamine and CH2(OH)(S03Na) 218
6.2.1.1.2 CH2(OH)(S03Na) in excess 220
6.2.1.1.3 Benzylamine in excess 221
6.2.1.2 Uv / visible kinetic studies 222
6.2.1.2.1 Absorbance against wavelength spectra and 222 absorbance against time plots
6.2.1.2.2 Absorbance against time plots: initial fast reaction 226
6.2.2 Reaction of CH2(OH)(S03Na) with 4-methoxybenzylamine 228
6.2.2.1 ^HNMR studies 228
6.2.2.1.1 Equimolar 4-methoxybenzylamine and 229 CH2(OH)(S03Na)
6.2.2.1.2 CH2(OH)(S03Na) in excess 232
6.2.2.1.3 4-Methoxybenzylamine in excess 233
6.2.2.2 Uv / visible kinetic studies 234
6.2.2.2.1 Absorbance against wavelength spectra and 234 absorbance against time plots
6.2.2.2.2 Ionic strength 239
6.2.2.2.3 Reaction in the presence of added sulfite ions 239
6.2.3 Reaction of CH2(OH)(S03Na) with 4-methylbenzylamine 241
6.2.3.1 ^HNMR studies 241
6.2.3.1.1 Equimolar 4-methylbenzylamine and 243 CH2(OH)(S03Na)
6.2.3.1.2 CH2(OH)(S03Na) in excess 245
6.2.3.1.3 4-Methylbenzylamine in excess 247
6.2.3.2 Uv / visible kinetic studies 248
6.2.4 Reaction of CH2(OH)(S03Na) with 4-nitrobenzylamine 250
6.2.4.1 ^HNMR studies 250
6.2.4.1.1 Equimolar 4-nitrobenzylamine and 253 CH2(OH)(S03Na)
6.2.4.1.2 CH2(OH)(S03Na) in excess 256
6.2.4.1.3 4-Nitrobenzylamine in excess 258
6.2.4.2 Uv / visible kinetic studies 259
6.2.5 Reaction of CH2(OH)(S03Na) with A/ methylbenzylamine 262
Vll l
6.2.5.1 ^HNMR studies 262
6.2.5.1.1 Equimolar iV-methylbenzylamine and 263 CH2(OH)(S03Na)
6.2.5.1.2 CH2(OH)(S03Na) in excess 265
6.2.5.1.3 7V-Methylbenzylamine in excess 265
6.2.5.2 Uv / visible kinetic studies 266
6.2.5.2.1 Absorbance against wavelength spectra and 266 absorbance against time plots
6.2.5.2.2 Reaction in the presence of added sulfite ions 269
6.3 CONCLUSION 271
6.3.1 Summary 271
6.3.2 Mechanism 274
6.4 E X P E R I M E N T A L 278
6.4.1 ^HNMR experiments 278 6.4.2 Uv / vis experiments 279
6.5 R E F E R E N C E S 282
C H A P T E R 7: Decomposition of RCHzNR'CHiSOj adducts 283
7.1 INTRODUCTION 284
7.2 R E S U L T S AND DISCUSSION 285
7.2.1 Decomposition of RCH2NR'CH2S03" to the starting materials 285
7.2.1.1 Benzylamine adduct: C6H5CH2NHCH2SO3" 285
7.2.1.1.1 Absorbance against wavelength spectra and 285 absorbance against time plots
7.2.1.1.2 Decomposition in the presence of added sulfite ions 287
7.2.1.2 7V-methylbenzylamine adduct: C6H5CH2N(CH3)(CH2S03') 289
7.2.1.2.1 Absorbance against wavelength spectra and 289 absorbance against time plots
7.2.1.2.2 Decomposition in the presence of added aqueous 292 formaldehyde solution
7.2.1.2.3 Decomposition in the presence of added sulfite ions 294
7.2.2 Decomposition of RCH2NR'CH2S03" to the iminium ion 295
IX
7.2.2.1 Benzylamine adduct: C6H5CH2NHCH2S03" 298
7.2.2.1.1 Rate constant for decomposition to the iminium ion 298
7.2.2.1.2 Effect of varying the C6H5CH2NHCH2S03" stock 300 solution composition
7.2.2.1.3 pH study 301
7.2.2.2 4-Methoxybenzylamine adduct: 4-CH3OC6H4CH2NHCH2SO3' 303
7.2.2.2.1 Rate constant for decomposition to the iminium ion 303
7.2.2.2.2 pH study 304
7.2.2.3 4-Methylbenzylamine adduct: 4-CH3C6H4CH2NHCH2SO3' 306
7.2.2.3.1 Rate constant for decomposition to the iminium ion 306
7.2.2.3.2 pH study 307
7.2.2.4 iV-Methylbenzylamine adduct: C6H5CH2N(CH3)(CH2S03") 309
7.2.2.4.1 Rate constant for decomposition to the iminium ion 309
7.2.2.4.2 pH study 310
7.2.2.5 Summary 312
7.3 CONCLUSION 314
7.4 E X P E R I M E N T A L 315
7.4.1 Decomposition of RCH2NR'CH2S03' to the starting materials 315
7.4.2 Decomposition of RCH2NR'CH2S03' to the iminium ion 317
7.5 R E F E R E N C E S 321
C H A P T E R 8: Conclusion 322
8.1 SUMMARY OF RESULTS 323
8.2 R E F E R E N C E S 327
C H A P T E R 9: Experimental 328
9.1 M A T E R I A L S 329
9.2 E X P E R I M E N T A L MEASUREMENTS 329
9.3 CONVENTIONAL UV / VIS SPECTROMETRY 329
9.4 STOPPED F L O W SPECTROPHOTOMETRY 330
9.5 DATA F I T T I N G AND ERRORS IN MEASUREMENT 331
9.6 *H NMR SPECTROSCOPY 333
9.7 pH MEASUREMENTS 335
A P P E N D I C E S 336
A l : Derivation of standard rate equations 337
A l . l R A T E EQUATION USED TO OBTAIN ^ A N D h 337
A2: Standardisation of the aqueous iodine solution and 339
determination of the extinction coefficients
A2.1 STANDARDISATION OF T H E AQUEOUS IODINE SOLUTION 339
A2.2 EXTINCTION C O E F F I C I E N T S OF THE AQUEOUS IODINE 340 SOLUTION
A2.3 R E F E R E N C E S 342
A3: Seminars and conferences attended 343
A3.1 SEMINARS ATTENDED 343
A3.2 C O N F E R E N C E S ATTENDED 345
XI
A C K N O W L E D G E M E N T S
I would like to thank my supervisor, Dr. Mike Crampton, for always being so interested
and willing to help. I would also like to mention my industrial supervisor, Dr. John
Atherton, fi"om Avecia, formerly Zeneca Specialities, who has made my work seem
important, i f only to me.
I am going to miss the rest of the lab; Linda 'Gibbo' Gibbons, Darren 'Sticky Baan'
Noble, Lynsey 'Brown Owl' Rabbitt, Colin 'CG' Greenhalgh, Paul Coupe, Andy
'Taffy' Munro and also Ian 'Are You Winnin' Robotham. All I can say is it is a straight
line and I didn't break it.
Finally I would especially like to thank the people without whom none of this would be
worthwhile: my Mum and Dad, Tony, and my sisters Susan and Gillian.
D E C L A R A T I O N
The work in this thesis was carried out in the Chemistry Department at the University of
Durham between 1st October 1996 and 30th September 1999. It has not been submitted
for any other degree and is the author's own work, except where acknowledged by
reference.
C O P Y R I G H T
The copyright of this thesis rests with the author. No quotation from it should be
published without prior written consent and information derived from it should be
acknowledged.
Xll
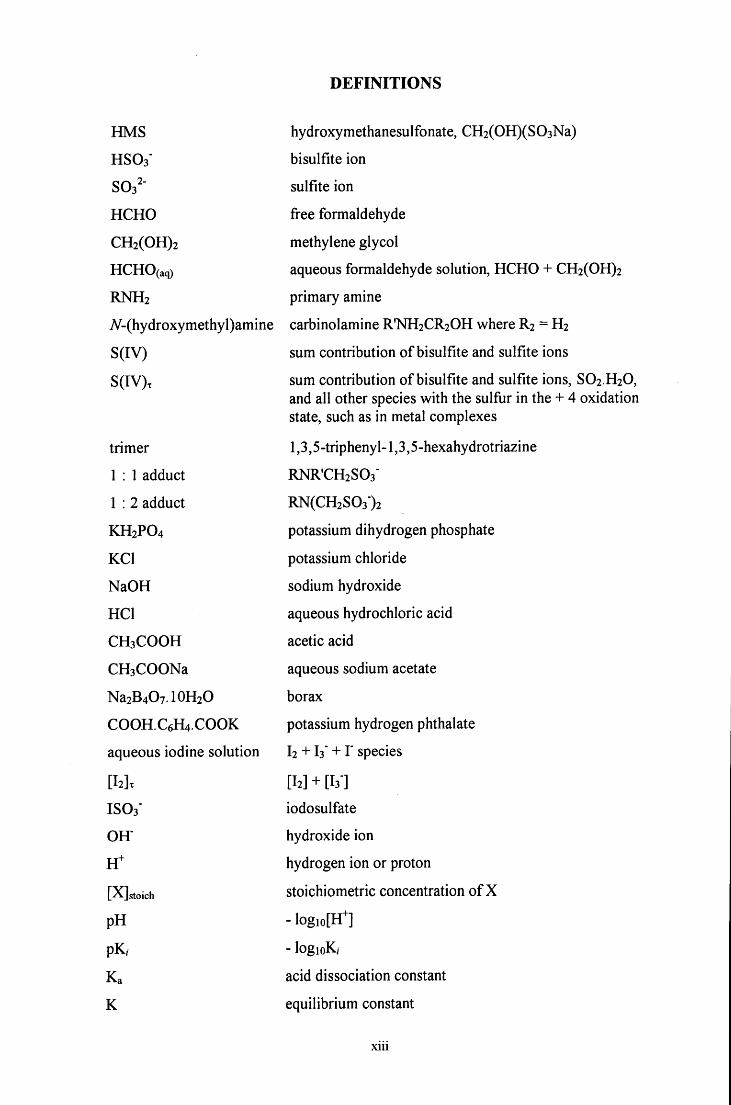
HMS
HSO3"
S03'-
HCHO
CH2(OH)2
HCHO(aq)
RNH2
#-(hydroxymethyl)amine
S(IV)
S(IV),
trimer
D E F I N I T I O N S
hydroxymethanesulfonate, CH2(OH)(S03Na)
bisulfite ion
sulfite ion
free formaldehyde
methylene glycol
aqueous formaldehyde solution, HCHO + CH2(OH)2
primary amine
carbinolamine R'NH2CR20H where R2 = H2
sum contribution of bisulfite and sulfite ions
sum contribution of bisulfite and sulfite ions, SO2 .H2O, and all other species with the sulfur in the + 4 oxidation state, such as in metal complexes
1,3,5-tripheny 1-1,3,5-hexahydrotriazine
1 : 1 adduct RNR'CH2S03"
1 : 2 adduct RN(CH2S03)2
KH2PO4 potassium dihydrogen phosphate
KCl potassium chloride
NaOH sodium hydroxide
HCl aqueous hydrochloric acid
CH3COOH acetic acid
CH3C00Na aqueous sodium acetate
Na2B4O7.10H2O borax
COOH.C6H4.COOK potassium hydrogen phthalate
aqueous iodine solution I2 +13" + r species
[l2]x [I2]+[I3]
IS03- iodosulfate
O H hydroxide ion
H " hydrogen ion or proton
[Xjstoich stoichiometric concentration of X
pH - logio[H^]
pK, - logioK,
K a acid dissociation constant
K equilibrium constant
Xll l
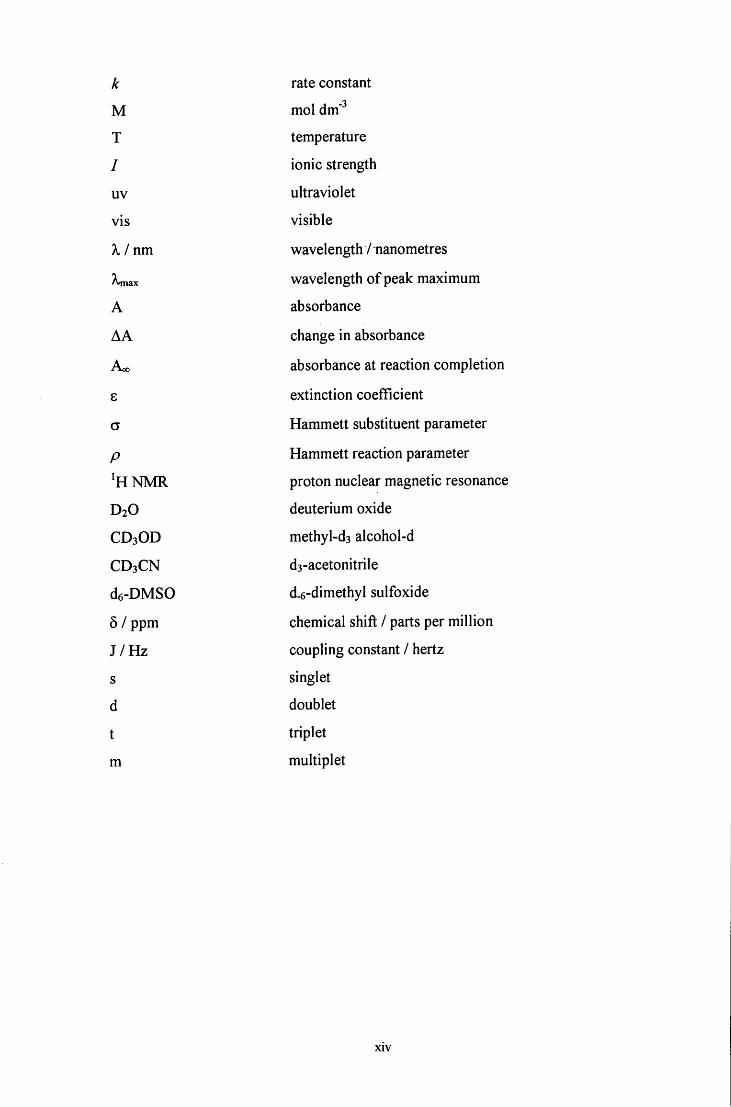
k rate constant
M mol dm"
T temperature
/ ionic strength
uv ultraviolet
vis visible
A, / nm wavelength / nanometres
wavelength of peak maximum
A absorbance
AA change in absorbance
Aoo absorbance at reaction completion
8 extinction coefficient
a Hammett substituent parameter
P Hammett reaction parameter
^HNMR proton nuclear magnetic resonance
D2O deuterium oxide
CD3OD methyl-ds alcohol-d
CD3CN ds-acetonitrile
d6-DMS0 d-6-dimethyl sulfoxide
5 / ppm chemical shift / parts per million
J /Hz coupling constant / hertz
s singlet
d doublet
t triplet
m multiplet
XIV

C H A P T E R 1
Introduction
C H A P T E R 1: Introduction
1.1 BACKGROUND
Condensation reactions involving formaldehyde, an amine and a nucleophile, HZ,
(Scheme 1.1) are potentially useflil in commercial synthetic processes.
Scheme 1.1: RNH2 + HCHO + HZ RNHCH2Z + H2O
Examples include the Mannich reaction, where HZ is a compound with an acidic
hydrogen, and the Strecker synthesis, where cyanide is the nucleophile.
There have been extensive studies on the reactions of amines with carbonyl compounds.
However there has been little study on the kinetics and mechanisms of reactions of the
type shown in Scheme 1.1, namely those involving formaldehyde, an amine and a
nucleophile. This is the focus of the work here.
1.2 REACTIONS O F CARBONYL COMPOUNDS WITH AMINES
Carbonyl addition reactions involve the attack of a lone pair of electrons of a
nucleophilic reagent on the carbon atom of a carbonyl group. The strong
electronegativity of the oxygen polarises the double bond and leaves a partial positive
charge on the carbon atom, facilitating nucleophilic attack. The attacking nucleophile
approaches the carbonyl carbon perpendicular to the plane of the carbonyl group. The
carbon atom of the planar carbonyl group has sp hybridisation with 120° bond angles.
As addition occurs, it undergoes a change in hybridisation to sp and becomes
tetrahedral. Steric, resonance, and inductive effects determine the rate of reaction and
equilibrium constant for addition of a nucleophile to a carbonyl group.
The reactions of ketones and aldehydes with amines have been reviewed by a number of
authors.^ The products of reaction depend on whether the amine is primary, RNH2,
secondary, RRTSfH, or tertiary, RR'R'TSf.
1.2.1 Primary amines
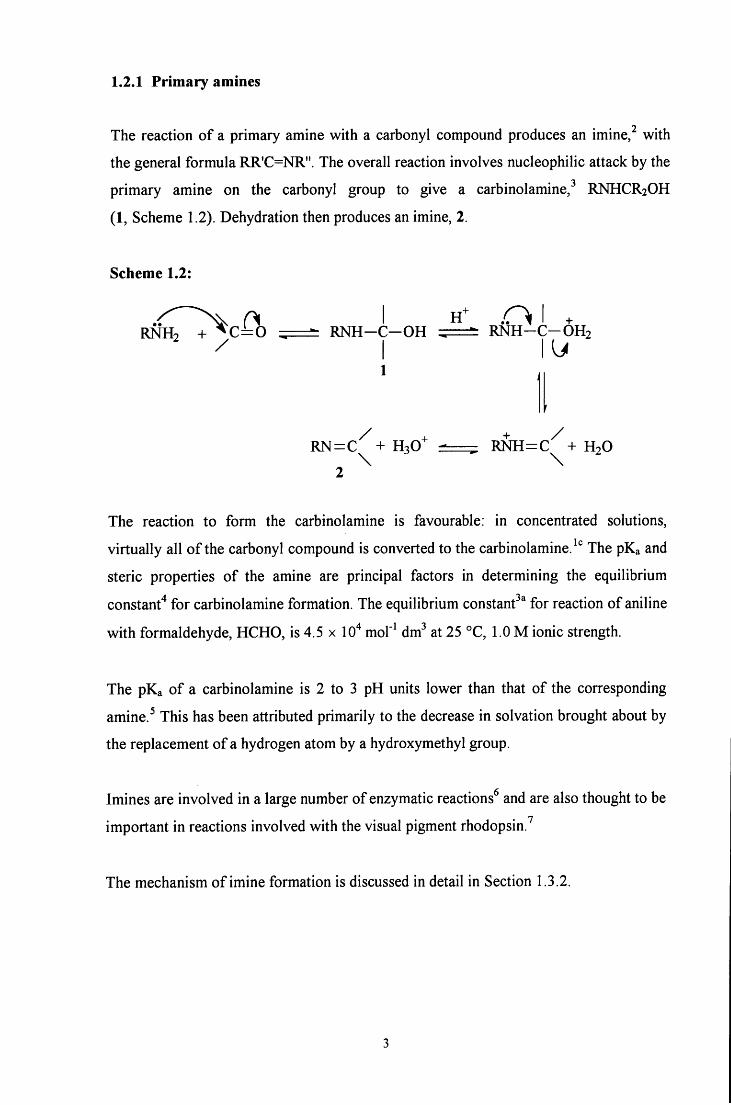
The reaction o f a primary amine with a carbonyl compound produces an imine, with
the general formula RR'C=NR". The overall reaction involves nucleophilic attack by the
primary amine on the carbonyl group to give a carbinolamine,^ R N H C R 2 O H
(1, Scheme 1.2). Dehydration then produces an imine, 2.
Scheme 1.2:
R N H 2 + ^ C = 0 R N H - C - O H R N H - C - O H 2
^ I 1
R N = C ^ + HgO^ R N H = C ^ + H 2 O \ \
2
The reaction to form the carbinolamine is favourable: in concentrated solutions,
virtually all o f the carbonyl compound is converted to the carbinolamine. The pKa and
steric properties o f the amine are principal factors in determining the equilibrium
constant'* for carbinolamine formation. The equilibrium constant^^ for reaction o f aniline
wi th formaldehyde, HCHO, is 4.5 x 10"* mol'^ dm^ at 25 °C, 1.0 M ionic strength.
The pKa o f a carbinolamine is 2 to 3 pH units lower than that o f the corresponding
amine.^ This has been attributed primarily to the decrease in solvation brought about by
the replacement o f a hydrogen atom by a hydroxymethyl group.
Imines are involved in a large number o f enzymatic reactions^ and are also thought to be
important in reactions involved with the visual pigment rhodopsin.^
The mechanism o f imine formation is discussed in detail in Section 1.3.2.
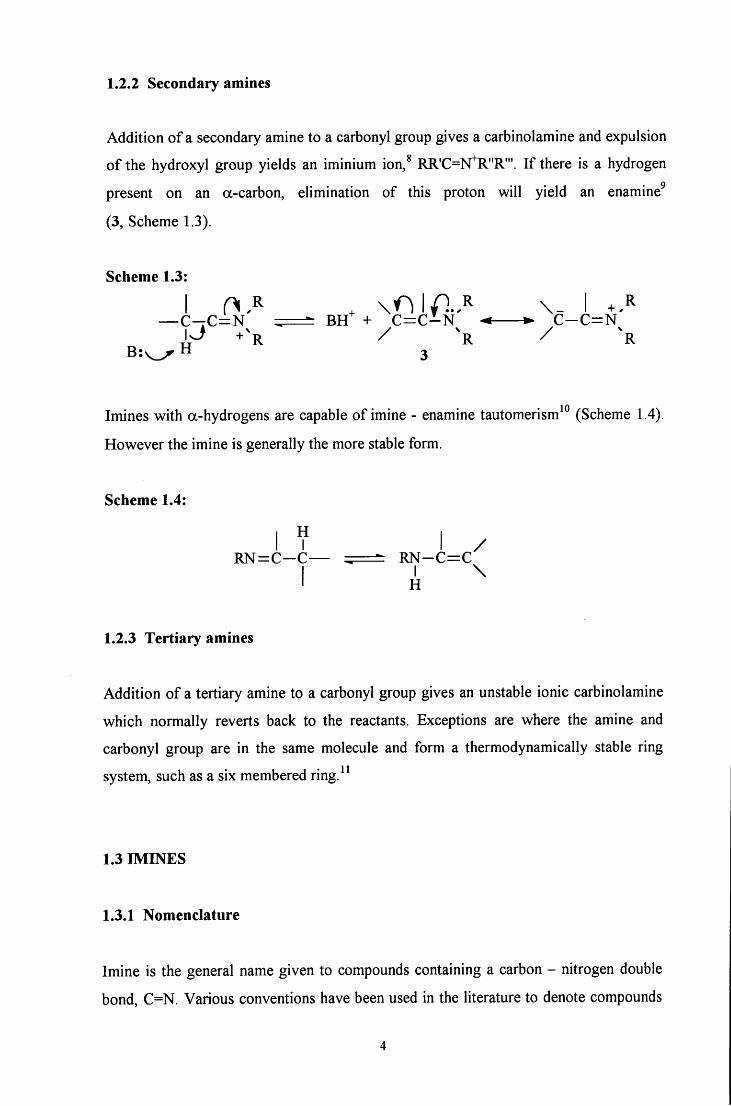
1.2.2 Secondary amines
Addition o f a secondary amine to a carbonyl group gives a carbinolamine and expulsion
o f the hydroxyl group yields an iminium ion,^ RR'C=]SrR"R'". I f there is a hydrogen
present on an a-carbon, elimination of this proton wi l l yield an enamine^
(3, Scheme 1.3).
Scheme 1.3:
— C - 7 C = N ^ — - B H + C = C - N -< C - C = N
Imines with a-hydrogens are capable o f imine - enamine tautomerism^^ (Scheme 1.4).
However the imine is generally the more stable form.
Scheme 1.4:
H I I /
R N = C - C — R N - C = C I \
H
1.2.3 Tertiary amines
Addition o f a tertiary amine to a carbonyl group gives an unstable ionic carbinolamine
which normally reverts back to the reactants. Exceptions are where the amine and
carbonyl group are in the same molecule and form a thermodynamically stable ring
system, such as a six membered ring.^^
1.3 I M I N E S
1.3.1 Nomenclature
Imine is the general name given to compounds containing a carbon - nitrogen double
bond, C=N. Various conventions have been used in the literature to denote compounds
containing a C=N bond depending on the groups attached to the carbon and nitrogen.
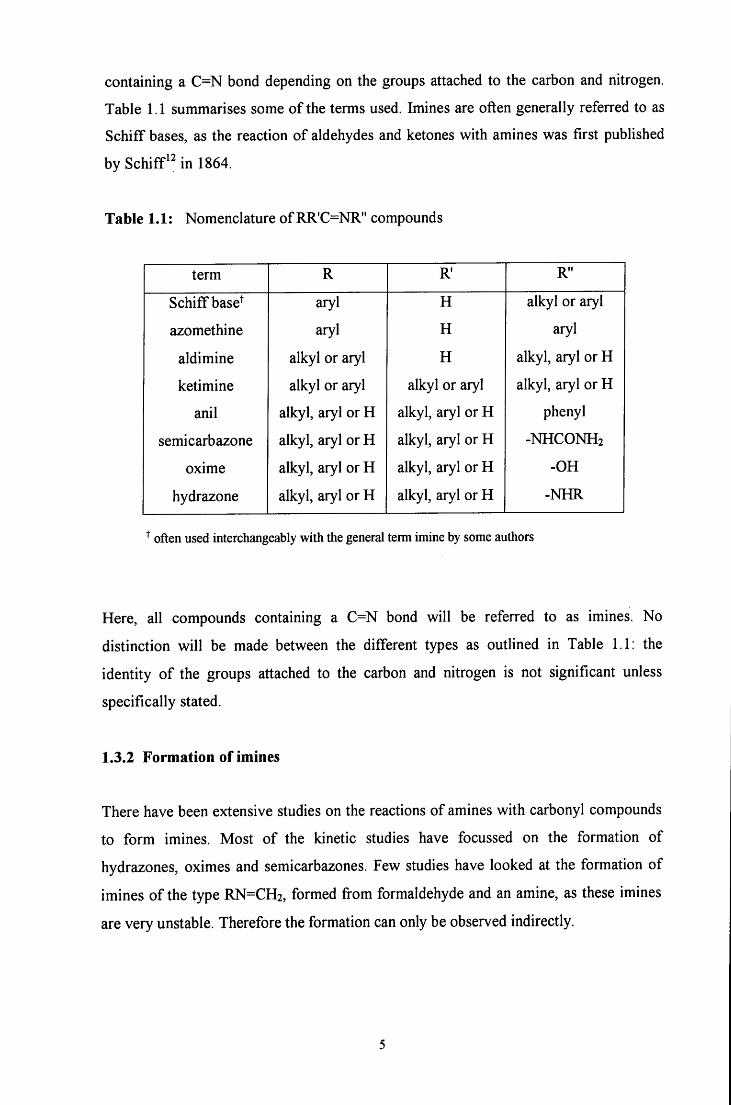
Table 1.1 summarises some o f the terms used. Imines are often generally referred to as
Schiff bases, as the reaction o f aldehydes and ketones with amines was first published
by Schiff in 1864.
Table 1.1: Nomenclature of RR'C=NR" compounds
term R R R"
Schiff base^ aryl H alkyl or aryl
azomethine aryl H aryl
aldimine alkyl or aryl H alkyl, aryl or H
ketimine alkyl or aryl alkyl or aryl alkyl, aryl or H
anil alkyl, aryl or H alkyl, aryl or H phenyl
semicarbazone alkyl, aryl or H alkyl, aryl or H - N H C O N H 2
oxime alkyl, aryl or H alkyl, aryl or H -OH
hydrazone alkyl, aryl or H alkyl, aryl or H -NHR
often used interchangeably with the general term imine by some authors
Here, all compounds containing a C=N bond w i l l be referred to as imines. No
distinction w i l l be made between the different types as outlined in Table 1.1: the
identity o f the groups attached to the carbon and nitrogen is not significant unless
specifically stated.
1.3.2 Formation of imines
There have been extensive studies on the reactions o f amines with carbonyl compounds
to fo rm imines. Most o f the kinetic studies have focussed on the formation o f
hydrazones, oximes and semicarbazones. Few studies have looked at the formation o f
imines o f the type R N = C H 2 , formed fi"om formaldehyde and an amine, as these imines
are very unstable. Therefore the formation can only be observed indirectly.
1.3.2.1 p H dependence
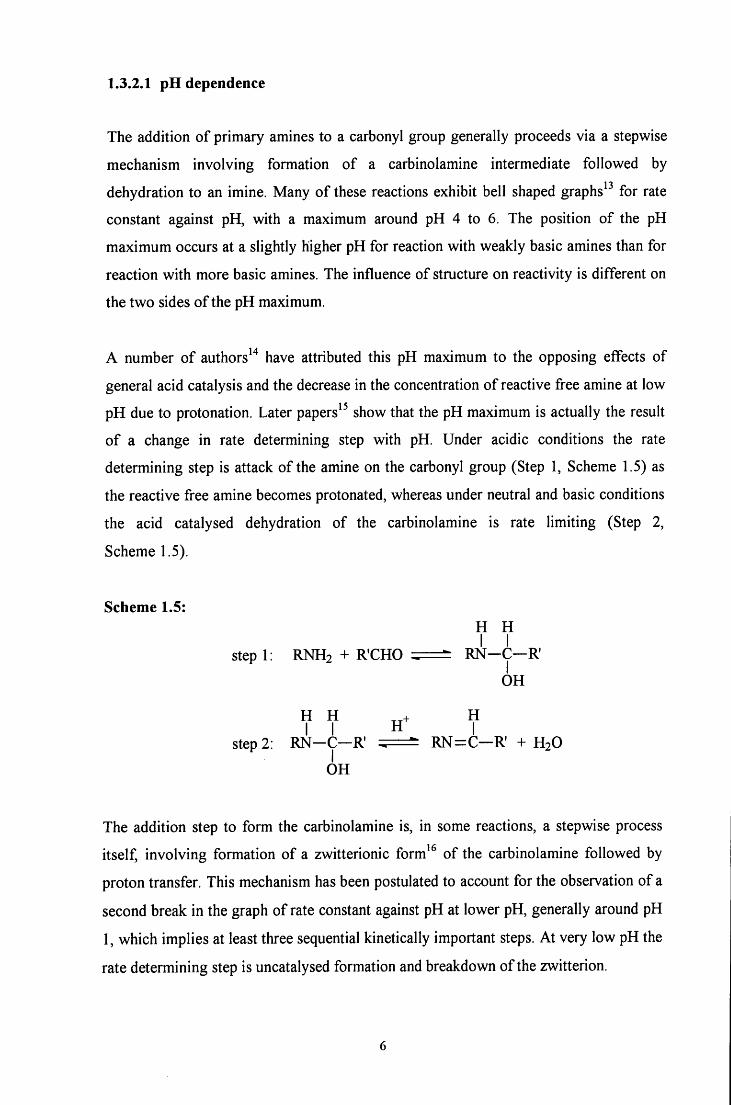
The addition o f primary amines to a carbonyl group generally proceeds via a stepwise
mechanism involving formation o f a carbinolamine intermediate followed by
dehydration to an imine. Many o f these reactions exhibit bell shaped graphs " for rate
constant against pH, with a maximum around pH 4 to 6. The position o f the pH
maximum occurs at a slightly higher pH for reaction with weakly basic amines than for
reaction with more basic amines. The influence o f structure on reactivity is different on
the two sides o f the pH maximum.
A number o f authors^"* have attributed this pH maximum to the opposing effects of
general acid catalysis and the decrease in the concentration o f reactive free amine at low
p H due to protonation. Later papers*^ show that the pH maximum is actually the result
o f a change in rate determining step with pH. Under acidic conditions the rate
determining step is attack o f the amine on the carbonyl group (Step 1, Scheme 1.5) as
the reactive free amine becomes protonated, whereas under neutral and basic conditions
the acid catalysed dehydration o f the carbinolamine is rate limiting (Step 2,
Scheme 1.5).
Scheme 1.5: H H
I I step 1: R N H 2 + R'CHO = ; = ^ R N - C — R '
O H
H H ^ + H I I H I
step 2: R N - C — R ' RN=:C—R' + H 2 O
O H
The addition step to form the carbinolamine is, in some reactions, a stepwise process
itself, involving formation o f a zwitterionic form^^ o f the carbinolamine followed by
proton transfer. This mechanism has been postulated to account for the observation of a
second break in the graph o f rate constant against pH at lower pH, generally around pH
1, which implies at least three sequential kinetically important steps. At very low pH the
rate determining step is uncatalysed formation and breakdown of the zwitterion.
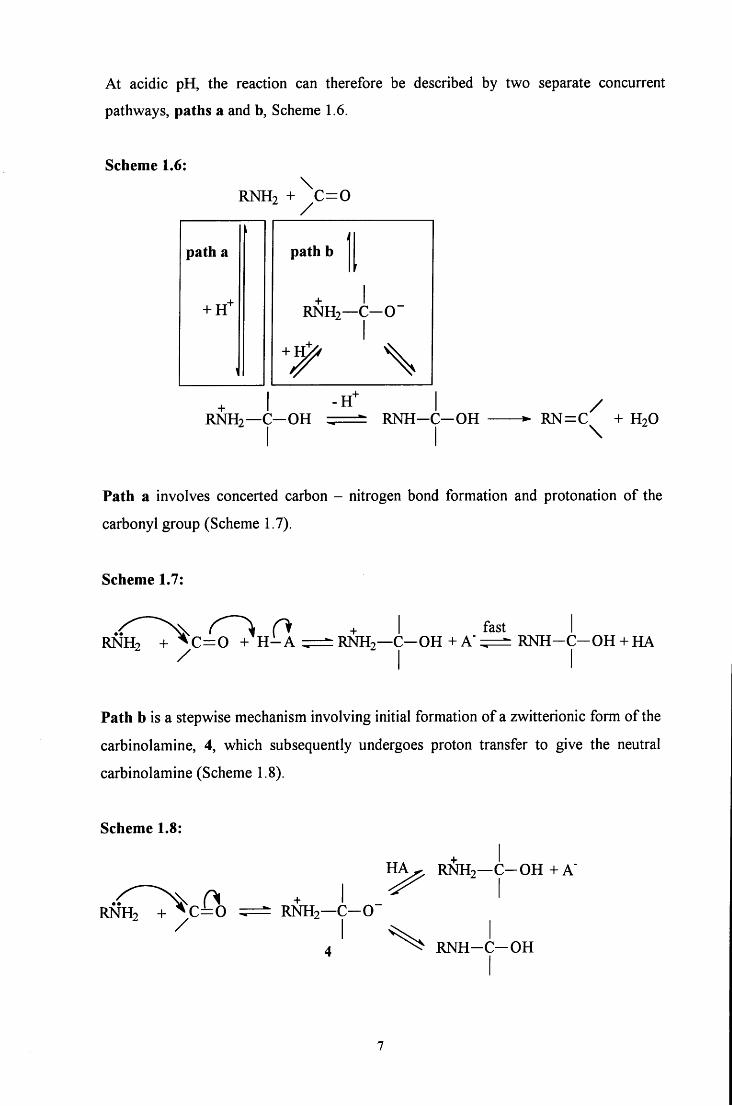
A t acidic pH, the reaction can therefore be described by two separate concurrent
pathways, paths a and b. Scheme 1.6.
Scheme 1.6:
R N H 2 + \ = 0
path a
+ H^
path b
R N H 2 — C - 0 "
R N H 2 — C - O H R N H - C - O H /
R N = C ^ + H 2 O
Path a involves concerted carbon - nitrogen bond formation and protonation o f the
carbonyl group (Scheme 1.7).
Scheme 1.7:
^ ^ + I fast R N H 2 + ^ C = 0 + H - A = ^ R N H 2 — C — O H + A ' ^ ^ R N H - C - O H + H A / I I
Path b is a stepwise mechanism involving initial formation o f a zwitterionic form of the
carbinolamine, 4, which subsequently undergoes proton transfer to give the neutral
carbinolamine (Scheme 1.8).
Scheme 1.8:
R N H 2 + V = 0 ^ R N H 2 — c - 0
H A - ^ R N H 2 — C - O H + A "
R N H - C - O H
Recent theoretical studies suggest that the proton transfer to convert the zwitterion to
the neutral carbinolamine proceeds through two water molecules.
The steric and electronic effects o f the carbonyl compound and the pKa o f the amine
determine the relative contributions o f each pathway. I t is thought that, in general, the
fol lowing rules apply:
1) for weakly basic amines or carbonyl compounds for which the equilibrium constant
for carbinolamine formation is small, the zwitterionic intermediate wi l l be unstable
and the reaction w i l l proceed via path a.
2) for moderately basic amines and carbonyl compounds with a large equilibrium
constant for carbinolamine formation, the zwitterionic intermediate wi l l be relatively
stable and path b is favoured.
To summarise, the rate determining step under neutral and basic conditions is generally
dehydration o f the carbinolamine, and under acidic conditions the rate determining step
is attack o f the amine on the carbonyl group. At low pH, the attack o f the amine on the
carbonyl group to produce the carbinolamine can occur either via a concerted
mechanism or via a stepwise reaction involving formation o f a carbinolamine
zwitterion. The reaction pathway followed depends on the pKa o f the amine and the
steric and electronic effects o f the groups attached to the carbonyl compound.
Although this is generally the case, there are a number o f reaction systems that have
been used to form oximes, semicarbazones and hydrazones that apparently show rate
l imiting carbinolamine dehydration even at low pH.^^ These reactions generally involve
intramolecular reactions and specifically a transition state with a cationic site on an
aromatic ring. The formation o f a cationic site on the substrate should increase the rate
o f amine attack relative to carbinolamine dehydration. This has the effect o f pushing the
change in rate determining step to lower pH values: the dehydration o f the
carbinolamine effectively becomes the rate determining step at all pH values.
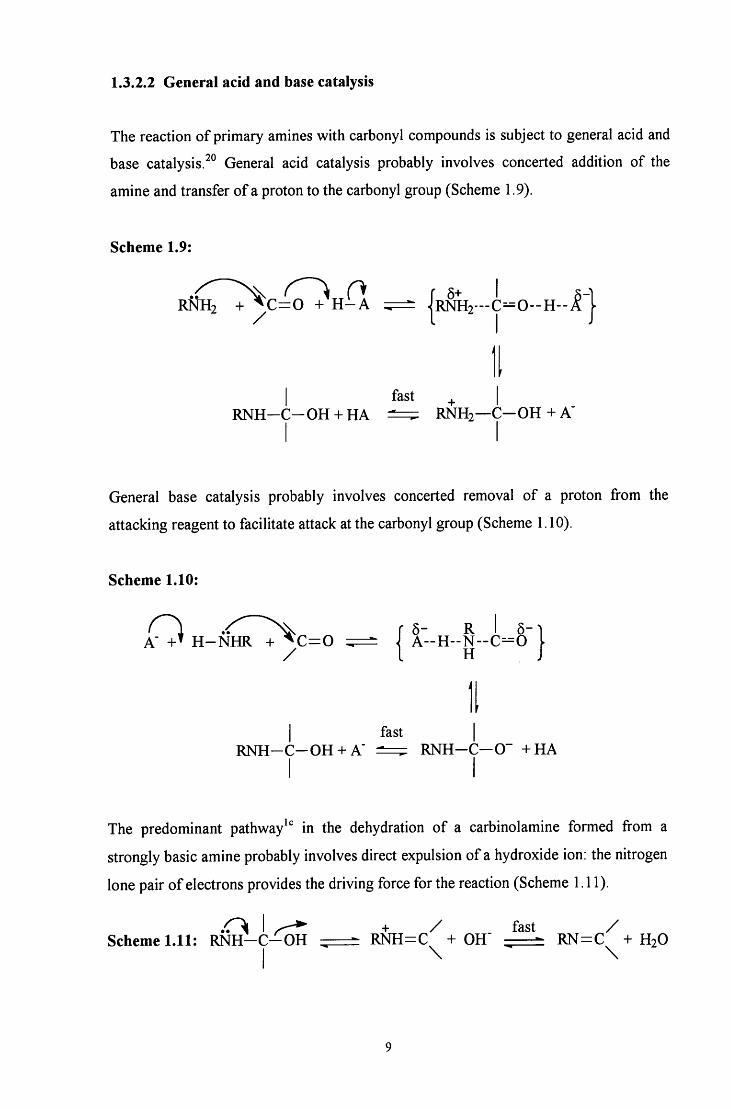
1.3.2.2 General acid and base catalysis
The reaction o f primary amines with carbonyl compounds is subject to general acid and
base catalysis.^^ General acid catalysis probably involves concerted addition o f the
amine and transfer o f a proton to the carbonyl group (Scheme 1.9).
Scheme 1.9:
R N H 2 + V = 0 + H - A — J R N H 2 - - - C - O - - H - - A .
fast R N H - C - O H + H A R N H 2 — C - O H + A"
General base catalysis probably involves concerted removal o f a proton from the
attacking reagent to facilitate attack at the carbonyl group (Scheme 1.10).
Scheme 1.10:
A" H - N H R + ^ C = 0 ^ A - - H - - N - - C = 0
fast R N H - C - O H + A" R N H - C - 0 " + H A
The predominant pa thway^ in the dehydration o f a carbinolamine formed from a
strongly basic amine probably involves direct expulsion o f a hydroxide ion: the nitrogen
lone pair o f electrons provides the driving force for the reaction (Scheme 1.11).
. 0 I ^ + / fast / Scheme 1.11: R N H - C - O H — - R N H = C + OH" - — - R N = C + H 2 O
I \ \
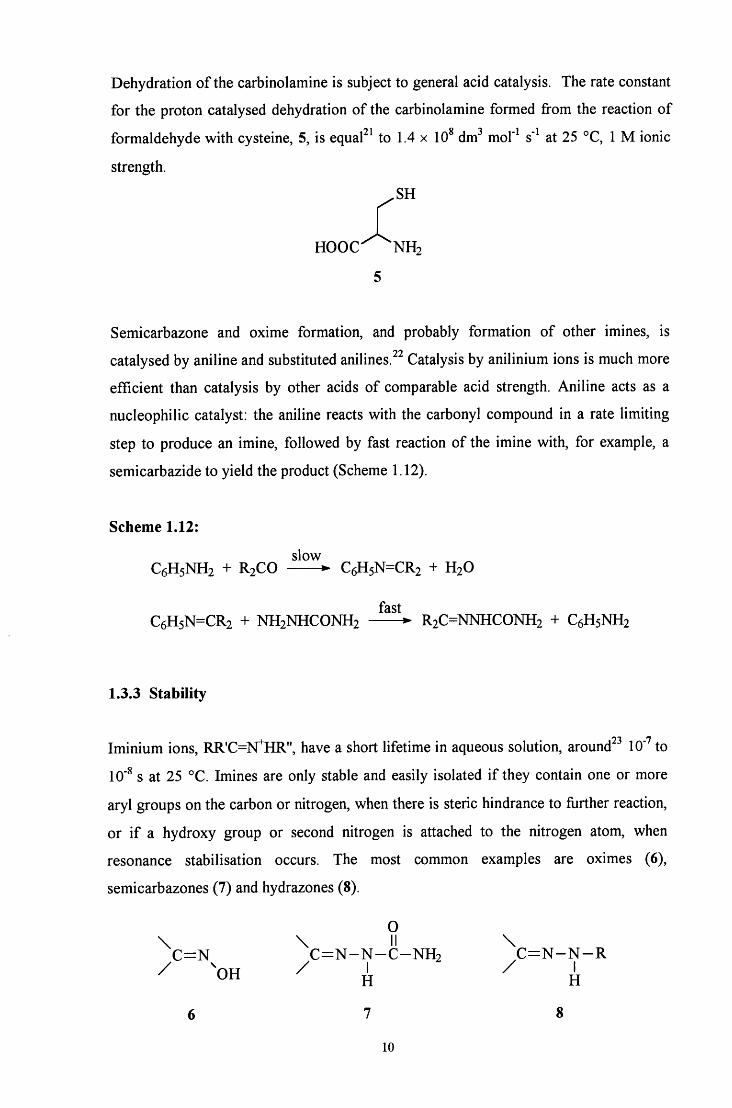
Dehydration o f the carbinolamine is subject to general acid catalysis. The rate constant
for the proton catalysed dehydration o f the carbinolamine formed from the reaction o f
formaldehyde with cysteine, 5, is equaP^ to 1.4 x 10^ dm^ mol"^ s" at 25 °C, 1 M ionic
strength.
. S H
H O O C ^ "NH2
5
Semicarbazone and oxime formation, and probably formation o f other imines, is
catalysed by aniline and substituted anilines.^^ Catalysis by anilinium ions is much more
efficient than catalysis by other acids o f comparable acid strength. Aniline acts as a
nucleophilic catalyst: the aniline reacts with the carbonyl compound in a rate limiting
step to produce an imine, followed by fast reaction o f the imine with, for example, a
semicarbazide to yield the product (Scheme 1.12).
Scheme 1.12:
slow C6H5NH2 + R 2 C O C6H5N=CR2 + H2O
fast C6H5N=CR2 + N H 2 N H C O N H 2 R 2 C = N N H C O N H 2 + C6H5NH2
1.3.3 Stability
Iminium ions, RR'C=N^HR", have a short lifetime in aqueous solution, around^^ 10'^ to
10'^ s at 25 °C. Imines are only stable and easily isolated i f they contain one or more
aryl groups on the carbon or nitrogen, when there is steric hindrance to further reaction,
or i f a hydroxy group or second nitrogen is attached to the nitrogen atom, when
resonance stabilisation occurs. The most common examples are oximes (6),
semicarbazones (7) and hydrazones (8).
O \ \ II \
C = N C = N - N - C - N H 2 C = N - N - R
8
10
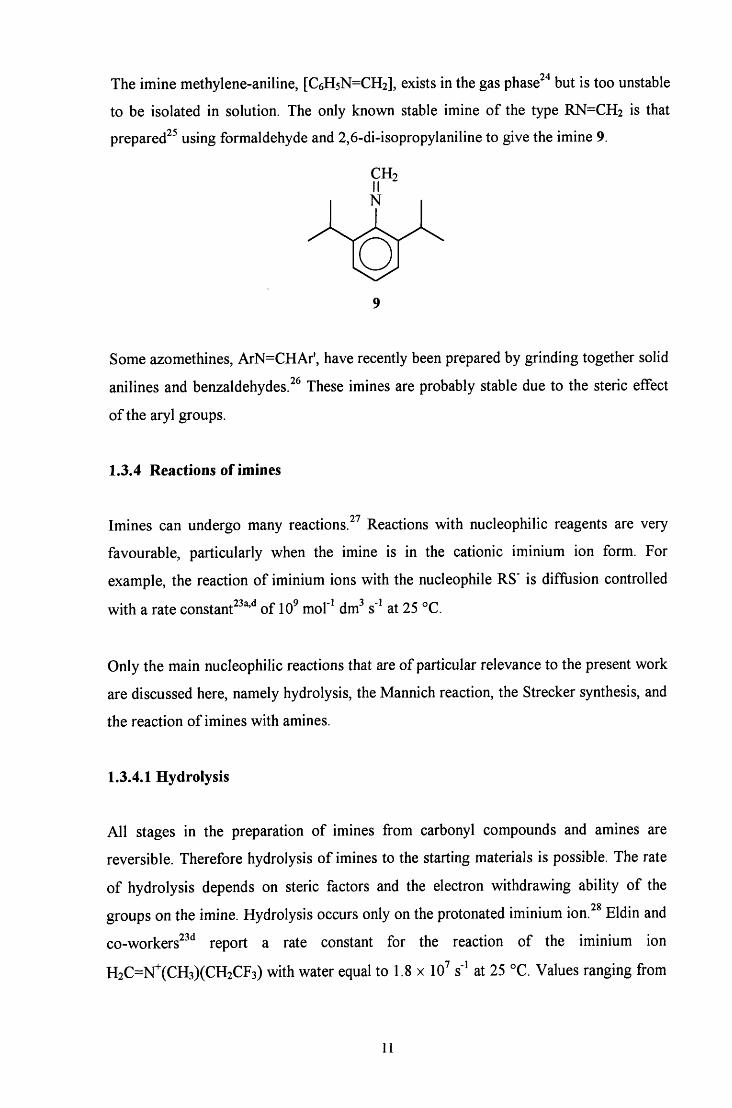
The imine methylene-aniline, [C6H5N=CH2], exists in the gas phase '* but is too unstable
to be isolated in solution. The only known stable imine of the type RN=CH2 is that
prepared^^ using formaldehyde and 2,6-di-isopropylaniline to give the imine 9.
Q Some azomethines, ArN=CHAr', have recently been prepared by grinding together solid
anilines and benzaldehydes. ^ These imines are probably stable due to the steric effect
of the aryl groups.
1.3.4 Reactions of imines
Imines can undergo many reactions. Reactions with nucleophilic reagents are very
favourable, particularly when the imine is in the cationic iminium ion form. For
example, the reaction of iminium ions with the nucleophile RS' is diffusion controlled
with a rate constant ^ * of 10^ mol' dm^ s" at 25 °C.
Only the main nucleophilic reactions that are of particular relevance to the present work
are discussed here, namely hydrolysis, the Mannich reaction, the Strecker synthesis, and
the reaction of imines with amines.
1.3.4.1 Hydrolysis
All stages in the preparation of imines from carbonyl compounds and amines are
reversible. Therefore hydrolysis of imines to the starting materials is possible. The rate
of hydrolysis depends on steric factors and the electron withdrawing ability of the
groups on the imine. Hydrolysis occurs only on the protonated iminium ion. Eldin and
co-workers ' report a rate constant for the reaction of the iminium ion
H2C=N^(CH3)(CH2CF3) with water equal to 1.8 x 10^ s" at 25 °C. Values ranging from
11
3.1 X 10 to 1.0 X 10 s at 25 °C are obtained for the hydrolysis o f iminium ions
formed from formaldehyde and iV-methylaniline derivatives 23a
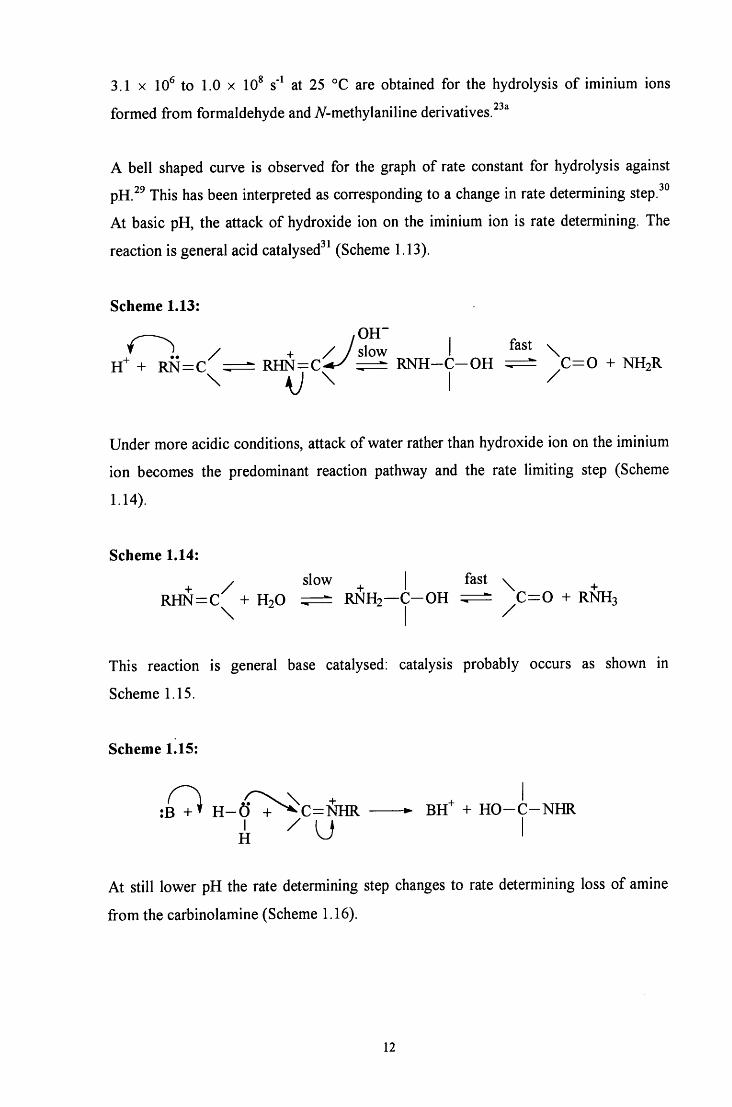
A bell shaped curve is observed for the graph o f rate constant for hydrolysis against
pH.^^ This has been interpreted as corresponding to a change in rate determining step.^°
A t basic pH, the attack o f hydroxide ion on the iminium ion is rate determining. The
reaction is general acid catalysed^^ (Scheme 1.13).
Scheme 1.13:
i \ / + / / s l o w I fast H ^ + R N = C R H N = C - ^ R N H - C - O H C = 0 + NH2R
^ \ j ^ I ^
Under more acidic conditions, attack o f water rather than hydroxide ion on the iminium
ion becomes the predominant reaction pathway and the rate limiting step (Scheme
1.14).
Scheme 1.14:
+ / + I fa^^ \ + R H N = C + H2O RNH2—C-OH = ^ C = 0 + RNH3 \ I /
This reaction is general base catalysed: catalysis probably occurs as shown in
Scheme 1.15.
Scheme 1.15:
H - 0 " " 4 ^ C = N H R B H ^ + H O - C - N H R
A I
A t still lower p H the rate determining step changes to rate determining loss o f amine
f rom the carbinolamine (Scheme 1.16).
12
Scheme 1.16:
^ / fast + I slow + I _ \ R H N = C ^ + H 2 0 ^ = ! ^ R N H 2 — C - O H R N H 2 — C - 0 : : ^ ^ C = 0 + R N H 2
This reaction is slow at low pH as a proton has to be removed from the oxygen atom of
the carbinolamine in order to obtain a sufficient driving force to expel the amine.
1.3.4.2 Mannich Reaction
The Mannich reaction involves reaction o f an aldehyde, usually formaldehyde, with
ammonia or a primary or secondary amine, and a compound with an easily removable,
acidic hydrogen, R ' H (Scheme 1.17).
Scheme 1.17: R 2 N H + HCHO + R 'H >• R 2 N C H 2 R ' + H 2 O
R ' H is usually a ketone, acid or ester. The product R 2 N C H 2 R ' is known as a Mannich
base. There have been a number o f reviews published on the synthesis and reactions of
Mannich bases. ^ The mechanism o f the reaction has been the subject o f considerable
discussion"'^ but kinetic studies '* suggest the following mechanisms in acidic and basic
media.
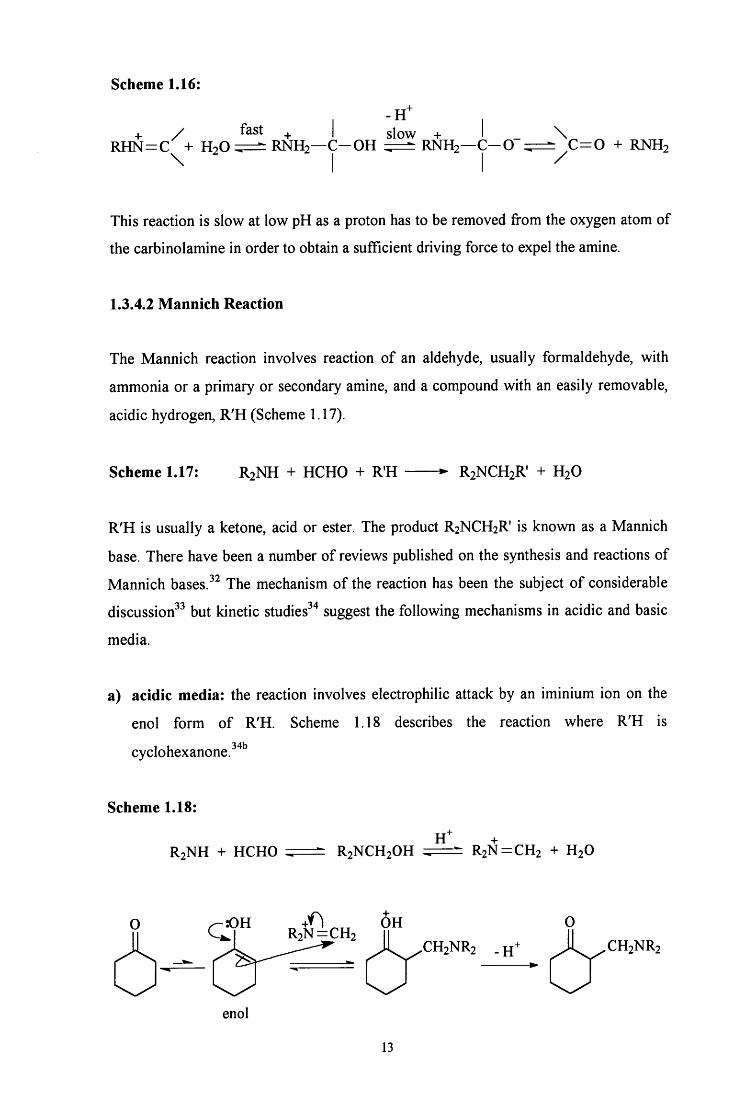
a) acidic media: the reaction involves electrophilic attack by an iminium ion on the
enol form o f R 'H. Scheme 1.18 describes the reaction where R ' H is
cyclohexanone
Scheme 1.18:
34b
r +
H + R 2 N H + HCHO ^ R 2 N C H 2 O H R 2 N = C H 2 + H 2 O
. i . / ^ - ^ - ^ ^ " ^ J - L / C H 2 N R 2 C H 2 N R 2
enol
13
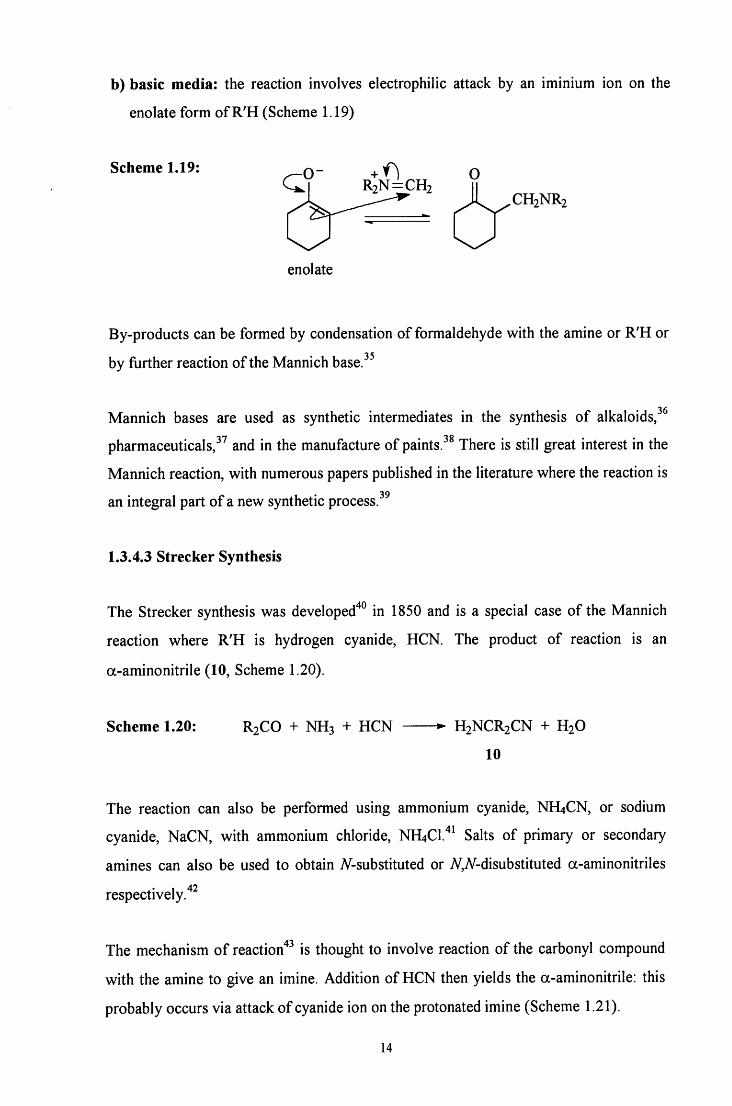
b) basic media: the reaction involves electrophilic attack by an iminium ion on the
enolate form o f R ' H (Scheme 1.19)
Scheme 1.19: O + ^ o R2N=CH2
CH2NR2
enolate
By-products can be formed by condensation o f formaldehyde with the amine or R ' H or
by further reaction o f the Mannich base.
36 Mannich bases are used as synthetic intermediates in the synthesis o f alkaloids,
pharmaceuticals,^^ and in the manufacture o f paints.^^ There is still great interest in the
Mannich reaction, with numerous papers published in the literature where the reaction is
an integral part o f a new synthetic process.
1.3.4.3 Strecker Synthesis
The Strecker synthesis was developed'^^ in 1850 and is a special case o f the Mannich
reaction where R ' H is hydrogen cyanide, HCN. The product o f reaction is an
a-aminonitrile (10, Scheme 1.20).
Scheme 1.20: R2CO + NH3 + H C N H2NCR2CN + H2O
10
The reaction can also be performed using ammonium cyanide, NH4CN, or sodium
cyanide, NaCN, with ammonium chloride, Nl i jC l .^^ Salts o f primary or secondary
amines can also be used to obtain A^-substituted or 7V,A^-disubstituted a-aminonitriles
respectively."*^
The mechanism o f reaction"*^ is thought to involve reaction o f the carbonyl compound
wi th the amine to give an imine. Addition of H C N then yields the a-aminonitrile: this
probably occurs via attack o f cyanide ion on the protonated imine (Scheme 1.21).
14
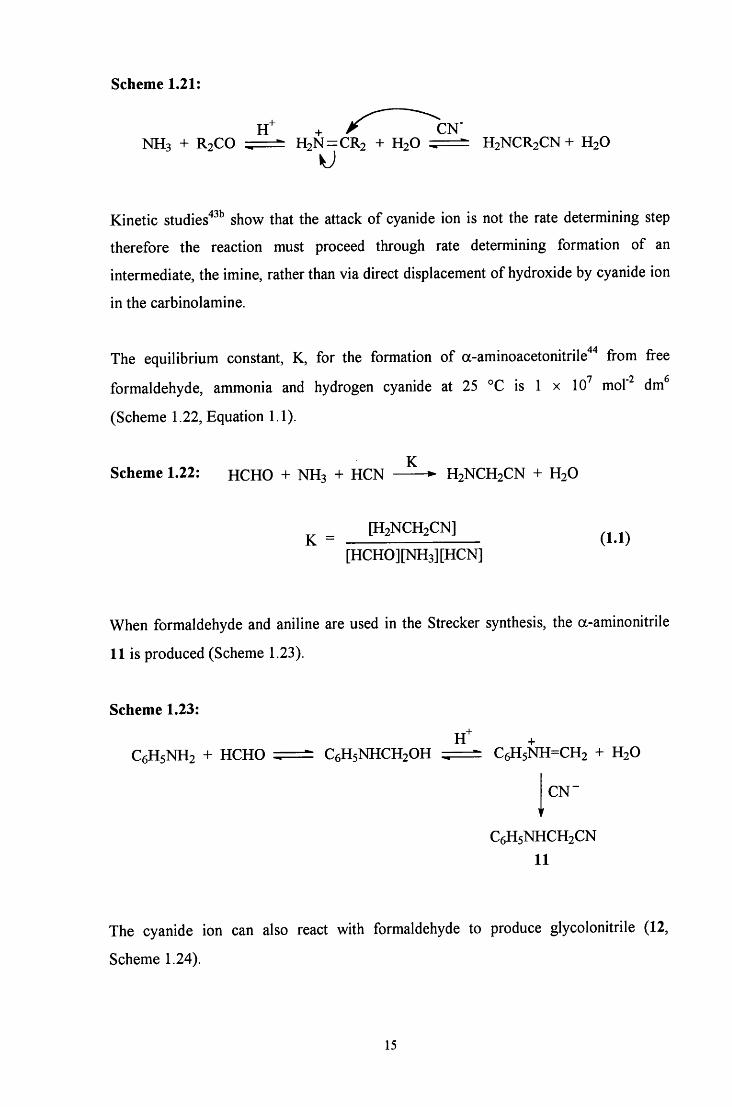
Scheme 1.21:
H " + A CN-NH3 + R 2 C O H 2 N = C R 2 + H 2 O : ^ = ^ H 2 N C R 2 C N + H 2 O
Kinetic studies"^^^ show that the attack o f cyanide ion is not the rate determining step
therefore the reaction must proceed through rate determining formation o f an
intermediate, the imine, rather than via direct displacement o f hydroxide by cyanide ion
in the carbinolamine.
The equilibrium constant, K, for the formation o f a-aminoacetonitrile'*'* from free 7 2 6
formaldehyde, ammonia and hydrogen cyanide at 25 °C is 1 x 10 mol' dm
(Scheme 1.22, Equation 1.1).
K Scheme 1.22: HCHO + NH3 + H C N H 2 N C H 2 C N + H 2 O
K = [ H 2 N C H 2 C N ]
[HCH0][NH3][HCN]
When formaldehyde and aniline are used in the Strecker synthesis, the a-aminonitrile
11 is produced (Scheme 1.23).
Scheme 1.23:
H ^ C6H5NH2 + HCHO = : = ^ C6H5NHCH2OH C6H5NH=CH2 + H 2 O
C N -
C6H5NHCH2CN 11
The cyanide ion can also react with formaldehyde to produce glycolonitrile (12,
Scheme 1.24).
15
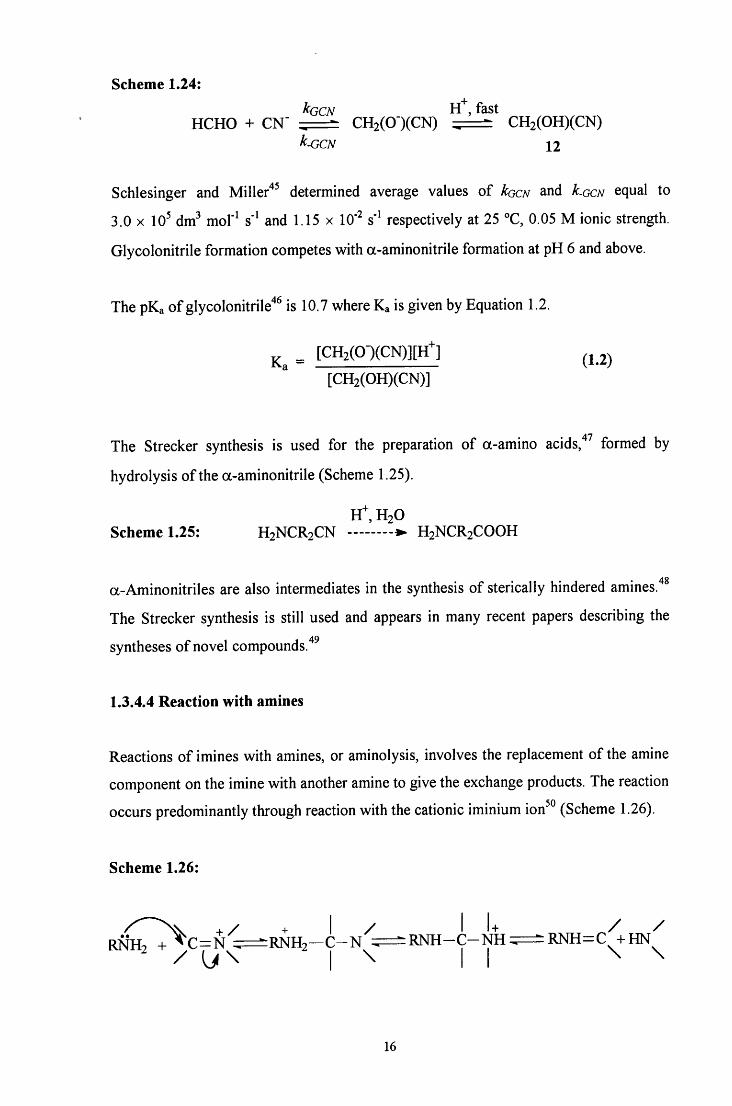
Scheme 1.24:
^GCN H^ , fast HCHO + CN" CH2 (0") (CN) C H 2 ( 0 H ) ( C N )
Schlesinger and Miller"*^ determined average values o f kocN and Lgcn equal to
3.0 X 10 dm^ mol"^ s' and 1.15 x 10" s' respectively at 25 °C, 0.05 M ionic strength.
Glycolonitrile formation competes with a-aminonitrile formation at p H 6 and above.
The pKa o f glycolonitrile'*^ is 10.7 where Ka is given by Equation 1.2.
Ka = [ C H 2 ( 0 - ) ( C N ) ] [ H 1 ( J 2 )
[ C H 2 ( 0 H ) ( C N ) ]
The Strecker synthesis is used for the preparation o f a-amino acids,"*^ formed by
hydrolysis o f the a-aminonitrile (Scheme 1.25).
H" , H 2 O Scheme 1.25: H 2 N C R 2 C N ^ H 2 N C R 2 C O O H
a-Aminonitriles are also intermediates in the synthesis o f sterically hindered amines."*^
The Strecker synthesis is still used and appears in many recent papers describing the
syntheses o f novel compounds."*^
1.3.4.4 Reaction with amines
Reactions o f imines with amines, or aminolysis, involves the replacement o f the amine
component on the imine with another amine to give the exchange products. The reaction
occurs predominantly through reaction with the cationic iminium ion^° (Scheme 1.26).
Scheme 1.26:
^ll2 + ' ^ C ^ ^ ^ R N H 2 - ( : - N ^ : ^ R N H - ^
16
The intermediate is analogous to the carbinolamine intermediate in imine formation.
Whichever step involves attack o f the weaker amine on the imine containing the
stronger amine is the rate determining step. ^
1.4 1 , 3 , 5 - H E X A H Y D R O T R I A Z I N E S
When equimolar amounts o f an amine and formaldehyde react, or when formaldehyde
is present in excess, a resinous chain polymer, 13, is formed in acidic conditions due to
spontaneous polymerisation o f the unstable imine [RN=CH2] that is formed.
— C H 2 N H R - C H 2 N H R —
^ n
13
In neutral media, [RN=CH2] rapidly polymerises to give a cyclic trimer, (Scheme 1.27,
14) 1,3,5-hexahydrotriazine, also known as a hexahydro-5-triazine.
Scheme 1.27:
3 H C H 0 + 3 R N H 2 3 H 2 O + 3 [ R N = C H 2 ] R N ' ^ N R
^ N ^ R
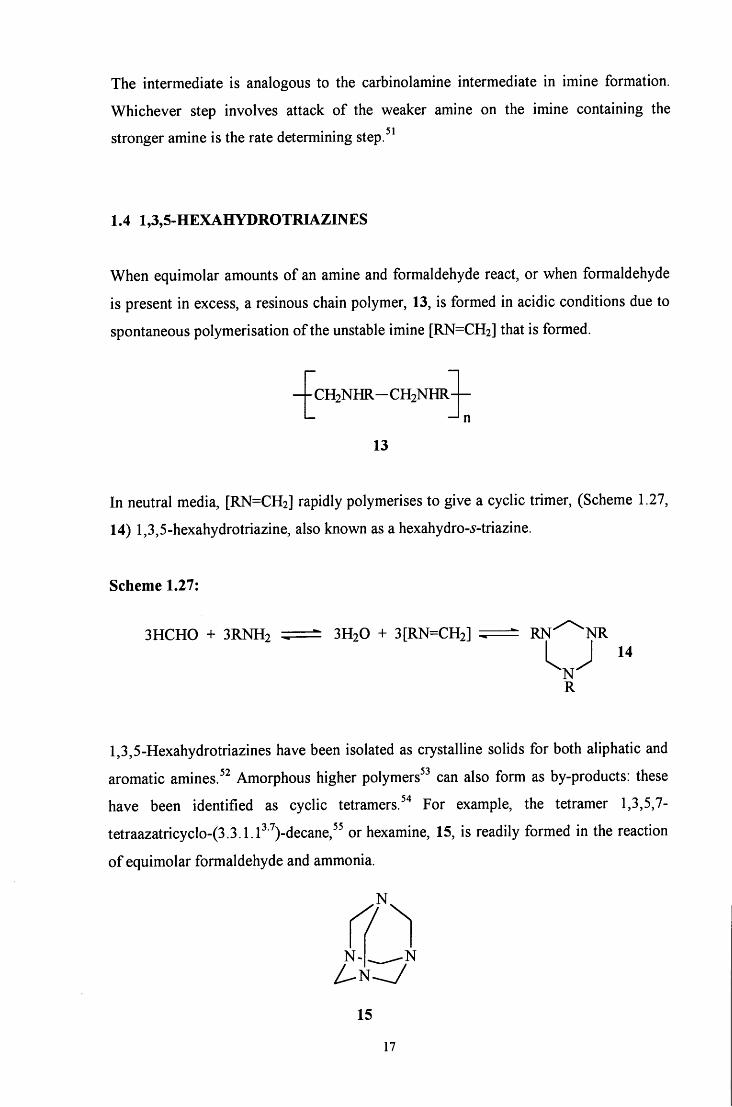
1,3,5-Hexahydrotriazines have been isolated as crystalline solids for both aliphatic and
aromatic amines.^^ Amorphous higher polymers" can also form as by-products: these
have been identified as cyclic tetramers.^"* For example, the tetramer 1,3,5,7-
tetraazatricyclo-(3.3.1.1 )-decane, or hexamine, 15, is readily formed in the reaction
o f equimolar formaldehyde and ammonia.
n N - . ^ ^ N
15
17
l,3,5-Triphenyl-l,3,5-hexahydrotriazine and other 1,3,5-triaryl-1,3,5-hexahydro-
triazines have been used to promote the stabilisation o f plasticised synthetic rubbers.^^
1.5 I N T R O D U C T I O N T O F O R M A L D E H Y D E AND S U L F I T E C H E M I S T R Y
The reactions o f formaldehyde, amines and a nucleophile are important in synthetic
processes. Numerous studies have examined hydrolysis o f imines, the Mannich reaction
and the Strecker synthesis. However only one study has looked at the reaction with
sulfite as the nucleophile.
The products o f reaction o f formaldehyde, anilines (RC6H4NH2) and sulfite are
aminomethanesulfonates, RC6H4NHCH2SO3". These compounds are important in the
azo dye industry as the methanesulfonate group provides high solubility and is a
blocking group^^ for diazo coupling reactions. Aminomethanesulfonates are also of
considerable interest for medical applications.^'^
To understand the reaction o f formaldehyde, amines and sulfite, the chemistry of
formaldehyde must be considered.
1.6 F O R M A L D E H Y D E
1.6.1 Formaldehyde solution composition
Formaldehyde chemistry is complicated by the fact that formaldehyde is seldom
encountered as pure HCHO, the reactive monomeric form. HCHO polymerises readily
at room temperature and below and therefore can only be kept in the pure monomeric
state for a very limited time. Hence formaldehyde can only be purchased in a solid
polymeric form, known as paraformaldehyde, or as a solution. The most common form
is a 37 % formaldehyde by weight aqueous solution containing 10 to 15 % methanol to
prevent precipitation o f solid polymer. This standard 37 % by weight solution was first
known under the trade names^^ 'Formalin' and 'Formol'.
18
Formaldehyde polymers can be categorised into two main groups: linear polymers, or
polyoxymethylene glycols, and cyclic polymers.
1.6.1.1 Linear polymers, or polyoxymethylene glycols, H0(CH20)nH
Less than 0 . 1 % aqueous formaldehyde solution is present as monomeric formaldehyde
even in concentrated solution. The formaldehyde is almost completely hydrated: the
principal form is the monohydrate, methylene glycol, CH2(OH)2, with other low
molecular weight polyoxymethylene glycols, H0(CH20)nH, also present. ^ The solution
composition can be described in terms of Scheme L28.
Scheme 1.28: HCHO + H2O CH2(OH)2
2CH2(OH)2 HO(CH20)2H + H2O
CH2(OH)2 + HO(CH20)2H HO(CH20)3H + H2O
etc.
The rate of formation of the higher molecular weight polyoxymethylene glycols is much
slower than that of methylene glycol: the rate constants differ by a factor^^ of 100 to
1000. All of the equilibria are reversible and the different forms generally react as
formaldehyde: the net effect of reactions involving aqueous formaldehyde solution is
usually what would be expected i f monomeric formaldehyde were employed. However
the polymers differ in the readiness with which they depolymerise to yield
formaldehyde in a reactive form.
Pure formaldehyde solutions are clear and colourless. Cloudiness or opalescence is
caused by polymer precipitation. The degree of precipitation depends on the total
formaldehyde concentration, temperature, standing time, pH and the concentration and
type of solution stabiliser, i f present. Each of these factors will be considered in turn.
a) Formaldehyde concentration
Iliceto and co-workers^"^ have calculated the probable proportion of formaldehyde
present as the various polyoxymethylene glycols at 35 °C for different aqueous
19
formaldehyde solution concentrations. Low formaldehyde concentrations favour
methylene glycol and high concentrations favour higher polyoxymethylene glycols.^^
b) Temperature
Polyoxymethylene glycols decrease in solubility with increasing molecular weight and
can precipitate out of solution when the concentration exceeds the solubility at a
particular temperature. At low temperatures, ^ formaldehyde solutions become cloudy
and eventually solid hydrated polymer separates as a precipitate. Solutions in which
polymer has precipitated can be clarified by warming i f exposure to low temperature
has been short. After long exposure, clarification is not possible. Polymer precipitation
can be prevented by maintaining the solution above the minimum temperature at which
precipitation is known to take place. The minimum temperature is a function of the
formaldehyde concentration and the type and concentration of any solution stabilisers
that may be present. Precipitation occurs below 7 °C for a 37 % by weight aqueous
formaldehyde solution containing 10 % methanol.
c) Standing time
Solutions containing 37 % or more by weight formaldehyde with no stabiliser present
precipitate low molecular weight polymers at room temperature. On standing, these
polymers increase in molecular weight. After dilution of an aqueous formaldehyde
solution to 4 % or less, higher molecular weight polymers dissociate over a period of
hours at room temperature to give methylene glycol via acid or base catalysed
pathways.
d) pH of the solution
In general, solutions with a pH in the range 3 to 5 are most stable with respect to
polymer precipitation as the polymerisation reactions proceed at minimal rates in this 67
range. Polymerisation becomes increasingly rapid as the pH varies from these limits.
20
e) Solution stabilisers
A 37 % by weight formaldehyde solution usually contains 10 to 15 % methanol,
CH3OH, to prevent polymer precipitation. Methanol combines with the dissolved
formaldehyde to form unstable low molecular weight compounds of high solubility.
These compounds are probably hemiacetals, HO(CH20)nCH3, which can exist in
equilibrium with polyoxymethylene glycols, as shown in Scheme 1.29.
Scheme 1.29: CH2(OH)2 + CH3OH HOCH2OCH3 + H2O
HO(CH20)2H + CH3OH HO(CH20)2CH3 + H2O
etc.
Compounds other than alcohols that will prevent polymer precipitation by forming
water soluble formaldehyde compounds include hydrogen sulfide^^ and neutral or
mildly acidic nitrogen compounds such as urea ^ and melamine.^^
To summarise, polyoxymethylene glycol polymer precipitation in a formaldehyde
solution can be avoided, or kept to a minimum, by adding a stabiliser to the solution,
storing above 7 °C at pH 3 to 5, and diluting the solution and leaving to stand prior to
use to ensure depolymerisation of higher molecular weight polymers to methylene
glycol.
Formaldehyde can also be purchased in a solid polymeric form, known as
paraformaldehyde. This contains a mixture of low molecular weight polyoxymethylene
glycols containing 8 to 100 formaldehyde units per molecule. 71
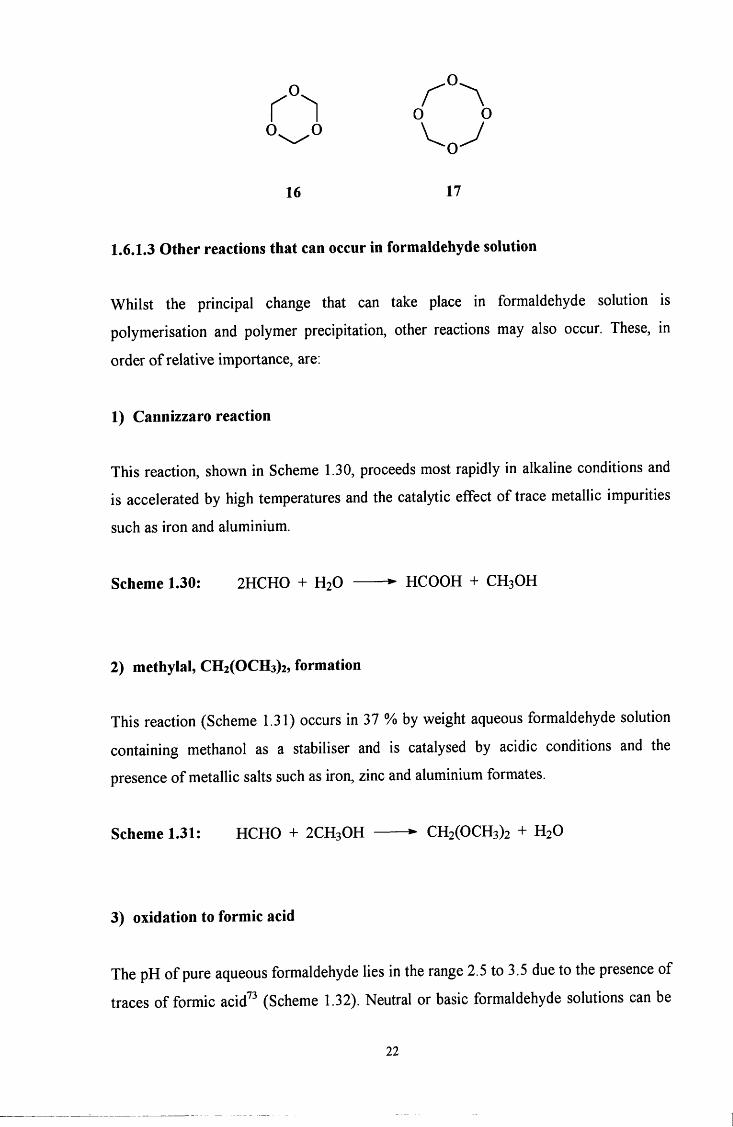
1.6.1.2 Cyclic polymers
Trioxane, 16, or alpha-trioxymethylene is the cyclic trimer of formaldehyde. 16 is a
stable chemical compound with unique, well defined properties. Tetraoxane, 17, is the
cyclic tetramer of formaldehyde. Neither of these compounds is present in significant • 72
quantities in formaldehyde solutions.
21
1 o o
16 17
1.6.1.3 Other reactions that can occur in formaldehyde solution
Whilst the principal change that can take place in formaldehyde solution is
polymerisation and polymer precipitation, other reactions may also occur. These, in
order of relative importance, are:
1) Cannizzaro reaction
This reaction, shown in Scheme 1.30, proceeds most rapidly in alkaline conditions and
is accelerated by high temperatures and the catalytic effect of trace metallic impurities
such as iron and aluminium.
Scheme 1.30: 2 H C H 0 + H2O HCOOH + CH3OH
2) methylal, CH2(OCH3)2, formation
This reaction (Scheme 1.31) occurs in 37 % by weight aqueous formaldehyde solution
containing methanol as a stabiliser and is catalysed by acidic conditions and the
presence of metallic salts such as iron, zinc and aluminium formates.
Scheme 1.31: HCHO + 2CH3OH CH2(OCH3)2 + H2O
3) oxidation to formic acid
The pH of pure aqueous formaldehyde lies in the range 2.5 to 3.5 due to the presence of
traces of formic acid^^ (Scheme 1.32). Neutral or basic formaldehyde solutions can be
22
The pKa of methylene glycoP to give CH2(0H)(0') is 13.27 at 25 °C in aqueous
solution.
Funderburk and co-workers studied the reaction of formaldehyde dehydration with
respect to pH and determined that the pseudo first order, buffer independent rate
constant can be described by Equation 1.3.
kdeh = ko + k d l f ] + kodOU-] (1.3)
At 25 °C, 1.0 M ionic strength, the values of kjj, koH and ko are equal to
2.84 mol" dm^ s'\ 2.1 x 10 mol' dm s' and 4 x 10" s" respectively. Between pH 4
and 7 the dehydration is approximately pH independent.
1.6.3 Detection of formaldehyde
The HCHO content of pure aqueous formaldehyde solutions or solutions containing
only small quantities of impurities can be determined accurately using specific gravity
or refractivity methods. Chemical procedures are also often used because of their
simplicity. There are a number of methods available although none are specific to
formaldehyde. 'Formaldehyde' by Walker ^ gives a detailed description of all the tests
and Biichi^^ has published a comprehensive review of the various methods. Biichi fin ».
concludes that the sodium sulfite method is the most satisfactory. This can be used to
detect any ketone or aldehyde but is sensitive to formaldehyde because of its high
reactivity. Impurities commonly present have little effect on the results, as do the
presence of methanol and methylal.The test is based on the detection of sodium
hydroxide liberated quantitatively when formaldehyde reacts with sodium sulfite to
form hydroxymethanesulfonate, CH2(OH)(S03Na) (Scheme 1.35). The sodium
hydroxide is titrated against a strong acid.
Scheme 1.35: HCHO + Na2S03 + H2O ^;=:= NaOH + CH2(OH)(S03Na)
This is a simple and sensitive method that can be used to detect and approximate the
presence of small quantities of formaldehyde.
24
1.7 HYDROXYMETHANESULFONATE, CH2(OH)(S03Na)
1.7.1 Introduction
Hydroxymethanesulfonate, or HMS, CH2(OH)(S03Na), is the adduct of formaldehyde
and sodium sulfite. HMS dissociates in aqueous solution and therefore is a convenient
method of producing formaldehyde and sulfite in situ in equimolar amounts. Of
particular interest here is the reaction of HMS with amines, as this is effectively a
reaction involving formaldehyde, an amine and a nucleophile, namely sulfite. The
formation of HMS is utilised in the formaldehyde clock reaction demonstration. HMS is
present in the atmosphere and has been detected in beer. These factors will also be
discussed.
1.7.2 Reaction with ammonia
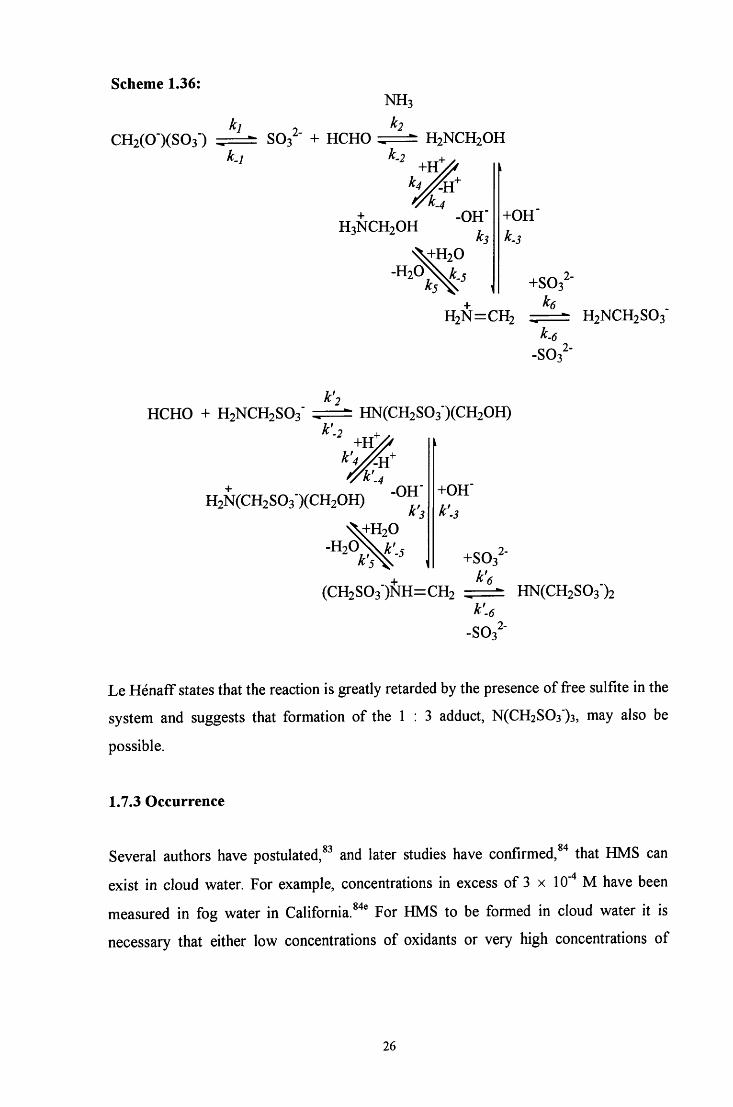
There has been only one previous study reported in the literature on the reaction of
hydroxymethanesulfonate, CH2(OH)(S03Na), with an amine: Le Henaff*^ studied the
reaction with ammonia. The products obtained are the 1 : 1 and 1 : 2 ammonia :
CH2(OH)(S03") adducts H2NCH2SO3" and HN(CH2S03')2. The reactions are shown in
Scheme 1.36. Concentrations of the intermediates are small. The rate and equilibrium
constants obtained at 20 °C are shown in Table 1.2.
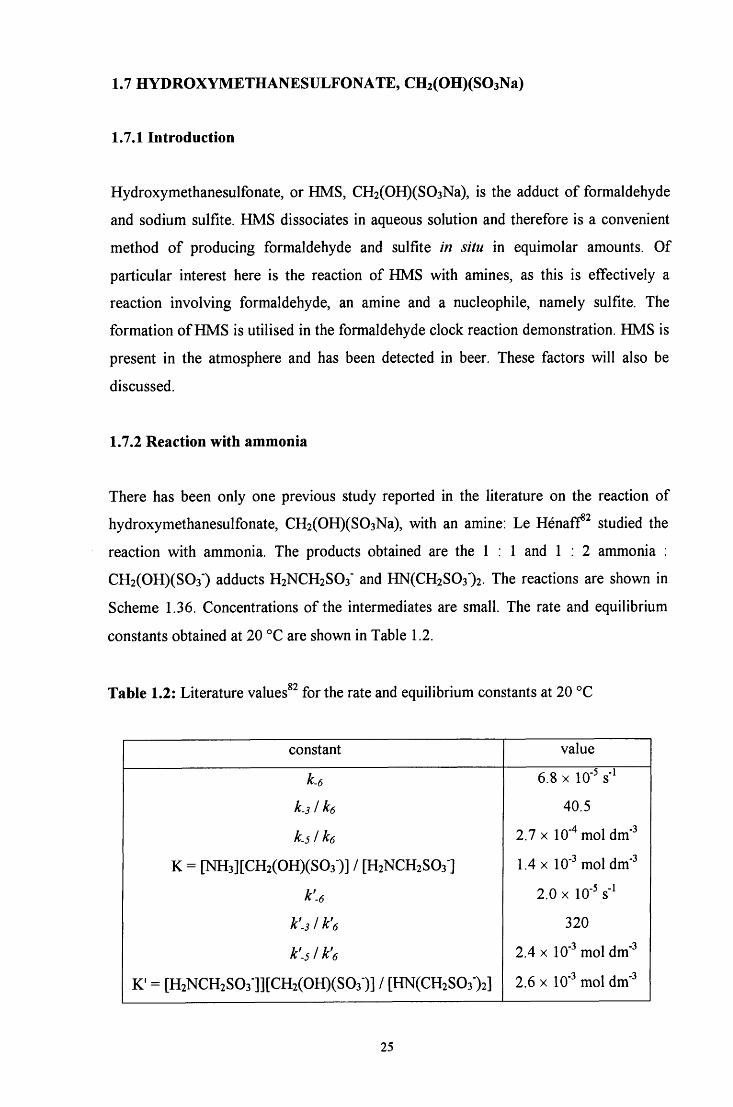
Table 1.2: Literature values^^ for the rate and equilibrium constants at 20 °C
constant value
k.6 6.8 X 10" s"
k.31 ke 40.5
k.51 ke 2.7 X lO'^mol dm"
K = [NH3][CH2(OH)(S03 )] / [H2NCH2SO3"] 1.4 X lO'^mol dm"
k'.6 2.0 X 10" s"
k'.s/k'e 320
k'.slk'e 2.4 X 10- mol dm'^
K' = [H2NCH2S03"]][CH2(OH)(S03 )] / [HN(CH2S03")2] 2.6 X 10" mol dm"
25
Scheme 1.36: NH3
CH2(0")(S03") SOj^" + HCHO HjNCHjOH
+ H >
+ -OH' H3NCH2OH
- H 2 ^ ,
+ 0 H ' k.3
+SO3""
H2N=CH2 H2NCH2S03" k.6
-S03^"
HCHO + H2NCH2S03' HN(CH2S03')(CH20H)
H2N(CH2S03")(CH20H)
^ H 2 0 • H 2 ^ ' .
+ 0 H ' k'.s
2-+SO3
+ k'e (CH2S03')NH=CH2 - — - HN(CH2S03")2
k'.6 -S03^'
Le Henaff states that the reaction is greatly retarded by the presence of free sulfite in the
system and suggests that formation of the 1 : 3 adduct, N(CH2S03')3, may also be
possible.
1.7.3 Occurrence
Several authors have postulated,^^ and later studies have confirmed,^"* that HMS can
exist in cloud water. For example, concentrations in excess of 3 x 10""* M have been
measured in fog water in California. "^ For HMS to be formed in cloud water it is
necessary that either low concentrations of oxidants or very high concentrations of
26
HCHO and S(IV)x species be present, such as is the case near combustion sources.
There must be low concentrations of oxidants as the formation of HMS from HCHO
and S(IV)x is slow relative to the oxidation of S(IV)x by hydrogen peroxide, H2O2, also
present in the atmosphere.
HMS is not oxidised by H2O2 or ozone. It is thought that once HMS is present in
cloud droplets it will persist until the cloud precipitates or evaporates. HMS has recently
been detected in atmospheric aerosol samples ^ indicating that it can also exist outside
of clouds.
HMS and other aldehyde - bisulfite adducts can inhibit free radical reactions in beer.
The acetaldehyde - bisulfite adduct has been detected during fermentation and in
commercial beers and has been shown to inhibit haze formation and flavour staling of
beer during storage. It has been postulated that aldehyde - bisulfite adducts such as
HMS have a radical scavenging activity and can prevent free radical oxidation chain
reactions during beer storage, leading to better stability of beer quality.
1.7.4 Formaldehyde clock reaction
Clock reactions involve the sudden appearance of a product some time after the initial
mixing of reagents. The term clock arises from the fact that at fixed concentrations and
constant temperature the appearance of the product occurs at a definite time after the
initial mixing. Reactions of this type are frequently used as demonstrations as the
endpoint is usually visually interesting.
The formaldehyde clock reaction forms the basis of several demonstrations and student
experiments. Aqueous solutions of formaldehyde and bisulfite / sulfite ions are mixed,
resulting in a dramatic rise in pH when the reaction nears completion. Any pH indicator
in the pH range 7 to 11, such as phenolphthalein, can be used to show the endpoint.
Many authors^^ have interpreted the reaction on the basis of a mechanism originally
suggested by Wagner^^ in 1929. He suggested that the reaction primarily being followed
^ S(IV)x = HSO3" + SOa ' + SO2.H2O + all other species where sulfur is in the +4 oxidation state, such as in metal complexes
27
was the reaction of HCHO with bisulfite ions, HSOa', to give HMS which was then
superseded by the reaction of HCHO with sulfite ions, SOa ", when all of the HSO3" had
reacted (Scheme 1.37).
Scheme 1.37: HCHO + HS03' CH2(OH)(S03 )
HCHO + S03^' — - CH2(0")(S03")
These reactions are slow compared to the reaction of bisulfite ions with hydroxide ions,
OH", to give sulfite ions and water, which is virtually instantaneous. When all of the
bisulfite ions have reacted, the OH" concentration will rise rapidly and the pH change
can be observed with a suitable indicator.
The colour change does coincide with the completion of bisulfite consumption.^^
However more recent research^^ suggests that above pH 4 the reaction is carried
primarily by sulfite ions as opposed to bisulfite ions. In aqueous solution formaldehyde
occurs mainly as the hydrate, methylene glycol, CH2(OH)2. The rate of HMS formation
is so much faster than the rate of dehydration of methylene glycol that the rate
determining step must be the latter under the usual formaldehyde clock laboratory
conditions.^^ To support this, the reaction is first order in free formaldehyde and zero
order in the combined initial bisulfite and sulfite ion concentration. Therefore the rate
constant associated with the formaldehyde clock reaction actually corresponds to the
dehydration of methylene glycol to give free formaldehyde, HCHO.
Burnett^^ laid out certain precautionary guidelines required in the choice of
concentrations and experimental procedures to follow for a successful formaldehyde
clock reaction. The ease of preparation of the reagents and the reproducibility of the
results make this experiment popular for demonstrations and basic chemistry classes.
28
1.8 AIMS
This work concerns the reaction of formaldehyde with amines with and without the
presence of sulfite, utilising anilines and benzylamines (RC6H4CH2NH2) as the amines.
The reaction with anilines produces aminomethanesulfonates which are industrially
important: the use of benzylamines provides a means of comparing aromatic versus
aliphatic systems using amines of similar structure. This work aims to:
• investigate the individual steps in the reaction
• study the reaction of formaldehyde with amines to give carbinolamines
• indirectly study the formation of imines of the type RN=CH2 by trapping the imine
with a nucleophile
• examine the possibility of polymerisation of RN=CH2 imines to give, for example,
1,3,5-hexahydrotriazines, and study the stability of these polymers in solution
• study the reaction of formaldehyde with amines in the presence of sulfite and
determine the effects of pH and structure of the anune
• study the decomposition of the aminomethanesulfonate products
• determine the overall rate determining step in the reaction of formaldehyde with
amines in the presence of sulfite
Formaldehyde and sulfite can be introduced into the system using
hydroxymethanesulfonate, CH2(OH)(S03Na). This has the advantage of avoiding the
use of aqueous formaldehyde solution, where formaldehyde is predominantly in the
form of methylene glycol rather than the reactive free HCHO form. As the kinetics and
mechanism of the decomposition of CH2(OH)(S03Na) has not previously been reported
in detail, it has been investigated here.
29
1.9 R E F E R E N C E S
1. (a) B. Capon, Org. React Mech, 1975, 1; (b) M. M. Sprung, Chem. Rev., 1940, 26,
297; (c) W. P. Jencks, Progr. Phys. Org. Chem., 1964, 2, 63; (d) R. Bonnett, 'The
Chemistry of the Carbon Nitrogen Double Bond', Ed. S. Patai, Interscience,
London, 1970, pp. 64
2. R. W. Layer, Chem. Rev., 1963, 63, 489
3. (a) W. R. Abrams and R. G. Kallen, J. Am. Chem. Soc, 1976, 98, 7777; (b) ibid.,
7789
4. (a) R. G. Kallen, R. O. Viale and L. K. Smith, J. Am. Chem. Soc, 1972, 94, 576; (b)
I . M . C. Brighente, L. R. Vottero, A. J. Terezani and R. A. Yunes, J. Phys. Org.
Chem., 1991, 4, 107; (c) I . M. C. Brighente and R. A. Yunes, J. Braz. Chem. Soc,
1997, 8, 549; (d) R. Wolfenden and W. P. Jencks, J. Am. Chem. Soc, 1961, 83,
2763
5. R. G. Kallen and W. P. Jencks, J. Biol. Chem., 1966, 241, 5864
6. (a) E. E. Snell and W. T. Jenkins, J. Cell. Comp. Physiol, 1959, 54, 161; (b) D. E.
Metzler, M . Ikawa and E. E. Snell, J. Am. Chem. Soc, 1954, 76, 648; (c) G. A.
Hamilton and F. H. Westheimer, ibid, 1959, 81, 6332; (d) W. P. Jencks, 'Catalysis
in Chemistry and Enzymology', Dover, New York, 1987; (e) A. E. Braunstein. 'The
Enzymes', Vol. 2, Eds. P. D. Boyer, H. Lardy and K. Myrback, Academic Press,
Inc., New York, 1960, p. 113; (f) E. E. Snell, 'The Mechanism of Action of Water-
soluble Vitamins', Little, Brown And Co., Boston, Mass., 1961, p. 18; (g) I .
Fridovich and F. H. Westheimer, J. Am. Chem. Soc, 1962, 84, 3208; (h) E. Grazi, T.
Cheng and B. L. Horecker, Biochem. Biophys. Res. Commun., 1962, 7, 250; (i) E.
Grazi, P. T. Rowley, T. Cheng, O. Tchola and B. L. Horecker, ibid, 9, 38
7. (a) R. A. Morton and G. A. J. Pitt, Prog Chem. Org Nat. Prod, 1957, 14, 244; (b)
R. Hubbard, Proc. Natl Phys. Lab., London, Symp. No. 8, 1958, 151
8. (a) S. J. Benkovic, P. A. Benkovic and D. R. Comfort, J. Am. Chem. Soc, 1969, 91,
1860; (b) J. W. Stanley, J. G. Beasley and I . W. Mathison, J. Org Chem., 1972, 37,
3746
30
9. S. F. Dyke, 'The Chemistry of Enamines', Cambridge University Press, London,
1973
10. (a) D. Craig, L. Schaefgen and W. P. Tyler, J. Am. Chem. Soc, 1948, 70, 1624; (b)
G. O. Dudek and R. H. Holm, ibid, 1961, 83, 3914; (c) T. M . Patrick, Jr., ibid,
1952, 74, 2984; (d) M . Saunders and E. H. Gold, J. Org. Chem., 1962, 27, 1439
11. R. McGrindle and A. J. McAlees, J. Chem. Soc, Chem. Commun., 1983, 61
12. H. Schiff, Ann., 1864,131, 118
13. (a) E. Barrett and A. Lapworth, J. Chem. Soc, 1908, 93, 85; (b) J. B. Conant and P.
D. Bartlett, J. Am. Chem. Soc, 1932, 54, 2881; (c) F. H. Westheimer, ibid, 1934,
56, 1962; (d) A. Olander, Z Physik Chem., 1927, 129, 1; (e) W. P. Jencks, J. Am.
Chem. Soc, 1959, 81, 475; (f) E. H. Cordes and W. P. Jencks, ibid, 1962, 84, 832;
(g) J. E. Reimann, W. P. Jencks, ibid, 1966, 88, 3973; (h) L. do Amaral, W. A.
Sandstrom and E. H. Cordes, ibid, 2225; (i) B. M . Anderson and W. P. Jencks,
ibid, 1960, 82, 1773; (j) A. V. Willi, Helv. Chim. Acta, 1956, 39, 1193; (k) J. M.
Sayer and W. P. Jencks, J. Am. Chem. Soc, 1973, 95, 5637; (1) A. Williams and M.
L. Bender, J. Am. Chem. Soc, 1966, 88, 2508
14. (a) L. P. Hammett, 'Physical Organic Chemistry', McGraw-Hill Book Co. Inc., New
York, 1940, p. 333; (b) G. H. Stempel, Jr., and G. S. Schaffel, J. Am. Chem. Soc,
1944,66, 1158;(c)Ref 13b
15. (a) Ref 13e - i ; (b) A. S. Stachissini and L. do Amaral, J. Org. Chem., 1991, 56,
1419; (c)Ref Ic
16. (a) J. M . Sayer, B. Pinsky, A. Schonbrunn and W. Washtein, J. Am. Chem. Soc,
1974, 96, 7998; (b) S. Rosenberg, S. M. Silver, J. M . Sayer and W. P. Jencks, J. Am.
Chem. Soc, 1974, 96, 7986; (c) J. Hine, F. A. Via, J. K. Gotkis and J. C. Craig, Jr.,
ibid, 1970, 92, 5186; (d) J. M. Sayer and W. P. Jencks, J. Am. Chem. Soc, 1972,
94, 3262; (e) H. Diebler and R. N. F. Thomeley, ibid, 1973, 95, 896
17. (a) N. E. Hall and B. J. Smith, J. Phys. Chem., 1998,102A, 4930; (b) I . H. Williams,
J. Am. Chem. Soc, 1987, 109, 6299
31
18. (a) R. Fett, E. L. Simionatto and R. A. Yunes, J. Phys. Org. Chem., 1990, 3, 620; (b)
I . M . C. Brighente, R. M . Budal and R. A. Yunes, J. Chem. Soc, Perkin Trans 2,
1991, 861;(c)Ref 16a
19. (a) M . Calzadilla, A. Malpica and P. M . Diaz, Int. J. Chem. Kinetics, 1996, 28, 687;
(b) A. Malpica, M . Calzadilla, J. Baumrucker, J. Jimenez, L. Lopez, G. Escobar and
C. Montes, J. Org. Chem., 1994, 59, 3398; (c) P. Sojo, F. Viloria, L. Malave, R.
Possamia, M . Calzadilla, J. Baumrucker, A. Malpica, R. Moscovici and L. do
Amaral, Am. Chem. Soc, 1976, 98, 4519
20. (a) Ref 13a, b, e, f, h, 1; (b) E. H. Cordes and W. P. Jencks, J. Am. Chem. Soc,
1962, 84, 4319; (c) D. H. R. Barton, R. E. O'Brien and S. Stemhall, J. Chem. Soc,
1962, 470
21. R. G. Kallen, J. Am. Chem. Soc, 1971, 93, 6236
22. E. H. Cordes and W. P. Jencks, J. Am. Chem. Soc, 1962, 84, 826
23. (a) S. Eldin and W. P. Jencks, J. Am. Chem. Soc, 1995, 117, 4851; (b) ibid, 9415;
(c) W. P. Jencks, J. Phys. Org Chem., 1996, 9, 337; (d) S. Eldin, J. A. Digits, S.-T.
Huang and W. P. Jencks, J. Am. Chem. Soc, 1995, 117, 6631; (e) C. K. Kim, 1. Y.
Lee, C. K. Kim and I . Lee, J. Phys. Org Chem., 1999, 12, 479
24. G. Distefano, A. G. Giumanini, A. Modelli and G. Poggi, J. Chem. Soc, Perkin
Trans. 2, 1985, 1623
25. G. Verardo, S. Cauci and A. G. Giumanini, J. Chem Soc, Chem. Commun., 1985,
24, 1787
26. J. Schmeyers, F. Toda, J. Boy and G. Kaupp, J. Chem. Soc, Perkin Trans. 2, 1998,
989
27. R. Bonnett, 'The Chemistry of the Carbon Nitrogen Double Bond', Ed. S. Patai,
Interscience, London, 1970, pp. 255
28. J. Hine, J. C. Craig, Jr., J. G. Underwood and F. A. Via, J. Am. Chem. Soc, 1970,
92, 5194
32
29. (a) Ref 13f, k; (b) K. Koehler, W. Sandstrom and E. H. Cordes, J. Am. Chem. Soc,
1964, 86, 2413
30. (a) W. P. Jencks, 'Catalysis in Chemistry and Enzymology', Dover, New York,
1987, pp. 490 - 496; (b) M . A. E. D. ElTaher, J. Solution. Chem., 1996, 25, 401; (c)
M . Brault, R. M . Pollack and C. L. Bevins, J. Org Chem., 1976, 41, 346; (d) E. H.
Cordes and W. P. Jencks, J. Am. Chem. Soc, 1963, 85, 2843; (e) Ref 13f; (f) Ref
29b
31. (a) Ref 13k; (b) R. L. Reeves, J. Am. Chem. Soc, 1962, 84, 3332
32. (a) M . Tramontini and L. Angiolini, Tetrahedron, 1990, 46, 1791; (b) F. F. Blicke,
Organic Reactions, 1942, 1, 303; (c) H. O. House, 'Modem Synthetic Reactions',
2nd Ed., W. A. Benjamin, Inc., Philippines, 1972, pp 654 - 660
33. (a) K. Bodendorf and G Koralewski, Arch Pharm., 1933, 271, 101; (b) S. V.
Lieberman and E. C. Wagner, J. Org. Chem., 1949,14, 1001
34. (a) E. R. Alexander and E. J. Underbill, J. Am. Chem. Soc, 1949, 71, 4014; (b) T. F.
Cummings and J. R. Shelton, J. Org. Chem., 1960, 25, 419; (c) J. E. Fernandez and
J. S. Fowler, ibid, 1964, 29, 402; (d) J. E. Fernandez, J. S. Fowler and S. J. Glaros,
ibid, 1965, 30, 2787; (e) D. N. Kirk and V. Petrow, J. Chem. Soc, 1962, 1091; (f)
M . Masui, K. Fujita and H. Ohmori, Chem. Commun., 1970, 13, 182; (g) H. Volz
and H. H. Kiltz, Tetrahedron Letters, 1970, 22, 1917
35. J. March, 'Advanced Organic Chemistry', Wiley-Interscience, New York, 1992, 4th
Ed., p. 901
36. R. Robinson, Chem. Soc, 1917, 111, 762
37. For example: (a) H. Bungaard, Methods in Enzymology, 1985, 112, 347; (b) J. R.
Dimmock, S. K. Raghavan, B. M . Logan and G. E. Bigam, Eur. J. Med. Chem.,
1983, 18, 249
38. M . Tramontini, L Angiolini and N. Ghedini, Polymer, 1988, 29, 771
39. Recent examples include: (a) M. Przeslawska, A. Koll and M . Witanowski, J. Phys.
Org Chem., 1999, 12, 486; (b) M. Arend and N. Risch, Tet. Letters, 1999, 40, 6205;
33
(c) N . Su, J. S. Bradshaw, P. B. Savage, K. E. Krakowiak, R. M . Izatt, S. L. DeWall
and G. W. Gokel, Tet, 1999, 55, 9737; (d) F. P. Tseng, F. C. Chang, S. F. Lin and J.
J. Lin, J. Appl. Poly. Sci., 1999, 71, 2129; (e) I . Ripoche, J. L. Canet, B. Aboab, J.
Gelas and Y. Troin, J. Chem. Soc, Perkin Trans. J, 1998, 20, 3485
40. A. Strecker, Liebigs Ann. Chem., 1850, 75, 27
41. (a) J. March, 'Advanced Organic Chemistry', Wiley-Interscience, New York, 1992,
4th Ed., p. 965; (b) D.K. Crump, for The Dow Chemical Company, E. P. 0 481 394
B l ; (c) K. Mai and G. Patil, Synth. Commun., 1985, 15, 157; (d) Tetrahedron Letts.,
1984, 25, 4583
42. D. B. Luten, J. Org Chem., 1938, 3, 588
43. (a) Y. Ogata and A. Kawasaki, J. Chem. Soc, B, 1971, 325; (b) T. D. Stewart and C.
L i , J. Am. Chem. Soc, 1938, 60, 2782; (c) J. Taillades and A. Commeyras,
Tetrahedron, 1974, 30, 2493; (d)Ref 8b
44. G. Moutou, J. Taillades, S. Benefice-Malouet, A. Commeyras, G. Messina and R.
Mansani, J. Phys. Org Chem., 1995, 8, 721
45. G. Schlesinger and S. L. Miller, J. Am. Chem. Soc, 1973, 95, 3729
46. W. Reenstra, R. H. Abeles and W. P. Jencks, Am. Chem. Soc, 1982, 104, 1019
47. (a) M . Bejaud, L. Mion, J. Taillades and A. Commeyras, Tetrahedron, 1975, 31,
403; (b) R. M . Williams, 'Synthesis of Optically Active a-Amino Acids', Pergamon
Press, New York, 1989, p. 208
48. (a) J. Sansoulet and C. Tackx, C R. Acad Sci., 1960, 250, 4370; (b) W. H. Taylor
and C. R. Hauser, J. Am. Chem. Soc, 1960, 82, 1960
49. Recent examples include: (a) R. H. Dave and B. D. Hosangadi, Tet., 1999, 55,
11295; (b) P. Portonovo, B. Liang and M. M. Joullie, Tet.-Asymmetry, 1999, 10,
1451; (c) K. P. Fondekar, F. J. Volk and A. W. Frahm, ibid. 111; (d) M.
BoisChoussy and J. P. Zhu, J. Org Chem., 1998, 63, 5662; (e) J. T. Edward and F.
L. Chubb, Proc. R. Ir. Acad, 1983, 83B, 57
34
50. W. P. Jencks, 'Catalysis in Chemistry and Enzymology', Dover, New York, 1987,
p. 505 - 506
51. (a) B. A. Porai-Koshits and A. L. Remizov, Prob. Mekhanizma Org. Reaktsii, Akad.
Nauk Ukr. SSR, Otdel Fizmat. i Khim. Nauk, 1953, 238; Chem. Abstr., 1956, 50,
16686; (b) Ref 50; (c)Ref 2
52. (a) J. Graymore, J. Chem. Soc, 1932, 1353; (b) J. G. Miller and E. C. Wagner, J.
Am. Chem. Soc, 1932, 54, 3698; (c) E. Zangrando, G. Poggi, A. G. Giumanini and
G. Verardo, J. f . prakt. Chem., 1987, 329, 195
53. (a) Ref 52b; (b) H. Krassig and H. Ringsdorf, Makromol. Chem., 1957, 22, 163; (c)
R. Carpignano, V. Bersano and A. Recorsio, Ann. Chim., Rome, 1959, 49, 1593
54. L. Randaccio, E. Zangrando, M. H. Gei and A. G. Giumanini, J. f . prakt. Chem.,
1987, 329, 187
55. (a) J. F. Walker, 'Formaldehyde', American Chemical Society Monograph,
Reinhold Publishing, New York, 1964, 3rd Ed., pp 511 - 551; (b) E. M . Smolin and
L. Rapoport, 'The Chemistry of Heterocyclic Compounds: 5-Triazines and
Derivatives', Interscience Publishers Ltd., London, 1959, pp 545 - 596; (d) H. H.
Richmond, G S. Myers and G. F. Wright, J. Am. Chem. Soc, 1948, 70, 3659; (e) A.
T. Nielsen, D. W. Moore, M . D. Ogan and R. L. Atkins, Org. Chem., 1979, 44,
1678
56. E. Gartner and A. Kock, U.S. Patent 2365405, 1944
57. (a) Ciba Ltd., Swiss Patent, 1953, 294228; (b) H. Berthold, M . Fedke and W.
Pritakow, Germ. (East) Patent, 1971, 94397
58. M . G. Neumann and R. A. M. C. De Groote, J. Pharm. Set, 1978, 67, 1283
59. R. A. M . C. De Groote, and M. G. Neumann, Ciencia e Cultura, 1977, D2.3, 63
60. (a) Y. Kurono, K. Ikeda and K. Uekama, Chem. Pharm. Bull, 1975, 23, 409; (b) W.
Ackerman, Proc. Soc. Expt. Biol Med, 1952, 80, 362; (c) R. L. Thompson, J.
Immun., 1947, 55, 347; (d) L. Neelakantan and W. H. Hartung, J. Org Chem., 1959,
24, 1943
35
61. J. E. Orloff, 'Formaldehyde', 1909, Liebzig, Barth, p. 45
62. (a) T. M . Gorrie, S. K. Raman, H. K. Rouette and H. Zollinger, Helv. Chim. Acta,
1973, 56, 175; (b) P. Skell and H. Suhr, Ber., 1961, 94, 3317
63. (a) M . Wadano, C. Trogus and K. Hess, Chem. Ber., 1934, 67, 174; (b) A. Skarbal
and R. Leutner, Oesterr. Chem. Z , 1937, 40, 235; (c) H. Hasse and G. Maurer, Ind.
Eng. Chem. Res., 1991, 30, 2195; (d) H. C. Sutton and T. M . Downes, J. Chem.
Soc, Chem. Comm., 1972, 1
64. A. Iliceto, S. Bezzi, N . Dallaporta and G. Giacommetti, Gazz. Chim. Ital, 1951, 81,
915
65. M . Baccaredda, Gazz. Chim. Ital., 1947, 78, 735
66. J. F. Walker, 'Formaldehyde', American Chemical Society Monograph, Reinhold
Publishing, New York, 1964, 3rd Ed.
67. (a) R. Bieber and G. TrQmpler, Helv. Chim. Acta, 1947, 30, 706; (b) Ref. 63 a
68. W. S. Hinegardner, E. I . du Pont de Nemours & Co., Inc., U. S. Patent 2002243,
1935
69. (a) H. M . Kvalnes, E. I . du Pont de Nemours & Co., Inc., U. S. Patent 2476212,
1949; Reissue 23, 174, 1949; (b) J. F. Walker, E. I . du Pont de Nemours & Co., Inc.,
U. S. Patent 2488363, 1949
70. R. C. Swain and P. Adams, American Cyanamid Co., U. S. Patent 2237092, 1942
71. (a) M . Delepine, Compt. Rend, 1897, 124, 1528; (b) H. Staudinger, R. Signer, H.
Johner, M . Luthy, W. Kern, D. Russidis and O. Schweitzer, Ann., 1929, 474, 241
72. K. Moedritzer and J. R. van Wazer, J. Phys. Chem., 1966, 70, 2025
73. M . Wadano, Ber., 1934, 67, 191
74. R.P.Bell, Adv. Phys. Org. Chem., 1966, 1
75. P. Valenta, Coll. Czech. Chem. Commun., 1960, 25, 853
36
76. (a) R. P. Bell and W. C. E. Higginson, Proc. Roy. Soc, 1949, 197A, 141; (b) M.
Eigen, Discuss. Faraday Soc, 1965, 39, 7; (c) R. P. Bell and P. G. Evans, Proc.
Roy Soc. London, Ser. A, 1966, 291, 297; (d) Ref. 74
77. R. P. Bell and D. P. Onwood, Trans. Faraday Soc, 1962, 58, 1557
78. L. H. Funderburk, L. Aldwin and W. P. Jencks, J. Am. Chem. Soc, 1978, 100, 5444
79. J. Buchi, Pharm. ActaHelv., 1931, 6, 1
80. (a) G. Lemme, Chem. Ztg., 1903, 27, 896; (b) S. S. Sadtler, Am. J. Pharm., 1904,
76, 84; (c) A. Seyewetz and H. Gibello, Bull. Soc. Chim., 1904, 31, 691
81. P. Borgstrom, J. Am. Chem. Soc, 1923, 45, 2150
82. Le HenafF, C R. Acad. Set, 1963, 256, 3090
83. (a) Y. Katagiri, N . Sawaki, Y. Arai, H. Okochi and M . Igawa, Chem. Letts., 1996, 3,
197; (b) J. W. Munger, D. J. Jacob and M . R. Hoffmann, J. Atmos. Chem., 1984, 1,
335; (c) J. W. Munger, D. J. Jacob, J. M. Waldman and M . R. Hoffmann, J.
Geophys. Res., 1983, 88, 5109; (d) L. W. Richards, J. A. Anderson, D. L.
Blumenthal, J. A. McDonald, G. L. Kok and A. L. Lazrus, Atmos. Environ., 1983,
17, 911
84. (a) X. Rao and J. L. Collett, Environ. Sci. and Technol, 1995, 29, 1023; (b) E. G.
Chapman, C. J. Barinaga, H. R. Udseth and R. D. Smith, Atmos. Environ., A, 1990,
24, 2951; (c) J. W. Munger, C. Tiller and M. R. Hoffmann, Science, 1990, 86, 545;
(d) C. C. Ang, F. Lipari and S. J. Swarin, Environ. Sci. Technol., 1987, 21, 102; (e)
J. W. Munger, C. Tiller and M . R. Hoffmann, Science, 1986, 231, 247
85. (a) G. L. Kok, S. N. Gitlin and A. L. Lazrus, J. Geophys. Res., 1986, 91, 2801; (b) J.
Hoigne, H. Bader, W. R. Haag and J. Staehelin, Water Res., 1985, 19, 993
86. (a) R. W. Dixon and H. Aasen, Atmos. Environ., 1999, 33, 2023; (b) K. R.
Neubauer, S. T. Sum, M. V. Johnston and A. S. Wexler, J. Geophys. Res., D, 1996,
101, 18701
37
87. (a) H. Kaneda, M . Takashio, T. Osawa, S. Kawakishi, S. Koshino and T. Tamaki, J.
Food Science, 1996, 61, 105; (b) H. Kaneda, M. Takashio, T. Osawa, S. Kawakishi
and T. Tamaki, J. Am. Soc. Brewing Chemists, 1996, 54, 115
88. H. Kaneda, T. Osawa, S. Kawakishi, M. Munekata and S. Koshino, Agricultural
and Food Chem., 1994, 42, 2428
89. (a) D. O. Cooke, 'Inorganic Reaction Mechanisms', The Chemical Society, London,
1979, p. 71; (b) T. Cassen, J. Chem. Educ, 1976, 53, 197; (c) P. Jones and K. B.
Oldham, J. Chem. Educ, 1963, 40, 366; (d) D. G. Chisman, Sch. Set Rev., 1956, 38,
100
90. C. Wagner, Ber., 1929, 62, 2873
91. P. Warneck, J. Chem. Educ., 1989, 66, 334
92. S. D. Boyce, M . R. Hoffmann, J. Phys. Chem., 1984, 88, 4740
93. M . G. Burnett, J. Chem. Educ., 1982, 59, 160
38
CHAPTER 2
Reaction of formaldehyde with aniline and
aniline derivatives
C H A P T E R 2: Reaction of formaldehyde with aniline and aniline derivatives
2.1 INTRODUCTION
The condensation of formaldehyde with aniline has been examined by a number of
authors, mainly from a synthetic viewpoint. The products of the reaction depend on the
pH of the reaction medium.
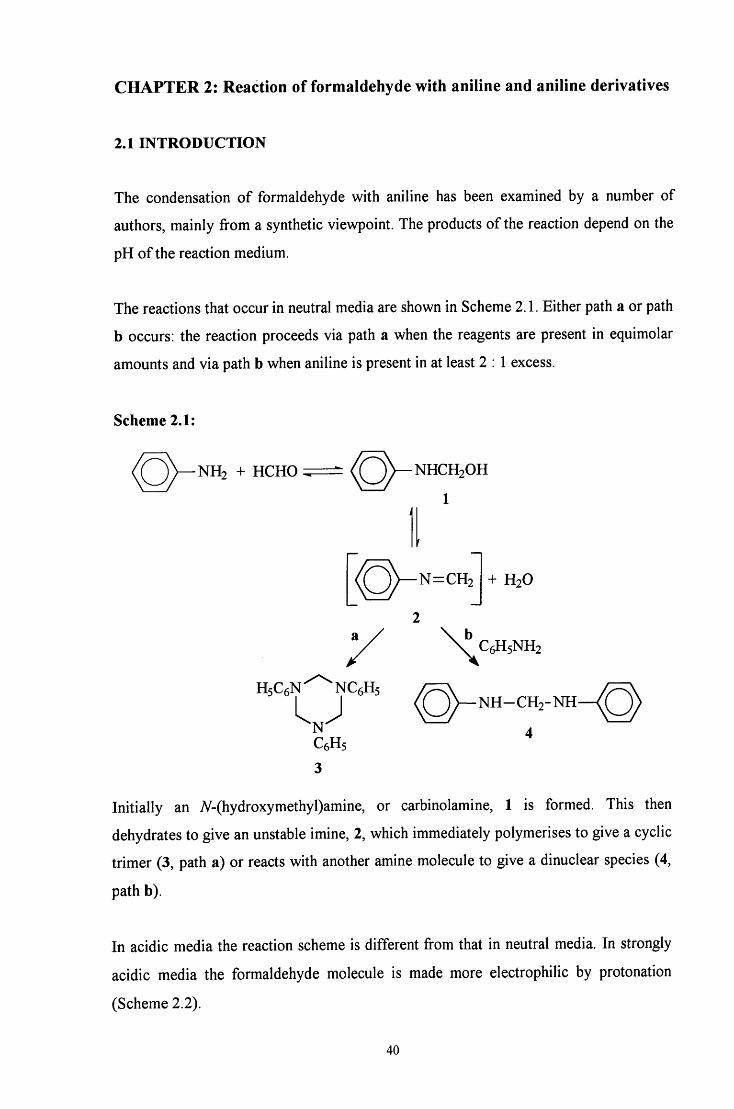
The reactions that occur in neutral media are shown in Scheme 2.1. Either path a or path
b occurs: the reaction proceeds via path a when the reagents are present in equimolar
amounts and via path b when aniline is present in at least 2 : 1 excess.
Scheme 2.1:
< ^ ^ ^ N H 2 + HCHO ^ NHCH2OH
CH2 + H2O
C6H5NH2
HsCeN^^NCgHs
C6H5
c h 2 - n h - h Q )
4
Initially an A^-(hydroxymethyl)amine, or carbinolamine, 1 is formed. This then
dehydrates to give an unstable imine, 2, which immediately polymerises to give a cyclic
trimer (3, path a) or reacts with another amine molecule to give a dinuclear species (4,
path b).
In acidic media the reaction scheme is different from that in neutral media. In strongly
acidic media the formaldehyde molecule is made more electrophilic by protonation
(Scheme 2.2).
40
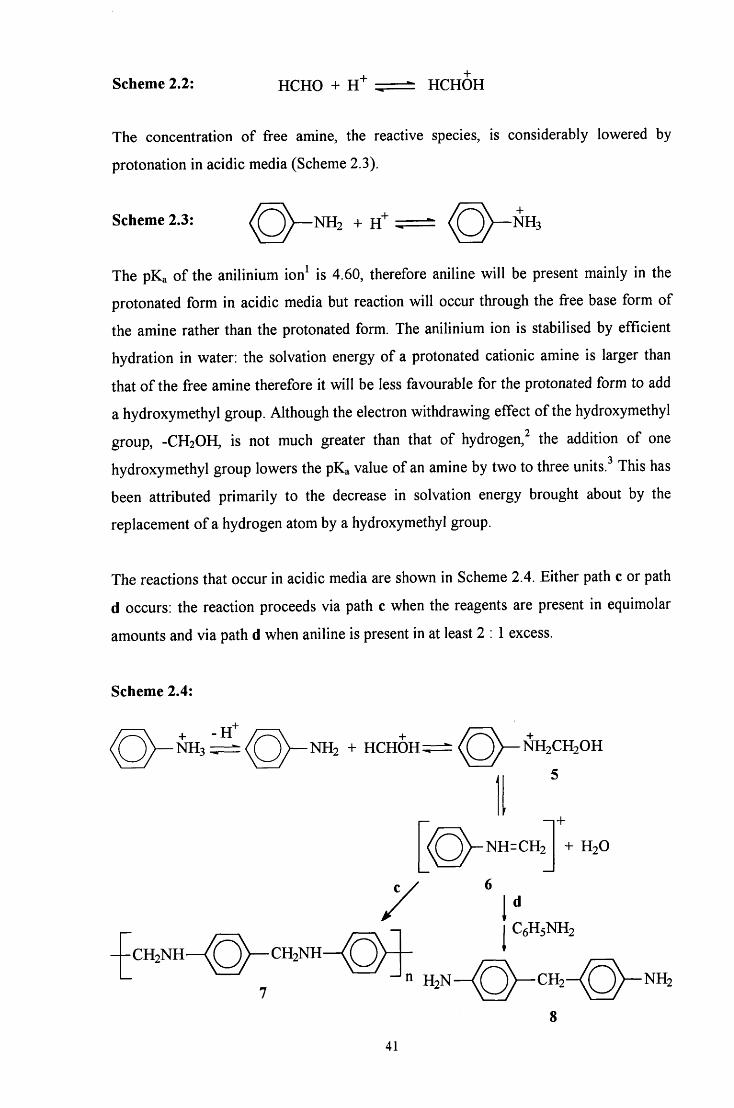
Scheme 2.2: H C H O + H ' H C H O H
The concentration of free amine, the reactive species, is considerably lowered by
protonation in acidic media (Scheme 2.3).
Scheme 2.3: NH2 + 'Oh NH3
The pKa of the anilinium ion^ is 4.60, therefore aniline will be present mainly in the
protonated form in acidic media but reaction will occur through the free base form of
the amine rather than the protonated form. The anilinium ion is stabilised by efficient
hydration in water: the solvation energy of a protonated cationic amine is larger than
that of the free amine therefore it will be less favourable for the protonated form to add
a hydroxymethyl group. Although the electron withdrawing effect of the hydroxymethyl
group, -CH2OH, is not much greater than that of hydrogen,^ the addition of one
hydroxymethyl group lowers the pKa value of an amine by two to three units.^ This has
been attributed primarily to the decrease in solvation energy brought about by the
replacement of a hydrogen atom by a hydroxymethyl group.
The reactions that occur in acidic media are shown in Scheme 2.4. Either path c or path
d occurs: the reaction proceeds via path c when the reagents are present in equimolar
amounts and via path d when aniline is present in at least 2 : 1 excess.
Scheme 2.4:
< ( ^ ^ N H 3 ^ < ^ ) — N H 2 + H C H O H ^ < ( ^ ) ^ N H 2 C H 2 0 H
— C H 2 N H - H ^ ^ ) ^ C H 2 N H — < ^
- 1 +
NH=CH2
6
+ H2O
d
C6H5NH2
n H 2 N - ^ P ; K C H 2 - < ^ - NH9
41
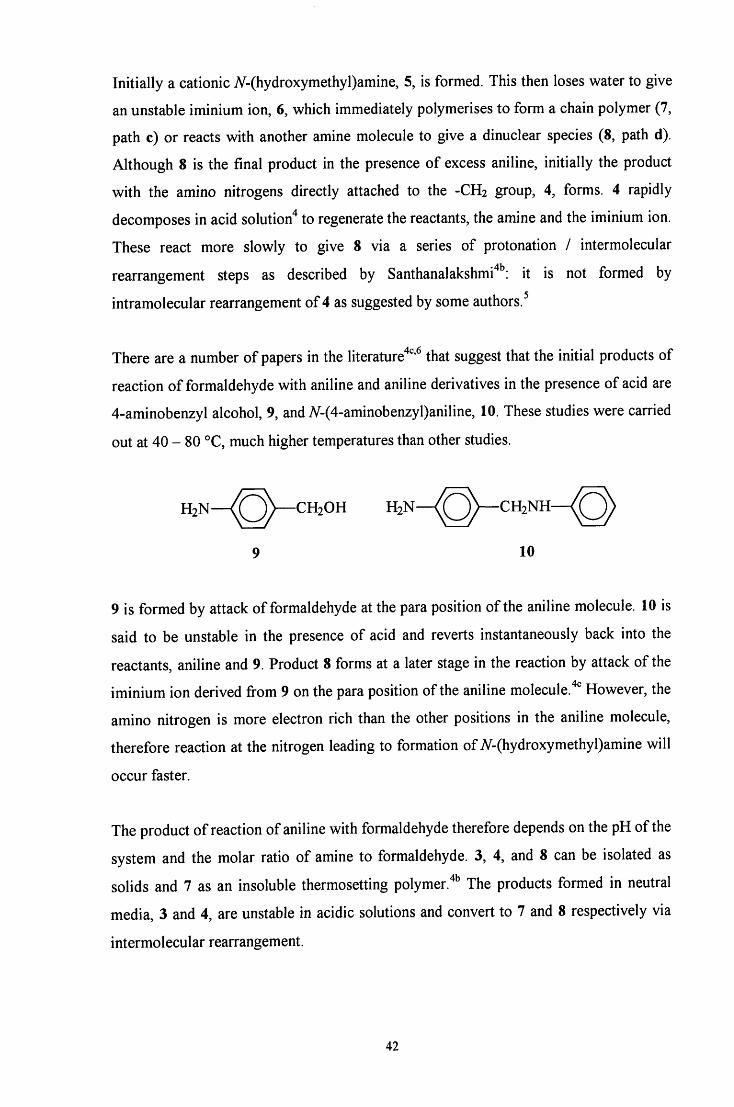
Initially a cationic 7V-(hydroxymethyl)amine, 5, is formed. This then loses water to give
an unstable iminium ion, 6, which immediately polymerises to form a chain polymer (7,
path c) or reacts with another amine molecule to give a dinuclear species (8, path d).
Although 8 is the final product in the presence of excess aniline, initially the product
with the amino nitrogens directly attached to the -CH2 group, 4, forms. 4 rapidly
decomposes in acid solution"^ to regenerate the reactants, the amine and the iminium ion.
These react more slowly to give 8 via a series of protonation / intermolecular
rearrangement steps as described by Santhanalakshmi'*'': it is not formed by
intramolecular rearrangement of 4 as suggested by some authors.^
There are a number of papers in the literature'*' ' that suggest that the initial products of
reaction of formaldehyde with aniline and aniline derivatives in the presence of acid are
4-aminobenzyl alcohol, 9, and A'-(4-aminobenzyl)aniline, 10. These studies were carried
out at 40 - 80 °C, much higher temperatures than other studies.
H 2 N - H ( ^ ) — C H 2 O H H 2 N — C H 2 N H — ^ ( ^ ^
9 10
9 is formed by attack of formaldehyde at the para position of the aniline molecule. 10 is
said to be unstable in the presence of acid and reverts instantaneously back into the
reactants, aniline and 9. Product 8 forms at a later stage in the reaction by attack of the
iminium ion derived from 9 on the para position of the aniline molecule.'*'' However, the
amino nitrogen is more electron rich than the other positions in the aniline molecule,
therefore reaction at the nitrogen leading to formation of 7V-(hydroxymethyl)amine will
occur faster.
The product of reaction of aniline with formaldehyde therefore depends on the pH of the
system and the molar ratio of amine to formaldehyde. 3, 4, and 8 can be isolated as
solids and 7 as an insoluble thermosetting polymer.'*^ The products formed in neutral
media, 3 and 4, are unstable in acidic solutions and convert to 7 and 8 respectively via
intermolecular rearrangement.
42
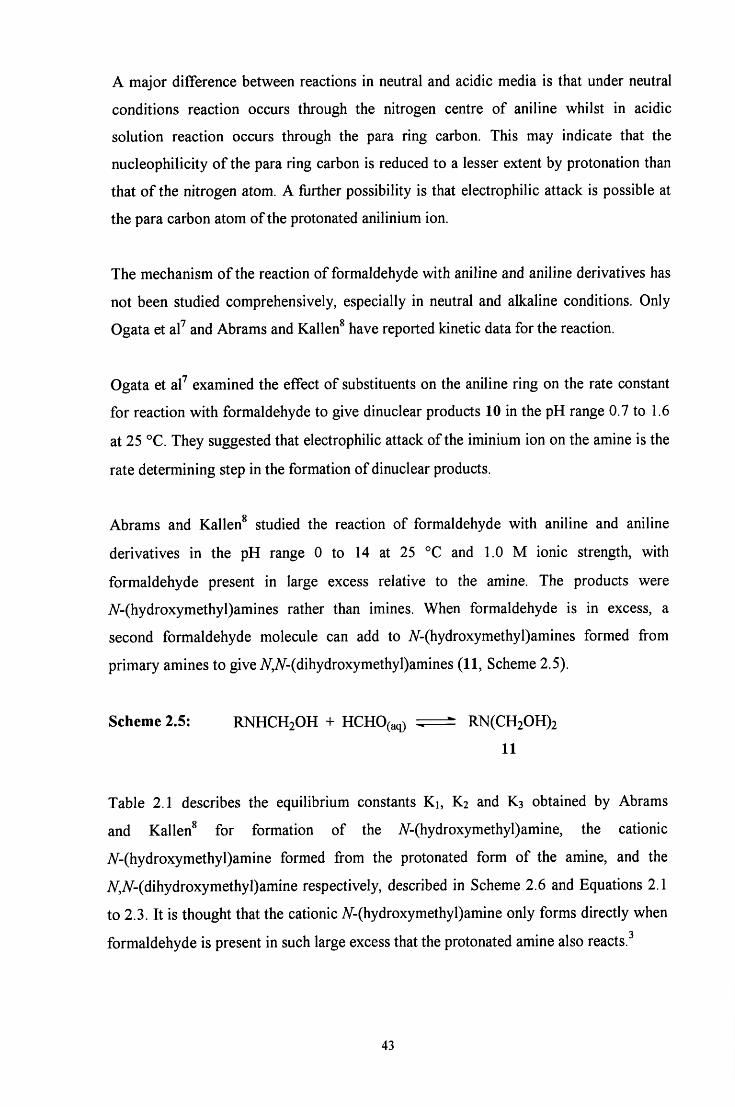
A major difference between reactions in neutral and acidic media is that under neutral
conditions reaction occurs through the nitrogen centre of aniline whilst in acidic
solution reaction occurs through the para ring carbon. This may indicate that the
nucleophilicity of the para ring carbon is reduced to a lesser extent by protonation than
that of the nitrogen atom. A further possibility is that electrophilic attack is possible at
the para carbon atom of the protonated anilinium ion.
The mechanism of the reaction of formaldehyde with aniline and aniline derivatives has
not been studied comprehensively, especially in neutral and alkaline conditions. Only 1 ft
Ogata et al and Abrams and Kallen have reported kinetic data for the reaction.
Ogata et aP examined the effect of substituents on the aniline ring on the rate constant
for reaction with formaldehyde to give dinuclear products 10 in the pH range 0.7 to 1.6
at 25 °C. They suggested that electrophilic attack of the iminium ion on the amine is the
rate determining step in the formation of dinuclear products.
Abrams and Kallen studied the reaction of formaldehyde with aniline and aniline
derivatives in the pH range 0 to 14 at 25 °C and 1.0 M ionic strength, with
formaldehyde present in large excess relative to the amine. The products were
7V-(hydroxymethyl)amines rather than imines. When formaldehyde is in excess, a
second formaldehyde molecule can add to 7V-(hydroxymethyl)amines formed from
primary amines to giveiV,7V-(dihydroxymethyl)amines (11, Scheme 2.5).
Scheme 2.5: RNHCH2OH + HCHO(aq) RN(CH20H)2
11
Table 2.1 describes the equilibrium constants K i , K2 and K3 obtained by Abrams
and Kallen^ for formation of the A^-(hydroxymethyl) amine, the cationic
7V-(hydroxymethyl)amine formed from the protonated form of the amine, and the
A^,A^-(dihydroxymethyl)amine respectively, described in Scheme 2.6 and Equations 2.1
to 2.3. It is thought that the cationic A/-(hydroxymethyl)amine only forms directly when
formaldehyde is present in such large excess that the protonated amine also reacts.
43
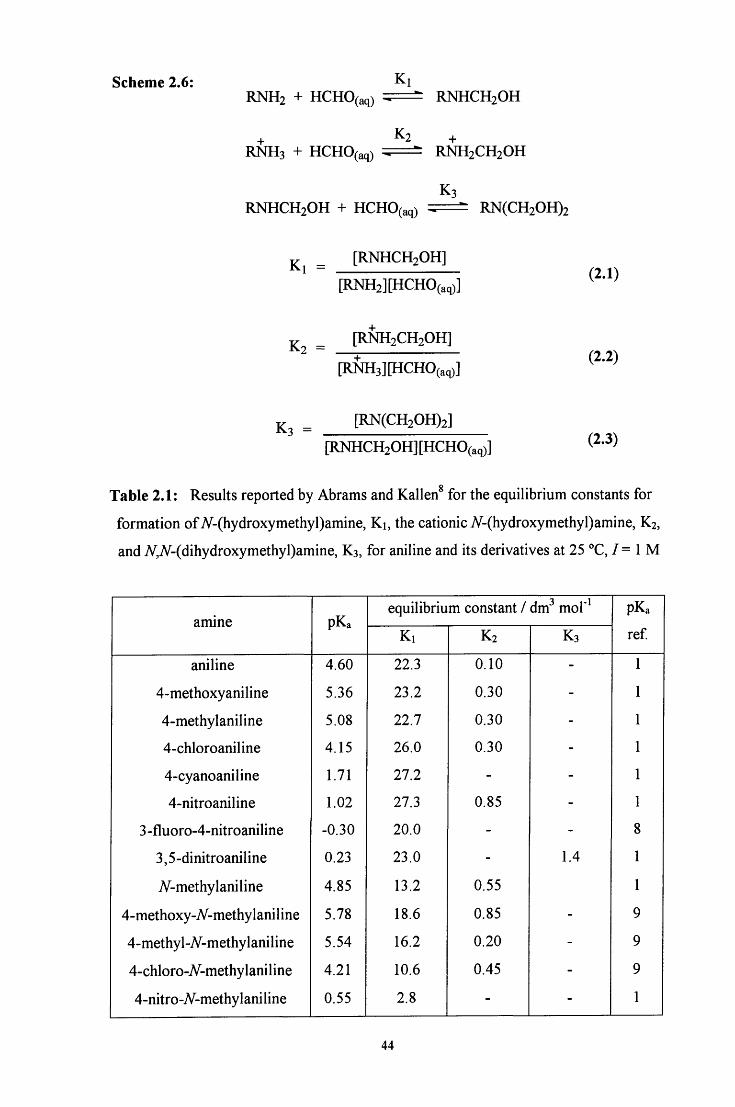
Scheme 2.6: K, RNH2 + HCHO(aq) = ^ RNHCH2OH
+ K2 + RNH3 + HCHO(aq) RNH2CH2OH
RNHCH2OH + HCHO(aq) K3
RN(CH20H)2
^ ^ [RNHCH2OH]
[RNH2][HCH0(aq)] (2.1)
J. [RNH2CH2OH] = [RNH3][HCH0(aq)]
[RN(CH20H)2] K , = [RNHCH20H][HCH0(aq)]
(2.2)
(2.3)
Table 2.1: Results reported by Abrams and Kallen^ for the equilibrium constants for
formation of 7V-(hydroxymethyl)amine, K i , the cationic 7V-(hydroxymethyl)amine, K2,
and A',iV-(dihydroxymethyl)amine, K 3 , for aniline and its derivatives at 25 °C, / = 1 M
amine pKa equilibrium constant / dm^ mol'^ pKa
ref amine pKa
K i K2 K3
pKa
ref
aniline 4.60 22.3 0.10 - 1
4-methoxyaniline 5.36 23.2 0.30 - 1
4-methylaniline 5.08 22.7 0.30 - 1
4-chloroaniline 4.15 26.0 0.30 - 1
4-cyanoaniline 1.71 27.2 - - 1
4-nitroaniline 1.02 27.3 0.85 - 1
3 -fluoro-4-nitroaniline -0.30 20.0 - -
3,5-dinitroaniline 0.23 23.0 - 1.4 1
A^-methylaniline 4.85 13.2 0.55 1
4-methoxy-7V-methylaniline 5.78 18.6 0.85 - 9
4-methyl-7V-methylaniline 5.54 16.2 0.20 - 9
4-chloro-7V-methylaniline 4.21 10.6 0.45 - 9
4-nitro-7V-methylaniline 0.55 2.8 - - 1
44
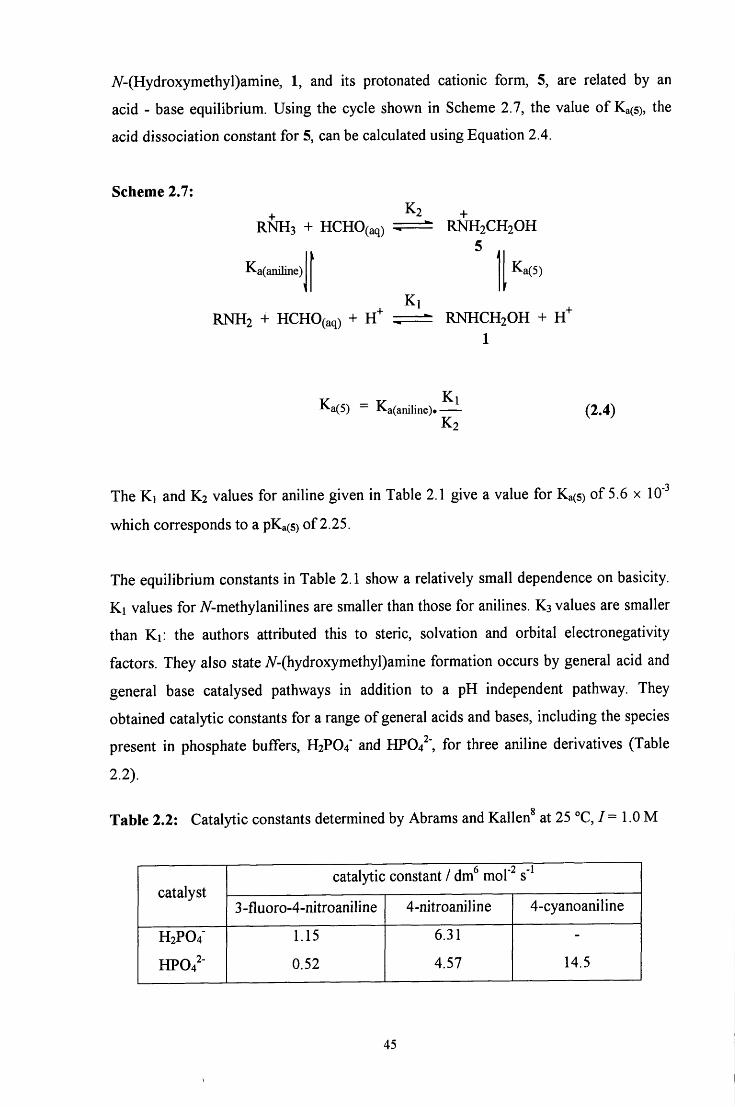
7V-(Hydroxymethyl)amine, 1, and its protonated cationic form, 5, are related by an
acid - base equilibrium. Using the cycle shown in Scheme 2.7, the value of Ka(5), the
acid dissociation constant for 5, can be calculated using Equation 2.4.
Scheme 2.7:
RNH3 + HCHO(aq)
Ka(aniline)
K2
Ki RNH2 + HCHO(aq) + K ^
RNH2CH2OH 5
41 Ka(5)
RNHCH2OH + H ' 1
Ka(5) - Ka(aniline).— K2
(2.4)
The K i and K2 values for aniline given in Table 2.1 give a value for Ka(s) of 5.6 x 10'
which corresponds to a pK^s) of 2.25.
The equilibrium constants in Table 2.1 show a relatively small dependence on basicity.
K i values for 7V-methylanilines are smaller than those for anilines. K3 values are smaller
than K i : the authors attributed this to steric, solvation and orbital electronegativity
factors. They also state 7V-(hydroxymethyl)amine formation occurs by general acid and
general base catalysed pathways in addition to a pH independent pathway. They
obtained catalytic constants for a range of general acids and bases, including the species
present in phosphate buffers, H2PO4' and HP04^', for three aniline derivatives (Table
2.2).
Table 2.2: Catalytic constants determined by Abrams and Kallen at 25 °C, / = 1.0 M
catalyst catalytic constant / dm^ mof
catalyst 3 -fIuoro-4-nitroaniline 4-nitroaniline 4-cyanoaniline
H2P04' 1.15 6.31 -
HP04^" 0.52 4.57 14.5
45
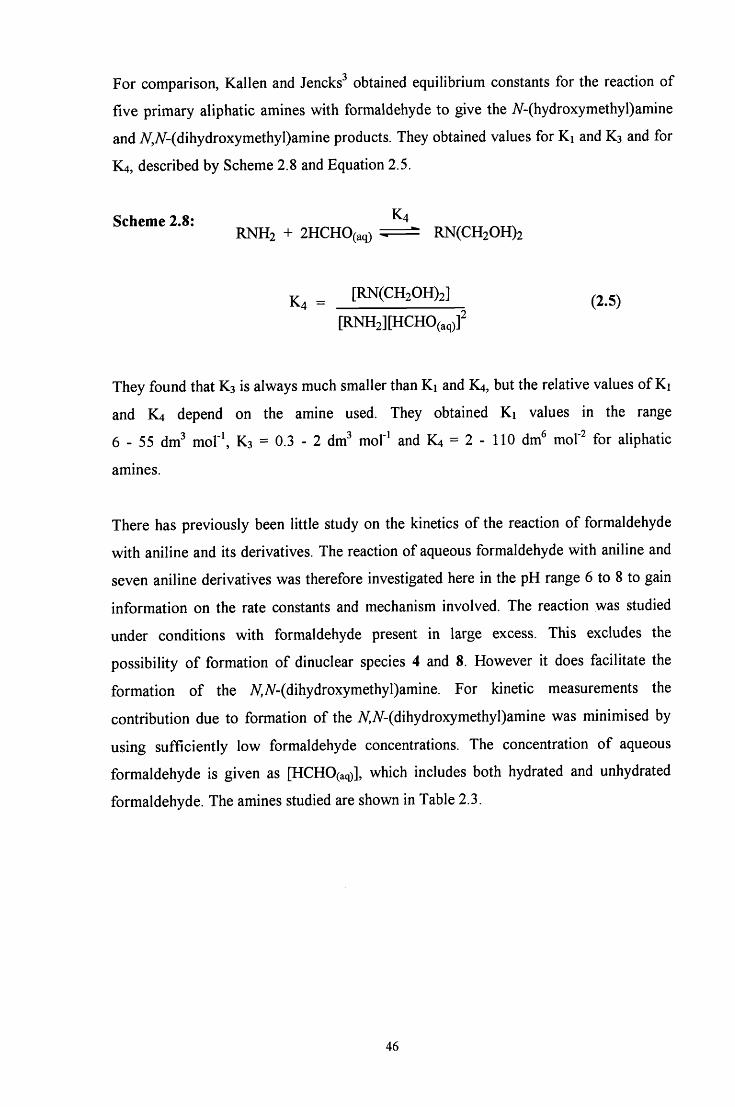
For comparison, Kallen and Jencks^ obtained equilibrium constants for the reaction of
five primary aliphatic amines with formaldehyde to give the iV-(hydroxymethyl)amine
and A^,A/-(dihydroxymethyl)amine products. They obtained values for K i and K3 and for
K4, described by Scheme 2.8 and Equation 2.5.
Scheme 2 8* RNH2 + 2HCH0(aq) RN(CH20H)2
^ [RN(CH20H)2] p.5)
[RNH2][HCH0(aq)]^
They found that K3 is always much smaller than K i and K4, but the relative values of K i
and K4 depend on the amine used. They obtained K i values in the range
6 - 55 dm^ mo\'\ K3 = 0 . 3 - 2 dm^ mol"^ and K4 = 2 - 110 dm^ mol"^ for aliphatic
amines.
There has previously been little study on the kinetics of the reaction of formaldehyde
with aniline and its derivatives. The reaction of aqueous formaldehyde with aniline and
seven aniline derivatives was therefore investigated here in the pH range 6 to 8 to gain
information on the rate constants and mechanism involved. The reaction was studied
under conditions with formaldehyde present in large excess. This excludes the
possibility of formation of dinuclear species 4 and 8. However it does facilitate the
formation of the 7V,iV-(dihydroxymethyl)amine. For kinetic measurements the
contribution due to formation of the 7V',7V-(dihydroxymethyl)amine was minimised by
using sufficiently low formaldehyde concentrations. The concentration of aqueous
formaldehyde is given as [HCHO(aq)], which includes both hydrated and unhydrated
formaldehyde. The amines studied are shown in Table 2.3.
46
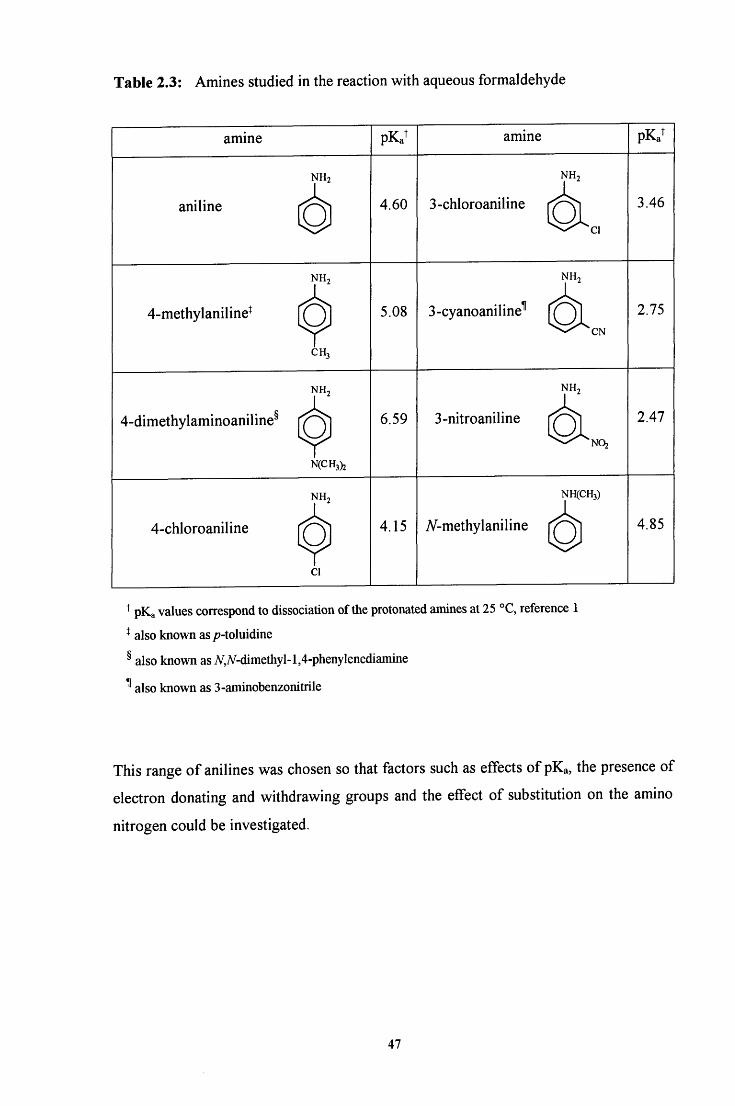
Table 2.3: Amines studied in the reaction with aqueous formaldehyde
amine pKa amine pKa
NH2
aniline 4.60 3-chloroaniline [ ^ ^ ] ^ 3.46
NH2
4-methylaniline*
CH3
5.08 3-cyanoaniline^ 1X31 2.75
NH2
4-dimethylaminoaniline^ {^^j
N(CH3)2
6.59
NH2
3-nitroaniline f ? ) | 2.47
NH2
4-chloroaniline ^^^^
Cl
4.15
NH(CH3)
A^-methylaniline 4.85
^ pKa values correspond to dissociation of the protonated amines at 25 °C, reference 1
* also known as /?-toluidine
^ also known asiV,A -dimethyl-l,4-phenylenediamine
^ also known as 3-aminobenzonitrile
This range of anilines was chosen so that factors such as effects of pKa, the presence of
electron donating and withdrawing groups and the effect of substitution on the amino
nitrogen could be investigated.
47
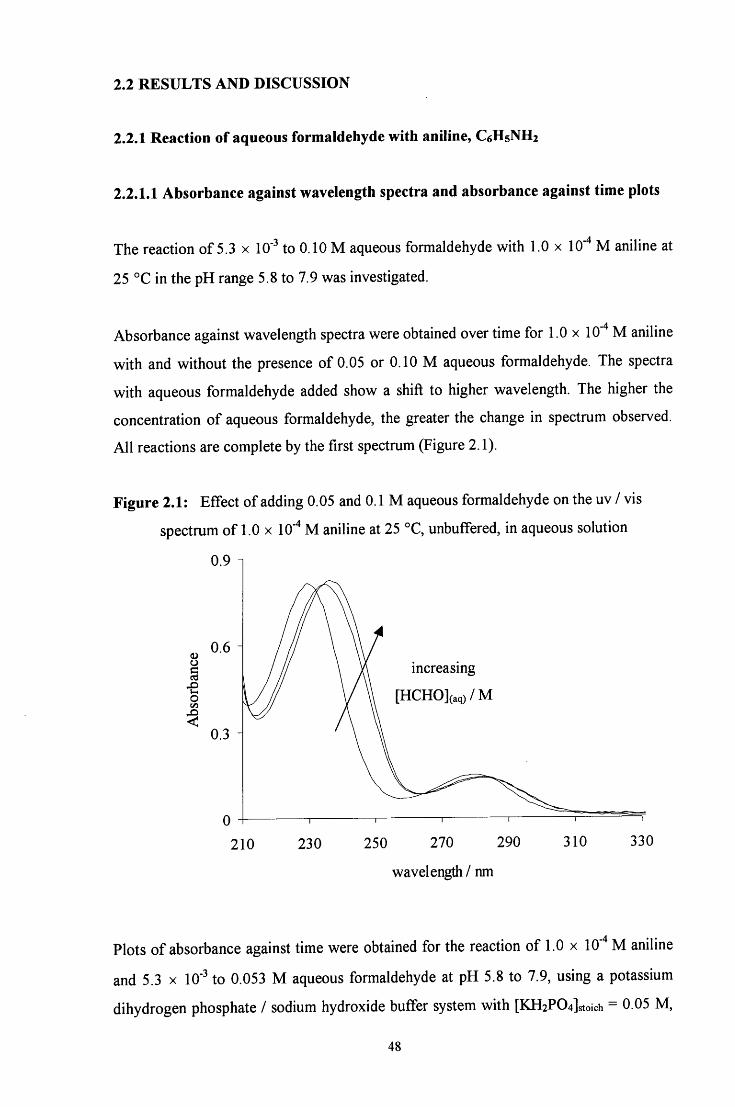
2.2 R E S U L T S AND DISCUSSION
2.2.1 Reaction of aqueous formaldehyde with aniline, CeHsNHi
2.2.1.1 Absorbance against wavelength spectra and absorbance against time plots
The reaction of 5.3 x 10' to 0.10 M aqueous formaldehyde with 1.0 x 10"" M aniline at
25 °C in the pH range 5.8 to 7.9 was investigated.
Absorbance against wavelength spectra were obtained over time for 1.0 x 10'"* M aniline
with and without the presence of 0.05 or 0.10 M aqueous formaldehyde. The spectra
with aqueous formaldehyde added show a shift to higher wavelength. The higher the
concentration of aqueous formaldehyde, the greater the change in spectrum observed.
Al l reactions are complete by the first spectrum (Figure 2.1).
Figure 2.1: Effect of adding 0.05 and 0.1 M aqueous formaldehyde on the uv / vis
spectrum of 1.0 x 10"" M aniline at 25 °C, unbuffered, in aqueous solution
0.9 1
o a
o
increasing [HCHO](aq)/M
210 230 250 270 290
wavelength / nm
310 330
Plots of absorbance against time were obtained for the reaction of 1.0 x 10"" M aniline
and 5.3 x 10" to 0.053 M aqueous formaldehyde at pH 5.8 to 7.9, using a potassium
dihydrogen phosphate / sodium hydroxide buffer system with [KH2P04]stoich = 0.05 M,
48
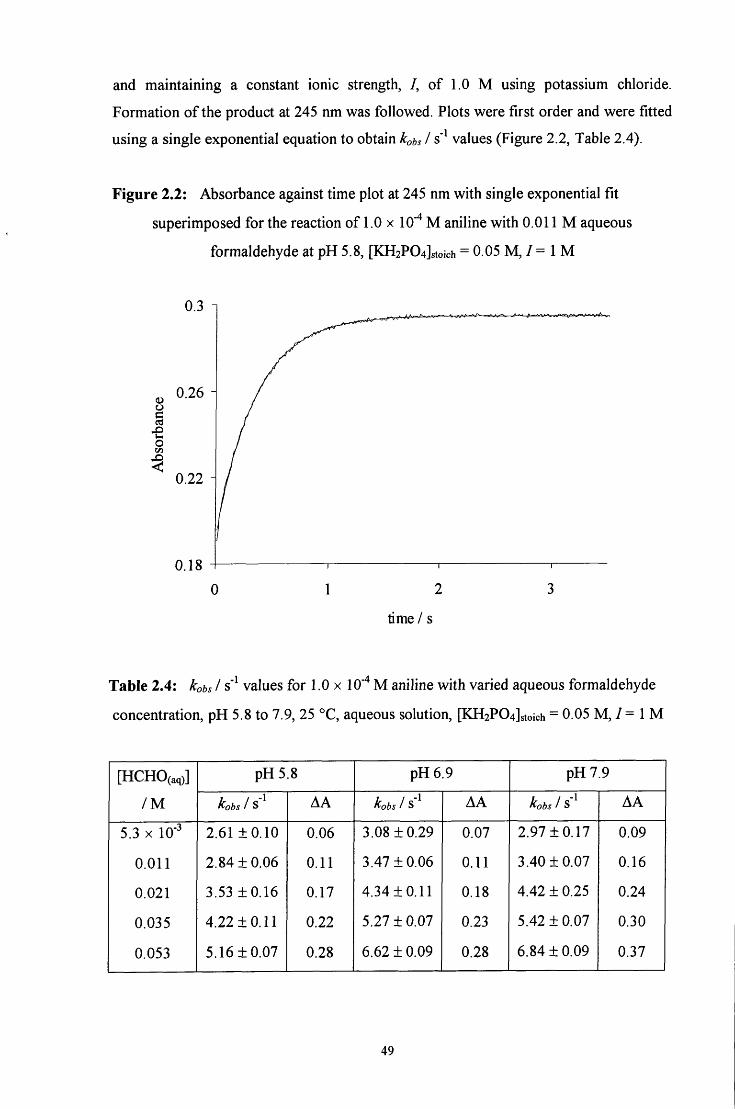
and maintaining a constant ionic strength, /, of 1.0 M using potassium chloride.
Formation of the product at 245 nm was followed. Plots were first order and were fitted
using a single exponential equation to obtain kobs I s' values (Figure 2.2, Table 2.4).
Figure 2.2: Absorbance against time plot at 245 nm with single exponential fit
superimposed for the reaction of 1.0 x lO''* M aniline with 0.011 M aqueous
formaldehyde at pH 5.8, [KH2P04]stoich = 0.05 M, / = 1 M
o
I O
0.26
0.22
0.18
time / s
Table 2.4: kobs I s' values for 1.0 x 10" M aniline with varied aqueous formaldehyde
concentration, pH 5.8 to 7.9, 25 °C, aqueous solution, [KH2P04]stoich = 0.05 M, / = 1 M
[HCHO(aq)]
/ M
pH5.8 pH6.9 pH7.9 [HCHO(aq)]
/ M kobs 1 S AA kobs 1 S AA kobs I S AA
5.3 X 10" 2.61 ±0.10 0.06 3.08 ±0.29 0.07 2.97 ±0.17 0.09
0.011 2.84 ± 0.06 0.11 3.47 ±0.06 0.11 3.40 ±0.07 0.16
0.021 3.53+0.16 0.17 4.34±0.11 0.18 4.42 ± 0.25 0.24
0.035 4.22 ±0.11 0.22 5.27 ±0.07 0.23 5.42 ± 0.07 0.30
0.053 5.16 ±0.07 0.28 6.62 ± 0.09 0.28 6.84 ±0.09 0.37
49
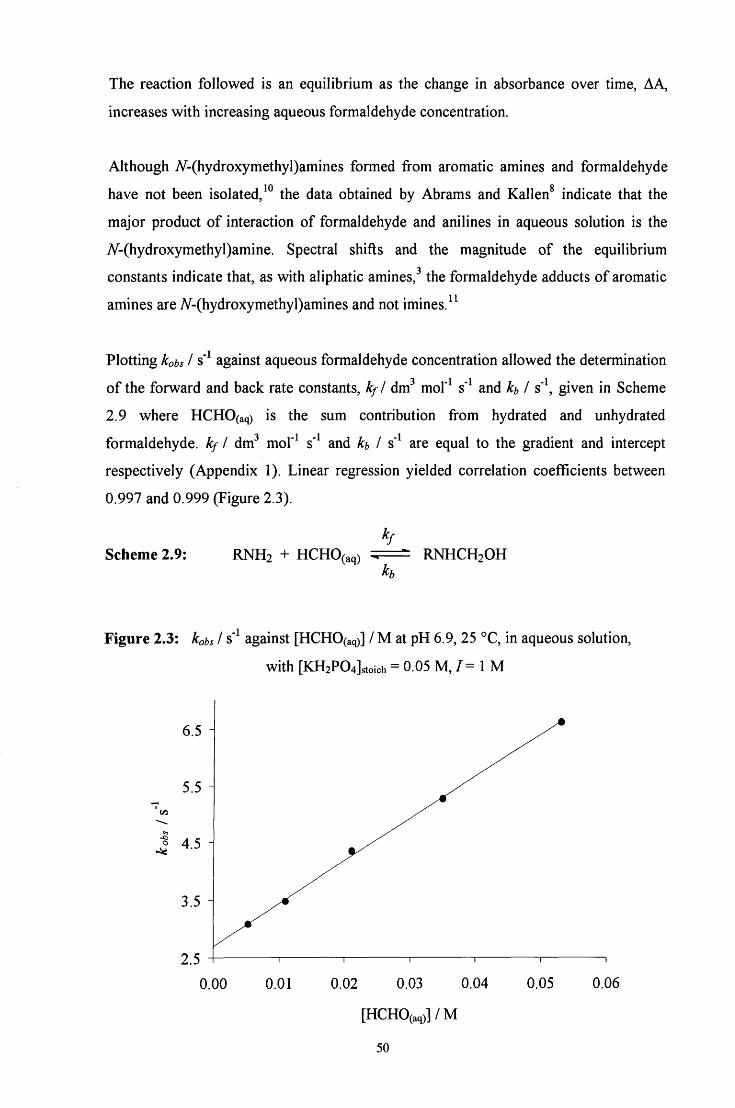
The reaction followed is an equilibrium as the change in absorbance over time, AA,
increases with increasing aqueous formaldehyde concentration.
Although 7V-(hydroxymethyl)amines formed from aromatic amines and formaldehyde
have not been isolated, the data obtained by Abrams and Kallen^ indicate that the
major product of interaction of formaldehyde and anilines in aqueous solution is the
7V-(hydroxymethyl)amine. Spectral shifts and the magnitude of the equilibrium
constants indicate that, as with aliphatic amines, the formaldehyde adducts of aromatic
amines are iV-(hydroxymethyl)amines and not imines. ^
Plotting kobs I s" against aqueous formaldehyde concentration allowed the determination
of the forward and back rate constants, kf I dm"' mol"^ s' and h I s" , given in Scheme
2.9 where HCHO(aq) is the sum contribution fi-om hydrated and unhydrated
formaldehyde, kf I drcf mol'^ s" and h I s" are equal to the gradient and intercept
respectively (Appendix 1). Linear regression yielded correlation coefficients between
0.997 and 0.999 (Figure 2.3).
kf
Scheme 2.9: RNH2 + HCHO(aq) = ; = ^ RNHCH2OH h
Figure 2.3: kobs I s" against [HCHO(aq)] / M at pH 6.9, 25 °C, in aqueous solution,
with [KH2P04]stoich = 0.05 M , / = 1 M
0.00 0.01 0.02 0.03 0.04 0.05 0.06
[HCHO(aq)]/M
50
The values obtained for kf I dm^ mol"^ s" and kb I s" and the calculated equilibrium
constant K / dm^ mof^ where K = kfl h, are given in Table 2.5.
Table 2.5: Values of ^/and h and the equilibrium constant, K, for the reaction of
aniline with aqueous formaldehyde, pH 5.8 to 7.9, 25 °C, aqueous solution, / = 1 M
pH k f l dm^ mol'^ s" h 1 K / dm' mol"'
5.8 53.9 ± 1.7 2.33 ±0.05 23 ± 1
7.0 73.9 ± 1.5 2.71 ±0.04 27 ± 1
7.9 80.9 ±2.4 2.59 ±0.07 3 1 ± 1
Since none of the reactants will be appreciably protonated in the pH range used, the
value of the equilibrium constant, K, would be expected to be independent of pH. The
slight increase observed in the values in Table 2.5 may therefore be within experimental
error: the average value of K is 27 ± 4 dm^ mor\ This is in good agreement with the 1 1 ft
value of 22.3 dm mol' obtained by Abrams and Kallen from equilibrium
spectrophotometric measurements.
The rate constant for the formation of the 7V-(hydroxymethyl)amine, kf, shows a real
increase with increasing pH and this was investigated further.
2.2.1.2 General acid and base catalysis
To determine whether the buffer concentration has any effect on the value of kobs I s"
obtained, the reaction was studied using a constant aqueous formaldehyde concentration
and varying the buffer concentration whilst retaining the buffer ratio and maintaining
the ionic strength at 1.0 M using potassium chloride.
Initially the reaction of 0.053 M aqueous formaldehyde with 1.0 x 10" M aniline in the
pH range 5.8 to 7.9 using potassium dihydrogen phosphate / sodium hydroxide buffers
with a stoichiometric potassium dihydrogen phosphate concentration of 0.050 to
0.144 M was studied. The kobs I s' values obtained are shown in Table 2.6.
51
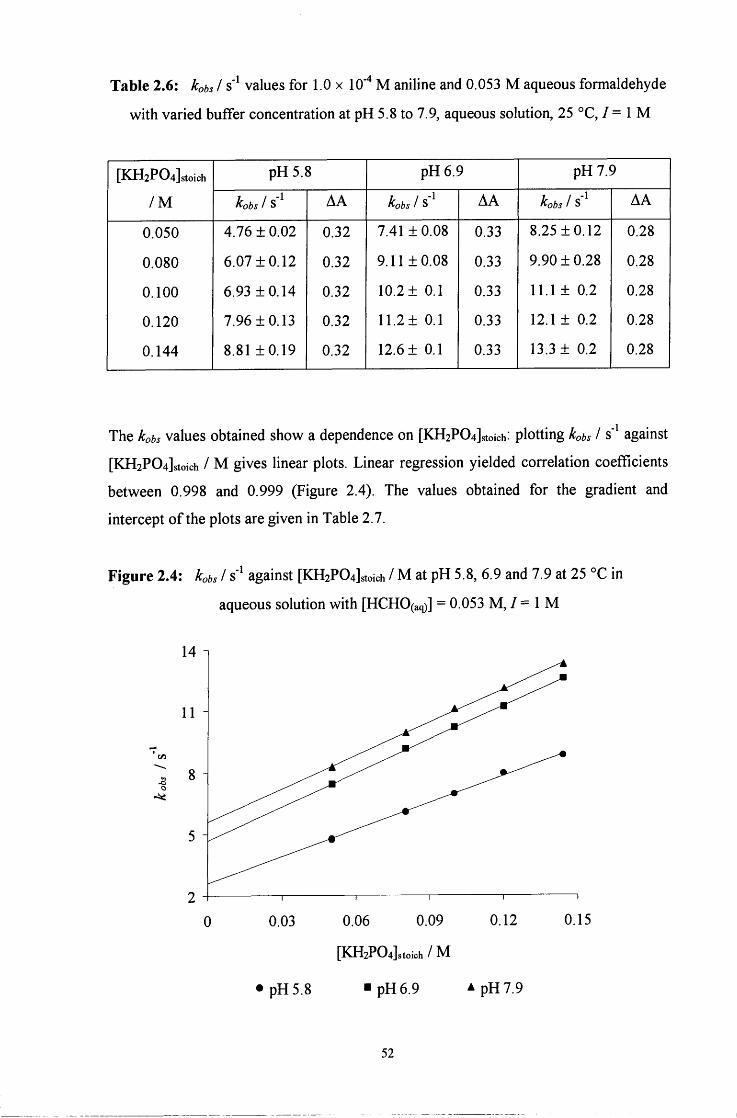
Table 2.6: kobs I s" values for 1.0 x 10"" M aniline and 0.053 M aqueous formaldehyde
wi th varied buffer concentration at pH 5.8 to 7.9, aqueous solution, 25 °C, / = 1 M
[KH2P04]^oich
/ M
pH5.8 pH6.9 pH7.9 [KH2P04]^oich
/ M kobs 1 S AA kobs 1 S AA kobs 1 S AA
0.050 4.76 ± 0.02 0.32 7.41 ± 0 . 0 8 0.33 8.25 ± 0 . 1 2 0.28
0.080 6.07 ± 0 . 1 2 0.32 9.11 ± 0 . 0 8 0.33 9.90 ± 0.28 0.28
0.100 6.93+0.14 0.32 10.2 ± 0.1 0.33 11.1 ± 0.2 0.28
0.120 7.96 + 0.13 0.32 11 .2± 0.1 0.33 12.1 ± 0.2 0.28
0.144 8.81+0.19 0.32 12.6 ± 0.1 0.33 13.3 ± 0.2 0.28
The kobs values obtained show a dependence on [KH2P04]stoich: plotting kobs I s' against
[KH2P04]stoich / M gives linear plots. Linear regression yielded correlation coefficients
between 0.998 and 0.999 (Figure 2.4). The values obtained for the gradient and
intercept o f the plots are given in Table 2.7.
Figure 2.4: hbs I s" against [KH2P04]stoich / M at pH 5.8, 6.9 and 7.9 at 25 °C in
aqueous solution with [HCHO(aq)] = 0.053 M , / = 1 M
14 n
0.03 0.06 0.09 0.12
[KH2P04]stoioh/M
• p H 5 . 8 • p H 6 . 9 A p H 7 . 9
0.15
52
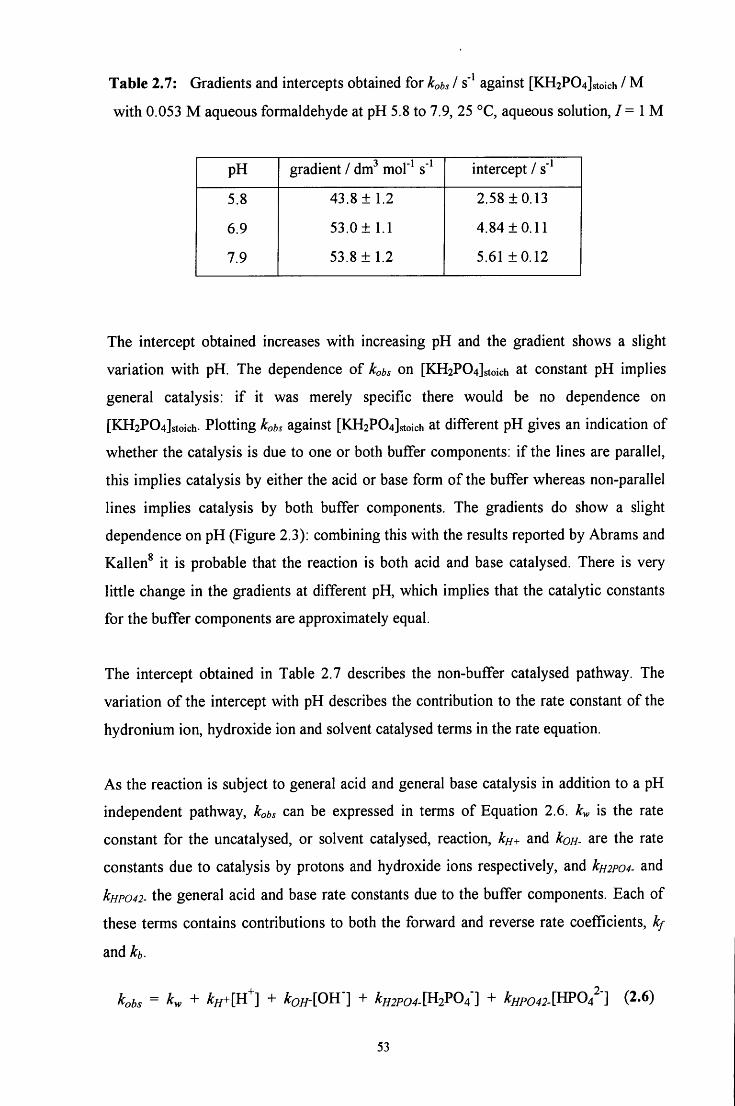
Table 2.7: Gradients and intercepts obtained for kots I s' against [KH2P04]stoich / M
with 0.053 M aqueous formaldehyde at pH 5.8 to 7.9, 25 °C, aqueous solution, / = 1 M
pH gradient / dm^ mol"^ s' intercept / s'
5.8 43.8 ± 1.2 2.58 ± 0 . 1 3
6.9 53.0 ± 1.1 4.84 ± 0 . 1 1
7.9 53.8 ± 1.2 5.61 ± 0 . 1 2
The intercept obtained increases with increasing pH and the gradient shows a slight
variation with pH. The dependence o f kobs on [KH2P04]stoich at constant pH implies
general catalysis: i f it was merely specific there would be no dependence on
[KH2P04]stoich. Plotting kobs against [KH2P04]stoich at different p H gives an indication of
whether the catalysis is due to one or both buffer components: i f the lines are parallel,
this implies catalysis by either the acid or base form o f the buffer whereas non-parallel
lines implies catalysis by both buffer components. The gradients do show a slight
dependence on p H (Figure 2.3): combining this with the results reported by Abrams and
Kallen^ it is probable that the reaction is both acid and base catalysed. There is very
little change in the gradients at different pH, which implies that the catalytic constants
for the buffer components are approximately equal.
The intercept obtained in Table 2.7 describes the non-buffer catalysed pathway. The
variation o f the intercept with pH describes the contribution to the rate constant o f the
hydronium ion, hydroxide ion and solvent catalysed terms in the rate equation.
As the reaction is subject to general acid and general base catalysis in addition to a pH
independent pathway, kobs can be expressed in terms o f Equation 2.6. k^ is the rate
constant for the uncatalysed, or solvent catalysed, reaction, kH+ and kon- are the rate
constants due to catalysis by protons and hydroxide ions respectively, and kH2P04- and
kHP042- the general acid and base rate constants due to the buffer components. Each o f
these terms contains contributions to both the forward and reverse rate coefficients, kf
and h .
Kbs = K + V [ H 1 + koH-[OU-] + ^H2P04- [H2P04-] + %TO«.[HPO/-] (2.6)
53
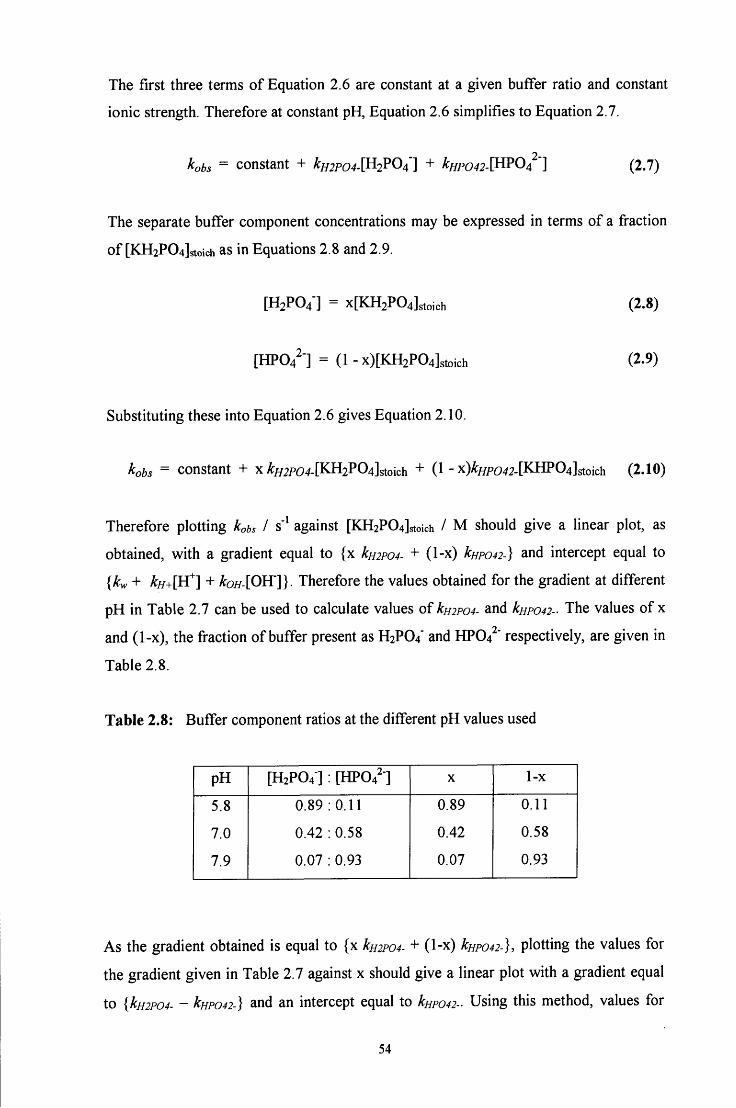
The first three terms o f Equation 2.6 are constant at a given buffer ratio and constant
ionic strength. Therefore at constant pH, Equation 2.6 simplifies to Equation 2.7.
2-n kobs = constant + Wo4-[H2P04"] + %pc»^2-[HP04 "] (2.7)
The separate buffer component concentrations may be expressed in terms o f a fraction
o f [KH2P04]stoich as in Equations 2.8 and 2.9.
[H2P04-] = x[KH2P04]stoich (2.8)
[HP04^-] = (1 - x)[KH2P04]stoich (2.9)
Substituting these into Equation 2.6 gives Equation 2.10.
kobs = constant + x kH2P04-U^2P04]stoich + (1 - x)A^pc>42-[KHP04]stoich (2.10)
Therefore plotting kobs I s' against [KH2P04]stoich / M should give a linear plot, as
obtained, wi th a gradient equal to {x kH2P04- + (1-x) kHP042-} and intercept equal to
{kw + ^//+[H^] + koH-[0^]}. Therefore the values obtained for the gradient at different
p H in Table 2.7 can be used to calculate values o f kH2P04- and kHP042-. The values of x
and (1-x), the fraction o f buffer present as H2PO4" and HP04^" respectively, are given in
Table 2.8.
Table 2.8: Buffer component ratios at the different pH values used
p H [H2PO4 ] : [HP04^ ] X 1-x
5.8 0.89 : 0.11 0.89 0.11
7.0 0.42 : 0.58 0.42 0.58
7.9 0.07 : 0.93 0.07 0.93
As the gradient obtained is equal to {x kH2P04- + (1-x) kHP042-}, plotting the values for
the gradient given in Table 2.7 against x should give a linear plot with a gradient equal
to {kH2P04- - kHP042-} and an intercept equal to kHP042- Using this method, values for
54
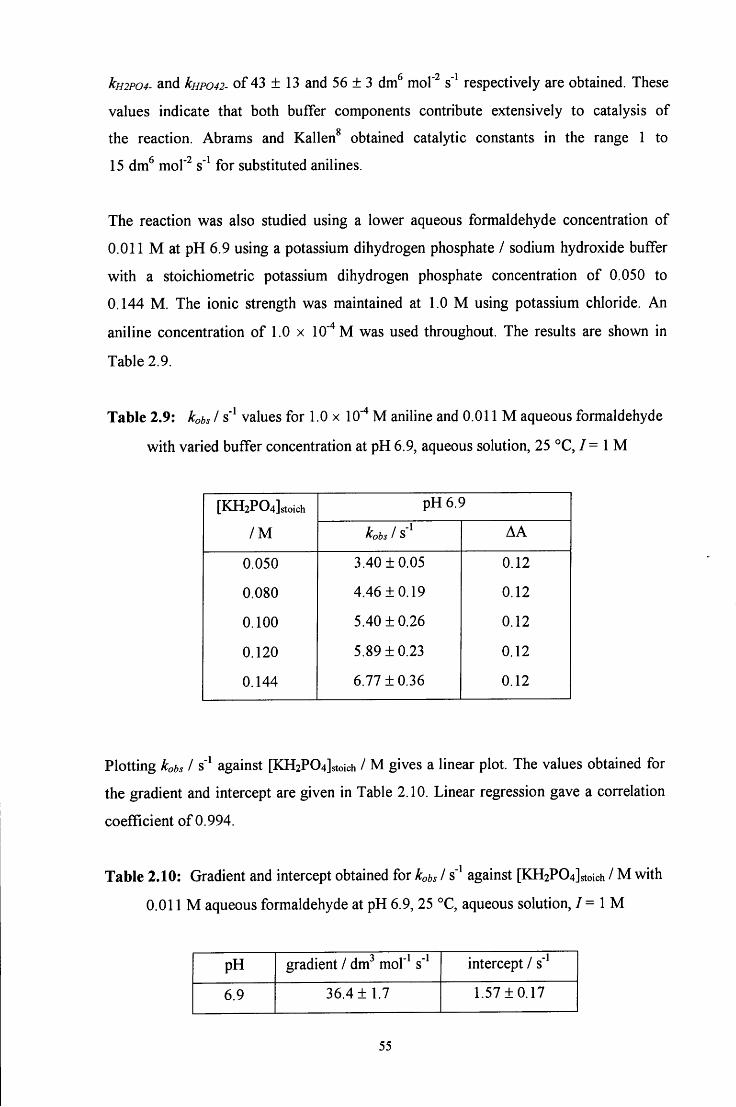
kH2P04- and kHP042- o f 43 ± 13 and 56 ± 3 dm^ mol"^ s" respectively are obtained. These
values indicate that both buffer components contribute extensively to catalysis o f Q
the reaction. Abrams and Kallen obtained catalytic constants in the range 1 to
15 dm mof s' for substituted anilines.
The reaction was also studied using a lower aqueous formaldehyde concentration o f
0.011 M at p H 6.9 using a potassium dihydrogen phosphate / sodium hydroxide buffer
wi th a stoichiometric potassium dihydrogen phosphate concentration o f 0.050 to
0.144 M . The ionic strength was maintained at 1.0 M using potassium chloride. An
aniline concentration o f 1.0 x 10""* M was used throughout. The results are shown in
Table 2.9.
Table 2.9: kobs I s" values for 1.0 x 10'" M aniline and 0.011 M aqueous formaldehyde
with varied buffer concentration at pH 6.9, aqueous solution, 25 °C, / = 1 M
[KH2P04]stoich
/ M
pH6.9 [KH2P04]stoich
/ M kobs 1 S A A
0.050 3.40 ± 0 . 0 5 0.12
0.080 4.46 ± 0 . 1 9 0.12
0.100 5.40 ± 0 . 2 6 0.12
0.120 5.89 ± 0 . 2 3 0.12
0.144 6.77 ± 0 . 3 6 0.12
Plotting kobs I s" against [KH2P04]stoich / M gives a linear plot. The values obtained for
the gradient and intercept are given in Table 2.10. Linear regression gave a correlation
coefficient o f 0.994.
Table 2.10: Gradient and intercept obtained for kobs I s" against [KH2P04]stoich / M with
0.011 M aqueous formaldehyde at pH 6.9, 25 °C, aqueous solution, / = 1 M
pH gradient / dm^ mol'^ s" intercept / s'
6.9 36.4 ± 1 . 7 1.57 ± 0 . 1 7
55
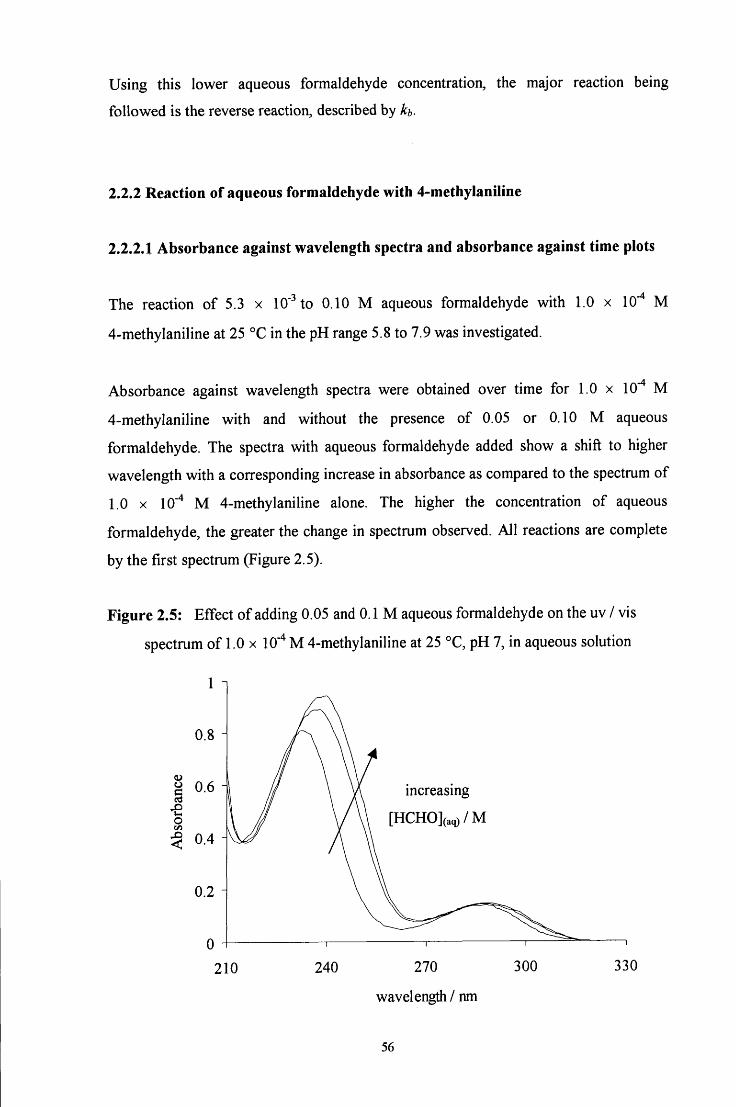
Using this lower aqueous formaldehyde concentration, the major reaction being
followed is the reverse reaction, described by h.
2.2.2 Reaction of aqueous formaldehyde with 4-methylaniline
2.2.2.1 Absorbance against wavelength spectra and absorbance against time plots
The reaction o f 5.3 x 10'^ to 0.10 M aqueous formaldehyde with 1.0
4-methylaniline at 25 °C in the pH range 5.8 to 7.9 was investigated.
X lO"* M
Absorbance against wavelength spectra were obtained over time for 1.0 x 10" M
4-methylaniline with and without the presence o f 0.05 or 0.10 M aqueous
formaldehyde. The spectra with aqueous formaldehyde added show a shift to higher
wavelength with a corresponding increase in absorbance as compared to the spectrum of
1.0 x 10'"* M 4-methylaniline alone. The higher the concentration o f aqueous
formaldehyde, the greater the change in spectrum observed. A l l reactions are complete
by the first spectrum (Figure 2.5).
Figure 2.5: Effect o f adding 0.05 and 0.1 M aqueous formaldehyde on the uv / vis
spectrum o f 1.0 x lO"' M 4-methylaniline at 25 °C, pH 7, in aqueous solution
increasing
[HCHO](aq) /M
210 240 270
wavelength / nm
300 330
56
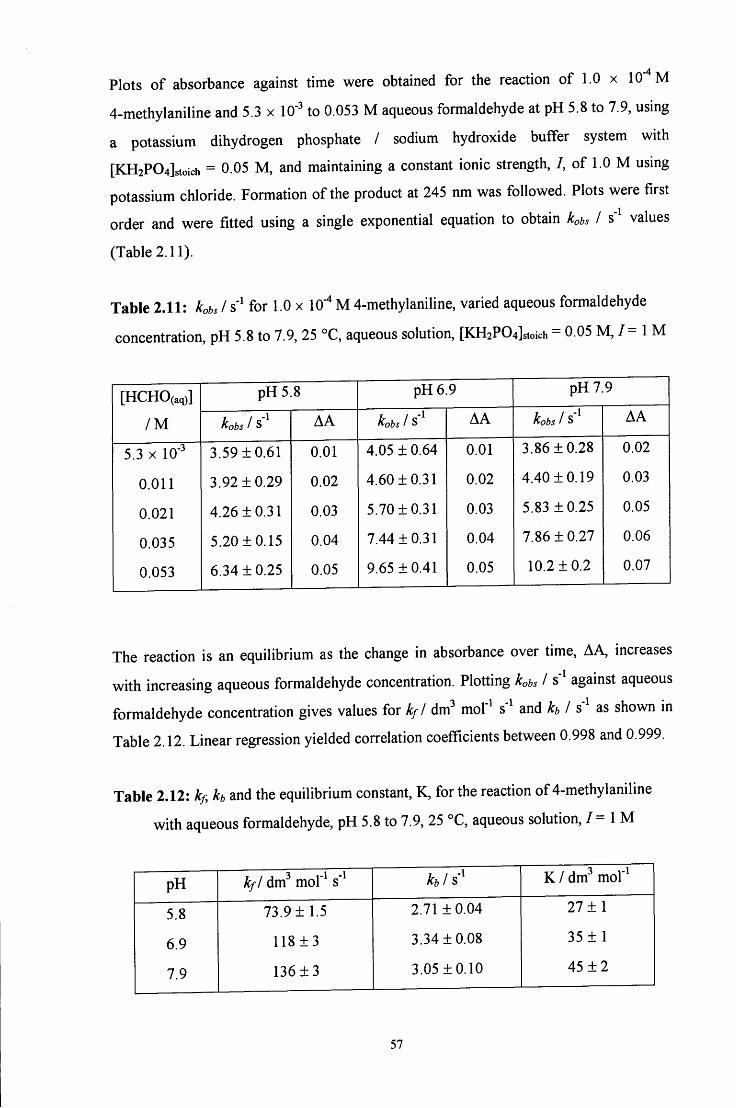
Plots o f absorbance against time were obtained for the reaction o f 1.0 x 10" M
4-methylaniline and 5.3 x 10" to 0.053 M aqueous formaldehyde at pH 5.8 to 7.9, using
a potassium dihydrogen phosphate / sodium hydroxide buffer system with
[KH2P04]stoich = 0.05 M , and maintaining a constant ionic strength, / , o f 1.0 M using
potassium chloride. Formation o f the product at 245 nm was followed. Plots were first
order and were fitted using a single exponential equation to obtain kobs I s" values
(Table 2.11).
Table 2.11: kobs I s' for 1.0 x 10"* M 4-methylaniline, varied aqueous formaldehyde
concentration, p H 5.8 to 7.9, 25 °C, aqueous solution, [KH2P04]stoich = 0.05 M , / = 1 M
[HCHO(aq)]
/ M
pH5.8 pH 6.9 pH7.9 [HCHO(aq)]
/ M kobs 1 S AA kobs 1 S AA kobs 1 S AA
5.3 x 10" 3.59 ± 0 . 6 1 0.01 4.05 ± 0.64 0.01 3.86 ± 0 . 2 8 0.02
0.011 3.92 ± 0 . 2 9 0.02 4.60 ± 0 . 3 1 0.02 4.40 ± 0 . 1 9 0.03
0.021 4.26 ± 0 . 3 1 0.03 5.70 ± 0 . 3 1 0.03 5.83 ± 0 . 2 5 0.05
0.035 5.20 ± 0 . 1 5 0.04 7.44 ± 0 . 3 1 0.04 7.86 ± 0 . 2 7 0.06
0.053 6.34 ± 0 . 2 5 0.05 9.65 ± 0 . 4 1 0.05 10.2 ± 0 . 2 0.07
The reaction is an equilibrium as the change in absorbance over time, AA, increases
wi th increasing aqueous formaldehyde concentration. Plotting kobs I s' against aqueous
formaldehyde concentration gives values for kfl dm^ mol"^ s" and h I s" as shown in
Table 2.12. Linear regression yielded correlation coefficients between 0.998 and 0.999.
Table 2.12: kf, h and the equilibrium constant, K, for the reaction o f 4-methylaniline
wi th aqueous formaldehyde, p H 5.8 to 7.9, 25 °C, aqueous solution, / = 1 M
p H k f l dm^ mol"^ s' kb 1 K / d m ^ m o l ' ^
5.8 73.9 ± 1.5 2.71 ± 0 . 0 4 27 ± 1
6.9 1 1 8 ± 3 3.34 ± 0 . 0 8 35 ± 1
7.9 136 ± 3 3.05 ± 0 . 1 0 45 ± 2
57
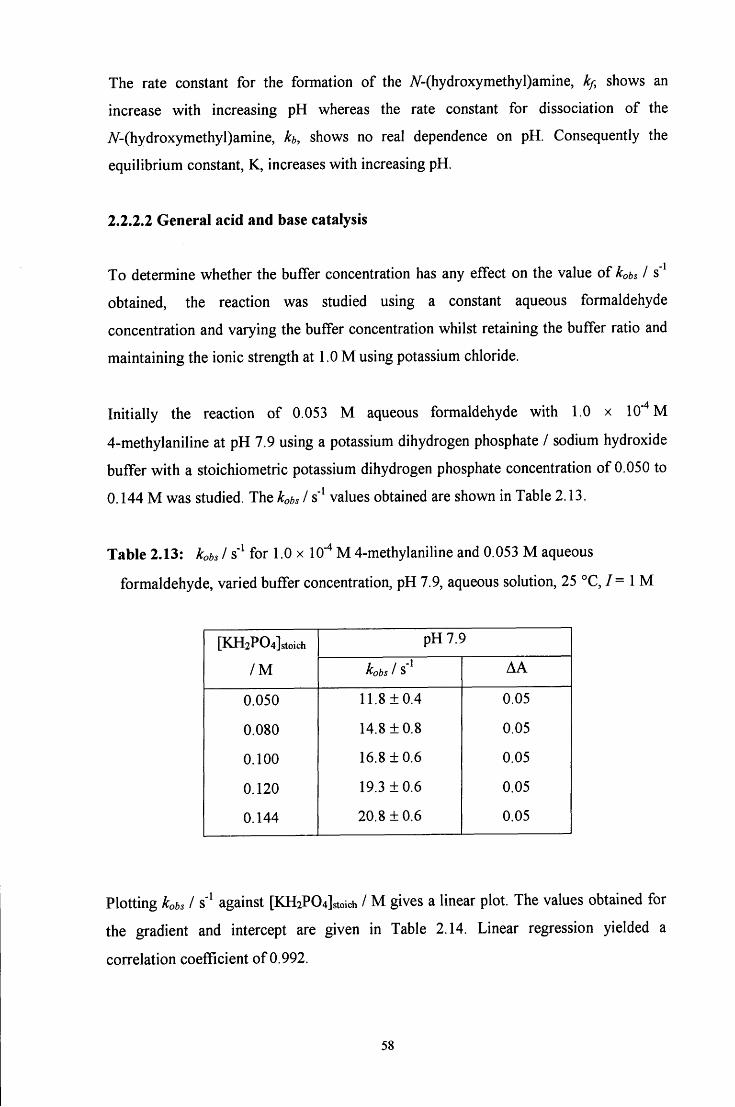
The rate constant for the formation o f the 7V-(hydroxymethyl)amine, kf, shows an
increase with increasing pH whereas the rate constant for dissociation o f the
#-(hydroxymethyl)amine, h, shows no real dependence on pH. Consequently the
equilibrium constant, K, increases with increasing pH.
2.2.2.2 General acid and base catalysis
To determine whether the buffer concentration has any effect on the value o f kobs I s'
obtained, the reaction was studied using a constant aqueous formaldehyde
concentration and varying the buffer concentration whilst retaining the buffer ratio and
maintaining the ionic strength at 1.0 M using potassium chloride.
Initially the reaction o f 0.053 M aqueous formaldehyde with 1.0 x lO'^^M
4-methylaniline at pH 7.9 using a potassium dihydrogen phosphate / sodium hydroxide
buffer wi th a stoichiometric potassium dihydrogen phosphate concentration o f 0.050 to
0.144 M was studied. The kobs I s' values obtained are shown in Table 2.13.
Table 2.13: kobs I s' for 1.0 x 10" M 4-methylaniline and 0.053 M aqueous
formaldehyde, varied buffer concentration, pH 7.9, aqueous solution, 25 °C, / = 1 M
[KH2P04]stoich
/ M
pH7.9 [KH2P04]stoich
/ M kobs 1 S A A
0.050 11.8 + 0.4 0.05
0.080 14.8 ± 0 . 8 0.05
0.100 16.8 ± 0 . 6 0.05
0.120 19.3 ± 0 . 6 0.05
0.144 20.8 ± 0.6 0.05
Plotting kobs I s' against [KH2P04]stoich / M gives a linear plot. The values obtained for
the gradient and intercept are given in Table 2.14. Linear regression yielded a
correlation coefficient o f 0.992.
58
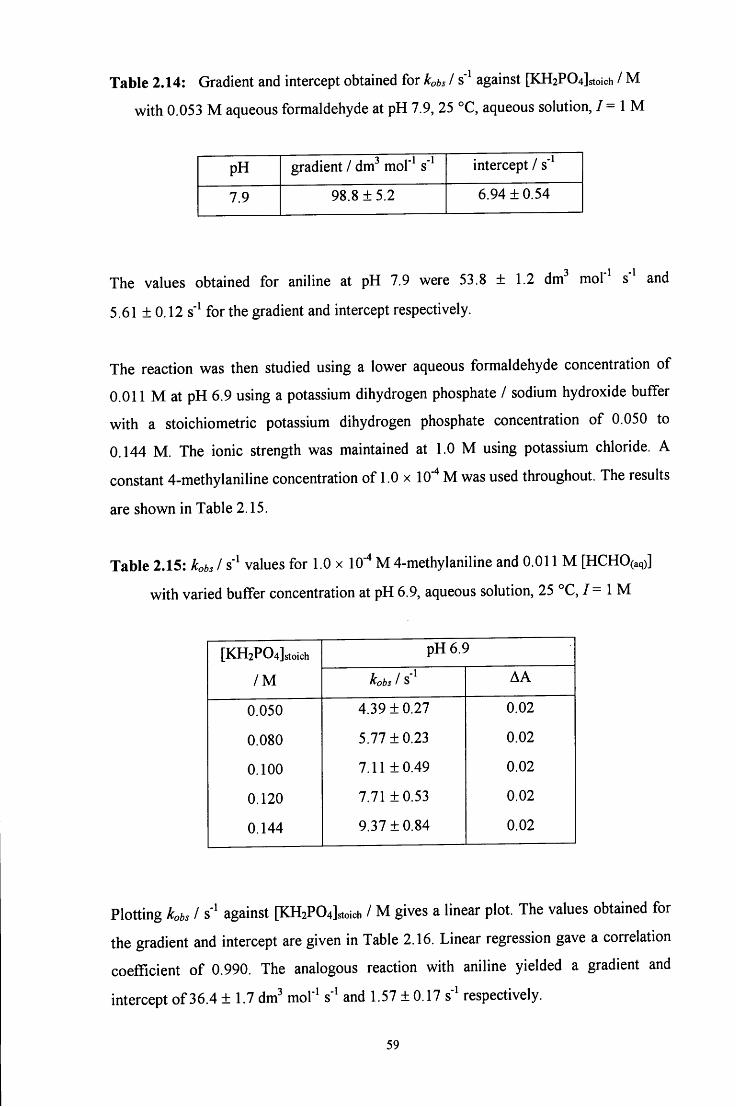
Table 2.14: Gradient and intercept obtained for kobs I s' against [KH2P04]stoich / M
with 0.053 M aqueous formaldehyde at pH 7.9, 25 °C, aqueous solution, / = 1 M
p H gradient / dm^ mol'^ s" intercept / s'
7.9 98.8 ± 5 . 2 6.94 ± 0 . 5 4
The values obtained for aniline at pH 7.9 were 53.8 ± 1.2 dm^ mof^ s" and
5.61 ± 0.12 s' for the gradient and intercept respectively.
The reaction was then studied using a lower aqueous formaldehyde concentration o f
0.011 M at p H 6.9 using a potassium dihydrogen phosphate / sodium hydroxide buffer
wi th a stoichiometric potassium dihydrogen phosphate concentration o f 0.050 to
0.144 M . The ionic strength was maintained at 1.0 M using potassium chloride. A
constant 4-methylaniline concentration o f 1.0 x 10""* M was used throughout. The results
are shown in Table 2.15.
Table 2.15: kobs I s' values for 1.0 x 10"* M 4-methylaniline and 0.011 M [HCHO(aq)]
wi th varied buffer concentration at pH 6.9, aqueous solution, 25 °C, / = 1 M
[KH2P04]stoich
/ M
pH 6.9 [KH2P04]stoich
/ M kobs 1 S AA
0.050 4.39 ± 0 . 2 7 0.02
0.080 5.77 ± 0.23 0.02
0.100 7.11 ± 0 . 4 9 0.02
0.120 7.71 ± 0 . 5 3 0.02
0.144 9.37 ± 0 . 8 4 0.02
Plotting kobs I s' against [KH2P04]stoich / M gives a linear plot. The values obtained for
the gradient and intercept are given in Table 2.16. Linear regression gave a correlation
coefficient o f 0.990. The analogous reaction with aniline yielded a gradient and
intercept o f 36.4 ± 1.7 dm^ mol'^ s' and 1.57 ± 0.17 s" respectively.
59
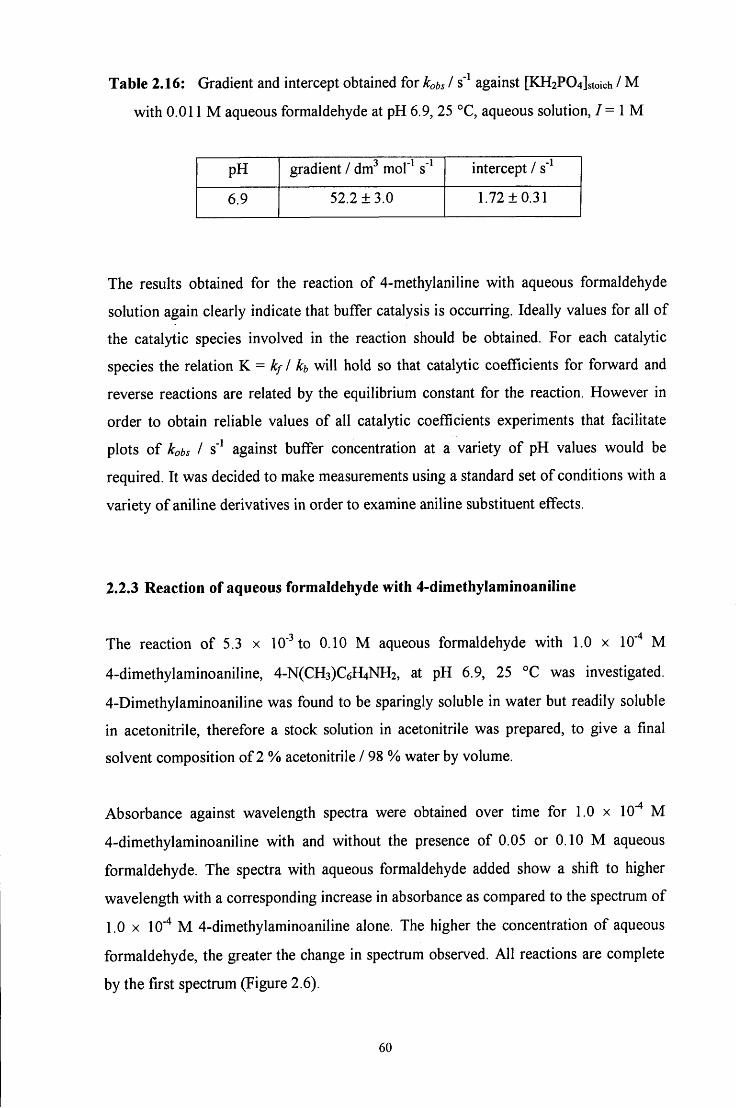
Table 2.16: Gradient and intercept obtained for kobs I s* against [KH2P04]stoich / M
with 0.011 M aqueous formaldehyde at pH 6.9, 25 °C, aqueous solution, 7 = 1 M
p H gradient / dm" mol"^ s"* intercept / s'
6.9 52.2 ± 3 . 0 1.72 ± 0 . 3 1
The results obtained for the reaction o f 4-methylaniline with aqueous formaldehyde
solution again clearly indicate that buffer catalysis is occurring. Ideally values for all o f
the catalytic species involved in the reaction should be obtained. For each catalytic
species the relation K = kf / kt w i l l hold so that catalytic coefficients for forward and
reverse reactions are related by the equilibrium constant for the reaction. However in
order to obtain reliable values o f all catalytic coefficients experiments that facilitate
plots o f kobs I s" against buffer concentration at a variety o f pH values would be
required. I t was decided to make measurements using a standard set o f conditions with a
variety o f aniline derivatives in order to examine aniline substituent effects.
2.2.3 Reaction of aqueous formaldehyde with 4-dimethylaminoaniline
The reaction o f 5.3 x 10' to 0.10 M aqueous formaldehyde with 1.0 x 10" M
4-dimethylaminoaniline, 4-N(CH3)C6H4NH2, at pH 6.9, 25 °C was investigated.
4-Dimethylaminoaniline was found to be sparingly soluble in water but readily soluble
in acetonitrile, therefore a stock solution in acetonitrile was prepared, to give a final
solvent composition o f 2 % acetonitrile / 98 % water by volume.
Absorbance against wavelength spectra were obtained over time for 1.0 x 10" M
4-dimethylaminoaniline with and without the presence o f 0.05 or 0.10 M aqueous
formaldehyde. The spectra with aqueous formaldehyde added show a shift to higher
wavelength with a corresponding increase in absorbance as compared to the spectrum of
1.0 X 10'" M 4-dimethylaminoaniline alone. The higher the concentration o f aqueous
formaldehyde, the greater the change in spectrum observed. A l l reactions are complete
by the first spectrum (Figure 2.6).
60
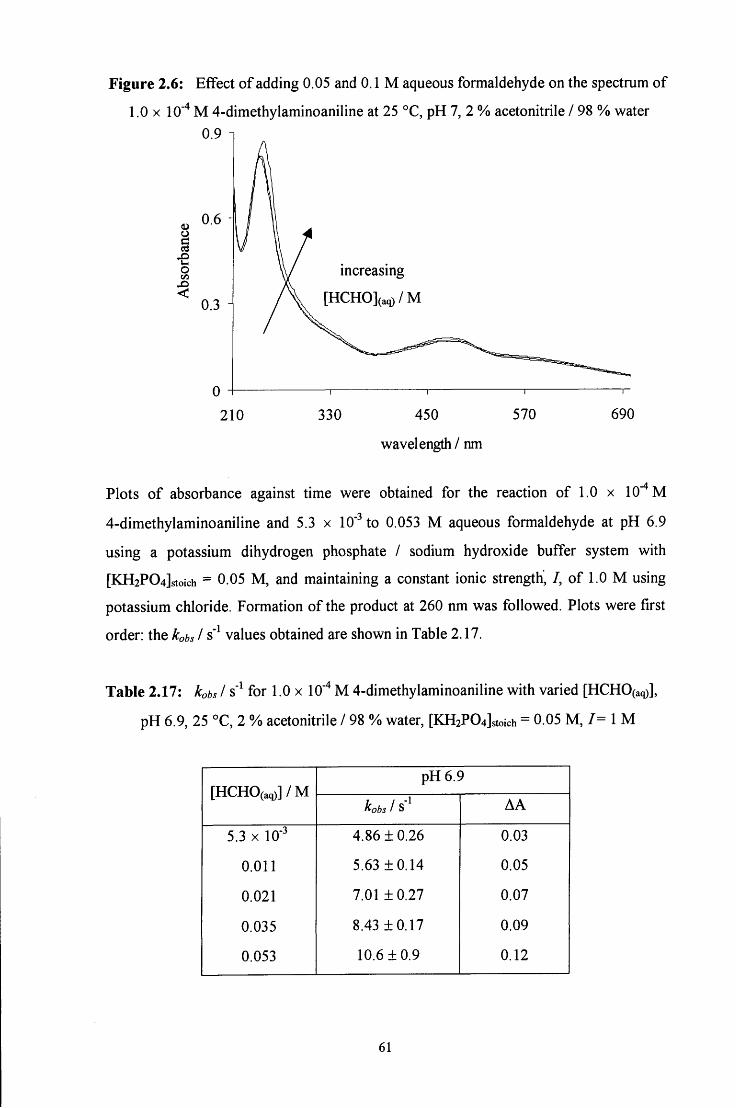
Figure 2.6: Effect o f adding 0.05 and 0.1 M aqueous formaldehyde on the spectrum of
1.0 X lO'"* M 4-dimethylaminoaniline at 25 °C, pH 7, 2 % acetonitrile / 98 % water
0.9 1
increasing
[HCHO](aq) /M
210 330 450 570
wavelength / nm
690
Plots o f absorbance against time were obtained for the reaction o f 1.0 x 10" M
4-dimethylaminoaniline and 5.3 x 10' to 0.053 M aqueous formaldehyde at pH 6.9
using a potassium dihydrogen phosphate / sodium hydroxide buffer system with
[KH2P04]stoich = 0.05 M , and maintaining a constant ionic strength, / , o f 1.0 M using
potassium chloride. Formation o f the product at 260 nm was followed. Plots were first
order: the kobs I s" values obtained are shown in Table 2.17.
Table 2.17: kobs I s" for 1.0 x 10""* M 4-dimethylaminoaniline with varied [HCHO(aq)],
p H 6.9, 25 °C, 2 % acetonitrile / 98 % water, [KH2P04]stoich = 0.05 M , / = 1 M
[HCHO(aq) ] /M pH 6.9
[HCHO(aq) ] /M kobs 1 S AA
5.3 X 10" 4.86 ± 0 . 2 6 0.03
0.011 5.63 ± 0 . 1 4 0.05
0.021 7.01 ± 0 . 2 7 0.07
0.035 8.43 ± 0 . 1 7 0.09
0.053 10.6 ± 0 . 9 0.12
61
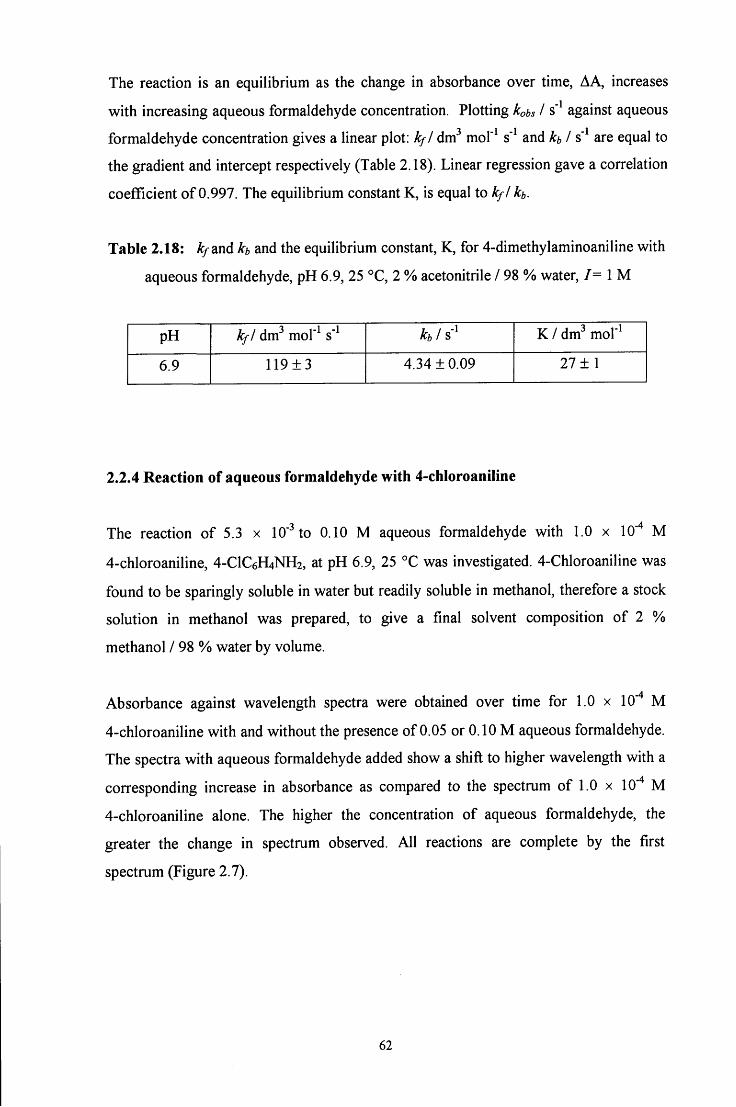
The reaction is an equilibrium as the change in absorbance over time, AA, increases
wi th increasing aqueous formaldehyde concentration. Plotting kobs I s** against aqueous
formaldehyde concentration gives a linear plot: kfl dm^ mol"^ s" and h I s' are equal to
the gradient and intercept respectively (Table 2.18). Linear regression gave a correlation
coefficient o f 0.997. The equilibrium constant K, is equal to kfl h.
Table 2.18: ^/and h and the equilibrium constant, K, for 4-dimethylaminoaniline with
aqueous formaldehyde, pH 6.9, 25 °C, 2 % acetonitrile / 98 % water, 7= 1 M
pH O 1 1
k f l dm mol" s" h 1 K / dm^ mol"*
6.9 1 1 9 ± 3 4.34 ± 0 . 0 9 27 ± 1
2.2.4 Reaction of aqueous formaldehyde with 4-chloroaniline
The reaction o f 5.3 x 10" to 0.10 M aqueous formaldehyde with 1.0 x 10" M
4-chloroaniline, 4-CIC6H4NH2, at pH 6.9, 25 °C was investigated. 4-Chloroaniline was
found to be sparingly soluble in water but readily soluble in methanol, therefore a stock
solution in methanol was prepared, to give a final solvent composition o f 2 %
methanol / 98 % water by volume.
Absorbance against wavelength spectra were obtained over time for 1.0 x 10""* M
4-chloroaniline wi th and without the presence of 0.05 or 0.10 M aqueous formaldehyde.
The spectra with aqueous formaldehyde added show a shift to higher wavelength with a
corresponding increase in absorbance as compared to the spectrum o f 1.0 x 10'"* M
4-chloroaniline alone. The higher the concentration o f aqueous formaldehyde, the
greater the change in spectrum observed. A l l reactions are complete by the first
spectrum (Figure 2.7).
62
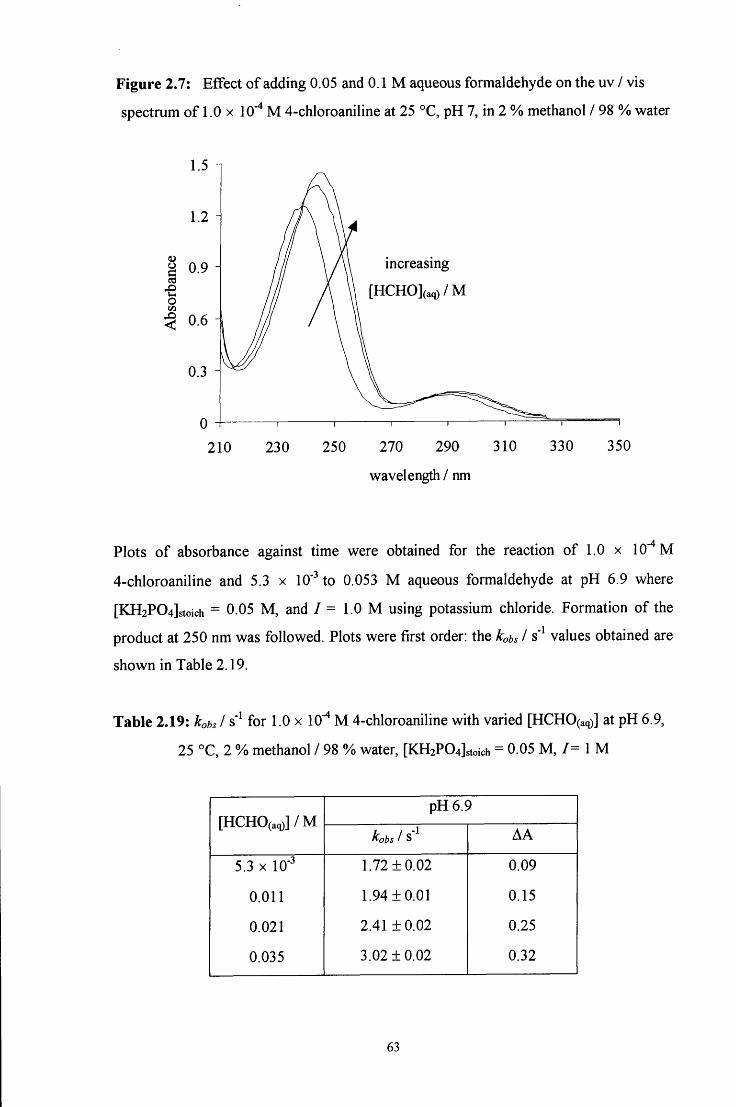
Figure 2.7: Effect o f adding 0.05 and 0.1 M aqueous formaldehyde on the uv / vis
spectrum o f 1.0 x 10""* M 4-chloroaniline at 25 °C, pH 7, in 2 % methanol / 98 % water
i o
increasing
[HCHO](aq) /M
210 230 250 270 290 310
wavelength / nm
330 350
Plots o f absorbance against time were obtained for the reaction o f 1.0 x 10" M
4-chloroaniline and 5.3 x 10' to 0.053 M aqueous formaldehyde at pH 6.9 where
[KH2P04]stoich = 0.05 M , and / = 1.0 M using potassium chloride. Formation o f the
product at 250 nm was followed. Plots were first order: the kobs I s" values obtained are
shown in Table 2.19.
Table 2.19: kobs I s" for 1.0 x 10"* M 4-chloroaniline with varied [HCHO(aq)] at pH 6.9,
25 °C, 2 % methanol / 98 % water, [KH2P04]stoich = 0.05 M , / = 1 M
[HCHO(aq) ] /M pH 6.9
[HCHO(aq) ] /M kobs / S A A
5.3 X 10" 1.72 ± 0 . 0 2 0.09
0.011 1.94 ± 0 . 0 1 0.15
0.021 2.41 ± 0 . 0 2 0.25
0.035 3.02 ± 0 . 0 2 0.32
63
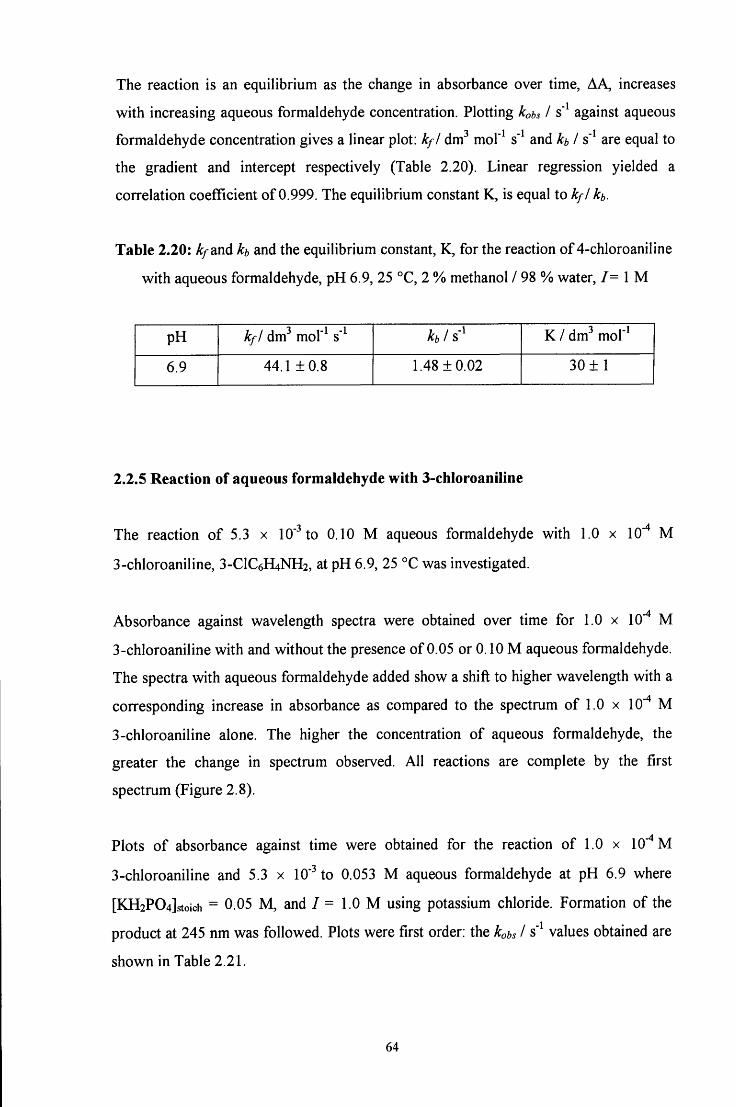
The reaction is an equilibrium as the change in absorbance over time, AA, increases
wi th increasing aqueous formaldehyde concentration. Plotting kobs I s" against aqueous
formaldehyde concentration gives a linear plot: kfl dm^ mol'^ s" and h I s'* are equal to
the gradient and intercept respectively (Table 2.20). Linear regression yielded a
correlation coefficient o f 0.999. The equilibrium constant K, is equal to kfl kb.
Table 2.20: ^/and h and the equilibrium constant, K, for the reaction o f 4-chloroaniIine
with aqueous formaldehyde, pH 6.9, 25 °C, 2 % methanol / 98 % water, 7= 1 M
pH k f l dm mol' s" kb 1 K / dm^ mol'^
6.9 44.1 ± 0 . 8 1.48 ± 0 . 0 2 30 ± 1
2.2.5 Reaction of aqueous formaldehyde with 3-chloroaniline
The reaction o f 5.3 x 10'^ to 0.10 M aqueous formaldehyde with 1.0 x 10" M
3-chloroaniline, 3-CIC6H4NH2, at pH 6.9, 25 °C was investigated.
Absorbance against wavelength spectra were obtained over time for 1.0 x 10" M
3-chloroaniline with and without the presence of 0.05 or 0.10 M aqueous formaldehyde.
The spectra with aqueous formaldehyde added show a shift to higher wavelength with a
corresponding increase in absorbance as compared to the spectrum o f 1.0 x 10" M
3-chloroaniline alone. The higher the concentration o f aqueous formaldehyde, the
greater the change in spectrum observed. A l l reactions are complete by the first
spectrum (Figure 2.8).
Plots o f absorbance against time were obtained for the reaction o f 1.0 x 10" M
3-chloroaniline and 5.3 x 10" to 0.053 M aqueous formaldehyde at pH 6.9 where
[KH2P04]stoich = 0.05 M , and 7 = 1.0 M using potassium chloride. Formation of the
product at 245 nm was followed. Plots were first order: the kobs I s' values obtained are
shown in Table 2.21.
64
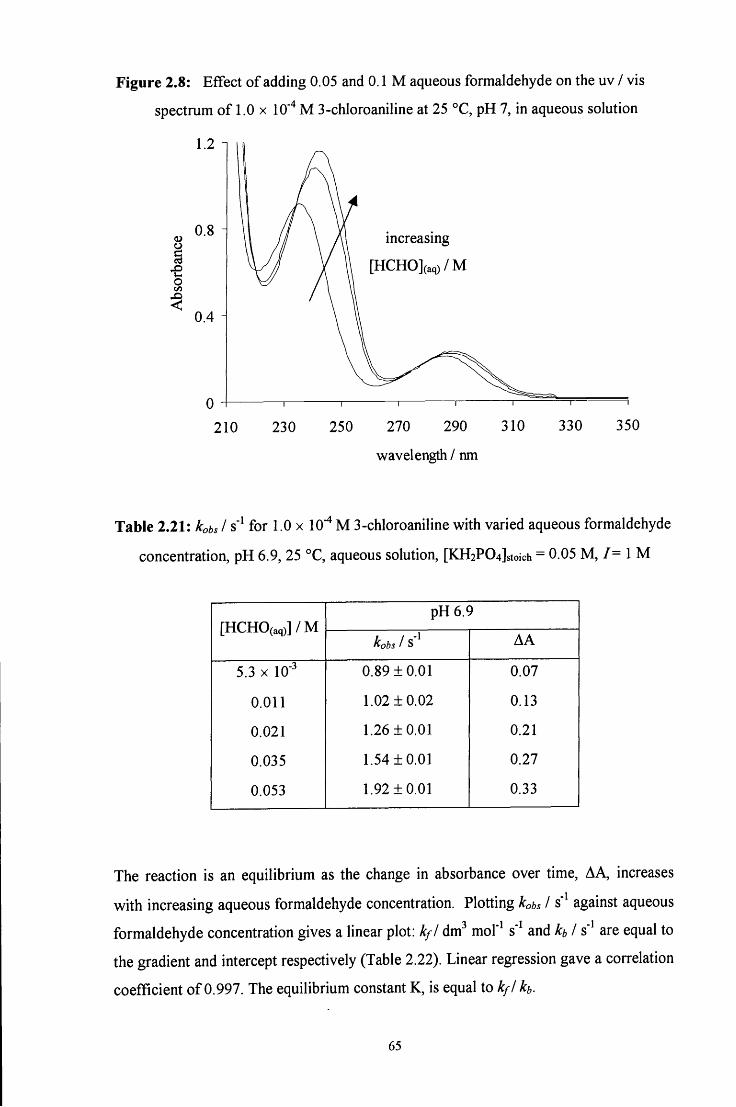
Figure 2.8: Effect o f adding 0.05 and 0.1 M aqueous formaldehyde on the uv / vis
spectrum o f 1.0 x 10""* M 3-chloroaniline at 25 °C, pH 7, in aqueous solution
1.2
I O
0.8
0.4
increasing
[HCHO](aq) /M
210 230 250 270 290 310
wavelength / nm
330 350
Table 2.21: kobs I s" for 1.0 x 10""* M 3-chloroaniline with varied aqueous formaldehyde
concentration, pH 6.9, 25 °C, aqueous solution, [KH2P04]stoich = 0.05 M , / = 1 M
[HCHO(aq) ] /M pH6.9
[HCHO(aq) ] /M kobs 1 S AA
5.3 X 10- 0.89 ± 0 . 0 1 0.07
0.011 1.02 ± 0 . 0 2 0.13
0.021 1.26 ± 0 . 0 1 0.21
0.035 1.54 ± 0 . 0 1 0.27
0.053 1.92 ± 0 . 0 1 0.33
The reaction is an equilibrium as the change in absorbance over time, AA, increases
wi th increasing aqueous formaldehyde concentration. Plotting kobs I s" against aqueous
formaldehyde concentration gives a linear plot: kfl dm^ mol'* s" and h I s" are equal to
the gradient and intercept respectively (Table 2.22). Linear regression gave a correlation
coefficient o f 0.997. The equilibrium constant K, is equal to kfl h.
65
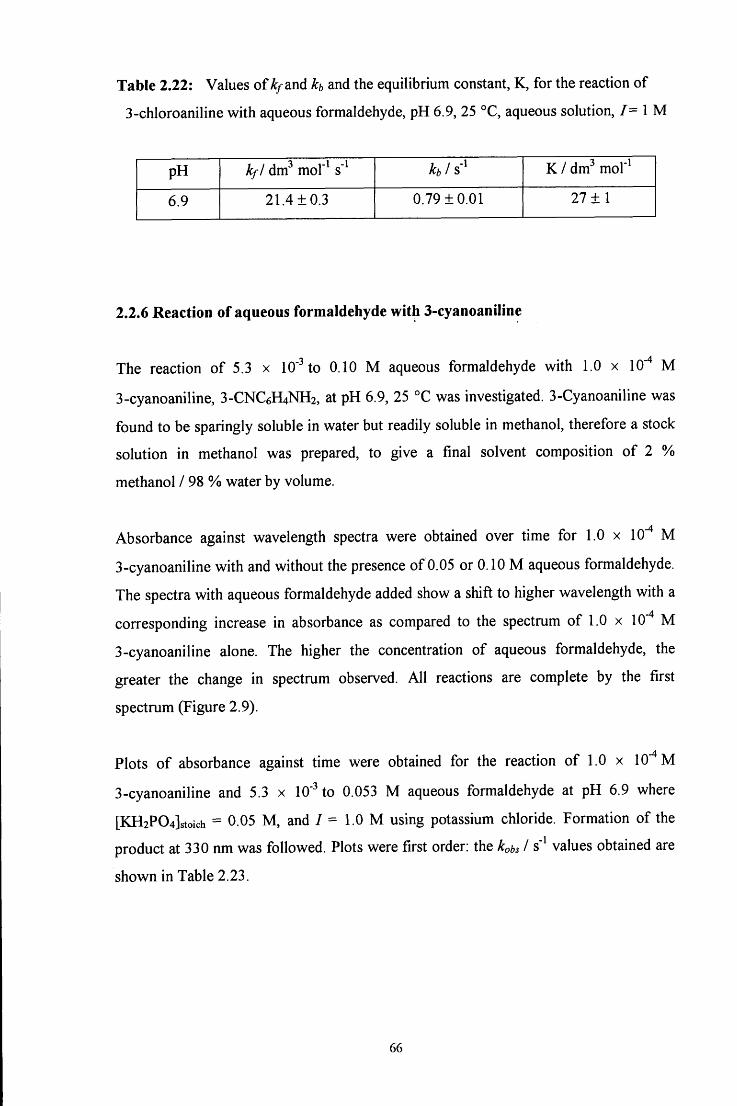
Table 2.22: Values o f ^/and kb and the equilibrium constant, K, for the reaction of
3-chloroaniline with aqueous formaldehyde, pH 6.9, 25 °C, aqueous solution, / = 1 M
pH kfl drr? mol'^ s' kb 1 K / dm^ mol"^
6.9 21.4 ± 0 . 3 0.79 ± 0 . 0 1 27 + 1
2.2.6 Reaction of aqueous formaldehyde with 3-cyanoaniline
The reaction o f 5.3 x 10'^ to 0.10 M aqueous formaldehyde with 1.0 x 10""* M
3-cyanoaniline, 3-CNC6H4NH2, at pH 6.9, 25 °C was investigated. 3-Cyanoaniline was
found to be sparingly soluble in water but readily soluble in methanol, therefore a stock
solution in methanol was prepared, to give a final solvent composition o f 2 %
methanol / 98 % water by volume.
Absorbance against wavelength spectra were obtained over time for 1.0 x 10"* M
3-cyanoaniline with and without the presence of 0.05 or 0.10 M aqueous formaldehyde.
The spectra with aqueous formaldehyde added show a shift to higher wavelength with a
corresponding increase in absorbance as compared to the spectrum of 1.0 x 10""* M
3-cyanoaniline alone. The higher the concentration o f aqueous formaldehyde, the
greater the change in spectrum observed. A l l reactions are complete by the first
spectrum (Figure 2.9).
Plots o f absorbance against time were obtained for the reaction o f 1.0 x 10"* M
3-cyanoaniline and 5.3 x 10" to 0.053 M aqueous formaldehyde at pH 6.9 where
[KH2P04]stoich = 0.05 M , and / = 1.0 M using potassium chloride. Formation of the
product at 330 nm was followed. Plots were first order: the kobs I s"* values obtained are
shown in Table 2.23.
66
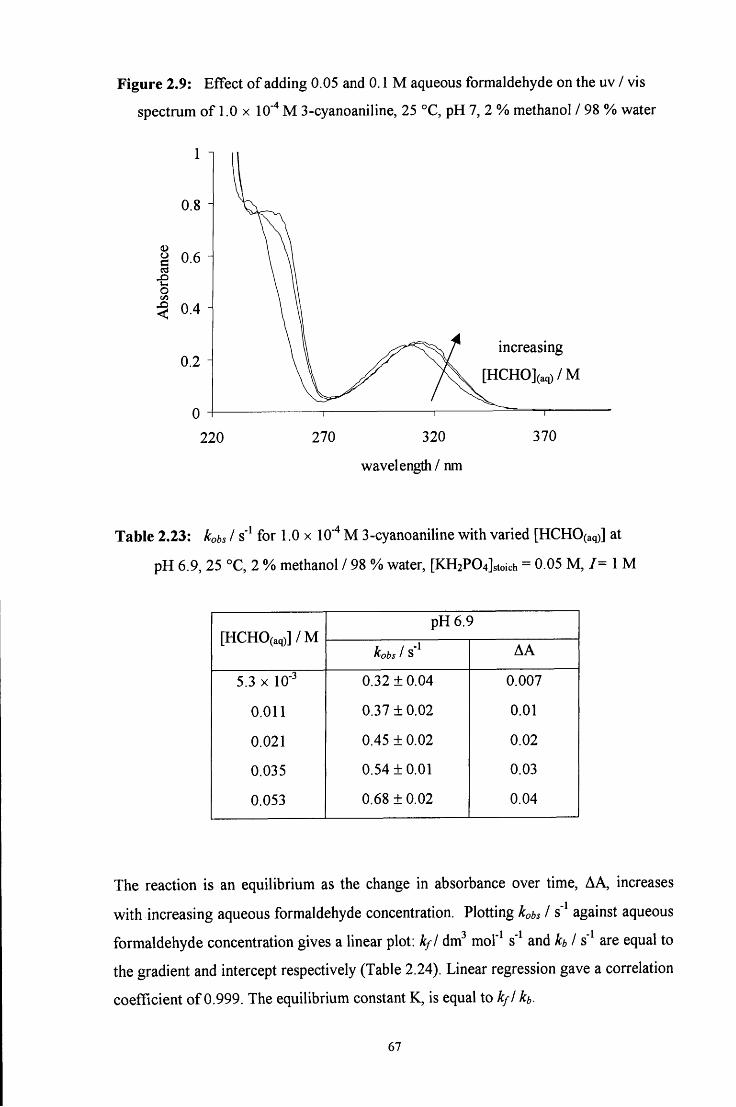
Figure 2.9: Effect o f adding 0.05 and 0.1 M aqueous formaldehyde on the uv / vis
spectrum o f 1.0 x 10"* M 3-cyanoaniline, 25 °C, pH 7, 2 % methanol / 98 % water
0.8 i
a 0.6
o 0.4
0.2
220
increasing
[HCHO](aq) /M
270 320
wavelength / nm
370
Table 2.23: kots I s" for 1.0 x lO'"* M 3-cyanoaniline wi th varied [HCHO(aq)] at
p H 6.9, 25 °C, 2 % methanol / 98 % water, [KH2P04]stoich = 0.05 M , 7= 1 M
[HCHO(aq) ] /M pH 6.9
[HCHO(aq) ] /M kobs 1 S AA
5.3 X 10- 0.32 ± 0 . 0 4 0.007
0.011 0.37 ± 0.02 0.01
0.021 0.45 ± 0.02 0.02
0.035 0.54 ± 0 . 0 1 0.03
0.053 0.68 ± 0.02 0.04
The reaction is an equilibrium as the change in absorbance over time, AA, increases
wi th increasing aqueous formaldehyde concentration. Plotting kobs I s' against aqueous
formaldehyde concentration gives a linear plot: kfl dm^ mol"^ s" and kb I s" are equal to
the gradient and intercept respectively (Table 2.24). Linear regression gave a correlation
coefficient o f 0.999. The equilibrium constant K, is equal to kfl kb.
67
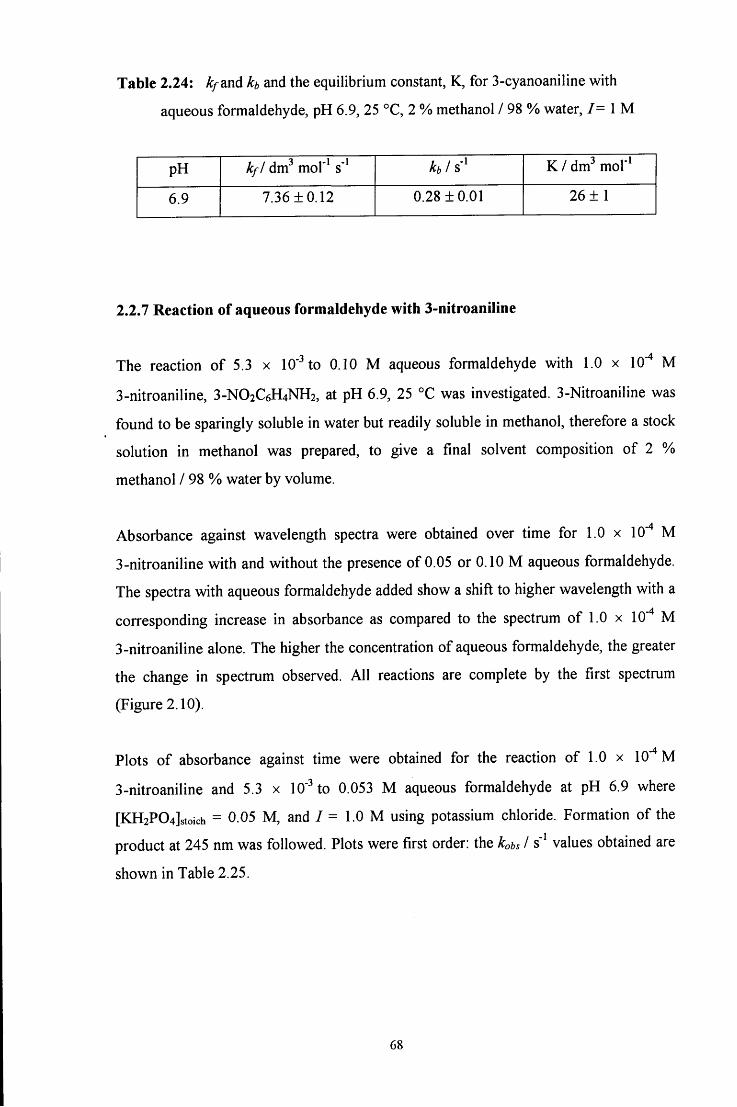
Table 2.24: k/md h and the equilibrium constant, K, for 3-cyanoaniline with
aqueous formaldehyde, pH 6.9, 25 °C, 2 % methanol / 98 % water, / = 1 M
pH kfl dm^ mol'^ s' kb 1 K / dm^ mol'^
6.9 7.36 ±0.12 0.28 ±0.01 26 ± 1
2.2.7 Reaction of aqueous formaldehyde with 3-nitroaiiiline
The reaction of 5.3 x 10" to 0.10 M aqueous formaldehyde with 1.0 x 10" M
3-nitroaniline, 3-NO2C6H4NH2, at pH 6.9, 25 °C was investigated. 3-NitroaniIine was
found to be sparingly soluble in water but readily soluble in methanol, therefore a stock
solution in methanol was prepared, to give a final solvent composition of 2 %
methanol / 98 % water by volume.
Absorbance against wavelength spectra were obtained over time for 1.0 x 10" M
3-nitroaniline with and without the presence of 0.05 or 0.10 M aqueous formaldehyde.
The spectra with aqueous formaldehyde added show a shift to higher wavelength with a
corresponding increase in absorbance as compared to the spectrum of 1.0 x lO'"* M
3-nitroaniline alone. The higher the concentration of aqueous formaldehyde, the greater
the change in spectrum observed. All reactions are complete by the first spectrum
(Figure 2.10).
Plots of absorbance against time were obtained for the reaction of 1.0 x 10" M
3-nitroaniline and 5.3 x 10' to 0.053 M aqueous formaldehyde at pH 6.9 where
[KH2P04]stoich = 0.05 M , and / = 1.0 M using potassium chloride. Formation of the
product at 245 nm was followed. Plots were first order: the kots I s' values obtained are
shown in Table 2.25.
68
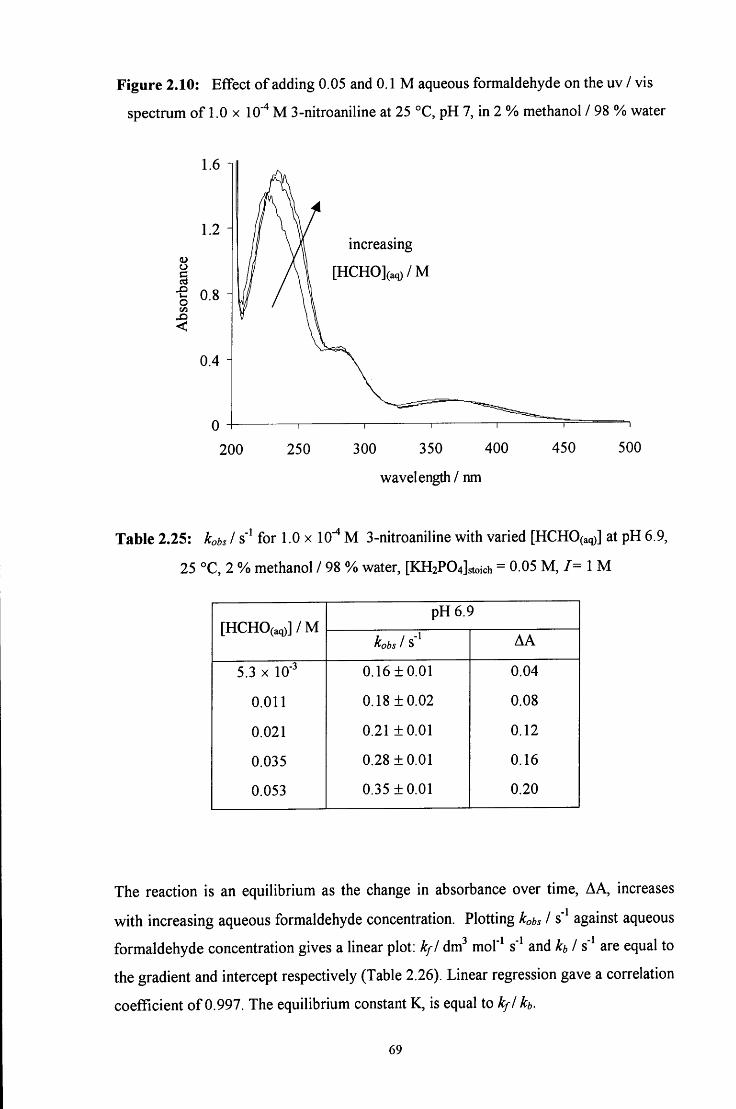
Figure 2.10: Effect of adding 0.05 and 0.1 M aqueous formaldehyde on the uv / vis
spectrum of 1.0 x 10"" M 3-nitroaniline at 25 °C, pH 7, in 2 % methanol / 98 % water
O u o
1.6
1.2
0.8
0.4 H
mcreasmg
[HCHO](aq) /M
200 250 300 350 400
wavelength / nm
450 500
Table 2.25: kobs I s' for 1.0 x 10"* M 3-nitroaniline with varied [HCHO(aq)] at pH 6.9,
25 °C, 2 % methanol / 98 % water, [KH2P04]stoich = 0.05 M , / = 1 M
[HCHO(aq) ] /M pH6.9
[HCHO(aq) ] /M kobs 1 S AA
5.3 X 10" 0.16 + 0.01 0.04
0.011 0.18 ±0.02 0.08
0.021 0.21 ±0.01 0.12
0.035 0.28 ±0.01 0.16
0.053 0.35 ±0.01 0.20
The reaction is an equilibrium as the change in absorbance over time, AA, increases
with increasing aqueous formaldehyde concentration. Plotting kobs I s' against aqueous
formaldehyde concentration gives a linear plot, kfl dm^ mol'^ s' and h I s" are equal to
the gradient and intercept respectively (Table 2.26). Linear regression gave a correlation
coefficient of 0.997. The equilibrium constant K, is equal to kfl h.
69
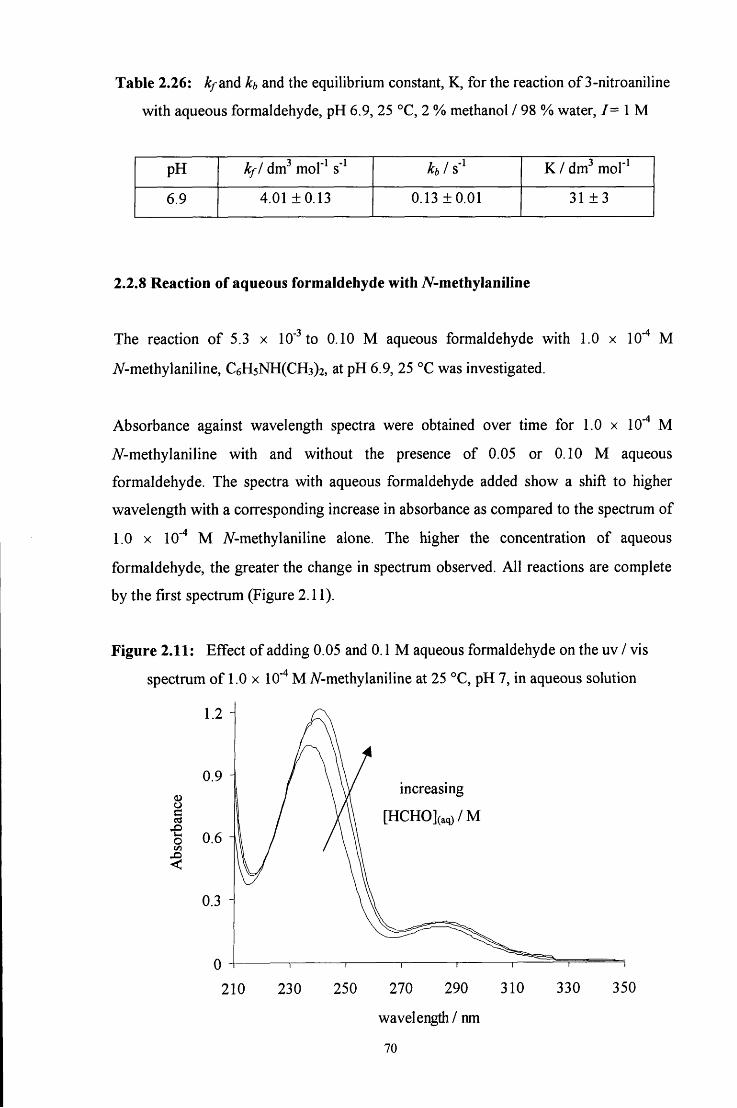
Table 2.26: kfand kb and the equilibrium constant, K, for the reaction of 3-nitroaniline
with aqueous formaldehyde, pH 6.9, 25 °C, 2 % methanol / 98 % water, / = 1 M
pH kf/ dm^ mol"^ s' kb 1 s- K/dm^ mol"^
6.9 4.01 ±0.13 0.13 ±0.01 31 ± 3
2.2.8 Reaction of aqueous formaldehyde with A^-methylaniline
The reaction of 5.3 x 10' to 0.10 M aqueous formaldehyde with 1.0 x 10" M
A^-methylaniline, C6H5NH(CH3)2, at pH 6.9, 25 °C was investigated.
Absorbance against wavelength spectra were obtained over time for 1.0 x 10'"* M
7V-methylaniline with and without the presence of 0.05 or 0.10 M aqueous
formaldehyde. The spectra with aqueous formaldehyde added show a shift to higher
wavelength with a corresponding increase in absorbance as compared to the spectrum of
1.0 X 10""* M iV-methylaniline alone. The higher the concentration of aqueous
formaldehyde, the greater the change in spectrum observed. All reactions are complete
by the first spectrum (Figure 2.11).
Figure 2.11: Effect of adding 0.05 and 0.1 M aqueous formaldehyde on the uv / vis
spectrum of 1.0 x lO'"* MiV-methylaniline at 25 °C, pH 7, in aqueous solution
1.2
o
o
0.9 i
0.6
0.3 H
increasing
[HCHO](aco/M
0 i \ 1 1 1 r
210 230 250 270 290 310 330 350
wavelength / nm
70
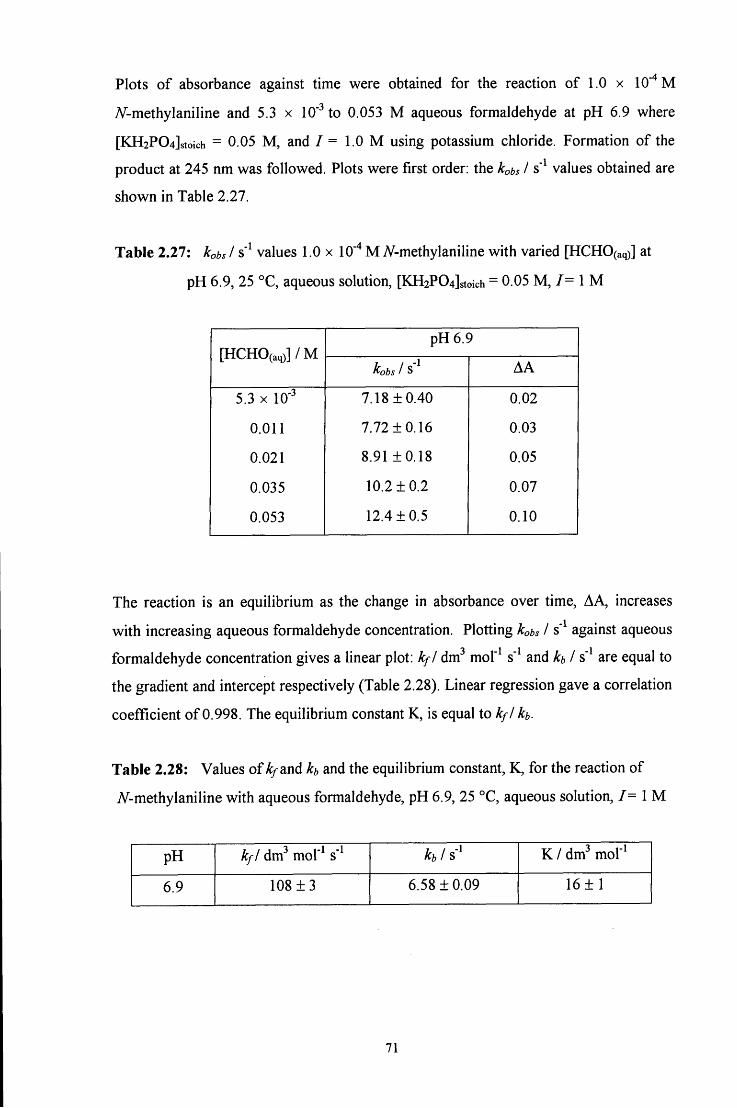
Plots of absorbance against time were obtained for the reaction of 1.0 x 10" M
7V-methylaniline and 5.3 x 10" to 0.053 M aqueous formaldehyde at pH 6.9 where
[KH2P04]stoich = 0.05 M , and / = 1.0 M using potassium chloride. Formation of the
product at 245 nm was followed. Plots were first order: the kobs I s' values obtained are
shown in Table 2.27.
Table 2.27: kobs I s' values 1.0 x 10" M A'^methylaniline with varied [HCHO(aq)] at
pH 6.9, 25 °C, aqueous solution, [KH2P04]stoich = 0.05 M , / = 1 M
[HCHO(aco]/M pH6.9
[HCHO(aco]/M kobs 1 S AA
5.3 X 10' 7.18 ±0.40 0.02
0.011 7.72 ±0.16 0.03
0.021 8.91 ±0.18 0.05
0.035 10.2 ±0.2 0.07
0.053 12.4 ±0.5 0.10
The reaction is an equilibrium as the change in absorbance over time, AA, increases
with increasing aqueous formaldehyde concentration. Plotting kobs I s' against aqueous o i l 1
formaldehyde concentration gives a linear plot: kfl dm mol" s" and h I s" are equal to
the gradient and intercept respectively (Table 2.28). Linear regression gave a correlation
coefficient of 0.998. The equilibrium constant K, is equal to kfl h.
Table 2.28: Values of ^/and h and the equilibrium constant, K, for the reaction of
iV-methylaniline with aqueous formaldehyde, pH 6.9, 25 °C, aqueous solution, / = 1 M
pH kfl dm^ mol'^ s' hls^ K/dm^mor^
6.9 108 ± 3 6.58 ±0.09 16± 1
71
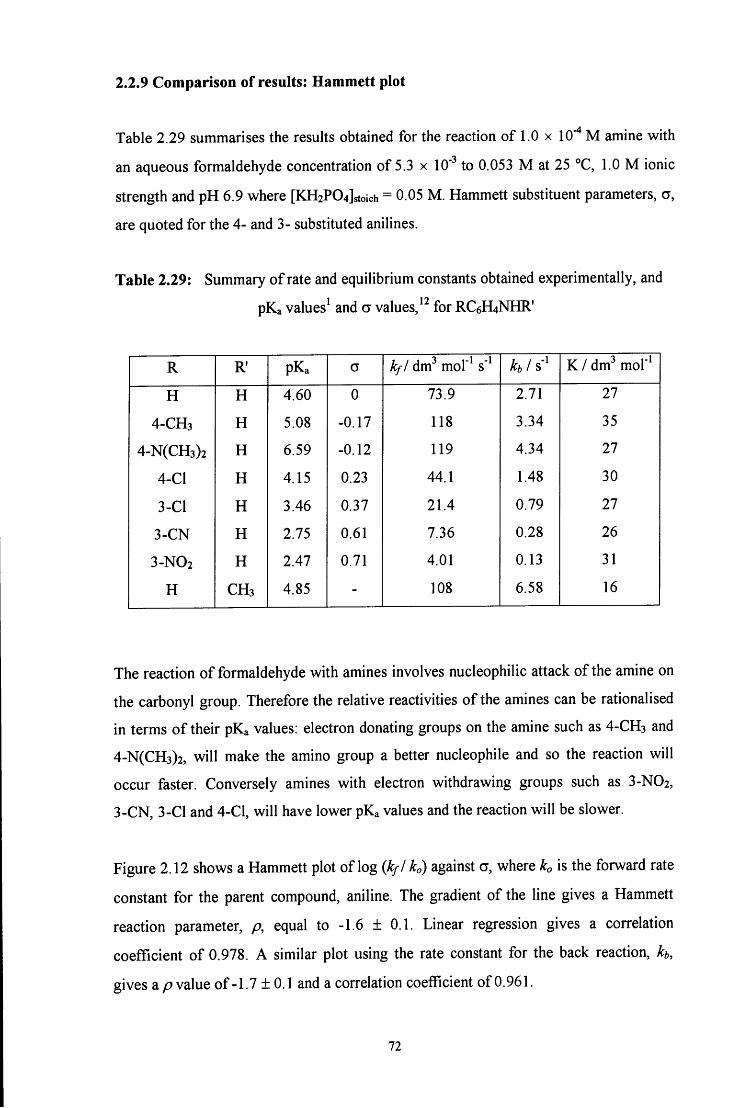
2.2.9 Comparison of results: Hammett plot
Table 2.29 summarises the results obtained for the reaction of 1.0 x 10" M amine with
an aqueous formaldehyde concentration of 5.3 x 10' to 0.053 M at 25 °C, 1.0 M ionic
strength and pH 6.9 where [KH2P04]stoich = 0.05 M . Hammett substituent parameters, a,
are quoted for the 4- and 3- substituted anilines.
Table 2.29: Summary of rate and equilibrium constants obtained experimentally, and
pKa values^ and a values, for RC6H4NHR'
R R' pKa 0 kfl dm^ mol"^ s' h 1 K / dm^ mol'^
H H 4.60 0 73.9 111 27
4-CH3 H 5.08 -0.17 118 3.34 35
4-N(CH3)2 H 6.59 -0.12 119 4.34 27
4-Cl H 4.15 0.23 44.1 1.48 30
3-Cl H 3.46 0.37 21.4 0.79 27
3-CN H 2.75 0.61 7.36 0.28 26
3-NO2 H 2.47 0.71 4.01 0.13 31
H CH3 4.85 - 108 6.58 16
The reaction of formaldehyde with amines involves nucleophilic attack of the amine on
the carbonyl group. Therefore the relative reactivities of the amines can be rationalised
in terms of their pKa values: electron donating groups on the amine such as 4-CH3 and
4-N(CH3)2, will make the amino group a better nucleophile and so the reaction will
occur faster. Conversely amines with electron withdrawing groups such as 3-NO2,
3-CN, 3-CI and 4-Cl, will have lower pKa values and the reaction will be slower.
Figure 2.12 shows a Hammett plot of log {kfl ko) against a, where ko is the forward rate
constant for the parent compound, aniline. The gradient of the line gives a Hammett
reaction parameter, p, equal to -1.6 ± 0.1. Linear regression gives a correlation
coefficient of 0.978. A similar plot using the rate constant for the back reaction, h,
gives a/? value of-1.7 ± 0.1 and a correlation coefficient of 0.961.
72
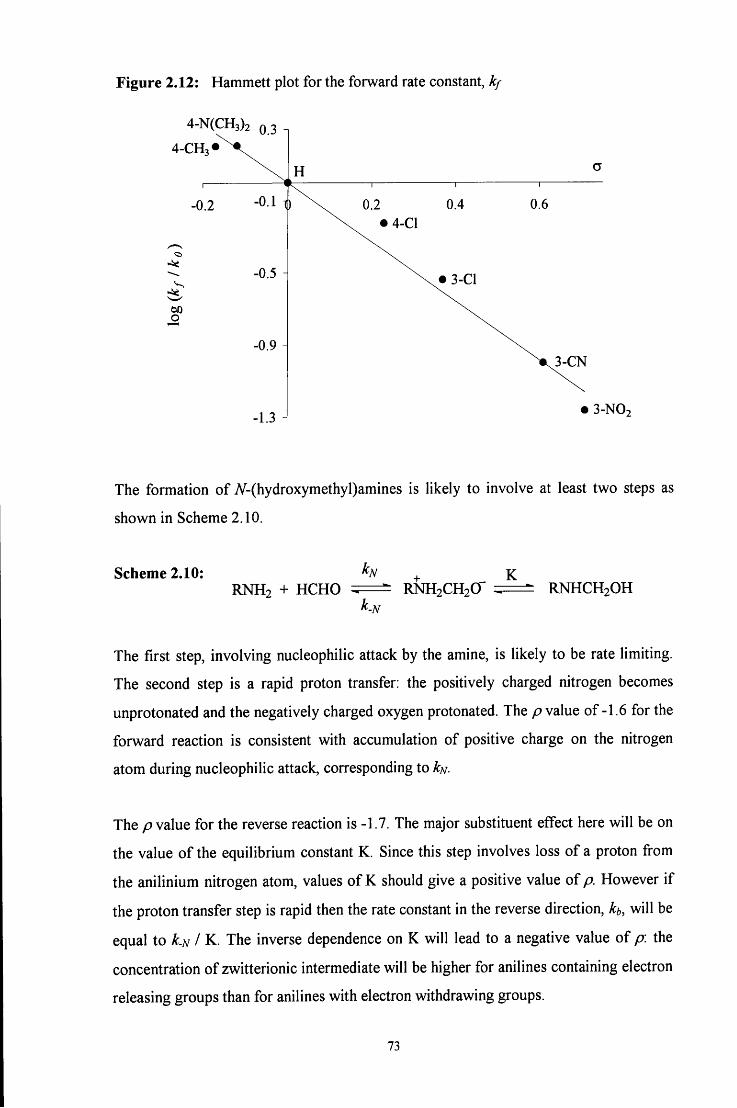
Figure 2.12: Hammett plot for the forward rate constant, kf
4-N(CH3)2 0.3 , 4-CH3
-0.2 -01 i
o
0.2 0.4 0.6 • 4-Cl
• 3-Cl
•1.3 -J 3-NO,
The formation of 7V-(hydroxymethyl)amines is likely to involve at least two steps as
shown in Scheme 2.10.
Scheme 2.10: RNH2 + HCHO ^
k. •N
+ _ K RNH2CH2O ^ RNHCH2OH
The first step, involving nucleophilic attack by the amine, is likely to be rate limiting.
The second step is a rapid proton transfer: the positively charged nitrogen becomes
unprotonated and the negatively charged oxygen protonated. The p value of -1.6 for the
forward reaction is consistent with accumulation of positive charge on the nitrogen
atom during nucleophilic attack, corresponding to kN.
The >o value for the reverse reaction is -1.7. The major substituent effect here will be on
the value of the equilibrium constant K. Since this step involves loss of a proton from
the anilinium nitrogen atom, values of K should give a positive value of p. However i f
the proton transfer step is rapid then the rate constant in the reverse direction, kb, will be
equal to k.N I K. The inverse dependence on K will lead to a negative value of p: the
concentration of zwitterionic intermediate will be higher for anilines containing electron
releasing groups than for anilines with electron withdrawing groups.
73
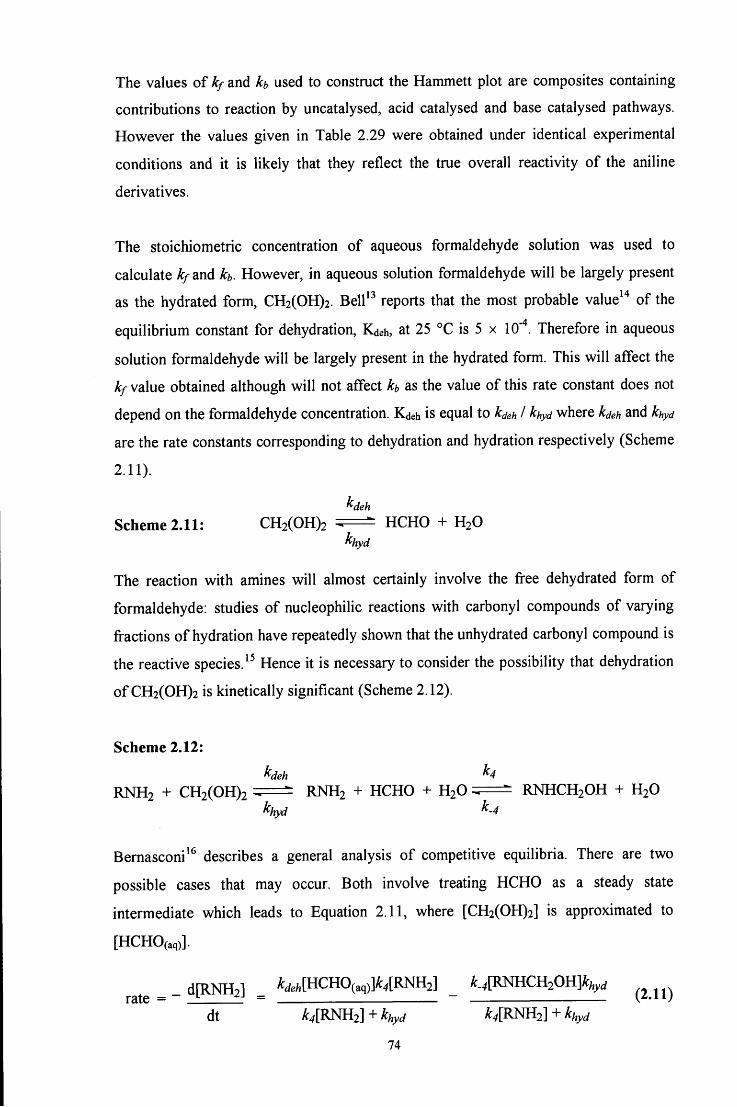
The values of kf and h used to construct the Hammett plot are composites containing
contributions to reaction by uncatalysed, acid catalysed and base catalysed pathways.
However the values given in Table 2.29 were obtained under identical experimental
conditions and it is likely that they reflect the true overall reactivity of the aniline
derivatives.
The stoichiometric concentration of aqueous formaldehyde solution was used to
calculate kf and h. However, in aqueous solution formaldehyde will be largely present
as the hydrated form, CH2(OH)2. Bell^^ reports that the most probable value ' of the
equilibrium constant for dehydration, Kdeh, at 25 °C is 5 x 10'" . Therefore in aqueous
solution formaldehyde will be largely present in the hydrated form. This will affect the
kf value obtained although will not affect h as the value of this rate constant does not
depend on the formaldehyde concentration. Kdeh is equal to kdeh I hyd where kdeh and hyd
are the rate constants corresponding to dehydration and hydration respectively (Scheme
2.11).
kdeh Scheme 2.11: CH2(OH)2 HCHO + H2O
khyd
The reaction with amines will almost certainly involve the free dehydrated form of
formaldehyde: studies of nucleophilic reactions with carbonyl compounds of varying
fractions of hydration have repeatedly shown that the unhydrated carbonyl compound is
the reactive species. Hence it is necessary to consider the possibility that dehydration
of CH2(OH)2 is kinetically significant (Scheme 2.12).
Scheme 2.12:
kdeh k4 RNH2 + CH2(OH)2 =^=^ RNH2 + HCHO + H2O RNHCH2OH + H2O
khyd k.4
Bemasconi^^ describes a general analysis of competitive equilibria. There are two
possible cases that may occur. Both involve treating HCHO as a steady state
intermediate which leads to Equation 2.11, where [CH2(OH)2] is approximated to
[HCHO(aq)].
d[RNH2l ^^e/,[HCH0(,q)fc[RNH2] ^ . 4 [ R N H C H 2 0 H ] ^ , , , rate = ~ tl = - (2.11)
dt ^^[RNH2] + khyd ^^[RNH2] + V
74
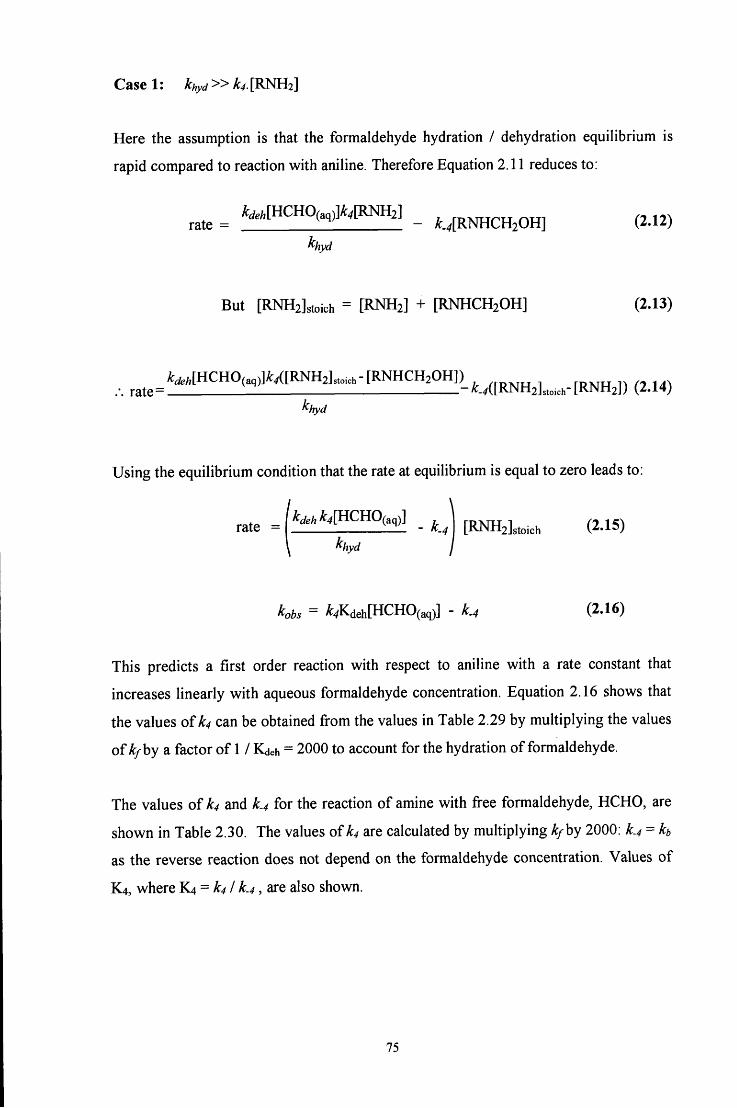
Case 1: khyd » k4. [RNH2]
Here the assumption is that the formaldehyde hydration / dehydration equilibrium is
rapid compared to reaction with aniline. Therefore Equation 2.11 reduces to:
rate = ^ ^ - ^ [ " ^ " ^ ( a c l ^ W ] _ . ^ f ^ c H . O H ] (2.12) hyd
But [RNH2]stoich = [RNH2] + [RNHCH2OH] (2.13)
rate= W H C H O , , J . X [ R N H . ] . . . , . - [ R N H C H . O H ] ) _ ^ ^ ^ ^ ^ ^ ^ ^ ^ ^^^^^^^
^hyd
Using the equilibrium condition that the rate at equilibrium is equal to zero leads to:
/
rate = ''"'"''^^^^^^^^'i'^ . k., [RNH2]„„i,, (2.15) ^hyd
Kbs = i^^Kdeh[HCHO(aq)] - k.4 (2.16)
This predicts a first order reaction with respect to aniline with a rate constant that
increases linearly with aqueous formaldehyde concentration. Equation 2.16 shows that
the values of k4 can be obtained fi'om the values in Table 2.29 by multiplying the values
of kfhy a factor of 1 / Kdeh = 2000 to account for the hydration of formaldehyde.
The values of k4 and k.4 for the reaction of amine with fi-ee formaldehyde, H C H O , are
shown in Table 2.30. The values of k4 are calculated by multiplying kfhy 2000: k.4 = kb
as the reverse reaction does not depend on the formaldehyde concentration. Values of
K4, where ¥^ = k41 k.4, are also shown.
75
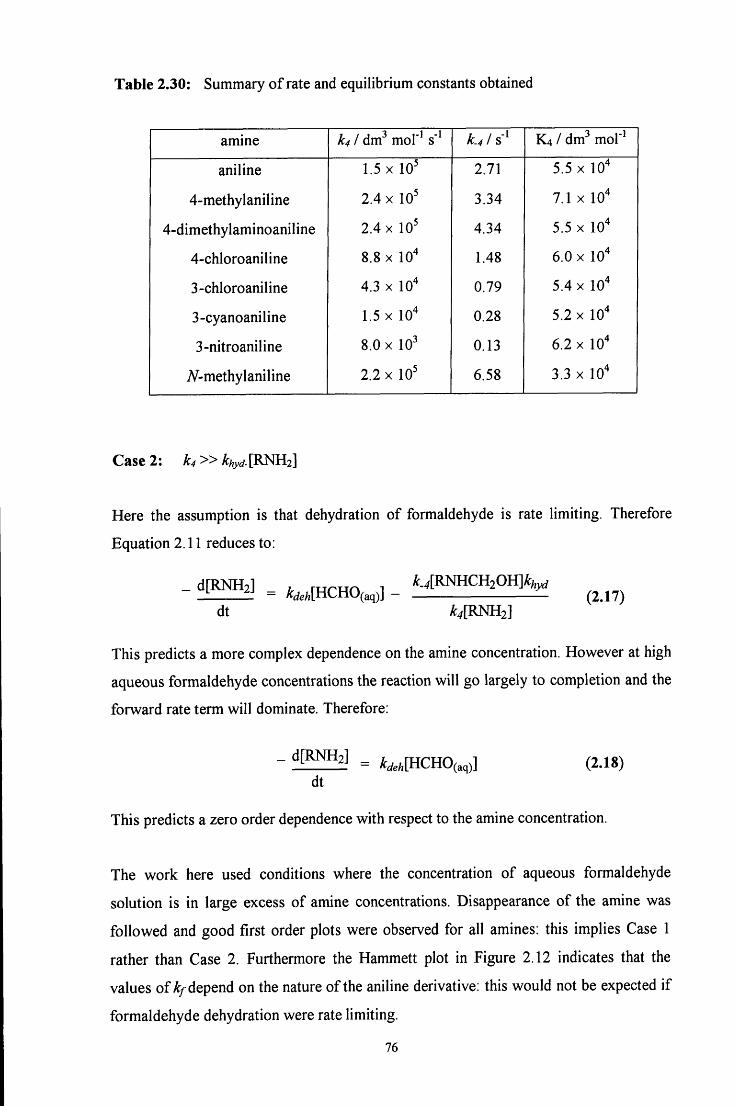
Table 2.30: Summary of rate and equilibrium constants obtained
amine k41 dm^ mol'^ s' k.4U-^ K4 / dm^ mol"^
aniline 1.5 X 10 2.71 5.5 X 10^
4-methylaniline 2.4 X 10 3.34 7.1 X lO'*
4-dimethylaminoaniline 2.4 X 10 4.34 5.5 X 10
4-chloroaniline 8.8 X lO'* 1.48 6.0 X lO'*
3-chloroaniline 4.3 X 10 0.79 5.4 X 10
3-cyanoaniline 1.5 X 10 0.28 5.2 X 10
3-nitroaniline 8.0 X 10 0.13 6.2 X 10
7V-methylaniline 2.2 X 10 6.58 3.3 X 10
Case 2: k4» hyd.[RNH2]
Here the assumption is that dehydration of formaldehyde is rate limiting. Therefore
Equation 2.11 reduces to:
- - WHCHO<,J - ^ - W H . O H ] V dt A: [RNH2]
This predicts a more complex dependence on the amine concentration. However at high
aqueous formaldehyde concentrations the reaction will go largely to completion and the
forward rate term will dominate. Therefore:
dt (2.18)
This predicts a zero order dependence with respect to the amine concentration.
The work here used conditions where the concentration of aqueous formaldehyde
solution is in large excess of amine concentrations. Disappearance of the amine was
followed and good first order plots were observed for all amines: this implies Case 1
rather than Case 2. Furthermore the Hammett plot in Figure 2.12 indicates that the
values of ^/depend on the nature of the aniline derivative: this would not be expected i f
formaldehyde dehydration were rate limiting.
76
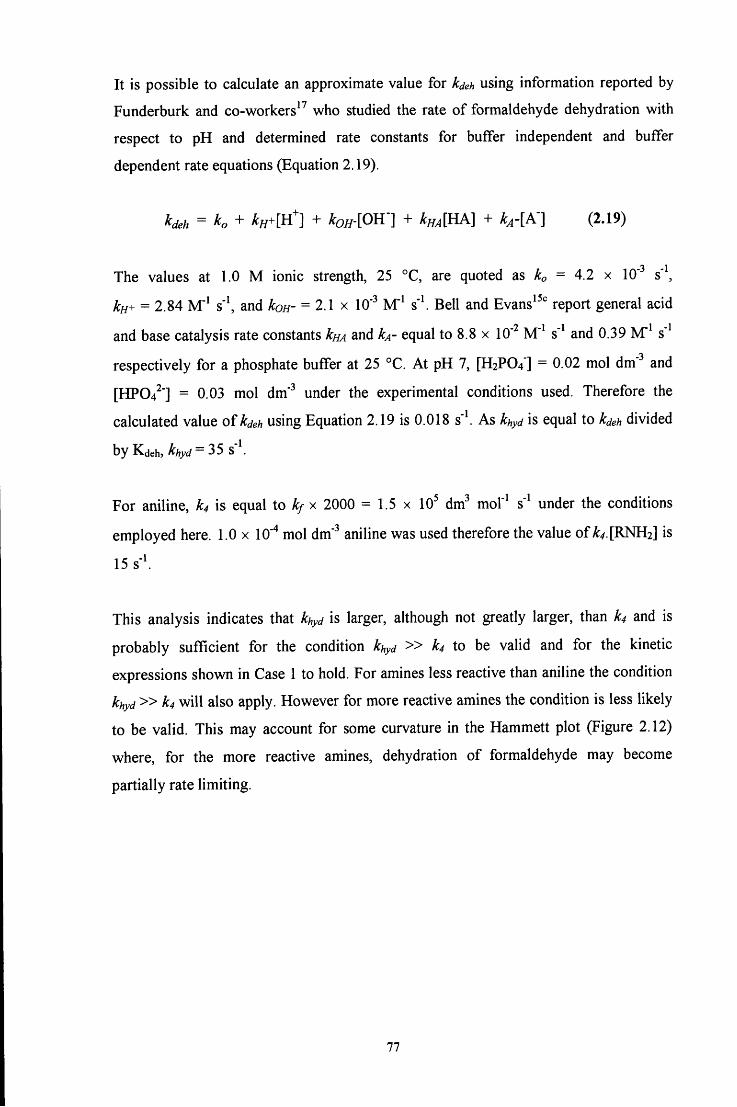
It is possible to calculate an approximate value for kdeh using information reported by
Funderburk and co-workers^^ who studied the rate of formaldehyde dehydration with
respect to pH and determined rate constants for buffer independent and buffer
dependent rate equations (Equation 2.19).
kdeh = ko + V [ h 1 + koH-m'] + kHA[iiA] + kAA-] (2.19)
The values at 1.0 M ionic strength, 25 °C, are quoted as ko = 4.2 x 10" s'\
kH+ = 2.84 M"^ s \ and koH- = 2.1 x 10" M"^ s'\ Bell and Evans^ ' report general acid
and base catalysis rate constants knA and kA- equal to 8.8 x 10' M"^ s" and 0.39 M"^ s'
respectively for a phosphate buffer at 25 °C. At pH 7, [H2PO4"] = 0.02 mol dm" and
[HP04^'] = 0.03 mol dm" under the experimental conditions used. Therefore the
calculated value of kdeh using Equation 2.19 is 0.018 s \ As khyd is equal to kdeh divided
by Kdeh, khyd = ^5 s \
For aniline, k4 is equal to kf x 2000 = 1.5 x 10 dm^ mol'^ s" under the conditions
employed here. 1.0 x 10'"* mol dm" aniline was used therefore the value of ^^.[RNH2] is
15 s-'.
This analysis indicates that khyd is larger, although not greatly larger, than k4 and is
probably sufficient for the condition khyd » k4 to be valid and for the kinetic
expressions shown in Case 1 to hold. For amines less reactive than aniline the condition
khyd » k4 wil l also apply. However for more reactive amines the condition is less likely
to be valid. This may account for some curvature in the Hammett plot (Figure 2.12)
where, for the more reactive amines, dehydration of formaldehyde may become
partially rate limiting.
77
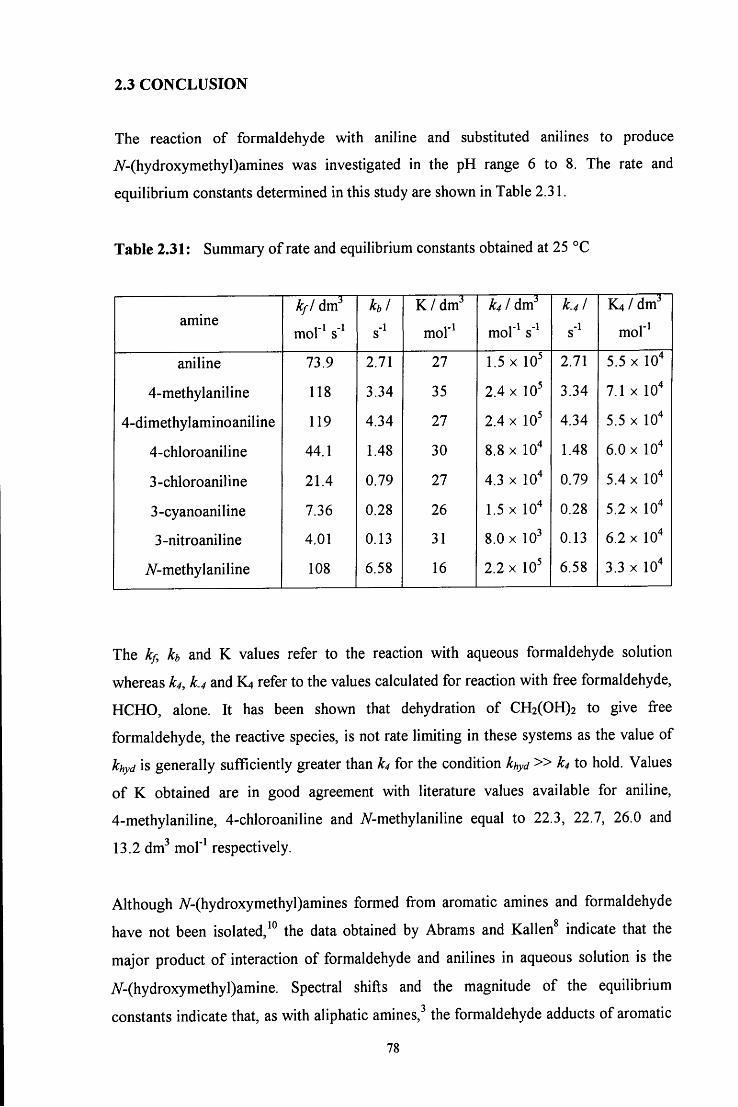
2.3 CONCLUSION
The reaction of formaldehyde with aniline and substituted anilines to produce
7V-(hydroxymethyl)amines was investigated in the pH range 6 to 8. The rate and
equilibrium constants determined in this study are shown in Table 2.31.
Table 2.31: Summary of rate and equilibrium constants obtained at 25 °C
amine kfl dm'
mof^ s-
h i K / d m '
mof^
k41 dm"*
mof^
k.4l K4/dm'
mof^
aniline 73.9 2.71 27 1.5 X 10 2.71 5.5 X 10
4-methylaniline 118 3.34 35 2.4 X 10 3.34 7.1 X 10
4-dimethylaminoaniline 119 4.34 27 2.4 X 10 4.34 5.5 X lO'*
4-chloroaniline 44.1 1.48 30 8.8 X 10 1.48 6.0 X 10
3-chloroaniline 21.4 0.79 27 4.3 X 10^ 0.79 5.4 X 10
3-cyanoaniline 7.36 0.28 26 1.5 X 10^ 0.28 5.2 X 10
3-nitroaniline 4.01 0.13 31 8.0 X 10 0.13 6.2 X 10
A^-methylaniline 108 6.58 16 2.2 X 10 6.58 3.3 X 10
The kf kb and K values refer to the reaction with aqueous formaldehyde solution
whereas k4, k.4 and K4 refer to the values calculated for reaction with fi-ee formaldehyde,
HCHO, alone. It has been shown that dehydration of CH2(OH)2 to give fi^ee
formaldehyde, the reactive species, is not rate limiting in these systems as the value of
hyd is generally sufficiently greater than k4 for the condition khyd » k4 to hold. Values
of K obtained are in good agreement with literature values available for aniline,
4-methylaniline, 4-chloroaniline and A'-methylaniline equal to 22.3, 22.7, 26.0 and
13.2 dm^ mol"^ respectively.
Although 7V-(hydroxymethyl)amines formed from aromatic amines and formaldehyde
have not been isolated, the data obtained by Abrams and Kallen^ indicate that the
major product of interaction of formaldehyde and anilines in aqueous solution is the
7V-(hydroxymethyl)amine. Spectral shifts and the magnitude of the equilibrium
constants indicate that, as with aliphatic amines, the formaldehyde adducts of aromatic
78
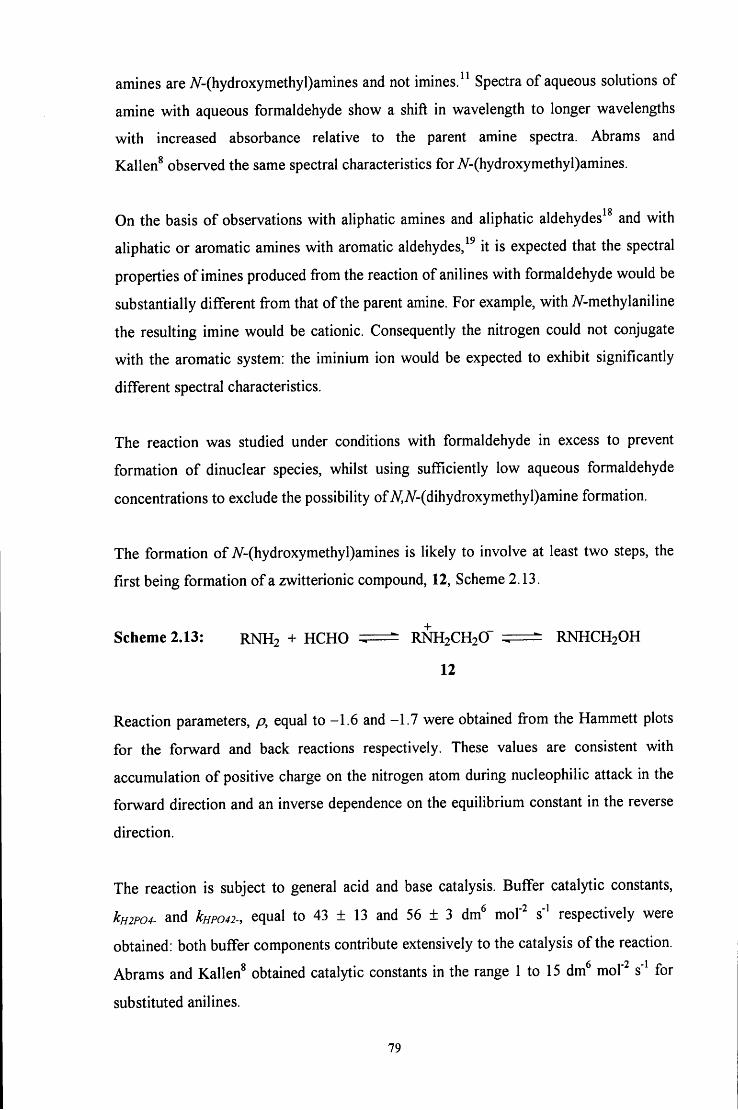
amines are 7V-(hydroxymethyl)amines and not imines. ^ Spectra of aqueous solutions of
amine with aqueous formaldehyde show a shift in wavelength to longer wavelengths
with increased absorbance relative to the parent amine spectra. Abrams and
Kallen^ observed the same spectral characteristics for A'-(hydroxymethyl)amines.
On the basis of observations with aliphatic amines and aliphatic aldehydes and with
aliphatic or aromatic amines with aromatic aldehydes, it is expected that the spectral
properties of imines produced from the reaction of anilines with formaldehyde would be
substantially different from that of the parent amine. For example, with A^-methylaniline
the resulting imine would be cationic. Consequently the nitrogen could not conjugate
with the aromatic system: the iminium ion would be expected to exhibit significantly
different spectral characteristics.
The reaction was studied under conditions with formaldehyde in excess to prevent
formation of dinuclear species, whilst using sufficiently low aqueous formaldehyde
concentrations to exclude the possibility of A'^7V-(dihydroxymethyl)amine formation.
The formation of iV-(hydroxymethyl)amines is likely to involve at least two steps, the
first being formation of a zwitterionic compound, 12, Scheme 2.13.
Scheme 2.13: RNH2 + HCHO ^ = = ^ RNH2CH2O RNHCH2OH
12
Reaction parameters, p, equal to -1.6 and -1.7 were obtained from the Hammett plots
for the forward and back reactions respectively. These values are consistent with
accumulation of positive charge on the nitrogen atom during nucleophilic attack in the
forward direction and an inverse dependence on the equilibrium constant in the reverse
direction.
The reaction is subject to general acid and base catalysis. Buffer catalytic constants,
kH2P04- and kHP042-, equal to 43 ± 13 and 56 ± 3 dm^ mol"^ s' respectively were
obtained: both buffer components contribute extensively to the catalysis of the reaction.
Abrams and Kallen obtained catalytic constants in the range 1 to 15 dm mol' s' for
substituted anilines.
79
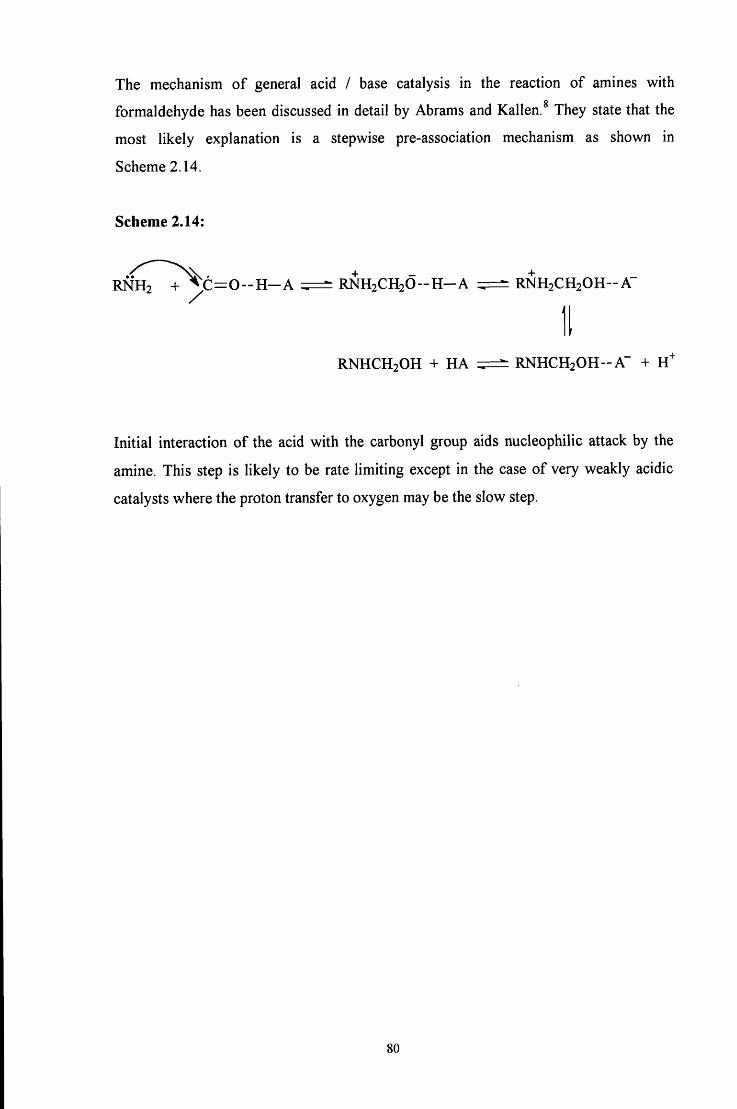
The mechanism of general acid / base catalysis in the reaction of amines with
formaldehyde has been discussed in detail by Abrams and Kallen.^ They state that the
most likely explanation is a stepwise pre-association mechanism as shown in
Scheme 2.14.
Scheme 2.14:
RNH2 + ^ C = 0 - H - A R N H 2 C H 2 O - H - A
RNHCH2OH + HA
RNH2CH2OH -A"
R N H C H 2 O H - A " + H '
Initial interaction of the acid with the carbonyl group aids nucleophilic attack by the
amine. This step is likely to be rate limiting except in the case of very weakly acidic
catalysts where the proton transfer to oxygen may be the slow step.
80
2.4 E X P E R I M E N T A L
2.4.1 Absorbance against wavelength spectra of formaldehyde with aniline and
aniline derivatives
Absorbance against wavelength spectra were obtained for the amine alone and with 0.05
and 0.10 M aqueous formaldehyde solution added at pH 7, or unbuffered in the case of
aniline. The reactions of aniline and the 4-CH3, 3-Cl and N-CII3 aniline derivatives were
carried out in 100 % aqueous solution, the 4-Cl, 3-NO2 and 3-CN aniline derivatives in
2 % methanol / 98 % water by volume, and the 4-N(CH3)2 aniline derivative in 2 %
acetonitrile / 98 % water by volume. Mixed solvent systems were used where the aniline
derivative was only sparingly soluble in water at the concentration required.
Spectra were obtained using a Perkin - Elmer Lambda 2 or 12 uv / vis spectrometer at
25 °C with 1 cm pathlength stoppered quartz cuvettes, taking scans every 15 minutes for
up to an hour using a scan speed of 480 nm min"\ The cuvettes were left in the
spectrometer for at least 10 minutes prior to use to allow the temperature to equilibrate
to 25 °C. Addition of the amine solution was used to initiate the reaction. In all
experiments the reaction was complete by the time the first spectrum was taken and
there was no fiirther change in the spectrum over the timescale used.
For the experiments performed at pH 7 a potassium dihydrogen phosphate / sodium
hydroxide buffer was employed, with stoichiometric concentrations of 0.19 M
potassium dihydrogen phosphate and 0.11 M sodium hydroxide.
2.4.2 Absorbance against time plots
The reaction of aqueous formaldehyde at concentrations ranging from 5.3 x 10' to
0.053 M with 1 x 10""* M amine in the pH range 5.8 to 7.9 was investigated. The
reactions of aniline and the 4-CH3, 3-Cl and N-CH3 aniline derivatives were carried out
in 100 % aqueous solution, the 4-Cl, 3-NO2 and 3-CN aniline derivatives in 2 %
methanol / 98 % water by volume, and the 4-N(CH3)2 aniline derivative in 2 %
acetonitrile / 98 % water by volume. Mixed solvent systems were used where the aniline
derivative was only sparingly soluble in water at the concentration required.
81
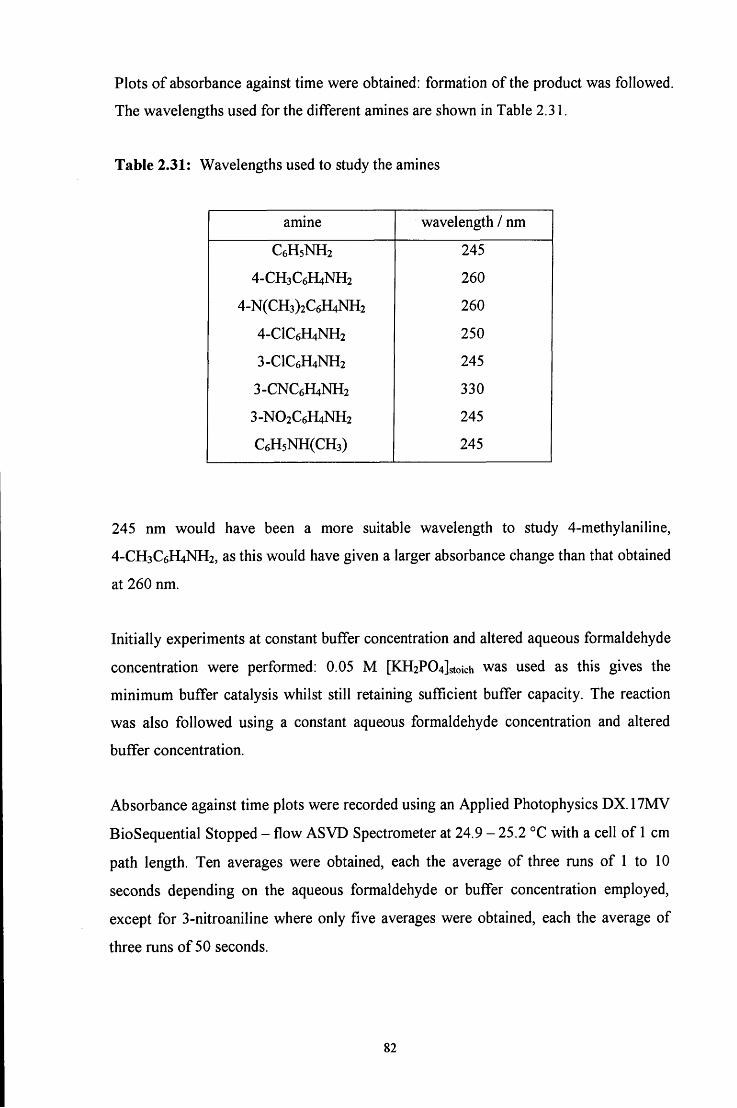
Plots of absorbance against time were obtained: formation of the product was followed.
The wavelengths used for the different amines are shown in Table 2.31.
Table 2.31: Wavelengths used to study the amines
amine wavelength / nm
C6H5NH2 245
4-CH3C6H4NH2 260
4-N(CH3)2C6H4NH2 260
4-CIC6H4NH2 250
3-CIC6H4NH2 245
3-CNC6H4NH2 330
3-NO2C6H4NH2 245
C6H5NH(CH3) 245
245 nm would have been a more suitable wavelength to study 4-methylaniline,
4-CH3C6H4NH2, as this would have given a larger absorbance change than that obtained
at 260 nm.
Initially experiments at constant buffer concentration and altered aqueous formaldehyde
concentration were performed: 0.05 M [KH2P04]stoich was used as this gives the
minimum buffer catalysis whilst still retaining sufficient buffer capacity. The reaction
was also followed using a constant aqueous formaldehyde concentration and altered
buffer concentration.
Absorbance against time plots were recorded using an Applied Photophysics DX.17MV
BioSequential Stopped - flow ASVD Spectrometer at 24.9 - 25.2 °C with a cell of 1 cm
path length. Ten averages were obtained, each the average of three runs of 1 to 10
seconds depending on the aqueous formaldehyde or buffer concentration employed,
except for 3-nitroaniline where only five averages were obtained, each the average of
three runs of 50 seconds.
82
The appropriate aqueous formaldehyde solution was placed in one syringe and the
amine solution with the appropriate buffer solution and potassium chloride in the other.
The amine / buffer / KCl solutions were made just prior to use. The averages were fitted
to obtain first order rate constants, kobs I s'\ using the single exponential fit function on
the ISX.17MV program installed on the spectrometer. Values of kobs I s" are quoted
to two decimal places, or three significant figures i f kobs ^ 10 s'\ Only the initial
data was used to fit the results for 4-chloroaniline as a true first order plot was
not obtained for the whole set of results. This may be due to formation of the
7\r,#-(dihydroxymethyl)amine.
Solid KCl was placed in a volumetric flask, the appropriate buffer added, and the KCl
dissolved using an ultrasonic bath. The amine was added just prior to use and the
solution made to the line using distilled water. For the amines where a mixed solvent
system was required, a final composition of 2 % methanol / acetonitrile by volume was
obtained by using 2 cm^ of the stock amine in methanol / acetonitrile in 50 cm^ total
volume.
For certain reactions, a change in ionic strength caused by the addition of inert ions can
greatly affect the rate constant. In the reactions studied here, there is formation of a
charged transition state. This species will have a denser ionic atmosphere than the
reactants and therefore increasing the ionic strength will increase the rate constant as
formation of the transition state will be favoured. Therefore potassium chloride was
used to keep the ionic strength constant at 1.0 M. For experiments at constant pH and
varied [HCHO(aq)] where the ionic strength was not kept constant, plots of kobs I s"
against [HCHO(aq)] / M did not give linear plots.
A stock solution of pH 6 buffer consisting of KH2PO4 and NaOH with stoichiometric
concentrations of 0.30 and 0.034 mol dm""' respectively was prepared. The concentration
of HP04^" wil l approximately be equal to that of [NaOH]stoich and therefore
[HP04^"] = 0.034 mol dm"^ Hence the amount of KH2PO4 present in the H2P04' form
wil l be equal to [KH2P04]stoich minus [HP04^"], therefore [H2PO4"] = 0.266 mol dm'l
Hence at pH 6, H2PO4" will be the predominant form, therefore only this species was
used to calculate the ionic strength of the buffer. This approximation is sufficiently
accurate when calculating the ionic strength. Equations 2.20 to 2.23 show the method
83
used to calculate the ionic strength, /, at pH 6, where c is equal to [KH2P04]stoich / M and
z is the charge on the ion. Strictly speaking the molality should be considered, but under
the conditions used the molarity approximates to the molality.
/ ='/2lciZi^ (2.20)
= ' /2[c(l)^+ c(-l) '] (2.21)
= c (2.22)
/. / = [KH2P04]stoich (2.23)
Therefore at pH 6 the ionic strength of the buffer is equal to [KH2P04]stoich. For example
when [KHzPOJsto ich = 0.05 M , / = 0.05 M. Therefore [KCl] = 1 - 0.05 = 0.95 M.
A stock solution of pH 8 buffer consisting of KH2PO4 and NaOH with stoichiometric
concentrations of 0.30 and 0.28 mol dm'" respectively was prepared. Therefore
[HP04^'] = 0.28 mol dm'^ and [H2P04'] = 0.02 mol dm'^ Hence at pH 8, HP04^" will be
the predominant form, therefore only this species was used to calculate the ionic
strength of the buffer. Applying Equation 2.20, the ionic strength of the buffer at pH 8 is
equal to 3 x [KH2P04]stoich.
A stock solution of pH 7 buffer consisting of KH2PO4 and NaOH with stoichiometric
concentrations of 0.30 and 0.175 mol dm" respectively was prepared. Therefore
[HP04^"] = 0.175 mol dm" and [H2P04'] = 0.125 mol dm'^ Therefore at pH 7, HP04^-
and H2PO4' wil l be present in approximately equal amounts. Hence at pH 7 the ionic
strength of the buffer is equal to 2 x [KH2P04]stoich.
For the experiments where the concentration of the aqueous formaldehyde was altered,
the buffer concentration and potassium chloride concentration were kept constant at
each pH. The buffers employed and the corresponding stoichiometric buffer
concentrations and potassium chloride concentrations in the final reaction mixtures are
shown in Table 2.33.
84
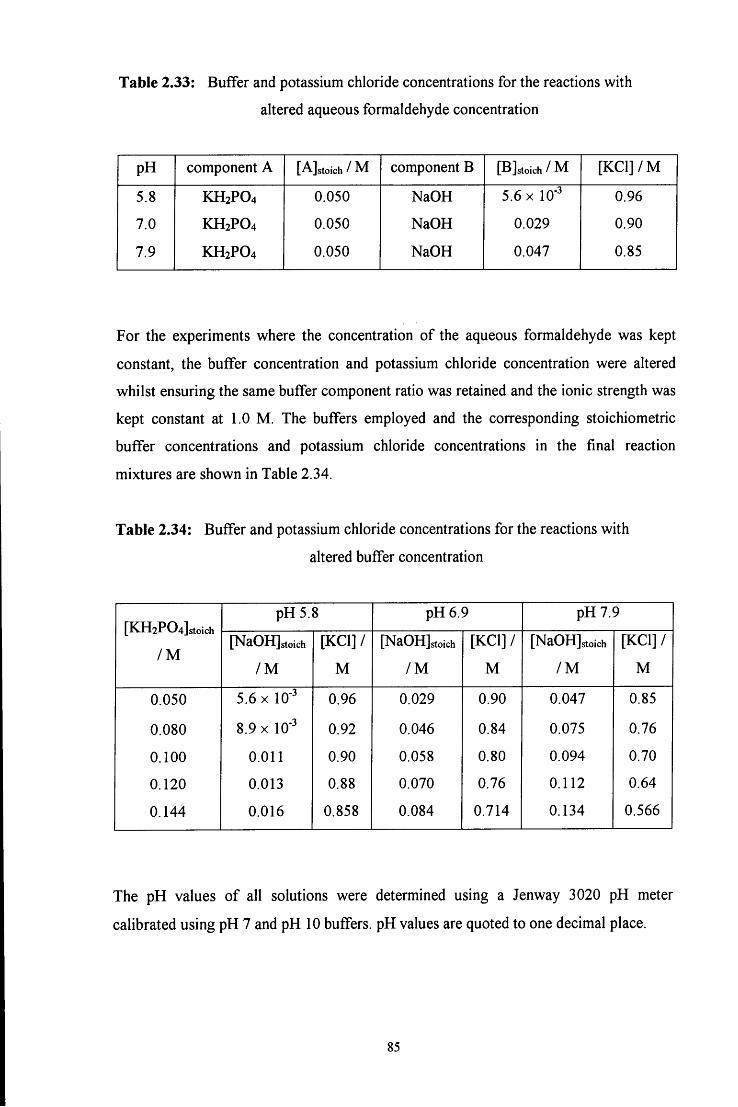
Table 2.33: Buffer and potassium chloride concentrations for the reactions with
altered aqueous formaldehyde concentration
pH component A [A]stoich / M component B [B]stoich/M [KCIJ /M
5.8 KH2PO4 0.050 NaOH 5.6 X 10' 0.96
7.0 KH2PO4 0.050 NaOH 0.029 0.90
7.9 KH2PO4 0.050 NaOH 0.047 0.85
For the experiments where the concentration of the aqueous formaldehyde was kept
constant, the buffer concentration and potassium chloride concentration were altered
whilst ensuring the same buffer component ratio was retained and the ionic strength was
kept constant at 1.0 M . The buffers employed and the corresponding stoichiometric
buffer concentrations and potassium chloride concentrations in the final reaction
mixtures are shown in Table 2.34.
Table 2.34: Buffer and potassium chloride concentrations for the reactions with
altered buffer concentration
[KH2P04]stoich
/ M
pH5.8 pH6.9 pH 7.9 [KH2P04]stoich
/ M [NaOH]stoich [KCl] / [NaOHJstoich [KCl] / [NaOHJstoich [KCl ] /
[KH2P04]stoich
/ M / M M / M M / M M
0.050 5.6 X 10' 0.96 0.029 0.90 0.047 0.85
0.080 8.9 X 10" 0.92 0.046 0.84 0.075 0.76
0.100 0.011 0.90 0.058 0.80 0.094 0.70
0.120 0.013 0.88 0.070 0.76 0.112 0.64
0.144 0.016 0.858 0.084 0.714 0.134 0.566
The pH values of all solutions were determined using a Jenway 3020 pH meter
calibrated using pH 7 and pH 10 buffers. pH values are quoted to one decimal place.
85
Linear regression within Microsoft Excel was used to calculate kf and h values. Values
of kf are quoted to three significant figures and values of h to two decimal places. For
4-chloroaniline the 0.053 M aqueous formaldehyde solution gave an anomalously high
result therefore this was not included in the data analysis. The equilibrium constant, K,
is quoted to two significant figures. The percentage error in K was calculated using
Equation 2.24. The percentage error was then converted to an absolute value of K.
% error in K =V [(% error in k^^ + (% error in k^f] (2.24)
Linear regression on Microsoft Excel was used to calculate p values: the linear plots
were fitted through the origin, p values are quoted to one decimal place.
2.4.3 Aqueous formaldehyde solution
The aqueous formaldehyde solutions were prepared by diluting, with distilled water, the
purchased 37 % by weight aqueous formaldehyde solution. These solutions were left to
stand at room temperature for at least IVi hours, more usually 4 - 4V4 hours, to ensure
depolymerisation. In concentrated solutions the amount of fi-ee formaldehyde available
is less than the stoichiometric amount of formaldehyde in solution as a significant
fraction of the total formaldehyde exists as polyoxymethylene polymers (Chapter 1,
Section 1.6).
The concentration of HCHO(aq) was calculated assuming complete depolymerisation: it
was assumed that [HCHO(aq)] = [aqueous formaldehyde]stoich and HCHO(aq) refers to
unhydrated and hydrated formaldehyde. The uv / vis spectrum of a 0.1 M aqueous
formaldehyde solution did not show any significant absorbance above 230 nm.
Therefore the spectrum due to aqueous formaldehyde will not interfere significantly
with the spectra or plots obtained here.
Concentrations of aqueous formaldehyde above 0.053 M were not used for kinetic
studies as above this concentration the results obtained were not a single exponential
plot. Plots consisting of two consecutive first order processes were obtained, but the two
processes were not sufficiently well separated to study both independently. These
86
processes are likely to be formation of the #-(hydroxymethyl)amine followed by
formation of an 7V,A^-(dihydroxymethyl)amine. Abrams and Kallen^ also observed
A^,7V-(dihydroxymethyl)amine formation with high formaldehyde concentrations.
87
2.5 R E F E R E N C E S
1. D. D. Perrin, 'Dissociation constants of organic bases in aqueous solution',
Butterworths, London, 1965 and 1972 Supplement
2. J. Hine and R. D. Weimar, Jr., J. Am. Chem. Soc, 1965, 87, 3387
3. R. G. Kallen and W. P. Jencks, J. Biol. Chem., 1966, 241, 5864
4. (a) E. C. Wagner, J. Org. Chem., 1954, 19, 1862; (b) J. Santhanalakshmi,
Thermochim. Acta., 1988, 127, 369; (c) M. R. G. Nayar and J. D. Francis,
Makromol. Chem., 1978, 179, 1783; (d) I . Wiesner and L. Wiesnerov, Int. Polymer
Sci. Tech., 1974, 1, 107
5. (a) I . Wiesner, Collect. Czech. Chem. Commun., 1973, 38, 1473; (b) O. Y. Fedotova,
M . A. Askarov and A. B. Kucharev, Dokl Akad Nauk Uzb. SSR, 1958, 6, 31; Chem.
Abstr., 1959, 53, 7092h
6. (a) M . R. G. Nayar and J. D. Francis, Ind. J. Chem., 1983, 22B, 776; (b) Y. Ogata
and M . Okano, J. Am. Chem. Soc, 1950, 72, 1459
7. Y. Ogata, M . Okano and M . Sugawara, J. Am. Chem. Soc, 1951, 73, 1715
8. W. R. Abrams and R. G. Kallen, J. Am. Chem. Soc, 1976, 98, 7777
9. L. D. Kershner and R. L. Schowen, J. Am. Chem. Soc, 1971, 93, 2014
10. (a) W. P. Jencks, Prog. Phys. Org Chem., 1964, 2, 63; (b) J. F. Walker,
'Formaldehyde', 3rd Ed., American Chemical Society Monograph Series, Reinhold,
New York, 1964; (c) P. Y. Sollenberg and R. B. Martin, 'The Chemistry of the
Amino Group', Ed. S. Patai, Interscience, New York, 1968, pp 349 - 406
11. J. De Luis, Ph.D. Thesis, 'Chemistry of Formaldehyde Amine Condensation
Products', Pennsylvania State University, University Park, 1964; Chem. Abstr.,
1965, 63, 8184d
12. D. D. Perrin and G. B. Barlin, Quarterly Reviews, Chem. Soc. London, 1966, 20, 75
13. R. P. Bell, Adv. Phys. Org. Chem., 1966, 1
14. P. Valenta, Coll. Czech. Chem. Comm., 1960, 25, 853
15. (a) R. G. Kallen, J. Am. Chem. Soc, 1971, 93, 6236; (b) G. E. Lienhard and W. P.
Jencks, ibid., 1966, 88, 3982; (c) R. P. Bell and P. G. Evans, Proc. R. Soc. London,
Ser. A., 1966, 291, 297; (d) P. Le Henaff, C R. Acad Sci., Paris, 1963, 256, 1752;
(e)Ref 10a
16. C. F. Bemasconi, 'Relaxation Kinetics', Academic Press, Inc., London, 1976
17. L. H. Funderburk, L. Aldwin and W. P. Jencks, J. Am. Chem. Soc, 1978,100, 5444
18. (a) J. Hine and C. Y. Yeh, J. Am. Chem. Soc, 1967, 89, 2669; (b) A. Williams and
M . L. Bender, ihid, 1966, 88, 2508; (c) J. Hine, J. C. Craig, Jr., J. G. Underwood, I I ,
and F. A. Via, ibid, 1970, 92, 5194; (d) J. Hine, F. A. Via, J. K. Gotkis and J. C.
Craig, Jr., ibid, 5186; (e) J. Hine, C. Y. Yeh and F. C. Schmalstieg, Org. Chem.,
1970, 35, 340; (f) E. M . Kosower and T. S. Sorensen, ibid, 1963, 28, 692
19. (a) E. H. Cordes and W. P. Jencks, J. Am. Chem. Soc, 1962, 84, 832; (b) ibid,
1963, 85, 2843
89
CHAPTER 3
Polymerisation of RC6H4N=CH2 imines
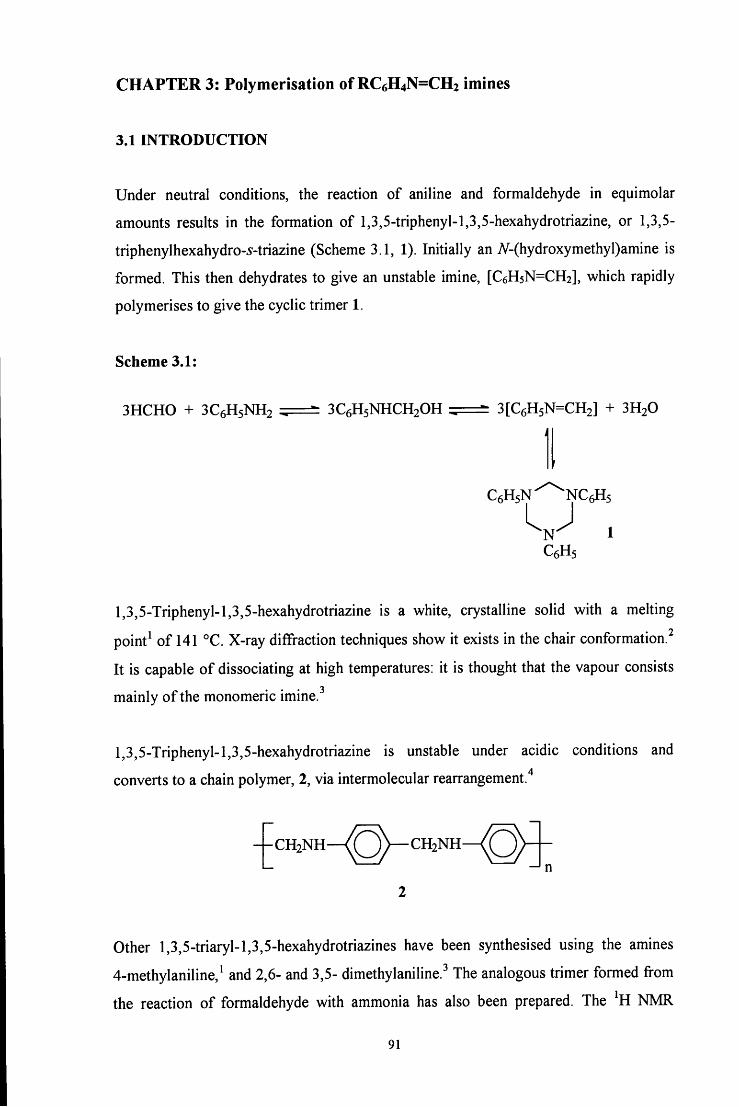
C H A P T E R 3: Polymerisation of RC6H4N=CH2 imines
3.1 mXRODUCTION
Under neutral conditions, the reaction of aniline and formaldehyde in equimolar
amounts results in the formation of l,3,5-triphenyl-l,3,5-hexahydrotriazine, or 1,3,5-
triphenylhexahydro-5-triazine (Scheme 3.1, 1). Initially an 7V-(hydroxymethyl)amine is
formed. This then dehydrates to give an unstable imine, [C6H5N=CH2], which rapidly
polymerises to give the cyclic trimer 1.
Scheme 3.1:
3HCH0 + 3C6H5NH2 ^ 3C6H5NHCH2OH 3[C6H5N=CH2] + 3H2O 4 1
CeHsN^^^NCeHs
^ N - ^ 1 C6H5
l,3,5-Triphenyl-l,3,5-hexahydrotriazine is a white, crystalline solid with a mehing
point^ of 141 °C. X-ray diffraction techniques show it exists in the chair conformation.^
It is capable of dissociating at high temperatures: it is thought that the vapour consists
mainly of the monomeric imine.
l,3,5-Triphenyl-l,3,5-hexahydrotriazine is unstable under acidic conditions and
converts to a chain polymer, 2, via intermolecular rearrangement."*
C H 2 N H — C H 2 N H —
n
Other l,3,5-triaryl-l,3,5-hexahydrotriazines have been synthesised using the amines
4-methylaniline,^ and 2,6- and 3,5- dimethylaniline.^ The analogous trimer formed from
the reaction of formaldehyde with ammonia has also been prepared. The NMR
91
spectrum^ of this trimer shows a sharp singlet at 6 3.95 ppm in deuterated water, D2O,
corresponding to the -NCH2N- group hydrogens.
l,3,5-Triphenyl-l,3,5-hexahydrotriazine was prepared here using the literature method.^
The novel syntheses of [4-RC6H4N=CH2] imine polymers were attempted using the
amines 4-dimethylaminoaniline, 4-aminobenzoic acid, 4-nitroaniline and sulfanilic acid,
where R = -NMe2, -COOH, -NO2, and -SO3H respectively. These amines were chosen
to see i f the presence of electron withdrawing or donating groups on the amine has any
effect on the reaction.
The work described in Chapter 2 studied the formation of the iV-(hydroxymethyl)amine.
The stability of l,3,5-triphenyl-l,3,5-hexahydrotriazine in solution and the mechanism
of formation of this trimer were studied here to attempt to determine under what
conditions the A^-(hydroxymethyl)amine reacts further to give the cyclic imine trimer
l,3,5-triphenyl-l,3,5-hexahydrotriazine.
92
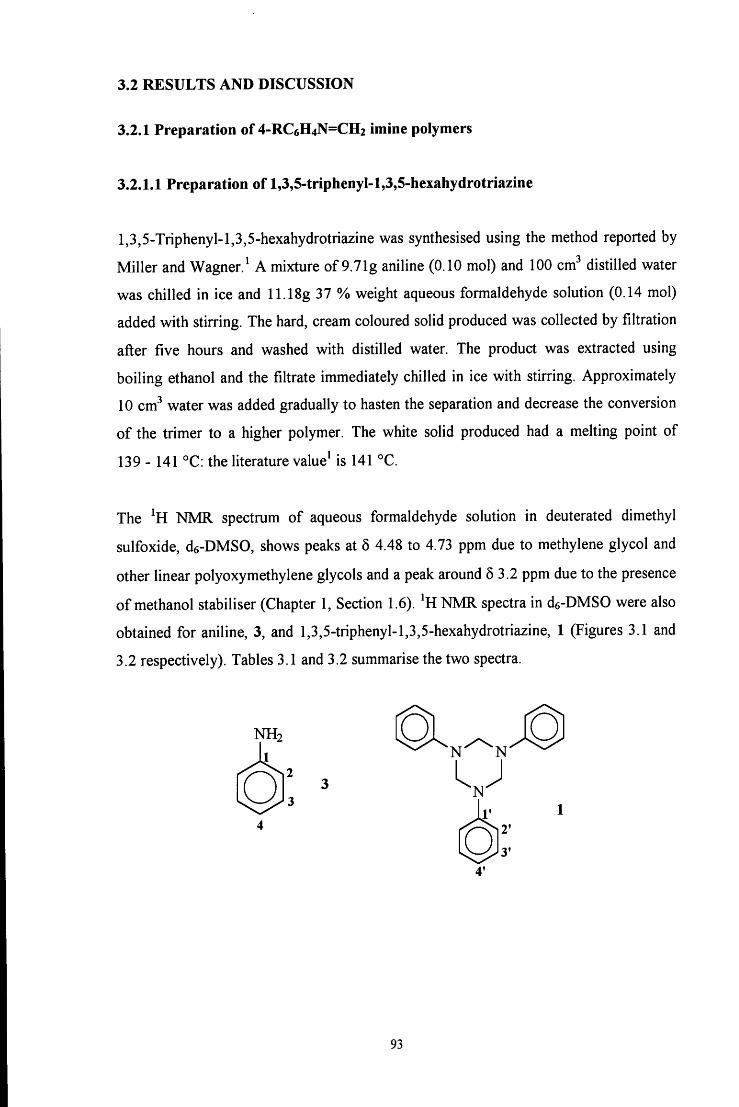
3.2 R E S U L T S AND DISCUSSION
3.2.1 Preparation of 4-RC6H4N=CH2 imine polymers
3.2.1.1 Preparation of l,3,5-triphenyI-l,3,5-hexahydrotriazine
l,3,5-Triphenyl-l,3,5-hexahydrotriazine was synthesised using the method reported by
Miller and Wagner.^ A mixture of 9.71g aniline (0.10 mol) and 100 cm^ distilled water
was chilled in ice and 11.18g 37 % weight aqueous formaldehyde solution (0.14 mol)
added with stirring. The hard, cream coloured solid produced was collected by filtration
afl;er five hours and washed with distilled water. The product was extracted using
boiling ethanol and the filtrate immediately chilled in ice with stirring. Approximately
10 cm"' water was added gradually to hasten the separafion and decrease the conversion
of the trimer to a higher polymer. The white solid produced had a melting point of
139 - 141 °C: the literature value^ is 141 °C.
The ^H NMR spectrum of aqueous formaldehyde solution in deuterated dimethyl
sulfoxide, de-DMSO, shows peaks at 5 4.48 to 4.73 ppm due to methylene glycol and
other linear polyoxymethylene glycols and a peak around 5 3.2 ppm due to the presence
of methanol stabiliser (Chapter 1, Section 1.6). ^HNMR spectra in de-DMSO were also
obtained for aniline, 3, and l,3,5-triphenyl-l,3,5-hexahydrotriazine, 1 (Figures 3.1 and
3.2 respectively). Tables 3.1 and 3.2 summarise the two spectra.
o
93
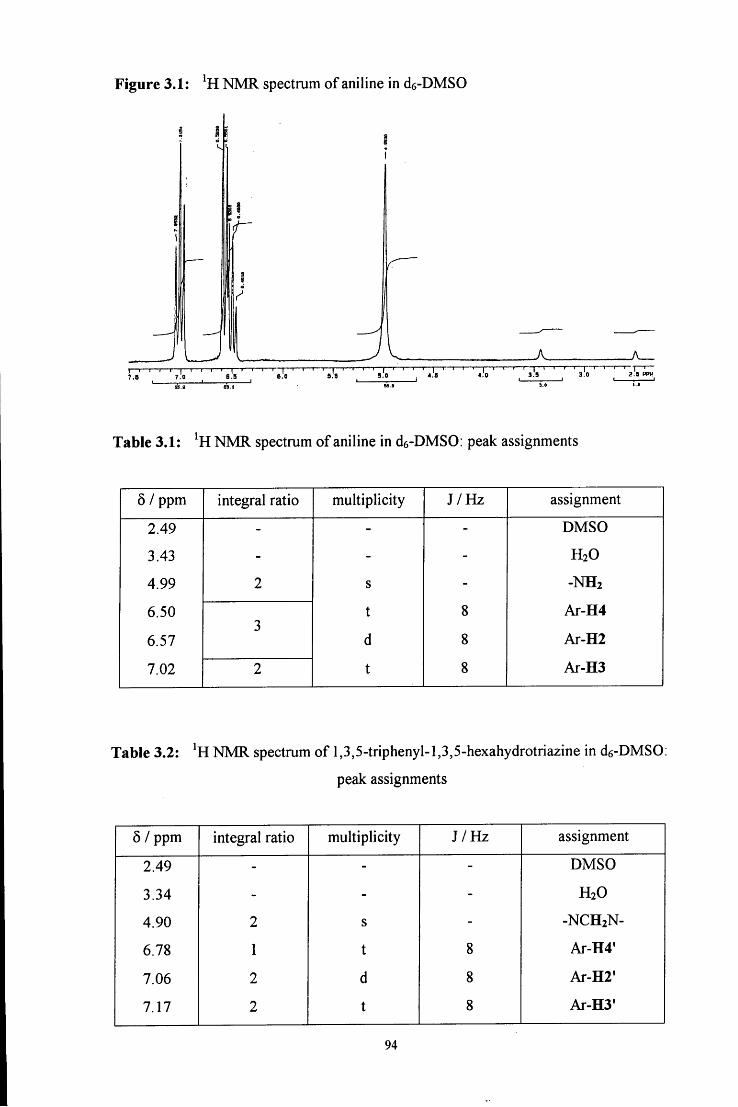
Figure 3.1: NMR spectrum of aniline in de-DMSO
-A. — — — — — — , — I — I — , — , — I — I — , — , — , — , — , — I — , — , — I — I — I — I — , — I — I — I — I — I — I — , — I — 1 — I — I — I — I — 1 — I — I p I I 1 — 1 r--| I
1.S 7.'o ' B.'s B.O O'B S.'O 4!B 4.'O , 3'» 3.0 . - I , r a . g 6 3 . 1
Table 3.1: NMR spectrum of aniline in de-DMSO: peak assignments
6 / ppm integral ratio multiplicity J /Hz assignment
2.49 - - - DMSO
3.43 - - - H2O
4.99 2 s - -NH2
6.50 t 8 Ar-H4 3
6.57 d 8 Ar-H2
7.02 2 t 8 Ar-H3
Table 3.2: NMR spectrum of l,3,5-triphenyl-l,3,5-hexahydrotriazine in de-DMSO:
peak assignments
5 / ppm integral ratio multiplicity J /Hz assignment
2.49 - - - DMSO
3.34 - - - H2O
4.90 2 s - -NCH2N-
6.78 1 t 8 Ar-H4'
7.06 2 d 8 Ar-H2'
7.17 2 t 8 Ar-H3'
94
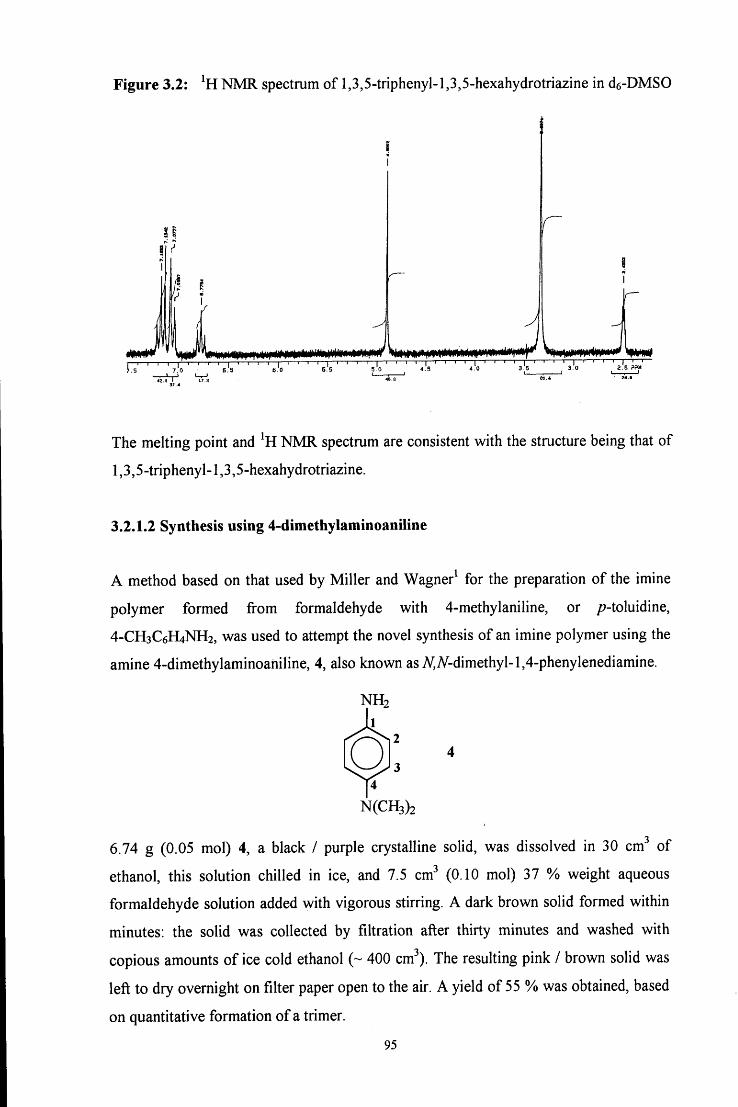
Figure 3.2: ^H NMR spectrum of l,3,5-triphenyl-l,3,5-hexahydrotriazine in de-DMSO
.J* ni»tMi<»m»>*iiiWwni|iiiniiiwi ir iiiinji»<ii|KMWiiwmoi(niwii mtKf a , a ?p»
The melting point and ^H NMR spectrum are consistent with the structure being that of
1,3,5 -tripheny 1-1,3,5-hexahy drotriazine.
3.2.1.2 Synthesis using 4-dimethylaniinoaniline
A method based on that used by Miller and Wagner^ for the preparation of the imine
polymer formed from formaldehyde with 4-methylaniline, or /?-toluidine,
4-CH3C6H4NH2, was used to attempt the novel synthesis of an imine polymer using the
amine 4-dimethylaminoaniline, 4, also known asiy;A^-dimethyl-l,4-phenylenediamine.
NH2 1
2
3 O
N(CH3)2
6.74 g (0.05 mol) 4, a black / purple crystalline solid, was dissolved in 30 cm^ of
ethanol, this solution chilled in ice, and 7.5 cm^ (0.10 mol) 37 % weight aqueous
formaldehyde solution added with vigorous stirring. A dark brown solid formed within
minutes: the solid was collected by filtration after thirty minutes and washed with
copious amounts of ice cold ethanol (~ 400 cm^). The resulting pink / brown solid was
lefl; to dry overnight on filter paper open to the air. A yield of 55 % was obtained, based
on quantitative formation of a trimer.
95
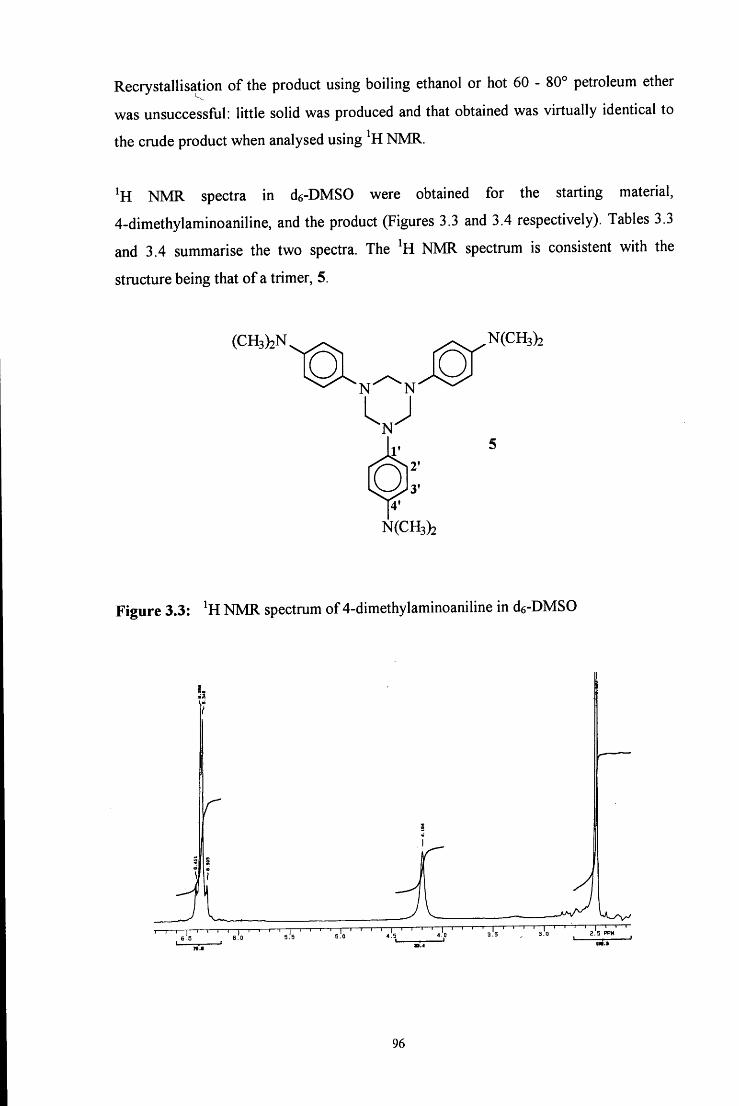
Recrystallisation of the product using boiling ethanol or hot 60 - 80° petroleum ether
was unsuccessful: little solid was produced and that obtained was virtually identical to
the crude product when analysed using NMR.
NMR spectra in de-DMSO were obtained for the starting material,
4-dimethylaminoaniline, and the product (Figures 3.3 and 3.4 respectively). Tables 3.3
and 3.4 summarise the two spectra. The NMR spectrum is consistent with the
structure being that of a trimer, 5.
(CH3)2N
N(CH3)2
N(CH3)2
Figure 3.3: NMR spectrum of 4-dimethylaminoaniline in de-DMSO
r
- 1 — i — I — I — r - I ' ' ' ' I.
96
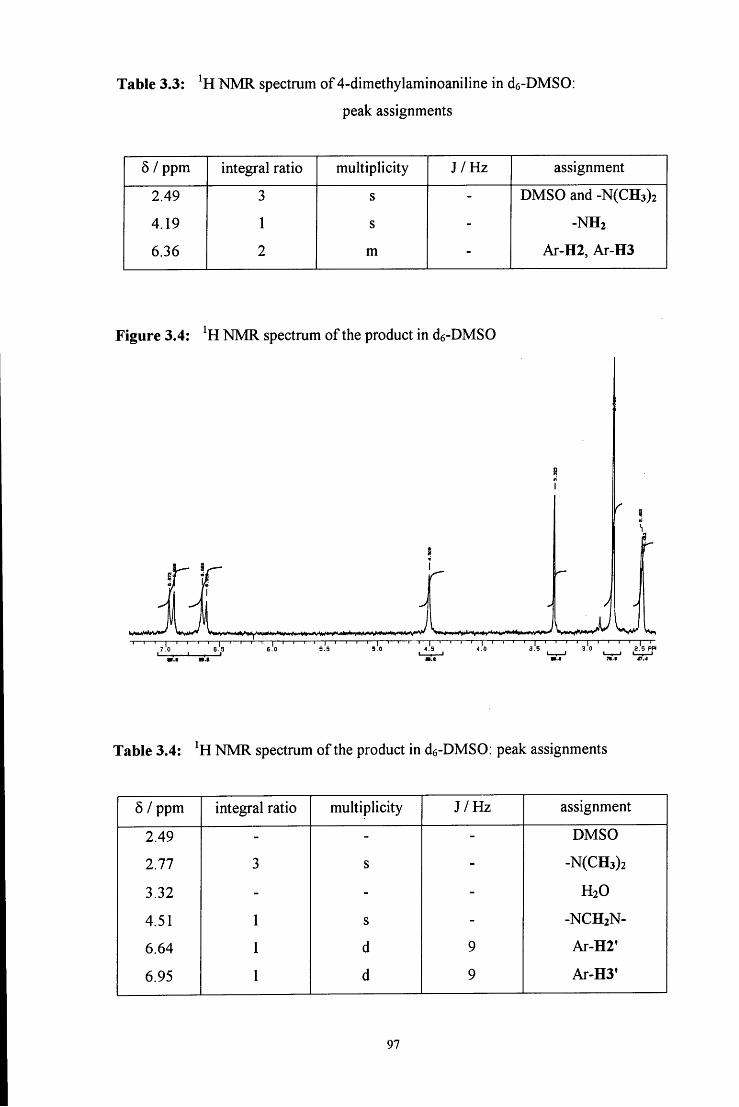
Table 3.3: NMR spectrum of 4-dimethylaminoaniline in de-DMSO:
peak assignments
5 / ppm integral ratio multiplicity J /Hz assignment
2.49 3 s - DMSO and -N(CH3)2
4.19 1 s - -NH2
6.36 2 m - Ar-H2, Ar-H3
Figure 3.4: NMR spectrum of the product in de-DMSO
5 . 0 A.5
m.t B . I n.i ii.t
Table 3.4: NMR spectrum of the product in de-DMSO: peak assignments
6 / ppm integral ratio multiplicity J /Hz assignment
2.49 - - - DMSO
2.77 3 s - -N(CH3)2
3.32 - - - H2O
4.51 1 s - -NCH2N-
6.64 1 d 9 Ar-H2'
6.95 1 d 9 Ar-H3'
97
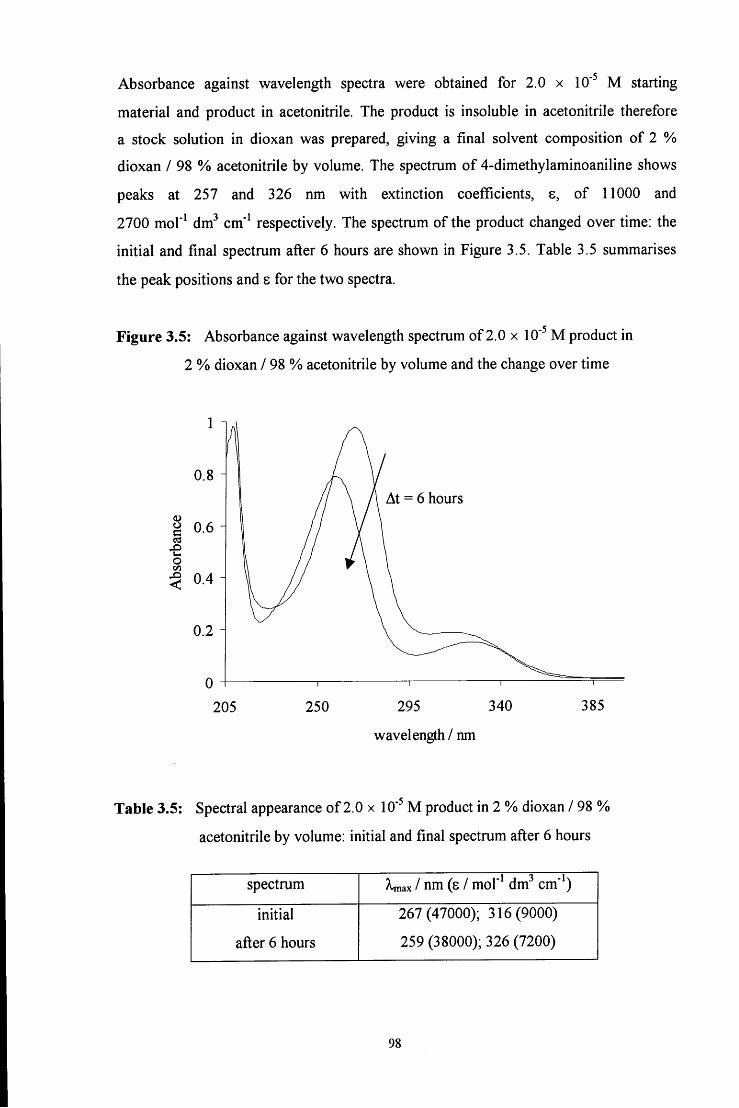
Absorbance against wavelength spectra were obtained for 2.0 x 10" M starting
material and product in acetonitrile. The product is insoluble in acetonitrile therefore
a stock solution in dioxan was prepared, giving a final solvent composition of 2 %
dioxan / 98 % acetonitrile by volume. The spectrum of 4-dimethylaminoaniline shows
peaks at 257 and 326 nm with extinction coefficients, 8, of 11000 and
2700 mol"^ dm^ cm" respectively. The spectrum of the product changed over time: the
initial and final spectrum after 6 hours are shown in Figure 3.5. Table 3.5 summarises
the peak positions and s for the two spectra.
Figure 3.5: Absorbance against wavelength spectrum of 2.0 x 10' M product in
2 % dioxan / 98 % acetonitrile by volume and the change over fime
205
At = 6 hours
a 0.6
250 295 340
wavelength / nm
385
Table 3.5: Spectral appearance of 2.0 x 10' M product in 2 % dioxan / 98 %
acetonitrile by volume: initial and final spectrum after 6 hours
spectrum >^ax / nm (e / mol'^ dm" cm" )
initial
after 6 hours
267(47000); 316(9000)
259 (38000); 326 (7200)
98
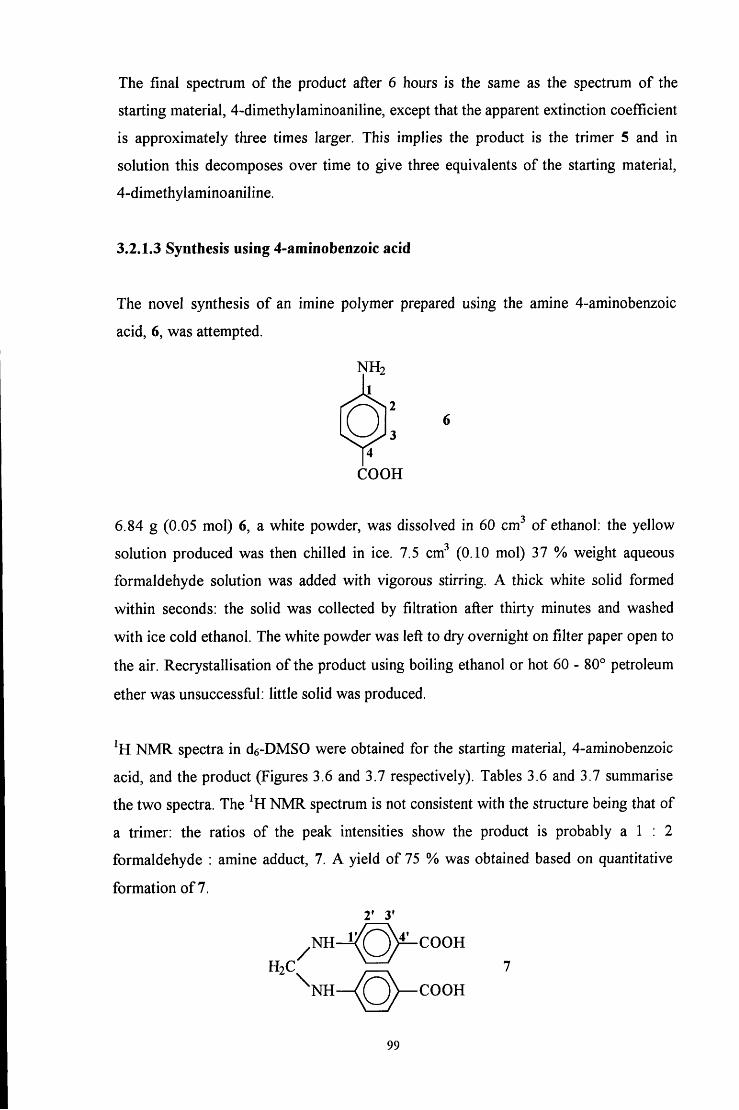
The final spectrum of the product after 6 hours is the same as the spectrum of the
starting material, 4-dimethylaminoaniline, except that the apparent extinction coefficient
is approximately three times larger. This implies the product is the trimer 5 and in
solution this decomposes over time to give three equivalents of the starting material,
4-dimethylaminoaniline.
3.2.1.3 Synthesis using 4-aminobenzoic acid
The novel synthesis of an imine polymer prepared using the amine 4-aminobenzoic
acid, 6, was attempted.
N H 2
1 2
Q 4
COOH
6.84 g (0.05 mol) 6, a white powder, was dissolved in 60 cm^ of ethanol: the yellow
solution produced was then chilled in ice. 7.5 cm^ (0.10 mol) 37 % weight aqueous
formaldehyde solution was added with vigorous stirring. A thick white solid formed
within seconds: the solid was collected by filtration after thirty minutes and washed
with ice cold ethanol. The white powder was left to dry overnight on filter paper open to
the air. Recrystallisation of the product using boiling ethanol or hot 60 - 80° petroleum
ether was unsuccessfiil: little solid was produced.
^H NMR spectra in de-DMSO were obtained for the starting material, 4-aminobenzoic
acid, and the product (Figures 3.6 and 3.7 respectively). Tables 3.6 and 3.7 summarise
the two spectra. The ^H NMR spectrum is not consistent with the structure being that of
a trimer: the ratios of the peak intensities show the product is probably a 1 : 2
formaldehyde : amine adduct, 7. A yield of 75 % was obtained based on quantitative
formation of 7.
2' 3'
.NH-i<(Q)^COOH
COOH
99
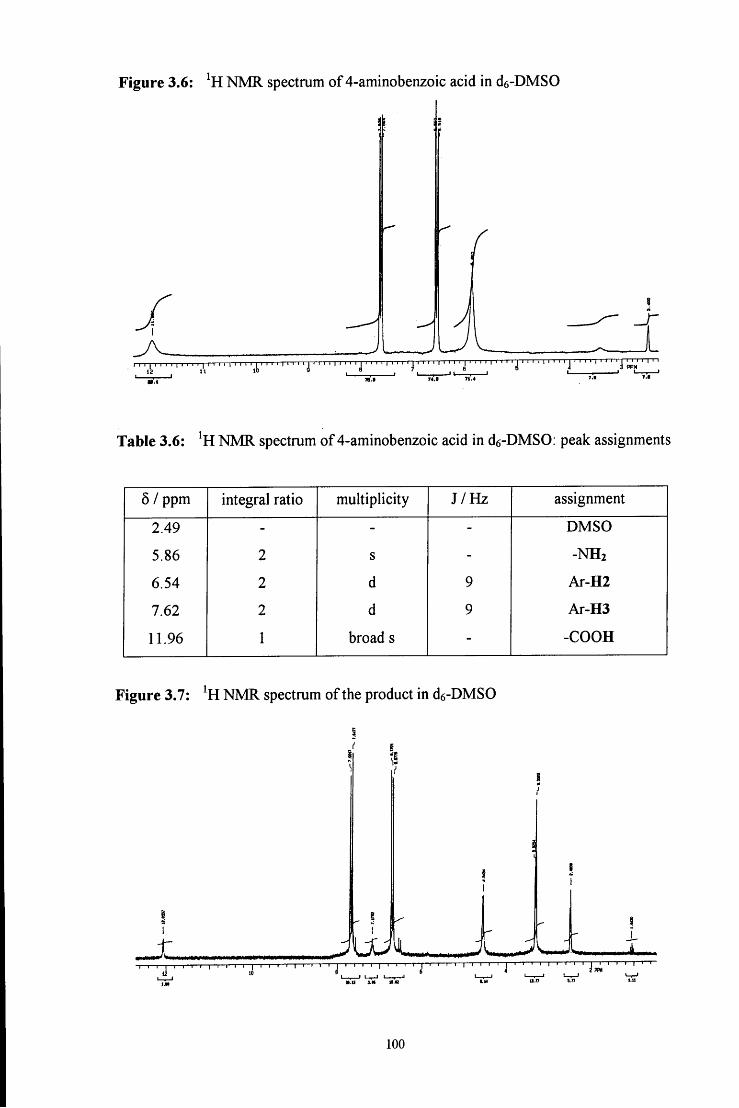
Figure 3.6: NMR spectrum of 4-aminobenzoic acid in de-DMSO
1 [ l l l l | l l l l | I I I M I I I I j ^ l l l M ' ' l ' j ' I I M M I I j l M M M J I j l l l l | I I M J I I M | l l l l j l l l . | I I I . J j ,
I I . 1 n . a 11.* 7 . 1 7 . i
Table 3.6: NMR spectrum of 4-aminobenzoic acid in de-DMSO; peak assignments
5 / ppm integral ratio multiplicity J /Hz assignment
2.49 - - - DMSO
5.86 2 s - -NH2
6.54 2 d 9 Ar-H2
7.62 2 d 9 Ar-H3
11.96 1 broad s - -COOH
Figure 3.7: NMR spectrum of the product in de-DMSO
I I 1 I I I 1 I I I I I ' ' ' J
I , ' l - r - J " ^ a.a X H u . a
V r [ • r I r I I I I I I I I I I I I I I P I I I I ' ' r ' I
L u a n s."
100
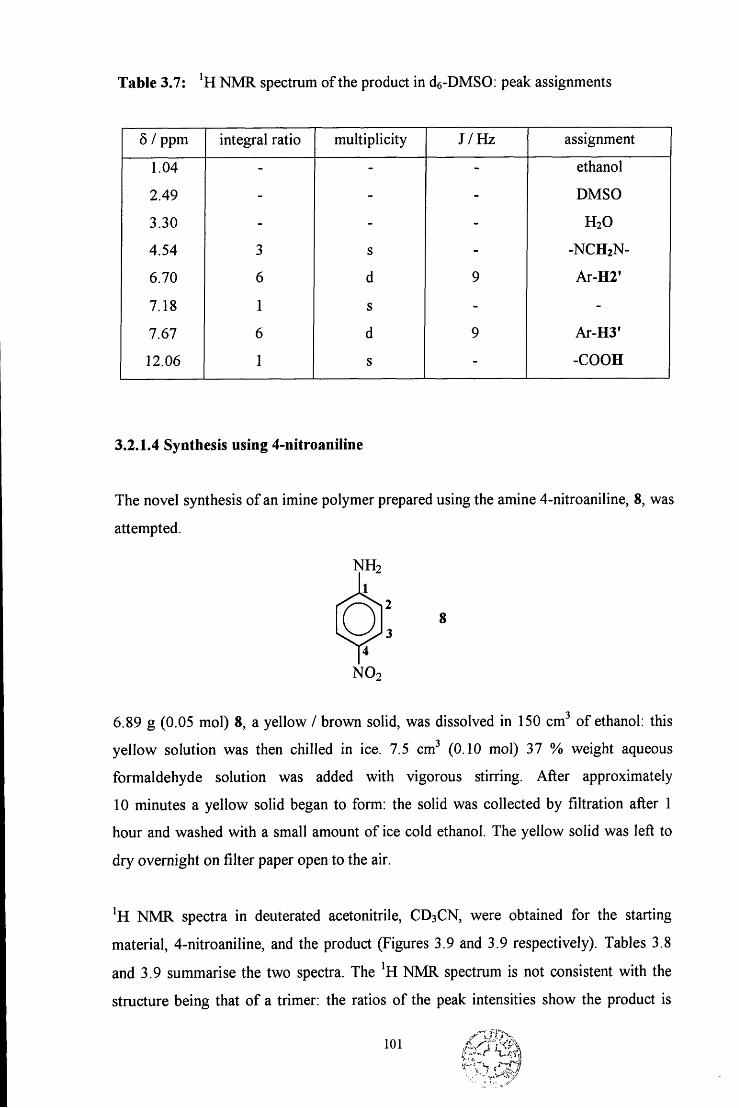
Table 3.7: NMR spectrum of the product in de-DMSO: peak assignments
5 / ppm integral ratio multiplicity J /Hz assignment
1.04 - - - ethanol
2.49 - - - DMSO
3.30 - - - H2O
4.54 3 s - -NCH2N-
6.70 6 d 9 Ar-H2'
7.18 1 s - -
7.67 6 d 9 Ar-H3'
12.06 1 s - -COOH
3.2.1.4 Synthesis using 4-nitroaniIine
The novel synthesis of an imine polymer prepared using the amine 4-nitroaniline, 8, was
attempted.
N H 2
1
2
3 Q
4
N O 2
6.89 g (0.05 mol) 8, a yellow / brown solid, was dissolved in 150 cm^ of ethanol: this
yellow solution was then chilled in ice. 7.5 cm"' (0.10 mol) 37 % weight aqueous
formaldehyde solution was added with vigorous stirring. After approximately
10 minutes a yellow solid began to form: the solid was collected by filtration after 1
hour and washed with a small amount of ice cold ethanol. The yellow solid was left to
dry overnight on filter paper open to the air.
NMR spectra in deuterated acetonitrile, CD3CN, were obtained for the starting
material, 4-nitroaniline, and the product (Figures 3.9 and 3.9 respectively). Tables 3.8
and 3.9 summarise the two spectra. The NMR spectrum is not consistent with the
structure being that of a trimer: the ratios of the peak intensities show the product is
101
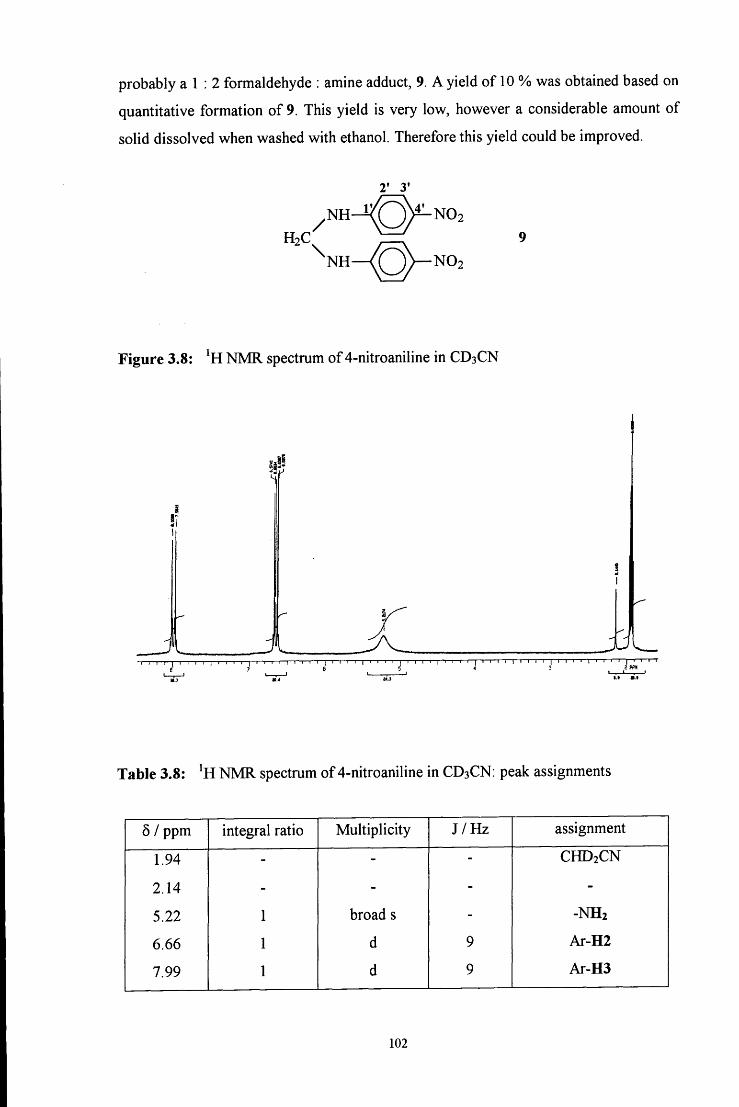
probably a 1 : 2 formaldehyde : amine adduct, 9. A yield of 10 % was obtained based on
quantitative formation of 9. This yield is very low, however a considerable amount of
solid dissolved when washed with ethanol. Therefore this yield could be improved.
H 2 C
^NH-^^(P)^N02
\ N H
Figure 3.8: NMR spectrum of 4-nitroaniline in CD3CN
4
J 1 1 1 1 1 1 1 1 1 1 1 1 1 1 ' 1 1 1 ' ' ' 1 1 ' I ' 1 1 ' 1 1 1 1 1 1 1 1 1 1 1 1 1 1 ' ' ' ' I ' ' ' ' 1 1 ' ' ' I ' ' ' ' 1 ' ' ' '
i 7 6 5 4 3 _ 2 (>!>!( _
Table 3.8: NMR spectrum of 4-nitroaniline in CD3CN: peak assignments
5 / ppm integral ratio Multiplicity J /Hz assignment
1.94 - - - CHD2CN
2.14 - - - -
5.22 1 broad s - -NH2
6.66 1 d 9 Ar-H2
7.99 1 d 9 Ar-H3
102
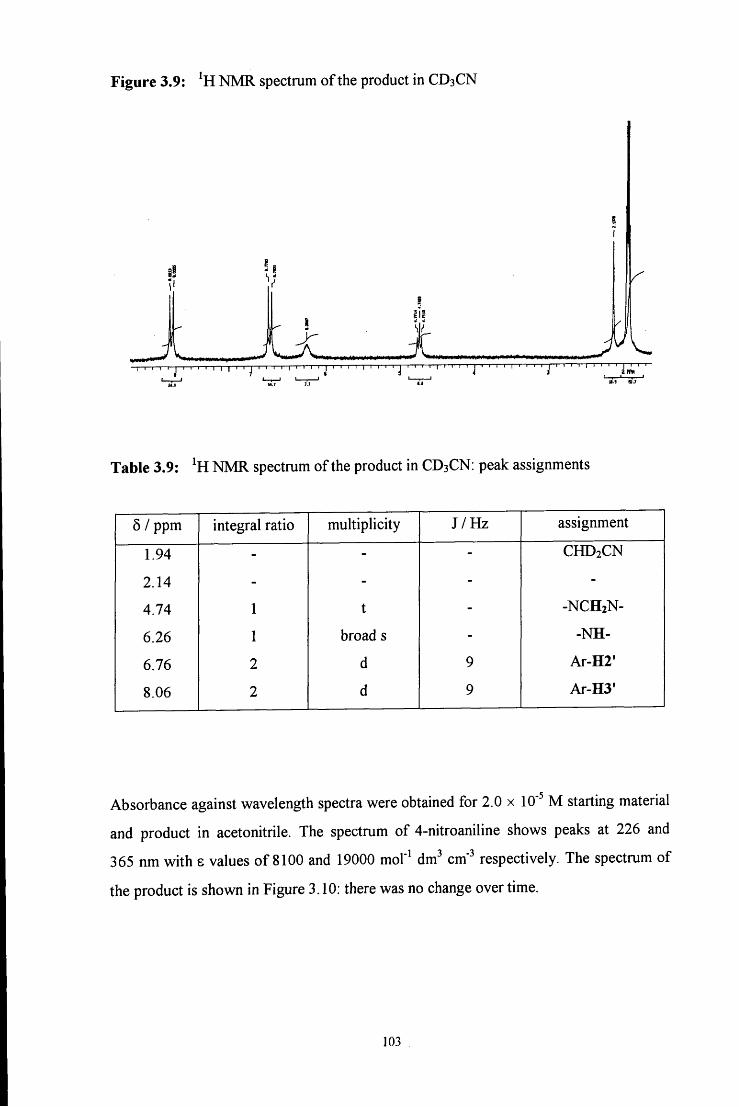
Figure 3.9: NMR spectrum of the product in CD3CN
J J , , , • J " " M . . M . . j I J j . 1 ^ . .
Table 3.9: NMR spectrum of the product in CD3CN: peak assignments
5 / ppm
1.94
2.14
4.74
6.26
6.76
8.06
integral ratio multiplicity
broad s
d
d
J /Hz assignment
CHD2CN
-NCH2N-
-NH-
Ar-H2'
Ar-H3'
Absorbance against wavelength spectra were obtained for 2.0 x 10' M starting material
and product in acetonitrile. The spectrum of 4-nitroaniline shows peaks at 226 and
365 nm with s values of 8100 and 19000 mol" dm cm' respectively. The spectrum of
the product is shown in Figure 3.10: there was no change over time.
103
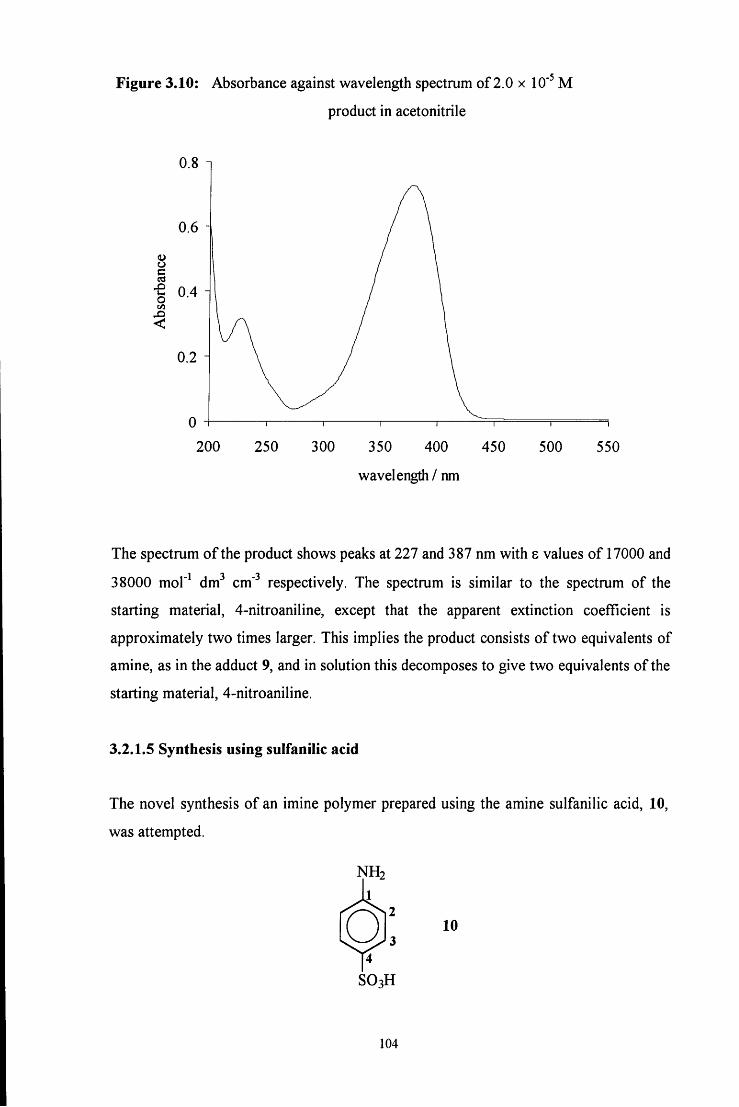
Figure 3.10: Absorbance against wavelength spectrum of 2.0 x 10" M
product in acetonitrile
o
o
200 250 300 350 400 450 500 550
wavelength / nm
The spectrum of the product shows peaks at 227 and 387 nm with s values of 17000 and
38000 mol"^ dm^ cm" respectively. The spectrum is similar to the spectrum of the
starting material, 4-nitroaniline, except that the apparent extinction coefficient is
approximately two times larger. This implies the product consists of two equivalents of
amine, as in the adduct 9, and in solution this decomposes to give two equivalents of the
starting material, 4-nitroaniline.
3.2.1.5 Synthesis using sulfanilic acid
The novel synthesis of an imine polymer prepared using the amine sulfanilic acid, 10,
was attempted.
N H 2
1
10 Q SO3H
104
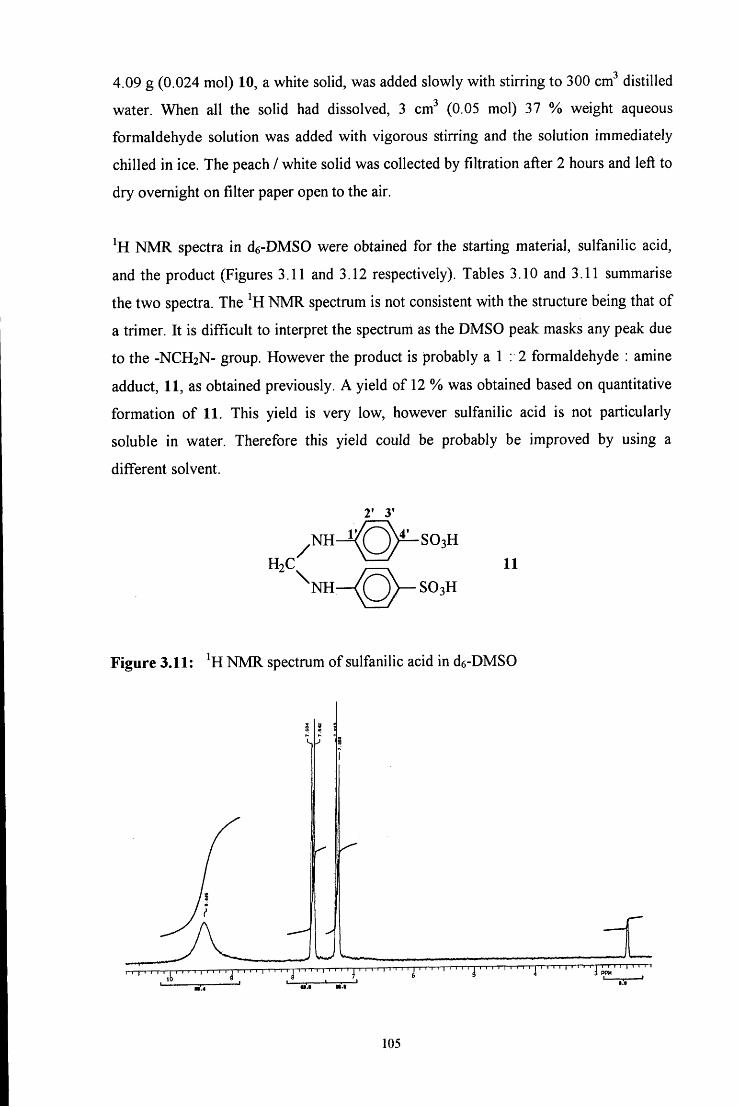
4.09 g (0.024 mol) 10, a white solid, was added slowly with stirring to 300 cm"' distilled
water. When all the solid had dissolved, 3 cm^ (0.05 mol) 37 % weight aqueous
formaldehyde solution was added with vigorous stirring and the solution immediately
chilled in ice. The peach / white solid was collected by filtration after 2 hours and left to
dry overnight on filter paper open to the air.
NMR spectra in de-DMSO were obtained for the starting material, sulfanilic acid,
and the product (Figures 3.11 and 3.12 respectively). Tables 3.10 and 3.11 summarise
the two spectra. The NMR spectrum is not consistent with the structure being that of
a trimer. It is difficult to interpret the spectrum as the DMSO peak masks any peak due
to the -NCH2N- group. However the product is probably a 1 : 2 formaldehyde : amine
adduct, 11, as obtained previously. A yield of 12 % was obtained based on quantitative
formation of 11. This yield is very low, however sulfanilic acid is not particularly
soluble in water. Therefore this yield could be probably be improved by using a
different solvent.
2' 3'
H 2 C NH-i^Q)^S03H
OV-SO3H
11
Figure 3.11: NMR spectrum of sulfanilic acid in de-DMSO
I I I I I i j I I I I I I I I I j I I I ' M I ' ' M I I M I I I 1^ I I ' M I I I I j I I I I I ' ' ' ' j"
105
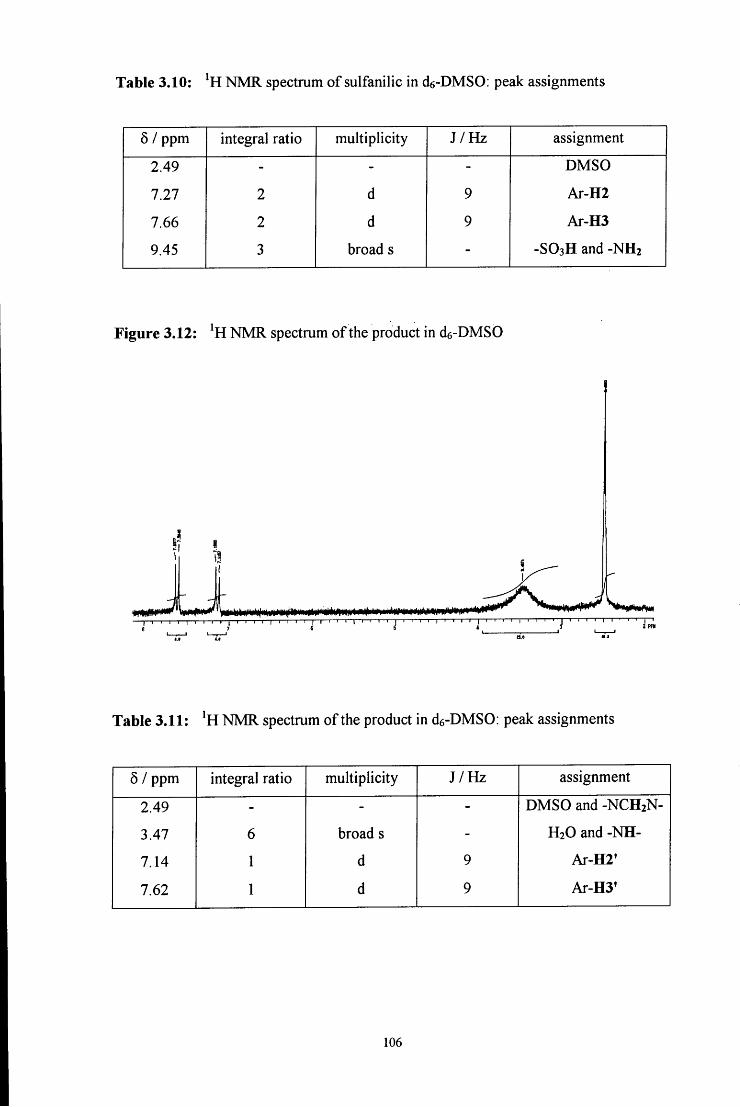
Table 3.10: NMR spectrum of sulfanilic in de-DMSO: peak assignments
6 / ppm integral ratio multiplicity J /Hz assignment
2.49 - - - DMSO
111 2 d 9 Ar-H2
7.66 2 d 9 Ar-H3
9.45 3 broad s - -SO3H and -NH2
Figure 3.12: NMR spectrum of the product in de-DMSO
| i i l l f c N i l > N ^ i H » i » i i ) l > l U m r t l l l H i I l M l l i l > i > i > ' i I i l l l M i M ^ i m n l M l i l ' i H I i l w H * * I I I I I I I I I ' I I ' I I I I I I ' • ' ' I ' I .
Table 3.11: NMR spectrum of the product in d6-DMS0: peak assignments
5 / ppm integral ratio multiplicity J /Hz assignment
2.49 - - - DMSO and -NCH2N-
3.47 6 broad s - H2O and -NH-
7.14 1 d 9 Ar-H2'
7.62 1 d 9 Ar-H3'
106
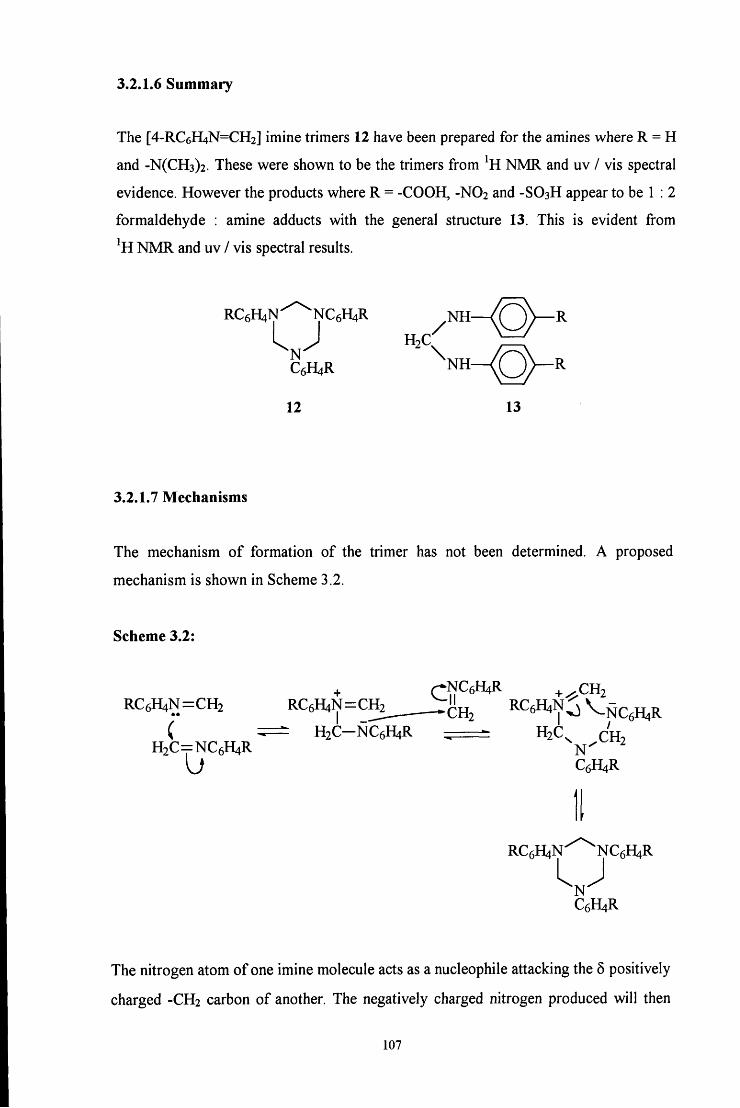
3.2.1.6 Summary
The [4-RC6H4N=CH2] imine trimers 12 have been prepared for the amines where R = H
and -N(CH3)2. These were shown to be the trimers from NMR and uv / vis spectral
evidence. However the products where R = -COOH, -NO2 and -SO3H appear to be 1 : 2
formaldehyde : amine adducts with the general structure 13. This is evident from
^H NMR and uv / vis spectral results.
R C 6 H 4 N ^ ^NC6H4R
^ N ^ C6H4R
12
H2C / \
N H
13
R
3.2.1.7 Mechanisms
The mechanism of formation of the trimer has not been determined. A proposed
mechanism is shown in Scheme 3.2.
Scheme 3.2:
RC6H4N=CH2
( H2C=NC6H4R
C^Cetm ^ ^ C H 2
- H2C-NC6H4R ^ H2C^ CHo N ^ C6H4R
RCgHjN"^ NC6H4R
^ N ^ C6H4R
The nitrogen atom of one imine molecule acts as a nucleophile attacking the 5 positively
charged -CH2 carbon of another. The negatively charged nitrogen produced will then
107
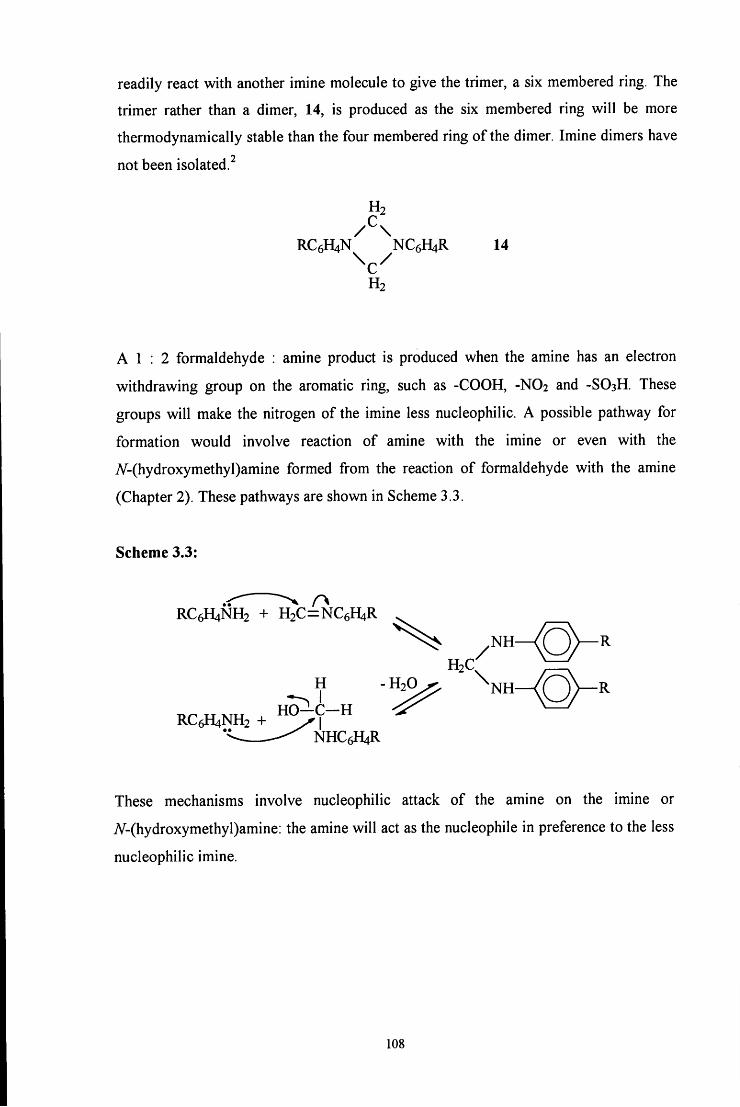
readily react with another imine molecule to give the trimer, a six membered ring. The
trimer rather than a dimer, 14, is produced as the six membered ring will be more
thermodynamically stable than the four membered ring of the dimer. Imine dimers have
not been isolated.
RC6H4N NC6H4R 14
H2
A 1 : 2 formaldehyde : amine product is produced when the amine has an electron
withdrawing group on the aromatic ring, such as -COOH, -NO2 and -SO3H. These
groups will make the nitrogen of the imine less nucleophilic. A possible pathway for
formation would involve reaction of amine with the imine or even with the
A^-(hydroxymethyl)amine formed from the reaction of formaldehyde with the amine
(Chapter 2). These pathways are shown in Scheme 3.3.
Scheme 3.3:
RC6H4NH2 + H2C=NC6H4R
H - 1 ^ 0 ^ ' \ n H ^ ( ^ ) - R
RC6H4NH2 + ^^Ji ^ NHC6H4R
These mechanisms involve nucleophilic attack of the amine on the imine or
A^-(hydroxymethyl)amine: the amine will act as the nucleophile in preference to the less
nucleophilic imine.
108
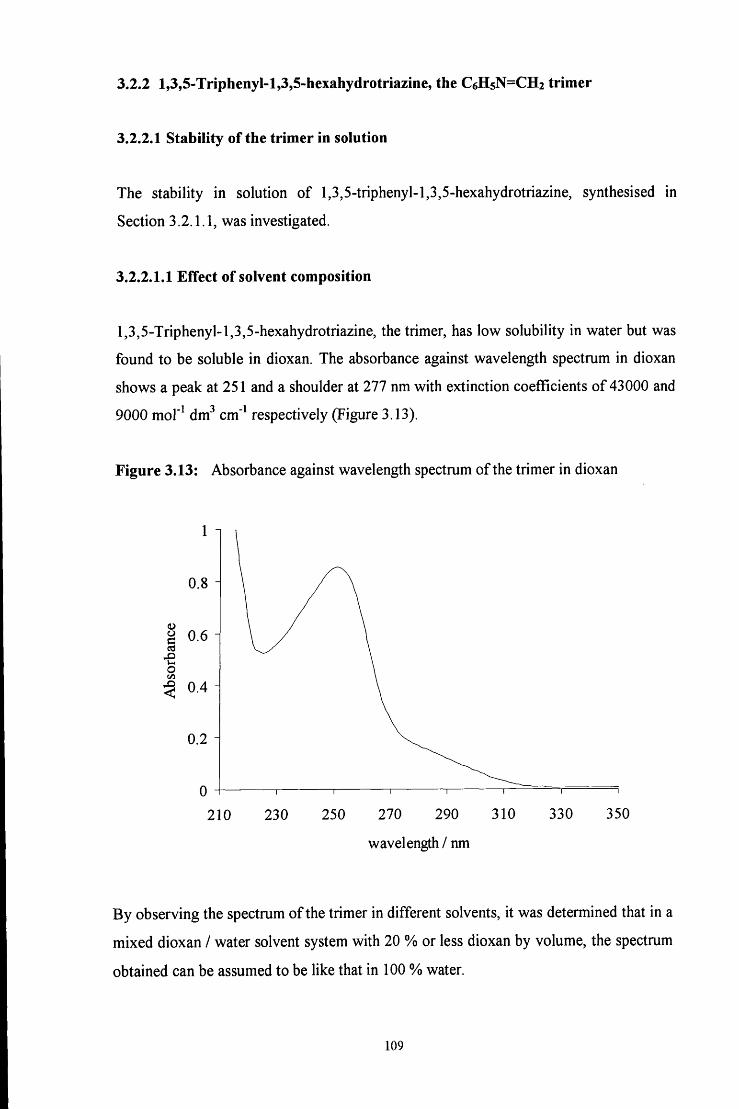
3.2.2 l,3,5-Triphenyl-l,3,5-hexahydrotriazine, the C6H5N=CH2 trimer
3.2.2.1 Stability of the trimer in solution
The stability in solution of l,3,5-triphenyl-l,3,5-hexahydrotriazine, synthesised in
Section 3.2.1.1, was investigated.
3.2.2.1.1 Effect of solvent composition
l,3,5-Triphenyl-l,3,5-hexahydrotriazine, the trimer, has low solubility in water but was
found to be soluble in dioxan. The absorbance against wavelength spectrum in dioxan
shows a peak at 251 and a shoulder at 277 nm with extinction coefficients of 43000 and
9000 mol"^ dm^ cm'^ respectively (Figure 3.13).
Figure 3.13: Absorbance against wavelength spectrum of the trimer in dioxan
1 n
0.8 H
c 0.6 I o ^ 0.4
0.2
0 i 1 1 1 1 1 T 1
210 230 250 270 290 310 330 350
wavelength / nm
By observing the spectrum of the trimer in different solvents, it was determined that in a
mixed dioxan / water solvent system with 20 % or less dioxan by volume, the spectrum
obtained can be assumed to be like that in 100 % water.
109
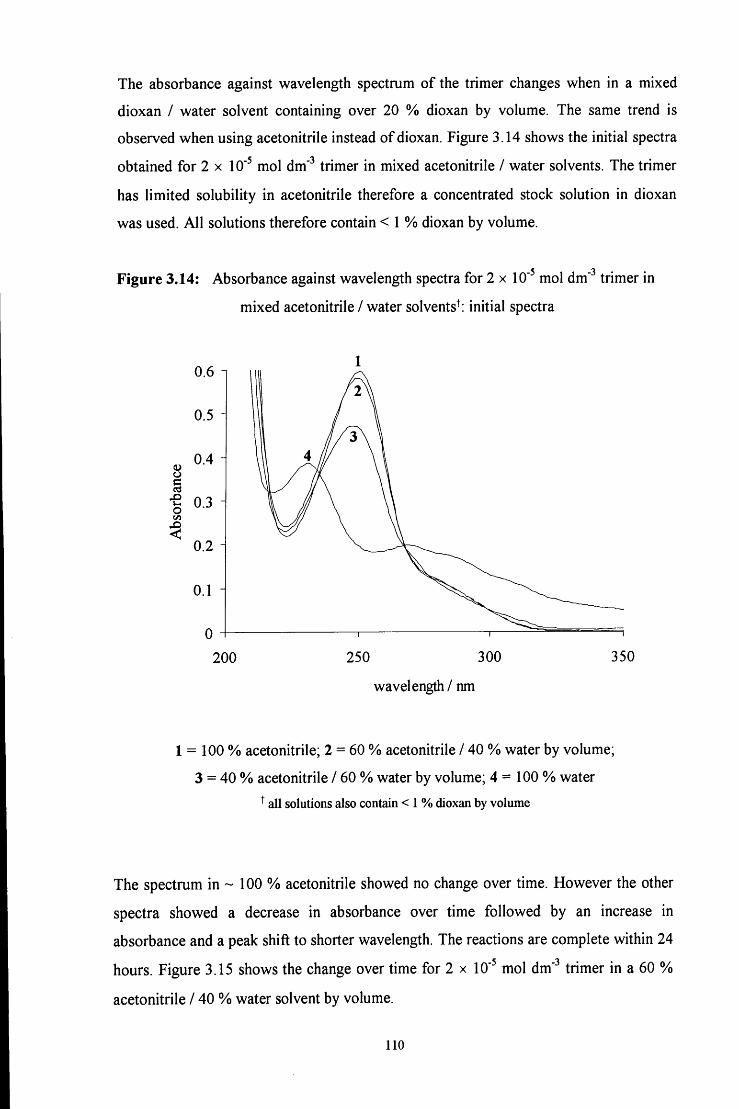
The absorbance against wavelength spectrum of the trimer changes when in a mixed
dioxan / water solvent containing over 20 % dioxan by volume. The same trend is
observed when using acetonitrile instead of dioxan. Figure 3.14 shows the initial spectra
obtained for 2 x 10" mol dm'^ trimer in mixed acetonitrile / water solvents. The trimer
has limited solubility in acetonitrile therefore a concentrated stock solution in dioxan
was used. Al l solutions therefore contain < 1 % dioxan by volume.
Figure 3.14: Absorbance against wavelength spectra for 2 x 10' mol dm' trimer in
mixed acetonitrile / water solvents^: initial spectra
0.6
0.5
I I 0.3
0.2
0.1
0
200 250 300
wavelength / nm
350
1 = 100 % acetonitrile; 2 = 60 % acetonitrile / 40 % water by volume;
3 = 40 % acetonitrile / 60 % water by volume; 4 = 100 % water
^ all solutions also contain < 1 % dioxan by volume
The spectrum in ~ 100 % acetonitrile showed no change over time. However the other
spectra showed a decrease in absorbance over time followed by an increase in
absorbance and a peak shift to shorter wavelength. The reactions are complete within 24
hours. Figure 3.15 shows the change over time for 2 x 10' mol dm'^ trimer in a 60 %
acetonitrile / 40 % water solvent by volume.
no
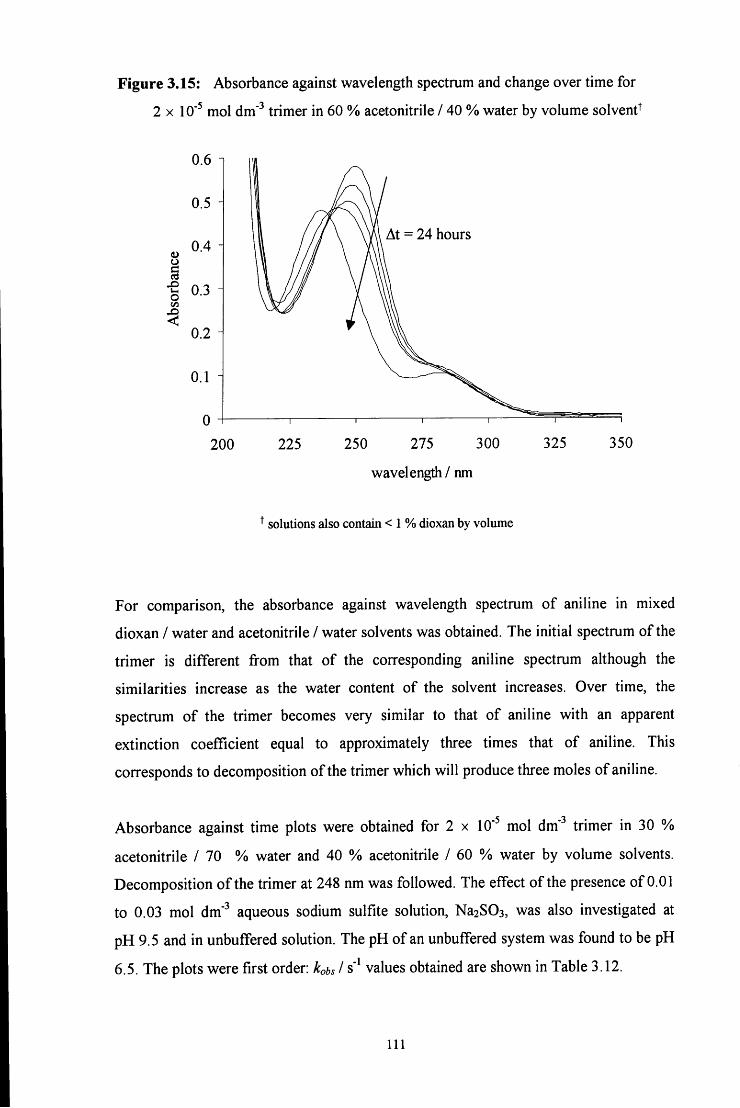
Figure 3.15: Absorbance against wavelength spectrum and change over time for
2 X 10' mol dm" trimer in 60 % acetonitrile / 40 % water by volume solvent^
0.6
o
0.5
0.4
0.3 H
0.2 i
0.1
At = 24 hours
200
— I 1 1 1 I I
225 250 275 300 325 350
wavelength / nm
solutions also contain < 1 % dioxan by volume
For comparison, the absorbance against wavelength spectrum of aniline in mixed
dioxan / water and acetonitrile / water solvents was obtained. The initial spectrum of the
trimer is different from that of the corresponding aniline spectrum although the
similarities increase as the water content of the solvent increases. Over time, the
spectrum of the trimer becomes very similar to that of aniline with an apparent
extinction coefficient equal to approximately three times that of aniline. This
corresponds to decomposition of the trimer which will produce three moles of aniline.
Absorbance against time plots were obtained for 2 x 10" mol dm' trimer in 30 %
acetonitrile / 70 % water and 40 % acetonitrile / 60 % water by volume solvents.
Decomposition of the trimer at 248 nm was followed. The effect of the presence of 0.01
to 0.03 mol dm" aqueous sodium sulfite solution, Na2S03, was also investigated at
pH 9.5 and in unbuffered solution. The pH of an unbuffered system was found to be pH
6.5. The plots were first order: kobs I s' values obtained are shown in Table 3.12.
I l l
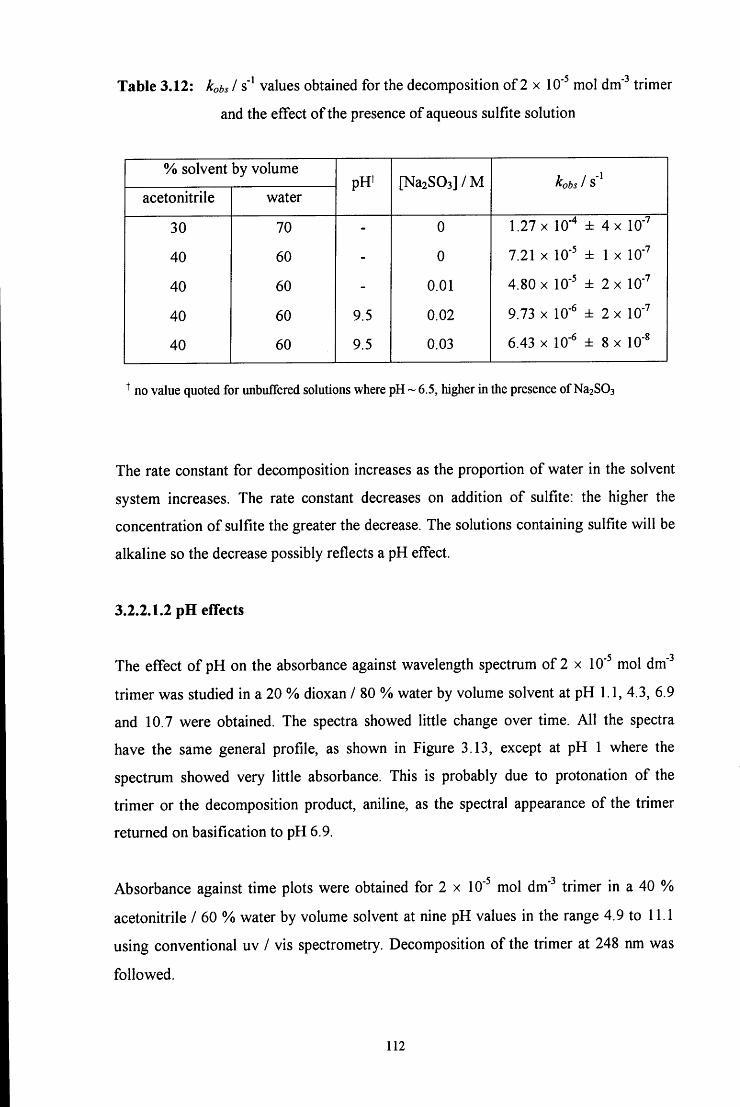
Table 3.12: kobs I s" values obtained for the decomposition of 2 x 10* mol dm' trimer
and the effect of the presence of aqueous sulfite solution
% solvent by volume pH^ [Na2S03]/M kobs Is'
acetonitrile water pH^ [Na2S03]/M kobs
30 70 - 0 1.27 X 10- ± 4 X lO'"
40 60 - 0 7.21 X 10- ± 1 X lO""
40 60 - 0.01 4.80 X 10" ± 2 X 10'
40 60 9.5 0.02 9.73 X 10- ± 2 X 10""
40 60 9.5 0.03 6.43 X 10- ± 8 X 10"
no value quoted for unbuffered solutions where pH ~ 6.5, higher in the presence of NaaSOa
The rate constant for decomposition increases as the proportion of water in the solvent
system increases. The rate constant decreases on addition of sulfite: the higher the
concentration of sulfite the greater the decrease. The solutions containing sulfite will be
alkaline so the decrease possibly reflects a pH effect.
3.2.2.1.2 pH effects
The effect of pH on the absorbance against wavelength spectrum of 2 x 10' mol dm'
trimer was studied in a 20 % dioxan / 80 % water by volume solvent at pH 1.1, 4.3, 6.9
and 10.7 were obtained. The spectra showed little change over time. All the spectra
have the same general profile, as shown in Figure 3.13, except at pH 1 where the
spectrum showed very little absorbance. This is probably due to protonation of the
trimer or the decomposition product, aniline, as the spectral appearance of the trimer
returned on basification to pH 6.9.
Absorbance against time plots were obtained for 2 x 10" mol dm" trimer in a 40 %
acetonitrile / 60 % water by volume solvent at nine pH values in the range 4.9 to 11.1
using conventional uv / vis spectrometry. Decomposition of the trimer at 248 nm was
followed.
112
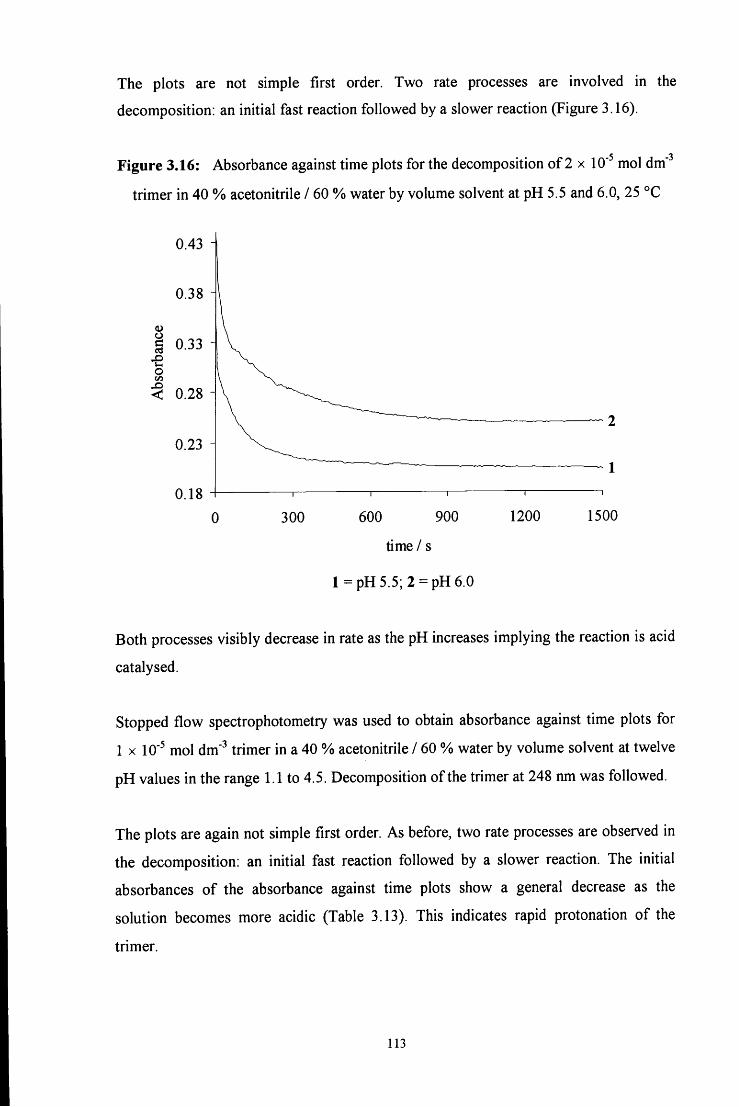
The plots are not simple first order. Two rate processes are involved in the
decomposition: an initial fast reaction followed by a slower reaction (Figure 3.16).
Figure 3.16: Absorbance against time plots for the decomposition of 2 x 10' mol dm
trimer in 40 % acetonitrile / 60 % water by volume solvent at pH 5.5 and 6.0, 25 °C
-3
0.43 4
S 0.33
o ^ 0.28
_ i 1 1 1 _
0 300 600 900 1200 1500
time / s
l = p H 5 . 5 ; 2 = pH6.0
Both processes visibly decrease in rate as the pH increases implying the reaction is acid
catalysed.
Stopped flow spectrophotometry was used to obtain absorbance against time plots for
1x10'^ mol dm" trimer in a 40 % acetonitrile / 60 % water by volume solvent at twelve
pH values in the range 1.1 to 4.5. Decomposition of the trimer at 248 nm was followed.
The plots are again not simple first order. As before, two rate processes are observed in
the decomposition: an initial fast reaction followed by a slower reaction. The initial
absorbances of the absorbance against time plots show a general decrease as the
solution becomes more acidic (Table 3.13). This indicates rapid protonation of the
trimer.
113
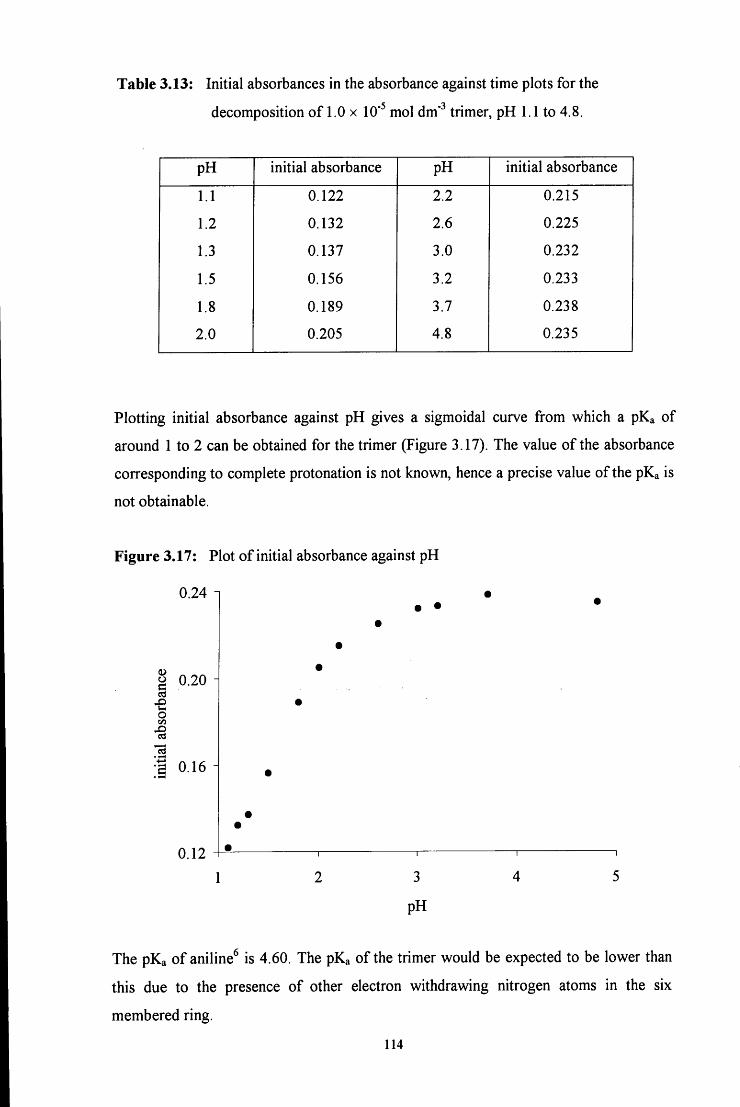
Table 3.13: Initial absorbances in the absorbance against time plots for the
decomposition of 1.0 x 10" mol dm'"* trimer, pH 1.1 to 4.8 -3
pH initial absorbance pH initial absorbance
1.1 0.122 2.2 0.215
1.2 0.132 2.6 0.225
1.3 0.137 3.0 0.232
1.5 0.156 3.2 0.233
1.8 0.189 3.7 0.238
2.0 0.205 4.8 0.235
Plotting initial absorbance against pH gives a sigmoidal curve from which a pKa of
around 1 to 2 can be obtained for the trimer (Figure 3.17). The value of the absorbance
corresponding to complete protonation is not known, hence a precise value of the pKa is
not obtainable.
Figure 3.17: Plot of initial absorbance against pH
0.24 1
I 0.20
1 i 0.16
0.12 3
pH
The pKa of aniline^ is 4.60. The pKa of the trimer would be expected to be lower than
this due to the presence of other electron withdrawing nitrogen atoms in the six
membered ring.
114
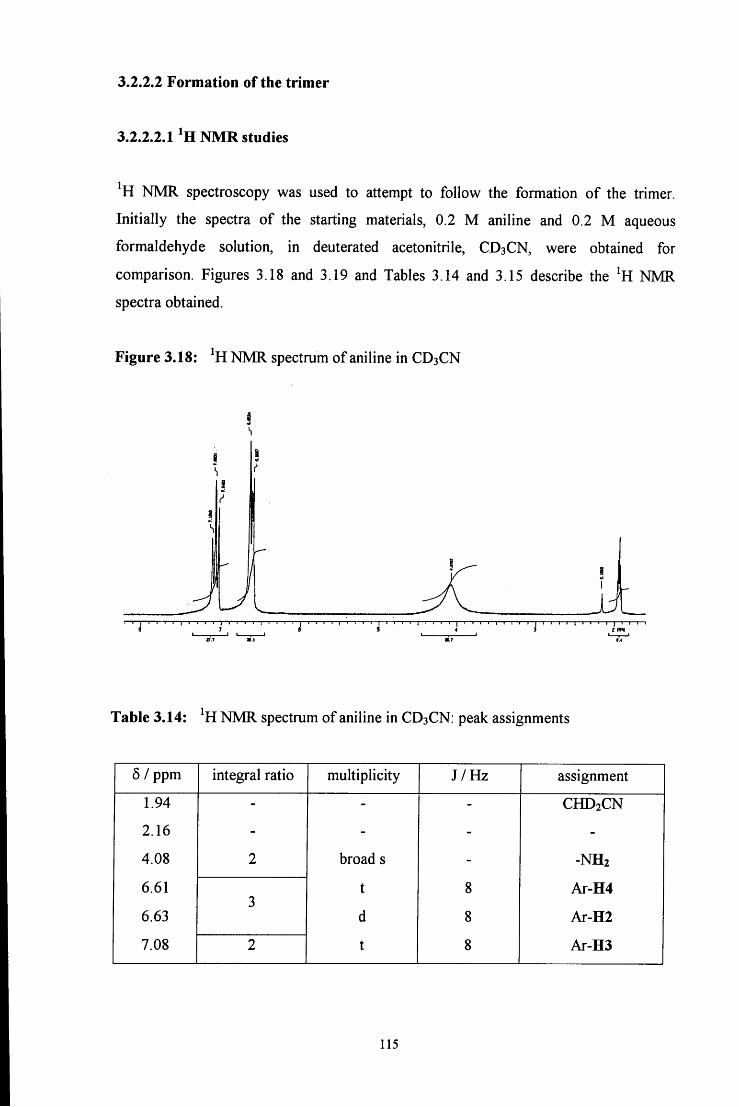
3.2.2.2 Formation of the trimer
3.2.2.2.1 NMR studies
^H NMR spectroscopy was used to attempt to follow the formation of the trimer.
Initially the spectra of the starting materials, 0.2 M aniline and 0.2 M aqueous
formaldehyde solution, in deuterated acetonitrile, CD3CN, were obtained for
comparison. Figures 3.18 and 3.19 and Tables 3.14 and 3.15 describe the ^H NMR
spectra obtained.
Figure 3.18: ^H NMR spectrum of aniline in CD3CN
\j I I I I I I I I I I I I
I
' ' 1 1 1 1 ' ' I ' ' ' ' I ' ' ' ' I ' ' ' ' ' ' I ' ' 1 1 ' ' ' I
Table 3.14: ^H NMR spectrum of aniline in CD3CN: peak assignments
6 / ppm integral ratio multiplicity J /Hz assignment
1.94 - - - CHD2CN
2.16 - - - -
4.08 2 broad s - -NH2
6.61 t 8 Ar-H4 3
6.63 d 8 Ar-H2
7.08 2 t 8 Ar-H3
115
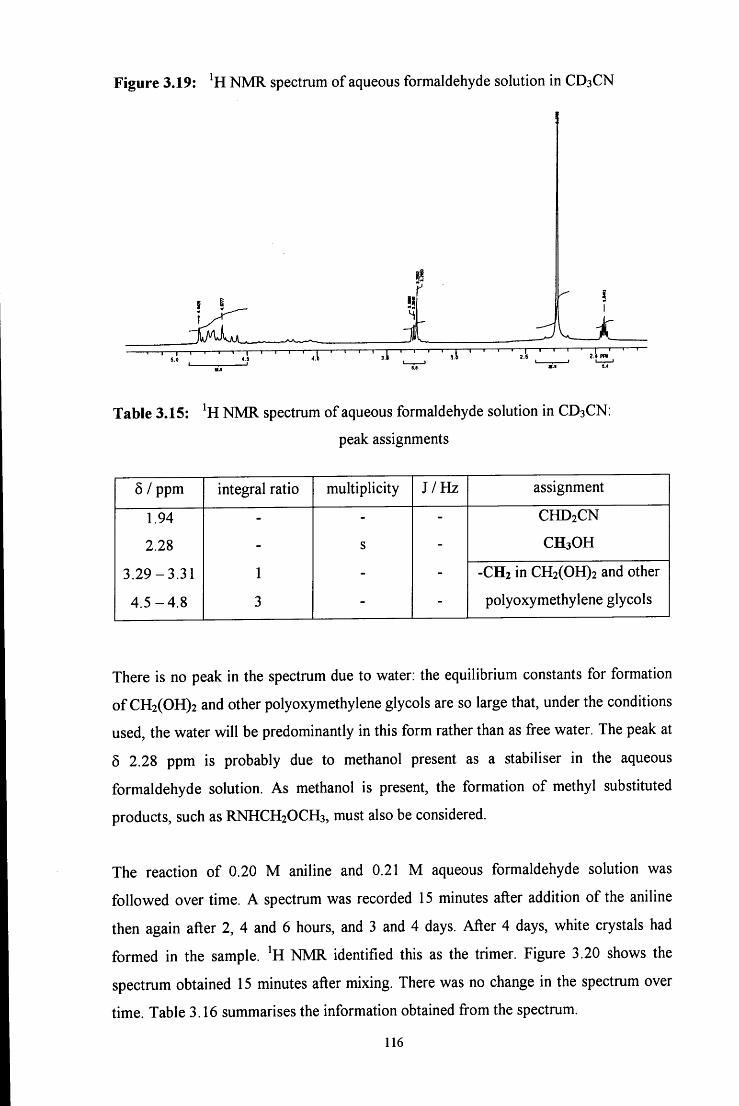
Figure 3.19: NMR spectrum of aqueous formaldehyde solution in CD3CN
I t
Table 3.15: NMR spectrum of aqueous formaldehyde solution in CD3CN:
peak assignments
6 / ppm integral ratio multiplicity J /Hz assignment
1.94 - - - CHD2CN
2.28 - s - CH3OH
3.29-3.31 1 - - -CH2 in CH2(OH)2 and other
4.5-4.8 3 - - polyoxymethylene glycols
There is no peak in the spectrum due to water: the equilibrium constants for formation
of CH2(OH)2 and other polyoxymethylene glycols are so large that, under the conditions
used, the water will be predominantly in this form rather than as free water. The peak at
5 2.28 ppm is probably due to methanol present as a stabiliser in the aqueous
formaldehyde solution. As methanol is present, the formation of methyl substituted
products, such as RNHCH2OCH3, must also be considered.
The reaction of 0.20 M aniline and 0.21 M aqueous formaldehyde solution was
followed over time. A spectrum was recorded 15 minutes after addition of the aniline
then again after 2, 4 and 6 hours, and 3 and 4 days. After 4 days, white crystals had
formed in the sample. NMR identified this as the trimer. Figure 3.20 shows the
spectrum obtained 15 minutes after mixing. There was no change in the spectrum over
time. Table 3.16 summarises the information obtained from the spectrum.
116
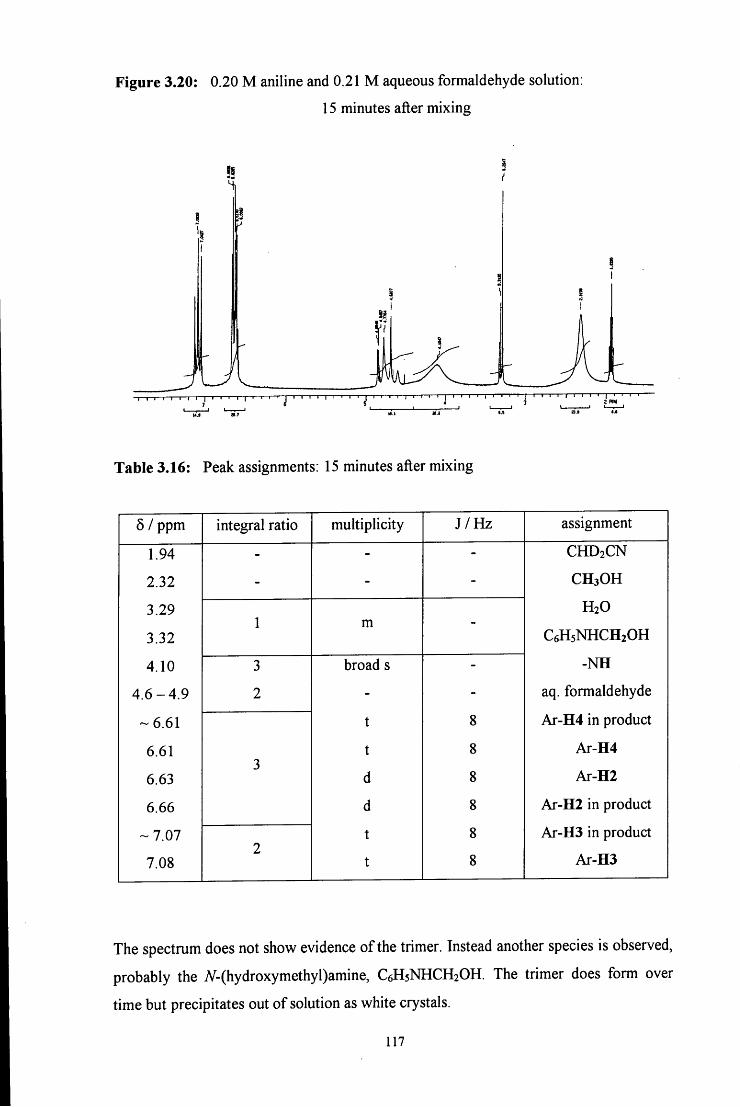
Figure 3.20: 0.20 M aniline and 0.21 M aqueous formaldehyde solution:
15 minutes after mixing
I M a.7
Table 3.16: Peak assignments: 15 minutes after mixing
5 / ppm integral ratio multiplicity J /Hz assignment
1.94 - - - CHD2CN
2.32 - - - CH3OH
3.29
3.32 1 m -
H2O
C6H5NHCH2OH
4.10 3 broad s - -NH
4.6-4.9 2 - - aq. formaldehyde
-6 .61 t 8 Ar-H4 in product
6.61 t 8 Ar-H4
6.63 J d 8 Ar-H2
6.66 d 8 Ar-H2 in product
-7.07 t 8 Ar-H3 in product
7.08 2 t 8 Ar-H3
The spectrum does not show evidence of the trimer. Instead another species is observed,
probably the A^-(hydroxymethyl)amine, C6H5NHCH2OH. The trimer does form over
time but precipitates out of solution as white crystals.
117
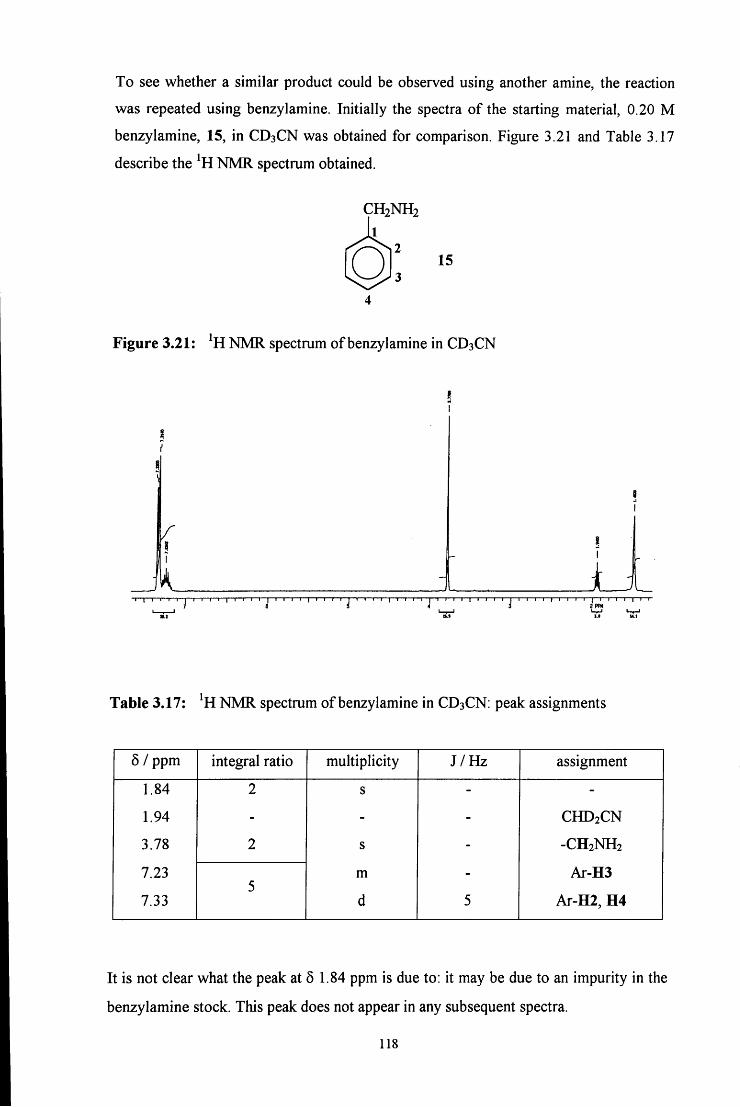
To see whether a similar product could be observed using another amine, the reaction
was repeated using benzylamine. Initially the spectra of the starting material, 0.20 M
benzylamine, 15, in CD3CN was obtained for comparison. Figure 3.21 and Table 3.17
describe the NMR spectrum obtained.
CH2NH2 1
15
Figure 3.21: NMR spectrum of benzylamine in CD3CN
1 1 1 1 1 1 1 1 1 1 1 1 1 1 1 1 1 1 ' ' I ' I ' ' ' ' I ' '
l . t ULl
Table 3.17: NMR spectrum of benzylamine in CD3CN: peak assignments
5 / ppm integral ratio multiplicity J /Hz assignment
1.84 2 s - -
1.94 - - - CHD2CN
3.78 2 s - -CH2NH2
7.23 m Ar-H3 5
7.33 d 5 Ar-H2, H4
It is not clear what the peak at 5 1.84 ppm is due to: it may be due to an impurity in the
benzylamine stock. This peak does not appear in any subsequent spectra.
118
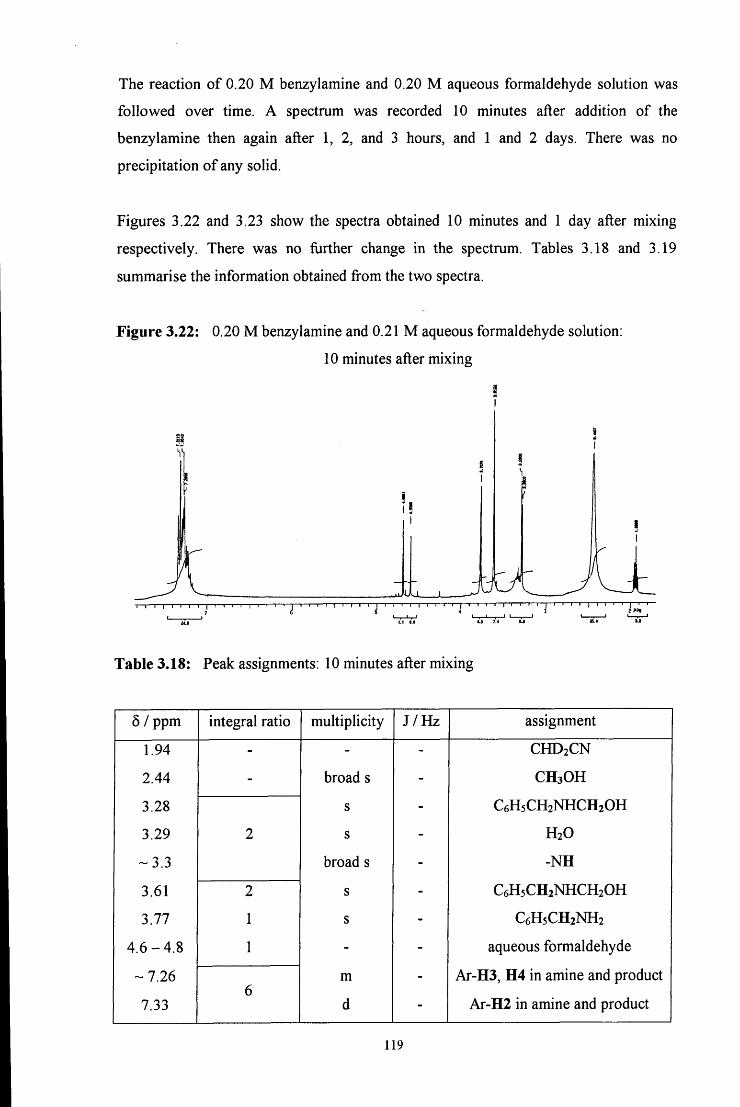
The reaction of 0.20 M benzylamine and 0.20 M aqueous formaldehyde solution was
followed over time. A spectrum was recorded 10 minutes after addition of the
benzylamine then again after 1, 2, and 3 hours, and 1 and 2 days. There was no
precipitation of any solid.
Figures 3.22 and 3.23 show the spectra obtained 10 minutes and 1 day after mixing
respectively. There was no fiirther change in the spectrum. Tables 3.18 and 3.19
summarise the information obtained from the two spectra.
Figure 3.22: 0.20 M benzylamine and 0.21 M aqueous formaldehyde solution:
10 minutes after mixing
I I I I 1 I I I I I I I • • I ' J I I I I I -1—I—I—I—r
U 7.4 U
Table 3.18: Peak assignments: 10 minutes after mixing
6 / ppm integral ratio multiplicity J /Hz assignment
1.94 - - - CHD2CN
2.44 - broad s - CH3OH
3.28 s - C6H5CH2NHCH2OH
3.29 2 s - H2O
-3.3 broad s - -NH
3.61 2 s - C6H5CH2NHCH2OH
3.77 1 s - C6H5CH2NH2
4.6-4.8 1 - - aqueous formaldehyde
-7.26 m - Ar-H3, H4 in amine and product
7.33 0 d - Ar-H2 in amine and product
119
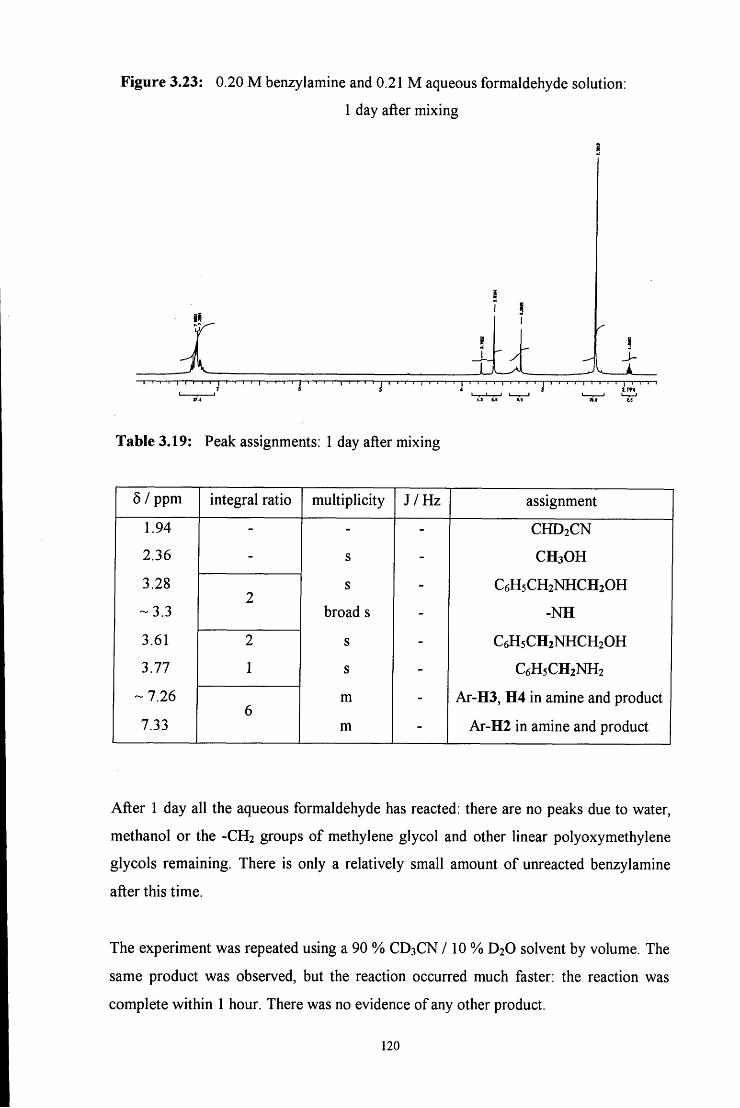
Figure 3.23: 0.20 M benzylamine and 0.21 M aqueous formaldehyde solution:
1 day after mixing
A I ' I I I I ' I ' I ' ' I ' I ' ' ' ' I ' ' ' ' I ' ' ' ' I I I I I I 1 1
Y i J -
l . t M 0.5
Table 3.19: Peak assignments: 1 day after mixing
5 / ppm integral ratio multiplicity J /Hz assignment
1.94 - - - CHD2CN
2.36 - s - CH3OH
3.28 9 s - C6H5CH2NHCH2OH
-3.3 broad s - -NH
3.61 2 s - C6H5CH2NHCH2OH
3.77 1 s - C6H5CH2NH2
-7.26 m - Ar-H3, H4 in amine and product
7.33 m - Ar-H2 in amine and product
After 1 day all the aqueous formaldehyde has reacted: there are no peaks due to water,
methanol or the -CH2 groups of methylene glycol and other linear polyoxymethylene
glycols remaining. There is only a relatively small amount of unreacted benzylamine
after this time.
The experiment was repeated using a 90 % CD3CN /10 % D2O solvent by volume. The
same product was observed, but the reaction occurred much faster: the reaction was
complete within 1 hour. There was no evidence of any other product.
120
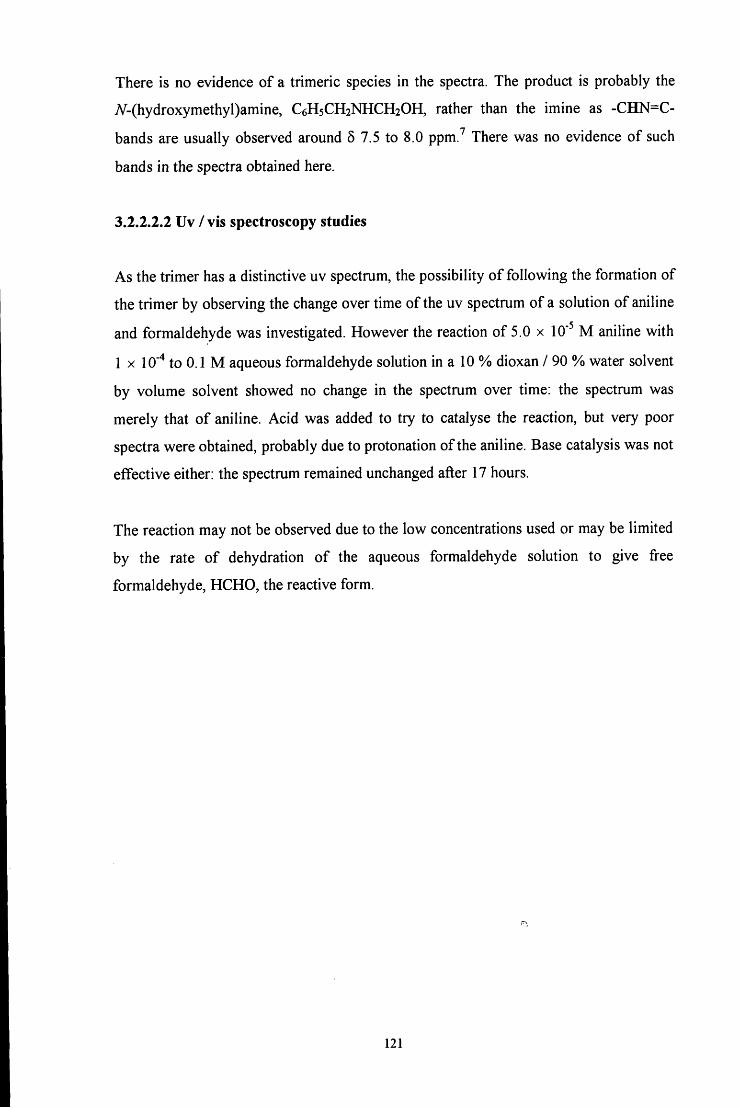
There is no evidence of a trimeric species in the spectra. The product is probably the
iV^-(hydroxymethyl)amine, C6H5CH2NHCH2OH, rather than the imine as -CHN=C-
bands are usually observed around 5 7.5 to 8.0 ppm.^ There was no evidence of such
bands in the spectra obtained here.
3.2.2.2.2 Uv / vis spectroscopy studies
As the trimer has a distinctive uv spectrum, the possibility of following the formation of
the trimer by observing the change over time of the uv spectrum of a solution of aniline
and formaldehyde was investigated. However the reaction of 5.0 x 10' M aniline with
1 X 10"'* to 0.1 M aqueous formaldehyde solution in a 10 % dioxan / 90 % water solvent
by volume solvent showed no change in the spectrum over time: the spectrum was
merely that of aniline. Acid was added to try to catalyse the reaction, but very poor
spectra were obtained, probably due to protonation of the aniline. Base catalysis was not
effective either: the spectrum remained unchanged after 17 hours.
The reaction may not be observed due to the low concentrations used or may be limited
by the rate of dehydration of the aqueous formaldehyde solution to give free
formaldehyde, HCHO, the reactive form.
121
3.3 CONCLUSION
The [4-RC6H4N=CH2] imine trimers were prepared for the amines where R = H and
-N(CH3)2. The products when R = -COOH, -NO2 and -SO3H appear to be 1 : 2
formaldehyde : amine adducts. These can form via reaction of the amine with the imine
or 7V-(hydroxymethyl)amine.
The stability in solution of the imine trimer formed fi-om aqueous formaldehyde
solution and aniline was studied. The trimer decomposes in solution to give as the
eventual products aniline and, by inference, aqueous formaldehyde. The results show
that the reaction is acid catalysed and involves at least two measurable processes. These
acid catalysed reactions could be as shown in Scheme 3.4.
Scheme 3.4:
C6H5N NC6H5
^ N ^ C6H5
C6H5N NC6H5 C6H5N NC6H5 fast . , . ^ > ^ 2 0 I H
V ^ ^ J ^ C H 2 O H + H ' NC3 ^ N
H C6H5 H C6H5
H2O, H""
C6H5N NC6H5
CH2(OH)2 + 1^ H N
H C6H5
These reactions involve rapid protonation of the trimer followed by rate determining
attack of water with carbon - nitrogen bond cleavage. Acid catalysed decomposition of
the A^-(hydroxymethyl)amine then yields an aniline derivative and aqueous
formaldehyde. Further analogous decomposition will yield aniline.
Formation of the iV-(hydroxymethyl)amines CeHsNHCHjOH and C6H5CH2NHCH2OH
was observed using ^H NMR spectroscopy for the reaction of aqueous formaldehyde
solution with aniline and benzylamine respectively in equimolar amounts. The trimer
122
formed over time for the reaction with aniline and precipitated out of solution as white
crystals.
The A^-(hydroxymethyl)amine is therefore the major product in the reaction of aqueous
formaldehyde solution with amines in equimolar concentrations: the trimer only forms
over a long period of time, over days under the conditions used. Dehydration of the
A'-(hydroxymethyl)amine is therefore likely to be rate limiting. Formation of cyclic
imines is accelerated by the presence of an electron withdrawing group on the aniline
such as 4-N(CH3)2.
The 1 : 2 formaldehyde : amine adducts produced with 4-RC6H4NH2 amines, where
R = -COOH, -NO2 and -SO3H, form much faster, generally within seconds or minutes
under the conditions used. This suggests that these products form predominantly via
reaction of the amine with the #-(hydroxymethyl)amine, as opposed to reaction of the
amine with the imine, as the imine will probably not form this rapidly.
123
3.4 E X P E R I M E N T A L
3.4.1 Preparation of 4-RC6H4N=CH2 imine polymers
The imine polymers were prepared as described in the text.
Recrystallisation was attempted for the 4-dimethylaminoaniline imine trimer using
boiling ethanol or hot 60 - 80° petroleum ether. 50 cm^ boiling ethanol or 60 - 80°
petroleum ether heated to 50 °C was added to 1 g of product. This was then filtered
rapidly through oven-hot apparatus and the filtrate cooled rapidly in ice. For the ethanol
recrystallisation, 20 cm^ distilled water was then added gradually over approximately
5 minutes. Solid began to form within a few minutes, forming faster on the addition of
water. The solution was left stirring in ice for 1 hour. The solution was then filtered and
the solid collected. For the recrystallisation involving petroleum ether, the filtrate was
cooled in ice for 10 minutes then left at room temperature for 24 hours. The solid
produced over this time was filtered and washed with cold 60 - 80° petroleum ether.
Both these methods were unsuccessfijl: little solid was produced and that obtained was
virtually identical to the crude product when analysed using uv / vis and NMR
spectroscopy.
Recrystallisation was also attempted for the 4-aminobenzoic acid product using boiling
ethanol or hot 60 - 80° petroleum ether. 50 cm^ boiling ethanol or 100 cm^ 60 - 80°
petroleum ether heated to 50 °C was added to 1 g of product. This was then filtered
rapidly through oven-hot apparatus and the filtrate cooled rapidly in ice. For the ethanol
recrystallisation, 20 cm^ distilled water was then added gradually over approximately
5 minutes. The solution was left stirring in ice for 2'/2 hours. No solid formed. For the
recrystallisation involving petroleum ether, the filtrate was cooled in ice for 10 minutes
then left at room temperature for 24 hours. Little solid was produced. The solution was
cooled in ice for a fiirther 6 hours: no ftirther solid was produced. Both these methods
were therefore unsuccessfiil: little solid was produced.
Recrystallisation of the aniline, 4-nitroaniline and sulfanilic acid products was not
attempted.
124
Sulfanilic acid is relatively soluble in water therefore the preparation was performed in
aqueous solution. However lower concentrations had to be used due to the limited
solubility. The aqueous sulfanilic acid solution was chilled in ice after addition of
aqueous formaldehyde solution to prevent sulfanilic acid fi-om precipitating out of
solution. The product obtained has limited solubility in de-DMSO: the ^H NMR sample
was left overnight to dissolve.
CD3CN was used as the ^H NMR solvent for the 4-nitroaniline product as in de-DMSO
the -NCH2N- peak is masked by the solvent peak: de-DMSO is a good hydrogen bond
donor therefore the spectra are shifted downfield in this solvent. The -NCH2N- peak in
the sulfanilic acid product is also masked, however it is not soluble in CD3CN therefore
this could not be used to obtain a spectrum.
^H NMR spectra were recorded using a 200 MHz Varian Mercury - 200, VXR 200 or
Gemini 200 spectrometer. The peak due to residual protons in the deuterated solvent
was used for locking purposes and as the reference peak for spectra. Chemical shifts are
quoted to 2 decimal places. Coupling constants are given where the multiplicity is
greater than a singlet and are quoted to the nearest whole number.
Absorbance against wavelength spectra were obtained for 4-dimethylaminoaniline and
4-nitroaniline and the respective imine polymers formed. Spectra were obtained using a
Perkin - Elmer Lambda 2 uv / vis spectrometer at 25 °C with 1 cm stoppered quartz
cuvettes, taking scans every 5 or 10 minutes for up to 4 hours using a scan speed of
480 nm min' \ The cuvettes were left in the spectrometer for at least 10 minutes prior to
use to allow the temperature to equilibrate to 25 °C. Extinction coefficients are quoted
to 2 or 3 significant figures and were calculated using only one spectrum in most cases.
3.4.2 Stability of l,3,5-triphenyl-l,3,5-hexahydrotriazine
3.4.2.1 Conventional uv / vis spectroscopy studies
Absorbance against wavelength spectra were obtained for the trimer and for aniline in
< 1 % dioxan / > 99 % water by volume to 100 % acetonitrile or dioxan solvents and for
the trimer in a 20 % dioxan / 80 % water by volume solvent at pH 1.1 to 10.7.
125
Absorbance against wavelength spectra were obtained using a Perkin - Elmer Lambda 2
uv / vis spectrometer at 25 °C with 1 cm stoppered quartz cuvettes, taking scans every
minute for up to 2 hours using a scan speed of 480 nm min'\ The cuvettes were left in
the spectrometer for at least 10 minutes prior to use to allow the temperature to
equilibrate to 25 °C. Extinction coefficients are quoted to 2 or 3 significant figures and
were calculated using only one spectrum in some cases.
Plots of absorbance against time were obtained for 2 x 10' mol dm'" trimer in 30 %
acetonitrile / 70 % water and 40 % acetonitrile / 60 % water by volume solvents, with
and without the presence of aqueous sulfite solution, and in a 20 % dioxan / 80 % water
by volume solvent at nine pH values in the range 4.9 to 11.1 at 25 °C.
Plots were recorded using a Perkin - Elmer Lambda 2 uv / vis spectrometer at 25 °C
with 1 cm stoppered quartz cuvettes. The data interval ranged from 5 seconds to
3 minutes and the overall reaction time from 2 to 15 hours depending on the pH, the
solvent system used and whether aqueous sodium sulfite was present. The cuvettes were
left in the spectrometer for at least 10 minutes prior to use to allow the temperature to
equilibrate at 25 °C. The decomposition of the trimer was followed at 248 nm. The
reaction was initiated by adding a small volume of a concentrated solution of trimer in
dioxan.
Sulfite ions absorb in the region studied: spectra of 0.01, 0.05 and 0.10 M aqueous
sodium sulfite solution were obtained and showed high absorbance around 250 nm and
to shorter wavelength. For example, the extinction coefficient of sulfite ions at 245 nm
was found to be 50 dm mol' cm' . Therefore when aqueous sodium sulfite solution
was added, the appropriate concentration was also added to the reference in order to
subtract the absorbance due to the presence of sulfite from the absorbance against time
plots.
First order kinetics were fitted using the PECCS program installed on the
Perkin - Elmer Lambda 2 spectrometer. Rate constants are quoted to 2 decimal places.
126
The buffers employed and the corresponding stoichiometric buffer concentrations in the
final solutions are shown in Table 3.20. Where buffers were used, the appropriate
volume of buffer was also present in the reference cuvette.
Table 3.20: Final buffer concentrations
pH component A [A]stoich / M component B [B]stoich / M
1.1 HCl 0.027 KCl 0.010
4.3 CH3COOH 0.020 CHsCOONa 4.0 X 10-
4.9 CH3COOH 0.050 CH3C00Na 0.020
5.3 CH3COOH 0.050 CH3C00Na 0.050
5.5 CH3COOH 0.030 CH3C00Na 0.050
6.0 CH3COOH 0.010 CH3C00Na 0.050
6.9 CH3COOH 0.010 CH3C00Na 0.056
9.5 Na2B4O7.10H2O 6.3 X 10' HCl 0.010
10.2 Na2B4O7.10H2O 6.3 X 10" HCl 2.3 X 10'
10.7 Na2B4O7.10H2O 2.5 X 10- NaOH 3.7 X 10'
11.1 Na2B4O7.10H2O 6.3 X 10" NaOH 9.2 X 10-
The pH values of all solutions were determined using a Jenway 3020 pH meter
calibrated using pH 7 and pH 10 (for alkaline solutions) or pH 4 (for acidic solutions)
buffers. pH values are quoted to one decimal place.
3.4.2.2 Stopped flow spectrophotometry studies
The decomposition of 1 x 10' mol dm' trimer in a 40 % acetonitrile / 60 % water by
volume solvent at twelve pH values in the range 1.1 to 4.5 was studied using stopped
flow spectrophotometry. Decomposition of the trimer at 248 nm was followed. Plots
were recorded using an Applied Photophysics DX.17MV BioSequential Stopped - flow
ASVD Spectrometer at 25.0 - 25.3 °C with a cell of 2 mm path length. Ten averages
were obtained, each the average of three runs of 50 to 100 seconds depending on the pH
value. The trimer solution in 40 % acetonitrile / 60 % water by volume was placed in
127
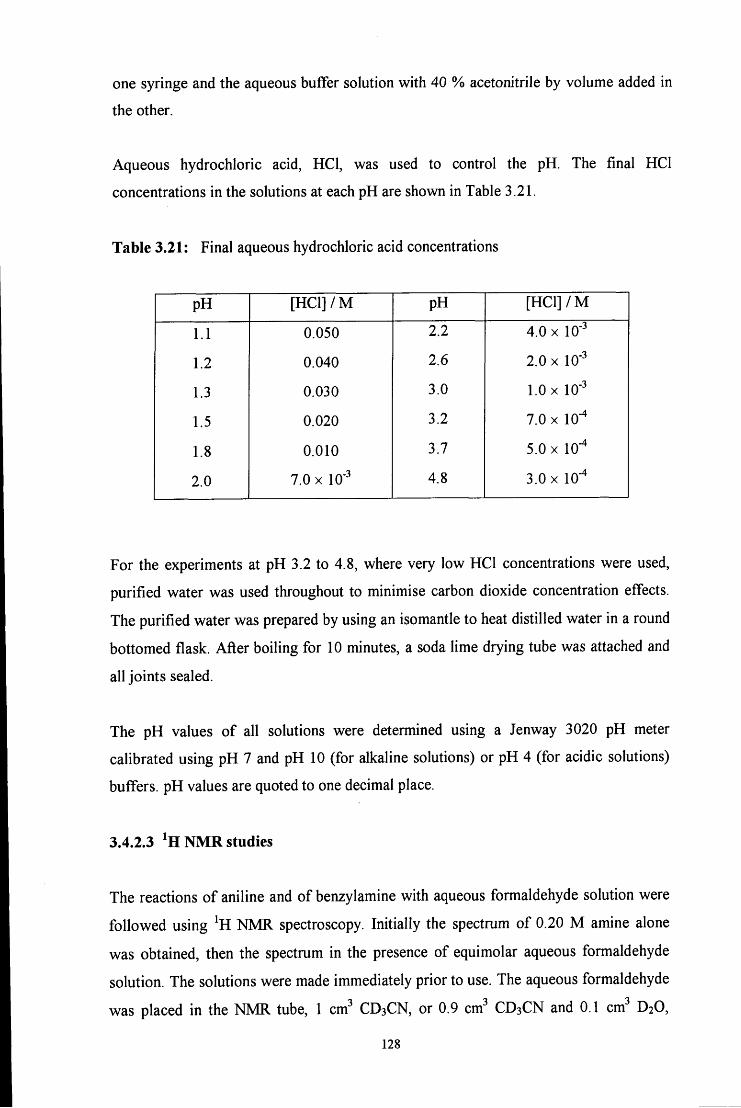
one syringe and the aqueous buffer solution with 40 % acetonitrile by volume added in
the other.
Aqueous hydrochloric acid, HCl, was used to control the pH. The final HCI
concentrations in the solutions at each pH are shown in Table 3.21.
Table 3.21: Final aqueous hydrochloric acid concentrations
pH [HC1]/M pH [HC1]/M
1.1 0.050 2.2 4.0 x 10-
1.2 0.040 2.6 2.0 X 10"
1.3 0.030 3.0 1.0 X 10-
1.5 0.020 3.2 7.0 X 10"
1.8 0.010 3.7 5.0 X 10-
2.0 7.0 x 10' 4.8 3.0 X 10"*
For the experiments at pH 3.2 to 4.8, where very low HCl concentrations were used,
purified water was used throughout to minimise carbon dioxide concentration effects.
The purified water was prepared by using an isomantle to heat distilled water in a round
bottomed flask. After boiling for 10 minutes, a soda lime drying tube was attached and
all joints sealed.
The pH values of all solutions were determined using a Jenway 3020 pH meter
calibrated using pH 7 and pH 10 (for alkaline solutions) or pH 4 (for acidic solutions)
buffers. pH values are quoted to one decimal place.
3.4.2.3 NMR studies
The reactions of aniline and of benzylamine with aqueous formaldehyde solution were
followed using NMR spectroscopy. Initially the spectrum of 0.20 M amine alone
was obtained, then the spectrum in the presence of equimolar aqueous formaldehyde
solution. The solutions were made immediately prior to use. The aqueous formaldehyde
was placed in the NMR tube, 1 cm^ CD3CN, or 0.9 cm^ CD3CN and 0.1 cm^ D2O,
128
added followed by the neat amine which was added at the NMR machine side. The
^H NMR spectrum of 0.20 M aqueous formaldehyde solution was also obtained for
comparison.
Spectra were recorded 10 to 15 minutes after mixing, then regularly until there was no
ftarther change in the spectrum. The time of mixing refers to the time at which the amine
was added to the NMR tube. The time of each spectrum was taken as the time when the
spectrometer started to acquire the spectrum.
^H NMR spectra were recorded using a 200 MHz Varian Mercury - 200 or Gemini 200
spectrometer. The 6 1.94 ppm singlet due to residual protons in the deuterated solvent,
CD3CN, was used for locking purposes and as the reference peak for all spectra.
Chemical shifts are quoted to 2 decimal places. Coupling constants are given where the
multiplicity is greater than a singlet and are quoted to the nearest whole number.
129
3.5 R E F E R E N C E S
1. J. G. Miller and E. C. Wagner, J. Am. Chem. Soc, 1932, 54, 3698
2. A. G. Giumanini, G. Verardo, L. Randaccio, N. Bresciani-Pahor and P. Traldi, J. f .
prakt. Chem., 1985, 327, 739
3. G. Distefano, A. G. Giumanini, A. Modelli and G. Poggi, J. Chem. Soc, Perkin
Trans. 2, 1985, 1623
4. J. Santhanalakshmi, Thermochim. Acta., 1988, 127, 369
5. A. T. Nielsen, D. W. Moore, M . D. Ogan and R. L. Atkins, Org. Chem., 1979, 44,
1678
6. D. D. Perrin, 'Dissociation constants of organic bases in aqueous solution',
Butterworths, London, 1965 and 1972 Supplement
7. M . R. Crampton, S. D. Lord and R. Millar, Chem. Soc, Perkin Trans. 2, 1997,
909
130
C H A P T E R 4
Decomposition of hydroxymethanesulfonate,
CH2(OH)(S03Na)
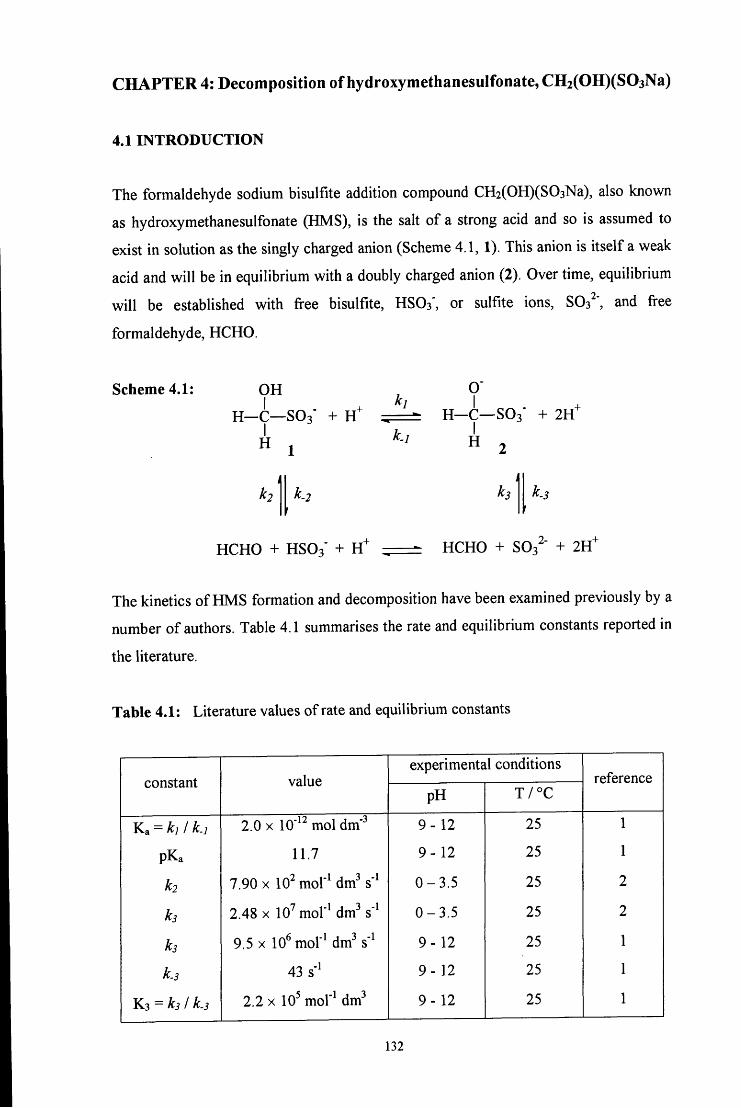
C H A P T E R 4: Decomposition of hydroxymethanesulfonate, CHjCOHXSOaNa)
4.1 INTRODUCTION
The formaldehyde sodium bisulfite addition compound CH2(OH)(S03Na), also known
as hydroxymethanesulfonate (HMS), is the salt of a strong acid and so is assumed to
exist in solution as the singly charged anion (Scheme 4.1, 1). This anion is itself a weak
acid and will be in equilibrium with a doubly charged anion (2). Over time, equilibrium
wil l be established with free bisulfite, HSO3', or sulfite ions, SOs ', and free
formaldehyde, HCHO.
Scheme 4.1: OH
H-C—SOg" +
H .
0"
H—C—SO3' + 2lC
H .
HCHO + HSOs' + H - HCHO + SOs " + 2YC
The kinetics of HMS formation and decomposition have been examined previously by a
number of authors. Table 4.1 summarises the rate and equilibrium constants reported in
the literature.
Table 4.1: Literature values of rate and equilibrium constants
constant value experimental conditions
reference constant value pH T / ° C
reference
Ka = k] / k.] 2.0 X 10" ^ mol dm' 9-• 12 25 1
pKa 11.7 9-• 12 25 1
k2 7.90 X 10^ mol'^ dm^ s' 0 - -3.5 25 2
ks 2.48 X lO' mol"^ dm^ s" 0 - -3.5 25 2
ks 9.5 X 10^ mol'^ dm s" 9-• 12 25 1
k.s 43 s" 9-• 12 25 1
K3 = ks/k.s 2.2 X 10^ mol"^ dm^ 9-• 12 25 1
132
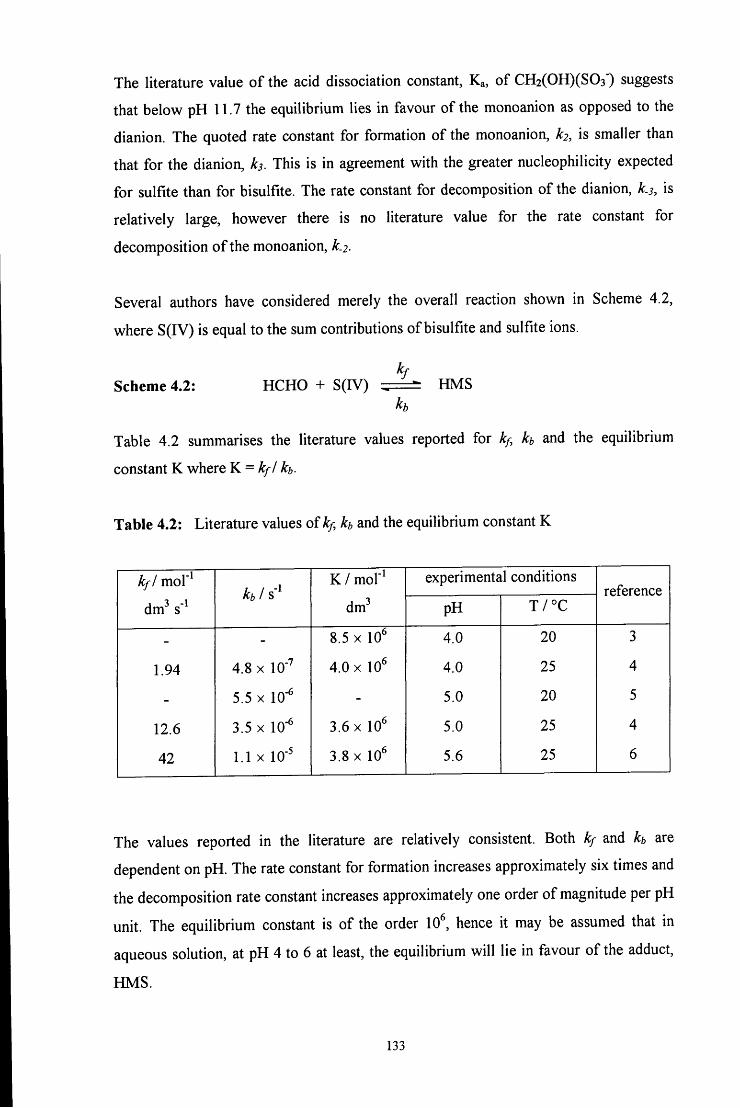
The literature value of the acid dissociation constant, Ka, of CH2(OH)(S03') suggests
that below pH 11.7 the equilibrium lies in favour of the monoanion as opposed to the
dianion. The quoted rate constant for formation of the monoanion, k2, is smaller than
that for the dianion, ks. This is in agreement with the greater nucleophilicity expected
for sulfite than for bisulfite. The rate constant for decomposition of the dianion, k.3, is
relatively large, however there is no literature value for the rate constant for
decomposition of the monoanion, k.2.
Several authors have considered merely the overall reaction shown in Scheme 4.2,
where S(IV) is equal to the sum contributions of bisulfite and sulfite ions.
Scheme 4.2: Kf
HCHO + S(IV) HMS h
Table 4.2 summarises the literature values reported for k f , h and the equilibrium
constant K where K = kf/ kb.
Table 4.2: Literature values of k f , h and the equilibrium constant K
k f l mol"^ kb 1
K / mol"^ experimental conditions reference
dm^ kb 1
dm^ pH T / ° C reference
- - 8.5 X 10 4.0 20 3
1.94 4.8 X 10"" 4.0 X 10 4.0 25 4
- 5.5 X 10' - 5.0 20 5
12.6 3.5 X 10" 3.6 X 10 5.0 25 4
42 1.1 X 10- 3.8 X 10 5.6 25 6
The values reported in the literature are relatively consistent. Both kf and h are
dependent on pH. The rate constant for formation increases approximately six times and
the decomposition rate constant increases approximately one order of magnitude per pH
unit. The equilibrium constant is of the order 10 , hence it may be assumed that in
aqueous solution, at pH 4 to 6 at least, the equilibrium will lie in favour of the adduct,
HMS.
133
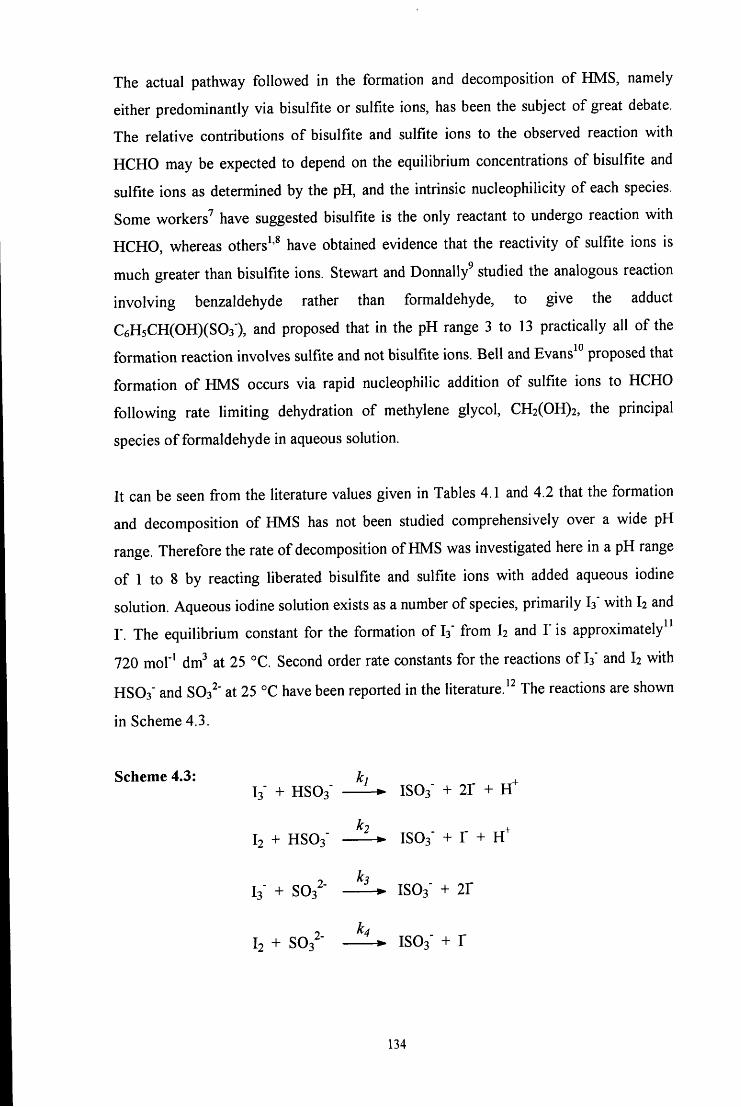
The actual pathway followed in the formation and decomposition of HMS, namely
either predominantly via bisulfite or sulfite ions, has been the subject of great debate.
The relative contributions of bisulfite and sulfite ions to the observed reaction with
HCHO may be expected to depend on the equilibrium concentrations of bisulfite and
sulfite ions as determined by the pH, and the intrinsic nucleophilicity of each species.
Some workers^ have suggested bisulfite is the only reactant to undergo reaction with
HCHO, whereas others ' have obtained evidence that the reactivity of sulfite ions is
much greater than bisulfite ions. Stewart and Donnally^ studied the analogous reaction
involving benzaldehyde rather than formaldehyde, to give the adduct
C6H5CH(OH)(S03'), and proposed that in the pH range 3 to 13 practically all of the
formation reaction involves sulfite and not bisulfite ions. Bell and Evans^" proposed that
formation of HMS occurs via rapid nucleophilic addition of sulfite ions to HCHO
following rate limiting dehydration of methylene glycol, CH2(OH)2, the principal
species of formaldehyde in aqueous solution.
It can be seen from the literature values given in Tables 4.1 and 4.2 that the formation
and decomposition of HMS has not been studied comprehensively over a wide pH
range. Therefore the rate of decomposition of HMS was investigated here in a pH range
of 1 to 8 by reacting liberated bisulfite and sulfite ions with added aqueous iodine
solution. Aqueous iodine solution exists as a number of species, primarily I3' with I2 and
r . The equilibrium constant for the formation of I3' from I2 and Y is approximately^^
720 mol'^ dm^ at 25 °C. Second order rate constants for the reactions of I3' and I2 with
HSO3' and 803^" at 25 °C have been reported in the literature. The reactions are shown
in Scheme 4.3.
Scheme 4.3: kj . V + HSOs' • ISO3' + 2r + H
k2 I2 + HSO3" ^ isOb" + r + h
2- ^3 I3" + S03^" • ISO3" + 21
I2 + S03^- IS03- + r
134
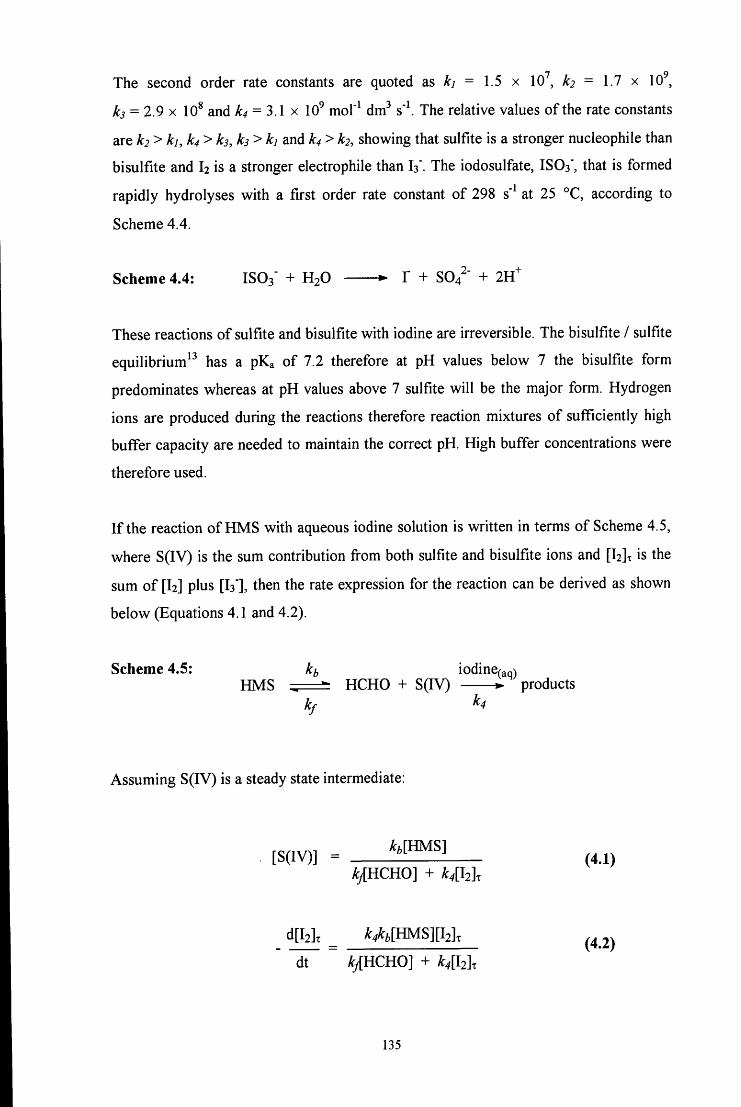
The second order rate constants are quoted as A:; = 1.5 x 10 , k2 = 1.7 x 10 ,
ks = 2.9 X 10^ and k4 = 3.l x 10 mol"* dm'' s"\ The relative values of the rate constants
are k2 > kj, k4 > kj, ks > kj and k4 > k2, showing that sulfite is a stronger nucleophile than
bisulfite and I2 is a stronger electrophile than I3". The iodosulfate, I S O 3 ' , that is formed
rapidly hydrolyses with a first order rate constant of 298 s' at 25 °C, according to
Scheme 4.4.
Scheme 4.4: ISO3" + H2O • T + SO/" + IH"
These reactions of sulfite and bisulfite with iodine are irreversible. The bisulfite / sulfite
equilibrium^^ has a pKa of 7.2 therefore at pH values below 7 the bisulfite form
predominates whereas at pH values above 7 sulfite will be the major form. Hydrogen
ions are produced during the reactions therefore reaction mixtures of sufficiently high
buffer capacity are needed to maintain the correct pH. High buffer concentrations were
therefore used.
I f the reaction of HMS with aqueous iodine solution is written in terms of Scheme 4.5,
where S(IV) is the sum contribution from both sulfite and bisulfite ions and [ I 2 ] t is the
sum of [I2] plus [I3"], then the rate expression for the reaction can be derived as shown
below (Equations 4.1 and 4.2).
Scheme 4.5: k^ iodine^aq) HMS ^ — - HCHO + S(IV) • products
kf
Assuming S(IV) is a steady state intermediate;
[S(IV)] = '^^^'^ (4.X) A/[HCHO] + klh].
d[l2]x ^^^z,[HMS][l2],
dt k^KCHO] + k4[l2]. (4.2)
135
It is expected that the rate of reaction of S(IV) with the aqueous iodine solution will be
much faster than the reaction of S(IV) with HCHO and therefore k4 » kf Hence the
rate equation reduces to Equation 4.3.
= kb\m^] (4.3) dt
Therefore the reaction should be zero order with respect to total aqueous iodine solution
concentration. In support of this, the rate of decomposition of aldehyde - bisulfite
adducts has previously been shown to be independent of the concentration of iodine. "*
The uv / vis spectrum of a standardised aqueous iodine solution with added potassium
iodide was found to show peaks at 287 and 350 nm with extinction coefficients of
19600 ± 300 and 13400 ± 300 mol'^ dm^ cm' respectively (Appendix 2).
Initially the reaction of aqueous iodine solution with aqueous sulfite solution was
investigated to observe the change in spectrum obtained. Then the reaction of HMS
with aqueous iodine solution was investigated in the pH range 1 to 8 to examine the
decomposition of HMS to gain a better understanding of the mechanism involved.
136
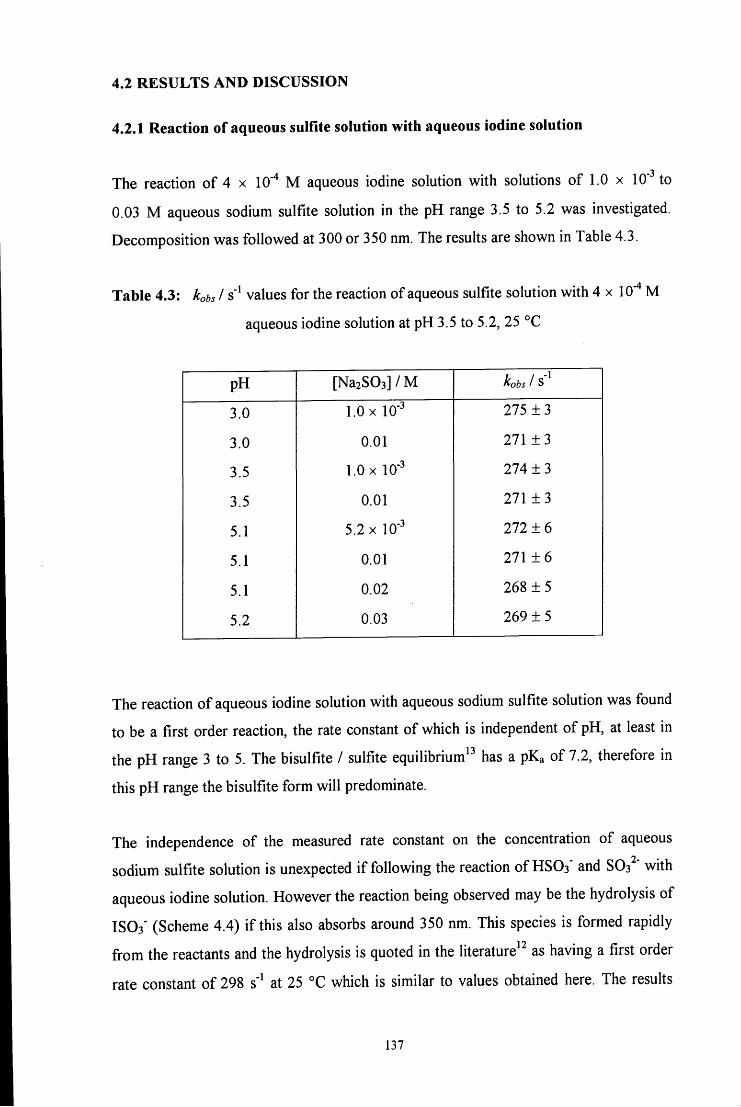
4.2 R E S U L T S AND DISCUSSION
4.2.1 Reaction of aqueous sulfite solution with aqueous iodine solution
The reaction of 4 x 10""* M aqueous iodine solution with solutions of 1.0 x 10"" to
0.03 M aqueous sodium sulfite solution in the pH range 3.5 to 5.2 was investigated.
Decomposition was followed at 300 or 350 nm. The results are shown in Table 4.3.
Table 4.3: kobs I s" values for the reaction of aqueous sulfite solution with 4 x 10" M
aqueous iodine solution at pH 3.5 to 5.2, 25 °C
pH [Na2S03]/M kobs 1 S
3.0 1.0 X 10- 275 ± 3
3.0 0.01 271 ± 3
3.5 1.0 X 10' 274 ± 3
3.5 0.01 271 ± 3
5.1 5.2 X 10- 272 + 6
5.1 0.01 2 7 1 + 6
5.1 0.02 268 + 5
5.2 0.03 269 ± 5
The reaction of aqueous iodine solution with aqueous sodium sulfite solution was found
to be a first order reaction, the rate constant of which is independent of pH, at least in
the pH range 3 to 5. The bisulfite / sulfite equilibrium^^ has a pKa of 7.2, therefore in
this pH range the bisulfite form will predominate.
The independence of the measured rate constant on the concentration of aqueous
sodium sulfite solution is unexpected i f following the reaction of HSO3' and SOs " with
aqueous iodine solution. However the reaction being observed may be the hydrolysis of
ISO3' (Scheme 4.4) i f this also absorbs around 350 nm. This species is formed rapidly 1 o
from the reactants and the hydrolysis is quoted in the literature as having a first order
rate constant of 298 s" at 25 °C which is similar to values obtained here. The results
137
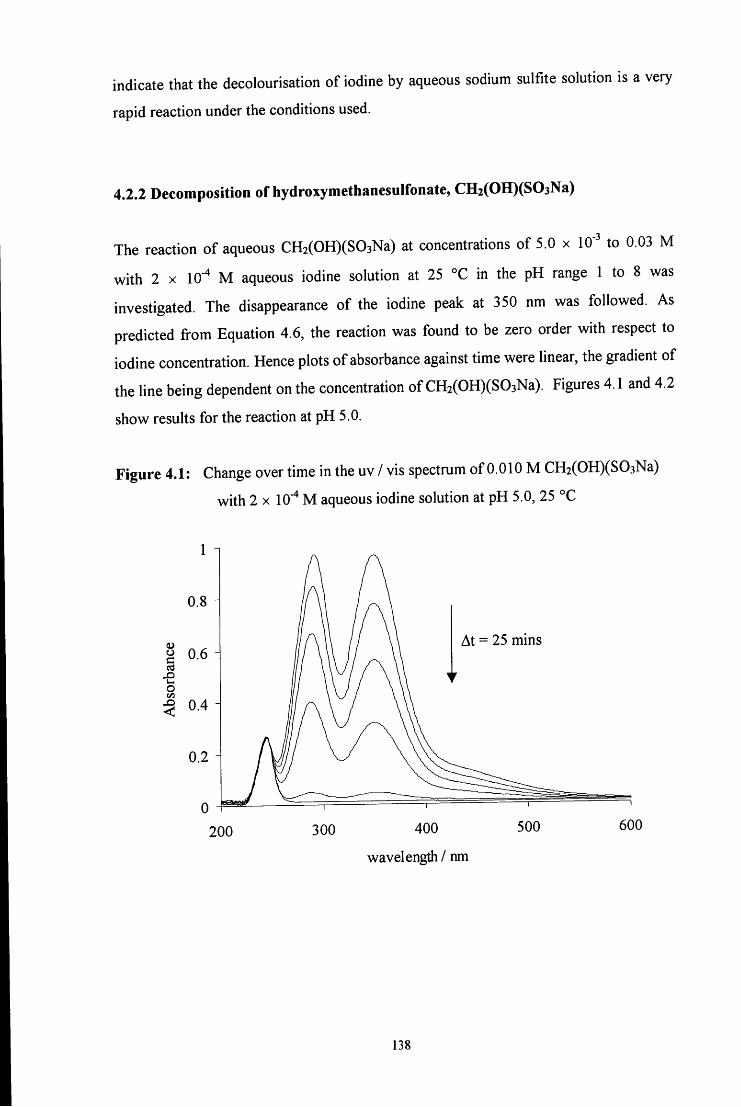
indicate that the decolourisation of iodine by aqueous sodium sulfite solution is a very
rapid reaction under the conditions used.
4.2.2 Decomposition of hydroxymethanesulfonate, CH2(OH)(S03Na)
The reaction of aqueous CH2(OH)(S03Na) at concentrations of 5.0 x 10" to 0.03 M
with 2 X lO""* M aqueous iodine solution at 25 °C in the pH range 1 to 8 was
investigated. The disappearance of the iodine peak at 350 nm was followed. As
predicted fi-om Equation 4.6, the reaction was found to be zero order with respect to
iodine concentration. Hence plots of absorbance against time were linear, the gradient of
the line being dependent on the concentration of CH2(0H)(S03Na). Figures 4.1 and 4.2
show results for the reaction at pH 5.0.
Figure 4.1: Change over time in the uv / vis spectrum of 0.010 M CH2(OH)(S03Na)
with 2 X 10- M aqueous iodine solution at pH 5.0, 25 °C
200
At = 25 mins 2 0.6 i
300 400
wavelength / nm
500 600
138
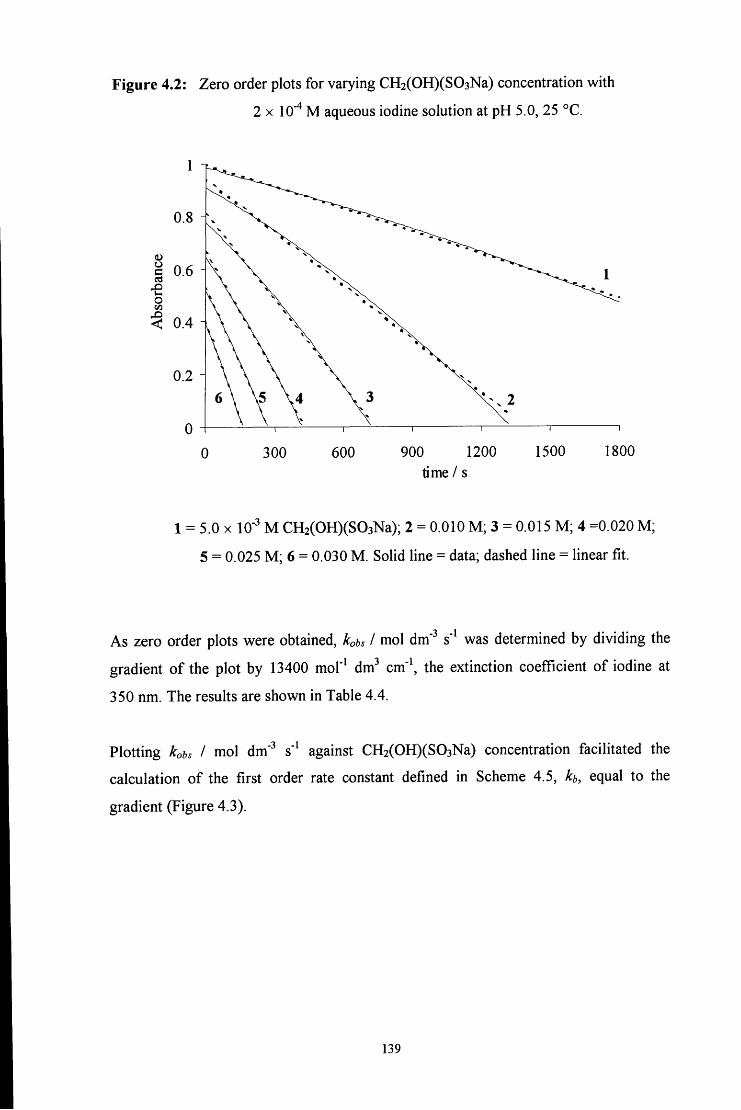
Figure 4.2: Zero order plots for varying CH2(OH)(S03Na) concentration with
2 X 10"" M aqueous iodine solution at pH 5.0, 25 °C.
5 0.6
< 0.4
300 600 900 1200 time / s
1500 1800
1 = 5.0 X 10- M CH2(OH)(S03Na); 2 = 0.010 M ; 3 = 0.015 M ; 4 =0.020 M;
5 = 0.025 M ; 6 = 0.030 M . Solid line = data; dashed line = linear fit.
As zero order plots were obtained, kobs I mol dm' s"' was determined by dividing the
gradient of the plot by 13400 mol"^ dm^ cm"\ the extinction coefficient of iodine at
350 nm. The results are shown in Table 4.4.
Plotting kobs I mol dm'^ s" against CH2(OH)(S03Na) concentration facilitated the
calculation of the first order rate constant defined in Scheme 4.5, h, equal to the
gradient (Figure 4.3).
139
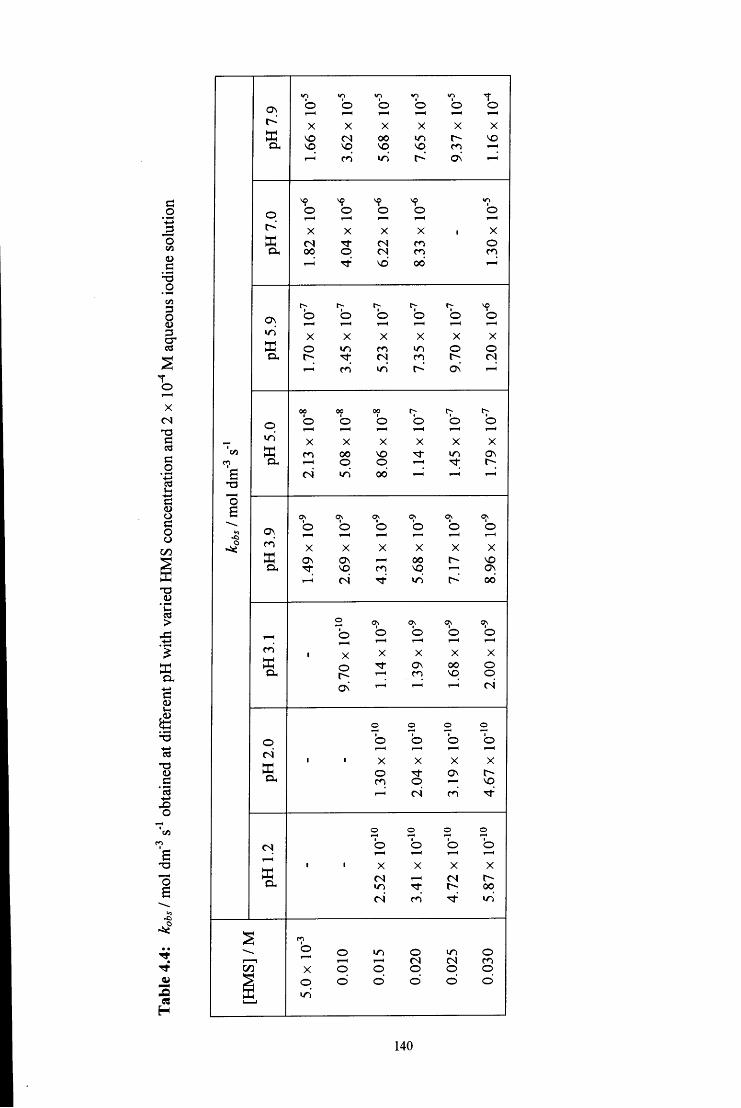
0\
X
b in b
b b b t o
X X X X X X VO VO VO 00
vq VO cn VO
.—I IT) o< r-I
o
CI, 00 o vd
X m 00
O
iri
Oh
b b b b b b X X X X X X o en o o
cs 1—1
B
I
O IT) X
ON CO
X m I—H
Ov
00 o
VO O X
0\ VO
o X X
00
in
X
00 - — I - — I " — I
VO ON 00
X Oh
o o o 1—1 " " ^
O Ov
X ON cn
00 VO
O o ^ ^ ^ (Sj
O
X ex
o o o o b b b b
<—1
X X X X o ON CO o I—1 VO 1—I cn
B o X
00 ir>
-4
3 H
X o
o o m o 1—1 r — I (N o o O O o b b b b b
140
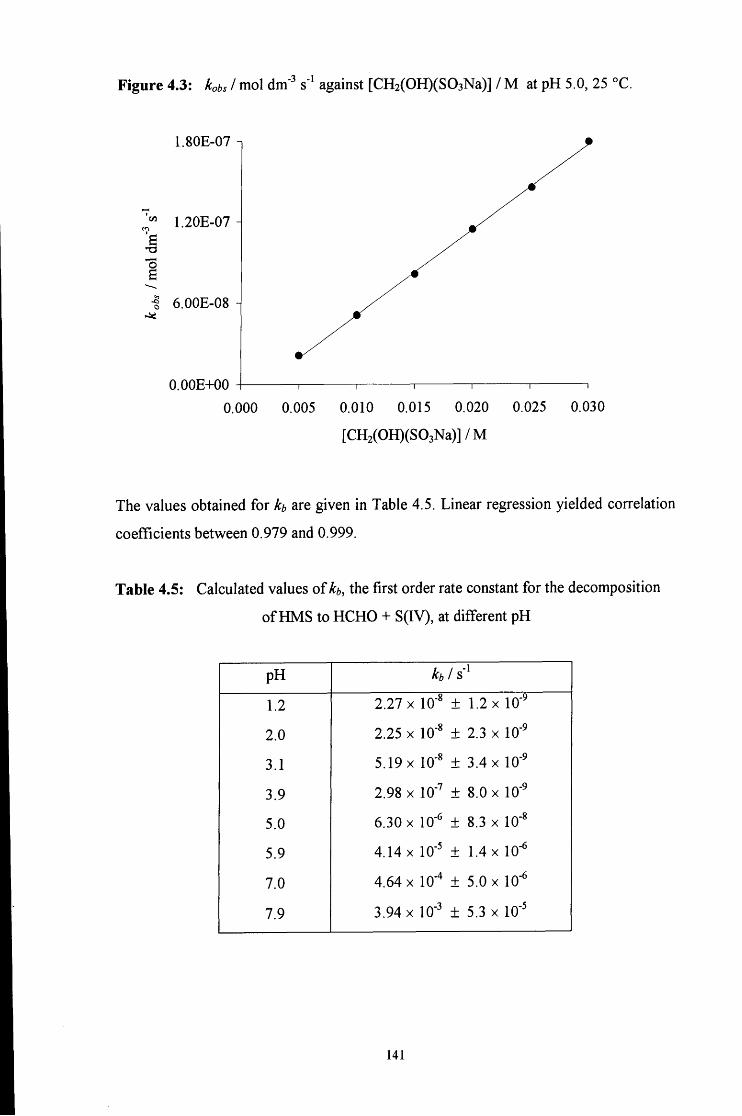
Figure 4.3: Kbs I mol dm" s" against [CH2(OH)(S03Na)] / M at pH 5.0, 25 °C.
1.80E-07 - 1
^ 1.20E-07
g
I 6.00E-08
O.OOE+00 0.000 0.005 0.010 0.015 0.020 0.025 0.030
[CH2(OH)(S03Na)]/M
The values obtained for h are given in Table 4.5. Linear regression yielded correlation
coefficients between 0.979 and 0.999.
Table 4.5: Calculated values of kb, the first order rate constant for the decomposition
of HMS to HCHO + S(IV), at different pH
pH
1.2 2.27 X 10" ± 1.2 X 10"
2.0 2.25 X 10" ± 2.3 X 10'
3.1 5.19 X 10' ± 3.4 X 10'
3.9 2.98 X 10"' ± 8.0 X 10"
5.0 6.30 X 10" ± 8.3 X 10"
5.9 4.14 X 10- ± 1.4 X 10-
7.0 4.64 X 10' ± 5.0 X 10'
7.9 3.94 X 10" + 5.3 X 10"
141
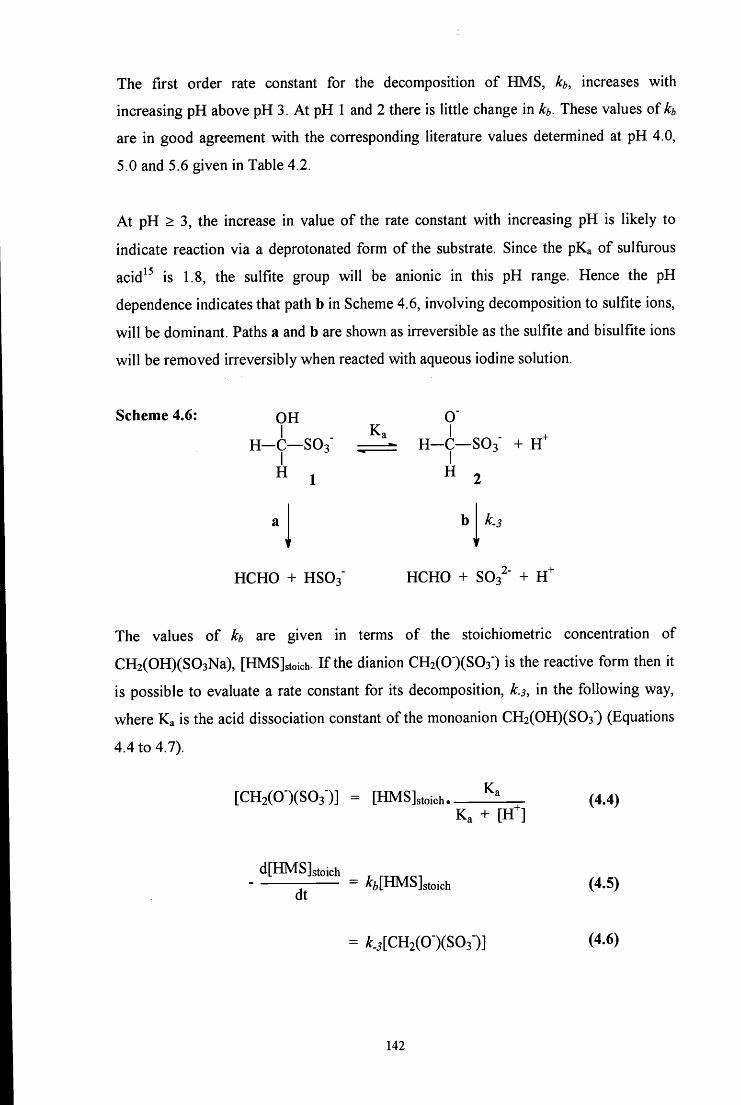
The first order rate constant for the decomposition of HMS, h, increases with
increasing pH above pH 3. At pH 1 and 2 there is little change in h. These values of h
are in good agreement with the corresponding literature values determined at pH 4.0,
5.0 and 5.6 given in Table 4.2.
At pH > 3, the increase in value of the rate constant with increasing pH is likely to
indicate reaction via a deprotonated form of the substrate. Since the pKa of sulfiirous
acid ^ is 1.8, the sulfite group will be anionic in this pH range. Hence the pH
dependence indicates that path b in Scheme 4.6, involving decomposition to sulfite ions,
will be dominant. Paths a and b are shown as irreversible as the sulfite and bisulfite ions
will be removed irreversibly when reacted with aqueous iodine solution.
Scheme 4.6: OH O" I Ka I
H—C—SO3 H-C—SO3 + H I I
H 1 H 2
k.,
HCHO + HSO3" HCHO + SOs " + H"
The values of h are given in terms of the stoichiometric concentration of
CH2(OH)(S03Na), [HMSjstoich. If the dianion CH2(0")(S03") is the reactive form then it
is possible to evaluate a rate constant for its decomposition, k.s, in the following way,
where Ka is the acid dissociation constant of the monoanion CH2(OH)(S03') (Equations
4.4 to 4.7).
[CH2(0-)(S03-)] = [HMSJstoich (4.4) Ka + [ H 1
d[HMS]stoich , = ^6[HMS]stoich (4.5)
at
= t3[CH2(0-)(S03-)] (4.6)
142
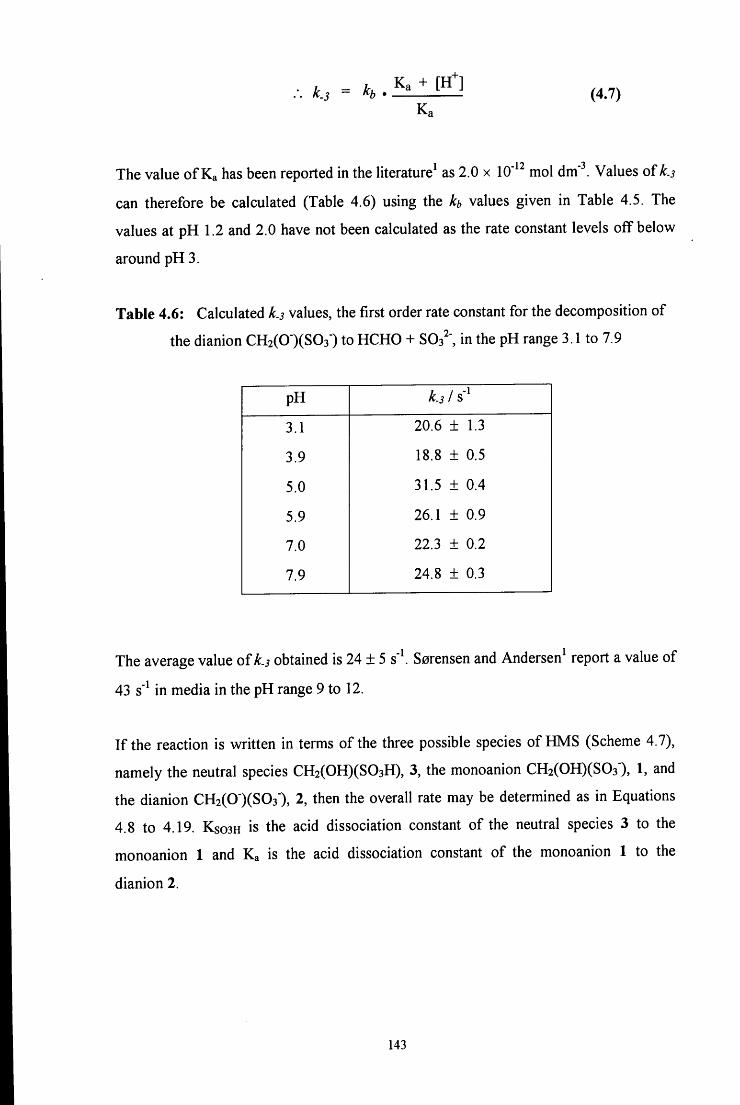
k.s = h • Ka + [ H i (4.7)
The value of Ka has been reported in the literature^ as 2.0 x 10' ^ mol dm" . Values of k.s
can therefore be calculated (Table 4.6) using the h values given in Table 4.5. The
values at pH 1.2 and 2.0 have not been calculated as the rate constant levels off below
around pH3.
Table 4.6: Calculated k.s values, the first order rate constant for the decomposition of
the dianion CH2(0')(S03') to HCHO + S03 ", in the pH range 3.1 to 7.9
pH k.s 1
3.1 20.6 ± 1.3
3.9 18.8 ± 0.5
5.0 31.5 ± 0.4
5.9 26.1 ± 0.9
7.0 22.3 ± 0.2
7.9 24.8 ± 0.3
The average value of k.s obtained is 24 ± 5 s'\ Sorensen and Andersen^ report a value of
43 s' in media in the pH range 9 to 12.
If the reaction is written in terms of the three possible species of HMS (Scheme 4.7),
namely the neutral species CH2(OH)(S03H), 3, the monoanion CH2(OH)(S03"), 1, and
the dianion CH2(0')(S03"), 2, then the overall rate may be determined as in Equations
4.8 to 4.19. Kso3H is the acid dissociation constant of the neutral species 3 to the
monoanion 1 and Ka is the acid dissociation constant of the monoanion 1 to the
dianion 2.
143
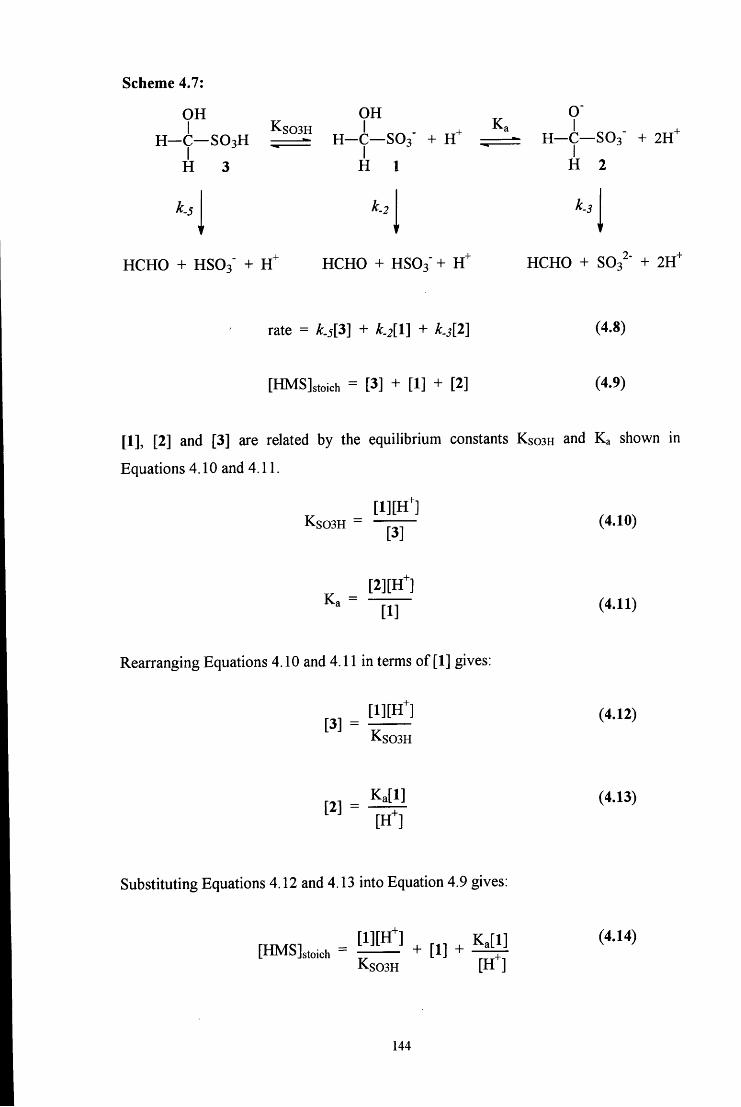
Scheme 4.7:
OH OH
H - 6 - S O 3 H ^ H - | - S 0 3 - + H^
H 3 H I
H C H O + HSO3" + H ^ H C H O + HSO3" + H ^
O"
H—C—SO3" + 2H^
H 2
k..
H C H O + S03^' + 2H'
rate = k.5[Z] + k.2[l] + k.sW
[HMSlstoich = [3] + [1] + [2]
(4.8)
(4.9)
[1], [2] and [3] are related by the equilibrium constants KSO3H and Ka shown in
Equations 4.10 and 4.11.
Kso3H -[ 1 ] [ H 1
[3] (4.10)
K« = m m
[1] (4.11)
Rearranging Equations 4.10 and 4.11 in terms of [1] gives:
[3] = [ I ] [ H 1
Ks03H
(4.12)
K a [ l ] [2] = - V
[ H i
(4.13)
Substituting Equations 4.12 and 4.13 into Equation 4.9 gives:
[HMS] stoich [ 1 ] [ H 1 , , K . [ l ]
Ks03H
(4.14)
144
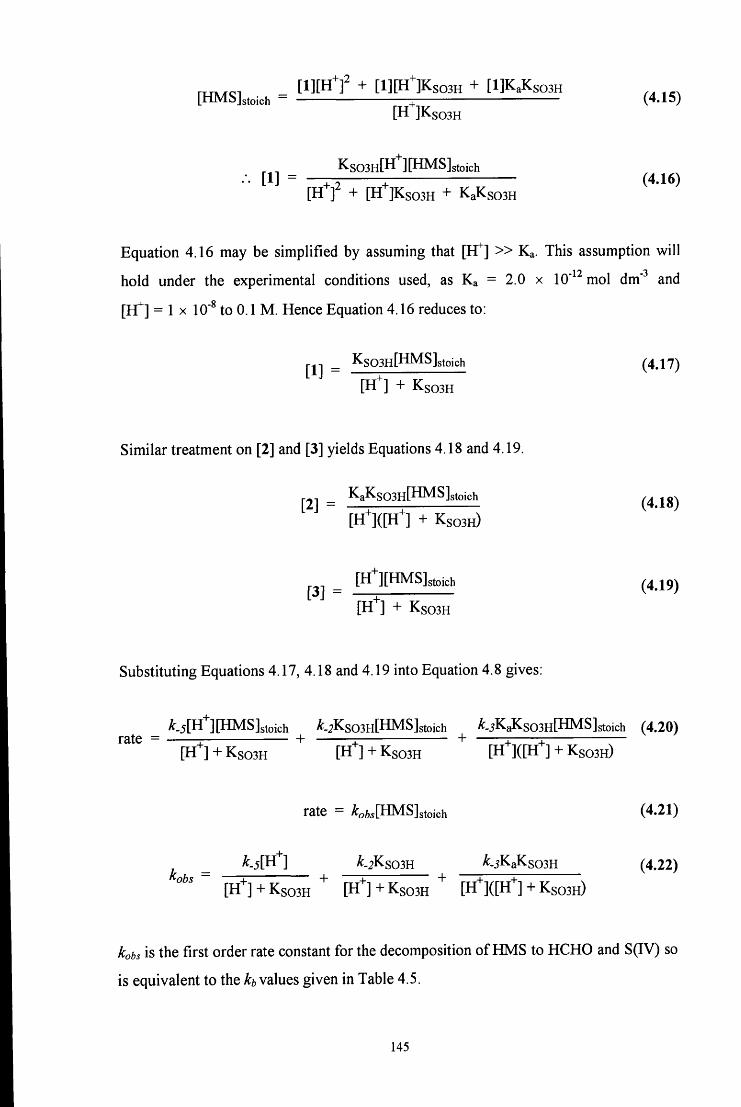
r.Tx;rei [ l ^ t ^ " ^ ' + [ l ]P"]Kso3H + [l]KaKso3H [HMS]stoich = + (4.15)
[H ]Kso3H
Kso3H[Hl[HMS]stoich
[ H ^ ^ + [H1KSO3H + KaKso3H
Equation 4.16 may be simplified by assuming that [H^] » Ka. This assumption will
hold under the experimental conditions used, as Ka = 2.0 x 10" mol dm' and
[H^] = 1 X 10' to 0.1 M. Hence Equation 4.16 reduces to:
[1] = ^S03H[HMS]stoich (4.17) [H ] + Kso3H
Similar treatment on [2] and [3] yields Equations 4.18 and 4.19.
[2] = ^^^S03H[HMS]stoich [ H ^ d H ^ + KSO3H)
^ ^ ^ ^ [Hl[HMS]stoich (4.19) [ H ^ + Ks03H
Substituting Equations 4.17, 4.18 and 4.19 into Equation 4.8 gives:
^.5[H^][HMS]stoich ^-2Kso3H[HMS]stoich ^-iKaKso3H[HMS]stoich (4.20) rate = r + z + + z ^ ^
[ H i + Kso3H [ H i + Kso3H [ H 1 ( [ H 1 + KSO3H)
rate = ^o^..[HMS]stoich (4.21)
^-5[H^] ^-2KS03H ^-iKaKs03H (4.22) ^obs
[ H i + Kso3H [ H i + KSO3H ^ [ H 1 ( [ H 1 + KSO3H)
kobs is the first order rate constant for the decomposition of HMS to HCHO and S(IV) so
is equivalent to the Ar, values given in Table 4.5.
145
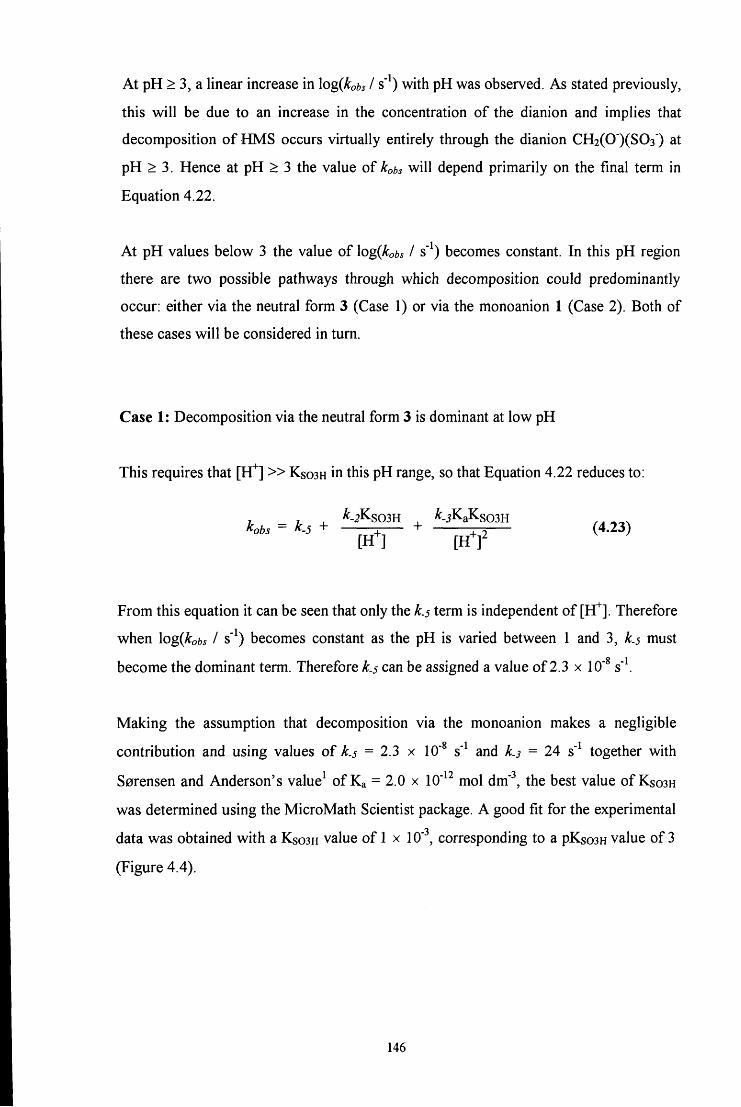
At pH > 3, a linear increase in \og(kobs I s" ) with pH was observed. As stated previously,
this will be due to an increase in the concentration of the dianion and implies that
decomposition of HMS occurs virtually entirely through the dianion CH2(0")(S03") at
pH > 3. Hence at pH > 3 the value of Kbs will depend primarily on the final term in
Equation 4.22.
At pH values below 3 the value of \og{kobs I s' ) becomes constant. In this pH region
there are two possible pathways through which decomposition could predominantly
occur: either via the neutral form 3 (Case 1) or via the monoanion 1 (Case 2). Both of
these cases will be considered in turn.
Case 1: Decomposition via the neutral form 3 is dominant at low pH
This requires that [H^] » KSO3H in this pH range, so that Equation 4.22 reduces to:
J ; ^ ^-iKsosH ^ ^-iKaKs03H kobs = k.5 + + (4.23)
[H^^] [ H ^ ^
From this equation it can be seen that only the k.5 term is independent of [H^]. Therefore
when \o%{kobs I s" ) becomes constant as the pH is varied between 1 and 3, k.5 must
become the dominant term. Therefore k.5 can be assigned a value of 2.3 x 10' s".
Making the assumption that decomposition via the monoanion makes a negligible
contribution and using values of k.5 = 2.3 x 10" s" and k.3 = 24 s' together with
Sorensen and Anderson's value of Ka = 2.0 x 10" mol dm", the best value of KSOSH
was determined using the MicroMath Scientist package. A good fit for the experimental
data was obtained with a KSO3H value of 1 x 10'" , corresponding to a pKsosH value of 3
(Figure 4.4).
146
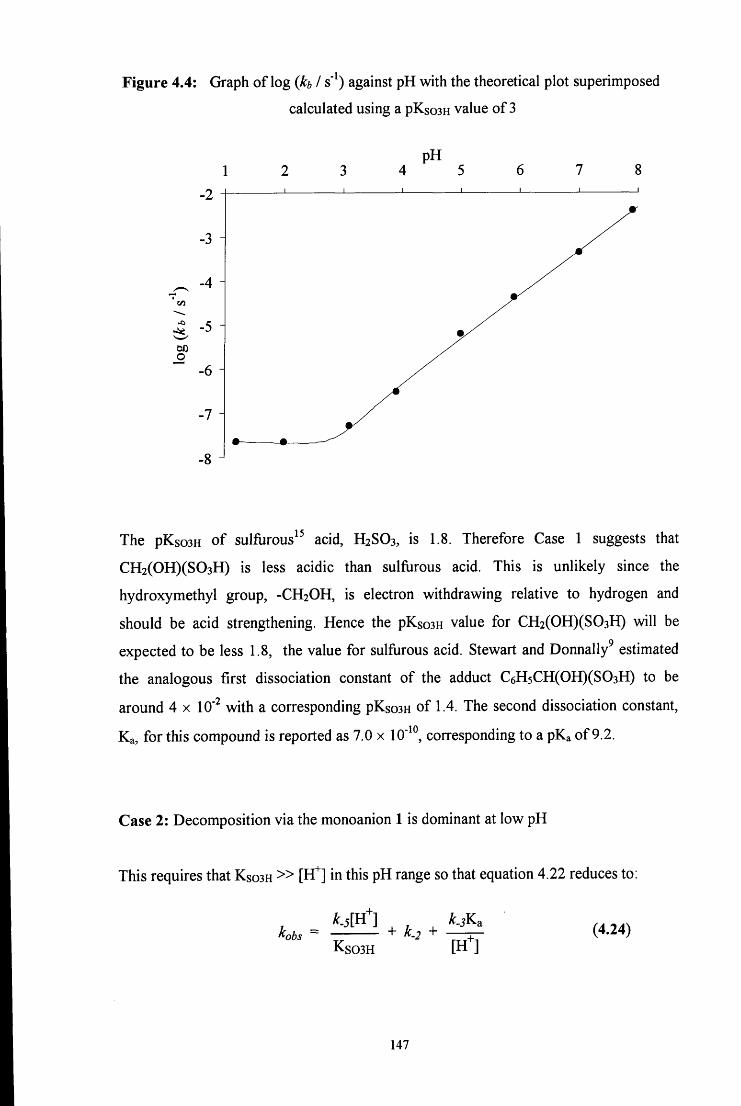
Figure 4.4: Graph of log {h I s' ) against pH with the theoretical plot superimposed
calculated using a pKso3H value of 3
-2
-3 ^
-4
too O
-6
-7H
-8
pH 4 5
The pKso3H of sulfurous^^ acid, H2SO3, is 1.8. Therefore Case 1 suggests that
CH2(OH)(S03H) is less acidic than sulfurous acid. This is unlikely since the
hydroxymethyl group, - C H 2 O H , is electron withdrawing relative to hydrogen and
should be acid strengthening. Hence the pKso3H value for CH2(OH)(S03H) will be
expected to be less 1.8, the value for sulfurous acid. Stewart and Donnally^ estimated
the analogous first dissociation constant of the adduct C6H5CH(OH)(S03H) to be
around 4 x 10' with a corresponding pKso3H of 1.4. The second dissociation constant,
Ka, for this compound is reported as 7.0 x 10"^°, corresponding to a pKa of 9.2.
Case 2: Decomposition via the monoanion 1 is dominant at low pH
This requires that KSO3H » [H^] in this pH range so that equation 4 . 2 2 reduces to:
(4.24) ^-5[H1 ^ , ^ ^-jKa
Ks03H [ H i
147
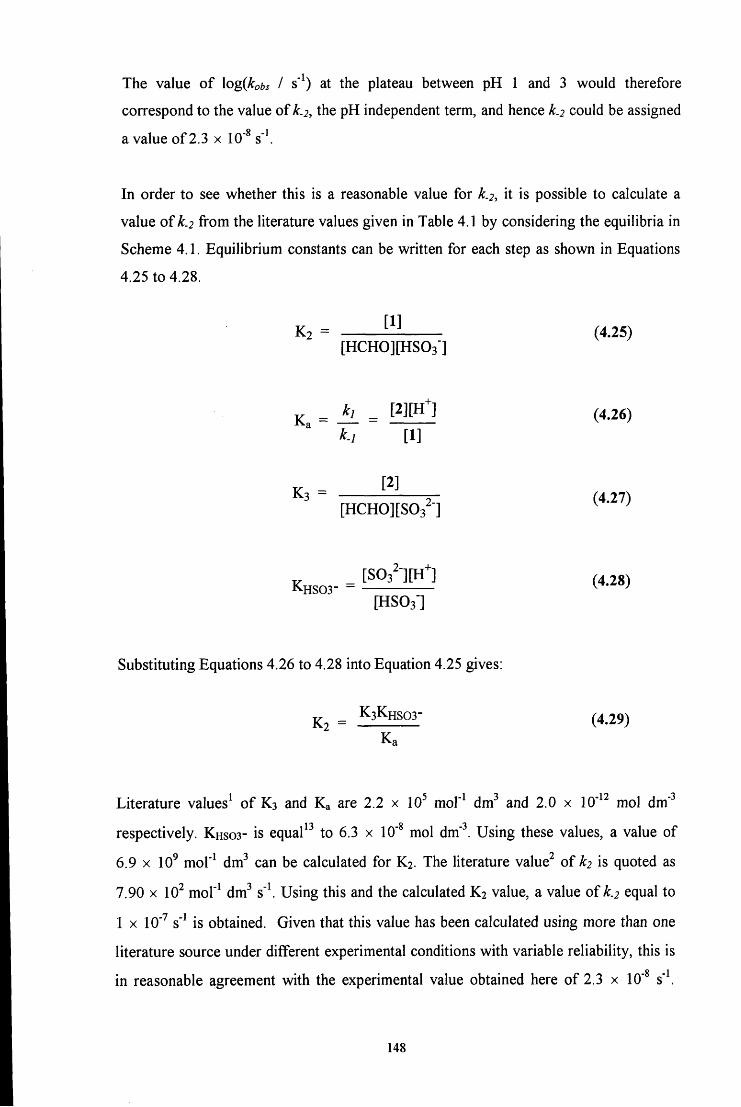
The value of \og(kobs I s" ) at the plateau between pH 1 and 3 would therefore
correspond to the value of k.2, the pH independent term, and hence k.2 could be assigned
a value of 2.3 x 10" s"\
In order to see whether this is a reasonable value for k.2, it is possible to calculate a
value of k.2 from the literature values given in Table 4.1 by considering the equilibria in
Scheme 4.1. Equilibrium constants can be written for each step as shown in Equations
4.25 to 4.28.
K2 = (4.25) [HCH0][HS03]
^ ki_^ [2 ] [H] (4,26)
/ [1]
^3 - Y' (4.27) [HCH0][S03^'] ^ ^
[HS03-]
Substituting Equations 4.26 to 4.28 into Equation 4.25 gives:
K2 = ^3^HS03- (4.29)
Literature values^ of K 3 and Ka are 2.2 x 10^ mol"^ dm^ and 2.0 x 10' ^ mol dm'
respectively. KHSOS- is equal to 6.3 x 10" mol dm'. Using these values, a value of
o.y X 10^ mof^ dm^ can be calculated for K2. The literature value^ of 2 is quoted as
7.90 X 10^ mol"^ dm^ s"\ Using this and the calculated K2 value, a value of k.2 equal to
1 X 10'^ s' is obtained. Given that this value has been calculated using more than one
literature source under different experimental conditions with variable reliability, this is O 1
in reasonable agreement with the experimental value obtained here of 2.3 x 10" s" .
148
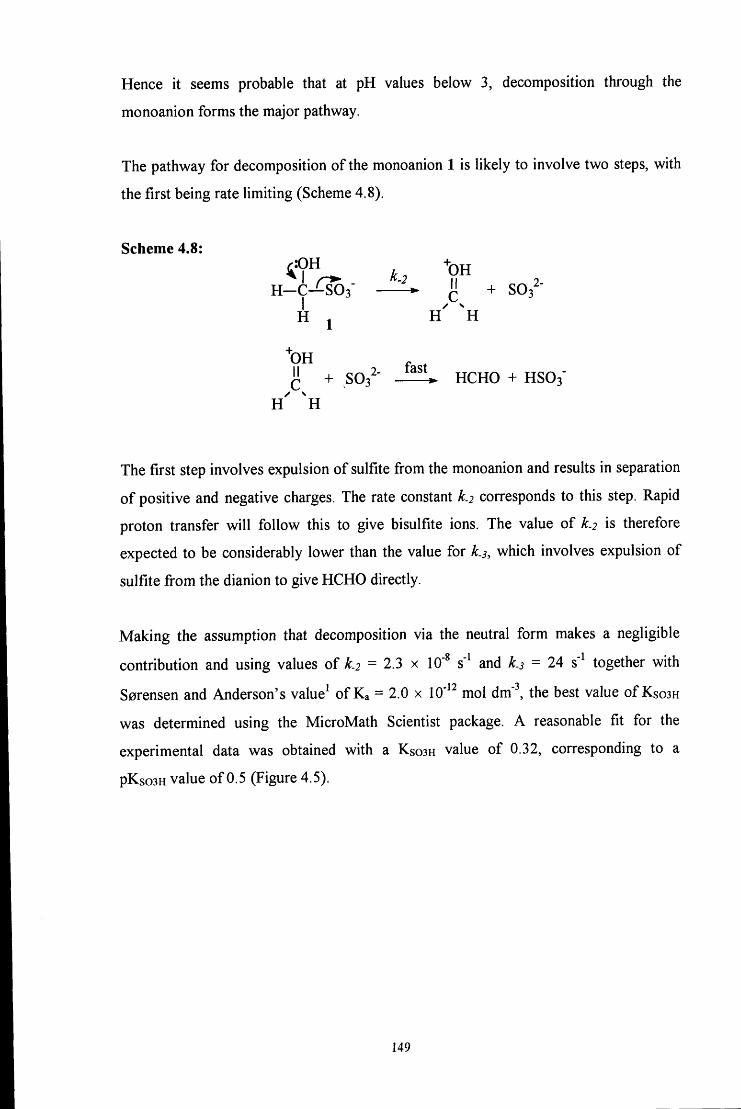
Hence it seems probable that at pH values below 3, decomposition through the
monoanion forms the major pathway.
The pathway for decomposition of the monoanion 1 is likely to involve two steps, with
the first being rate limiting (Scheme 4.8).
Scheme 4.8:
H_C-^S03" ^ + SOs -I
H . H H 1
"OH •l + S03^' HCHO + HSOs"
H H
The first step involves expulsion of sulfite from the monoanion and results in separation
of positive and negative charges. The rate constant k.2 corresponds to this step. Rapid
proton transfer will follow this to give bisulfite ions. The value of k.2 is therefore
expected to be considerably lower than the value for k.3, which involves expulsion of
sulfite from the dianion to give HCHO directly.
Making the assumption that decomposition via the neutral form makes a negligible 0 1 1
contribution and using values of k.2 = 2.3 x 10" s" and k.3 = 24 s" together with
S0rensen and Anderson's value of Ka = 2.0 x 10' mol dm', the best value of KSOSH
was determined using the MicroMath Scientist package. A reasonable fit for the
experimental data was obtained with a KSOSH value of 0.32, corresponding to a
pKso3H value of 0.5 (Figure 4.5).
149

Figure 4.5: Graph of log {h I s" ) against pH with the theoretical plot superimposed
calculated using a pKso3H value of 0.5
-2
-3
-4
-5
-2 .6
pH 4 5
The pKso3H value for CH2(OH)(S03Na) is expected to be less than 1.8, the pKso3H for
sulfiarous acid, due to the electron withdrawing effect of the hydroxymethyl group,
-CH2OH. The value of 0.5 obtained here conforms to this prediction whereas for Case 1
the pKso3H value for HMS had to be assumed to be greater than the pKso3H for
sulfiarous acid to obtain a good fit for the experimental data.
150
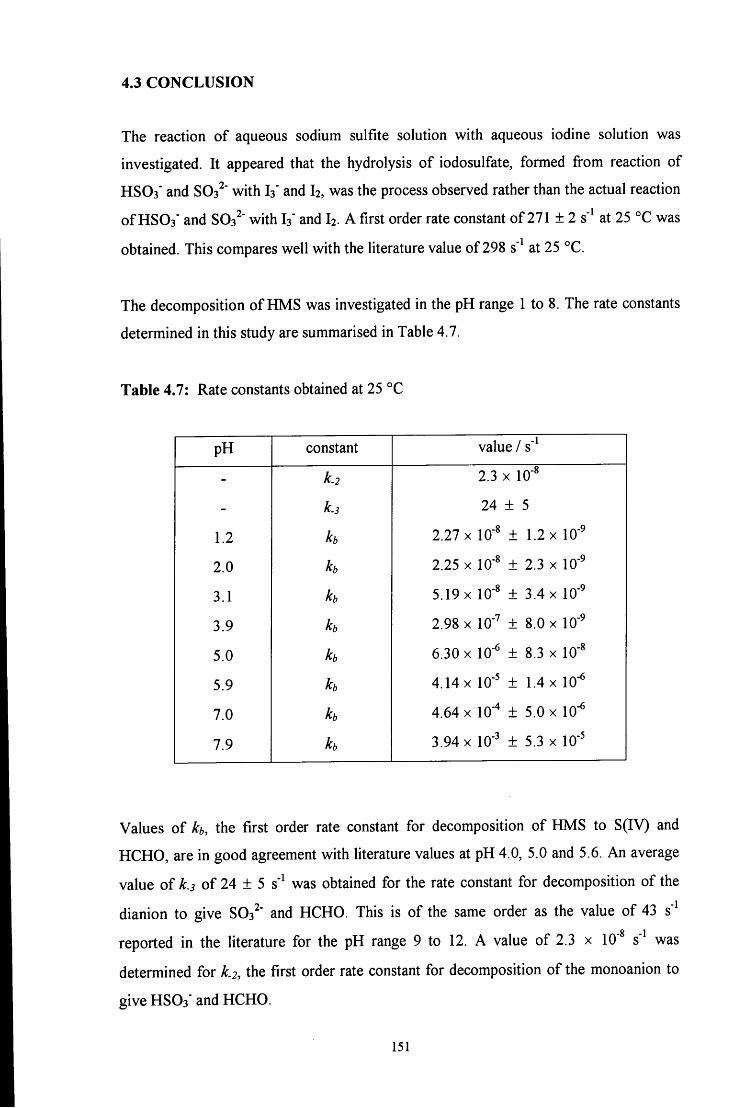
4.3 CONCLUSION
The reaction of aqueous sodium sulfite solution with aqueous iodine solution was
investigated. It appeared that the hydrolysis of iodosulfate, formed from reaction of
HSO3" and SO3 with Is' and I2, was the process observed rather than the actual reaction
of H S O 3 ' and S03 ' with I 3 ' and I2. A first order rate constant of 271 ± 2 s' at 25 °C was
obtained. This compares well with the literature value of 298 s' at 25 °C.
The decomposition of HMS was investigated in the pH range 1 to 8. The rate constants
determined in this study are summarised in Table 4.7.
Table 4.7: Rate constants obtained at 25 °C
pH constant value / s'
- k.2 2.3 X 10'
- k.3 24 ± 5
1.2 h 2.27 X 10' ± 1.2 X 10'
2.0 h 2.25 X 10" ± 2.3 X 10'
3.1 h 5.19 X 10' ± 3.4 X 10"
3.9 h 2.98 X lO''' ± 8.0 X 10'
5.0 h 6.30 X 10' ± 8.3 X 10'
5.9 h 4.14 X 10" ± 1.4 X 10'
7.0 h 4.64 X 10' ± 5.0 X 10'
7.9 h 3.94 X 10" ± 5.3 X 10'
Values of h, the first order rate constant for decomposition of HMS to S(IV) and
HCHO, are in good agreement with literature values at pH 4.0, 5.0 and 5.6. An average
value of k.3 of 24 + 5 s' was obtained for the rate constant for decomposition of the
dianion to give SO3 ' and HCHO. This is of the same order as the value of 43 s'
reported in the literature for the pH range 9 to 12. A value of 2.3 x 10' s' was
determined for k.2, the first order rate constant for decomposition of the monoanion to
give HSO3" and HCHO.
151
To summarise, this work has determined that the decomposition of HMS occurs
virtually entirely through the dianion CH2(0")(S03') at pH values above 3. Below this
pH, decomposition through the monoanion CH2(OH)(S03") forms the major pathway,
although the reaction is considerably slower than when it occurs through the dianion.
The pathway for decomposition of the monoanion is likely to involve two steps, the first
being rate limiting. Initially sulfite will be expelled fi"om the monoanion resulting in
separation of positive and negative charges, followed by rapid proton transfer to give
the final species, bisulfite and HCHO. The value of k.2 is therefore expected to be
considerably lower than the value for k.3, which involves direct expulsion of sulfite, the
final species, fi-om the dianion.
152
4.4 E X P E R I M E N T A L
4.4.1 Reaction of aqueous sulfite solution with aqueous iodine solution
The reaction of aqueous sulfite solution at concentrations ranging fi"om 1.0 x 10' to
0.03 M with 4 X 10'"* M aqueous iodine solution in the pH range 3.0 to 5.2 was
investigated.
Plots of absorbance against time were obtained. The disappearance of the aqueous
iodine solution peak at 300 or 350 nm was followed. Aqueous sulfite solution does not
absorb strongly in this region. The plots were recorded using an Applied Photophysics
DX.17MV BioSequential Stopped - flow ASVD Spectrometer at 25.0 - 25.1 °C with a
cell of 1 cm path length. Ten averages were obtained, each the average of three runs of
0.05 seconds. The appropriate aqueous sulfite solution was placed in one syringe and
the aqueous iodine solution with the appropriate buffer solution, i f used, in the other.
The averages were fitted to obtain first order rate constant values, kobs, using the single
exponential fit fijnction on the ISX.17MV program installed on the spectrometer. Rate
constants are quoted to one decimal place.
Experiments performed at pH 3.5 were unbuffered. At pH 5 an acetate / acetic acid
buffer was used, with stoichiometric concentrations of 0.12 M sodium acetate and
0.05 M acefic acid. At pH 3.0, 0.01 M HCl(aq) was added for the 0.01 M sulfite
experiment and 1.0 x 10' M HCl(aq)for the 1.0 x 10'" M sulfite experiment to control
the pH.
4.4.2 Decomposition of hydroxymethanesulfonate, CH2(OH)(S03Na)
-3 The reaction of aqueous CH2(OH)(S03Na) at six concentrations ranging fi-om 5.0 x 10
to 0.03 M with 2 x 10" M aqueous iodine solution in the pH range 1.2 to 7.9 was
investigated.
Absorbance against wavelength spectra were obtained for three CH2(OH)(S03Na)
concentrations at pH 5.0 using a Perkin - Elmer Lambda 2 uv / vis spectrometer at
153
25 °C with 1 cm stoppered quartz cuvettes, taking scans every 5 minutes using a scan
speed of 480 nm min'V
Plots of absorbance against time were obtained at all pH values. The disappearance of
the aqueous iodine solution peak at 350 nm was followed. The experiments at pH 1.2 to
5.0 and the three lower concentrations at pH 5.9 were carried out using conventional
uv / vis spectrometry. The plots were recorded on a Perkin - Elmer Lambda 2 or
Lambda 12 uv / vis spectrometer at 25 °C using 1 cm stoppered quartz cuvettes. The
data interval ranged from 15 to 90 seconds and the overall time from 15 minutes to
16 hours depending on the pH used. At pH 3.1 the lowest CH2(OH)(S03Na)
concentration and at pH 1.2 and 2.0 the lowest two concentrations were not used to
obtain kb values as the reactions were deemed too slow to obtain reliable rate constants.
For all uv / vis work the cuvettes were left in the spectrometer for at least 10 minutes
prior to use to allow the temperature to equilibrate to 25 °C. Addition of the aqueous
iodine solution was used to initiate the reaction. Zero order kinetics were observed and
linear regression on Microsoft Excel was used to calculate h values. Rate constants are
quoted to three significant figures.
The three higher concentrations at pH 5.9 and the experiments at pH 7.0 and 7.9 were
performed using stopped - flow spectrophotometry at 25.0 - 25.1 °C using an Applied
Photophysics DX.17MV BioSequential Stopped - flow ASVD Spectrometer with a
1 cm path length. Ten averages were obtained, each the average of three runs of 0.2 to
50 seconds depending on the CH2(OH)(S03Na) concentration and the pH used. The
appropriate aqueous CH2(OH)(S03Na) solution was placed in one syringe and the
aqueous iodine solution with the appropriate buffer solution in the other. The averages
were fitted using linear regression on the ISX.17MV program installed on the
spectrometer. Rate constants are quoted to three significant figures. The 0.025 M
CH2(OH)(S03Na) solution at pH 7.0 gave an anomalously high result therefore this was
not included in the data analysis.
The MicroMath Scientist package for Microsoft Windows, Version 2.0 was used to fit
the data to obtain the best KSO3H value.
154
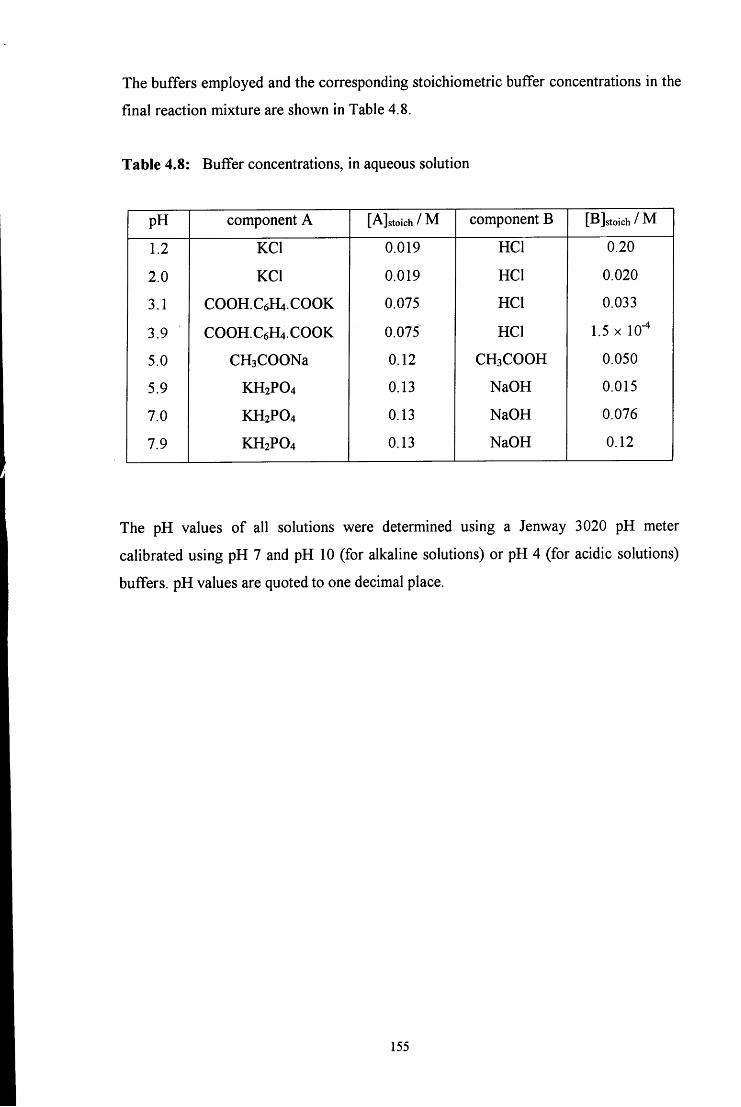
The buffers employed and the corresponding stoichiometric buffer concentrations in the
final reaction mixture are shown in Table 4.8.
Table 4.8: Buffer concentrations, in aqueous solution
pH component A [A]stoich / M component B [BJstoich/M
1.2 KCl 0.019 HCl 0.20
2.0 KCl 0.019 HCl 0.020
3.1 COOH.CeHt.COOK 0.075 HCl 0.033
3.9 COOH.CeHj.COOK 0.075 HCl 1.5 x 10"
5.0 CH3C00Na 0.12 CH3COOH 0.050
5.9 KH2PO4 0.13 NaOH 0.015
7.0 KH2PO4 0.13 NaOH 0.076
7.9 KH2PO4 0.13 NaOH 0.12
The pH values of all solutions were determined using a Jenway 3020 pH meter
calibrated using pH 7 and pH 10 (for alkaline solutions) or pH 4 (for acidic solutions)
buffers. pH values are quoted to one decimal place.
155
4.5 R E F E R E N C E S
1. P. E. S0rensen and V. S. Andersen, Acta Chem. Scand., 1970, 24, 1301
2. S. D. Boyce and M . R. Hoffmann, J. Phys. Chem., 1984, 88, 4740
3. S. Dong and P. K. Dasgupta, Atmos. Environ., 1986, 20, 1635
4. G. L. Kok, S. N. Gitlin and A. L. Lazrus, J. Geophys. Res., D, 1986, 91, 2801
5. D. A. Blackadder and C. Hinshelwood, J. Chem. Soc, 1958, 2720
6. U. Deister, R. Neeb, G. Helas and P. Wameck, J. Phys. Chem., 1986, 90, 3213
7. (a) P. Jones and K. B. Oldham, J. Chem. Educ, 1963, 40, 366; (b) C. Wagner, Ber.,
1929, 69, 2873
8. (a) E. A. Betterton and M . R. Hoffmann, J. Phys. Chem., 1987, 91, 3011; (b) A.
Skrabal and R. Skrabal, Sitz. Akad. Wirs. Wien, 1936,145, 617
9. T. D. Stewart and L. H. Donnally, J. Am. Chem. Soc, 1932, 54, 3559
10. R. P. Bell and P. G. Evans, Proc. R. Soc. London, Ser. A, 1966, 291, 297
11. (a) D. A. Palmer, R. W. Ramette and R. E. Mesmer, J. Solution Chem., 1984, 13,
637; (b) R. W. Ramette and R. W. Sandford, J. Am. Chem. Soc, 1965, 87, 5001
12. B. S. Yiin and D. W. Margerum, Inorg. Chem., 1990, 29, 1559
13. (a) E. Hayon, A. Treinin and J. Wilf, J. Am. Chem. Soc, 1972, 94, 47; (b) H. V.
Tartar and H. H. Garretson, J. Am. Chem. Soc, 1941, 63, 808
14. T. D. Stewart and L. H. Donnally, J, Am. Chem. Soc, 1932, 54, 2333
15. 'CRC Handbook of Chemistry and Physics', CRC Press, Florida, 1982, 63rd Ed.,
D173
156
CHAPTER 5
Reaction of hydroxymethanesulfonate,
CHiCOHXSOjNa), with aniline
and aniline derivatives
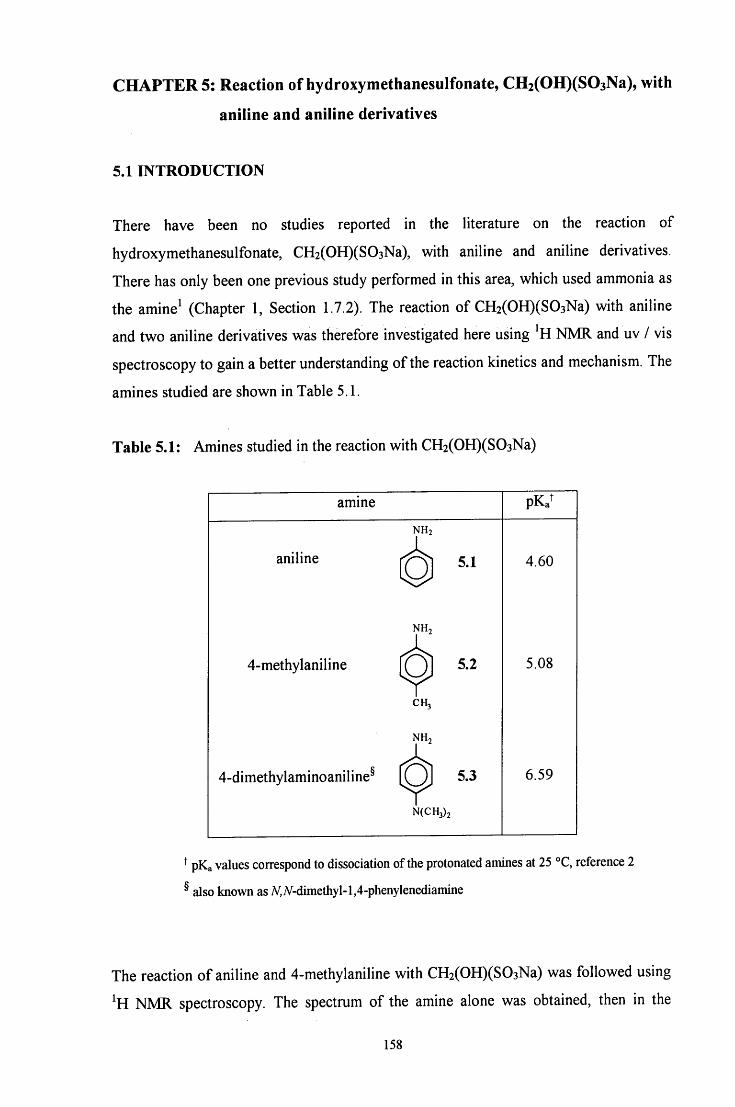
C H A P T E R 5: Reaction of hydroxymethanesulfonate, CH2(OH)(S03Na), with
aniline and aniline derivatives
5.1 INTRODUCTION
There have been no studies reported in the literature on the reaction of
hydroxymethanesulfonate, CH2(OH)(S03Na), with aniline and aniline derivatives.
There has only been one previous study performed in this area, which used ammonia as
the amine (Chapter 1, Section 1.7.2). The reaction of CH2(OH)(S03Na) with aniline
and two aniline derivatives was therefore investigated here using ^H NMR and uv / vis
spectroscopy to gain a better understanding of the reaction kinetics and mechanism. The
amines studied are shown in Table 5.1.
Table 5.1: Amines studied in the reaction with CH2(OH)(S03Na)
amine pKa
NH2 1 aniline 6 5.1 4.60
4-methylaniline 5.2 5.08
T C H 3
NH, 1
4-dimethylaminoaniline^ 5.3 6.59
T N(CH3)2
^ pKa values correspond to dissociation of the protonated amines at 25 °C, reference 2
^ also known asA^,iV-dimethyl-l,4-phenylenediamine
The reaction of aniline and 4-methylaniline with CH2(OH)(S03Na) was followed using
^H NMR spectroscopy. The spectrum of the amine alone was obtained, then in the
158
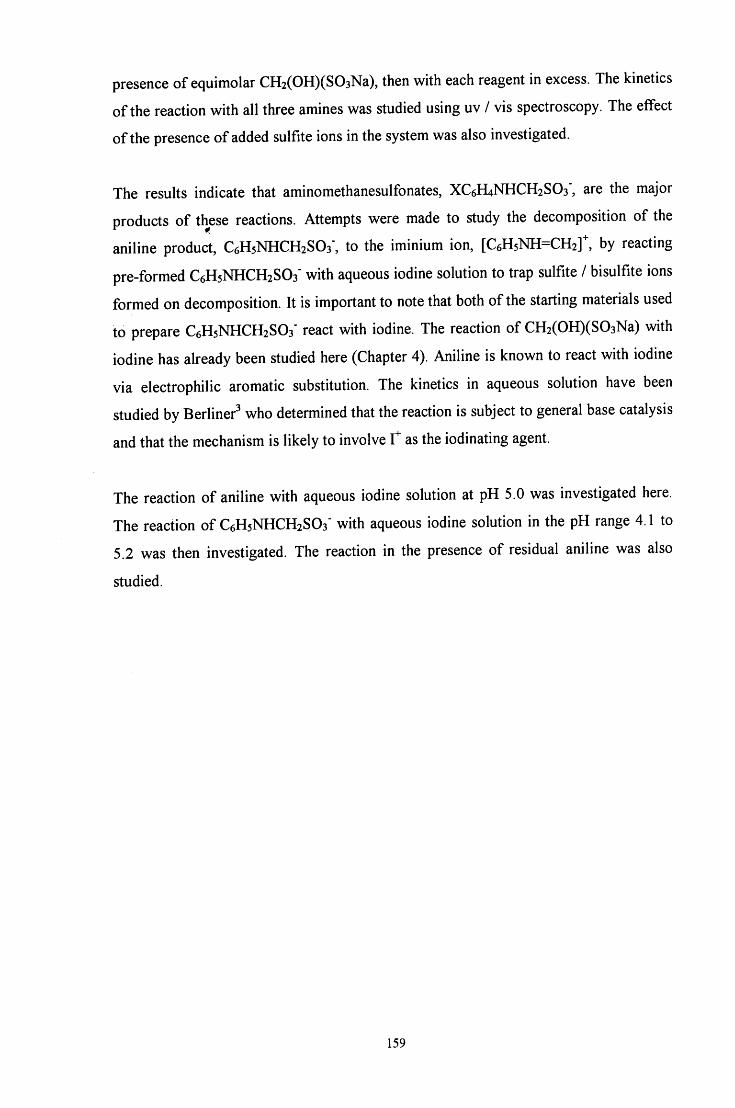
presence of equimolar CH2(OH)(S03Na), then with each reagent in excess. The kinetics
of the reaction with all three amines was studied using uv / vis spectroscopy. The effect
of the presence of added sulfite ions in the system was also investigated.
The results indicate that aminomethanesulfonates, XC6H4NHCH2S03', are the major
products of these reactions. Attempts were made to study the decomposition of the
aniline product, C6H5NHCH2SO3", to the iminium ion, [C6H5NH=CH2]^, by reacting
pre-formed C6H5NHCH2S03' with aqueous iodine solution to trap sulfite / bisulfite ions
formed on decomposition. It is important to note that both of the starting materials used
to prepare C6H5NHCH2SO3" react with iodine. The reaction of CH2(OH)(S03Na) with
iodine has already been studied here (Chapter 4). Aniline is known to react with iodine
via electrophilic aromatic substitution. The kinetics in aqueous solution have been
studied by Berliner^ who determined that the reaction is subject to general base catalysis
and that the mechanism is likely to involve as the iodinating agent.
The reaction of aniline with aqueous iodine solution at pH 5.0 was investigated here.
The reaction of C6H5NHCH2SO3" with aqueous iodine solution in the pH range 4.1 to
5.2 was then investigated. The reaction in the presence of residual aniline was also
studied.
159
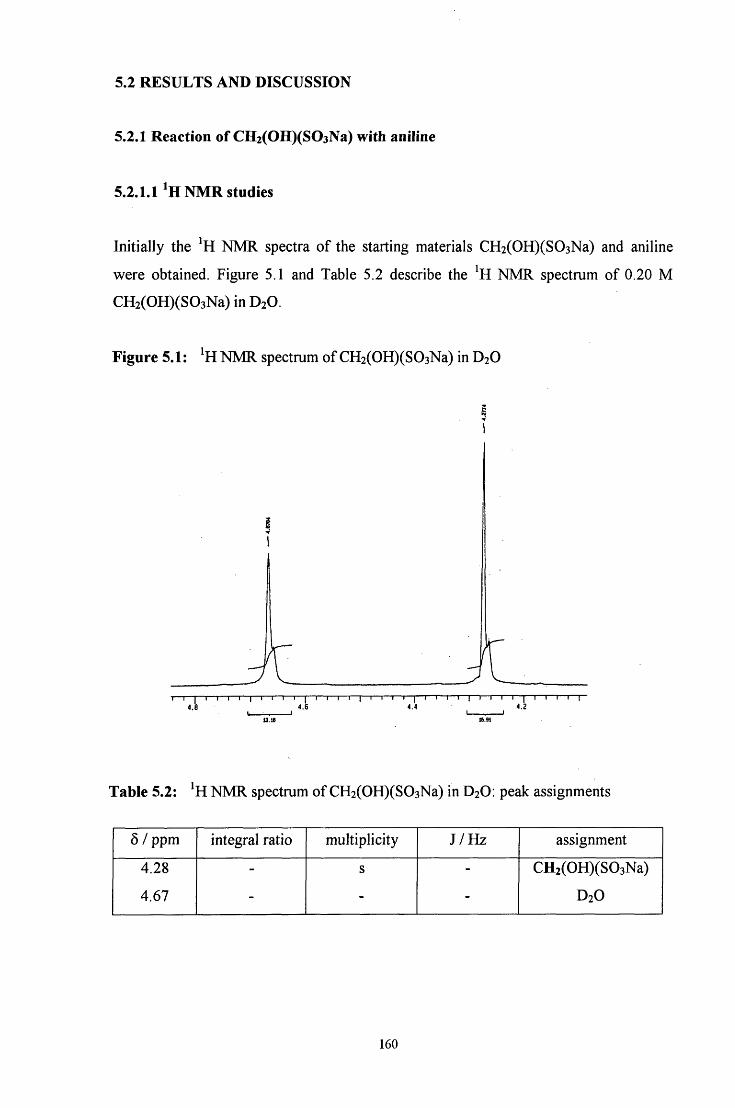
5.2 R E S U L T S AND DISCUSSION
5.2.1 Reaction of CH2(OH)(S03Na) with aniline
5.2.L1^H NMR studies
Initially the ^H NMR spectra of the starting materials CH2(OH)(S03Na) and aniline
were obtained. Figure 5.1 and Table 5.2 describe the ^H NMR spectrum of 0.20 M
CH2(OH)(S03Na)inD20.
Figure 5.1: ^H NMR spectrum of CH2(OH)(S03Na) in D2O
a I — I — 1 — I — I — I — 1 — I — I — I — I — I — I — I — 1 — r
4.4 4.2 I I
Table 5.2: ^H NMR spectrum of CH2(OH)(S03Na) in D2O: peak assignments
5 / ppm integral ratio multiplicity J /Hz assignment
4.28
4.67 -
s
-
CH2(OH)(S03Na)
D2O
160
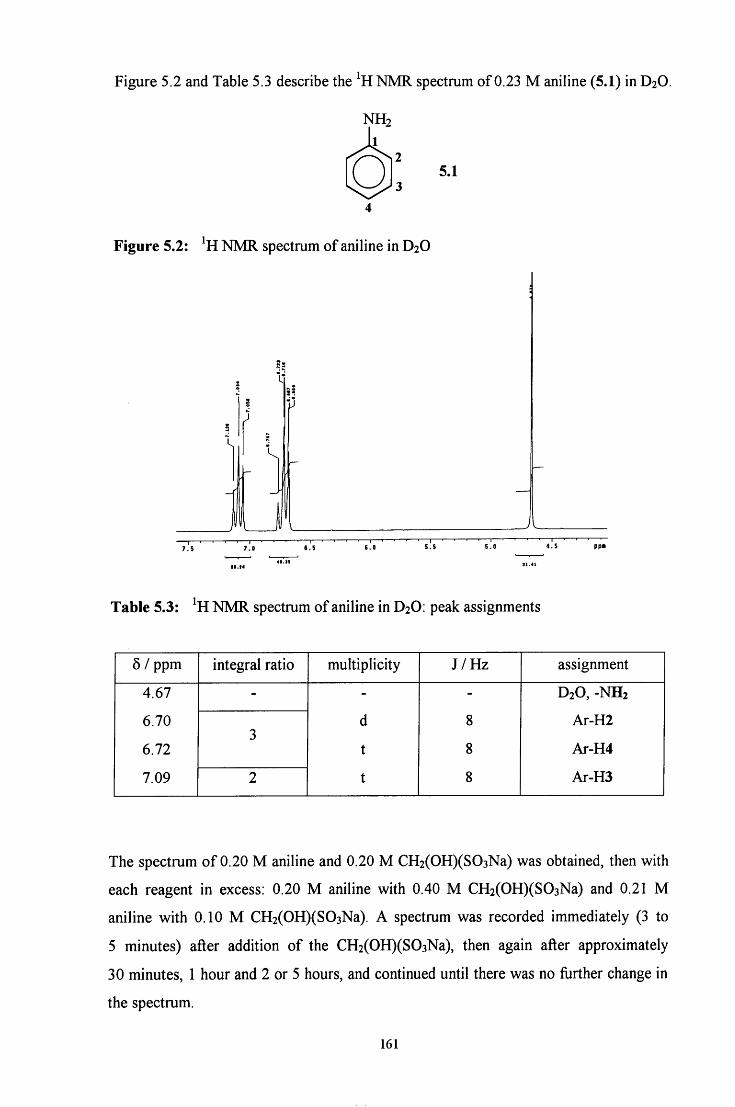
Figure 5.2 and Table 5.3 describe the ^H NMR spectrum of 0.23 M aniline (5.1) in D2O.
NH2 1
Q 5.1
Figure 5.2: ^H NMR spectrum of aniline in D2O
4.5 ppa
Table 5.3: ^H NMR spectrum of aniline in D2O: peak assignments
5 / ppm integral ratio multiplicity J /Hz assignment
4.67 - - - D2O, -NH2
6.70 d 8 Ar-H2
6.72 J
t 8 Ar-H4
7.09 2 t 8 Ar-H3
The spectrum of 0.20 M aniline and 0.20 M CH2(OH)(S03Na) was obtained, then with
each reagent in excess: 0.20 M aniline with 0.40 M CH2(OH)(S03Na) and 0.21 M
aniline with 0.10 M CH2(OH)(S03Na). A spectrum was recorded immediately (3 to
5 minutes) after addition of the CH2(OH)(S03Na), then again after approximately
30 minutes, 1 hour and 2 or 5 hours, and continued until there was no flirther change in
the spectrum.
161
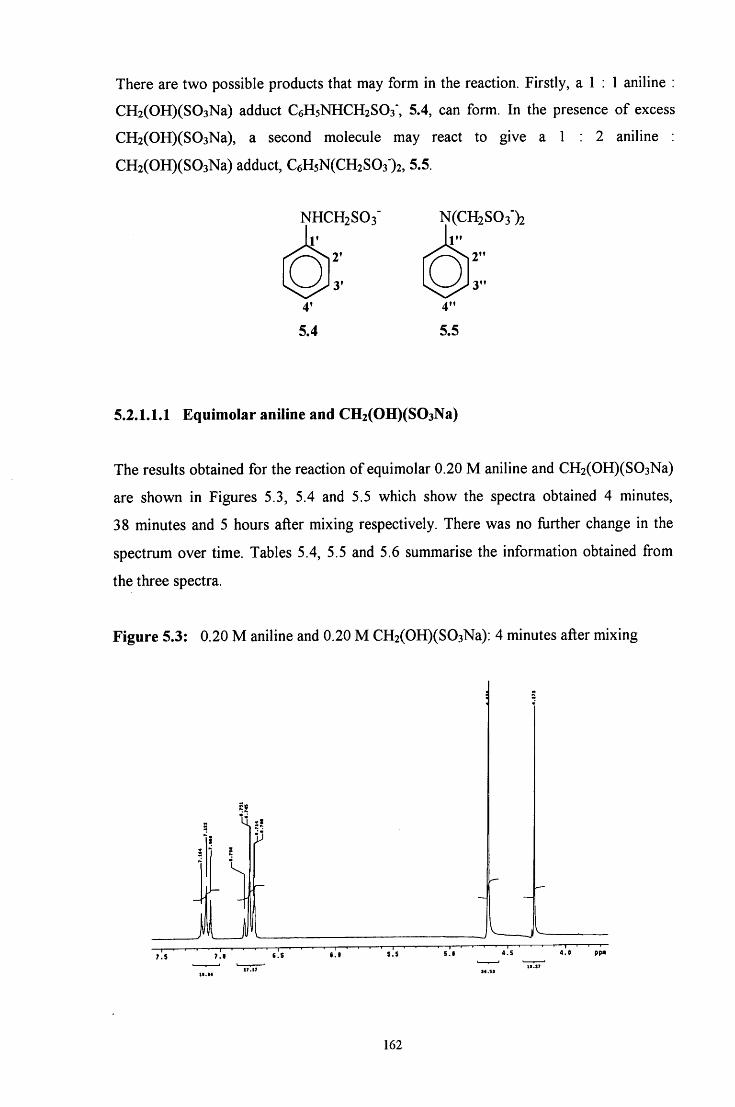
There are two possible products that may form in the reaction. Firstly, a 1 : 1 aniline :
CH2(OH)(S03Na) adduct C6H5NHCH2SO3", 5.4, can form. In the presence of excess
CH2(OH)(S03Na), a second molecule may react to give a 1 : 2 aniline :
CH2(OH)(S03Na) adduct, C6H5N(CH2S03 )2, 5.5.
NHCH2SO3' r
V
y 4'
5.4
N(CH2S03')2 1'
2"
3" Q
4" 5.5
5.2.1.1.1 Equimolar aniline and CH2(0H)(S03Na)
The results obtained for the reaction of equimolar 0.20 M aniline and CH2(OH)(S03Na)
are shown in Figures 5.3, 5.4 and 5.5 which show the spectra obtained 4 minutes,
38 minutes and 5 hours after mixing respectively. There was no further change in the
spectrum over time. Tables 5.4, 5.5 and 5.6 summarise the information obtained from
the three spectra.
Figure 5.3: 0.20 M aniline and 0.20 M CH2(OH)(S03Na): 4 minutes after mixing
S8
^ 5 '
J
7^5^ 7 .1 6.S « . l 5.S 5 .1 ^4.5 1.9 pp» ' • ' ' „'.. ' i i . t ?
162
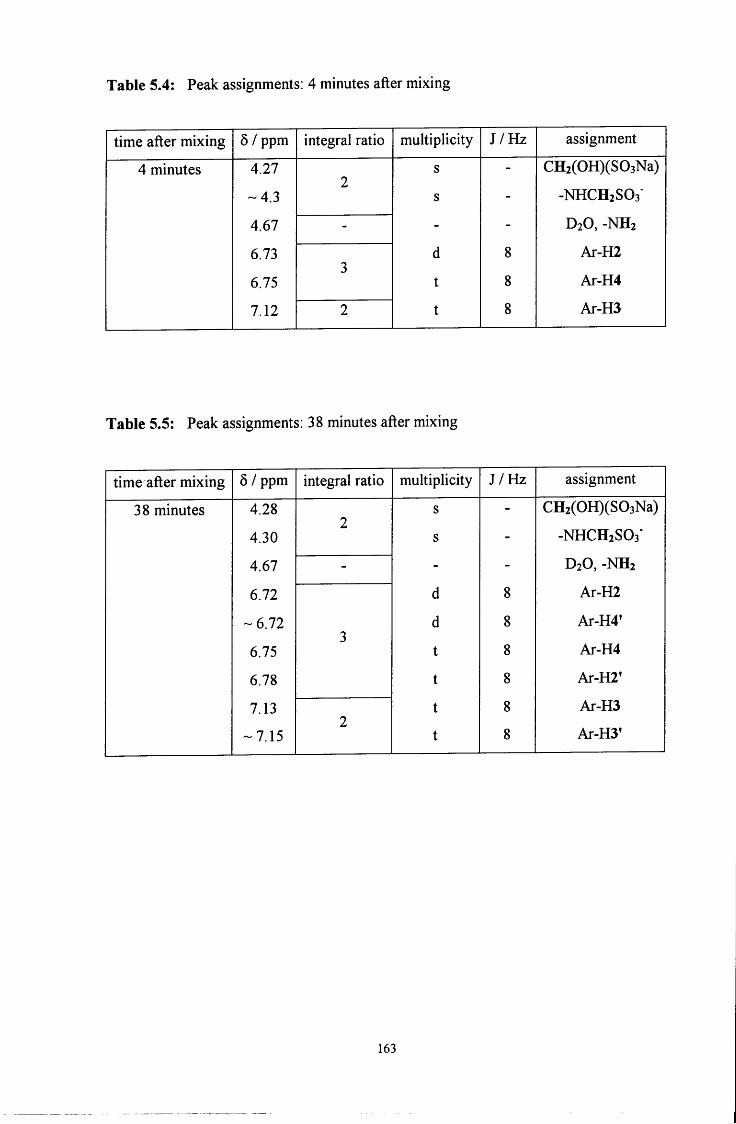
Table 5.4: Peak assignments: 4 minutes after mixing
time after mixing 5 / ppm integral ratio multiplicity J /Hz assignment
4 minutes 4.27 s - CH2(OH)(S03Na)
-4.3 s - -NHCHzSOs'
4.67 - - - D2O, -NH2
6.73 d 8 Ar-H2
6.75 J t 8 Ar-H4
7.12 2 t 8 Ar-H3
Table 5.5: Peak assignments: 38 minutes after mixing
time after mixing 6 / ppm integral ratio multiplicity J /Hz assignment
38 minutes 4.28 s - CH2(OH)(S03Na) 2
4.30 s - -NHCH2SO3"
4.67 - - - D2O, -NH2
6.72 d 8 Ar-H2
-6.72 d 8 Ar-H4'
6.75 J t 8 Ar-H4
6.78 t 8 Ar-H2'
7.13 t 8 Ar-H3 2
-7.15 t 8 Ar-H3'
163
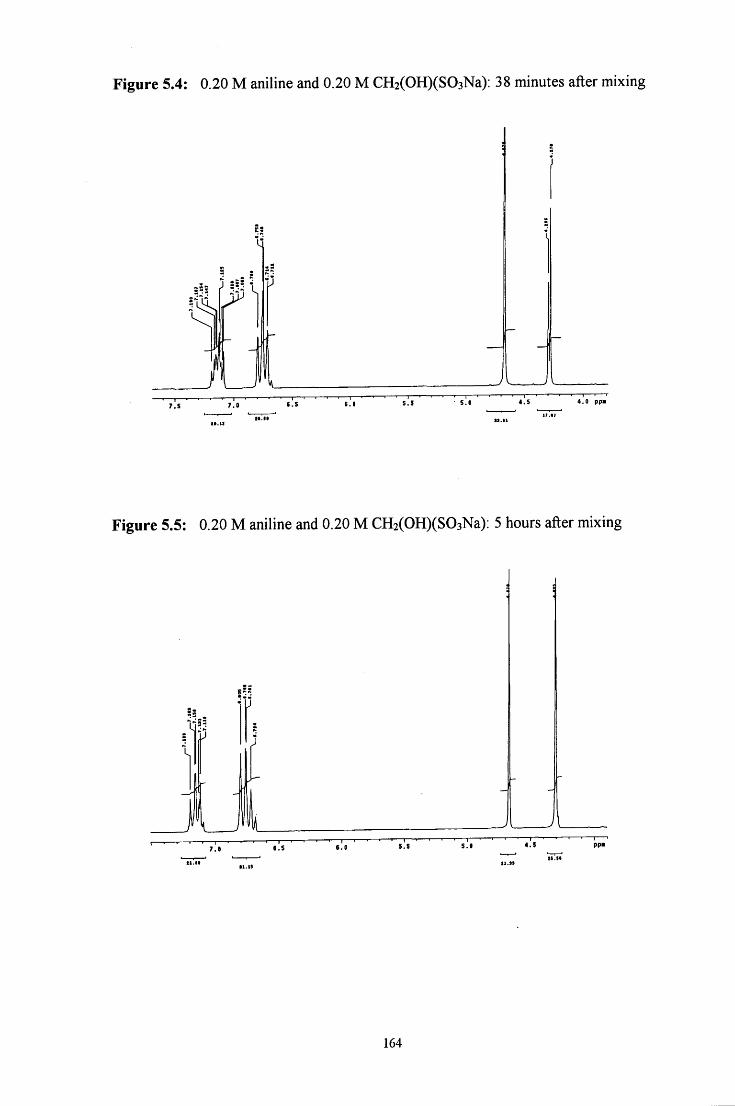
Figure 5.4: 0.20 M aniline and 0.20 M CH2(OH)(S03Na): 38 minutes after mixing
- 1 — . — I — i — ' — r - I — • — I — ' — • — r y l s • • • ; . 0 « . 5 6.1 5.5 S.C 4.S 4.0 p p .
Figure 5.5: 0.20 M aniline and 0.20 M CH2(OH)(S03Na): 5 hours after mixing
7.B 6.5
J \ J - ^ — I — . — . — I — I — i — 1 — • — • — r 6.0 5.5 5 .1 4.5 PP«
• t!.t»
164
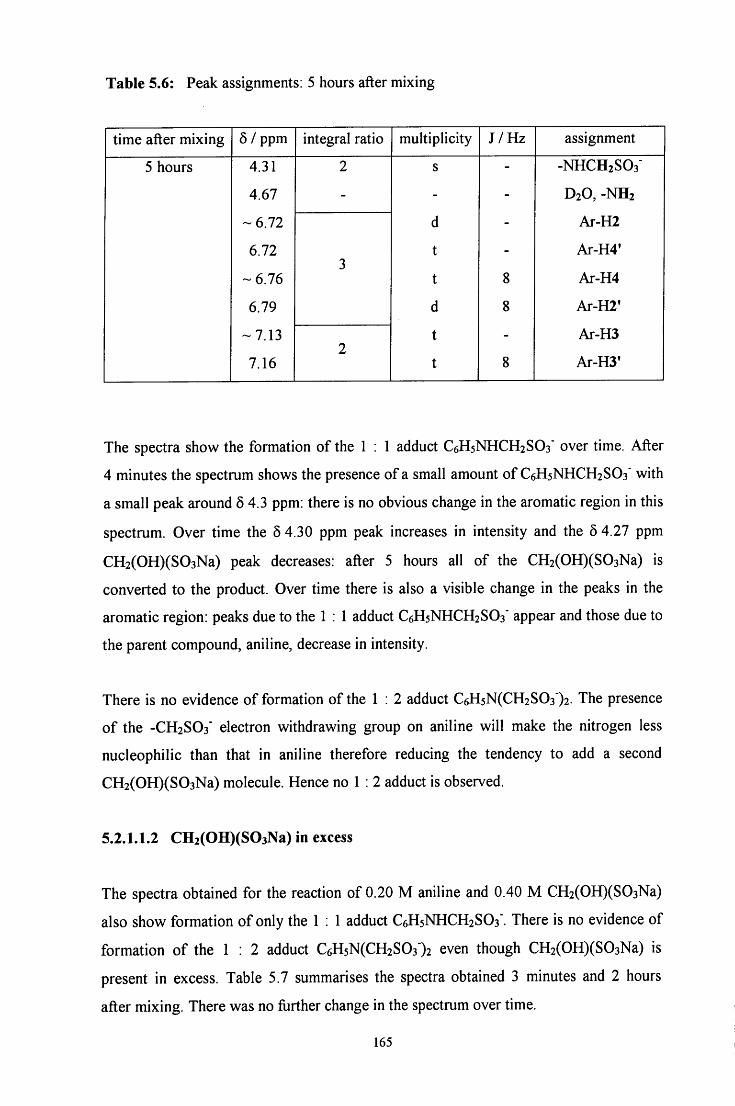
Table 5.6: Peak assignments: 5 hours after mixing
time after mixing 6 / ppm integral ratio multiplicity J /Hz assignment
5 hours 4.31 2 s - -NHCHjSOs'
4.67 - - - D 2 O , - N H 2
-6.72 d - Ar-H2
6.72 t - Ar-H4'
-6.76 t 8 Ar-H4
6.79 d 8 Ar-H2'
-7.13 t - Ar-H3 2
7.16 t 8 Ar-H3'
The spectra show the formation of the 1 : 1 adduct C6H5NHCH2SO3' over time. After
4 minutes the spectrum shows the presence of a small amount of C6H5NHCH2SO3" with
a small peak around 5 4.3 ppm: there is no obvious change in the aromatic region in this
spectrum. Over time the 6 4.30 ppm peak increases in intensity and the 5 4.27 ppm
CH2(OH)(S03Na) peak decreases: after 5 hours all of the CH2(OH)(S03Na) is
converted to the product. Over time there is also a visible change in the peaks in the
aromatic region: peaks due to the 1 : 1 adduct C6H5NHCH2SO3' appear and those due to
the parent compound, aniline, decrease in intensity.
There is no evidence of formation of the 1 : 2 adduct C6H5N(CH2S03")2 The presence
of the -CH2SO3" electron withdrawing group on aniline will make the nitrogen less
nucleophilic than that in aniline therefore reducing the tendency to add a second
CH2(OH)(S03Na) molecule. Hence no 1 : 2 adduct is observed.
5.2.1.1.2 CH2(OH)(S03Na) in excess
The spectra obtained for the reaction of 0.20 M aniline and 0.40 M CH2(OH)(S03Na)
also show formation of only the 1 ; 1 adduct C6H5NHCH2SO3". There is no evidence of
formation of the 1 : 2 adduct C6H5N(CH2S03")2 even though CH2(OPI)(S03Na) is
present in excess. Table 5.7 summarises the spectra obtained 3 minutes and 2 hours
after mixing. There was no ftirther change in the spectrum over time.
165
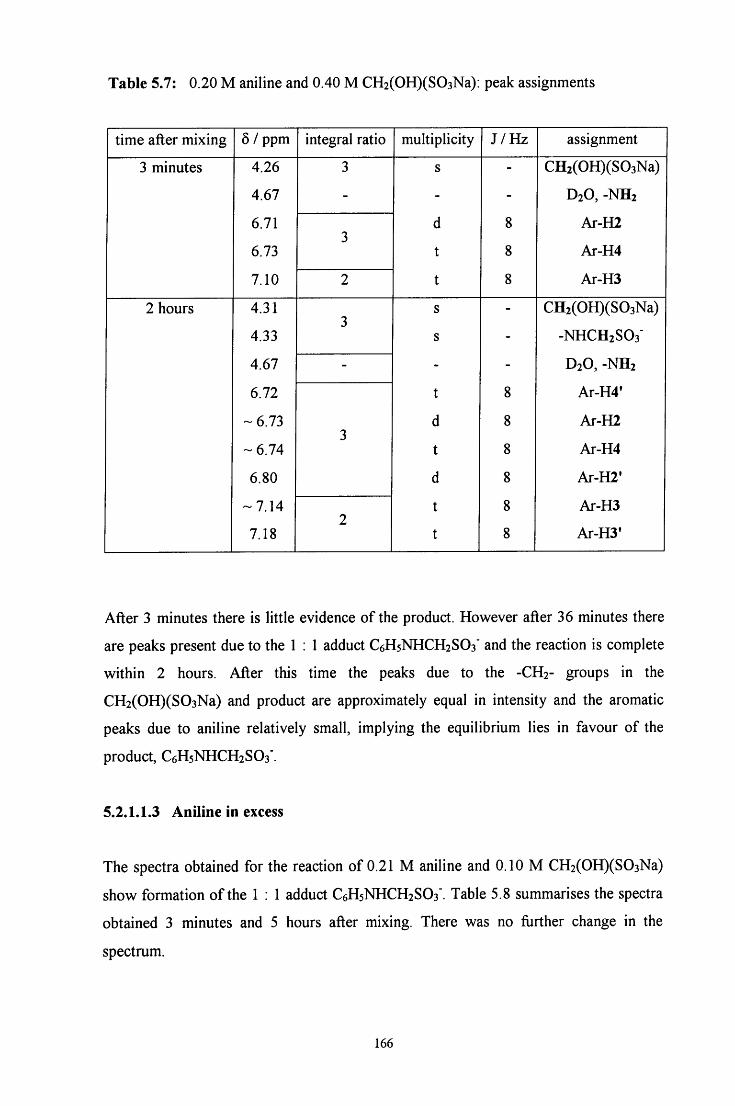
Table 5.7: 0.20 M aniline and 0.40 M CH2(OH)(S03Na): peak assignments
time after mixing 6 / ppm integral ratio multiplicity J /Hz assignment
3 minutes 4.26 3 s - CH2(OH)(S03Na)
4.67 - - - D 2 O , - N H 2
6.71 d 8 Ar-H2
6.73 J
t 8 Ar-H4
7.10 2 t 8 Ar-H3
2 hours 4.31 s - CH2(OH)(S03Na)
4.33 s - -NHCH2SO3"
4.67 - - - D 2 O , - N H 2
6.72 t 8 Ar-H4'
-6.73 1
d 8 Ar-H2
-6.74 J
t 8 Ar-H4
6.80 d 8 Ar-H2'
-7.14 t 8 Ar-H3 2
7.18 t 8 Ar-H3'
After 3 minutes there is little evidence of the product. However after 36 minutes there
are peaks present due to the 1 : 1 adduct C6H5NHCH2SO3" and the reaction is complete
within 2 hours. After this time the peaks due to the - C H 2 - groups in the
CH2(OH)(S03Na) and product are approximately equal in intensity and the aromatic
peaks due to aniline relatively small, implying the equilibrium lies in favour of the
product, C6H5NHCH2S03'.
5.2.1.1.3 Aniline in excess
The spectra obtained for the reaction of 0.21 M aniline and 0.10 M CH2(OH)(S03Na)
show formation of the 1 : 1 adduct C6H5NHCH2SO3'. Table 5.8 summarises the spectra
obtained 3 minutes and 5 hours after mixing. There was no fijrther change in the
spectrum.
166
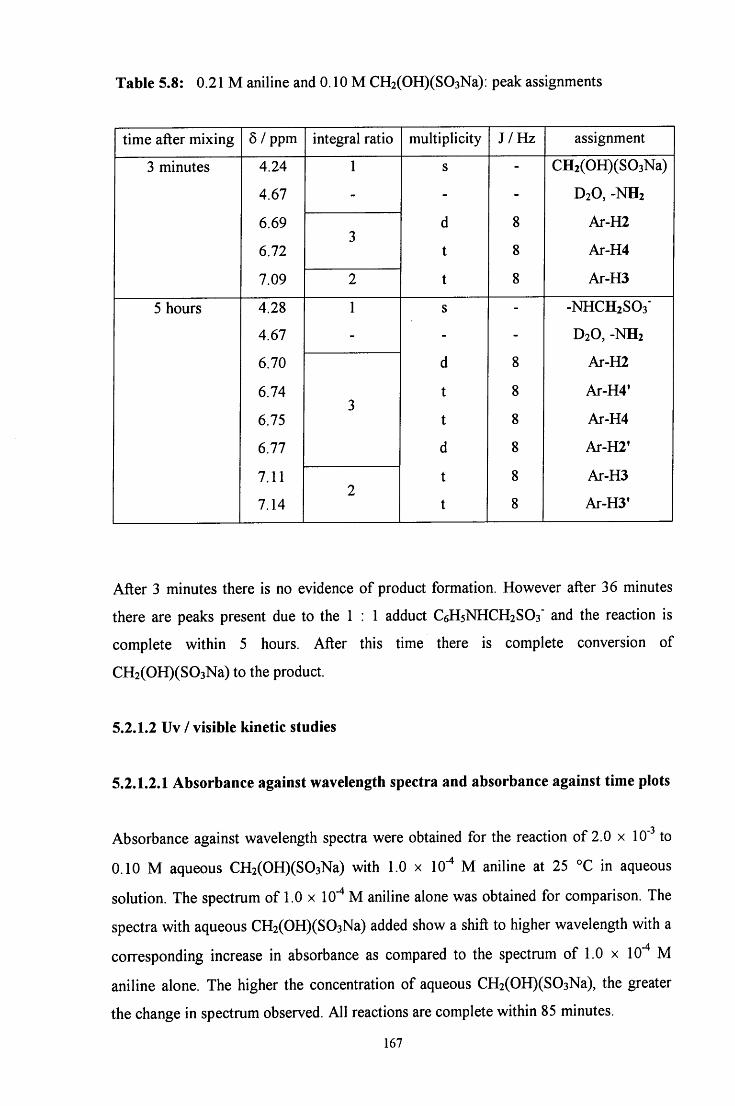
Table 5.8: 0.21 M aniline and 0.10 M CH2(OH)(S03Na): peak assignments
time after mixing 6 / ppm integral ratio multiplicity J /Hz assignment
3 minutes 4.24 1 s - CH2(OH)(S03Na)
4.67 - - - D 2 O , - N H 2
6.69 d 8 Ar-H2
6.72 t 8 Ar-H4
7.09 2 t 8 Ar-H3
5 hours 4.28 1 s - -NHCH2SO3"
4.67 - - - D 2 O , - N H 2
6.70 d 8 Ar-H2
6.74 t 8 Ar-H4' 3
6.75 t 8 Ar-H4
6.77 d 8 Ar-H2'
7.11 t 8 Ar-H3 2
7.14 t 8 Ar-H3'
After 3 minutes there is no evidence of product formation. However after 36 minutes
there are peaks present due to the 1 : 1 adduct C 6 H 5 N H C H 2 S O 3 " and the reaction is
complete within 5 hours. After this time there is complete conversion of
CH2(OH)(S03Na) to the product.
5.2.1.2 Uv / visible kinetic studies
5.2.1.2.1 Absorbance against wavelength spectra and absorbance against time plots
Absorbance against wavelength spectra were obtained for the reaction of 2.0 x lO'"' to
0.10 M aqueous CH2(OH)(S03Na) with 1.0 x 10"* M aniline at 25 °C in aqueous
solution. The spectrum of 1.0 x 10" M aniline alone was obtained for comparison. The
spectra with aqueous CH2(OH)(S03Na) added show a shift to higher wavelength with a
corresponding increase in absorbance as compared to the spectrum of 1.0 x 10""* M
aniline alone. The higher the concentration of aqueous CH2(OH)(S03Na), the greater
the change in spectrum observed. All reactions are complete within 85 minutes.
167
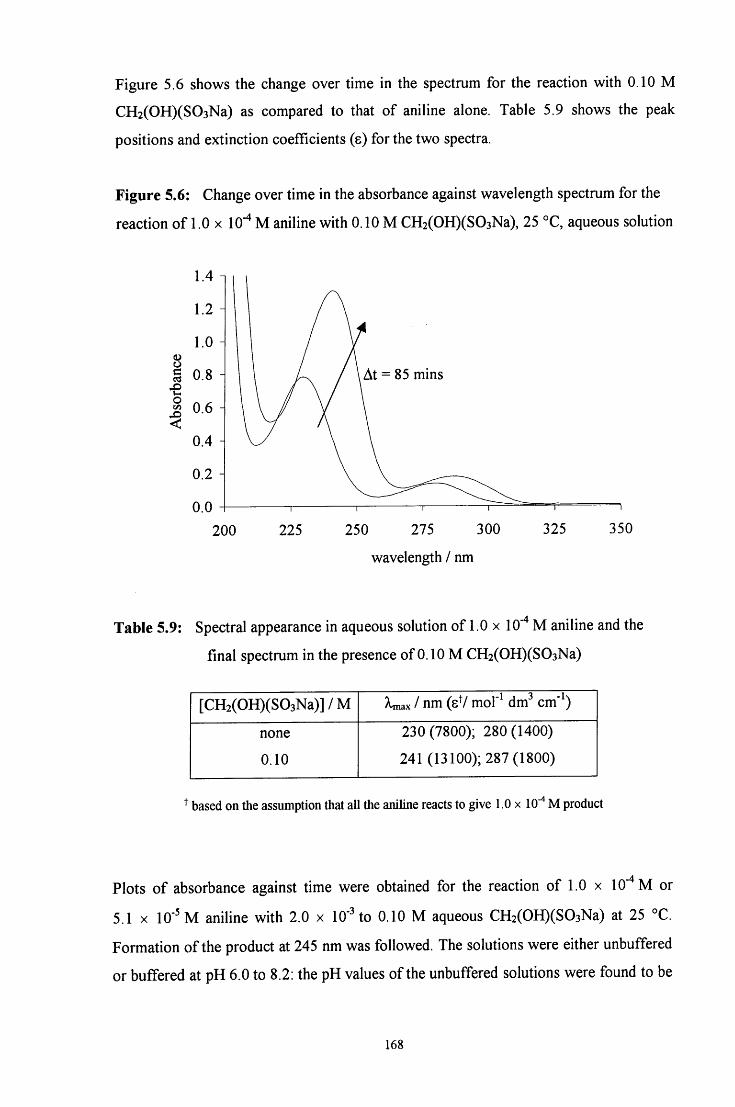
Figure 5.6 shows the change over time in the spectrum for the reaction with 0.10 M
CH2(OH)(S03Na) as compared to that of aniline alone. Table 5.9 shows the peak
positions and extinction coefficients (s) for the two spectra.
Figure 5.6: Change over time in the absorbance against wavelength spectrum for the
reaction of 1.0 x 10"* M aniline with 0.10 M CH2(OH)(S03Na), 25 °C, aqueous solution
1.4 n
1.2 -
1.0 -(U c 0.8 -
bsol
0.6 -<
0.4 -
0.2 -
0.0 -
At = 85 mms
200 225 250 275 300
wavelength / nm
325 350
Table 5.9: Spectral appearance in aqueous solution of 1.0 x 10""* M aniline and the
final spectrum in the presence of 0.10 M CH2(OH)(S03Na)
[CH2(OH)(S03Na)]/M Xmax 1 nm (sV mol"^ dm^ cm'^)
none
0.10
230(7800); 280(1400)
241 (13100); 287(1800)
based on the assumption that all the aniUne reacts to give 1.0 x 10" M product
Plots of absorbance against time were obtained for the reaction of 1.0 x 10'"* M or
5.1 X 10" M aniline with 2.0 x 10" to 0.10 M aqueous CH2(OH)(S03Na) at 25 °C.
Formation of the product at 245 nm was followed. The solutions were either unbuffered
or buffered at pH 6.0 to 8.2: the pH values of the unbuffered solutions were found to be
168
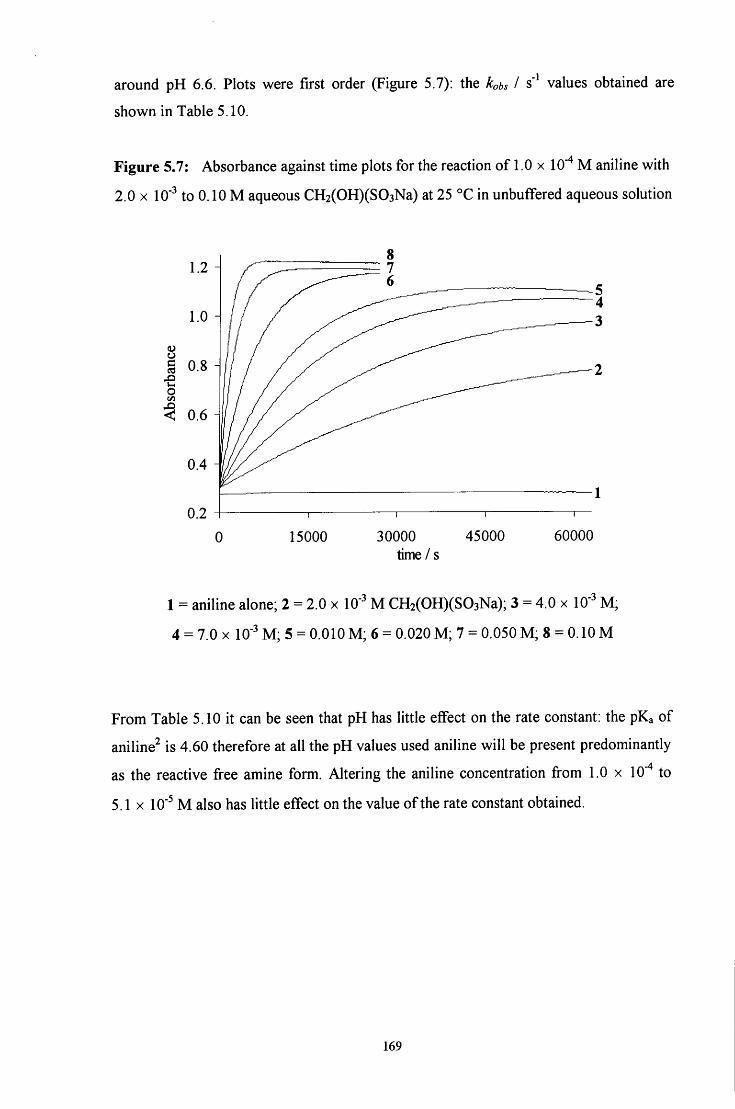
around pH 6.6. Plots were first order (Figure 5.7): the kobs I s' values obtained are
shown in Table 5 .10.
Figure 5.7: Absorbance against time plots for the reaction of 1.0 x 10"^ M aniline with
2 .0 X 10"^ to 0 .10 M aqueous CH2(OH)(S03Na) at 25 °C in unbuffered aqueous solution
5 0.8
<^ 0.6
15000 3 0 0 0 0
time/s 4 5 0 0 0 6 0 0 0 0
1 = aniline alone; 2 = 2.0 x 10"^ M CH2(OH)(S03Na); 3 = 4 .0 x 10"^ M;
4 = 7.0 X 10"^ M ; 5 = 0 .010 M ; 6 = 0 .020 M ; 7 = 0 .050 M ; 8 = 0 .10 M
From Table 5 .10 it can be seen that pH has little effect on the rate constant: the p K a of
aniline^ is 4 .60 therefore at all the pH values used aniline will be present predominantly
as the reactive free amine form. Altering the aniline concentration from 1.0 x 10"^ to
5.1 X 10'^ M also has little effect on the value of the rate constant obtained.
169
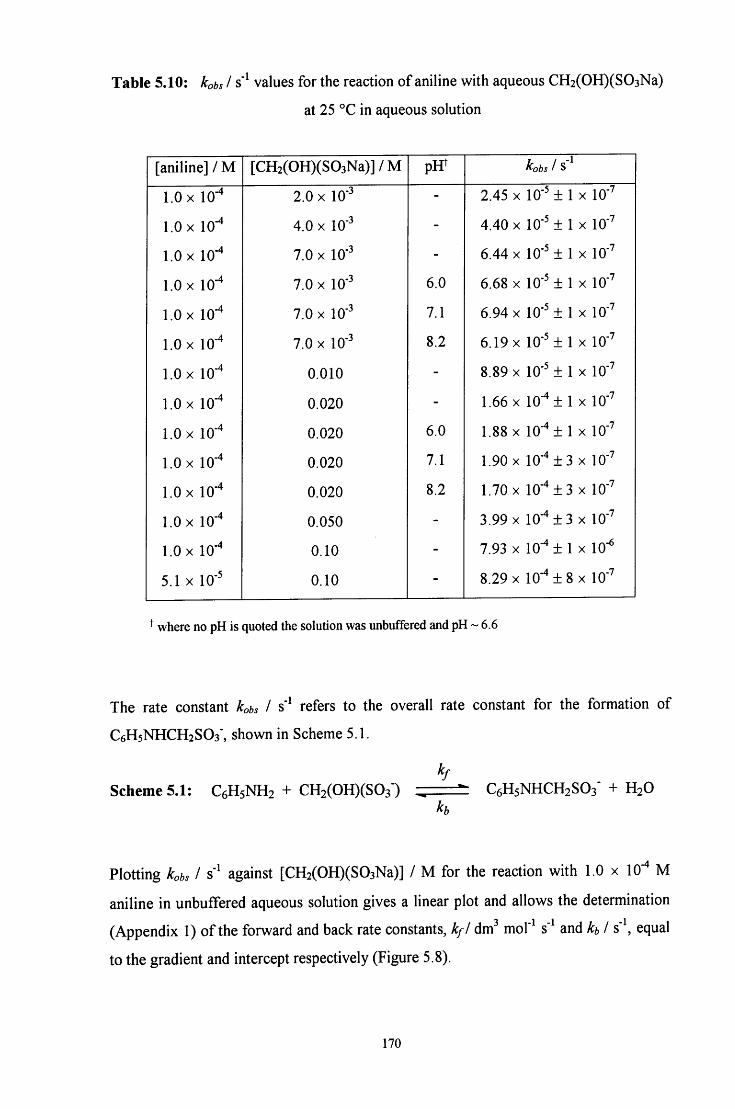
Table 5.10: kobs I s' values for the reaction of aniline with aqueous CH2(OH)(S03Na)
at 25 °C in aqueous solution
[aniline] / M [CH2(OH)(S03Na)]/M pH^
1.0 X 10- 2.0 X 10" - 2.45 X 10' ± 1 X 10"
1.0 X 10" 4.0 X 10" - 4.40 X 10" ± 1 X 10"
1.0 X 10"* 7.0 X 10" - 6.44 X 10' ± 1 X 10"
1.0 X 10- 7.0 X 10" 6.0 6.68 X 10' ± 1 X 10-
1.0 X 10"* 7.0 X 10" 7.1 6.94 X 10" ± 1 X 10-
1.0 X 10- 7.0 X 10' 8.2 6.19 X 10" ± 1 X 10"
1.0 X 10- 0.010 - 8.89 X 10' ± 1 X 10"
1.0 X 10- 0.020 - 1.66 X 10- ± 1 X 10'''
1.0 X 10" 0.020 6.0 1.88 X 10- ± 1 X 10-'
1.0 X 10- 0.020 7.1 1.90 X 10' ± 3 X 10"
1.0 X 10" 0.020 8.2 1.70 X 10"* ± 3 X 10""
1.0 X lO''* 0.050 - 3.99 X 10"* ± 3 X 10'
1.0 X 10"* 0.10 - 7.93 X 10"*± 1 X 10"
5.1 X 10- 0.10 - 8.29 X 10"*±8 X lO""
where no pH is quoted the solution was unbuffered and pH ~ 6.6
The rate constant kobs I s' refers to the overall rate constant for the formation of
C6H5NHCH2SO3', shown in Scheme 5.1.
kf
Scheme 5.1: C6H5NH2 + CHsCOHXSOs") ^ C6H5NHCH2SO3 + H2O h
Plotting kobs I s' against [CH2(OH)(S03Na)] / M for the reaction with 1.0 x 10"* M
aniline in unbuffered aqueous solution gives a linear plot and allows the determination
(Appendix 1) of the forward and back rate constants, kfl dm^ mol"* s" and h I s'*, equal
to the gradient and intercept respectively (Figure 5.8).
170
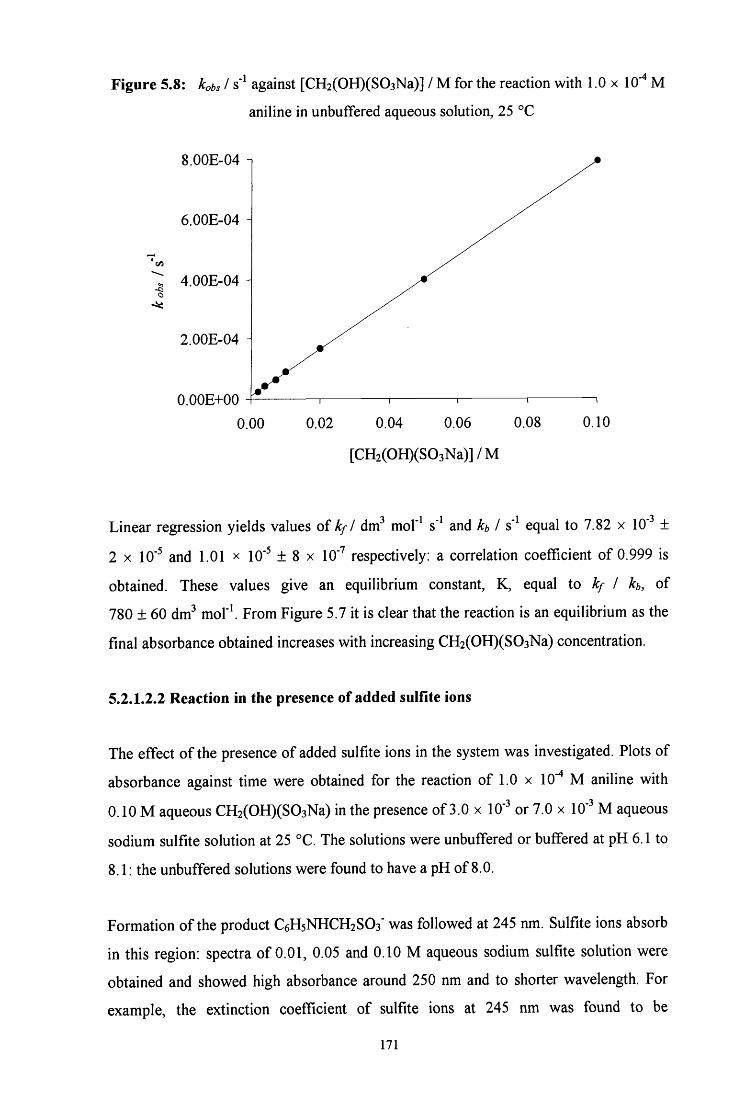
Figure 5.8: kobs I s" against [CH2(OH)(S03Na)] / M for the reaction with 1.0 x 10"* M
aniline in unbuffered aqueous solution, 25 °C
8.00E-04
6.00E-04
. 4.00E-04 H
2.00E-04 H
O.OOE+00 0.00 0.02 0.04 0.06 0.08 0.10
[CH2(OH)(S03Na)]/M
Linear regression yields values of kfl dm^ mol'^ s' and h I s' equal to 7.82 x 10' ±
2 X 10" and 1.01 x lO" ± 8 x lO'" respectively: a correlation coefficient of 0.999 is
obtained. These values give an equilibrium constant, K, equal to kf I h, of
780 ± 60 dm^ mor\ From Figure 5.7 it is clear that the reaction is an equilibrium as the
final absorbance obtained increases with increasing CH2(OH)(S03Na) concentration.
5.2.1.2.2 Reaction in the presence of added sulfite ions
The effect of the presence of added sulfite ions in the system was investigated. Plots of
absorbance against time were obtained for the reaction of 1.0 x 10""* M aniline with
0.10 M aqueous CH2(OH)(S03Na) in the presence of 3.0 x 10" or 7.0 x 10' M aqueous
sodium sulfite solution at 25 °C. The solutions were unbuffered or buffered at pH 6.1 to
8.1: the unbuffered solutions were found to have a pH of 8.0.
Formation of the product C6H5NHCH2SO3" was followed at 245 nm. Sulfite ions absorb
in this region: spectra of 0.01, 0.05 and 0.10 M aqueous sodium sulfite solution were
obtained and showed high absorbance around 250 nm and to shorter wavelength. For
example, the extinction coefficient of sulfite ions at 245 nm was found to be
171
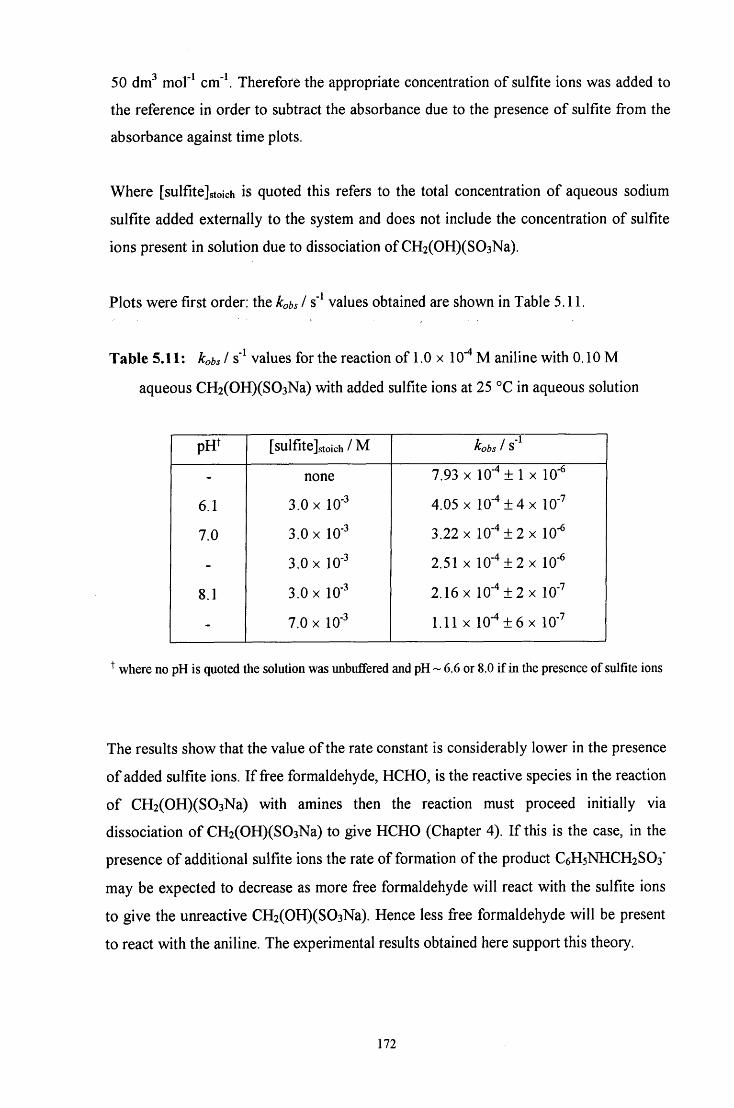
50 dm^ mof* cm"\ Therefore the appropriate concentration of sulfite ions was added to
the reference in order to subtract the absorbance due to the presence of sulfite from the
absorbance against time plots.
Where [sulfite]stoich is quoted this refers to the total concentration of aqueous sodium
sulfite added externally to the system and does not include the concentration of sulfite
ions present in solution due to dissociation of CH2(OH)(S03Na).
Plots were first order: the kobs I s" values obtained are shown in Table 5.11.
Table 5.11: kobs I s"* values for the reaction of 1.0 x 10"* M aniline with 0.10 M
aqueous CH2(OH)(S03Na) with added sulfite ions at 25 °C in aqueous solution
p i r [sulfite]stoich / M kobs 1 S
- none 7.93 X 10"* + 1 X 10'
6.1 3.0 x 10" 4.05 X 10'^±4 X 10'
7.0 3.0 X 10- 3.22 X 10" ± 2 X 10'
- 3.0 X 10- 2.51 X 10"^+ 2 X 10"
8.1 3.0 X 10" 2.16 X 10' ± 2 X 10"'
- 7.0 X 10' 1.11 X 10-^±6x 10-
where no pH is quoted the solution was unbuffered and pH ~ 6.6 or 8.0 if in the presence of sulfite ions
The results show that the value of the rate constant is considerably lower in the presence
of added sulfite ions. I f fi"ee formaldehyde, HCHO, is the reactive species in the reaction
of CH2(OH)(S03Na) with amines then the reaction must proceed initially via
dissociation of CH2(OH)(S03Na) to give HCHO (Chapter 4). I f this is the case, in the
presence of additional sulfite ions the rate of formation of the product C6H5NHCH2SO3"
may be expected to decrease as more free formaldehyde will react with the sulfite ions
to give the unreactive CH2(OH)(S03Na). Hence less fi-ee formaldehyde will be present
to react with the aniline. The experimental results obtained here support this theory.
172
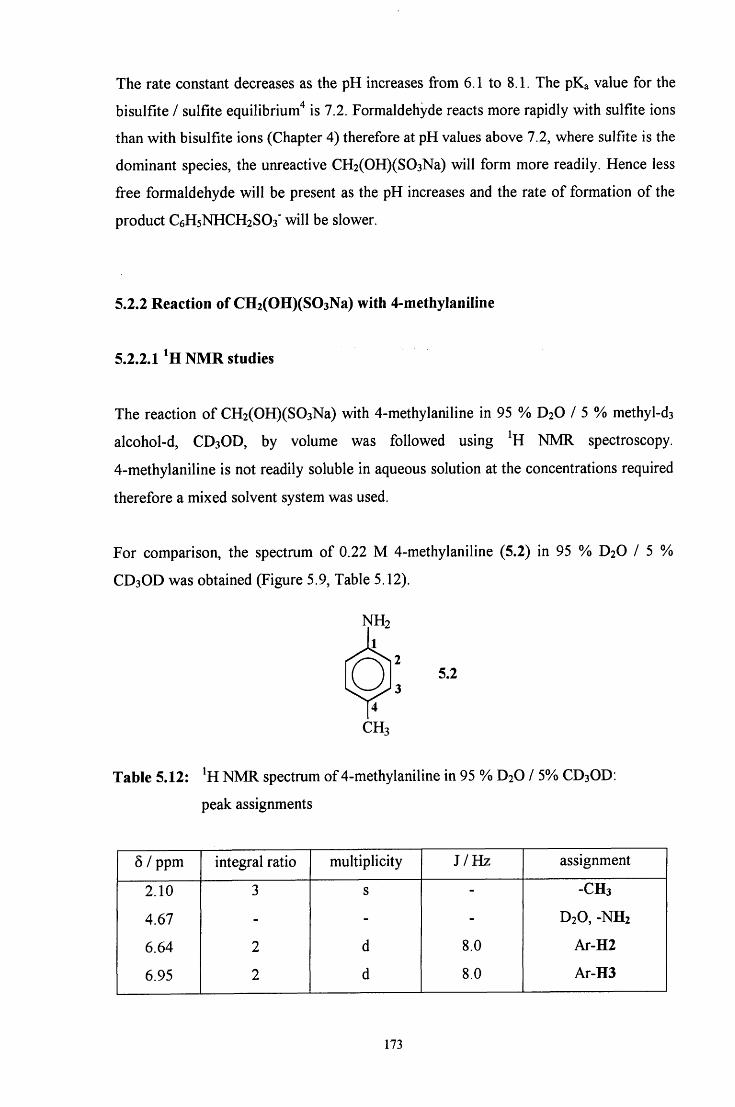
The rate constant decreases as the pH increases from 6.1 to 8.1. The p K a value for the
bisulfite / sulfite equilibrium"* is 7.2. Formaldehyde reacts more rapidly with sulfite ions
than with bisulfite ions (Chapter 4 ) therefore at pH values above 7 .2, where sulfite is the
dominant species, the unreactive CH2(OH)(S03Na) will form more readily. Hence less
free formaldehyde will be present as the pH increases and the rate of formation of the
product C6H5NHCH2SO3" will be slower.
5.2.2 Reaction of CH2(OH)(S03Na) with 4-methyIaniline
5.2.2.1 NMR studies
The reaction of CH2(OH)(S03Na) with 4-methylaniline in 95 % D 2 O / 5 % methyl-D3
alcohol-d, CD3OD, by volume was followed using ^H NMR spectroscopy.
4-methylaniline is not readily soluble in aqueous solution at the concentrations required
therefore a mixed solvent system was used.
For comparison, the spectrum of 0 .22 M 4-methylaniline (5.2) in 95 % D 2 O / 5 %
CD3OD was obtained (Figure 5.9, Table 5 .12) .
N H 2
1
5.2 Q 4
CH3
Table 5.12: ^H N M R spectrum of 4-methylaniline in 95 % D 2 O / 5% C D 3 O D :
peak assignments
5 / ppm integral ratio multiplicity J /Hz assignment
2 .10 3 s - -CH3
4 . 6 7 - - - D 2 O , - N H 2
6 .64 2 d 8.0 Ar-H2
6.95 2 d 8.0 Ar-H3
173
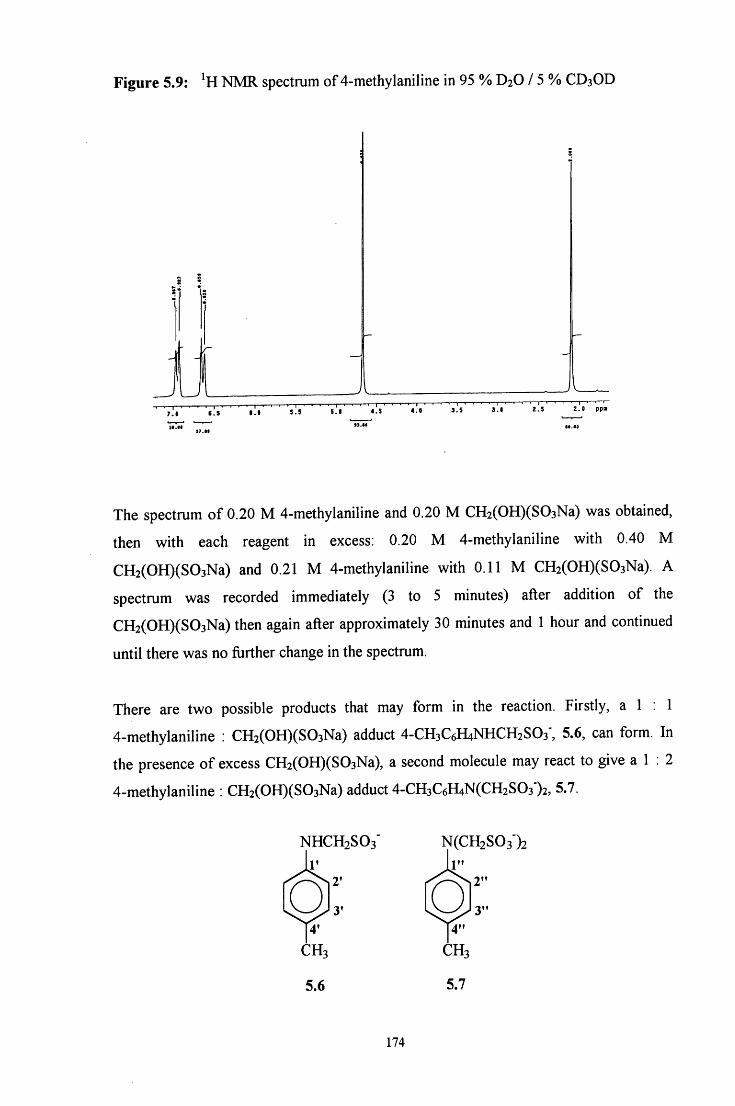
Figure 5.9: ' H N M R spectrum of 4-methylaniline in 95 % D 2 O / 5 % C D 3 O D
7.1 11.
S . I 4 . 5
M.H
The spectrum of 0.20 M 4-methylaniline and 0.20 M CH2(OH)(S03Na) was obtained,
then with each reagent in excess: 0.20 M 4-methylaniline with 0.40 M
CH2(OH)(S03Na) and 0.21 M 4-methylaniline with 0 . 1 1 M CH2(OH)(S03Na). A
spectrum was recorded immediately (3 to 5 minutes) after addition of the
CH2(OH)(S03Na) then again after approximately 3 0 minutes and 1 hour and continued
until there was no fiirther change in the spectrum.
There are two possible products that may form in the reaction. Firstly, a 1 : 1
4-methylaniline : CH2(OH)(S03Na) adduct 4-CH3C6H4NHCH2SO3", 5.6, can form. In
the presence of excess CH2(OH)(S03Na), a second molecule may react to give a 1 : 2
4-methylaniline : CH2(OH)(S03Na) adduct 4-CH3C6H4N(CH2S03')2, 5.7.
NHCH2SO3' r
T
3' Q
4' CH3
5.6
N(CH2S03')2 1"
2"
3" Q
4' CH3
5.7
174
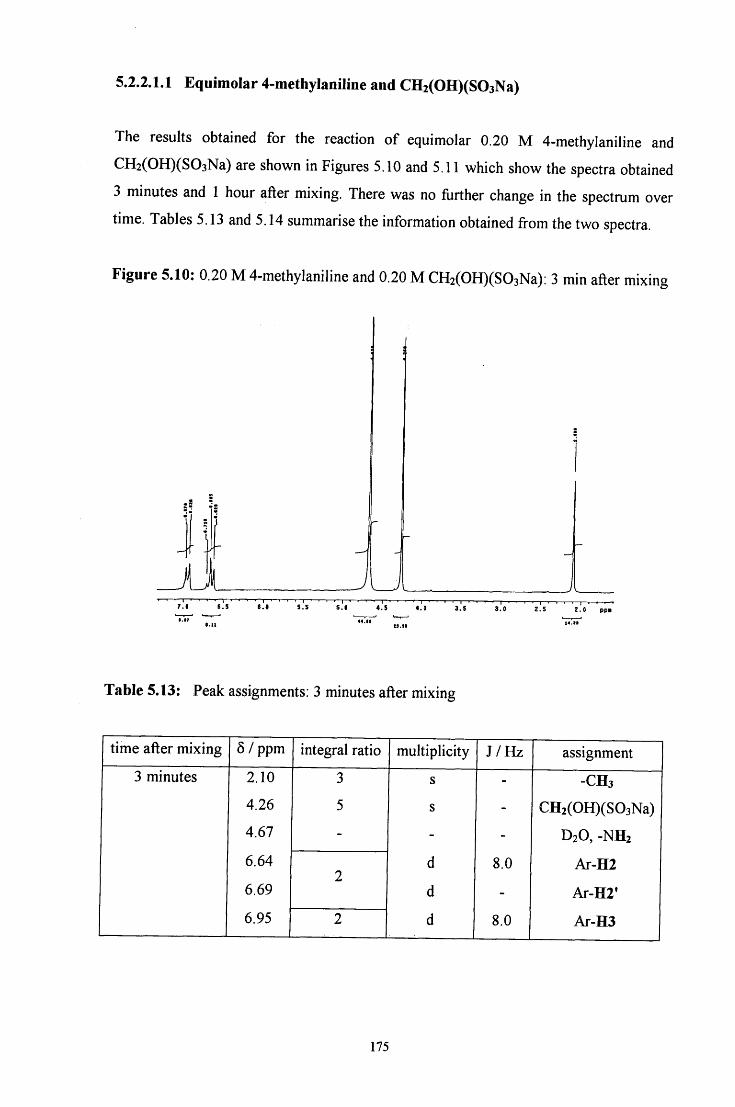
5.2.2.1.1 Equimolar 4-methylaniline and CH2(OH)(S03Na)
The results obtained for the reaction of equimolar 0.20 M 4-methylaniline and
CH2(OH)(S03Na) are shown in Figures 5.10 and 5.11 which show the spectra obtained
3 minutes and 1 hour after mixing. There was no fiirther change in the spectrum over
time. Tables 5.13 and 5.14 summarise the information obtained from the two spectra.
Figure 5.10: 0.20 M 4-methylaniline and 0.20 M CH2(OH)(S03Na): 3 min after mixing
J i l
Table 5.13: Peak assignments: 3 minutes after mixing
« - 5 6 .0 5 . 5 S.I 4 . 5 4 . 0 3 . 5 3 . 0 Z . S 2 . 0 p p i
time after mixing 6 / ppm integral ratio muhiplicity J /Hz assignment
3 minutes 2.10 3 s - -CH3
4.26 5 s - CH2(OH)(S03Na) 4.67 - - - D 2 O , - N H 2
6.64 d 8.0 Ar-H2 2
Ar-H2
6.69 d - Ar-H2'
6.95 2 d 8.0 Ar-H3
175
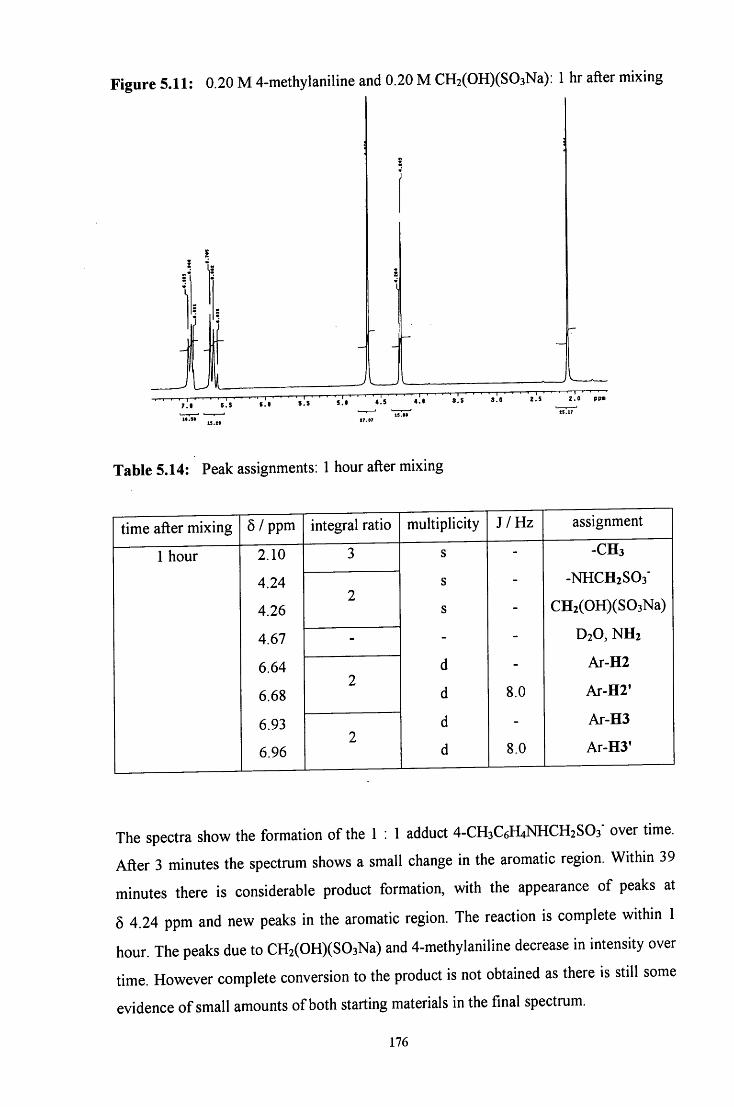
Figure 5.11: 0.20 M 4-methylaniline and 0.20 M CH2(OH)(S03Na): 1 hr after mixing
Table 5.14: Peak assignments: 1 hour after mixing
time after mixing 5 / ppm integral ratio multiplicity J /Hz assignment
1 hour 2.10 3 s - - C H 3
4.24 s - -NHCH2SO3"
4.26 2 s - CH2(OH)(S03Na)
4.67 - - - D 2 O , N H 2
6.64 d - Ar-H2
6.68 2 d 8.0 Ar-H2'
6.93 d - A r - H 3
6.96 2 d 8.0 Ar-H3'
The spectra show the formation of the 1 : 1 adduct 4-CH3C6H4NHCH2SO3" over time.
After 3 minutes the spectrum shows a small change in the aromatic region. Within 39
minutes there is considerable product formation, with the appearance of peaks at
5 4.24 ppm and new peaks in the aromatic region. The reaction is complete within 1
hour. The peaks due to CH2(OH)(S03Na) and 4-methylaniline decrease in intensity over
time. However complete conversion to the product is not obtained as there is still some
evidence of small amounts of both starting materials in the final spectrum.
176
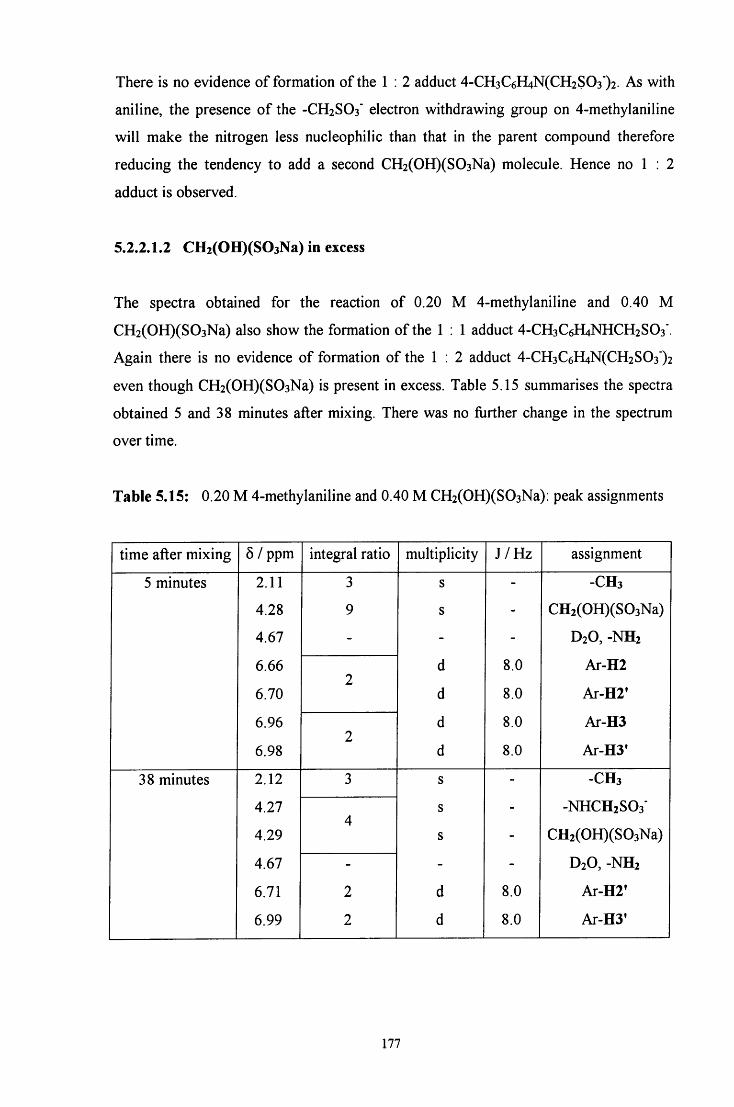
There is no evidence of formation of the 1 : 2 adduct 4-CH3C6H4N(CH2S03")2. As with
aniline, the presence of the -CH2SO3" electron withdrawing group on 4-methylaniline
will make the nitrogen less nucleophilic than that in the parent compound therefore
reducing the tendency to add a second CH2(OH)(S03Na) molecule. Hence no 1 : 2
adduct is observed.
5.2.2.1.2 CH2(OH)(S03Na) in excess
The spectra obtained for the reaction of 0.20 M 4-methylaniline and 0.40 M
CH2(OH)(S03Na) also show the formation of the 1 : 1 adduct 4-CH3C6H4NHCH2SO3".
Again there is no evidence of formation of the 1 : 2 adduct 4-CH3C6H4N(CH2S03")2
even though CH2(OH)(S03Na) is present in excess. Table 5.15 summarises the spectra
obtained 5 and 38 minutes after mixing. There was no fiirther change in the spectrum
over fime.
Table 5.15: 0.20 M 4-methylaniline and 0.40 M CH2(OH)(S03Na): peak assignments
time after mixing 5 / ppm integral ratio multiplicity J /Hz assignment
5 minutes 2.11 3 s - -CH3
4.28 9 s - CH2(OH)(S03Na)
4.67 - - - D 2 O , - N H 2
6.66 d 8.0 Ar-H2 2
6.70 d 8.0 Ar-H2'
6.96 d 8.0 Ar-H3 2
6.98 d 8.0 Ar-H3'
38 minutes 2.12 3 s - -CH3
4.27 s - -NHCH2S03' 4
4.29 s - CH2(OH)(S03Na)
4.67 - - - D 2 O , - N H 2
6.71 2 d 8.0 Ar-H2'
6.99 2 d 8.0 Ar-H3'
177
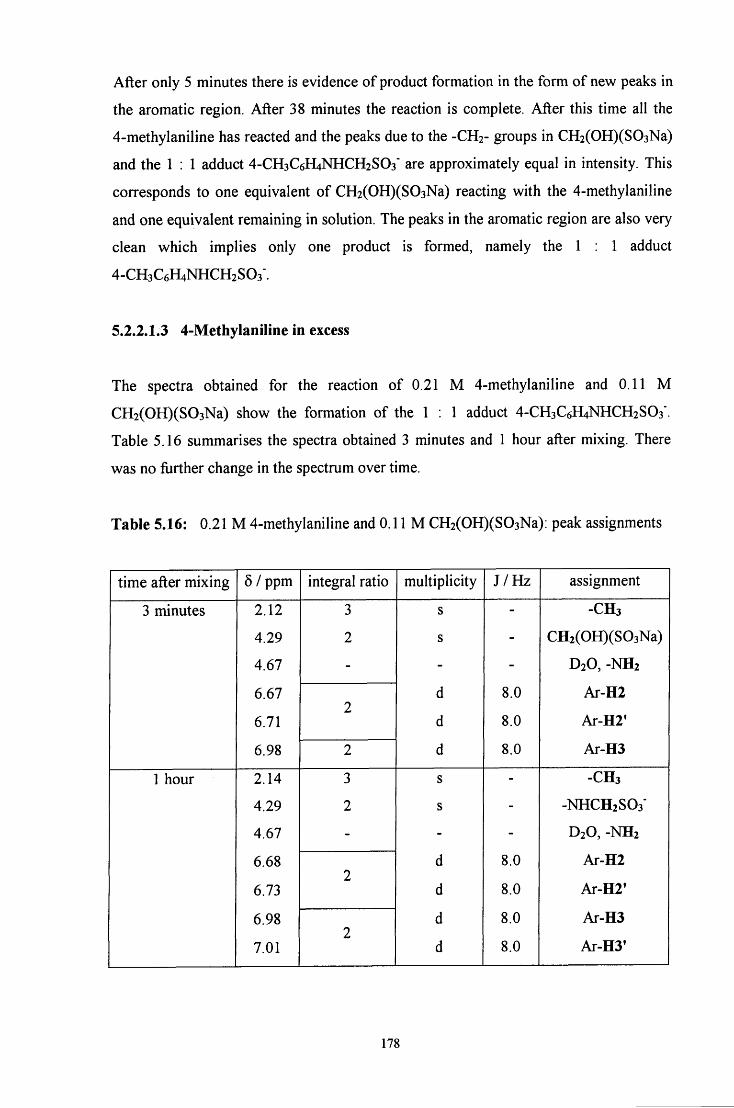
After only 5 minutes there is evidence of product formation in the form of new peaks in
the aromatic region. After 38 minutes the reaction is complete. After this time all the
4-methylaniline has reacted and the peaks due to the -CH2- groups in CH2(OH)(S03Na)
and the 1 : 1 adduct 4-CH3C6H4NHCH2SO3" are approximately equal in intensity. This
corresponds to one equivalent of CH2(OH)(S03Na) reacting with the 4-methylaniline
and one equivalent remaining in solution. The peaks in the aromatic region are also very
clean which implies only one product is formed, namely the 1 : 1 adduct
4-CH3C6H4NHCH2S03'.
5.2.2.1.3 4-Methylaniline in excess
The spectra obtained for the reaction of 0.21 M 4-methylaniline and 0.11 M
CH2(OH)(S03Na) show the formation of the 1 : 1 adduct 4-CH3C6H4NHCH2S03'.
Table 5.16 summarises the spectra obtained 3 minutes and 1 hour after mixing. There
was no fiirther change in the spectrum over time.
Table 5.16: 0.21 M 4-methylaniline and 0.11 M CH2(OH)(S03Na): peak assignments
fime after mixing 5 / ppm integral ratio multiplicity J / H z assignment
3 minutes 2.12 3 s - -CH3
4.29 2 s - CH2(OH)(S03Na)
4.67 - - - D 2 O , - N H 2
6.67 d 8.0 Ar-H2 2
6.71 d 8.0 Ar-H2'
6.98 2 d 8.0 Ar-H3
1 hour 2.14 3 s - -CH3
4.29 2 s - -NHCH2SO3"
4.67 - - - D 2 O , - N H 2
6.68 d 8.0 Ar-H2 2
6.73 d 8.0 Ar-H2'
6.98 d 8.0 Ar-H3 2
7.01 d 8.0 Ar-H3'
178
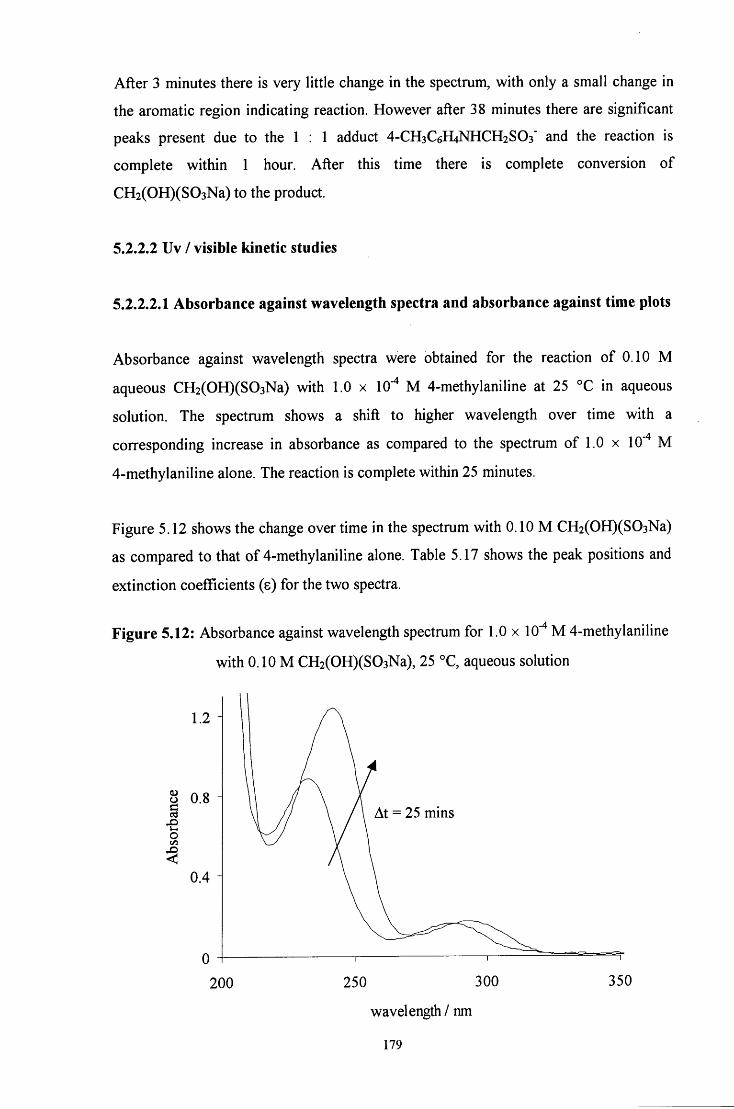
After 3 minutes there is very little change in the spectrum, with only a small change in
the aromatic region indicating reaction. However after 38 minutes there are significant
peaks present due to the 1 : 1 adduct 4 - C H 3 C 6 H 4 N H C H 2 S O 3 ' and the reaction is
complete within 1 hour. After this time there is complete conversion of
CH2(OH)(S03Na) to the product.
5.2.2.2 Uv / visible kinetic studies
5.2.2.2.1 Absorbance against wavelength spectra and absorbance against time plots
Absorbance against wavelength spectra were obtained for the reaction of 0.10 M
aqueous CH2(OH)(S03Na) with 1.0 x 10"* M 4-methylaniline at 25 °C in aqueous
solution. The spectrum shows a shift to higher wavelength over time with a
corresponding increase in absorbance as compared to the spectrum of 1.0 x 10'"* M
4-methylaniline alone. The reaction is complete within 25 minutes.
Figure 5.12 shows the change over time in the spectrum with 0.10 M CH2(OH)(S03Na)
as compared to that of 4-methylaniline alone. Table 5.17 shows the peak positions and
extinction coefficients (s) for the two spectra.
Figure 5.12: Absorbance against wavelength spectrum for 1.0 x 10" M 4-methylaniline
with 0.10 M CH2(OH)(S03Na), 25 °C, aqueous solufion
i At = 25 mins
200 250 300
wavelength / nm
179
350
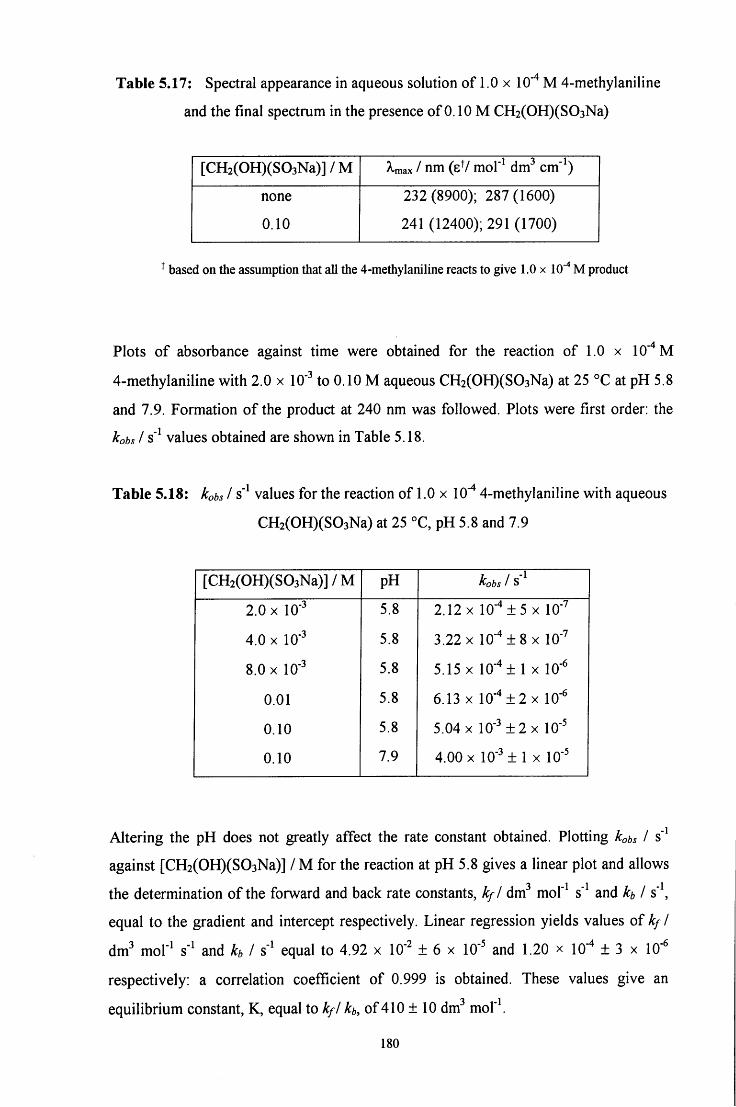
Table 5.17: Spectral appearance in aqueous solution of 1.0 x lO""* M 4-methylaniline
and the final spectrum in the presence of 0.10 M CH2(OH)(S03Na)
[CH2(OH)(S03Na)]/M Xmax 1 nm (eV mol"^ dm^ cm'^)
none
0.10
232(8900); 287(1600)
241 (12400); 291 (1700)
^ based on the assumption that all the 4-methyIaniline reacts to give 1.0 x lO"' M product
Plots of absorbance against time were obtained for the reaction of 1.0 x 10""* M
4-methylaniline with 2.0 x 10' to 0.10 M aqueous CH2(OH)(S03Na) at 25 °C at pH 5.8
and 7.9. Formation of the product at 240 nm was followed. Plots were first order: the
kobs I s' values obtained are shown in Table 5.18.
Table 5.18: kobs I s" values for the reaction of 1.0 x 10" 4-methylaniline with aqueous
CH2(OH)(S03Na) at 25 °C, pH 5.8 and 7.9
[CH2(OH)(S03Na)]/M pH kobs 1 S
2.0 X 10" 5.8 2.12 X 10" ± 5 X 10"
4.0 X 10" 5.8 3.22 X 10"^±8x lO'"
8.0 X 10' 5.8 5.15 X 10- ± 1 X 10'
0.01 5.8 6.13 X 10"'*±2x 10-
0.10 5.8 5.04 X 10"^+ 2 X 10-
0.10 7.9 4.00 X 10" ± 1 X 10"
Altering the pH does not greatly affect the rate constant obtained. Plotting kobs I s"
against [CH2(OH)(S03Na)] / M for the reaction at pH 5.8 gives a linear plot and allows
the determination of the forward and back rate constants, k f l dvc? mol"^ s' and h I s'\
equal to the gradient and intercept respectively. Linear regression yields values of kf I
dm^ mof^ s" and h I equal to 4.92 x 10" ± 6 x 10" and 1.20 x lO'^ ± 3 x 10 ^
respectively: a correlation coefficient of 0.999 is obtained. These values give an
equilibrium constant, K, equal to k/f of 410 ± 10 dm^ mol'V
180
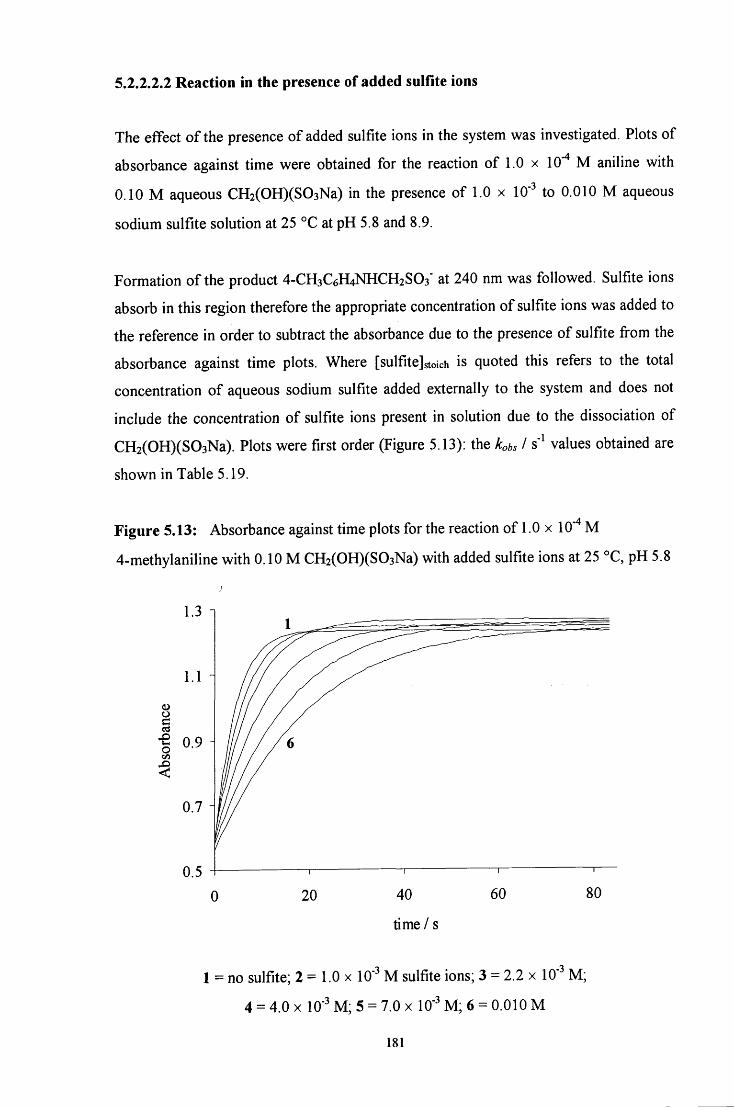
5.2.2.2.2 Reaction in the presence of added sulfite ions
The effect of the presence of added sulfite ions in the system was investigated. Plots of
absorbance against time were obtained for the reaction of 1.0 x 10* M aniline with
0.10 M aqueous CH2(OH)(S03Na) in the presence of 1.0 x 10' to 0.010 M aqueous
sodium sulfite solution at 25 °C at pH 5.8 and 8.9.
Formation of the product 4-CH3C6H4NHCH2SO3" at 240 nm was followed. Sulfite ions
absorb in this region therefore the appropriate concentration of sulfite ions was added to
the reference in order to subtract the absorbance due to the presence of sulfite from the
absorbance against time plots. Where [sulfite]stoich is quoted this refers to the total
concentration of aqueous sodium sulfite added externally to the system and does not
include the concentration of sulfite ions present in solution due to the dissociation of
CH2(OH)(S03Na). Plots were first order (Figure 5.13): the kobs I s' values obtained are
shown in Table 5.19.
Figure 5.13: Absorbance against time plots for the reaction of 1.0 x 10""* M
4-methylaniline with 0.10 M CH2(OH)(S03Na) with added sulfite ions at 25 °C, pH 5.8
<L) O
o
1.3
1.1 ^
0 .9 H
0.7 H
0.5
20 40
time / s
60 80
1 = no sulfite; 2 = 1.0 x 10' M sulfite ions; 3 = 2.2 x 10' M ;
4 = 4.0 x 10" M ; 5 = 7.0 x 10" M ; 6 = 0.010 M
181
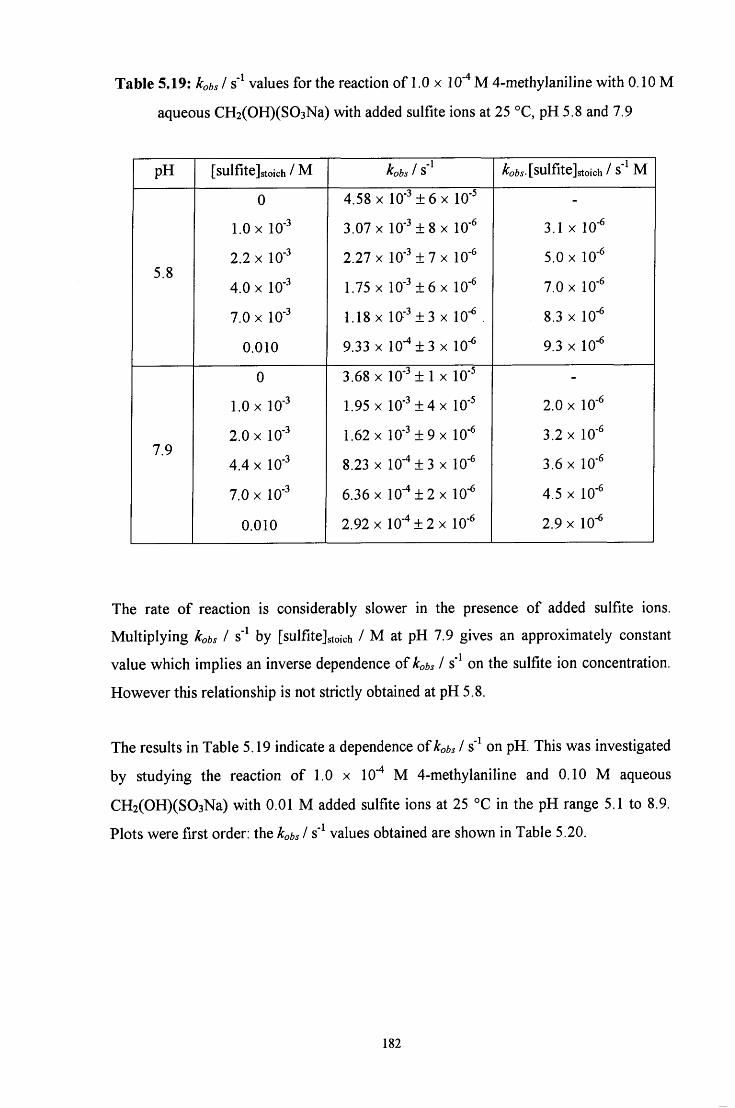
Table 5.19: kobs I s' values for the reaction of 1.0 x 10'"* M 4-methylaniline with 0.10 M
aqueous CH2(OH)(S03Na) with added sulfite ions at 25 °C, pH 5.8 and 7.9
pH [sulfitejstoich / M kobs 1 S Aroi,i.[sulfite]stoich / s" M
0 4.58 X 10" ± 6 X 10" -
1.0 X 10" 3.07 X 10" ± 8 X 10' 3.1 X 10-
2.2 X 10' 2.27 X 10' ± 7 X 10" 5.0 X 10- 5.8
4.0 X 10" 1.75 X 10' ± 6 X 10" 7.0 X 10-
7.0 X 10' 1.18 X 10" ± 3 X 10" 8.3 X 10"
0.010 9.33 X lO'"* ± 3 X 10' 9.3 X 10-
0 3.68 X 10" ± 1 X 10" -
1.0 X 10' 1.95 X 10' ± 4 X 10" 2.0 X 10-
2.0 X 10' 1.62 X 10" ± 9 X 10" 3.2 X 10" 7.9
4.4 X 10" 8.23 X 10"^±3 X 10' 3.6 X 10-
7.0 X 10" 6.36 X 10"*±2 X 10" 4.5 X 10-
0.010 2.92 X 10" ± 2 X 10" 2.9 X 10-
The rate of reaction is considerably slower in the presence of added sulfite ions.
Multiplying kobs / s' by [sulfitejstoich / M at pH 7.9 gives an approximately constant
value which implies an inverse dependence of kobs I s" on the sulfite ion concentration.
However this relationship is not strictly obtained at pH 5.8.
The results in Table 5.19 indicate a dependence of Kbs I s" on pH. This was investigated
by studying the reaction of 1.0 x 10" M 4-methylaniline and 0.10 M aqueous
CH2(OH)(S03Na) with 0.01 M added sulfite ions at 25 °C in the pH range 5.1 to 8.9.
Plots were first order; the kobs I s" values obtained are shown in Table 5.20.
182
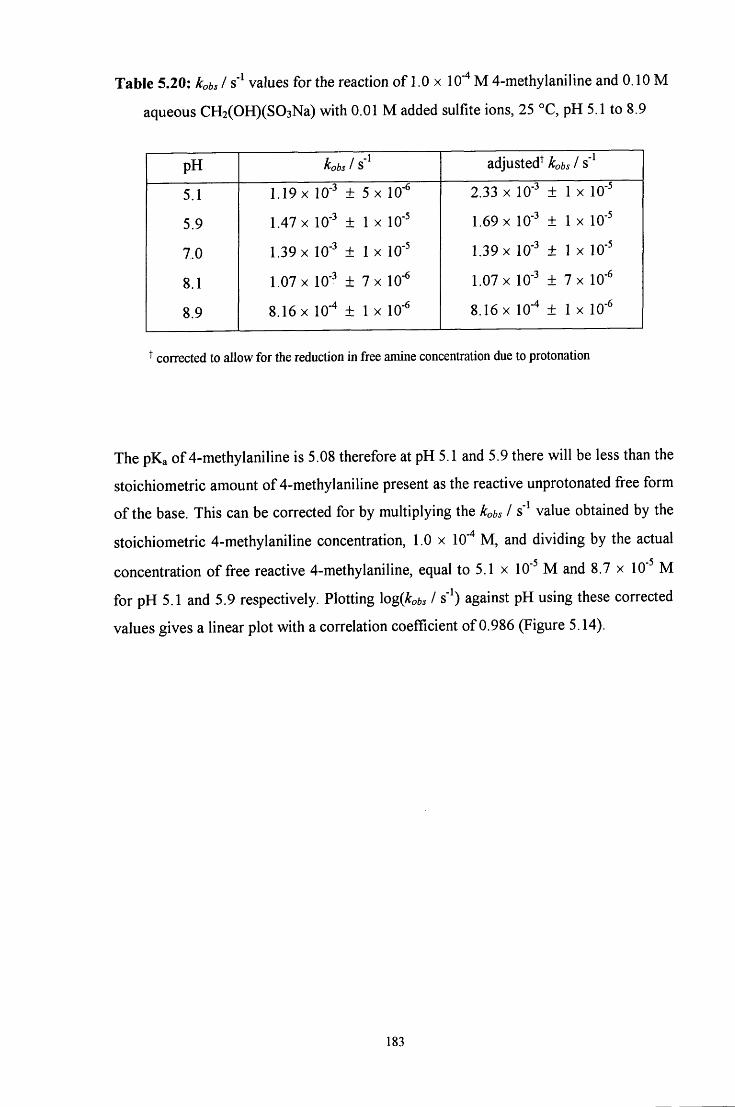
Table 5.20: kobs I s' values for the reaction of 1.0 x lO'" M 4-methylaniline and 0.10 M
aqueous CH2(OH)(S03Na) with 0.01 M added sulfite ions, 25 °C, pH 5.1 to 8.9
pH kobs 1 S adjusted^ kobs 1 s"
5.1 1.19 X 10" ± 5 X 10" 2.33 X 10" ± 1 X 10'
5.9 1.47 X 10' ± 1 X 10" 1.69 X 10" ± 1 X 10"
7.0 1.39 X 10' ± 1 X 10" 1.39 X 10" ± 1 X 10"
8.1 1.07 X 10' ± 7x 10" 1.07 X 10" ± 7x 10'
8.9 8.16 X 10"* ± 1 X 10' 8.16 X 10' ± 1 X 10"
^ corrected to allow for the reduction in free amine concentration due to protonation
The pKa of 4-methylaniline is 5.08 therefore at pH 5.1 and 5.9 there will be less than the
stoichiometric amount of 4-methylaniline present as the reactive unprotonated free form
of the base. This can be corrected for by multiplying the kobs I s" value obtained by the
stoichiometric 4-methylaniline concentration, 1.0 x lO''* M , and dividing by the actual
concentration of free reactive 4-methylaniline, equal to 5.1 x 10" M and 8.7 x 10' M
for pH 5.1 and 5.9 respectively. Plotting \o%{kobs I s' ) against pH using these corrected
values gives a linear plot with a correlation coefficient of 0.986 (Figure 5.14).
183
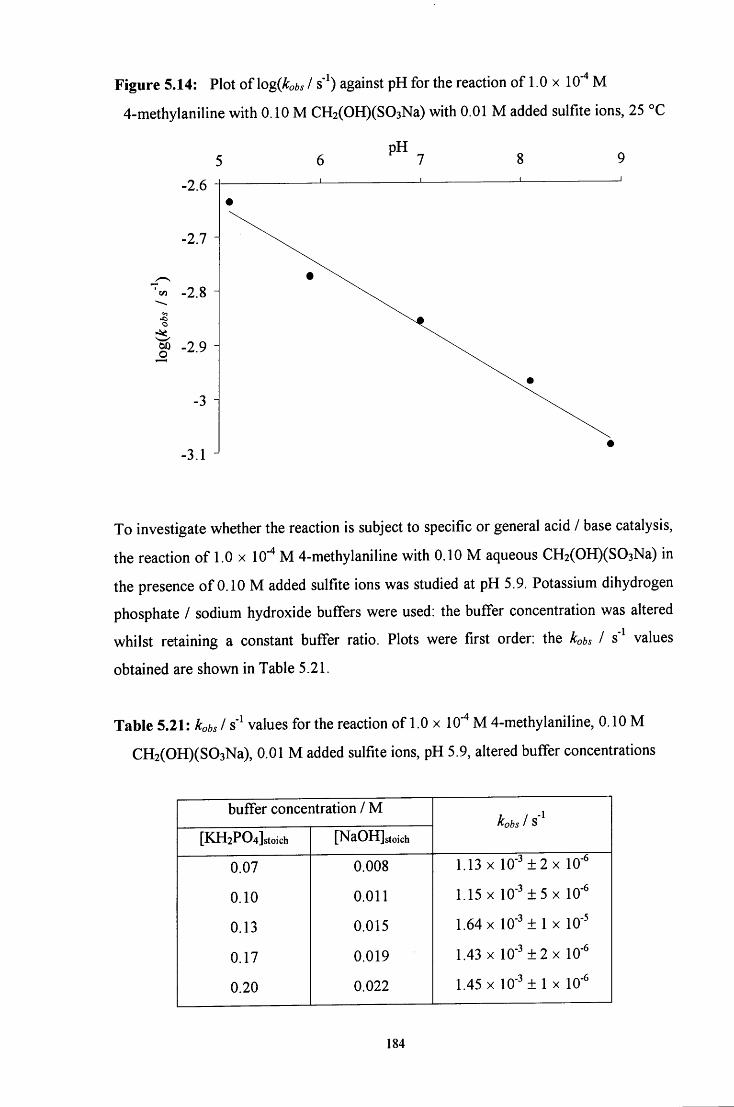
Figure 5.14: Plot of \og(kobs I s' ) against pH for the reaction of 1.0 x 10" M
4-methylaniline with 0.10 M CH2(OH)(S03Na) with 0.01 M added sulfite ions, 25 °C
pH .
-2.6
•2.7
•2.8
^ -2.9
-3
-3.1 '
To investigate whether the reaction is subject to specific or general acid / base catalysis,
the reaction of 1.0 x 10""* M 4-methylaniline with 0.10 M aqueous CH2(OH)(S03Na) in
the presence of 0.10 M added sulfite ions was studied at pH 5.9. Potassium dihydrogen
phosphate / sodium hydroxide buffers were used: the buffer concentration was altered
whilst retaining a constant buffer ratio. Plots were first order: the kobs I s' values
obtained are shown in Table 5.21.
Table 5.21: kobs I s' values for the reaction of 1.0 x lO'"* M 4-methylaniline, 0.10 M
CH2(OH)(S03Na), 0.01 M added sulfite ions, pH 5.9, altered buffer concentrations
buffer concentration / M kobs 1 S
[KH2P04]stoich [NaOH]stoich kobs 1 S
0.07 0.008 1.13 X 10" ± 2 X 10'
0.10 0.011 1.15 X 10" ± 5 X 10"
0.13 0.015 1.64 X 10"^±1 X 10"
0.17 0.019 1.43 X 10"^ 2 X 10'
0.20 0.022 1.45 X 1 0 " H l X 10"
184
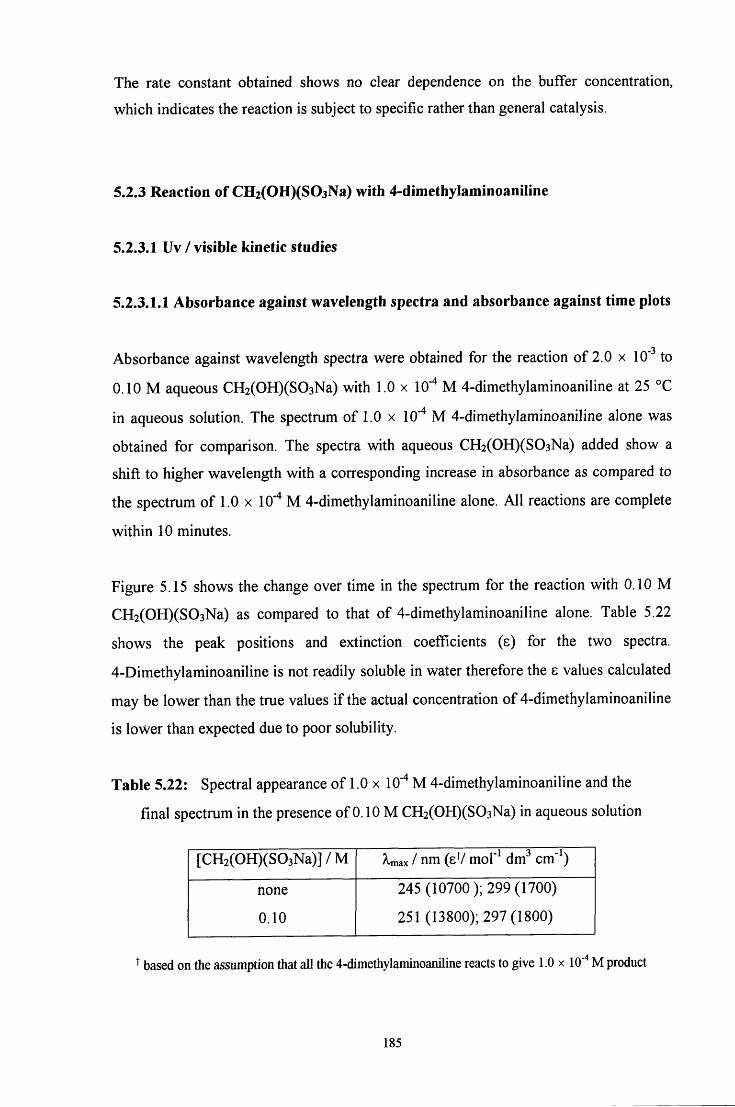
The rate constant obtained shows no clear dependence on the buffer concentration,
which indicates the reaction is subject to specific rather than general catalysis.
5.2.3 Reaction of CHzCOHXSOjNa) with 4-dimethylaminoaniIine
5.2.3.1 Uv / visible kinetic studies
5.2.3.1.1 Absorbance against wavelength spectra and absorbance against time plots
Absorbance against wavelength spectra were obtained for the reaction of 2.0 x 10' to
0.10 M aqueous CH2(OH)(S03Na) with 1.0 x 10' M 4-dimethylaminoaniline at 25 °C
in aqueous solution. The spectrum of 1.0 x 10" M 4-dimethylaminoaniline alone was
obtained for comparison. The spectra with aqueous CH2(OH)(S03Na) added show a
shift to higher wavelength with a corresponding increase in absorbance as compared to
the spectrum of 1.0 x 10""* M 4-dimethylaminoaniline alone. All reactions are complete
within 10 minutes.
Figure 5.15 shows the change over time in the spectrum for the reaction with 0.10 M
CH2(OH)(S03Na) as compared to that of 4-dimethylaminoaniline alone. Table 5.22
shows the peak positions and extinction coefficients (s) for the two spectra.
4-Dimethylaminoaniline is not readily soluble in water therefore the 8 values calculated
may be lower than the true values i f the actual concentration of 4-dimethylaminoaniline
is lower than expected due to poor solubility.
Table 5.22: Spectral appearance of 1.0 x 10""* M 4-dimethylaminoaniline and the
final spectrum in the presence of 0.10 M CH2(OH)(S03Na) in aqueous solution
[CH2(OH)(S03Na)]/M A^ax / nm (eV mol'^ dm^ cm" )
none
0.10
245 (10700); 299(1700)
251 (13800); 297(1800)
based on the assumption that all the 4-dimethylaniinoaniline reacts to give 1.0 x 10"' M product
185
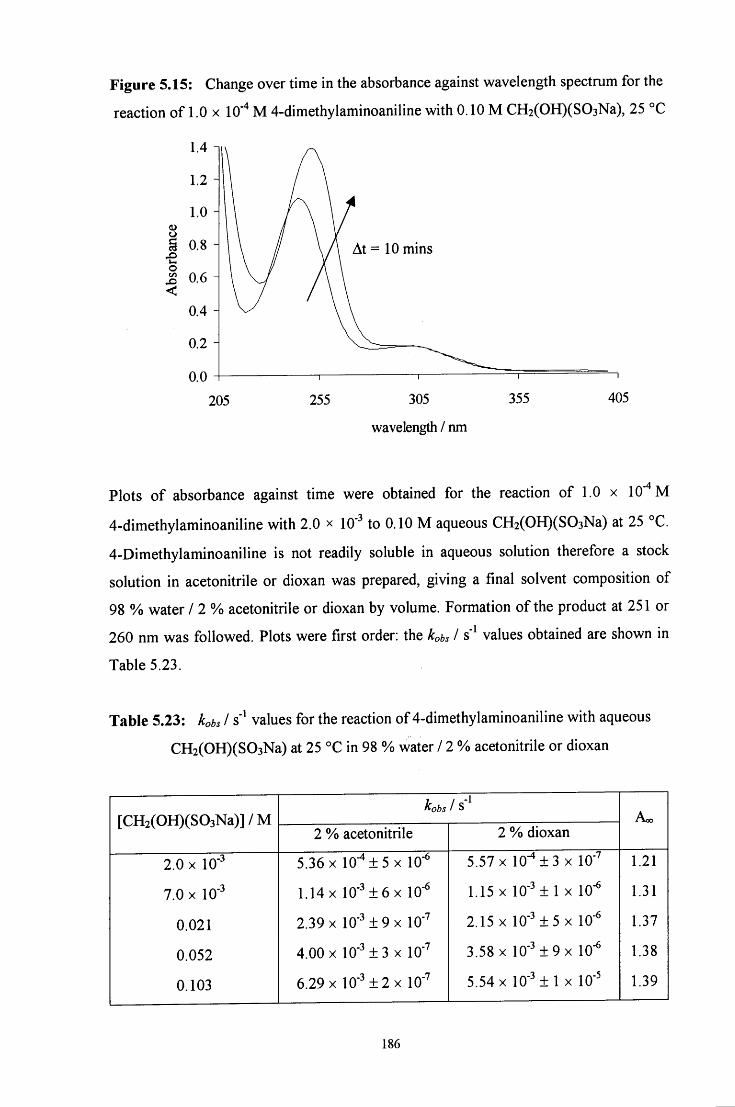
Figure 5.15: Change over time in the absorbance against wavelength spectrum for the
reaction of 1.0 x 10' M 4-dimethylaminoaniline with 0.10 M CH2(OH)(S03Na), 25 °C
§ 0.8 H At = 10 mins
205 255 305
wavelength / nm
355 405
Plots of absorbance against time were obtained for the reaction of 1.0 x 10'"* M
4-dimethylaminoaniline with 2.0 x lO'^ to 0.10 M aqueous CH2(OH)(S03Na) at 25 °C.
4-Dimethylaminoaniline is not readily soluble in aqueous solution therefore a stock
solution in acetonitrile or dioxan was prepared, giving a final solvent composition of
98 % water / 2 % acetonitrile or dioxan by volume. Formation of the product at 251 or
260 nm was followed. Plots were first order: the kobs I s' values obtained are shown in
Table 5.23.
Table 5.23: kobs I s' values for the reaction of 4-dimethylaminoaniline with aqueous
CH2(OH)(S03Na) at 25 °C in 98 % water / 2 % acetonitrile or dioxan
[CH2(OH)(S03Na)]/M kobs Is'
[CH2(OH)(S03Na)]/M 2 % acetonitrile 2 % dioxan
2.0 X 10" 5.36 X 10-^±5x 10- 5.57 X 10"^±3 X 10' 1.21
7.0 X 10" 1.14 X 10' ± 6 X 10- 1.15 X 10" ± 1 X 10' 1.31
0.021 2.39 X 10" ± 9 X 10'" 2.15 X 10"^±5 X 10' 1.37
0.052 4.00 X 10' ± 3 X 10"' 3.58 X 10" ± 9 X 10" 1.38
0.103 6.29 X 10' ± 2 X 10''' 5.54 X l O ' H 1 X 10" 1.39
186
There is little difference in the rate constants obtained in the two solvent systems,
indicating that the 2 % organic component has little effect on the kinetics. The
absorbance values at reaction completion, Aoo, show that the reaction goes largely to the
product. Hence the forward rate term, kf, dominates.
The values show a general increase with increasing concentration of CH2(OH)(S03Na)
but the increase is not linear. This may be due to the fact that in these solutions neither
the pH nor the concentration of sulfite ions in solution were controlled. Since the p K a
value of 4-dimethylaminoaniline is 6.59, values of rate constants in these solutions are
likely to be dependent on the pH of the solution.
5.2.3.1.2 Reaction in the presence of added sulfite ions
The effect of the presence of added sulfite ions in the system was investigated. Plots
of absorbance against time were obtained for the reaction of 1.0 x 10" M
4-dimethylaminoaniline with 0.10 M aqueous CH2(OH)(S03Na) in the presence of
2.0 X 10' to 0.010 M aqueous sodium sulfite solution at 25 °C at pH 5.9 and 8.0 in a
98 % water / 2 % acetonitrile by volume solvent.
Formation of the product 4-N(CH3)2C6H4NHCH2S03' at 260 nm was followed. Sulfite
ions absorb in this region: spectra of 0.01, 0.05 and 0.10 M aqueous sodium sulfite
solution were obtained and showed high absorbance around 250 nm and to shorter
wavelength. For example, the extinction coefficient of sulfite ions at 245 nm was found
to be 50 dm mol" cm" . Therefore the appropriate concentration of sulfite ions was
added to the reference in order to subtract the absorbance due to the presence of sulfite
from the absorbance against time plots.
Where [sulfite]stoich is quoted this refers to the total concentration of aqueous sodium
sulfite added externally to the system and does not include the concentration of sulfite
ions present in solution due to dissociation of CH2(OH)(S03Na).
Plots were first order: the kobs I s" values obtained are shown in Table 5.24.
187
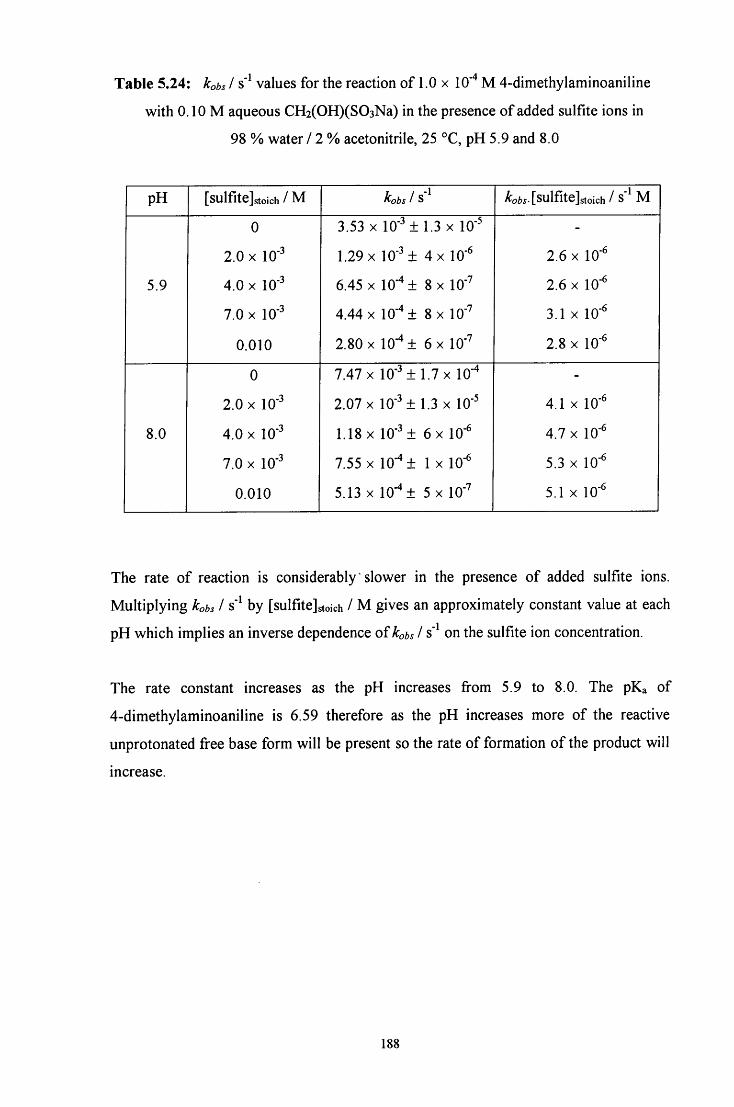
Table 5.24: kobs I s" values for the reaction of 1.0 x 10" M 4-dimethylaminoaniline
with 0.10 M aqueous CH2(OH)(S03Na) in the presence of added sulfite ions in
98 % water / 2 % acetonitrile, 25 °C, pH 5.9 and 8.0
pH [sulfite]stoich / M kobs 1 S ^o65 [sulfite]stoich / s' M
0 3.53 X 10" ± 1.3 X 10" -
2.0 X 10" 1.29 X 10" ± 4x 10' 2.6 X 10'
5.9 4.0 X 10" 6.45 X lO"* ± 8 X 10-" 2.6 X 10"
7.0 X 10" 4.44 X 10" ± 8x 10"' 3.1 X 10"
0.010 2.80 X 10" + 6 X lO'" 2.8 X 10-
0 7.47 X 10 '^±1.7x 10"* -
2.0 X 10' 2.07x10"^ ±1.3x10-^ 4.1 X 10"
8.0 4.0 X 10" 1.18 X 10' ± 6x 10" 4.7 X 10-
7.0 X 10' 7.55 X 10"* ± 1 X 10' 5.3 X 10-
0.010 5.13 X 10"*+ 5 X 10- 5.1 X 10-
The rate of reaction is considerably slower in the presence of added sulfite ions.
Multiplying kobs I s' by [sulfite]stoich / M gives an approximately constant value at each
pH which implies an inverse dependence of kobs I s" on the sulfite ion concentration.
The rate constant increases as the pH increases from 5.9 to 8.0. The p K a of
4-dimethylaminoaniline is 6.59 therefore as the pH increases more of the reactive
unprotonated free base form will be present so the rate of formation of the product will
increase.
188
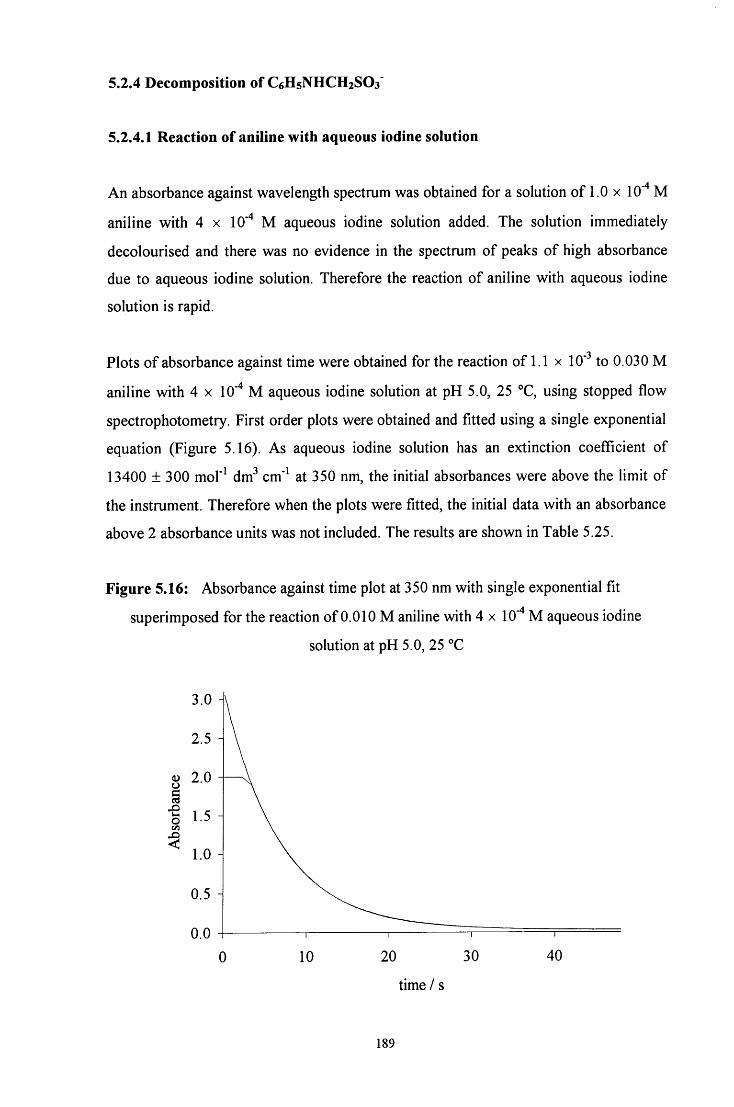
5.2.4 Decomposition of C6H5NHCH2SO3
5.2.4.1 Reaction of aniline with aqueous iodine solution
An absorbance against wavelength spectrum was obtained for a solution of 1.0 x 10""* M
aniline with 4 x 10""* M aqueous iodine solution added. The solution immediately
decolourised and there was no evidence in the spectrum of peaks of high absorbance
due to aqueous iodine solution. Therefore the reaction of aniline with aqueous iodine
solution is rapid.
Plots of absorbance against time were obtained for the reacfion of 1.1 x 10'" to 0.030 M
aniline with 4 x 10" M aqueous iodine solution at pH 5.0, 25 °C, using stopped flow
spectrophotometry. First order plots were obtained and fitted using a single exponential
equation (Figure 5.16). As aqueous iodine solution has an extinction coefficient of 1 1
13400 ± 300 mol" dm" cm'' at 350 nm, the initial absorbances were above the limit of
the instrument. Therefore when the plots were fitted, the initial data with an absorbance
above 2 absorbance units was not included. The results are shown in Table 5.25.
Figure 5.16: Absorbance against fime plot at 350 nm with single exponential fit
superimposed for the reaction of 0.010 M aniline with 4 x 10" M aqueous iodine
solution at pH 5.0, 25 °C
V 2.0
time / s
189
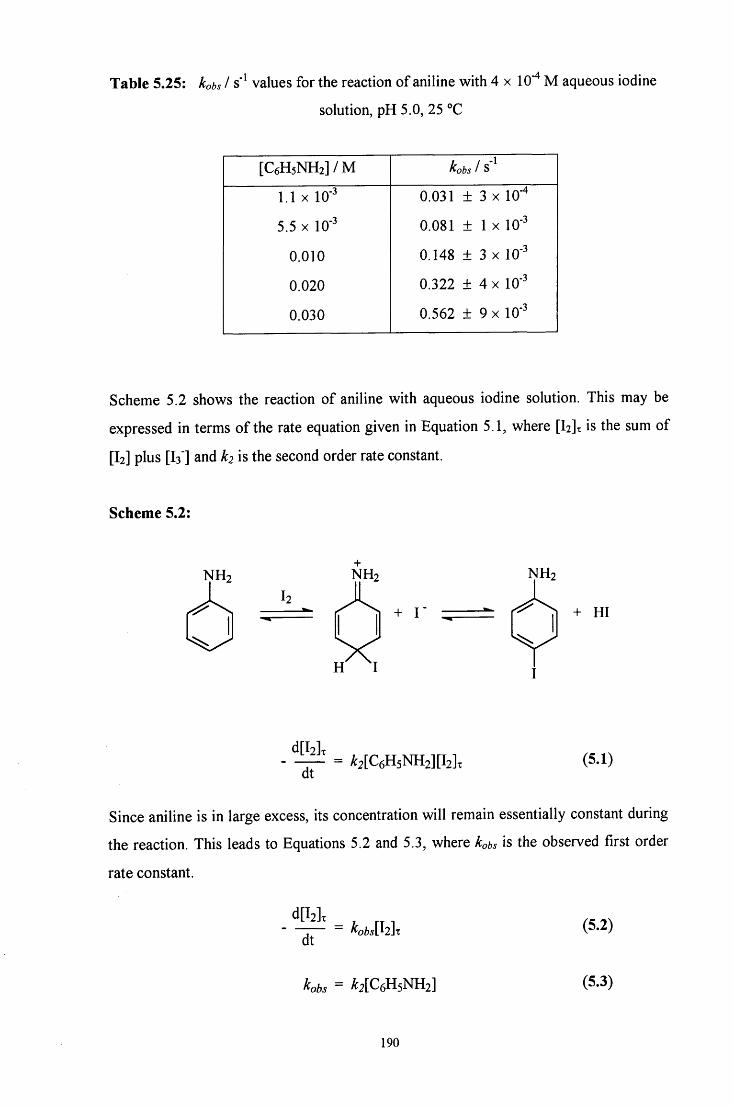
Table 5.25: hbs I s" values for the reaction of aniline with 4 x 10"* M aqueous iodine
solution, pH 5.0, 25 °C
[C6H5NH2]/M kobs 1 S
1.1 X 10- 0.031 ± 3 X 10"*
5.5 X 10- 0.081 ± 1 X 10'
0.010 0.148 ± 3 X 10"
0.020 0.322 ± 4 X 10"
0.030 0.562 ± 9 X 10"
Scheme 5.2 shows the reaction of aniline with aqueous iodine solution. This may be
expressed in terms of the rate equation given in Equation 5.1, where [l2]x is the sum of
[I2] plus [I3"] and k2 is the second order rate constant.
Scheme 5.2:
NH2 NH2
„x NH2
+ HI
d[l2]x dt
= A:2[C6H5NH2][l2]x (5.1)
Since aniline is in large excess, its concentration will remain essentially constant during
the reaction. This leads to Equations 5.2 and 5.3, where kobs is the observed first order
rate constant.
d[l2L
dt - kobsWliy
kobs = ^2[C6H5NH2]
(5.2)
(5.3)
190
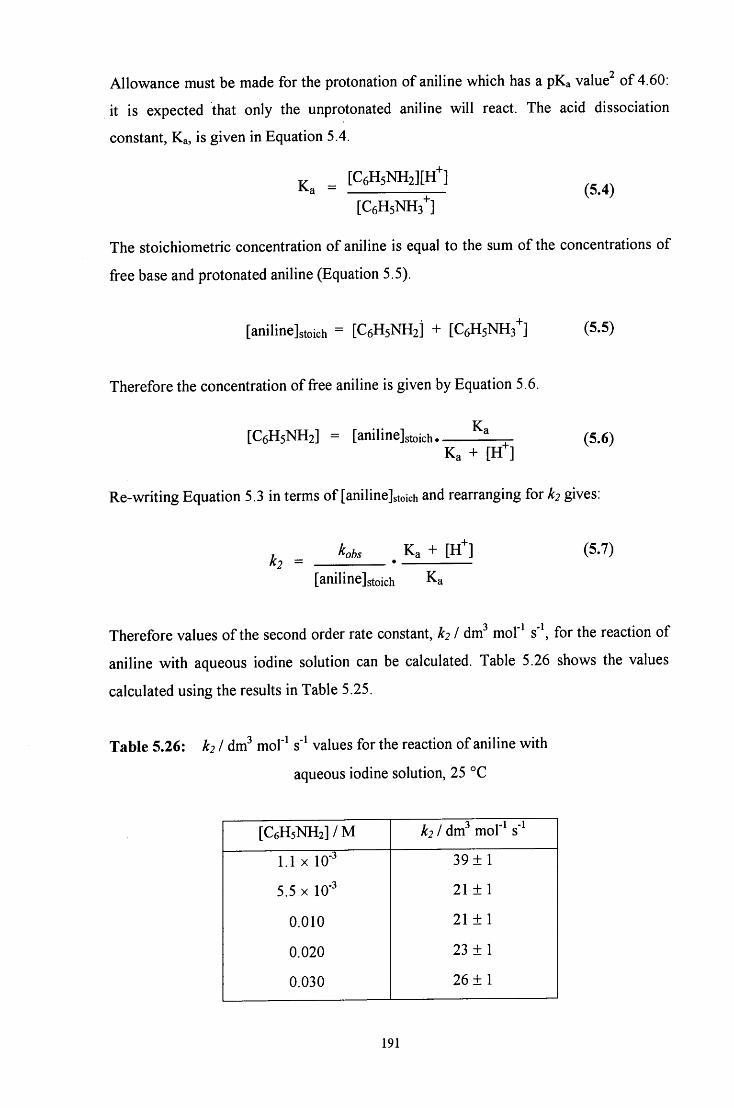
Allowance must be made for the protonation of aniline which has a p K a value^ of 4.60:
it is expected that only the unprotonated aniline will react. The acid dissociation
constant, K a , is given in Equation 5.4.
[C6H5NH2][H1
[C6H5NH3I (5.4)
The stoichiometric concentration of aniline is equal to the sum of the concentrations of
free base and protonated aniline (Equafion 5.5).
[aniline]stoich = [C6H5NH2] + [CgHsNHs"]
Therefore the concentration of free aniline is given by Equation 5.6.
(5.5)
[C6H5NH2] = [anilinejstoich. Ka + [H ' ]
Re-writing Equation 5.3 in terms of [aniline]stoich and rearranging for 2 gives:
Kbs Ka + [ H i
(5.6)
k, = (5.7)
[aniline]stoich Ka
Therefore values of the second order rate constant, k21 dvc? mol'^ s"\ for the reaction of
aniline with aqueous iodine solution can be calculated. Table 5.26 shows the values
calculated using the results in Table 5.25.
Table 5.26: kj I dm^ mol"^ s' values for the reaction of aniline with
aqueous iodine solution, 25 °C
[C6H5NH2]/M k21 dm^ mol"^ s"
1.1 X 10" 39 ± 1
5.5 X 10' 21 ± 1
0.010 21 ± 1
0.020 23 ± 1
0.030 26 ± 1
191
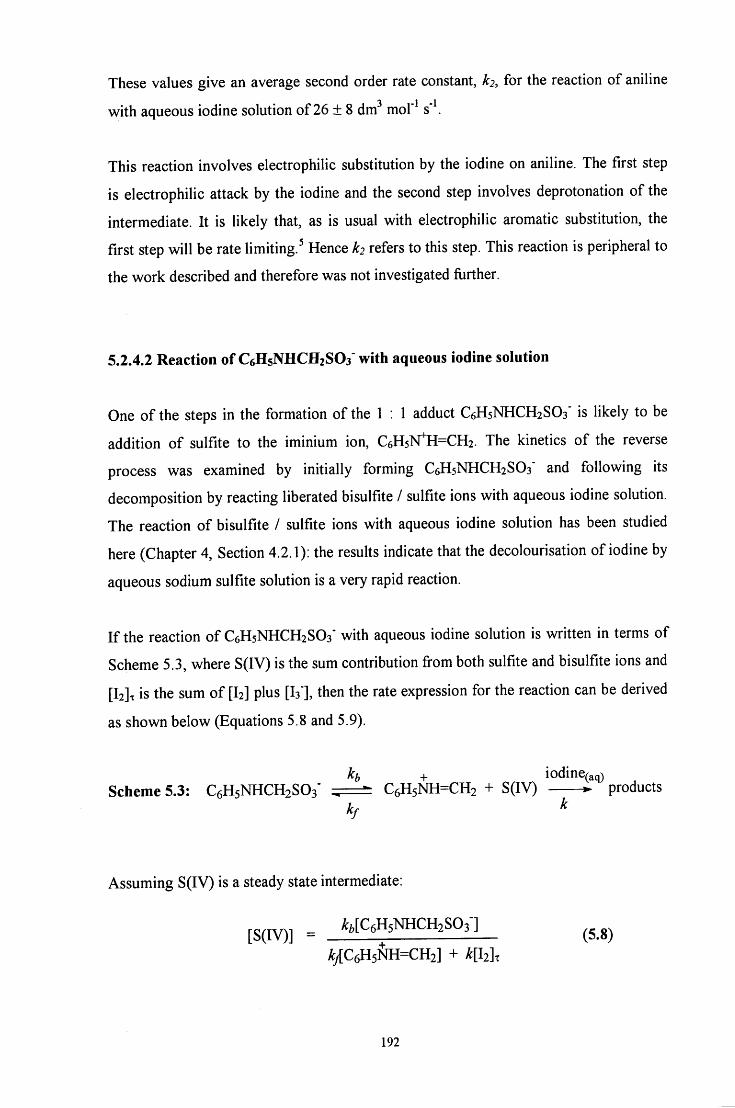
These values give an average second order rate constant, k2, for the reaction of aniline
with aqueous iodine solution of 26 ± 8 dm"' mol' s'\
This reaction involves electrophilic substitution by the iodine on aniline. The first step
is electrophilic attack by the iodine and the second step involves deprotonation of the
intermediate. It is likely that, as is usual with electrophilic aromatic substitution, the
first step will be rate limiting. Hence k2 refers to this step. This reaction is peripheral to
the work described and therefore was not investigated fiirther.
5.2.4.2 Reaction of C6H5NHCH2SO3' with aqueous iodine solution
One of the steps in the formation of the 1 : 1 adduct C6H5NHCH2SO3" is likely to be
addition of sulfite to the iminium ion, C6H5lSrH=CH2. The kinetics of the reverse
process was examined by initially forming C6H5NHCH2SO3' and following its
decomposition by reacting liberated bisulfite / sulfite ions with aqueous iodine solution.
The reaction of bisulfite / sulfite ions with aqueous iodine solution has been studied
here (Chapter 4, Section 4 .2 .1 ) : the results indicate that the decolourisation of iodine by
aqueous sodium sulfite solution is a very rapid reaction.
If the reaction of C6H5NHCH2SO3' with aqueous iodine solution is written in terms of
Scheme 5.3, where S(IV) is the sum contribution from both sulfite and bisulfite ions and
[l2]x is the sum of [I2] plus [Is"], then the rate expression for the reaction can be derived
as shown below (Equations 5.8 and 5.9) .
kb + iodine(aq) Scheme 5.3: C6H5NHCH2SO3' ^ — ^ C6H5NH=CH2 + S(IV) products
kf ^
Assuming S ( I V ) is a steady state intermediate:
[S(IV)] = ^.[C6H3NHCH2S03-] ^^3^
A/[C6H5ivfH=CH2] + MIilx
192
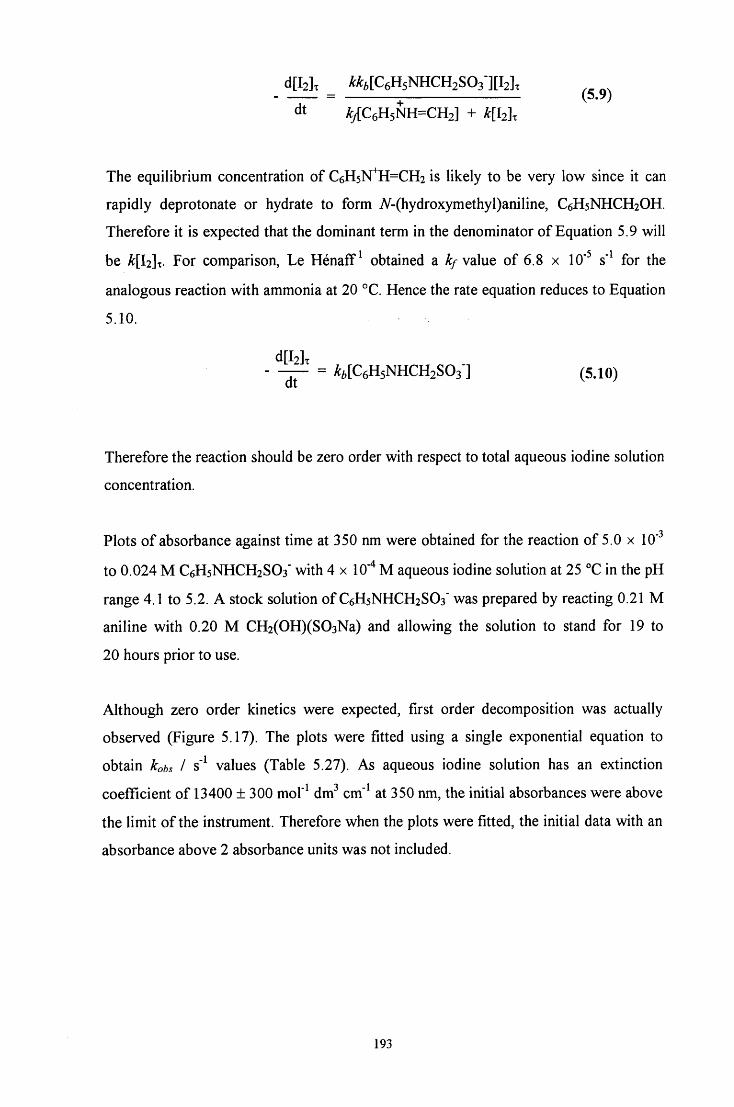
d[l2]x _ %[C6H5NHCH2S03-][l2]x ^^^^
dt ^/C6H5NH=CH2] + A:[I2]T
The equilibrium concentration of C6H5>rH=CH2 is likely to be very low since it can
rapidly deprotonate or hydrate to form iV-(hydroxymethyl)aniline, C6H5NHCH2OH.
Therefore it is expected that the dominant term in the denominator of Equation 5.9 will
be A:[l2]x. For comparison, Le Henaff^ obtained a ^/value of 6.8 x 10" s" for the
analogous reaction with ammonia at 20 °C. Hence the rate equation reduces to Equation
5.10.
d[l2]x - — = A:,[C6H5NHCH2S03-] (5.10)
Therefore the reaction should be zero order with respect to total aqueous iodine solution
concentration.
Plots of absorbance against time at 350 nm were obtained for the reacfion of 5.0 x 10'
to 0.024 M C6H5NHCH2SO3" with 4 x lO'' M aqueous iodine solufion at 25 °C in the pH
range 4.1 to 5.2. A stock solution of C6H5NHCH2SO3" was prepared by reacting 0.21 M
aniline with 0.20 M CH2(OH)(S03Na) and allowing the solution to stand for 19 to
20 hours prior to use.
Although zero order kinetics were expected, first order decomposition was actually
observed (Figure 5.17). The plots were fitted using a single exponential equation to
obtain kobs I s' values (Table 5.27). As aqueous iodine solution has an extinction
coefficient of 13400 ±300 mol'^ dm^ cm" at 350 nm, the initial absorbances were above
the limit of the instrument. Therefore when the plots were fitted, the initial data with an
absorbance above 2 absorbance units was not included.
193
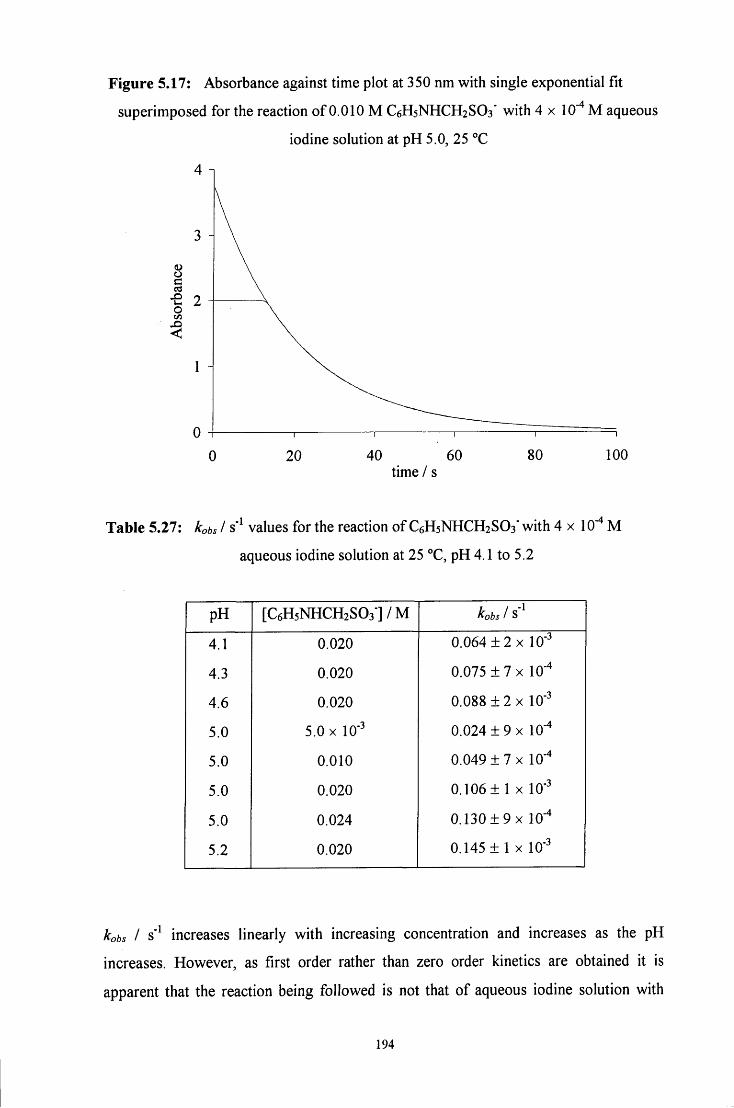
Figure 5.17: Absorbance against time plot at 350 nm with single exponential fit
superimposed for the reaction of 0.010 M C6H5NHCH2SO3" with 4 x 10"* M aqueous
iodine solution at pH 5.0, 25 °C
4 n
20 40 60 time / s
80 100
Table 5.27: kobs I s' values for the reaction of C6H5NHCH2SO3" with 4 x 10' M
aqueous iodine solution at 25 °C, pH 4.1 to 5.2
pH [C6H5NHCH2S03]/M kobs 1 S
4.1 0.020 0.064 ± 2 X 10"
4.3 0.020 0.075 ± 7 X 10"
4.6 0.020 0.088 ± 2 X 10"
5.0 5.0 X 10' 0.024 ± 9 X 10""*
5.0 0.010 0.049 + 7 X 10'
5.0 0.020 0.106 ± 1 X 10"
5.0 0.024 0 . 1 3 0 ± 9 x 10"
5.2 0.020 0.145 ± 1 X 10'
kobs I s'* increases linearly with increasing concentration and increases as the pH
increases. However, as first order rather than zero order kinetics are obtained it is
apparent that the reaction being followed is not that of aqueous iodine solution with
194
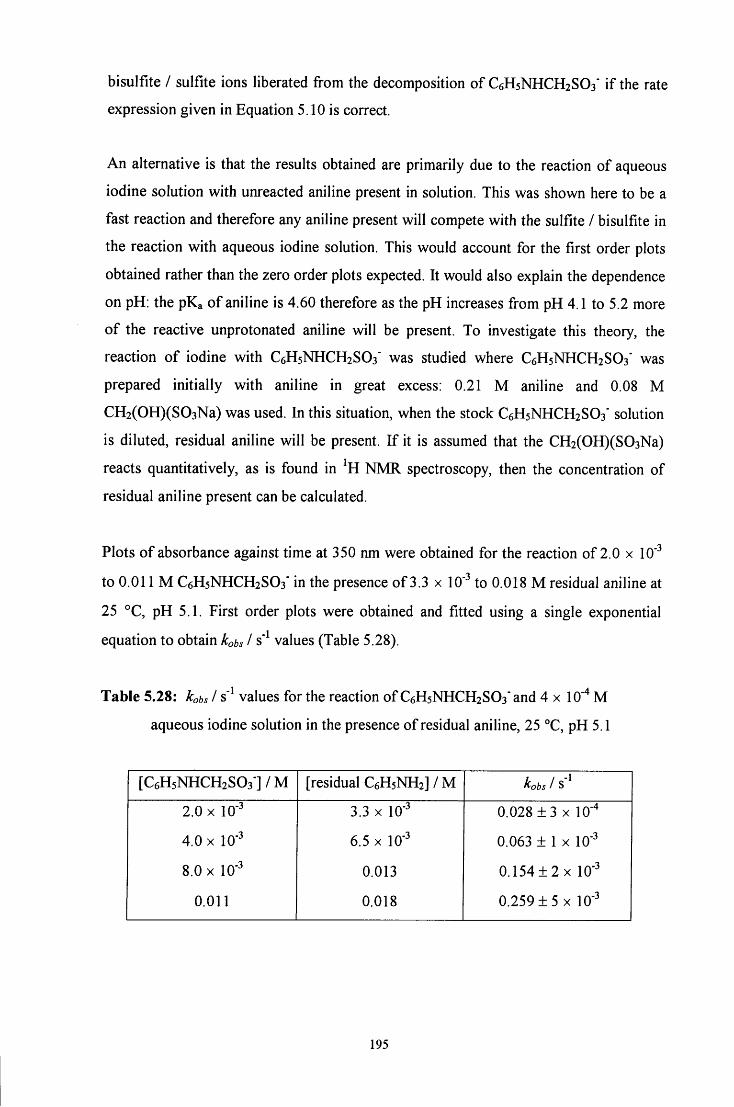
bisulfite / sulfite ions liberated from the decomposition of C6H5NHCH2S03' i f the rate
expression given in Equation 5 .10 is correct.
An alternative is that the results obtained are primarily due to the reaction of aqueous
iodine solution with unreacted aniline present in solution. This was shown here to be a
fast reacfion and therefore any aniline present will compete with the sulfite / bisulfite in
the reacfion with aqueous iodine solufion. This would account for the first order plots
obtained rather than the zero order plots expected. It would also explain the dependence
on pH: the p K a of aniline is 4 .60 therefore as the pH increases from pH 4.1 to 5.2 more
of the reactive unprotonated aniline will be present. To investigate this theory, the
reaction of iodine with C6H5NHCH2S03' was studied where C6H5NHCH2SO3' was
prepared initially with aniline in great excess: 0.21 M aniline and 0 .08 M
CH2(OH)(S03Na) was used. In this situation, when the stock C6H5NHCH2S03' solution
is diluted, residual aniline will be present. I f it is assumed that the CH2(OH)(S03Na)
reacts quantitatively, as is found in ^H N M R spectroscopy, then the concentration of
residual aniline present can be calculated.
Plots of absorbance against fime at 350 nm were obtained for the reacfion of 2.0 x 10'"
to 0 .011 M C6H5NHCH2SO3" in the presence of 3.3 x 10'^ to 0 .018 M residual aniline at
25 °C, pH 5.1. First order plots were obtained and fitted using a single exponenfial
equation to obtain kobs I s" values (Table 5 .28) .
Table 5.28: kobs I s' values for the reacfion of C6H5NHCH2SO3" and 4 x 10"^ M
aqueous iodine solution in the presence of residual aniline, 25 °C, pH 5.1
[C6H5NHCH2S031/M [residual C6H5NH2]/M kobs 1 S
2 .0 X 10'^ 3.3 X 10"^ 0 .028 ± 3 X 10"^
4 .0 X 10-^ 6.5 X 10'^ 0.063 ± 1 X 10'^
8.0 X 10"^ 0.013 0 .154 + 2 X 10"^
0.011 0 .018 0 .259 + 5 X 10-^
195
These rate constants agree reasonably with the results obtained for the reaction of
aniline with aqueous iodine solution (Table 5.25) which leads to the conclusion that this
is in fact the reaction observed, at least primarily, rather than the reaction of aqueous
iodine solution with bisulfite / sulfite ions liberated from the decomposition of
C6H5NHCH2SO3'. Therefore it is not possible to follow the decomposition of
C 6 H 5 N H C H 2 S 0 3 " using this method.
196
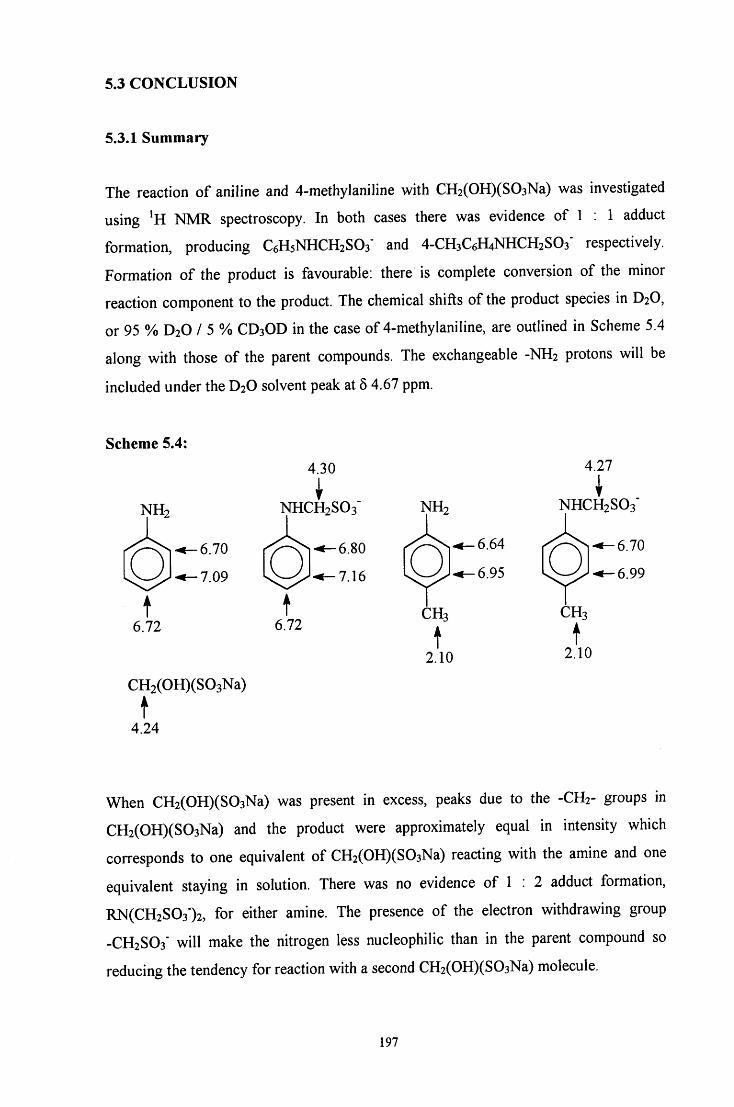
5.3 CONCLUSION
5.3.1 Summary
The reaction of aniline and 4-methylaniline with CH2(OH)(S03Na) was investigated
using NMR spectroscopy. In both cases there was evidence of 1 : 1 adduct
formation, producing C6H5NHCH2SO3" and 4-CH3C6H4NHCH2S03" respectively.
Formation of the product is favourable: there is complete conversion of the minor
reaction component to the product. The chemical shifts of the product species in D2O,
or 95 % D2O / 5 % CD3OD in the case of 4-methylaniline, are outlined in Scheme 5.4
along with those of the parent compounds. The exchangeable -NH2 protons will be
included under the D2O solvent peak at 5 4.67 ppm.
Scheme 5.4:
NH2
6.70
7.09
4.30
NHCH2SO3'
6.80
7.16 o
6.64
6.95
4.27
NHCHsSGs"
6.70
6.99
CH3
t 2.10
CH3
2.10
CH2(OH)(S03Na)
t 4.24
When CH2(OH)(S03Na) was present in excess, peaks due to the -CH2- groups in
CH2(OH)(S03Na) and the product were approximately equal in intensity which
corresponds to one equivalent of CH2(OH)(S03Na) reacting with the amine and one
equivalent staying in solution. There was no evidence of 1 : 2 adduct formation,
RN(CH2S03")2, for either amine. The presence of the electron withdrawing group
-CH2SO3' will make the nitrogen less nucleophilic than in the parent compound so
reducing the tendency for reaction with a second CH2(OH)(S03Na) molecule.
197
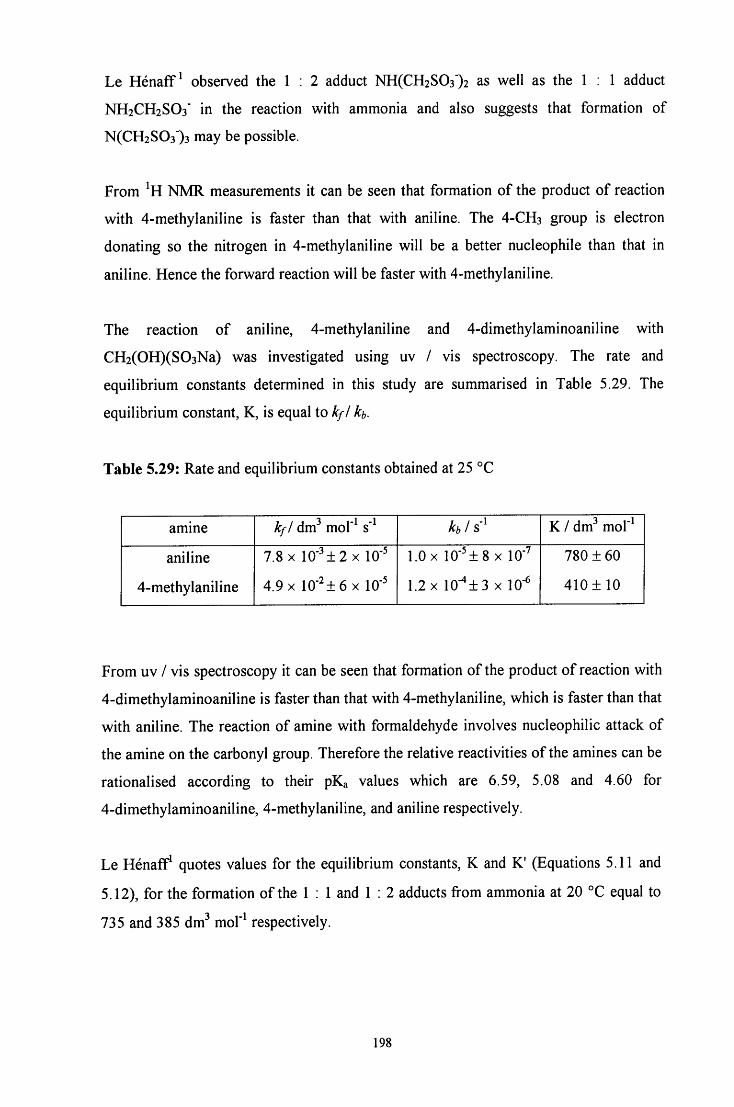
Le HenafF^ observed the 1 : 2 adduct N H ( C H 2 S 0 3 ' ) 2 as well as the 1 : 1 adduct
NH2CH2SO3" in the reaction with ammonia and also suggests that formation of
N(CH2S03")3 may be possible.
From NMR measurements it can be seen that formation of the product of reaction
with 4-methylaniline is faster than that with aniline. The 4-CH3 group is electron
donating so the nitrogen in 4-methylaniline will be a better nucleophile than that in
aniline. Hence the forward reaction will be faster with 4-methylaniline.
The reaction of aniline, 4-methylaniline and 4-dimethylaminoaniline with
CH2(OH)(S03Na) was investigated using uv / vis spectroscopy. The rate and
equilibrium constants determined in this study are summarised in Table 5.29. The
equilibrium constant, K, is equal to kfl kb.
Table 5.29: Rate and equilibrium constants obtained at 25 °C
amine kfl dvcf mol'^ s' h 1 s' K / dm^ mol"^
aniline
4-methylaniline
7.8 X 10'^±2 X 10'
4.9 X 10 '^±6x 10"
1.0 X 10"^±8 X 10"'
1.2 X 10"^±3 X 10'
780 ± 60
410± 10
From uv / vis spectroscopy it can be seen that formation of the product of reaction with
4-dimethylaminoaniline is faster than that with 4-methylaniline, which is faster than that
with aniline. The reaction of amine with formaldehyde involves nucleophilic attack of
the amine on the carbonyl group. Therefore the relative reactivities of the amines can be
rationalised according to their pKa values which are 6.59, 5.08 and 4.60 for
4-dimethylaminoaniline, 4-methylaniline, and aniline respectively.
Le Henaff^ quotes values for the equilibrium constants, K and K' (Equations 5.11 and
5.12), for the formation of the 1 : 1 and 1 : 2 adducts from ammonia at 20 °C equal to
735 and 385 dm mol" respectively.
198
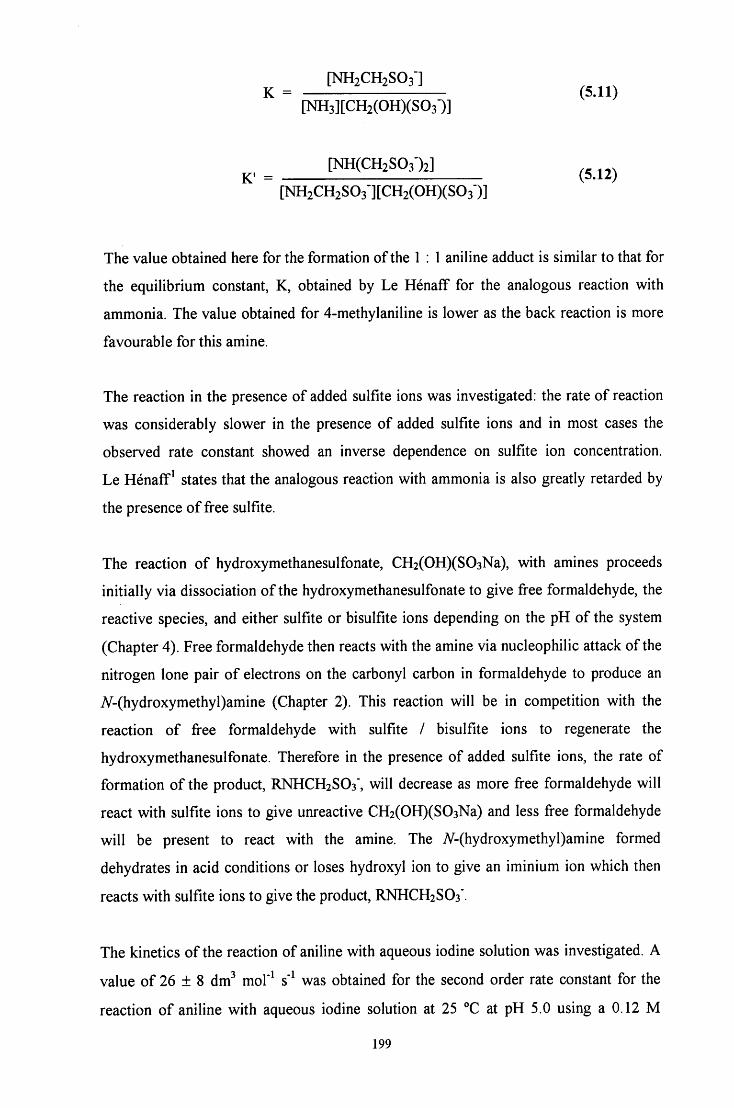
[NH2CH2S03"]
[NH3][CH2(OH)(S03-)]
[NH2CH2S03-][CH2(OH)(S03-)]
The value obtained here for the formation of the 1 : 1 aniline adduct is similar to that for
the equilibrium constant, K, obtained by Le Henaff for the analogous reaction with
ammonia. The value obtained for 4-methylaniline is lower as the back reaction is more
favourable for this amine.
The reaction in the presence of added sulfite ions was investigated: the rate of reaction
was considerably slower in the presence of added sulfite ions and in most cases the
observed rate constant showed an inverse dependence on sulfite ion concentration.
Le Henaff^ states that the analogous reaction with ammonia is also greatly retarded by
the presence of free sulfite.
The reaction of hydroxymethanesulfonate, CH2(OH)(S03Na), with amines proceeds
initially via dissociation of the hydroxymethanesulfonate to give free formaldehyde, the
reactive species, and either sulfite or bisulfite ions depending on the pH of the system
(Chapter 4). Free formaldehyde then reacts with the amine via nucleophilic attack of the
nitrogen lone pair of electrons on the carbonyl carbon in formaldehyde to produce an
7V-(hydroxymethyl)amine (Chapter 2). This reaction will be in competition with the
reaction of free formaldehyde with sulfite / bisulfite ions to regenerate the
hydroxymethanesulfonate. Therefore in the presence of added sulfite ions, the rate of
formation of the product, RNHCH2SO3", will decrease as more free formaldehyde will
react with sulfite ions to give unreactive CH2(OH)(S03Na) and less free formaldehyde
will be present to react with the amine. The 7V-(hydroxymethyl)amine formed
dehydrates in acid conditions or loses hydroxyl ion to give an iminium ion which then
reacts with sulfite ions to give the product, RNHCH2SO3'.
The kinetics of the reaction of aniline with aqueous iodine solution was investigated. A
value of 26 ± 8 dm^ mol'^ s" was obtained for the second order rate constant for the
reaction of aniline with aqueous iodine solution at 25 °C at pH 5.0 using a 0.12 M
199
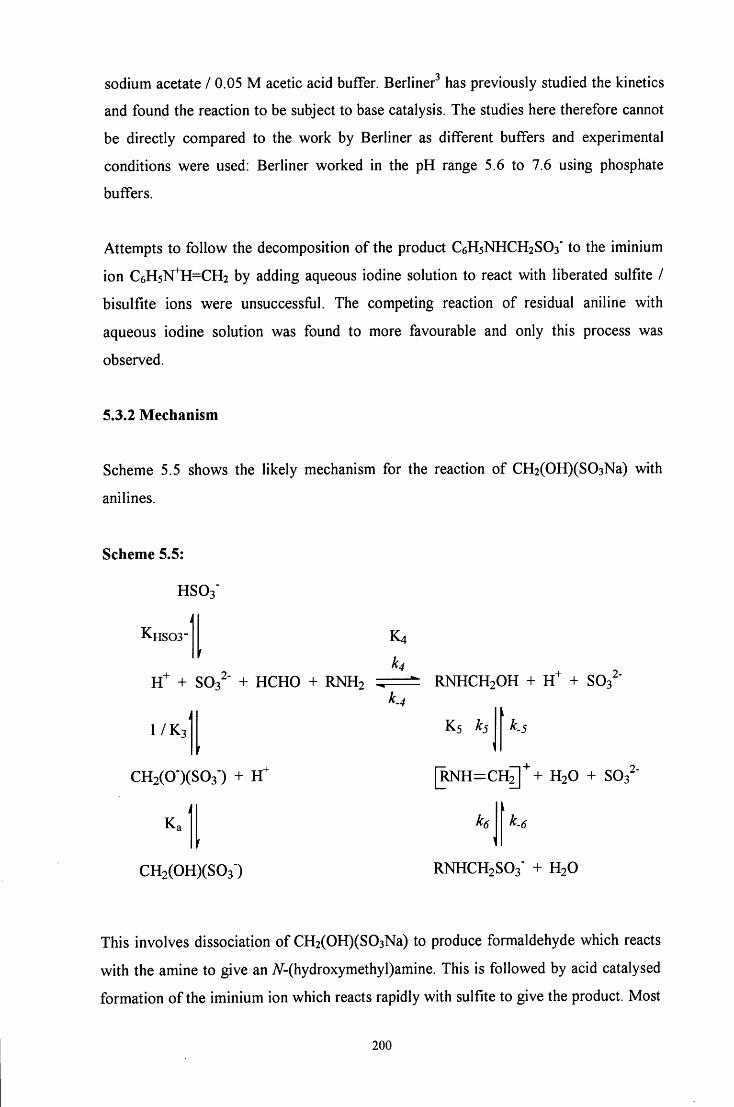
sodium acetate / 0.05 M acetic acid buffer. Berliner^ has previously studied the kinetics
and found the reaction to be subject to base catalysis. The studies here therefore cannot
be directly compared to the work by Berliner as different buffers and experimental
conditions were used: Berliner worked in the pH range 5.6 to 7.6 using phosphate
buffers.
Attempts to follow the decomposition of the product C6H5NHCH2SO3" to the iminium
ion C6H5N^=CH2 by adding aqueous iodine solution to react with liberated sulfite /
bisulfite ions were unsuccessful. The competing reaction of residual aniline with
aqueous iodine solution was found to more favourable and only this process was
observed.
5.3.2 Mechanism
Scheme 5.5 shows the likely mechanism for the reaction of CH2(OH)(S03Na) with
anilines.
Scheme 5.5:
HSOs"
4 KHSOS-
+ S03^" + HCHO + RNH2
l / K .
CH2(0-)(S03-) +
ill
Ka
CH2(OH)(S03")
K4
k4
k.. RNHCH2OH + + SOB^'
K5 ks k.'
R N H = C H ^ ' ' + H2O + SOs '
k6
RNHCH2SO3" + H2O
This involves dissociation of CH2(OH)(S03Na) to produce formaldehyde which reacts
with the amine to give an A^-(hydroxymethyl)amine. This is followed by acid catalysed
formation of the iminium ion which reacts rapidly with sulfite to give the product. Most
200
of the kinetic measurements have been made with sufficiently high concentrations of
CH2(OH)(S03Na) to ensure that the reaction goes largely to completion. Hence the
forward rate term will dominate the observed kinetics. The rate constants obtained show
an inverse dependence on added sulfite concentration. They also show a very weak
dependence on pH: the results in Table 5.20 show that a change of four pH units causes
a less than three-fold change in the value of the rate constant.
The results in Chapter 4 show that under the conditions used here the decomposition of
CH2(OH)(S03Na) to give free formaldehyde, HCHO, will be a rapid equilibrium. The
rate constant for reaction of HCHO with sulfite ions is around^ 1 x 10^ mol"^ dm^ s'V _ n 1
The rate constant for formaldehyde hydration is approximately 10 s' and the rate
constant for reaction with aniline is 1.5 x 10" dm^ mol'^ s' (Chapter 2). Therefore using
an aniline concentration of 10" mol dm" , the reaction of HCHO with water or with
amine will not compete with the reaction with sulfite when [803^"] > 10' dm^ mofV
Therefore HCHO is effectively a steady state intermediate in equilibrium with
CH2 (OH ) (S03) .
It is expected that the reaction of the iminium ion [RNH=CH2] with SO3 " is rapid,
probably diffusion controlled, as iminium ions are generally unstable. The iminium ion
has the potential of also reacting with aqueous amine or water present in the system
(Chapter 1, Section 1.3.4) but these reactions will not be competing here as the reaction
with sulfite is so rapid. For comparison, Eldin and Jencks^ have studied the reaction of
iminium ions with RS' as the nucleophile and state the reaction is diffusion controlled
with a rate constant of 10^ dm^ mol"^ s'\
Therefore the rate determining step in Scheme 5.5 is likely to be either the reaction of
HCHO with RNH2 (Case 1) or dehydration of the 7V-(hydroxymethyl)amine
RNHCH2OH to give the iminium ion (Case 2). Both of these cases will be considered in
turn.
Case 1: The reaction of HCHO with RNH2 is rate limiting
In this case, the assumption is that k4 is rate limiting. Therefore the overall rate equation
is given by Equation 5.13.
201
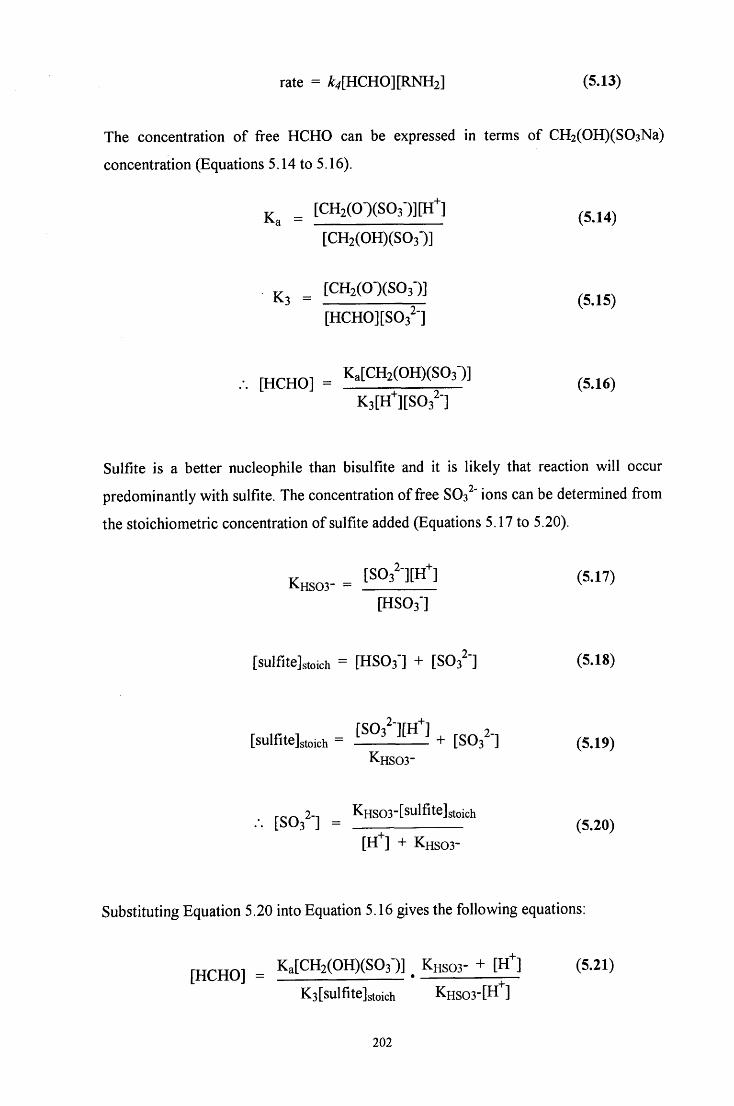
rate = A:^[HCH0][RNH2] (5.13)
The concentration of free HCHO can be expressed in terms of CH2(OH)(S03Na)
concentration (Equations 5.14 to 5.16).
^ [CH2(0-)(S03-)][H^]
[CH2(OH)(S03")]
_ [CH2(0XSO,)] K.3 - _ (5.15)
[HCH0][S03^"]
. p ^ ^ ^ ^ ^ K.[CH2(OH)(S03-)] ^^^^^
K3[H*][S03'-]
Sulfite is a better nucleophile than bisulfite and it is likely that reaction will occur
predominantly with sulfite. The concentration of free SOa ' ions can be determined from
the stoichiometric concentration of sulfite added (Equations 5 .17 to 5 .20).
KHSO3- = [S03^-][H^] (5.17)
[HSO3"]
[sulfitelstoich = [HSO3"] + [S03^-] (5.18)
2- + [sulfiteJstoich = ^^^^ ^ + [SOB^-] (5.19)
K H S 0 3 -
ror^ 2-n KHS03-[sulfite]stoich [SO3 ] = (5.20)
[ H i + KHSO3-
Substituting Equation 5.20 into Equation 5.16 gives the following equations:
Ka[CH2(OH)(S03-)] KHSO3- + [ H i (5.21) [HCHO] =
K3[sulfite]stoich KHSO3-[H"^]
202
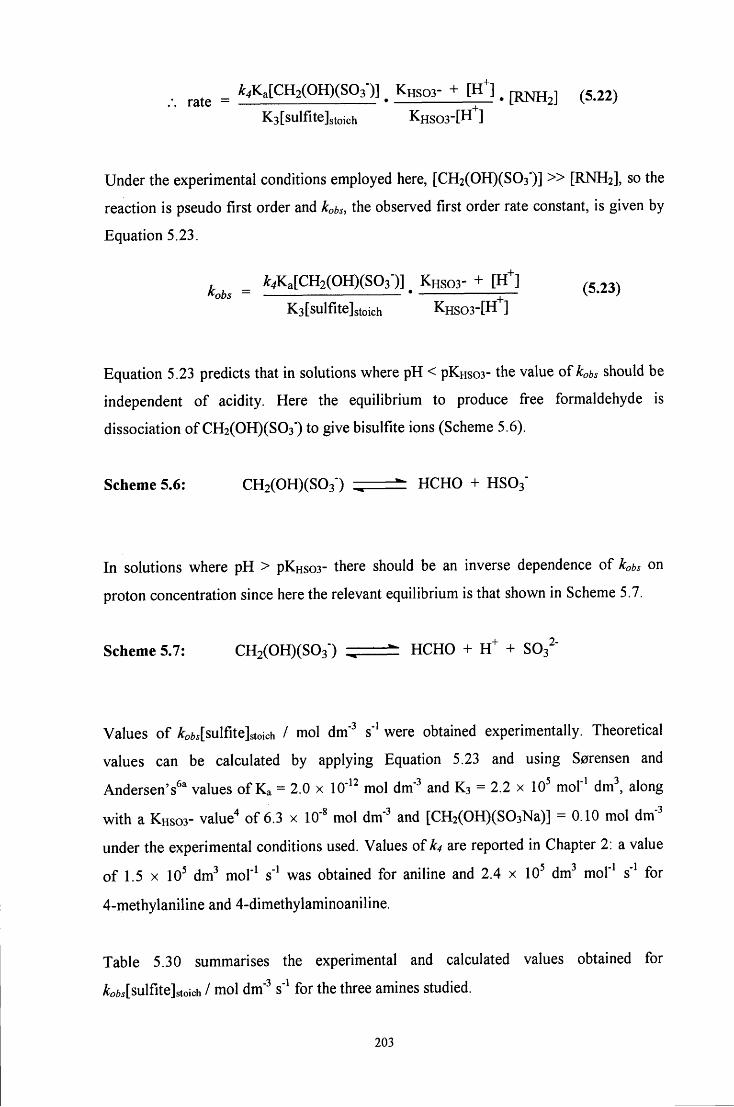
= ^4Ka[CH2(OH)(S03-)] ^ KHSOB- + [ H ] , ^ ^ ^ ^ (5 22)
K3[sulfite]stoich KHSO3-[H^]
Under the experimental conditions employed here, [CH2(OH)(S03')] » [RNH2], so the
reaction is pseudo first order and kobs, the observed first order rate constant, is given by
Equation 5.23.
^^^^ ^ ^,Ka[CH2(OH)(S03-)] ^ KHSO3- + [ H i (5 23)
K3[sulfite]stoich K H S O 3 - [ H 1
Equation 5.23 predicts that in solutions where pH < PKhsos- the value of kobs should be
independent of acidity. Here the equilibrium to produce free formaldehyde is
dissociation of CH2(OH)(S03") to give bisulfite ions (Scheme 5.6).
Scheme 5.6: CH2(OH)(S03") ^ HCHO + HSO3"
In solutions where pH > PKhso3- there should be an inverse dependence of kobs on
proton concentration since here the relevant equilibrium is that shown in Scheme 5.7.
Scheme 5.7: CH2(OH)(S03") , HCHO + H^ + SOB^"
Values of ^ofci[sulfite]stoich / mol dm" s' were obtained experimentally. Theoretical
values can be calculated by applying Equation 5.23 and using S0rensen and
Andersen's^^ values of Ka = 2.0 x 10" ^ mol dm' and K3 = 2.2 x 10^ mol' dm^ along
with a Khso3- value^ of 6.3 x 10" mol dm" and [CH2(OH)(S03Na)] = 0.10 mol dm"
under the experimental conditions used. Values of k4 are reported in Chapter 2: a value
of 1.5 X 10^ dm^ mol" s" was obtained for aniline and 2.4 x 10^ dm" mol" s' for
4-methylaniline and 4-dimethylaminoaniline.
Table 5.30 summarises the experimental and calculated values obtained for
^ofti[sulfite]stoich / mol dm" s' for the three amines studied.
203
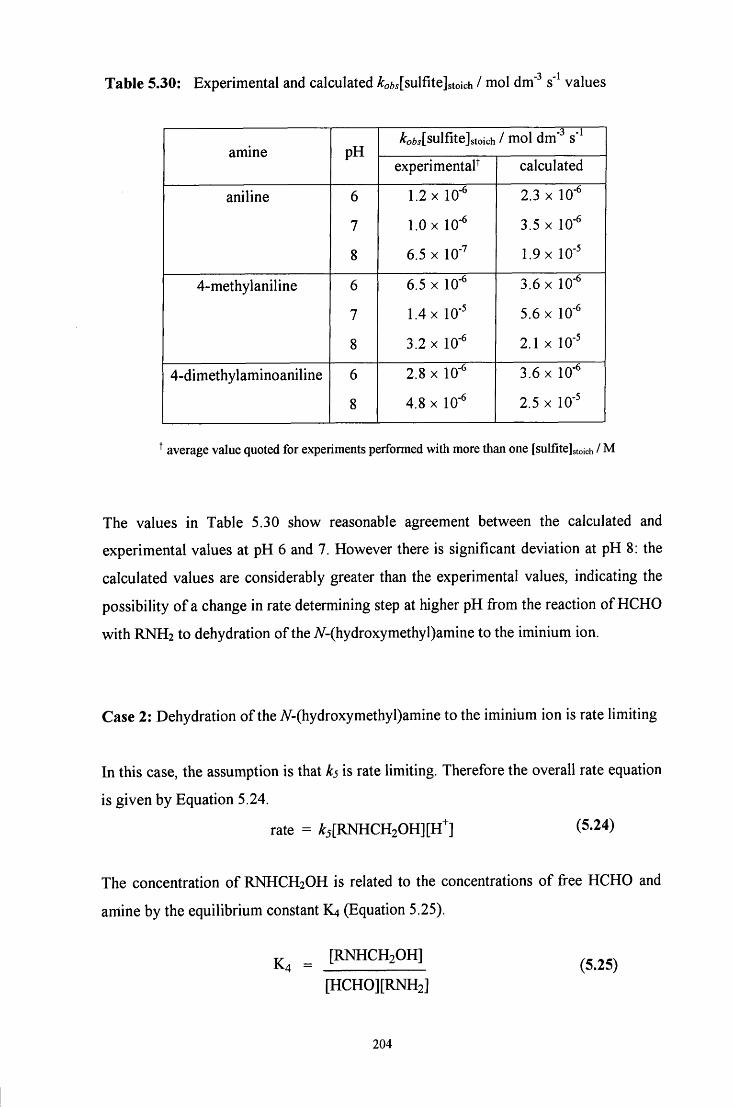
Table 5.30; Experimental and calculated ^o6i[sulfite]stoich / mol dm" s' values
amine pH ^oi>5[sulfite]stoich / mol dm" s*
amine pH experimental calculated
aniline 6 1.2 X 10" 2.3 X 10"
7 1.0 X 10- 3.5 X 10"
8 6.5 X 10" 1.9 X 10-
4-methylaniline 6 6.5 X 10- 3.6 X 10"
7 1.4 X 10" 5.6 X 10-
8 3.2 X 10" 2.1 X 10"
4-dimethylaminoaniline 6 2.8 X 10' 3.6 X 10-
8 4.8 X 10' 2.5 X 10"
^ average value quoted for experiments performed with more than one [sulfitejstoich / M
The values in Table 5.30 show reasonable agreement between the calculated and
experimental values at pH 6 and 7. However there is significant deviation at pH 8: the
calculated values are considerably greater than the experimental values, indicating the
possibility of a change in rate determining step at higher pH from the reaction of HCHO
with RNH2 to dehydration of the 7V-(hydroxymethyl)amine to the iminium ion.
Case 2: Dehydration of the A^-(hydroxymethyl)amine to the iminium ion is rate limiting
In this case, the assumption is that is rate limiting. Therefore the overall rate equation
is given by Equation 5.24.
rate = ^5[RNHCH20H][H^] (5.24)
The concentration of RNHCH2OH is related to the concentrations of free HCHO and
amine by the equilibrium constant K4 (Equation 5.25).
^ [RNHCH2OH] ^4 =
[HCH0][RNH2] (5.25)
204
Substituting this into Equation 5.21 gives:
rate = ^5K4[HCHO][RNH2][H^] (5.26)
Substituting Equation 5.24 into Equation 5.26 gives:
^ ^ ^ ^5K4Ka[CH2(OH)(S03-)] ^ KHSO3- + m . fRNH^j (5.27)
KB[sulfite]stoich KHSO3-
Under the experimental conditions employed here, [CH2(OH)(S03")] » [RNH2], so the
reaction is pseudo first order and kobs, the observed first order rate constant, is given by
Equation 5.28.
^ ^ ^ ^5K4Ka[CH2(OH)(SOB')] ^ KHSOB- + [ h 1 ^^^^^^
KB[sulfite]stoich KHSO3-
K4 values were determined in Chapter 2: approximately 6x10"* dm mol' is obtained
for all three amines studied here. Using this value and S0rensen and Andersen's ^ values
of Ka = 2.0 X 10" ^ mol dm" and K3 = 2.2 x 10 mol* dm^ along with a Khso3- value^ of
6.3 X 10' mol dm" and [CH2(OH)(S03Na)] = 0.10 mol dm" an average value of 5
equal to 3.0 x 10^ dm mol'' s' can be calculated using the experimental
A:ofci[sulfite]stoich / mol dm' s" values in Table 5.30. The value obtained for ks is not
unreasonable given that Kallen^ reports a value of 1.4 x 10 dm" mol' s' for the acid
catalysed reaction of the A'-(hydroxymethyl)amine formed from cysteine and
formaldehyde.
To summarise, at low and neutral pH the rate determining step is likely to be the
reaction of HCHO with RNH2. At higher pH the rate determining step becomes
dehydration of the A -(hydroxymethyl)amine to the iminium ion: this is an acid
catalysed reaction and therefore at high pH can become rate limiting. At pH values
where pH > pKhso3-, the steps preceding ks show an inverse dependence on proton
concentration. Therefore when ks, the acid catalysed step, becomes rate determining the
experimentally observed rate constant, kobs, is predicted to remain independent of
acidity.
205
5.4 E X P E R I M E N T A L
5.4.1 NMR experiments
The reactions of aniline and of 4-methylaniline with CH2(OH)(S03Na) were followed
using ^H NMR spectroscopy. Initially the spectrum of 0.20 to 0.23 M amine alone was
obtained, then the spectrum in the presence of equimolar CH2(OH)(S03Na) (0.2 M
each), then with each reagent in excess (0.2 M amine with 0.4 or 0.1 M
CH2(OH)(S03Na)). The solutions were made immediately prior to use. The amine was
placed in the NMR tube: neat aniline was used, however 4-methylaniline is a solid
which is not readily soluble in aqueous solution therefore a stock solution in methyl-d3
alcohol-d, CD3OD, was prepared. 1 cm^ D2O was then added to the NMR tube followed
by the CH2(OH)(S03Na) which was added at the NMR machine side. The ^H NMR
spectrum of 0.20 M CH2(OH)(S03Na) in D2O was also obtained for comparison.
Spectra were recorded immediately (3 to 5 minutes) after mixing, then 30 minutes,
1 hour and 2 or 5 hours after mixing and continued until there was no fiirther change in
the spectrum. The time of mixing refers to the time at which CH2(OH)(S03Na) was
added to the NMR tube. The time of each spectrum was taken as the time when the
spectrometer started to acquire the spectrum.
4-Methylaniline is not readily soluble in aqueous solution at the concentrations
required. Therefore the solubility in different solvents was tested. 4-Methylaniline was
found to dissolve in acetonitrile but when water was added the solution was not
miscible. 4-Methylaniline was also found to dissolve readily in methanol. Therefore a
stock solution in CD3OD was prepared. A 5 % CD3OD / 95 % water by volume solvent
was used for the ^H NMR: a high D2O content was used so that the spectra could be
compared with those of aniline in D2O and with the uv / vis spectra carried out in
aqueous solution. The ^H NMR spectrum of CHD2OD is characterised by a quintet at
5 3.35 ppm. However it was not visible in any spectra as it was present in too small a
proportion.
When D2O was added to the stock solution of 4-methylaniline in CD3OD, oil globules
formed and the solution froze easily. However when heated under the tap the solution
206
became homogeneous with no oil globules. The solution was also heated under the tap
i f the solution froze between recording spectra.
^H NMR spectra were recorded using a 200 MHz Varian Mercury - 200 spectrometer.
The 5 4.67 ppm singlet due to residual protons in the deuterated solvent, D2O, was used
for locking purposes and as the reference peak for all spectra. Chemical shifts are
quoted to 2 decimal places. Coupling constants are given where the multiplicity is
greater than a singlet and are quoted to the nearest whole number.
It was not possible to follow the reaction of 4-dimethylaminoaniline using ^H NMR
spectroscopy in a solvent composed mainly of D2O: 4-dimethylaminoaniline is not
soluble in aqueous solution. Although soluble in acetonitrile, when a stock solution was
prepared in d3-acetonitrile, CD3CN, and a 5 % CD3CNI 95 % water by volume solvent
used for the NMR, the peaks were broad and very low in intensity.
4-Dimethylaminoaniline was also found to be fairly soluble in methanol but when a
stock solution was made in CD3OD and a 5 % CD3OD / 95 % water by volume solvent
used in NMR, again the peaks were broad and very low in intensity.
5.4.2 Uv / vis experiments
Absorbance against wavelength spectra were obtained for the reaction of 1.0 x 10" M
aniline, 4-methylaniline and 4-dimethylaminoaniline with 2.0 x 10'" to 0.10 M
CH2(OH)(S03Na). 4-Methylaniline is soluble in aqueous solution at the concentrations
used: lower concentrations were used than for the ^H NMR experiments where a 5 %
CD3OD195% D2O by volume solvent system was required. 4-Dimethylaminoaniline is
not readily soluble in water therefore the e values calculated may be lower than the true
values i f the actual concentration of 4-dimethylaminoaniline is lower than expected due
to poor solubility.
Spectra were obtained using a UV-2101 PC Shimadzu Corporation or Perkin - Elmer
Lambda 2 uv / vis spectrometer at 25 °C with 1 cm stoppered quartz cuvettes, taking
scans every 5 or 10 minutes for up to 3 or 4 hours using a scan speed of 480 nm min'V
The cuvettes were left in the spectrometer for at least 10 minutes prior to use to allow
207
the temperature to equilibrate to 25 °C. Addition of the amine solution was used to
initiate the reaction. Extinction coefficients are quoted to 2 or 3 significant figures and
were calculated using only one spectrum in most cases.
Plots of absorbance against time were obtained for the reaction of 5.0 x 10' or
1.0 x 10- M amine with 2.0 x lO" to 0.10 M aqueous CH2(OH)(S03Na) at 25 °C The
effect of the presence of added sulfite ions in the system was investigated: the reaction
of 1.0 X 10"^M amine with 0.10 M aqueous CH2(OH)(S03Na) solution in the presence
of 1.0 X 10" to 0.010 M aqueous sodium sulfite solufion was studied at 25 °C.
Plots were recorded using a Perkin - Elmer Lambda 2 or 12 uv / vis spectrometer at
25 °C with 1 cm stoppered quartz cuvettes. The time interval ranged from 30 seconds to
3Y2 minutes and the overall reaction time from V/2 to ITA hours depending on the pH
and concentrations used. The cuvettes were left in the spectrometer for at least 10
minutes prior to use to allow the temperature to equilibrate at 25 °C. Addition of the
amine solution was used to initiate the reaction. The formation of the product was
followed at 245 nm when using aniline, 240 nm for 4-methylaniline and 251 or 260 nm
for 4-dimethylaminoaniline. 4-Dimethylaminoaniline is not readily soluble in aqueous
solution therefore a stock solution in acetonitrile or dioxan was prepared, giving a final
solvent composition of 2 % acetonitrile or dioxan / 98 % water by volume. The reaction
in 2 % acetonitrile was performed twice: excellent agreement in the results was
obtained.
Figure 5.8 includes results from three experiments carried out under identical
conditions. As a control, the reaction with 0.10 M CH2(OH)(S03Na) was performed in
all three experiments and the reaction with 2.0 x 10' M in two experiments. Excellent
agreement was obtained: the rate constants for these two concentrations are quoted as an
average.
The spectrum of CH2(OH)(S03Na) does not show any significant absorbance in the
uv / vis spectrum. However sulfite ions do absorb in this region: spectra of 0.01, 0.05
and 0.10 M aqueous sodium sulfite solution were obtained and showed high absorbance
around 250 nm and to shorter wavelength. For example, the extinction coefficient of
sulfite ions at 245 nm was found to be 50 dm^ mol"^ cm'\ Therefore the appropriate
208
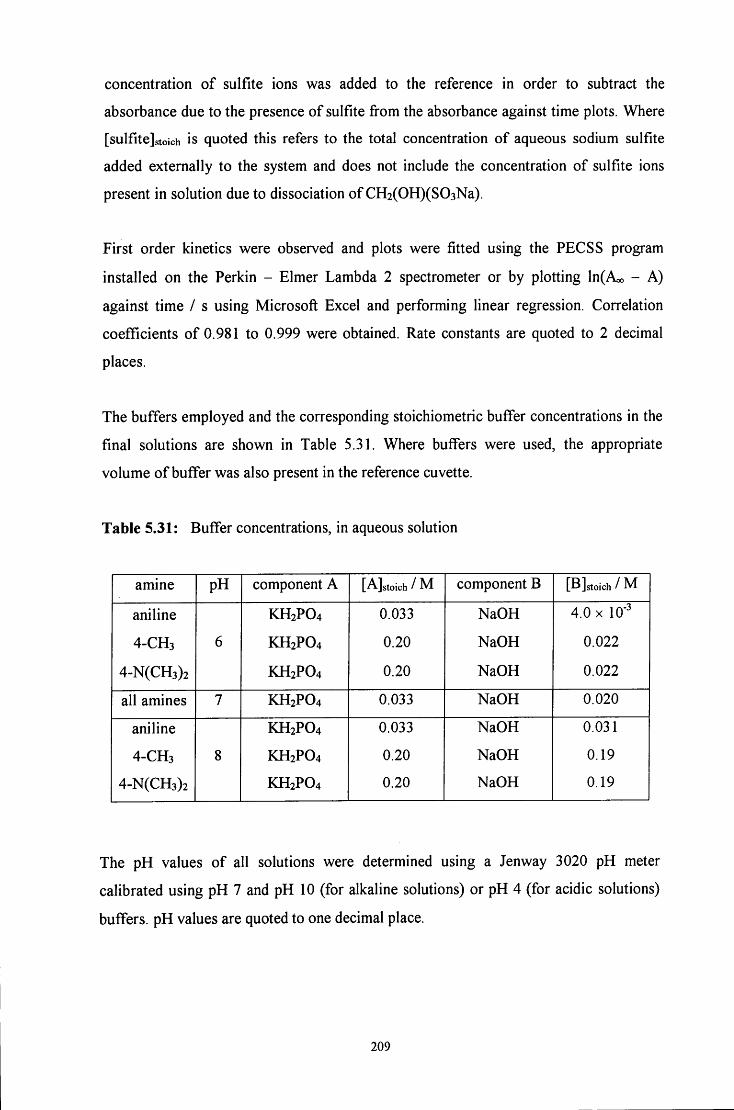
concentration of sulfite ions was added to the reference in order to subtract the
absorbance due to the presence of sulfite from the absorbance against time plots. Where
[sulfite]stoich is quoted this refers to the total concentration of aqueous sodium sulfite
added externally to the system and does not include the concentration of sulfite ions
present in solution due to dissociation of CH2(OH)(S03Na).
First order kinetics were observed and plots were fitted using the PECSS program
installed on the Perkin - Elmer Lambda 2 spectrometer or by plotting ln(Aoo - A)
against time / s using Microsoft Excel and performing linear regression. Correlation
coefficients of 0.981 to 0.999 were obtained. Rate constants are quoted to 2 decimal
places.
The buffers employed and the corresponding stoichiometric buffer concentrations in the
final solutions are shown in Table 5.31. Where buffers were used, the appropriate
volume of buffer was also present in the reference cuvette.
Table 5.31: Buffer concentrations, in aqueous solution
amine pH component A [A]stoich / M component B [B]stoich / M
aniline KH2PO4 0.033 NaOH 4.0 X 10"
4-CH3 6 KH2PO4 0.20 NaOH 0.022
4-N(CH3)2 KH2PO4 0.20 NaOH 0.022
all amines 7 KH2PO4 0.033 NaOH 0.020
aniline KH2PO4 0.033 NaOH 0.031
4-CH3 8 KH2PO4 0.20 NaOH 0.19
4-N(CH3)2 KH2PO4 0.20 NaOH 0.19
The pH values of all solutions were determined using a Jenway 3020 pH meter
calibrated using pH 7 and pH 10 (for alkaline solutions) or pH 4 (for acidic solutions)
buffers. pH values are quoted to one decimal place.
209
5.4.3 Decomposition of C6H5NHCH2SO3
The reaction of 1.1 x 10" to 0.030 M aniline with 4 x 10 M aqueous iodine solution at
pH 5.0 was investigated. The reaction of 5.0 x 10" to 0.024 M C6H5NHCH2SO3" with
4 X 10" M aqueous iodine solution in the pH range 4.1 to 5.2 was investigated. The
reaction in the presence of residual iodine was also studied.
Plots of absorbance against time were obtained at 350 nm using an Applied
Photophysics DX.17MV BioSequential Stopped - flow ASVD Spectrometer with a
1 cm path length at 24.8-25.1 °C. Five or ten averages were obtained, each the average
of three runs of 50 to 200 seconds depending on the pH and the concentration of
C6H5NHCH2SO3" or aniline used. The appropriate aqueous C6H5NHCH2SO3" or aniline
solution was placed in one syringe and the aqueous iodine solution with the appropriate
buffer solution in the other.
In the reaction of C6H5NHCH2SO3', it was the intention to follow the zero order
disappearance of the aqueous iodine solution but first order disappearance was actually
observed. The averages were fitted using the single exponential equation on the
ISX.17MV program installed on the spectrometer. All plots showed good first order fits.
Rate constants are quoted to three decimal places. As aqueous iodine solution has an
extinction coefficient of 13400 ± 300 mol'^ dm^ cm" at 350 nm, the initial absorbances
at the concentrations used were above the limit of the instrument, therefore when the
plots were fitted the initial data was not included. Data with an absorbance above 2
absorbance units was not included: fitting was started from the first 1 to 25 seconds of
the plot, depending on the pH and the concentration of C6H5NHCH2SO3" or aniline
used.
The C6H5NHCH2SO3" solutions were prepared by mixing 0.21 M aniline and 0.20 M
CH2(OH)(S03Na), or 0.08 M CH2(OH)(S03Na) for the experiment in the presence of
residual aniline, in water and allowing the solution to stand for 19 to 20 hours prior to
use. The solution was then diluted to the appropriate concentration. C6H5NHCH2SO3'
concentrations are quoted given the assumption that all the CH2(OH)(S03Na) reacted to
form the product. The solution was left for a long period of time to ensure reaction
completion.
210
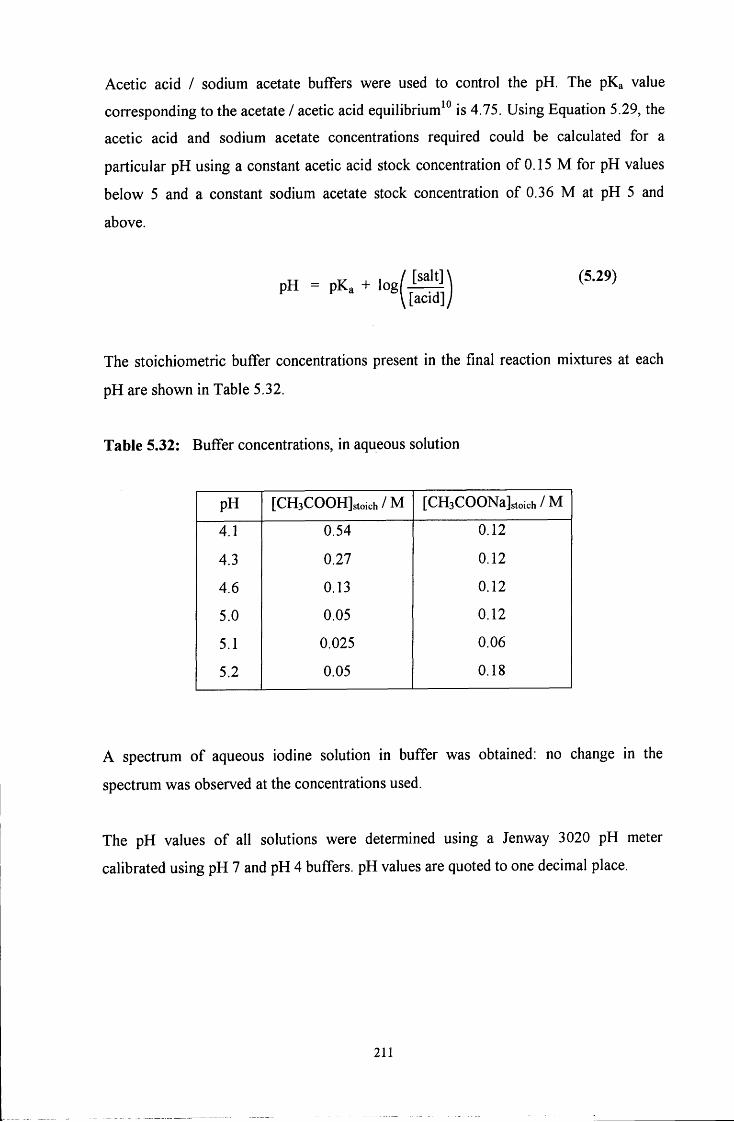
Acetic acid / sodium acetate buffers were used to control the pH. The pKa value
corresponding to the acetate / acetic acid equilibrium^^ is 4.75. Using Equation 5.29, the
acetic acid and sodium acetate concentrations required could be calculated for a
particular pH using a constant acetic acid stock concentration of 0.15 M for pH values
below 5 and a constant sodium acetate stock concentration of 0.36 M at pH 5 and
above.
^ , / [salt]\ pH = pKa + log i — i
\[acid]/ (5.29)
The stoichiometric buffer concentrations present in the final reaction mixtures at each
pH are shown in Table 5.32.
Table 5.32: Buffer concentrations, in aqueous solution
pH [CH3COOH]^oich/M [CH3COONa]stoich/M
4.1 0.54 0.12
4.3 0.27 0.12
4.6 0.13 0.12
5.0 0.05 0.12
5.1 0.025 0.06
5.2 0.05 0.18
A spectrum of aqueous iodine solution in buffer was obtained: no change in the
spectrum was observed at the concentrations used.
The pH values of all solutions were determined using a Jenway 3020 pH meter
calibrated using pH 7 and pH 4 buffers. pH values are quoted to one decimal place.
211
5.5 R E F E R E N C E S
1. P. Le Henaff, Compt. Rend. Acad. Set, 1963, 256, 3090
2. D. D. Perrin, 'Dissociation constants of organic bases in aqueous solution',
Butterworths, London, 1965 and 1972 Supplement
3. E. Berliner, J. Am. Chem. Soc, 1950, 72, 4003
4. (a) E. Hayon, A. Treinin and J. Wilf, J. Am. Chem. Soc, 1972, 94, 47; (b) H. V.
Tartar an(^H. H. Garretson, J. Am. Chem. Soc, 1941, 63, 808
5. J. March, 'Advanced Organic Chemistry', Wiley - Interscience, New York, 1992,
4th Ed., pp. 501
6. (a) P. E. Sorensen and V. S. Andersen, Acta Chem. Scand, 1970, 24, 1301; (b) S. D.
Boyce and M. R. Hoffmann, J. Phys. Chem., 1984, 88, 4740
7. R. P. Bell and P. G. Evans, Proc. Roy. Soc. London, 1966, 291A, 297
8. (a) S. Eldin and W. P. Jencks, J. Am. Chem. Soc, 1995, 117, 4851; (b) S. Eldin, J.
A. Digits, S.-T. Huang and W. P. Jencks, ibid, 6631
9. R. G. Kallen, J. Am. Chem. Soc, 1971, 93, 6236
10. 'CRC Handbook of Chemistry and Physics', CRC Press, Florida, 1982, 63rd Ed.,
D171
212
CHAPTER 6
Reaction of hydroxymethanesulfonate,
CHzCOHXSOjNa), with benzylamine
and benzylamine derivatives
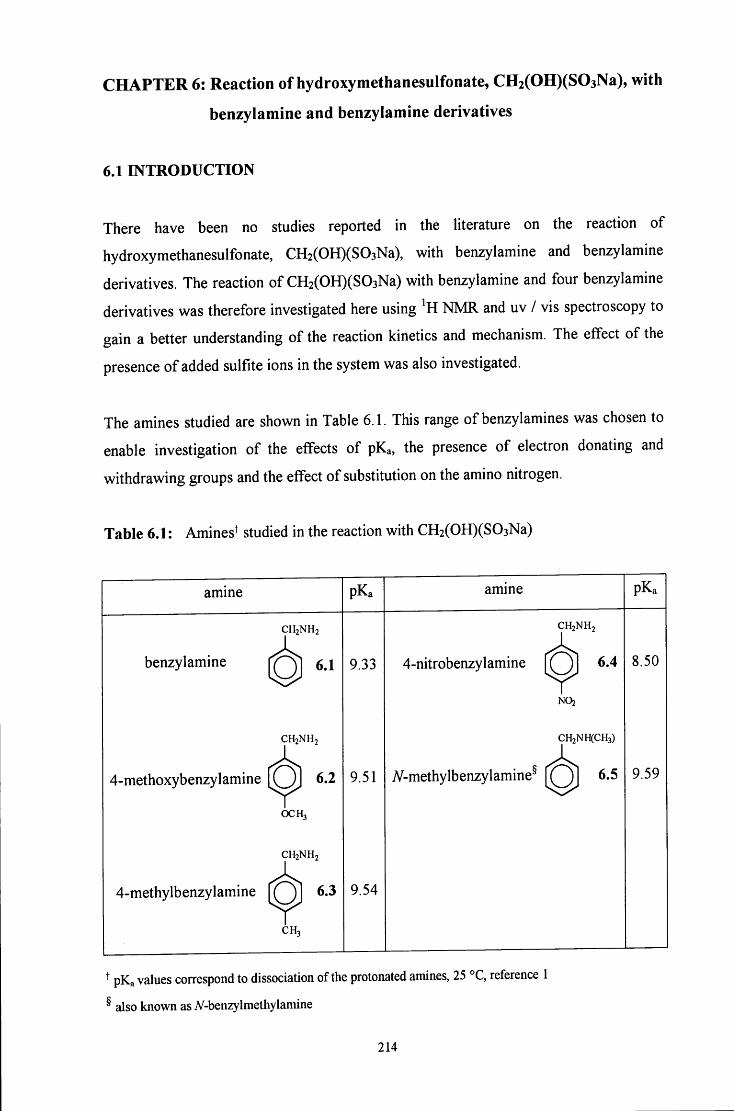
C H A P T E R 6: Reaction of hydroxymethanesulfonate, CHiCOHXSOjNa), with
benzylamine and benzylamine derivatives
6.1 INTRODUCTION
There have been no studies reported in the literature on the reaction of
hydroxymethanesulfonate, CH2(OH)(S03Na), with benzylamine and benzylamine
derivatives. The reaction of CH2(OH)(S03Na) with benzylamine and four benzylamine
derivatives was therefore investigated here using NMR and uv / vis spectroscopy to
gain a better understanding of the reaction kinetics and mechanism. The effect of the
presence of added sulfite ions in the system was also investigated.
The amines studied are shown in Table 6.1. This range of benzylamines was chosen to
enable investigation of the effects of pKa, the presence of electron donating and
withdrawing groups and the effect of substitution on the amino nitrogen.
Table 6.1: Amines^ studied in the reaction with CH2(OH)(S03Na)
amine pKa amine pKa
CH2NH2 1
CH2NH2
benzylamine 9.33 4-nitrobenzylamine 8.50
1
CH2NH2 CH2NH(CH3) f
4-methoxybenzylamine h " 9.51 A^-methylbenzylamine^ 9.59
1 0CH3
CH2NH2
4-methylbenzylamine 9.54
1 CH3
^ pKa values correspond to dissociation of the protonated amines, 25 °C, reference 1
^ also known as A' -benzylmethylamine
214
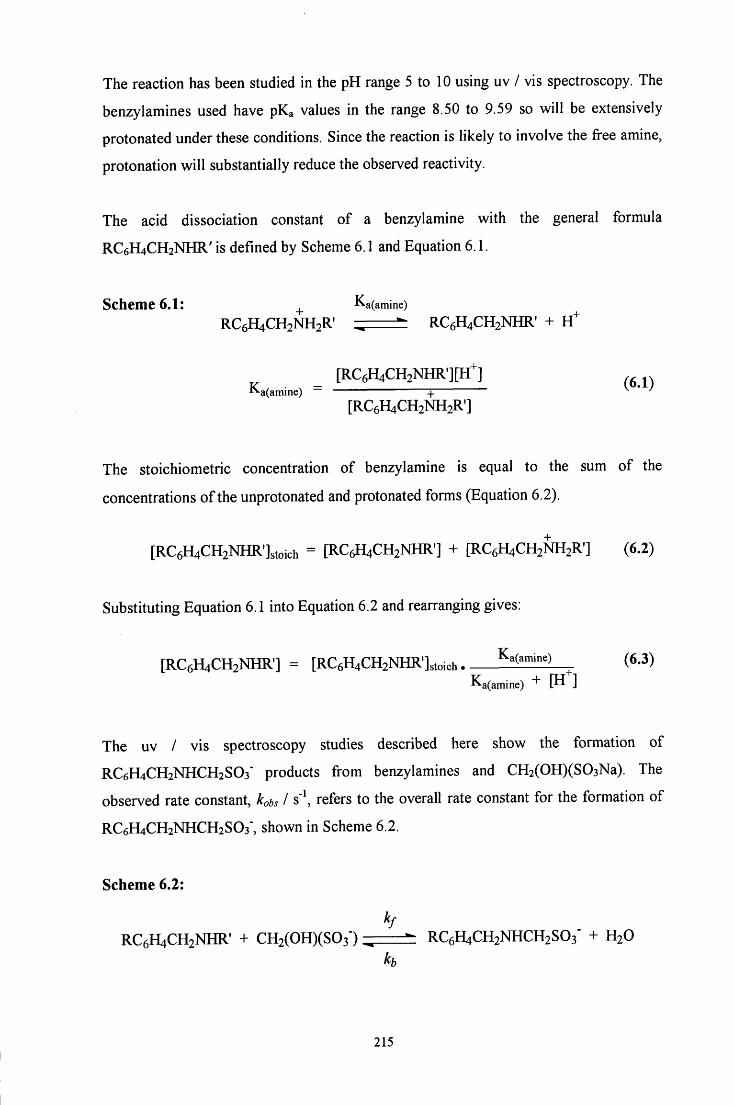
The reaction has been studied in the pH range 5 to 10 using uv / vis spectroscopy. The
benzylamines used have pKa values in the range 8.50 to 9.59 so will be extensively
protonated under these conditions. Since the reaction is likely to involve the free amine,
protonation will substantially reduce the observed reactivity.
The acid dissociation constant of a benzylamine with the general formula
RC6H4CH2NHR' is defined by Scheme 6.1 and Equation 6.1.
Scheme 6.1: ^ Ka(amine) RC6H4CH2NH2R' ^ RC6H4CH2NHR' + H^
[RC6H4CH2NHR'][H^] ^^^^
[RC6H4CH2NH2R'] Ka(amine) +
The stoichiometric concentration of benzylamine is equal to the sum of the
concentrations of the unprotonated and protonated forms (Equation 6.2).
[RC6H4CH2NHR']stoich = [RC6H4CH2NHR'] + [RC6H4CH2NH2R'] (6.2)
Substituting Equation 6.1 into Equation 6.2 and rearranging gives:
[RC6H4CH2NHR'] = [RC6H4CH2NHRlto ich . (6-3) Ka(amine) + P ]
The uv / vis spectroscopy studies described here show the formation of
RC6H4CH2NHCH2S03" products from benzylamines and CH2(OH)(S03Na). The
observed rate constant, kobs I s"\ refers to the overall rate constant for the formation of
RC6H4CH2NHCH2SO3", shown in Scheme 6.2.
Scheme 6.2:
RCeHiCHzNHR' + CHiCOHXSOj") , - RC6H4CH2NHCH2SO3" + H j O
h
215
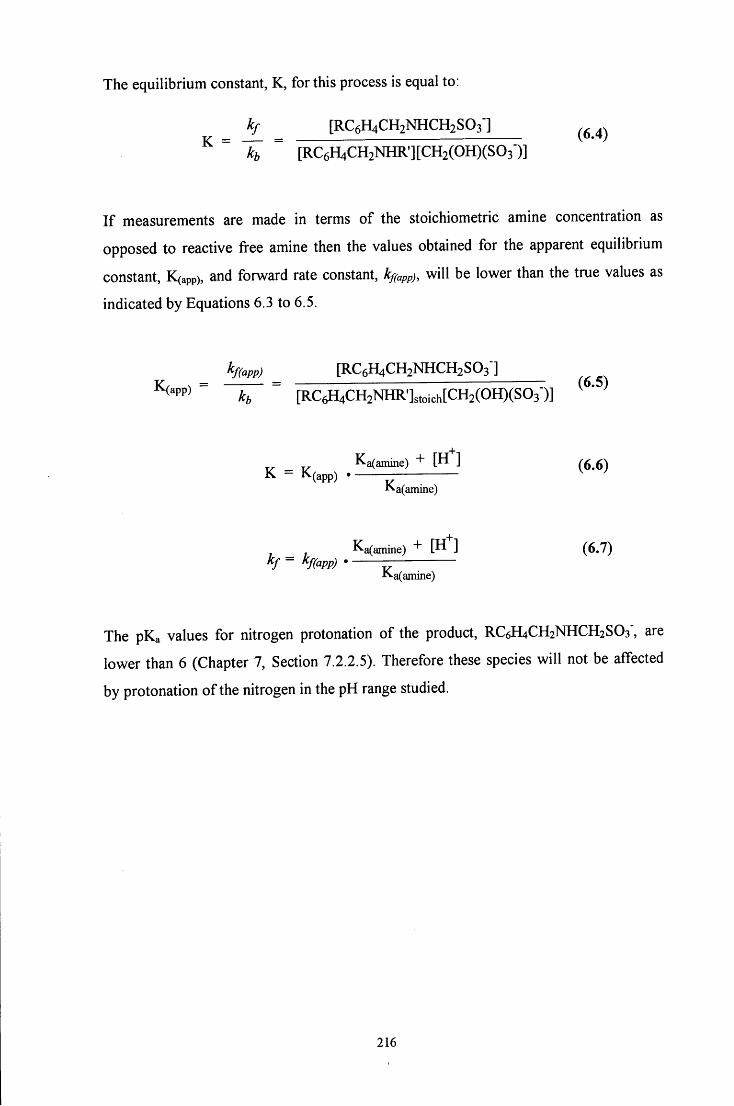
The equilibrium constant, K, for this process is equal to:
K = kf _ [RC6H4CH2NHCH2SO3 ] ^ 4
~ [RC6H4CH2NHR'][CH2(OH)(S03')]
I f measurements are made in terms of the stoichiometric amine concentration as
opposed to reactive free amine then the values obtained for the apparent equilibrium
constant, K(app), and forward rate constant, kf(app), will be lower than the true values as
indicated by Equations 6.3 to 6.5.
kf(app) _ [RC6H4CH2NHCH2SO3 ]
K(app) = — ^ - [RC6H4CH2NHR']3toich[CH2(OH)(S03-)] ^^'^^
Ka(ainine) + [H" ] (6.6) K - K(app) .
^a(ainme)
, _ , Ka(amine) + P""] (6.7) kf - kf(app)
J a(amme)
The pKa values for nitrogen protonation of the product, RC6H4CH2NHCH2S03', are
lower than 6 (Chapter 7, Section 7.2.2.5). Therefore these species will not be affected
by protonation of the nitrogen in the pH range studied.
216
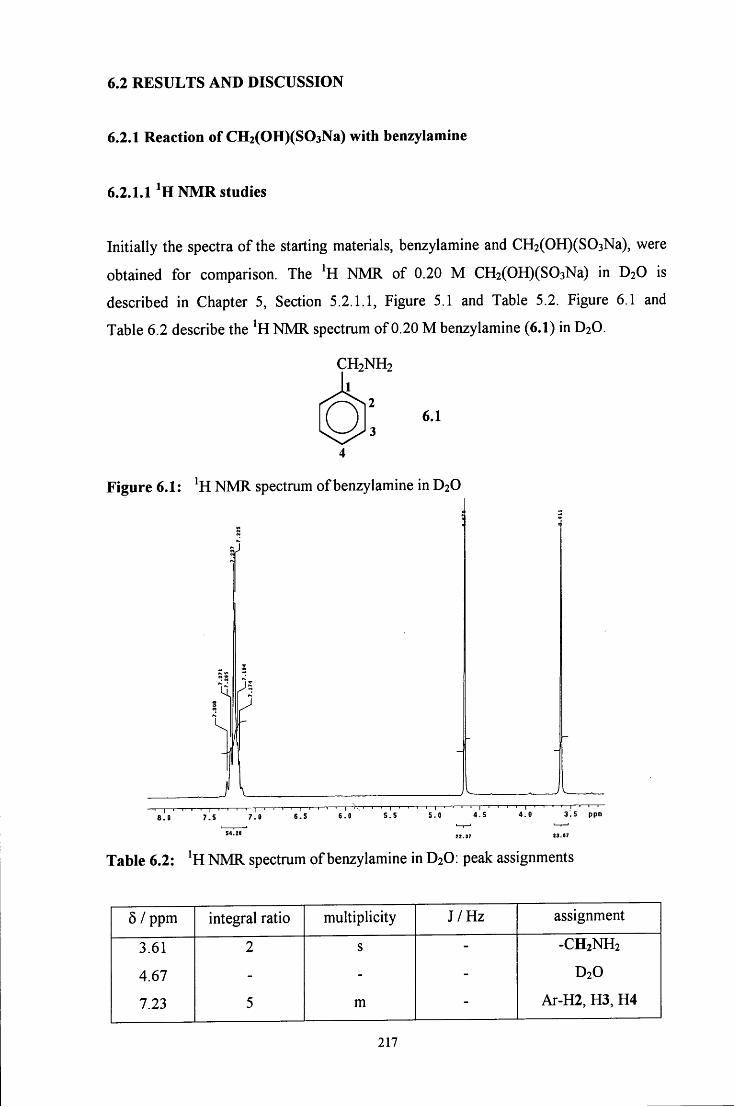
6.2 R E S U L T S AND DISCUSSION
6.2.1 Reaction of CHiCOHXSOjNa) with benzylamine
6.2.1.1 NMR studies
Initially the spectra of the starting materials, benzylamine and CH2(OH)(S03Na), were
obtained for comparison. The ^H NMR of 0.20 M CH2(OH)(S03Na) in D2O is
described in Chapter 5, Section 5.2.1.1, Figure 5.1 and Table 5.2. Figure 6.1 and
Table 6.2 describe the ^H NMR spectrum of 0.20 M benzylamine (6.1) in D2O.
CH2NH2 1
2
3
6.1
Figure 6.1: ^H NMR spectrum of benzylamine in D2O
-r I ' ' . I . ' ' ' ' I . 8.0 7.5 7.0 6.S 6.0 S.5 S.O 4.5 4.0 3.5 ppa
Table 6.2: ^H NMR spectrum of benzylamine in D2O: peak assignments
5 / ppm integral ratio multiplicity J /Hz assignment
3.61 2 s - -CH2NH2
4.67 - - - D2O
7.23 5 m - Ar-H2, H3, H4
217
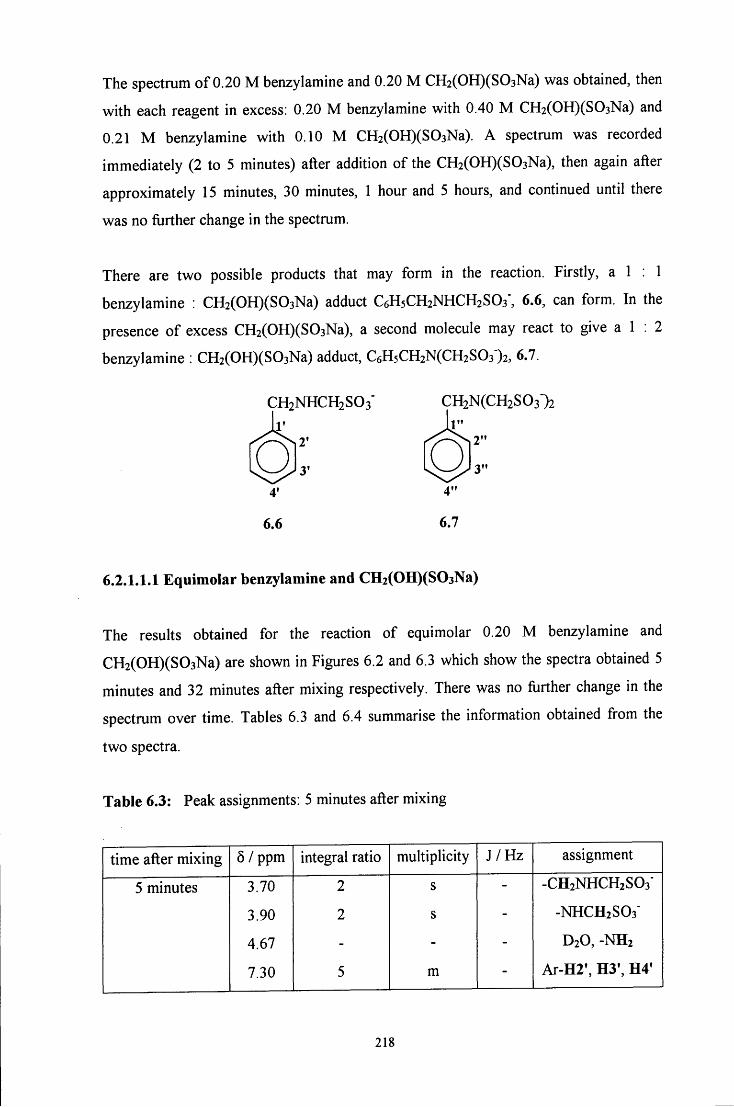
The spectrum of 0.20 M benzylamine and 0.20 M CH2(OH)(S03Na) was obtained, then
with each reagent in excess: 0.20 M benzylamine with 0.40 M CH2(OH)(S03Na) and
0.21 M benzylamine with 0.10 M CH2(OH)(S03Na). A spectrum was recorded
immediately (2 to 5 minutes) after addition of the CH2(OH)(S03Na), then again after
approximately 15 minutes, 30 minutes, 1 hour and 5 hours, and continued until there
was no further change in the spectrum.
There are two possible products that may form in the reaction. Firstly, a 1 : 1
benzylamine : CH2(OH)(S03Na) adduct C6H5CH2NHCH2S03', 6.6, can form. In the
presence of excess CH2(OH)(S03Na), a second molecule may react to give a 1 : 2
benzylamine : CH2(OH)(S03Na) adduct, C6H5CH2N(CH2S03")2, 6.7.
CH2NHCH2SO3"
V
3'
4'
6.6
CH2N(CH2S03')2 1"
2"
3"
4"
6.7
6.2.1.1.1 Equimolar benzylamine and CHiCOHXSOsNa)
The results obtained for the reaction of equimolar 0.20 M benzylamine and
CH2(OH)(S03Na) are shown in Figures 6.2 and 6.3 which show the spectra obtained 5
minutes and 32 minutes after mixing respectively. There was no fiirther change in the
spectrum over time. Tables 6.3 and 6.4 summarise the information obtained from the
two spectra.
Table 6.3: Peak assignments: 5 minutes after mixing
time after mixing 5 /ppm integral ratio multiplicity J /Hz assignment
5 minutes 3.70 2 s - -CH2NHCH2S03'
3.90 2 s - -NHCH2SO3'
4.67 - - - D2O, -NH2
7.30 5 m - Ar-H2', H3', H4'
218
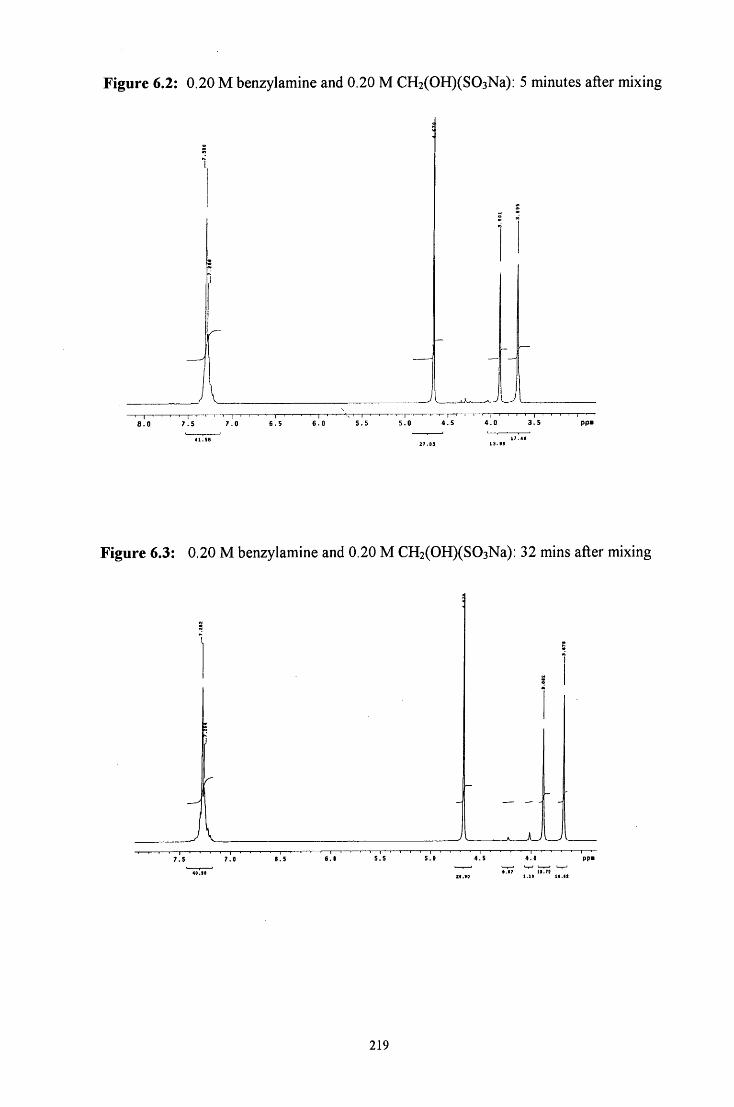
Figure 6.2: 0.20 M benzylamine and 0.20 M CH2(OH)(S03Na): 5 minutes after mixing
r
' I • ' ' < ' a.O 7.S 7 .0 E.5 6 . 0 S.5 5.0 4 . 5 4 . 0 3 .5 p p i
27.03 13.99
Figure 6.3: 0.20 M benzylamine and 0.20 M CH2(OH)(S03Na): 32 mins after mixing
r
- | , r—, 1 1 1 . . 1 — r - I — I — . — 1 — 1 — I — 1 — 1 — 1 — • — 1 -7.S 7.0 S.5 S . I 5.5 5.1 4.5 4.0 ppa
219
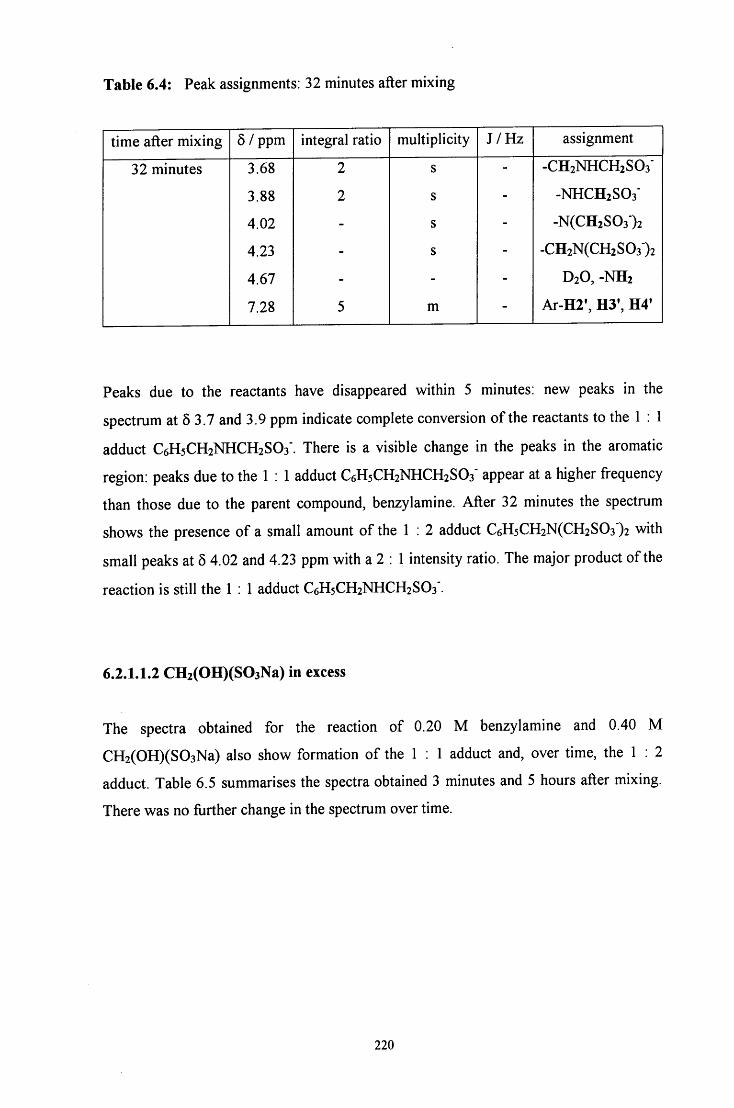
Table 6.4: Peak assignments: 32 minutes after mixing
time after mixing 5 / ppm integral ratio multiplicity J /Hz assignment
32 minutes 3.68 2 s - -CH2NHCH2SO3"
3.88 2 s - -NHCH2S03'
4.02 - s - -N(CH2S03")2
4.23 - s - -CH2N(CH2S03)2
4.67 - - - D2O, -NH2
7.28 5 m - Ar-H2', H3', H4'
Peaks due to the reactants have disappeared within 5 minutes: new peaks in the
spectrum at 5 3.7 and 3.9 ppm indicate complete conversion of the reactants to the 1 : 1
adduct C6H5CH2NHCH2SO3'. There is a visible change in the peaks in the aromatic
region: peaks due to the 1 : 1 adduct C6H5CH2NHCH2SO3' appear at a higher frequency
than those due to the parent compound, benzylamine. After 32 minutes the spectrum
shows the presence of a small amount of the 1 : 2 adduct C6H5CH2N(CH2S03')2 with
small peaks at 6 4.02 and 4.23 ppm with a 2 : 1 intensity ratio. The major product of the
reaction is still the 1 : 1 adduct C6H5CH2NHCH2SO3".
6.2.1.1.2 CH2(OH)(S03Na) in excess
The spectra obtained for the reaction of 0.20 M benzylamine and 0.40 M
CH2(OH)(S03Na) also show formation of the 1 : 1 adduct and, over time, the 1 : 2
adduct. Table 6.5 summarises the spectra obtained 3 minutes and 5 hours after mixing.
There was no fiirther change in the spectrum over time.
220
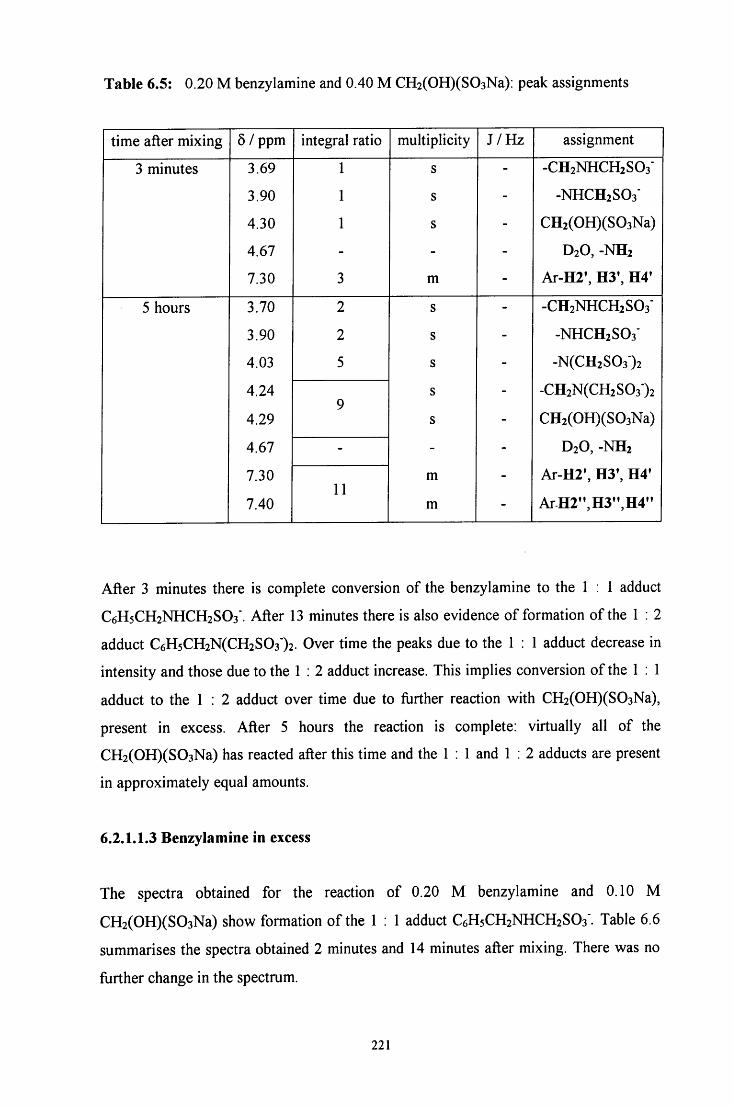
Table 6.5: 0.20 M benzylamine and 0.40 M CH2(OH)(S03Na): peak assignments
time after mixing 6 / ppm integral ratio multiplicity J / H z assignment
3 minutes 3.69 1 s - -CH2NHCH2S03'
3.90 1 s - -NHCH2SO3"
4.30 1 s - CH2(OH)(S03Na)
4.67 - - - D2O, -NH2
7.30 3 m - Ar-H2', H3', H4'
5 hours 3.70 2 s - -CH2NHCH2SO3"
3.90 2 s - -NHCH2S03'
4.03 5 s - -N(CH2S03")2
4.24 Q
s - -CH2N(CH2S03")2
4.29 s - CH2(OH)(S03Na)
4.67 - - - D2O, -NH2
7.30 m - Ar-H2', H3', H4' 11
Ar-H2', H3', H4'
7.40 m - ArH2",H3",H4"
After 3 minutes there is complete conversion of the benzylamine to the 1 : 1 adduct
C6H5CH2NHCH2S03' . After 13 minutes there is also evidence of formation of the 1 : 2
adduct C6H5CH2N(CH2S03")2. Over time the peaks due to the 1 : 1 adduct decrease in
intensity and those due to the 1 : 2 adduct increase. This implies conversion of the 1 : 1
adduct to the 1 : 2 adduct over time due to ftirther reaction with CH2(OH)(S03Na),
present in excess. After 5 hours the reaction is complete: virtually all of the
CH2(OH)(S03Na) has reacted after this time and the 1 : 1 and 1 : 2 adducts are present
in approximately equal amounts.
6.2.1.1.3 Benzylamine in excess
The spectra obtained for the reaction of 0.20 M benzylamine and 0.10 M
CH2(OH)(S03Na) show formation of the 1 : 1 adduct C6H5CH2NHCH2SO3". Table 6.6
summarises the spectra obtained 2 minutes and 14 minutes after mixing. There was no
fiirther change in the spectrum.
221
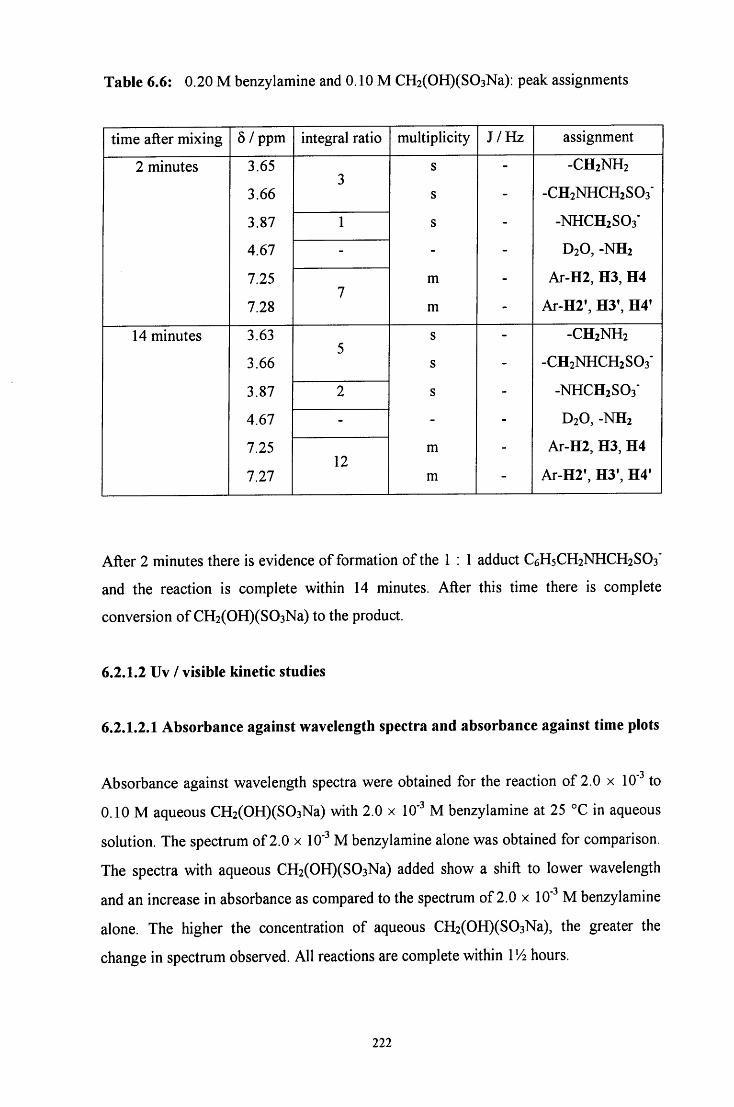
Table 6.6: 0.20 M benzylamine and 0.10 M CH2(OH)(S03Na): peak assignments
time after mixing 5 / ppm integral ratio multiplicity J / H z assignment
2 minutes 3.65 '?
s - -CH2NH2
3.66 s - -CH2NHCH2SO3"
3.87 1 s - -NHCH2S03'
4.67 - - - D2O, -NH2
7.25 m - Ar-H2, H3, H4 7
Ar-H2, H3, H4
7.28 m - Ar-H2', H3', H4'
14 minutes 3.63 c s - -CH2NH2
3.66 J s - -CH2NHCH2SO3"
3.87 2 s - -NHCH2SO3"
4.67 - - - D2O, -NH2
7.25 m - Ar-H2, H3, H4 12
Ar-H2, H3, H4
7.27 m - Ar-H2', H3', H4'
After 2 minutes there is evidence of formation of the 1 : 1 adduct C6H5CH2NHCH2SO3'
and the reaction is complete within 14 minutes. After this time there is complete
conversion of CH2(OH)(S03Na) to the product.
6.2.1.2 Uv / visible kinetic studies
6.2.1.2.1 Absorbance against wavelength spectra and absorbance against time plots
Absorbance against wavelength spectra were obtained for the reaction of 2.0 x 10" to
0.10 M aqueous CH2(OH)(S03Na) with 2.0 x 10' M benzylamine at 25 °C in aqueous
solution. The spectrum of 2.0 x 10' M benzylamine alone was obtained for comparison.
The spectra with aqueous CH2(OH)(S03Na) added show a shift to lower wavelength
and an increase in absorbance as compared to the spectrum of 2.0 x lO""' M benzylamine
alone. The higher the concentration of aqueous CH2(OH)(S03Na), the greater the
change in spectrum observed. All reactions are complete within VA hours.
222
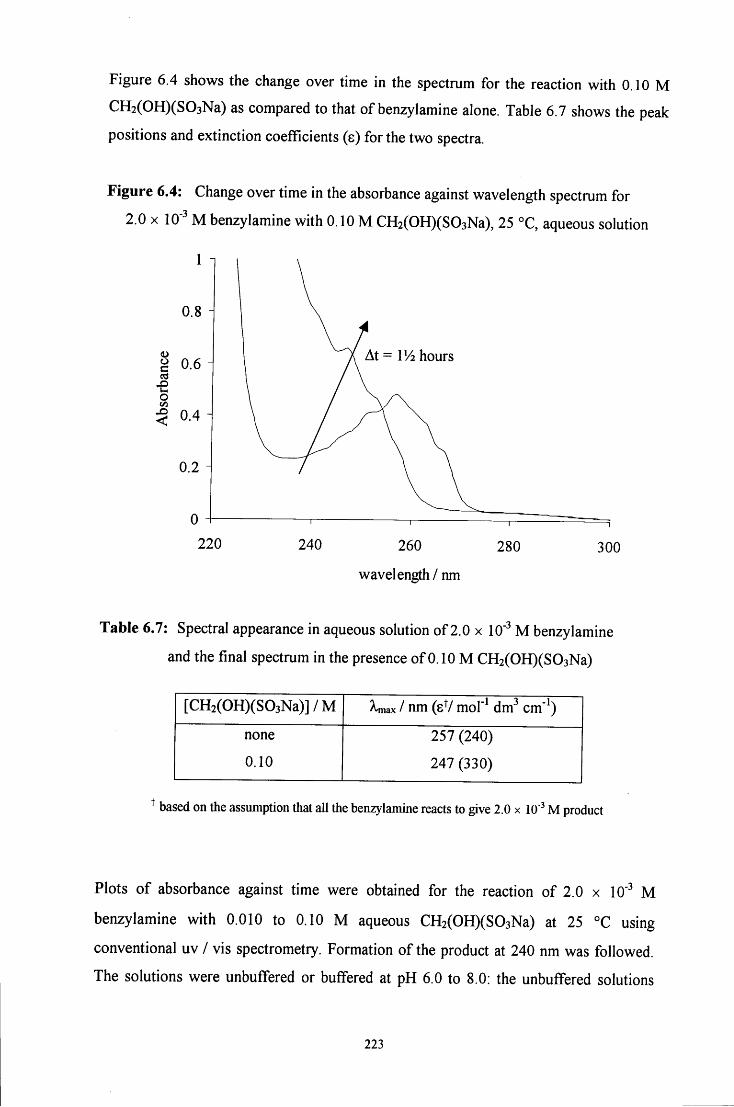
Figure 6.4 shows the change over time in the spectrum for the reaction with 0.10 M
CH2(OH)(S03Na) as compared to that of benzylamine alone. Table 6.7 shows the peak
positions and extinction coefficients (s) for the two spectra.
Figure 6.4: Change over time in the absorbance against wavelength spectrum for
2.0 X 10" M benzylamine with 0.10 M CH2(0H)(S03Na), 25 °C, aqueous solution
0.8 i
g 0.6
o ^ 0.4
0.2 H
220
At = VA hours
240 260
wavelength/nm
280 300
Table 6.7: Spectral appearance in aqueous solution of 2.0 x 10' M benzylamine
and the final spectrum in the presence of 0.10 M CH2(0H)(S03Na)
[CH2(OH)(S03Na)]/M Xmax 1 nm (sV mol'^ dm^ cm'^)
none
0.10
257 (240)
247 (330)
^ based on the assumption that all the benzylamine reacts to give 2.0 x 10' M product
Plots of absorbance against time were obtained for the reaction of 2.0 x 10" M
benzylamine with 0.010 to 0.10 M aqueous CH2(OH)(S03Na) at 25 °C using
conventional uv / vis spectrometry. Formation of the product at 240 nm was followed.
The solutions were unbuffered or buffered at pH 6.0 to 8.0: the unbuffered solutions
223
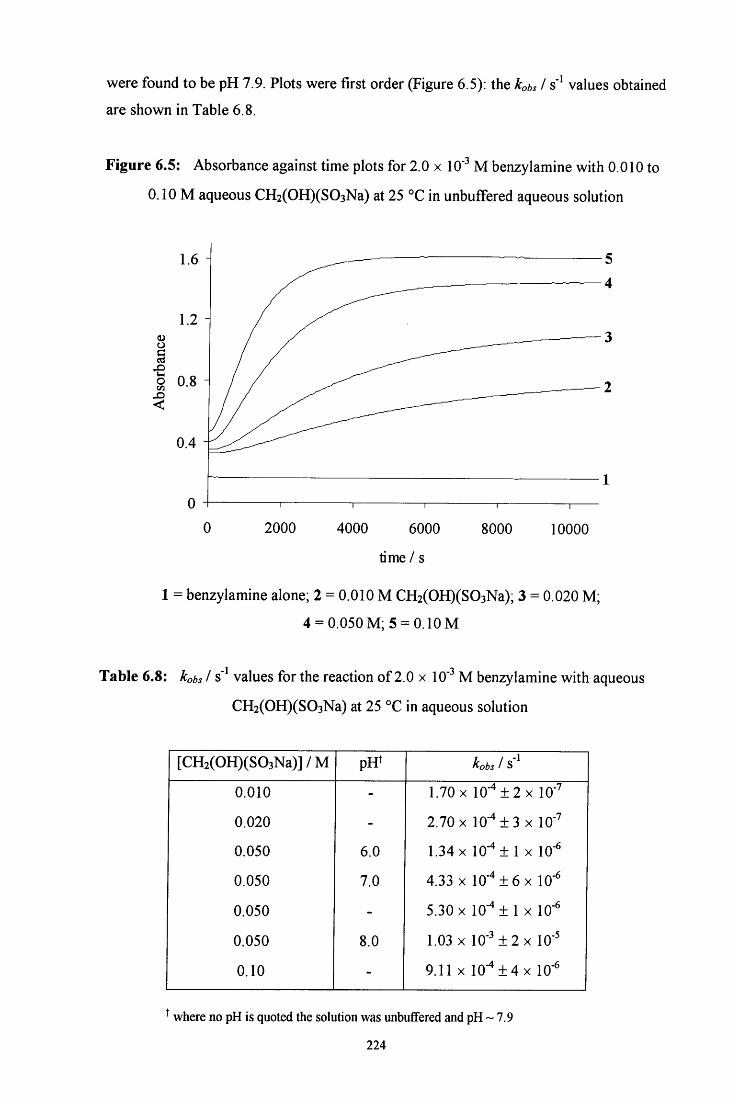
were found to be pH 7.9. Plots were first order (Figure 6.5): the kobs I s' values obtained
are shown in Table 6.8.
Figure 6.5: Absorbance against time plots for 2.0 x 10' M benzylamine with 0.010 to
0.10 M aqueous CH2(OH)(S03Na) at 25 °C in unbuffered aqueous solution
o X )
9 0.8
0 2000 4000 6000 8000 10000
time / s
1 = benzylamine alone; 2 = 0.010 M CH2(OH)(S03Na); 3 = 0.020 M ;
4 = 0.050 M ;5 = 0.10M
Table 6.8: kobs I s' values for the reaction of 2.0 x 10" M benzylamine with aqueous
CH2(OH)(S03Na) at 25 °C in aqueous solution
[CH2(OH)(S03Na)]/M pH^ kobs 1 S
0.010 - 1.70 X 10"* ± 2 X 10""
0.020 - 2.70 X 10" ± 3 X 10'
0.050 6.0 1.34 X 10"^± 1 X 10"
0.050 7.0 4.33 X 10" ± 6 X 10"
0.050 - 5.30 X 10- ± 1 X 10-
0.050 8.0 1.03 X 10' ± 2 X 10'
0.10 - 9.11 X 10"^±4x 10"
^ where no pH is quoted the solution was unbuffered and pH ~ 7.9
224
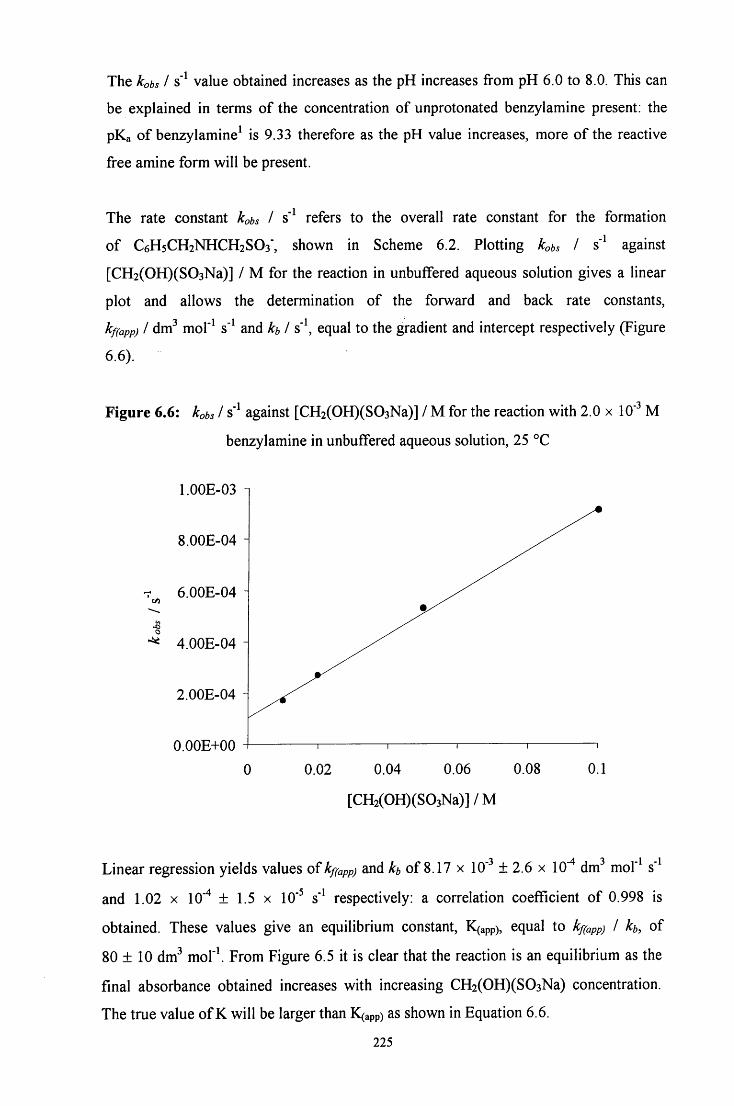
The kobs I s" value obtained increases as the pH increases fi-om pH 6.0 to 8.0. This can
be explained in terms of the concentration of unprotonated benzylamine present: the
pKa of benzylamine^ is 9.33 therefore as the pH value increases, more of the reactive
free amine form will be present.
The rate constant kobs I s' refers to the overall rate constant for the formation
of C6H5CH2NHCH2SO3*, shown in Scheme 6.2. Plotting kobs I s' against
[CH2(OH)(S03Na)] / M for the reaction in unbuffered aqueous solution gives a linear
plot and allows the determination of the forward and back rate constants,
kf(app) I dm" mol' s" and h I s'\ equal to the gradient and intercept respectively (Figure
6.6).
Figure 6.6: kobs I s' against [CH2(OH)(S03Na)] / M for the reaction with 2.0 x 10" M
benzylamine in unbuffered aqueous solution, 25 °C
l.OOE-03 1
8.00E-04
6.00E-04
4.00E-04
2.00E-04
O.OOE+00 0.02 0.04 0.06 0.08 0.1
[CH2(OH)(S03Na)]/M
Linear regression yields values of kf(app) and kb of 8.17 x 10" ± 2.6 x 10""* dm" mol"^ s'
and 1.02 x 10'" ± 1.5 x 10" s' respectively: a correlation coefficient of 0.998 is
obtained. These values give an equilibrium constant, K(app), equal to kf(app) I h, of
80 ± 10 dm^ mor\ From Figure 6.5 it is clear that the reaction is an equilibrium as the
final absorbance obtained increases with increasing CH2(OH)(S03Na) concentration.
The true value of K will be larger than K(app) as shown in Equation 6.6.
225
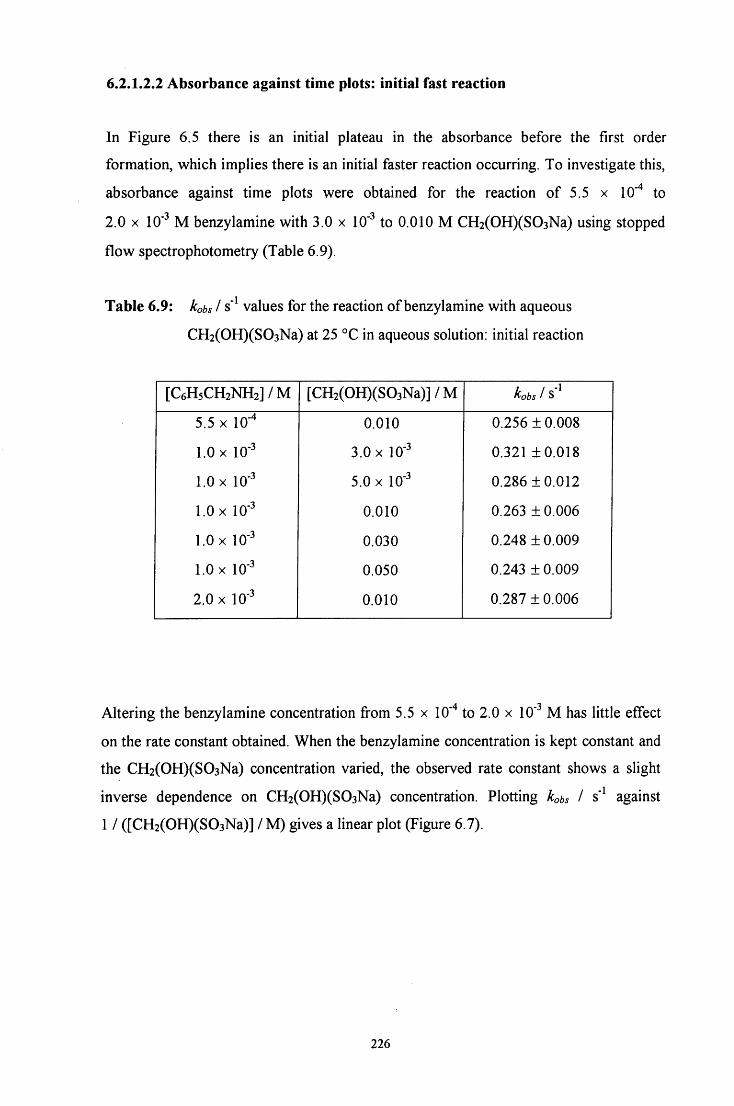
6.2.1.2.2 Absorbance against time plots: initial fast reaction
In Figure 6.5 there is an initial plateau in the absorbance before the first order formation, which implies there is an initial faster reaction occurring. To investigate this, absorbance against time plots were obtained for the reaction of 5.5 x 10'"* to 2.0 X 10' M benzylamine with 3.0 x 10" to 0.010 M CH2(OH)(S03Na) using stopped flow spectrophotometry (Table 6.9).
Table 6.9: kobs I s" values for the reaction of benzylamine with aqueous
CH2(OH)(S03Na) at 25 °C in aqueous solution: initial reaction
[CeHsCHzNHzl/M [CH2(OH)(S03Na)]/M kobs 1 S
5.5 X 10- 0.010 0.256 ±0.008
1.0 X 10" 3.0 X 10" 0.321 ±0.018
1.0 X 10' 5.0 X 10" 0.286 ±0.012
1.0 X 10" 0.010 0.263 ± 0.006
1.0 X 10" 0.030 0.248 ± 0.009
1.0 X 10" 0.050 0.243 ±0.009
2.0 X 10- 0.010 0.287 ±0.006
Altering the benzylamine concentration from 5.5 x lO''* to 2.0 x 10" M has little effect
on the rate constant obtained. When the benzylamine concentration is kept constant and
the CH2(OH)(S03Na) concentration varied, the observed rate constant shows a slight
inverse dependence on CH2(OH)(S03Na) concentration. Plotting kobs I s' against
1 / ([CH2(OH)(S03Na)] / M) gives a linear plot (Figure 6.7).
226
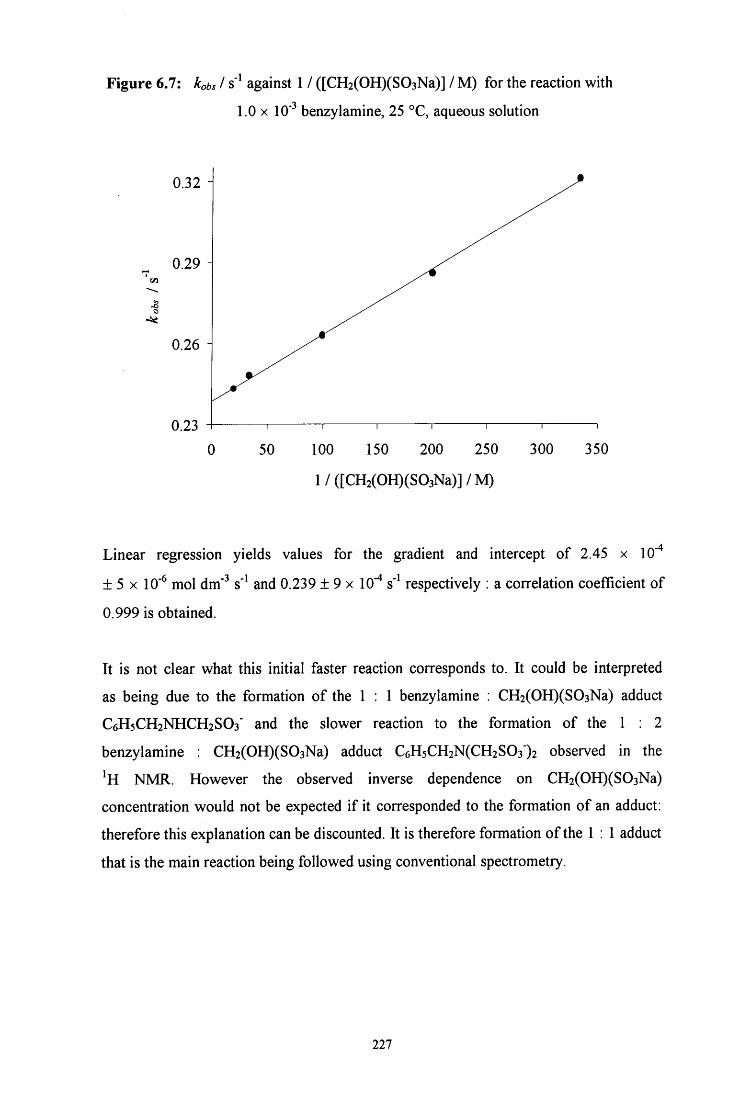
Figure 6.7: kobs I s" against 1 / ([CH2(OH)(S03Na)] / M) for the reaction with
1.0 X 10' benzylamine, 25 °C, aqueous solution
0.32
0.29
0.26 H
0.23
50 100 150 200 250
1 / ([CH2(OH)(S03Na)] / M)
300 350
Linear regression yields values for the gradient and intercept of 2.45 x 10'"*
± 5 X 10' mol dm'^ s' and 0.239 ± 9 x 10" s" respectively : a correlation coefficient of
0.999 is obtained.
It is not clear what this initial faster reaction corresponds to. It could be interpreted
as being due to the formation of the 1 : 1 benzylamine : CH2(OH)(S03Na) adduct
C6H5CH2NHCH2SO3" and the slower reaction to the formation of the 1 : 2
benzylamine : CH2(OH)(S03Na) adduct C6H5CH2N(CH2S03")2 observed in the
NMR. However the observed inverse dependence on CH2(OH)(S03Na)
concentration would not be expected i f it corresponded to the formation of an adduct:
therefore this explanation can be discounted. It is therefore formation of the 1 : 1 adduct
that is the main reaction being followed using conventional spectrometry.
227
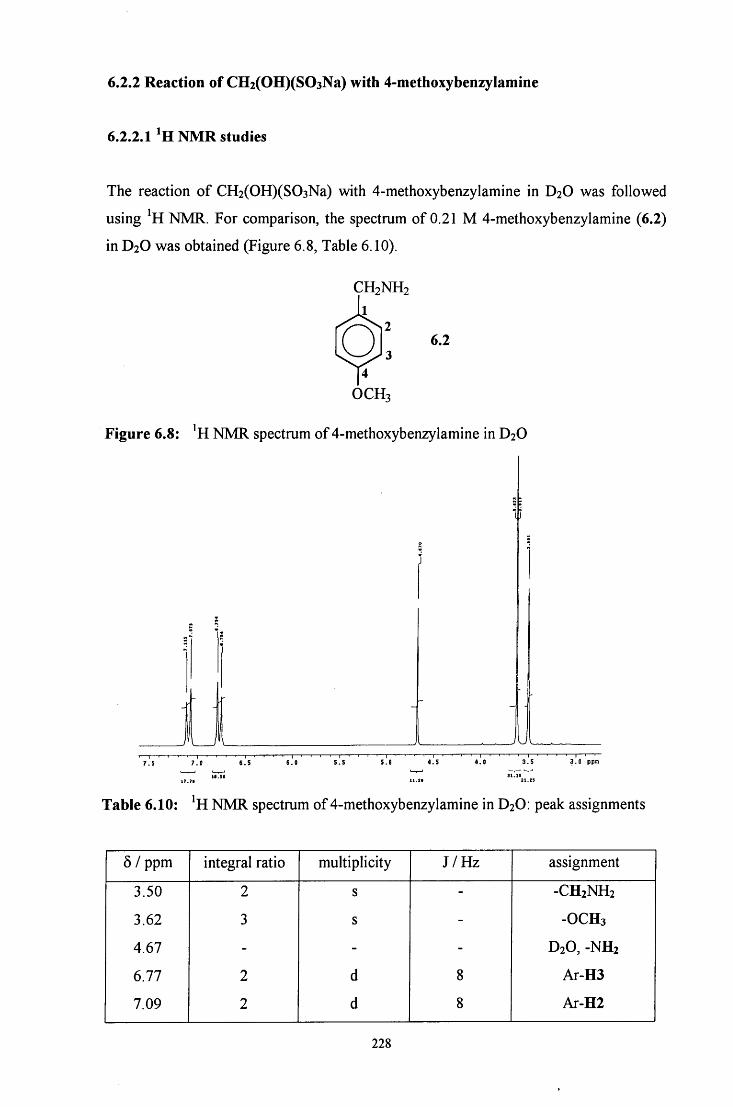
6.2.2 Reaction of CH2(OH)(S03Na) with 4-methoxybenzyIamine
6.2.2.1 NMR studies
The reaction of CH2(OH)(S03Na) with 4-methoxybenzylamine in D2O was followed
using NMR. For comparison, the spectrum of 0.21 M 4-methoxybenzylamine (6.2)
in D2O was obtained (Figure 6.8, Table 6.10).
CH2NH2 1
6.2 Q 4
O C H 3
Figure 6.8: NMR spectrum of 4-methoxybenzylamine in D2O
U T.i 7 . 0 6 . 5 6 . 0 5 . 5 5 . 8 4 . 5 4 . 0 3 . 5 3 . 0 ppn
17.71 11-21 21-25
Table 6.10: NMR spectrum of 4-methoxybenzylamine in D2O: peak assignments
5 / ppm integral ratio multiplicity J /Hz assignment
3.50 2 s - -CH2NH2
3.62 3 s - - O C H 3
4.67 - - - D2O, -NH2
6.77 2 d 8 Ar-H3
7.09 2 d 8 Ar-H2
228
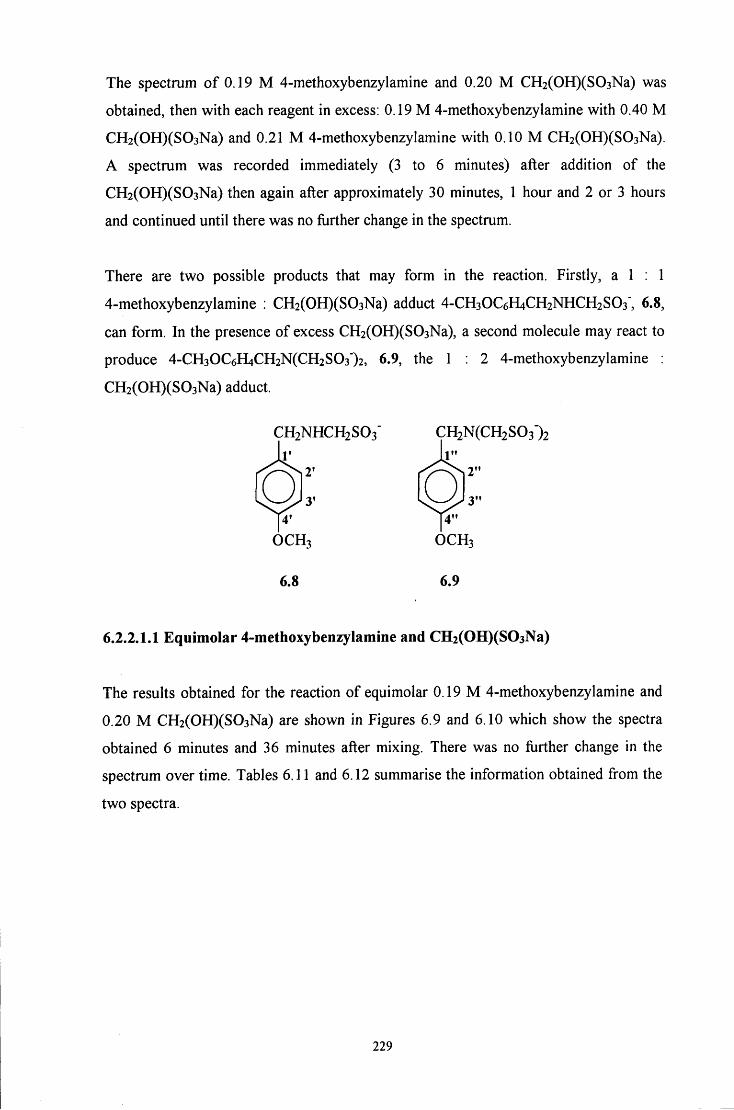
The spectrum of 0.19 M 4-methoxybenzylamine and 0.20 M CH2(OH)(S03Na) was
obtained, then with each reagent in excess: 0.19 M 4-methoxybenzylamine with 0.40 M
CH2(OH)(S03Na) and 0.21 M 4-methoxybenzylamine with 0.10 M CH2(OH)(S03Na).
A spectrum was recorded immediately (3 to 6 minutes) after addition of the
CH2(OH)(S03Na) then again after approximately 30 minutes, 1 hour and 2 or 3 hours
and continued until there was no flirther change in the spectrum.
There are two possible products that may form in the reaction. Firstly, a 1 : 1
4-methoxybenzylamine : CH2(OH)(S03Na) adduct 4-CH3OC6H4CH2NHCH2SO3", 6.8,
can form. In the presence of excess CH2(OH)(S03Na), a second molecule may react to
produce 4-CH30C6H4CH2N(CH2S03')2, 6.9, the 1 : 2 4-methoxybenzylamine :
CH2(OH)(S03Na) adduct.
CH2NHCH2S03' r
r
y Q
4'
O C H 3
6.8
CH2N(CH2S03")2 1"
2" Q 3" 4"
O C H 3
6.9
6,1.2AA Equimolar 4-niethoxybenzylamine and CH2(OH)(S03Na)
The results obtained for the reaction of equimolar 0.19 M 4-methoxybenzylamine and
0.20 M CH2(OH)(S03Na) are shown in Figures 6.9 and 6.10 which show the spectra
obtained 6 minutes and 36 minutes after mixing. There was no fiirther change in the
spectrum over time. Tables 6.11 and 6.12 summarise the information obtained from the
two spectra.
229
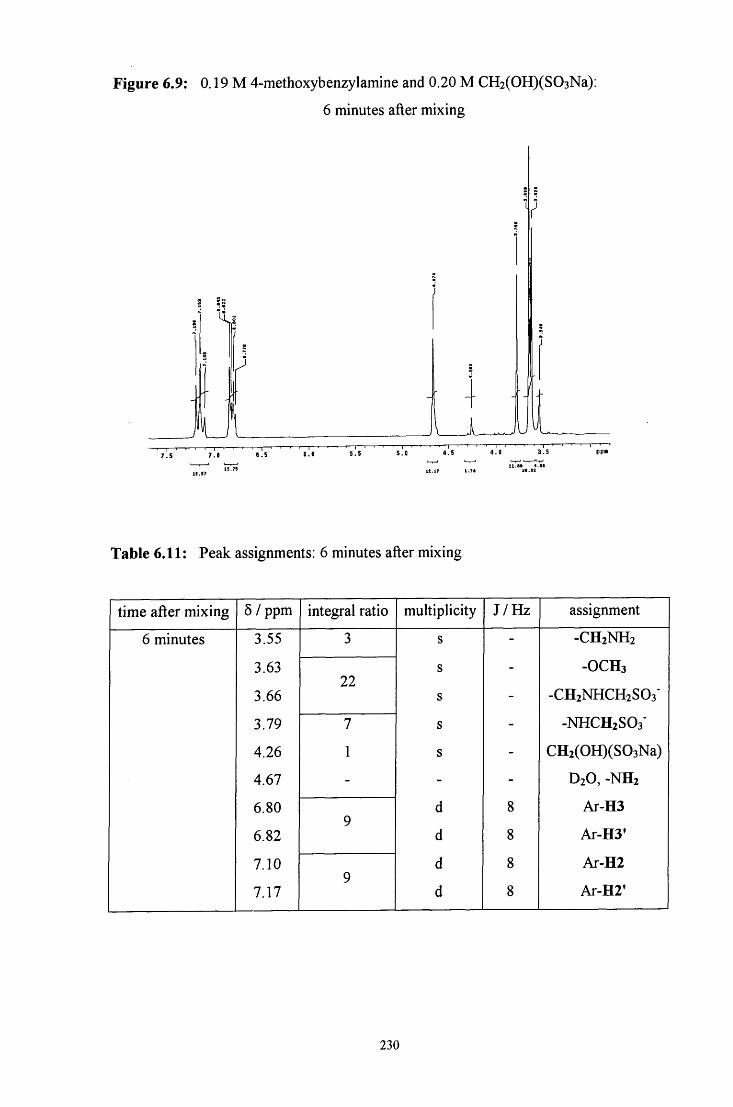
Figure 6.9: 0.19 M 4-methoxybenzylamine and 0.20 M CH2(OH)(S03Na):
6 minutes after mixing
V
Table 6.11: Peak assignments: 6 minutes after mixing
4 . 0 3 . 5
i i -ae 4 . U
time after mixing 6 / ppm integral ratio multiplicity J /Hz assignment
6 minutes 3.55 3 s - -CH2NH2
3.63 s - - O C H 3 22
3.66 s - -CH2NHCH2S03'
3.79 7 s - -NHCHzSOs-
4.26 1 s - CH2(OH)(S03Na)
4.67 - - - D2O, -NH2
6.80 Q d 8 Ar-H3
6.82 y
d 8 Ar-H3'
7.10 o d 8 Ar-H2
7.17 y
d 8 Ar-H2'
230
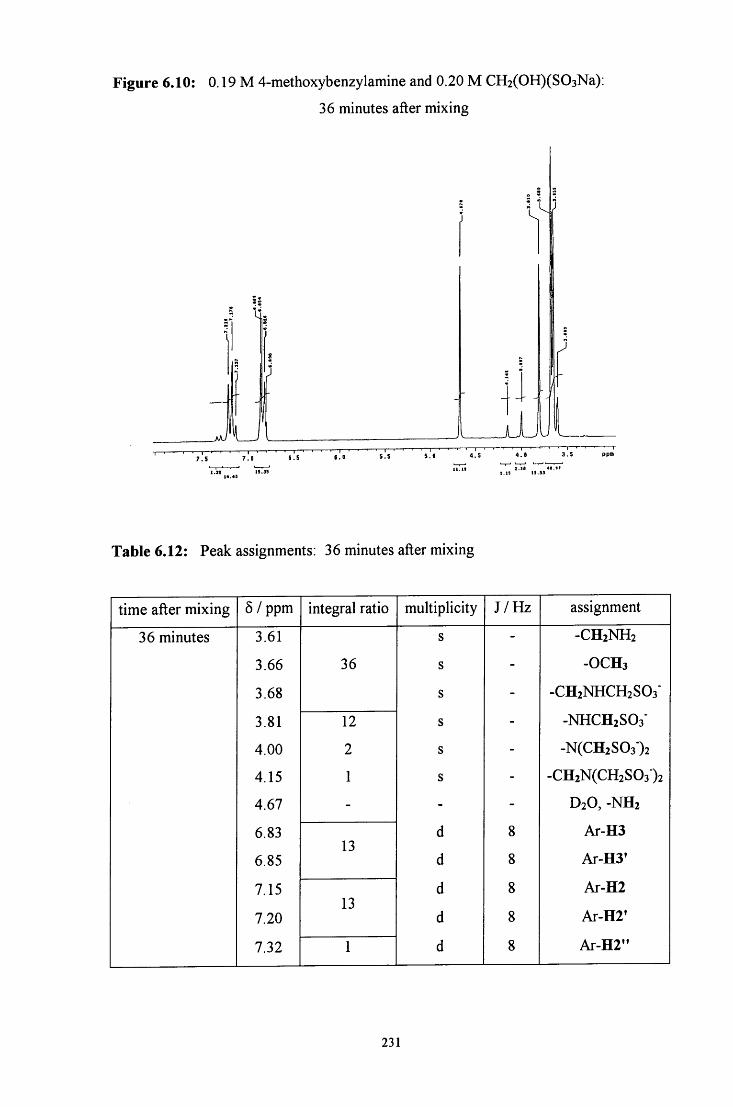
Figure 6.10: 0.19 M 4-methoxybenzylamine and 0.20 M CH2(OH)(S03Na):
36 minutes after mixing
5 . 0 I . S
11.11 1.15 H.S3
Table 6.12: Peak assignments: 36 minutes after mixing
time after mixing 5 / ppm integral ratio multiplicity J /Hz assignment
36 minutes 3.61 s - -CH2NH2
3.66 36 s - - O C H 3
3.68 s - -CH2NHCH2SO3"
3.81 12 s - -NHCH2SO3"
4.00 2 s - -N(CH2S03")2
4.15 1 s - -CH2N(CH2S03")2
4.67 - - - D2O, -NH2
6.83 d 8 Ar-H3 13
6.85 d 8 Ar-H3'
7.15 d 8 Ar-H2 13
7.20 d 8 Ar-H2'
7.32 1 d 8 Ar-H2"
231
The spectra show the formation of both the 1 : 1 adduct 4-CH3OC6H4CH2NHCH2SO3'
and the 1 : 2 adduct 4-CH30C6H4CH2N(CH2S03")2 over time. After only 6 minutes
there is considerable 1 : 1 adduct 4-CH3OC6H4CH2NHCH2SO3" formation with the
appearance of peaks at 6 3.66 and 6 3.79 ppm. There is also a change in the aromatic
region, with the product peaks resonating at a slightly higher frequency than the
corresponding peaks in the parent compound, 4-methoxybenzylamine. After 36 minutes
new peaks due to the 1 : 2 adduct 4-CH30C6H4CH2N(CH2S03")2 at 5 4.00 and
5 4.15 ppm are present and small peaks in the aromatic region at slightly higher
frequency than the 1 : 1 adduct. There is no fiirther change in the spectrum after
36 minutes.
The peaks due to CH2(OH)(S03Na) and 4-methoxybenzylamine decrease in intensity
over time. Although all the CH2(OH)(S03Na) reacts, there is still some evidence of a
small amount of amine in the final spectrum. The major product of reaction is the 1 : 1
adduct 4-CH3OC6H4CH2NHCH2SO3", which forms immediately, with a smaller
proportion of the 1 : 2 adduct 4-CH30C6H4CH2N(CH2S03")2 forming over time.
6.2.2.1.2 CH2(OH)(S03Na) in excess
The spectra obtained for the reaction of 0.20 M 4-methoxybenzylamine and 0.40 M
CH2(OH)(S03Na) also show the formation of 4-CH30C6H4CH2NHCH2S03', the 1 : 1
adduct and, over time, the 1 : 2 adduct 4-CH30C6H4CH2N(CH2S03")2. Table 6.13
summarises the spectra obtained 3 minutes and 1 hour after mixing. There was no
ftarther change in the spectrum over time.
After only 3 minutes all the 4-methoxybenzylamine reacts to give the 1 : 1 adduct
4-CH3OC6H4CH2NHCH2SO3'. Within 30 minutes there is also substantial 1 : 2 adduct,
4-CH30C6H4CH2N(CH2S03")2, formation. The reaction is complete within 1 hour,
when the amount of 1 : 2 adduct is almost equal to the amount of 1 : 1 adduct present.
232
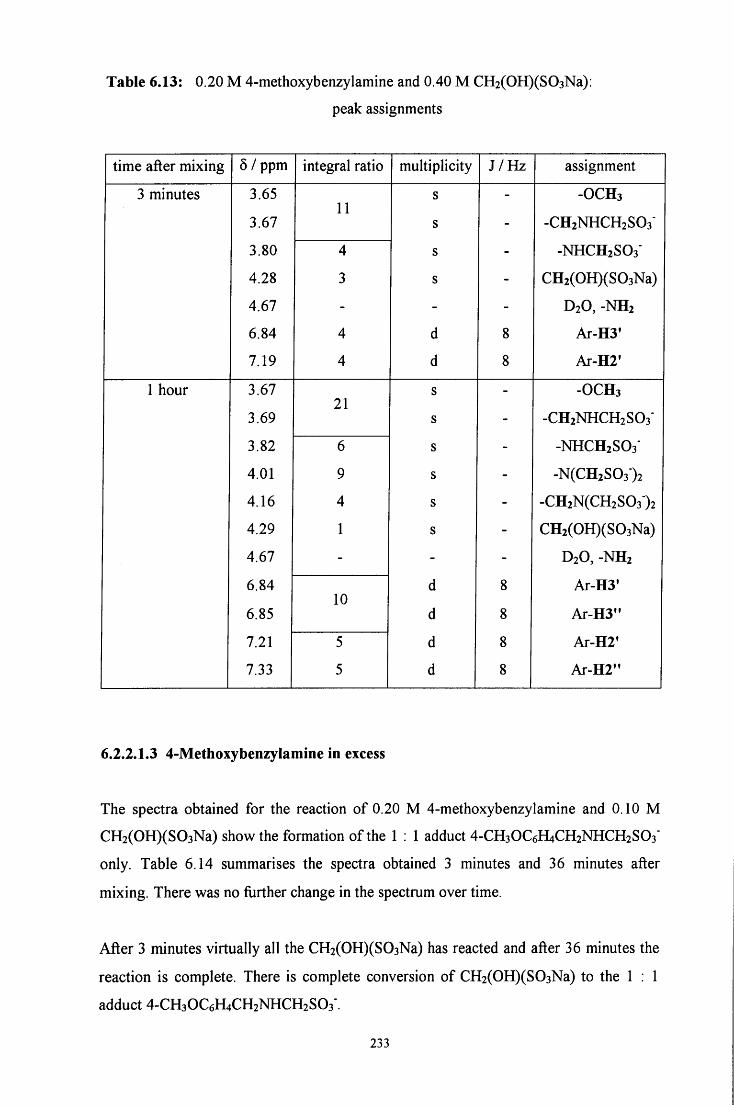
Table 6.13: 0.20 M 4-methoxybenzylamine and 0.40 M CH2(OH)(S03Na):
peak assignments
time after mixing 6 / ppm integral ratio muhiplicity J /Hz assignment
3 minutes 3.65 s - - O C H 3 11
3.67 s - -CH2NHCH2S03'
3.80 4 s - -NHCH2S03'
4.28 3 s - CH2(OH)(S03Na)
4.67 - - - D2O, -NH2
6.84 4 d 8 Ar-H3'
7.19 4 d 8 Ar-H2'
1 hour 3.67 s _ - O C H 3 21
3.69 s - -CH2NHCH2S03'
3.82 6 s - -NHCH2S03'
4.01 9 s - -N(CH2S03-)2
4.16 4 s - -CH2N(CH2S03')2
4.29 1 s - CH2(OH)(S03Na)
4.67 - - - D2O, -NH2
6.84 d 8 Ar-H3' 10
6.85 d 8 Ar-H3"
7.21 5 d 8 Ar-H2'
7.33 5 d 8 Ar-H2"
6.2.2.1.3 4-MethoxybenzyIamine in excess
The spectra obtained for the reaction of 0.20 M 4-methoxybenzylamine and 0.10 M
CH2(OH)(S03Na) show the formation of the 1 : 1 adduct 4-CH3OC6H4CH2NHCH2SO3"
only. Table 6.14 summarises the spectra obtained 3 minutes and 36 minutes after
mixing. There was no fiirther change in the spectrum over time.
After 3 minutes virtually all the CH2(OH)(S03Na) has reacted and after 36 minutes the
reaction is complete. There is complete conversion of CH2(OH)(S03Na) to the 1 : 1
adduct 4-CH30C6H4CH2NHCH2S03".
233
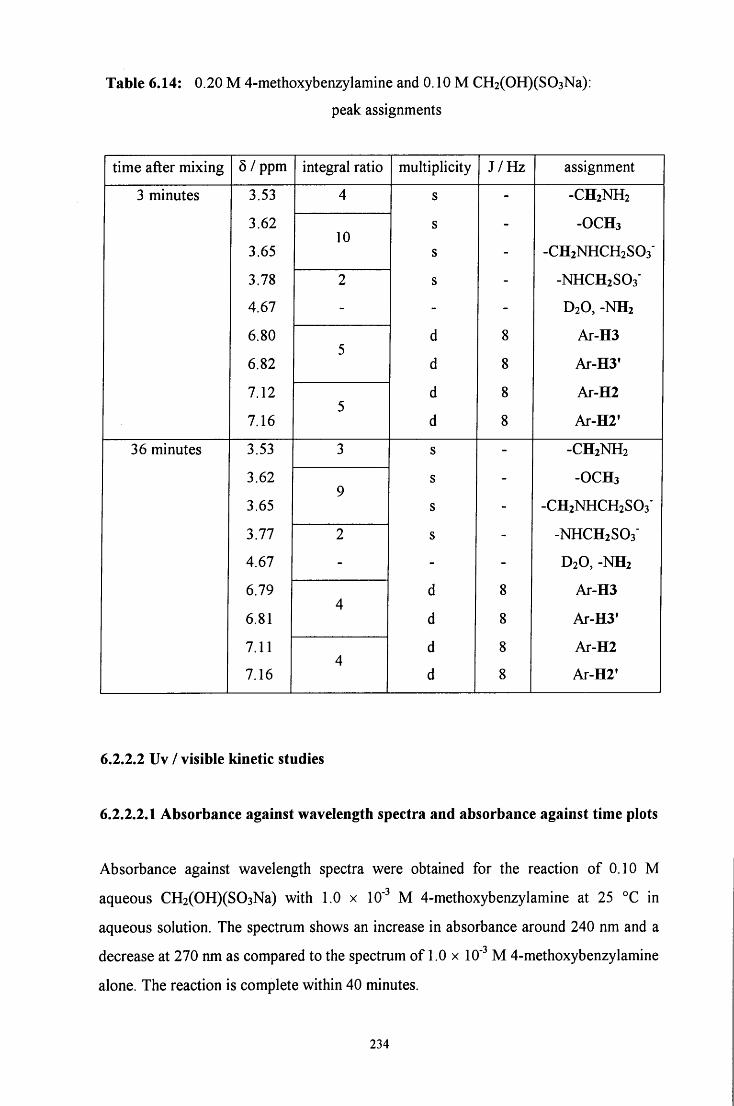
Table 6.14: 0.20 M 4-methoxybenzylamine and 0.10 M CH2(OH)(S03Na):
peak assignments
time after mixing 6 / ppm integral ratio multiplicity J /Hz assignment
3 minutes 3.53 4 s - -CH2NH2
3.62 s _ - O C H 3 10
3.65 s - -CH2NHCH2SO3"
3.78 2 s - -NHCH2S03"
4.67 - - - D2O, -NH2
6.80 d 8 Ar-H3 5
6.82 d 8 Ar-H3'
7.12 d 8 Ar-H2 5
7.16 d 8 Ar-H2'
36 minutes 3.53 3 s - -CH2NH2
3.62 s - - O C H 3 9
3.65 s - -CH2NHCH2S03"
3.77 2 s - -NHCH2SO3"
4.67 - - - D2O, -NH2
6.79 d 8 Ar-H3 4
6.81 d 8 Ar-H3'
7.11 d 8 Ar-H2 4
7.16 d 8 Ar-H2'
6.2.2.2 Uv / visible kinetic studies
6.2.2.2.1 Absorbance against wavelength spectra and absorbance against time plots
Absorbance against wavelength spectra were obtained for the reaction of 0.10 M
aqueous CH2(OH)(S03Na) with 1.0 x 10" M 4-methoxybenzylamine at 25 °C in
aqueous solution. The spectrum shows an increase in absorbance around 240 nm and a
decrease at 270 nm as compared to the spectrum of 1.0 x 10' M 4-methoxybenzylamine
alone. The reaction is complete within 40 minutes.
234
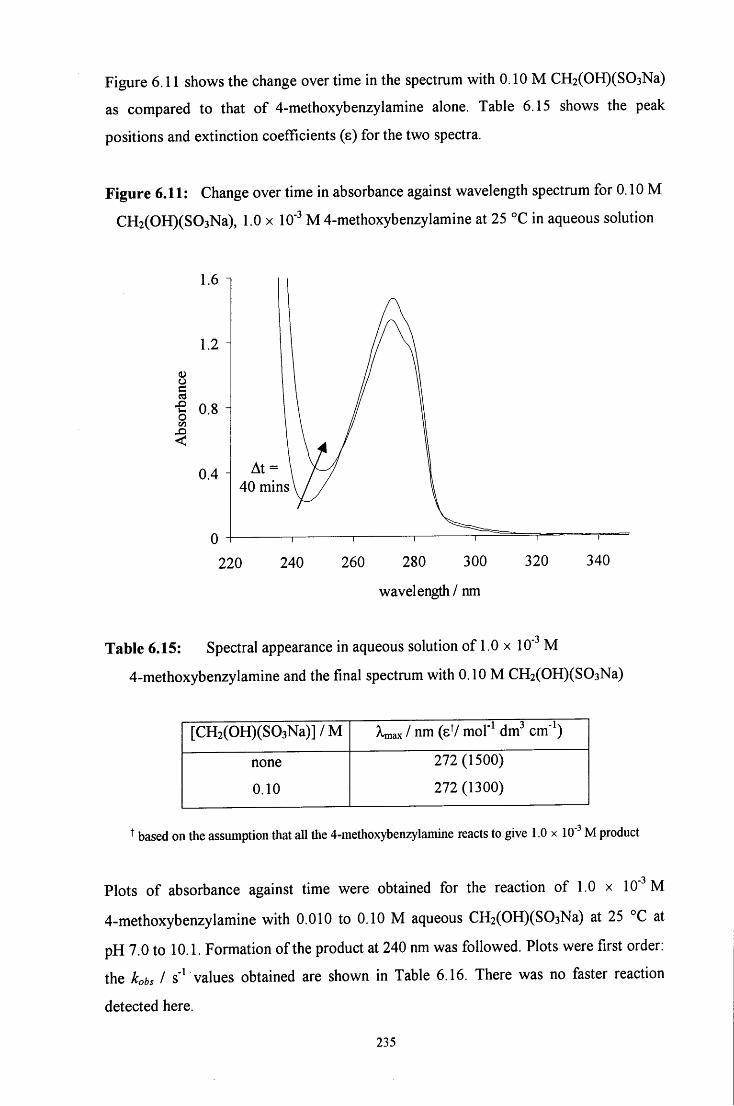
Figure 6.11 shows the change over time in the spectrum with 0.10 M CH2(OH)(S03Na)
as compared to that of 4-methoxybenzylamine alone. Table 6.15 shows the peak
positions and extinction coefficients (s) for the two spectra.
Figure 6.11: Change over time in absorbance against wavelength spectrum for 0.10 M
CH2(OH)(S03Na), 1.0 x 10' M 4-methoxybenzylamine at 25 °C in aqueous solution
o §
1.6 n
1.2
0.8 H
0.4 H At = 40 mins
220 240 260 280 300
wavelength / nm
320 340
Table 6.15: Spectral appearance in aqueous solution of 1.0 x 10' M
4-methoxybenzylamine and the final spectrum with 0.10 M CH2(OH)(S03Na)
[CH2(OH)(S03Na)]/M Krnux 1 nm (sV mol"^ dm" cm'^)
none
0.10
272(1500)
272 (1300)
^ based on the assumption that all the 4-methoxybenzylamine reacts to give 1.0 x 10' M product
Plots of absorbance against time were obtained for the reaction of 1.0 x 10" M
4-methoxybenzylamine with 0.010 to 0.10 M aqueous CH2(OH)(S03Na) at 25 °C at
pH 7.0 to 10.1. Formation of the product at 240 nm was followed. Plots were first order:
the kobs I s' values obtained are shown in Table 6.16. There was no faster reaction
detected here.
235
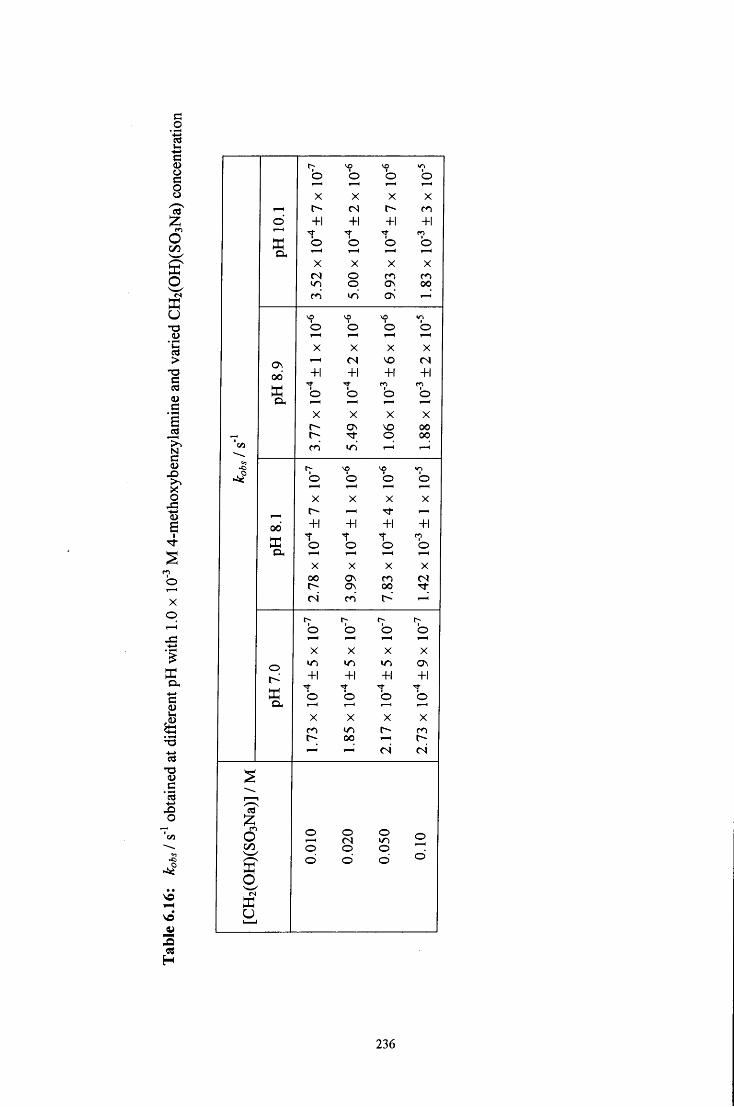
c o o
I O
o
'S > § 0)
s 4) o
•4-»
S
X o
c
o
so
e2
a,
On 00 X
6
o
u
X
+ 1 t o
o X
+ 1
X
+ 1 t o
o o
X
+ 1
X
+ 1
OS
X
+ 1
o o
o o
o O
o o d
X m + 1
00 ON ^
X
+ 1
X X X X ON 00
o 00 ^ "
I — 1
b b b b I — 1 r—t
X X X X
00 + 1 + 1 + 1 + 1 b t o b
C I
b "- <—1
X X X X 00 ON m
ON 00 m I - H
b b b b I — ( I — H I - H
X X X X »r) ON
+\ + 1 + 1 + 1 b b b b
O H I — I • — I I — H
X X X X m »n
00 1—H
T — I I — 1
236
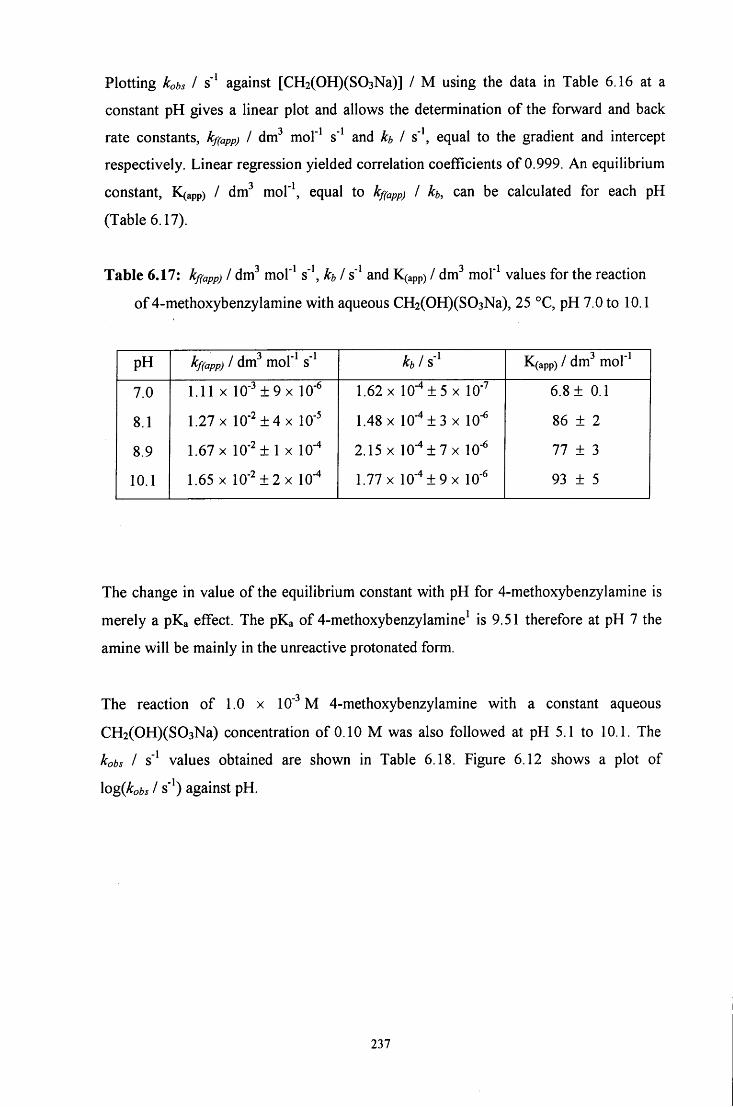
Plotting kobs I s' against [CH2(OH)(S03Na)] / M using the data in Table 6.16 at a
constant pH gives a linear plot and allows the determination of the forward and back
rate constants, kf(app) I dvc? mol'^ s" and h I s'\ equal to the gradient and intercept
respectively. Linear regression yielded correlation coefficients of 0.999. An equilibrium
constant, K(app) / dm^ mor\ equal to kf(app) I h, can be calculated for each pH
(Table 6.17).
Table 6.17: kf(app) I dvc? mol"^ s'\ h I s' and K(app) / dm^ mol'^ values for the reaction
of 4-methoxybenzylamine with aqueous CH2(OH)(S03Na), 25 °C, pH 7.0 to 10.1
pH kf(app) 1 dm^ mol"^ s' h 1 s' K(app) / dm^ mol"^
7.0 1.11 X 10" ± 9 X 10' 1.62 X 10-^±5 X 10" 6.8 ± 0.1
8.1 1.27 X 10" ± 4 X 10- 1.48 X 10" ± 3 X 10' 86 ± 2
8.9 1.67 X 10" ± 1 X 10- 2.15 X 10"^±7x 10' 77 ± 3
10.1 1.65 X 10" ± 2 X lO"* 1.77 X 10-^±9x 10" 93 + 5
The change in value of the equilibrium constant with pH for 4-methoxybenzylamine is
merely a pKa effect. The pKa of 4-methoxybenzylamine^ is 9.51 therefore at pH 7 the
amine will be mainly in the unreactive protonated form.
The reaction of 1.0 x 10" M 4-methoxybenzylamine with a constant aqueous
CH2(OH)(S03Na) concentration of 0.10 M was also followed at pH 5.1 to 10.1. The
kobs I s' values obtained are shown in Table 6.18. Figure 6.12 shows a plot of
\og(kobs I s' ) against pH.
237
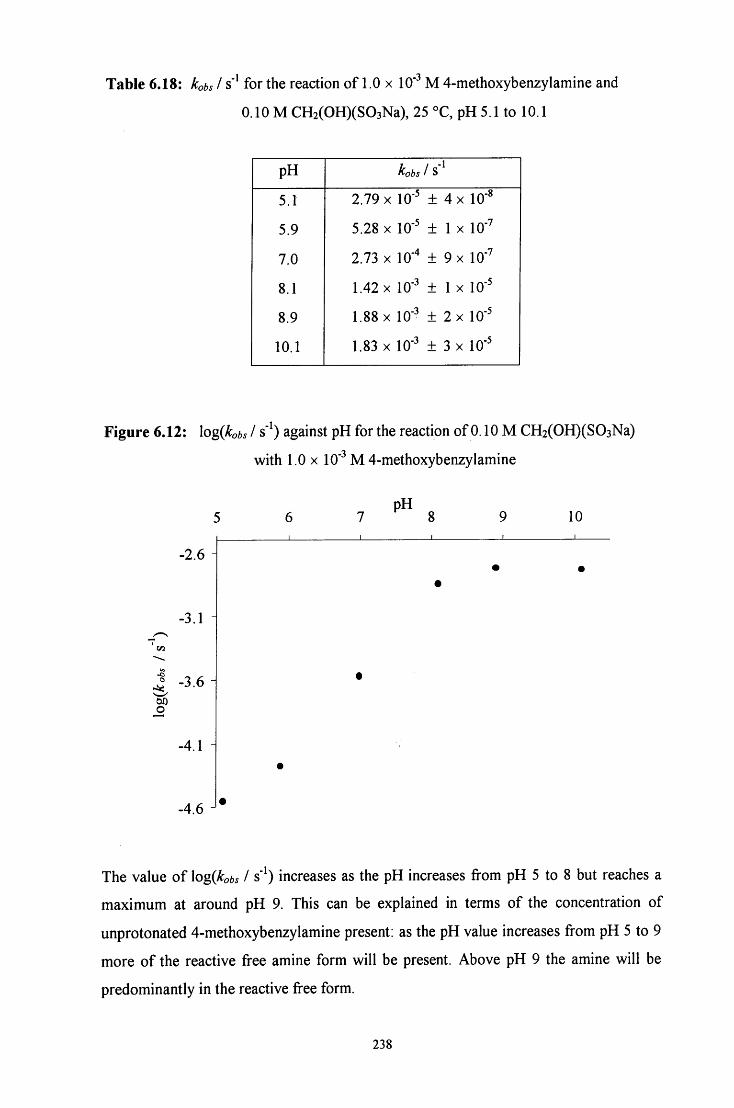
Table 6.18: kobs I s" for the reaction of 1.0 x 10" M 4-methoxybenzylamine and
0.10 M CH2(OH)(S03Na), 25 °C, pH 5.1 to 10.1
pH kobs I s '
5.1 2.79 X 10' ± 4 X 10'
5.9 5.28 X 10" ± 1 X 10'
7.0 2.73 X lO"'* ± 9 X 10"'
8.1 1.42 X 10' ± 1 X 10-
8.9 1.88 X 10- ± 2 X 10"
10.1 1.83 X 10' ± 3 X 10-
Figure 6.12: \og{kobs I s ' ) against pH for the reaction of 0.10 M CH2(OH)(S03Na)
with 1.0 X 10" M 4-methoxybenzylamine
-2.6
•3.1 H
00 o
-3.6
-4.1 H
-4.6
pH 10
The value of \o%{kobs I s"*) increases as the pH increases from pH 5 to 8 but reaches a
maximum at around pH 9. This can be explained in terms of the concentration of
unprotonated 4-methoxybenzylamine present: as the pH value increases from pH 5 to 9
more of the reactive free amine form will be present. Above pH 9 the amine will be
predominantly in the reactive free form.
238
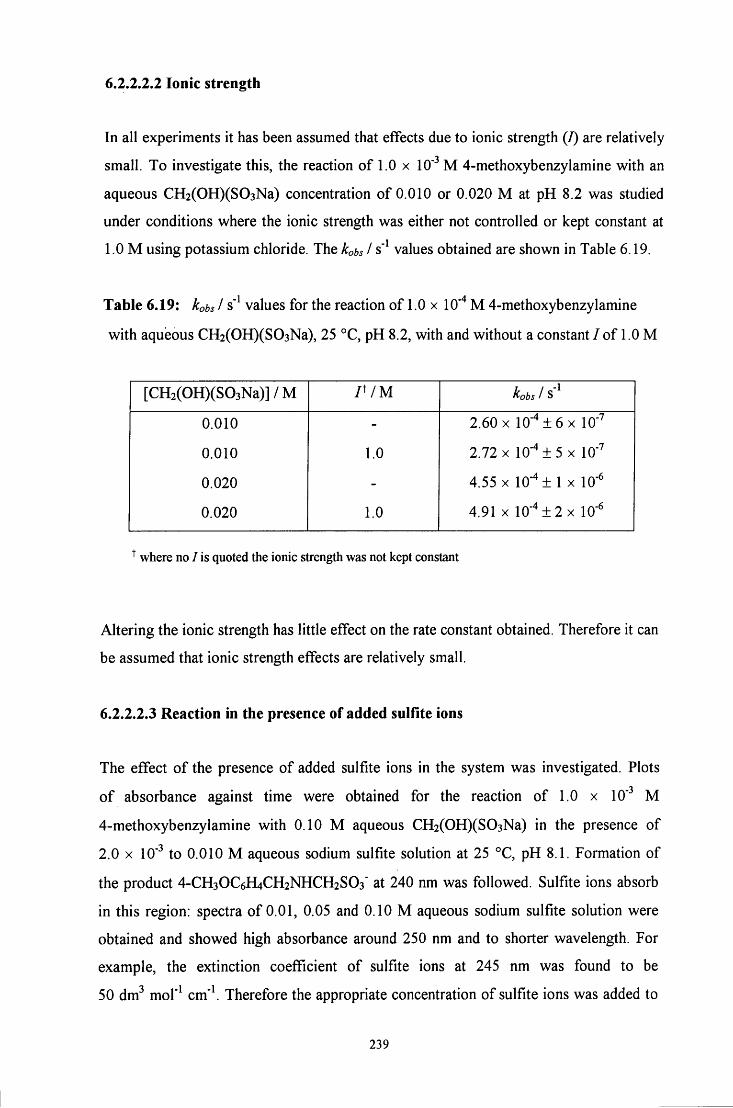
6.2.2.2.2 Ionic strength
In all experiments it has been assumed that effects due to ionic strength (I) are relatively
small. To investigate this, the reaction of 1.0 x 10'" M 4-methoxybenzylamine with an
aqueous CH2(OH)(S03Na) concentration of 0.010 or 0.020 M at pH 8.2 was studied
under conditions where the ionic strength was either not controlled or kept constant at
1.0 M using potassium chloride. The kobs I s' values obtained are shown in Table 6.19.
Table 6.19: kobs I s" values for the reaction of 1.0 x 10" M 4-methoxybenzylamine
with aqueous CH2(OH)(S03Na), 25 °C, pH 8.2, with and without a constant/of 1.0 M
[CH2(OH)(S03Na)]/M r / M kobs 1 S
0.010 - 2.60 X 10"^±6x 10"
0.010 1.0 2.72 X to"*! 5 X 10-
0.020 - 4.55 X 10"*± 1 X 10-
0.020 1.0 4.91 X 10"^±2x 10"
^ where no / is quoted the ionic strength was not kept constant
Altering the ionic strength has little effect on the rate constant obtained. Therefore it can
be assumed that ionic strength effects are relatively small.
6.2.2.2.3 Reaction in the presence of added sulfite ions
The effect of the presence of added sulfite ions in the system was investigated. Plots
of absorbance against time were obtained for the reaction of 1.0 x 10" M
4-methoxybenzylamine with 0.10 M aqueous CH2(OH)(S03Na) in the presence of
2.0 X 10'" to 0.010 M aqueous sodium sulfite solution at 25 °C, pH 8.1. Formation of
the product 4-CH3OC6H4CH2NHCH2SO3" at 240 nm was followed. Sulfite ions absorb
in this region: spectra of 0.01, 0.05 and 0.10 M aqueous sodium sulfite solution were
obtained and showed high absorbance around 250 nm and to shorter wavelength. For
example, the extinction coefficient of sulfite ions at 245 nm was found to be
50 dm^ mol"^ cm'\ Therefore the appropriate concentration of sulfite ions was added to
239
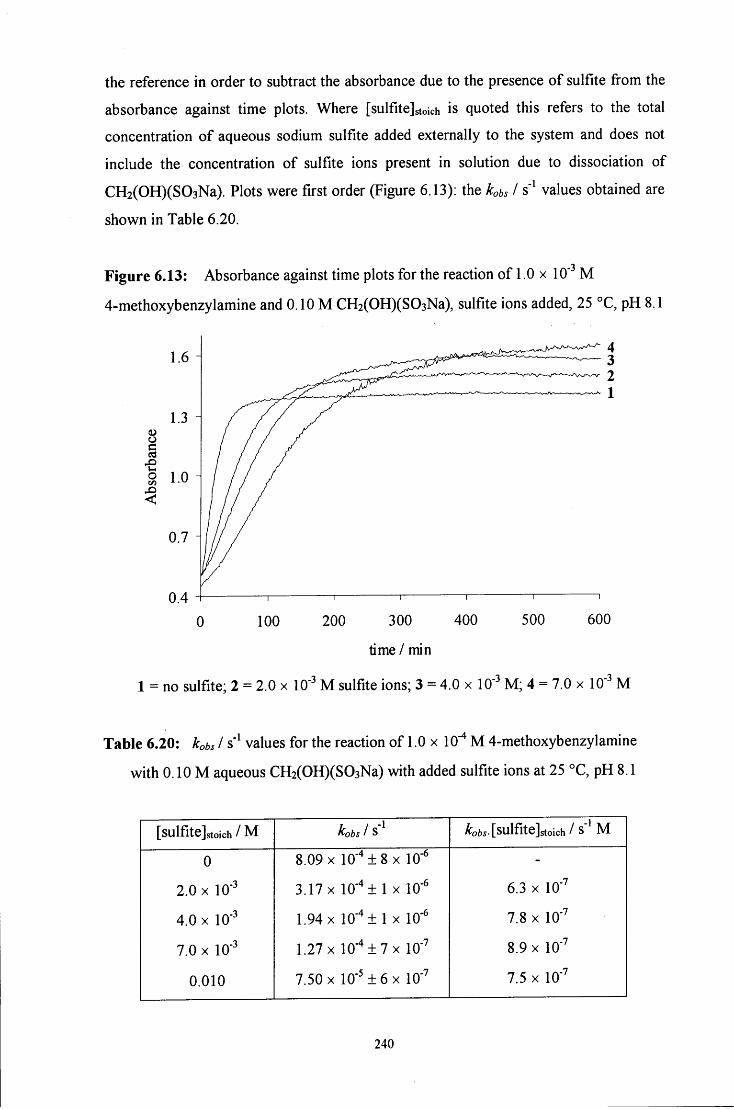
the reference in order to subtract the absorbance due to the presence of sulfite from the
absorbance against time plots. Where [sulfitejstoich is quoted this refers to the total
concentration of aqueous sodium sulfite added externally to the system and does not
include the concentration of sulfite ions present in solution due to dissociation of
CH2(OH)(S03Na). Plots were first order (Figure 6.13): the kobs I s'' values obtained are
shown in Table 6.20.
Figure 6.13: Absorbance against time plots for the reaction of 1.0 x 10" M
4-methoxybenzylamine and 0.10 M CH2(OH)(S03Na), sulfite ions added, 25 °C, pH 8.1
O
O
0.4 i \ \ \ r
0 100 200 300 400 500 600
time / min
1 = no sulfite; 2 = 2.0 x 10' M sulfite ions; 3 = 4.0 x 10" M ; 4 = 7.0 x 10" M
Table 6.20: kobs I s' values for the reaction of 1.0 x 10" M 4-methoxybenzylamine
with 0.10 M aqueous CH2(OH)(S03Na) with added sulfite ions at 25 °C, pH 8.1
[sulfite]stoich / M kobs 1 S ^oft5.[sulfite]stoich / s'' M
0 8.09 X 10"^±8x 10" -
2.0 X 10' 3.17 X 10- ± 1 X 10" 6.3 X 10'
4.0 X 10" 1.94 x 10" ± 1 X 10" 7.8 X 10-
7.0 X 10' 1.27 X 10"^±7x 10-" 8.9 X 10""
0.010 7.50 X 10" ± 6 X 10" 7.5 X 10-
240
The rate constant of reaction is considerably slower in the presence of added sulfite
ions. Multiplying Kbs I s" by [sulfitejstoich / M gives similar values which implies an
inverse dependence of kobs I s' on the sulfite ion concentration.
I f fi-ee formaldehyde, HCHO, is the reactive species in the reaction of
CH2(OH)(S03Na) with amines then the reaction must proceed initially via dissociation
of CH2(OH)(S03Na) to give HCHO (Chapter 4). I f this is the case, in the presence of
additional sulfite ions the rate of formation of the product 4-CH3OC6H4CH2NHCH2SO3"
may be expected to decrease as more free formaldehyde will react with the sulfite ions
to give the unreactive CH2(OH)(S03Na). Hence less free formaldehyde will be present
to react with the 4-methoxybenzylamine. The experimental results obtained here
support this theory.
6.2.3 Reaction of CH2(OH)(S03Na) with 4-niethylbenzylamine
6.2.3.1 NMR studies
The reaction of CH2(OH)(S03Na) with 4-methylbenzylamine in a 97 % D2O / 3 %
methyl-d3 alcohol-d, CD3OD, by volume solvent was followed using ^H NMR
spectroscopy. 4-Methylbenzylamine is not readily soluble in aqueous solution at the
concentrations required therefore a mixed solvent system was used. Lower
concentrations of reactants had to be used for this amine to be soluble in a solvent
system with this proportion of water. For comparison, the spectrum of 0.016 M
4-methylbenzylamine (6.3) in 97 % D2O / 3 % CD3OD by volume was obtained (Figure
6.14, Table 6.21).
CH2NH2
1 2
4 CH3
6.3
241
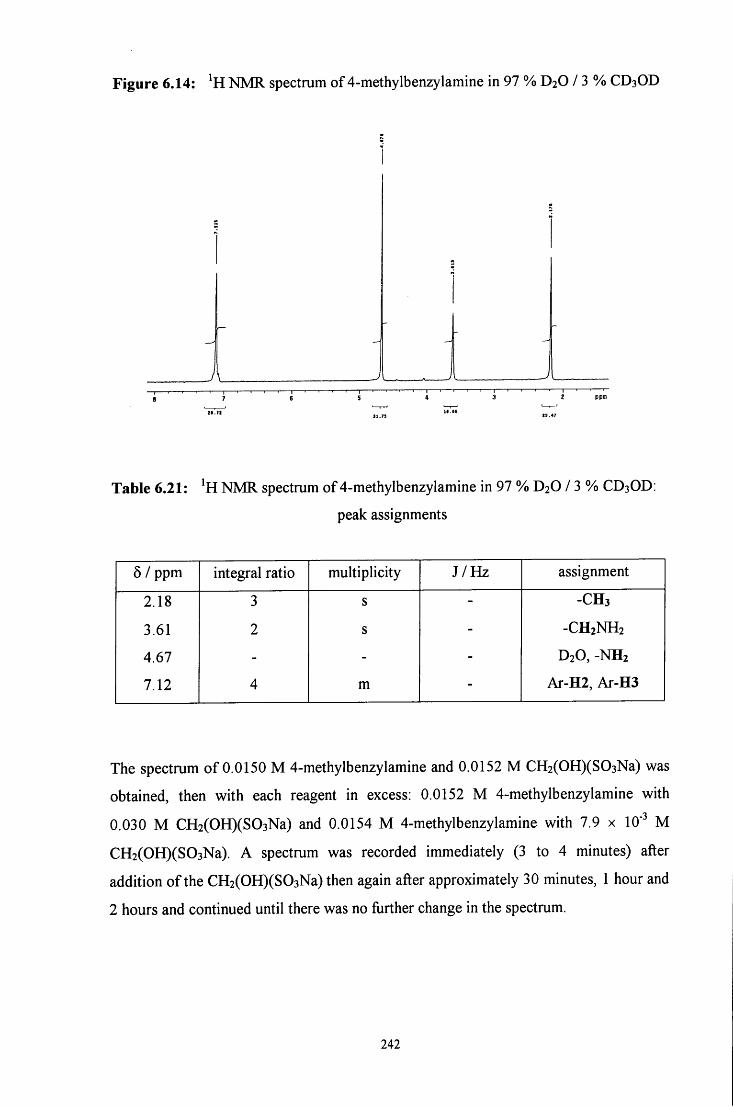
Figure 6.14: NMR spectrum of 4-methylbenzylamine in 97 % D2O / 3 % CD3OD
Table 6.21: NIVIR spectrum of 4-methylbenzylamine in 97 % D2O / 3 % CD3OD:
peak assignments
5 / ppm integral ratio multiplicity J /Hz assignment
2.18 3 s - -CH3
3.61 2 s - -CH2NH2
4.67 - - - D2O, -NH2
7.12 4 m - Ar-H2, Ar-H3
The spectrum of 0.0150 M 4-methylbenzylamine and 0.0152 M CH2(OH)(S03Na) was
obtained, then with each reagent in excess: 0.0152 M 4-methylbenzylamine with
0.030 M CH2(OH)(S03Na) and 0.0154 M 4-methylbenzylamine with 7.9 x 10" M
CH2(OH)(S03Na). A spectrum was recorded immediately (3 to 4 minutes) after
addition of the CH2(OH)(S03Na) then again after approximately 30 minutes, 1 hour and
2 hours and continued until there was no fiirther change in the spectrum.
242
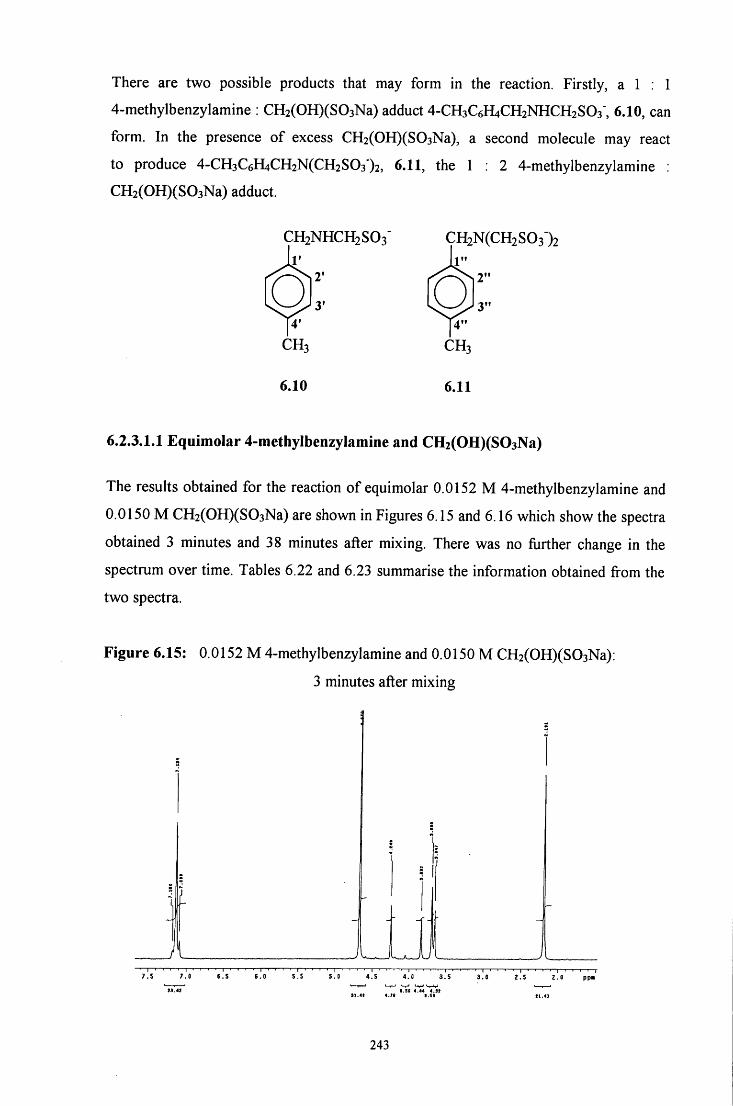
There are two possible products that may form in the reaction. Firstly, a 1 : 1
4-methylbenzylamine : CH2(OH)(S03Na) adduct 4-CH3C6H4CH2NHCH2S03', 6.10, can
form. In the presence of excess CH2(OH)(S03Na), a second molecule may react
to produce 4-CH3C6H4CH2N(CH2S03')2, 6.11, the 1 : 2 4-methylbenzylamine :
CH2(OH)(S03Na) adduct.
CHiNHCHsSOs" 1'
2' Q 3' 4'
CH3
CH2N(CH2S03")2 1"
2" Q 3" 4"
CH3
6.10 6.11
6.2.3.1.1 Equimolar 4-niethyIbenzylamine and CH2(OH)(S03Na)
The results obtained for the reaction of equimolar 0.0152 M 4-methylbenzylamine and
0.0150 M CH2(OH)(S03Na) are shown in Figures 6.15 and 6.16 which show the spectra
obtained 3 minutes and 38 minutes after mixing. There was no fiirther change in the
spectrum over fime. Tables 6.22 and 6.23 summarise the information obtained fi-om the
two spectra.
Figure 6.15: 0.0152 M 4-methylbenzylamine and 0.0150 M CH2(OH)(S03Na):
3 minutes after mixing
7 . S 7 . 0 6 . S 6 . 0
» . 4 t
LLJJl 91.41 4-;c
0.5( 4.44 4-J>
' I ' I , . I , I . , I I I , , , I , , S . S 5 . 0 4 . 5 4 . 0 3 . 5 3 . 0 2 . 5 2 . 0 p p a
243
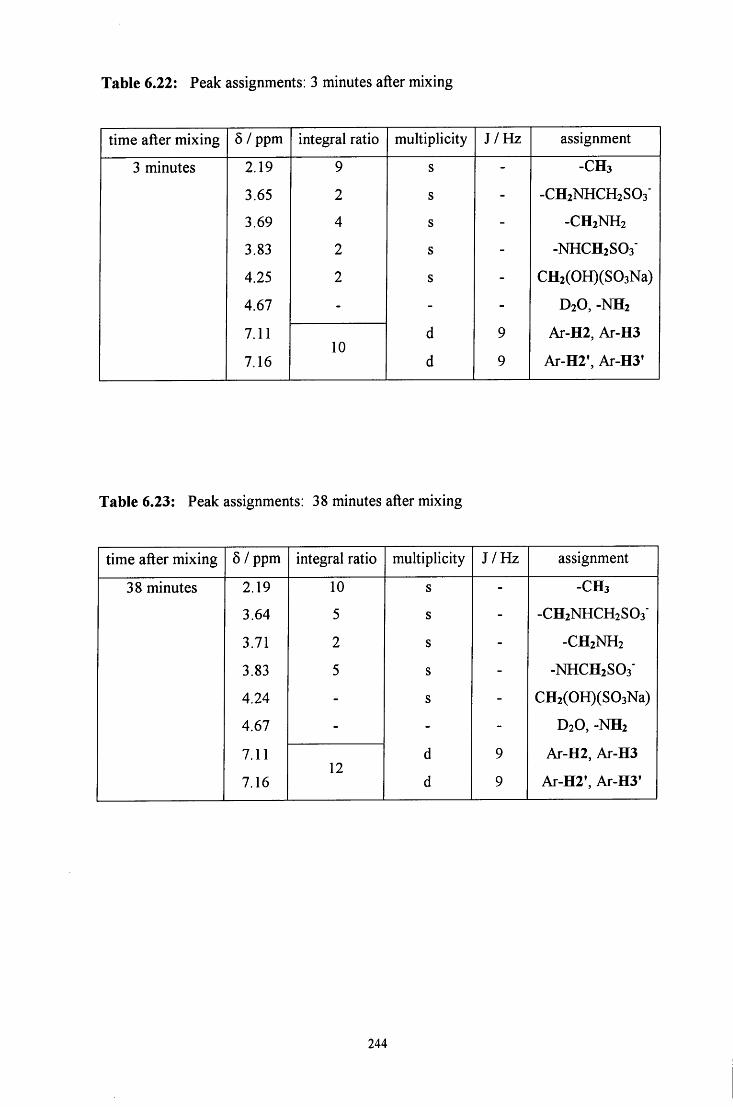
Table 6.22: Peak assignments: 3 minutes after mixing
time after mixing 6 / ppm integral ratio multiplicity J /Hz assignment
3 minutes 2.19 9 s - -CH3
3.65 2 s - -CHzNHCHsSOs-
3.69 4 s - -CH2NH2
3.83 2 s - -NHCH2SO3"
4.25 2 s - CH2(OH)(S03Na)
4.67 - - - D2O, -NH2
7.11 d 9 Ar-H2, Ar-H3 10
Ar-H2, Ar-H3
7.16 d 9 Ar-H2', Ar-H3'
Table 6.23: Peak assignments: 38 minutes after mixing
time after mixing 5 / ppm integral ratio multiplicity J /Hz assignment
38 minutes 2.19 10 s - -CH3
3.64 5 s - -CH2NHCH2SO3"
3.71 2 s - -CH2NH2
3.83 5 s - -NHCH2SO3"
4.24 - s - CH2(OH)(S03Na)
4.67 - - - D2O, -NH2
7.11 d 9 Ar-H2, Ar-H3 12
Ar-H2, Ar-H3
7.16 d 9 Ar-H2', Ar-H3'
244
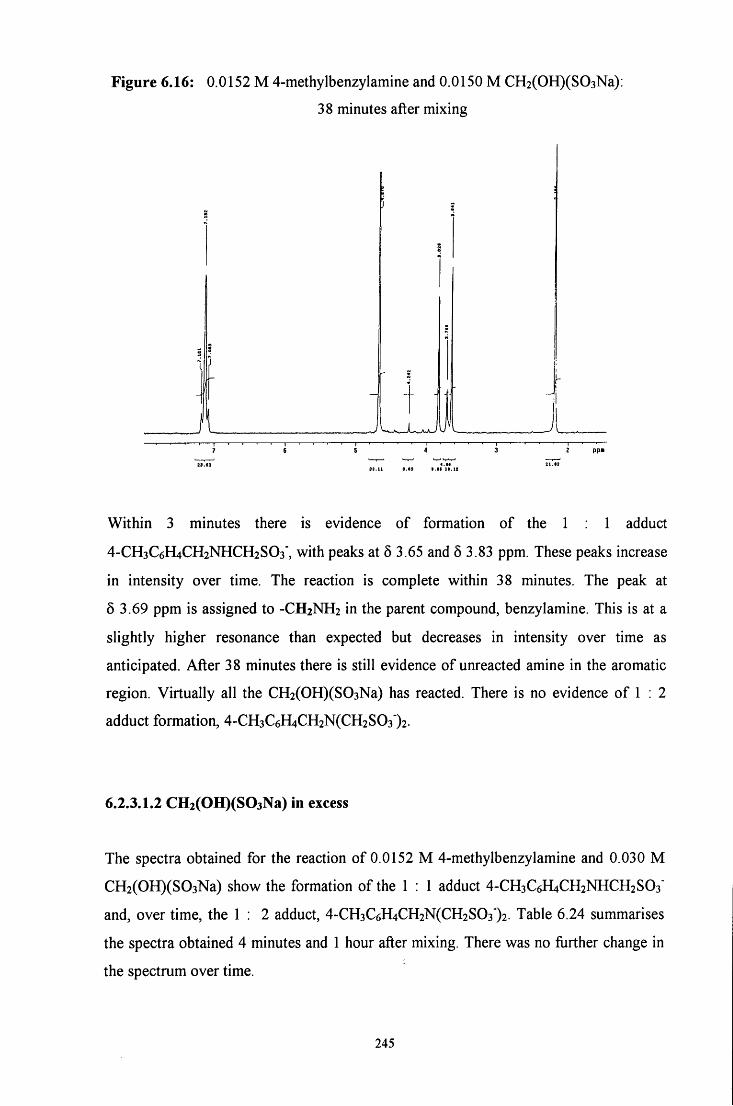
Figure 6.16: 0.0152 M 4-methylbenzylamine and 0.0150 M CH2(OH)(S03Na):
38 minutes after mixing
I
3 ) . I I I .a t I t . I t
Within 3 minutes there is evidence of formation of the 1 : 1 adduct
4-CH3C6H4CH2NHCH2SO3", with peaks at 5 3.65 and 5 3.83 ppm. These peaks increase
in intensity over time. The reaction is complete within 38 minutes. The peak at
6 3.69 ppm is assigned to -CH2NH2 in the parent compound, benzylamine. This is at a
slightly higher resonance than expected but decreases in intensity over time as
anticipated. After 38 minutes there is still evidence of unreacted amine in the aromatic
region. Virtually all the CH2(OH)(S03Na) has reacted. There is no evidence of 1 : 2
adduct formation, 4-CH3C6H4CH2N(CH2S03')2.
6.2.3.1.2 CH2(OH)(S03Na) in excess
The spectra obtained for the reaction of 0.0152 M 4-methylbenzylamine and 0.030 M
CH2(OH)(S03Na) show the formation of the 1 : 1 adduct 4-CH3C6H4CH2NHCH2S03'
and, over time, the 1 : 2 adduct, 4-CH3C6H4CH2N(CH2S03")2. Table 6.24 summarises
the spectra obtained 4 minutes and 1 hour after mixing. There was no further change in
the spectrum over time.
245
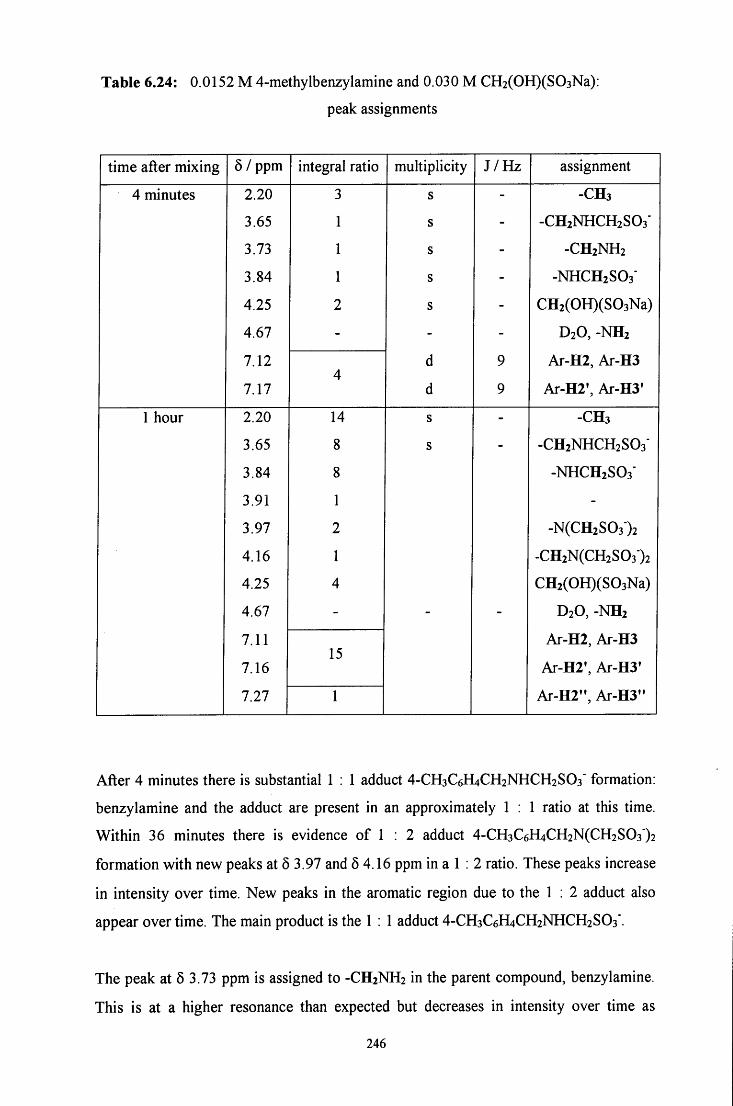
Table 6.24: 0.0152 M 4-methylbenzylamine and 0.030 M CH2(OH)(S03Na):
peak assignments
time after mixing 5 / ppm integral ratio multiplicity J /Hz assignment
4 minutes 2.20 3 s - -CH3
3.65 1 s - -CH2NHCH2S03'
3.73 1 s - -CH2NH2
3.84 1 s - -NHCH2SO3"
4.25 2 s - CH2(OH)(S03Na)
4.67 - - - D2O, -NH2
7.12
7.17 4
d
d
9
9
Ar-H2, Ar-H3
Ar-H2', Ar-H3'
1 hour 2.20 14 s - -CH3
3.65 8 s - -CH2NHCH2S03'
3.84 8 -NHCH2SO3"
3.91 1 -
3.97 2 -N(CH2S03-)2
4.16 1 -CH2N(CH2S03")2
4.25 4 CH2(OH)(S03Na)
4.67 - - - D2O, -NH2
7.11
7.16 15
Ar-H2, Ar-H3
Ar-H2', Ar-H3'
7.27 1 Ar-H2", Ar-H3"
After 4 minutes there is substantial 1 : 1 adduct 4-CH3C6H4CH2NHCH2SO3" formation:
benzylamine and the adduct are present in an approximately 1 : 1 ratio at this time.
Within 36 minutes there is evidence of 1 : 2 adduct 4-CH3C6H4CH2N(CH2S03')2
formation with new peaks at 6 3.97 and 5 4.16 ppm in a 1 : 2 ratio. These peaks increase
in intensity over time. New peaks in the aromatic region due to the 1 : 2 adduct also
appear over time. The main product is the 1 : 1 adduct 4-CH3C6H4CH2NHCH2SO3*.
The peak at 5 3.73 ppm is assigned to -CH2NH2 in the parent compound, benzylamine.
This is at a higher resonance than expected but decreases in intensity over time as
246
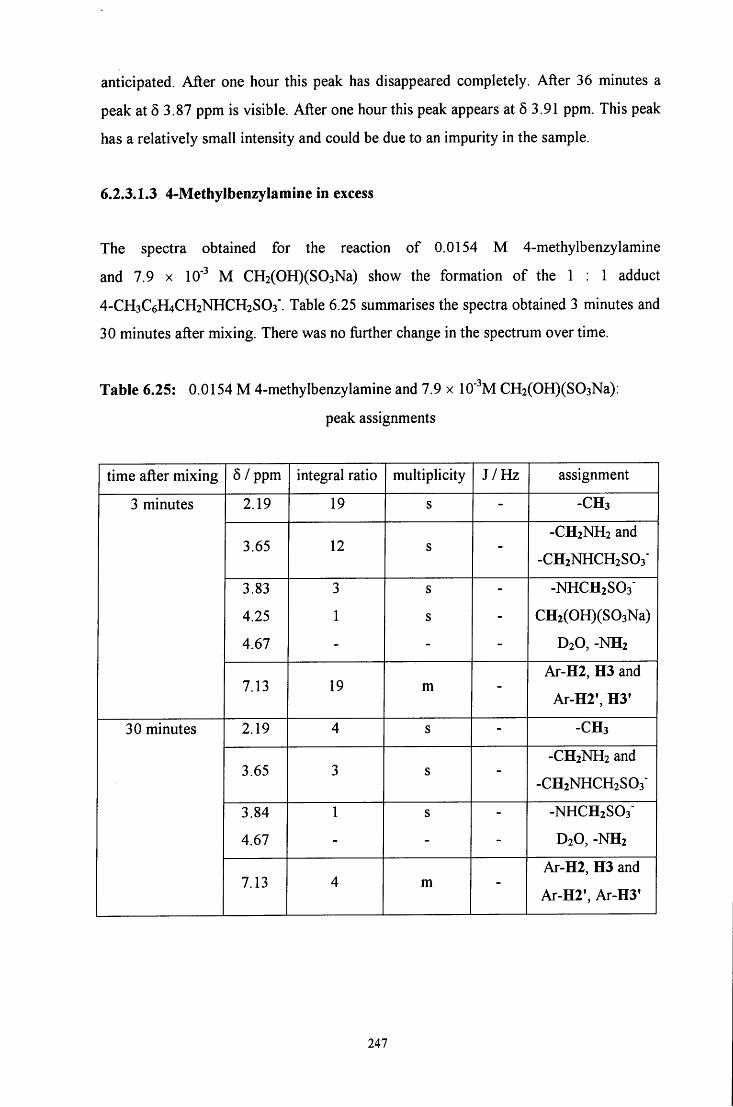
anticipated. After one hour this peak has disappeared completely. After 36 minutes a
peak at 5 3.87 ppm is visible. After one hour this peak appears at 5 3.91 ppm. This peak
has a relatively small intensity and could be due to an impurity in the sample.
6.2.3.1.3 4-MethyibenzyIamine in excess
The spectra obtained for the reaction of 0.0154 M 4-methylbenzylamine
and 7.9 x 10" M CH2(OH)(S03Na) show the formation of the 1 : 1 adduct
4-CH3C6H4CH2NHCH2SO3'. Table 6.25 summarises the spectra obtained 3 minutes and
30 minutes after mixing. There was no fiirther change in the spectrum over time.
Table 6.25: 0.0154 M 4-methylbenzylamine and 7.9 x lO^^M CH2(OH)(S03Na):
peak assignments
time after mixing 6 / ppm integral ratio muhiplicity J /Hz assignment
3 minutes 2.19 19 s - -CH3 3 minutes
3.65 12 s --CH2NH2 and
-CH2NHCH2S03'
3 minutes
3.83
4.25
4.67
3
1
s
s -
-NHCH2SO3"
CH2(OH)(S03Na)
D2O, -NH2
3 minutes
7.13 19 m -Ar-H2, H3 and
Ar-H2', H3'
30 minutes 2.19 4 s - -CH3 30 minutes
3.65 3 s --CH2NH2 and
-CH2NHCH2S03'
30 minutes
3.84
4.67
1 s
-
-NHCH2S03'
D2O, -NH2
30 minutes
7.13 4 m -Ar-H2, H3 and
Ar-H2', Ar-H3'
247
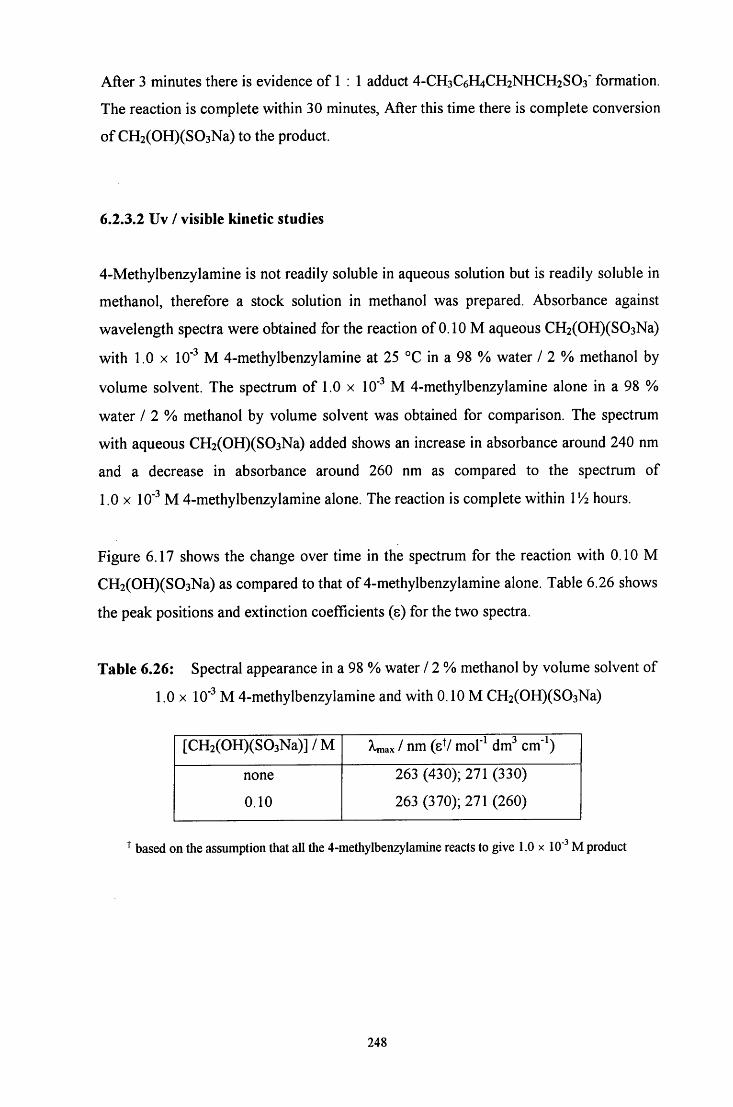
After 3 minutes there is evidence of 1 : 1 adduct 4-CH3C6H4CH2NHCH2SO3' formation.
The reaction is complete within 30 minutes. After this time there is complete conversion
of CH2(OH)(S03Na) to the product.
6.2.3.2 Uv / visible kinetic studies
4-Methylbenzylamine is not readily soluble in aqueous solution but is readily soluble in
methanol, therefore a stock solution in methanol was prepared. Absorbance against
wavelength spectra were obtained for the reaction of 0.10 M aqueous CH2(OH)(S03Na)
with 1.0 X 10" M 4-methylbenzylamine at 25 °C in a 98 % water / 2 % methanol by
volume solvent. The spectrum of 1.0 x 10" M 4-methylbenzylamine alone in a 98 %
water / 2 % methanol by volume solvent was obtained for comparison. The spectrum
with aqueous CH2(OH)(S03Na) added shows an increase in absorbance around 240 nm
and a decrease in absorbance around 260 nm as compared to the spectrum of
1.0 X 10' M 4-methylbenzylamine alone. The reaction is complete within VA hours.
Figure 6.17 shows the change over time in the spectrum for the reaction with 0.10 M
CH2(OH)(S03Na) as compared to that of 4-methylbenzylamine alone. Table 6.26 shows
the peak positions and extinction coefficients (s) for the two spectra.
Table 6.26: Spectral appearance in a 98 % water / 2 % methanol by volume solvent of
1.0 X 10' M 4-methylbenzylamine and with 0.10 M CH2(OH)(S03Na)
[CH2(OH)(S03Na)]/M > ax / nm (eV mol"^ dm" cm'^)
none
0.10
263 (430); 271 (330)
263 (370); 271 (260)
based on the assumption that all the 4-methylbenzylamine reacts to give 1.0 x 10' M product
248
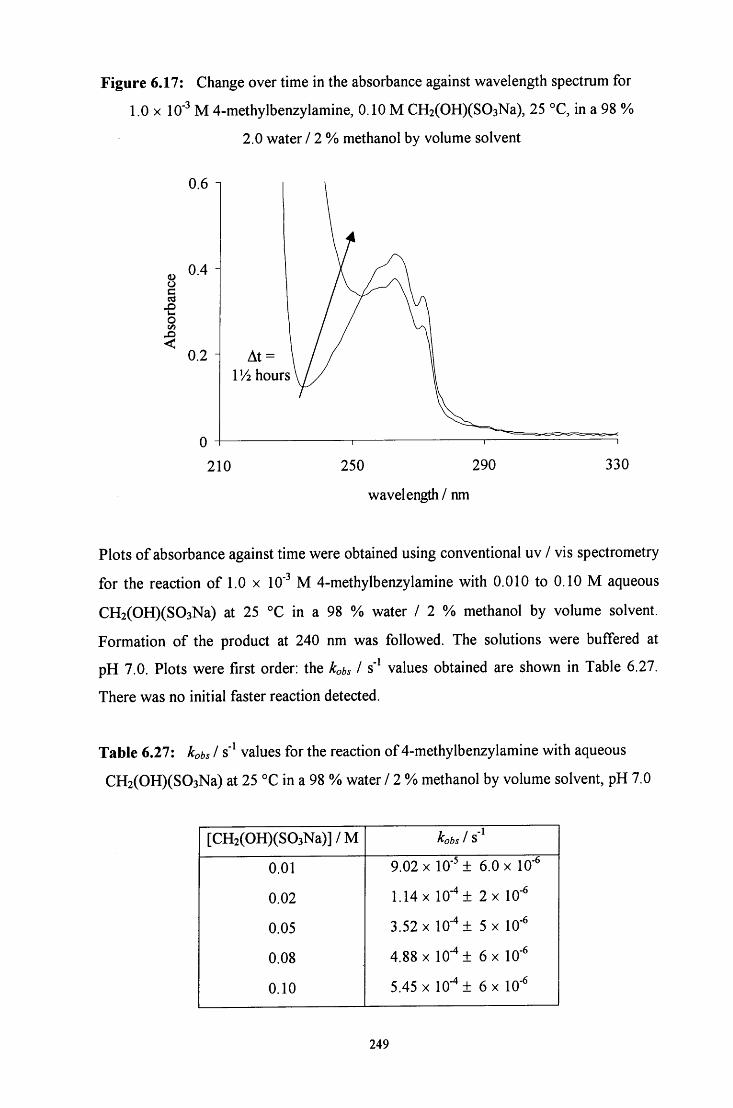
Figure 6.17: Change over time in the absorbance against wavelength spectrum for
1.0 X 10- M 4-methylbenzylamine, 0.10 M CH2(OH)(S03Na), 25 °C, in a 98 %
2.0 water / 2 % methanol by volume solvent
0.6
I o
0.4
0.2 H At = VA hours
210 250 290
wavelength / nm
330
Plots of absorbance against time were obtained using conventional uv / vis spectrometry
for the reaction of 1.0 x 10" M 4-methylbenzylamine with 0.010 to 0.10 M aqueous
CH2(OH)(S03Na) at 25 °C in a 98 % water / 2 % methanol by volume solvent.
Formation of the product at 240 nm was followed. The solutions were buffered at
pH 7.0. Plots were first order: the kobs I s' values obtained are shown in Table 6.27.
There was no initial faster reaction detected.
Table 6.27: kobs I s" values for the reaction of 4-methylbenzylamine with aqueous
CH2(OH)(S03Na) at 25 °C in a 98 % water / 2 % methanol by volume solvent, pH 7.0
[CH2(OH)(S03Na)]/M kobs 1 S
0.01 9.02 X 10' ± 6.0 X 10"
0.02 1.14 X 10"^± 2x 10"
0.05 3.52 X 10-^± 5 X 10'
0.08 4.88 X 10' ± 6x 10"
0.10 5.45 X 10"* + 6 X 10-
249
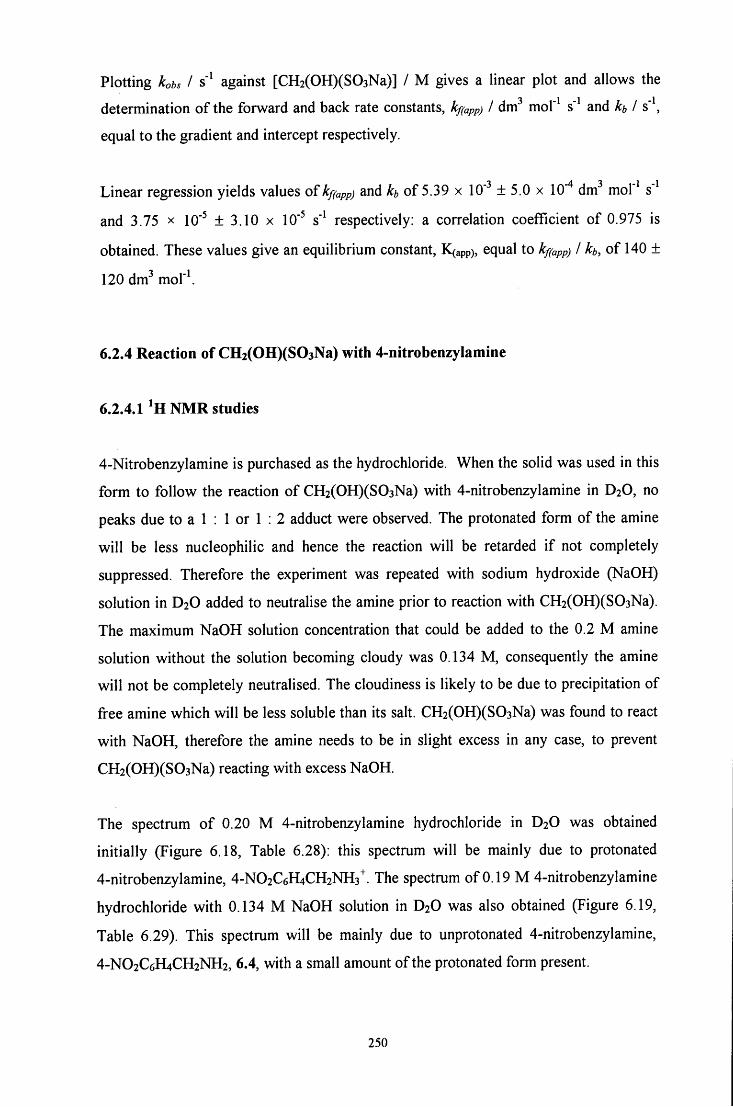
Plotting kobs I s" against [CH2(OH)(S03Na)] / M gives a linear plot and allows the
determination of the forward and back rate constants, kf(app) I dm^ mol'^ s" and h i s'\
equal to the gradient and intercept respectively.
Linear regression yields values of kf(app) and A: of 5.39 x 10' ± 5.0 x 10" dm^ mol"^ s'
and 3.75 x lO" ± 3.10 x 10' s" respectively: a correlation coefficient of 0.975 is
obtained. These values give an equilibrium constant, K(app), equal to kf(app) I h, of 140 ±
120 dm^ mo\'\
6.1 A Reaction of CH2(OH)(S03Na) with 4-nitrobenzylamine
6.2.4.1 NMR studies
4-Nitrobenzylamine is purchased as the hydrochloride. When the solid was used in this
form to follow the reaction of CH2(OH)(S03Na) with 4-nitrobenzylamine in D2O, no
peaks due to a 1 : 1 or 1 : 2 adduct were observed. The protonated form of the amine
wil l be less nucleophilic and hence the reaction will be retarded i f not completely
suppressed. Therefore the experiment was repeated with sodium hydroxide (NaOH)
solution in D2O added to neutralise the amine prior to reaction with CH2(OH)(S03Na).
The maximum NaOH solution concentration that could be added to the 0.2 M amine
solution without the solution becoming cloudy was 0.134 M , consequently the amine
wil l not be completely neutralised. The cloudiness is likely to be due to precipitation of
free amine which will be less soluble than its salt. CH2(OH)(S03Na) was found to react
with NaOH, therefore the amine needs to be in slight excess in any case, to prevent
CH2(OH)(S03Na) reacting with excess NaOH.
The spectrum of 0.20 M 4-nitrobenzylamine hydrochloride in D2O was obtained
initially (Figure 6.18, Table 6.28): this spectrum will be mainly due to protonated
4-nitrobenzylamine, 4-N02C6H4CH2NH3^. The spectrum of 0.19 M 4-nitrobenzylamine
hydrochloride with 0.134 M NaOH solution in D2O was also obtained (Figure 6.19,
Table 6.29). This spectrum will be mainly due to unprotonated 4-nitrobenzylamine,
4-NO2C6H4CH2NH2, 6.4, with a small amount of the protonated form present.
250
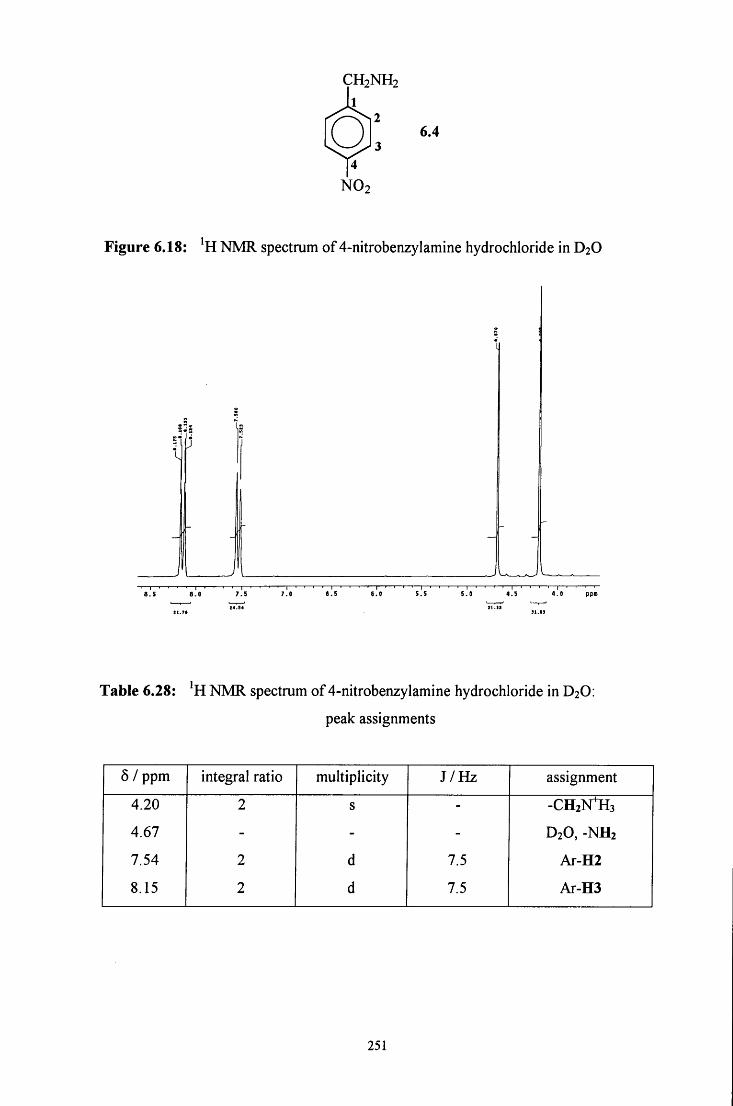
CH2NH2 1
Q 6.4
4 NO2
Figure 6.18: NMR spectrum of 4-nitrobenzylamine hydrochloride in D2O
Table 6.28: NMR spectrum of 4-nitrobenzylamine hydrochloride in D2O:
peak assignments
6 / ppm integral ratio multiplicity J /Hz assignment
4.20 2 s - -CH2]SrH3
4.67 - - - D2O, -NH2
7.54 2 d 7.5 Ar-H2
8.15 2 d 7.5 Ar-H3
251
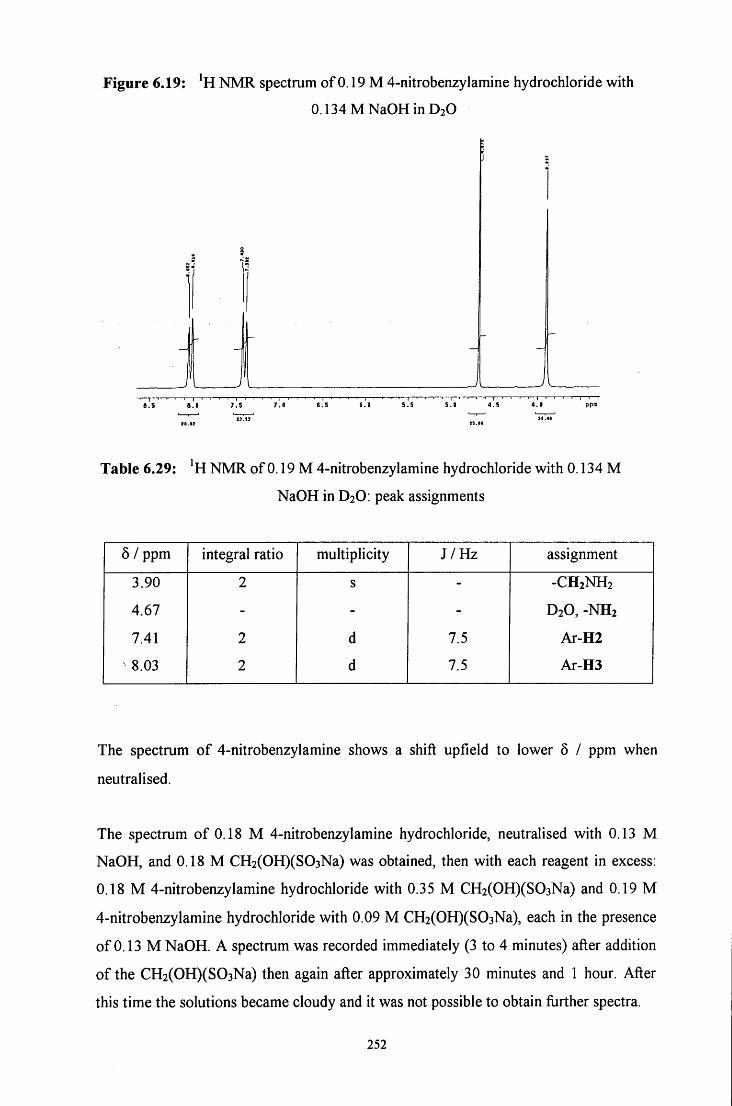
Figure 6.19: NMR spectrum of 0.19 M 4-nitrobenzylamine hydrochloride with
0.134MNaOHinD2O
Table 6.29: NMR of 0.19 M 4-nitrobenzylamine hydrochloride with 0.134 M
NaOH in D2O: peak assignments
6 / ppm integral ratio multiplicity J /Hz assignment
3.90 2 s - -CH2NH2
4.67 - - - D2O, -NH2
7.41 2 d 7.5 Ar-H2
8.03 2 d 7.5 Ar-H3
The spectrum of 4-nitrobenzylamine shows a shift upfield to lower 5 / ppm when
neutralised.
The spectrum of 0.18 M 4-nitrobenzylamine hydrochloride, neutralised with 0.13 M
NaOH, and 0.18 M CH2(OH)(S03Na) was obtained, then with each reagent in excess:
0.18 M 4-nitrobenzylamine hydrochloride with 0.35 M CH2(OH)(S03Na) and 0.19 M
4-nitrobenzylamine hydrochloride with 0.09 M CH2(OH)(S03Na), each in the presence
of 0.13 M NaOH. A spectrum was recorded immediately (3 to 4 minutes) after addition
of the CH2(OH)(S03Na) then again after approximately 30 minutes and 1 hour. After
this time the solutions became cloudy and it was not possible to obtain further spectra.
252
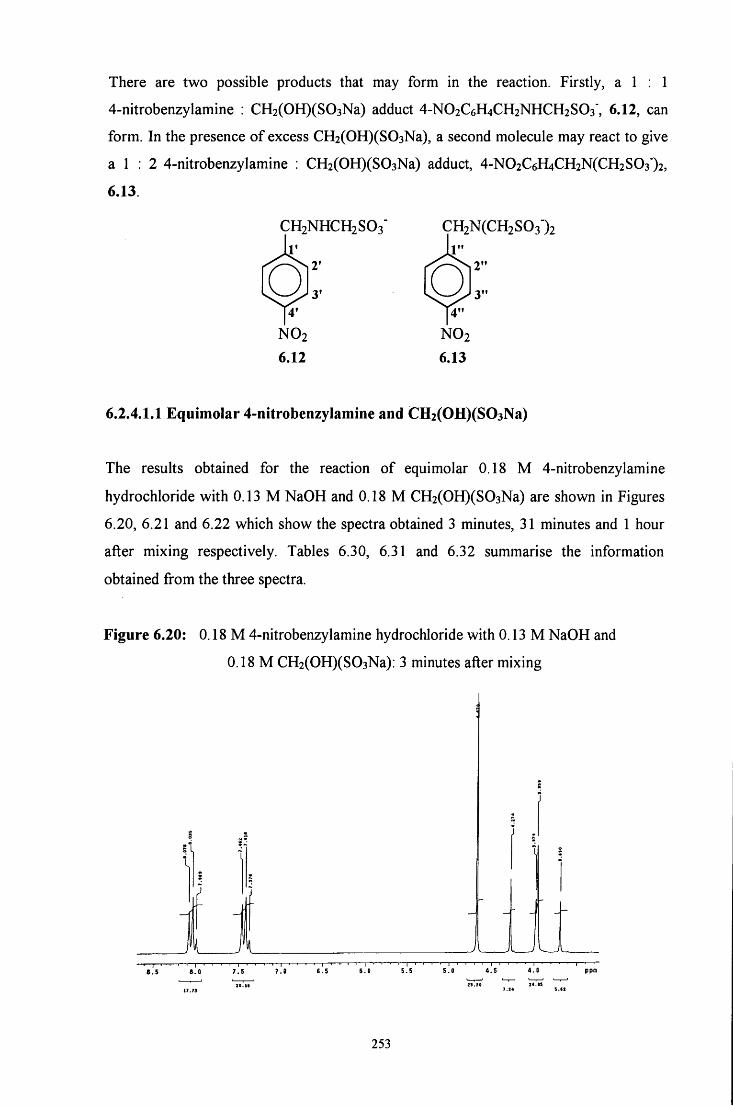
There are two possible products that may form in the reaction. Firstly, a 1 : 1
4-nitrobenzylamine : CH2(OH)(S03Na) adduct 4-NO2C6H4CH2NHCH2SO3", 6.12, can
form. In the presence of excess CH2(OH)(S03Na), a second molecule may react to give
a 1 : 2 4-nitrobenzylamine : CH2(0H)(S03Na) adduct, 4-N02C6H4CH2N(CH2S03')2,
6.13
CH2NHCH2SO3"
r
Q 4'
NO2
6.12
CH2N(CH2S03")2
1" 2"
3" 4"
NO2
6.13
6.2.4.1.1 Equimolar 4-nitrobenzylamine and CH2(OH)(S03Na)
The results obtained for the reaction of equimolar 0.18 M 4-nitrobenzylamine
hydrochloride with 0.13 M NaOH and 0.18 M CH2(OH)(S03Na) are shown in Figures
6.20, 6.21 and 6.22 which show the spectra obtained 3 minutes, 31 minutes and 1 hour
after mixing respectively. Tables 6.30, 6.31 and 6.32 summarise the information
obtained from the three spectra.
Figure 6.20: 0.18 M 4-nitrobenzylamine hydrochloride with 0.13 M NaOH and
0.18 M CH2(OH)(S03Na). 3 minutes after mixing
• I ' 8.5 8.0 7.5 7.9 S.5
J I JL I S.O 4.5
2s.>a
4.0 ppm
2<.05
253
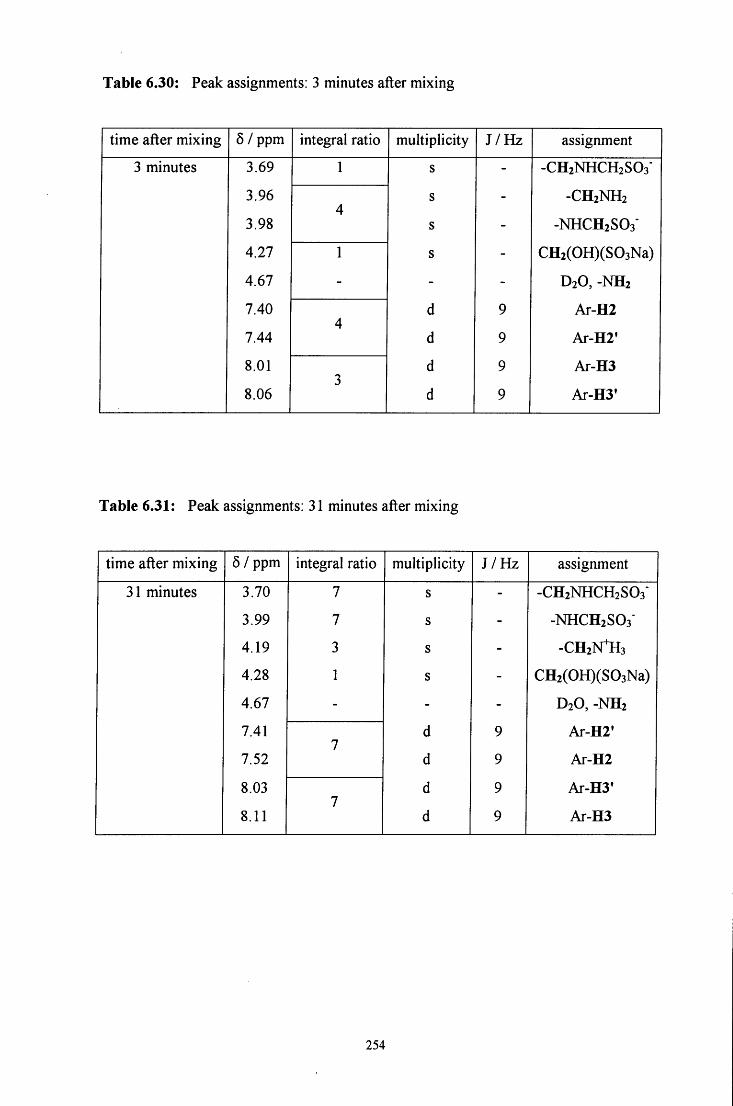
Table 6.30: Peak assignments: 3 minutes after mixing
time after mixing 5 / ppm integral ratio multiplicity J / H z assignment
3 minutes 3.69 1 s - -CH2NHCH2S03'
3.96 s _ -CH2NH2 4
-CH2NH2
3.98 s - -NHCH2SO3'
4.27 1 s - CH2(OH)(S03Na)
4.67 - - - D2O, -NH2
7.40 d 9 Ar-H2 4
7.44 d 9 Ar-H2'
8.01 d 9 Ar-H3
8.06 d 9 Ar-H3'
Table 6.31: Peak assignments: 31 minutes after mixing
time after mixing 5 / ppm integral ratio multiplicity J / H z assignment
31 minutes 3.70 7 s - -CH2NHCH2SO3"
3.99 7 s - -NHCH2S03'
4.19 3 s - -CH2Nll3
4.28 1 s - CH2(OH)(S03Na)
4.67 - - - D2O, -NH2
7.41 7 d 9 Ar-H2'
7.52 /
d 9 Ar-H2
8.03 7 d 9 Ar-H3'
8.11 /
d 9 Ar-H3
254
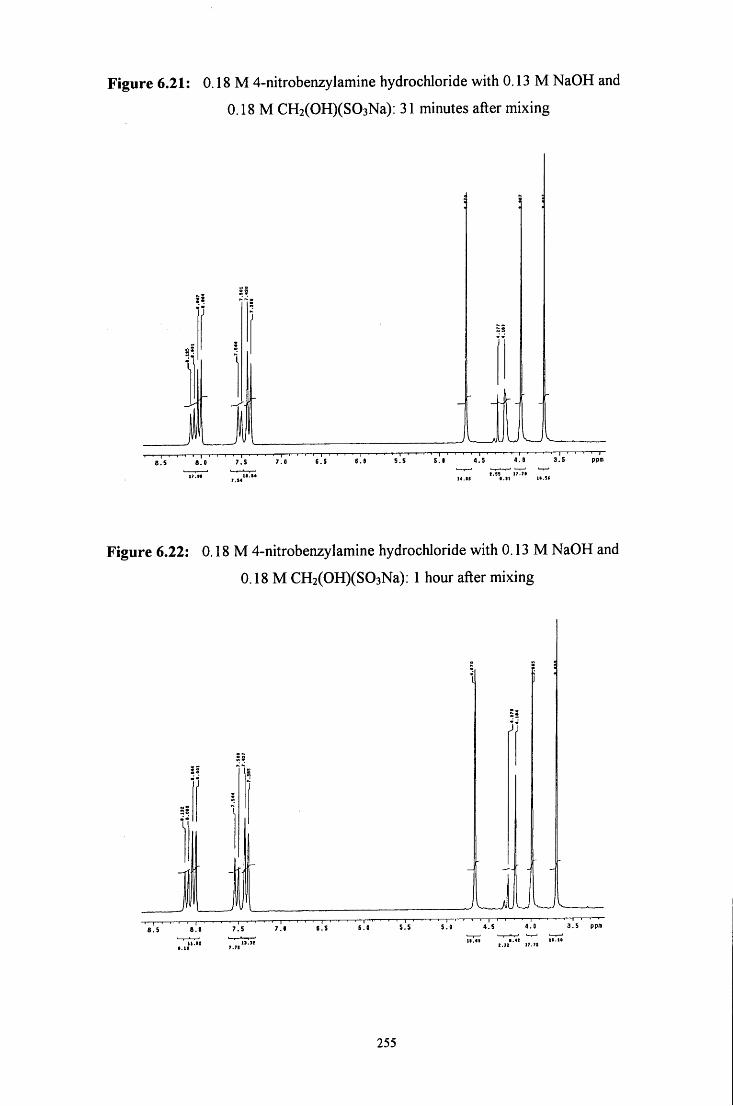
Figure 6.21: 0.18 M 4-nitrobenzylamine hydrochloride with 0.13 M NaOH and
0.18 M CH2(OH)(S03Na): 31 minutes after mixing
I I I I I • 1 ' 8.5 8.0 7.S 7.0 6.5 6 .0
17.H 11.1 I4.it e.ii l i .si
Figure 6.22: 0.18 M 4-nitrobenzylamine hydrochloride with 0.13 M NaOH and
0.18 M CH2(OH)(S03Na): 1 hour after mixing
S 1 \ J
J L ^ J U U L J - , — I — 1 — I — I — r I ' ' ' ' I i ' I I ' • ' I
i i . i t . , . " « •.to »-'t
5 6.0 5.5 5.0 4.5 4.0 3.5 ppia
ii!<i •.«» ««.i« J.J2
255
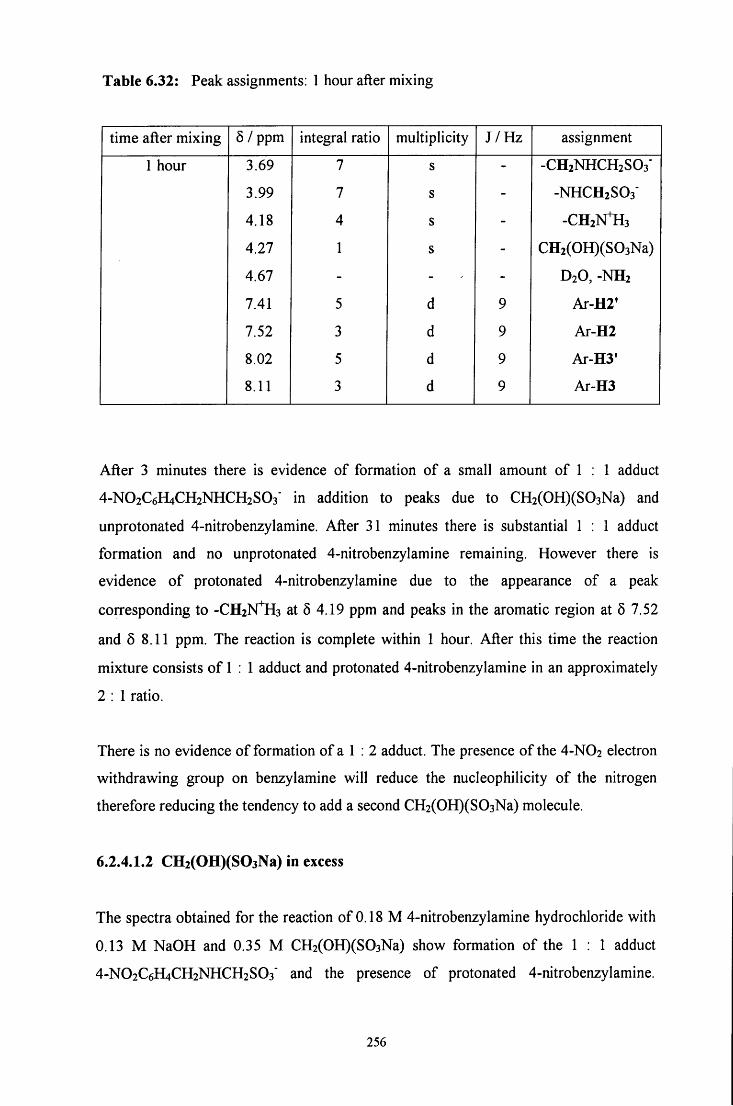
Table 6.32: Peak assignments: 1 hour after mixing
time after mixing 6 / ppm integral ratio multiplicity J / H z assignment
1 hour 3.69 7 s - -CH2NHCH2SO3"
3.99 7 s - -NHCH2S03'
4.18 4 s - -CH2N^3
4.27 1 s - CH2(OH)(S03Na)
4.67 - - - D2O, -NH2
7.41 5 d 9 Ar-H2'
7.52 3 d 9 Ar-H2
8.02 5 d 9 Ar-H3'
8.11 3 d 9 Ar-H3
After 3 minutes there is evidence of formation of a small amount of 1 : 1 adduct
4-NO2C6H4CH2NHCH2SO3" in addition to peaks due to CH2(OH)(S03Na) and
unprotonated 4-nitrobenzylamine. After 31 minutes there is substantial 1 : 1 adduct
formation and no unprotonated 4-nitrobenzylamine remaining. However there is
evidence of protonated 4-nitrobenzylamine due to the appearance of a peak
corresponding to - C H 2 N ^ 3 at 5 4.19 ppm and peaks in the aromatic region at 5 7.52
and 5 8.11 ppm. The reaction is complete within 1 hour. After this time the reaction
mixture consists of 1 : 1 adduct and protonated 4-nitrobenzylamine in an approximately
2 : 1 ratio.
There is no evidence of formation of a 1 : 2 adduct. The presence of the 4-NO2 electron
withdrawing group on benzylamine will reduce the nucleophilicity of the nitrogen
therefore reducing the tendency to add a second CH2(OH)(S03Na) molecule.
6.2.4.1.2 CH2(OH)(S03Na) in excess
The spectra obtained for the reaction of 0.18 M 4-nitrobenzylamine hydrochloride with
0.13 M NaOH and 0.35 M CH2(OH)(S03Na) show formation of the 1 : 1 adduct
4-NO2C6H4CH2NHCH2SO3" and the presence of protonated 4-nitrobenzylamine.
256
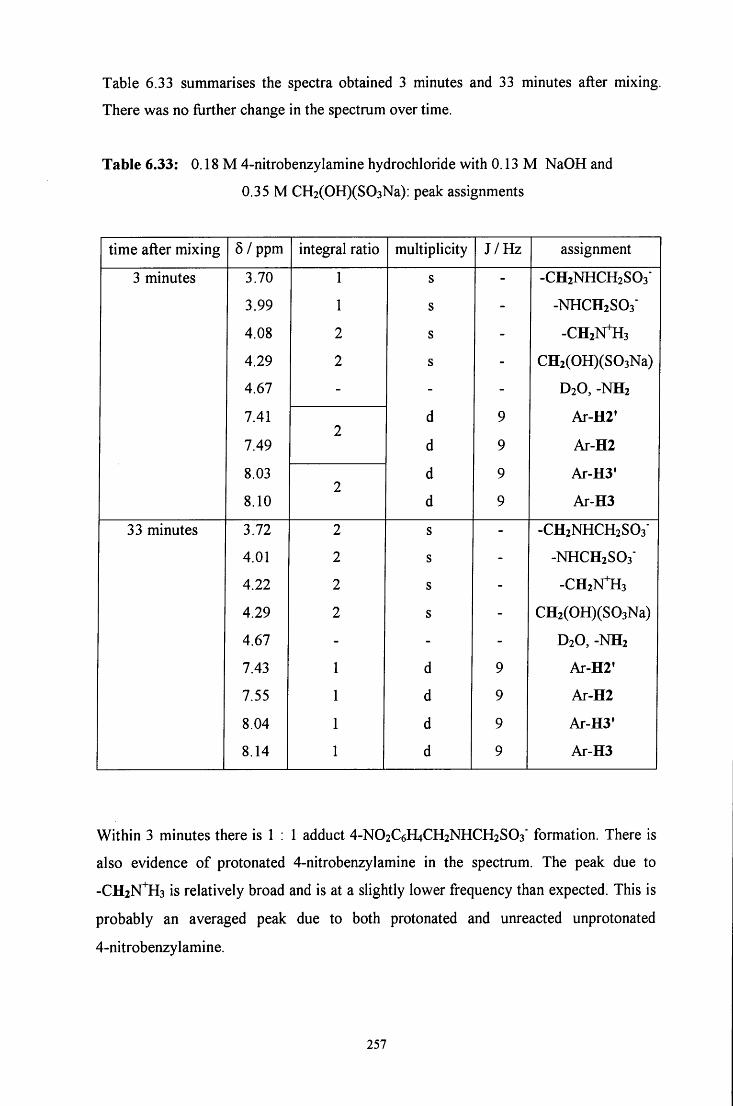
Table 6.33 summarises the spectra obtained 3 minutes and 33 minutes after mixing.
There was no further change in the spectrum over time.
Table 6.33: 0.18 M 4-nitrobenzylamine hydrochloride with 0.13 M NaOH and
0.35 M CH2(OH)(S03Na): peak assignments
time after mixing 6 / ppm integral ratio multiplicity J / H z assignment
3 minutes 3.70 1 s - -CH2NHCH2SO3"
3.99 1 s - -NHCH2S03'
4.08 2 s - -CH2N^3
4.29 2 s - CH2(OH)(S03Na)
4.67 - - - D2O, -NH2
7.41 d 9 Ar-H2' 2
7.49 d 9 Ar-H2
8.03 d 9 Ar-H3' 2
8.10 d 9 Ar-H3
33 minutes 3.72 2 s - -CH2NHCH2S03'
4.01 2 s - -NHCH2S03'
4.22 2 s - -CH2N^3
4.29 2 s - CH2(OH)(S03Na)
4.67 - - - D2O, -NH2
7.43 1 d 9 Ar-H2'
7.55 1 d 9 Ar-H2
8.04 1 d 9 Ar-H3'
8.14 1 d 9 Ar-H3
Within 3 minutes there is 1 : 1 adduct 4-NO2C6H4CH2NHCH2SO3" formation. There is
also evidence of protonated 4-nitrobenzylamine in the spectrum. The peak due to
- C H 2 N ^ 3 is relatively broad and is at a slightly lower frequency than expected. This is
probably an averaged peak due to both protonated and unreacted unprotonated
4-nitrobenzylamine.
257
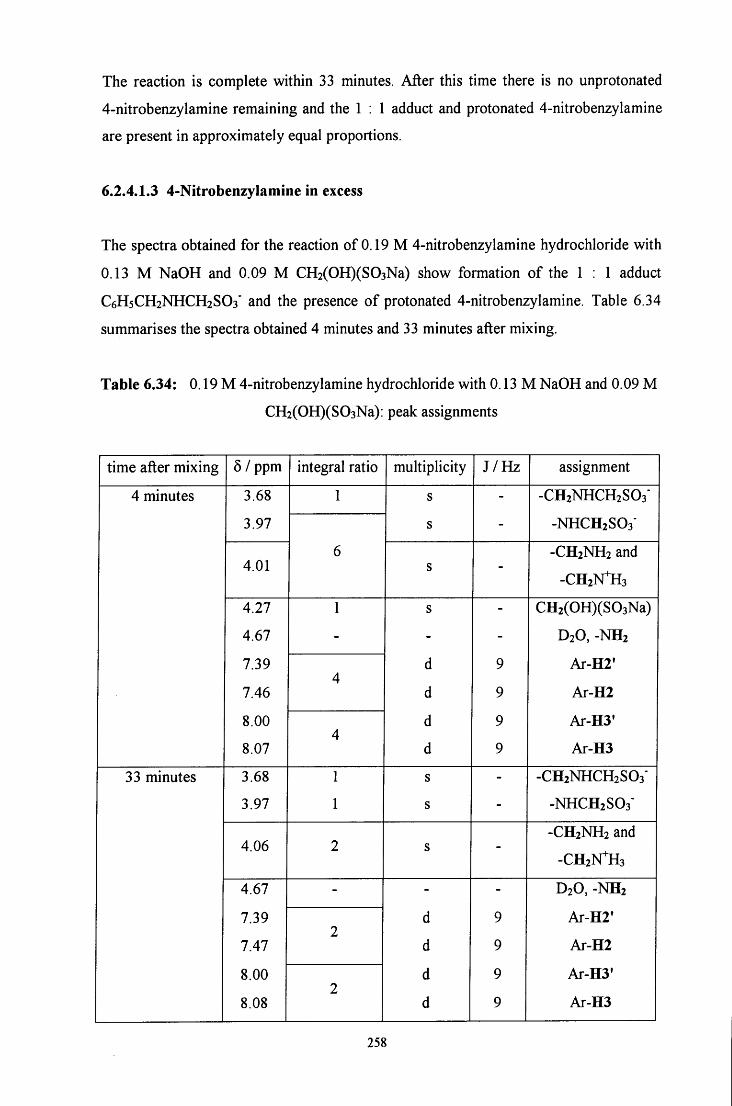
The reaction is complete within 33 minutes. After this time there is no unprotonated
4-nitrobenzylamine remaining and the 1 : 1 adduct and protonated 4-nitrobenzylamine
are present in approximately equal proportions.
6.2.4.1.3 4-Nitrobenzylamine in excess
The spectra obtained for the reaction of 0.19 M 4-nitrobenzylamine hydrochloride with
0.13 M NaOH and 0.09 M CH2(OH)(S03Na) show formation of the 1 : 1 adduct
C6H5CH2NHCH2SO3* and the presence of protonated 4-nitrobenzylamine. Table 6.34
summarises the spectra obtained 4 minutes and 33 minutes after mixing.
Table 6.34: 0.19 M 4-nitrobenzylamine hydrochloride with 0.13 M NaOH and 0.09 M
CH2(OH)(S03Na): peak assignments
time after mixing 5 / ppm integral ratio multiplicity J / H z assignment
4 minutes 3.68 1 s - -CH2NHCH2S03"
3.97 s - -NHCH2SO3"
4.01 6
s --CH2NH2 and
- C H 2 N ^ 3
4.27 1 s - CH2(OH)(S03Na)
4.67 - - - D2O, -NH2
7.39
7.46 4
d
d
9
9
Ar-H2'
Ar-H2
8.00
8.07 4
d
d
9
9
Ar-H3'
Ar-H3
33 minutes 3.68 1 s - -CH2NHCH2S03'
3.97 1 s - -NHCH2SO3"
4.06 2 s --CH2NH2 and
-CH2Nll3
4.67 - - - D2O, -NH2
7.39
7.47 2
d
d
ON
O
N
Ar-H2'
Ar-H2
8.00
8.08 2
d
d
9
9
Ar-H3'
Ar-H3
258
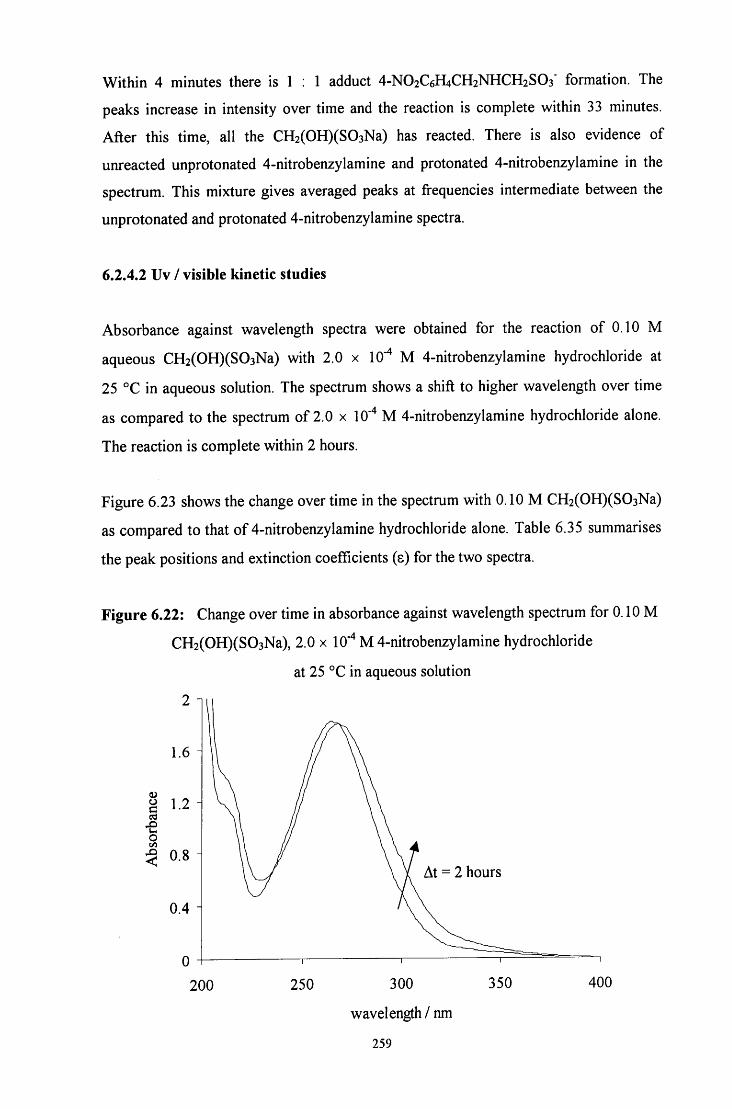
Within 4 minutes there is 1 : 1 adduct 4-NO2C6H4CH2NHCH2SO3" formation. The
peaks increase in intensity over time and the reaction is complete within 33 minutes.
After this time, all the CH2(OH)(S03Na) has reacted. There is also evidence of
unreacted unprotonated 4-nitrobenzylamine and protonated 4-nitrobenzylamine in the
spectrum. This mixture gives averaged peaks at frequencies intermediate between the
unprotonated and protonated 4-nitrobenzylamine spectra.
6.2.4.2 Uv / visible kinetic studies
Absorbance against wavelength spectra were obtained for the reaction of 0.10 M
aqueous CH2(OH)(S03Na) with 2.0 x 10" M 4-nitrobenzylamine hydrochloride at
25 °C in aqueous solution. The spectrum shows a shift to higher wavelength over time
as compared to the spectrum of 2.0 x lO'"* M 4-nitrobenzylamine hydrochloride alone.
The reaction is complete within 2 hours.
Figure 6.23 shows the change over time in the spectrum with 0.10 M CH2(OH)(S03Na)
as compared to that of 4-nitrobenzylamine hydrochloride alone. Table 6.35 summarises
the peak positions and extinction coefficients (s) for the two spectra.
Figure 6.22: Change over time in absorbance against wavelength spectrum for 0.10 M
CH2(OH)(S03Na), 2.0 x 10" M 4-nitrobenzylamine hydrochloride
at 25 °C in aqueous solution
2
o u o 1/5
At = 2 hours
200 250 300 350
wavelength / nm
259
400
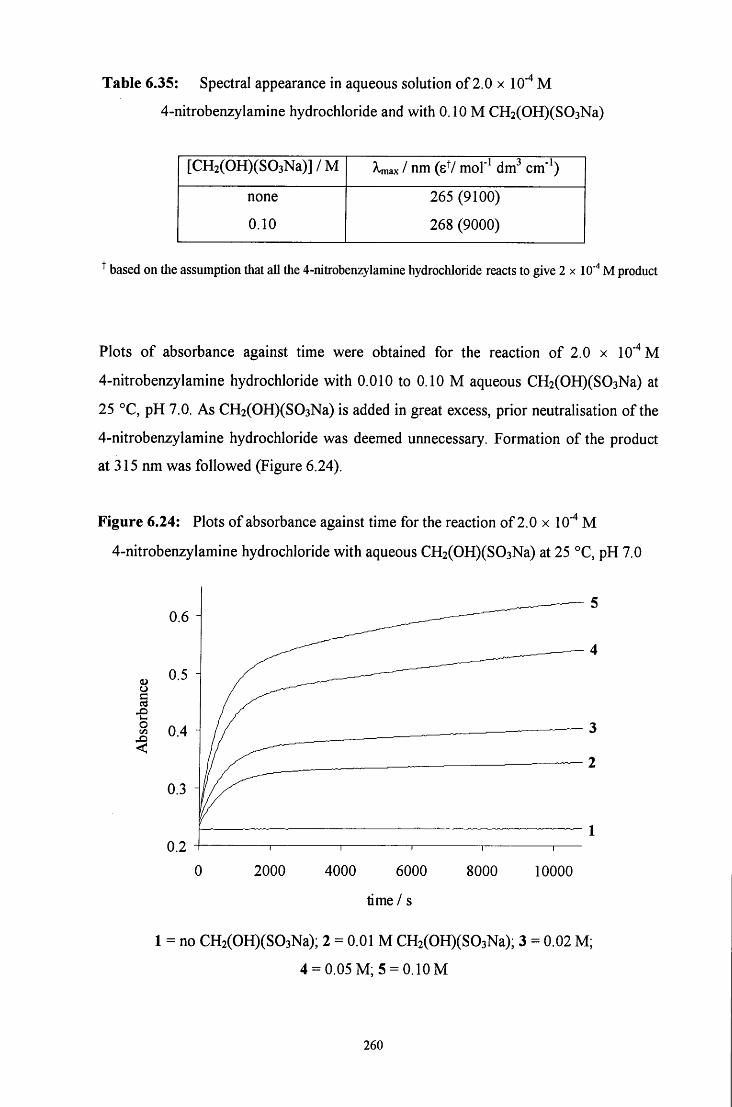
Table 6.35: Spectral appearance in aqueous solution of 2.0 x 10" M
4-nitrobenzylamine hydrochloride and with 0.10 M CH2(OH)(S03Na)
[CH2(OH)(S03Na)]/M Xmax 1 nm (sV mol'^ dm^ cm'^)
none
0.10
265 (9100)
268 (9000)
^ based on the assumption that all the 4-nitrobenzylamine hydrochloride reacts to give 2 x 10 '' M product
Plots of absorbance against time were obtained for the reaction of 2.0 x 10'"* M
4-nitrobenzylamine hydrochloride with 0.010 to 0.10 M aqueous CH2(OH)(S03Na) at
25 °C, pH 7.0. As CH2(OH)(S03Na) is added in great excess, prior neutralisation of the
4-nitrobenzylamine hydrochloride was deemed unnecessary. Formation of the product
at 315 nm was followed (Figure 6.24).
Figure 6.24: Plots of absorbance against time for the reaction of 2.0 x 10"" M
4-nitrobenzylamine hydrochloride with aqueous CH2(OH)(S03Na) at 25 °C, pH 7.0
? 0.4
0 2000 4000 6000 8000 10000
time / s
1 = no CH2(OH)(S03Na); 2 = 0.01 M CH2(OH)(S03Na); 3 = 0.02 M ;
4 = 0.05 M ;5 = 0.10M
260
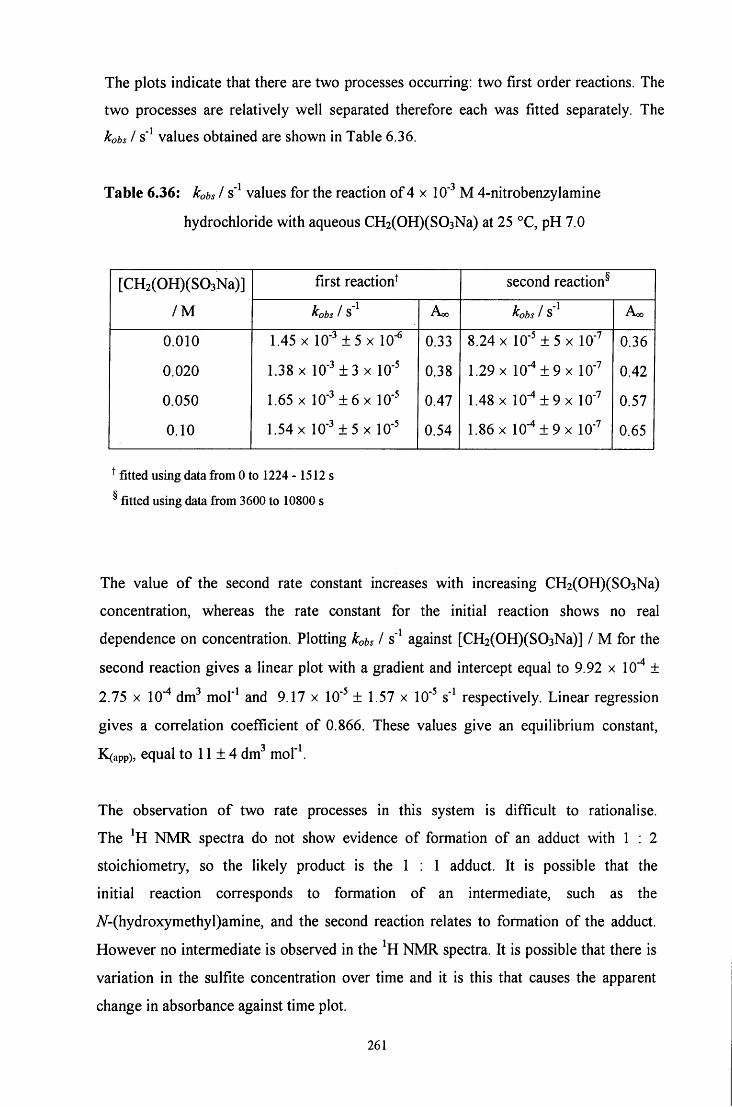
The plots indicate that there are two processes occurring: two first order reactions. The
two processes are relatively well separated therefore each was fitted separately. The
kobs I s" values obtained are shown in Table 6.36.
Table 6.36: kobs I s' values for the reaction of 4 x 10" M 4-nitrobenzylamine
hydrochloride with aqueous CH2(OH)(S03Na) at 25 °C, pH 7.0
[CH2(OH)(S03Na)]
/ M
first reaction^ second reaction^ [CH2(OH)(S03Na)]
/ M kobs 1 S Aoo kobs 1 S Aoo
0.010 1.45 X 10" ± 5 X 10- 0.33 8.24 X 10" ± 5 X 10- 0.36
0.020 1.38 X 10" ± 3 X 10' 0.38 1.29 X 10"^±9x 10" 0.42
0.050 1.65 X 10' ± 6 X 10" 0.47 1.48 X 10"* ± 9 X lO'" 0.57
0.10 1.54 X 10' ± 5 X 10" 0.54 1.86 X 10"* ± 9 X 10" 0.65
^ fitted using data from 0 to 1224 - 1512 s
^ fitted using data from 3600 to 10800 s
The value of the second rate constant increases with increasing CH2(OH)(S03Na)
concentration, whereas the rate constant for the initial reaction shows no real
dependence on concentration. Plotting kobs I s' against [CH2(OH)(S03Na)] / M for the
second reaction gives a linear plot with a gradient and intercept equal to 9.92 x 10"* ±
2.75 X 10'"* dm^ mol"^ and 9.17 x 10' ± 1.57 x 10" s" respectively. Linear regression
gives a correlation coefficient of 0.866. These values give an equilibrium constant,
K(app), equal to 11 ± 4 dm^ mof^
The observation of two rate processes in this system is difficult to rationalise.
The NMR spectra do not show evidence of formation of an adduct with 1 : 2
stoichiometry, so the likely product is the 1 : 1 adduct. It is possible that the
initial reaction corresponds to formation of an intermediate, such as the
iV-(hydroxymethyl)amine, and the second reaction relates to formation of the adduct.
However no intermediate is observed in the NMR spectra. It is possible that there is
variation in the sulfite concentration over time and it is this that causes the apparent
change in absorbance against time plot.
261
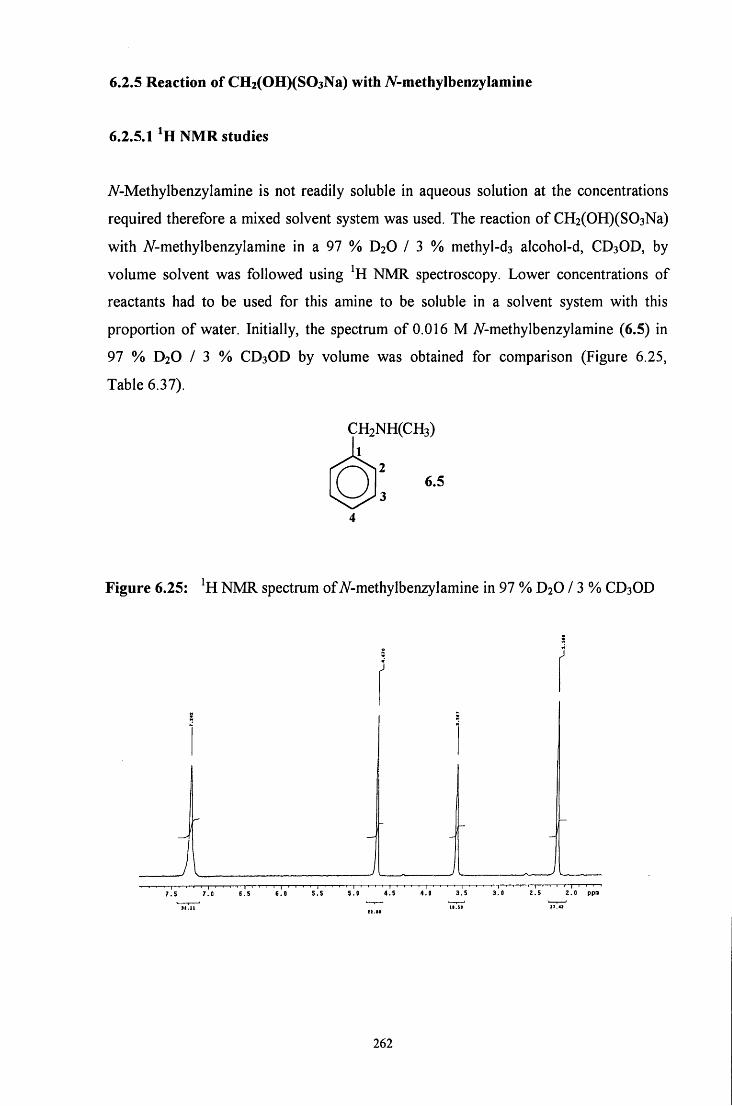
6.2.5 Reaction of CHiCOHXSOjNa) with A^-methylbenzylamine
6.2.5.1 NMR studies
iV-Methylbenzylamine is not readily soluble in aqueous solution at the concentrations
required therefore a mixed solvent system was used. The reaction of CH2(OH)(S03Na)
with A^-methylbenzylamine in a 97 % D2O / 3 % methyl-d3 alcohol-d, CD3OD, by
volume solvent was followed using NMR spectroscopy. Lower concentrations of
reactants had to be used for this amine to be soluble in a solvent system with this
proportion of water. Initially, the spectrum of 0.016 M 7V-methylbenzylamine (6.5) in
97 % D2O / 3 % C D 3 O D by volume was obtained for comparison (Figure 6.25,
Table 6.37).
CH2NH(CH3)
o
Figure 6.25: NMR spectrum of A^-methylbenzylamine in 97 % D2O / 3 % C D 3 O D
7 . 5 7 . 0
262
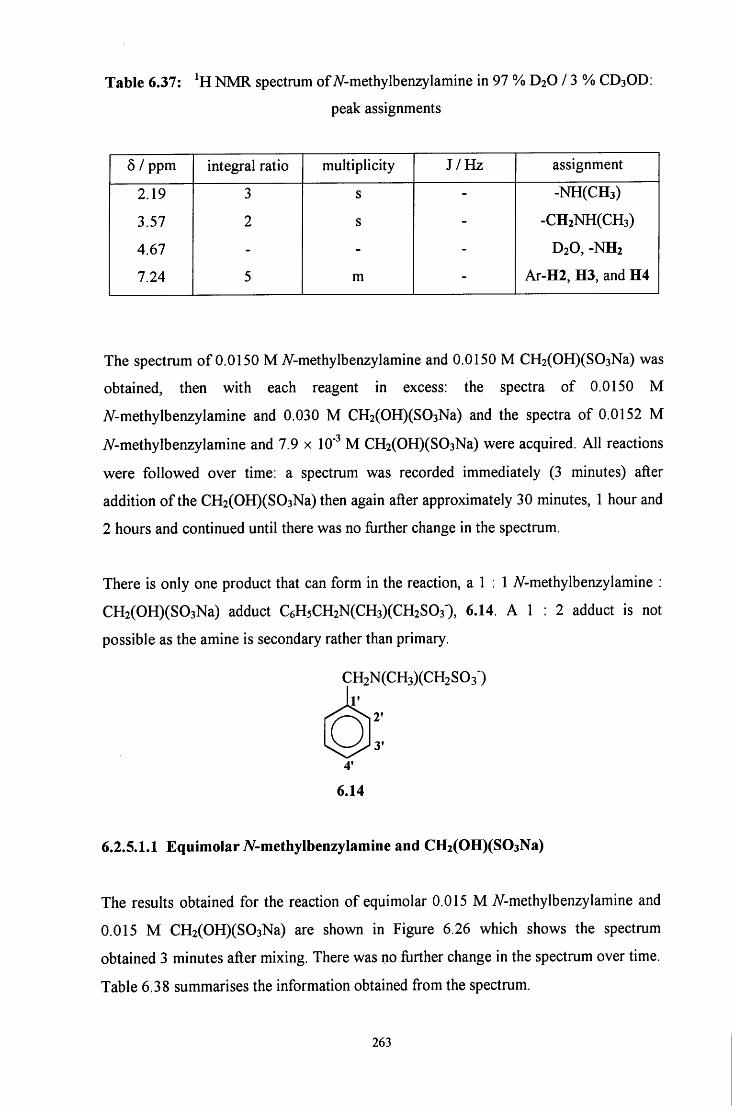
Table 6.37: NMR spectrum of A^-methylbenzylamine in 97 % D2O / 3 % C D 3 O D :
peak assignments
6 / ppm integral ratio multiplicity J /Hz assignment
2.19 3 s - -NH(CH3)
3.57 2 s - -CH2NH(CH3)
4.67 - - - D2O, -NH2
7.24 5 m - Ar-H2, H3, and H4
The spectrum of 0.0150 MA^-methylbenzylamine and 0.0150 M CH2(OH)(S03Na) was
obtained, then with each reagent in excess: the spectra of 0.0150 M
A^-methylbenzylamine and 0.030 M CH2(OH)(S03Na) and the spectra of 0.0152 M
7V-methylbenzylamine and 7.9 x 10" M CH2(OH)(S03Na) were acquired. All reactions
were followed over time: a spectrum was recorded immediately (3 minutes) after
addition of the CH2(OH)(S03Na) then again after approximately 30 minutes, 1 hour and
2 hours and continued until there was no fiirther change in the spectrum.
There is only one product that can form in the reaction, a 1 : 1 A^-methylbenzylamine :
CH2(OH)(S03Na) adduct C6H5CH2N(CH3)(CH2S03"), 6.14. A 1 : 2 adduct is not
possible as the amine is secondary rather than primary.
CH2N(CH3)(CH2S03) V
3' Q 4'
6.14
6.2.5.1.1 EquimolarA^-methylbenzylamineand CHzCOHXSOjNa)
The results obtained for the reaction of equimolar 0.015 M iV-methylbenzylamine and
0.015 M CH2(OH)(S03Na) are shown in Figure 6.26 which shows the spectrum
obtained 3 minutes after mixing. There was no fiirther change in the spectrum over time.
Table 6.38 summarises the information obtained from the spectrum.
263
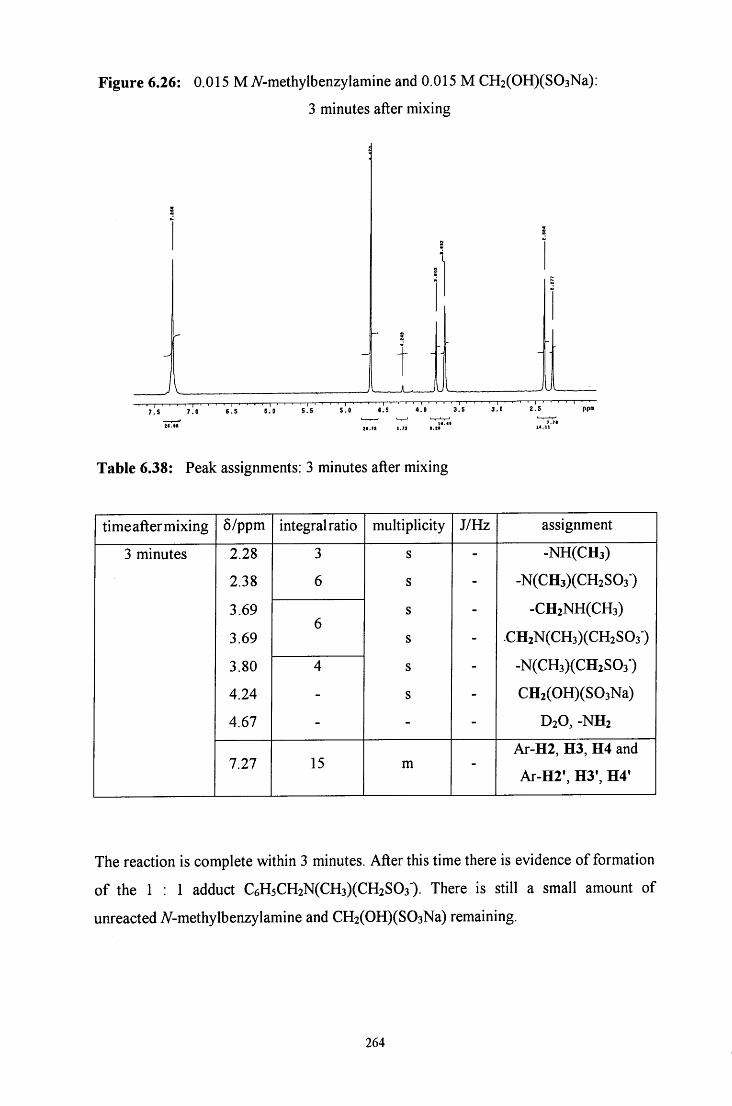
Figure 6.26: 0.015 M 7V-methylbenzylamine and 0.015 M CH2(OH)(S03Na):
3 minutes after mixing
JL JUL. S.O 4.5 4.0
U.li 9.79 I
Table 6.38: Peak assignments: 3 minutes after mixing
time after mixing 6/ppm integral ratio multiplicity J/Hz assignment
3 minutes 2.28 3 s - -NH(CH3)
2.38 6 s - -N(CH3)(CH2S03-)
3.69 s - -CH2NH(CH3)
3.69 O s - .CH2N(CH3)(CH2S03")
3.80 4 s - -N(CH3)(CH2S03-)
4.24 - s - CH2(OH)(S03Na)
4.67 - - - D2O, -NH2
7.27 15 m -Ar-H2, H3, H4 and
Ar-H2', H3', H4'
The reaction is complete within 3 minutes. After this time there is evidence of formation
of the 1 : 1 adduct C6H5CH2N(CH3)(CH2S03"). There is still a small amount of
unreacted A^-methylbenzylamine and CH2(OH)(S03Na) remaining.
264
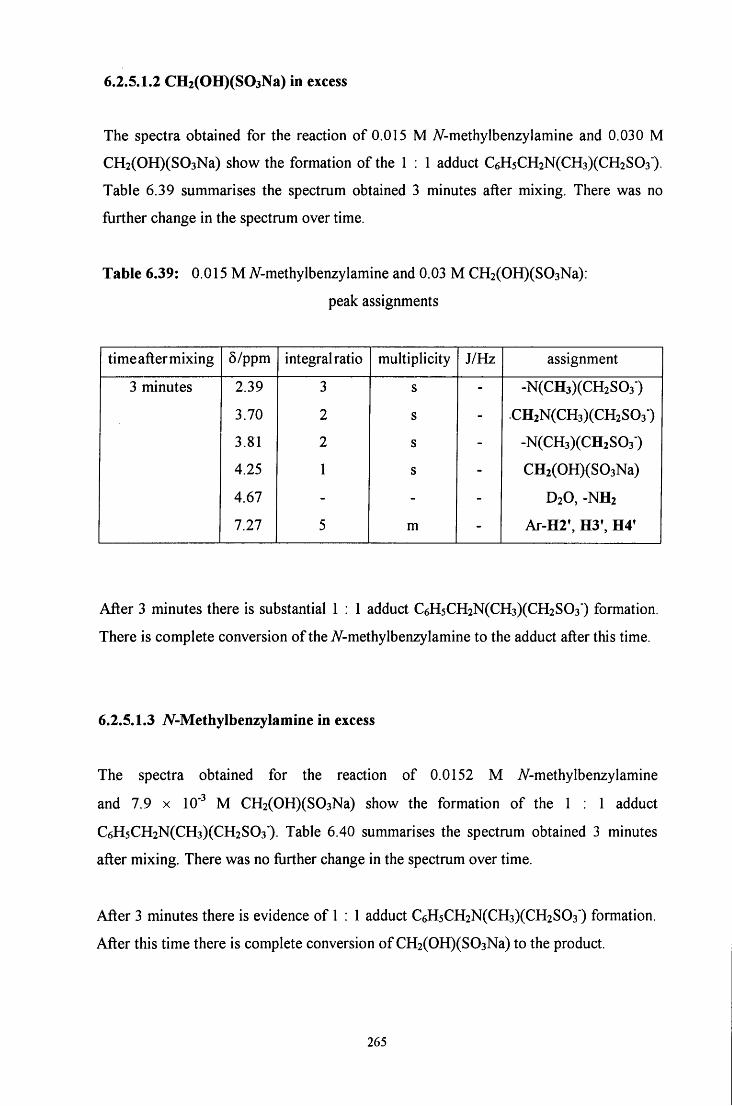
6.2.5.1.2 CH2(OH)(S03Na) in excess
The spectra obtained for the reaction of 0.015 M 7V-methylbenzylamine and 0.030 M
CH2(OH)(S03Na) show the formation of the 1 : 1 adduct C6H5CH2N(CH3)(CH2S03")
Table 6.39 summarises the spectrum obtained 3 minutes after mixing. There was no
fijrther change in the spectrum over time.
Table 6.39: 0.015 M 7V-methylbenzylamine and 0.03 M CH2(OH)(S03Na):
peak assignments
time after mixing 5/ppm integral ratio multiplicity J/Hz assignment
3 minutes 2.39 3 s - -N(CH3)(CH2S03-)
3.70 2 s - .CH2N(CH3)(CH2S03-)
3.81 2 s - -N(CH3)(CH2S03-)
4.25 1 s - CH2(OH)(S03Na)
4.67 - - - D2O, -NH2
7.27 5 m - Ar-H2', H3', H4'
After 3 minutes there is substantial 1 : 1 adduct C6H5CH2N(CH3)(CH2S03') formation.
There is complete conversion of the A'-methylbenzylamine to the adduct after this time.
6.2.5.1.3 A^-Methylbenzylamine in excess
The spectra obtained for the reaction of 0.0152 M A^-methylbenzylamine
and 7.9 x 10" M CH2(OH)(S03Na) show the formation of the 1 : 1 adduct
C6H5CH2N(CH3)(CH2S03')- Table 6.40 summarises the spectrum obtained 3 minutes
after mixing. There was no fiirther change in the spectrum over time.
After 3 minutes there is evidence of 1 : 1 adduct C6H5CH2N(CH3)(CH2S03") formation.
After this time there is complete conversion of CH2(OH)(S03Na) to the product.
265
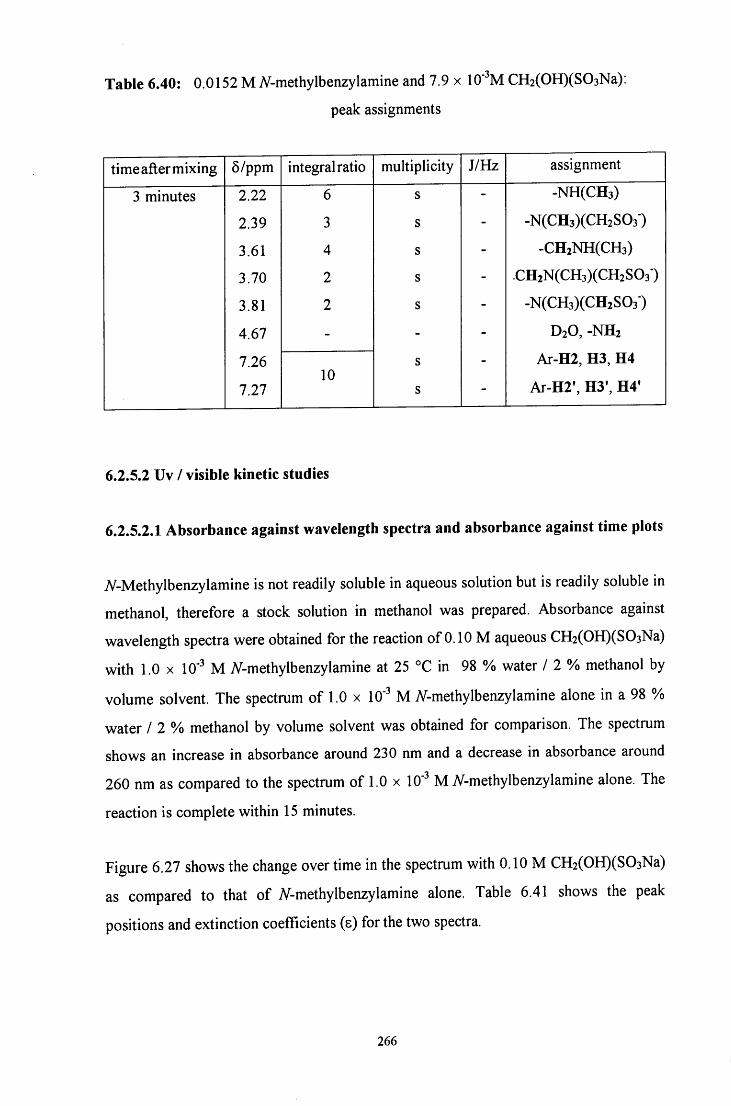
Table 6.40: 0.0152 M A^-methylbenzylamine and 7.9 x lO'^M CH2(OH)(S03Na):
peak assignments
time after mixing 5/ppm integral ratio multiplicity J/Hz assignment
3 minutes 2.22 6 s - -NH(CH3)
2.39 3 s - -N(CH3)(CH2S03-)
3.61 4 s - -CH2NH(CH3)
3.70 2 s - .CH2N(CH3)(CH2S03")
3.81 2 s - -N(CH3)(CH2S03-)
4.67 - - - D2O, -NH2
7.26 s - Ar-H2, H3, H4 10
Ar-H2', H3', H4' 7.27 s - Ar-H2', H3', H4'
6.2.5.2 Uv / visible kinetic studies
6.2.5.2.1 Absorbance against wavelength spectra and absorbance against time plots
A^-Methylbenzylamine is not readily soluble in aqueous solution but is readily soluble in
methanol, therefore a stock solution in methanol was prepared. Absorbance against
wavelength spectra were obtained for the reaction of 0.10 M aqueous CH2(OH)(S03Na)
with 1.0 X 10" M A/-methylbenzylamine at 25 °C in 98 % water / 2 % methanol by
volume solvent. The spectrum of 1.0 x 10" M 7V-methylbenzylamine alone in a 98 %
water / 2 % methanol by volume solvent was obtained for comparison. The spectrum
shows an increase in absorbance around 230 nm and a decrease in absorbance around
260 nm as compared to the spectrum of 1.0 x 10" M 7V-methylbenzylamine alone. The
reaction is complete within 15 minutes.
Figure 6.27 shows the change over time in the spectrum with 0.10 M CH2(OH)(S03Na)
as compared to that of A^-methylbenzylamine alone. Table 6.41 shows the peak
positions and extinction coefficients (e) for the two spectra.
266
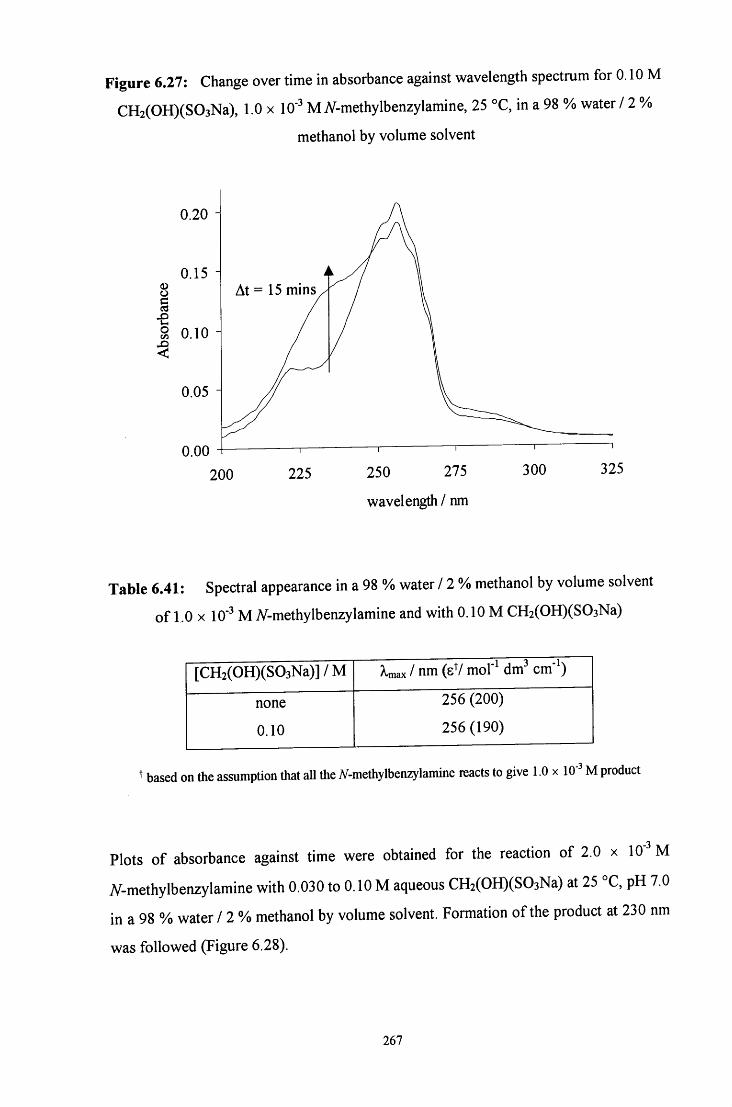
Figure 6.27: Change over time in absorbance against wavelength spectrum for 0.10 M
CH2(OH)(S03Na), 1.0 x 10" M A^-methylbenzylamine, 25 °C, in a 98 % water / 2 %
methanol by volume solvent
At = 15 mms
0.00 200 225 250 275
wavelength / nm
300 325
Table 6.41: Spectral appearance in a 98 % water / 2 % methanol by volume solvent
of 1.0 X 10' M A^-methylbenzylamine and with 0.10 M CH2(OH)(S03Na)
[CH2(OH)(S03Na)]/M ^ax / nm (sV mol"^ dm"* cm'^
none
0.10
256 (200)
256 (190)
^ based on the assumption that all the iV-methylbenzylamine reacts to give 1.0 x 10' M product
Plots of absorbance against time were obtained for the reaction of 2.0 x 10" M
A^-methylbenzylamine with 0.030 to 0.10 M aqueous CH2(OH)(S03Na) at 25 °C, pH 7.0
in a 98 % water / 2 % methanol by volume solvent. Formation of the product at 230 nm
was followed (Figure 6.28).
267
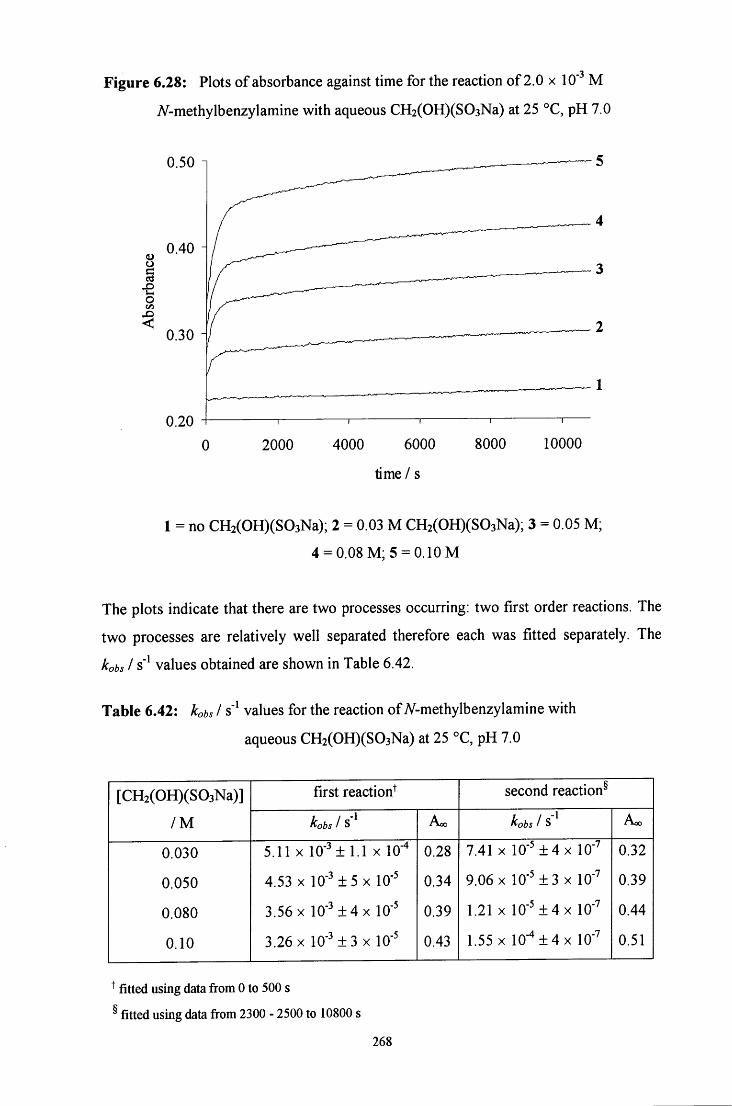
Figure 6.28: Plots of absorbance against time for the reaction of 2.0 x 10" M
A^-methylbenzylamine with aqueous CH2(OH)(S03Na) at 25 °C, pH 7.0
0.50
o
o
0.40
0.30 i
0.20 " I 1 I I r
2000 4000 6000 8000 10000
time / s
1 = no CH2(OH)(S03Na); 2 = 0.03 M CH2(OH)(S03Na); 3 = 0.05 M ;
4 = 0.08 M;5 = 0.10M
The plots indicate that there are two processes occurring: two first order reactions. The
two processes are relatively well separated therefore each was fitted separately. The
kobs I s' values obtained are shown in Table 6.42.
Table 6.42: kobs I s' values for the reaction of A^-methylbenzylamine with
aqueous CH2(OH)(S03Na) at 25 °C, pH 7.0
[CH2(OH)(S03Na)]
/ M
first reaction^ second reaction^ [CH2(OH)(S03Na)]
/ M kobs 1 S Aoo kobs 1 S Aoo
0.030 5.11 X 10" ± 1.1 X 10"* 0.28 7.41 X 10" ± 4 X 10"" 0.32
0.050 4.53 X 10' ± 5 X 10' 0.34 9.06 X 10" ± 3 X 10' 0.39
0.080 3.56 X 1 0 " n 4 x 10' 0.39 1.21 X 10" ± 4 X 10' 0.44
0.10 3.26 X 10' ± 3 X 10" 0.43 1.55 X 10"*±4x 10"" 0.51
^ fitted using data from 0 to 500 s
^ fitted using data from 2300 - 2500 to 10800 s
268

The second rate constant increases with increasing CH2(OH)(S03Na) concentration,
however the rate constant for the initial reaction shows a slight decrease.
Plotting kobs I s' against [CH2(OH)(S03Na)] / M for the second reaction gives a linear
plot with a gradient and intercept equal to 1.19 x 10' ± 8 x 10" dm^ mol'^ and
3.59 X 10" ± 5.3 X 10' s' respectively. Linear regression yields a correlation
coefficient of 0.991. These values give an equilibrium constant, K^app), equal to
33 ± 3 dm^ mol'V As with reaction with 4-nitrobenzylamine, the observation of two rate
processes is difficult to rationalise. However the kinetics were simplified in the presence
of added sulfite ions, where a single rate process was observed.
6.2.5.2.2 Reaction in the presence of added sulfite ions
The effect of the presence of added sulfite ions in the system was investigated. Plots
of absorbance against time were obtained for the reaction of 2.0 x 10' M
#-methylbenzylamine with 0.10 M aqueous CH2(OH)(S03Na) in the presence of
2.0 X 10" to 0.010 M aqueous sodium sulfite solution at 25 °C, pH 8.1, in a
98 % water / 2 % methanol by volume solvent. Formation of the product
C6H5CH2NH(CH3)CH2S03" at 230 nm was followed. Sulfite ions absorb in this region:
spectra of 0.01, 0.05 and 0.10 M aqueous sodium sulfite solution were obtained and
showed high absorbance around 250 nm and to shorter wavelength. For example, the
extinction coefficient of sulfite ions at 245 nm was found to be 50 dm" mol"^ cm"\
Therefore the appropriate concentration of sulfite ions was added to the reference in
order to subtract the absorbance due to the presence of sulfite from the absorbance
against time plots.
Where [sulfite]stoich is quoted this refers to the total concentration of aqueous sodium
sulfite added externally to the system and does not include the concentration of sulfite
ions present in solution due to dissociation of CH2(OH)(S03Na).
Plots were first order: the kobs I s" values obtained are shown in Table 6.43.
269
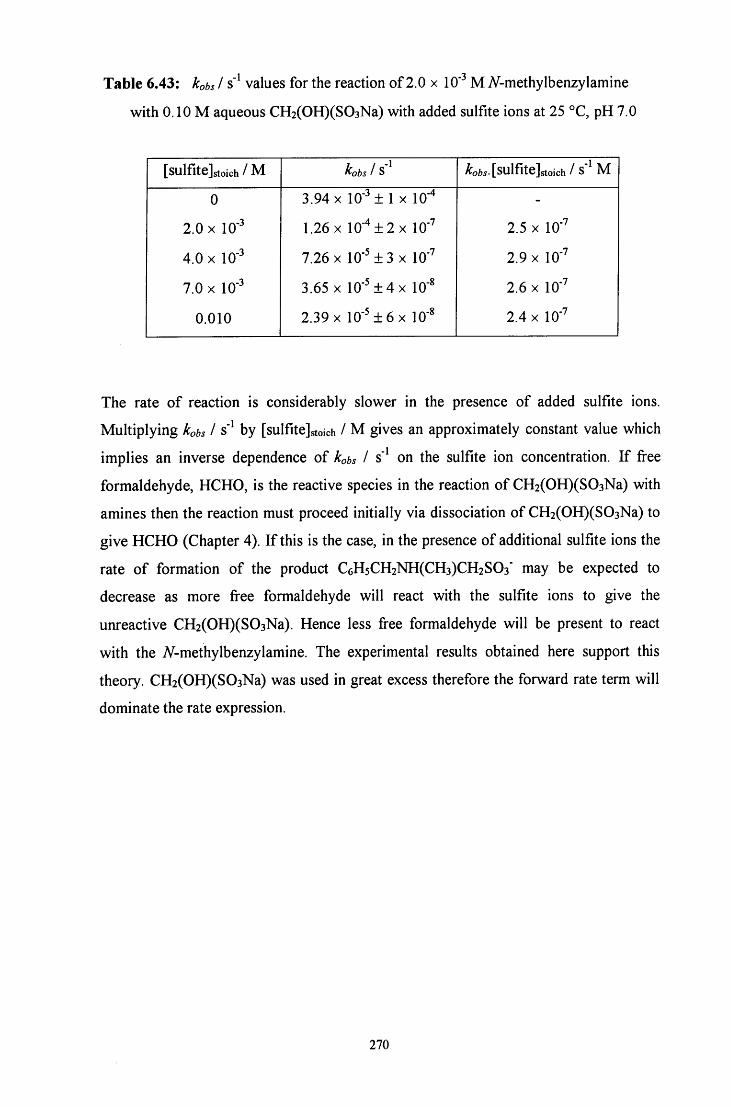
Table 6.43: kobs I s" values for the reaction of 2.0 x 10" M 7V-methylbenzylamine
with 0.10 M aqueous CH2(OH)(S03Na) with added sulfite ions at 25 °C, pH 7.0
[sulfite]stoich / M kobs 1 S A:o!,i.[sulfite]stoich / s" M
0 3.94 X 10" ± 1 X 10"* -
2.0 X 10- 1.26 X 10"* ± 2 X 10" 2.5 X 10-
4.0 X 10- 7.26 X 10" ± 3 X 10-" 2.9 X 10"
7.0 X 10- 3.65 X 10" ± 4 X 10- 2.6 X lO"*
0.010 2.39 X 10" ± 6 X 10" 2.4 X 10"
The rate of reaction is considerably slower in the presence of added sulfite ions.
Multiplying kobs I s' by [sulfitejstoich / M gives an approximately constant value which
implies an inverse dependence of Kbs I s' on the sulfite ion concentration. I f free
formaldehyde, HCHO, is the reactive species in the reaction of CH2(OH)(S03Na) with
amines then the reaction must proceed initially via dissociation of CH2(OH)(S03Na) to
give HCHO (Chapter 4). I f this is the case, in the presence of additional sulfite ions the
rate of formation of the product C6H5CH2NH(CH3)CH2S03" may be expected to
decrease as more free formaldehyde will react with the sulfite ions to give the
unreactive CH2(OH)(S03Na). Hence less free formaldehyde will be present to react
with the 7V-methylbenzylamine. The experimental results obtained here support this
theory. CH2(OH)(S03Na) was used in great excess therefore the forward rate term will
dominate the rate expression.
270
6.3 CONCLUSION
6.3.1 Summary
The reaction of benzylamine and four benzylamine derivatives with CH2(OH)(S03Na)
was investigated using NMR spectroscopy. There was evidence of both 1 : 1 and
1 : 2 adduct formation for the reaction with benzylamine, 4-methoxybenzylamine, and
4-methylbenzylamine. However only the 1 : 1 adduct was observed for the reaction with
4-nitrobenzylamine. The presence of the 4-N02 electron withdrawing group lowers the
nucleophilicity of the benzylamine nitrogen therefore the tendency to add a second
CH2(OH)(S03Na) molecule is reduced.
Only the 1 : 1 adduct was observed in the reaction with A^-methylbenzylamine as the
1 : 2 adduct cannot form. The formation of the 1 : 1 adduct with 7V-methylbenzylamine
is much faster than with the other benzylamines. This is due to the presence of the
electron donating methyl group adjacent to the nitrogen which greatly increases the
nucleophilicity of the benzylamine nitrogen.
The chemical shifts of the product species in D2O, or 97 % D2O / 3 % CD3OD in the
case of 4-methyl- and iV-methyl- benzylamine, are outlined in Scheme 6.3 along with
those of the parent compounds. The exchangeable -NH2 protons will be included under
the D2O solvent peak at 6 4.67 ppm.
271
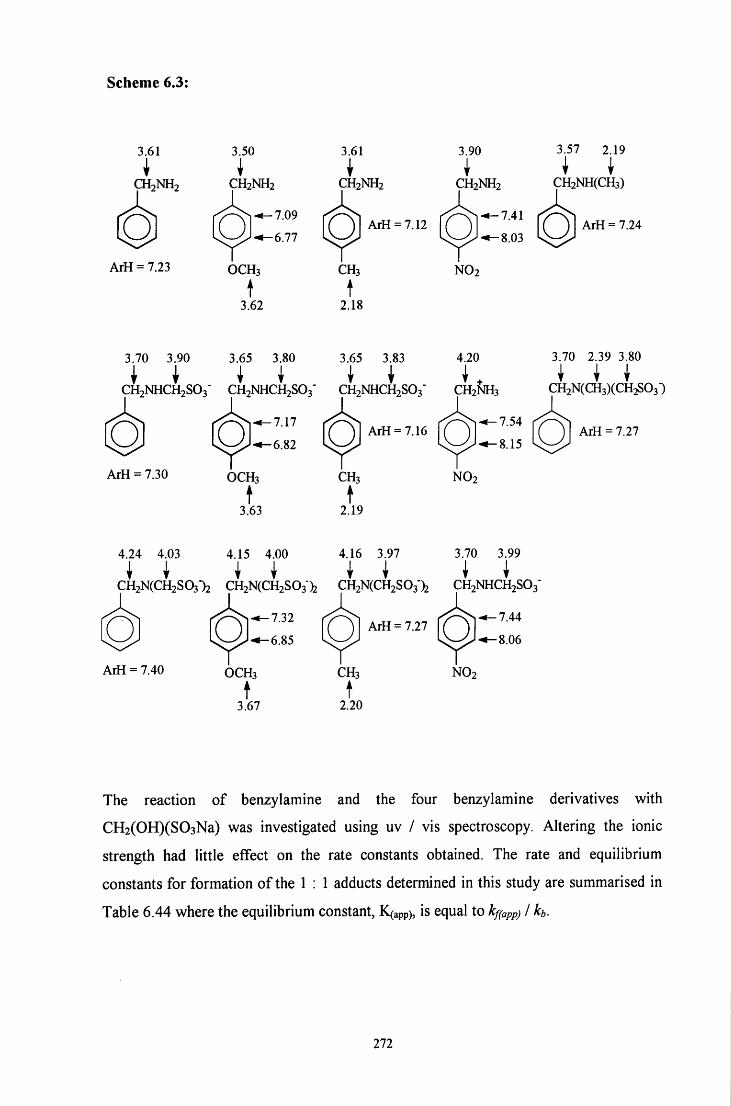
Scheme 6.3:
CH2NH2
ArH = 7.23
CH2NH2 CH2NH2
ArH = 7.12
3.90
I CH2NH2
3.57 2.19
I I CH2NH(CH3)
ArH = 7.24
3.70 3.90 3.65 3.80
CH2NHCH2S03- CH2NHCH2S03'
h 6. ArH = 7.30
4.24 4.03 4.15 4.00
3.65 3.83
CHzNHCHzSOs-
ArH = 7.16
4.16 3.97
CH2NH3
^ - ^ - ^ 7 . 5 4 r ^ S h ( ) ( ) ArH = 7.27 ; S ^ - « - 8 . 1 5
3.70 2.39 3.80
I I I CH2N(CH3)(CH2S03-)
3.70 3.99
CH2N(CH2S03')2 CH2N(CH2S03-)2 CH2N(CH2S03-)2 CH2NHCH2S03-
H3 NO2 ArH = 7.40
•7.44
8.06
The reaction of benzylamine and the four benzylamine derivatives with
CH2(OH)(S03Na) was investigated using uv / vis spectroscopy. Altering the ionic
strength had little effect on the rate constants obtained. The rate and equilibrium
constants for formation of the 1 : 1 adducts determined in this study are summarised in
Table 6.44 where the equilibrium constant, K(app), is equal to k/fappj I h.
Ill
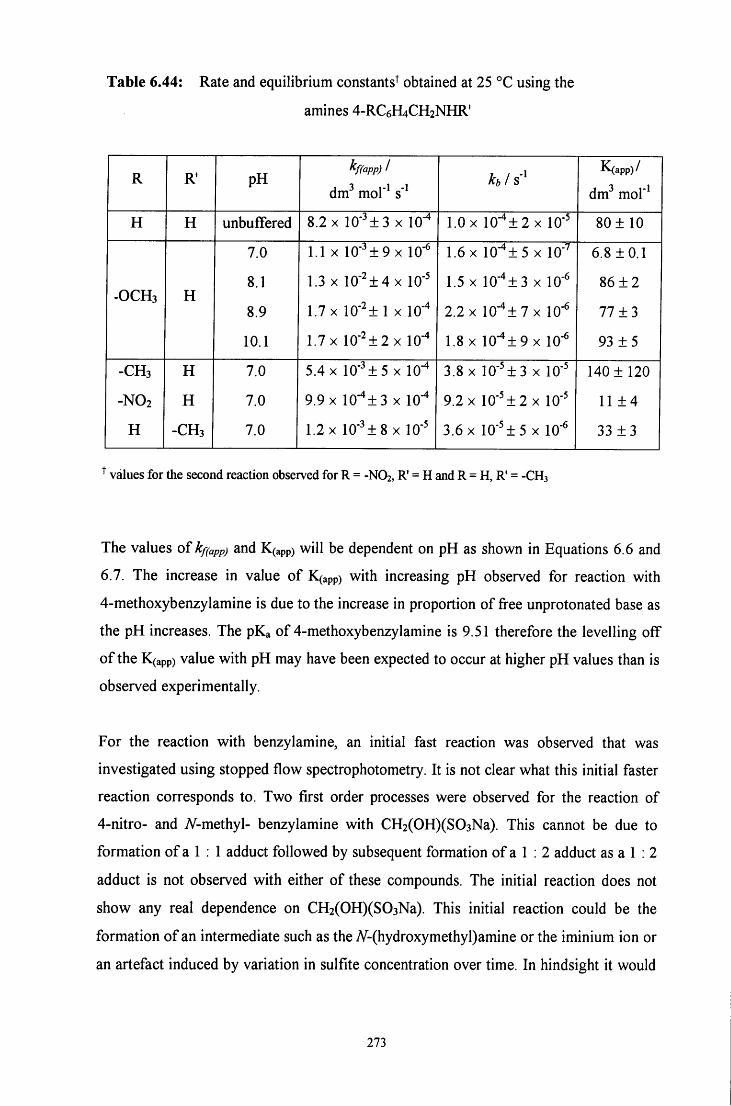
Table 6.44: Rate and equilibrium constants^ obtained at 25 °C using the
amines 4-RC6H4CH2NHR'
R R pH kf(app) /
dm mol' s' kb 1 s'
K(app)/
dm" mol'^
H H unbuffered 8.2 X 10"^±3 X 10" 1.0 X 10"^±2 X 10" 80± 10
7.0 1.1 X 10-^±9x 10' 1.6 X 10"^! 5 X lO'" 6.8 ±0.1
-OCH3 H 8.1
8.9
1.3 X 10'^±4 X 10'
1.7 X 10"^±1 X 10"
1.5 X 10"^±3 X 10"
2.2 X 10"^±7x 10"
86 ± 2
77 ± 3
10.1 1.7 X 10 '^±2x 10"* 1.8 X 10-^19 X 10- 93 ± 5
-CH3 H 7.0 5.4 X 10'^±5 X lO"* 3.8 X 10"^±3 X 10" 140±120
-NO2 H 7.0 9.9 X 10"^±3 X 10" 9.2 X 10"^±2x 10" 11 ± 4
H -CH3 7.0 1.2 X 10"^±8 X 10" 3.6 X 10"^±5 X 10- 33 ± 3
^ values for the second reaction observed for R = -NO2, R' = H and R = H, R' = -CH3
The values of kf(app) and K(app) will be dependent on pH as shown in Equations 6.6 and
6.7. The increase in value of K(app) with increasing pH observed for reaction with
4-methoxybenzylamine is due to the increase in proportion of free unprotonated base as
the pH increases. The pKa of 4-methoxybenzylamine is 9.51 therefore the levelling off
of the K(app) value with pH may have been expected to occur at higher pH values than is
observed experimentally.
For the reaction with benzylamine, an initial fast reaction was observed that was
investigated using stopped flow spectrophotometry. It is not clear what this initial faster
reaction corresponds to. Two first order processes were observed for the reaction of
4-nitro- and A^-methyl- benzylamine with CH2(OH)(S03Na). This cannot be due to
formation of a 1 : 1 adduct followed by subsequent formation of a 1 : 2 adduct as a 1 : 2
adduct is not observed with either of these compounds. The initial reaction does not
show any real dependence on CH2(OH)(S03Na). This initial reaction could be the
formation of an intermediate such as the A'-(hydroxymethyl)amine or the iminium ion or
an artefact induced by variation in sulfite concentration over time. In hindsight it would
273
have been advisable to make all kinetic measurements and equilibrium studies in
solutions where both the pH and the concentration of free sulfite were controlled.
The reaction in the presence of added sulfite ions was investigated for two of the
benzylamine derivatives: the rate of reaction was considerably slower in the presence of
added sulfite ions and the observed rate constant showed an inverse dependence on
sulfite ion concentration.
The reaction of hydroxymethanesulfonate, CH2(OH)(S03Na), with amines proceeds
initially via dissociation of the hydroxymethanesulfonate to give fi*ee formaldehyde, the
reactive species, and either sulfite or bisulfite ions depending on the pH of the system
(Chapter 4). Free formaldehyde then reacts with the amine via nucleophilic attack of the
nitrogen lone pair of electrons on the carbonyl carbon in formaldehyde to produce an
A/-(hydroxymethyl)amine (Chapter 2). This reaction will be in competition with
the reaction of free formaldehyde with sulfite / bisulfite ions to regenerate
hydroxymethanesulfonate. Therefore in the presence of added sulfite ions, the rate of
formation of the product, RCH2NR'CH2S03', will decrease as more fi-ee formaldehyde
will react with sulfite ions to give unreactive CH2(OH)(S03Na) and less free
formaldehyde will be present to react with the amine. The A'-(hydroxymethyl)amine
formed dehydrates in acid conditions or loses hydroxyl ion to give an iminium ion
which then reacts with sulfite ions to give the product, RCH2NR'CH2S03'.
6.3.2 Mechanism
The likely mechanism is shown in Scheme 6.4. The experiments were generally
performed at pH values lower than the pKa values of the amines. Therefore the amine
will be present mainly in the unreactive protonated form. The equilibrium between the
protonated amine and the reactive unprotonated amine must therefore be included in the
mechanism.
274
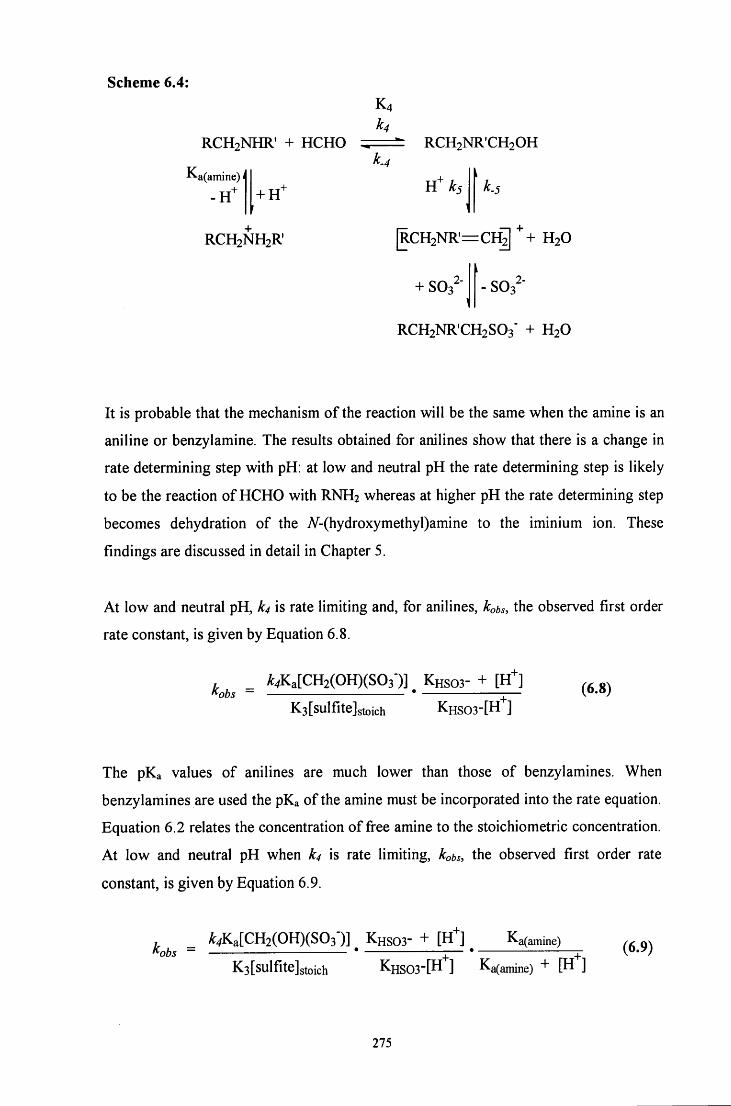
Scheme 6.4: K4 k4
RCHsNHR' + HCHO RCHsNR'CHsOH
Ka(amine) \ W ks k.<
RCH2NH2R R C H 2 N R = C H ^ H2O
+ S03^ SO3'
RCH2NR 'CH2S03' + H2O
It is probable that the mechanism of the reaction will be the same when the amine is an
aniline or benzylamine. The results obtained for anilines show that there is a change in
rate determining step with pH: at low and neutral pH the rate determining step is likely
to be the reaction of HCHO with RNH2 whereas at higher pH the rate determining step
becomes dehydration of the A^-(hydroxymethyl)amine to the iminium ion. These
findings are discussed in detail in Chapter 5.
At low and neutral pH, k4 is rate limiting and, for anilines, kobs, the observed first order
rate constant, is given by Equation 6.8.
^^^^ ^ ^,Ka[CH2(OH)(S03-)] ^ KHSO3- + [ H i
K3[sulfite]stoich KHSO3-[H"^] (6.8)
The p K a values of anilines are much lower than those of benzylamines. When
benzylamines are used the p K a of the amine must be incorporated into the rate equation.
Equation 6 .2 relates the concentration of free amine to the stoichiometric concentration.
At low and neutral pH when k4 is rate limiting, kobs, the observed first order rate
constant, is given by Equation 6.9.
^obs ~ ^4Ka[CH2(OH)(S03")] KHS03- + P ] Ka(amine)
K3[sulfite]stoich KHSOS-P"^] ^a(amme) + P" ] (6.9)
275
Values of A:o65[sulfite]stoich / mol dm'^ s' were obtained experimentally. Table 6.45
summarises the values obtained for the two amines studied.
Table 6.45: Experimental A:ofcJsulfite]stoich / mol dm' s" values^
amine PH ^o&5[sulfite]stoich / mol dm'^ s'
4-methoxybenzylamine
A^-methylbenzylamine
8
7
7.6 X lO""
2.6 X 10"
^ average value quoted as experiments performed with more than one [sulfitejstoich / M
Values of k4 can be determined by applying Equation 6.9 and using the experimental
values of o ^LsulfiteJstoich / mol dm" s" along with S0rensen and Andersen's values of
Ka = 2.0 X 10' ^ mol dm" and K 3 = 2.2 x 10 mol'^ dm^ and a Khso3- value^ of
6.3 X 10" mol dm" . Under the experimental conditions used, [CH2(OH)(S03Na)] is
equal to 0.10 mol dm'" . The pKa values of 4-methoxybenzylamine and
7V-methylbenzylamine are 9.51 and 9.59 respectively.
The calculated k4 values for 4-methoxybenzylamine and A^-methylbenzylamine are
2.3 X 10 and 4.3 x 10 dm^ mol'^ s" respectively. In Chapter 2, k4 values of
8.0x10 to 2.4x10 dm mol" s" were obtained for anilines.
Values of k4 for the reaction of benzylamines and benzylamine derivatives have not
been reported in the literature. However, a correlation is expected between k4 values,
measuring the nucleophilicities of the amines, and their basicities, as measured by pKa
values. Atherton"* has calculated a Br0nsted p value, relating nucleophilicity and
basicity, of around 0.26 for this reaction. Therefore a value for k4 of around
10^ dm^ mol"^ s" might be expected for reaction of an amine whose conjugate acid has a
pKa value of around 9.
The value of k4 obtained here for A^-methylbenzylamine is in approximate agreement
with the expected value of 10 dm^ mol'^ s'\ However the value obtained for
4-methoxybenzylamine is lower, 2.3 x 10 dm^ mol" s"\ This suggests that a step other
276
than nucleophilic attack of the amine on HCHO is rate Hmiting. It is therefore necessary
to consider the possibility that, as is the case for aniline, dehydration of the
7V-(hydroxymethyl)benzylamine can become the rate determining step and ks is rate
limiting.
The rate expression derived for anilines for the observed first order rate constant, kobs,
applying the assumption that ks is rate limiting is given in Equation 6.10.
^ ^ ^ ^5K4Ka[CH2(OH)(S03-)] ^ K H S O 3 - + [ H i (6
K3[sulfite]stoich K H S O 3 -
As before, the pKa of the amine must be built into this equation for benzylamines.
Therefore kobs at high pH is given by Equation 6.11 when the amine is a benzylamine.
^^^^ ^ ^5K4Ka[CH2(OH)(S03')] ^ K H S 0 3 - + [ H i ^ Ka(amine) (^^ j j )
K3[sulflte]stoich K H S 0 3 - Ka(amme) + [H ]
Abrams and Kallen^ report that the value of K4, the equilibrium constant for
7V-(hydroxymethyl)amine formation, is not strongly dependent on the nature of the
amine and is approximately 4x10"^ dm^ mol"^ in terms of free HCHO. Using this value
together with the values of ^o6i[sulfite]stoich in Table 6.45 and the other known
equilibrium constants, a value of ks equal to 8 x 10 dm^ mol'^ s" can be calculated.
This value is not unreasonable given that values greater than 10^ dm^ mol"^ s"
have previously been reported for the proton catalysed dehydration of
7V-(hydroxymethyl)amines formed from diprotic amines.
To summarise, the rate limiting step for the overall reaction is likely to change from
formation of the A^-(hydroxymethyl)amine to iV-(hydroxymethyl)amine dehydration as
the pH increases from 6 to 8.
277
6.4 E X P E R I M E N T A L
6.4.1 NMR experiments
The reactions of benzylamine and four benzylamine derivatives with CH2(OH)(S03Na)
were followed using ^H NMR spectroscopy. Initially the spectrum of 0.015 to 0.2 M
amine alone was obtained, then the spectrum in the presence of equimolar
CH2(OH)(S03Na) (0.2 M or 0.015 M each), then with each reagent in excess (0.2 M
amine with 0.4 or 0.1 M CH2(OH)(S03Na) or 0.015 M amine with 0.030 or
7.9 X 10' M CH2(OH)(S03Na)). The concentrations used were determined by the
solubility of the amine. The solutions were made immediately prior to use. The amine
was placed in the NMR tube: neat amine was used or, i f using a solid, a solution in D2O
was prepared. 4-Methyl- and TV-methyl- benzylamine are not readily soluble in aqueous
solution therefore a stock solution in methyl-d3 alcohol-d, CD3OD, was prepared. 1 cm^
D2O was then added to the NMR tube followed by the CH2(OH)(S03Na) which was
added at the NMR machine side. A final solvent system of 3 % CD3OD / 97 % water
by volume was used for the 4-methyl- and A^-methyl- benzylamines. The ^H NMR
spectrum of CHD2OD is characterised by a quintet at 6 3.35 ppm. However it was not
visible in any spectra as it was present in too small a proportion.
4-Nitrobenzylamine is purchased as the hydrochloride. Therefore the solution was
neutralised prior to addition of CH2(OH)(S03Na) by adding an NaOH in D2O solution.
The maximum NaOH solution concentration that could be added to a 0.2 M amine
solution without the solution becoming cloudy was 0.134 M. CH2(OH)(S03Na) reacts
with NaOH therefore the amine must necessarily be in slight excess to prevent this
reaction from occurring.
Spectra were recorded immediately (2 to 5 minutes) after mixing, then 30 minutes,
1 hour and 5 hours after mixing and continued until there was no fiirther change in the
spectrum. A spectrum after 15 minutes was also obtained for the reaction with
benzylamine. The time of mixing refers to the time at which CH2(OH)(S03Na) was
added to the NMR tube. The time of each spectrum was taken as the time when the
spectrometer started to acquire the spectrum.
278
^H NMR spectra were recorded using a 200 MHz Varian Mercury - 200 spectrometer.
The 5 4.67 ppm singlet due to residual protons in the deuterated solvent, D2O, was used
for locking purposes and as the reference peak for all spectra. Chemical shifts are
quoted to 2 decimal places. Coupling constants are given where the multiplicity is
greater than a singlet and are quoted to the nearest whole number.
6.4.2 Uv / vis experiments
Absorbance against wavelength spectra were obtained for the reaction of the amine
(2.0 X 10- to 2.0 X 10" M) with 2.0 x 10" to 0.10 M CH2(OH)(S03Na). Mixed solvent
systems of 2 % methanol / 98 % water by volume were used for 4-methyl and
A'-methyl- benzylamine as these amines are not soluble in aqueous solution.
Spectra were obtained using a UV-2101 PC Shimadzu Corporation or Perkin - Elmer
Lambda 2 uv / vis spectrometer at 25 °C with 1 cm stoppered quartz cuvettes, taking
scans every 5 or 15 minutes for up to 3 or IV2 hours using a scan speed of 480 nm min'\
The cuvettes were left in the spectrometer for at least 10 minutes prior to use to allow
the temperature to equilibrate to 25 °C. Addition of the amine solution was used to
initiate the reaction. Extinction coefficients are quoted to 2 or 3 significant figures and
were calculated using only one spectrum in most cases.
Plots of absorbance against time were obtained for the reaction of the amine
(2.0 X 10" to 2.0 X 10- M) with 0.01 to 0.10 M aqueous CH2(OH)(S03Na) at 25 °C.
The effect of the presence of added sulfite ions in the system was investigated for two
amines: the reaction of 1.0 x 10" or 2.0 x 10' M amine with 0.10 M aqueous
CH2(OH)(S03Na) solution in the presence of 2.0 x 10" to 0.010 M aqueous sodium
sulfite solution was studied at 25 °C at pH 7 or 8.
Plots were recorded using a Perkin - Elmer Lambda 2 or 12 uv / vis spectrometer at
25 °C with 1 cm stoppered quartz cuvettes. The data interval ranged from 20 seconds to
171/2 minutes and the overall reaction time from 3 to 16 hours depending on the pH and
concentrations used. The cuvettes were left in the spectrometer for at least 10 minutes
prior to use to allow the temperature to equilibrate at 25 °C. Addition of the amine
solution was used to initiate the reaction. Formation of the product was followed at
279
240 nm when using benzylamine, 4-methoxybenzylamine and 4-methylbenzylamine,
315 nm for 4-nitrobenzylamine and 230 nm for A^-methylbenzylamine. Mixed solvent
systems of 2 % methanol / 98 % water by volume were used for reactions with 4-methyl
and iV-methyl- benzylamine.
The spectrum of CH2(OH)(S03Na) does not show any significant absorbance in the
uv / vis spectrum. However sulfite ions do absorb in this region; spectra of 0.01, 0.05
and 0.10 M aqueous sodium sulfite solution were obtained and showed high absorbance
around 250 nm and to shorter wavelength. For example, the extinction coefficient of
sulfite ions at 245 nm was found to be 50 dm^ mol'^ cm \ Therefore the appropriate
concentration of sulfite ions was added to the reference in order to subtract the
absorbance due to the presence of sulfite from the absorbance against time plots. Where
[sulfitejstoich is quoted this refers to the total concentration of aqueous sodium sulfite
added externally to the system and does not include the concentration of sulfite ions
present in solution due to dissociation of CH2(OH)(S03Na).
For experiments where the ionic strength was kept constant, potassium chloride was
used to maintain an ionic strength of 1.0 M .
First order plots were fitted using the PECSS program installed on the Perkin - Elmer
Lambda 2 spectrometer or by plotting ln(Aoo - A) against time / s using Microsoft Excel
and performing linear regression. Rate constants are quoted to 2 decimal places. Linear
regression on Microsoft Excel was used to calculate kf(app) and kb values, equal to the
gradient and intercept respectively. Values are quoted to three significant figures. The
equilibrium constant, K(app), is quoted to two significant figures. The percentage error in
K(app) was calculated using Equation 6.12. The percentage error was then converted to
an absolute value of K(app).
2 2 % error in K(app) =>/ [(% error in kf(app)) + (% error in kb) ] (6.12)
The buffers employed and the corresponding stoichiometric buffer concentrations in the
final solutions are shown in Table 6.46. Where buffers were used, the appropriate
volume of buffer was also present in the reference cuvette.
280
Table 6.46: Buffer concentrations, in aqueous solution
pH component A [AJstoich / M component B [BJstoich / M
6 KH2PO4 0.19 NaOH 0.011
7 KH2PO4 0.19 NaOH 0.022
8 KH2PO4 0.19 NaOH 0.18
9 Na2B4O7.10H2O 0.016 HCl 6.0 X 10"
10 Na2B4O7.10H2O 0.032 NaOH 0.046
The pH values of all solutions were determined using a Jenway 3020 pH meter
calibrated using pH 7 and pH 10 (for alkaline solutions) or pH 4 (for acidic solutions)
buffers. pH values are quoted to one decimal place.
Plots of absorbance against time were obtained at 240 nm for the reaction of
5.5 X 10"" to 3.0 X 10" M benzylamine with 3.0 x 10' to 0.10 M aqueous
CH2(OH)(S03Na) at 25 °C using stopped flow spectrophotometry to study the initial
faster reaction. Plots were recorded using an Applied Photophysics DX.17MV
BioSequential Stopped - flow ASVD Spectrometer at 25.1 - 25.2 °C with a cell of 1 cm
path length. Ten averages were obtained, each the average of three runs of 50 seconds.
The appropriate aqueous benzylamine solution was placed in one syringe and the
aqueous CH2(OH)(S03Na) solution in the other. The averages were fitted to obtain first
order rate constants, kobs I s'\ using the single exponential fit fiinction on the !SX.17MV
program installed on the spectrometer. Values of kobs I s" are quoted to three decimal
places.
281
6.5 R E F E R E N C E S
1. D. D. Perrin, 'Dissociation Constants of Organic Bases in Aqueous Solution',
Butterworths, London, 1965 and 1972 Supplement
2. P. E. Serensen and V. S. Andersen, Acta Chem. Scand, 1970, 24, 1301
3. (a) E. Hayon, A. Treinin and J. Wilf, J. Am, Chem. Soc, 1972, 94, 47; (b) H. V.
Tartar and H. H. Garretson, J. Am. Chem. Soc, 1941, 63, 808
4. J. H. Atherton, unpublished work
5. W. R. Abrams and R. G. Kallen, J. Am. Chem. Soc, 1976, 98, 7777
6. R. G. Kallen, J. Am. Chem. Soc, 1971, 93, 6236
282
CHAPTER 7
Decomposition of RCHiNR'CHiSOj' adducts
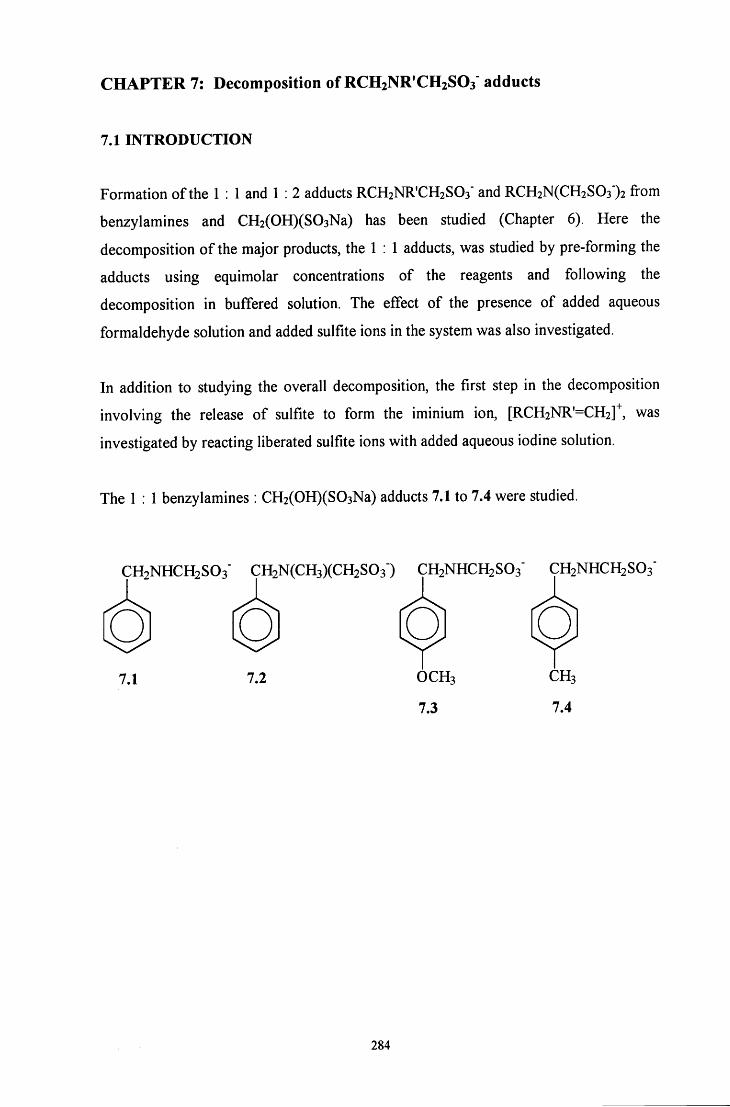
C H A P T E R 7: Decomposition of RCHjNR'CHzSOa adducts
7.1 INTRODUCTION
Formation of the 1 : 1 and 1 : 2 adducts RCH2NR'CH2S03' and RCH2N(CH2S03')2 from
benzylamines and CH2(OH)(S03Na) has been studied (Chapter 6). Here the
decomposition of the major products, the 1 : 1 adducts, was studied by pre-forming the
adducts using equimolar concentrations of the reagents and following the
decomposition in buffered solution. The effect of the presence of added aqueous
formaldehyde solution and added sulfite ions in the system was also investigated.
In addition to studying the overall decomposition, the first step in the decomposition
involving the release of sulfite to form the iminium ion, [RCH2NR-CH2]^, was
investigated by reacting liberated sulfite ions with added aqueous iodine solution.
The 1 : 1 benzylamines : CH2(OH)(S03Na) adducts 7.1 to 7.4 were studied.
CH2NHCH2SO3" CH2N(CH3)(CH2S03") CH2NHCH2SO3" CH2NHCH2SO3
7.1 7.2
o O C H 3
7.3
CH3
7.4
284
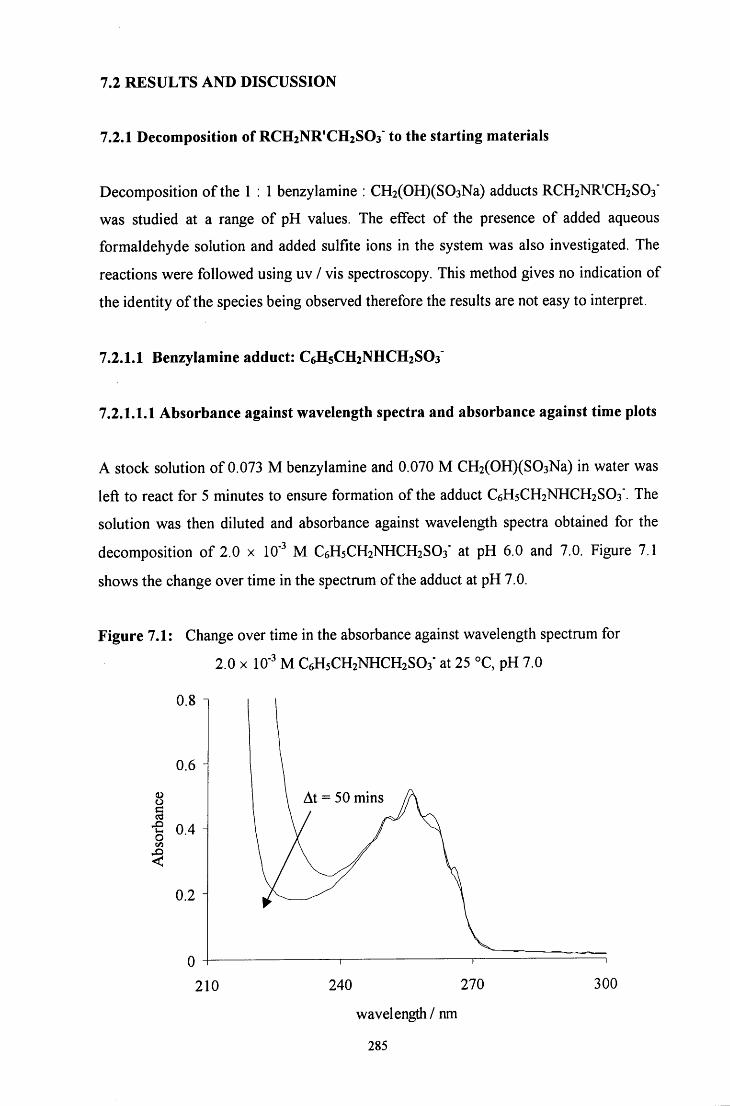
7.2 R E S U L T S AND DISCUSSION
7.2.1 Decomposition of RCHiNR'CHiSOs to the starting materials
Decomposition of the 1 : 1 benzylamine : CH2(OH)(S03Na) adducts RCH2NRCH2S03'
was studied at a range of pH values. The effect of the presence of added aqueous
formaldehyde solution and added sulfite ions in the system was also investigated. The
reactions were followed using uv / vis spectroscopy. This method gives no indication of
the identity of the species being observed therefore the results are not easy to interpret.
7.2.1.1 Benzylamine adduct: C6H5CH2NHCH2SO3
7.2.1.1.1 Absorbance against wavelength spectra and absorbance against time plots
A stock solution of 0.073 M benzylamine and 0.070 M CH2(OH)(S03Na) in water was
left to react for 5 minutes to ensure formation of the adduct C6H5CH2NHCH2SO3". The
solution was then diluted and absorbance against wavelength spectra obtained for the
decomposition of 2.0 x 10" M C6H5CH2NHCH2SO3" at pH 6.0 and 7.0. Figure 7.1
shows the change over time in the spectrum of the adduct at pH 7.0.
Figure 7.1: Change over time in the absorbance against wavelength spectrum for
2.0 X 10- M C6H5CH2NHCH2SO3" at 25 °C, pH 7.0
0.8
O
o
0.6
0.4 H
0.2 i
At = 50 mins
210 240 270
wavelength / nm
285
300
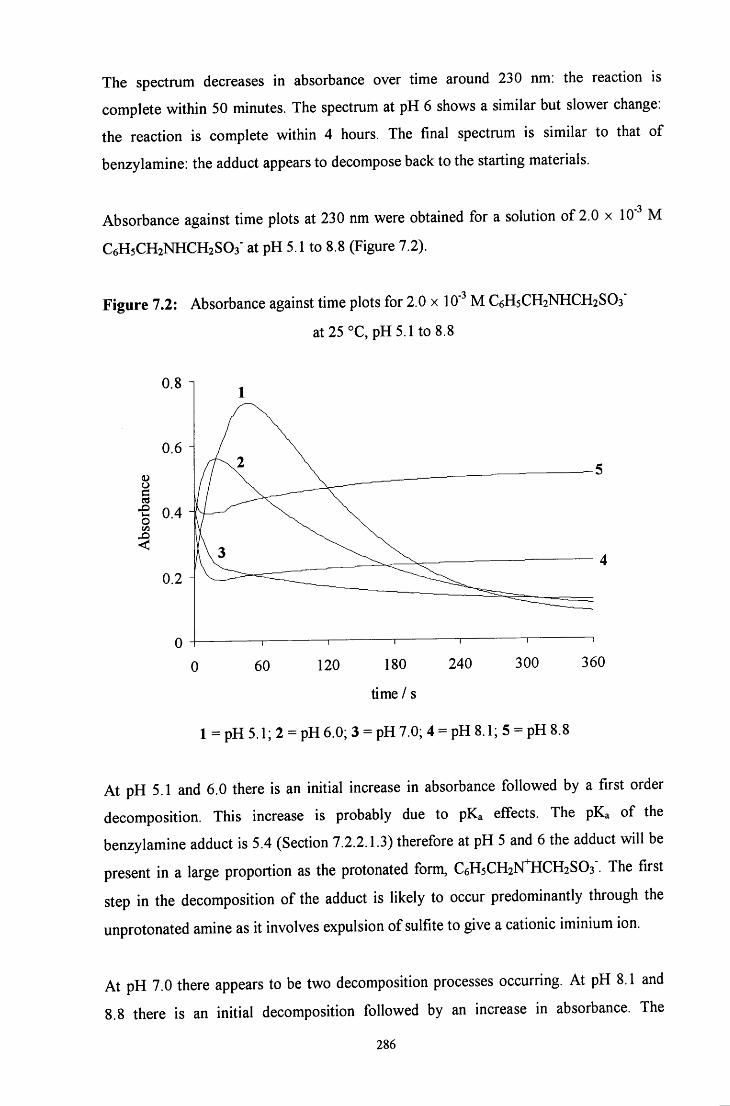
The spectrum decreases in absorbance over time around 230 nm; the reaction is
complete within 50 minutes. The spectrum at pH 6 shows a similar but slower change:
the reaction is complete within 4 hours. The final spectrum is similar to that of
benzylamine: the adduct appears to decompose back to the starting materials.
Absorbance against time plots at 230 nm were obtained for a solution of 2.0 x 10' M
C6H5CH2NHCH2S03' at pH 5.1 to 8.8 (Figure 7.2).
Figure 7.2: Absorbance against time plots for 2.0 x 10" M C 6 H 5 C H 2 N H C H 2 S O 3 "
at 25 °C,pH5.1 to8 .8
§
60 120 180
time / s
240 300 360
1 = pH 5.1; 2 = pH 6.0; 3 = pH 7.0; 4 = pH 8.1; 5 = pH 8.8
At pH 5.1 and 6.0 there is an initial increase in absorbance followed by a first order
decomposition. This increase is probably due to pKa effects. The pKa of the
benzylamine adduct is 5.4 (Section 7.2.2.1.3) therefore at pH 5 and 6 the adduct will be
present in a large proportion as the protonated form, C6H5CH2NtlCH2S03". The first
step in the decomposition of the adduct is likely to occur predominantly through the
unprotonated amine as it involves expulsion of sulfite to give a cationic iminium ion.
At pH 7.0 there appears to be two decomposition processes occurring. At pH 8.1 and
8.8 there is an initial decomposition followed by an increase in absorbance. The
286
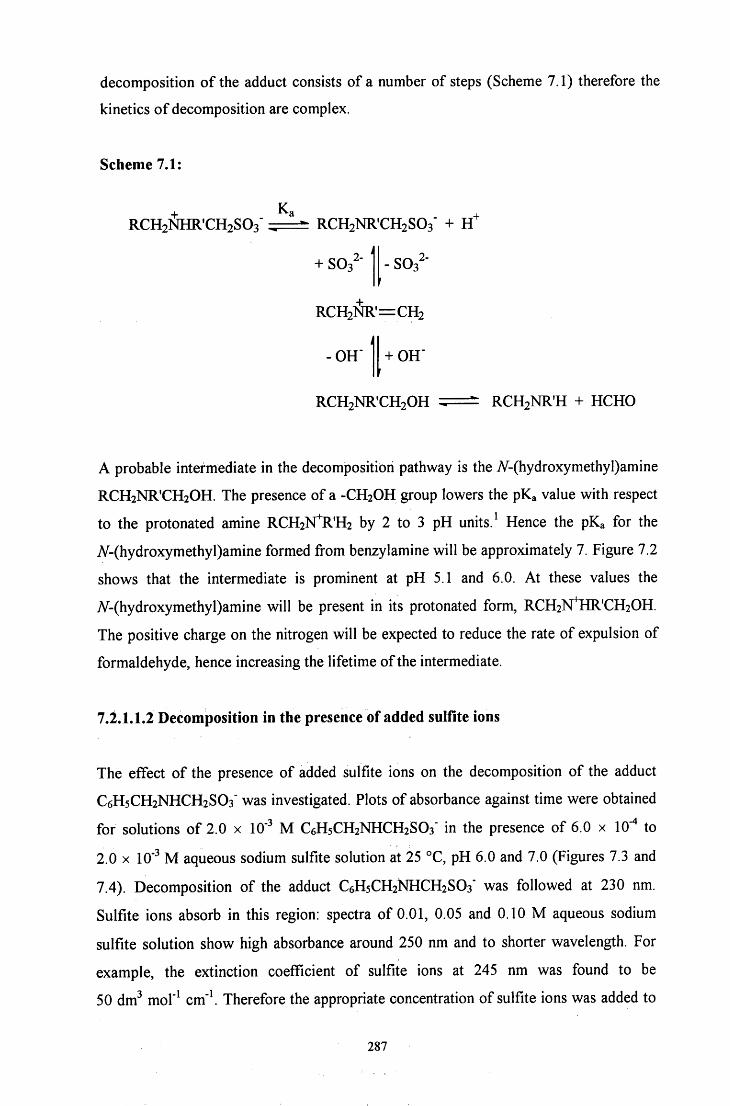
decomposition of the adduct consists of a number of steps (Scheme 7.1) therefore the
kinetics of decomposition are complex.
Scheme 7.1:
RCHsNHR'CHsSOs" RCH2NRCH2SO3' + H
. 41 + S0. SOa
RCH2NR'=CH2
-OH" + 0H"
RCH2NR'CH20H RCH2NR 'H + HCHO
A probable intermediate in the decomposition pathway is the //-(hydroxymethyl)amine
RCH2NRCH2OH. The presence of a -CH2OH group lowers the pKa value with respect
to the protonated amine RCH2lsrR'H2 by 2 to 3 pH units. Hence the pKa for the
7V-(hydroxymethyl)amine formed from benzylamine will be approximately 7. Figure 7.2
shows that the intermediate is prominent at pH 5.1 and 6.0. At these values the
A^-(hydroxymethyl)amine will be present in its protonated form, RCH2N^HRCH20H.
The positive charge on the nitrogen will be expected to reduce the rate of expulsion of
formaldehyde, hence increasing the lifetime of the intermediate.
7.2.1.1.2 Decomposition in the presence of added sulfite ions
The effect of the presence of added sulfite ions on the decomposition of the adduct
C6H5CH2NHCH2SO3" was investigated. Plots of absorbance against time were obtained
for solutions of 2.0 x 10' M C6H5CH2NHCH2SO3" in the presence of 6.0 x 10"* to
2.0 X 10' M aqueous sodium sulfite solution at 25 °C, pH 6.0 and 7.0 (Figures 7.3 and
7.4). Decomposition of the adduct C6H5CH2NHCH2SO3" was followed at 230 nm.
Sulfite ions absorb in this region: spectra of 0.01, 0.05 and 0.10 M aqueous sodium
sulfite solution show high absorbance around 250 nm and to shorter wavelength. For
example, the extinction coefficient of sulfite ions at 245 nm was found to be
50 dm"' mol"^ cm"\ Therefore the appropriate concentration of sulfite ions was added to
287
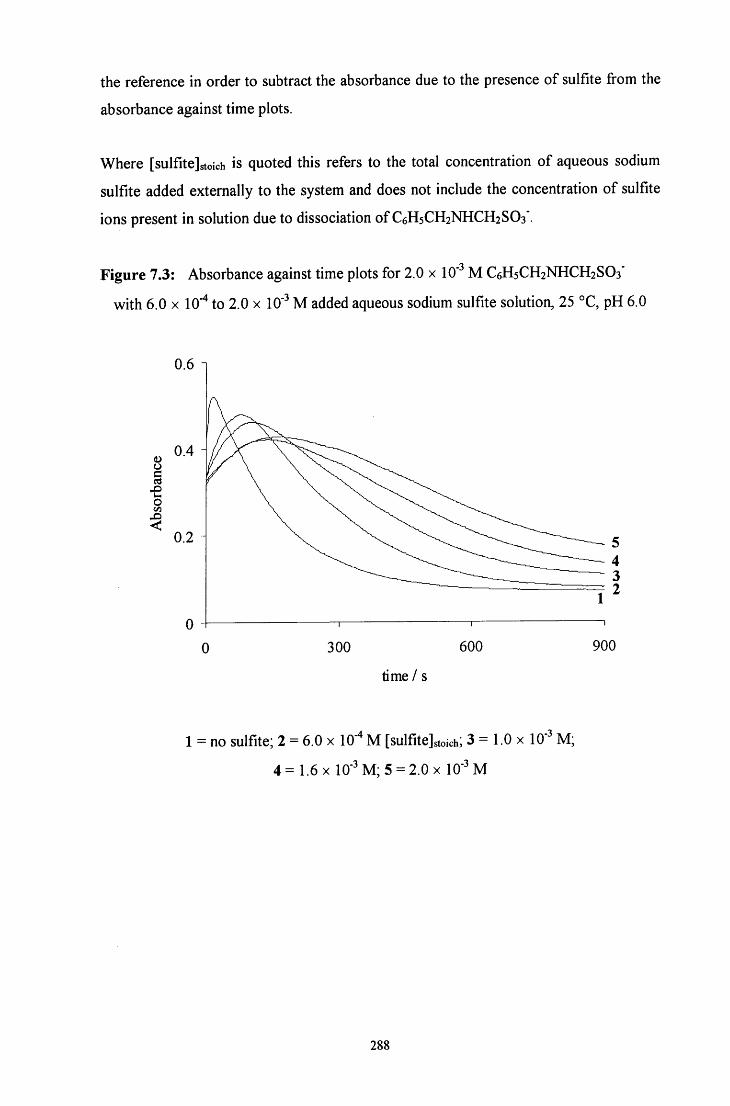
the reference in order to subtract the absorbance due to the presence of sulfite fi-om the
absorbance against time plots.
Where [sulfite]stoich is quoted this refers to the total concentration of aqueous sodium
sulfite added externally to the system and does not include the concentration of sulfite
ions present in solution due to dissociation of C6H5CH2NHCH2SO3".
Figure 7.3: Absorbance against time plots for 2.0 x 10" M C6H5CH2NHCH2SO3'
with 6.0 x 10""* to 2.0 x 10' M added aqueous sodium sulfite solution, 25 °C, pH 6.0
0.6 1
4) i
300 600 900
time / s
1 = no sulfite; 2 = 6.0 x 10" M [sulfite]stoich; 3 = 1.0 x 10" M ;
4= 1.6x 10" M ; 5 = 2.0 X 10"'M
288
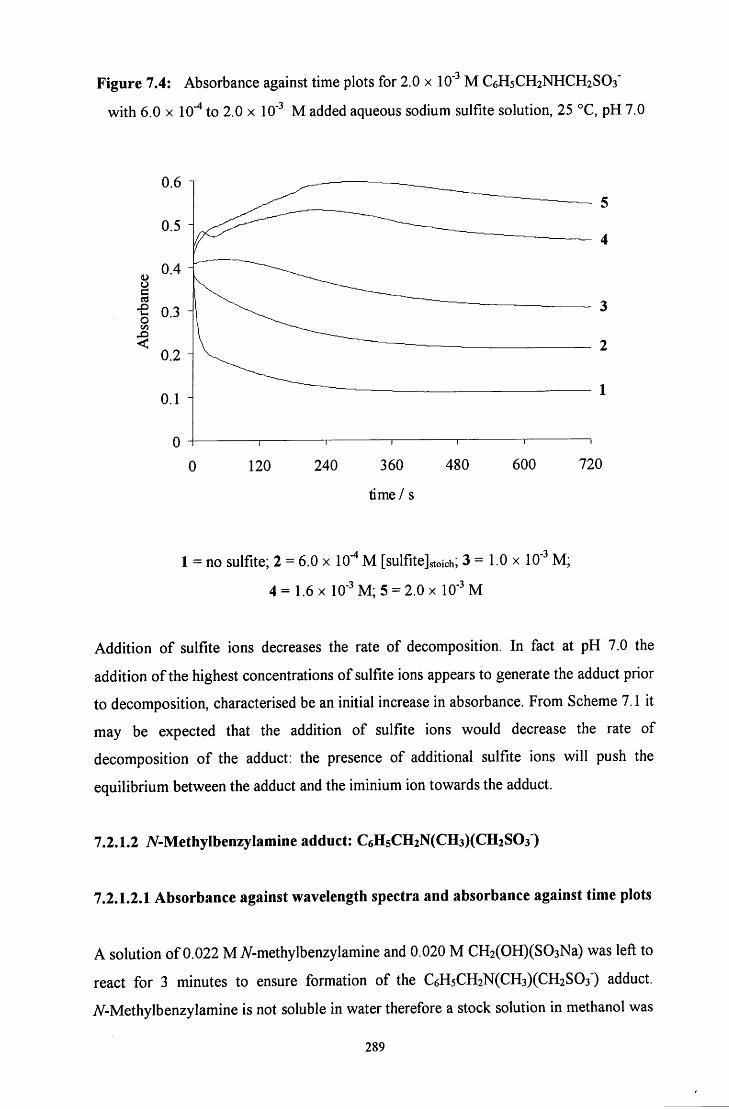
Figure 7.4: Absorbance against time plots for 2.0 x 10" M C6H5CH2NHCH2SO3"
with 6.0 X 10'" to 2.0 x 10" M added aqueous sodium sulfite solution, 25 °C, pH 7.0
120 240 360 480
time / s
1 = no sulfite; 2 = 6.0 x 10" M [sulfite]stoich; 3 = 1.0 x 10' M ;
4=1 .6x 10- M ;5 = 2.0x 10" M
Addition of sulfite ions decreases the rate of decomposition. In fact at pH 7.0 the
addition of the highest concentrations of sulfite ions appears to generate the adduct prior
to decomposition, characterised be an initial increase in absorbance. From Scheme 7.1 it
may be expected that the addition of sulfite ions would decrease the rate of
decomposition of the adduct: the presence of additional sulfite ions will push the
equilibrium between the adduct and the iminium ion towards the adduct.
7.2.1.2 iV-Methylbenzylamine adduct: C6H5CH2N(CH3)(CH2S03 )
7.2.1.2.1 Absorbance against wavelength spectra and absorbance against time plots
A solution of 0.022 MAT-methylbenzylamine and 0.020 M CH2(OH)(S03Na) was left to
react for 3 minutes to ensure formation of the C6H5CH2N(CH3)(CH2S03') adduct.
7V-Methylbenzylamine is not soluble in water therefore a stock solution in methanol was
289
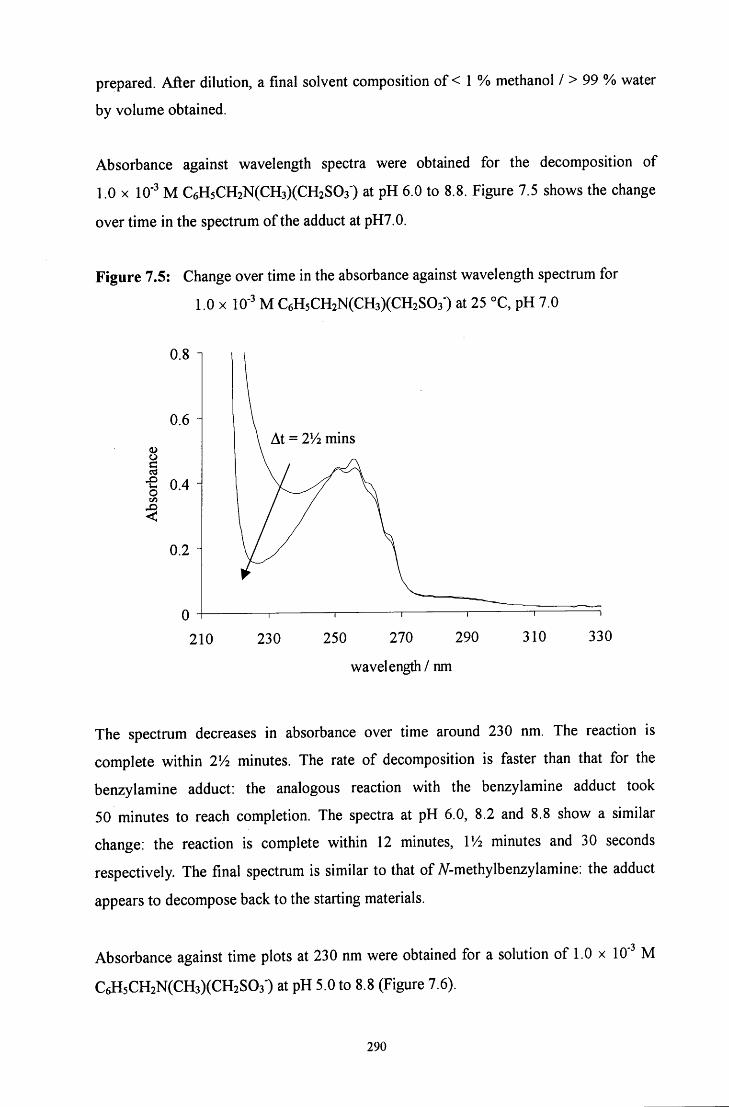
prepared. After dilution, a final solvent composition of < 1 % methanol / > 99 % water
by volume obtained.
Absorbance against wavelength spectra were obtained for the decomposition of
1.0 X 10- M C6H5CH2N(CH3)(CH2S03") at pH 6.0 to 8.8. Figure 7.5 shows the change
over time in the spectrum of the adduct at pH7.0.
Figure 7.5: Change over time in the absorbance against wavelength spectrum for
1.0 X 10- M C6H5CH2N(CH3)(CH2S03") at 25 °C, pH 7.0
I o
0.8
0.6 H
0.4 i
0.2
At = 2/2 mms
210 230 250 270 290
wavelength / nm
310 330
The spectrum decreases in absorbance over time around 230 nm. The reaction is
complete within 2V2 minutes. The rate of decomposition is faster than that for the
benzylamine adduct: the analogous reaction with the benzylamine adduct took
50 minutes to reach completion. The spectra at pH 6.0, 8.2 and 8.8 show a similar
change: the reaction is complete within 12 minutes, IV2 minutes and 30 seconds
respectively. The final spectrum is similar to that of A -methylbenzylamine: the adduct
appears to decompose back to the starting materials.
Absorbance against time plots at 230 nm were obtained for a solution of 1.0 x 10' M
C6H5CH2N(CH3)(CH2S03") at pH 5.0 to 8.8 (Figure 7.6).
290
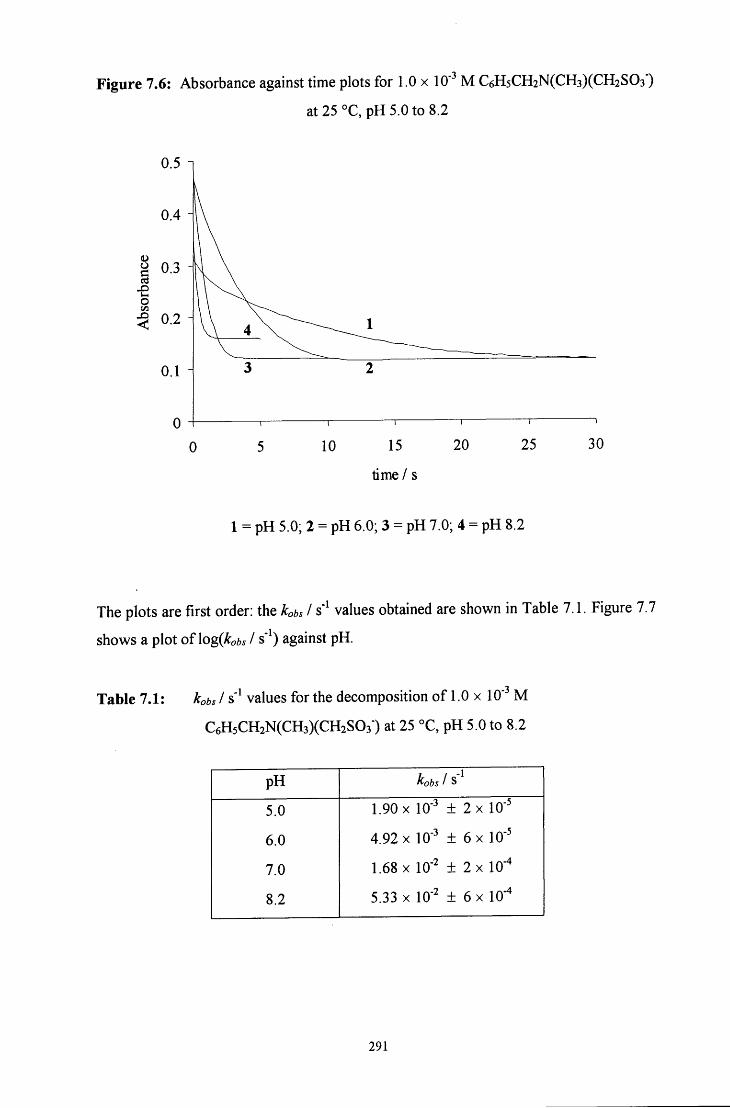
Figure 7.6: Absorbance against time plots for 1.0 x 10' M C6H5CH2N(CH3)(CH2S03')
at 25 °C, pH 5.0 to 8.2
a 0.3
10 15
time / s
20 25 30
1 = pH 5.0; 2 = pH 6.0; 3 = pH 7.0; 4 = pH 8.2
The plots are first order: the kobs I s' values obtained are shown in Table 7.1. Figure 7.7
shows a plot of \og{kobs I s' ) against pH.
Table 7.1: kobs I s' values for the decomposition of 1.0 x 10" M
C6H5CH2N(CH3)(CH2S03") at 25 °C, pH 5.0 to 8.2
pH kobs / S
5.0 1.90 x 10" ± 2x 10"
6.0 4.92 X 10" ± 6 X 10'
7.0 1.68 X 10" ± 2 X 10"*
8.2 5.33 X 10' ± 6 X 10"*
291
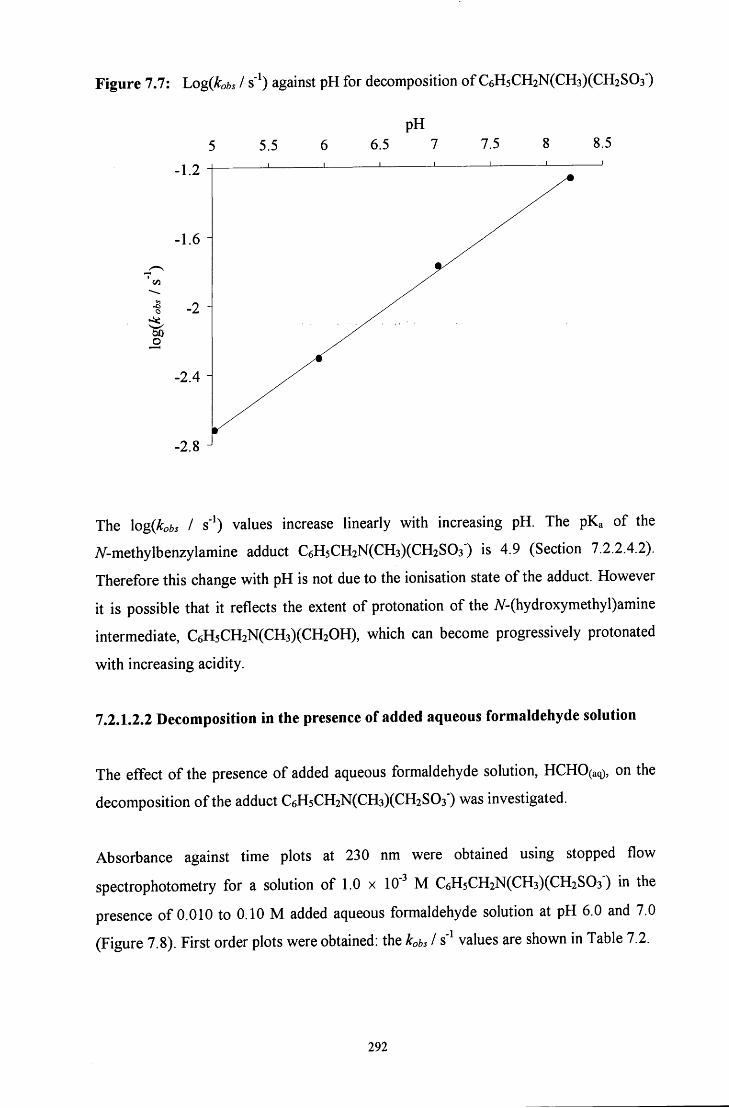
Figure 7.7: Log(fc6, / s'') against pH for decomposition of C6H5CH2N(CH3)(CH2S03 )
pH
to O
5 5.5 6 6.5 7 7.5 8 8.5
-1.2
The \og(kobs I s' ) values increase linearly with increasing pH. The pKa of the
A -methylbenzylamine adduct C6H5CH2N(CH3)(CH2S03") is 4.9 (Section 7.2.2.4.2).
Therefore this change with pH is not due to the ionisation state of the adduct. However
it is possible that it reflects the extent of protonation of the A -(hydroxymethyl)amine
intermediate, C6H5CH2N(CH3)(CH20H), which can become progressively protonated
with increasing acidity.
7.2.1.2.2 Decomposition in the presence of added aqueous formaldehyde solution
The effect of the presence of added aqueous formaldehyde solution, HCHO(aq), on the
decomposition of the adduct C6H5CH2N(CH3)(CH2S03") was investigated.
Absorbance against time plots at 230 nm were obtained using stopped flow
spectrophotometry for a solution of 1.0 x 10' M C6H5CH2N(CH3)(CH2S03') in the
presence of 0.010 to 0.10 M added aqueous formaldehyde solution at pH 6.0 and 7.0
(Figure 7.8). First order plots were obtained; the kobs I s" values are shown in Table 7.2.
292
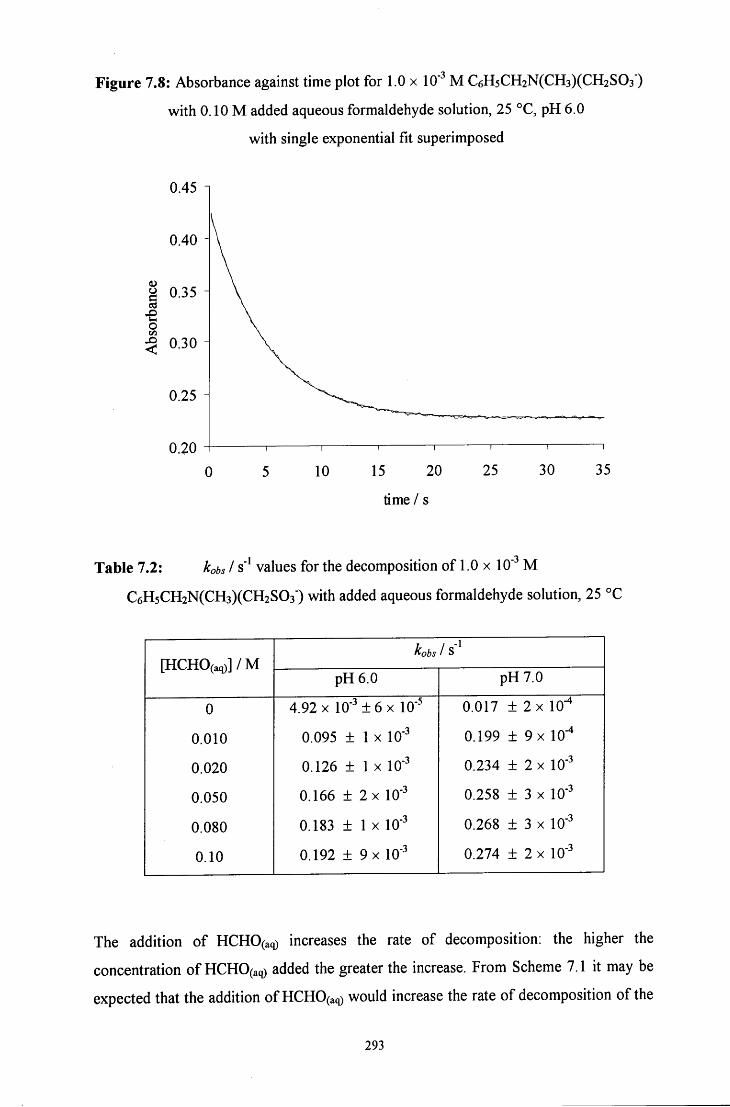
Figure 7.8: Absorbance against time plot for 1.0 x 10" M C6H5CH2N(CH3)(CH2S03')
with 0.10 M added aqueous formaldehyde solution, 25 °C, pH 6.0
with single exponential fit superimposed
0.45 1
0.40
a 0.35 X)
^ 0.30
0.25
0.20 10 15
—1 1 1 1 20 25 30 35
time / s
Table 7.2: kobs I s' values for the decomposition of 1.0 x 10" M
C6H5CH2N(CH3)(CH2S03") with added aqueous formaldehyde solution, 25 °C
[ H C H O ( a q ) ] / M ^obs Is'
[ H C H O ( a q ) ] / M pH6.0 pH7.0
0 4.92 X 10" ± 6 X 10" 0.017 ± 2 X lO"*
0.010 0.095 ± 1 X 10' 0.199 ± 9x 10"*
0.020 0.126 ± 1 X 10" 0.234 ± 2 X 10"
0.050 0.166 ± 2 X 10' 0.258 ± 3 X 10"
0.080 0.183 ± 1 X 10" 0.268 ± 3 X 10'
0.10 0.192 ± 9x 10" 0.274 ± 2x10"^
The addition of H C H O ( a q ) increases the rate of decomposition: the higher the
concentration of H C H O ( a q ) added the greater the increase. From Scheme 7.1 it may be
expected that the addition of H C H O ( a q ) would increase the rate of decomposition of the
293
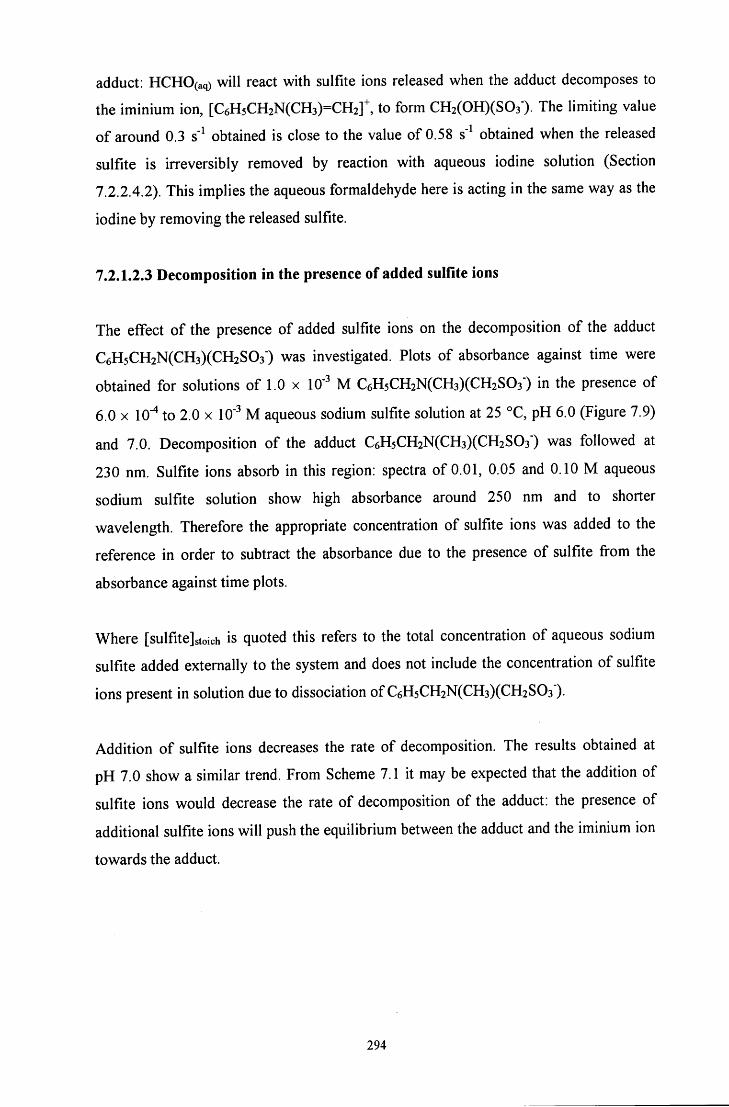
adduct: HCHO(aq) will react with sulfite ions released when the adduct decomposes to
the iminium ion, [C6H5CH2N(CH3)=CH2]^ to form CH2(OH)(S03'). The limiting value
of around 0.3 s" obtained is close to the value of 0.58 s" obtained when the released
sulfite is irreversibly removed by reaction with aqueous iodine solution (Section
7.2.2.4.2). This implies the aqueous formaldehyde here is acting in the same way as the
iodine by removing the released sulfite.
7.2.1.2.3 Decomposition in the presence of added sulfite ions
The effect of the presence of added sulfite ions on the decomposition of the adduct
C6H5CH2N(CH3)(CH2S03") was investigated. Plots of absorbance against time were
obtained for solutions of 1.0 x 10' M C6H5CH2N(CH3)(CH2S03") in the presence of
6.0 X 10'"* to 2.0 X 10" M aqueous sodium sulfite solution at 25 °C, pH 6.0 (Figure 7.9)
and 7.0. Decomposition of the adduct C6H5CH2N(CH3)(CH2S03") was followed at
230 nm. Sulfite ions absorb in this region: spectra of 0.01, 0.05 and 0.10 M aqueous
sodium sulfite solution show high absorbance around 250 nm and to shorter
wavelength. Therefore the appropriate concentration of sulfite ions was added to the
reference in order to subtract the absorbance due to the presence of sulfite fi*om the
absorbance against time plots.
Where [sulfitejstoich is quoted this refers to the total concentration of aqueous sodium
sulfite added externally to the system and does not include the concentration of sulfite
ions present in solution due to dissociation of C6H5CH2N(CH3)(CH2S03")-
Addition of sulfite ions decreases the rate of decomposition. The results obtained at
pH 7.0 show a similar trend. From Scheme 7.1 it may be expected that the addition of
sulfite ions would decrease the rate of decomposition of the adduct: the presence of
additional sulfite ions will push the equilibrium between the adduct and the iminium ion
towards the adduct.
294
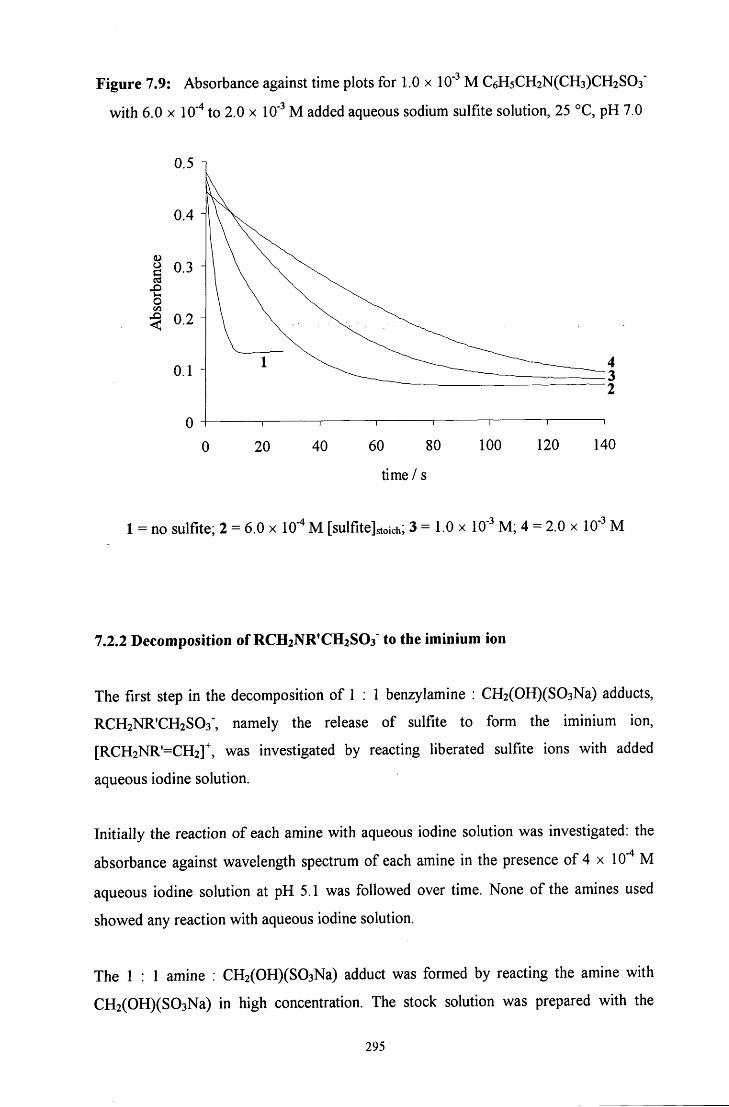
Figure 7.9: Absorbance against time plots for 1.0 x 10' M C6H5CH2N(CH3)CH2S03'
with 6.0 X 10'"* to 2.0 X 10" M added aqueous sodium sulfite solution, 25 °C, pH 7.0
0.5 1
a 0.3
time / s
1 = no sulfite; 2 = 6.0 x 10" M [sulfite]stoich; 3 = 1.0 x lO"' M; 4 = 2.0 x 10' M
7.2.2 Decomposition of RCH2NR'CH2S03' to the iminium ion
The first step in the decomposition of 1 : 1 benzylamine : CH2(OH)(S03Na) adducts,
RCH2NR'CH2S03', namely the release of sulfite to form the iminium ion,
[RCH2NR-CH2]^, was investigated by reacting liberated sulfite ions with added
aqueous iodine solution.
Initially the reaction of each amine with aqueous iodine solution was investigated: the
absorbance against wavelength spectrum of each amine in the presence of 4 x 10" M
aqueous iodine solution at pH 5.1 was followed over time. None of the amines used
showed any reaction with aqueous iodine solution.
The 1 : 1 amine : CH2(OH)(S03Na) adduct was formed by reacting the amine with
CH2(OH)(S03Na) in high concentration. The stock solution was prepared with the
295
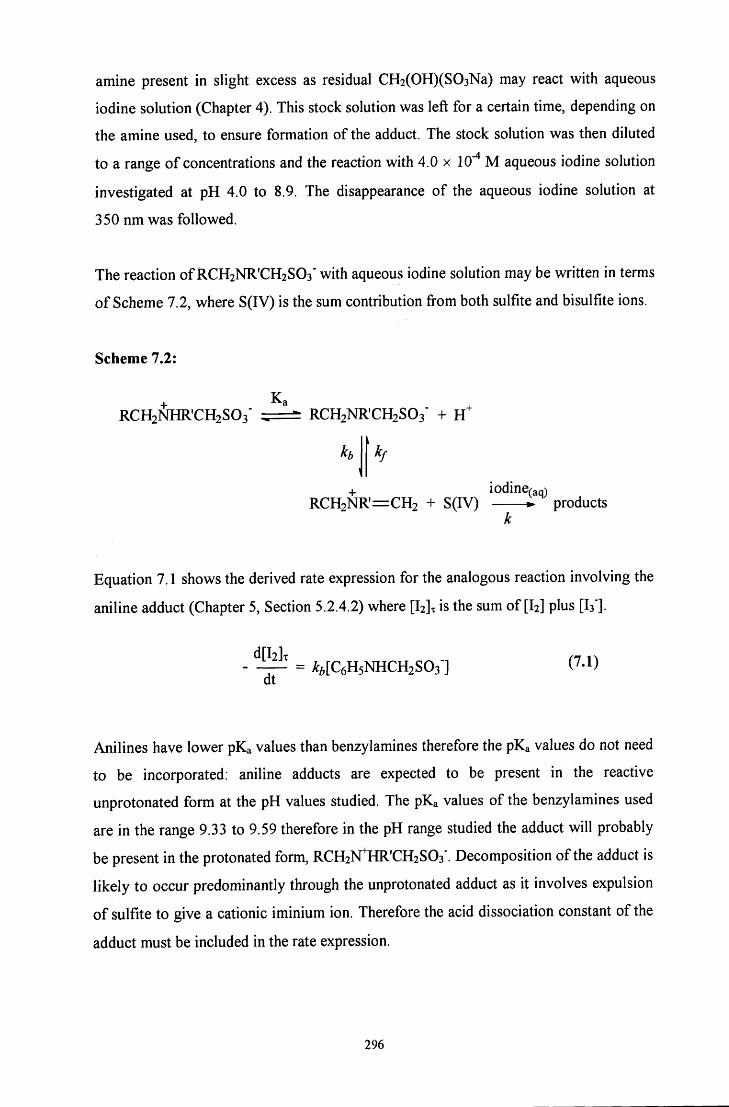
amine present in slight excess as residual CH2(OH)(S03Na) may react with aqueous
iodine solution (Chapter 4). This stock solution was left for a certain time, depending on
the amine used, to ensure formation of the adduct. The stock solution was then diluted
to a range of concentrations and the reaction with 4.0 x 10""* M aqueous iodine solution
investigated at pH 4.0 to 8.9. The disappearance of the aqueous iodine solution at
350 nm was followed.
The reaction of RCH2NR'CH2S03' with aqueous iodine solution may be written in terms
of Scheme 7.2, where S(IV) is the sum contribution from both sulfite and bisulfite ions.
Scheme 7.2:
RCHsNHR'CHsSOs" RCH2NR'CH2S03" +
+ iodine(an) RCH2NR'=CH2 + S ( I V ) • products
Equation 7.1 shows the derived rate expression for the analogous reaction involving the
aniline adduct (Chapter 5, Section 5.2.4.2) where [I2]t is the sum of [I2] plus [I3'].
- — = >ti[C6H5NHCH2S03"] ( -1) dt
Anilines have lower p K a values than benzylamines therefore the p K a values do not need
to be incorporated: aniline adducts are expected to be present in the reactive
unprotonated form at the pH values studied. The p K a values of the benzylamines used
are in the range 9.33 to 9.59 therefore in the pH range studied the adduct will probably
be present in the protonated form, RCH2]SrHR'CH2S03". Decomposition of the adduct is
likely to occur predominantly through the unprotonated adduct as it involves expulsion
of sulfite to give a cationic iminium ion. Therefore the acid dissociation constant of the
adduct must be included in the rate expression.
296
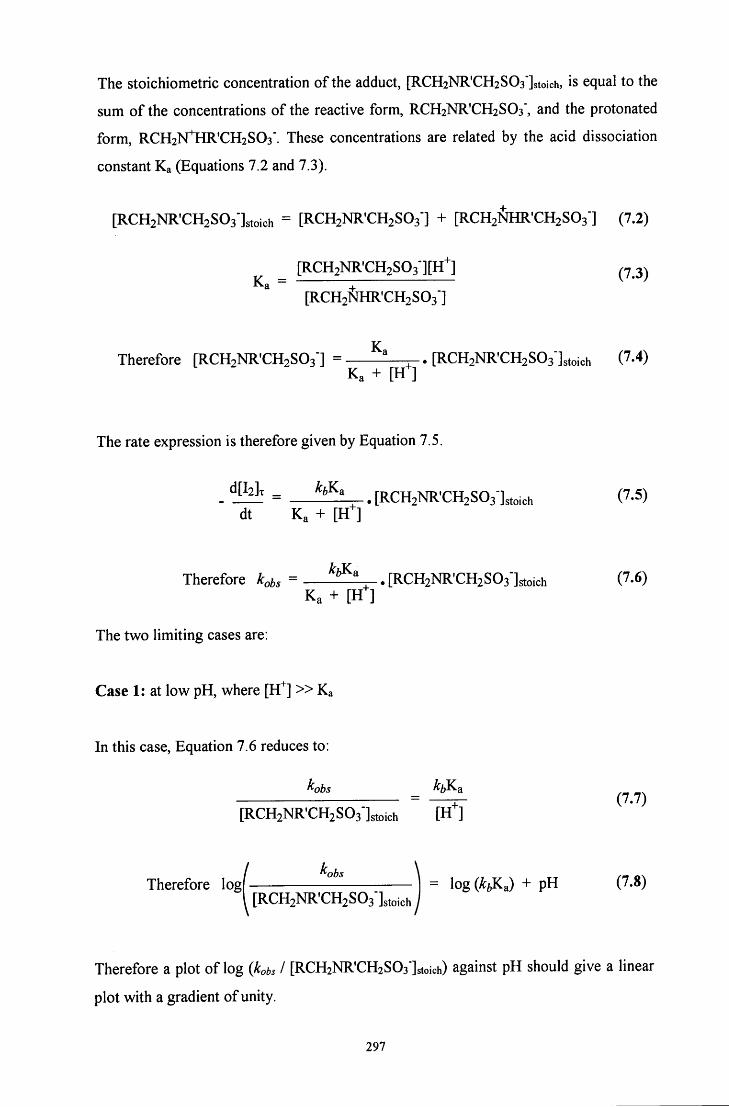
The stoichiometric concentration of the adduct, [RCH2NR'CH2S03']stoich, is equal to the
sum of the concentrations of the reactive form, RCH2NR'CH2S03", and the protonated
form, RCH2lsrHR'CH2S03". These concentrations are related by the acid dissociation
constant K a (Equations 7 .2 and 7 .3) .
[RCHsNR'CHsSOs'lstoich = [RCHsNR'CHsSOs'J + [RCHsNHR'CHsSOs] (7.2)
^ ^ [RCH2NR'CH2S03-][H^] ^ 3)
[RCHsfolR'CHsSOs"]
Therefore [RCHsNR'CHsSOs"] = —. [RCHsNR'CHsSOglstoich (7-4) Ka + [H"]
The rate expression is therefore given by Equation 7.5.
. = . [RCHjNR'CHjSOj-l^oieh (7-5) dt Ka + [it]
Therefore = ^ ^ i ^ , [RCH2NR'CH2S03"]s„ioh (7.6)
The two limiting cases are:
Case 1: at low pH, where [H^] » K a
In this case, Equation 7.6 reduces to:
^obs ^feKg (7.7)
[RCH2NR'CH2S03-]stoich [ H ^
Therefore logf — 1 = log(A:f^a) + pH (7.8) [RCH2NR'CH2S03-]stoich
Therefore a plot of log (kobs I [RCH2NR'CH2S03"]stoich) against pH should give a linear
plot with a gradient of unity.
297
Case 2: at high pH, where Ka » [H^]
Here Equation 7.6 reduces to:
[RCH2NR'CH2S03]stoich
Therefore at high pH the rate constant will show no dependence on pH.
Equation 7.5 shows that the reaction should be zero order with respect to total aqueous
iodine solution concentration. Zero order plots were obtained and kots I mol dm" s'' was
determined by dividing the gradient of the plot by 13400 mol" dm^ cm"\ the extinction
coefficient of iodine at 350 nm.
7.2.2.1 Benzylamine adduct: C6H5CH2NHCH2SO3
7.2.2.1.1 Rate constant for decomposition to the iminium ion
A stock solution of 0.073 M benzylamine and 0.070 M CH2(OH)(S03Na) in water was
left to react for 5 minutes to ensure formation of the adduct C6H5CH2NHCH2SO3".
The reaction of 2.5 x 10" to 0.010 M C6H5CH2NHCH2SO3" with 4.0 x 10' M aqueous
iodine solution at pH 5.1, 25 °C was followed using stopped flow spectrophotometry.
Zero order kinetics were observed (Figure 7.10). The kots I mol dm" s' values are
shown in Table 7.3.
298
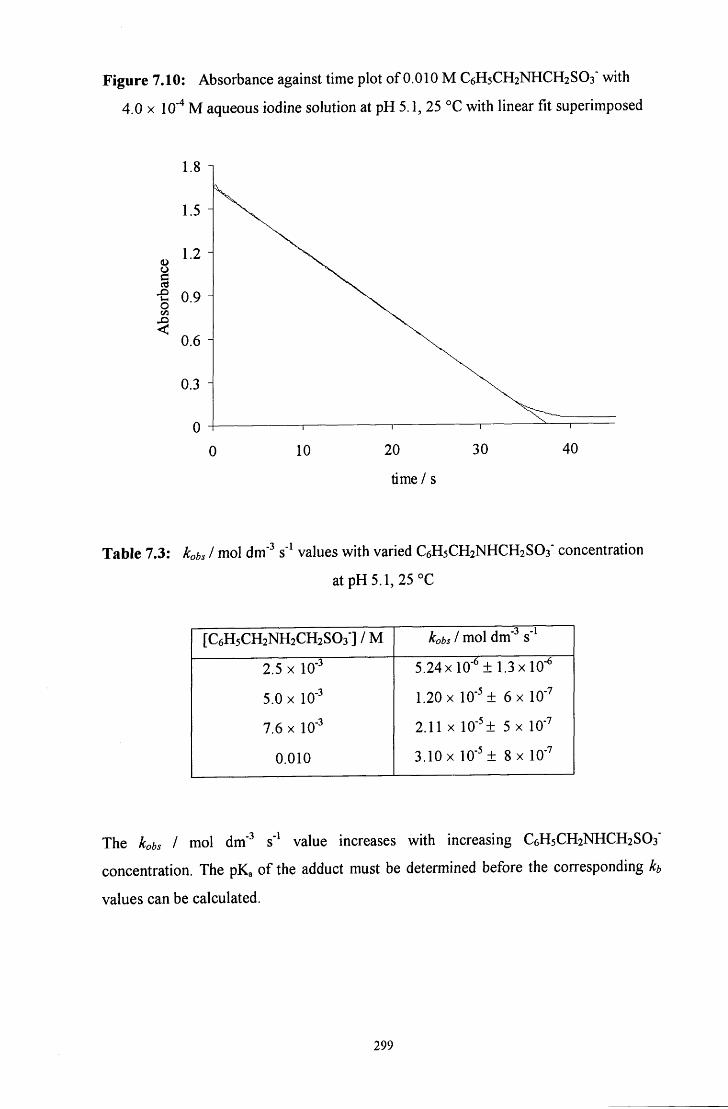
Figure 7.10: Absorbance against time plot of 0.010 M C6H5CH2NHCH2SO3" with
4.0 X 10'" M aqueous iodine solution at pH 5.1, 25 °C with linear fit superimposed
-€ 0.9
10 20
time / s
30 40
Table 7.3: hbs I mol dm' s values with varied C6H5CH2NHCH2SO3" concentration
at pH 5.1, 25 °C
[C6H5CH2NH2CH2S03'] / M kobs 1 mol dm" s'
2.5 X 10- 5.24x10-^ ±1.3x10-^
5.0 X 10" 1.20 X 10' ± 6x 10'
7.6 X 10' 2.11 X 10" ± 5 X 10"
0.010 3.10 X 10' ± 8x lO""
The kobs I mol dm' s' value increases with increasing C6H5CH2NHCH2SO3'
concentration. The pKa of the adduct must be determined before the corresponding h
values can be calculated.
299
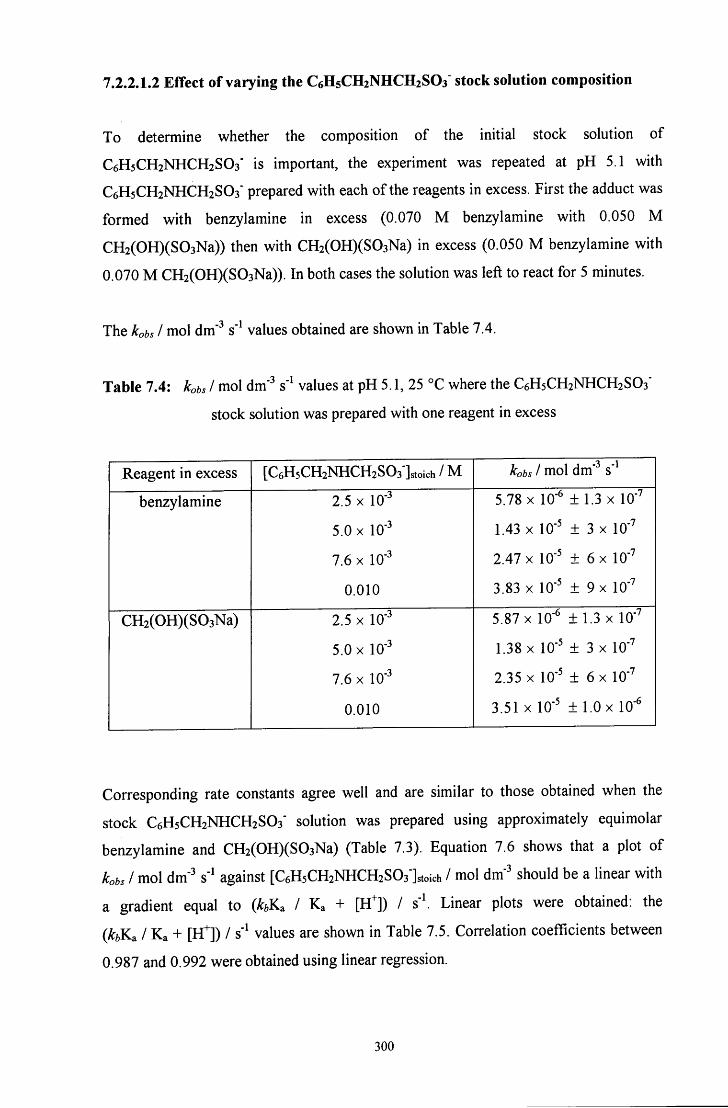
7.2.2.1.2 Effect of varying the C6H5CH2NHCH2SO3" stock solution composition
To determine whether the composition of the initial stock solution of
C6H5CH2NHCH2SO3" is important, the experiment was repeated at pH 5.1 with
C6H5CH2NHCH2SO3" prepared with each of the reagents in excess. First the adduct was
formed with benzylamine in excess (0.070 M benzylamine with 0.050 M
CH2(OH)(S03Na)) then with CH2(OH)(S03Na) in excess (0.050 M benzylamine with
0.070 M CH2(OH)(S03Na)). In both cases the solution was left to react for 5 minutes.
The kobs I mol dm' s" values obtained are shown in Table 7.4.
Table 7.4: hbs I mol dm' s" values at pH 5.1, 25 °C where the C6H5CH2NHCH2SO3'
stock solution was prepared with one reagent in excess
Reagent in excess [C6H5CH2NHCH2S03"]stoich / M 3 1
kobs 1 mol dm' s"
benzylamine 2.5 X 10' 5.78 X 10" ± 1.3 X 10"'
5.0 X 10' 1.43 X 10" ± 3 X 10'
7.6 X 10- 2.47 X 10' ± 6 X 10"''
0.010 3.83 X 10' ± 9 X 10"''
CH2(OH)(S03Na) 2.5 X 10- 5.87 X 10' ±1.3 X 10'''
5.0 X 10- 1.38 X 10' ± 3 X 10"'
7.6 X 10- 2.35 X 10' ± 6 X 10'''
0.010 3.51 X 10- ± 1.0 X 10-
Corresponding rate constants agree well and are similar to those obtained when the
stock C6H5CH2NHCH2SO3' solution was prepared using approximately equimolar
benzylamine and CH2(OH)(S03Na) (Table 7.3). Equation 7.6 shows that a plot of
kobs I mol dm" s" against [C6H5CH2NHCH2S03"]stoich / mol dm" should be a linear with
a gradient equal to (^^Ka / K a + [H^]) / s"\ Linear plots were obtained: the
{kb¥^3, / K a + [H^]) / s" values are shown in Table 7.5. Correlation coefficients between
0.987 and 0.992 were obtained using linear regression.
300
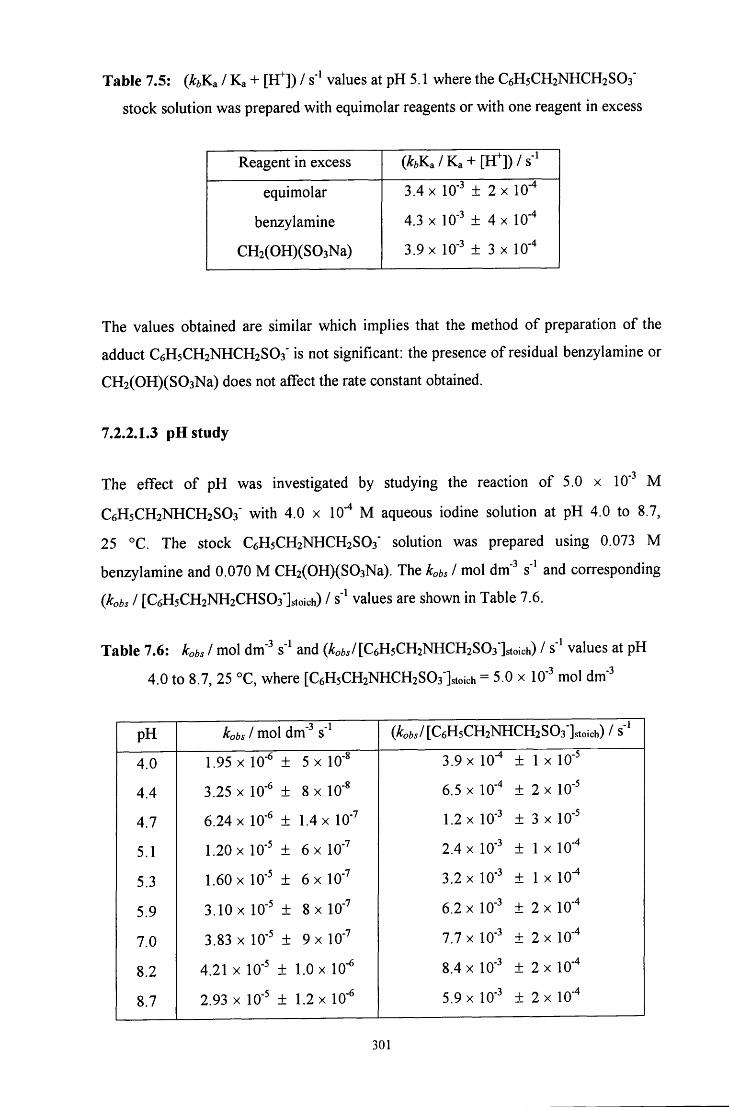
Table 7.5: (hK^ I K a + [H^]) / s" values at pH 5.1 where the C6H5CH2NHCH2SO3"
stock solution was prepared with equimolar reagents or with one reagent in excess
Reagent in excess ( ^ , K a / K a + [ H ^ ] ) / s - ^
equimolar
benzylamine
CH2(OH)(S03Na)
3.4 X 10' ± 2x 10"
4.3 X 10" ± 4 X 10"
3.9 X 10" ± 3 X 10'
The values obtained are similar which implies that the method of preparation of the
adduct C6H5CH2NHCH2SO3' is not significant: the presence of residual benzylamine or
CH2(OH)(S03Na) does not affect the rate constant obtained.
7.2.2.1.3 pH study
The effect of pH was investigated by studying the reaction of 5.0 x 10"" M
C 6 H 5 C H 2 N H C H 2 S O 3 ' with 4.0 X 10' M aqueous iodine solution at pH 4.0 to 8.7,
25 °C. The stock C6H5CH2NHCH2SO3" solution was prepared using 0.073 M
benzylamine and 0.070 M CH2(OH)(S03Na). The kobs I mol dm' s' and corresponding
(kobs I [C6H5CH2NH2CHS03']stoich) / s' values are shown in Table 7.6.
Table 7.6: hbs I mol dm" s' and (^o6./[C6H5CH2NHCH2S03']stoich) / s" values at pH
4.0 to 8.7, 25 °C, where [C6H5CH2NHCH2S03"]stoich = 5.0 x 10' mol dm ^
pH kobs 1 mol dm" s" (itoi./[C6H5CH2NHCH2S03"]stoich) / s-
4.0 1.95 X 10- ± 5 X 10- 3.9 X 10- ± 1 X 10"
4.4 3.25 X 10- ± 8 X 10' 6.5 X 10- ± 2 X 10'
4.7 6.24 X 10- ± 1.4 X 10' 1.2 X 10- ± 3 X 10'
5.1 1.20 X 10' ± 6 X lO"* 2.4 X 10" ± 1 X 10"*
5.3 1.60 X 10" ± 6 X 10" 3.2 X 10" ± 1 X 10-
5.9 3.10 X 10- ± 8 X 10" 6.2 X 10' ± 2 X 10"
7.0 3.83 X 10' ± 9 X 10" 7.7 X 10- ± 2 X 10'
8.2 4.21 X 10' ± 1.0 X 10- 8.4 X 10- ± 2 X 10"
8.7 2.93 X 10" ± 1.2x 10' 5.9 X 10" ± 2 X 10"
301
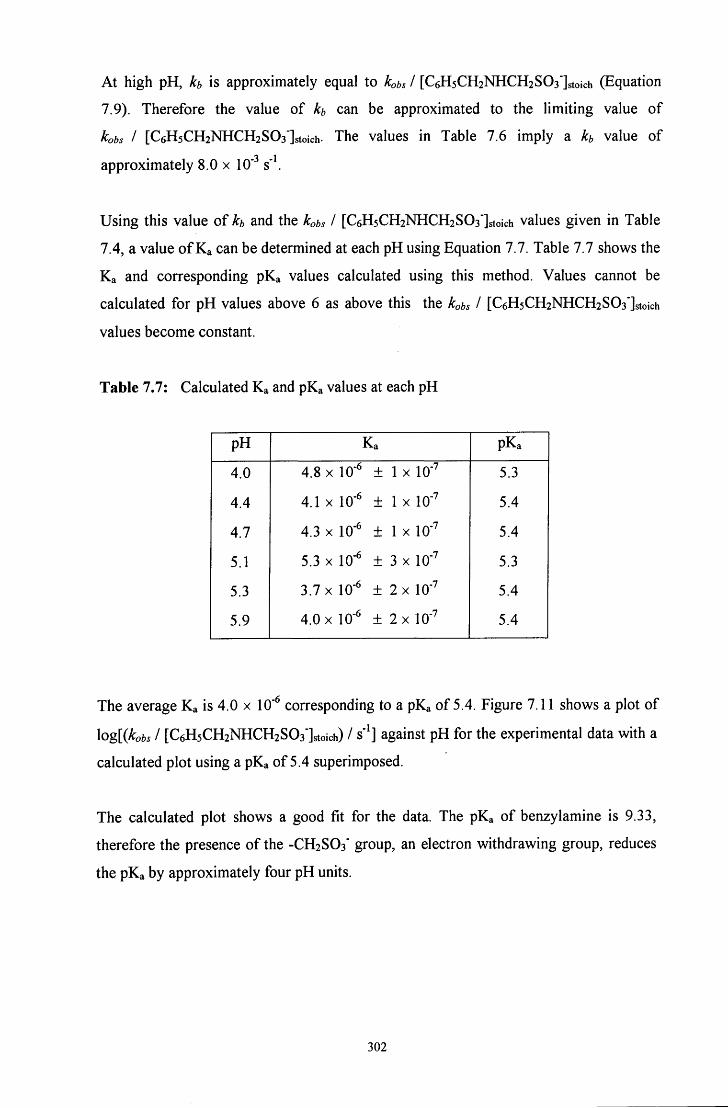
At high pH, kb is approximately equal to hbs I [C6H5CH2NHCH2S03']stoich (Equation
7 .9 ) . Therefore the value of h can be approximated to the limiting value of
kobs I [C6H5CH2NHCH2S03']stoich. The values in Table 7.6 imply a h value of 3 1
approximately 8.0 x 10" s' .
Using this value of h and the kobs I [C6H5CH2NHCH2S03']stoich values given in Table
7.4, a value of K a can be determined at each pH using Equation 7.7. Table 7.7 shows the
K a and corresponding p K a values calculated using this method. Values cannot be
calculated for pH values above 6 as above this the kobs I [C6H5CH2NHCH2S03"]stoich
values become constant.
Table 7 .7: Calculated K a and p K a values at each pH
p H K a p K a
4 .0 4.8 X 10"^ ± 1 X lO"'' 5.3
4 .4 4.1 X 10"^ ± 1 X 10"^ 5.4
4 .7 4.3 X 10"^ ± 1 X 10"^ 5.4
5.1 5.3 X 10"^ ± 3 X 10"' 5.3
5.3 3 .7 X 10"^ ± 2 X 10"^ 5.4
5.9 4.0 X 10"^ ± 2 X 10"^ 5.4
The average K a is 4 .0 x 10'^ corresponding to a p K a of 5.4. Figure 7.11 shows a plot of
\og[{kobs I [C6H5CH2NHCH2S03"]stoich) / s" ] against pH for the experimental data with a
calculated plot using a p K a of 5.4 superimposed.
The calculated plot shows a good fit for the data. The p K a of benzylamine is 9 .33,
therefore the presence of the -CH2SO3" group, an electron withdrawing group, reduces
the p K a by approximately four pH units.
302
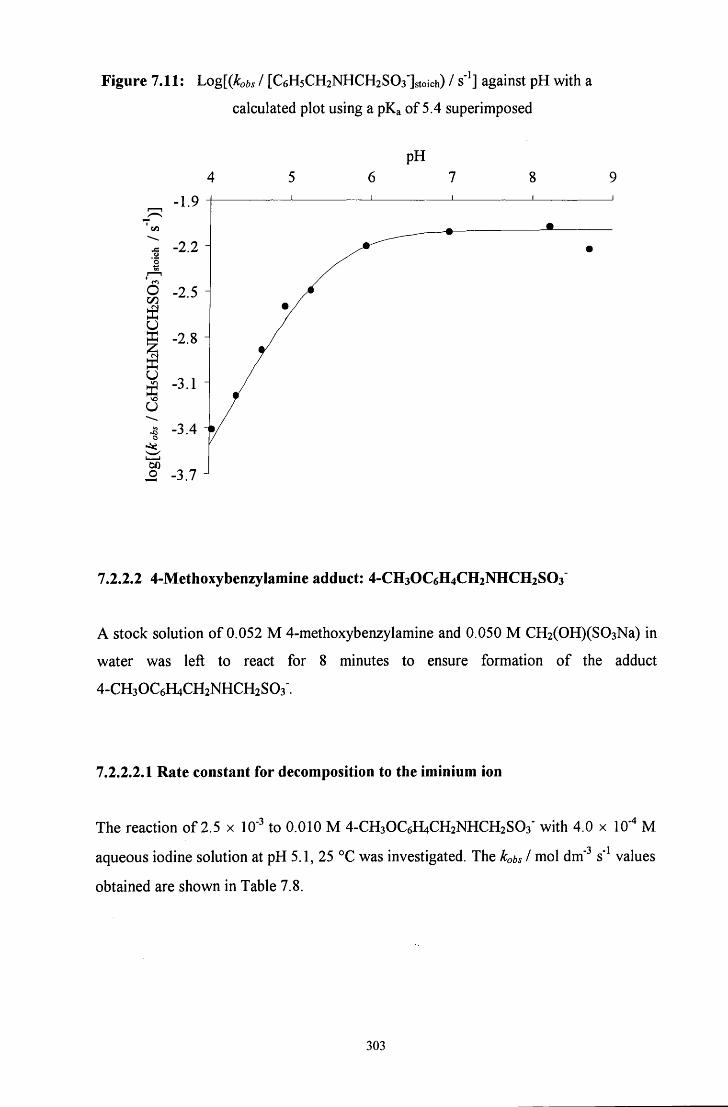
Figure 7 . 11 : Log[{kobs I [C6H5CH2NHCH2S03"]stoich) / s" ] against pH with a
calculated plot using a p K a of 5.4 superimposed
7 .2 .2 .2 4-Methoxybenzylamine adduct: 4 - C H 3 O C 6 H 4 C H 2 N H C H 2 S O 3
A stock solution of 0.052 M 4-methoxybenzylamine and 0.050 M CH2(OH)(S03Na) in
water was left to react for 8 minutes to ensure formation of the adduct
4-CH30C6H4CH2NHCH2S03'.
7.2 .2 .2 .1 Rate constant for decomposition to the iminium ion
The reaction of 2.5 x 10"^ to 0 .010 M 4 - C H 3 O C 6 H 4 C H 2 N H C H 2 S O 3 " with 4 .0 x 10'^ M
aqueous iodine solution at pH 5.1, 25 °C was investigated. The kobs I mol dm" s' values
obtained are shown in Table 7.8.
303
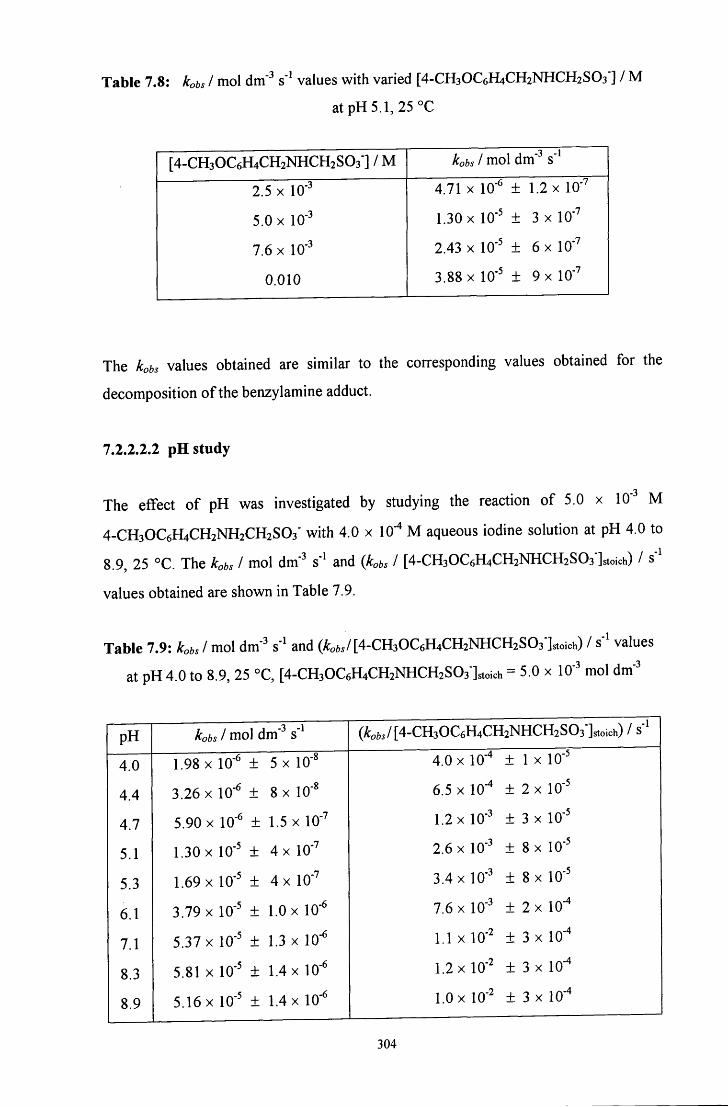
Table 7.8: Kbs I mol dm" s'' values with varied [4-CH30C6H4CH2NHCH2S03"] / M
atpH5.1, 25 °C
[ 4 - C H 3 O C 6 H 4 C H 2 N H C H 2 S O 3 ] / M 3 1
kobs 1 mol dm" s'
2.5 X 10"' 4.71 X 10' ± 1.2 X 10-
5.0 X 10" 1.30 X 10" ± 3 X lO'"
7.6 X 10' 2.43 X 10' ± 6 X 10""
0.010 3.88 X 10' ± 9 X 10"*
The kobs values obtained are similar to the corresponding values obtained for the
decomposition of the benzylamine adduct.
7.2.2.2.2 pH study
The effect of pH was investigated by studying the reaction of 5.0 x 10' M
4-CH30C6H4CH2NH2CH2S03' with 4.0 x lO'"* M aqueous iodine solution at pH 4.0 to
8.9, 25 °C. The hbs I mol dm' s' and {Kbs I [4-CH30C6H4CH2NHCH2S03 ]stoich) / s'
values obtained are shown in Table 7.9.
Table 7.9: Kbs I mol dm" and (^o!,./[4-CH30C6H4CH2NHCH2S03"]stoich) / s" values
at pH 4.0 to 8.9, 25 °C, [4-CH30C6H4CH2NHCH2S03"]stoich = 5.0 x 10"' mol dm"'
pH 3 1
kobs 1 mol dm' s" (^ofe./[4-CH30C6H4CH2NHCH2S03']stoich) / s'
4.0 1.98 X 10' ± 5 X 10- 4.0 X 10" ± 1 X 10"'
4.4 3.26 X 10" ± 8 X 10" 6.5 X 10- ± 2x 10"
4.7 5.90 X 10" ± 1.5 X 10- 1.2 X 10" ± 3 X 10'
5.1 1.30 X 10" + 4 X 10" 2.6 X 10" ± 8 X 10'
5.3 1.69 X 10" ± 4 X 10' 3.4 X 10' ± 8 X 10'
6.1 3.79 X 10' ± 1.0 X 10- 7.6 X 10' ± 2 X 10"
7.1 5.37 X 10- ± 1.3 X 10- 1.1 X 10' ± 3 X 10-
8.3 5.81 X 10- ± 1.4 X 10- 1.2 X 10" ± 3 X lO"*
8.9 5.16 X 10- ± 1.4 X 10' 1.0 X 10- ± 3 X 10-
304
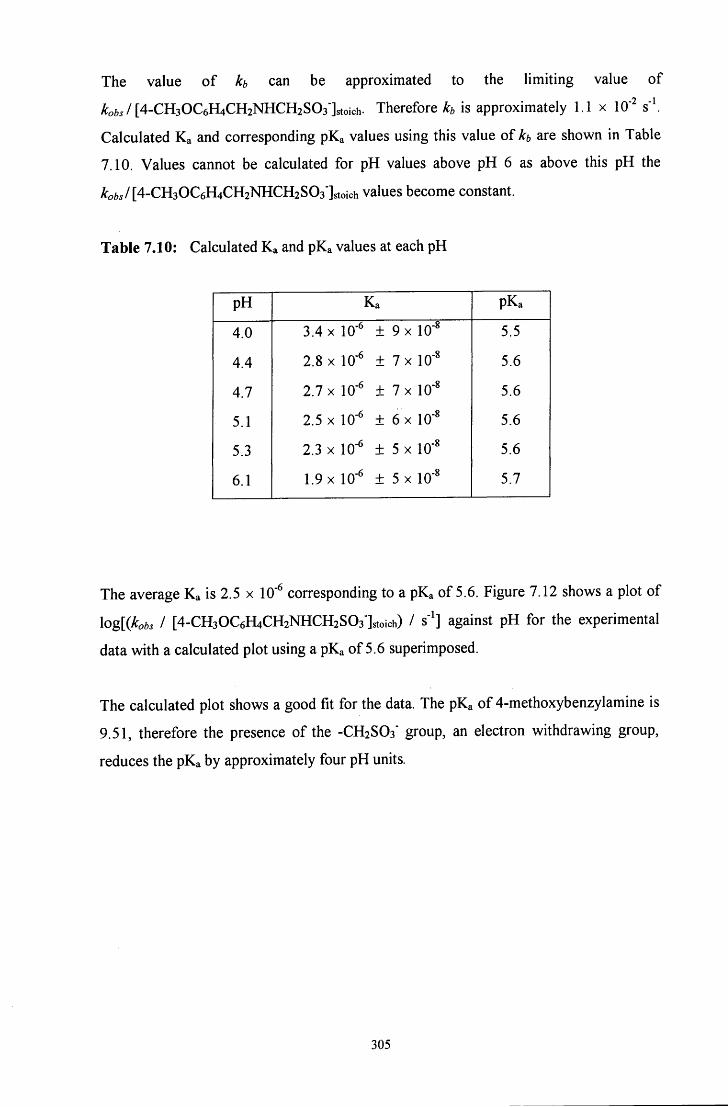
The value of kb can be approximated to the limiting value of
^ofc./[4-CH30C6H4CH2NHCH2S03"]stoich. Therefore h is approximately 1.1 x 10"S"\
Calculated K a and corresponding p K a values using this value of kb are shown in Table
7.10. Values cannot be calculated for pH values above pH 6 as above this pH the
^oftj/[4-CH30C6H4CH2NHCH2S03"]stoich values become constant.
Table 7.10: Calculated K a and p K a values at each pH
p H K a p K a
4.0 3.4 X 10" + 9 X 10" 5.5
4.4 2.8 X 10" + 7 X 10" 5.6
4.7 2.7 X 10" ± 7 X 10" 5.6
5.1 2.5 X 10" ± 6 X 10" 5.6
5.3 2.3 X 10" ± 5 X 10" 5.6
6.1 1.9 X 10" ± 5 X 10" 5.7
The average K a is 2.5 x 10" corresponding to a p K a of 5.6. Figure 7.12 shows a plot of
\og[{kobs I [4-CH30C6H4CH2NHCH2S03"]stoich) / s" ] against pH for the experimental
data with a calculated plot using a p K a of 5.6 superimposed.
The calculated plot shows a good fit for the data. The p K a of 4-methoxybenzylamine is
9.51, therefore the presence of the -CH2SO3" group, an electron withdrawing group,
reduces the p K a by approximately four pH units.
305
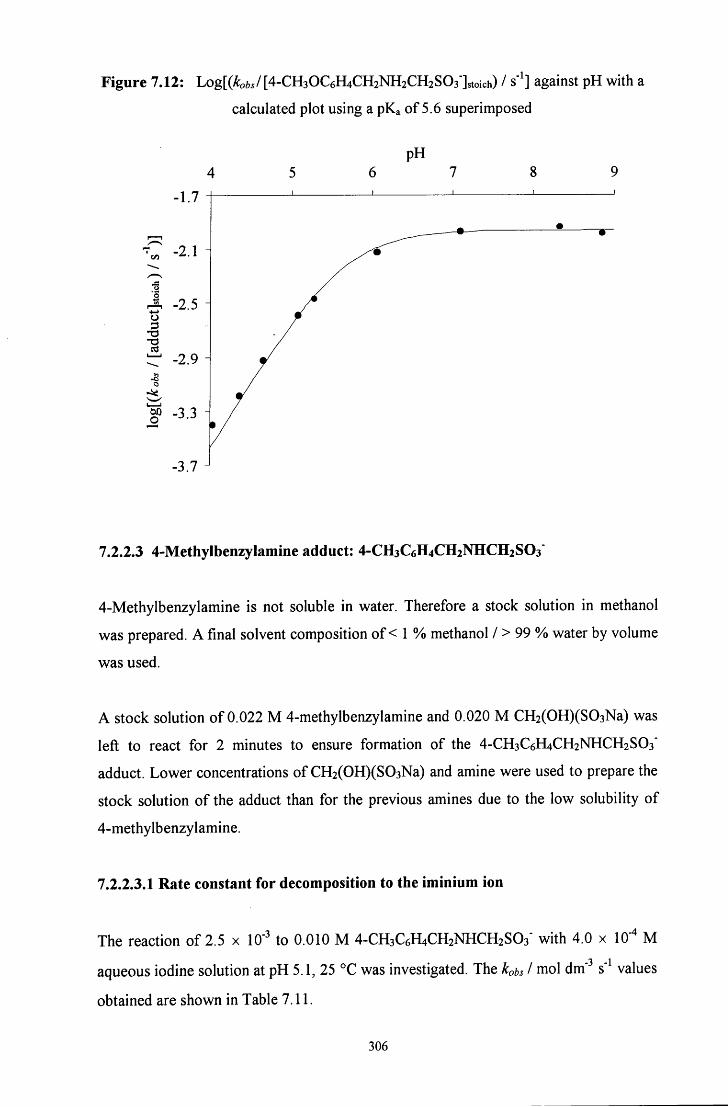
Figure 7.12: Log[(^o6./[4-CH30C6H4CH2NH2CH2S03"]stoich) / s" ] against pH with a
calculated plot using a pKa of 5.6 superimposed
-1.7
-2.1 H
-2.5 o
-2.9 H
^ - 3 3
•3.7
7.2.2.3 4-Methylbenzylamine adduct: 4-CH3C6H4CH2NHCH2SO3
4-Methylbenzylamine is not soluble in water. Therefore a stock solution in methanol
was prepared. A final solvent composition of < 1 % methanol / > 99 % water by volume
was used.
A stock solution of 0.022 M 4-methylbenzylamine and 0.020 M CH2(OH)(S03Na) was
left to react for 2 minutes to ensure formation of the 4 - C H 3 C 6 H 4 C H 2 N H C H 2 S O 3 "
adduct. Lower concentrations of CH2(OH)(S03Na) and amine were used to prepare the
stock solution of the adduct than for the previous amines due to the low solubility of
4-methylbenzylamine.
7.2.2.3.1 Rate constant for decomposition to the iminium ion
The reaction of 2.5 x 10" to 0.010 M 4 - C H 3 C 6 H 4 C H 2 N H C H 2 S O 3 " with 4.0 x 10" M
aqueous iodine solution at pH 5.1, 25 °C was investigated. The kobs I mol dm" s' values
obtained are shown in Table 7.11.
306
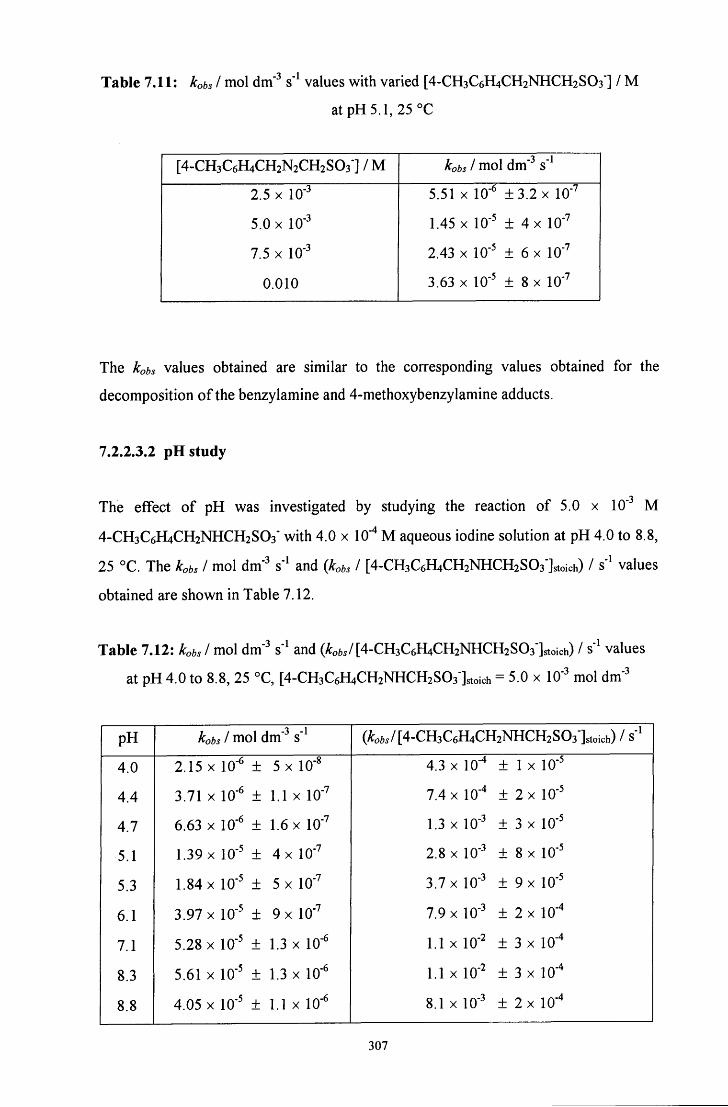
Table 7.11: kobs I mol dm' s" values with varied [4-CH3C6H4CH2NHCH2SO3'] / M
atpH5.1, 25 °C
[4-CH3C6H4CH2N2CH2SO3 ] / M 3 1 kobs 1 mol dm" s"
2.5 X 10- 5.51 X 10" ±3.2x 10"
5.0 X 10' 1.45 X 10" ± 4x 10"
7.5 X 10' 2.43 X 10" ± 6 X 10""
0.010 3.63 X 10"' ± 8 X lO'"
The kobs values obtained are similar to the corresponding values obtained for the
decomposition of the benzylamine and 4-methoxybenzylamine adducts.
7.2.2.3.2 pH study
The effect of pH was investigated by studying the reaction of 5.0 x 10"' M
4-CH3C6H4CH2NHCH2SO3' with 4.0 X 10" M aqueous iodine solution at pH 4.0 to 8.8,
25 °C. The kobs I mol dm" s" and {kobs I [4-CH3C6H4CH2NHCH2S03"]stoich) / s' values
obtained are shown in Table 7.12.
Table 7.12: kobs I mol dm" s" and (^o6s/[4-CH3C6H4CH2NHCH2S03"]stoich) / ^ values
at pH 4.0 to 8.8, 25 °C, [4-CH3C6H4CH2NHCH2S03"]stoich = 5.0 x 10" mol dm"
pH 3 1 kobs 1 mol dm" s"
(^,,,/[4-CH3C6H4CH2NHCH2S03"]stoich) / s"'
4.0 2.15 X 10" ± 5 X 10" 4.3 X 10" ± 1 X 10"
4.4 3.71 X 10" ± 1.1 X 10" 7.4 X 10" ± 2 X 10"
4.7 6.63 X 10" + 1.6 X 10" 1.3 X 10" ± 3 X 10"
5.1 1.39 X 10"' + 4 X 10" 2.8 X 10" ± 8 X 10"
5.3 1.84 X 10" ± 5 X 10" 3.7 X 10" ± 9 X 10"
6.1 3.97 X 10" ± 9 X 10'' 7.9 X 10" ± 2 X 10"
7.1 5.28 X 10" ± 1.3 X 10" 1.1 X 10" ± 3x 10""
8.3 5.61 X 10" ± 1.3 X 10" 1.1 X 10" ± 3 X 10"
8.8 4.05 X 10" ± 1.1 X 10" 8.1 X 10" ± 2 X 10"
307

The value of h can be approximated to the Hmiting value of
>o6 / [4-CH3C6H4CH2NHCH2S03"]stoich. Therefore h is approximately 1.1 x 10" s\
Calculated Ka and corresponding pKa values using this value of h are shown in Table
7.13. Values cannot be calculated for pH values above pH 6 as above this pH the
^o65/[4-CH3C6H4CH2NHCH2S03"]stoich values become constant.
Table 7.13: Calculated Ka and pKa values at each pH
pH Ka pKa
4.0 3.6 X 10" ± 8 X 10- 5.4
4.4 3.3 X 10" ± 9 X 10' 5.5
4.7 3.0 X 10" ± 7 X 10" 5.5
5.1 2.8 X 10" ± 8 X 10" 5.6
5.3 2.5 X 10' ± 7 X 10" 5.6
6.1 2.2 X 10" ± 5 X 10- 5.7
The average Ka is 3.2 x 10" corresponding to a pKa of 5.5. Figure 7.13 shows a plot of
\og[(kobs I [4-CH3C6H4CH2NHCH2S03']stoich) / s" ] against pH for the experimental data
with a calculated plot using a pKa of 5.5 superimposed.
The calculated plot shows a good fit for the data. The pKa of 4-methylbenzylamine is
9.54, therefore the presence of the -CH2SO3' group, an electron withdrawing group,
reduces the pKa by approximately four pH units.
308
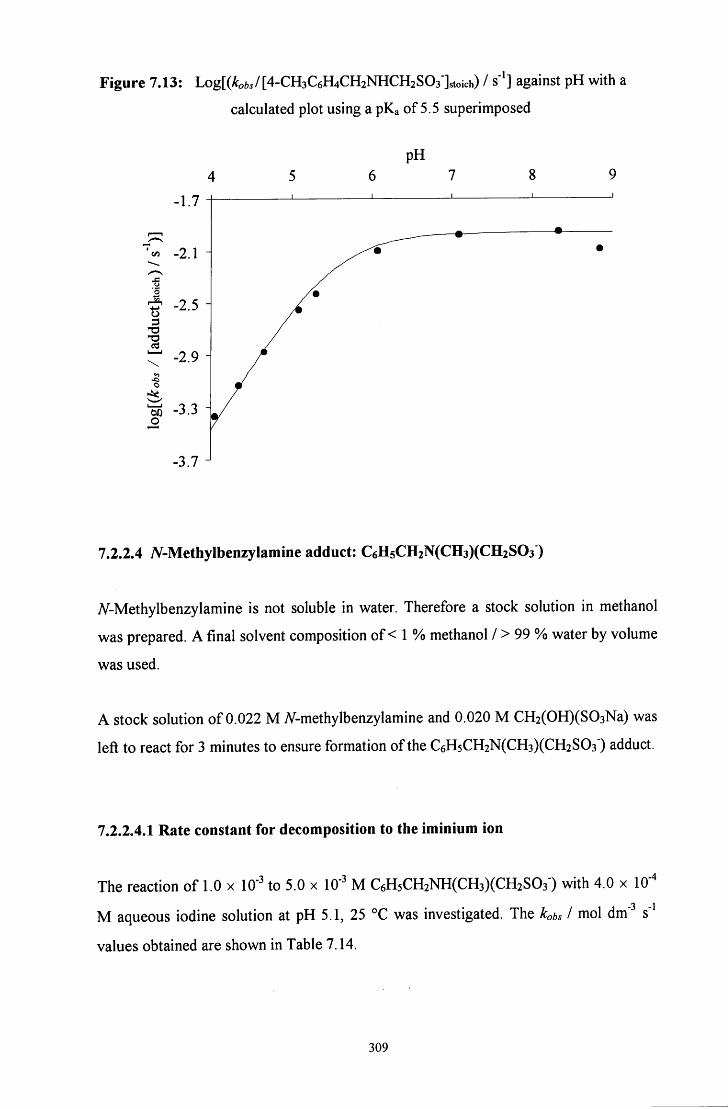
Figure 7.13: Log[(A:ofc./ [4-CH3C6H4CH2NHCH2S03"]stoich) / s" ] against pH with a
calculated plot using a pKa of 5.5 superimposed
pH
-3.7
7.2.2.4 A^-Methylbenzylamine adduct: CeHgCHzNCCHsXCHzSOs )
A'-Methylbenzylamine is not soluble in water. Therefore a stock solution in methanol
was prepared. A final solvent composition of < 1 % methanol / > 99 % water by volume
was used.
A stock solution of 0.022 M A^-methylbenzylamine and 0.020 M CH2(OH)(S03Na) was
left to react for 3 minutes to ensure formation of the C6H5CH2N(CH3)(CH2S03') adduct.
7.2.2.4.1 Rate constant for decomposition to the iminium ion
4
3 _-l The reaction of 1.0 x 10' to 5.0 x 10" M C6H5CH2NH(CH3)(CH2S03") with 4.0 x 10
M aqueous iodine solution at pH 5.1, 25 °C was investigated. The hbs I mol dm" s
values obtained are shown in Table 7.14.
309
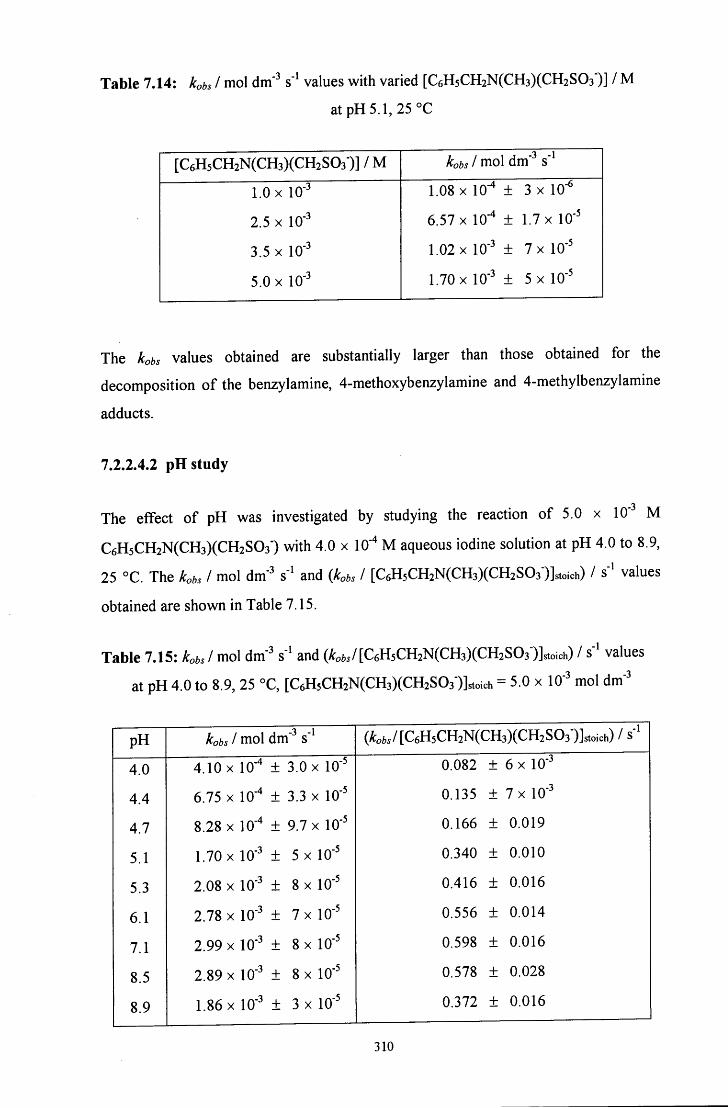
Table 7.14: kobs I mol dm" s" values with varied [C6H5CH2N(CH3)(CH2S03")] / M
atpH5.1, 25 °C
[C6H5CH2N(CH3)(CH2S03 ) ] / M 3 1
kobs 1 mol dm" s'
1.0 X 10' 1.08 X 10' ± 3 X 10-"
2.5 X 10" 6.57 X 10" ± 1.7 X 10"
3.5 X 10" 1.02 X 10' ± 7x 10'
5.0 X 10" 1.70 X 10" ± 5 X 10"
The kobs values obtained are substantially larger than those obtained for the
decomposition of the benzylamine, 4-methoxybenzylamine and 4-methylbenzylamine
adducts.
7.2.2.4.2 pH study
The effect of pH was investigated by studying the reaction of 5.0 x 10" M
C6H5CH2N(CH3)(CH2S03") with 4.0 x 10' M aqueous iodine solution at pH 4.0 to 8.9,
25 °C. The hbs I mol dm" s" and {kobs I [C6H5CH2N(CH3)(CH2S03')]stoich) / s" values
obtained are shown in Table 7.15.
Table 7.15: Kbs I mol dm"' s" and (A:.,./[C6H5CH2N(CH3)(CH2S03-)]^oich) / values
at pH 4.0 to 8.9, 25 °C, [C6H5CH2N(CH3)(CH2S03-)]stoich = 5.0 x 10"' mol dm -3
pH kobs 1 mol dm" s' (^oft./[C6H5CH2N(CH3)(CH2S03")]stoich) / s-
4.0 4.10 X 10" ± 3.0 X 10" 0.082 ± 6 X 10"
4.4 6.75 X 10- ± 3.3 X 10' 0.135 ± 7 X 10"
4.7 8.28 X 10"" ± 9.7 X 10' 0.166 ± 0.019
5.1 1.70 X 10' ± 5 X 10" 0.340 ± 0.010
5.3 2.08 X 10" ± 8 X 10' 0.416 + 0.016
6.1 2.78 X 10' ± 7 X 10- 0.556 ± 0.014
7.1 2.99 X 10' ± 8 X 10' 0.598 ± 0.016
8.5 2.89 X 10" ± 8 X 10" 0.578 ± 0.028
8.9 1.86 X 10" ± 3 X 10" 0.372 ± 0.016
310

The value of kb can be approximated to the limiting value of
kobs I [C6H5CH2N(CH3)(CH2S03')]stoich. Therefore h is approximately 0.58 s'\
Calculated Ka and corresponding pKa values using this value of h are shown in Table
7.16. Values cannot be calculated for pH values above pH 6 as above this pH the
^ofe5/[C6H5CH2N(CH3)(CH2S03')]stoich values become constant.
Table 7.16: Calculated Ka and pKa values at each pH
pH Ka pKa
4.0 1.5 X 10- ± 1 X 10" 4.8
4.4 1.4 X 10" ± 7x lO'" 4.9
4.7 9.1 X 10' ± 1.1 X 10" 5.0
5.1 1.1 X 10" ± 3 X 10- 5.0
5.3 1.2 X 10' ± 5x 10"'' 4.9
6.1 1.7 X 10" ± 4x 10"' 4.8
The average Ka is 1.2 x 10' corresponding to a pKa of 4.9. Figure 7.14 shows a plot of
\og[{kobs I [C6H5CH2N(CH3)(CH2S03')]stoich) / s' ] against pH for the experimental data
with a calculated plot using a pKa of 4.9 superimposed.
The calculated plot shows a good fit for the data. The pKa of 7V-methylbenzylamine is
9.59, therefore the presence of the -CH2SO3' group, an electron withdrawing group,
reduces the pKa by approximately five pH units.
311
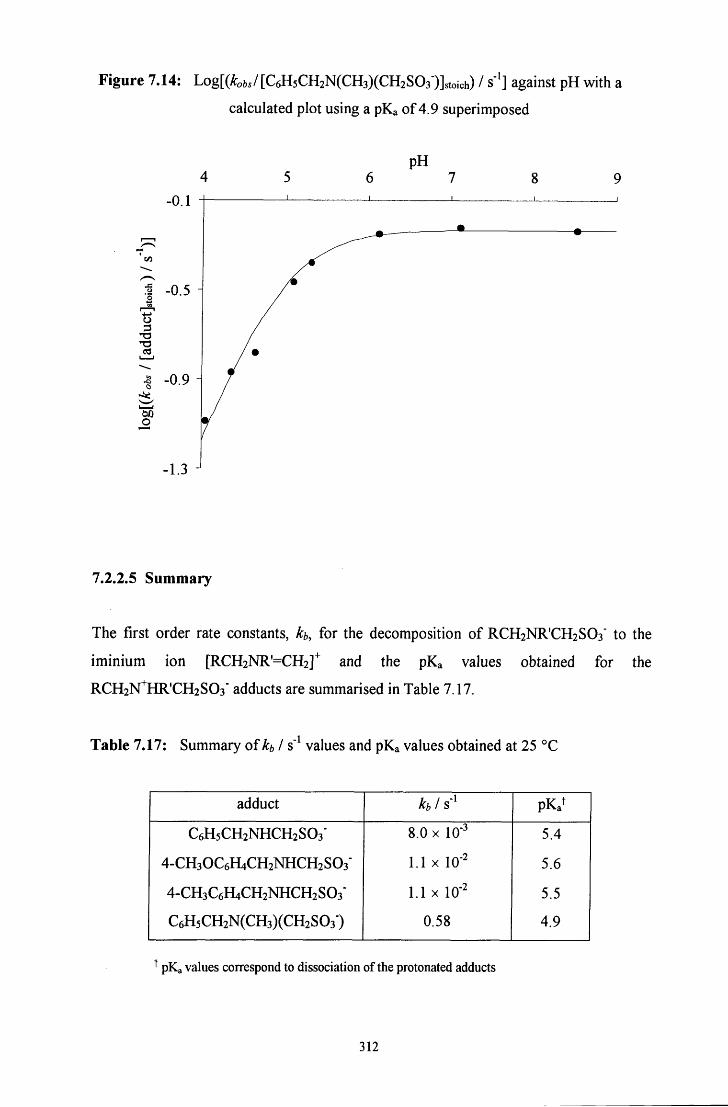
Figure 7.14: Log[(A:oi./ [C6H5CH2N(CH3)(CH2S03')]stoich) / s" ] against pH with a
calculated plot using a pKa of 4.9 superimposed
•3
I — I
o
-1.3
7.2.2.5 Summary
The first order rate constants, kb, for the decomposition of RCH2NR'CH2S03' to the
iminium ion [RCH2NR-CH2]^ and the pKa values obtained for the
RCH2N'HR'CH2S03" adducts are summarised in Table 7.17.
Table 7.17: Summary of kb I s' values and pKa values obtained at 25 °C
adduct h 1 s" pKa
C6H5CH2NHCH2SO3" 8.0 X 10" 5.4
4-CH3OC6H4CH2NHCH2SO3" 1.1 X 10- 5.6
4-CH3C6H4CH2NHCH2S03" 1.1 X 10- 5.5
C6H5CH2N(CH3)(CH2S03) 0.58 4.9
^ pKa values correspond to dissociation of the protonated adducts
312
The kb values for the benzylamine, 4-methoxybenzylamine and 4-methylbenzylamine
adducts are all similar but the value for the iV-methylbenzylamine adduct is around 100
times larger. This can be explained in terms of the electron donating effect of the methyl
group which will stabilise the positive charge on the nitrogen in the developing iminium
ion.
The pKa values of the benzylamine, 4-methoxybenzylamine and 4-methylbenzylamine
adducts are all around 5.4 to 5.6. However the pKa of the A'-methylbenzylamine adduct
is lower at 4.9. This may be attributed to the steric effect of the methyl group which will
prevent solvation to a greater degree and so make the 7V-methylbenzylamine adduct a
weaker base.
The effect of the -CH2SO3" substituent is to increase the acidity of the benzylammonium
ions by approximately 4 pH units. This may be attributed partly to electronic effects and
partly to solvation effects.
It has previously been shown that the effect of the -CH2OH substituent on nitrogen
lowers the pKa of protonated amines by 2 to 3 pH units. This effect was attributed
largely to the reduction in solvation of the protonated species. In the protonated species
RCH2lsrH(CH3)(CH2S03"), the -CH2SO3' group will be expected to increase acidity due
to its electron withdrawing ability. However the main effect is likely to be steric
hindrance to solvation. Hence the energy will be raised and the acidity increases relative
to the benzylammonium ion.
313
7.3 CONCLUSION
The decomposition of RCH2NR'CH2S03' adducts was followed in buffered solution.
The adduct decomposes back to the starting materials. The rate of decomposition
increases with increasing pH. The rate of decomposition was faster for the adduct
formed from A^-methylbenzylamine, C6H5CH2N(CH3)(CH2S03"), than that formed from
benzylamine, C6H5CH2NHCH2SO3".
The addition of aqueous formaldehyde solution increased the rate of decomposition:
sulfite ions released when the adduct decomposes to the iminium ion will react with the
aqueous formaldehyde solution to produce CH2(OH)(S03").
The addition of sulfite ions decreases the rate of decomposition as the equilibrium is
pushed back towards formation of the adduct.
The first order rate constants, h, obtained for the decomposition of RCH2NR'CH2S03'
to the iminium ion [RCH2NR-CH2]^ are equal to 1 x 10' s' for the benzylamine,
4-methoxybenzylamine and 4-methylbenzylamine adducts where R' = H and R = H,
4-OCH3 and 4-CH3 respectively, and 0.58 s" for the 7V-methylbenzylamine adduct
where R = H and R' = -CH3. The h value for the 7V-methylbenzylamine adduct is larger
due to the electron donating effect of the methyl group which will stabilise the positive
charge on the nitrogen in the developing iminium ion.
The pKa values of the benzylamine, 4-methoxybenzylamine and 4-methylbenzylamine
adducts were determined to between 5.4 and 5.6. The pKa of the A^-methylbenzylamine
adduct is lower, 4.9, due to the steric effect of the methyl group which will prevent
solvation to a greater degree.
314
7.4 E X P E R I M E N T A L
7.4.1 Decomposition of RCH2NHCH2SO3" to the starting materials
The decomposition of the adducts formed from benzylamine and 7V-methylbenzylamine
was studied by pre-forming the adducts then obtaining absorbance against wavelength
and absorbance against time plots for diluted samples at a range of pH values.
The adducts were prepared using approximately equimolar concentrations of amine and
CH2(OH)(S03Na) to prevent formation of the 1 ; 2 adduct. High concentrations of
amine and CH2(OH)(S03Na) were used to ensure formation of the 1 : 1 adduct. The
CH2(OH)(S03Na) solid was dissolved in distilled water and placed in a 100 cm^ flask.
The amine was then added and the solution made to the line using distilled water. In
cases where an amine was used which was not soluble in water, a concentrated stock
solution of the amine in methanol was prepared. The final solvent composition in the
reaction mixture was < 1 % methanol / > 99 % water by volume.
The stock adduct solution was left for 3 to 5 minutes to ensure adduct production. I f the
solution was left too long it became cloudy. Therefore the time the solution was left was
determined from considering the time taken for adduct formation in the ^H NMR
spectra (Chapter 6) and the time taken for the solution to become cloudy.
The concentrations of adduct quoted assume that the minor reagent reacts quantitatively
to give the adduct: this assumption is valid considering the ^H NMR experiments
described in Chapter 6 which generally show complete conversion of the minor reagent.
Absorbance against wavelength spectra were obtained for the decomposition of
2 X 10" mol dm" benzylamine adduct at pH 6 and 7 and 1 x 10" mol dm'"
A^-methylbenzylamine adduct at pH 5 to 9 and in the presence of 0.010 to 0.10 M added
aqueous formaldehyde solution at pH 6 and 7. Spectra were recorded using a
Perkin - Elmer Lambda 2 or Lambda 12 uv / vis spectrometer at 25 °C with 1 cm
stoppered quartz cuvettes, taking scans every 1 to 10 minutes for up to 10 hours using a
scan speed of 480 nm min"\
315
Absorbance against time plots were obtained for the decomposition of the adducts at pH
5 to 9 and in the presence of 0.010 to 0.10 M added aqueous formaldehyde solution at
pH 6 and 7 and in the presence of 6.0 x 10" to 2.0 x 10' M aqueous sulfite solution at
pH 6 and 7.
Sulfite ions absorb in the region studied: spectra of 0.01, 0.05 and 0.10 M aqueous
sodium sulfite solution show high absorbance around 250 nm and to shorter
wavelength. For example the extinction coefficient of sulfite ions at 245 nm was found
to be 50 dm mol' cm" . Therefore the appropriate concentration of sulfite ions was
added to the reference in order to subtract the absorbance due to the presence of sulfite
from the absorbance against time plots.
Where [sulfite]stoich is quoted this refers to the total concentration of aqueous sodium
sulfite added externally to the system and does not include the concentration of sulfite
ions present due to dissociation of the adduct.
The aqueous formaldehyde solutions were prepared by diluting, with distilled water, the
purchased 37 % by weight aqueous formaldehyde solution. These solutions were left to
stand at room temperature for at least 2'/4 hours, more usually 4 - AVi hours, to ensure
depolymerisation.
Spectra were recorded using a Perkin - Elmer Lambda 2 or Lambda 12 uv / vis
spectrometer at 25 °C with 1 cm stoppered quartz cuvettes, taking readings every 5 to
90 seconds for between 5 minutes and 3 hours. First order rate constants were obtained
using the Perkin Elmer Computerised Spectroscopy Software (PECSS) program
installed on the Perkin - Elmer Lambda 2 spectrometer or by plotting ln(Aoo - A)
against time / s using Microsoft Excel and performing linear regression.
For the reaction of the A'^methylbenzylamine adduct with added aqueous formaldehyde
solution the plots were recorded at 25.0 - 25.2 °C using an Applied Photophysics
DX. 17MV BioSequential Stopped - flow ASVD Spectrometer with a 1 cm path length.
Five averages were obtained, each the average of three runs of 50 seconds. The
appropriate adduct solution was placed in one syringe and the aqueous formaldehyde
solution with the appropriate buffer solution in the other. The solutions were made just
316
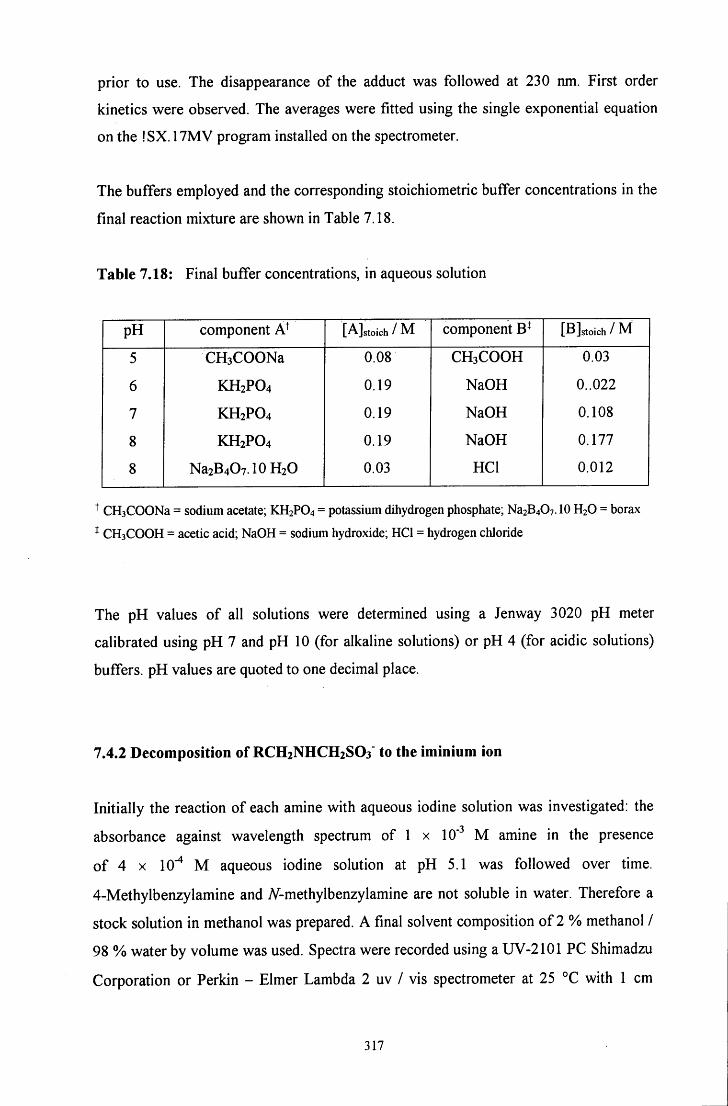
prior to use. The disappearance of the adduct was followed at 230 nm. First order
kinetics were observed. The averages were fitted using the single exponential equation
on the !SX. 17MV program installed on the spectrometer.
The buffers employed and the corresponding stoichiometric buffer concentrations in the
final reaction mixture are shown in Table 7.18.
Table 7.18: Final buffer concentrations, in aqueous solution
pH component A^ [A]stoich / M component [B]stoich / M
5 CH3C00Na 0.08 CH3COOH 0.03
6 KH2PO4 0.19 NaOH 0..022
7 KH2PO4 0.19 NaOH 0.108
8 KH2PO4 0.19 NaOH 0.177
8 Na2B4O7.10H2O 0.03 HCl 0.012
^ CHaCOONa = sodium acetate; KH2PO4 = potassium dihydrogen phosphate; Na2B4O7.10 H2O = borax
* CH3COOH = acetic acid; NaOH = sodium hydroxide; H C l = hydrogen chloride
The pH values of all solutions were determined using a Jenway 3020 pH meter
calibrated using pH 7 and pH 10 (for alkaline solutions) or pH 4 (for acidic solutions)
buffers. pH values are quoted to one decimal place.
7.4.2 Decomposition of RCH2NHCH2SO3" to the iminium ion
Initially the reaction of each amine with aqueous iodine solution was investigated: the
absorbance against wavelength spectrum of 1 x 10' M amine in the presence
of 4 X 10- M aqueous iodine solution at pH 5.1 was followed over time.
4-Methylbenzylamine and 7V-methylbenzylamine are not soluble in water. Therefore a
stock solution in methanol was prepared. A final solvent composition of 2 % methanol /
98 % water by volume was used. Spectra were recorded using a UV-2101 PC Shimadzu
Corporation or Perkin - Elmer Lambda 2 uv / vis spectrometer at 25 °C with 1 cm
317
stoppered quartz cuvettes, taking scans every 10 minutes using a scan speed of
480 nm min"\
Plots of absorbance against time for the reaction of adduct with 4 x 10""* M aqueous
iodine solution were obtained at pH 5.1 using four adduct concentrations from 2.5 x 10'"
to 0.010 M or 1.0 X 10" to 5.0 x 10' M in the case of the 7V-methylbenzylamine adduct,
then at pH 4 to 9 using a constant adduct concentration of 5.0 x 10' M . Plots were
recorded at 24.8 - 25.1 °C using an Applied Photophysics DX.17MV BioSequential
Stopped - flow ASVD Spectrometer with a 1 cm path length. The experiments for each
adduct were carried out in a random order to minimise errors due to environmental
changes.
Ten averages were obtained, each the average of three runs of 0.05 to 200 seconds
depending on the amine, the adduct concentration and the pH used, except where the
timescale was 50 seconds or more when only 3 or 5 averages were obtained. The
appropriate adduct solution was placed in one syringe and the aqueous iodine solution
with the appropriate buffer solution in the other. The solutions were made just prior to
use. The disappearance of the aqueous iodine solution peak at 350 nm was followed.
Zero order kinetics were observed. The averages were fitted using linear regression
using the ISX.17MV program installed on the spectrometer.
The adducts were prepared using approximately equimolar concentrations of amine and
CH2(OH)(S03Na) to prevent formation of the 1 : 2 adduct, except for the one
experiment where the solutions were made with one reagent in excess. The method used
was the same as that described in Section 7.4.1. The stock adduct solution was left for 2
to 8 minutes to ensure adduct production.
K I was added to the stock aqueous iodine solution in great excess to ensure formation of
the absorbing species (Appendix 2). For absorbance against time plots where the initial
absorbance of the aqueous iodine solution was above 2 due to the high extinction
coefficient of iodine, the initial data was not included in the linear fit.
kobs I mol dm"" s' values were determined by dividing the gradient of the linear fit
by the extinction coefficient, s, of aqueous iodine solution at 350 nm, 13400 ±
318
3 1 1
300 dm mol" cm" (Appendix 2). The errors in the kobs values were determined by
applying Equation 7.10.
% error in k^bs = V 1(% error in e)^ + (% error in gradient)^] (7.10)
The errors in the kobs I [adduct]stoich and K a values were calculated by determining the
percentage error in the kobs value and converting this into an absolute value of
kobs I [adduct]stoich or K a .
kobs values are quoted to three significant figures, kobs I [adduct]stoich to two, or three
significant figures in the case of the A^-methylbenzylamine adduct, and K a values to two
significant figures.
The pH 8.9 data point for the A^-methylbenzylamine adduct gave an anomalously low
result and therefore was not included in the \og[{kobs I [adduct]stoich]) / s' ] against pH
plot. A pH 10 borax / hydrochloric acid buffer was prepared but could not be used as
the aqueous iodine solution immediately decolourised when added to the buffer: the
pH 9 buffer was also prepared from borax, with sodium hydroxide, therefore this may
account for the lower than expected values obtained at this pH.
The buffers employed and the corresponding stoichiometric buffer concentrations in the
final reaction mixture are shown in Table 7.19.
The pH values of all solutions were determined using a Jenway 3020 pH meter
calibrated using pH 7 and pH 10 (for alkaline solutions) or pH 4 (for acidic solutions)
buffers. pH values are quoted to one decimal place.
319
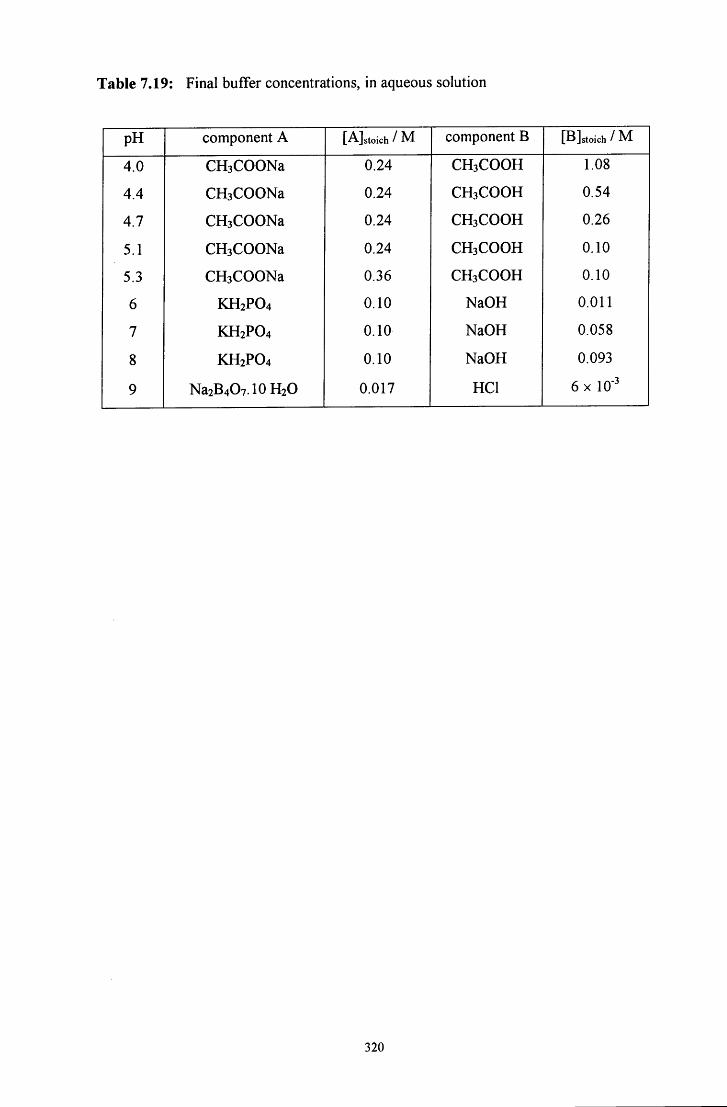
Table 7.19: Final buffer concentrations, in aqueous solution
pH component A [A]stoich / M component B [B]stoich / M
4.0 CH3C00Na 0.24 CH3COOH 1.08
4.4 CH3C00Na 0.24 CH3COOH 0.54
4.7 CH3C00Na 0.24 CH3COOH 0.26
5.1 CH3C00Na 0.24 CH3COOH 0.10
5.3 CH3C00Na 0.36 CH3COOH 0.10
6 KH2PO4 0.10 NaOH 0.011
7 KH2PO4 0.10 NaOH 0.058
8 KH2PO4 0.10 NaOH 0.093
9 Na2B4O7.10H2O 0.017 HCl 6 X 10"
320
7.5 R E F E R E N C E S
1. R. G. Kallen and W. P. Jencks, J. Biol Chem., 1966, 241, 5864
321
C H A P T E R 8
C o n c l u s i o n
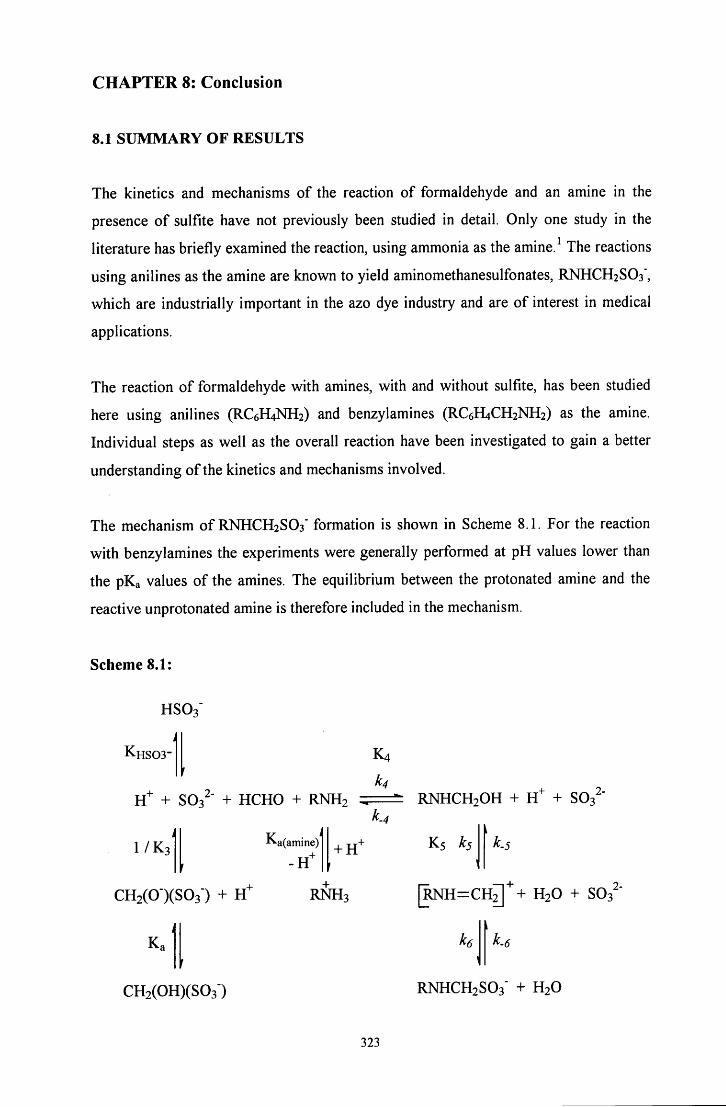
C H A P T E R 8: Conclusion
8.1 SUMMARY OF RESULTS
The kinetics and mechanisms of the reaction of formaldehyde and an amine in the
presence of sulfite have not previously been studied in detail. Only one study in the
literature has briefly examined the reaction, using ammonia as the amine. The reactions
using anilines as the amine are known to yield aminomethanesulfonates, RNHCH2SO3',
which are industrially important in the azo dye industry and are of interest in medical
applications.
The reaction of formaldehyde with amines, with and without sulfite, has been studied
here using anilines (RC6H4NH2) and benzylamines (RC6H4CH2NH2) as the amine.
Individual steps as well as the overall reaction have been investigated to gain a better
understanding of the kinetics and mechanisms involved.
The mechanism of RNHCH2SO3" formation is shown in Scheme 8.1. For the reaction
with benzylamines the experiments were generally performed at pH values lower than
the pKa values of the amines. The equilibrium between the protonated amine and the
reactive unprotonated amine is therefore included in the mechanism.
Scheme 8.1:
HSO3"
4 KhS03-
+ SOs " + HCHO + RNH2
K4
k4
i.4 I / K 3
K a(amine)
CH2(0-)(S03) + RNH3
K,
CH2(OH)(S03')
RNHCH2OH + + S03^"
K5 k,
R N H = C H J ] ' ' + H 2 O + S03^
R N H C H 2 S 0 3 ' + H 2 O
323
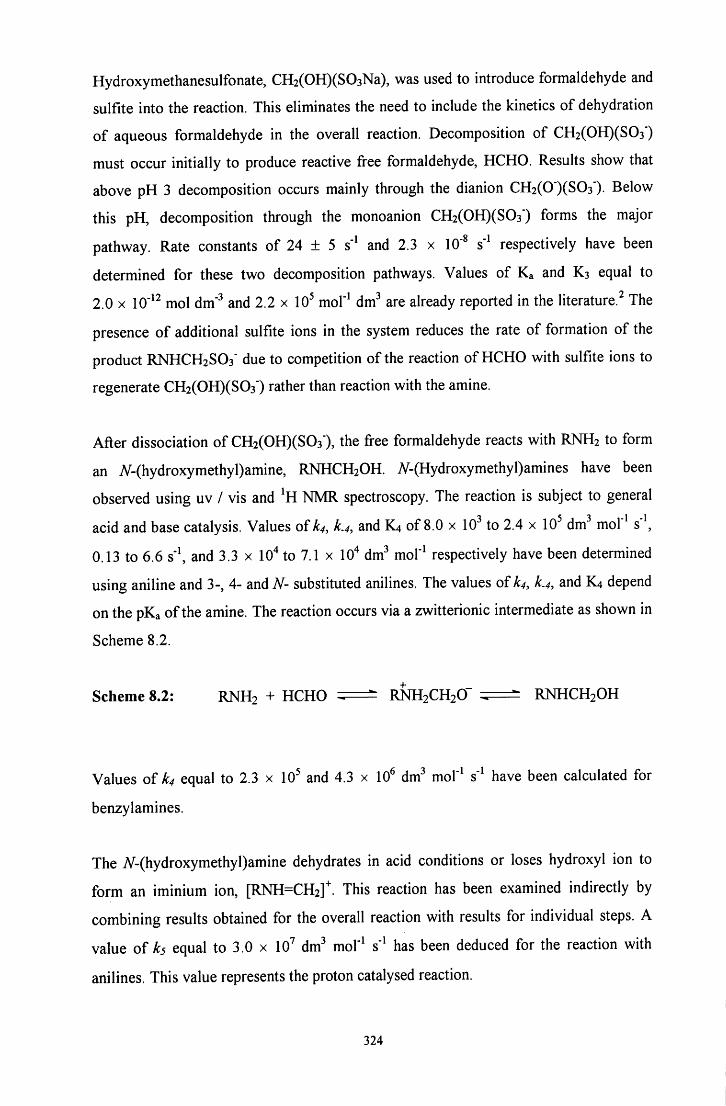
Hydroxymethanesulfonate, CH2(OH)(S03Na), was used to introduce formaldehyde and
sulfite into the reaction. This eliminates the need to include the kinetics of dehydration
of aqueous formaldehyde in the overall reaction. Decomposition of CH2(OH)(S03')
must occur initially to produce reactive free formaldehyde, HCHO. Results show that
above pH 3 decomposition occurs mainly through the dianion CH2(0')(S03'). Below
this pH, decomposition through the monoanion CH2(OH)(S03') forms the major
pathway. Rate constants of 24 ± 5 s' and 2.3 x 10" s'' respectively have been
determined for these two decomposition pathways. Values of Ka and K3 equal to
2.0 X 10'*^ mol dm" and 2.2 x 10 mol'^ dm"' are already reported in the literature.^ The
presence of additional sulfite ions in the system reduces the rate of formation of the
product RNHCH2SO3" due to competition of the reaction of HCHO with sulfite ions to
regenerate CH2(OH)(S03") rather than reaction with the amine.
After dissociation of CH2(OH)(S03"), the free formaldehyde reacts with RNH2 to form
an iV-(hydroxymethyl)amine, RNHCH2OH. 7V-(Hydroxymethyl)amines have been
observed using uv / vis and ^H NMR spectroscopy. The reaction is subject to general
acid and base catalysis. Values of k4, k.4, and K4 of 8.0 x 10 to 2.4 x 10 dm^ mol" s'\
0.13 to 6.6 s'\ and 3.3 x 10" to 7.1 x 10"* dm^ mol"^ respectively have been determined
using aniline and 3-, 4- and A - substituted anilines. The values of k4, k.4, and K4 depend
on the pKa of the amine. The reaction occurs via a zwitterionic intermediate as shown in
Scheme 8.2.
Scheme 8.2: RNH2 + HCHO : ^ = ^ RNH2CH2O" : ^ = ^ RNHCH2OH
Values of k4 equal to 2.3 x 10 and 4.3 x 10 dm^ mol'^ s' have been calculated for
benzylamines.
The A^-(hydroxymethyl)amine dehydrates in acid conditions or loses hydroxyl ion to
form an iminium ion, [RNH=CH2]^. This reaction has been examined indirectly by
combining results obtained for the overall reaction with results for individual steps. A
value of ks equal to 3.0 x 10 dm"' mol"^ s' has been deduced for the reaction with
anilines. This value represents the proton catalysed reaction.
324
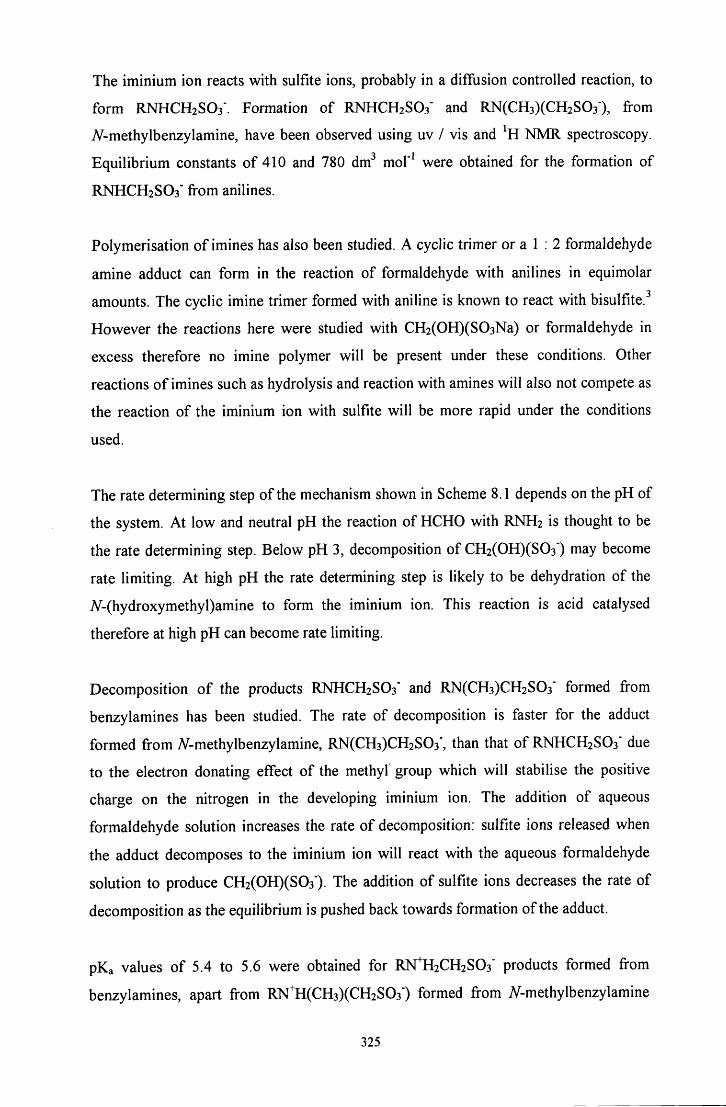
The iminium ion reacts with sulfite ions, probably in a diffusion controlled reaction, to
form RNHCH2S03". Formation of RNHCH2S03' and RN(CH3)(CH2S03), from
A^-methylbenzylamine, have been observed using uv / vis and NMR spectroscopy.
Equilibrium constants of 410 and 780 dm^ mol'^ were obtained for the formation of
RNHCH2SO3" from anilines.
Polymerisation of imines has also been studied. A cyclic trimer or a 1 : 2 formaldehyde
amine adduct can form in the reaction of formaldehyde with anilines in equimolar
amounts. The cyclic imine trimer formed with aniline is known to react with bisulfite.^
However the reactions here were studied with CH2(OH)(S03Na) or formaldehyde in
excess therefore no imine polymer will be present under these conditions. Other
reactions of imines such as hydrolysis and reaction with amines will also not compete as
the reaction of the iminium ion with sulfite will be more rapid under the conditions
used.
The rate determining step of the mechanism shown in Scheme 8.1 depends on the pH of
the system. At low and neutral pH the reaction of HCHO with R N H 2 is thought to be
the rate determining step. Below pH 3, decomposition of CH2(OH)(S03") may become
rate limiting. At high pH the rate determining step is likely to be dehydration of the
A^-(hydroxymethyl)amine to form the iminium ion. This reaction is acid catalysed
therefore at high pH can become rate limiting.
Decomposition of the products RNHCH2S03' and RN(CH3)CH2S03" formed from
benzylamines has been studied. The rate of decomposition is faster for the adduct
formed from 7V-methylbenzylamine, RN(CH3)CH2S03', than that of RNHCH2SO3" due
to the electron donating effect of the methyl group which will stabilise the positive
charge on the nitrogen in the developing iminium ion. The addition of aqueous
formaldehyde solution increases the rate of decomposition: sulfite ions released when
the adduct decomposes to the iminium ion will react with the aqueous formaldehyde
solution to produce CH2(OH)(S03'). The addition of sulfite ions decreases the rate of
decomposition as the equilibrium is pushed back towards formation of the adduct.
pKa values of 5.4 to 5.6 were obtained for R>rH2CH2S03' products formed from
benzylamines, apart from R]srH(CH3)(CH2S03") formed from A^-methylbenzylamine
325
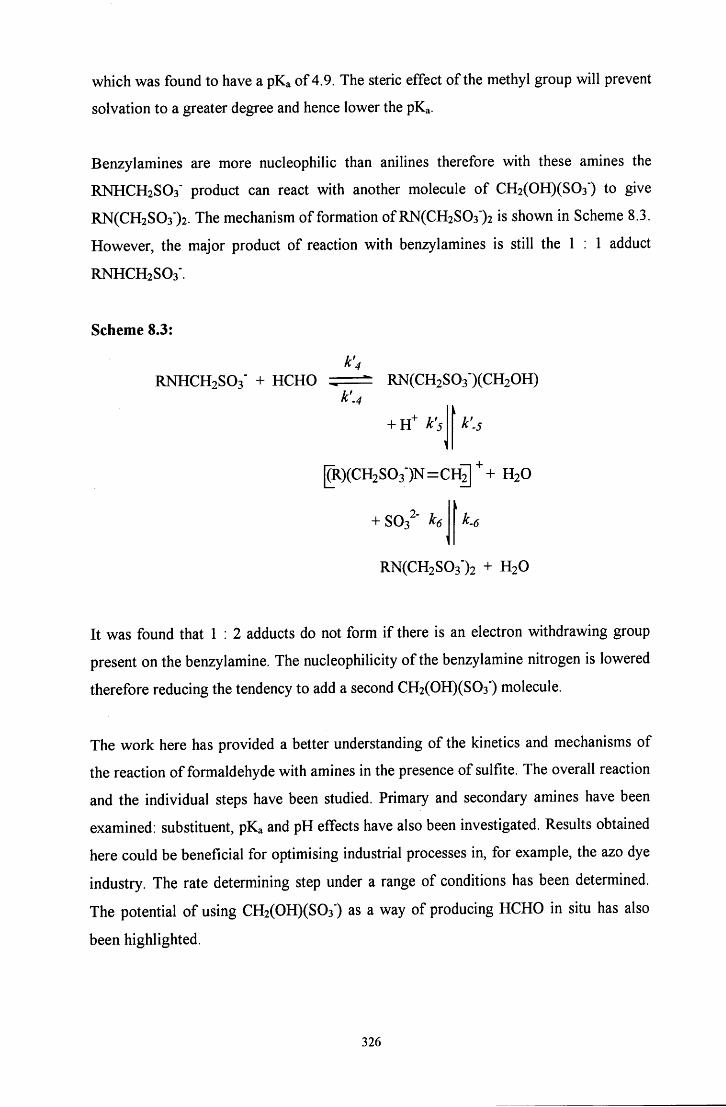
which was found to have a pKa of 4.9. The steric effect of the methyl group will prevent
solvation to a greater degree and hence lower the pKa.
Benzylamines are more nucleophilic than anilines therefore with these amines the
RNHCH2SO3" product can react with another molecule of CH2(OH)(S03') to give
RN(CH2S03')2. The mechanism of formation of RN(CH2S03")2 is shown in Scheme 8.3.
However, the major product of reaction with benzylamines is still the 1 : 1 adduct
RNHCH2SO3".
Scheme 8.3:
k'4 RNHCH2SO3" + H C H O = ^ = ^ RN(CH2S03")(CH20H)
k'.4
+ H^ k's \k'.
( r ) ( C H 2 S 0 3 ) N = C H 7 | ' ' + H20
+ S03^' ke k.,
RN(CH2S03")2 + H2O
It was found that 1 : 2 adducts do not form i f there is an electron withdrawing group
present on the benzylamine. The nucleophilicity of the benzylamine nitrogen is lowered
therefore reducing the tendency to add a second CH2(OH)(S03') molecule.
The work here has provided a better understanding of the kinetics and mechanisms of
the reaction of formaldehyde with amines in the presence of sulfite. The overall reaction
and the individual steps have been studied. Primary and secondary amines have been
examined: substituent, pKa and pH effects have also been investigated. Results obtained
here could be beneficial for optimising industrial processes in, for example, the azo dye
industry. The rate determining step under a range of conditions has been determined.
The potential of using CH2(OH)(S03') as a way of producing HCHO in situ has also
been highlighted.
326
8.2 R E F E R E N C E S
1. P. Le Henaff, Compt. Rend Acad. Set, 1963, 256, 3090
2. P. E. S0rensen and V. S. Andersen, Acta. Chem. Scand, 1970, 24, 1301
3. Badische Anilin and Soda Fabrik, Germ. Patent, 1902, 132621
327
CHAPTER 9
Experimental
C H A P T E R 9: Experimental
9.1 M A T E R I A L S
Materials of the highest grades were purchased commercially from Aldrich and used
without purification, apart from the imine polymers which were synthesised as
described in the text. A Sonomatic sonic bath was used to dissolve compounds with low
solubility.
A 37 % by weight aqueous formaldehyde solution with 10 % methanol stabiliser
was used: this was diluted and left to stand for at least 2V2 hours, more usually
4 - 4V^ hours, prior to use to ensure depolymerisation of higher molecular weight
polyoxymethylene glycols to methylene glycol. For NMR work, 99.6 to 99.9 atom % D
solvents in 1 cm^ prescored ampules were used.
General purpose methanol was used for washing all apparatus.
9.2 E X P E R I M E N T A L MEASUREMENTS
Volumes were measured generally using glass pipettes for volumes greater than 0.5 cm^
and Gilson Pipettman dispensing pipettes with disposable tips for smaller volumes. The
Gilson Pipettman pipettes were calibrated prior to use by weighing the volume of water
dispensed at a particular setting, assuming a density of water of 1 g cm'^, and adjusting
the volume setting accordingly.
Mehing points were determined using a digital Gallenkamp melting apparatus.
9.3 CONVENTIONAL UV / VIS SPECTROMETRY
Absorbance against time spectra and absorbance against time plots were recorded using
a UV-2101 PC Shimadzu Corporation or a Perkin - Elmer Lambda 2 or Lambda 12
uv / vis spectrometer at 25 °C using 1 cm path length stoppered quartz cuvettes. The
329
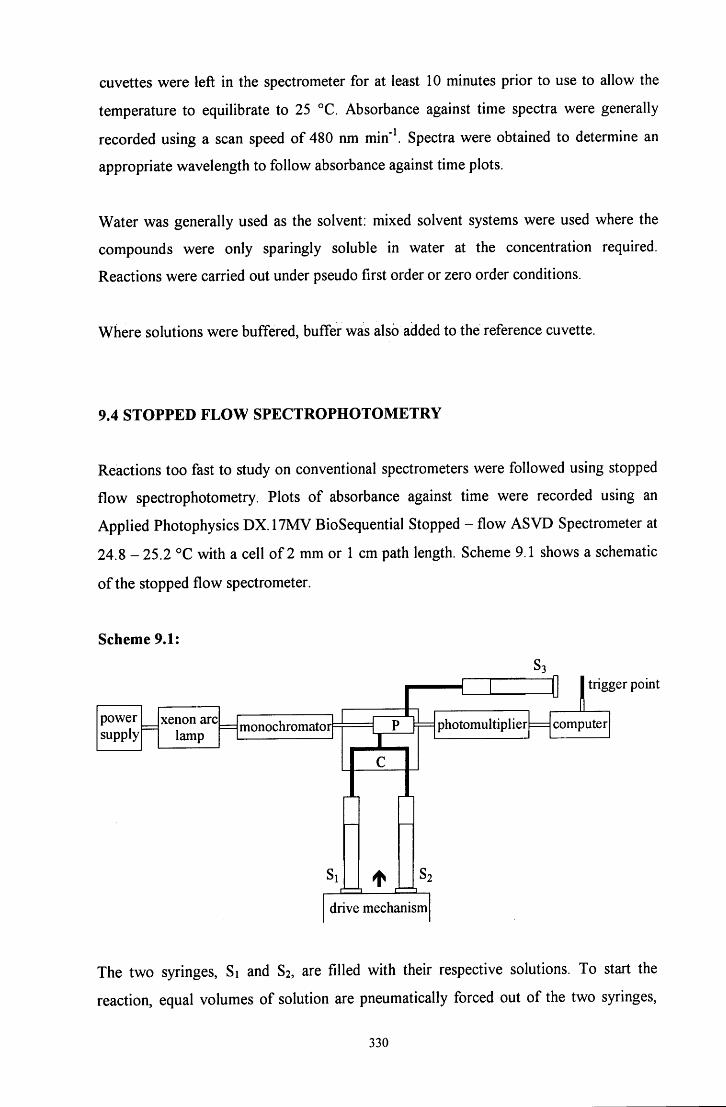
cuvettes were left in the spectrometer for at least 10 minutes prior to use to allow the
temperature to equilibrate to 25 °C. Absorbance against time spectra were generally
recorded using a scan speed of 480 nm mm\ Spectra were obtained to determine an
appropriate wavelength to follow absorbance against time plots.
Water was generally used as the solvent: mixed solvent systems were used where the
compounds were only sparingly soluble in water at the concentration required.
Reactions were carried out under pseudo first order or zero order conditions.
Where solutions were buffered, buffer was also added to the reference cuvette.
9.4 STOPPED F L O W SPECTROPHOTOMETRY
Reactions too fast to study on conventional spectrometers were followed using stopped
flow spectrophotometry. Plots of absorbance against time were recorded using an
Applied Photophysics DX.17MV BioSequential Stopped - flow ASVD Spectrometer at
24.8 - 25.2 °C with a cell of 2 mm or 1 cm path length. Scheme 9.1 shows a schematic
of the stopped flow spectrometer.
Scheme 9.1:
power supply
xenon arc lamp
monochromator p IT
1 C
photomultiplier
trigger point
computer
drive mechanism
The two syringes, Si and S2, are filled with their respective solutions. To start the
reaction, equal volumes of solution are pneumatically forced out of the two syringes,
330
through a mixing cell, C, and along an observation tube to the collector syringe, S3. The
recording of the plot and the stopping of the flow of solution are triggered by the
plunger of syringe S3 reaching the trigger point.
The amount of light passing through a fixed point, P, just downstream of the mixing cell
wil l change as the reaction proceeds. The monochromator fixes the light at the desired
wavelength. The photomultiplier converts the light passing through point P into an
electric current and a voltage is generated proportional to the light intensity. This signal
is sampled by the computer at pre-selected intervals over an appropriate time range: the
computer software transforms this change in voltage against time data into absorbance
against time data by applying Equation 9.1, where A = absorbance, Vo = initial voltage
and A V = change in vohage.
A = logio/ ] (9.1)
The dead time of the spectrometer is approximately 5 ms therefore reactions with half
lives smaller than this cannot be measured using stopped flow techniques.
The apparatus was washed through with distilled water and the appropriate solutions
prior to use. Approximately five short runs were performed prior to obtaining results to
ensure efficient mixing. Water was generally used as the solvent: mixed solvent systems
were used where the compounds were only sparingly soluble in water at the
concentration required. Reactions were carried out under pseudo first order or zero
order conditions. Runs were often carried out in a random order rather than in
increasing / decreasing concentration to minimise errors due to environmental changes.
9.5 DATA F I T T I N G AND ERRORS IN MEASUREMENT
For results obtained using conventional spectroscopy methods, first order kinetics were
fitted using the Perkin Elmer Computerised Spectroscopy Software (PECSS) program
installed on the Perkin - Elmer Lambda 2 spectrometer or by plotting ln(Aoo - A )
against time / s using Microsoft Excel and performing linear regression. Good
331
correlation was obtained between the two methods. Zero order plots were fitted using
linear regression on Microsoft Excel. First order rate constants obtained using stopped
flow spectrophotometry were fitted using the single exponential fi t fiinction and zero
order plots fitted using linear regression on the ISX.17MV program installed on the
spectrometer.
Al l fitting methods used to obtain first order rate constants are based on the following
equations for deriving a rate expression for a first order reaction. For a reaction of the
type A B, the rate of formation of B, or the rate of decomposition of A, can be
expressed in terms of Equation 9.2.
m _ d[A] —— = —— = ^obsW (9.2) dt dt
Integrating this equation gives:
[A], t
_ '-^d[A] = k i , d t (9-3) J [A] J
[A]o 0
lii[A]t - ln[A]„ = -kobst (9.4)
1 , [A]t
where [A]o and [A]t are concentrations of A at time t = 0 and t respectively.
The Beer Lambert Law states that A = eel, where s is the extinction coefficient, c the
concentration and 1 the cell pathlength. I f the pathlength is assumed to be 1 cm then
Equations 9.6 to 9.14 apply.
A c = SA[A]O (9.6)
A t = 8A[A]t + 8B[B]t (9.7)
Since [B]t = [A]o - [A] t (9.8)
332
^ A t = SA[A] t + 8B[A]O - SB[A] t (9.9)
Aoo = 8B[B]ao = SB[A]O since [B]oo = [A]o (9.10)
Therefore (A^o - A t ) = 8B[A]t - 8A[A]t (9.11)
Hence [A] t =^^^11^ (9.12) (EB - BA)
Similarly (Aoo - A o ) = 8B[A]O - 8A[A]O (9.13)
Hence [ A L J . ^ ^ ^ (9.14) (SB - SA)
Substituting Equafions 9.12 and 9.14 into Equation 9.5 gives:
1 (Aoo - A t )
^ ln(Aoo - A t ) = -kobs t + ln(Aoo - A o ) (9.16)
Therefore plotting ln(Aoo - A t ) against time should give a linear plot with a gradient
equal to -kobs- Infinity values, Aco, were determined over at least ten half lives and the
data fitted over approximately 80 % of the reaction.
The MicroMath Scientist package for Microsoft Windows, Version 2.0 was also used to
fi t data. Linear regression on Microsoft Excel was used to calculate gradients and
intercepts of linear plots and the errors in these values.
9.6 NMR SPECTROSCOPY
NMR spectra were recorded using a 200 MHz Varian Mercury-200 or Varian
VXR-200, or a 400 MHz Varian Gemini-400 spectrometer. The solvent present in the
highest proportion was used for locking purposes and as the reference peak for spectra.
333
Mixed solvents were used where the compounds were not soluble in water at the
concentrations required.
Spectra were recorded immediately and continued until there was no fiirther change in
the spectrum. The time of mixing refers to the time at which the reaction initiator was
added to the NMR tube. The time of each spectrum was taken as the time when the
spectrometer started to acquire the spectrum.
For the reactions involving an amine and CH2(OH)(S03Na), the volumes of amine and
CH2(OH)(S03Na) needed to obtain the required final concentrations using 1 cm^ D 2 O
solvent were calculated using Equation 9 .17 or 9.18, depending on whether the amine
used was a liquid or a solid respectively, and Equation 9 .19.
yd 1000
y
ci = ^- X [amineJstock (9-18) 1 + y + x
C2 = X [CH2(OH)(S03Na)]stock (9.19) 1 + y + X
y = volume of neat amine / cm ; x = volume of CH2(OH)(S03Na) solution / cm ;
d = density of the amine; MW = molecular weight of the amine; Ci = final concentration
of amine in the NMR tube / mol dm" ; C2 = final concentration of CH2(OH)(S03Na) in
the NMR tube / mol dm'^; [amine]stock = concentration of the stock amine solution in
D 2 O / mol dm" ; [CH2(OH)(S03Na)]stock = concentration of the stock CH2(OH)(S03Na)
solution in D 2 O / mol dm'^.
Where the amine was insoluble in D 2 O , mixed solvent systems were used. A stock
amine solution was prepared in a mixed solvent: this was then added to the NMR tube.
The mixed solvent required to prepare the amine was determined using Equation 9.20.
^ X — (9.20) 100 1 + y + x 1
% = final percentage of the minor solvent required in the NMR tube; z = volume of
minor solvent / cm , 1 - z = volume of D 2 O / cm .
334
9.7 pH MEASUREMENTS
The pH values of solutions were determined using a Jenway 3020 pH meter calibrated
using pH 7 and pH 10 (for alkaline solutions) or pH 4 (for acidic solutions) buffers at
25 °C. The sample was thermostatted at 25 °C prior to taking a pH measurement. The
pH meter temperature probe was also inserted into the sample solution to measure the
temperature.
335

APPENDICES
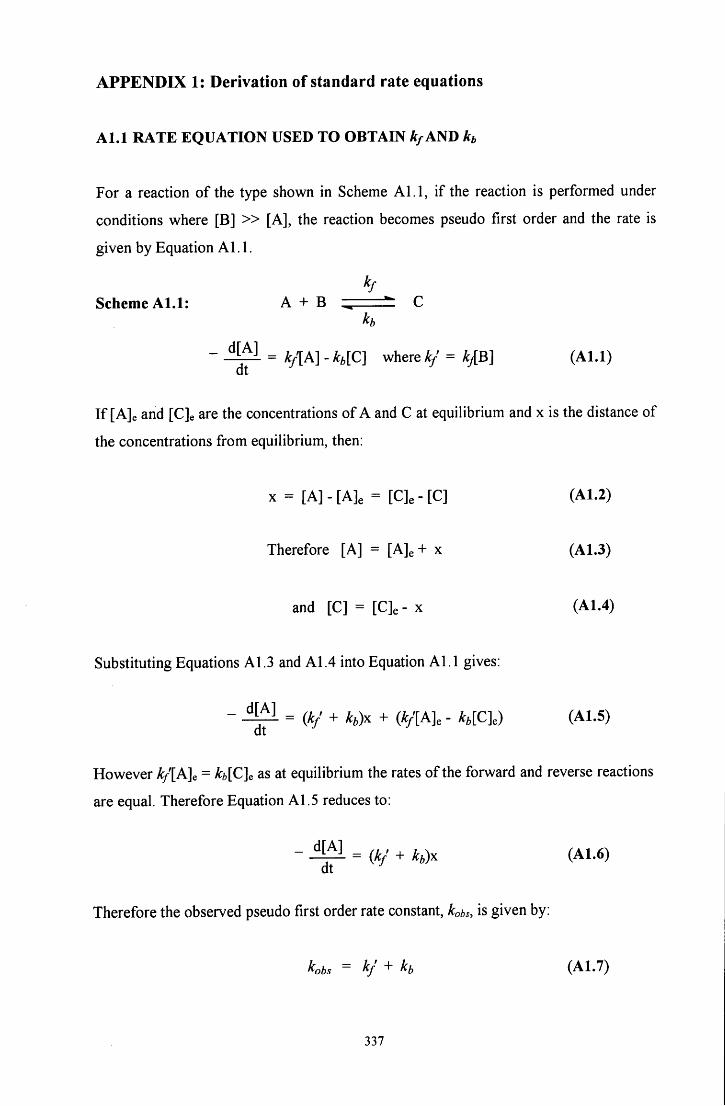
A P P E N D I X 1: Derivation of standard rate equations
A l . l R A T E EQUATION USED TO OBTAIN ^ AND kt
For a reaction of the type shown in Scheme A l . l , i f the reaction is performed under
conditions where [B] » [A], the reacfion becomes pseudo first order and the rate is
given by Equation A l . l .
kf
Scheme A L l : A + B ^ C kb
- = k/[k] - kb[C] where k/ = k^B] (Al . l )
I f [A]e and [C]e are the concentrations of A and C at equilibrium and x is the distance of
the concentrations from equilibrium, then:
X = [A] - [Ale = [C]e - [C] (A1.2)
Therefore [A] = [A]e + x (A1.3)
and [C] = [C]e - x (A1.4)
Substitufing Equations A1.3 and A1.4 into Equation A l . l gives:
- = (V + h)x + (V[A]e - kh[Cl) (A1.5)
However kf[A]e = kb[C]s as at equilibrium the rates of the forward and reverse reactions
are equal. Therefore Equation A1.5 reduces to:
- = (k/ + kb)x (A1.6)
Therefore the observed pseudo first order rate constant, kotsy is given by:
kobs = kf + kb (A1.7)
337
Therefore kobs = ^y[B] + kb (A1.8)
Therefore plotting Kbs I s' against [B] / M should give a linear plot with a gradient
equal to ^/and an intercept equal to h.
338
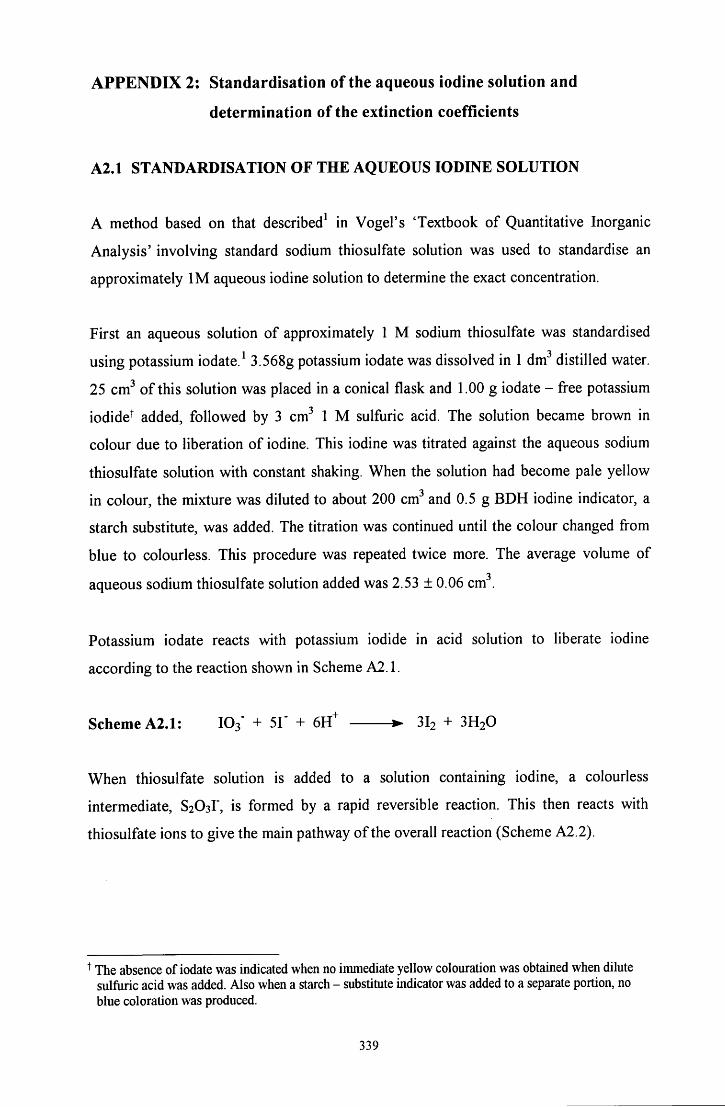
A P P E N D I X 2: Standardisation of the aqueous iodine solution and
determination of the extinction coefficients
A2.1 STANDARDISATION OF T H E AQUEOUS IODINE SOLUTION
A method based on that described^ in Vogel's 'Textbook of Quantitative Inorganic
Analysis' involving standard sodium thiosulfate solution was used to standardise an
approximately I M aqueous iodine solution to determine the exact concentration.
First an aqueous solution of approximately 1 M sodium thiosulfate was standardised
using potassium iodate.^ 3.568g potassium iodate was dissolved in 1 dm^ distilled water.
25 cm^ of this solution was placed in a conical flask and 1.00 g iodate - free potassium
iodide^ added, followed by 3 cm^ 1 M sulfiaric acid. The solution became brown in
colour due to liberation of iodine. This iodine was titrated against the aqueous sodium
thiosulfate solution with constant shaking. When the solution had become pale yellow
in colour, the mixture was diluted to about 200 cm^ and 0.5 g BDH iodine indicator, a
starch substitute, was added. The titration was continued until the colour changed from
blue to colourless. This procedure was repeated twice more. The average volume of
aqueous sodium thiosulfate solution added was 2.53 ± 0.06 cm .
Potassium iodate reacts with potassium iodide in acid solution to liberate iodine
according to the reaction shown in Scheme A2.1.
Scheme A2.1: IO3' + 51" + 6 H ^ 3I2 + 3 H 2 O
When thiosulfate solution is added to a solution containing iodine, a colourless
intermediate, S203r, is formed by a rapid reversible reaction. This then reacts with
thiosulfate ions to give the main pathway of the overall reaction (Scheme A2.2).
^ The absence of iodate was indicated when no immediate yellow colouration was obtained when dilute sulfuric acid was added. Also when a starch - substitute indicator was added to a separate portion, no blue coloration was produced.
339
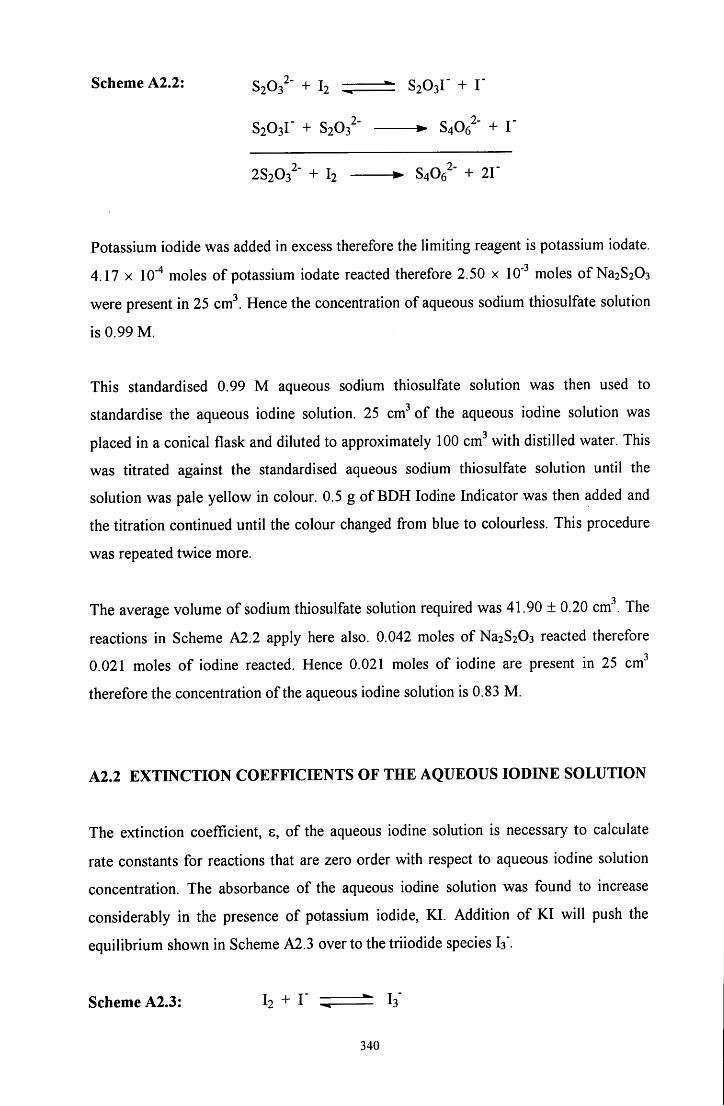
Scheme A2.2: SsOs " + h , SiOsI' + I "
82031" + 8203 " • 8406 ' + I
28203 " + h • S406^' + 21"
Potassium iodide was added in excess therefore the limiting reagent is potassium iodate.
4.17 X lO''* moles of potassium iodate reacted therefore 2.50 x 10""' moles of Na28203
were present in 25 cm"*. Hence the concentration of aqueous sodium thiosulfate solution
is 0.99 M.
This standardised 0.99 M aqueous sodium thiosulfate solution was then used to
standardise the aqueous iodine solution. 25 cm" of the aqueous iodine solution was
placed in a conical flask and diluted to approximately 100 cm" with distilled water. This
was titrated against the standardised aqueous sodium thiosulfate solution until the
solution was pale yellow in colour. 0.5 g of BDH Iodine Indicator was then added and
the titration continued until the colour changed from blue to colourless. This procedure
was repeated twice more.
The average volume of sodium thiosulfate solution required was 41.90 ± 0.20 cm . The
reactions in 8cheme A2.2 apply here also. 0.042 moles of Na2S203 reacted therefore
0.021 moles of iodine reacted. Hence 0.021 moles of iodine are present in 25 cm^
therefore the concentration of the aqueous iodine solution is 0.83 M.
A2.2 EXTINCTION C O E F F I C I E N T S OF T H E AQUEOUS IODINE SOLUTION
The extinction coefficient, s, of the aqueous iodine solution is necessary to calculate
rate constants for reactions that are zero order with respect to aqueous iodine solution
concentration. The absorbance of the aqueous iodine solution was found to increase
considerably in the presence of potassium iodide, K I . Addition of K I will push the
equilibrium shown in Scheme A2.3 over to the triiodide species I3".
Scheme A2.3: I2 + I" ^ I3"
340
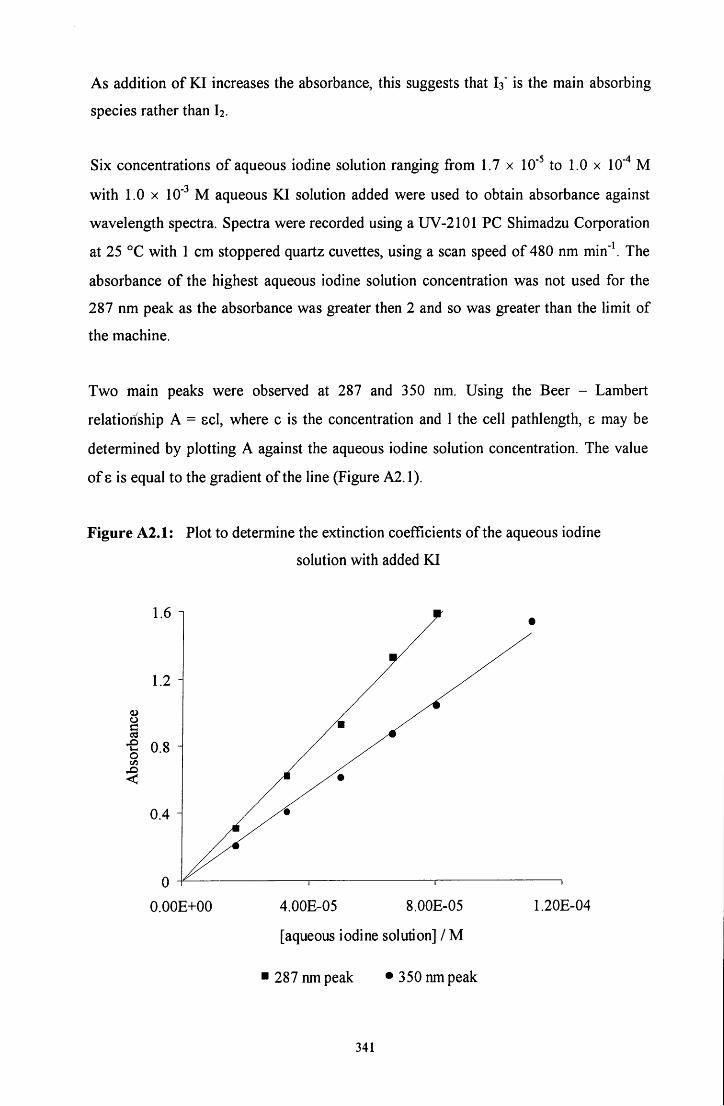
As addition of K I increases the absorbance, this suggests that I3' is the main absorbing
species rather than h.
Six concentrations of aqueous iodine solution ranging from 1.7 x 10' to 1.0 x 10" M
with 1.0 X 10" M aqueous K I solution added were used to obtain absorbance against
wavelength spectra. Spectra were recorded using a UV-2101 PC Shimadzu Corporation
at 25 °C with 1 cm stoppered quartz cuvettes, using a scan speed of 480 nm min"\ The
absorbance of the highest aqueous iodine solution concentration was not used for the
287 nm peak as the absorbance was greater then 2 and so was greater than the limit of
the machine.
Two main peaks were observed at 287 and 350 nm. Using the Beer - Lambert
relationship A = scl, where c is the concentration and 1 the cell pathlength, s may be
determined by plotting A against the aqueous iodine solution concentration. The value
of 8 is equal to the gradient of the line (Figure A2.1).
Figure A2.1: Plot to determine the extinction coefficients of the aqueous iodine
solution with added K I
-e 0.8
O.OOE+00 4.00E-05 8.00E-05
[aqueous iodine solution] / M
1.20E-04
287 nm peak 350 nm peak
341
Values of 8 equal to 19600 ± 300 and 13400 ± 300 dm^ mol"^ cm" for the 287 and
350 nm peaks respectively are obtained. Linear regression yielded correlation
coefficients of 0.995 and 0.990 respectively.
To ensure the presence of the absorbing species, I 3 ' , K I was usually added in great
excess to the aqueous iodine solution when used experimentally.
A2.3 R E F E R E N C E S
1. A. Vogel, ' A Textbook of Quantitative Inorganic Analysis', 4th Ed., Longman Inc.,
1978, New York, pp. 375 - 379
342
A P P E N D I X 3: Seminars and conferences attended
A3.1 SEMINARS ATTENDED
23.10.96 Professor H. Ringsdorf, Johannes Gutenberg - Universitat, Germany
Function Based on Organisation
30.10.96 Dr. P. Mountford, Nottingham University
Recent Developments in Group IV Imido Chemistry
06.11.96 Dr. M . Duer, Cambridge University
Solid State NMR Studies of Organic Solid to Liquid - Crystalline Phase
Transitions
18.11.96 Professor G. Olah, University of Southern California
Crossing Conventional Lines in My Chemistry of the Elements
27.11.96 Dr. R. Templer, Imperial College, London
Molecular Tubes and Sponges
15.01.97 Dr. V. K. Aggarwal, University of Sheffield
Sulfur Mediated Asymmetric Synthesis
29.01.97 Professor A. Kirby, University of Cambridge, Ingold Lecturer
Molecular Recognition of Transition States
05.02.97 Dr. A. Haynes, University of Sheffield
Mechanism in Homogeneous Catalytic Carbonylation
19.02.97 Professor B. Hayden, Southampton University
The Dynamics of Dissociation at Surfaces and Fuel Cell Catalysts
19.03.97 Dr. K. Reid, University of Nottingham
Probing Dynamical Processes with Photoelectronics
29.10.97 Professor B. Peacock, University of Glasgow, RSC Endowed Lecture
Probing Chirality with Circular Dichroism
343
05.11.97 Dr. M . Hii, Oxford University
Studies of the Heck Reaction
03.12.97 Professor A. P. Davis, Trinity College Dublin
Steroid - Based Frameworks for Supramolecular Chemistry
10.12.97 Professor M . Page, University of Huddersfield
The Mechanism and Inhibition of Beta - Lactamases
28.01.98 Dr. 8. Rannard, Coutaulds Coatings, Coventry
Synthesis of Dendrimers using Highly Selective Chemical Reactions
18.02.98 Professor G. Hancock, Oxford University
Surprises in the Photochemistry of Tropospheric Ozone
11.03.98 Professor M . J. Cook, University of East Anglia
How to Make Phthalocyanine Films and What to Do With Them
23.10.98 Professor J. Scaiano, University of Ottawa, Canada, R8C Endowed Lecture
In Search of Hypervalent Free Radicals
18.11.98 Dr. R. Cameron, Cambridge University
Biodegradable Polymers: Morphology and Controlled Release
02.12.98 Dr. M . Jaspers, University of Aberdeen
Bioactive Compounds Isolated from Marine Invertebrates and
Cyanobacteria: Drugs from the Deep
27.01.99 Professor K. Wade, University of Durham
Foresight or Hindsight? Some Borane Lessons and Loose Ends
03.02.99 Dr. C. Schofield, University of Oxford
Studies on the Stereoelectronics of Enzyme Catalysis
17.02.99 Dr. B. Horrocks, Newcastle University
Microelectrode Techniques for the Study of Immobilised Enzymes and
Nucleic Acids
344
A3.2 CONFERENCES ATTENDED
22.12.97 Graduate Poster Competition, University of Durham
Sponsored by ICI
Poster presented entitled 'Mechanism of Amine / Formaldehyde and
Nucleophile Reactions'
09.01.98 International Winter School on Organic Reactivity, Bressanone, Italy
to Sponsored by EU
17.01.98 Poster presented entitled 'Mechanism of Amine / Formaldehyde and
Nucleophile Reactions'
18.09.98 Organic Reaction Mechanisms Group Conference, Zeneca, Huddersfield
Poster presented entitled 'Mechanism of Amine / Formaldehyde /
Nucleophile Reactions'
21.12.98 Graduate Poster Competition, University of Durham
Sponsored by ICI
Poster presented entitled 'Condensation Reactions of Formaldehyde and
Amines with addition of Sulfite'
23.06.99 University of Durham Graduate Symposium, University of Durham
Oral presentation entitled 'Reaction of Formaldehyde with Amines in the
presence of Sulfite'
22.08.99 7th European Symposium on Organic Reactivity (ESOR), Ulm, Germany
to Poster presented entitled 'Condensation Reactions of Formaldehyde and
27.08.99 Amines with and without the presence of Sulfite'
17.09.99 Organic Reaction Mechanisms Group Conference, Roche Discovery,
Welwyn Garden City
Poster presented entitled 'Condensation Reactions of Formaldehyde and
Amines with and without the presence of Sulfite'
345