Embed Size (px)
Citation preview
Kinetics Notes- Part 2
TWO TYPES OF RATE LAWS
• Thus far, we have examinedDifferential rate laws—– data table contains concentration and rate data. – Use table logic or algebra to determine the orders
of reactants and the value of the rate constant, k.– Rate=k[A]m[B]n
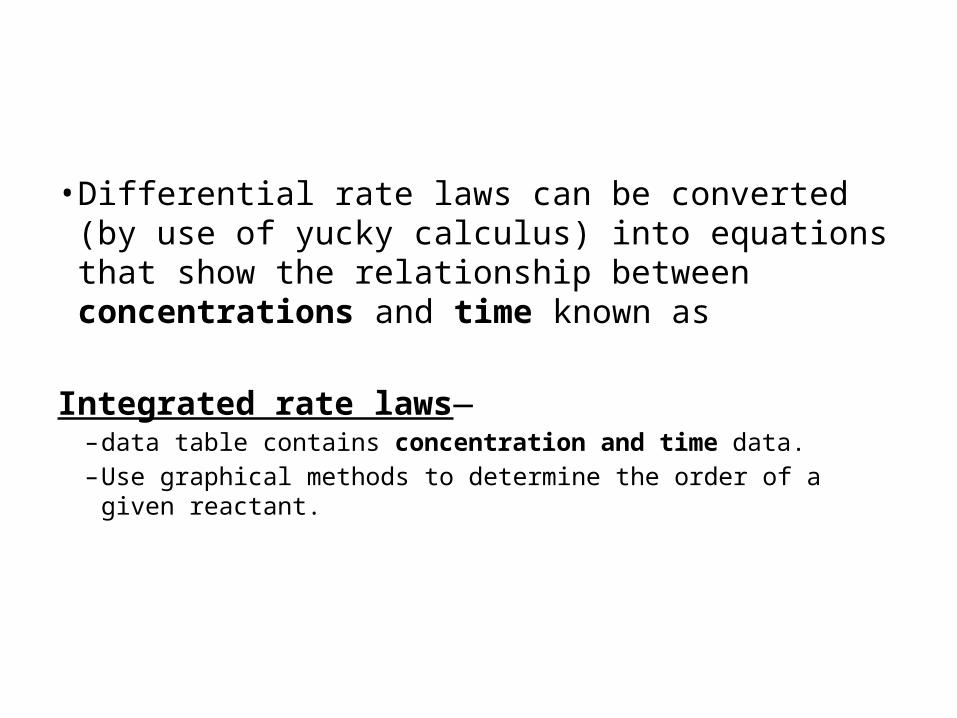
• Differential rate laws can be converted (by use of yucky calculus) into equations that show the relationship between concentrations and time known as
Integrated rate laws—– data table contains concentration and time data. – Use graphical methods to determine the order of a given reactant.
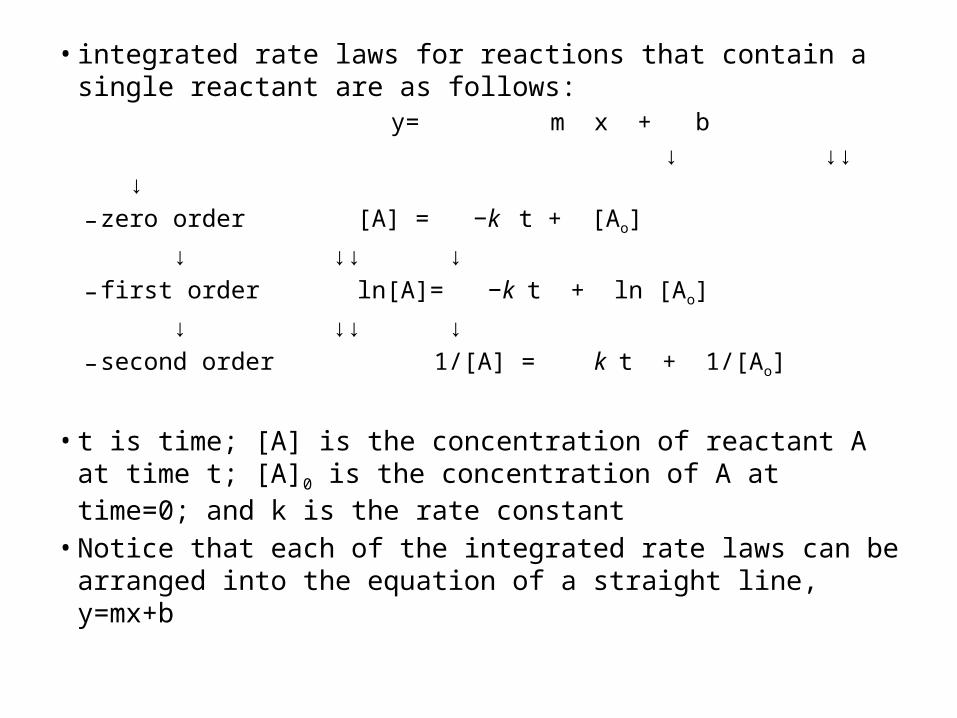
• integrated rate laws for reactions that contain a single reactant are as follows:
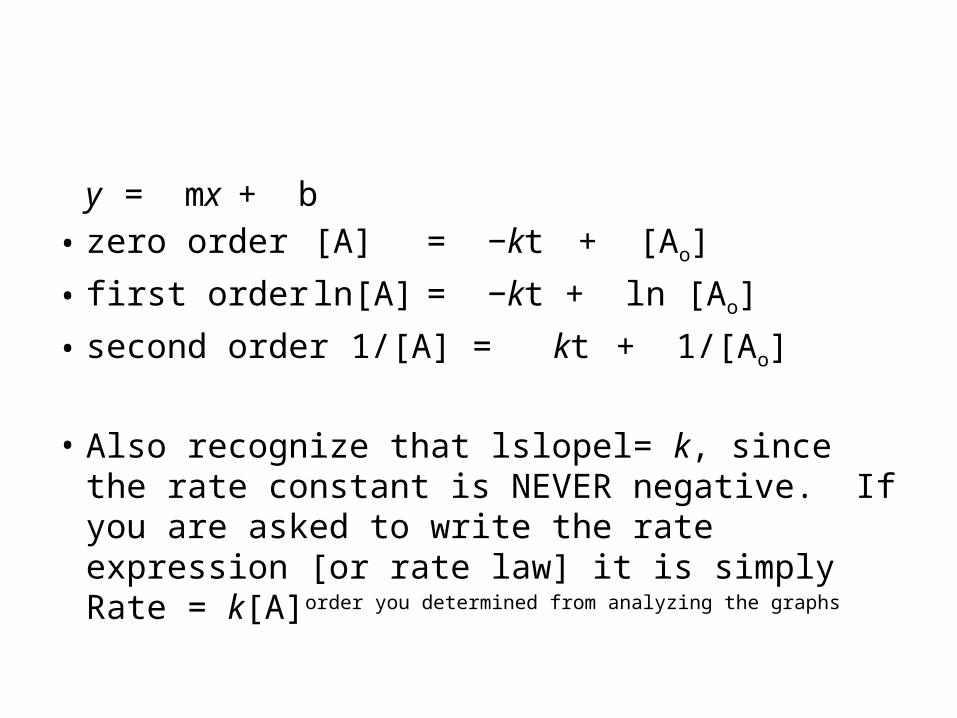
y= m x + b ↓ ↓↓ ↓ – zero order [A] = −k t + [Ao]
↓ ↓↓ ↓ – first order ln[A]= −k t + ln [Ao]
↓ ↓↓ ↓ – second order 1/[A] = k t + 1/[Ao]
• t is time; [A] is the concentration of reactant A at time t; [A]0 is the concentration of A at time=0; and k is the rate constant
• Notice that each of the integrated rate laws can be arranged into the equation of a straight line, y=mx+b
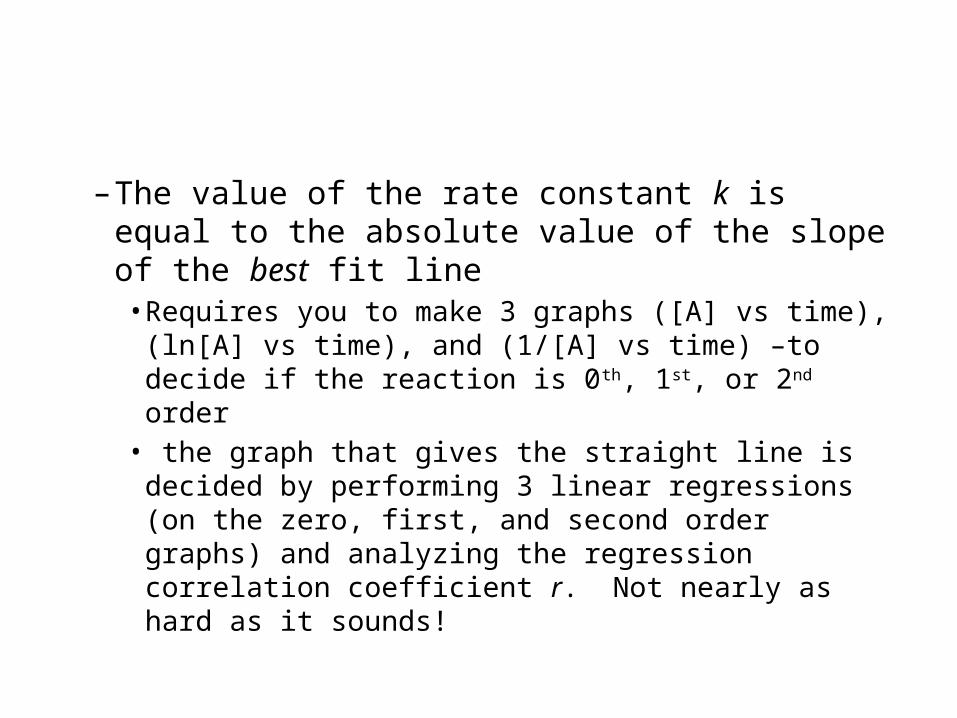
– The value of the rate constant k is equal to the absolute value of the slope of the best fit line• Requires you to make 3 graphs ([A] vs time), (ln[A]
vs time), and (1/[A] vs time) –to decide if the reaction is 0th, 1st, or 2nd order• the graph that gives the straight line is decided
by performing 3 linear regressions (on the zero, first, and second order graphs) and analyzing the regression correlation coefficient r. Not nearly as hard as it sounds!
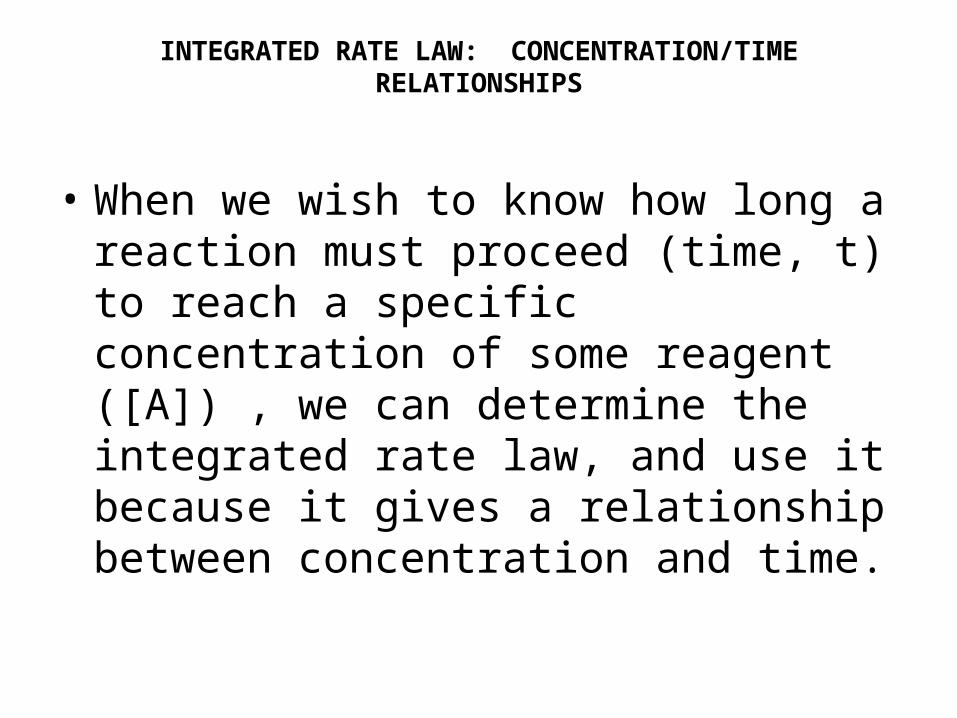
INTEGRATED RATE LAW: CONCENTRATION/TIME RELATIONSHIPS
• When we wish to know how long a reaction must proceed (time, t) to reach a specific concentration of some reagent ([A]) , we can determine the integrated rate law, and use it because it gives a relationship between concentration and time.
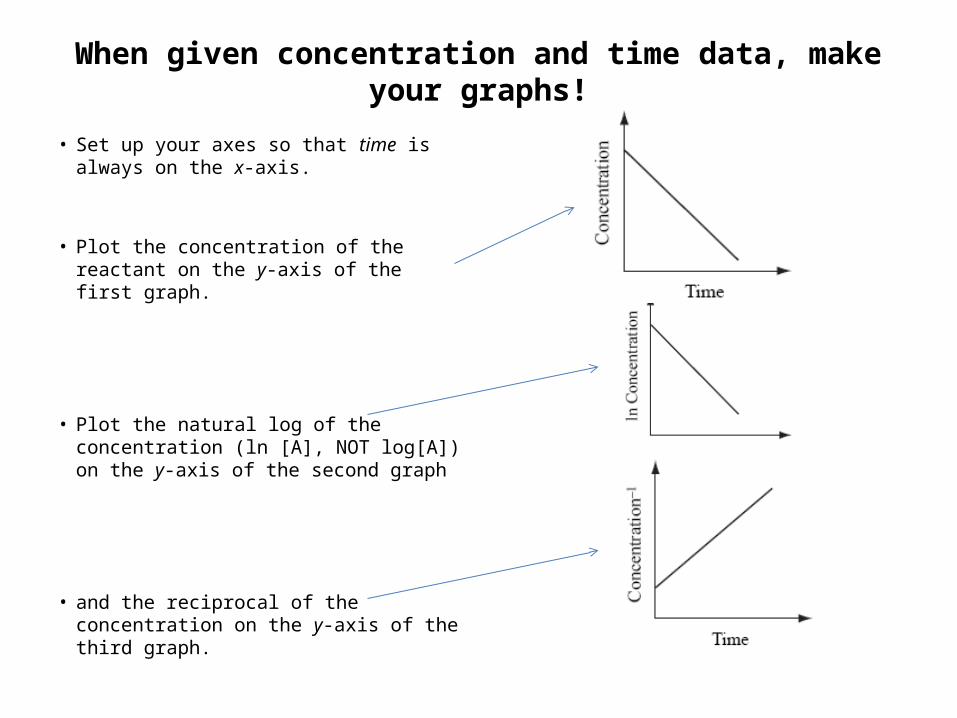
When given concentration and time data, make your graphs!
• Set up your axes so that time is always on the x-axis.
• Plot the concentration of the reactant on the y-axis of the first graph.
• Plot the natural log of the concentration (ln [A], NOT log[A]) on the y-axis of the second graph
• and the reciprocal of the concentration on the y-axis of the third graph.
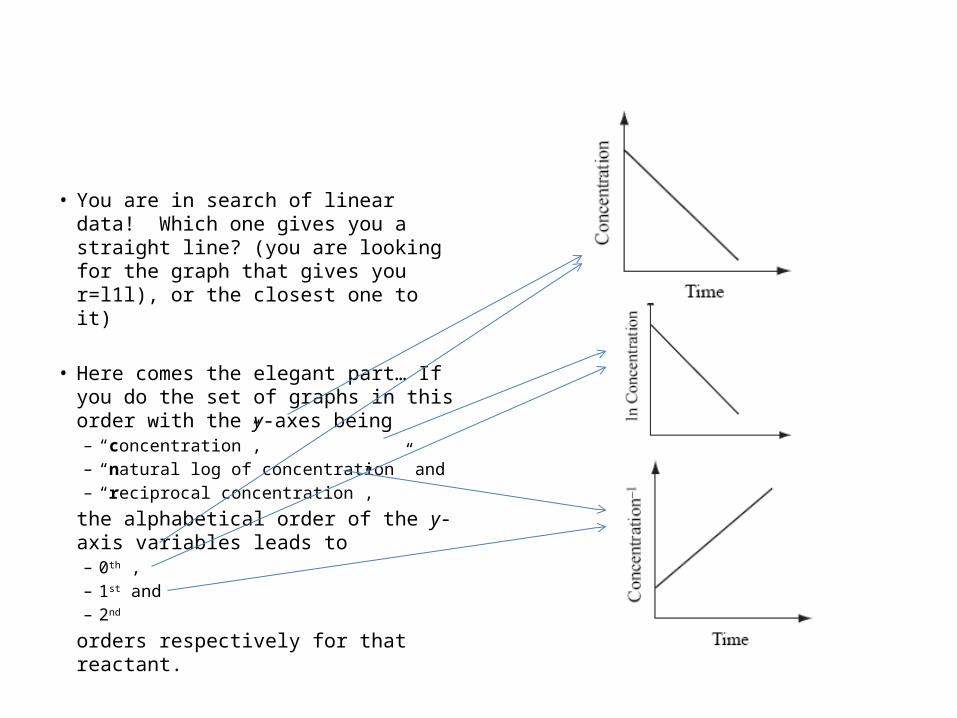
• You are in search of linear data! Which one gives you a straight line? (you are looking for the graph that gives you r=l1l), or the closest one to it)
• Here comes the elegant part… If you do the set of graphs in this order with the y-axes being – “concentration”, – “natural log of concentration” and – “reciprocal concentration”,
the alphabetical order of the y-axis variables leads to – 0th , – 1st and – 2nd
orders respectively for that reactant.
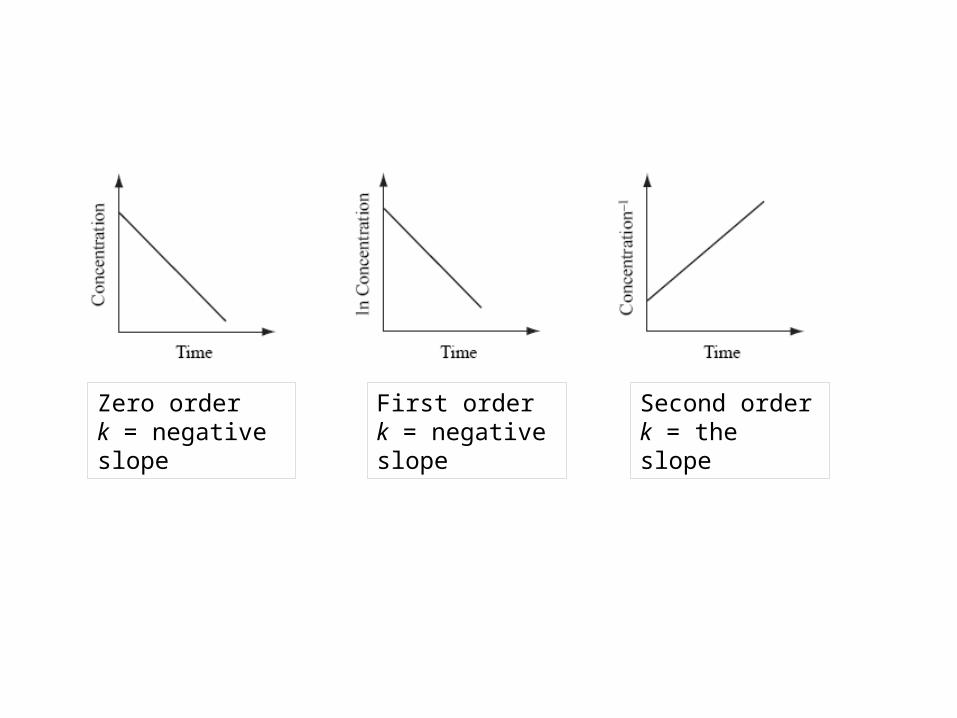
Zero orderk = negative slope
First orderk = negative slope
Second orderk = the slope
• You can now easily solve for either time or concentration once you know the order of the reactant.
• Just remember y = mx + b. • Choose the set of variables that gave you the best
straight line (r value closest to ±1) and insert them in place of x and y in the generalized equation for a straight line.
• “A” is reactant A and Ao is the initial concentration of reactant A at time zero [the y-intercept].
y = mx+ b• zero order [A] = −kt+ [Ao]
• first order ln[A] = −kt + ln [Ao]
• second order 1/[A] = kt + 1/[Ao]
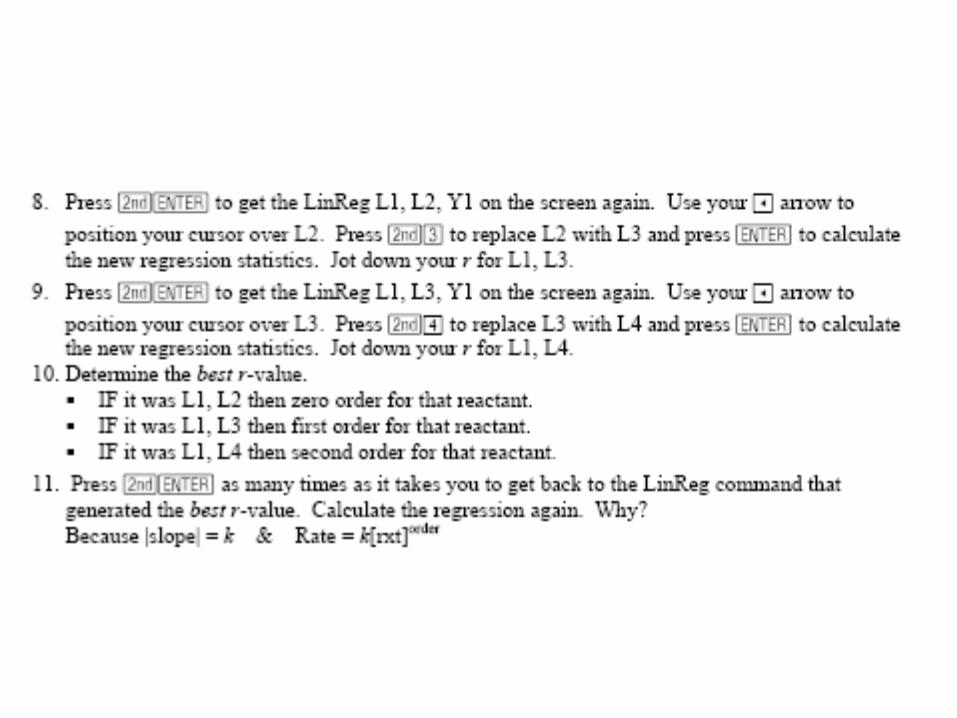
• Also recognize that lslopel= k, since the rate constant is NEVER negative. If you are asked to write the rate expression [or rate law] it is simply Rate = k[A]order you determined from analyzing the graphs
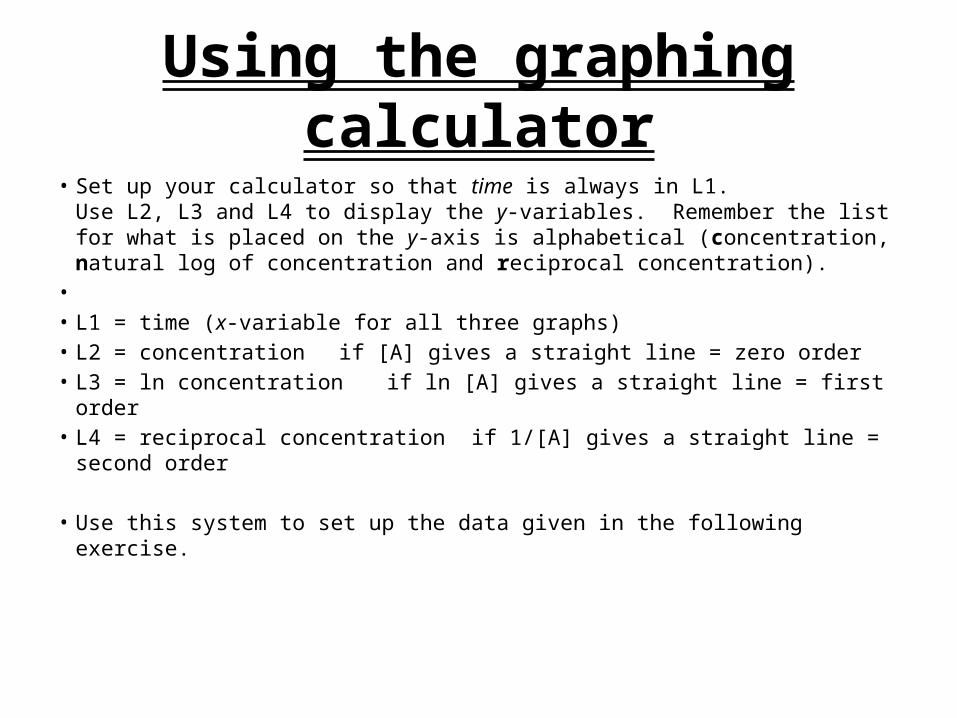
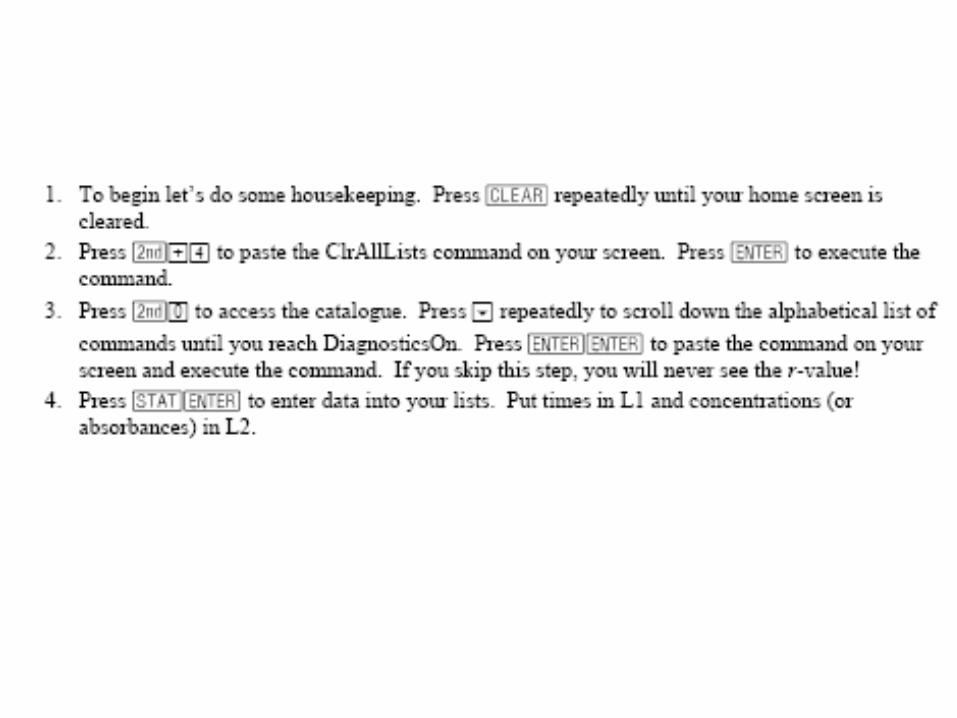
Using the graphing calculator• Set up your calculator so that time is always in L1.
Use L2, L3 and L4 to display the y-variables. Remember the list for what is placed on the y-axis is alphabetical (concentration, natural log of concentration and reciprocal concentration).
• • L1 = time (x-variable for all three graphs)• L2 = concentration if [A] gives a straight line = zero order• L3 = ln concentration if ln [A] gives a straight line = first order• L4 = reciprocal concentration if 1/[A] gives a straight line = second order
• Use this system to set up the data given in the following exercise.
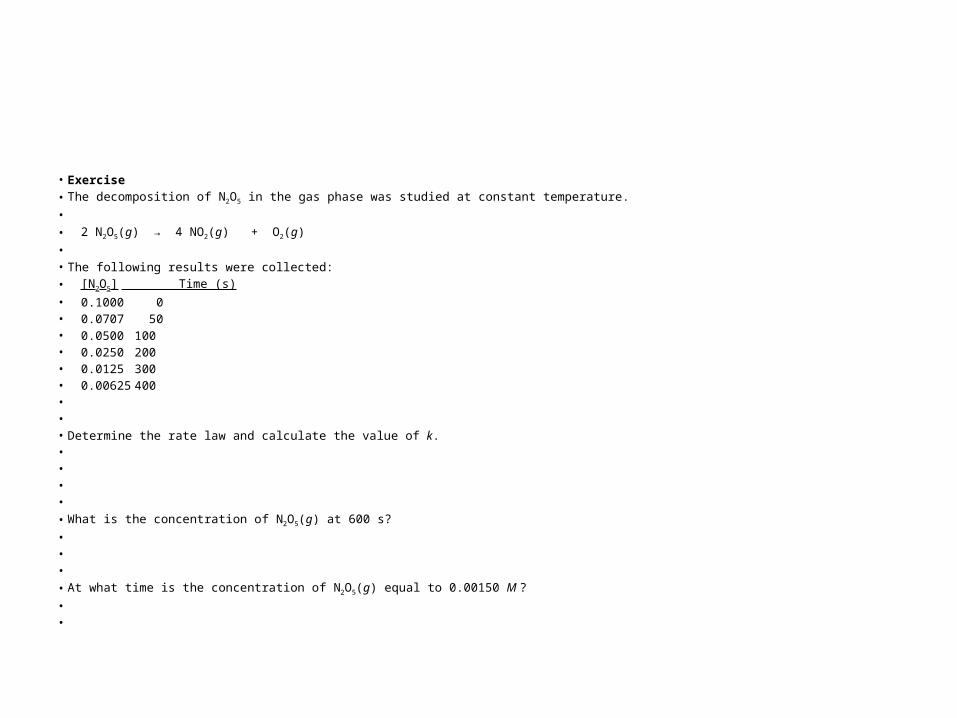
• Exercise• The decomposition of N2O5 in the gas phase was studied at constant temperature.• • 2 N2O5(g) → 4 NO2(g) + O2(g)• • The following results were collected:• [N2O5] Time (s)• 0.1000 0• 0.0707 50• 0.0500 100• 0.0250 200• 0.0125 300• 0.00625 400• • • Determine the rate law and calculate the value of k. • • • • • What is the concentration of N2O5(g) at 600 s?• • • • At what time is the concentration of N2O5(g) equal to 0.00150 M ?• •
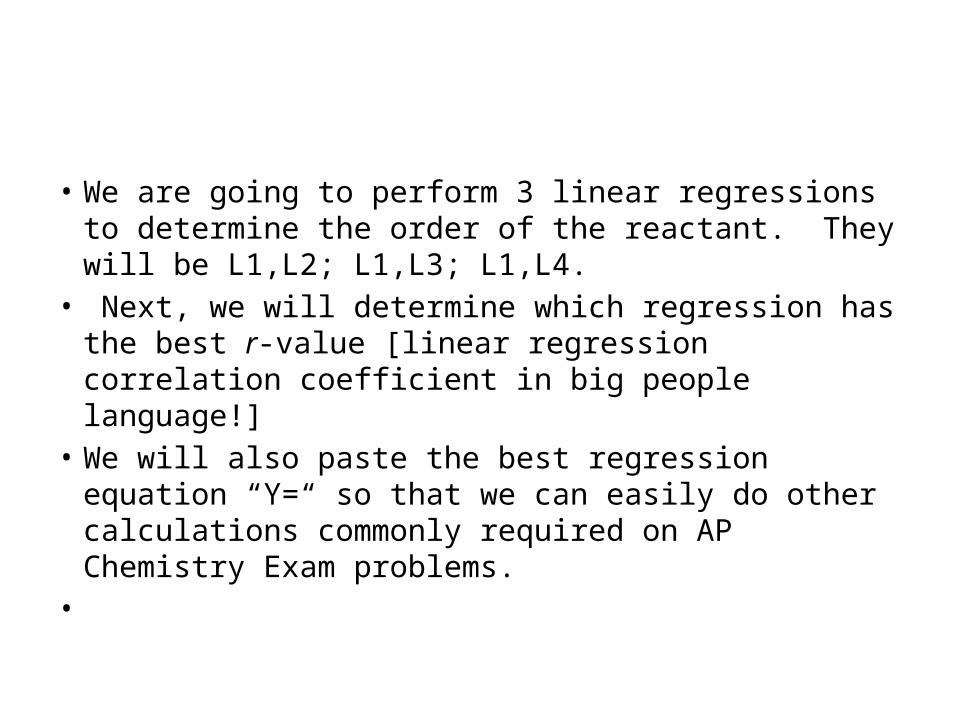
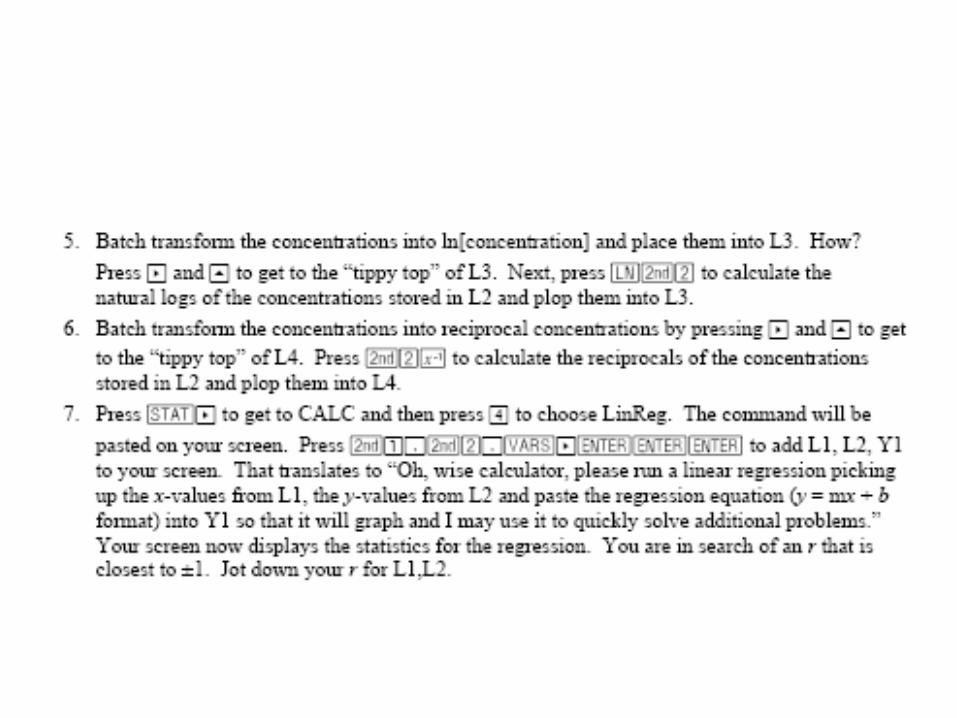
• We are going to perform 3 linear regressions to determine the order of the reactant. They will be L1,L2; L1,L3; L1,L4.
• Next, we will determine which regression has the best r-value [linear regression correlation coefficient in big people language!]
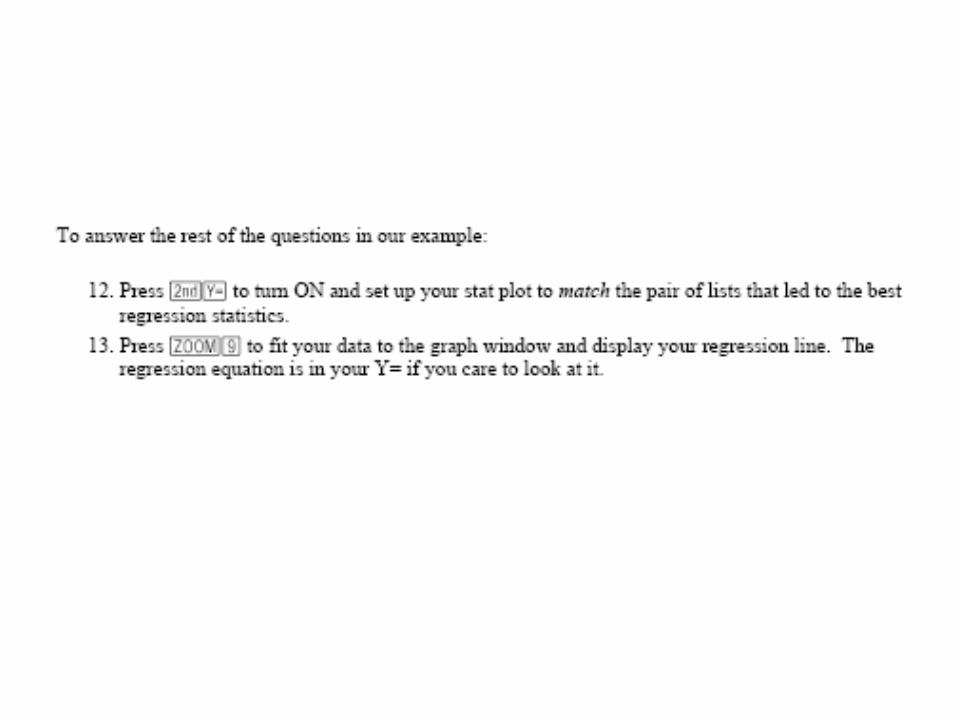
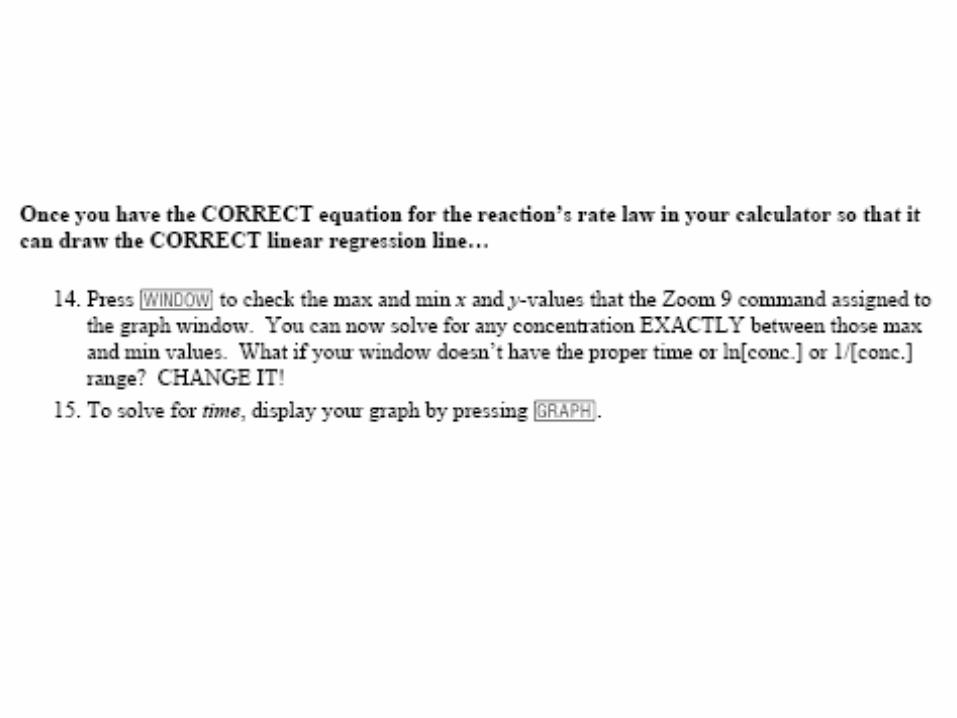
• We will also paste the best regression equation “Y=“ so that we can easily do other calculations commonly required on AP Chemistry Exam problems.
•

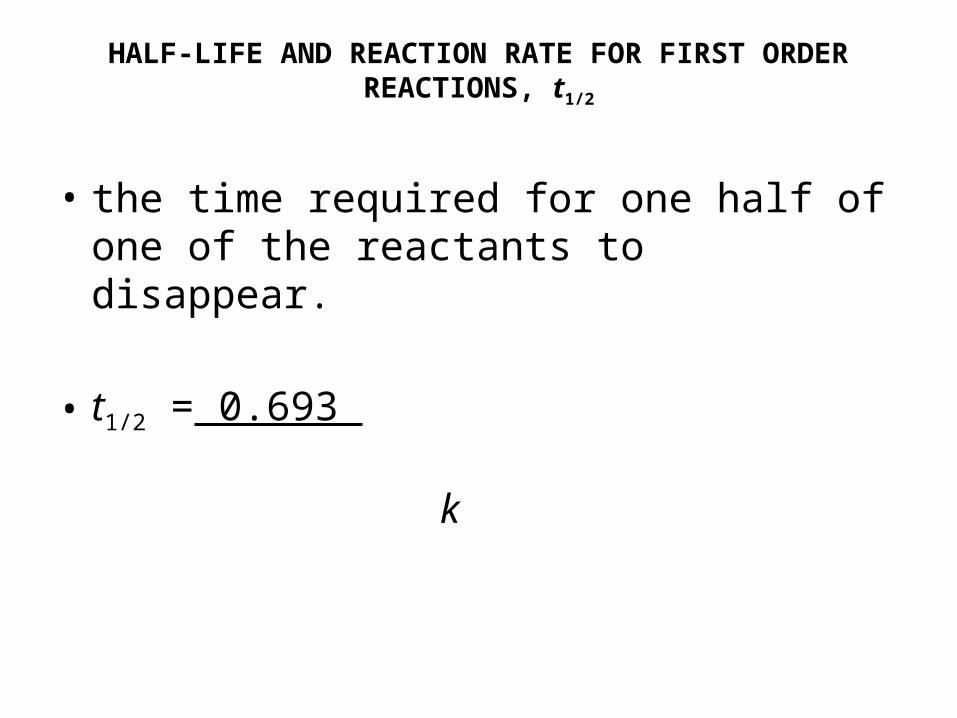
HALF-LIFE AND REACTION RATE FOR FIRST ORDER REACTIONS, t1/2
• the time required for one half of one of the reactants to disappear.
• t1/2 = 0.693
k
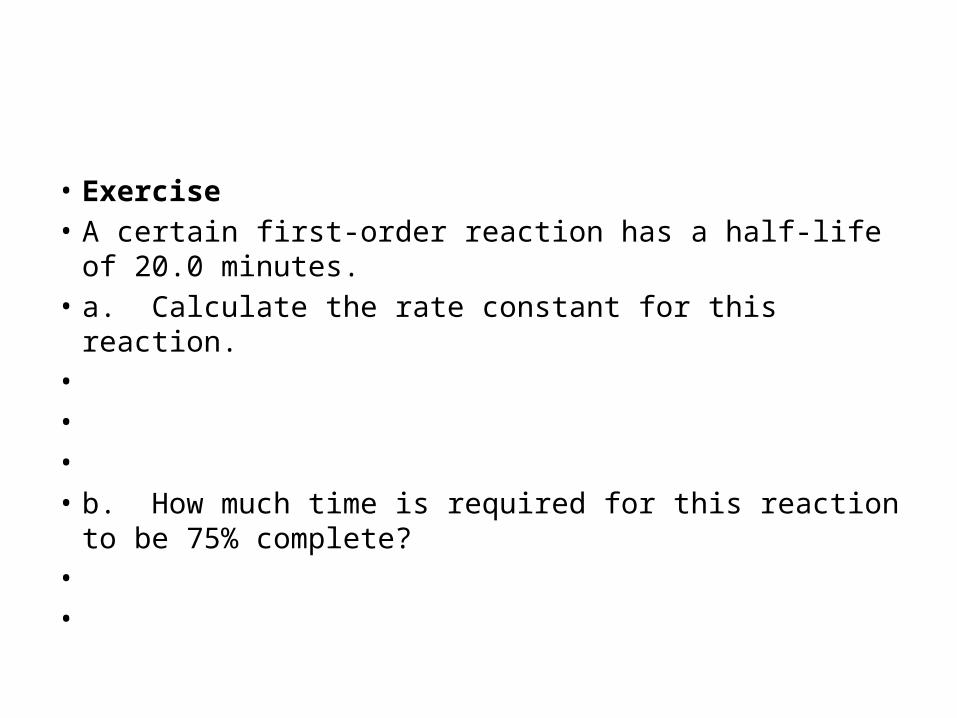
• Exercise • A certain first-order reaction has a half-life of 20.0 minutes.• a. Calculate the rate constant for this reaction.• • • • b. How much time is required for this reaction to be 75%
complete?• •
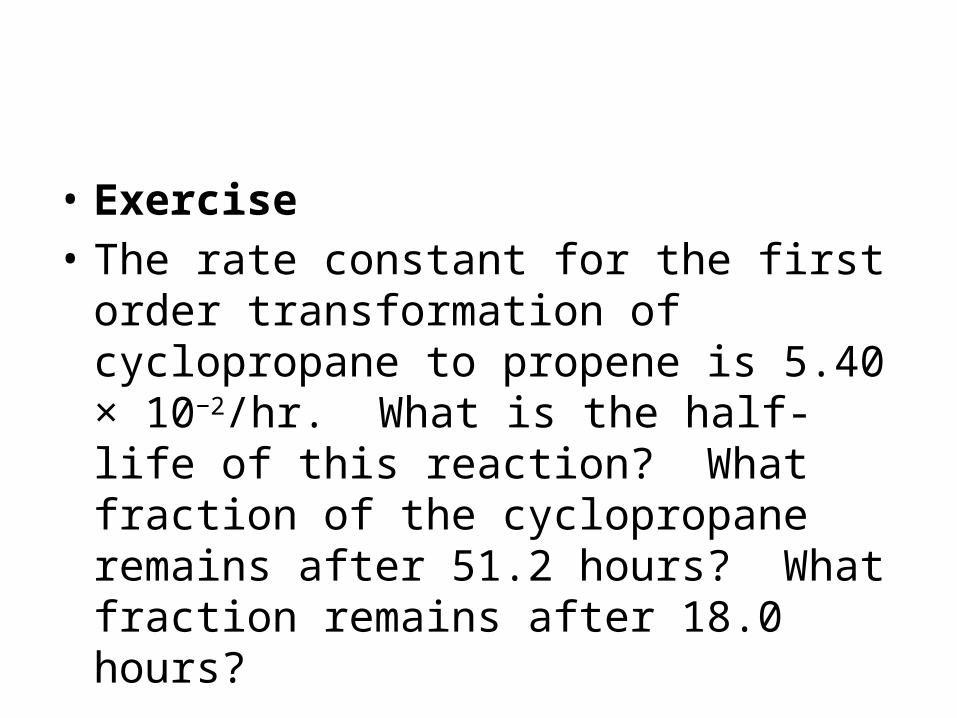
• Exercise• The rate constant for the first order
transformation of cyclopropane to propene is 5.40 × 10⁻²/hr. What is the half-life of this reaction? What fraction of the cyclopropane remains after 51.2 hours? What fraction remains after 18.0 hours?
•
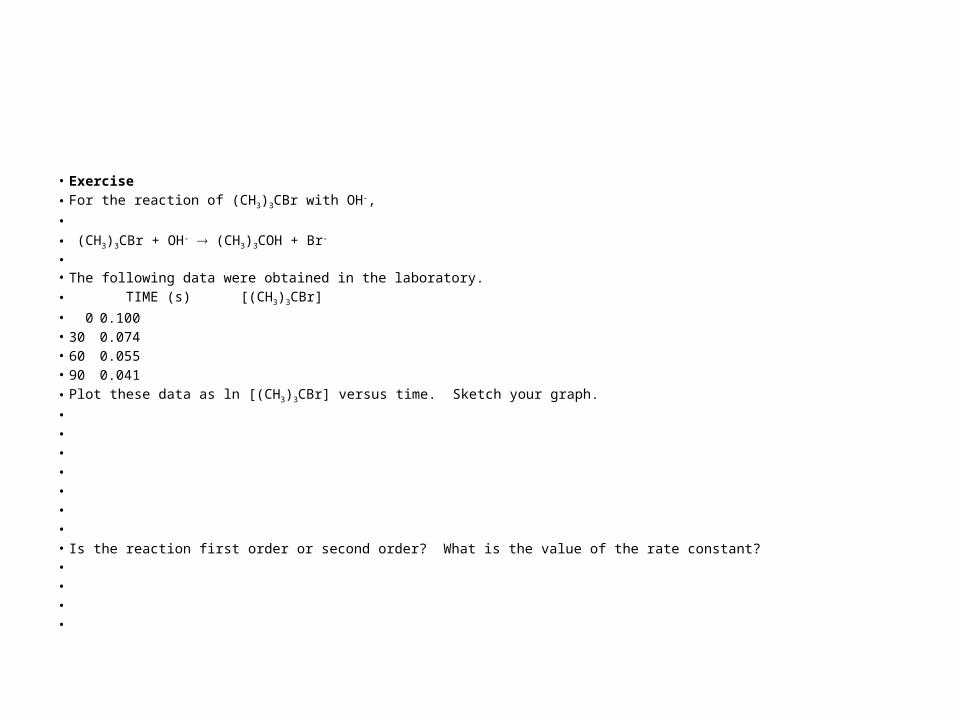
• Exercise • For the reaction of (CH3)3CBr with OH-,• • (CH3)3CBr + OH- (CH3)3COH + Br-
•
• The following data were obtained in the laboratory.• TIME (s) [(CH3)3CBr]• 0 0.100• 30 0.074• 60 0.055• 90 0.041• Plot these data as ln [(CH3)3CBr] versus time. Sketch your graph.• • • • • • • • Is the reaction first order or second order? What is the value of the rate constant?• • • •
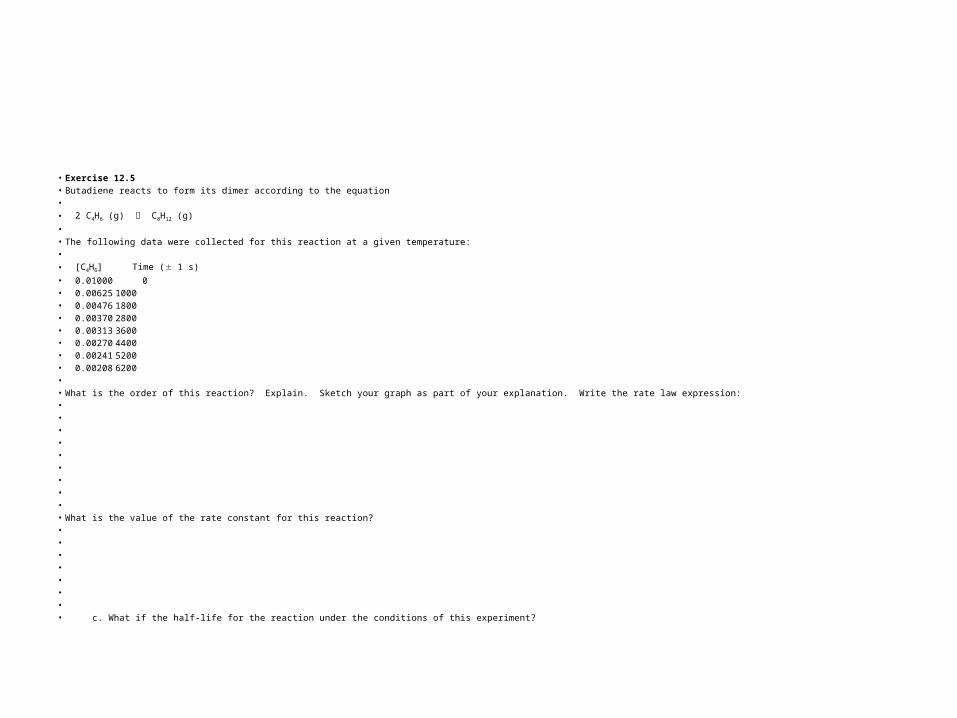
• Exercise 12.5• Butadiene reacts to form its dimer according to the equation• • 2 C4H6 (g) C8H12 (g)• • The following data were collected for this reaction at a given temperature:• • [C4H6] Time ( 1 s)• 0.01000 0• 0.00625 1000• 0.00476 1800• 0.00370 2800• 0.00313 3600• 0.00270 4400• 0.00241 5200• 0.00208 6200• • What is the order of this reaction? Explain. Sketch your graph as part of your explanation. Write the rate law expression:• • • • • • • • • • What is the value of the rate constant for this reaction?• • • • • • • • c. What if the half-life for the reaction under the conditions of this experiment?
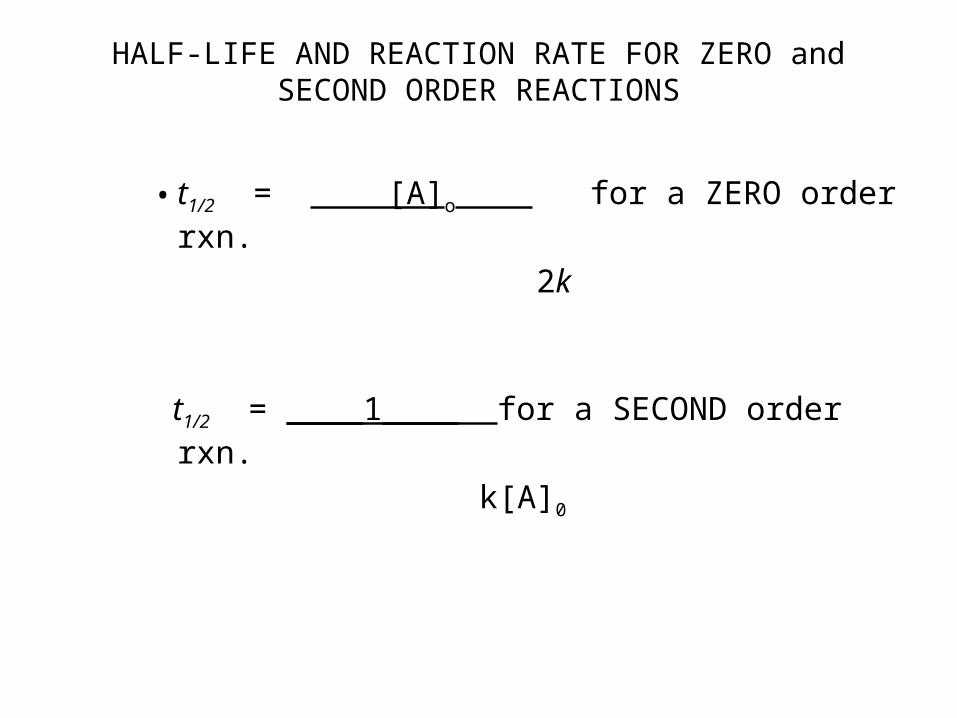
HALF-LIFE AND REACTION RATE FOR ZERO and SECOND ORDER REACTIONS
• t1/2 = [A]o for a ZERO order rxn.
2k
t1/2 = ____1____ for a SECOND order rxn.
k[A]0
• Zero-order reactions are most often encountered when a substance such as a metal surface or an enzyme is required for the reaction to occur. The enzyme or catalyst may be come saturated and therefore an increase in the [reactant/substrate] has no effect on the rate.
INTEGRATED RATE LAWS FOR REACTIONS WITH MORE THAN ONE REACTANT
• Must still be determined by experiment! But we use a technique called “swamping”.
• Flood the reaction vessel with high concentrations of all but one reactant and perform the experiment. The reactants at high concentrations like say, 1.0 M compared to the reactant with a low concentration say, 1.0 x 10⁻³ M, stay the same.
• “In English”—the rate is now dependent on the concentration of the little guy since the big guy’s aren’t changing (much), therefore the rate = k’ [little guy]
• We now re-write the rate as a pseudo-rate-law and k’ is a pseudo-rate-constant
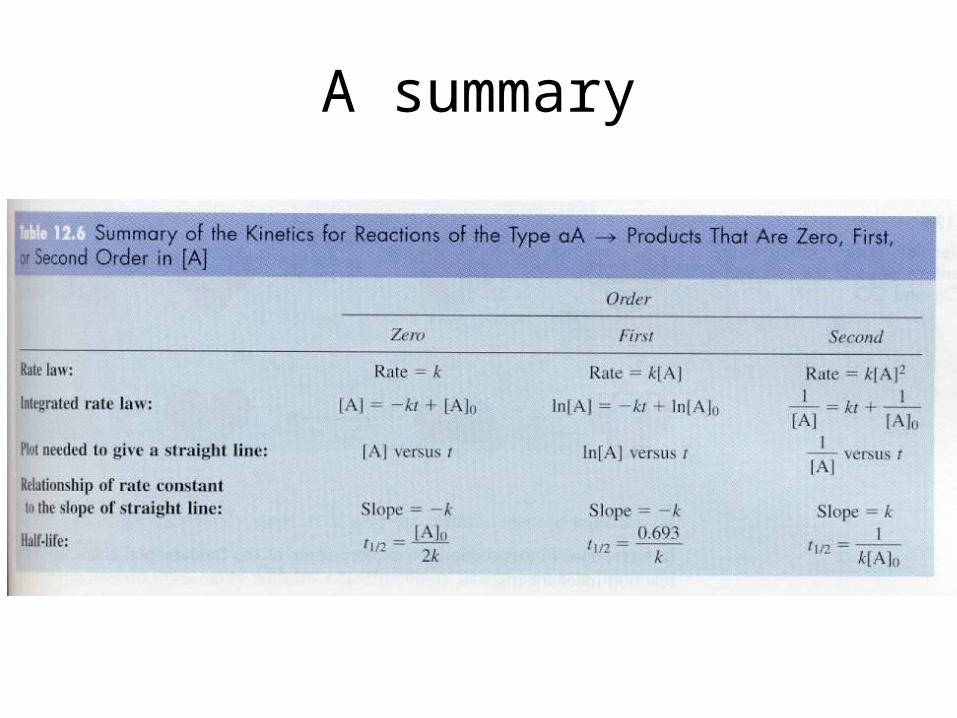
A summary
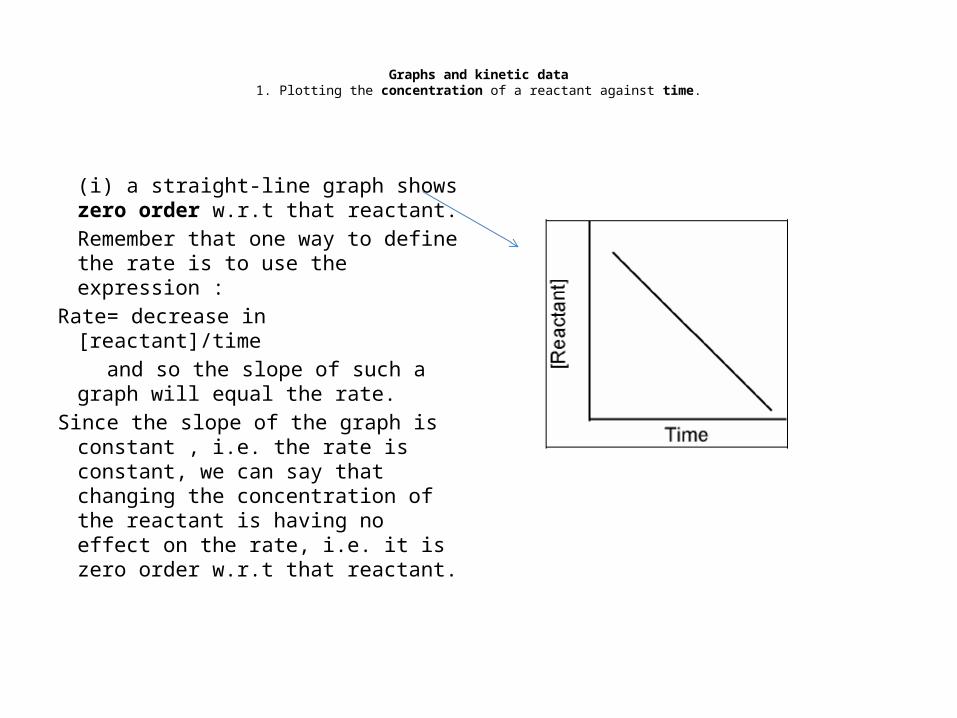
Graphs and kinetic data1. Plotting the concentration of a reactant against time.
(i) a straight-line graph shows zero order w.r.t that reactant.Remember that one way to define the rate is to use the expression :
Rate= decrease in [reactant]/time and so the slope of such a graph
will equal the rate. Since the slope of the graph is
constant , i.e. the rate is constant, we can say that changing the concentration of the reactant is having no effect on the rate, i.e. it is zero order w.r.t that reactant.
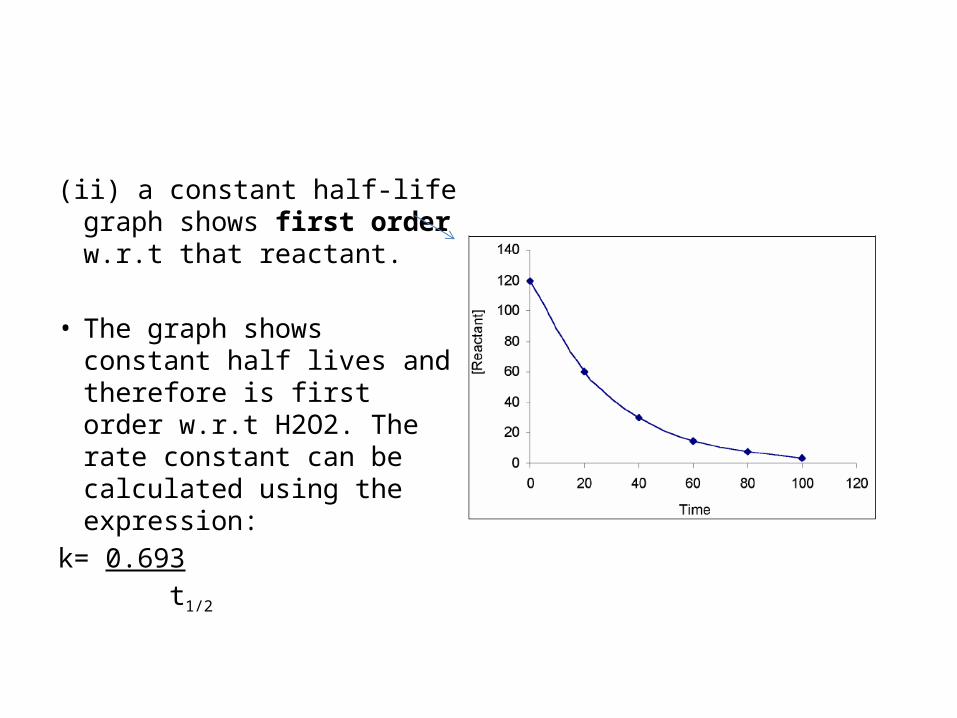
(ii) a constant half-life graph shows first order w.r.t that reactant.
• The graph shows constant half lives and therefore is first order w.r.t H2O2. The rate constant can be calculated using the expression:
k= 0.693 t1/2
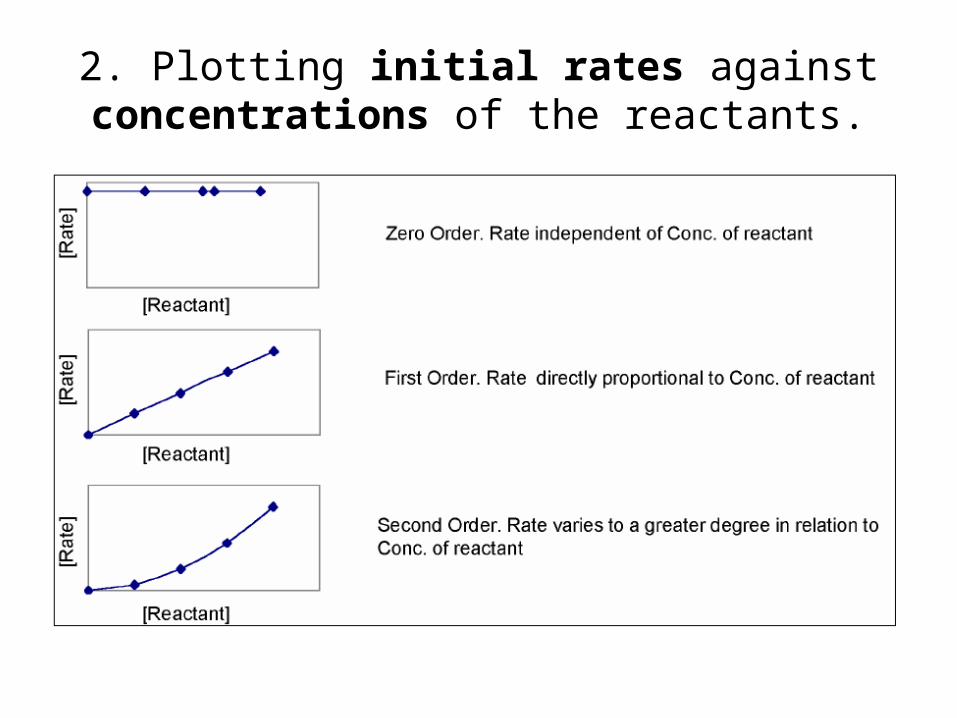
2. Plotting initial rates against concentrations of the reactants.
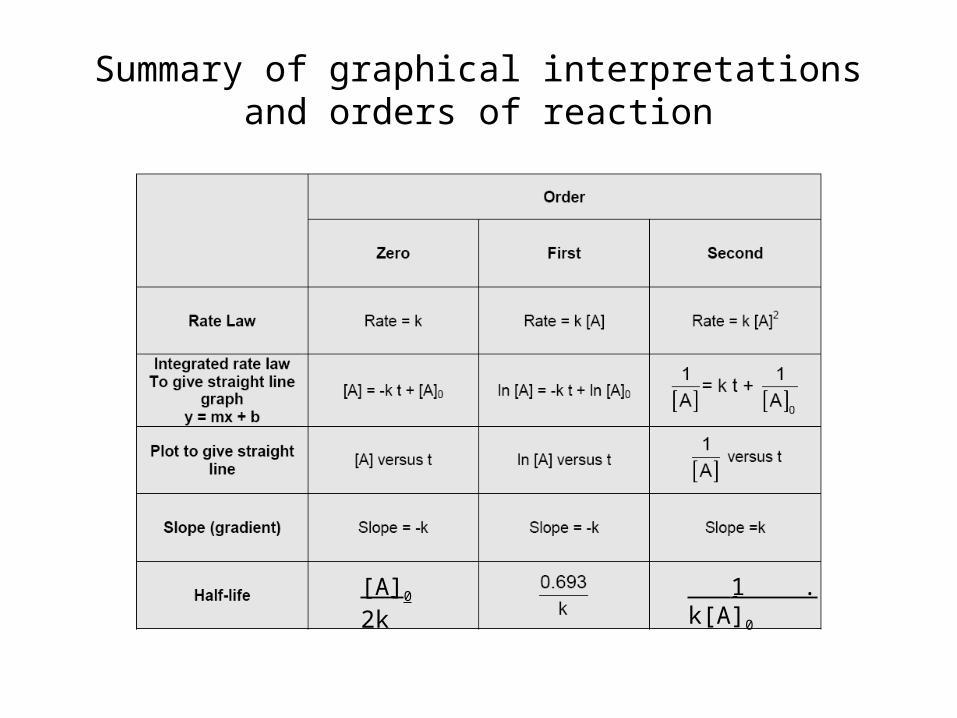
Summary of graphical interpretations and orders of reaction
[A]0
2k 1 .k[A]0


![Empirical Rate Laws [Compatibility Mode]](https://img.pdfslide.net/doc/110x75/577cc5be1a28aba7119d17cc/empirical-rate-laws-compatibility-mode.jpg)