Embed Size (px)
Citation preview
Kinetics of Changes in Oxyhemoglobin Saturation during Walking and Cycling
Tests in Chronic Obstructive Pulmonary Disease
Ming-Lung Chuang, M.D.1,2,4
; I-Feng Lin, Dr.P.H.6; and Shih-Pin Chen, M.D.
3,5
Correspondence to:
Ming-Lung Chuang, M.D.
Division of Pulmonary Medicine
Department of Critical Care Medicine
Chung Shan Medical University Hospital
#110, Section 1, Chien-Kuo North Road,
South District, Taichung 40201, Taiwan
Tel: +886-4-2473-9595 ext. 34718
E-mail: [email protected]
Running title: HbO2 Changes during Walking and Cycling in COPD
Registered at this site: Chang Gung Memorial Hospital, Taoyuan, and Chung Shan
Medical University Hospital, Taichung, Taiwan
Registration number: CMRP443 and CSHRP11144
The name of the institution(s) review board: The Institutional Review Boards of
Chang Gung Memorial Hospital and Chung Shan Medical University Hospital
Conflict of interest disclosure: None
__________________________ 1Division of Pulmonary Medicine and
2Department of Critical Care Medicine,
3Department of Internal Medicine, Chung Shan Medical University Hospital,
Taichung, Taiwan 40201, ROC 4School of Medicine,
5Institute of Medicine, Chung Shan Medical University,
Taichung, Taiwan 40201, ROC 6Institute of Public Health, National Yang Ming University, Taipei, Taiwan 112
RESPIRATORY CARE Paper in Press. Published on August 13, 2013 as DOI: 10.4187/respcare.02494
Epub ahead of print papers have been peer-reviewed and accepted for publication but are posted before being copy edited and proofread, and as a result, may differ substantially when published in final version in the online and print editions of RESPIRATORY CARE.
Copyright (C) 2013 Daedalus Enterprises
ABSTRACT
BACKGROUND AND OBJECTIVE: The patterns and kinetics of changes in
oxyhemoglobin saturation measured with pulse oximetry (∆SpO2) in six-minute
walking test (6MWT) and cycling test has not been addressed in patients with chronic
obstructive pulmonary disease (COPD). METHODS: Sixty COPD patients with
FEV1 54±18%pred were evaluated for anthropometrics, oxygen-cost diagram (OCD)
score, lung function tests, and the 6MWT and cycling test with SpO2 measurements.
The ∆SpO2 were compared within individual tests and between both tests. The
differences in the variables between desaturators and non-desaturators were compared.
RESULTS: In the 6MWT, four patterns of SpO2 developed.
Desaturation-re-saturation was the most common (46%). ∆SpO2 ≥3% occurred
approximately at 1.2 minutes and the nadir re-saturated at 3.5 min. The ∆SpO2
between the start and the nadir (∆SpO2SN) was greater than that between the start and
the end (∆SpO2SE) (p<0.0001). The desaturators had less inspiratory muscle strength
(IMS), more dyspnea, and shorter distance on the 6MWT, while the re-saturators had
greater FEV1/FVC and less functional residual capacity (all p<0.05). In the cycling
test, three patterns of SpO2 developed. Desaturation was the most common (57%).
The ∆SpO2 ≥3% and SpO2nadir occurred at 4.6 min and 6.6 min, respectively, of the
6.8-minute exercise duration. The desaturators had less body mass index, OCD score,
RESPIRATORY CARE Paper in Press. Published on August 13, 2013 as DOI: 10.4187/respcare.02494
Epub ahead of print papers have been peer-reviewed and accepted for publication but are posted before being copy edited and proofread, and as a result, may differ substantially when published in final version in the online and print editions of RESPIRATORY CARE.
Copyright (C) 2013 Daedalus Enterprises

IMS post-exercise, diffusing capacity, SpO2 and work on walking, and peak exercise
performance (all p<0.05). In both tests, the ∆SpO2SN during the 6MWT was greater
(p<0.05) but the ∆SpO2SE was similar (p=0.79). The desaturators in both tests had
lower OCD scores (p<0.01) and poorer peak exercise performance. CONCLUSIONS:
Measurement of ∆SpO2SN rather than ∆SpO2SE during the 6MWT is recommended
because ∆SpO2SN is greater and the SpO2nadir is earlier. In both exercise tests,
exertional desaturation can be predicted with the OCD scores and has more capability
to predict peak exercise performance than the 6MWT.
Key words: six-minute walking test, incremental cardio-pulmonary exercise test,
desaturation, hypoxemia, chronic obstructive pulmonary disease
RESPIRATORY CARE Paper in Press. Published on August 13, 2013 as DOI: 10.4187/respcare.02494
Epub ahead of print papers have been peer-reviewed and accepted for publication but are posted before being copy edited and proofread, and as a result, may differ substantially when published in final version in the online and print editions of RESPIRATORY CARE.
Copyright (C) 2013 Daedalus Enterprises

Introduction
Walking may induce hypoxemia or oxyhemoglobin (HbO2) desaturation
(decrease in SpO2) more profoundly than cycling does in patients with chronic
obstructive pulmonary disease (COPD).1-5 Differences in change (∆) in PaO2 or SpO2
between the two exercise modes are due to utilizing different muscle groups for
ventilatory compensations for exercise demand.1, 3, 6, 7
However, results of previous
reports are inconsistent,8, 9
perhaps due to differences in the definitions of desaturation,
modes of exercise, and patient populations.10
Patterns and kinetics of SpO2 during different modes of exercise may also
influence the magnitude of ∆SpO2. There are three types of changes in SpO2 during
the six-minute walk test (6MWT) in different individual studies: desaturated,
non-desaturated,4 and re-saturated during the last few minutes,
4, 9, 11 but are rarely
reported in a single study. ∆SpO2 during 6MWT may be influenced by various stages
of COPD4, 12, 13
and by different protocols in conducting the test, which is
self-pacing,14 conducted with “neutral” verbal encouragement, and with allowed rest.
5,
11 In contrast, ∆SpO2 during incremental cycling test may be influenced by various
stages of COPD15, 16
but may rarely be influenced by different protocols conducting
the test, which is computer-controlled, conducted with verbal encouragement,
continuous to symptom-limited exhaustion.
RESPIRATORY CARE Paper in Press. Published on August 13, 2013 as DOI: 10.4187/respcare.02494
Epub ahead of print papers have been peer-reviewed and accepted for publication but are posted before being copy edited and proofread, and as a result, may differ substantially when published in final version in the online and print editions of RESPIRATORY CARE.
Copyright (C) 2013 Daedalus Enterprises
We hypothesized that three types of ∆SpO2 may occur in one individual study
and the nadir of SpO2 may occur midway during the 6MWT, so merely taking the
PaO27 or SpO2
17 at the start and the end of exercise (SE) may be inappropriate.
11 This
study aimed to investigate how the patterns and kinetics of ∆SpO2 in these patients
differ in each mode of exercise and between both modes, and how the clinical
characteristics differ between patients with and without HbO2 desaturation.
Methods
Study design
A cohort of COPD patients underwent the 6MWT and symptom-limited cycling
test in random order. Changes in their SpO2 and the other variables during the tests
were compared.
Subjects
The diagnosis of COPD was based on the criteria set by the Global Initiative for
Chronic Obstructive Lung Disease (GOLD).18 All of the patients were clinically stable
for one month before undergoing the two exercise tests, which were conducted within
two weeks. Patients were excluded if they had significant co-morbidities, needed
home oxygen therapy, or participated in any physical training program during this
study. The Institutional Review Boards of Chang Gung Memorial Hospital and Chung
RESPIRATORY CARE Paper in Press. Published on August 13, 2013 as DOI: 10.4187/respcare.02494
Epub ahead of print papers have been peer-reviewed and accepted for publication but are posted before being copy edited and proofread, and as a result, may differ substantially when published in final version in the online and print editions of RESPIRATORY CARE.
Copyright (C) 2013 Daedalus Enterprises
Shan Medical University Hospital approved this study and all of the participants
provided written informed consent.
Protocols and measurements
Oxygen-cost diagram (OCD). The OCD was used as a scale for daily activities
assessed by the patients themselves. The patients were asked to indicate a point on an
OCD, a 100-mm long vertical line with everyday activities listed alongside the line,
spaced according to the oxygen requirement associated with the performance of each
task, above which their breathlessness limited them.19 The distance from zero was
measured and scored.
Pulmonary function testing. Pulmonary function tests to identify COPD were
performed before the exercise tests. The forced vital capacity (FVC), forced expired
volume in one second (FEV1), forced expired flow rate from 25-75% of vital capacity
(FEF25-75), total lung capacity (TLC), and residual volume (RV) were measured by
pressure-sensitive body plethysmography (6200 Autobox DL, Sensormedics, Yorba
Linda, CA, USA). The best of three technically satisfactory readings was used.20, 21
All lung function data were obtained after inhaling 400 µg of fenoterol HCl. The
diffusing capacity for carbon monoxide (DLCO) was measured using the single-breath
technique. Simple volume calibration was done using a 3-L syringe before each test.
RESPIRATORY CARE Paper in Press. Published on August 13, 2013 as DOI: 10.4187/respcare.02494
Epub ahead of print papers have been peer-reviewed and accepted for publication but are posted before being copy edited and proofread, and as a result, may differ substantially when published in final version in the online and print editions of RESPIRATORY CARE.
Copyright (C) 2013 Daedalus Enterprises
The maximum inspiratory pressure (MIP), indicating inspiratory muscle strength,
was measured at RV with a nose clip and a forceful inspiratory maneuver leading to
sustained maximal effort for 1-3 sec, and followed by natural release upon fatigue
(Micro Medical RPM, Rochester, Kent, UK). Maximum expiratory pressure (MEP),
for expiratory muscle strength, was measured at TLC. Both MIP and MEP were
performed thrice before and after the cycling test, with a 1-minute recovery period in
between. The best result was recorded for analysis.
Six-minute Walking Test. The walking tests were conducted in a
temperature-controlled 20-meter corridor. Blood pressure and breathing frequency
were measured. The perceived exertion was measured using a modified Borg score22
at rest, midway through, and at the end of the walk. The 6MWT was conducted with
the help of verbal encouragement as per the American Thoracic Society
recommendations.14 The SpO2 and pulse rate readings were continuously determined
by pulse oximetry (Ohmeda or Nellcor) to maximize the signal and minimize motion
artifacts. The signals were stable before the recording, and then stored and printed as
4-sec averages. However, the data in this report were for each minute only.
The pulse oximeters were validated by arterial blood gas analysis.12 Patterns of
∆SpO2 were identified and classified independently by two investigators. Consensus
was reached after discussion if there were any discrepancies. The ∆SpO2 was reported
RESPIRATORY CARE Paper in Press. Published on August 13, 2013 as DOI: 10.4187/respcare.02494
Epub ahead of print papers have been peer-reviewed and accepted for publication but are posted before being copy edited and proofread, and as a result, may differ substantially when published in final version in the online and print editions of RESPIRATORY CARE.
Copyright (C) 2013 Daedalus Enterprises

as ∆SpO2SN or the ∆SpO2SE. The minimal clinically significant difference (MCSD) of
SpO2 was defined as a decrease ≥3% from the start of the exercise.12
Each patient performed the 6MWT twice, with >30 min rest in between. The
longest distance walked was recorded in meters and then converted to work of
walking (D⋅W) by multiplying the distance in kilometers by the body weight in
kilograms.9
Maximum cardio-pulmonary exercise testing. After a 2-minute rest from the
mounting on the bike, each patient began a 2-minute unloaded cycling followed by a
ramp-pattern exercise test to the limit of tolerance using a computer-controlled and
electronic-braked cycle ergometer (Medical Graphics or Vmax). Work rate was
selected at a slope of 5-20 watts per min according to pre-determined fitness based on
a derived protocol formula.23
Heart rate, SpO2, oxygen uptake (V& O2) (ml/min), CO2 output (V& CO2) (ml/min),
V& E, blood pressure, and Borg score were measured. Pulse rate and SpO2 were
measured continuously by pulse oximetry (Ohmeda, or Nonin 7500). Calibrations of
the preVentTM
or mass flow pneumotachograph were performed using a 3-L syringe
before each test. The O2 and CO2 analyzers were calibrated with standard gases.
Statistical analysis
Data were summarized as mean±standard deviation (SD). Unpaired and paired
RESPIRATORY CARE Paper in Press. Published on August 13, 2013 as DOI: 10.4187/respcare.02494
Epub ahead of print papers have been peer-reviewed and accepted for publication but are posted before being copy edited and proofread, and as a result, may differ substantially when published in final version in the online and print editions of RESPIRATORY CARE.
Copyright (C) 2013 Daedalus Enterprises

t-tests were used to compare the means of variables between the two independent
groups and two dependent groups, respectively. One-way ANOVA was used to
compare the three groups of consistent changes in the variables. All tests were
two-sided and statistical significance was set at p<0.05. All statistical analyses were
performed using the SAS version 9 (SAS Institute Inc.) and Microcal Origin v 4.0
(Northampton).
Sample size and power calculations. The changes in ∆SpO2 between at-start and
nadir (∆SpO2SN) of the 6MWT were the primary outcomes. We estimated that a
sample size of 21 participants in each group would be required to detect a MCSD in
∆SpO2 of 3% with a standard deviation of the change of 4%9, statistical power of 0.90
and alpha =0.05 using the Power Analysis and Sample Size (NCSS, LLC, Utah,
U.S.A.).
RESULTS
Sixty patients with COPD (59 men), aged 66.7±6.9 years and with a body mass
index (BMI) of 22.4±3.7 kg/m2 were enrolled (Table 1). Thirty-seven were recruited
from Chang Gung Memorial Hospital and 23 from Chung Shan Medical University
Hospital. Most had stage II or stage III COPD, with elevated static air trapping and
mildly impaired diffusing capacity.
Six-minute walk test
RESPIRATORY CARE Paper in Press. Published on August 13, 2013 as DOI: 10.4187/respcare.02494
Epub ahead of print papers have been peer-reviewed and accepted for publication but are posted before being copy edited and proofread, and as a result, may differ substantially when published in final version in the online and print editions of RESPIRATORY CARE.
Copyright (C) 2013 Daedalus Enterprises

All patients completed the 6MWT but three were excluded due to unstable
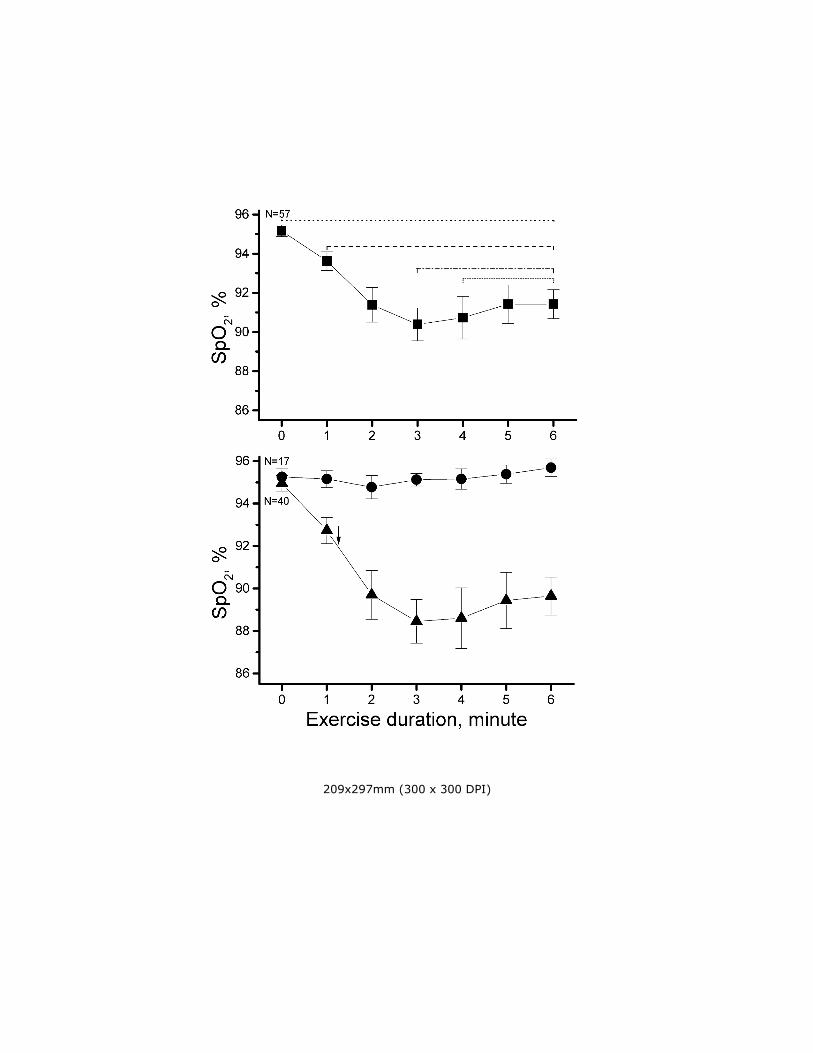
baseline recording. Overall, the ∆SpO2SE was 3.7±5.1% (p<0.0001) (Table 2; Fig. 1)
and 70% of patients presented with desaturation, with the MCSD detected at 1.2 min
(Fig. 1, lower panel, p<0.0001). The desaturation group was further separated into
three sub-groups: three out of 57 patients (5%) who desaturated after the 3rd minute;
26 (46%) who desaturated 7.8±5.6% (∆SpO2SN) (p<0.0001) (Table 2; Fig. 2) from the
start of walking to the nadir, and then re-saturated at 3.5±1.4 min; and 11 (19%) who
desaturated immediately after the start of walking but did not re-saturate. The
∆SpO2SE was less than the ∆SpO2SN (p<0.0001).
Forty patients (70%) with desaturation during walking had significantly less
inspiratory muscle strength (p=0.01), more breathless perception (p=0.03), and less
walking distance (p=0.05) than those without desaturation (Table 3). Patients with
desaturation-re-saturation had greater FEV1/FVC (p=0.01) and less air trapping
(p<0.05) than those with desaturation.
Cycling test
Fifty of the 60 patients completed the symptom-limited cycling test. Thirteen
were excluded (10 did not want to perform the test and three had technical difficulties)
so SpO2 analysis was performed in 47 patients (Table 2).
There were two typical patterns of SpO2 during the cycling test (Fig. 3). Two
RESPIRATORY CARE Paper in Press. Published on August 13, 2013 as DOI: 10.4187/respcare.02494
Epub ahead of print papers have been peer-reviewed and accepted for publication but are posted before being copy edited and proofread, and as a result, may differ substantially when published in final version in the online and print editions of RESPIRATORY CARE.
Copyright (C) 2013 Daedalus Enterprises
patients who presented with irregular patterns of ∆SpO2 were not shown in Figure 3.
In total, 27 of 47 patients (57%) desaturated during the cycling test. Desaturation was
initially detected in approximately 30% of the loaded exercise (i.e., approximately 2
min of the total 6.8 min exercise duration). The MCSD was detected at 68% of the
loaded exercise (i.e., approximately 4.6 min of the total exercise duration) and the
nadir at 97% (i.e., 6.6 min of the total exercise duration) (Table 2; Fig. 3). Patients
who desaturated had lower BMI and OCD score, poorer lung function, more
tachypnea and perceived breathlessness, and lower work of walking during the
6MWT. They also had poorer cardio-pulmonary function during the peak exercise test
(Table 4).
Comparisons between the two exercise tests
The SpO2 was significantly different between the two exercise tests at the start of
the loaded exercise (p<0.0001) (Table 2). The difference in ∆SpO2SN was significant
(p=0.02) but not the difference in ∆SpO2SE (p=0.79). The timing of MCSD and the
nadir of SpO2 was much earlier in the 6MWT than in the cycling test (1.2 min and 3.5
min vs. 4.6 min and 6.6 min, respectively) (both p<0.0001).
More patients had MCSD during the 6MWT than the cycling test (40 vs. 27) but
the difference was insignificant (p=NS). Moreover, 64% (n=30) had consistent ∆SpO2
in both tests (Table 5). Those with desaturation in both modes of exercise (i.e., DD
RESPIRATORY CARE Paper in Press. Published on August 13, 2013 as DOI: 10.4187/respcare.02494
Epub ahead of print papers have been peer-reviewed and accepted for publication but are posted before being copy edited and proofread, and as a result, may differ substantially when published in final version in the online and print editions of RESPIRATORY CARE.
Copyright (C) 2013 Daedalus Enterprises

type) had poorer OCD score (p<0.01) and cardio-pulmonary function at peak exercise
(p=0.04 to 0.006) (Table 5). Thus, the OCD score might predict exertional
desaturation in both sub-maximal and maximum exercise testing.
DISCUSSION
The present study has several important findings. First, in the 6MWT, the
∆SpO2SN was much greater than the ∆SpO2SE (Fig. 1; Table 2). Between the 6MWT
and cycling test, the ∆SpO2SN during the 6MWT was greater (Figs. 1 and 3; Table 2).
Second, the timing of MCSD (i.e., ∆SpO2 ≥3%) and the nadir of SpO2 occurred much
earlier in the 6MWT than in the cycling test (1.2 and 3.5 min vs. 4.6 and 6.6 min,
respectively; both p<0.0001). Continuous monitoring and recording of SpO2 and
∆SpO2SN during the entire 6MWT is more appropriate than merely taking ∆SpO2SE.
Six-minute walk test
The SpO2 measurement for patients with COPD during the 6MWT has been
recommended for routine use because of the high incidence of desaturation5, 24
and the
related severity25 and mortality.
26 In the ATS guidelines, it is an optional
measurement.14
In this study, there are four patterns of SpO2 changes (Figs. 1 and 2). Twenty-six
(46%) patients re-saturating during the second half of the 6MWT had better
RESPIRATORY CARE Paper in Press. Published on August 13, 2013 as DOI: 10.4187/respcare.02494
Epub ahead of print papers have been peer-reviewed and accepted for publication but are posted before being copy edited and proofread, and as a result, may differ substantially when published in final version in the online and print editions of RESPIRATORY CARE.
Copyright (C) 2013 Daedalus Enterprises
FEV1/FVC and smaller FRC than patients without re-saturation (both p<0.05; Table
3). These patients may have slowed down on their own volition, or even rested, to
compensate for ventilation when the SpO2 reached nadir. This is supported by a recent
study.11 Nonetheless, walking-induced desaturation remained steady despite taking a
rest.5
This issue of measuring ∆SpO2SN during the entire 6MWT has not been raised
until recently by Fiore et al.11 However, ∆SpO2SN during the 6MWT is greater and
∆SpO2SE is smaller in this study than in Fiore’s study (7.8% vs. 7% and 3.7% vs. 6%,
respectively). The proportion of patients with re-saturation is greater in this study than
in Fiore’s study (26/40 vs. 5/22, p=0.001). They did not present the kinetic of SpO2
changes during the 6MWT.
The time to desaturation in the 6MWT predicts 24-hour SpO2 changes in COPD
patients with a PaO2 between 60 and 70 mm Hg.27 Exertional desaturation after the
first minute of the 6MWT forecasts a 74% probability of desaturation in daily
activities, while exertional desaturation after 3.5 minutes of the 6MWT negatively
predicts (100%) desaturation in whole-day events.27 However, most previous studies
report ∆SpO2SE4, 8, 17, 28
or ∆PaO2SE,7 but no differences in ∆SpO2SE or ∆PaO2SE
between the two modes of exercise have been reported in previous studies7, 8 and in
the present one. A previous study measured SpO2 on the 3rd minute, but the nadir
RESPIRATORY CARE Paper in Press. Published on August 13, 2013 as DOI: 10.4187/respcare.02494
Epub ahead of print papers have been peer-reviewed and accepted for publication but are posted before being copy edited and proofread, and as a result, may differ substantially when published in final version in the online and print editions of RESPIRATORY CARE.
Copyright (C) 2013 Daedalus Enterprises
might not occur exactly on the 3rd minute, thereby missing the point.
4
Those with desaturation had marginally lower OCD score and diffusing capacity
and significantly weaker inspiratory muscle strength, and more dyspnea, shorter
distance walked, and relative tachycardia during the walking test (all p=0.07 to <0.05;
Table 3). One previous study reported that the mean SpO2 during the 6MWT was
modestly related to lung function (DLCO, FEV1/FVC, and peak flow rate, r=0.48-0.55)
but not related to perceived breathlessness and the distance walked.29 Another study
reported that the resting SpO2 was significantly related to FEV1 and the distance
walked5 and to FEV1 plus FEF25-75%
30. The sensitivity and specificity of exertional
desaturation were 75% when DLCO threshold was set at 60%pred.31 DLCO >80%pred
plus resting SpO2 has been used to exclude the evolution of exertional desaturation32.
The disagreement in the variables of lung function, dyspnea score, and the walking
performance in relation to SpO2 between the study and the previous reports might be
due to the different definition of SpO2 and COPD populations.10
Cycling Test
Non-desaturation may be due to increased ventilation and improved Q/V &&
matching. The mechanisms of SpO2 desaturation are related to hypoventilation
secondary to airway obstruction,4, 12, 33
decreased mixed venous PO2, deterioration of
Q/V && matching and diffusing capacity, and increased shunting,10, 33
but not necessarily
RESPIRATORY CARE Paper in Press. Published on August 13, 2013 as DOI: 10.4187/respcare.02494
Epub ahead of print papers have been peer-reviewed and accepted for publication but are posted before being copy edited and proofread, and as a result, may differ substantially when published in final version in the online and print editions of RESPIRATORY CARE.
Copyright (C) 2013 Daedalus Enterprises
to increased pulmonary vascular resistance.34
In this study, BMI, OCD score, lung function (including peak flow rate and
DLCO), perceived breathlessness, HbO2 saturation, and work of walking during the
6MWT, and cardio-pulmonary function at peak exercise are worse in those with
desaturation (Table 4). This is partly consistent with previous reports, as exertional
desaturation is predicted by FEV1 <35%pred plus DLCO <35%pred15 and is excluded by
DLCO >55%pred15 or FEV1/FVC >0.5 plus DLCO >20 ml/min/mm Hg
16. After the
cycling test, the inspiratory muscles are weaker in patients with desaturation (Table 4),
indicating that HbO2 saturation may influence the recovery of inspiratory muscles
after exercise. This might be concomitantly due to intercostal muscle blood flow
limitation during intense exercise as shown using near infra-red spectroscopy.35
Exertional desaturation during a maximum exercise test may be significantly related
to poorer anthropometrics and lung function at rest, and impacts on the exercise
capability of daily activities and on sub-maximal and maximum exercises.
6MWT versus Cycling Test
At the start of the 6MWT, SpO2 was significantly lower (p<0.0001; Table 2),
which is consistent with another report.2 It is possible that there is relatively more
hyperventilation triggered by unloaded pedaling during the cycling test than that
triggered by standing ready for the walking test. Unfortunately, ventilation during the
RESPIRATORY CARE Paper in Press. Published on August 13, 2013 as DOI: 10.4187/respcare.02494
Epub ahead of print papers have been peer-reviewed and accepted for publication but are posted before being copy edited and proofread, and as a result, may differ substantially when published in final version in the online and print editions of RESPIRATORY CARE.
Copyright (C) 2013 Daedalus Enterprises
walking test was not measured for comparison.
The work load in the cycling test increased more slowly than in the walking test.
An incremental cycling test ideally lasts for 10 min, hence 85% of the maximum
exercise intensity takes 8.5 minutes. In contrast, the intensity of walking is
approximately 85% of the maximum exercise intensity for patients with COPD.9 The
timing of reaching asymptote of heart rate change during the 6MWT reportedly
develops by the 3rd minute, as in constant work-rate exercise.
8 In turn, the exercise
intensity of the early phase of 6MWT is much heavier than that of the cycling test.
Consequently, the 6MWT causes earlier HbO2 desaturation, if ever, than the cycling
test (MCSD and nadir time, 1.2 and 3.5 min vs. 4.6 and 6.6 min, respectively) (Table
2; Figs. 1 and 3).
The re-saturation that occurs in the 6MWT does not happen in the cycling test.
The cycling test is considered an external pacing exercise mode wherein the load is
increased regularly and smoothly by a computer, while the walking test is an internal
pacing exercise mode controlled by the patients themselves. The notion is compatible
with a previous report that re-saturation develops after rest.11
Poulain et al. reported three sub-groups of COPD patients based on significant
HbO2 desaturation in both the 6MWT and the cycling test (DD), in neither test (NN)
and in the 6MWT alone (DND).4 The present study has more DD patients and fewer
RESPIRATORY CARE Paper in Press. Published on August 13, 2013 as DOI: 10.4187/respcare.02494
Epub ahead of print papers have been peer-reviewed and accepted for publication but are posted before being copy edited and proofread, and as a result, may differ substantially when published in final version in the online and print editions of RESPIRATORY CARE.
Copyright (C) 2013 Daedalus Enterprises

NN patients (p<0.001), and four unique NDD-types (i.e., desaturation in the cycling
test alone). The patients here may have more severe airway obstruction than those in
Poulain’s study.4
Poulain et al. also reported that the severity of FEV1/FVC was related to the
agreement in occurrence of HbO2 desaturation between the 6MWT and cycling test.4
The DD sub-group had the lowest FEV1/FVC while the NN sub-group had the highest.
This relationship is not seen in the present study. Body height and OCD scores are
significantly related across the DD, DND-NDD, and NN sub-groups (Table 5).
Patients in the DD sub-group have significantly less active daily lives, suggesting that
the OCD score can predict exertional HbO2 desaturation in both exercise modes;
diffusing capacity plays only a marginally significant role. The discrepancies between
the study and Poulain’s study are perhaps due to the various speeds and volitional
rests in the 6MWT (Tables 3-5).
Study Limitations
There are concerns regarding the accuracy of measuring SpO2 by pulse
oximetry.36, 37
The pulse oximeters used in the study were validated by arterial blood
gas analysis.12 The pattern of heart rate readings remained constantly exponential
when there was SpO2 re-saturation. Extraction of arterial blood during the field walk
test is technically difficult in the prompt collection of arterial blood at the end of the
RESPIRATORY CARE Paper in Press. Published on August 13, 2013 as DOI: 10.4187/respcare.02494
Epub ahead of print papers have been peer-reviewed and accepted for publication but are posted before being copy edited and proofread, and as a result, may differ substantially when published in final version in the online and print editions of RESPIRATORY CARE.
Copyright (C) 2013 Daedalus Enterprises

walking test. This problem may cause the inconsistency in the previous reports.1, 3, 7
In
a previous study, blood that was immediately sampled within 15 sec after the end of
walking showed insignificant difference in PaO2 between the 6MWT and cycling
test.7 However, two other reports demonstrated significant differences in PaO2.
1, 3
Sampling blood within 15 seconds is technically demanding and inappropriate as it
was shown in this study that SpO2 re-saturated significantly within 16±14.1 sec
during the recovery phase of the cycling test. Although arterial blood sampling during
the treadmill walking test is feasible, the test is an external pacing modality unlike the
field walking test. Earlobe blood sampling is an alternative and is less invasive,4 but it
has questionable accuracy.38 Pursed lips breathing
39 could not be evaluated on the
6MWT as the study was not designed for this. Lastly, the 6MWT performance was
not significantly different across the DD, DND-NDD, and NN sub-groups (Table 5)
but was different between the non-desaturation and desaturation sub-groups (Table 3),
suggesting a grouping effect. The DND and NDD (n=4) sub-groups were combined
because of their small sample sizes.
CONCLUSIONS
Monitoring of SpO2 and recording of the ∆SpO2Start-Nadir during the entire
six-minute walk test is recommended because ∆SpO2Start-Nadir is greater than
RESPIRATORY CARE Paper in Press. Published on August 13, 2013 as DOI: 10.4187/respcare.02494
Epub ahead of print papers have been peer-reviewed and accepted for publication but are posted before being copy edited and proofread, and as a result, may differ substantially when published in final version in the online and print editions of RESPIRATORY CARE.
Copyright (C) 2013 Daedalus Enterprises
∆SpO2Start-End and the timing of SpO2nadir during the 6MWT occurs earlier compared to
the cycling test. Oxygen-cost diagram scores can predict the agreement in occurrence
of SpO2 changes in both tests. Exertional desaturation in both tests can predict a
poorer peak exercise performance than a walking performance.
RESPIRATORY CARE Paper in Press. Published on August 13, 2013 as DOI: 10.4187/respcare.02494
Epub ahead of print papers have been peer-reviewed and accepted for publication but are posted before being copy edited and proofread, and as a result, may differ substantially when published in final version in the online and print editions of RESPIRATORY CARE.
Copyright (C) 2013 Daedalus Enterprises
Acknowledgments
This study was supported in part by the Chung Shan Medical University
Research Program (No. CS11144) and Chang Gung Medical Research Program
(CMRP No. 443).
RESPIRATORY CARE Paper in Press. Published on August 13, 2013 as DOI: 10.4187/respcare.02494
Epub ahead of print papers have been peer-reviewed and accepted for publication but are posted before being copy edited and proofread, and as a result, may differ substantially when published in final version in the online and print editions of RESPIRATORY CARE.
Copyright (C) 2013 Daedalus Enterprises

REFERENCES
1. Palange P, Forte S, Onorati P, Manfredi F, Serra P, Carlone S. Ventilatory and
metabolic adaptations to walking and cycling in patients with COPD. J Appl
Physiol 2000;88(5):1715-1720.
2. Hill K, Dolmage TE, Woon L, Coutts D, Goldstein R, Brooks D. Comparing
peak and submaximal cardiorespiratory responses during field walking tests
with incremental cycle ergometry in COPD. Respirology 2012;17(2):278-284.
3. Mahler DA, Gifford AH, Waterman LA, Ward J, Machala S, Baird JC.
Mechanism of greater oxygen desaturation during walking compared with
cycling in patients with COPD. Chest 2011;140(2):351-358.
4. Poulain M, Durand F, Palomba B, Ceugniet F, Desplan J, Varray A, et al.
6-minute walk testing is more sensitive than maximal incremental cycle
testing for detecting oxygen desaturation in patients with COPD. Chest
2003;123(5):1401-1407.
5. Spence DP, Hay JG, Carter J, Pearson MG, Calverley PM. Oxygen
desaturation and breathlessness during corridor walking in chronic obstructive
pulmonary disease: effect of oxitropium bromide. Thorax
1993;48(11):1145-1150.
6. Chilibeck PD, Paterson DH, Smith WD, Cunningham DA. Cardiorespiratory
kinetics during exercise of different muscle groups and mass in old and young.
J Appl Physiol 1996;81(3):1388-1394.
7. Troosters T, Vilaro J, Rabinovich R, Casas A, Barbera JA, Rodriguez-Roisin R,
et al. Physiological responses to the 6-min walk test in patients with chronic
obstructive pulmonary disease. Eur Respir J 2002;20(3):564-569.
8. Casas A, Vilaro J, Rabinovich R, Mayer A, Barbera JA, Rodriguez-Roisin R,
et al. Encouraged 6-min walking test indicates maximum sustainable exercise
in COPD patients. Chest 2005;128(1):55-61.
9. Chuang ML, Lin IF, Wasserman K. The body weight-walking distance product
as related to lung function, anaerobic threshold and peak VO2 in COPD
patients. Respir Med 2001;95(7):618-626.
10. Panos RJ, Eschenbacher W. Exertional desaturation in patients with chronic
obstructive pulmonary disease. Copd 2009;6(6):478-487.
11. Fiore C, Lee A, McDonald C, Hill C, Holland A. Should oxyhaemoglobin
saturation be monitored continuously during the 6-minute walk test? Chron
Respir Dis 2013;8(3):181-184.
12. Chuang ML, Lin IF, Vintch JR, Ho BS, Chao SW, Ker JJ. Significant
exercise-induced hypoxaemia with equivocal desaturation in patients with
RESPIRATORY CARE Paper in Press. Published on August 13, 2013 as DOI: 10.4187/respcare.02494
Epub ahead of print papers have been peer-reviewed and accepted for publication but are posted before being copy edited and proofread, and as a result, may differ substantially when published in final version in the online and print editions of RESPIRATORY CARE.
Copyright (C) 2013 Daedalus Enterprises
chronic obstructive pulmonary disease. Intern Med J 2006;36(5):294-301.
13. Minh VD, Lee HM, Dolan GF, Light RW, Bell J, Vasquez P. Hypoxemia
during exercise in patients with chronic obstructive pulmonary disease. Am
Rev Respir Dis 1979;120(4):787-794.
14. ATS. ATS statement: guidelines for the six-minute walk test. Am J Respir Crit
Care Med 2002;166(1):111-1117.
15. Owens GR, Rogers RM, Pennock BE, Levin D. The diffusing capacity as a
predictor of arterial oxygen desaturation during exercise in patients with
chronic obstructive pulmonary disease. N Engl J Med
1984;310(19):1218-1221.
16. Ries AL, Farrow JT, Clausen JL. Pulmonary function tests cannot predict
exercise-induced hypoxemia in chronic obstructive pulmonary disease. Chest
1988;93(3):454-459.
17. Turner SE, Eastwood PR, Cecins NM, Hillman DR, Jenkins SC. Physiologic
responses to incremental and self-paced exercise in COPD: a comparison of
three tests. Chest 2004;126(3):766-773.
18. GOLD C. Global Strategy for the Diagnosis, Management, and Prevention of
Chronic Obstructive Pulmonary Disease (revised 2011). Disclosure forms for
GOLD Committees are posted on the GOLD Website, www.goldcopd.org
2011.
19. McGavin CR, Artvinli M, Naoe H, McHardy GJ. Dyspnoea, disability, and
distance walked: comparison of estimates of exercise performance in
respiratory disease. Br Med J 1978;2(6132):241-243.
20. Miller MR, Crapo R, Hankinson J, Brusasco V, Burgos F, Casaburi R, et al.
General considerations for lung function testing. Eur Respir J
2005;26(1):153-161.
21. Miller MR, Hankinson J, Brusasco V, Burgos F, Casaburi R, Coates A, et al.
Standardisation of spirometry. Eur Respir J 2005;26(2):319-338.
22. Borg G. Psychophysical bases of perceived exertion. Med Sci Sports Exercise
1982;14:377-381.
23. Chuang ML, Lee CH, Lin IF. Using the oxygen-cost diagram in ramp-slope
selection for dyspneic patients. Intern Med 2010;49(14):1325-1332.
24. Jenkins S, Cecins N. Six-minute walk test: observed adverse events and
oxygen desaturation in a large cohort of patients with chronic lung disease.
Intern Med J 2011;41(5):416-422.
25. Cutaia M, Brehm R, Cohen M. The relationship of the BODE index to oxygen
saturation during daily activities in patients with chronic obstructive
pulmonary disease. Lung 2011;189(4):269-277.
RESPIRATORY CARE Paper in Press. Published on August 13, 2013 as DOI: 10.4187/respcare.02494
Epub ahead of print papers have been peer-reviewed and accepted for publication but are posted before being copy edited and proofread, and as a result, may differ substantially when published in final version in the online and print editions of RESPIRATORY CARE.
Copyright (C) 2013 Daedalus Enterprises

26. Casanova C, Cote C, Marin JM, Pinto-Plata V, de Torres JP, Aguirre-Jaime A,
et al. Distance and oxygen desaturation during the 6-min walk test as
predictors of long-term mortality in patients with COPD. Chest
2008;134(4):746-752.
27. Garcia-Talavera I, Garcia CH, Macario CC, de Torres JP, Celli BR,
Aguirre-Jaime A. Time to desaturation in the 6-min walking distance test
predicts 24-hour oximetry in COPD patients with a PO2 between 60 and
70mmHg. Respir Med 2008;102(7):1026-1032.
28. Luxton N, Alison JA, Wu J, Mackey MG. Relationship between field walking
tests and incremental cycle ergometry in COPD. Respirology
2008;13(6):856-862.
29. Mak VH, Bugler JR, Roberts CM, Spiro SG. Effect of arterial oxygen
desaturation on six minute walk distance, perceived effort, and perceived
breathlessness in patients with airflow limitation. Thorax 1993;48(1):33-38.
30. Gunen H, Kosar F. Spirometric predictors for the exclusion of severe
hypoxemia in chronic obstructive pulmonary disease. Can Respir J
2001;8(4):245-249.
31. Hadeli KO, Siegel EM, Sherrill DL, Beck KC, Enright PL. Predictors of
oxygen desaturation during submaximal exercise in 8,000 patients. Chest
2001;120(1):88-92.
32. D'Urzo AD, Mateika J, Bradley DT, Li D, Contreras MA, Goldstein RS.
Correlates of arterial oxygenation during exercise in severe chronic
obstructive pulmonary disease. Chest 1989;95(1):13-17.
33. Gallagher CG. Exercise limitation and clinical exercise testing in chronic
obstructive pulmonary disease. Clin Chest Med 1994;15(2):305-326.
34. Christensen CC, Ryg MS, Edvardsen A, Skjonsberg OH. Relationship between
exercise desaturation and pulmonary haemodynamics in COPD patients. Eur
Respir J 2004;24(4):580-586.
35. Vogiatzis I, Athanasopoulos D, Habazettl H, Aliverti A, Louvaris Z,
Cherouveim E, et al. Intercostal muscle blood flow limitation during exercise
in chronic obstructive pulmonary disease. Am J Respir Crit Care Med
2010;182(9):1105-1113.
36. Barthelemy JC, Geyssant A, Riffat J, Antoniadis A, Berruyer J, Lacour JR.
Accuracy of pulse oximetry during moderate exercise: a comparative study.
Scand J Clin Lab Invest 1990;50(5):533-539.
37. Yamaya Y, Bogaard HJ, Wagner PD, Niizeki K, Hopkins SR. Validity of pulse
oximetry during maximal exercise in normoxia, hypoxia, and hyperoxia. J
Appl Physiol 2002;92(1):162-168.
RESPIRATORY CARE Paper in Press. Published on August 13, 2013 as DOI: 10.4187/respcare.02494
Epub ahead of print papers have been peer-reviewed and accepted for publication but are posted before being copy edited and proofread, and as a result, may differ substantially when published in final version in the online and print editions of RESPIRATORY CARE.
Copyright (C) 2013 Daedalus Enterprises
38. Eaton T, Rudkin S, Garrett JE. The clinical utility of arterialized earlobe
capillary blood in the assessment of patients for long-term oxygen therapy.
Respir Med 2001;95(8):655-660.
39. Faager G, Stahle A, Larsen FF. Influence of spontaneous pursed lips breathing
on walking endurance and oxygen saturation in patients with moderate to
severe chronic obstructive pulmonary disease. Clin Rehabil
2008;22(8):675-683.
RESPIRATORY CARE Paper in Press. Published on August 13, 2013 as DOI: 10.4187/respcare.02494
Epub ahead of print papers have been peer-reviewed and accepted for publication but are posted before being copy edited and proofread, and as a result, may differ substantially when published in final version in the online and print editions of RESPIRATORY CARE.
Copyright (C) 2013 Daedalus Enterprises

LEGEND
Figure 1. Upper panel: SpO2 (%) as a function of exercise duration (min) during the
six-minute walk test in 57 patients with COPD after excluding three patients due
to technical difficulties in pulse oximetry. Solid square: group mean; bars:
standard errors. Lower panel: Patients with (n=40) and those without
desaturation (n=17). Solid circle: group mean of patients without desaturation;
solid triangle: group mean of patients with desaturation; bars: standard errors;
arrows: minimal clinically significant desaturation (i.e., ≥3%); dotted line: all
p<0.0001, comparisons of the mean SpO2 of each minute with the zero time
point; dashed line: all p<0.001 to <0.01, comparisons of the mean SpO2 of each
minute with the 1st minute; dotted-dashed line: both p<0.05, comparisons of the
mean SpO2 of the 5th and 6
th min with the 3
rd min; short dotted line: both p<0.01
to <0.05, comparisons of the mean SpO2 of the 5th and 6
th min with the 4
th min.
Figure 2. SpO2 (%) as a function of exercise duration (min) during the six-minute
walk test in 40 COPD patients with SpO2 desaturation. The patients were divided
into three subgroups based on the patterns of SpO2 changes. Upper panel: Solid
square: the group mean of SpO2 desaturation after the 3rd minute of exercise; bars:
standard errors; dashed line: all p<0.05, comparisons of the mean SpO2 with the
3rd minute. Middle panel: Solid square: the group mean of SpO2 desaturation
RESPIRATORY CARE Paper in Press. Published on August 13, 2013 as DOI: 10.4187/respcare.02494
Epub ahead of print papers have been peer-reviewed and accepted for publication but are posted before being copy edited and proofread, and as a result, may differ substantially when published in final version in the online and print editions of RESPIRATORY CARE.
Copyright (C) 2013 Daedalus Enterprises
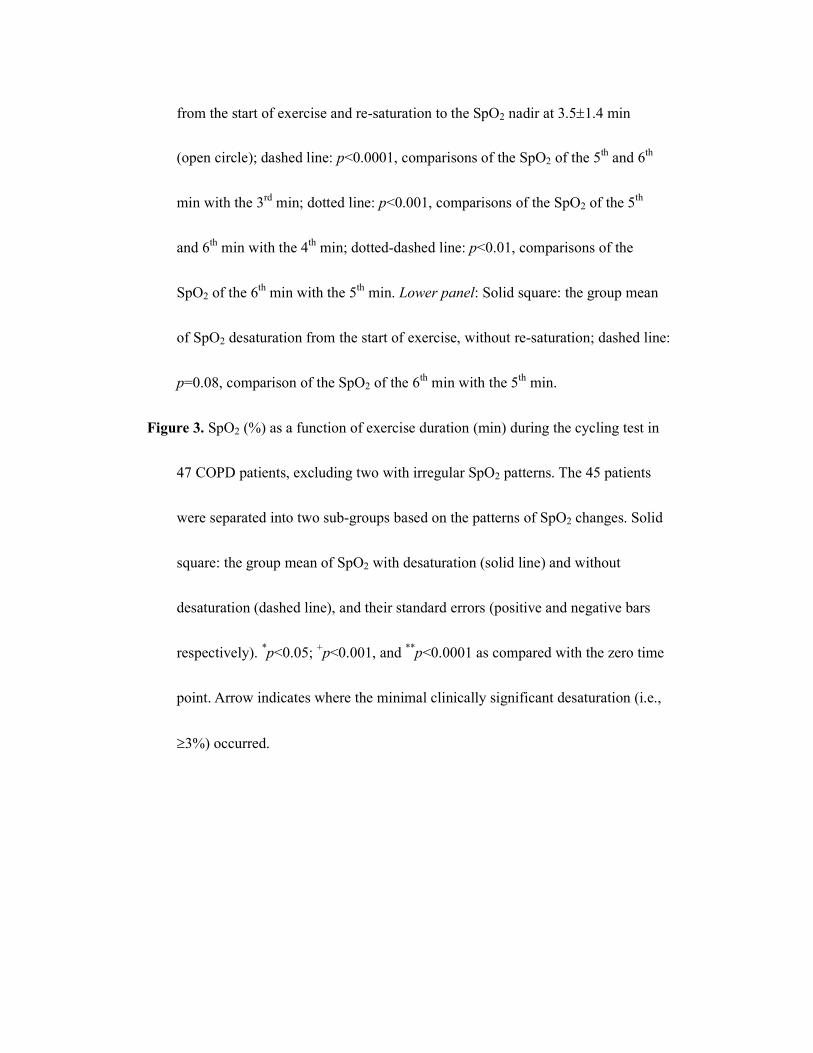
from the start of exercise and re-saturation to the SpO2 nadir at 3.5±1.4 min
(open circle); dashed line: p<0.0001, comparisons of the SpO2 of the 5th and 6
th
min with the 3rd min; dotted line: p<0.001, comparisons of the SpO2 of the 5
th
and 6th min with the 4
th min; dotted-dashed line: p<0.01, comparisons of the
SpO2 of the 6th min with the 5
th min. Lower panel: Solid square: the group mean
of SpO2 desaturation from the start of exercise, without re-saturation; dashed line:
p=0.08, comparison of the SpO2 of the 6th min with the 5
th min.
Figure 3. SpO2 (%) as a function of exercise duration (min) during the cycling test in
47 COPD patients, excluding two with irregular SpO2 patterns. The 45 patients
were separated into two sub-groups based on the patterns of SpO2 changes. Solid
square: the group mean of SpO2 with desaturation (solid line) and without
desaturation (dashed line), and their standard errors (positive and negative bars
respectively). *p<0.05;
+p<0.001, and
**p<0.0001 as compared with the zero time
point. Arrow indicates where the minimal clinically significant desaturation (i.e.,
≥3%) occurred.
RESPIRATORY CARE Paper in Press. Published on August 13, 2013 as DOI: 10.4187/respcare.02494
Epub ahead of print papers have been peer-reviewed and accepted for publication but are posted before being copy edited and proofread, and as a result, may differ substantially when published in final version in the online and print editions of RESPIRATORY CARE.
Copyright (C) 2013 Daedalus Enterprises
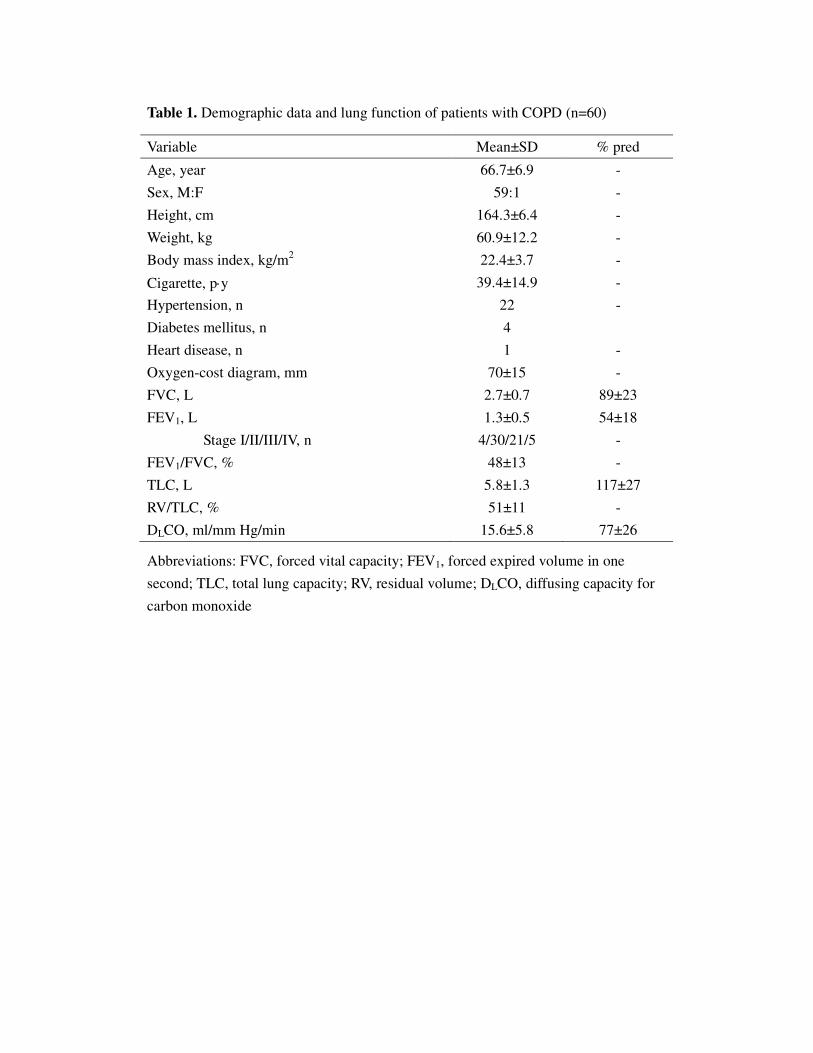
Table 1. Demographic data and lung function of patients with COPD (n=60)
Variable Mean±SD % pred
Age, year 66.7±6.9 -
Sex, M:F 59:1 -
Height, cm 164.3±6.4 -
Weight, kg 60.9±12.2 -
Body mass index, kg/m2 22.4±3.7 -
Cigarette, p⋅y 39.4±14.9 -
Hypertension, n 22 -
Diabetes mellitus, n 4
Heart disease, n 1 -
Oxygen-cost diagram, mm 70±15 -
FVC, L 2.7±0.7 89±23
FEV1, L 1.3±0.5 54±18
Stage I/II/III/IV, n 4/30/21/5 -
FEV1/FVC, % 48±13 -
TLC, L 5.8±1.3 117±27
RV/TLC, % 51±11 -
DLCO, ml/mm Hg/min 15.6±5.8 77±26
Abbreviations: FVC, forced vital capacity; FEV1, forced expired volume in one
second; TLC, total lung capacity; RV, residual volume; DLCO, diffusing capacity for
carbon monoxide
RESPIRATORY CARE Paper in Press. Published on August 13, 2013 as DOI: 10.4187/respcare.02494
Epub ahead of print papers have been peer-reviewed and accepted for publication but are posted before being copy edited and proofread, and as a result, may differ substantially when published in final version in the online and print editions of RESPIRATORY CARE.
Copyright (C) 2013 Daedalus Enterprises
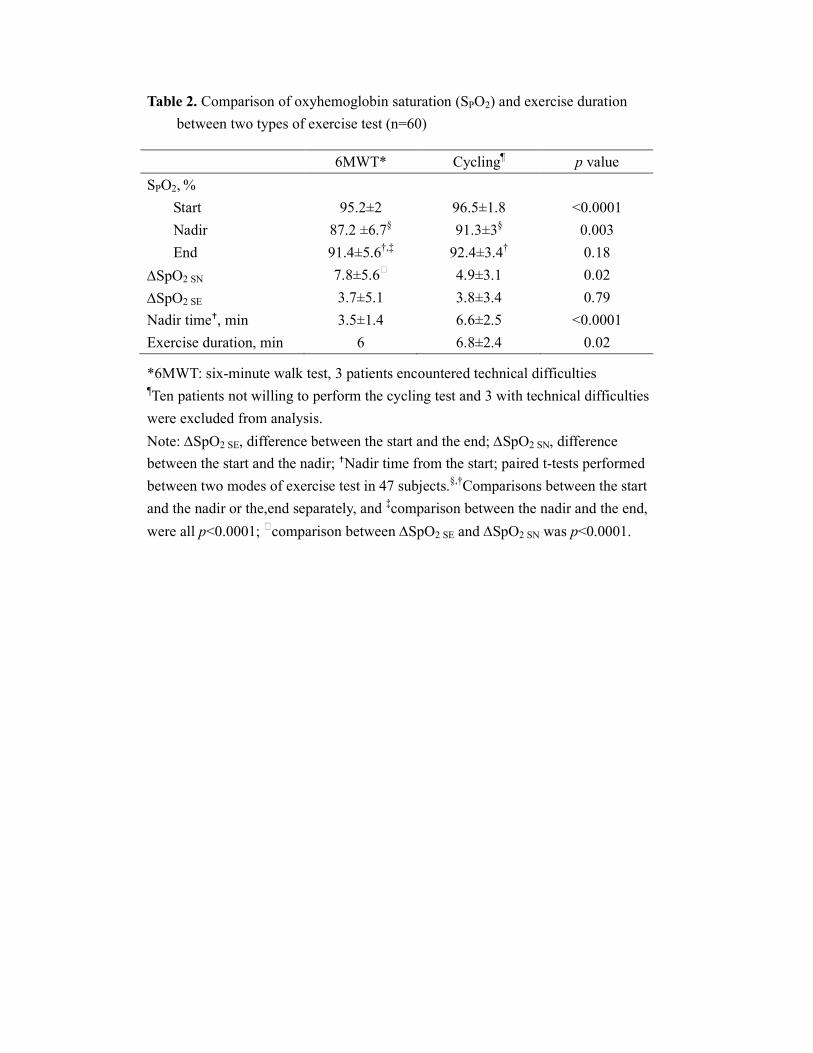
Table 2. Comparison of oxyhemoglobin saturation (SPO2) and exercise duration
between two types of exercise test (n=60)
6MWT* Cycling¶ p value
SPO2, %
Start 95.2±2 96.5±1.8 <0.0001
Nadir 87.2 ±6.7§ 91.3±3
§ 0.003
End 91.4±5.6†,‡ 92.4±3.4
† 0.18
∆SpO2 SN 7.8±5.68 4.9±3.1 0.02
∆SpO2 SE 3.7±5.1 3.8±3.4 0.79
Nadir time�, min 3.5±1.4 6.6±2.5 <0.0001
Exercise duration, min 6 6.8±2.4 0.02
*6MWT: six-minute walk test, 3 patients encountered technical difficulties ¶Ten patients not willing to perform the cycling test and 3 with technical difficulties
were excluded from analysis.
Note: ∆SpO2 SE, difference between the start and the end; ∆SpO2 SN, difference
between the start and the nadir; �Nadir time from the start; paired t-tests performed
between two modes of exercise test in 47 subjects.§,†Comparisons between the start
and the nadir or the,end separately, and ‡comparison between the nadir and the end,
were all p<0.0001; 8comparison between ∆SpO2 SE and ∆SpO2 SN was p<0.0001.
RESPIRATORY CARE Paper in Press. Published on August 13, 2013 as DOI: 10.4187/respcare.02494
Epub ahead of print papers have been peer-reviewed and accepted for publication but are posted before being copy edited and proofread, and as a result, may differ substantially when published in final version in the online and print editions of RESPIRATORY CARE.
Copyright (C) 2013 Daedalus Enterprises
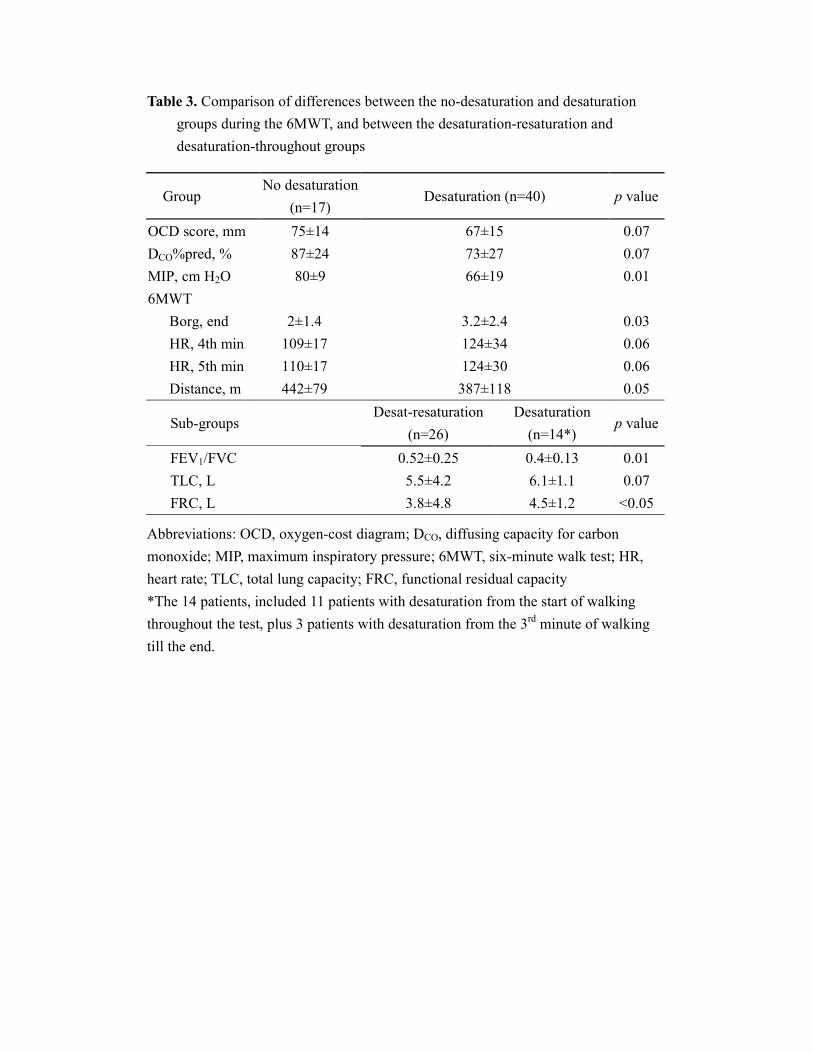
Table 3. Comparison of differences between the no-desaturation and desaturation
groups during the 6MWT, and between the desaturation-resaturation and
desaturation-throughout groups
Group No desaturation
(n=17) Desaturation (n=40) p value
OCD score, mm 75±14 67±15 0.07
DCO%pred, % 87±24 73±27 0.07
MIP, cm H2O 80±9 66±19 0.01
6MWT
Borg, end 2±1.4 3.2±2.4 0.03
HR, 4th min 109±17 124±34 0.06
HR, 5th min 110±17 124±30 0.06
Distance, m 442±79 387±118 0.05
Sub-groups Desat-resaturation
(n=26)
Desaturation
(n=14*) p value
FEV1/FVC
0.52±0.25 0.4±0.13 0.01
TLC, L 5.5±4.2 6.1±1.1 0.07
FRC, L 3.8±4.8 4.5±1.2 <0.05
Abbreviations: OCD, oxygen-cost diagram; DCO, diffusing capacity for carbon
monoxide; MIP, maximum inspiratory pressure; 6MWT, six-minute walk test; HR,
heart rate; TLC, total lung capacity; FRC, functional residual capacity
*The 14 patients, included 11 patients with desaturation from the start of walking
throughout the test, plus 3 patients with desaturation from the 3rd minute of walking
till the end.
RESPIRATORY CARE Paper in Press. Published on August 13, 2013 as DOI: 10.4187/respcare.02494
Epub ahead of print papers have been peer-reviewed and accepted for publication but are posted before being copy edited and proofread, and as a result, may differ substantially when published in final version in the online and print editions of RESPIRATORY CARE.
Copyright (C) 2013 Daedalus Enterprises

Table 4. Differences in demographics, lung function, 6MWT, and peak exercise
between patients with and those without desaturation during the cycling test
(mean±SD)
No desaturation
(n=18)
Desaturation
(n=27) p value
Body mass index, kg/m2 23.8±3.7 21.7±3.3 0.05
Oxygen-cost diagram score, mm 80±11 65±14 0.0002
Peak flow rate, L/s 4.1±1.3 2.9±1.5 0.006
Peak flow rate% pred 57%±18% 41%±22% 0.008
DLCO% pred 84%±21% 68%±23% 0.02
Post MIP, cm H2O 84.9±14.7 66.9±22.3 0.02
6MWT
Breathing frequency@6min,
b/min 23.5±3.6 28.0±6.3 0.004
Borg@3min 2.1±1.4 3.4±2.5 0.03
SpO2@1min, % 94.7±1.7 92.3±3.0 0.01
SpO2@3min, % 92.6±3.8 88.6±6.7 0.01
SpO2@6min, % 93.9±2.8 89.7±5.6 0.002
∆SpO2SE, % 1.8±3.0 5.1±5.5 0.01
Distance⋅Weight, kg⋅km 28.6±4.7 23.0±9.7 0.02
Cycling test
V& O2peak, L/min 1.3±0.3 1±0.4 0.01
V& CO2peak, L/min 1.3±0.3 1±0.5 0.03
O2 pulsepeak, ml/min/beat 9.6±2.5 7.1±2.1 0.01
∆V& O2/∆WR 8.1±1.1 6.6±2.2 0.01
Systolic BPpeak, mm Hg 200.7±30.7 222.3±36.7 0.04
V& Epeak, L/min 43.6±10 36.4±13.1 0.04
Tidal volumepeak, L 1.4±0.2 1.1±0.4 0.001
Inspiratory duty cyclepeak 0.44±0.04 0.41±0.05 0.03
Abbreviations: Post MIP, maximum inspiratory pressure measured after the cycling
exercise; 6MWT, six-minute walk test; ∆, difference;V& O2, oxygen uptake;V& CO2,
CO2 output; O2 pulse, V& O2/heart rate; ∆V& O2/∆WR, slope of change inV& O2 and
change in work rate;V& E, minute ventilation; Inspiratory duty cycle, inspiratory
time/breathing cycle time
RESPIRATORY CARE Paper in Press. Published on August 13, 2013 as DOI: 10.4187/respcare.02494
Epub ahead of print papers have been peer-reviewed and accepted for publication but are posted before being copy edited and proofread, and as a result, may differ substantially when published in final version in the online and print editions of RESPIRATORY CARE.
Copyright (C) 2013 Daedalus Enterprises

Table 5. Comparisons of demographic data, lung-function, and exercise response
among the four types of agreements in SpO2 changes between two exercise tests
Variables
Type
p value DD
(n=23, 49%)
DND-NDD*
(n=17, 36%)
NN
(n=7, 15%)
Age, yr 64.8±4.6 66.7±7.2 64.3±7.5 NS
Height, cm 166.1±5.7 161.4±6.2 168.6±5 <0.05
BMI, kg/m2 22.4±4.2 22.2±3.3 23.1±1.9 NS
OCD score, mm 66±14 74±14 84±6 <0.01
FVC, L 2.7±0.7 2.4±0.5 2.8±0.7 NS
FEV1, L 1.2±0.5 1.2±0.4 1.4±0.3 NS
FEV1/FVC, % 47±15 50±12 50±11 NS
TLC, L 6.3±0.9 5.7±1.3 6.5±1 NS
RV/TLC, % 54±9 54±13 56±10 NS
DLCO, ml/mm Hg/min 15.6±5.6 14.7±4.7 19.9±6.2 0.09
6MWT
Distance, meter 400±111 395±97 474±73 NS
Distance⋅weight, km⋅kg 25±10 24.4±5 29.6±7.2 NS
Borg @ 6 min 4.7±2 3.6±2.2 5.8±2.4 NS
Cycling test
V& O2peak, L/min 0.97±0.35 1.12±0.36 1.38±0.36 0.04
V& CO2peak, L/min 1.04±0.45 1.18±0.45 1.42±0.37 0.06
O2Ppeak, ml/beat 7±1.9 8.3±2.7 10±2.8 0.03
VTpeak, L 1.1±0.38 1.31±0.29 1.53±0.22 <0.01
Abbreviation: DD, ∆SPO2 ≥3% occurred in both the walk test and in the cycling test;
DND-NDD, ∆SPO2 ≥3% in either the 6MWT or the cycling test; NN, ∆SPO2 ≥3%
occurred in neither test; BMI, body mass index; OCD, oxygen-cost diagram; RV,
residual volume; O2P, oxygen pulse =V& O2/heart rate *The DND and NDD was combined as a sub-group because there were only four
patients in the NDD subgroup.
RESPIRATORY CARE Paper in Press. Published on August 13, 2013 as DOI: 10.4187/respcare.02494
Epub ahead of print papers have been peer-reviewed and accepted for publication but are posted before being copy edited and proofread, and as a result, may differ substantially when published in final version in the online and print editions of RESPIRATORY CARE.
Copyright (C) 2013 Daedalus Enterprises