Embed Size (px)
Citation preview

Kinetics of Crossflow Membrane Kinetics of Crossflow Membrane Bioreactor (CFBioreactor (CF--MBR) Processes in The MBR) Processes in The
Treatment of Refinery WastewaterTreatment of Refinery Wastewater
Muhammad Muhitur RahmanMuhammad Muhitur Rahman
Saudi Company for Environmental Works Saudi Company for Environmental Works (SEW)(SEW)
22
OUTLINEIntroductionIntroduction
Research ObjectivesResearch Objectives
Materials and MethodsMaterials and Methods
Results and DiscussionResults and Discussion
ConclusionConclusion

33
INTRODUCTION
Characteristics and sources of oily waste
Petroleum is an oily liquid, which typically contains C, HPetroleum is an oily liquid, which typically contains C, H22, S, N, O, S, N, O2 2 and also and also Fe, Ca, K, Na, I, As and other element. Fe, Ca, K, Na, I, As and other element.
The combined refinery wastes may contain The combined refinery wastes may contain crude oilcrude oilvarious dissolved or suspended organic compounds discharged in lvarious dissolved or suspended organic compounds discharged in liquors iquors sludges from the various stages of processingsludges from the various stages of processing
Wastes from the oil refineries comes from leaks, spills, tank drWastes from the oil refineries comes from leaks, spills, tank drawaw--off, and off, and other sources like emulsion incident to chemical treatment and cother sources like emulsion incident to chemical treatment and cooling ooling waters. waters.

44
Introduction (Cont’d)
Basics of CF-MBR Process
Activated Sludge Activated Sludge ProcessProcess
Concentrate
PermeateInfluent
Crossflow FiltrationDead-end Filtration
Influent
Filtrate
Cross Flow Cross Flow FiltrationFiltration

55
Conventional wastewater treatment
Conventional treatment with tertiary membrane filtration
Treatment with membrane bioreactor

66
Introduction (Cont’d)
Biochemical Kinetics of MBR System
Kinetic study of MBR is needed to understand the Kinetic study of MBR is needed to understand the interaction between biological and filtration unitinteraction between biological and filtration unit
Basic Equations are based on Monod (1949) equationBasic Equations are based on Monod (1949) equation
Major factors affecting the biokinetic coefficients are Major factors affecting the biokinetic coefficients are ((RozichRozich and Gaudy, 1992)and Gaudy, 1992)
Reactor growth rateReactor growth rateWaste compositionWaste compositionTemperatureTemperaturePopulation diversityPopulation diversity
77
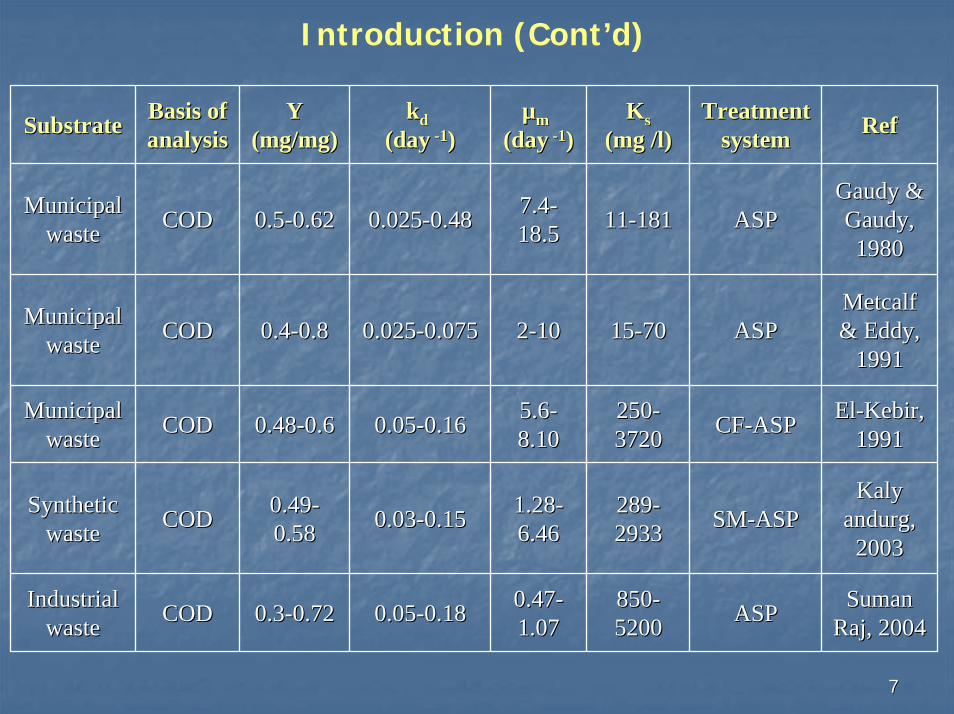
Introduction (Cont’d)
SubstrateSubstrate Basis of Basis of analysisanalysis
Y Y (mg/mg)(mg/mg)
kkdd(day(day --11))
µµmm(day(day --11))
KKss(mg /l)(mg /l)
Treatment Treatment systemsystem RefRef
Municipal Municipal wastewaste CODCOD 0.50.5--0.620.62 0.0250.025--0.480.48 7.47.4--
18.518.5 1111--181181 ASPASPGaudy & Gaudy & Gaudy, Gaudy, 19801980
Municipal Municipal wastewaste CODCOD 0.40.4--0.80.8 0.0250.025--0.0750.075 22--1010 1515--7070 ASPASP
Metcalf Metcalf & Eddy, & Eddy,
19911991
Municipal Municipal wastewaste CODCOD 0.480.48--0.60.6 0.050.05--0.160.16 5.65.6--
8.108.10250250--37203720 CFCF--ASPASP ElEl--KebirKebir, ,
19911991
Synthetic Synthetic wastewaste CODCOD 0.490.49--
0.580.58 0.030.03--0.150.15 1.281.28--6.466.46
289289--29332933 SMSM--ASPASP
KalyKalyandurgandurg, ,
20032003
Industrial Industrial wastewaste CODCOD 0.30.3--0.720.72 0.050.05--0.180.18 0.470.47--
1.071.07850850--52005200 ASPASP SumanSuman
RajRaj, 2004, 2004

88
RESEARCH OBJECTIVESRESEARCH OBJECTIVES
To study the interaction between the biological and To study the interaction between the biological and filtration unit of CFfiltration unit of CF--MBR at MLSS concentration of 3000 MBR at MLSS concentration of 3000 mg/l. For this purpose following biokinetic coefficients mg/l. For this purpose following biokinetic coefficients were determined: were determined:
saturation constant (Ksaturation constant (Kss))
specific growth rate (specific growth rate (µµ) )
yield coefficient (Y) and yield coefficient (Y) and
endogenous decay coefficient (endogenous decay coefficient (kkdd) )

99
MATERIALS AND METHODS
Membrane Characteristics
1-14pH Range15 barMaximum Filtration pressure1200 CMaximum Thermal stability0.019 m2Effective Surface area0.022 m2Total Surface area38.5 mm2Cross-sectional area5 x 20 cmLength7 mmInner diameter10 mmOuter diameter0.2 µmPore sizeAluminaMaterial
Hollow Tubular ceramic membrane
Configuration
1-14pH Range15 barMaximum Filtration pressure1200 CMaximum Thermal stability0.019 m2Effective Surface area0.022 m2Total Surface area38.5 mm2Cross-sectional area5 x 20 cmLength7 mmInner diameter10 mmOuter diameter0.2 µmPore sizeAluminaMaterial
Hollow Tubular ceramic membrane
Configuration

1010

1111
Materials and Methods (Cont’d)
Influent Substrate
The oily waste was collected from a petroleum refineryThe oily waste was collected from a petroleum refinery
The oil content was 160x10The oil content was 160x1033 mg/lmg/l
The COD varied from 0.37x10The COD varied from 0.37x1066 to 2.3x10to 2.3x10⁶ 6 mg/lmg/l
Essential nutrients were added in the bioreactor consisting Essential nutrients were added in the bioreactor consisting
of glucose, peptone and east extractof glucose, peptone and east extract
The influent COD calculation was based on the mass The influent COD calculation was based on the mass
loading per day (gm/day) rather than the concentration loading per day (gm/day) rather than the concentration
(mg/l) (mg/l)

1212
Experimental Procedure layoutExperimental Procedure layout
Aeration Tank

1313
1414
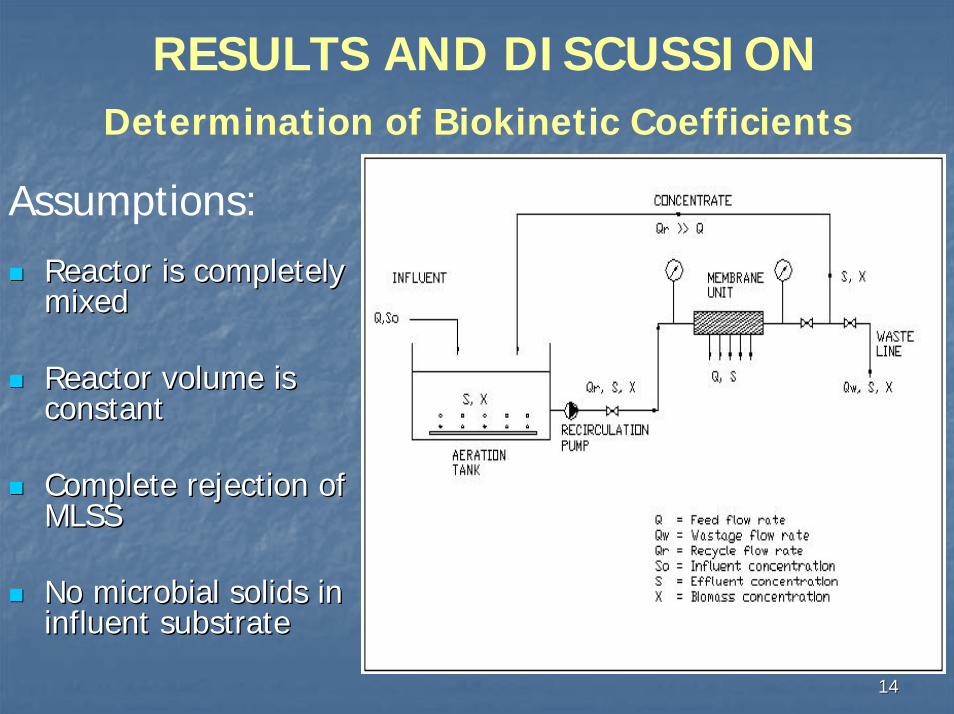
RESULTS AND DISCUSSIONDetermination of Biokinetic Coefficients
Assumptions:
Reactor is completely Reactor is completely mixedmixed
Reactor volume is Reactor volume is constantconstant
Complete rejection of Complete rejection of MLSSMLSS
No microbial solids in No microbial solids in influent substrateinfluent substrate

1515
Determination of Biokinetic Coefficients (Cont’d)
Substrate Balance
Rate of change of Substrate in the reactor
Rate of input of the feed substrate
Substrate lost during Deliberate wastage
= - -Rate of removal due to washout
-Rate of removal due to biomass utilization
( ) SQQQSYXVQS
dtdSV ww −−−−= µ0
( )Yk
SRTYSS
VXQ d+=−
110
For steady state condition

1616
Determination of Biokinetic Coefficients (Cont’d)
Biomass Balance
Rate of increase due to growth
Rate of change of biomass in the reactor
Rate of loss due to endogenous respiration
Deliberate wastage--=
XQXVkXVdtdXV wd −−=µ
( ) mm
s
d SK
SRTkSRT
µµ11
1+⎟⎠⎞
⎜⎝⎛=
+For steady state condition

1717
Determination of Biokinetic Coefficients (Cont’d)
Steady state data at MLSS 3000 mg/l
SRT/ SRT/ (1+SRT(1+SRT
**kkdd
Q(SQ(S00--S)/VXS)/VXSRTSRTQSQSQSQS001/S1/SSSXXavgavgQQ
Steady Steady State State PeriodPeriod
dayday1/d1/ddaydaygm/dgm/dgm/dgm/dl/mgl/mgmg/lmg/lmg/lmg/ll/dl/d
8.58.50.480.4836.2536.251.9181.91835.77535.7750.01430.0143707035473547272766--99
7.097.090.700.7019.5819.582.2412.24146.96646.9660.00990.00991011013184318422222222--2525
5.785.780.790.7912.0412.042.7242.72453.77553.7750.00910.00911101103224322425253232--3434
4.994.990.880.889.059.053.2923.29262.54562.5450.00860.00861161163382338228284343--4646

1818
Determination of Biokinetic Coefficients (Cont’d)
y = 4.5075x + 0.4051R2 = 0.9084
0.00
0.10
0.20
0.30
0.40
0.50
0.60
0.70
0.80
0.90
1.00
0.01 0.03 0.05 0.07 0.09 0.11 0.13
1/SRT (1/Day)
Q(S
o-S)
/VX
(Kg
CO
D/K
g M
LSS/
Day
)
y = 549.54x + 0.8335R2 = 0.8546
0.00
1.00
2.00
3.00
4.00
5.00
6.00
7.00
8.00
9.00
10.00
0.008 0.009 0.010 0.011 0.012 0.013 0.014 0.015
1/S (L/mg)
SRT/
(1+S
RT*
kd) (
Day
)
Determination of Y and kd at MLSS 3000 mg/l
Determination of µm and KS at MLSS 3000 mg/l

1919
Determination of Biokinetic Coefficients (Cont’d)
Summary of Kinetic Coefficients for CF-MBR at MLSS concentration of 3000 mg/l
MLSS, MLSS, mg/lmg/l
Y Y (mg/mg)(mg/mg)
kkdd(day(day--11))
µµmm(day(day--11))
KKSS(mg COD/l)(mg COD/l)
30003000 0.2220.222 0.090.09 1.21.2 659.45659.45

2020
Relationship Between Effluent COD and SRT
0
50
100
150
200
250
300
350
400
0 10 20 30 40 50 60
SRT (day)
Efflu
ent C
OD
(mg/
l)
⎟⎠⎞
⎜⎝⎛ +−
⎟⎠⎞
⎜⎝⎛ +
=
dm
ds
kSRT
kSRT
KS
1
1
µ
Simulated Effluent COD for MLSS concentration of 3000 mg/l

2121
CONCLUSIONCONCLUSION
Kinetic coefficients Y, kKinetic coefficients Y, kdd, , µµmm and Kand KSS were evaluated. were evaluated.
The simulation study showed good agreement between The simulation study showed good agreement between model predictions and experimental data.model predictions and experimental data.
The model can be used to simulate and investigate The model can be used to simulate and investigate different operational strategies.different operational strategies.

Thank youThank you

2323
Questions?Questions?


![Chapter 16. Membrane Bioreactor (()MBR)wemt.snu.ac.kr/lecture 2012-2/ENV/MBR/MBR 1 2012-2학기 [호환 모드].pdf · Global Water Shortage in 2025 Very high stress High stress Mid](https://img.pdfslide.net/doc/110x75/5e0ad284b700074b47620d13/chapter-16-membrane-bioreactor-mbrwemtsnuackrlecture-2012-2envmbrmbr.jpg)