Embed Size (px)
Citation preview
Energy Procedia 49 ( 2014 ) 1970 – 1979
Available online at www.sciencedirect.com
ScienceDirect
1876-6102 © 2013 The Authors. Published by Elsevier Ltd. This is an open access article under the CC BY-NC-ND license (http://creativecommons.org/licenses/by-nc-nd/3.0/).Selection and peer review by the scientifi c conference committee of SolarPACES 2013 under responsibility of PSE AG. Final manuscript published as received without editorial corrections. doi: 10.1016/j.egypro.2014.03.209
SolarPACES 2013
Kinetics of thermal reduction step of thermochemical two-step water splitting using CeO2 particles: Master-plot method for
analyzing non-isothermal experiments T. Ishidaa, N. Gokonb,†, T. Hatamachic , T. Kodamac
aGraduate school of Science and Technology, Niigata University, 8050 Ikarashi 2-nocho, Nishi-ku, Niigata 950-2181, JAPAN bCenter for Transdisciplinary Research, Department of Chemistry & Chemical Engineering, Niigata University, 8050 Ikarashi 2-nocho, Nishi-ku,
Niigata 950-2181, JAPAN, Phone/FAX: +81-25-262-6820, E-mail: [email protected] c Department of Chemistry & Chemical Engineering, Faculty of Engineering, Niigata University, 8050 Ikarashi 2-nocho, Nishi-ku, Niigata 950-
2181, JAPAN.
Abstract
Thermochemical two-step water splitting cycle by concentrated solar heat has been studied as an energy conversion of solar energy into hydrogen energy. The thermochemical two-step water splitting cycle using metal oxide redox pair was composed of thermal reduction (T-R) step of metal oxide at higher temperature to release oxygen and, subsequent water decomposition (W-D) step of the reduced metal oxide with steam at lower temperature to produce hydrogen. Recently, cerium oxide (CeO2) is concerned as a redox pair of the thermochemical cycle for highly reactivity and cyclicity at high temperature. In this study, we focused a kinetic analysis of thermochemical two-step water splitting using cerium oxide. Various theoretical reaction models for thermal reduction (T-R) step of CeO2 particles are examined, and the appropriate reaction model for experimental results of thermogravimetric analysis was found by Master plot method. Finally, the reaction rate equation of thermal reduction is estimated.
© 2013 The Authors. Published by Elsevier Ltd. Selection and peer review by the scientific conference committee of SolarPACES 2013 under responsibility of PSE AG.
Keywords: thermochemical two-step water splitting cycle; hydrogen production; Cerium oxide; Master plot; Thermogravimetry; kinetic analysis
© 2013 The Authors. Published by Elsevier Ltd. This is an open access article under the CC BY-NC-ND license (http://creativecommons.org/licenses/by-nc-nd/3.0/).Selection and peer review by the scientific conference committee of SolarPACES 2013 under responsibility of PSE AG. Final manuscript published as received without editorial corrections.

T. Ishida et al. / Energy Procedia 49 ( 2014 ) 1970 – 1979 1971
Nomenclature
δ a no unit nonstoichimetric number, the range of value is 0~0.5 TG(%) weight change rate of sample (calculated as the weight change value[g] ratio initial sample weight[g] T-R abbreviation of thermal reduction W-D abbreviation of water decomposition α a reaction fraction, no unit t time, min m weight of sample at time t, g mi initial weight of sample, g mf final weight of sample, g f(α) a function of reaction fraction α for a reaction model, no unit Ea activation energy, J mol-1 A frequency factor, s-1 R universal gas constant, J mol-1 K-1 T sample temperature, K θ generalized time, min
1. Introduction
Direct or single-step water-splitting needs thermodynamically a very high temperature above 2500 K to reach significant dissociation and so, the use of redox pair is proposed as a reaction media in order to low this temperature [1]. Mixed metal oxides are one of promising candidates for hydrogen production via solar thermochemical cycles. Such cycle consists of a two-step process that involves a metal-oxide redox pair and water. However, a redox material of iron oxide is melted and sintered during thermal-reduction (T-R) step of thermochemical two-step cycles, which strongly decreases specific surface area and consequently production performance of oxygen and hydrogen for a cyclic two-step water-splitting. In order to lower the temperature of the T-R step and enhance hydrogen productivity for two-step water splitting, various ferrites doped metallic cations (Zn, Ni, Mn, Co.) are extensively studied.
The present authors have demonstrated repeatable two step water splitting using highly active NiFe2O4 particles supported on monoclinic ZrO2 particles (NiFe2O4/m-ZrO2) operating at temperatures of K [1].
NiFe2O4/m-ZrO2 → 3Ni1/3Fe2/3O/m-ZrO2 + 1/2O2 (T-R step) (1) 3Ni1/3Fe2/3O/m-ZrO2 + H2O →NiFe2O4/m-ZrO2 + H2 (W-D step) (2) The m-ZrO2 support characterizes a high melting point more than 2273 K and causes a repeatable volume
expansion/shrinkage of ZrO2 crystal lattice involving phase transition of monoclinic into tetragonal crystal structures at T >1443 K. Thus, the m-ZrO2 support has good resistance to agglomeration or sintering at temperatures of
K. Unsupported NiFe2O4 particles have been also used and tested for a repeatable two step water splitting. Solar chemical receivers/absorbers or reactors operating at temperatures of 1073–1773 K are developed and tested for hydrogen production from water via the two-step water-splitting cycle using ferrite redox materials [1]. And Abanades S et al. performed to identify kinetics analysis of the oxidation step in two-step redox cycle using stannum oxide SnO2[2] and zinc oxide ZnO[2,3] by thermogravimetry.
Cerium oxide has recently emerged as a promising reactive redox material for thermochemical two-step water splitting cycle [4]. The redox cycle includes higher melting points for the oxides, leading to good sintering resistence and superior cyclic reactivity by itself without any support materials at high temperature. However, it is reported that Cerium oxide can form a compound at the thermal reduction (T-R) temperature less than 2273K that are non-stoichiometric state in oxide between CeO2 and Ce2O3, requiring a relatively lower reduction temperature, decreasing volatility [4-10]. A repeatable two-step water splitting cycle using CeO2/CeO2- is represented by:

1972 T. Ishida et al. / Energy Procedia 49 ( 2014 ) 1970 – 1979
CeO2 → CeO2- (T-R step) (3) CeO2- → CeO2 + (W-D step) (4)
CeO2- represents a non-stoichiometric state of cerium oxide that is formed during the T-R step and oxygen is
releared from CeO2. The CeO2- has a sufficiently reactive as the redox material for two-step water splitting. In the second step (W-D step), the CeO2- can react with steam at lower temperatures less than 1273 K to produce hydrogen.
In this study, we focused a kinetic analysis of thermochemical two-step water splitting using cerium oxide. Various theoretical reaction models for thermal reduction (T-R) step of CeO2 particles are examined, and the appropriate reaction model for experimental results of thermogravimetric analysis was found by Master plot method. Finally, the reaction rate equation of thermal reduction is reported. The reaction rate equation for T-R step will be useful for an estimation of oxygen or hydrogen productivities for the solar chemical receivers/absorbers or reactors such as a fluidized bed reactor using reacting particles of CeO2.
2. Experimental set-up
The CeO2 particles (99.9 % purity) was purchased from Kojundo Chemical Laboratory CO.,LTD. Approximately 240 mg of CeO2 particles was packed into a platinum cup (5 mm in diameter and 5 mm deep), and mounted on the balance in a ceramic reaction chamber. Fig.1 shows experimental set-up for thermogravimetry reactor (Thermo plus EVO 2/TG-DTA series manufactured by Rigaku Co. ltd. Mechanical error of balance is ±1 %) used for thermal reduction (T-R) step of CeO2 particles. The CeO2 particles mounted in the thermogravimetry reactor were first heated to 1773K with different heating rates of 10 K/min, 20 K/min, and 30 K/min using an electric furnace, while passing N2 gas (purity 99.999%) through the reactor at a flow rate of 200 cm3•min–1(nor) controlled by mass flow controller (KOFLOC RK1700 1 L/min. precision, 7 % for full scale), in order to perform the T R step. The temperature of the CeO2 particles was controlled using an R-type thermocouple (tolerance, ±3.75 K) in contact with the platinum cup. The particles were heated at a constant temperature of 1773 K for 30 min, subsequently it was cooled to 1273 K to perform the subsequent W-D step. The weight change of the CeO2 particles by O2 release during T-R step was measured against time.
Subsequently, a gas mixture containing H2O and N2 was introduced into the reactor to perform the W D step. This mixture was produced by bubbling N2 gas at a flow rate of 200 cm3•min–1(nor) through a glass tube into distilled water at 368 K. The partial pressure of steam in the H2O/N2 mixture was estimated to be 74 %, by considering the steam vapor pressure at 368K and 1 bar. The sample was heated at given temperature of 1273K within 1 min in an electric furnace of thermogravimetry reactor, and the W D step was continued for 25 min. The temperature of the sample was too controlled using a R-type thermocouple in contact with the platinum cup. The weight change of the sample by H2 generation during W-D step was measured against time.
The T R and W D steps were alternately repeated three times.
Fig.1. Schematic of the thermogravimetry reactor for thermochemical two-step water splitting cycle using CeO2 particles.
T. Ishida et al. / Energy Procedia 49 ( 2014 ) 1970 – 1979 1973
3. Kinetic analysis of thermal reduction step using CeO2 particles
3.1. Isothermal and non-isothermal Master-plots methods for identifying reaction model
A reaction fraction for O2 release during the T-R step was defined as follows:
where mi, mf and m are initial weight, final weight and weight of sample at time t, respectively. In thermogravimetry, the reaction fraction α was calculated by the measured weight change of sample.
A rate of chemical reaction can be generally described by:
where A and Ea correspond to the frequency factor and activation energy, respectively. k(T) is the rate constant at temperature T, and f(α) is a function of reaction fraction for a reaction model which represents the reaction mechanism (theoretical reaction models based on various physical and chemical mechanisms are shown in appendix A).
Isothermal Master-plots [11] are composed of the theoretical kinetic reaction model and the experimental kinetic data at a constant temperature, and a reaction model at a constant temperature is estimated and evaluated based on their comparison. The isothermal Master plot was analyzed as follows:
where (dα/dt)α=X is a reaction rate for a reference point at α = X. In isothermal Master plot method, the experimental kinetic data, (dα/dt)/(dα/dt)α=X, measured under isothermal condition (T = Tα=X) are used, and the value of (dα/dt)/(dα/dt)α=X was plotted against α. The theoretical plots of f(α)/f(X) against reaction fraction α was calculated for various functions of f(α) listed in appendix A. The experimental plots were compared with various theoretical plots. In this study, the isothermal Master plots method was applied for T-R step at a constant temperature of 1773K, with the aim of identification of reaction model function in isothermal reduction reaction.
Non-isothermal Master plots method was applied in order to identify a reaction model with a heating rate during T-R step. Firstly, a generalized time θ is defined as follows[12]:
where θ denotes the reaction time taken to attain a particular α at infinite temperature. A derivation of Eq. (8) leads to
where Ea is activation energy estimated by Freeman and Carroll method [13]. Combining Eqs. (6) and (9), the following expression is obtained
Here, θ depends on temperature T(s) of CeO2, as shown in Eq(9). Thus, the analytic equation for non-isothermal Master plots leads to
where f(X) is a constant for a reaction model f(α) at a given reaction fraction α=X. The theoretical values of f(α)/f(X) and the experimental values of (dα/dθ)(dα/dθ)α=X were plotted against α, respectively. The both values were compared to identify the theoretical reaction model during T-R step with increasing temperatures as well as the isothermal Master plots method.
1974 T. Ishida et al. / Energy Procedia 49 ( 2014 ) 1970 – 1979
3.2. Determination of kinetic parameter by Sharp-Wentworth method
Analysis equation for Sharp-Wentworth method [14] is derived from Eq. (6);
Natural logarithm for both side of the Eq. (12) is follow:
A reaction model f(α) estimated by non-isothermal Master plot is substituted to eq.(12), and activation energy Ea and frequency factor A were calculated. In the analysis of thermochemical parameter, the left-hand side were plotted against (-1/T) and A was calculated by the intercept, Ea was done by the slope of plots. The estimated reaction model was evaluated by using eq. (13).
4. Result and discussion
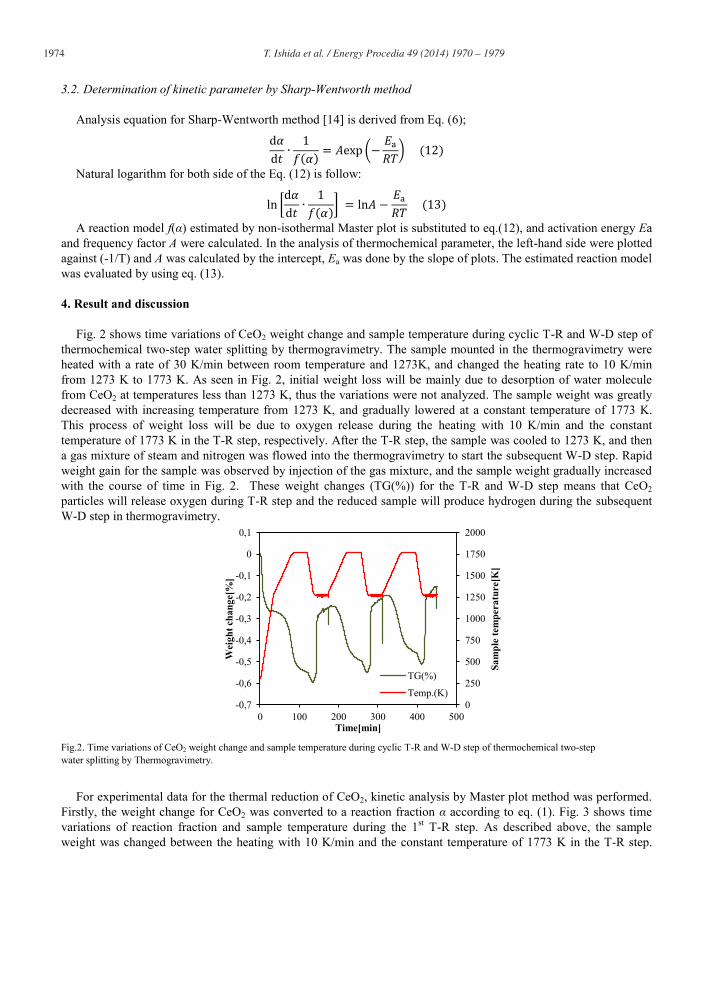
Fig. 2 shows time variations of CeO2 weight change and sample temperature during cyclic T-R and W-D step of thermochemical two-step water splitting by thermogravimetry. The sample mounted in the thermogravimetry were heated with a rate of 30 K/min between room temperature and 1273K, and changed the heating rate to 10 K/min from 1273 K to 1773 K. As seen in Fig. 2, initial weight loss will be mainly due to desorption of water molecule from CeO2 at temperatures less than 1273 K, thus the variations were not analyzed. The sample weight was greatly decreased with increasing temperature from 1273 K, and gradually lowered at a constant temperature of 1773 K. This process of weight loss will be due to oxygen release during the heating with 10 K/min and the constant temperature of 1773 K in the T-R step, respectively. After the T-R step, the sample was cooled to 1273 K, and then a gas mixture of steam and nitrogen was flowed into the thermogravimetry to start the subsequent W-D step. Rapid weight gain for the sample was observed by injection of the gas mixture, and the sample weight gradually increased with the course of time in Fig. 2. These weight changes (TG(%)) for the T-R and W-D step means that CeO2 particles will release oxygen during T-R step and the reduced sample will produce hydrogen during the subsequent W-D step in thermogravimetry.
Fig.2. Time variations of CeO2 weight change and sample temperature during cyclic T-R and W-D step of thermochemical two-step water splitting by Thermogravimetry.
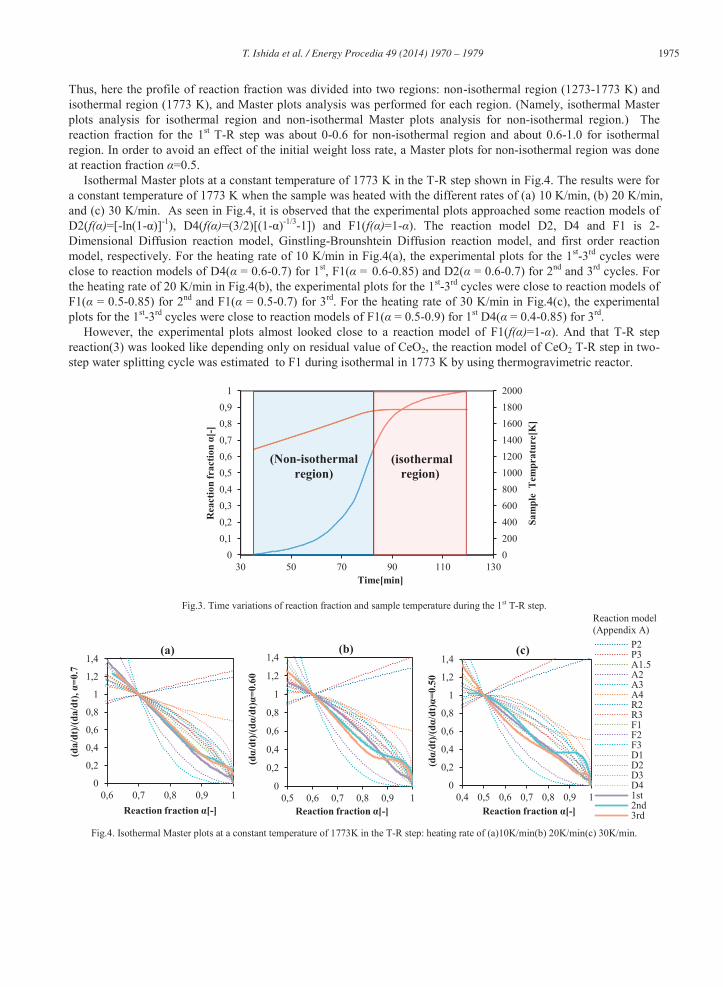
For experimental data for the thermal reduction of CeO2, kinetic analysis by Master plot method was performed. Firstly, the weight change for CeO2 was converted to a reaction fraction α according to eq. (1). Fig. 3 shows time variations of reaction fraction and sample temperature during the 1st T-R step. As described above, the sample weight was changed between the heating with 10 K/min and the constant temperature of 1773 K in the T-R step.
0
250
500
750
1000
1250
1500
1750
2000
-0,7
-0,6
-0,5
-0,4
-0,3
-0,2
-0,1
0
0,1
0 100 200 300 400 500
Sam
ple
tem
pera
ture
[K]
Wei
ght c
hang
e[%
]
Time[min]
TG(%)
Temp.(K)
T. Ishida et al. / Energy Procedia 49 ( 2014 ) 1970 – 1979 1975
Thus, here the profile of reaction fraction was divided into two regions: non-isothermal region (1273-1773 K) and isothermal region (1773 K), and Master plots analysis was performed for each region. (Namely, isothermal Master plots analysis for isothermal region and non-isothermal Master plots analysis for non-isothermal region.) The reaction fraction for the 1st T-R step was about 0-0.6 for non-isothermal region and about 0.6-1.0 for isothermal region. In order to avoid an effect of the initial weight loss rate, a Master plots for non-isothermal region was done at reaction fraction α=0.5.
Isothermal Master plots at a constant temperature of 1773 K in the T-R step shown in Fig.4. The results were for a constant temperature of 1773 K when the sample was heated with the different rates of (a) 10 K/min, (b) 20 K/min, and (c) 30 K/min. As seen in Fig.4, it is observed that the experimental plots approached some reaction models of D2(f(α)=[-ln(1-α)]-1), D4(f(α)=(3/2)[(1-α)-1/3-1]) and F1(f(α)=1-α). The reaction model D2, D4 and F1 is 2-Dimensional Diffusion reaction model, Ginstling-Brounshtein Diffusion reaction model, and first order reaction model, respectively. For the heating rate of 10 K/min in Fig.4(a), the experimental plots for the 1st-3rd cycles were close to reaction models of D4(α = 0.6-0.7) for 1st, F1(α = 0.6-0.85) and D2(α = 0.6-0.7) for 2nd and 3rd cycles. For the heating rate of 20 K/min in Fig.4(b), the experimental plots for the 1st-3rd cycles were close to reaction models of F1(α = 0.5-0.85) for 2nd and F1(α = 0.5-0.7) for 3rd. For the heating rate of 30 K/min in Fig.4(c), the experimental plots for the 1st-3rd cycles were close to reaction models of F1(α = 0.5-0.9) for 1st D4(α = 0.4-0.85) for 3rd.
However, the experimental plots almost looked close to a reaction model of F1(f(α)=1-α). And that T-R step reaction(3) was looked like depending only on residual value of CeO2, the reaction model of CeO2 T-R step in two-step water splitting cycle was estimated to F1 during isothermal in 1773 K by using thermogravimetric reactor.
Fig.3. Time variations of reaction fraction and sample temperature during the 1st T-R step.
Fig.4. Isothermal Master plots at a constant temperature of 1773K in the T-R step: heating rate of (a)10K/min(b) 20K/min(c) 30K/min.
0200400600800100012001400160018002000
00,10,20,30,40,50,60,70,80,9
1
30 50 70 90 110 130
Sam
ple
Tem
prat
ure[
K]
Rea
ctio
n fr
actio
n α[
-]
Time[min]
0
0,2
0,4
0,6
0,8
1
1,2
1,4
0,6 0,7 0,8 0,9 1
(da/
dt)/(
da/d
t), α
=0.7
Reaction fraction α[-]
(a)
0
0,2
0,4
0,6
0,8
1
1,2
1,4
0,5 0,6 0,7 0,8 0,9 1
(dα/
dt)/(
dα/d
t)α=0
.60
Reaction fraction α[-]
(b)
0
0,2
0,4
0,6
0,8
1
1,2
1,4
0,4 0,5 0,6 0,7 0,8 0,9 1
(dα/
dt)/(
dα/d
t)α=0
.50
Reaction fraction α[-]
(c) P2P3A1.5A2A3A4R2R3F1F2F3D1D2D3D41st2nd3rd
(isothermal region)
(Non-isothermal region)
Reaction model (Appendix A)
1976 T. Ishida et al. / Energy Procedia 49 ( 2014 ) 1970 – 1979
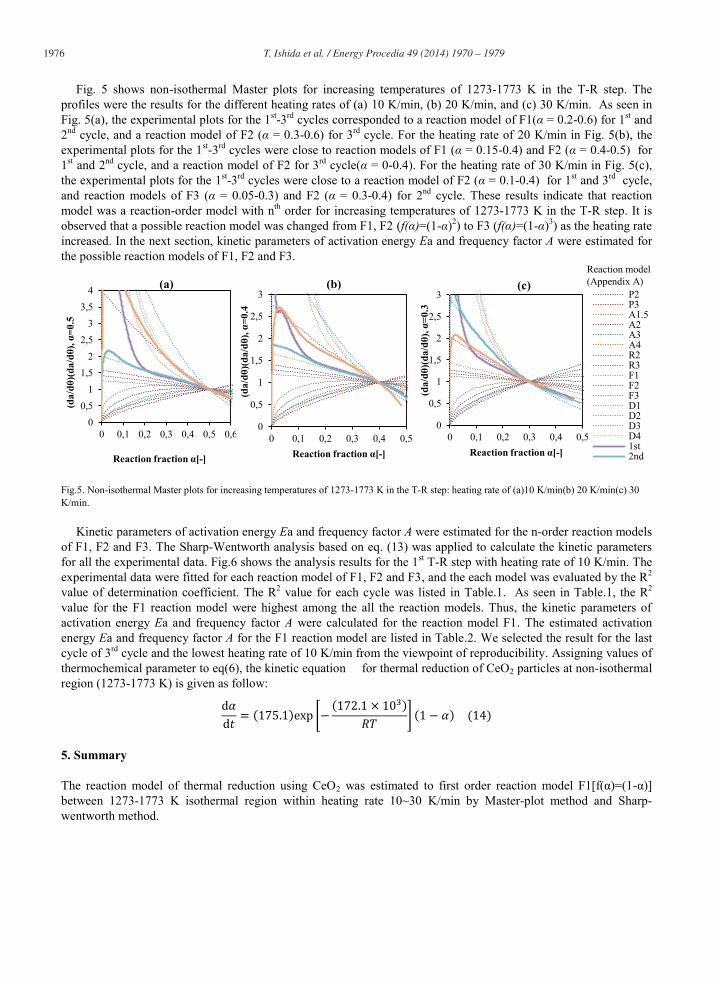
Fig. 5 shows non-isothermal Master plots for increasing temperatures of 1273-1773 K in the T-R step. The
profiles were the results for the different heating rates of (a) 10 K/min, (b) 20 K/min, and (c) 30 K/min. As seen in Fig. 5(a), the experimental plots for the 1st-3rd cycles corresponded to a reaction model of F1(α = 0.2-0.6) for 1st and 2nd cycle, and a reaction model of F2 (α = 0.3-0.6) for 3rd cycle. For the heating rate of 20 K/min in Fig. 5(b), the experimental plots for the 1st-3rd cycles were close to reaction models of F1 (α = 0.15-0.4) and F2 (α = 0.4-0.5) for 1st and 2nd cycle, and a reaction model of F2 for 3rd cycle(α = 0-0.4). For the heating rate of 30 K/min in Fig. 5(c), the experimental plots for the 1st-3rd cycles were close to a reaction model of F2 (α = 0.1-0.4) for 1st and 3rd cycle, and reaction models of F3 (α = 0.05-0.3) and F2 (α = 0.3-0.4) for 2nd cycle. These results indicate that reaction model was a reaction-order model with nth order for increasing temperatures of 1273-1773 K in the T-R step. It is observed that a possible reaction model was changed from F1, F2 (f(α)=(1-α)2) to F3 (f(α)=(1-α)3) as the heating rate increased. In the next section, kinetic parameters of activation energy Ea and frequency factor A were estimated for the possible reaction models of F1, F2 and F3.
Fig.5. Non-isothermal Master plots for increasing temperatures of 1273-1773 K in the T-R step: heating rate of (a)10 K/min(b) 20 K/min(c) 30 K/min.
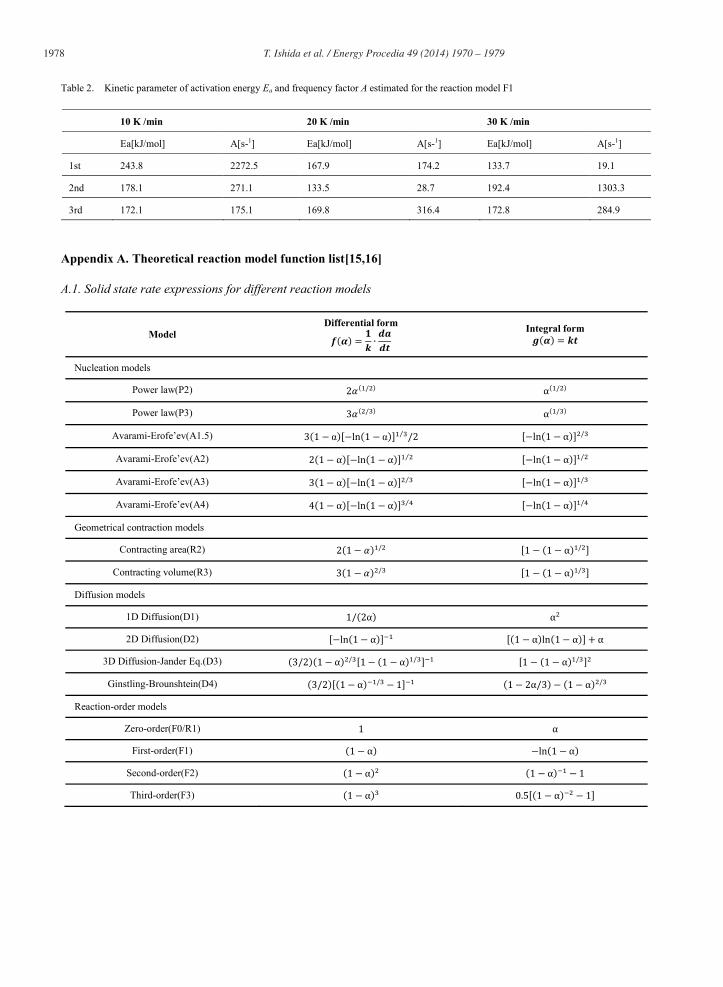
Kinetic parameters of activation energy Ea and frequency factor A were estimated for the n-order reaction models of F1, F2 and F3. The Sharp-Wentworth analysis based on eq. (13) was applied to calculate the kinetic parameters for all the experimental data. Fig.6 shows the analysis results for the 1st T-R step with heating rate of 10 K/min. The experimental data were fitted for each reaction model of F1, F2 and F3, and the each model was evaluated by the R2 value of determination coefficient. The R2 value for each cycle was listed in Table.1. As seen in Table.1, the R2 value for the F1 reaction model were highest among the all the reaction models. Thus, the kinetic parameters of activation energy Ea and frequency factor A were calculated for the reaction model F1. The estimated activation energy Ea and frequency factor A for the F1 reaction model are listed in Table.2. We selected the result for the last cycle of 3rd cycle and the lowest heating rate of 10 K/min from the viewpoint of reproducibility. Assigning values of thermochemical parameter to eq(6), the kinetic equation for thermal reduction of CeO2 particles at non-isothermal region (1273-1773 K) is given as follow:
5. Summary
The reaction model of thermal reduction using CeO2 was estimated to first order reaction model F1[f(α)=(1-α)] between 1273-1773 K isothermal region within heating rate 10~30 K/min by Master-plot method and Sharp-wentworth method.
00,5
11,5
22,5
33,5
4
0 0,1 0,2 0,3 0,4 0,5 0,6
(da/
dθ)(d
a/dθ
), α=
0.5
Reaction fraction α[-]
(a)
0
0,5
1
1,5
2
2,5
3
0 0,1 0,2 0,3 0,4 0,5(d
a/dθ
)(da/
dθ), α=
0.3
Reaction fraction α[-]
(c) P2P3A1.5A2A3A4R2R3F1F2F3D1D2D3D41st2nd
Reaction model (Appendix A)
0
0,5
1
1,5
2
2,5
3
0 0,1 0,2 0,3 0,4 0,5
(da/
dθ)(d
a/dθ
), α=
0.4
Reaction fraction α[-]
(b)

T. Ishida et al. / Energy Procedia 49 ( 2014 ) 1970 – 1979 1977
We selected the result for the last cycle of 3rd cycle and the lowest heating rate of 10 K/min from the viewpoint of reproducibility. The kinetic equation for thermal reduction of CeO2 particles at non-isothermal region (1273-1773 K) is given as follow eq(14)
Fig.6. Sharp-wentworth plots for the 1st T-R step with heating rate of 10 K/min: for reaction model of (a)F1, (b) F2, and (c) F3.
Table 1. Comparison of R2 value in Sharp-Wentworth plots using different reaction model for identification of the most fitting model to T-R step.
Heating rate [K/min]
Reaction model
R2
1st 2nd 3rd
10
F1 0.9688 0.9974 0.9986
F2 0.9535 0.9894 0.9923
F3 0.9385 0.9777 0.9812
20
F1 0.9961 0.9991 0.9983
F2 0.9888 0.9955 0.9957
F3 0.9778 0.9899 0.9916
30
F1 0.9940 0.9911 0.9905
F2 0.9857 0.9994 0.9988
F3 0.9927 0.9523 0.9430
y = -29320x + 11,823 R² = 0,9688
-9-8-7-6-5-4-3-2-10
0,00055 0,0006 0,00065 0,0007
ln[(d
a/dt
)/f(a
)] [-
]
1/T[K-1] (a)F1
y = -36859x + 16,714 R² = 0,9535
-9-8-7-6-5-4-3-2-10
0,00055 0,0006 0,00065 0,0007
ln[(d
a/dt
)/f(a
)] [-
]
1/T[K-1]
(b)F2
y = -44398x + 21,606 R² = 0,9385
-9-8-7-6-5-4-3-2-10
0,00055 0,0006 0,00065 0,0007
ln[(d
a/dt
)/f(a
)] [-
]
1/T[K-1]
(c)F3
1978 T. Ishida et al. / Energy Procedia 49 ( 2014 ) 1970 – 1979
Table 2. Kinetic parameter of activation energy Ea and frequency factor A estimated for the reaction model F1
10 K /min 20 K /min 30 K /min
Ea[kJ/mol] A[s-1] Ea[kJ/mol] A[s-1] Ea[kJ/mol] A[s-1]
1st 243.8 2272.5 167.9 174.2 133.7 19.1
2nd 178.1 271.1 133.5 28.7 192.4 1303.3
3rd 172.1 175.1 169.8 316.4 172.8 284.9
Appendix A. Theoretical reaction model function list[15,16]
A.1. Solid state rate expressions for different reaction models
Model Differential form
Integral form
Nucleation models
Power law(P2)
Power law(P3)
Avarami-Erofe’ev(A1.5) α α
Avarami-Erofe’ev(A2)
Avarami-Erofe’ev(A3)
Avarami-Erofe’ev(A4)
Geometrical contraction models
Contracting area(R2)
Contracting volume(R3)
Diffusion models
1D Diffusion(D1)
2D Diffusion(D2)
3D Diffusion-Jander Eq.(D3)
Ginstling-Brounshtein(D4)
Reaction-order models
Zero-order(F0/R1)
First-order(F1)
Second-order(F2)
Third-order(F3)
T. Ishida et al. / Energy Procedia 49 ( 2014 ) 1970 – 1979 1979
References
[1] Kodama T, Gokon N. Thermochemical cycles for high-temperature solar hydrogen production. Chemical Reviews 2007; 107: 4048–4077. [2] Abanades S. CO2 and H2O reduction by solar thermochemical looping using SnO2/SnO redox reactions: Thermogravimetric analysis.
International Journal of Hydrogen energy 2012;37:8223-8231. [3] Levenque G, and Abanades S. Kinetic analysis of high-temperature solid-gas reactions by an inverse method applied to ZnO and SnO2 solar
thermal dissociation. Chemical Engineering Journal 2013; 217: 139-149. [4] Abanades S, and Flamant G. Thermochemical hydrogen production from a two-step solar-driven water-splitting cycle based on cerium
oxides. Solar Energy 2006; 80: 1611-1623. [5] Kaneko H, Miura T, and Ishihara H et al.. Reactive ceramics of CeO2-MOx (M=Mn, Fe, Ni, Cu) for H2 generation by two-step water splitting
using concentrated solar thermal energy. Energy 2007; 32: 656-663. [6] Siegel N.P, Garino T, and Coker E.N et al.. Implementation of Cerium oxide structures in solar fuel production systems. In Proceedings of
SolarPACES2010 Conference (Perpinan, France, September 21-25 2010), SolarPACES, France (USB publication). [7] Abanades S, Legal A, and Cordier A et al. Investigation of reactive cerium-based oxides for H2 production by thermochemical two-step
water- splitting. Journal of Materials Science 2010; 45: 4163-4173. [8] Chueh W. C, Falter C, Abbott M. Scipio D. Furler P. Haile S. M. and Steinfeld A. High-Flux Solar-Driven Thermochemical dissociation of
CO2 and H2O Using Nonstoichiometric Ceria. Science 2010; 330: 1797-1801. [9] Chueh W. C, Haile S. M. A thermochemical study of ceria: exploiting an old material for new modes of energy conversion and CO2
mitigation. Philosophical Transactions of Royal Society A 2010; 368: 3269-3294. [10] Furler P, Scheffe J. R, and Steinfeld A. Syngas production by simultaneous splitting of H2O and CO2 via ceria redox reactions in a high-
temperature solar reactor. Energy & Environmental Science 2012; 5: 6098-6103. [11] Francisco J. Gotor, Jose´ M. Criado, Jiri Malek, and Nobuyoshi Koga. Kinetic analysis of solid-state reaction: The universality of Master
plots for analyzing Isothermal and Nonisothermal experiments. J. Phys. Chem. A 2000; 104: 10777-10782. [12] T. Ozawa. Non-isothermal kinetics (1) Single elementary process. Netsu Sokutei 31 (3) 2004:125-132 [13] Eli S. Freeman, Benjamin Carroll. The application of thermoanalytical techniques to reaction kinetics: The thermogravimetric evaluation of
the kinetics of the decomposition of calcium oxalate monohydrate. J. Phys. Chem 1958; 62(4): 394-397. [14] J. H. Sharp, and S.A. Wentworth. Anal. Chem 1969; 41: 2060. [15] Parviz Pourghahramani, Eric Forssberg. Reduction kinetics of mechanically activated hematite concentrate with hydrogen gas using
nonisothermal methods. Thermochimica acta 454(2007)69-77. [16] Ammar Khawam. Application of solid-state kinetics to desolvation reactions. University of Iowa, Iowa Reseach Online 2007.