Embed Size (px)
Citation preview

King George whiting (Sillaginodes punctata) Fishery
Fishery Assessment Report to PIRSA
AJ Fowler, R McGarvey, and JE Feenstra
August 2008
SARDI Publication Number F2007/000843-2
SARDI Research Report Series Number 296
King George whiting (Sillaginodes punctata) Fishery
Fishery Assessment Report to PIRSA
AJ Fowler, R McGarvey, and JE Feenstra
August 2008
2

This publication may be cited as: Fowler AJ, McGarvey R, Feenstra JE. (2008). King George whiting (Sillaginodes punctata) Fishery. Fishery Assessment Report to PIRSA Fisheries. South Australian Research and Development Institute (Aquatic Sciences), Adelaide, 77 pp. SARDI Publication Number F2007/000843-2. SARDI Research Report Series No. 296. South Australian Research and Development Institute SARDI Aquatic Sciences PO Box 120 HENLEY BEACH SA 5022 Telephone: (08) 8207 5400 Facsimile: (08) 8207 5481 http://www.sardi.sa.gov.au Disclaimer. The authors warrant that they have taken all reasonable care in producing this report. The report has been through the SARDI Aquatic Sciences internal review process, and has been formally approved for release by the Chief Scientist. Although all reasonable efforts have been made to ensure quality, SARDI Aquatic Sciences does not warrant that the information in this report is free from errors or omissions. SARDI Aquatic Sciences does not accept any liability for the contents of this report or for any consequences arising from its use or any reliance placed upon it. © 2008 SARDI Aquatic Sciences This work is copyright. Apart from any use as permitted under the Copyright Act 1968, no part may be reproduced by any process without prior written permission from the author. Author(s): A.J. Fowler, R. McGarvey, J.E. Feenstra Reviewers: M.A. Steer and T. Ward Approved by: T. Ward
Signed: Date: 8th August 2008 Distribution: PIRSA Fisheries, SARDI Aquatic Sciences Library Circulation: Public Domain
3

TABLE OF CONTENTS
TABLE OF CONTENTS.................................................................................................................... 4
LIST OF TABLES............................................................................................................................... 7
1. EXECUTIVE SUMMARY ......................................................................................................... 8
2. GENERAL INTRODUCTION ................................................................................................ 10 2.1. Overview ................................................................................................................................. 10 2.2. Description of Fishery ............................................................................................................. 11 2.3. Management Regulations ........................................................................................................ 12 2.4 Recreational Fishery................................................................................................................ 13 2.4. Population Biology and Life History....................................................................................... 17
3. TRENDS IN COMMERCIAL CATCH, EFFORT AND CPUE .......................................... 20 3.1 Introduction ............................................................................................................................. 20 3.2 Results ..................................................................................................................................... 21 3.3 Discussion ............................................................................................................................... 44
4. POPULATION STRUCTURE................................................................................................. 45 4.1 Introduction ............................................................................................................................. 45 4.2 Materials and Methods ............................................................................................................ 46 4.3 Results ..................................................................................................................................... 47 4.4 Discussion ............................................................................................................................... 50
5. MODEL ASSESSMENT OF BIOLOGICAL PERFORMANCE INDICATORS .............. 51 5.1. Introduction ............................................................................................................................. 51 5.2 Results ..................................................................................................................................... 53
6. ASSESSMENT OF BIOLOGICAL PERFORMANCE INDICATORS .............................. 59 6.1 Introduction ............................................................................................................................. 59 6.2 Materials and Methods ............................................................................................................ 59 6.3 Results ..................................................................................................................................... 61 6.4 Discussion ............................................................................................................................... 62
7. DISCUSSION............................................................................................................................. 64 7.1 Context of this assessment....................................................................................................... 64 7.2 Determination of stock status .................................................................................................. 65 7.3 Uncertainty in the fishery ........................................................................................................ 67 7.4 Management implications ....................................................................................................... 68 7.5 Future work ............................................................................................................................. 68
8. REFERENCE LIST .................................................................................................................. 69
9. ACKNOWLEDGEMENTS ...................................................................................................... 72
10. APPENDICES........................................................................................................................ 73 10.1 Appendix 1 - Commercial fishery statistics in 2005, 2006 and 2007...................................... 73 10.2 Appendix 2 - Recent modifications to the WhitEst model ...................................................... 75 10.3 Appendix 3 - Model fits to data............................................................................................... 76
4
LIST OF FIGURES
Fig. 3.1 Map of South Australia showing the seven fishery regions for which data are presented in this report. (1 = Far West Coast, 2 = Mid West Coast, 3 = Coffin Bay, 4 = Southern Spencer Gulf, 5 = Northern Spencer Gulf, 6 = Gulf St. Vincent, 7 = Kangaroo Island.) .............................................................................................. 20
Fig. 3.2 Total annual catch and value of the South Australian King George whiting fishery since 1984. ......... 22
Fig. 3.3 Historical trends in State-wide totals for catch, effort and CPUE for the main gear types used by the commercial fishing sector. Note that it was not possible to provide State-wide estimates of targeted effort for haul nets, which thereby prevented estimating targeted CPUE. .......................................................................... 23
Fig. 3.4 Top graph shows the number of licence holders who could legally take King George whiting in each year. Bottom graph shows the actual number of licence holders who reported taking some King George whiting and those who targeted this species in each year.................................................................................... 24
Fig. 3.5 Monthly estimates of total State-wide catch and fishing effort (all gears combined) for the King George whiting commercial fishery between July 2003 and December 2007..................................................... 25
Fig. 3.6 Far West Coast. Top graph – historical trends in total catch by gear type. Middle graph – historical trends in total effort by gear type. Bottom graph – historical trends in CPUE. The long-term mean for the handline fishery is indicated on each graph......................................................................................................... 27
Fig. 3.7 Mid West Coast. Top graph - historical trends in total catch by gear type. Middle graph - historical trends in total effort by gear type. Bottom graph - historical trends in CPUE by gear type. .............................. 29
Fig. 3.8 Coffin Bay. Top graph - historical trends in total catch by gear type. Middle graph – historical trends in total effort by gear type. Bottom graph – historical trends in CPUE by gear type. ........................................ 31
Fig. 3.9 Southern Spencer Gulf. Top graph - historical trends in total catch by gear type. Middle graph - historical trends in total effort by gear type. Bottom graph - historical trends in CPUE by gear type. .............. 33
Fig. 3.10 Southern Spencer Gulf. Top graph - historical trends in haul net catch for each of the three effort categories. Middle graph - historical trends in haul net effort for each of the three effort categories. Bottom graph - historical trends in CPUE for each of the three effort categories. ........................................................... 34
Fig. 3.11 Northern Spencer Gulf. Top graph - historical trends in total catch by gear type. Middle graph - historical trends in total effort by gear type. Bottom graph - historical trends in CPUE by gear type. .............. 36
Fig. 3.12 Northern Spencer Gulf. Top graph - historical trends in haul net catch for each of the three effort categories. Middle graph - historical trends in haul net effort for each of the three effort categories. Bottom graph - historical trends in CPUE for each of the three effort categories. ........................................................... 37
Fig. 3.13 Gulf St. Vincent. Top graph – historical trends in total catch by gear type. Middle graph – historical trends in total effort by gear type. Bottom graph – historical trends in CPUE by gear type. ............................. 39
Fig. 3.14 Gulf St. Vincent. Top graph – historical trends in haul net catch for each of the three effort categories. Middle graph – historical trends in haul net effort for each of the three effort categories. Bottom graph – historical trends in CPUE for each of the three effort categories. ....................................................................... 40
Fig. 3.15 Kangaroo Island. Top graph - historical trends in total catch by gear type. Middle graph - historical trends in total effort by gear type. Bottom graph - historical trends in CPUE by gear type. .............................. 42
Fig. 3.16 Kangaroo Island Top graph - historical trends in haul net catch for each of the three effort categories. Middle graph - historical trends in haul net effort for each of the three effort categories. Bottom graph - historical trends in CPUE for each of the three effort categories (note the exceptionally high estimate of CPUE for targeted effort in 2001). ................................................................................................................................. 43
5

Fig. 4.1 Age and size structures of samples of King George whiting collected between July 2006 and June 2007 from the West Coast of Eyre Peninsula (FWC = Far West Coast, MWC = Mid West Coast). .................. 47
Fig. 4.2 Age and size structures of samples of King George whiting collected between July 2006 and June 2007 from Spencer Gulf (NSG = Northern Spencer Gulf, SSG = Southern Spencer Gulf). ............................... 48
Fig. 4.3 Age and size structures of samples of King George whiting collected between July 2006 and June 2007 from Gulf St. Vincent and Investigator Strait (GSV = Gulf St. Vincent, KI = Kangaroo Island). ............. 49
Fig. 5.1 Map of South Australia showing the Marine Fishing Areas in which commercial catch and effort are reported, and the 6 spatial cells used in WhitEst, the King George whiting stock assessment model................. 52
Fig. 5.2 Monthly regional biological indicators 1984-2007 for the South Australian King George whiting population. These performance indicators of (a) yearly recruit numbers, (b) legal biomass averaged over the 12 months of each calendar year, and (c) harvest fraction as the monthly model-estimated catch divided by the start-of-month legal biomass, are estimated by the FRDC-sponsored spatial dynamic stock assessment model (WhitEst). ............................................................................................................................................................ 56
Fig. 5.3 Yearly State-wide (excluding spatial cell 6) model biological indicators 1984-2007 for South Australian King George whiting. These performance indicators of (a) yearly recruit numbers, (b) legal biomass averaged over the 12 months of each calendar year, and (c) harvest fraction as the yearly model-estimated catch divided by the yearly average legal biomass, are estimated by the FRDC-sponsored spatial dynamic stock assessment model (WhitEst). Error bars show 95% confidence intervals. ......................................................... 57
Fig. 5.4 Yearly regional model biological indicators 1984-2007 for South Australian King George whiting. Regions are the West Coast (including Far and Mid West Coast, and Coffin Bay, spatial cell 1 shown in Fig. 5.1), Spencer Gulf (Fig. 5.1, spatial cells 2 and 3), and Gulf St. Vincent and Kangaroo Island (Fig. 5.1, model cells 4 and 5). Error bars show 95% confidence intervals. .................................................................................. 58
Fig. 10.1. Model and data monthly catch total by weight. Data is total commercial catch (by all gears and target types) reported in monthly logbooks. Model outputs show model fitted values of commercial catch total.............................................................................................................................................................................. 77
6

LIST OF TABLES
Table 2.1 Summary of results of catch and targeted effort on King George whiting, based on the creel survey of the recreational boat fishery through 1994 –‘96 (McGlennon and Kinloch 1997). ............................................. 15
Table 2.2. Summary of results from the National Recreational and Indigenous Fishing Survey (Henry and Lyle 2003) for King George whiting in South Australia for the period of May 2000 – April 2001, compared with estimates of the commercial catch over the same time period............................................................................. 16
Table 2.3 Summary of regional estimates of recreational fishing effort for King George whiting, based on the results of the National Recreational and Indigenous Fishing Survey by region (Jones and Doonan 2005). ....... 16
Table 3.1 Fishery regions considered for the King George whiting fishery and the Marine Fishing Areas that comprise them (refer Fig. 3.1). ............................................................................................................................ 21
Table 6.1 Summary of the results of the comparisons between the general fishery performance indicators and the limit reference points for the King George whiting fishery, based on State-wide data. ................................ 61
Table 6.2 Yearly biological performance indicators for the three regions considered in the WhitEst model, as well as combined at the State-wide level. Limit reference points that were breached are highlighted in yellow. The current performance year covers the period January 2007 – December 2007.............................................. 63
Table A.1. Summary of total catch and effort by gear type for each of the seven fishery regions in 2005. (HL=handline, GN= gillnet, HN=haul net). Regions are identified in Table 3.1. .............................................. 74
Table A.2. Summary of total catch and effort by gear type for each of the seven fishery regions in 2006. ....... 74
Table A.3. Summary of total catch and effort by gear type for each of the seven fishery regions in 2007. ....... 74
7

1. EXECUTIVE SUMMARY
1. This is the 7th in a series of stock assessment reports on South Australia’s King George
whiting fishery since 1997. This assessment comes 3.5 years after important changes
were made to the management in response to a significant down-turn in the fishery
through the period of 1999 to 2002.
2. This report provides an assessment of three types of fishery performance indicators:
State-wide and regional commercial catch, effort and CPUE data by gear type for the
period of 1984 to 2007, thus adding three years of data since the last assessment; recent
data population size and age structures for numerous places across the State; estimates of
output parameters from the computer fishery assessment model WhitEst for the period
of 1984 to 2007, including seasonal and annual estimates of recruitment, fishable
biomass and exploitation rate.
3. The State-wide commercial fishery statistics were dominated by a declining trend in
fishing effort due to the ongoing decline in the number of commercial fishers. As a
consequence, commercial catch has also experienced a long downward trend. The trend
in State-wide handline CPUE between 2005 and 2007 was upward, thus indicating a
significant turn-around from the downward trend that was evident between 1999 and
2002. All regional trends in handline CPUE were also upward.
4. The size and age structures determined from market sampling done during 2006/07 did
not differ from the population structure evident through the 1990s and early 2000s. As
such, there is no evidence for population truncation over the past decade that is relatable
to the fishery.
5. The output parameters from WhitEst showed strong increases in recruitment and
fishable biomass for 2005-07, relative to the early 2000s, at the State-wide level and for
each of the principal regions of West Coast, Spencer Gulf and Gulf St. Vincent. The
model also indicated decreasing exploitation rates for the commercial sector.
6. The fishery performance indicators were compared against limit reference points.
Breaches of limit reference points related to the on-going reduction in total catch and to
the historically high levels of catch rates in each of 2005, 2006 and 2007. These results
8

were positive signs for the status of the fishery, indicating that there has been a
significant turn-around since the negative status that was evident from 1999 to 2002.
7. The biological fishery performance indicators that were compared against limit
reference points included fishable biomass, recruitment and exploitation rates. These
were estimated using the WhitEst model for both the regional and State-wide spatial
scales. Estimates of fishable biomass and recruitment rates in 2007 were generally
above the 5-year averages and breached limit reference points. Estimates of exploitation
rate were relatively low on the West Coast, but approached the maximum recommended
level in the two gulfs.
8. The fourth biological performance indicator considered was population age structure.
There was no evidence that any regional population age structures had changed
significantly over the past decade.
9. The primary uncertainty in our understanding of the King George whiting fishery relates
to the lack of time series data on catch and effort from the recreational sector. This
means that trends in total catch and exploitation are unknown. A recreational fishery
survey is currently underway, whose results will be comparable to data collected in
2000/01. These trends in recreational catch and effort data will be available for the next
stock assessment scheduled for 2011.
10. The positive indicators provide no concern about the current status of the stocks in South
Australia’s King George whiting fishery.
9

2. GENERAL INTRODUCTION
2.1. Overview
Stock assessments have been produced regularly for King George whiting since 1997 with this
being the seventh since that time. This report has two aims; to present information from the
fishery and the biology of the species, and to synthesise this information into an assessment of
the status of the stocks. The last stock assessment report was completed in August 2005,
which reported on data available up to the end of 2004 (McGarvey et al. 2005). This report
incorporates a further three years of commercial catch and effort data, presenting data collected
up to the end of 2007.
This chapter provides introductory information that establishes the context for the information
that follows in the subsequent empirical and modelling based chapters. It includes a
description of the fishery, a statement of the management regulations, and provides historical
data on catch and effort levels in the recreational sector. It also provides a summary of the
population biology and life history of the species based on research that has been done over the
past 30 years or so across southern Australia. Chapter 3 presents a summary of the data from
the commercial fishery for the three years of 2005 to 2007, i.e. State-wide and regional
estimates of fishery catch, effort and CPUE. These data are then placed in their historical
context based on similar information that has been collected since 1984. This involves a
detailed consideration of the regional estimates of catch and effort for the three main gear types
of handlines, haul nets and gill nets for seven fishery regions.
Chapter 4 provides an analysis of the population size and age structures based on samples
collected from across the State by market sampling between July 2006 and June 2007. Since
the population characteristics of King George whiting are so variable from place-to-place and
so dependent on life history processes it is important that such data be collected every few
years to assess for possible size and age truncation and also to update the computer fishery
assessment model.
Chapter 5 presents the output from the fishery stock assessment model WhitEst that integrates
several types of data from the fishery to output various parameters that indicate the status of
the fishery (Fowler and McGarvey 2000). The input data include: the time series of
commercial catch and effort data; data on recreational catch from the NRIF survey; and
regional estimates of population size and age structures that were collected at various times
10

between 1995 and 2008. The model output includes time-series of estimates of recruitment,
fishable biomass and annual exploitation rate for the three regions of West Coast, Spencer Gulf
and Gulf St. Vincent/Kangaroo Island.
Chapter 6 addresses the second aim of the report, i.e. to determine the status of the King
George whiting fishery in South Australia. This is done by considering the biological
performance indicators that are specified in the Marine Scalefish Fishery Management Plan
(Noell et al. 2006), and by comparing the data available for King George whiting against the
prescribed limit reference points. Chapter 7 also pertains to the second aim of the report. The
data from various sources that were considered in Chapters 3 to 6 are considered in the context
of the assessment of biological performance indicators to determine the status of the fishery at
the end of December 2007.
2.2. Description of Fishery
In South Australia, the fishery for King George whiting is geographically extensive, and
includes all coastal waters from Gulf St. Vincent westwards to Denial Bay, throughout which it
is intensively targeted by recreational and commercial marine scalefish fishers. The
commercial fishery produces, on average, about 3 times greater harvested biomass than
Victoria and significantly more than the catch of Western Australia (ABARE 2007). In South
Australia, King George whiting has traditionally been the most valuable marine scalefish
species, but in 2000/01 its total value dropped to second behind that of sardines (Knight et al.
2004). However, King George whiting remains the highest value species by unit weight
(Knight et al. 2007a).
The King George whiting fishery in South Australia is a "gauntlet" fishery. Juveniles move
from shallow, protected nursery areas to adjacent deeper water where they become vulnerable
to fishing. The faster growing individuals in each annual cohort reach fishable size during the
period of rapid growth in late summer and autumn when water temperatures are highest.
Seasonal levels of exploitation in the commercial fishery for both handlines and haul nets peak
in late autumn and winter, when the new recruits are targeted. Monthly catches generally peak
in July. In early summer, when fish reach about 3.5 years of age (based on a birth date of 1st
May (Fowler and Short 1998)), movement of young adult King George whiting in the two
gulfs is directed southwards. As fish move south they encounter a gauntlet of fishing nets and
lines that are used to target these young adults, resulting in high levels of exploitation. The
survivors that reach the southern, deeper, offshore spawning areas at and near the mouths of
11

the two gulfs replenish the populations of larger, older fish (Fowler et al. 2000a, Fowler et al.
2002).
The fisheries in Gulf St. Vincent, northern Spencer Gulf and the West Coast bays
predominantly take relatively small, young, immature fish of about 3 years of age that are quite
close to the minimum legal size, while fish on the spawning grounds tend to be larger and
older, with some up to 18 years of age. Analysis of the reproductive activity of adult fish
during the time of spawning in different regions of the two gulfs indicated that King George
whiting of comparable size and age showed no evidence of spawning activity in the northern
regions, but nearly all those found in the southern aggregations, regardless of size, showed
evidence of active spawning (Fowler et al. 1999, Fowler et al. 2000a). Since spawning in the
gulfs is confined to southern areas, the reproductive sustainability of populations is determined
by successful persistence of resident populations in these spawning areas. These spawning
sub-populations of larger, older fish are replenished annually by immigrants from inshore
fishing grounds and the upper gulfs. These immigrants are 3-4 years of age (Fowler et al.
2000a, Fowler et al. 2002). Historically, the exploitation of spawning aggregations was
relatively low, which may have accounted for the stable recruitment of King George whiting
over the years for which catch data were available (Fowler and McGarvey 2000, McGarvey et
al. 2000). However, anecdotal reports suggest that with a developing charter boat fishery and
an expanded range offshore of the commercial and recreational sectors, it is possible that
fishing pressure on the spawning aggregations has increased in recent years.
The commercial sector of the Marine Scalefish fishery uses a variety of gear types of which
handlines, haul nets and gillnets are the principal ones for targeting King George whiting.
Recreational fishing is by hook and line, principally from boats.
2.3. Management Regulations
New management regulations for the South Australian King George whiting fishery were
implemented in October 2004. These included: (1) an increase in legal minimum length
(LML) from 30 to 31 cm in all waters east of longitude 136°E; (2) the daily recreational bag
limit was reduced from 20 to 12 legal-size fish per person, with the boat limit reduced from 60
to 36 fish per boat; (3) the existing licence amalgamation scheme was enhanced by reducing
the number of points needed to acquire an amalgamated licence (from 26 to 24); (4) also, if a
non-licensed person was detected in possession of more than 75 King George whiting, which is
considered a commercial quantity, then that person may be guilty of an offence. At that time
12

consideration of appropriate management options were informed by management simulations
that were undertaken using the simulation model WhitSim that tested a range of different
strategies. The results of these had previously been summarised in an earlier stock assessment
report (McGarvey et al. 2003).
The principal means of effort control in the commercial sector is limited entry. Furthermore,
since 1994 a license amalgamation scheme has been operating to reduce effort in this sector
and to remove latent effort from the fishery. As a consequence, the number of commercial
Marine Scalefish licenses (‘M’ and ‘’B’ class) has fallen from 701 in 1984 to 350 in 2005/06.
Furthermore, the use of haul nets in the commercial sector is strongly regulated by a complex
suite of input and output controls. The nets must have a mesh size of less than 15 cm, a
maximum length of 600 m, a maximum drop of 5 m in the wings and 10 m in the bunt or
pocket. Their use is restricted to waters of less than 5 m depth, and is banned within half a
nautical mile of any officially recognised artificial reef and within a radius of 100 m of any
jetty, wharf or pier. Furthermore, there are many permanent and seasonal netting closures that
have been introduced over the years for such reasons as protection of nursery areas and
spawning grounds (Noell et al. 2006). A significant rationalisation of the net sector was
undertaken in 2005 when a net license buy-back scheme resulted in the reduction in net
endorsements from 104 to 49 and the removal of approximately 45% of net fishing effort. At
that time further permanent spatial closures to the net fishery were also implemented in large
parts of the State’s inshore waters.
Previous significant changes to the management of the King George whiting fishery include a
reduction in the recreational bag limit from 30 to 20 fish.day-1 or from 90 to 60 fish.boatday-1
in September 1994. This was followed by an increase in the LML from 28 to 30 cm TL for
both commercial and recreational sectors in September 1995 (Fowler and McGarvey 1997).
2.4 Recreational Fishery
Since the production of the Marine Scalefish Green Paper (Jones et al. 1990) our understanding
of the recreational catch and effort for King George whiting in South Australia has been based
on results from two surveys; a creel survey through 1994-96 (McGlennon and Kinloch 1997),
and the National Recreational and Indigenous Fishing Survey (NRIFS) for the period of May
2000 – April 2001 (Henry and Lyle 2003). The sampling methodologies and estimates of
recreational catch and effort for King George whiting from these two large-scale surveys are
described below. Furthermore, since September 2005 the charter boat sector has been
13

providing monthly catch and effort data that were recently summarised in a status report
(Knight et al. 2007b).
Creel Survey (1994-’96)
This was an extensive two-year SARDI/FRDC project that estimated the recreational catch of
marine boat-fishers in several regions across South Australia, between Victor Harbor and
Ceduna (McGlennon and Kinloch 1997). The study used the ‘bus-route’ survey method where
interviewers travelled around pre-determined circuits of boat ramps, where at each ramp the
number of boat trailers was counted to estimate fishing effort and any fishers that returned to
the boat ramp during the waiting period were interviewed to provide estimates of catch. The
results were used to derive estimates of total catch and effort, using the techniques summarised
in McGlennon and Kinloch (1997). Since the creel survey was restricted to some public boat
ramps during daylight hours it provided estimates of only a subset of the total recreational
catch. Also, Kangaroo Island and east of Victor Harbor were excluded due to the time and
costs of travel.
Spatial comparison
Over the 2 years of the recreational boat survey, 631 sample-days were surveyed during which
3,513 interviews were conducted. Total annual fishing effort was estimated at 988,980 boat
hours, distributed over 200,000 boat trips. Of this total fishing effort, 41% was targeted at
King George whiting. The total harvest of all major species was estimated to be 3,770,256
fish, which included 1,154,662 (31% of total) King George whiting.
Of the catch of King George whiting, 98.8% was taken in six of the fishery regions for which
commercial fishery data are considered, i.e. Far West Coast (FWC), Mid-West Coast (MWC),
Coffin Bay (CB), Southern Spencer Gulf (SSG), Northern Spencer Gulf (NSG) and Gulf St.
Vincent (GSV) (Table 2.1). Targeted recreational effort increased from west to east, probably
reflecting the trend in human population density, with Gulf St. Vincent having the highest
recreational effort due to the influence of metropolitan Adelaide. Total catches also decreased
from east to west, presumably reflecting geographic variation in fishing effort. However,
CPUE was variable among the regions, i.e. the two Spencer Gulf regions and the Far West
Coast had the highest catch rates, while Gulf St. Vincent and the Mid West Coast produced the
lowest.
14

Table 2.1 Summary of results of catch and targeted effort on King George whiting, based on the creel survey of the recreational boat fishery through 1994 –‘96 (McGlennon and Kinloch 1997).
Region Total catch (t) Total catch (numbers)
Targeted effort
(boat-days)
CPUE (kg.boat-day-1)
CPUE (no.boat-day-1)
% of total by rec fishery
FWC 21.1 94,039 4,537.1 4.65 20.7 15.8 MWC 5.8 35,466 3,871.3 1.50 9.2 14.9 CB 21.3 110,184 7,039.4 3.03 15.7 28.1 SSG 80.5 274,220 15,605.8 5.16 17.6 39.3 NSG 51.9 227,269 12,267.7 4.23 18.5 34.9 GSV 85.1 399,536 33,230.9 2.56 12.0 48.4 Total 265.7 1,140,714 76,552.2 34.2
In Gulf St. Vincent, the total recreational catch was almost comparable with that of the
commercial fishery. Westwards from there, there was a trend of decreasing significance of
recreational catch. In Spencer Gulf, the recreational component was greater than a third of the
total, but on the west coast the recreational catch was less than one sixth of the total.
National Recreational and Indigenous Fishing Survey (2000/01)
Recreational Catch
A national FRDC-NHT funded project for estimating non-commercial catches of marine fish
species was undertaken from May 2000 to April 2001 (Henry and Lyle 2003). The sampling
method was by telephone and diary survey, providing a more comprehensive census of the
total recreational and indigenous catch than the creel survey described above. This telephone
and diary survey also included catches from charter boats, which accounted for 1.7% of the
recorded recreational fishing effort.
The estimate of State-wide recreational harvest of King George whiting was 2,238,071 fish,
with an estimated total weight of 584.7 tonnes (Table 2.2). Both these estimates were
approximately twice those from the creel survey (c.f. Table 2.1). In 2000/01 the highest
catches were made in (GSV + KI) and SSG. The catches decreased from east to west. In
every region the estimated recreational catch in 2000/01 was substantially higher than that of
1994/96. For the survey period, the total State-wide catch of King George whiting, combining
recreational and commercial catches, was 1,023.4 tonnes. The estimated recreational catch of
584.7 tonnes exceeded that of the commercial catch. Also, in most regions the recreational
component of the total catch exceeded the commercial component (Table 2.2).
15

Table 2.2. Summary of results from the National Recreational and Indigenous Fishing Survey (Henry and Lyle 2003) for King George whiting in South Australia for the period of May 2000 – April 2001, compared with estimates of the commercial catch over the same time period.
Region Estimate of numbers caught
Average weight per
fish (g)
Estimated recreational
catch (tonnes)
Estimated commercial
catch (tonnes)
Total regional
catch (tonnes)
Recreational % of total
(FWC + MWC) 227,867 233.01 53.1 138.6 191.7 27.7 CB 425,941 199.40 84.9 24.3 109.2 77.7 SSG 548,354 322.09 176.6 107.7 284.3 62.1 NSG 407,218 209.51 85.3 69.0 154.3 55.3 (GSV + KI) 588,940 289.26 170.4 98.8 269.2 63.3 Other Regions 39,751 362.20 14.4 0.3 14.7 98.0 Total 2,238,071 584.7 438.7 1,023.4 57.1
Recreational Effort
The NRIF survey estimated that there were 328,277 recreational fishers in the State,
representing approximately 176,000 households that used a total of 38,713 boats for their
recreational fishing activities (Jones and Doonan 2005). Recreational fishers from across all
South Australian waters, including inland waters and the Lakes and Coorong, engaged in an
estimated 2,216,041 fishing events that occupied a total of 9,767,947 fishing hours. Of these
totals, it is estimated that there were 1,544,295 fishing events and 5,783,000 fishing hours
undertaken in marine waters for Marine Scalefish fish species.
Table 2.3 Summary of regional estimates of recreational fishing effort for King George whiting, based on the results of the National Recreational and Indigenous Fishing Survey by region (Jones and Doonan 2005).
Fishing Region Effort (hrs) -targeted on KGW
Effort (hrs) – KGW not
targeted, but landed
Total effort (hrs) on KGW
Targeted effort (% of total effort)
West Coast 317,632 80,404 398,036 79.8 Spencer Gulf 570,716 127,402 698,118 81.8 Gulf St. Vincent 359,487 120,476 479,963 74.9 Kangaroo Island 45,251 10,436 55,687 81.3 South East 46,574 28,194 74,768 62.3 Total 1,339,659 366,912 1,706,571 78.5
For King George whiting the estimates of total estimated targeted and non-targeted effort were
1,339,659 hours and 366,912 hours, respectively (Table 2.3). Thus, targeted effort constituted
about 78.5% of the total on King George whiting. The highest levels of effort were in the two
gulfs, whilst Spencer Gulf supported the highest targeted effort. The West Coast also received
16

a high level of targeted recreational effort. The waters around Kangaroo Island and the South
East experienced relatively low levels of effort on King George whiting, compared with the
other regions.
2.4. Population Biology and Life History
Although the general life cycle of King George whiting has been known for a number of years
(Jones et al. 1990), our understanding of it was further enhanced through FRDC project 95/008
(Fowler and McGarvey 2000). That study synthesised information on population age
structures, adult movement patterns, reproductive biology, characteristics of recruitment and
genetic structure to develop a comprehensive picture of the life history and stock structure of
this species in South Australia.
The nursery areas for recruitment of King George whiting are shallow, protected bays where
the post-larvae arrive during the winter and spring in each year. Important nursery areas
include Barker Inlet, Franklin Harbor, and the West Coast bays. Juveniles reside in these
nursery habitats for a year or two before they move out into gulf waters or deeper areas of the
West Coast bays, which are characterised by broken, low-profile reef and stands of seagrass
(e.g. Posidonia spp.) (Jones et al. 1990).
When the fish reach 3-4 years of age they are capable of moving distances of up to several
hundred kilometres within a few months (Fowler and McGarvey 1997, Fowler and March
2000, Fowler and McGarvey 2000, McGarvey and Feenstra 2002, Fowler et al. 2002). They
migrate from nursery areas to spawning grounds, whilst there are also less directed movements
among coastal areas, mostly along the coast. Fish from Gulf St. Vincent and northern Spencer
Gulf move the greatest distances, generally in a net southerly direction. Some tagged fish from
Gulf St. Vincent were recaptured along the north coast of Kangaroo Island; some from
northern Spencer Gulf were recaptured principally in Hardwicke Bay in the south-east of the
gulf, whilst some were found around the islands of the south-western part of the gulf; those
from West Coast bays were rarely recaptured, but are thought to end up around shoals and
islands offshore of the bays. In contrast, fish tagged near Kangaroo Island and southern
Spencer Gulf did not move far and showed no systematic directional displacement (Fowler and
McGarvey 1997, 1999; Fowler and March 2000; Fowler et al. 2002). These different
movement patterns influence population structure. In those source areas from where fish move
and where fishing is concentrated, population structure is generally truncated, consisting of
small fish from a few young age classes. By contrast, at destination locations, many older age
17

classes are well represented with some fish up to 18 years of age (Fowler et al. 1999, Fowler et
al. 2000a).
Spawning occurs at the offshore grounds to which fish migrate, including: in Investigator Strait
along the north coast of Kangaroo Island; the south-eastern tip of Yorke Peninsula in Gulf St.
Vincent (Tapley Shoal); and south-eastern Spencer Gulf around Corny Point and Wardang
Island. Spawning typically occurs between March and May (Fowler et al. 1999, Fowler et al.
2000a). Patterns of distribution and abundance of larvae, determined by plankton sampling
during the 1980s (Bruce 1989), provided further evidence that spawning occurs in the southern
locations and that larvae are advected northwards into the gulfs (B. Bruce unpublished data).
To date, the spawning areas responsible for replenishing the West Coast bays have not been
determined. Commercially harvested fish from these bays display minimal gonad maturation,
suggesting that spawning may occur further offshore from these fishing grounds.
The long pre-settlement duration of 80 to >120 days for larval King George whiting (Fowler
and Short 1996) would be expected to provide ample opportunity for advection over long
distances by hydrodynamic processes, as is the case for Victorian populations (Jenkins et al.
2000). In Port Phillip Bay, Victoria, the inter-annual variation in post-larval abundance is
strongly correlated with the strength of the zonal westerly winds that presumably influence the
rate of transport of the larvae. This influences recruitment success and productivity to the
fishery several years later (Jenkins 2005). Because of this, it is possible that spawning by the
South Australian stock ultimately replenishes the populations of King George whiting in Port
Phillip Bay, Western Port and Corner Inlet, i.e. the places where this species is commercially
fished in Victoria. In contrast, however, hydrodynamic modelling for the coastal areas around
South Australia suggests that King George whiting larvae are advected over only relatively
short distances of 50-100 km (Fowler et al. 2000b). This suggests that the South Australian
populations are sustained by local spawning. The hydrodynamic modelling suggested the
existence of relationships between particular spawning locations and nursery areas separated
only by 100-200 km. Furthermore, the combination of hydrodynamic modelling, sampled
larval distributions, and adult movement patterns suggest that the two gulfs are largely distinct
self-sustaining populations. Nevertheless, analysis of stock structure based on mitochondrial
DNA and microsatellite primers found no significant phylogeographic structure across the
distribution of King George whiting (Haigh and Donnellan 2000). This is consistent with its
long pre-settlement duration, and does not counter the above-mentioned subpopulation model
since only a minimal but consistent exchange of individuals (two or three fish per year)
between sub-populations is sufficient to maintain them as genetically homogeneous (Taylor
and Dizon 1996).
18
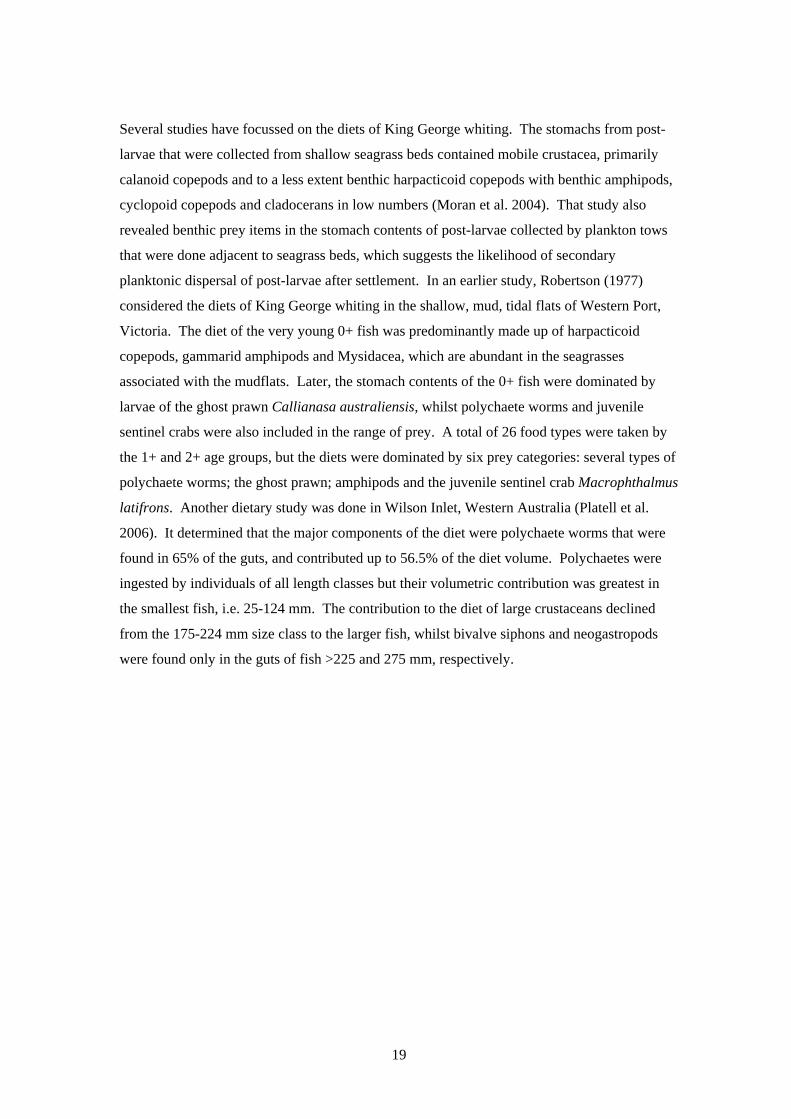
Several studies have focussed on the diets of King George whiting. The stomachs from post-
larvae that were collected from shallow seagrass beds contained mobile crustacea, primarily
calanoid copepods and to a less extent benthic harpacticoid copepods with benthic amphipods,
cyclopoid copepods and cladocerans in low numbers (Moran et al. 2004). That study also
revealed benthic prey items in the stomach contents of post-larvae collected by plankton tows
that were done adjacent to seagrass beds, which suggests the likelihood of secondary
planktonic dispersal of post-larvae after settlement. In an earlier study, Robertson (1977)
considered the diets of King George whiting in the shallow, mud, tidal flats of Western Port,
Victoria. The diet of the very young 0+ fish was predominantly made up of harpacticoid
copepods, gammarid amphipods and Mysidacea, which are abundant in the seagrasses
associated with the mudflats. Later, the stomach contents of the 0+ fish were dominated by
larvae of the ghost prawn Callianasa australiensis, whilst polychaete worms and juvenile
sentinel crabs were also included in the range of prey. A total of 26 food types were taken by
the 1+ and 2+ age groups, but the diets were dominated by six prey categories: several types of
polychaete worms; the ghost prawn; amphipods and the juvenile sentinel crab Macrophthalmus
latifrons. Another dietary study was done in Wilson Inlet, Western Australia (Platell et al.
2006). It determined that the major components of the diet were polychaete worms that were
found in 65% of the guts, and contributed up to 56.5% of the diet volume. Polychaetes were
ingested by individuals of all length classes but their volumetric contribution was greatest in
the smallest fish, i.e. 25-124 mm. The contribution to the diet of large crustaceans declined
from the 175-224 mm size class to the larger fish, whilst bivalve siphons and neogastropods
were found only in the guts of fish >225 and 275 mm, respectively.
19

3. TRENDS IN COMMERCIAL CATCH, EFFORT AND CPUE
3.1 Introduction
Commercial fishers in the Marine Scalefish fishery are required to submit a monthly catch
return that relates their catch and effort for that particular month. Such data have now been
collected since 1984, thus providing a data time-series that exceeds 20 years. For this stock
assessment on King George whiting the catch and effort data were accumulated across fishers
to provide regional, annual totals of catch and effort by gear type, which were then used to
calculate annual estimates of catch per unit effort (CPUE) for each region. The data for the
three main gear types, i.e. handlines, haul nets and gill nets are reported for the seven regions
shown in Fig. 3.1. The Marine Fishing Areas that comprise these are identified in Table 3.1.
1716
40
36
11
138° E136° E134° E
4948
116
17
2
3
5
430
34
9
108
15
27
28
39 41 4244
43
35
33
32
2223
21
29
7
31
1820
11
19
6
7
1617
35° S
33° S
0
SCALE (km)
100
36
1716
40
36
11
138° E138° E138° E136° E136° E136° E134° E134° E134° E
4948
116
17
2
3
5
430
34
9
108
15
27
28
39 41 4244
43
35
33
32
2223
21
29
7
31
1820
11
19
6
7
1617
35° S
33° S33° S
0
SCALE (km)
1000
SCALE (km)
100
36
Fig. 3.1 Map of South Australia showing the seven fishery regions for which data are presented in this report. (1 = Far West Coast, 2 = Mid West Coast, 3 = Coffin Bay, 4 = Southern Spencer Gulf, 5 = Northern Spencer Gulf, 6 = Gulf St. Vincent, 7 = Kangaroo Island.)
20

With respect to fishing effort, data are reported as fisherdays, which relate to the number of
days fished and number of personnel involved. If there were two fishers on board a vessel for
a day of fishing then this counted as two fisherdays. There are two components of fishing
effort for each gear type, i.e. targeted and untargeted effort. For handlines and gillnets, total
effort was estimated from targeted effort, which was scaled upwards by the proportional
additional catch that was taken by untargeted effort. Thus, for handlines and gill nets it was
possible to provide annual estimates of total catch and effort and associated estimates of
CPUE. However, for haul nets the situation is more complex because fishers may catch
substantial numbers of King George whiting whilst targeting other species, or when targeting
no species in particular. Under such circumstances it is not possible to determine the targeted
effort that was directed specifically at King George whiting, making it impossible to provide a
direct estimate of targeted CPUE. Consequently, for haul nets, estimates of catch, effort and
CPUE are provided for three different fishing effort categories: targeted effort; effort targeted
at other species; and effort not directed at any particular species.
Table 3.1 Fishery regions considered for the King George whiting fishery and the Marine Fishing Areas that comprise them (refer Fig. 3.1).
Region name Marine Fishing Areas Far West Coast (FWC) 07, 08, 09, 10 Mid West Coast (MWC) 15, 16, 17, 18 Coffin Bay (CB) 27, 28 Southern Spencer Gulf (SSG) 29, 30, 31, 32, 33 Northern Spencer Gulf (NSG) 11, 19, 20, 21, 22, 23 Gulf St. Vincent (GSV) 34, 35, 36, 40, 43 Kangaroo Island (KI) 39, 41, 42, 44, 48, 49
3.2 Results
Trends in commercial catch and effort
The specific data on commercial catches and levels of effort by region and gear type for each
year of 2005, 2006 and 2007 are presented in Tables A.1, A.2 and A.3 in Appendix 1. These
add three years of data to the longterm trends. The estimates of State-wide commercial catch of
King George whiting decreased substantially between 1984 and 2007 (Fig. 3.2). From 1984 to
1992 catch was variable, showed no long term trend, and culminated in the highest ever annual
catch of 776 t in 1992 (Fig. 3.2). Subsequently, catch decreased and stabilised at 550-600 t.yr-1
until 1999, before dropping substantially below 450 t.yr-1 in 2000. It dropped again to 370-380
t.yr-1 in 2002 and 2003, and has been consistent at 340-350 t.yr-1 between 2004 and 2007. As
21

such, in 2007 the commercial catch of King George whiting was 42% lower than that taken in
1999 and 55% lower than that of 1992.
The estimates of annual value of the commercial fishery for King George whiting increased
between 1984 and 1995 from $2.8 million to $5.4 million. The value then dropped
substantially in 1997 to less than $4 million, before increasing again in 1999 to greater than $5
million. The total value of the King George whiting commercial fishery decreased in both
2004 and 2005, before increasing again to above $4.5 million in 2006 (Fig. 3.2).
0
200
400
600
800
1000
1984
1986
1988
1990
1992
1994
1996
1998
2000
2002
2004
2006
Cat
ch (t
onne
s)
0
1000
2000
3000
4000
5000
6000
Valu
e ($
,000
)
Catch Value
Fig. 3.2 Total annual catch and value of the South Australian King George whiting fishery since 1984.
Since 1984, handlines have been the dominant gear type in the commercial fishery (Fig. 3.3).
Between 1984 and 1999 handline catch varied around 400 t.yr-1, with no obvious long-term
trend. However, since then handline catch has dropped consistently from 426 t in 1999 to 281
t in 2007, i.e. a drop of 34%, with a decline since 1992 of 39%. Haul nets remain the second
most significant gear type for taking King George whiting despite that catches have decreased
systematically since the record catch taken with this gear in 1992. The haul net catch of 40 t
recorded in 2006 was the lowest yet recorded after which there was a marginal increase to 51 t
in 2007. The gillnet catch has always been below 50 t.year-1. In 2000, it dropped by 49% to
24 t and has gradually been decreasing since then, falling to only 13 t in 2007.
Handline effort has decreased from 31,235 fisherdays in 1992 to 14,410 fisherdays in 2007, i.e.
a reduction of 54% over this 15 year period (Fig. 3.3). Gill net effort has declined by 88%
from 2,523 to only 305 fisherdays over the same period. Such decreases in effort reflect the
declining trend in the number of licence holders in the commercial fishery, which accelerated
22

after 1994 when the licence amalgamation scheme was introduced (Fig. 3.4). Consequently,
over the years there has been a considerable decrease in numbers of commercial fishers who
targeted and/or caught King George whiting (Fig. 3.4).
05000
10000150002000025000300003500040000
1984
1986
1988
1990
1992
1994
1996
1998
2000
2002
2004
2006
Effo
rt (f
ishe
rday
s)
05
1015202530354045
1984
1986
1988
1990
1992
1994
1996
1998
2000
2002
2004
2006
CPU
E (k
g/fis
herd
ay)
State-wide totals
0
100200
300400
500
600700
800
1984
1986
1988
1990
1992
1994
1996
1998
2000
2002
2004
2006
Cat
ch (t
onne
s)
TotalGillnetHandlineHaulnet
Fig. 3.3 Historical trends in State-wide totals for catch, effort and CPUE for the main gear types used by the commercial fishing sector. Note that it was not possible to provide State-wide estimates of targeted effort for haul nets, which thereby prevented estimating targeted CPUE.
23

The estimates of State-wide CPUE for handlines and gillnets have been variable, but generally
trended upward between 1984 and 1999 (Fig. 3.3). Both dropped noticeably in 2000. Since
then CPUE has increased dramatically in the gillnet fishery, but these estimates are based on
low levels of catch and effort. Targeted CPUE from the handline fishery decreased
substantially in both 2000 and 2002, but has trended upwards since 2002. In 2007, State-wide
handline CPUE was 19.5 kg.fisherday-1, i.e. the highest ever recorded, being marginally above
the previous maximum of 19.1 kg.fisherday-1 recorded in 1999.
0
100
200
300
400
500
600
700
1983
1985
1987
1989
1991
1993
1995
1997
1999
2001
2003
2005
2007
Taking KGWTargeting KGW
0
100
200
300
400
500
600
1983
1985
1987
1989
1991
1993
1995
1997
1999
2001
2003
2005
2007
'M' class
'B' class
Rock lobster
Num
ber o
f lic
ence
hol
ders
0
100
200
300
400
500
600
700
1983
1985
1987
1989
1991
1993
1995
1997
1999
2001
2003
2005
2007
Taking KGWTargeting KGW
0
100
200
300
400
500
600
1983
1985
1987
1989
1991
1993
1995
1997
1999
2001
2003
2005
2007
'M' class
'B' class
Rock lobster
Num
ber o
f lic
ence
hol
ders
Fig. 3.4 Top graph shows the number of licence holders who could legally take King George whiting in each year. Bottom graph shows the actual number of licence holders who reported taking some King George whiting and those who targeted this species in each year.
24

Seasonality of catch
The seasonality of the State-wide commercial catch of King George whiting is apparent from
monthly catch totals (Fig. 3.5). For the period of July 2003 to December 2007 monthly catches
were highest during winter, and dropped to annual minima in summer. The monthly estimates
for effort on King George whiting tended to be highest from March through to September, but
were particularly low in each year between November and January.
0
10
20
30
40
50
60
Jul-0
3
Oct
-03
Jan-
04
Apr
-04
Jul-0
4
Oct
-04
Jan-
05
Apr
-05
Jul-0
5
Oct
-05
Jan-
06
Apr
-06
Jul-0
6
Oct
-06
Jan-
07
Apr
-07
Jul-0
7
Oct
-07
Cat
ch (t
onne
s)
0
500
1000
1500
2000
2500
Effo
rt (f
ishe
rday
s)
Total catch Targeted effort
Fig. 3.5 Monthly estimates of total State-wide catch and fishing effort (all gears combined) for the King George whiting commercial fishery between July 2003 and December 2007.
25

Regional Catch and Effort Statistics
The remainder of this chapter provides a summary of the catch, effort and CPUE data from
1984 to 2007 for each of the seven fishery regions that were identified in Table 3.1 and Fig.
3.1. For each region, estimates of total catch are presented for the three gear types of
handlines, haul nets and gillnets. Estimates of total effort and CPUE are provided for
handlines and gill nets. For the regions where haul nets remain a significant gear type (NSG,
GSV and KI), or have diminished recently as a consequence of the netting closures in 2005
(SSG) a separate figure is provided that relates the region-specific estimates of catch, effort
and CPUE for where effort was reported as ‘targeted’, ‘no specific species targeted’ and ‘other
species targeted’.
Far West Coast (Denial and Streaky Bays)
The annual catch from the bays of the Far West Coast is usually the highest of any region
across the State (Appendix 1 - Tables A.1-A.3). Historically, the catch in this region has been
dominated by the handline sector since the implementation of a netting ban in 1958. The
handline catch from the Far West Coast reached a peak of 150,455 kg in 1989 after which it
declined consistently until 1998 (Fig. 3.6). It was then highly variable through the period of
1999 to 2002, but has been gradually declining since then. Between 1984 and 1997 handline
effort declined by 40% to approximately 6,000 fisherdays.year-1 (Fig. 3.6). It then increased
again in 1999, was relatively stable until 2004 but has gradually declined since then. Targeted
handline effort declined by 24.6% from 6,384 fisherdays in 2004 to 4,815 fisherdays in 2007.
CPUE showed a long-term increasing trend through the period of 1984 and 1999 (Fig. 3.6).
Through this period there were two notable peaks, one from 1989 to 1992 and the second from
1996 to 1999. It was in this latter year that the highest CPUE ever of 22.3 kg.fisherday-1 was
recorded. Between 1999 and 2004, CPUE declined substantially, dropping to a minimum of
15.9 kg.fisherday-1. It has subsequently risen again to 18.7 kg. fisherday-1.
26

0
2000
4000
6000
8000
10000
12000
1984
1986
1988
1990
1992
1994
1996
1998
2000
2002
2004
2006
Effo
rt (f
ishe
rday
s)
0
5
10
15
20
25
1984
1986
1988
1990
1992
1994
1996
1998
2000
2002
2004
2006
CPU
E (k
g/fis
herd
ays)
Far West Coast
0
40000
80000
120000
160000
200000
1984
1986
1988
1990
1992
1994
1996
1998
2000
2002
2004
2006
Cat
ch (k
g)
Gillnet Handline
Haulnet Long-term mean
0
2000
4000
6000
8000
10000
12000
1984
1986
1988
1990
1992
1994
1996
1998
2000
2002
2004
2006
Effo
rt (f
ishe
rday
s)
0
5
10
15
20
25
1984
1986
1988
1990
1992
1994
1996
1998
2000
2002
2004
2006
CPU
E (k
g/fis
herd
ays)
Far West Coast
0
40000
80000
120000
160000
200000
1984
1986
1988
1990
1992
1994
1996
1998
2000
2002
2004
2006
Cat
ch (k
g)
Gillnet Handline
Haulnet Long-term mean
Fig. 3.6 Far West Coast. Top graph – historical trends in total catch by gear type. Middle graph – historical trends in total effort by gear type. Bottom graph – historical trends in CPUE. The long-term mean for the handline fishery is indicated on each graph.
27

Mid West Coast (Baird and Venus Bays)
The catch from the bays of the Mid West Coast is generally considerably less than that from
the Far West Coast (Tables 3.2 - 3.4). Handlines, gillnets and hauling nets have each
historically contributed to the catches in this region in order of decreasing significance (Fig.
3.7). Prior to 2005, Baird Bay and half of Venus Bay were closed to net fishing. In August
2005, the remaining part of Venus Bay was also closed to net fishing, thus restricting the
fishing activity in these bays to line fishing.
The handline catch in these West Coast bays has generally been highly variable from year-to-
year but in 2000 dropped to the lowest recorded level, and then remained low in both 2001 and
2002. Handline catch has subsequently increased considerably to at least an average catch
level in 2005. The catches from gillnets and haul nets have also been historically quite
variable, but they also dropped to their lowest levels in the period of 2000 to 2002. From then
they remained low until no net catch was taken subsequent to the netting closures in August
2005.
Handline effort has been highly variable from year-to-year but nevertheless has demonstrated a
significant and accelerating long-term decline, particularly through the period of 1999 to 2002,
culminating in the lowest recorded effort in 2001 and 2002 (Fig. 3.7). There was a substantial
increase in effort in 2003, followed by another fall in 2004. Effort stabilised at a relatively low
level through the years of 2005 to 2007. Effort in the gillnet sector declined significantly after
1992, falling to its lowest level in 2002 before dropping to zero in 2006 due to the net closure.
Between 1984 and 2000 handline CPUE was quite variable by virtue of the highly variable
annual catch and effort data. There was no long-term trend through this period. Nevertheless,
since 2000 handline CPUE has risen consistently from a low level of 7.8 kg.fisherday-1 to a
maximum of 23.8 kg.fisherday-1 in 2006. Gillnet CPUE was also highly variable between 1984
and 2000 before increasing considerably through the years of 2002 to 2005 (Fig. 3.7).
28

0
20000
40000
60000
80000
100000
1984
1986
1988
1990
1992
1994
1996
1998
2000
2002
2004
2006
Cat
ch (k
g)
GillnetHandlineHaulnetLong-term average
0
500
1000
1500
2000
2500
3000
3500
4000
1984
1986
1988
1990
1992
1994
1996
1998
2000
2002
2004
2006
Effo
rt (f
ishe
rday
s)
0
5
10
15
20
25
30
35
1984
1986
1988
1990
1992
1994
1996
1998
2000
2002
2004
2006
CPU
E (k
g/fis
herd
ays)
Mid West Coast
0
20000
40000
60000
80000
100000
1984
1986
1988
1990
1992
1994
1996
1998
2000
2002
2004
2006
Cat
ch (k
g)
GillnetHandlineHaulnetLong-term average
0
500
1000
1500
2000
2500
3000
3500
4000
1984
1986
1988
1990
1992
1994
1996
1998
2000
2002
2004
2006
Effo
rt (f
ishe
rday
s)
0
5
10
15
20
25
30
35
1984
1986
1988
1990
1992
1994
1996
1998
2000
2002
2004
2006
CPU
E (k
g/fis
herd
ays)
Mid West Coast
Fig. 3.7 Mid West Coast. Top graph - historical trends in total catch by gear type. Middle graph - historical trends in total effort by gear type. Bottom graph - historical trends in CPUE by gear type.
29

Coffin Bay
As consequence of a review of the net fishery that was undertaken in 1995 and 1996, Coffin
Bay was closed to net fishing in 1996. As such, this region has effectively been a line fishery
since then.
Between 1984 and 1988 handlines and haul nets contributed similarly to the King George
whiting catch in Coffin Bay (Fig. 3.8). After this, the two trend lines diverged as the catch
from haul nets increased, whilst that from handlines decreased. The haul net catch decreased
between 1990 and 1995, before dropping to zero due to the net closure. Handline catch
increased significantly at that time, but subsequently declined to a minimum in 2005. Total
handline catch increased considerably from 6,121 kg in 2005 to 18,704 kg in 2006.
The temporal variation in fishery catches is also reflected in the trends in effort (Fig. 3.8).
There have been several peaks and troughs in handline effort since the mid 1980’s with the two
peak years being 1995 and 2000. Since then handline effort declined to a minimum of 316
fisherdays in 2005 before increasing to 713 fisherdays in 2007. Although gillnet effort has
always been low in Coffin Bay, it decreased considerably in 1994, before dropping to zero in
1997.
CPUE for handlines increased substantially and reached a maximum of 24 kg.fisherday-1 in
1995 (Fig. 3.8). There was another peak in 1998 of 23.0 kg.fisherday-1 before declining
systematically over a six-year period, dropping to a minimum of 17.8 kg.fisherday-1 in 2002.
Since 2004, handline CPUE has gradually increased to 26.2 kg.fisherday-1 that was attained in
2007.
30

0
10000
20000
30000
40000
50000
1984
1986
1988
1990
1992
1994
1996
1998
2000
2002
2004
2006
Cat
ch (k
g)GillnetHandlineHaulnet
0
500
1000
1500
2000
2500
1984
1986
1988
1990
1992
1994
1996
1998
2000
2002
2004
2006
Effo
rt (f
ishe
rday
s)
0102030405060708090
1984
1986
1988
1990
1992
1994
1996
1998
2000
2002
2004
2006
CPU
E (k
g/fis
herd
ays)
Coffin Bay
0
10000
20000
30000
40000
50000
1984
1986
1988
1990
1992
1994
1996
1998
2000
2002
2004
2006
Cat
ch (k
g)GillnetHandlineHaulnet
0
500
1000
1500
2000
2500
1984
1986
1988
1990
1992
1994
1996
1998
2000
2002
2004
2006
Effo
rt (f
ishe
rday
s)
0102030405060708090
1984
1986
1988
1990
1992
1994
1996
1998
2000
2002
2004
2006
CPU
E (k
g/fis
herd
ays)
Coffin Bay
Fig. 3.8 Coffin Bay. Top graph - historical trends in total catch by gear type. Middle graph – historical trends in total effort by gear type. Bottom graph – historical trends in CPUE by gear type.
31

Southern Spencer Gulf
Handlines are the most significant gear type in this region followed by haul nets and gillnets
(Fig. 3.9). Catch in the handline sector has been highly variable over the years with three
obvious peaks, one in 1986, the next in 1991 and the third in 1997. Since then, catches have
decreased systematically from 131,074 kg to only 57,395 kg in 2004 before recovering to
74,140 kg in 2007. Haul net catch declined considerably between 1984 and 2004, particularly
through two periods, i.e. 1992 to 1995 and 1999 to 2002. There was a marginal increase in
haul net catch between 2003 and 2005 before dropping to minimal levels as a consequence of
the netting closures that were implemented in 2005. Gillnet catches also fell considerably in
2000, and have remained low since. Nevertheless, they remain considerably higher than the
haul net catches.
Handline effort has been variable since 1984, with peaks in 1986, 1991-92, and a minor one in
1997 (Fig. 3.9). Nevertheless, there has been a consistent declining trend since the peak in
1992, when handline effort was 8,997 fisherdays. This declined by 61.4% to 3,471 fisherdays
in 2007. Gillnet effort declined from a maximum of 1,018 fisherdays in 1999 to only 59
fisherdays in 2006, before increasing marginally to 81 fisherdays in 2007.
The estimates of CPUE for handlines increased between 1984 and 1998, declined consistently
to 2003, but then increased in each year to 2007 (Fig. 3.9). CPUE was variable for the gillnet
sector between 1984 and 1997, before increasing dramatically in 1998. Since then it has been
highly variable, due to the very low levels of catch and effort.
The annual catches with haul nets through the period of 2000 to 2004 were the lowest ever
recorded, due to low fishing effort (Fig. 3.10). The catches then dropped to negligible amounts
in 2006 and 2007 due to the large areas that were closed to netting in 2005. The estimates of
CPUE were highly variable in recent years, which may reflect that the catches and effort were
low and variable. The time series for the different categories of CPUE do not show any
consistent trend and are difficult to interpret because of the low catch and effort levels.
32

0
40000
80000
120000
160000
1984
1986
1988
1990
1992
1994
1996
1998
2000
2002
2004
2006
Cat
ch (k
g)
GillnetHandlineHaulnet
0
2000
4000
6000
8000
10000
12000
1984
1986
1988
1990
1992
1994
1996
1998
2000
2002
2004
2006
Effo
rt (f
ishe
rday
s)
0
10
20
30
40
50
60
1984
1986
1988
1990
1992
1994
1996
1998
2000
2002
2004
2006
CPU
E (k
g/fis
herd
ays)
Southern Spencer Gulf
0
40000
80000
120000
160000
1984
1986
1988
1990
1992
1994
1996
1998
2000
2002
2004
2006
Cat
ch (k
g)
GillnetHandlineHaulnet
0
2000
4000
6000
8000
10000
12000
1984
1986
1988
1990
1992
1994
1996
1998
2000
2002
2004
2006
Effo
rt (f
ishe
rday
s)
0
10
20
30
40
50
60
1984
1986
1988
1990
1992
1994
1996
1998
2000
2002
2004
2006
CPU
E (k
g/fis
herd
ays)
Southern Spencer Gulf
Fig. 3.9 Southern Spencer Gulf. Top graph - historical trends in total catch by gear type. Middle graph - historical trends in total effort by gear type. Bottom graph - historical trends in CPUE by gear type.
33

0
5000
10000
15000
20000
25000
30000
35000
1984
1986
1988
1990
1992
1994
1996
1998
2000
2002
2004
2006
Hau
lnet
cat
ch (k
g)Targeted effort
No specific target
Targeting otherspecies
0200400600800
10001200140016001800
1984
1986
1988
1990
1992
1994
1996
1998
2000
2002
2004
2006
Hau
lnet
eff
ort (
fishe
rday
s)
0
20
40
60
80
100
120
1984
1986
1988
1990
1992
1994
1996
1998
2000
2002
2004
2006
CPU
E (k
g/fis
herd
ays)
Southern Spencer Gulf
0
5000
10000
15000
20000
25000
30000
35000
1984
1986
1988
1990
1992
1994
1996
1998
2000
2002
2004
2006
Hau
lnet
cat
ch (k
g)Targeted effort
No specific target
Targeting otherspecies
0200400600800
10001200140016001800
1984
1986
1988
1990
1992
1994
1996
1998
2000
2002
2004
2006
Hau
lnet
eff
ort (
fishe
rday
s)
0
20
40
60
80
100
120
1984
1986
1988
1990
1992
1994
1996
1998
2000
2002
2004
2006
CPU
E (k
g/fis
herd
ays)
Southern Spencer Gulf
Fig. 3.10 Southern Spencer Gulf. Top graph - historical trends in haul net catch for each of the three effort categories. Middle graph - historical trends in haul net effort for each of the three effort categories. Bottom graph - historical trends in CPUE for each of the three effort categories.
34

Northern Spencer Gulf
Haul nets have consistently been the dominant gear type in this region (Fig. 3.11). Haul net
catch was highly variable until 1997 after which there has been a consistent downward trend.
The lowest haul net catch of 22,171 kg was taken in 2006 that was followed by a marginal
increase in 2007 (Fig. 3.11). Handline catch has also declined considerably since the high
catches of the early 1990s, resulting in the lowest catches on record during 2000, 2001 and
2002, and a marginal recovery from 2002 to 2007. This decline in handline catch from 1997
was consistent with a decrease in fishing effort, particularly through the period of 1994 to
2001. There has been a marginal increase in handline fishing effort since 2001. The low catch
of the gillnet sector reflects the reduction in effort that occurred in 1988, when effort was
virtually reduced to zero.
CPUE in the handline sector has varied in several phases between 1984 and 2007, but has
nevertheless demonstrated a long-term increasing trend (Fig. 3.11). CPUE in 1984 was 10.4
kg.fisherday-1 and has gradually increased to 18.7 kg.fisherday-1 in 2007. CPUE for the gillnet
sector has been highly variable due to the low catch and effort with this gear type.
Both targeted and non-targeted haul net catch have declined since 1992 (Fig. 3.12), reflecting a
continual decline in both targeted and non-targeted effort since 1988. CPUE of both targeted
and non-targeted effort have declined since 1990, with the decrease most evident through the
period of 1998 to 2001. Since then, there have been marginal increases in CPUE for the
different effort types (Fig. 3.12).
35
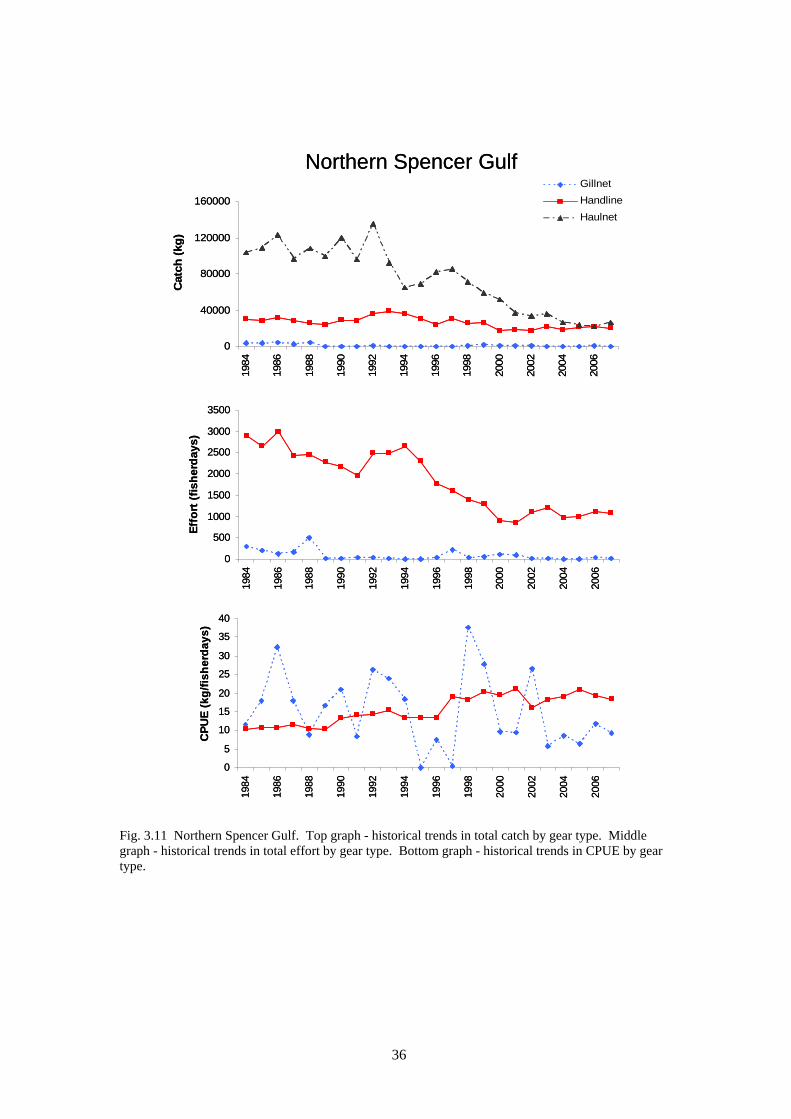
0
40000
80000
120000
160000
1984
1986
1988
1990
1992
1994
1996
1998
2000
2002
2004
2006
Cat
ch (k
g)GillnetHandlineHaulnet
0
500
1000
1500
2000
2500
3000
3500
1984
1986
1988
1990
1992
1994
1996
1998
2000
2002
2004
2006
Effo
rt (f
ishe
rday
s)
0
5
10
15
20
25
30
35
40
1984
1986
1988
1990
1992
1994
1996
1998
2000
2002
2004
2006
CPU
E (k
g/fis
herd
ays)
Northern Spencer Gulf
0
40000
80000
120000
160000
1984
1986
1988
1990
1992
1994
1996
1998
2000
2002
2004
2006
Cat
ch (k
g)GillnetHandlineHaulnet
0
500
1000
1500
2000
2500
3000
3500
1984
1986
1988
1990
1992
1994
1996
1998
2000
2002
2004
2006
Effo
rt (f
ishe
rday
s)
0
5
10
15
20
25
30
35
40
1984
1986
1988
1990
1992
1994
1996
1998
2000
2002
2004
2006
CPU
E (k
g/fis
herd
ays)
Northern Spencer Gulf
Fig. 3.11 Northern Spencer Gulf. Top graph - historical trends in total catch by gear type. Middle graph - historical trends in total effort by gear type. Bottom graph - historical trends in CPUE by gear type.
36

0
20000
40000
60000
80000
100000
1984
1986
1988
1990
1992
1994
1996
1998
2000
2002
2004
2006
Hau
lnet
cat
ch (k
g)Targeted effort
No specific target
Targeting otherspecies
0
1000
2000
3000
4000
1984
1986
1988
1990
1992
1994
1996
1998
2000
2002
2004
2006
Hau
lnet
eff
ort (
fishe
rday
s)
0
5
10
15
20
25
30
35
1984
1986
1988
1990
1992
1994
1996
1998
2000
2002
2004
2006
CPU
E (k
g/fis
herd
ays)
Northern Spencer Gulf
0
20000
40000
60000
80000
100000
1984
1986
1988
1990
1992
1994
1996
1998
2000
2002
2004
2006
Hau
lnet
cat
ch (k
g)Targeted effort
No specific target
Targeting otherspecies
0
1000
2000
3000
4000
1984
1986
1988
1990
1992
1994
1996
1998
2000
2002
2004
2006
Hau
lnet
eff
ort (
fishe
rday
s)
0
5
10
15
20
25
30
35
1984
1986
1988
1990
1992
1994
1996
1998
2000
2002
2004
2006
CPU
E (k
g/fis
herd
ays)
Northern Spencer Gulf
Fig. 3.12 Northern Spencer Gulf. Top graph - historical trends in haul net catch for each of the three effort categories. Middle graph - historical trends in haul net effort for each of the three effort categories. Bottom graph - historical trends in CPUE for each of the three effort categories.
37

Gulf St. Vincent
Haul nets, handlines and gillnets have each contributed substantially to the fishery for King
George whiting in Gulf St. Vincent (Fig. 3.13). Haul net catch was quite variable from 1984
but reached a peak in 1998 after which it declined systematically. It fell from 37,762 kg in
1998 to only 10,089 kg in 2006, before increasing in 2007 to 15,935 kg. Handline catches
were highest through the early and mid 1990’s but have shown a long-term systematic decline
from 38,916 kg to 9,347 kg that was attained in 2005. The gillnet catches were also relatively
low through 2000-2002, increased in 2003, but then decreased to a minimum level of 2,017 kg
in 2006.
Handline effort was quite variable from 1984 until it reached a peak in 1992, after which it
decreased systematically (Fig. 3.13). The peak in effort in 1992 was 3,787 fisherdays, which
fell to 789 fisherdays in 2005. Gillnet effort has also declined over the same period,
particularly between 2001 and 2006.
CPUE in the handline fishery increased consistently from 1984, attaining a maximum of 14.7
kg.fisherday-1 in 2001 before decreasing annually between 2001 and 2005 (Fig. 3.13). It has
subsequently increased to 13.9 kg.fisherday-1. CPUE for gillnets increased to 1999, but then
became highly variable due to the low levels of catch and effort.
Haul net catch has decreased considerably since 1998 (Fig. 3.14), primarily reflecting a
significant decline in effort directed at ‘no specific targeted species’. The different categories
of CPUE in the haul net sector have either remained steady or increased in recent years.
Although targeted catch and effort have been relatively low in Gulf St. Vincent, the CPUE has
increased through the years particularly from 1998 to 2002. CPUE for the untargeted effort
types have been relatively stable.
38

0
10000
20000
30000
40000
50000
1984
1986
1988
1990
1992
1994
1996
1998
2000
2002
2004
2006
Cat
ch (k
g)GillnetHandlineHaulnet
0
1000
2000
3000
4000
5000
1984
1986
1988
1990
1992
1994
1996
1998
2000
2002
2004
2006
Effo
rt (f
ishe
rday
s)
05
1015202530354045
1984
1986
1988
1990
1992
1994
1996
1998
2000
2002
2004
2006
CPU
E (k
g/fis
herd
ays)
Gulf St. Vincent
0
10000
20000
30000
40000
50000
1984
1986
1988
1990
1992
1994
1996
1998
2000
2002
2004
2006
Cat
ch (k
g)GillnetHandlineHaulnet
0
1000
2000
3000
4000
5000
1984
1986
1988
1990
1992
1994
1996
1998
2000
2002
2004
2006
Effo
rt (f
ishe
rday
s)
05
1015202530354045
1984
1986
1988
1990
1992
1994
1996
1998
2000
2002
2004
2006
CPU
E (k
g/fis
herd
ays)
Gulf St. Vincent
Fig. 3.13 Gulf St. Vincent. Top graph – historical trends in total catch by gear type. Middle graph – historical trends in total effort by gear type. Bottom graph – historical trends in CPUE by gear type.
39

0
10000
20000
30000
4000019
84
1986
1988
1990
1992
1994
1996
1998
2000
2002
2004
2006
Hau
lnet
cat
ch (k
g)
Targeted effort
No specific target
Targeting otherspecies
0
500
1000
1500
2000
2500
3000
3500
1984
1986
1988
1990
1992
1994
1996
1998
2000
2002
2004
2006
Hau
lnet
eff
ort (
fishe
rday
s)
0
10
20
30
40
50
60
1984
1986
1988
1990
1992
1994
1996
1998
2000
2002
2004
2006
CPU
E (k
g/fis
herd
ays)
Gulf St. Vincent
0
10000
20000
30000
4000019
84
1986
1988
1990
1992
1994
1996
1998
2000
2002
2004
2006
Hau
lnet
cat
ch (k
g)
Targeted effort
No specific target
Targeting otherspecies
0
500
1000
1500
2000
2500
3000
3500
1984
1986
1988
1990
1992
1994
1996
1998
2000
2002
2004
2006
Hau
lnet
eff
ort (
fishe
rday
s)
0
10
20
30
40
50
60
1984
1986
1988
1990
1992
1994
1996
1998
2000
2002
2004
2006
CPU
E (k
g/fis
herd
ays)
Gulf St. Vincent
Fig. 3.14 Gulf St. Vincent. Top graph – historical trends in haul net catch for each of the three effort categories. Middle graph – historical trends in haul net effort for each of the three effort categories. Bottom graph – historical trends in CPUE for each of the three effort categories.
40

Kangaroo Island
Handlines have been the main gear type in this region since 1984. Handline catches increased
from 1986 to a maximum of 47,880 kg in 1998, after which they declined substantially to
27,337 kg in 2002 (Fig. 3.15). Since then there has been a gradual increase in annual catch to
30,330 kg that was taken in 2007. Haul nets have also been an important gear type in this
region. Catches gradually declined from the peak of 13,594 kg in 1992 to 3,533 kg in 2003.
Since then, haul net catch has increased considerably to 7,826 kg in 2007. Gillnets have only
ever provided a marginal catch but nevertheless the catches have increased since the late
1990s.
Handline effort increased substantially between 1988 and 1992, before declining
systematically over the following years (Fig. 3.15). Handline effort in 1992 was 3,887
fisherdays and in 2007 was 1,742 fisherdays, representing a 55.2% reduction. Effort in the
gillnet sector decreased to virtually zero through the early 1990’s but has increased moderately
since then, and in the early 2000s has generally been less than 100 fisherdays.yr-1.
CPUE in the handline sector increased moderately through the years to a maximum of 15.5
kg.fisherday-1 in 1998 (Fig. 3.15). After that, CPUE slowly declined to 13.7 kg.fisherday-1 in
2002, but has subsequently been on an upward trend. The CPUE of 17.4 kg.fisherday-1 in 2007
was the highest ever recorded.
The haul net catch increased through the 1980’s and early 1990’s but decreased from 1994 to
2004 (Figs. 3.15, 3.16). The catch and effort data, reflect a significant change from targeted to
untargeted catch and effort between 1991 and 1992, which more likely reflects the way that
such data have been reported by fishers rather than a change in fishing methodology. Catch
and effort have decreased significantly in the main reporting category, i.e. "no specific target",
since 1992. Estimates of CPUE were higher in the 1990s and 2000s compared to the 1980s.
Nevertheless, the estimates were variable through the 2000s due the low estimates of catch and
effort through this period.
41

0
10000
20000
30000
40000
50000
60000
70000
1984
1986
1988
1990
1992
1994
1996
1998
2000
2002
2004
2006
Cat
ch (k
g)
GillnetHandlineHaulnet
0
1000
2000
3000
4000
1984
1986
1988
1990
1992
1994
1996
1998
2000
2002
2004
2006
Effo
rt (f
ishe
rday
s)
0
10
20
30
40
50
1984
1986
1988
1990
1992
1994
1996
1998
2000
2002
2004
2006
CPU
E (k
g/fis
herd
ays)
Kangaroo Island
0
10000
20000
30000
40000
50000
60000
70000
1984
1986
1988
1990
1992
1994
1996
1998
2000
2002
2004
2006
Cat
ch (k
g)
GillnetHandlineHaulnet
0
1000
2000
3000
4000
1984
1986
1988
1990
1992
1994
1996
1998
2000
2002
2004
2006
Effo
rt (f
ishe
rday
s)
0
10
20
30
40
50
1984
1986
1988
1990
1992
1994
1996
1998
2000
2002
2004
2006
CPU
E (k
g/fis
herd
ays)
Kangaroo Island
Fig. 3.15 Kangaroo Island. Top graph - historical trends in total catch by gear type. Middle graph - historical trends in total effort by gear type. Bottom graph - historical trends in CPUE by gear type.
42
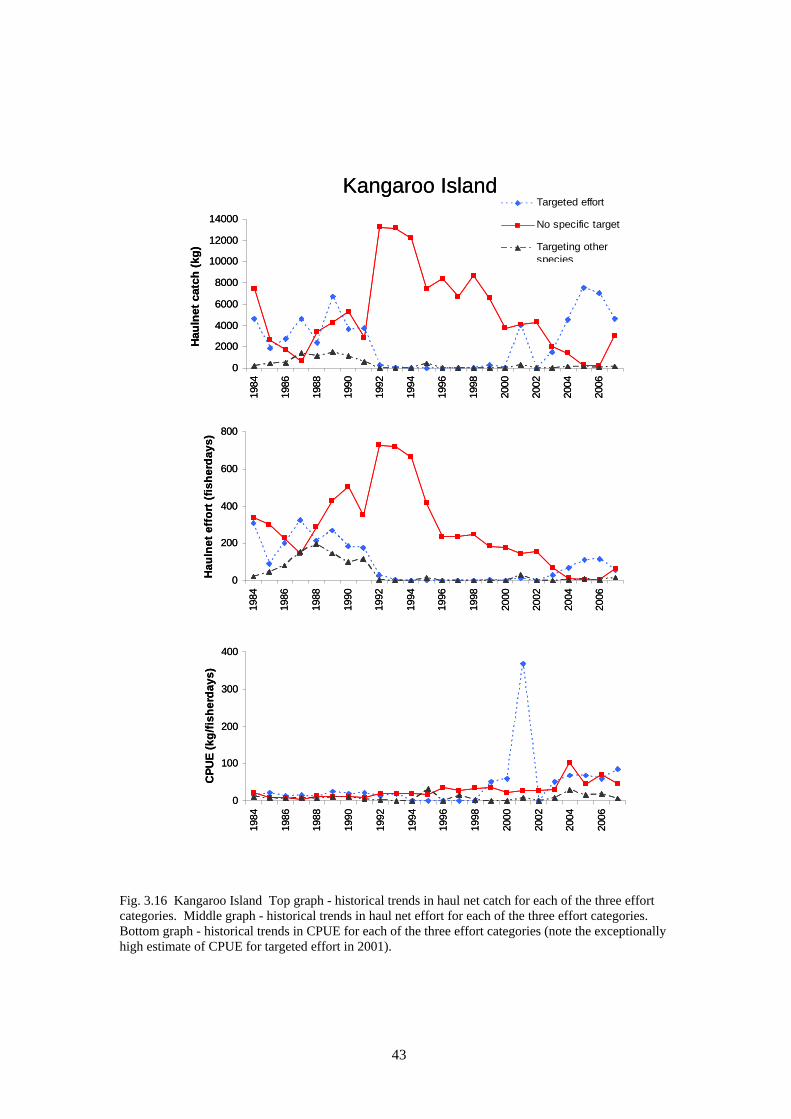
0
2000
4000
6000
8000
10000
12000
14000
1984
1986
1988
1990
1992
1994
1996
1998
2000
2002
2004
2006
Hau
lnet
cat
ch (k
g)Targeted effort
No specific target
Targeting otherspecies
0
200
400
600
800
1984
1986
1988
1990
1992
1994
1996
1998
2000
2002
2004
2006
Hau
lnet
eff
ort (
fishe
rday
s)
0
100
200
300
400
1984
1986
1988
1990
1992
1994
1996
1998
2000
2002
2004
2006
CPU
E (k
g/fis
herd
ays)
Kangaroo Island
0
2000
4000
6000
8000
10000
12000
14000
1984
1986
1988
1990
1992
1994
1996
1998
2000
2002
2004
2006
Hau
lnet
cat
ch (k
g)Targeted effort
No specific target
Targeting otherspecies
0
200
400
600
800
1984
1986
1988
1990
1992
1994
1996
1998
2000
2002
2004
2006
Hau
lnet
eff
ort (
fishe
rday
s)
0
100
200
300
400
1984
1986
1988
1990
1992
1994
1996
1998
2000
2002
2004
2006
CPU
E (k
g/fis
herd
ays)
Kangaroo Island
Fig. 3.16 Kangaroo Island Top graph - historical trends in haul net catch for each of the three effort categories. Middle graph - historical trends in haul net effort for each of the three effort categories. Bottom graph - historical trends in CPUE for each of the three effort categories (note the exceptionally high estimate of CPUE for targeted effort in 2001).
43

3.3 Discussion
The State-wide commercial fishery statistics demonstrate some strong trends that largely
reflect significant changes in the structure of the fishery. Between 1984 and 2007 the State-
wide commercial catch dropped in several significant steps. These decreases reflect substantial
reductions in handline and gillnet catches since 1999 and a gradual decline in haul net catch
since 1992. Such reductions are the consequence of substantial falls in commercial fishing
effort. Both targeted handline and gillnet fishing effort have fallen considerably since 1992. It
is more problematic to determine levels of targeted haul net effort, nevertheless since 1984
there has been a substantial reduction in the number of net endorsements that has culminated in
a decrease in the total number of haul net fishing days (Fowler 2005), suggesting the likelihood
that targeted haul net effort on King George whiting has declined.
Despite the changes in commercial catch and effort described above, which are attributable to
structural changes in the fishery, the important indicator of stock status is CPUE. The State-
wide estimates of CPUE for both handlines and gillnets have generally increased since 1984
but demonstrated considerable declines in the early 2000s, which caused the concern for stock
status that was expressed in an earlier stock assessment report (McGarvey et al. 2003).
Nevertheless, the State-wide estimates of handline and gillnet CPUE have now recovered, and
reached new maxima in 2006 and 2007.
The most significant gear types differ between the different regions and are partly a
consequence of historical management decisions. As such, line fishing has become the
dominant gear used in most regions, with the use of haul nets largely now restricted to the
northern gulfs. In each region, handline CPUE increased between 2005 and 2007, relative to
the preceding few years. Furthermore, in the northern gulfs haul net CPUE also increased in
the past few years. These are consistent positive indicators for the status of the regional stocks
of King George whiting.
44

4. POPULATION STRUCTURE
4.1 Introduction
Populations of fish that are subjected to fishing pressure normally experience some degree of
truncation of their age and size distributions as a consequence of the removal of the larger,
older individuals. This can have further population-level effects by influencing egg
production, and ultimately recruitment success (Longhurst 2002; Francis 2003, Berkeley et al.
2004). As such, population structure can be an important indicator of the status of a fishery.
Nevertheless, its assessment as an indicator depends on having a good understanding of the life
history of the species and its influence on spatial variation in population structure.
The characteristics of the populations of King George whiting throughout South Australia’s
coastal waters have been determined on several occasions, revealing a complex interaction
between population structure and life history. King George whiting are not distributed evenly
with respect to size and age (Fowler 1998, Fowler et al. 2000a, Fowler and McGarvey 2000).
Catches from throughout Gulf St. Vincent, northern Spencer Gulf and from the bays of the
West Coast of Eyre Peninsula tend to be almost exclusively small fish from the 3+ age class.
Alternatively, fish sampled from Investigator Strait along the northern coast of Kangaroo
Island and from south eastern Spencer Gulf show a much broader size and age range. The
latter populations are found in deeper waters in more exposed places, and consist of multiple
year classes of fish of up to 20 years of age.
Tag/recapture studies have revealed that the populations of larger, older fish on the spawning
grounds are replenished by migration from the northern gulfs (Fowler et al. 2002). Thus, fish
movement constitutes an important obligative process that closes the life history cycle between
nursery areas and spawning grounds. These older, larger fish that occur in the deeper offshore
places constitute the spawning populations (Fowler et al. 1999). Spawning does not occur
generally throughout all South Australia’s coastal waters but rather only at particular locations
or spawning grounds. Given this geographic separation between the spawning grounds and
nursery areas, the eggs and larvae must be advected to the nursery areas. As such, it is likely
that the larger, older fish in the spawning populations make substantial contributions to egg
production and so the age structures of these populations may be important indicators of egg
production.
45

The age structures show evidence of strong and weak year classes. This suggests that year
class strength is a consequence of recruitment processes, with the rates showing considerable
inter-annual variability. Furthermore, similar strong year classes have been evident in both
Southern Spencer Gulf and Investigator Strait, showing that environmental influences over
recruitment operate at the geographic spatial scale.
The studies on population structure that were done between 1995 and 1998, identified both the
spatial dispersion patterns, with respect to size and age, as well as the locations of the
spawning grounds (Fowler et al. 1999, Fowler et al. 2000a). The sampling that was done
between 2001 and 2004 purposely focussed on the populations on the spawning grounds since
their age structures may be important indicators of egg production. In each case these historic
sampling programs depended on samples that were accessed from both the commercial and
recreational fishing sectors. In 2006, a new sampling protocol for King George whiting was
initiated, i.e. a fish market-based sampling protocol for the commercial catch. The aim of this
chapter is to present the results from the recent sampling that was done between July 2006 and
June 2007, and to provide a qualitative comparison with data collected from the same regions
in the past. This will determine whether there is evidence for recent truncation of the
population structure that is relatable to fishing pressure.
4.2 Materials and Methods
The market sampling was concentrated at the SAFCOL fish market. Generally once per week,
a team of three researchers processed samples of King George whiting prior to the morning
auction. These data were augmented with that collected on field trips to the West Coast.
Catches were selected from those available to ensure as broad a geographic coverage as
possible. A two-stage sampling protocol was used in processing catches. First, a relatively
large number of fish were measured to obtain size information for the catch, from which a sub-
sample of fish was taken for further biological analysis. Back in the laboratory, these fish were
measured for total length (TL) and weighed individually, sexed and the stage of reproductive
development determined. They were then dissected for the removal of the sagittae, i.e. the
largest pair of otoliths, for ageing. One otolith from each fish was embedded in resin and
sectioned using a diamond saw to produce a thin transverse section. The section was mounted
on a glass microscope slide and then interpreted using low power microscopy by counting the
opaque zones. Each count was then interpreted to provide an estimate of fish age (Fowler and
Short 1998). For each region an age/length key was developed to convert the sample
46

proportions by length into proportions by age. Thus, a population size and age structure was
produced for each region.
4.3 Results
West Coast of Eyre Peninsula
The size structures of fish sampled from the West Coast of Eyre Peninsula showed
considerable spatial variation (Fig. 4.1). The length frequency distribution for the Far West
Coast ranged from 30 to 52 cm TL, but most fish were <38 cm, with the modal size at 34 cm.
Alternatively, the size distribution for the Mid West Coast was dominated by smaller fish that
rarely exceeded 34 cm TL. Both populations consisted of only a few age classes and were
each dominated by the 3-year age class (Fig. 4.1). The remaining fish from the Far West Coast
included representatives from the 2+, 4+ and 5+ age classes whereas for the Mid West Coast
the remaining 10% of the population involved only 4+ fish.
0
5
10
15
20
25
30
35
26 28 30 32 34 36 38 40 42 44 46 48 50 52 54 56 58 600
10
20
30
40
50
60
70
80
90
100
2 3 4 5 6 7 8 9 10 11 12 13 14 15 16
0
5
10
15
20
25
30
35
26 28 30 32 34 36 38 40 42 44 46 48 50 52 54 56 58 600
10
20
30
40
50
60
70
80
90
100
2 3 4 5 6 7 8 9 10 11 12 13 14 15 16
FWCn = 1518
MWCn = 267
Per
cent
TL (cm) Age (yr)
Per
cent
0
5
10
15
20
25
30
35
26 28 30 32 34 36 38 40 42 44 46 48 50 52 54 56 58 600
10
20
30
40
50
60
70
80
90
100
2 3 4 5 6 7 8 9 10 11 12 13 14 15 16
0
5
10
15
20
25
30
35
26 28 30 32 34 36 38 40 42 44 46 48 50 52 54 56 58 600
10
20
30
40
50
60
70
80
90
100
2 3 4 5 6 7 8 9 10 11 12 13 14 15 16
FWCn = 1518
MWCn = 267
Per
cent
TL (cm) Age (yr)
Per
cent
Fig. 4.1 Age and size structures of samples of King George whiting collected between July 2006 and June 2007 from the West Coast of Eyre Peninsula (FWC = Far West Coast, MWC = Mid West Coast).
47

Spencer Gulf
Samples were collected from Northern Spencer Gulf that had been taken using both handlines
and haul nets. The size distributions were similar between gear types with catches dominated
by fish from 31 – 36 cm TL, with a modal size of either 33 or 34 cm (Fig. 4.2). The age
distributions ranged from 2+ to 5+ fish, but were dominated by the 3+ age class that
contributed up to 80% of the catch (Fig. 4.2). Southern Spencer Gulf provided a much broader
size distribution with the majority of fish from 34 to 41 cm TL. The age distribution was also
broader with some fish up to 11 years of age. Fish from the 4+ and 5+ age classes constituted
considerably higher proportions of the catch than was the case for Northern Spencer Gulf.
0
5
10
15
20
25
30
35
26 28 30 32 34 36 38 40 42 44 46 48 50 52 54 56 58 600
10
20
30
40
50
60
70
80
90
100
2 3 4 5 6 7 8 9 10 11 12 13 14 15 16
0
5
10
15
20
25
30
35
26 28 30 32 34 36 38 40 42 44 46 48 50 52 54 56 58 600
10
20
30
40
50
60
70
80
90
100
2 3 4 5 6 7 8 9 10 11 12 13 14 15 16
0
5
10
15
20
25
30
35
26 28 30 32 34 36 38 40 42 44 46 48 50 52 54 56 58 600
10
20
30
40
50
60
70
80
90
100
2 3 4 5 6 7 8 9 10 11 12 13 14 15 16
NSG –haulnetsn = 3110
SSGn = 3471
Per
cent
TL (cm) Age (yr)
Per
cent
P
erce
nt
NSG –handlinen = 550
0
5
10
15
20
25
30
35
26 28 30 32 34 36 38 40 42 44 46 48 50 52 54 56 58 600
10
20
30
40
50
60
70
80
90
100
2 3 4 5 6 7 8 9 10 11 12 13 14 15 16
0
5
10
15
20
25
30
35
26 28 30 32 34 36 38 40 42 44 46 48 50 52 54 56 58 600
10
20
30
40
50
60
70
80
90
100
2 3 4 5 6 7 8 9 10 11 12 13 14 15 16
0
5
10
15
20
25
30
35
26 28 30 32 34 36 38 40 42 44 46 48 50 52 54 56 58 600
10
20
30
40
50
60
70
80
90
100
2 3 4 5 6 7 8 9 10 11 12 13 14 15 16
NSG –haulnetsn = 3110
SSGn = 3471
Per
cent
TL (cm) Age (yr)
Per
cent
P
erce
nt
NSG –handlinen = 550
Fig. 4.2 Age and size structures of samples of King George whiting collected between July 2006 and June 2007 from Spencer Gulf (NSG = Northern Spencer Gulf, SSG = Southern Spencer Gulf).
48

Gulf St. Vincent and Investigator Strait
The fish sampled from MFAs 34 and 35 in northern Gulf St. Vincent were predominantly from
31 to 36 cm TL with the mode at 32 cm TL (Fig. 4.3). Although fish of up to 5 years of age
were recorded, approximately 90% of those sampled were from the 3+ age class. In
comparison, the fish from Block 40, which incorporates the south western corner of Gulf St.
Vincent as well the majority of Investigator Strait, had a very broad size distribution, being
dominated by fish from the 33 to 43 cm TL size classes. The age distribution included fish that
were up to 10 years old but was dominated by those from 3 to 7 years. The fish sampled from
along the northern coast of Kangaroo Island also had a broader size distribution than those
from the gulf. Although there was a distinct mode at 34 cm, the distribution included relatively
large numbers of fish that were up to 42 cm TL. As such, the age distribution was also broad,
involving fish of up to 12 years of age, but was still dominated by relatively young fish from
the 3+ and 4+ age classes.
0
5
10
15
20
25
30
35
26 28 30 32 34 36 38 40 42 44 46 48 50 52 54 56 58 600
10
20
30
40
50
60
70
80
90
100
2 3 4 5 6 7 8 9 10 11 12 13 14 15 16
0
5
10
15
20
25
30
35
26 28 30 32 34 36 38 40 42 44 46 48 50 52 54 56 58 600
10
20
30
40
50
60
70
80
90
100
2 3 4 5 6 7 8 9 10 11 12 13 14 15 16
0
5
10
15
20
25
30
35
26 28 30 32 34 36 38 40 42 44 46 48 50 52 54 56 58 600
10
20
30
40
50
60
70
80
90
100
2 3 4 5 6 7 8 9 10 11 12 13 14 15 16
GSV–Block 40n = 424
KIn = 2292
Per
cent
TL (cm) Age (yr)
Per
cent
P
erce
nt
GSV n = 1269
0
5
10
15
20
25
30
35
26 28 30 32 34 36 38 40 42 44 46 48 50 52 54 56 58 600
10
20
30
40
50
60
70
80
90
100
2 3 4 5 6 7 8 9 10 11 12 13 14 15 16
0
5
10
15
20
25
30
35
26 28 30 32 34 36 38 40 42 44 46 48 50 52 54 56 58 600
10
20
30
40
50
60
70
80
90
100
2 3 4 5 6 7 8 9 10 11 12 13 14 15 16
0
5
10
15
20
25
30
35
26 28 30 32 34 36 38 40 42 44 46 48 50 52 54 56 58 600
10
20
30
40
50
60
70
80
90
100
2 3 4 5 6 7 8 9 10 11 12 13 14 15 16
GSV–Block 40n = 424
KIn = 2292
Per
cent
TL (cm) Age (yr)
Per
cent
P
erce
nt
GSV n = 1269
Fig. 4.3 Age and size structures of samples of King George whiting collected between July 2006 and June 2007 from Gulf St. Vincent and Investigator Strait (GSV = Gulf St. Vincent, KI = Kangaroo Island).
49

4.4 Discussion
The market sampling program undertaken between July 2006 and June 2007 produced
estimates of population structure for each of the different fishery regions considered for South
Australia’s King George whiting fishery (Fig. 3.1). The data were consistent with those
collected previously and with the current understanding of the life history of the species.
Comparison of these size and age structures with those collected during the 1990s and early
2000s indicates that there has been no significant change over the past decade. As such, there
is no evidence that population truncation has occurred over this time.
50

5. MODEL ASSESSMENT OF BIOLOGICAL PERFORMANCE INDICATORS
5.1. Introduction
WhitEst model: description and input data
For King George whiting in South Australia the primary management objective remains to
ensure sustainability of the fishery. To facilitate this, a computer fishery model was developed
in an FRDC-funded project (Fowler and McGarvey 2000). This is a dynamic, spatial, age-
structured model that is used to integrate up-to-date data from several data sources to provide
estimates of biological performance indicators on the status of the fishery. The model involves
six spatial cells, five of which contribute most of the catch, i.e. the West Coast, and the upper
and southern regions of the two gulfs, whilst the last cell is located offshore from the West
Coast (Fig. 5.1). The model takes into account yearly summer migration from inshore areas in
the northern gulfs to the spawning regions in the southern gulfs. Furthermore, a spatial model
breakdown in combination with a monthly time step allows the model to keep account of the
exploitation that varies seasonally in space and time. Exploitation is high in the upper gulfs
and inshore, but lower in the southern-gulf offshore areas where spawning occurs. The data
and inputs to the model are (1) monthly catch and effort totals, (2) samples of commercial-
catch proportions by fish age and sex in different spatial cells for some months through the two
sampling periods of September 1994-June 1997 and July 2004-June 2007, (3) a growth curve
of estimated length-at-age (McGarvey and Fowler 2002), (4) estimated migration rates among
the 5 spatial cells based on tag/recapture studies done in the 1960’s, 1970’s, and 1980’s
(McGarvey and Feenstra 2002), (5) a partition of each yearly cohort length distribution into
monthly slices. A new model slice (i.e. length bin) is created in each monthly model time step,
a ‘slice’ being defined as the proportion of each King George whiting cohort that reaches legal
size each month. This slice partition model framework (McGarvey et al. 2007) permits a
description of the seasonal growth of each cohort into the legally harvestable size range, as the
yearly recruitment pulse reaching legal size in late summer and autumn of each year, and the
subsequent large shift of MSF fishing effort to King George whiting that occurs each winter,
often peaking in July. The slice partition modelling method (1) separates legal from sublegal
fish, (2) explicitly models the arrival of new recruits that grow into legal size each month, and
(3) keeps account of model-predicted, legal fish numbers by both age and length. Recent
improvements to the model are summarised in Appendix 2.
51

The model is fitted to monthly catches, conditional upon the associated effort in fisher days.
Catch and effort data are analysed and modelled separately for the four gear types (handline,
haul net, gillnet, and all other gears combined) and three target types (targeting King George
whiting, targeting any other specific marine scalefish species, and not targeting any species in
particular) reported in monthly commercial catch and effort logbooks. Recreational catch and
effort by month and spatial cell are from the National Recreational and Indigenous Fishing
Survey (Henry and Lyle 2003) and cover one year only. Further details of this model are
included in the FRDC final report (Fowler and McGarvey 2000), with the additional details
added since 2000 summarised in Appendix 2. The King George whiting model was externally
reviewed in detail by Dr André Punt (University of Washington, Seattle, USA).
3
1
5
2
4
78
14
2625
3837
15
24
13
39
4947 48
30
29
50
33
44
28
32
36
2322
9
21
27
40B
43
10
45
40C
42
40A
19
35
34
41
18
31
11
17
20
16
138°E136°E134°E
32°S
33°S
34°S
35°S
36°S
0 50 10025 kms
6 (Outlying regions)
MFA blocksModel spatial cells
1 - WC
2 - NSG
3 - SSG
4 - NGSV
5 - SGSV
Fig. 5.1 Map of South Australia showing the Marine Fishing Areas in which commercial catch and effort are reported, and the 6 spatial cells used in WhitEst, the King George whiting stock assessment model.
52

WhitEst model indicators: recruitment, biomass and exploitation rate
The model outputs three principal biological performance indicators: recruitment; legal-size
population biomass; and exploitation rate. Biomass and exploitation rate are presented as
monthly model estimates, and also as their yearly averages. Yearly biomass is calculated for
each calendar year as the mean of the monthly model-estimated biomass levels. Exploitation
rate is defined as the fraction of biomass harvested over any specified time period. The yearly
exploitation rate performance indicator is defined as the sum of yearly catches across all gear
and target types,divided by the (yearly average) legal biomass in each calendar year.
Recruitment is estimated as yearly numbers of 1 year olds. In the recruitment time series
graphs, the year shown on the x-axis is the year that these fish entered the fishable stock as 3-
year olds.
5.2 Results
Yearly recruitment is shown in all model output figures (Figs. 5.2-5.4). Monthly biomass and
harvest fraction estimates are first presented broken down among the three main fishery
regions (Gulf St. Vincent, Spencer Gulf and West Coast; Fig. 5.2). To examine long-term
trends, biomass and exploitation rate are also shown as yearly quantities in Figs. 5.3-5.4,
specifically yearly State-wide totals (Fig. 5.3) and yearly regional totals (Fig. 5.4). Confidence
intervals were calculated from the maximised model likelihood only for the yearly regional
indicators. Estimated model population indicators for South Australian King George whiting
show the following features:
1. Seasonal variation: As observed directly in monthly catch and effort time series (Fig. 3.5),
model estimates of fishing mortality and biomass show high seasonal variation (Fig. 5.2).
The yearly cycle of model-estimated biomass occurs months ahead of the cycling trend in
commercial catch and effort. King George whiting are most abundant in late summer and
autumn subsequent to the late summer season of fastest growth when the highest numbers
recruit to legal size. The seasonal peaks in commercial catch occur in mid-winter (Fig.
3.5), when the effort of fishers is principally targeted on the newly recruited year class of
3-year-old King George whiting.
2. Long-term trends, biomass and recruitment: Since model catch and effort data were first
collected in July 1983, yearly model population abundance indicators for South Australian
King George whiting have been generally stable. Over decadal time scales, the trends of
53

State-wide model estimates of recruitment and biomass (Fig. 5.3) have shown relatively
flat time trends with modest yearly variation.
3. Long-term trends, exploitation rate: Model estimated exploitation rate has shown a steady
decline over two decades. This presumably reflects the declining trend in the number of
M- and B-class marine scalefish license holders who catch and target King George whiting
(Fig. 3.4).
4. Recent years 2005-2007, biomass and recruitment: The model estimates show a striking
improvement in the status of the King George whiting resource over the last three years.
State-wide estimates of biomass and recruitment (Fig. 5.3) showed strong yearly increases
over these years, reversing the downward trend that was evident in 1999 to 2002, which
led to the management actions of 2004. All three regions showed rising trends in both
recruitment and biomass, with historically unprecedented increases evident on the West
Coast, and with Spencer Gulf showing greater increases than Gulf St. Vincent (Fig. 5.4).
West Coast biomass and recruitment estimates reached new highs in 2007.
5. Trends for long-term exploitation rates remain somewhat uncertain because of insufficient
effort data for the recreational sector. The model data inputs come principally from the
commercial sector while recreational catch was estimated to comprise more than half the
total State-wide catch in 2001. In the absence of any time series data for the recreational
sector, the WhitEst model assumes that recreational catch and effort vary proportionally
with the South Australian human population. Thus, the model does not take account of
either possible change in recreational effort or of possible increase in effective effort that
might result from the increased use of fish-finders, GPS and of published increased
information sharing in relation to fishing ‘hot spots’ through various media including
television, newspaper, magazines and internet forums.
6. In earlier runs the model underestimated the observed catches from the West Coast, and
from the upper Gulf St. Vincent, for the last model year, 2007. Sensitivity testing showed
that this effect on the West Coast was specifically due to an absence of newly recruited
fish in the age samples from January to June 2007. Because the sample sizes in these last
few months from the West Coast were small, this model effect is presumed to be an
artefact of sampling. This was corrected for the West Coast only, by removing the age
samples from the fitted dataset for July 2006-June 2007, after which the underestimation of
catches for West Coast in the last year was alleviated (Appendix 3 - Fig. 10.1).
54
7. The model is now generating estimates of exploitation rate that are, on average, about 20-
25% lower than previous WhitEst model versions. The reasons for this change are two-
fold: namely an important change to the way yearly measures of biomass and exploitation
rate (the latter being catch divided by biomass) are defined and reported; and second, due
to the effect on model estimates of reducing the number of model spatial cells. The
definition for the statistic reported as the indicator for yearly biomass has been changed
from reporting the value of monthly estimated model biomass from the start of each year
(1 January) to now being calculated as the mean of monthly biomass estimates over the full
12 months of each calendar year. Examination of seasonal variation in monthly biomass
(Fig. 5.2) shows that, particularly for the West Coast, and to a lesser extend for GSV, the
value at 1 January is lower than the yearly average. Thus, for these two regions in
particular, part of the reduced level of estimated exploitation rate is due to the
implementation of the new definition for the yearly biomass indicator. Second, a further
reduction in the mortality rate estimates was found to be linked to changes in the
movement rates in the two gulfs (by sensitivity testing and comparison of model runs) after
model cells were re-aggregated. In particular, the exploitation rate estimates declined in
the upper subregions of both gulfs, which was linked to changes in the estimated rates of
movement. Estimated movement rates southward were about 10-12% higher after the
lower gulf cells (and in GSV only, the two upper gulf cells) were amalgamated.
55
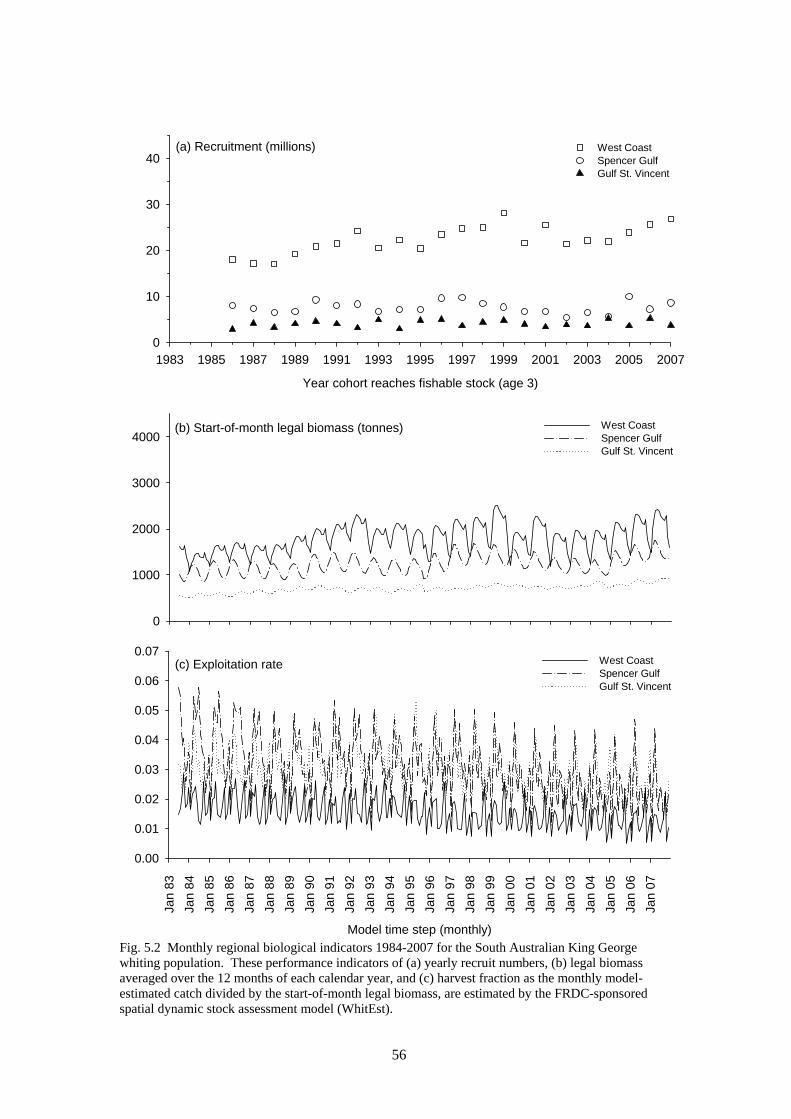
Year cohort reaches fishable stock (age 3)
1983 1985 1987 1989 1991 1993 1995 1997 1999 2001 2003 2005 20070
10
20
30
40West CoastSpencer GulfGulf St. Vincent
0
1000
2000
3000
4000West CoastSpencer GulfGulf St. Vincent
Model time step (monthly)
Jan
83
Jan
84
Jan
85
Jan
86
Jan
87
Jan
88
Jan
89
Jan
90
Jan
91
Jan
92
Jan
93
Jan
94
Jan
95
Jan
96
Jan
97
Jan
98
Jan
99
Jan
00
Jan
01
Jan
02
Jan
03
Jan
04
Jan
05
Jan
06
Jan
07
0.00
0.01
0.02
0.03
0.04
0.05
0.06
0.07West CoastSpencer GulfGulf St. Vincent
(a) Recruitment (millions)
(b) Start-of-month legal biomass (tonnes)
(c) Exploitation rate
Fig. 5.2 Monthly regional biological indicators 1984-2007 for the South Australian King George whiting population. These performance indicators of (a) yearly recruit numbers, (b) legal biomass averaged over the 12 months of each calendar year, and (c) harvest fraction as the monthly model-estimated catch divided by the start-of-month legal biomass, are estimated by the FRDC-sponsored spatial dynamic stock assessment model (WhitEst).
56

Year cohort reaches fishable stock (age 3)
1983 1985 1987 1989 1991 1993 1995 1997 1999 2001 2003 2005 20070
10
20
30
40
50(a) Recruitment (millions)
0
1000
2000
3000
4000
5000
6000
Calender year
1983 1985 1987 1989 1991 1993 1995 1997 1999 2001 2003 2005 20070.0
0.1
0.2
0.3
0.4
0.5
(b) Start of year legal biomass (tonnes)
(c) Yearly exploitation rate
Fig. 5.3 Yearly State-wide (excluding spatial cell 6) model biological indicators 1984-2007 for South Australian King George whiting. These performance indicators of (a) yearly recruit numbers, (b) legal biomass averaged over the 12 months of each calendar year, and (c) harvest fraction as the yearly model-estimated catch divided by the yearly average legal biomass, are estimated by the FRDC-sponsored spatial dynamic stock assessment model (WhitEst). Error bars show 95% confidence intervals.
57

Year cohort reaches fishable stock (age 3)
1983 1985 1987 1989 1991 1993 1995 1997 1999 2001 2003 2005 20070
10
20
30
40 West CoastSpencer GulfGulf St. Vincent
(a) Recruitment (millions)
0
500
1000
1500
2000
2500
3000 West CoastSpencer GulfGulf St. Vincent
Calender year
1983 1985 1987 1989 1991 1993 1995 1997 1999 2001 2003 2005 20070.1
0.2
0.3
0.4
0.5
0.6West CoastSpencer GulfGulf St. Vincent
(b) Start-of-year legal biomass (tonnes)
(c) Yearly exploitation rate
Fig. 5.4 Yearly regional model biological indicators 1984-2007 for South Australian King George whiting. Regions are the West Coast (including Far and Mid West Coast, and Coffin Bay, spatial cell 1 shown in Fig. 5.1), Spencer Gulf (Fig. 5.1, spatial cells 2 and 3), and Gulf St. Vincent and Kangaroo Island (Fig. 5.1, model cells 4 and 5). Error bars show 95% confidence intervals.
58

6. ASSESSMENT OF BIOLOGICAL PERFORMANCE INDICATORS
6.1 Introduction
The recently completed Management Plan for the Marine Scalefish Fishery of South Australia
provides a strategic framework to guide fishery management decisions (Noell et al. 2006).
This framework links the management goals with the stock assessment process and also
identifies the appropriate responses to the potential outcomes of the assessment. Essential to
this process are fishery performance indicators that relate to the status of the fishery, with
respect to the management objectives. For this fishery there are two sets of fishery
performance indicators that are assessed against particular limit reference points, i.e. the
‘general performance indicators’ that relate to the commercial catch and effort data and
‘biological performance indicators’ that relate to estimates of biological parameters. For the
former, the indicators and reference points that are specified in the Management Plan (Noell et
al. 2006) were not used in this assessment. At a meeting of the Marine Scalefish Fishery
Management Committee that was held on the 17th February 2006,it was agreed that new sets of
general performance indicators and limit reference points should be adopted (Minutes of
meeting No. 98 of MSFMC), which are outlined below. The biological performance indicators
remain as specified in the Management Plan (Noell et al. 2006).
6.2 Materials and Methods
General Performance Indicators
There are three general fishery performance indicators that were calculated from the
commercial fishery statistics: total commercial catch; targeted effort; and targeted CPUE.
These were assessed against the following limit reference points:
1. the 3rd highest and 3rd lowest values over the reference period;
2. the greatest (%) inter-annual variation (+ and -) over the reference period;
3. the greatest rate of change (trend) over periods of three years (+ and -) through the
reference period.
Since three new years of commercial catch and effort data were presented in this report, i.e. for
2005, 2006 and 2007 (Chapter 3), the status of the fishery at the end of each year was
considered. The annual State-wide totals of commercial catch, targeted effort and targeted
59

CPUE for the handline sector were calculated for each calendar year from 1984 until each
prescribed year. In each case, the limit reference points were then derived based on the time
series of data. The estimates of data in each of 2005, 2006 or 2007 were then compared with
the limit reference points determined for the whole time series.
Biological Performance Indicators
For King George whiting, the four biological performance indicators that were assessed were
fishable biomass, exploitation rate of the fishable biomass, abundance of pre-recruits, and age
structure (Noell et al. 2006). The first three of these were outputs from the WhitEst model
(Chapter 5), and the fourth relates to the analysis of population structure that was presented in
Chapter 4.
The definitions of the time series indicators for biomass and exploitation rate, as determined by
WhitEst, were modified in this assessment compared to earlier ones. Here, biomass was
calculated as the average monthly model estimate across the 12 months, rather than the start-
of-year (1 January) model biomass estimate, as was the case previously. This definition is
appropriate because it avoids the arbitrary choice of any particular month as the yearly
indicator value. Yearly exploitation rate was calculated as the ratio of the model-estimated
catch, summed over the whole year, divided by the yearly average biomass, as defined above.
Using model rather than data catch is appropriate because it is most consistent with the data
measures of mortality rate from age samples that underlie the best estimates of exploitation
rate.
For fishable biomass and the abundance of pre-recruits (as model estimates of 1-year olds for
each cohort), the limit reference points were triggered if the indicator in the most recent
(reference) year was either 10% lower or greater than its average value from the previous five
years (Noell et al. 2006). Here, the estimates of fishable biomass and recruitment, as outputs
from the WhitEst fishery model for 2007, were compared with the model-estimated yearly
averages from 2002 to 2006. The estimates of all three biological performance indicators were
evaluated for each of the three main regions that were considered in the WhitEst model, i.e.
West Coast, Spencer Gulf and Gulf St. Vincent (yearly regional indicators shown in Fig. 5.4).
The State-wide indicators of biomass and recruitment (Fig. 5.3) were summed across the three
regions while for exploitation rate, an overall ratio of the model catch for all regions divided by
the biomass sum, was evaluated.
60
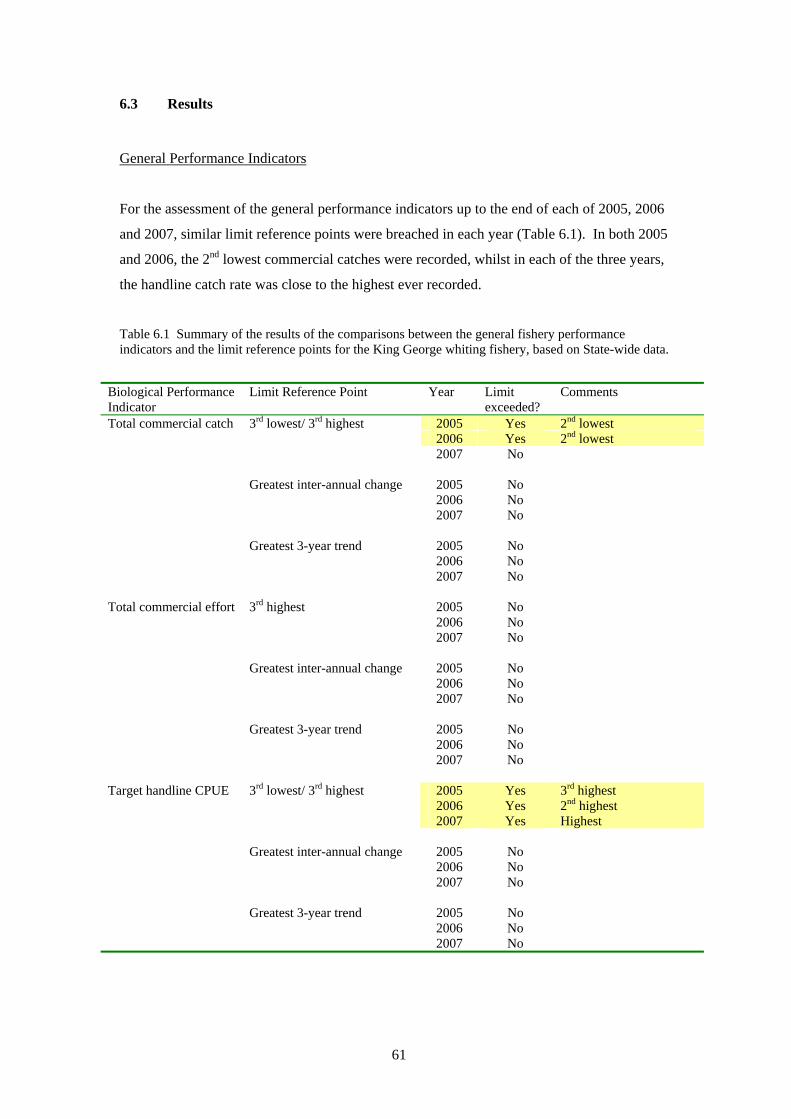
6.3 Results
General Performance Indicators
For the assessment of the general performance indicators up to the end of each of 2005, 2006
and 2007, similar limit reference points were breached in each year (Table 6.1). In both 2005
and 2006, the 2nd lowest commercial catches were recorded, whilst in each of the three years,
the handline catch rate was close to the highest ever recorded.
Table 6.1 Summary of the results of the comparisons between the general fishery performance indicators and the limit reference points for the King George whiting fishery, based on State-wide data.
Biological Performance Indicator
Limit Reference Point Year Limit exceeded?
Comments
Total commercial catch 3rd lowest/ 3rd highest 2005 Yes 2nd lowest 2006 Yes 2nd lowest 2007 No Greatest inter-annual change 2005 No 2006 No 2007 No Greatest 3-year trend 2005 No 2006 No 2007 No Total commercial effort 3rd highest 2005 No 2006 No 2007 No Greatest inter-annual change 2005 No 2006 No 2007 No Greatest 3-year trend 2005 No 2006 No 2007 No Target handline CPUE 3rd lowest/ 3rd highest 2005 Yes 3rd highest 2006 Yes 2nd highest 2007 Yes Highest Greatest inter-annual change 2005 No 2006 No 2007 No Greatest 3-year trend 2005 No 2006 No 2007 No
61

Biological Performance Indicators
In 2007, estimates of fishable biomass for each of the West Coast, Spencer Gulf and Gulf St.
Vincent, and at the State-wide level were considerably higher than the five-year averages, and
in all cases breached the limit reference point of 10% above average (Table 6.2). Similarly, the
estimates of numbers of pre-recruits in 2007 for all three regions and at the State-wide level,
were also more than 10% greater in 2007 than the average of the previous 5 years. As such, the
evaluation of biomass and recruitment as biological performance indicators for King George
whiting showed a favourable outcome for the status of the fishery.
The third output parameter from the WhitEst model considered as a biological performance
indicator was exploitation rate. The assigned limit reference point for this is that the
exploitation rate should not exceed the international standard of 28% (Caddy 1998). The
estimate of exploitation rate for the West Coast for 2007 fell well below this upper limit (Table
6.2). However, in both gulfs the estimates of exploitation rate were only marginally lower than
this limit, suggesting that in each case the proportion of the legal biomass that was harvested
was approximately equal to the maximum recommended level. At the State-wide level, the
limit reference point was not breached.
The final biological fishery indicator was age structure. The limit reference point for this
indicator is that there has been no significant change over the previous 5 years. The age
structures at numerous places across the fishery were considered in Chapter 4. Comparison of
these age structures against data collected during the 1990s and early 2000s indicated that there
had been no significant change over the past decade or so (Table 6.2).
6.4 Discussion
Several general performance indicators and biological performance indicators breached the
limit reference points. These breaches were all consistent with each other, and point to a
consistent indication of stock status. The results are best interpreted with respect to data
presented in Fig. 3.3, which indicate that between 2005 and 2007, commercial catch and effort
were at their lowest ever recorded levels, whilst CPUE had attained record high levels. The
model outputs indicate that these are the result of above-average levels of fishable biomass.
Also, in several regions, recruitment rates have also been above average. Overall, the data
suggest that the declining catch is the consequence of declining fishing effort, and that the high
62

catch rates currently reflect high levels of biomass available to the fishers, a consequence of
above-average recruitment.
Table 6.2 Yearly biological performance indicators for the three regions considered in the WhitEst model, as well as combined at the State-wide level. Limit reference points that were breached are highlighted in yellow. The current performance year covers the period January 2007 – December 2007.
Biological performance indicator
Biological limit reference point
West Coast Spencer Gulf Gulf St. Vincent State-wide
Fishable biomass
+/- 10% of previous 5-yr average
16.7% above average of
previous 5 years
20.4% above average of
previous 5 years
13.4% above average of
previous 5 years
17.2% above average of
previous 5 years
Pre-recruit Abundance
+/- 10% of previous 5-yr average
2004 cohort is 17% above average of previous 5 years
2004 cohort is
23% above average of
previous 5 years
2004 cohort is
14% below average of
previous 5 years
2004 cohort is 14% above average of previous 5 years
Exploitation rate
Exceeds international standard (28% yearly)
14.7% 27.2% 27.6% 21.5%
Age structure
Significant change over previous 5 years
No change over time
No change over time
No change over time
No change over time
63

7. DISCUSSION
7.1 Context of this assessment
In the early 2000s there was considerable concern about the long-term sustainability of the
South Australian King George whiting fishery (McGarvey et al. 2003). It was apparent from
several sets of data that the abundances of this species across South Australia had decreased
considerably through the period of 1999 to 2002. This concerning status prompted a review of
the management of the fishery through 2004 that culminated in significant changes that came
into force on the 1st October 2004. The next stock assessment that was done after this
implementation was completed in August 2005 (McGarvey et al. 2005). That report
summarised data that were collected only up to the end of 2004 and so was unlikely to have
revealed any benefits from the management changes. However, it did provide an opportunity
to assess whether the downward trends in biological performance indicators that were evident
through the period of 1999 to 2002 had continued or not. In this regard that assessment
provided the initial indications that there had been a turn-around across a broad geographic
area in the declining trends in the catch and effort data, whilst the associated output from the
WhitEst model indicated marginal increases in recruitment and biomass in the three main
fishery regions. Nevertheless, that stock assessment also identified that there still remained
some concerning breaches of fishery performance indicators.
The current stock assessment report is significant as it provides the first opportunity to assess
the status of the King George whiting fishery from data collected up to approximately 3 years
after the new management changes were implemented. There were several sets of data
considered here that relate to the status of the fishery. Firstly, the commercial catch, effort and
CPUE data were considered at both the State-wide and regional scales. Secondly, the size and
age structures of populations at various places across the fishery were considered. Finally,
these two independent datasets were then integrated in the WhitEst fishery assessment model,
to generate a number of output parameters that are indicative of fishery status. The various
fishery performance indicators were assessed against prescribed limit reference points.
64

7.2 Determination of stock status
Commercial fishery statistics
The most complete and informative data on the status of the King George whiting stocks are
the estimates of catch, effort and CPUE from the commercial fishing sector. In this report we
presented data for the calendar years of 1984 to 2007, thus providing an additional three years
of data subsequent to those reported by McGarvey et al. (2005). The dominant long-term trend
in this 24-year dataset was a steady decline in commercial fishing effort that was particularly
evident after 1992. This has been driven by an on-going reduction in the number of marine
scalefish commercial fishers, particularly as a consequence of the licence amalgamation
scheme. This continual decline in licence holders has resulted in less fishing days, culminating
in a general reduction in commercial catch. Prior to 1999 these reductions in commercial catch
and effort were generally associated with estimates of rising CPUE. However, between 1999
and 2002 there were declines in the regional estimates of CPUE that were the primary cause
for concern with respect to stock status through that period. Then in 2005 it became apparent
that the downward trends in regional estimates of CPUE had been arrested in most regions,
based on the catch and effort data of 2003 and 2004 (McGarvey et al. 2005). Fortunately, it
now appears that those regional trends of increasing CPUE have continued to 2007. Even in
Gulf St. Vincent the handline CPUE has increased in both 2006 and 2007, halting a four year
declining trend. As such, in all regions, handline CPUE was higher through the period of 2005
to 2007 than during the earlier years of the 2000s, providing a positive indication of stock
status.
Population structure
The second set of data considered as indicators of stock status were population size and age
structures. Through broad-scale population sampling during the 1990s it became evident that
King George whiting in South Australia are not distributed evenly with respect to size and age
(Fowler and McGarvey 2000, Fowler et al. 2000). Whilst some populations consist of
relatively small, young fish, others support broader age and size ranges of individuals. These
latter populations form the spawning aggregations during the reproductive season (Fowler et
al. 1999), and are supplemented by movement of small, young adults from the inshore areas
(Fowler et al. 2002). The different size and age distributions of fish in different regions are the
culmination of a complicated sequence of life history and demographic processes. As such, we
consider that the regional estimates of population structure provide significant indicators of
65

stock status. In this study market sampling for King George whiting was undertaken across the
geographic range of the fishery between July 2006 and June 2007 and the size and age
distributions were considered against historical data. These comparisons did not provide any
evidence of significant change in population structure across the range of the species in South
Australia that was attributable to the fishery.
Computer fishery assessment model
The computer fishery assessment model ‘WhitEst’ integrates fishery and biological data to
provide annual estimates of recruitment, fishable biomass and annual exploitation rate. As
reported by McGarvey et al. (2003), there were some concerning trends in these output
parameters estimated up to 2002. In comparison, the estimates of output parameters calculated
up to the end of 2007, as reported here, showed much more positive trends. Estimates of
recruitment for the West Coast and Spencer Gulf increased between 2002 and 2007. The
estimates of fishable biomass increased appreciably for each of the three regions, particularly
between 2004 and 2007, and were associated with continual declines in the annual exploitation
rates for each region. These model outputs are favourable outcomes for the status of the
fishery.
Comparisons with limit reference points
The different fishery performance indicators that were discussed above were assessed against
specific limit reference points. Most of the general performance indicators that relate to catch
and effort data from the commercial sector did not exceed the limit reference points.
Nevertheless, there were some breaches that were consistent for the period of 2005-2007. The
first related to the historically low total commercial catches. This highlights the extent to
which commercial catch has declined in recent years, a reflection of the decreasing commercial
fishing effort. The other breaches related to high estimates of State-wide handline CPUE,
which have increased in the recent three years to the highest on record. This is strongly
indicative of the significant turn-around in stock status that has taken place since the early
2000’s.
Three of the biological performance indicators were output parameters from WhitEst. There
were breaches for fishable biomass and recruitment indices that were consistent across the
three regions and at the State-wide level. For fishable biomass all breaches were indicative of
the current positive status of the stocks. Similarly, for recruitment, the breaches for the West
Coast and Spencer Gulf reflected higher than average recruitment. It was only for Gulf St.
66

Vincent that the breach related to lower recruitment than for the 5-year average. In this latter
region recruitment was particularly variable between 2003 and 2006, with relatively high rates
recorded in both 2004 and 2006. Nevertheless, the overall State-wide recruitment estimate in
2007 was 17% above the previous 5-year average. The fourth biological performance indicator
was population age structure. There were no significant changes in any regional age structures
over the past five years.
7.3 Uncertainty in the fishery
The range of fishery indicators considered in this stock assessment provided consistent results
with respect to the status of the stocks of King George whiting. Nevertheless, the assessment
is fundamentally dependent on the commercial catch and effort statistics. These data constitute
the general performance indicators, and are also the primary data input into the fishery
assessment model WhitEst, which outputs the biological performance indicators. As such, the
commercial catch and effort data are implicit to both sets of indicators. At present, there are no
alternative indicators that are independent of the commercial fishery. This dependence on a
particular data source provides the greatest uncertainty about the assessment of stock status.
There also remains some uncertainty about the fishery with respect to the lack of understanding
about the recreational sector and the influence that recreational catch and effort have on total
catch and fishing mortality. This lack of data was accommodated in the ‘WhitEst’ fishery
model by assuming that the annual catch and effort of the recreational sector varied
proportionally with change in human population size in South Australia, extrapolating forward
and backward from the single set of regional estimates from the NRIF survey (Henry and Lyle
2003). However, it is unlikely that this really provides a satisfactory time-series of recreational
catch and effort, as it does not accommodate a potentially increasing rate of participation in
recreational fishing or changes to effective effort due to the increased availability of better
boats and electronic equipment, such as echo sounders and GPS. In the absence of time-series
data for this sector it is not possible to determine what accounted for the downturn in the stocks
and fishery catches that occurred between 1999 and 2002. Fortunately, however, in 2007/08 a
new telephone diary survey of the South Australian recreational sector has been underway,
which will provide new estimates of regional recreational catch and effort for comparison with
those recreational data collected in 2000/01 (Henry and Lyle 2003).
67

7.4 Management implications
The new management regulations that were implemented in October 2004 raised the minimum
legal size, reduced recreational bag and boat limits and sought to accelerate the rate of
commercial licence amalgamation. It is now more than three and a half years since those
management changes were implemented. The various fishery performance indicators
monitored in this study are all currently positive with respect to the status of the stocks,
indicating no immediate requirement to reconsider the current management regulations for the
species. The recreational fishing survey that has been underway since August 2007 will be
completed in late 2008 and the results should become available some time in 2009 or 2010. As
such, the next stock assessment for King George whiting that is scheduled for 2011 will
provide opportunity to undertake a comprehensive analysis of the new results for the
recreational sector. Since the same sampling methods are being used as those used in 2000/01
(Henry and Lyle 2003), it will be possible to determine whether recreational catch and effort
have increased through the intervening six and half years or so, and the consequences of the
results for the status of the King George whiting stocks.
7.5 Future work
The current plans for future work on King George whiting are outlined in a 5-year plan that
was agreed to in 2005. The monitoring of the commercial catch and effort, and that of the
Charter Boat sector, by SARDI’s Fisheries Statistics Unit will continue into the future. The
collection of new catch and effort data from the recreational sector is currently being done and
the results will be available in 2009 or 2010. The plan for future surveys of the recreational
sector remains unresolved.
A significant catch sampling program for King George whiting, which was aimed at describing
the spatial variation in population structure, was undertaken through the 1990s. Since then
catch sampling has been undertaken in 2004/05 and 2006/07. In both cases, the sampling was
concentrated at the SAFCOL fish market in Adelaide, which provided good samples from Gulf
St. Vincent and northern Spencer Gulf. The sampling also involved trips to the West Coast so
as to access fish that were captured near and landed at various ports between Port Lincoln and
Denial Bay. The next market-based catch sampling planned for this species is for the period of
July 2008 to June 2010. These data will be used to inform the WhitEst fishery assessment
model for future stock assessments, and to monitor for contractions in size and age structures
that may relate to fishing activity. The next stock assessment is planned for the financial year
of 2010-2011 to be delivered in July 2011.
68

The work outlined above is designed to ensure that the King George whiting fishery, being the
premier and icon species of South Australia’s Marine Scalefish fishery, is not overfished.
Nevertheless, this is only one aspect of ensuring that the fishery conforms to the principles of
ecologically sustainable development. Recently, SARDI has undertaken a project that was
aimed at determining the bycatch issues in the Marine Scalefish fishery. This study has
determined that some undersized King George whiting are taken as bycatch when targeted
using both handlines and haul nets. Although these undersized fish are released it is currently
unknown what level of mortality they experience as a consequence of their capture and release.
A research focus for the future is to determine the release mortality for these undersized fish
when they are captured using haul nets of different mesh sizes and handlines with different
hook sizes.
8. REFERENCE LIST
Australian Bureau of Agricultural and Resource Economics (ABARE (2007). Australian Fisheries
Statistics, 2006. Canberra. Berkeley SA, Hixon MA, Larson RJ and Love MS (2004) Fisheries sustainability via protection of age
structure and spatial distribution of fish populations. Fisheries 29: 23-32. Bruce BD (1989) Studying larval fish ecology: benefits to King George whiting research. SAFISH 13:
4-9. Caddy JF (1998) A short review of precautionary reference points and some proposals for their use in
data-poor situations. FAO Fishery Technical Paper 379. 30 pp. Francis RC (2003) A web of small tensions. Fisheries 28: 20-23. Fowler AJ (1998) King George whiting (Sillaginodes punctata). South Australian Fisheries
Assessment Series 98/6. 58 pp. Fowler AJ (2002) Snapper (Pagrus auratus). South Australian Fisheries Assessment Series 01/013. 64
pp. Fowler AJ, March WA (2000) Characteristics of movement of King George whiting (Percoidei:
Sillaginidae) in South Australian waters. Fish Movement and Migration. Australian Society of Fish Biology Workshop, Bendigo 28-29th Sept. 1999. pp. 136-143.
Fowler AJ, McGarvey R (1997) King George whiting (Sillaginodes punctata). South Australian
Fisheries Assessment Series 97/6. 93 pp. Fowler AJ, McGarvey R (1999) King George whiting (Sillaginodes punctata). South Australian
Fisheries Assessment Series 99/03. 41 pp. Fowler AJ, McGarvey R (2000) Development of an integrated fisheries management model for King
George whiting (Sillaginodes punctata) in South Australia. Final report to FRDC for project 95/008. 232 pp.
69

Fowler AJ, Short DA (1996) Temporal variation in the early life-history characteristics of the King George whiting (Sillaginodes punctata) from analysis of otolith microstructure. Marine and Freshwater Research 47: 809-818.
Fowler AJ, Short DA (1998) Validation of age determination from otoliths of the King George whiting
Sillaginodes punctata (Perciformes). Marine Biology 130: 577-587. Fowler AJ, Jones GK, and McGarvey R (2002). Characteristics and consequences of movement patterns
of King George whiting (Perciformes: Sillaginodes punctata) in South Australia. Marine and Freshwater Research 53: 1055-1069.
Fowler AJ, McLeay L, Short DA (1999) Reproductive mode and spawning information based on gonad
analysis for the King George whiting (Percoidei: Sillaginidae) from South Australia. Marine Freshwater Research 50: 1-14.
Fowler AJ, McLeay L, Short DA (2000a) Spatial variation in size and age structures and reproductive
characteristics of the King George whiting (Percoidei: Sillaginidae) in South Australian waters. Marine and Freshwater Research 51: 11-22.
Fowler AJ, Black KP, Jenkins GP (2000b) Determination of spawning areas and larval advection
pathways for King George whiting in south-eastern Australia using otolith microstructure and hydrodynamic modelling. II. South Australia. Marine Ecology Progress Series 199: 243-254.
Fowler AJ, McGarvey R, Feenstra JE, Jackson WB (2007) Snapper (Pagrus auratus) Fishery. Fishery
Assessment Report to PIRSA. South Australian Research and Development Institute (Aquatic Sciences), Adelaide, F2007/000523-1, SARDI Research Report Series No. 224. Pp 90.
Haigh LJ, Donnellan S (2000) Stock structure based on analysis of mitochondrial DNA and
microsatellites. In: (Fowler AJ, McGarvey R, eds) Development of an integrated fisheries management model for King George whiting (Sillaginodes punctata) in South Australia. Final Report to FRDC for project 95/008. pp 105-124.
Henry GW, Lyle JM (2003) The National Recreational and Indigenous Fishing Survey. Final Report to
FRDC for project 99/158. 200 pp. Jenkins GP (2005) Influence of climate on the fishery recruitment of a temperate, seagrass-associated
fish, the King George whiting Sillaginodes punctata. Marine Ecology Progress Series 288: 263-271.
Jenkins GP, Black KP, Hamer PA (2000) Determination of spawning areas and larval advection
pathways for King George whiting in southeastern Australia using otolith microstructure and hydrodynamic modelling. I. Victoria. Marine Ecology Progress Series Vol 199: 231-242.
Jones GK, Hall DA, Hill KM, Staniford A (1990) The South Australian marine scalefish fishery: stock
assessment, economics, management. South Australian Department of Fisheries green Paper. 186 pp.
Jones GK, Doonan A (2002) 2000-01 National Recreational and Indigenous Fishing Survey. South
Australian Regional Information. South Australian Fisheries Management Series. Paper No. 46. Knight MA, Tsolos A, Doonan AM (2004) South Australian fisheries and aquaculture information and
statistics report. SARDI Research Report Series No. 60. 82 pp. Knight MA, Doonan AM, Tsolos A (2007a) South Australian wild fisheries information and statistics
report. South Australian Research and Development Institute (Aquatic Sciences), Adelaide, F2007/000571-1. SARDI Research Report Series No. 200.
Knight MA, Doonan AM, Tsolos A (2007b) South Australian Recreational Charter Boat Fishery. South
Australian Research and Development Institute (Aquatic Sciences), Adelaide, F2007/000847-1. SARDI Research Report Series No. 239.
70

Kumar MS, Hill R, Partington D (1995) The impact of commercial hauling nets and recreational line
fishing on the survival of undersize King George whiting (Sillaginodes punctata). SARDI Research Report Series No. 6. 60 pp.
Longhurst A (2002) Murphy’s law revisited: longevity as a factor in recruitment to fish populations.
Fisheries Research 56: 125-131. Moran, SM, Jenkins GP, Keough MJ, Hindell JS (2004) Evidence for secondary planktonic transport of
post-larvae of seagrass-associated King George whiting. Journal of Fish Biology 64: 1226-1241. McGarvey R, Feenstra JE (2002) Estimating rates of fish movement from tag-recoveries: conditioning
by recapture. Canadian Journal of Fisheries and Aquatic Sciences 59: 1054-1064. McGarvey R, Fowler AJ (2002) Seasonal growth of King George whiting (Sillaginodes punctata) from
length-at-age samples truncated by legal minimum size. Fishery Bulletin 100: 545-558. McGarvey R, Feenstra JE, Fowler AJ (2000) King George whiting (Sillaginodes punctata). South
Australian Fisheries Assessment Series 00/03. 47 pp. McGarvey R, Fowler AJ, Feenstra JE, Fleer DA, Jones GK (2003) King George whiting (Sillaginodes
punctata). SARDI Aquatic Sciences Publication No. RD03/0152. 76 pp. McGarvey R, Fowler AJ, Feenstra JE, Jackson WB and Jennings PR (2005). King George whiting
(Sillaginodes punctata) fishery. Fishery Assessment Report to PIRSA for the Marine Scalefish Fishery Management Committee. South Australian Research and Development Institute (Aquatic Sciences), Adelaide RD03/0152-2.
McGarvey R, Fowler AJ, Feenstra JE, Jackson WB (2006). Garfish (Hyporhamphus melanochir)
Fishery. Fishery Assessment Report to PIRSA for the Marine Scalefish Fishery Management Committee. South Australian Research and Development Institute (Aquatic Sciences), Adelaide, RD04/0152-2. SARDI Research Report Series No. 163. pp 55.
McGarvey R, Feenstra JE, Ye Q (2007) Modeling fish numbers dynamically by age and length:
partitioning cohorts into ‘slices’. Canadian Journal of Fisheries and Aquatic Sciences 64: 1157-1173.
McGlennon D, Kinloch MA (1997) Resource allocation in the South Australian marine scalefish
fishery. FRDC project 93/249, Final Report. 105 pp. Moran SM, Jenkins GP, Keough MJ, Hindell JS (2004) Evidence for secondary planktonic transport of
post-larvae of seagrass-associated King George whiting. Journal of Fish Biology 64: 1226-1241. Noell C, Presser J, Jones K (2006) Management Plan for the South Australian Marine Scalefish fishery.
The South Australian Fisheries Management Series Paper No. 45. 68 pp. Platell ME, Orr PA, Potter IC (2006) Inter- and intraspecific partitioning of food resources by six large
and abundant fish species in a seasonally open estuary. Journal of Fish Biology 69: 243-262. Robertson, AI (1977) Ecology of juvenile King George whiting Sillaginodes punctata (Cuvier +
Valenciennes) (Pisces: Perciformes) in Western Port, Victoria. Australian Journal of Marine and Freshwater Research 28: 35-43.
Taylor BL, Dizon AE (1996) The need to estimate power to link genetics and demography for
conservation. Conservation Biology 10: 661-664.
71

9. ACKNOWLEDGEMENTS
We wish to extend our gratitude to the numerous fish processors and fishers who gave us
access to samples of King George whiting for the collection of data and biological material. In
particular we thank Don Dew and his co-workers of Adelaide’s SAFCOL fish market for their
on-going support of the catch sampling program. In all cases the data on population structure
make a significant contribution to our stock assessment work.
The data on catch and effort from the commercial sector of the Marine Scalefish fishery were
provided to us by Angelo Tsolos of the Fisheries Statistics Unit of SARDI (Aquatic Sciences).
The market sampling was undertaken by Bruce Jackson and Matt Lloyd. The figures presented
in Chapter 6 were prepared by Janet Matthews. The report was reviewed by Michael Steer and
Tim Ward from SARDI Aquatic Sciences and Andrew Sullivan from PIRSA Fisheries, whose
comments helped to improve an earlier draft of the report. The contributions of all are
acknowledged and greatly appreciated.
72

10. APPENDICES
10.1 Appendix 1 - Commercial fishery statistics in 2005, 2006 and 2007
Commercial catches by region and gear type for each of 2005, 2006 and 2007 are presented in
Tables A.1, A.2 and A.3, respectively. The total State-wide catch in 2005 was 347,747 kg. A
similar total catch was taken in 2006, whilst that taken in 2007 was marginally higher.
Handlines were the dominant gear type in each year accounting for 76.3% of the catch in 2005,
and up to 83.8% in 2006. The percentage of total catch taken by haul nets fell from 16.5% in
2005 to 11.6% in 2006. The gillnet catch accounted for only 2.7 to 5.1% of the total catch.
In 2005, there were 15,059 handline fishing days and only 618 gillnet fishing days (Table A.1).
These are each lower than the effort levels in 2004, as reported by McGarvey et al. (2005).
Handline effort increased marginally in 2006 before dropping considerably in 2007. Gillnet
effort fell by about 50% in 2006 and then remained low in 2007.
In each year the total catch was highest on the Far West Coast, with Southern Spencer Gulf
consistently the second most significant region (Tables A.1, A.2, A.3). Also, in each year
Coffin Bay provided the lowest total catch of all seven regions.
73
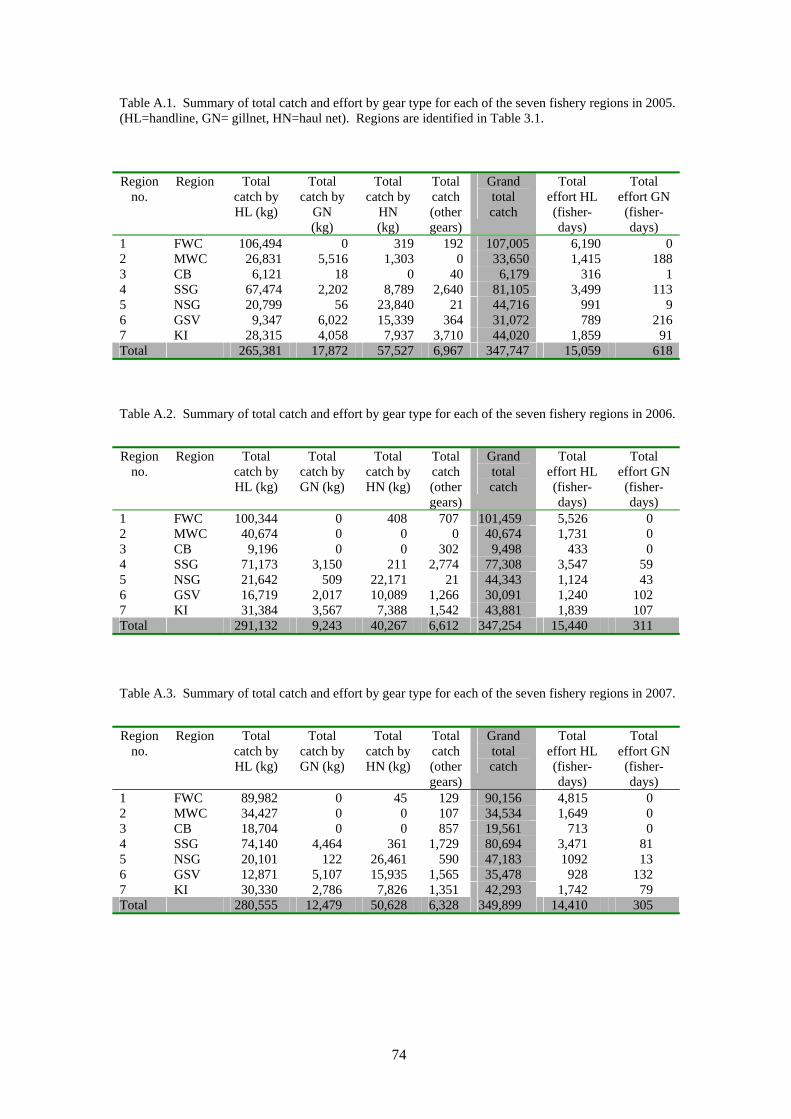
Table A.1. Summary of total catch and effort by gear type for each of the seven fishery regions in 2005. (HL=handline, GN= gillnet, HN=haul net). Regions are identified in Table 3.1. Region
no. Region Total
catch by HL (kg)
Total catch by
GN (kg)
Total catch by
HN (kg)
Total catch (other gears)
Grand total catch
Total effort HL (fisher-days)
Total effort GN (fisher-days)
1 FWC 106,494 0 319 192 107,005 6,190 0 2 MWC 26,831 5,516 1,303 0 33,650 1,415 188 3 CB 6,121 18 0 40 6,179 316 1 4 SSG 67,474 2,202 8,789 2,640 81,105 3,499 113 5 NSG 20,799 56 23,840 21 44,716 991 9 6 GSV 9,347 6,022 15,339 364 31,072 789 216 7 KI 28,315 4,058 7,937 3,710 44,020 1,859 91 Total 265,381 17,872 57,527 6,967 347,747 15,059 618 Table A.2. Summary of total catch and effort by gear type for each of the seven fishery regions in 2006.
Region no.
Region Total catch by HL (kg)
Total catch by GN (kg)
Total catch by HN (kg)
Total catch (other gears)
Grand total catch
Total effort HL (fisher-days)
Total effort GN (fisher-days)
1 FWC 100,344 0 408 707 101,459 5,526 0 2 MWC 40,674 0 0 0 40,674 1,731 0 3 CB 9,196 0 0 302 9,498 433 0 4 SSG 71,173 3,150 211 2,774 77,308 3,547 59 5 NSG 21,642 509 22,171 21 44,343 1,124 43 6 GSV 16,719 2,017 10,089 1,266 30,091 1,240 102 7 KI 31,384 3,567 7,388 1,542 43,881 1,839 107 Total 291,132 9,243 40,267 6,612 347,254 15,440 311
Table A.3. Summary of total catch and effort by gear type for each of the seven fishery regions in 2007.
Region no.
Region Total catch by HL (kg)
Total catch by GN (kg)
Total catch by HN (kg)
Total catch (other gears)
Grand total catch
Total effort HL (fisher-days)
Total effort GN (fisher-days)
1 FWC 89,982 0 45 129 90,156 4,815 0 2 MWC 34,427 0 0 107 34,534 1,649 0 3 CB 18,704 0 0 857 19,561 713 0 4 SSG 74,140 4,464 361 1,729 80,694 3,471 81 5 NSG 20,101 122 26,461 590 47,183 1092 13 6 GSV 12,871 5,107 15,935 1,565 35,478 928 132 7 KI 30,330 2,786 7,826 1,351 42,293 1,742 79 Total 280,555 12,479 50,628 6,328 349,899 14,410 305
74

10.2 Appendix 2 - Recent modifications to the WhitEst model
The principal modification of the King George whiting model (WhitEst) for this stock
assessment was to reduce the number of spatial cells (model subregions) from 13 to 6. The 6th
(formerly 13th) subregion includes all outlying areas, including the State’s Southeast, where
King George whiting catches are minimal. Thus, the effective reduction was from 12 to 5
principal model subregions. This reduction in spatial resolution was undertaken principally
because the model in previous versions had difficulties with resolving movement rates due to
insufficient tag-recovery data sample sizes, as noted previously (McGarvey et al. 2005). In the
West Coast, there was also presumed to be no movement among the three subregions, and thus,
retaining them as separate was unnecessary. In the two gulfs, especially in Spencer Gulf, tag
recovery data sample sizes were insufficient to precisely estimate the movement rate
parameters, of which there could be 12 x 12 = 144 for the model overall. By aggregating the
model spatial cells, notably aggregating the three lower Gulf St. Vincent cells and the two
lower Spencer Gulf cells each into one lower gulf subregion, the need to describe movement
among lower gulf cells was alleviated.
One additional spatial improvement was implemented to address the problem that MFA 40
(formerly spatial cell 9) spanned the lower Yorke Peninsula and thus had area in the lower
portions of both gulfs. Partitioning it between the two lower gulf subregions using its three
subdivisions (A, B & C) implemented with the new catch and effort logbooks permitted
allocation of the catches correctly between the respective lower portions of each gulf.
These spatial model changes did not substantially alter the model estimates. The main effect is
to reduce the extent of spatial variation, in particular, since the lower gulf cells, notably in
GSV, now include areas of substantial catch, whereas, the area north of Kangaroo Island
formerly was principally a spawning migratory destination with little fishing.
We also list the changes made to the King George whiting model in the 2005 assessment. (1)
Migration was spread across 3 months (November, December and January) rather than moving
all model fish once yearly in January. This noticeably smoothed the changes in stock
abundance in upper gulf cells during summer migration, and is a more realistic model
description since southward movement occurs over several early summer months. (2) Kernel
density (smoothed) curves are now used to characterise length-sample distributions. (3) Three
changes were implemented to improve model fits to commercial catch totals, including (i) a
more flexible seasonal (i.e. monthly) description of variation in catchability by effort type; (ii)
75

76
separate monthly catchability parameters for recreational catch; and (iii) a normal likelihood
function for the fits to catches at age, replacing the lognormal likelihood. These changes
substantially improved the closeness of fit of model-predicted catches by weight that had
previously underestimated the mean data catch values by a few percent. All three changes
measurably improved the model fits to monthly catch totals by weight. In addition, (4) the
recent change in legal minimum length from 30 to 31 cm in the two gulfs is now programmed
into the model slice-growth population array. For fitting to recreational catch, (5) we now fit
directly to survey King George whiting numbers landed, which is how catch was estimated and
reported from the NRIF survey, rather than fitting to recreational catch in weight landed.
10.3 Appendix 3 - Model fits to data
Parameters and thus stock indicators in the WhitEst model are estimated by fitting to data for
commercial catch totals by weight, recreational catch total numbers, and to commercial catch
samples calculated as proportions of King George whiting landed by yearly ages (and sex), in
each month when sampling occurs. Due to space limitations, only model fits to the reported
monthly King George whiting catch totals are shown for the 5 principal subregions, in Fig 10.1
below. Plots of fit to the extensive age samples are available upon request, with a separate age
fit plot shown for the five subregions and both sexes, and for each month of the two age and
length sampling programs which ran from September 1994 to June 1997, and from July 2004
to June 2007.

0
20
40
Jan
84 -
Jan
85 -
Jan
86 -
Jan
87 -
Jan
88 -
Jan
89 -
Jan
90 -
Jan
91 -
Jan
92 -
Jan
93 -
Jan
94 -
Jan
95 -
Jan
96 -
Jan
97 -
Jan
98 -
Jan
99 -
Jan
00 -
Jan
01 -
Jan
02 -
Jan
03 -
Jan
04 -
Jan
05 -
Jan
06 -
Jan
07 -
Model time-step
DataModel
Commercial catch (tonnes): Fits for West Coast
0
20
40
Jan
84 -
Jan
85 -
Jan
86 -
Jan
87 -
Jan
88 -
Jan
89 -
Jan
90 -
Jan
91 -
Jan
92 -
Jan
93 -
Jan
94 -
Jan
95 -
Jan
96 -
Jan
97 -
Jan
98 -
Jan
99 -
Jan
00 -
Jan
01 -
Jan
02 -
Jan
03 -
Jan
04 -
Jan
05 -
Jan
06 -
Jan
07 -
Model time-step
DataModel
Commercial catch (tonnes): Fits for Northern Spencer Gulf
0
10
20
Jan
84 -
Jan
85 -
Jan
86 -
Jan
87 -
Jan
88 -
Jan
89 -
Jan
90 -
Jan
91 -
Jan
92 -
Jan
93 -
Jan
94 -
Jan
95 -
Jan
96 -
Jan
97 -
Jan
98 -
Jan
99 -
Jan
00 -
Jan
01 -
Jan
02 -
Jan
03 -
Jan
04 -
Jan
05 -
Jan
06 -
Jan
07 -
Model time-step
DataModel
Commercial catch (tonnes): Fits for Southern Spencer Gulf
0
5
10
15
Jan
84 -
Jan
85 -
Jan
86 -
Jan
87 -
Jan
88 -
Jan
89 -
Jan
90 -
Jan
91 -
Jan
92 -
Jan
93 -
Jan
94 -
Jan
95 -
Jan
96 -
Jan
97 -
Jan
98 -
Jan
99 -
Jan
00 -
Jan
01 -
Jan
02 -
Jan
03 -
Jan
04 -
Jan
05 -
Jan
06 -
Jan
07 -
Model time-step
DataModel
Commercial catch (tonnes): Fits for Northern Gulf St. Vincent
0
5
10
Jan
84 -
Jan
85 -
Jan
86 -
Jan
87 -
Jan
88 -
Jan
89 -
Jan
90 -
Jan
91 -
Jan
92 -
Jan
93 -
Jan
94 -
Jan
95 -
Jan
96 -
Jan
97 -
Jan
98 -
Jan
99 -
Jan
00 -
Jan
01 -
Jan
02 -
Jan
03 -
Jan
04 -
Jan
05 -
Jan
06 -
Jan
07 -
Model time-step
DataModel
Commercial catch (tonnes): Fits for Southern Gulf St. Vincent
Fig. 10.1. Model and data monthly catch total by weight. Data is total commercial catch (by all gears and target types) reported in monthly logbooks. Model outputs show model fitted values of commercial catch total.
77