Embed Size (px)
Citation preview

21 July 2016
1QFY17 Results Update | Sector: Textiles
Kitex Garments
BSE SENSEX S&P CNX CMP: INR488 TP: INR770 (+58%) Buy 27,711 8,510 Bloomberg KTG IN Equity Shares (m) 47.5 M.Cap.(INRb)/(USDb) 23.2 / 0.3
52-Week Range (INR) 934/340 1, 6, 12 Rel. Per (%) 1/-23/-43 Avg Val, (INR m) 95 Free float (%) 45.8 Financials & Valuations (INR b) Y/E Mar 2016 2017E 2018E Sales 5.5 6.6 7.9 EBITDA 1.9 2.4 3.0 NP 1.1 1.6 2.0 EPS (INR) 23.6 32.8 42.7 EPS Gr. (%) 13.8 39.0 30.2 BV/Sh. (INR) 77.3 103.1 137.6 RoE (%) 35.5 36.3 35.5 RoCE (%) 27.4 32.2 33.6 P/E (x) 20.7 14.9 11.4 P/BV (x) 6.3 4.7 3.5 Estimate change TP change Rating change
Confident about meeting growth guidance given new client additions and capacity expansion Results in line with expectations: Kitex Garments’ (KTG) 1QFY17 revenues grew
9.4% YoY to INR1.2b (v/s est. of INR1.1b), led by higher garments (+6.6% YoY) and net fabric (+23.1% YoY) revenues. EBITDA margin expanded 80bp YoY to 28.4% (v/s est. of 29.5%), while PAT grew 31% to INR209m on account of lower interest outgo. Management continues to maintain its guidance of 20% annual growth over the next three years due to new client additions and commensurate capacity addition. After increasing capacity to 320,000 pcs/day from 270,000 pcs/day, the company aims to sustain this momentum, which should aid targeted top line growth of 20% for FY17.
Addition of clients to drive revenues: KTG recently added a new client, Sam’s Club, which is a subsidiary of Wal-Mart. Sam’s is a wholesale format business with lower margins of 15-18% (v/s retailer margins of 50-60%), but we note that it sells products in large quantities to its members. We view this as a huge opportunity in terms of business for KTG. The company expects USD5-6m business in FY17 and USD15m in FY18. Additionally, Kitex has shipped its first consignment of Lamaze on a test basis (order size of USD50,000), and for the full year, it intends to clock USD7m of revenues.
New textile policy to be favorable: Based on available prima facie information, KTG expects the new textile policy to be highly favorable for the garment industry. It expects annual benefit of INR18.7m from the Provident Fund scheme, INR250-300m from increased rate of duty drawback by 5%, and higher capital subsidy benefit (15-25%) on capex planned. Also, in terms of Income Tax, it will qualify under section 80JJAA, which should help it save INR100m.
Valuation and view: We expect 20% revenue CAGR, along with 35% PAT CAGR over FY16-18 after considering the impact of IT benefit u/s 80JJAA. We expect EBITDA margins to expand by 390bp over FY16-18E given operating leverage benefits. Given huge scalability, strong return ratios and free cash generation, we maintain Buy with a TP of INR770—valuing it at 18x FY18E EPS.
Investors are advised to refer through important disclosures made at the last page of the Research Report. Motilal Oswal research is available on www.motilaloswal.com/Institutional-Equities, Bloomberg, Thomson Reuters, Factset and S&P Capital.
Niket Shah ([email protected]); +91 22 6129 1535 Chintan Modi ([email protected]); +91 22 6129 1554
Motilal Oswal values your support in the Asiamoney Brokers Poll 2016 for
India Research, Sales and Trading team. We request your ballot.

Kitex Garments
21 July 2016 2
Revenues meet expectations KTG’s 1QFY17 revenue grew 9.4% to INR1.2b (est. of INR1.1b) led by garments
which grew 6.6% and net fabric revenues which grew 23.1%. EBITDA marginsexpanded 80bp YoY to 28.4% (est. of 29.5%) while PAT grew by 31% to INR209mon account of lower interest outgo.
The management continues to maintain its guidance of 20% growth every yearover next 3 years on the back of new client additions and commensuratecapacity addition to support growth.
Currently, the company has already increased capacity to 320,000 pcs per dayfrom 270,000 pcs per day and will continue to increase the same which shall aidtargeted topline growth of 20% for FY17.
Exhibit 1: Revenue growth trend
Source: MOSL, Company
Exhibit 2: EBITDA and margins trend
Source: MOSL, Company
Exhibit 3: PAT growth trend
Source: MOSL, Company
Garments segment reports 6.6% growth, fabrics grow 23.4% During 1QFY17, garments segment grew 6.6% to INR970m while net fabric
revenues grew 23.4% to INR223m. Garment business contribution to total revenue stood at 81% as against 83% in
1QFY16. Garment margins improved by 150bp YoY to 32.8% while fabric margins
decreased from 4.4% in 1QFY16 to 4% in 1QFY17.
1,005 1,001 995 1,4221,028
1,282 1,221 1,580 1,091 1,343
1,181
1,844 1,193
58% 52%
3%
56%
2%
28% 23% 11% 6% 5%
-3%
17% 9%
1QFY
14
2QFY
14
3QFY
14
4QFY
14
1QFY
15
2QFY
15
3QFY
15
4QFY
15
1QFY
16
2QFY
16
3QFY
16
4QFY
16
1QFY
17
Revenues (INR m) Revenue growth (%)
159 173 203 417 272 337 419 660 301 451 417 693 339
16% 17% 20%
29% 26% 26%34%
42%
28% 34% 35% 38%
28%
1QFY
14
2QFY
14
3QFY
14
4QFY
14
1QFY
15
2QFY
15
3QFY
15
4QFY
15
1QFY
16
2QFY
16
3QFY
16
4QFY
16
1QFY
17
EBITDA (INR m) EBITDA Margins (%)
130 120
113
211
144
193 231 416
160
272 241 449 209
80%
197%
9%
171%
11% 61%
104% 97%
11% 41%
4% 8% 32%
1QFY
14
2QFY
14
3QFY
14
4QFY
14
1QFY
15
2QFY
15
3QFY
15
4QFY
15
1QFY
16
2QFY
16
3QFY
16
4QFY
16
1QFY
17
PAT (INR m) PAT growth (%)

Kitex Garments
21 July 2016 3
Exhibit 4: Garments revenues and growth
Source: MOSL, Company
Exhibit 5: Fabric revenue and growth
Source: MOSL, Company
Exhibit 6: Segment revenue mix (%)
Source: MOSL, Company
Exhibit 7: Segment margins
Source: MOSL, Company
Management confident of 20% CAGR over FY16-FY19 aided by newer clients and products Kitex recently added new client – Sams Club which is a subsidiary of Wal-mart
and is wholesale format business where its (Sams Club’s) margins are lower at15-18% compared to retailer margins 50-60% margins which is available to itsmembers but sells in large quantities. This can be a huge opportunity in terms ofbusiness for Kitex, going ahead. The company expects USD5-6m business in FY17and USD15m in FY18.
Additionally, Kitex shipped out first its first consignment of Lamaze on test basis(size of USD50,000) but on a full year it intends to clock USD7m of revenue. ByFall season the company intends to increase traction in business. It also in talkswith COSCO for Lamaze business.
New Textile policy to be favorable As per prima facie information available, Kitex expects new policy to be highly
favorable for garment industry. It expects annual benefit of INR18.7m from Provident Fund scheme, INR250-
300m benefit from increased rate of duty drawback by 5% and increased capitalsubsidy benefit (15% to 25%) on capex planned.
However, the management has clarified that it is as per prima facie evidenceavailable but will get clarity once it receives detailed document.
Additionally, under Income Tax it will qualify under section 80JJAA which shallhelp savings of INR100m.
851 805
723
1123 8191091
1116 1435
910 1170 1051 1630 970
57% 53%
-14%
49%
-4%
36%
54%
28% 11% 7%
-6%
14% 7%
1QFY
14
2QFY
14
3QFY
14
4QFY
14
1QFY
15
2QFY
15
3QFY
15
4QFY
15
1QFY
16
2QFY
16
3QFY
16
4QFY
16
1QFY
17
Garments (INR m) Growth (YoY)
154 196 272
299 209 191
105 145 181 173 130 213 223
62% 49%
124% 89%
36% -3%
-61% -51%-13% -10%
24% 47%
23%
1QFY
14
2QFY
14
3QFY
14
4QFY
14
1QFY
15
2QFY
15
3QFY
15
4QFY
15
1QFY
16
2QFY
16
3QFY
16
4QFY
16
1QFY
17
Fabric (INR m) Growth (YoY)
85% 80% 73% 79% 80% 85% 91% 91% 83% 87% 89% 88% 81%
15% 20% 27% 21% 20% 15% 9% 9% 17% 13% 11% 12% 19%
1QFY
14
2QFY
14
3QFY
14
4QFY
14
1QFY
15
2QFY
15
3QFY
15
4QFY
15
1QFY
16
2QFY
16
3QFY
16
4QFY
16
1QFY
17Garments Fabrics
25% 29% 29% 36% 31% 29%35%
46% 31% 37% 40% 43%
33%
-34% -34%
-4%
12% 1% 3% 8% 7% 4% 5% 6% 5% 4%
1QFY
14
2QFY
14
3QFY
14
4QFY
14
1QFY
15
2QFY
15
3QFY
15
4QFY
15
1QFY
16
2QFY
16
3QFY
16
4QFY
16
1QFY
17
Garments Fabrics

Kitex Garments
21 July 2016 4
Cotton price increase will have no impact on margins The management clarified that recent increase in cotton prices will have no
impact on the margins of the company. The company when it gets a confirmedPurchase Order from clients it simultaneously books/cover the raw material forthe same and pricing is accordingly done. Therefore, there will never be anyimpact on margins of the company.
Other conference call highlights Current debt on books includes INR500m of packing credit and term loan of
INR190m. The recent Madras high court order to increase pay hike by 30% will not impact
Kitex as it is located in Kerela. Additionally, the minimum wages prescribed inKerela is INR5,500 to 7,000p.m however, Kitex’s starting salary is INR8,000pmand goes upto INR12,000-13,000pm.
The management clarified that amount lying in dollar need not be convertedinto rupee as per FEMA rule if it is already hedged. Kitex has already hedged itcash lying in dollar denominations.
Exhibit 8: Quarterly metrics (%) 1QFY14 2QFY14 3QFY14 4QFY14 1QFY15 2QFY15 3QFY15 4QFY15 1QFY16 2QFY16 3QFY16 4QFY16 1QFY17
Sales Growth % Garments 57 53 -14 49 -4 36 54 28 11 7 -6 14 7 Fabrics 62 49 124 89 36 -3 -61 -51 -13 -10 24 47 23
Sales Mix % Garments 85 80 73 79 80 85 91 91 83 87 89 88 81 Fabrics 15 20 27 21 20 15 9 9 17 13 11 12 19
EBIT Margin % Garments 25 29 29 36 31 29 35 46 31 37 42 43 33 Fabrics -34 -34 -4 12 1 3 8 7 4 5 7 5 4
EBIT Contri % Garments 133 140 106 92 99 98 98 99 97 98 98 99 97 Fabrics -33 -40 -6 8 1 2 2 1 3 2 2 1 3
Source: Company, MOSL
Valuation and view
We value KTG at 18x FY18E EPS, higher than its 5-year average of 12.2x, which we believe is justified considering:
Large opportunity: Kitex has presence in the highly niche USD20b global infant-wear clothing market and is the 3rd largest vendor globally. With India’s market share being low single-digit, and with India’s growing competitiveness against erstwhile low-cost countries like China (~52% market share), we believe the long term opportunity for KTG is large.

Kitex Garments
21 July 2016 5
High entry barriers: KTG is the largest exporter of infant-wear clothing out of India and commands a 70% market share for all infant-wear clothing exports out of India. Adhering to stringent safety measures, maintaining high quality standards, higher degree of complexity (than adult garments) due to involvement of small sizes, need for greater variety, smaller batch size orders and high labor requirements are some of the key entry barriers that support superior profitability for the company.
Industry leading return ratios: KTG commands strong, industry leading return ratios (41.8% RoCE and 35.5% RoE), with its business model generating robust free cash generation (INR4.6b over FY16-18). We believe KTG stands out amongst listed textile exporters (with most of them present in capital intensive, low RoCE businesses of yarn and fabric manufacturing (averaging ~10% RoCE).
Opportunity to enter the brands business: We expect KTG to capture a larger pie of the infant-wear value chain through its forward integration with its launch of own brand in the US market (Little Stars) as well as licensing of private labels (Lamaze) in the US market. Forward integration holds high significance for the company as margins in its own brand will be double of the current business (~60% versus current margins of ~30%), along with higher realizations.
We value the stock at 18x FY18E EPS of INR42.7, arriving at price target of INR770. Maintain Buy.
Exhibit 9: 15 year PE band
Source: MOSL, Company
Exhibit 10: 15 year PB band
Source: MOSL, Company
Operating metrics Exhibit 11: Operating metrics and key assumptions Y/E March (INR m) FY12 FY13 FY14 FY15 FY16 FY17E FY18E Growth (%) Garments 15 31 27 7 19 19 Fabric -36 82 -29 7 -5 0 Net Revenues 2 40 16 7 21 20
Contribution (%) Garments 75 84 79 87 87 86 85 Fabric 25 16 21 13 13 10 8 In-licensed brands 4 6 Net Revenues 100 100 100 100 100 100 100
Source: Company, MOSL
15.5
6.4
12.6
8.5
0
7
14
21
28
35
42
Jun-
01
Aug-
02
Oct
-03
Dec
-04
Feb-
06
Mar
-07
May
-08
Jul-0
9
Sep-
10
Nov
-11
Dec
-12
Feb-
14
Apr-1
5
Jun-
16
P/E (x) 14Yrs Avg(x)5 Yrs Avg(x) 10 Yrs Avg(x)
4.8
2.0
3.9 2.6
0.0
4.0
8.0
12.0
16.0
Jun-
01
Aug-
02
Oct
-03
Dec
-04
Feb-
06
Mar
-07
May
-08
Jul-0
9
Sep-
10
Nov
-11
Dec
-12
Feb-
14
Apr-1
5
Jun-
16
P/B (x) 14 Yrs Avg(x)5 Yrs Avg(x) 10 Yrs Avg(x)

Kitex Garments
21 July 2016 6
Story in charts
Exhibit 12: Global children’s wear market is huge
Source: MOSL, Company
Exhibit 13: India has high potential for infant-wear sourcing
Source: MOSL, Company
Exhibit 14: Kitex is the 3rd largest infant-wear player
Source: MOSL, Company
Exhibit 15: Kitex dominated infant-wear exports from India
Source: MOSL, Company
Exhibit 16: Diversified client mix augurs well for margins
Source: MOSL, Company
Exhibit 17: Kitex reports strong capital efficiency
Source: MOSL, Company
216 229 244 259 275 292
2013 2014 2015 2016 2017 2018
Children's wear market (USD b)
China 52%
Bangladesh 9%
Cambodia 8%
Vietnam 6%
India 5%
Others 20%
7.5 6.5
5.5
Wingloo (China) Gimmell (Singapore) Kitex (India)
Global infant-wear suppliers capacity (Lakh Pieces per day)
Kitex, 70%
Jay Jay Mills, 15%
Others, 15%
Gerber, 25%
Toys R Us, 20%
Jockey, 20%
Mothercare, 20%
Carters, 15%
18
24
30 27
31 33
FY13 FY14 FY15 FY16 FY17E FY18E
RoCE (%)

Kitex Garments
21 July 2016 7
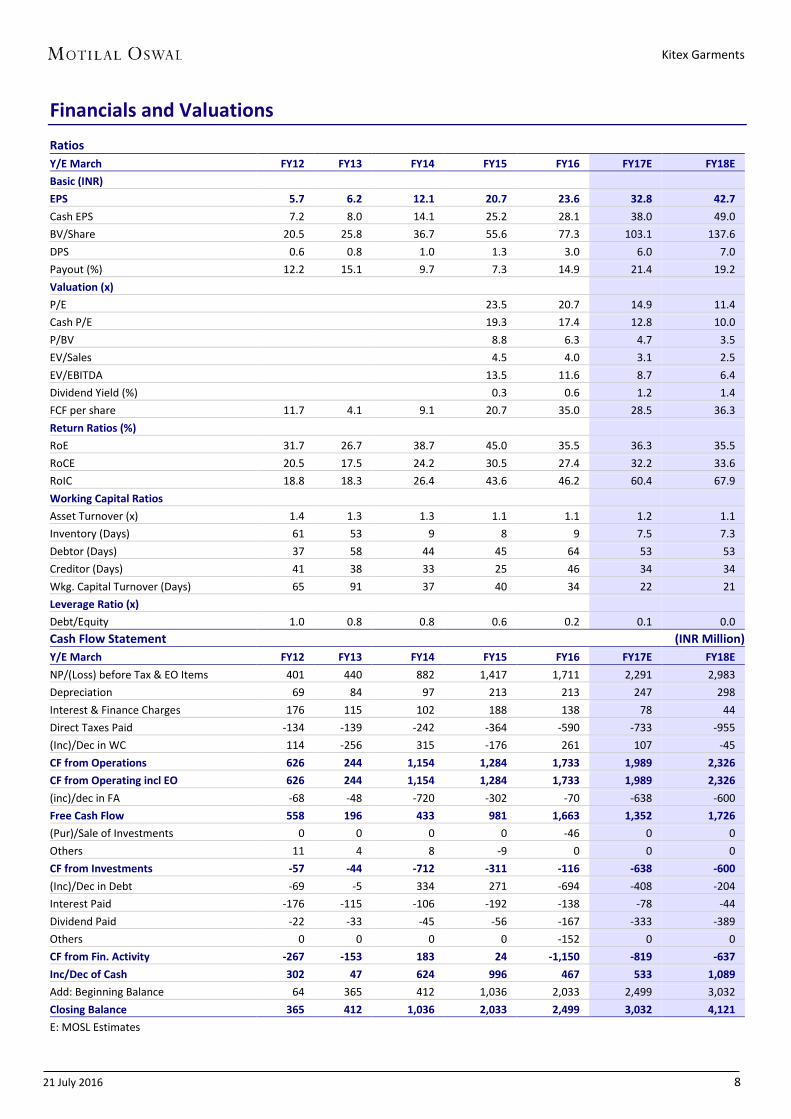
Financials and Valuations
Income Statement (INR Million) Y/E March FY12 FY13 FY14 FY15 FY16 FY17E FY18E Net Sales 3,120 3,170 4,422 5,111 5,458 6,578 7,904 Change (%) 21.9 1.6 39.5 15.6 6.8 20.5 20.2 EBITDA 582 601 951 1,687 1,863 2,368 3,004 Margin (%) 18.7 19.0 21.5 33.0 34.1 36.0 38.0 Depreciation 69 86 97 213 213 247 298 EBIT 514 515 855 1,474 1,650 2,121 2,706 Int. and Finance Charges 176 115 106 192 138 78 44 Other Income - Rec. 64 40 133 134 198 248 322 PBT bef. EO Exp. 401 440 882 1,417 1,711 2,291 2,983 EO Expense/(Income) 0 0 0 0 0 0 0 PBT after EO Exp. 401 440 882 1,417 1,711 2,291 2,983 Current Tax 124 149 254 422 590 733 955 Deferred Tax 6 -2 55 10 0 0 0 Tax Rate (%) 32.4 33.3 34.9 30.5 34.5 32.0 32.0 Reported PAT 271 294 574 985 1,121 1,558 2,029 PAT Adj for EO items 271 294 574 985 1,121 1,558 2,029 Change (%) 31.5 8.3 95.3 71.7 13.8 39.0 30.2 Margin (%) 8.7 9.3 13.0 19.3 20.5 23.7 25.7
Balance Sheet (INR Million) Y/E March FY12 FY13 FY14 FY15 FY16 FY17E FY18E Equity Share Capital 48 48 48 48 48 48 48 Total Reserves 927 1,176 1,694 2,591 3,626 4,851 6,491 Net Worth 974 1,224 1,742 2,639 3,674 4,899 6,538 Minority Interest 0 0 0 0 0 0 0 Deferred Liabilities 163 162 216 226 206 206 206 Total Loans 1,015 1,012 1,342 1,612 918 510 306 Capital Employed 2,153 2,397 3,299 4,477 4,798 5,615 7,050
Gross Block 1,613 1,638 2,374 2,625 2,686 3,336 3,936 Less: Accum. Deprn. 385 465 562 743 956 1,203 1,501 Net Fixed Assets 1,228 1,172 1,812 1,882 1,730 2,133 2,435 Capital WIP 4 23 7 3 12 0 0 Total Investments 0 0 0 0 46 46 46
Curr. Assets, Loans&Adv. 1,443 1,755 2,219 3,468 4,401 5,054 6,501 Inventory 520 459 108 112 130 135 157 Account Receivables 318 506 531 627 960 956 1,149 Cash and Bank Balance 365 412 1,036 2,033 2,499 3,032 4,121 Loans and Advances 240 378 544 696 811 931 1,075 Curr. Liability & Prov. 522 553 738 876 1,391 1,619 1,932 Account Payables 348 333 402 343 688 621 747 Provisions 174 221 337 532 703 997 1,186 Net Current Assets 921 1,202 1,480 2,592 3,010 3,436 4,569 Appl. of Funds 2,153 2,397 3,299 4,477 4,798 5,615 7,050 E: MOSL Estimates
Kitex Garments
21 July 2016 8
Financials and Valuations Ratios Y/E March FY12 FY13 FY14 FY15 FY16 FY17E FY18E Basic (INR) EPS 5.7 6.2 12.1 20.7 23.6 32.8 42.7 Cash EPS 7.2 8.0 14.1 25.2 28.1 38.0 49.0 BV/Share 20.5 25.8 36.7 55.6 77.3 103.1 137.6 DPS 0.6 0.8 1.0 1.3 3.0 6.0 7.0 Payout (%) 12.2 15.1 9.7 7.3 14.9 21.4 19.2 Valuation (x) P/E 23.5 20.7 14.9 11.4 Cash P/E 19.3 17.4 12.8 10.0 P/BV 8.8 6.3 4.7 3.5 EV/Sales 4.5 4.0 3.1 2.5 EV/EBITDA 13.5 11.6 8.7 6.4 Dividend Yield (%) 0.3 0.6 1.2 1.4 FCF per share 11.7 4.1 9.1 20.7 35.0 28.5 36.3 Return Ratios (%) RoE 31.7 26.7 38.7 45.0 35.5 36.3 35.5 RoCE 20.5 17.5 24.2 30.5 27.4 32.2 33.6 RoIC 18.8 18.3 26.4 43.6 46.2 60.4 67.9 Working Capital Ratios Asset Turnover (x) 1.4 1.3 1.3 1.1 1.1 1.2 1.1 Inventory (Days) 61 53 9 8 9 7.5 7.3 Debtor (Days) 37 58 44 45 64 53 53 Creditor (Days) 41 38 33 25 46 34 34 Wkg. Capital Turnover (Days) 65 91 37 40 34 22 21 Leverage Ratio (x) Debt/Equity 1.0 0.8 0.8 0.6 0.2 0.1 0.0 Cash Flow Statement (INR Million) Y/E March FY12 FY13 FY14 FY15 FY16 FY17E FY18E NP/(Loss) before Tax & EO Items 401 440 882 1,417 1,711 2,291 2,983 Depreciation 69 84 97 213 213 247 298 Interest & Finance Charges 176 115 102 188 138 78 44 Direct Taxes Paid -134 -139 -242 -364 -590 -733 -955(Inc)/Dec in WC 114 -256 315 -176 261 107 -45CF from Operations 626 244 1,154 1,284 1,733 1,989 2,326 CF from Operating incl EO 626 244 1,154 1,284 1,733 1,989 2,326 (inc)/dec in FA -68 -48 -720 -302 -70 -638 -600Free Cash Flow 558 196 433 981 1,663 1,352 1,726 (Pur)/Sale of Investments 0 0 0 0 -46 0 0 Others 11 4 8 -9 0 0 0 CF from Investments -57 -44 -712 -311 -116 -638 -600(Inc)/Dec in Debt -69 -5 334 271 -694 -408 -204Interest Paid -176 -115 -106 -192 -138 -78 -44Dividend Paid -22 -33 -45 -56 -167 -333 -389Others 0 0 0 0 -152 0 0 CF from Fin. Activity -267 -153 183 24 -1,150 -819 -637Inc/Dec of Cash 302 47 624 996 467 533 1,089 Add: Beginning Balance 64 365 412 1,036 2,033 2,499 3,032 Closing Balance 365 412 1,036 2,033 2,499 3,032 4,121 E: MOSL Estimates
Kitex Garments
21 July 2016 9
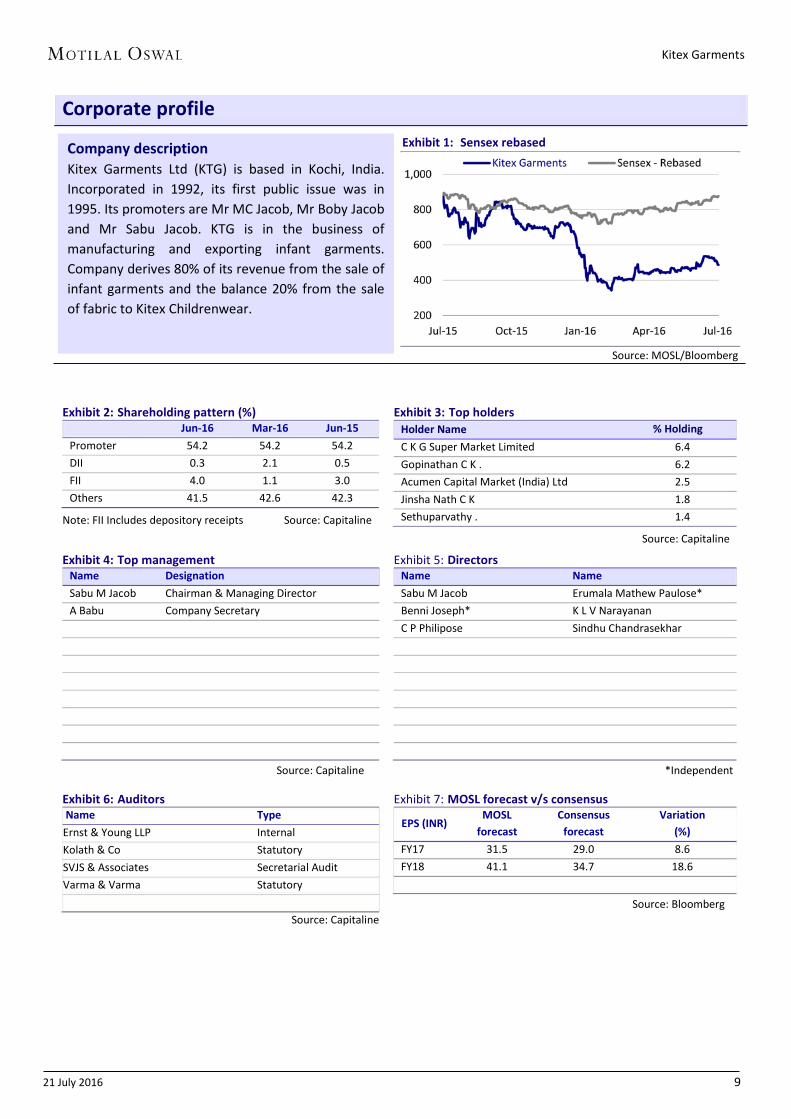
Corporate profile Exhibit 1: Sensex rebased
Source: MOSL/Bloomberg
Exhibit 2: Shareholding pattern (%) Jun-16 Mar-16 Jun-15
Promoter 54.2 54.2 54.2 DII 0.3 2.1 0.5 FII 4.0 1.1 3.0 Others 41.5 42.6 42.3
Note: FII Includes depository receipts Source: Capitaline
Exhibit 3: Top holders Holder Name % Holding C K G Super Market Limited 6.4 Gopinathan C K . 6.2 Acumen Capital Market (India) Ltd 2.5 Jinsha Nath C K 1.8 Sethuparvathy . 1.4
Source: Capitaline
Exhibit 4: Top management Name Designation Sabu M Jacob Chairman & Managing Director A Babu Company Secretary
Source: Capitaline
Exhibit 5: Directors Name Name Sabu M Jacob Erumala Mathew Paulose* Benni Joseph* K L V Narayanan C P Philipose Sindhu Chandrasekhar
*Independent
Exhibit 6: Auditors Name Type Ernst & Young LLP Internal Kolath & Co Statutory SVJS & Associates Secretarial Audit Varma & Varma Statutory
Source: Capitaline
Exhibit 7: MOSL forecast v/s consensus
EPS (INR) MOSL
forecast Consensus
forecast Variation
(%) FY17 31.5 29.0 8.6 FY18 41.1 34.7 18.6
Source: Bloomberg
Company description Kitex Garments Ltd (KTG) is based in Kochi, India. Incorporated in 1992, its first public issue was in 1995. Its promoters are Mr MC Jacob, Mr Boby Jacob and Mr Sabu Jacob. KTG is in the business of manufacturing and exporting infant garments. Company derives 80% of its revenue from the sale of infant garments and the balance 20% from the sale of fabric to Kitex Childrenwear.

Kitex Garments
Kitex Garments
Kitex Garments
PRODUCT GALLERY
Kitex Garments
21 July 2016 11
N O T E S

Kitex Garments
21 July 2016 12
Disclosures
This document has been prepared by Motilal Oswal Securities Limited (hereinafter referred to as Most) to provide information about the company (ies) and/sector(s), if any, covered in the report and may be distributed by it and/or its affiliated company(ies). This report is for personal information of the selected recipient/s and does not construe to be any investment, legal or taxation advice to you. This research report does not constitute an offer, invitation or inducement to invest in securities or other investments and Motilal Oswal Securities Limited (hereinafter referred as MOSt) is not soliciting any action based upon it. This report is not for public distribution and has been furnished to you solely for your general information and should not be reproduced or redistributed to any other person in any form. This report does not constitute a personal recommendation or take into account the particular investment objectives, financial situations, or needs of individual clients. Before acting on any advice or recommendation in this material, investors should consider whether it is suitable for their particular circumstances and, if necessary, seek professional advice. The price and value of the investments referred to in this material and the income from them may go down as well as up, and investors may realize losses on any investments. Past performance is not a guide for future performance, future returns are not guaranteed and a loss of original capital may occur.
MOSt and its affiliates are a full-service, integrated investment banking, investment management, brokerage and financing group. We and our affiliates have investment banking and other business relationships with a some companies covered by our Research Department. Our research professionals may provide input into our investment banking and other business selection processes. Investors should assume that MOSt and/or its affiliates are seeking or will seek investment banking or other business from the company or companies that are the subject of this material and that the research professionals who were involved in preparing this material may educate investors on investments in such business . The research professionals responsible for the preparation of this document may interact with trading desk personnel, sales personnel and other parties for the purpose of gathering, applying and interpreting information. Our research professionals are paid on twin parameters of performance & profitability of MOSt. MOSt generally prohibits its analysts, persons reporting to analysts, and members of their households from maintaining a financial interest in the securities or derivatives of any companies that the analysts cover. Additionally, MOSt generally prohibits its analysts and persons reporting to analysts from serving as an officer, director, or advisory board member of any companies that the analysts cover. Our salespeople, traders, and other professionals or affiliates may provide oral or written market commentary or trading strategies to our clients that reflect opinions that are contrary to the opinions expressed herein, and our proprietary trading and investing businesses may make investment decisions that are inconsistent with the recommendations expressed herein. In reviewing these materials, you should be aware that any or all of the foregoing among other things, may give rise to real or potential conflicts of interest. MOSt and its affiliated company(ies), their directors and employees and their relatives may; (a) from time to time, have a long or short position in, act as principal in, and buy or sell the securities or derivatives thereof of companies mentioned herein. (b) be engaged in any other transaction involving such securities and earn brokerage or other compensation or act as a market maker in the financial instruments of the company(ies) discussed herein or act as an advisor or lender/borrower to such company(ies) or may have any other potential conflict of interests with respect to any recommendation and other related information and opinions.; however the same shall have no bearing whatsoever on the specific recommendations made by the analyst(s), as the recommendations made by the analyst(s) are completely independent of the views of the affiliates of MOSt even though there might exist an inherent conflict of interest in some of the stocks mentioned in the research report Reports based on technical and derivative analysis center on studying charts company's price movement, outstanding positions and trading volume, as opposed to focusing on a company's fundamentals and, as such, may not match with a report on a company's fundamental analysis. In addition MOST has different business segments / Divisions with independent research separated by Chinese walls catering to different set of customers having various objectives, risk profiles, investment horizon, etc, and therefore may at times have different contrary views on stocks sectors and markets.
Unauthorized disclosure, use, dissemination or copying (either whole or partial) of this information, is prohibited. The person accessing this information specifically agrees to exempt MOSt or any of its affiliates or employees from, any and all responsibility/liability arising from such misuse and agrees not to hold MOSt or any of its affiliates or employees responsible for any such misuse and further agrees to hold MOSt or any of its affiliates or employees free and harmless from all losses, costs, damages, expenses that may be suffered by the person accessing this information due to any errors and delays. The information contained herein is based on publicly available data or other sources believed to be reliable. Any statements contained in this report attributed to a third party represent MOSt’s interpretation of the data, information and/or opinions provided by that third party either publicly or through a subscription service, and such use and interpretation have not been reviewed by the third party. This Report is not intended to be a complete statement or summary of the securities, markets or developments referred to in the document. While we would endeavor to update the information herein on reasonable basis, MOSt and/or its affiliates are under no obligation to update the information. Also there may be regulatory, compliance, or other reasons that may prevent MOSt and/or its affiliates from doing so. MOSt or any of its affiliates or employees shall not be in any way responsible and liable for any loss or damage that may arise to any person from any inadvertent error in the information contained in this report. MOSt or any of its affiliates or employees do not provide, at any time, any express or implied warranty of any kind, regarding any matter pertaining to this report, including without limitation the implied warranties of merchantability, fitness for a particular purpose, and non-infringement. The recipients of this report should rely on their own investigations.
This report is intended for distribution to institutional investors. Recipients who are not institutional investors should seek advice of their independent financial advisor prior to taking any investment decision based on this report or for any necessary explanation of its contents.
Most and it’s associates may have managed or co-managed public offering of securities, may have received compensation for investment banking or merchant banking or brokerage services, may have received any compensation for products or services other than investment banking or merchant banking or brokerage services from the subject company in the past 12 months. Most and it’s associates have not received any compensation or other benefits from the subject company or third party in connection with the research report. Subject Company may have been a client of Most or its associates during twelve months preceding the date of distribution of the research report
MOSt and/or its affiliates and/or employees may have interests/positions, financial or otherwise of over 1 % at the end of the month immediately preceding the date of publication of the research in the securities mentioned in this report. To enhance transparency, MOSt has incorporated a Disclosure of Interest Statement in this document. This should, however, not be treated as endorsement of the views expressed in the report.
Motilal Oswal Securities Limited is registered as a Research Analyst under SEBI (Research Analyst) Regulations, 2014. SEBI Reg. No. INH000000412
Pending Regulatory inspections against Motilal Oswal Securities Limited: SEBI pursuant to a complaint from client Shri C.R. Mohanraj alleging unauthorized trading, issued a letter dated 29th April 2014 to MOSL notifying appointment of an Adjudicating Officer as per SEBI regulations to hold inquiry and adjudge violation of SEBI Regulations; MOSL replied to the Show Cause Notice whereby SEBI granted us an opportunity of Inspection of Documents. Since all the documents requested by us were not covered we have requested to SEBI vide our letter dated June 23, 2015 to provide pending list of documents for inspection.
List of associate companies of Motilal Oswal Securities Limited -Click here to access detailed report
Analyst Certification The views expressed in this research report accurately reflect the personal views of the analyst(s) about the subject securities or issues, and no part of the compensation of the research analyst(s) was, is, or will be directly or indirectly related to the specific recommendations and views expressed by research analyst(s) in this report. The research analysts, strategists, or research associates principally responsible for preparation of MOSt research receive compensation based upon various factors, including quality of research, investor client feedback, stock picking, competitive factors and firm revenues Disclosure of Interest Statement KITEX GARMENTS Analyst ownership of the stock NoServed as an officer, director or employee No
A graph of daily closing prices of securities is available at www.nseindia.com and http://economictimes.indiatimes.com/markets/stocks/stock-quotes
Regional Disclosures (outside India) This report is not directed or intended for distribution to or use by any person or entity resident in a state, country or any jurisdiction, where such distribution, publication, availability or use would be contrary to law, regulation or which would subject MOSt & its group companies to registration or licensing requirements within such jurisdictions.
For Hong Kong: This report is distributed in Hong Kong by Motilal Oswal capital Markets (Hong Kong) Private Limited, a licensed corporation (CE AYY-301) licensed and regulated by the Hong Kong Securities and Futures Commission (SFC) pursuant to the Securities and Futures Ordinance (Chapter 571 of the Laws of Hong Kong) “SFO”. As per SEBI (Research Analyst Regulations) 2014 Motilal Oswal Securities (SEBI Reg No. INH000000412) has an agreement with Motilal Oswal capital Markets (Hong Kong) Private Limited for distribution of research report in Kong Kong. This report is intended for distribution only to “Professional Investors” as defined in Part I of Schedule 1 to SFO. Any investment or investment activity to which this document relates is only available to professional investor and will be engaged only with professional investors.” Nothing here is an offer or solicitation of these securities, products and services in any jurisdiction where their offer or sale is not qualified or exempt from registration. The Indian Analyst(s) who compile this report is/are not located in Hong Kong & are not conducting Research Analysis in Hong Kong.
For U.S Motilal Oswal Securities Limited (MOSL) is not a registered broker - dealer under the U.S. Securities Exchange Act of 1934, as amended (the"1934 act") and under applicable state laws in the United States. In addition MOSL is not a registered investment adviser under the U.S. Investment Advisers Act of 1940, as amended (the "Advisers Act" and together with the 1934 Act, the "Acts), and under applicable state laws in the United States. Accordingly, in the absence of specific exemption under the Acts, any brokerage and investment services provided by MOSL, including the products and services described herein are not available to or intended for U.S. persons.
This report is intended for distribution only to "Major Institutional Investors" as defined by Rule 15a-6(b)(4) of the Exchange Act and interpretations thereof by SEC (henceforth referred to as "major institutional investors"). This document must not be acted on or relied on by persons who are not major institutional investors. Any investment or investment activity to which this document relates is only available to major institutional investors and will be engaged in only with major institutional investors. In reliance on the exemption from registration provided by Rule 15a-6 of the U.S. Securities Exchange Act of 1934, as amended (the "Exchange Act") and interpretations thereof by the U.S. Securities and Exchange Commission ("SEC") in order to conduct business with Institutional Investors based in the U.S., MOSL has entered into a chaperoning agreement with a U.S. registered broker-dealer, Motilal Oswal Securities International Private Limited. ("MOSIPL"). Any business interaction pursuant to this report will have to be executed within the provisions of this chaperoning agreement.
The Research Analysts contributing to the report may not be registered /qualified as research analyst with FINRA. Such research analyst may not be associated persons of the U.S. registered broker-dealer, MOSIPL, and therefore, may not be subject to NASD rule 2711 and NYSE Rule 472 restrictions on communication with a subject company, public appearances and trading securities held by a research analyst account.
For Singapore Motilal Oswal Capital Markets Singapore Pte Limited is acting as an exempt financial advisor under section 23(1)(f) of the Financial Advisers Act(FAA) read with regulation 17(1)(d) of the Financial Advisors Regulations and is a subsidiary of Motilal Oswal Securities Limited in India. This research is distributed in Singapore by Motilal Oswal Capital Markets Singapore Pte Limited and it is only directed in Singapore to accredited investors, as defined in the Financial Advisers Regulations and the Securities and Futures Act (Chapter 289), as amended from time to time.
In respect of any matter arising from or in connection with the research you could contact the following representatives of Motilal Oswal Capital Markets Singapore Pte Limited: Varun Kumar Kadambari Balachandran [email protected] [email protected] Contact : (+65) 68189232 (+65) 68189233 / 65249115 Office Address:21 (Suite 31),16 Collyer Quay,Singapore 04931
Motilal Oswal Securities Ltd Motilal Oswal Tower, Level 9, Sayani Road, Prabhadevi, Mumbai 400 025
Phone: +91 22 3982 5500 E-mail: [email protected]