Embed Size (px)
DESCRIPTION
http://playground.unisoncreative.com/pag/wp-content/uploads/2011/04/KJAB_20110426-PACL-Annual-Results.pdf
Citation preview

RNS Number : 4481F Pacific Alliance China Land Limited 26 April 2011
26 April 2011
Pacific Alliance China Land Limited ('PACL' or the 'Company')
Full year results for the period ended 31 December 2010
Pacific Alliance China Land Limited ('PACL' or the 'Company'), an AIM-traded, closed-end investment company with a portfolio of investments including existing properties, new developments, distressed projects and real estate companies in Greater China, has today announced its full year financial results to 31 December 2010. PACL is managed by PAG (formerly known as Pacific Alliance Group), one of the region's largest Asia-focussed alternative investment managers with funds under management across real estate, private equity and hedge funds and special situations and has over 260 staff across offices in Hong Kong, Tokyo, Beijing, Hangzhou, Shanghai, and Tianjin, as well as a presence in Delhi and Seoul. Financial Highlights
· Net asset value as at 31 December 2010 was US$242 million, representing US$1.75 per share, a 26.7 per cent increase on the prior year to 31 December 2009 (US$209.5 million, representing US$1.38 per share).
· The Company's share price increased 46 per cent over the last 12 months, closing at US$1.25 on 31 December 2010, and consistently outperformed major benchmark indices including the FTSE 350 Real Estate Index and the FTSE AIM All-Share Index.
· Since the inception of the Company, the net asset value has grown from $1.00 to $1.75 (as at 31 December 2010), equivalent to a rate of 20 per cent gross of distributions compounded annually despite a market downturn in 2008.
· The Company made two distributions by way of tender offer in 2010 and one in 2009 amounting to a total of US$26 million.
Portfolio and Fund Developments
· The Company applied a very active management approach with its investee companies during the year, and was able to generate a total of RMB96.4 million from Project Jingrui and Project Silk and US$18.3 million from Project Hainan Airport Group and Project Diplomat.
· In September 2010, PACL invested US$22 million to acquire a 15 per cent equity interest with a preferred return in a primarily residential development project in the third tier city of Jiangyin in Jiangsu Province with Shanghai Aijia Investment Group, a leading regional developer in the Yangtze River Delta.
According to Patrick Boot, Managing Director, Pacific Alliance Real Estate Limited, the Company has continued to achieve solid and sustained growth despite a challenging China property market. "Over the course of 2010, we made a strategic decision to minimize our exposure to China's residential property sector which continues to feel the effects of sustained inflationary pressure and stricter monetary

policy initiatives. As a result, we are somewhat insulated against potential price corrections in the residential sector and have instead continued to derive value from the more stable and growing commercial property market "In addition, our commitment to project quality and relationships with industry-leading partners has again delivered significant value to shareholders, with much of our growth driven by three strategic investments completed in 2009 with leading developers and operators in mixed-use property, serviced apartments and shopping malls. "The economic and monetary outlook for China property in 2011 will be challenging, but we are confident we are well placed to continue to deliver value to shareholders." Significant Subsequent Events
· In February 2011, PACL modified its distribution policy so that each distribution will represent 50 per cent of the net realised profit of a fully realised investment, with the remaining 50 per cent, plus returned principal, available for reinvestment.
For further information please contact:
MANAGER: Patrick Boot, Managing Partner PAG Real Estate 45/F,Unit01, Tower 2, Plaza 66 1366 Nanjing Road (West) Shanghai 200040, China T: (86) 21 6288 3788 F: (86) 21 6288 9272 [email protected]
LEGAL COUNSEL: Jon Lewis, General Counsel PAG 15/F, AIA Central 1 Connaught Road Central, Hong Kong T: (852) 2918 0088 F: (852) 2918 0881 [email protected]
BROKER: Hiroshi Funaki LCF Edmond de Rothschild Securities T: (44) 20 7845 5960 F: (44) 20 7845 5961 [email protected]
NOMINATED ADVISER: Philip Secrett Grant Thornton Corporate Finance T: (44) 20 7383 5100 [email protected]
MEDIA RELATIONS: Stephanie Barry PAG T: (852) 3719 3375 [email protected]
Notes to Editors:
Pacific Alliance China Land Limited ('PACL') (AIM: PACL) is a closed-end investment company with net assets of US$240.9 million at 28 February 2011. PACL was admitted to trading on the AIM Market of the London Stock Exchange in November 2007. PACL is focused on investing in a portfolio of existing properties, new developments, distressed projects and pre-IPO and IPO real estate companies in Greater China.

For more information about PACL, please visit: www.pacl-fund.com
Pacific Alliance China Land is managed by PAG (formerly known as Pacific Alliance Group), the Asian alternative investment fund management group. Founded in 2002, PAG is now one of the region's largest Asia-focused alternative investment managers, with funds under management across Private Equity, Real Estate and Hedge Funds and Special Situations.
PAG has over 260 staff across offices in Hong Kong, Tokyo, Beijing, Hangzhou, Shanghai, and Tianjin, as well as a presence in Delhi and Seoul.
For more information about PAG, please visit: www.pacific-alliance.com

Chairperson's Statement Pacific Alliance China Land Limited ("the Company") achieved another year of solid performance in 2010. The Company's net asset value (NAV) as of 31 December 2010 was US$242 million or US$1.7480 per share, a 26.7% increase from the 2009 Audited Financial Statements. The Company's continued commitment to project quality and strong relationships with industry-leading partners has delivered significant value to Shareholders. The Company's major growth has again been derived from the three strategic investments made early in 2009 which continue to outperform. Project Auspice, China's largest mixed-use developer achieved impressive increases in revenue and profits; Project Diplomat, recognised as one of the most prestigious serviced apartment developments in Beijing, continues to see rental increases and improvements in management quality; and Project Malls, one of the country's largest integrated shopping mall developer/operators has expanded its revenue sources to include fund management services for external investors. Despite the continued growth of China's property market in 2010, the investment manager maintains a cautious outlook for 2011. The Chinese government has initiated numerous measures to curb residential property prices and with inflation pressures rising, it is unlikely they will ease any of these measures in the short term. However, the Company's portfolio remains largely insulated against any potential downturn in the residential property market. The investment manager made a strategic decision two years ago to shift its focus to the retail/commercial property sector working exclusively with strong industry leaders in China which should protect the Company from volatility in the residential property sector. At the same time, the Company is well placed to capitalise on the growing demand in the retail/commercial sector driven by positive government policy (pro-consumption) and rising wages. By the end of 2011, the Company expects to exit more investments which should help support further distributions to investors as well as provide free cash to pursue additional strategic investments. The combined impact of sustained interest rate hikes and increasingly restrictive bank lending should result in a number of attractively priced opportunities and the Company is well placed to capitalize on these. The Board of Directors would like to take this opportunity to thank you for the important role you have played in the Company's growth in 2010, and for your continuing support in 2011. This promises to be a challenging year as we continue to navigate a rapidly changing marketplace, but we are confident the investment manager will continue to aggressively manage the Company's core investment holdings to achieve long-term financial rewards for our Shareholders. Margaret Brooke Chairperson

Investment Manager's Report Portfolio Performance As at 31 December 2010, the Company's audited total net asset value ("NAV") was US$242 million, at US$1.7480 per share. This is a 26.7% increase from the 2009 Audited Financial Statements and an annualized increase of 20% since inception. Independent valuations are currently undertaken on a quarterly basis by recognized international valuation firms and real estate appraisers. The NAV as per the December 2010 newsletter was US$1.7532, 0.3% higher than the audited NAV. The difference is a result of provision for fees being accrued. The announced NAV in January 2011 incorporated the adjustment. On 31 December 2010, the Company's share price closed at US$1.2525, a 46% increase year-on-year and a 28% discount to the audited NAV per ordinary share. PACL's share price has outperformed major benchmark indices including the FTSE 350 Real Estate Index and the FTSE AIM All-Share Index on a consistent basis. 31 December 2010 31 December 2009 US$ US$ Realized Gain
Investment interest income 15,441,136 16,620,660 Dividend income 332,100 - Deposit interest 581,868 373,203 Other income 1,209,875 360,730
─────── ───────
17,564,979 17,354,593
Change in Unrealized Gain Pre-IPO financing 29,829,626 5,866,667
Bridge financing (5,129,675) (6,584,785) Co-development 9,466,229 5,183,385 Other real estate investments 46,636,232 65,931,356 Share of profits payable to PACL II (9,403,257) (6,601,116) Foreign exchange 4,479,011 (254,760)
─────── ───────
75,878,166 63,540,747
─────── ───────
93,443,145 80,895,340
═════════ ═════════
Portfolio Summary As at 31 December 2010, the Company held investments with a cost of approximately US$155 million and fair value of US$336 million. The Company's portfolio is diversified across five strategies including bridge financing, Co-development, Pre-IPO financing, Platform investment and asset acquisition.

Breakdown of Investments by Strategy
Investments Fair Value US$ Type of investment % of
Total Location
Project Malls 88,260,042 Platform Investment 22.05% Mainland China
Project Diplomat 58,055,978 Asset Acquisitions 14.50% Beijing
Project Auspice 54,540,000 Pre-IPO Financing 13.62% Mainland China
Project Speed 48,957,746 Bridge Financing (1)(2) 12.23% Guandong Project Winpoint 21,721,598 Co-Development 5.43% Hangzhou Project Blue Bird 18,119,561 Co-Development (2) 4.53% Qingdao Project Shanghai Jingrui 17,668,314 Co-Development (2) 4.41% Huzhou
Hainan Airport Group 14,500,000 Pre-IPO Financing (2) 3.62% Mainland China
Project Beijing Olympic 13,927,947 Bridge Financing (1) (2) 3.48% Beijing Cash 64,596,405 Cash (2) 16.13%
TOTAL 400,347,591
100.00%
(1) The allocation by strategy as per the Investment Manager's report differs from the Auditor report investment schedule. The cost of the loans receivable disclosed in the Audit report schedule represents the cost of investments for accounting purposes, which are higher than the respective cost of the loans according to the terms under the loan agreements. Collection/Repayment of loans receivable is calculated based upon the effective interest method in the audit report schedule, whereas in the Investment Manager's report and newsletter, in accordance with the legal agreements, the cost is reduced prior to a reduction of interest.
(2) The investment value includes an amount attributable to the PACL II shareholders.
Investment Strategy Over the course of 2010, the investment manager has taken deliberate action to minimize its exposure to the residential property sector which we expect to be negatively impacted by China's increasing inflationary pressure and resultant monetary policy responses. The commercial property sector, however, presents a different and more positive investment outlook for the Company. The asset prices of office and retail properties have not inflated as much during the recent run-up of residential housing prices, as these markets are more insulated from speculation and more driven by end-user demand. Over the last twelve months, we have witnessed solid growth in both rentals and occupancies in Grade A office and retail property as business demand continues to increase. Furthermore, commercial properties, particularly those in premium locations, appear to represent an effective and consistent opportunity for inflation hedge in Asia, as rents correlate favorably with inflation due to rising land and building costs. Indeed, retail rents have the best positive correlation to consumption and inflation in China because they are derived, in many cases, in percentage terms to the revenues of shop tenants.
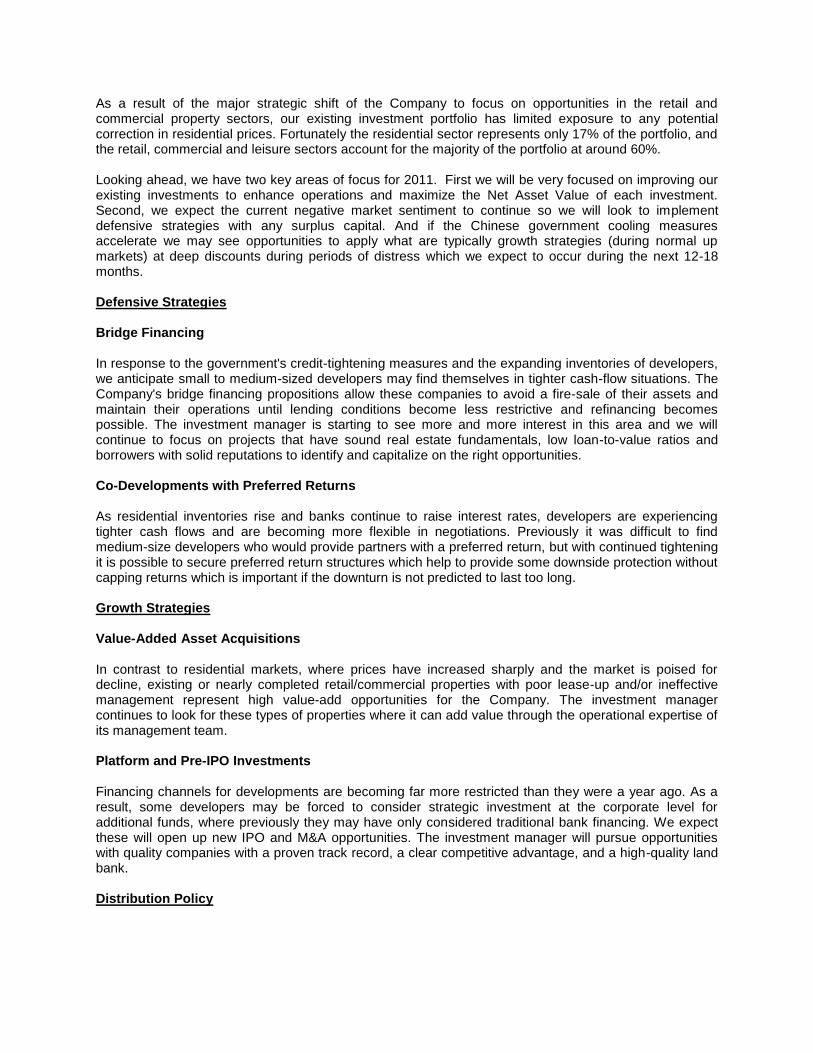
As a result of the major strategic shift of the Company to focus on opportunities in the retail and commercial property sectors, our existing investment portfolio has limited exposure to any potential correction in residential prices. Fortunately the residential sector represents only 17% of the portfolio, and the retail, commercial and leisure sectors account for the majority of the portfolio at around 60%. Looking ahead, we have two key areas of focus for 2011. First we will be very focused on improving our existing investments to enhance operations and maximize the Net Asset Value of each investment. Second, we expect the current negative market sentiment to continue so we will look to implement defensive strategies with any surplus capital. And if the Chinese government cooling measures accelerate we may see opportunities to apply what are typically growth strategies (during normal up markets) at deep discounts during periods of distress which we expect to occur during the next 12-18 months. Defensive Strategies Bridge Financing In response to the government's credit-tightening measures and the expanding inventories of developers, we anticipate small to medium-sized developers may find themselves in tighter cash-flow situations. The Company's bridge financing propositions allow these companies to avoid a fire-sale of their assets and maintain their operations until lending conditions become less restrictive and refinancing becomes possible. The investment manager is starting to see more and more interest in this area and we will continue to focus on projects that have sound real estate fundamentals, low loan-to-value ratios and borrowers with solid reputations to identify and capitalize on the right opportunities. Co-Developments with Preferred Returns As residential inventories rise and banks continue to raise interest rates, developers are experiencing tighter cash flows and are becoming more flexible in negotiations. Previously it was difficult to find medium-size developers who would provide partners with a preferred return, but with continued tightening it is possible to secure preferred return structures which help to provide some downside protection without capping returns which is important if the downturn is not predicted to last too long. Growth Strategies Value-Added Asset Acquisitions In contrast to residential markets, where prices have increased sharply and the market is poised for decline, existing or nearly completed retail/commercial properties with poor lease-up and/or ineffective management represent high value-add opportunities for the Company. The investment manager continues to look for these types of properties where it can add value through the operational expertise of its management team. Platform and Pre-IPO Investments Financing channels for developments are becoming far more restricted than they were a year ago. As a result, some developers may be forced to consider strategic investment at the corporate level for additional funds, where previously they may have only considered traditional bank financing. We expect these will open up new IPO and M&A opportunities. The investment manager will pursue opportunities with quality companies with a proven track record, a clear competitive advantage, and a high-quality land bank. Distribution Policy

On 7 February 2011, the policy was modified so that each distribution represents 50% of the Company's net realized profit of the fully realized investment, with the returned principal plus the balance of the net realized profit available for reinvestment. Conclusion 2010 was an exciting year for the Company as we saw strong results from growth strategies we invoked in 2009 to chart a new retail/commercial focus for the fund. The Company has achieved significant NAV appreciation from the three key investments that were made back in 2009 when market sentiment was poor and prices were distressed. With rising inflation and tight monetary policy continuing we are now focusing on defensive strategies that will allow us to protect capital in the event of market declines. In addition we will also look for opportunities to acquire existing assets and equity in platform companies at deep discounts.

CONSOLIDATED STATEMENT OF ASSETS AND LIABILITIES AS AT 31 DECEMBER 2010 Note 2010 2009 US$ US$ Assets Investments, at fair value (Cost: US$155,493,106; 2009: US$189,143,890) 3,4,5 335,751,186 286,592,862
Other receivables 1,500,000 3,648,352 Other assets - 895,509 Restricted cash 3,6 - 12,000,000 Cash and bank balances 3 64,596,405 81,614,495 ────────── ────────── Total assets 401,847,591 384,751,218 ------------------ ------------------ Liabilities Amounts due to PACL II Limited 10(a) 101,159,458 115,042,310 Performance fee payable 9,10(b) 12,341,008 14,424,994 Bank loans 6 - 12,000,000 Provision for taxation 8 46,706,527 30,119,037 Advanced receipt on disposal of investments - 2,586,020 Accrued expenses and other payables 135,878 1,036,990 ────────── ────────── Total liabilities 160,342,871 175,209,351 ------------------ ------------------ Net assets 241,504,720 209,541,867 ══════════ ══════════ Analysis of net assets Share capital 7 1,898,339 1,898,339 Share premium 7 187,935,554 187,935,554 Capital surplus 7 1,816,917 1,816,917 Tendered shares 7 (52,378,592) (34,969,715) Retained earnings 102,232,502 52,860,772 ────────── ────────── Net assets (equivalent to US$1.7480 (2009: US$1.3800) per share based on 138,156,860 (2009: 151,842,044) issued and outstanding shares) 241,504,720 209,541,867 ══════════ ══════════ The accompanying notes are an integral part of these consolidated financial statements.

CONSOLIDATED SCHEDULE OF INVESTMENTS AS AT 31 DECEMBER 2010
As at 31-Dec-10 As at 31-Dec-09
Investments - Assets
% of
effect
ive
% of effect
ive
% of assets
equity interest
held Cost/
principal Fair value % of
assets
equity interest
held Cost/
principal Fair value
US$ US$
US$ US$
COMMON STOCKS
130.22% 91.44%
Aviation, China
6.92% 12.34%
Hainan Airport Group Limited
6.92% 4.90% 10,002,500 14,500,000 12.34% 4.90% 20,000,000 25,866,667
Real Estate Development, China
123.30% 79.10%
Huzhou Jingrui Real Estate Co. Ltd.
1
8.43% 49.00% 7,423,167 17,668,314 9.88% 49.00% 14,915,165 20,706,779
Qingdao Vanke Real Estate Co. Ltd.
1
8.65% 40.00% 5,860,000 18,119,561 5.44% 40.00% 5,860,000 11,391,905
Jiangyin Aijia Investment
10.37% 15.00% 22,725,000 21,721,598 0.00% 0.00% - -
SZITIC Commercial Property Co Ltd
42.12% 30.00% 12,500,000 88,260,042 28.42% 30.00% 12,500,000 59,553,356
Dalian Wanda Commercial Real Estate Co Ltd
26.03% 0.50% 22,414,500 54,540,000 10.70% 0.50% 22,414,500 22,414,500
Beijing Hines Jing Sheng Real Estate Development Co Ltd (Embassy House, Beijing)
27.71% 40.00% 20,880,000 58,055,978 24.66% 40.00% 32,800,000 51,678,000
BONDS
Real Estate Development, China
23.36% 21.46%

Times Property Holdings Co. Ltd.
23.36% 40,000,000 48,957,746 21.46% 40,000,000 44,976,526
LOANS RECEIVABLE
6.65% 23.86%
Real Estate Development, China
6.65% 23.86%
Spirit Charter Investment Limited
2
6.65% 13,687,939 13,927,947 6.69% 13,607,260 14,023,657
Zhonghong Xingye Real Estate Development
0.00% - - 8.20% 12,910,405 17,179,847
Co. Ltd. 2
Zhongjiang Holding Co. Ltd.
2
0.00% - - 8.97% 14,136,560 18,801,625
155,493,106 335,751,186 189,143,890 286,592,862
1 The cost as at 31 December 2008 included 2 components: common stock and loans receivable. The
loans were repaid during 2009 and the cost as at 31 December 2010 included the common stock component only.
2 The principal above represents the principal calculated according to the Fund's accounting purpose,
which is different from the loan principal calculated in accordance with the legal agreements whereby the cost is paid prior to the repayment of interest component.
The accompanying notes are an integral part of these consolidated financial statements.

CONSOLIDATED STATEMENT OF OPERATIONS FOR THE YEAR ENDED 31 DECEMBER 2010
Note 2010 2009
US$ US$
Income
Interest income
581,868 733,933
Dividend income
332,100 -
Other income 9 1,209,875 -
───────── ─────────
Total income
2,123,843 733,933
----------------- -----------------
Expenses
Local taxes 8 23,871,231 20,007,210 Management fees 9,10(b) 4,000,797 4,253,345 Performance fees 9,10(b) 12,341,008 14,424,994 Legal and professional fees
2,662,741 770,780
Investment structuring costs
1,672 625,586
Interest expenses 6 1,283 85,569 Other expenses
1,192,683 1,000,364
───────── ─────────
Total expenses
44,071,415 41,167,848
----------------- -----------------
Net investment loss
(41,947,572) (40,433,915)
----------------- -----------------
Realized and unrealized gains from investments
Net realized gains from investments
15,441,136 16,620,660
Net change in unrealized gains from investments
80,802,412 70,396,622
Net increase in payable from gains attributable to PACL II 10(a) (9,403,257) (6,601,116)
Net foreign exchange gains/(losses)
4,479,011 (254,760)
───────── ─────────
Net realized and unrealized gains from investments
91,319,302 80,161,406
----------------- -----------------
Net increase in net assets from operations
49,371,730 39,727,491
═════════ ═════════
The accompanying notes are an integral part of these consolidated financial statements.

CONSOLIDATED STATEMENT OF CHANGES IN NET ASSETS FOR THE YEAR ENDED 31 DECEMBER 2010
Note
Share capital
and share premium
Capital surplus
Tendered shares
Retained earnings Total
US$ US$ US$ US$ US$
At 1 January 2009
370,000,000 3,910,000 (26,215,000) 13,133,281 360,828,281
Repurchase and cancellation of shares
7, 10(a) (180,166,107) (2,093,083) - - (182,259,190)
Repurchase of shares 7 - - (8,754,715) - (8,754,715)
Net increase in net assets from operations
- - - 39,727,491 39,727,491
────────── ───────── ────────── ───────── ──────────
At 31 December 2009 and 1 January 2010
189,833,893 1,816,917 (34,969,715) 52,860,772 209,541,867
Repurchase of shares 7 - - (17,408,877) - (17,408,877)
Net increase in net assets from operations
- - - 49,371,730 49,371,730
────────── ───────── ────────── ───────── ──────────
At 31 December 2010
189,833,893 1,816,917 (52,378,592) 102,232,502 241,504,720
══════════ ═════════ ══════════ ═════════ ══════════
The accompanying notes are an integral part of these consolidated financial statements.

CONSOLIDATED STATEMENT OF CASH FLOWS FOR THE YEAR ENDED 31 DECEMBER 2010
2010 2009
US$ US$
Net increase in net assets from operations 49,371,730 39,727,491
Adjustments (Increase)/decrease in operating assets Purchase of investments (22,422,000) (67,714,500)
Disposal of investments 69,506,052 127,757,981
Net realized and unrealized gains from investments (98,828,396) (87,002,647)
Net increase in payable from gain attributable to PACL II Limited 9,403,257 6,601,116
Amounts due from related parties - 7,542
Other receivables 2,148,352 (3,561,837)
Other assets 895,509 691,532
Restricted cash 12,000,000 (12,000,000)
Increase/(decrease) in operating liabilities Amounts due to PACL II Limited (23,286,109) 108,441,194
Performance fee payable (2,083,986) 14,424,994
Provision for taxation 16,587,490 19,825,944
Accrued expenses and other payables (901,112) 734,758
────────── ──────────
Net cash generated from operating activities 12,390,787 147,933,568
------------------- -------------------
Bank loans (repaid)/obtained (12,000,000) 12,000,000
Repurchase of shares (17,408,877) (191,013,905)
────────── ──────────
Net cash used in from financing activities (29,408,877) (179,013,905)
------------------- -------------------
Net decrease in cash and cash equivalents (17,018,090) (31,080,337)
Beginning balance 81,614,495 112,694,832
────────── ──────────
Ending balance, representing cash and bank balances 64,596,405 81,614,495
══════════ ══════════
Non-cash transactions See Note 10(a) for the restructuring of the Company. The accompanying notes are an integral part of these consolidated financial statements.

NOTES TO THE CONSOLIDATED FINANCIAL STATEMENTS FOR THE YEAR ENDED 31 DECEMBER 2010 1 Organization Pacific Alliance China Land Limited (the "Company") was incorporated on 5 September 2007 in the Cayman Islands. It is a closed-end Cayman Islands registered, exempted company. The address of its registered office is PO Box 309GT, Ugland House, South Church Street, George Town, Grand Cayman, Cayman Islands. The Company can raise additional capital up to the authorized share capital as described in Note 7 below. The Company's ordinary shares are traded on the AIM Market of the London Stock Exchange. The principal investment objective of the Company is to provide shareholders with capital growth and a regular level of income from investments in existing properties, new developments, distressed projects and real estate companies in Greater China. The Company's investment activities are managed by the Investment Manager, Pacific Alliance Real Estate Limited ("PARE"). The Company has appointed Sanne Trust Company Limited to act as the Custodian of certain assets of the Company, the Administrator and Registrar pursuant to the custodian agreement and fund administration services agreement respectively. The consolidated financial statements were approved by the Board of Directors on 21 April 2011. 2 Summary of significant accounting policies The following significant accounting policies are in conformity with accounting principles generally accepted in the United States of America. The Company applies the provisions of FASB ASC 946-10, Financial Services - Investment Companies (formerly the AICPA Audit and Accounting Guide for Investment Companies) (the "Guide"). Such policies are consistently followed by the Company in the preparation of its consolidated financial statements. (a) Principles of consolidation These consolidated financial statements include the financial statements of the Company and its subsidiaries (collectively the "Fund"). Subsidiaries are fully consolidated from the date on which control is transferred to the Fund and deconsolidated from the date that control ceases. Inter-company transactions between group companies are eliminated upon consolidation. The Fund uses wholly and partially owned special purpose vehicles ("SPV") to hold and transact in certain investments. The Fund's policy is to consolidate, as appropriate, those SPVs in which the Fund has control over significant operating, financial or investing decisions of the entity. Except when an operating company provides services to the Fund, investment in an operating company is carried at fair value (refer to Note 2(c) below for fair value measurement). (b) Use of estimates The preparation of consolidated financial statements in conformity with accounting principles generally accepted in the United States of America requires the Fund's management to make estimates and assumptions that affect the reported value of assets and liabilities and disclosures of contingent assets and liabilities as of 31 December 2010 and the reported amounts of income and expenses for the year then ended. The areas involving a higher degree of judgment or complexity, or areas where assumptions and estimates are significant to the financial statements are disclosed in Notes 2(c) and 2(g).

(c) Investments The Fund holds investment securities which are unlisted and have limited marketability. The Fund engages in secured lending transactions consisting of repurchase agreements and other secured borrowings. (i) Recognition and derecognition Regular purchase and sale of investments are accounted for on the trade date, the date the trade is executed. Costs used in determining realized gains and losses on the disposal of investments are based on the specific identification method for unlisted or unquoted investments. Cost includes legal and due diligence fees associated with the acquisition of investments. Transfer of investments is accounted for as a sale when the Fund has relinquished control over the transferred assets. Any realized gains and losses from investments are recognized in the consolidated statement of operations. (ii) Fair value measurement The Fund is an investment company under the Guide. As a result, the Fund records and re-measures its investments on the consolidated statement of assets and liabilities at fair value, with unrealized gains and losses resulting from changes in fair value recognized in the consolidated statement of operations. Fair value is the amount that would be received to dispose of the investments in an orderly transaction between market participants at the measurement date, i.e. the exit price. Fair value of investments is determined by the Valuation Committee, which is established by the Investment Manager and the Board of Directors. The fair value of unlisted or unquoted securities are based on the Fund's valuation models, including earnings multiples (based on the budgeted earnings or historical earnings of the issuer and earnings multiples of comparable listed companies) and discounted cash flows. The Valuation Committee also considers the relevant developments since acquisition of the investments, the original transaction price, recent transactions in the same or similar instruments, completed third-party transactions in comparable instruments, reliable indicative offers from potential buyers and rights in connection with realization. It adjusts the model as necessary for factors such as non-maintainable earnings, tax risk, growth stage, and cash traps. Cross-checks of primary techniques are made against other secondary valuation techniques. In determining fair valuation of certain unlisted securities, the Valuation Committee uses as reference valuations made by independent valuers which rely on the financial data of investees and on estimates made by the management of the investee companies as to the effect of future developments. The independent valuers also assist in the selection of valuation techniques and models. However, there are inherent limitations in any valuation technique due to the lack of observable inputs. Estimated fair value may differ significantly from the value that would have been used had a readily available market for such investments existed and these differences could be material to the financial statements. Additional information about the level of market observability associated with investments carried at fair value are disclosed in Note 4 below. The Fund enters into secured lending transactions which are reported as operating activities in these consolidated financial statements. Loans receivable are recorded at fair value in accordance with the guidance set forth in Note 4. The valuation techniques applied usually takes into account the estimated future cash flows, liquidity, credit, market and interest rate factors. (d) Cash and cash equivalents

Cash represents cash at banks and does not include restricted cash such as fixed deposits pledged as security for the bank loans. Cash equivalents are defined as those instruments which mature within 3 months or less of the date of purchase. (e) Bank loans Bank loans are initially recognized at fair value, net of transaction costs incurred and subsequently stated at amortized cost. Any difference between the proceeds (net of transaction costs) and the redemption value is recognized in the consolidated statement of operations over the period of the borrowing using the effective interest method.
(f) Foreign currency translation
The books and records of the Fund are maintained in United States Dollars ("US$"), which is also the
functional currency. Assets and liabilities, both monetary and non-monetary, denominated in foreign
currencies are translated into US$ at year-end exchange rates, while income and expenses are
translated at the exchange rates in effect during the year. Gains and losses attributed to changes in the value of foreign currencies for investments, cash balances and other assets and liabilities are reported as foreign exchange gain and loss.
(g) Income taxes
Under the current laws of the Cayman Islands, there are no income taxes payables in that jurisdiction by
the Fund. The Fund may be subject to taxes imposed in other countries in which it invests. Such taxes
are generally based on income and gains earned. Taxes are accrued on investment income, realized
gains, and unrealized gains, as appropriate, when the income and gains are earned. The Fund accrues
for liabilities relating to uncertain tax positions only when such liabilities are probable and can be
reasonably estimated in accordance with the authoritative guidance contained in ASC 740 described in
Note 8. Such income and gains are recorded gross of taxes in the consolidated statement of operations
and taxes are shown as a separate item in the consolidated statement of operations.
The Fund files tax returns as prescribed by the tax laws of the jurisdictions in which it operates. The Fund uses the asset and liability method to provide income taxes on all transactions recorded in the consolidated financial statements. This method requires that income taxes reflect the expected future tax consequences of temporary differences between carrying amounts of assets or liabilities for book and tax purposes. Accordingly, a deferred tax asset or liability for each temporary difference is determined based on the tax rates that the Fund expects to be in effect when the underlying items of income and expense are realized.
(h) Recognition of income and expenses
Interest income on bank balances is accrued as earned using the effective interest method.
Dividend income is recognized on the ex-dividend date and is recorded net of withholding taxes where applicable.
Expenses are recorded on an accrual basis. (i) Subsequent events In accordance with FASB ASC 855-10, "Subsequent Events", (formerly FAS165), the Fund discloses events that occur after the balance sheet date but before the financial statements are issued or are available to be issued. See Note 19, Subsequent Events, for further discussion.

(j) Critical accounting estimate and assumptions Estimates and judgements are continually evaluated and are based on historical experience and other factors, including expectations of future events that are believed to be reasonable under the circumstances. The resulting accounting estimates will, by definition, seldom equal the related actual results. The estimates and assumptions that have a significant risk of causing a material adjustment to the carrying amounts of assets and liabilities within the next financial year are addressed below. (a) Income taxes The Fund is subject to income taxes in jurisdictions it operates. Significant judgement is required in determining the worldwide provision for income taxes. There are many transactions and calculations for which the ultimate tax determination is uncertain. The Fund recognises liabilities for anticipated tax audit issues based on estimates of whether additional taxes will be due. Where the final tax outcome of these matters is different from the amounts that were initially recorded, such differences will impact the current and deferred income tax assets and liabilities in the period in which such determination is made.
3 Concentration of risks
(a) Market risk
Market risk represents the potential loss in value of financial instruments caused by movements in market
variables, such as equity prices.
Investments are made with a focus on the Greater China. Political or economic conditions and the
possible imposition of adverse laws or currency exchange restrictions in that region could cause the
Fund's investments and the respective markets to become less liquid and also the prices to become more
volatile.
The Fund's investments may have concentration in a particular industry or sector and performance of that
particular industry or sector may have a significant impact on the Fund. The Fund's concentration of
investments in a particular industry or sector is presented on the consolidated schedule of investments.
The Fund's investments may also be subject to the risk associated with investing in private equity
securities. Investments in private equity securities may be illiquid and subject to various restrictions on
resale and there can be no assurance that the Fund will be able to realize the value of such investments
in a timely manner.
See Note 4 below for a discussion on the inputs in fair value measurement of the Fund's investments.
(b) Interest rate risk
Interest rate risk arises from the fluctuations in the prevailing levels of market interest rates which affect
the fair value of financial assets and liabilities and future cash flows. The Fund has bank accounts,
restricted cash, loans receivable and bank loans that expose the Fund to interest rate risk. The Fund has
direct exposure to interest rate changes in respect of the valuation and cash flows of its interest bearing
assets and liabilities. The Fund may also be indirectly affected by interest rate changes in respect of the
earnings of certain companies in which it invests.
(c) Currency risk
The Fund has assets and liabilities denominated in currencies other than the US$, the functional currency.
The Fund is therefore exposed to currency risk as the value of assets and liabilities denominated in other
currencies may fluctuate due to changes in exchange rates. The net assets of the Fund are denominated
in the following currencies:

2010 2009
US$ US$
Renminbi 146,343,636 146,624,339
United States Dollar 95,161,084 62,917,528
────────── ────────── 241,504,720 209,541,867
══════════ ══════════
(d) Credit risk
The Fund is exposed to default risk by the counterparties of the loans receivable. Whilst the loans
receivable are structured to provide the Fund with adequate collateral in the event of default, enforcement
may be subject to the legal system of the countries where the relevant agreements are entered. Even
where the contract is enforced, the collateral may not be sufficient to fully compensate the Fund for
default losses. In an attempt to mitigate the losses, the Fund, where possible, obtains independent
valuations of the collateral on a regular basis and monitors the fair value of collateral relative to the loan
amounts plus accrued interest and where necessary, requires additional cash or collateral from the
borrower to manage its exposure. However, these valuations do not guarantee the ultimate realizable
value of the collateral.
The legal system of the countries in which the Fund invests vary widely in their development, degree of
sophistication, attitude, and policies towards bankruptcy, insolvency, liquidation, receivership, default and
treatment of creditors and debtors. Furthermore, the effectiveness of the judicial system of the countries
in which the Fund invests varies, thus the Fund (or any entity in which the Fund holds a direct or
secondary interest) may have difficulty in successfully pursuing claims in the courts of such countries. To
the extent that the Fund or an entity in which the Fund holds a direct or secondary interest has obtained a
judgement but is required to seek its enforcement in the courts of the countries in which the Fund invests,
there can be no assurance that the court will enforce such judgement.
As at 31 December 2010, investments in loans receivables and bonds of US$62,885,693 (2009: US$94,981,654) were borrowed/issued by counterparties which are currently unrated by any rating agency.
(e) Liquidity risk
As the Company is closed-end, it is not exposed to redemptions of shares by its shareholders.
The Fund is exposed to liquidity risk as majority of the investments of the Fund are illiquid while some of
the Fund's liabilities are with short maturity. Details of the maturity analysis on loans receivable are set
out in Note 5 below. Illiquid investments include any securities or instruments which are not actively
traded on any major securities market or for which no established secondary market exists where the
investments can be readily converted into cash. Reduced liquidity resulting from the absence of an
established secondary market may have an adverse effect on the prices of the Fund's investments and
the Fund's ability to dispose of them where necessary to meet liquidity requirements. The liquidity risk
and the liability level of the Fund is closely monitored by the Investment Manager. All current bank loans
are fully collateralized with cash and the Fund has been able to distribute US$71,675,801 and
US$23,286,108 to PACL II during the year ended 2009 and 2010. At 28 February 2011, the Fund had
distributed a further US$37,000,000 to PACL II.
China currently has foreign exchange restrictions, especially in relation to the repatriation of foreign
funds. Any unexpected foreign exchange control in China may cause difficulties in the repatriation of

funds. The Fund invests in China and is therefore exposed to the risk of repatriating funds out of China on
a timely basis to meet its obligations. See Note 3(c) above for exposures to Renminbi.
The Fund has the ability to borrow in the short term and this is subject to certain limitations, including the
total amount of all borrowings outstanding at any time shall not exceed 50% of the Fund's total assets at
such time. 4 Investments In accordance with Financial Accounting Standards Board ("FASB") ASC 820-10, Fair Value Measurements and Disclosures, (formerly Statement of Financial Accounting Standards ("SFAS") No. 157), the Fund discloses the fair value of its investments in a hierarchy that prioritizes the inputs to valuation techniques used to measure the fair value. The hierarchy gives the highest priority to valuations based upon unadjusted quoted prices in active markets for identical assets or liabilities (Level 1 measurements) and the lowest priority to valuations based upon unobservable inputs that are significant to the valuation (Level 3 measurements). FASB ASC 820-10-35-39 to 55 provides three levels of the fair value hierarchy as follows: Level 1 Inputs that reflect unadjusted quoted prices in active markets for identical assets or liabilities that the Fund has the ability to access at the measurement date; Level 2 Inputs other than quoted prices included within Level 1 that are observable for the asset or liability either directly or indirectly, including quoted prices for similar assets or liabilities in active markets, quoted prices for identical or similar assets or liabilities in markets that are not considered to be active, inputs other than quoted prices that are observable for the asset or liability, and inputs that are derived principally from or corroborated by observable market data by correlation or other means; Level 3 Unobservable inputs based on the best information available in the circumstances, to the extent observable inputs are not available (including the Fund's own assumptions used in determining the fair value of investments). Inputs to measure fair values broadly refer to the assumptions that market participants use to make valuation decisions, including assumptions about risk. Inputs may include price information, volatility statistics, specific and broad credit data, liquidity statistics and other factors. An asset or a liability's level within the fair value hierarchy is based on the lowest level of any input that is significant to the fair value measurement. However, the determination of what constitutes "observable" requires significant judgment. The Valuation Committee considers observable data to be such market data which is readily available, regularly distributed or updated, reliable and verifiable, not proprietary and provided by multiple, independent sources that are actively involved in the relevant market. The categorization of an asset or a liability within the hierarchy is based upon the pricing transparency of the asset or liability and does not necessarily correspond to the Valuation Committee's perceived risk of that asset or liability. In determining an instrument's placement within the hierarchy, the Valuation committee follows the following: Level 1 Investments in listed stocks and derivatives that are valued using quoted prices in active markets and are therefore classified within Level 1 of the fair value hierarchy. As at 31 December 2009 and 2010, the Fund did not have any investments that were categorized as Level 1 within the fair value hierarchy.

Level 2 Investments in listed stocks for which trading is restricted for a certain period of time and for which the restriction is applicable to market participants in general (for example, legal person shares containing lock-up periods) are valued using the last traded prices of the listed stocks after factoring in discounts for liquidity. Such investments are generally classified within Level 2 of the fair value hierarchy. The discounts for restrictions are estimated by the Valuation Committee by analyzing the length of the restriction period and are as follows: Discount for restrictions Length of restriction period 5% 1 to 6 months 10%, reducing over the period 7 to 12 months 25%, reducing over the period More than 12 months As at 31 December 2010, the Fund did not have any investments that were categorized as Level 2 within the fair value hierarchy (2009: Nil). Level 3 Assets are classified within Level 3 of the fair value hierarchy if they are traded infrequently and therefore have little or no price transparency. Such assets include investments in unlisted stocks and bonds and loans receivable. Investments classified within Level 3 have significant unobservable inputs, as they trade infrequently or not at all. Level 3 instruments include illiquid listed equity, private equity, real estate investments, certain bank loans and bridge loans, less liquid corporate debt securities (including distressed debt instruments), collateralized debt obligations, less liquid convertible debt securities, and investments in closed-end funds. When observable prices are not available for these securities, the Valuation Committee uses one or more valuation techniques (e.g., the market approach or the income approach) for which sufficient and reliable data is available. Within Level 3, the use of the market approach generally consists of using comparable market transactions, while the income approach generally consists of the net present value of estimated future cash flows, adjusted as appropriate for liquidity, credit, market and/or other risk factors. The inputs used by the Valuation committee in estimating the value of Level 3 investments include the original transaction price, recent transactions in the same or similar instruments, completed or pending third-party transactions in the underlying investment or comparable issuers, subsequent rounds of financing, recapitalizations and other transactions across the capital structure, offerings in the equity or debt capital markets, and changes in financial ratios or cash flows. Valuation of Level 3 investments may also be adjusted to reflect illiquidity and/or non-transferability with the amount of such discount estimated by the Valuation Committee in the absence of market information. The fair value measurement of Level 3 investments does not include transaction costs that may have been capitalized as part of the security's cost basis. Assumptions used by the Valuation Committee due to the lack of observable inputs may significantly impact the resulting fair value and therefore the Fund's results of operations. All of the company's investments are categorized as Level 3 investments within the fair value hierarchy. The following table summarizes the changes in fair value of the Fund's Level 3 instruments by captions: As at 31 December 2010 Level 3
US$ Investments - stocks 272,865,492 Investments - bonds (Note 5) 48,957,746 Investments - loans receivable (Note 5) 13,927,947 ──────────
335,751,185 ══════════

As at 31 December 2009 Level 3
US$
Investments - stocks 191,611,208 Investments - bonds (Note 5) 44,976,526 Investments - loans receivable (Note 5) 50,005,128 ──────────
286,592,862 ══════════ As at 31 December 2010, investments of US$258,365,492 (2009: US$184,546,165) were held directly by the Fund, and investments of US$77,385,693(2009: US$102,046,697) were held through jointly controlled entities with Pacific Alliance Asia Opportunity Fund L.P. ("PAX L.P."), an investment fund managed by Pacific Alliance Investment Management Limited, a fellow subsidiary of the Investment Manager. The following table summarizes the changes in fair value of the Fund's Level 3 instruments.
Investments
- stocks Investments
- bonds
Investments - loans
receivable Total US$ US$ US$ US$ At 1 January 2009 72,745,627 40,000,000 144,302,049 257,047,676 Purchase of investments 67,714,500 - - 67,714,500 Proceeds from sale of investments
(25,826,485) - (85,501,227) (111,327,712)
Net realized gains - - 16,620,660 16,620,660 Net unrealized gains/(losses) 76,977,566 4,976,526 (25,416,354) 56,537,737 ────────── ────────── ────────── ────────── At 31 December 2009 and 1 January 2010 191,611,208 44,976,526 50,005,128 286,592,862 Purchase of investments 22,422,000 - - 22,422,000 Proceeds from sale of investments (32,617,250) - (39,474,821) (72,092,072) Net realized gains 2,932,600 12,508,536 15,441,136 Net unrealized gains/(losses) 88,516,934 3,981,220 (9,110,895) 83,387,259 ────────── ────────── ────────── ────────── At 31 December 2010 272,865,492 48,957,746 13,927,948 335,751,186 ══════════ ══════════ ══════════ ══════════ Total net change in unrealized gains on Level 3 instruments as shown above are presented in the consolidated statement of operations. 5 Investments - loans receivable and bonds As at 31 December 2010, the Fund had loans receivable from unaffiliated parties amounting to US$13,927,948 (2009: US$50,005,128). The loans will mature in the next 12 months. The interest rates charged on the loans range from 10% to 35% per annum (2009: 10% to 35% per annum).

For the year ended 31 December 2010, total realized gains recognized on these loans amounted to US$12,508,536 (2009: US$16,620,660) and net change in unrealized losses for loans receivables amounted to US$9,110,895 (2009: unrealized losses of US$25,416,354). The loans are categorized into the following types by structure: 2010 2009 US$ US$ Repurchase agreements 13,927,948 50,005,128 ══════════ ══════════ As at 31 December 2010, the Fund had a bond investment from an unaffiliated party amounting to US$48,957,746 (2009: US$44,976,526) which will mature in the next 12 months. The Fund held collateral on the bond investment in the form of assets of the bond issuer and its subsidiaries. The fair value of the investment is determined by the Valuation Committee. For the year ended 31 December 2010, total unrealized gains recognized on the bond amounted to US$3,981,220 (2009: US$4,976,526). 6 Bank loans and restricted cash In order to finance the investment projects in different currencies, the Fund may from time to time enter into loan agreements with banks which are fully secured by deposits in currencies other than the denomination of the loans held directly by the Fund or related entities. In the event that amounts under the loan agreements are due and not paid, the banks are entitled to receive an amount of the deposits equal to the unpaid amount. There was no bank loan as at 31 December 2010. As at 31 December 2009, a bank loan was drawn from a bank which amounted to US$12,000,000. The loan was repaid on 4 January 2010. The interest rate charged on the loan was LIBOR plus 1% per annum with fixed deposits of US$12,000,000 pledged to the bank. For the year ended 31 December 2010, total interest expense incurred on bank loans amounted to US$1,283 (2009: US$85,569). 7 Share capital, share premium, capital surplus and tendered shares
Number of shares
outstanding Share capital
Share premium
Capital surplus
Tendered shares Total
US$ US$ US$ US$ US$ As at 1 January 2009 340,040,000 3,700,000 366,300,000 3,910,000 (26,215,000) 347,695,000 Repurchase and cancellation of shares (180,166,107) (1,801,661) (178,364,446) (2,093,083) - (182,259,190) Repurchase of shares as tendered shares (8,031,849) - - - (8,754,715) (8,754,715) ───────── ──────── ───────── ──────── ───────── ────────── As at 31 December 2009 and 1 January 151,842,044 1,898,339 187,935,554 1,816,917 (34,969,715) 156,681,095

2010 Repurchase of shares as tendered shares (13,685,184) - - - (17,408,877) (17,408,877) ───────── ──────── ───────── ──────── ───────── ────────── As at 31 December 2010 138,156,860 1,898,339 187,935,554 1,816,917 (52,378,592) 139,272,218 ═════════ ════════ ═════════ ════════ ═════════ ══════════ At 31 December 2010, the total authorized number of ordinary shares was 10,000,000,000 (2009: 10,000,000,000) with par value of US$0.01 (2009: US$0.01) per share. In March 2009, the Company repurchased 180,166,107 shares at US$1.01 per share and cancelled these shares as part of the reorganization of the Company. See Note 11(a) below for details. As at 1 January 2009, the number of tendered shares was 29,960,000. In July 2009, the Company further repurchased 8,031,849 shares at US$1.09 per share through a wholly-owned subsidiary, PACL Trading Limited, and held these shares as tendered shares. As at 31 December 2010, the number of tendered shares grew to 51,677,033 shares of which 6,970,762 shares at US$1.12 per share were repurchased in January 2010, and 6,714,422 shares at US$1.43 per share were repurchased in August 2010. As at 31 December 2010, the Company had 189,833,893 (2009: 189,833,893) ordinary shares in issue, of which 51,677,033 (2009: 37,991,849) were held as tendered shares. 8 Taxation The Fund adopted the authoritative guidance contained in FASB ASC 740 on accounting for and disclosure of uncertainty in tax positions, which required the directors to determine whether a tax position of the Fund is more likely than not to be sustained upon examination, including resolution of any related appeals or litigation processes, based on the technical merits of the position. For tax positions meeting the more likely than not threshold, the tax amount recognized in the financial statements is reduced by the largest benefit that has a greater than 50 percent likelihood of being realized upon ultimate settlement with the relevant taxing authority. The uncertain tax positions identified by the directors mainly include: (a) Whether any of the Fund and its offshore SPVs would be deemed as a China Tax Resident Enterprise ("TRE") under the China Corporate Income Tax ("CIT") Law. If an offshore entity is deemed as a China TRE, its income would be subject to China corporate income tax at 25%. (b) Whether any of the Fund and its offshore SPVs that may derive income would be deemed as having an establishment or place in China. If an offshore entity has an establishment or place in China, income derived by the offshore entity that is derived from China by the establishment or place or income that is effectively connected to the establishment or place would be subject to China corporate income tax at 25%. (c) Whether any of the Fund and its offshore SPVs is subject to Hong Kong profits tax. An entity would be subject to Hong Kong profits tax if (i) the entity carries on a trade, profession or business in Hong Kong; (ii) profits are derived from that trade, profession or business carried on in Hong Kong (excluding gains of a capital nature); and (iii) the profits arise in or are derived from Hong Kong, i.e. have a Hong Kong source.

The directors assessed that the Fund and its offshore SPVs are not TREs in China and do not have any establishment or place in China. Gains from disposal of investments in China by the Fund or its SPVs may be subject to China withholding tax at 10% without considering the potential relief that may be available under any tax treaty between the tax jurisdiction of the transferor and China. In addition, where Chinese equity investment is held via an offshore intermediate holding company, exit of the Chinese equity investment via disposal of shares in the offshore intermediate holding company could be regarded as an indirect transfer of the Chinese equity investment. According to the General Anti Avoidance Rules under the China CIT Law, if arrangement of adopting the above investment holding structure and exiting via indirect transfer do not have reasonable commercial purpose, the Chinese tax authority is empowered to disregard such arrangement and impose withholding tax on the gains from such an indirect transfer. The directors have reviewed the structure of the investment portfolio and assessed the potential withholding tax implications and considered adequate provision to China tax has been made on the Fund's financial statements. As at 31 December 2010, provision for current tax and deferred tax amounted to US$161,682 (2009: US$69,682) and US$46,544,845 (2009: US$30,049,355) respectively. However, given the uncertainty of China tax, the Investment Manager would like to highlight that there is a possibility that some or all of the tax provided as at 31 December 2010 will not be payable and may be released. The Investment Manager is regularly monitoring the position. The Investment Manger has reviewed the structure of the Fund's investment portfolio and considered the Fund's exposure to Hong Kong Profits tax has been properly reflected in the Fund's consolidated financial statements. Under current Cayman Islands legislation applicable to an exempted company, there is no income tax, capital gains or withholding tax, estate duty, or inheritance tax payable by the Fund. 9 Management fees and performance fees Pursuant to the Investment Management Agreement dated 20 November 2007, the Investment Manager was appointed to manage the investments of the Fund. The Investment Manager will receive an aggregate management fee of 2% per annum of the quarterly Net Asset Value ("NAV"). The management fee is paid quarterly in advance based on the NAV at the first day of each fiscal quarter. For the year ended 31 December 2010, total management fees amounted to US$4,000,797 (2009: US$4,253,345). The Investment Manager is also entitled to receive performance fees from the Fund in the event that the year-end NAV is greater than (a) the year-end NAV for the last year in which a performance fee was payable ("High Water Mark") and (b) the year-end NAV for the last year in which a performance fee was payable increased by an annual hurdle rate of 8% ("Hurdle"). The performance fee will be calculated as follows:
· 0% of the relevant increase in the year-end NAV if the year-end NAV is at or below the Hurdle;
· 100% of the relevant increase in the year-end NAV above the Hurdle up to 10% (the "Catch-up"); and
· 20% of the relevant increase in the year-end NAV above the Catch-up. For the year ended 31 December 2010, total performance fees from PACL amounted to US$12,341,008 (2009: US$14,424,994). Under the Investment Management Agreement, the performance fee shall be paid 75% in cash and 25% in the Company's ordinary shares ("share portion"). The Company may elect to meet its share obligation either by issuing new shares at NAV or purchasing the equivalent number of shares in the market. During the year ended 31 December 2010, the Investment Manager agreed to receive a cash of US$2,396,374 from the Fund to settle its obligation in respect of the share portion of the 2009 performance fee of US$3,606,249 and a gain of US$1,209,875 was recognised by the Fund as other income in the

consolidated statement of operations. Had the Fund opted for issuing new shares at NAV to settle the outstanding performance fee payable as at 31 December 2009, the Company's total number of issued shares would have increased by 2,594,424. With the cash proceeds received from Fund, the Investment Manager purchased 2,594,424 shares from the market. 10 Related-party transactions The Fund had the following significant related-party transactions. (a) Restructuring with PACL II Limited On 2 March 2009, the Company held an extraordinary general meeting to approve a tender offer that allowed shareholders to exchange all or part of their shares for shares in PACL II Limited ("PACL II"), a Cayman Islands private vehicle that will be used to realize and distribute cash from exited investments based on the investment and asset positions held by the Fund as at 31 December 2008 ("Tender Offer Portfolio"). PACL II is also managed by the Investment Manager. It will, without any further action on the part of its shareholders, automatically wind up and dissolve in 3 years upon when its ordinary shares were first issued. The duration of PACL II may be extended by 1 year upon written election by the Investment Manager. As part of this restructuring, the Company repurchased 180,166,107 shares at a tender price of US$1.01 per share in exchange for holders of these shares receiving the same number of shares in PACL II. Under the terms of the tender offer, PACL II is entitled to receive 50.33% of the proceeds from the Tender Offer Portfolio, which reflects a 5% discount of its proportionate share of the Tender Offer Portfolio. As such, the amount due to PACL II is recorded as a payable by the Fund, adjusted at each period end based on the movement in the fair value of the underlying assets and the income and expense attributable to the Tender Offer Portfolio. The amount is unsecured, non-interest bearing. The following table summarizes the changes in payable to PACL II. 2010 2009 US$ US$ At beginning of the year/period 115,042,310 182,259,190 Distributions to PACL II (23,286,109) (71,675,801) Net increase in payable from gains attributable to PACL II
9,403,257 6,601,116
Management fees paid on behalf of PACL II - (2,142,195) ────────── ────────── At end of the year/period 101,159,458 115,042,310 ══════════ ══════════ During the year ended 31 December 2010, the Fund distributed US$23,286,109 (2009: US$71,675,801) of realization proceeds from the Tender Offer Portfolio to shareholders of PACL II and a net increase in payable to PACL II from gains attributable to PACL II of US$9,403,257 (2009: US$6,601,116) was recognized as a gain as a result of the increase in value of the Tender Offer Portfolio. (b) Management fees and performance fees to the Investment Manager The Fund pays management fees and performance fees to the Investment Manager. See Note 9 above for details. (c) Directors' remuneration The Company pays each of its director annual fees of US$30,000. If a director is a member of the Valuation Committee or Audit Committee, the director also receives and additional fee of US$10,000, or

US$5,000 if they are Chairman of either committee. During the year, Chris Gradel and Horst Geicke agreed to waive their directors' fees, and Chris Gradel has also agreed to waive his committee fee for the years ended 31 December 2009 and 2010. 11 Financial highlights Net asset value per share at the end of the year is as follows: 2010 2009 US$ US$ Per share data (for a share outstanding throughout the year) Net asset value at beginning of year 1.3800 1.0611 Net investment loss (0.3036) (0.2663) Net realized and unrealized gains from investments 0.6716 0.5852 ────── ────── Net asset value at end of year 1.7480 1.3800 ══════ ══════ The following represents the ratios to average net assets and other supplemental information: 2010 2009 US$ US$ Total return before performance fees (1) 33.14% 39.00% Performance fees 6.47% 8.95% Total return after performance fees (1) 26.67% 30.05% Ratios to average net assets (2) Total expenses (20.77%) (19.84%) Net investment loss (19.77%) (19.48%)
(1) Total return represents the change in NAV (before and after performance fees), adjusted for cash flows in relation to capital transactions for the year/period. (2) Average net assets is derived from the beginning and ending NAV, adjusted for cash flows in relation to capital transactions for the year/period. For the year ended 31 December 2010, the average net assets amounted to US$212,219,678 (2009: US$207,531,977). 12 Commitment and contingency In the normal course of business, the Fund may enter into arrangements that contain a variety of representations and warranties that provide general indemnification under certain circumstances. The Fund's maximum exposure under these arrangements is unknown, as this would involve future claims that may be made against the Fund and which have not yet occurred. However, based on experience, the directors expect the risk of loss to be remote, and, therefore, no provision has been recorded. 13 Subsequent events Management has performed a subsequent events review from 1 January 2011 through to 21 April 2011, being the date that the financial statements were issued, and has determined that there were no subsequent events requiring adjustment or disclosure in the financial statements. 14 New accounting pronouncements In January 2010, the FASB issued guidance that requires new disclosures and clarifies existing disclosure requirements, about fair value measurements. The new guidance requires disclosure of gross significant transfers in and/or out between Levels 1 and 2 and the reasons for those transfers, disclosure

of all transfers in/out of Level 3 and the reasons for those transfers, and purchases, sales, issuances and settlements to be disclosed separately within the Level 3 roll-forward. The guidance also clarifies the levels of disaggregation in presenting fair value disclosures for each class of assets and liabilities and the disclosures about valuation techniques and inputs that are required for fair value measurements that fall within either Level 2 or Level 3. The standard enhances the fair value disclosure requirements and thus, its adoption during the year had no impact on the statement of assets and liabilities, statement of operations or the statement of changes in net assets. As the guidance is limited to enhanced disclosures, adoption did not have a material impact on the Fund's consolidated financial statements.
This information is provided by RNS
The company news service from the London Stock Exchange END


![Pacl] a 1984](https://img.pdfslide.net/doc/110x75/5695d33e1a28ab9b029d475d/pacl-a-1984.jpg)