Embed Size (px)
Citation preview

8
Klozur® KP Slurry Injection via Hydraulic
Fracturing: Fundamentals, Methods, and
Lessons Learned
Webinar | September 22, 2021

9
Presentation Outline
▪ Klozur® KP Chemistry
▪ Klozur® KP Case Studies
▪ Why KP?
▪ Lessons Learned
▪ Application:
− Fracture Form
− Managing Daylighting
− Diffusion of Reagents
| September 22, 2021 | Klozur® KP Slurry Injection via Hydraulic Fracturing: Fundamentals, Methods, and Lessons Learned
ChemistryDose
ContactAnd
Monitoring

10
Klozur® PersulfateDifferences between Sodium and Potassium Persulfates
▪ Environmental Grade Sodium Persulfate
▪ Environmental Grade Potassium Persulfate
| September 22, 2021 | Klozur® KP Slurry Injection via Hydraulic Fracturing: Fundamentals, Methods, and Lessons Learned
Temperature Klozur® SP Klozur® KP
(̊C) wt% g/L wt% g/L
0 36.5 480 1.6 17
10 40.1 540 2.6 29
20 41.8 570 4.5 47
25 42.3 580 5.7 59
Characteristic Klozur® SP Klozur® KP
Formula Na2S2O8 K2S2O8
Molecular Weight 238.1 270.3
Color White White
Loose Bulk Density (g/cc) 1.12 1.30
Key Differences:- Solubility- Na+ vs K+ residual

11
▪ Sodium and potassium persulfate are used in environmental remediation applications
▪ A strong oxidant
▪ Activation results in the formation of oxidative and reductive radicals
▪ Applicable across a broad range of contaminants
▪ Extended subsurface lifetime (weeks to months)
▪ Little to no gas evolution
| September 22, 2021 | Klozur® KP Slurry Injection via Hydraulic Fracturing: Fundamentals, Methods, and Lessons Learned
All Klozur® persulfates release
the persulfate anion
Free Radical Chemistry:
Persulfates produce free radicals in many diverse reaction situations
S2O8-2 + activator SO4•- + (SO4•- or SO4
-2)
Activation produces a radical which is more powerful and kinetically fast

12
Klozur® Persulfate Degradation Pathways
| September 22, 2021 | Klozur® KP Slurry Injection via Hydraulic Fracturing: Fundamentals, Methods, and Lessons Learned
Activation Methods: Alkaline, Hydrogen Peroxide, and Heat
Activation Method: Iron Chelate, Klozur® One
ReductiveOxidative Either
BTEX
Oxygenates
PAHs
Petroleum Hydrocarbons
1,4-Dioxane
MGP Residuals
PCE, TCE, DCE and VC
Select Pesticides
Chlorobenzenes
Select Fluorinated Compounds
Chlorophenols
Select Energetics
PCBs
Select Pesticides
Select Energetics
Carbon Tetrachloride
1,1,1-Trichloroethane
Dichloroethanes
13
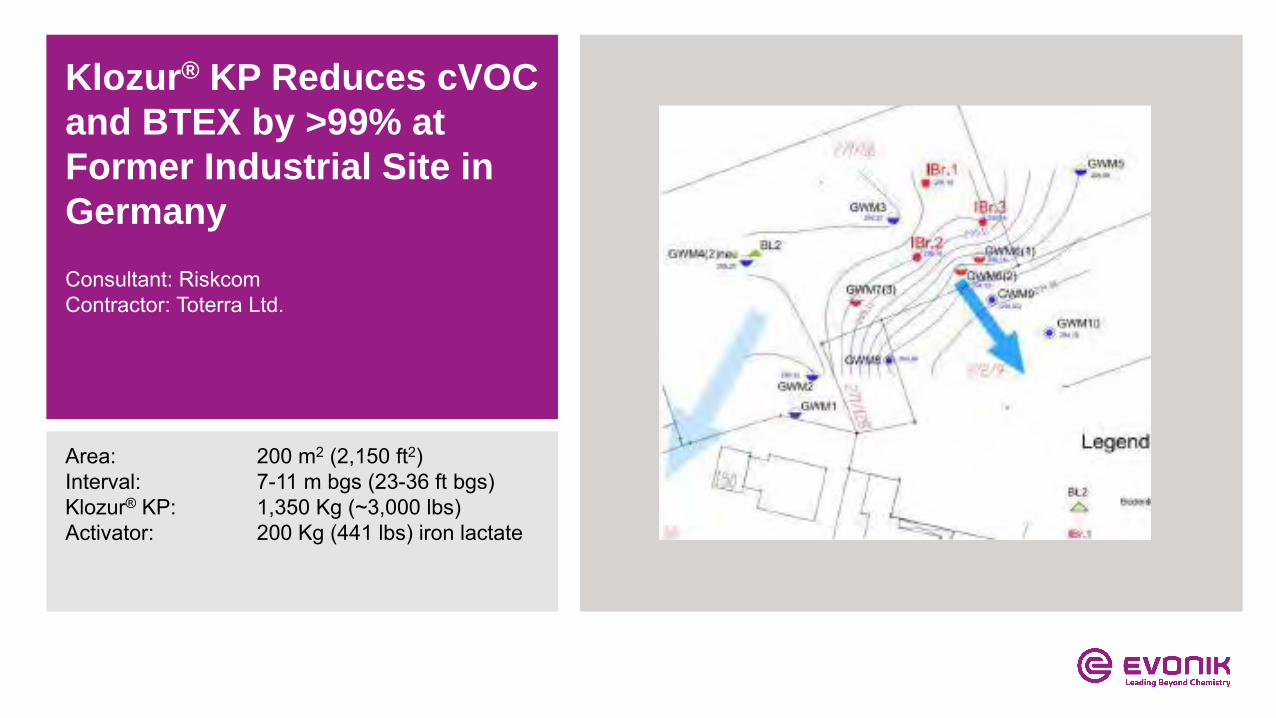
Klozur® KP Reduces cVOC
and BTEX by >99% at
Former Industrial Site in
Germany
Area: 200 m2 (2,150 ft2)Interval: 7-11 m bgs (23-36 ft bgs)Klozur® KP: 1,350 Kg (~3,000 lbs)Activator: 200 Kg (441 lbs) iron lactate
Consultant: RiskcomContractor: Toterra Ltd.

14
Klozur® KP Case StudyFormer Industrial Site in Germany
| September 22, 2021 | Klozur® KP Slurry Injection via Hydraulic Fracturing: Fundamentals, Methods, and Lessons Learned
DateContaminant (mg/L)
PCE TCE cDCE BTEX PAH
Baseline 13,000 22,000 52,000 20,713 98
6 Months Post 8 23 3,800 47 5
Percent Reduction 99.9% 99.9% 92.7% 99.8% 94.5%
12 Months Post 4 6 13,000 2,570 104
Percent Reduction 99.97% 99.97% 75.0% 87.6% -5.3%
▪ 1 Year Post Application Monitoring
▪ Successful distribution of KP and activator over a 200 m2 area (2,152 ft2) with 3 injection locations
▪ Activated Klozur® KP resulted in up to 99% treatment of Target COCs

15
Klozur® KP Reduces
Pentachlorophenol by up
to 99 percent at Former
Wood Treatment Site in
Pacific Northwest USA
Klozur KP: 4,400 lbsActivator: Hydrated LimeInjection: 12 DPT locationsSpacing: 5 to 10 ft Interval: 32 to 40 ft bgs
Consultant: ERMContractor: Cascade
16
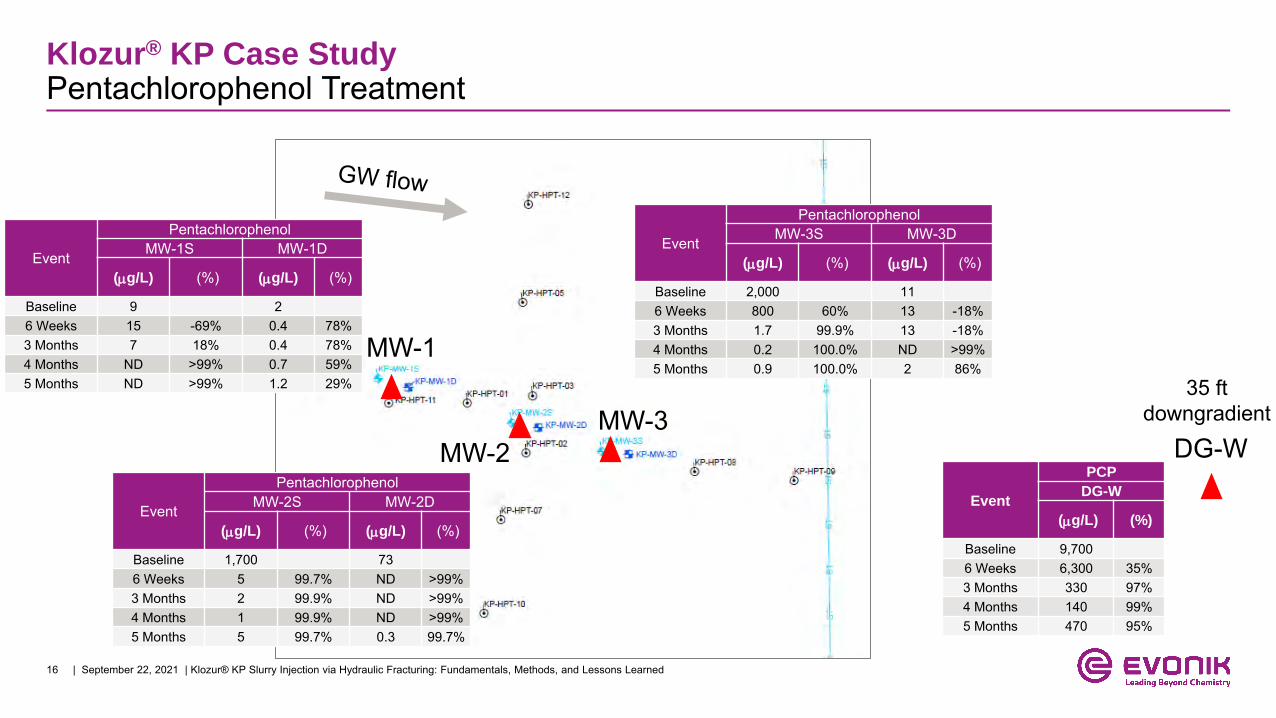
Klozur® KP Case StudyPentachlorophenol Treatment
| September 22, 2021 | Klozur® KP Slurry Injection via Hydraulic Fracturing: Fundamentals, Methods, and Lessons Learned
MW-1
MW-2MW-3
DG-W
Event
PCP
DG-W
(mg/L) (%)
Baseline 9,7006 Weeks 6,300 35%3 Months 330 97%4 Months 140 99%5 Months 470 95%
Event
PentachlorophenolMW-1S MW-1D
(mg/L) (%) (mg/L) (%)
Baseline 9 26 Weeks 15 -69% 0.4 78%3 Months 7 18% 0.4 78%4 Months ND >99% 0.7 59%5 Months ND >99% 1.2 29%
Event
PentachlorophenolMW-2S MW-2D
(mg/L) (%) (mg/L) (%)
Baseline 1,700 736 Weeks 5 99.7% ND >99%3 Months 2 99.9% ND >99%4 Months 1 99.9% ND >99%5 Months 5 99.7% 0.3 99.7%
Event
PentachlorophenolMW-3S MW-3D
(mg/L) (%) (mg/L) (%)
Baseline 2,000 116 Weeks 800 60% 13 -18%3 Months 1.7 99.9% 13 -18%4 Months 0.2 100.0% ND >99%5 Months 0.9 100.0% 2 86%
35 ft downgradient

17
Klozur® KP - Case StudySummary
▪ Klozur® KP has been used at a variety of sites to remediate
− Variety of contaminants
− Co-mingled plumes
− Variety of sites
▪ Treatment has been found to be ~99 percent reduction
▪ Hydrated lime is most common activator (alkaline activation) although iron-chelate has also been used.
▪ Once dissolved, remediation chemistry of Klozur® KP is the same as Klozur® SP
| September 22, 2021 | Klozur® KP Slurry Injection via Hydraulic Fracturing: Fundamentals, Methods, and Lessons Learned

18
Why Klozur® KP?
▪Time
▪ Klozur® KP (potassium persulfate) dissolves over a period of time to maintain a consistent concentration
▪ Klozur® SP – dissolved and available at time of application
− Typically reactive for 2-8 weeks
| September 22, 2021 | Klozur® KP Slurry Injection via Hydraulic Fracturing: Fundamentals, Methods, and Lessons Learned

19
What Do You Do with More Remediation Time?
▪ Treating Aqueous Phase Contaminants
− Permeable Reactive Barriers (PRBs)
− Source zones
▪ Longer Contact Time
− Low permeable soils
− Low solubility contaminants
− Low contaminant concentrations
▪ High groundwater velocity
| September 22, 2021 | Klozur® KP Slurry Injection via Hydraulic Fracturing: Fundamentals, Methods, and Lessons Learned
Conceptual Klozur® KP Persistence (months)
Temp (◦C) 5 10 15 20 25
Solubility (g/L) 22 29 37 47 59
(ft/yr) (m/yr)
Gro
undw
ater
See
page
Ve
loci
ty
10 3 315 239 187 147 117
25 8 126 96 75 59 47
50 15 63 48 37 29 23
75 23 42 32 25 20 16
100 20 31 24 19 15 12
500 152 6 5 4 3 21% KP by w/w Soil15% ePV30 ft length parallel to groundwater flowAssumes achieving 50% solubility in cross section or pore volume

20
Groundwater Contamination
Aqueous phase contaminants to migrate to solid state Klozur® KP
▪ Permeable Reactive Barriers (PRBs)
− Treating groundwater contamination as it passes into PRB. Soil contamination directly downgradient of PRB.
− Will require periodically refreshment
▪ Source zones/Groundwater plumes
− Typically treated with Klozur® SP
− Low Koc contaminants are not on soil, primarily in aqueous phase
− 1,4-Dioxane, vinyl chloride, MTBE, etc
− Solid slurry displaces less groundwater
| September 22, 2021 | Klozur® KP Slurry Injection via Hydraulic Fracturing: Fundamentals, Methods, and Lessons Learned
Contaminant EPA Koc Foc
Contaminant
Distribution
(%)
GW Soil
1,4-Dioxane 17
0.005
70% 30%1,1,1-TCA 110 27% 73%1,2-DCA 38 51% 49%1,1-DCA 53 43% 57%DCE 38 51% 49%Benzene 59 40% 60%Toluene 182 18% 82%Ethylbenzene 363 10% 90%Xylene 386 9% 91%
TCE 166 19% 81%Carbon Tetrachloride 174 19% 81%1,2-Dichlorobenzene 617 6% 94%
Dieldrin 21,380 0% 100%
Note: 1. Assuming 1.5 g/cm3 soil bulk density and effective pore volume of 0.15
𝐾𝑑 = 𝐾𝑜𝑐 ∗ 𝑓𝑜𝑐 =𝑆𝑜𝑖𝑙 (
𝑔𝐾𝑔
)
𝐺𝑊 (𝑔𝐿)

21
Longer Contact time: Low solubility contaminants
▪ Treatment time
− Not just kinetics (PAHs/PCBs react very quickly with sulfate/hydroxyl radicals)
− Time for entire mass to dissolve into aqueous phase
− High Koc/low solubility
▪ Extended persistence allows for active oxidant to be present as contaminants slowly dissolve
− Ex. Large PAHs, PCBs, and some pesticides
▪ Treatment time:
− Contaminants treated within less than 8 weeks = treat with SP
− Longer—treat with KP
| September 22, 2021 | Klozur® KP Slurry Injection via Hydraulic Fracturing: Fundamentals, Methods, and Lessons Learned
PCB
Day 56 PCB % Reduction
Klozur® SP Klozur® KPLow High Low High
Arochlor1254 12% 26% 53% 53%

22
Longer Contact TimeLow Permeable Soils and Low Contaminant Concentrations
▪ Low permeable soils
− Persulfate anion to diffuse into low permeable matrix
− Contaminant to diffuse from low permeable matrix into active treatment zone
▪ Low contaminant concentrations
− Time for diffusion of mg/L concentrations from matrix and reagent into matrix
| September 22, 2021 | Klozur® KP Slurry Injection via Hydraulic Fracturing: Fundamentals, Methods, and Lessons Learned
Persulfate Contaminant

23
High Groundwater Velocities
▪ Is 2-4 months enough contact?
▪ Klozur® SP, which tends to persist 2-8 weeks, could flow out of target zone before completely reacted
− 500 ft/yr is 42 ft/month or 10 ft/week
▪ As a solid, Klozur® KP would stay in treatment zone, slowly dissolving.
| September 22, 2021 | Klozur® KP Slurry Injection via Hydraulic Fracturing: Fundamentals, Methods, and Lessons Learned
Conceptual Klozur® KP Persistence (months)
Temp (◦C) 5 10 15 20 25
Solubility (g/L) 22 29 37 47 59
(ft/yr) (m/yr)
Gro
undw
ater
See
page
Ve
loci
ty
10 3 315 239 187 147 117
25 8 126 96 75 59 47
50 15 63 48 37 29 23
75 23 42 32 25 20 16
100 20 31 24 19 15 12
500 152 6 5 4 3 21% KP by w/w Soil15% ePV30 ft length parallel to groundwater flowAssumes achieving 50% solubility in cross section or pore volume

24
Lessons Learned
▪ Monitoring
− Have monitoring wells within the injection area/PRB
− Monitor performance at the PRB
− Monitor for the activity/persistence of the Klozur KP
− Monitor for expected residuals (potassium, sodium, calcium, sulfate), residual persulfate, pH, conductivity, and ORP
▪ Site characterization
− Groundwater flux is critical parameter (hydraulic conductive and groundwater gradient)
− Effective/mobile porosity convert that to velocity
▪ Application
− KP and HL being injected as high concentration solid slurries (50 to 70 percent by weight)
− Care with fracture pressure and volumes applied per fracture to control distribution
| September 22, 2021 | Klozur® KP Slurry Injection via Hydraulic Fracturing: Fundamentals, Methods, and Lessons Learned

25
Summary
▪ Klozur® KP has same powerful chemistry as Klozur® SP
−Persulfate anion
−Oxidative and reductive pathways
▪ Klozur® KP has lower solubility that can allow more contact time in the subsurface
−PRBs
−Aqueous phase contaminants
−Low solubility/high Koc contaminants
−Low permeable soils
−Very high groundwater velocity sites
| September 22, 2021 | Klozur® KP Slurry Injection via Hydraulic Fracturing: Fundamentals, Methods, and Lessons Learned

In-Situ Access to Contaminants
Klozur® KP Slurry Injection via Hydraulic Fracturing
Fracture Form and Hydraulic Fracturing Processes
Distribution Mechanisms for Persulfate in Fractures
Data Compiled from Six KP Projects in Five States
» Reagent Loading and Field Productivity
» Daylighting
» Costs
Klozur® KP Case Study – Industrial Site in New Mexico
Q&A w/ Smith, Baird & Ross

In-Situ Access to Contaminants


In-Situ Access to Contaminants
Controlled Hydraulic Fracturing using KP
Make a thick slurry
Pump slurry into the formation
Create a fracture in the formation
» Horizontal, sheetlike structure
» Solids-laden slurry simultaneously creates & fills fracture
Monitor injections and record process data
KP Slurry

In-Situ Access to Contaminants
Oxidant Distribution via Chemical Diffusion
K-Permanganate Frac
Photo Credit: URS

In-Situ Access to Contaminants
Oxidant Distribution via Chemical Diffusion
K-Permanganate FracKlozur® KP Frac
Photo Credit: URS
Klozur® KP Frac
Photo Credit: Brown and Caldwell

In-Situ Access to Contaminants
Oxidant Distribution via Chemical Diffusion is Well Understood and Documented
Cavanagh, B.A., P.C. Johnson, and E.J. Daniels (2014), Reduction of Diffusive Contaminant Emissions from a Dissolved Source in a Lower Permeability Layer by Sodium Persulfate Treatment. Environmental Science & Technology, Vol 48
Hønning, J., M.M. Broholm, and P.L. Bjerg (2007), Role of Diffusion in Chemical Oxidation of PCE in a Dual Permeability System. Environmental Science & Technology, Vol 41, Issue 24
Johnson, R.L., P.G. Tratnyek, and R.O. Johnson (2008), Persulfate Persistence under Thermal Activation Conditions. Environmental Science & Technology, Vol 42, Issue 24
Siegrist, R. L., K.S. Lowe, L.C. Murdoch, T.L. Case and D.A. Pickering (1999), Oxidization By Fracture Emplaced Reactive Solids. Journal of Environmental Engineering, Vol 125, Issue 5
Struse, A.M., R.L. Siegrist, H.E. Dawson and M.A. Urynowicz (2002), Diffusive Transport of Permanganate during In Situ Oxidation. Journal of Environmental Engineering, Vol 128, Issue 4

Klozur® KP Injection Projects
Pilot for PHCs – Jul 20176,000 lbs KP+Activators8 fractures, 24.5-28.0 ft bgs
Two Phases for Mixed Plume – 2017 & 201939,700 lbs KP+SP+Activator71 fractures, 15-25 ft bgs Full Scale for 1,4-D – 2019
194,000 lbs KP234 fractures, 30-50 ft bgs
Full Scale for CVOCs – 202020,300 lbs KP+Activator40 fractures, 4-8 ft bgs
Full Scale for CVOCs – 202110,700 lbs KP+Activator18 fractures, 13-23 ft bgs
In-Situ Access to Contaminants
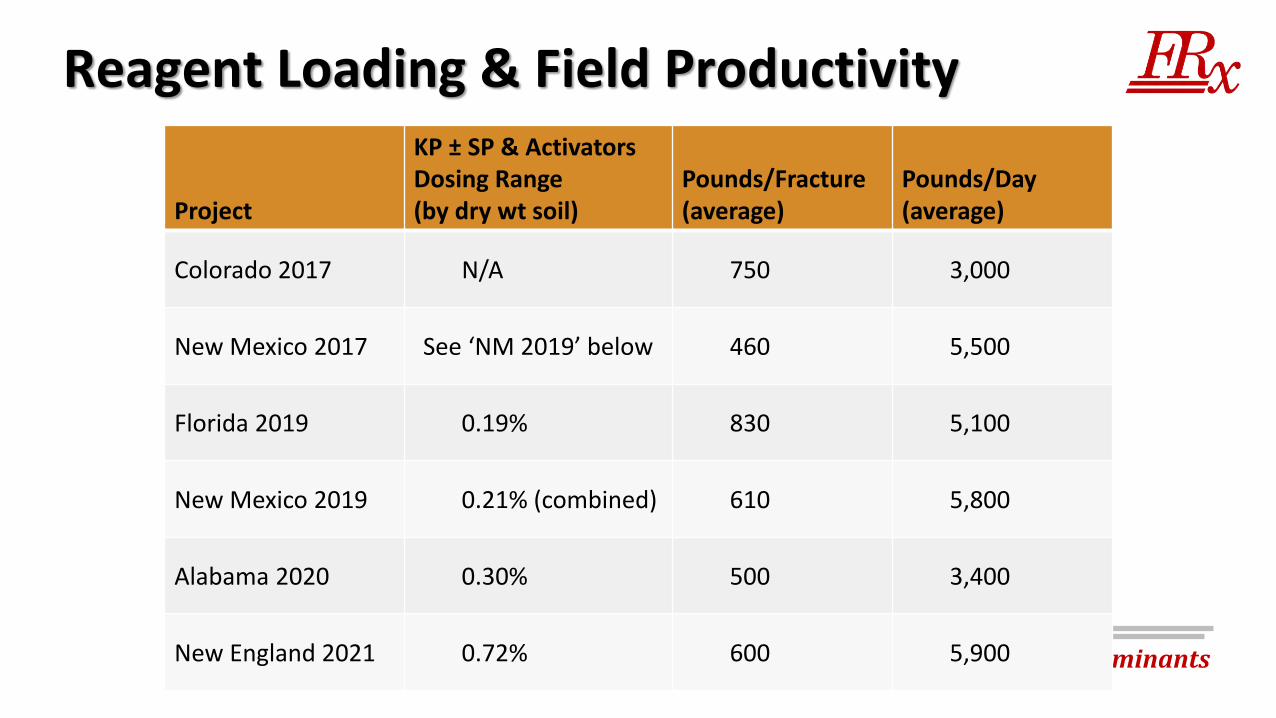
Reagent Loading & Field Productivity
Project
KP ± SP & ActivatorsDosing Range(by dry wt soil)
Pounds/Fracture (average)
Pounds/Day(average)
Colorado 2017 N/A 750 3,000
New Mexico 2017 See ‘NM 2019’ below 460 5,500
Florida 2019 0.19% 830 5,100
New Mexico 2019 0.21% (combined) 610 5,800
Alabama 2020 0.30% 500 3,400
New England 2021 0.72% 600 5,900

In-Situ Access to Contaminants
Daylighting is a Common ProblemOften a BIG One
Indicative of steeply dipping fractures
Multiple causes, commonly manmade
Excessive amounts can kill an injection project
Can be minimized and possibly eliminated

In-Situ Access to Contaminants
Daylighting can be Minimized or Eliminated

In-Situ Access to Contaminants
Daylighting at Klozur® KP Projects
ProjectInjection
Interval (ft bgs)Daylighting
ObservationsFracs
AttemptedDaylighting
Rate
Florida 2019 25-59 1 234 < 1%
New Mexico 2017 & 2019
15-25 5 71 7%
Alabama 2020 4-8 5 40 13%
New England 2021 13-23 0 18 0%
Total 11 363 5%

In-Situ Access to Contaminants
Example Klozur® KP Project CostsDrilling, KP ± Activators, Fracturing
Project Amendments
Amendment Mass (lbs)
Treatment Area (square feet)
Treatment Unit Cost
($/cy)
New Mexico2017 & 2019
Klozur® KP
Klozur® SP
Fe-EDTA
39,700 12,500 $84
Alabama2020
Klozur® KP
Hydrated Lime20,300 15,300 $54
Florida2019
Klozur® KP 194,000 47,500 $55
New England2021
Klozur® KP
Hydrated Lime10,700 1,350 $222

In-Situ Access to Contaminants
Klozur® KP Case StudyIndustrial Site in New Mexico
Former industrial service facility
Alluvial overbank deposits: Silt and silty clay with clay layers and lenses of carbonate rubble
Primary CoCs: naphthalene, benzene, and 1,1-DCA
Source and plume remediation approach over time based on varied CoCs, hydrogeology, and property boundary

In-Situ Access to Contaminants
Treatment of Residual Source Zone
Soil excavation and SVE
Treated groundwater infiltration
Groundwater extraction and treatment via granular activated carbon
ISCO injections

In-Situ Access to Contaminants
Remedial Goal, Approach, and Additional Considerations
Goal: Obtain NFA without long-term monitoring
Approach» Phased ISCO for treatment of residual source
» Hydraulic control of far downgradient plume
» Source polishing of 1,1-DCA with enhanced dichlorination
Decision Points and Tasks» Remedial design investigation to characterize source
» Treatability testing for optimal activation
» Execute Phase 1 injections and Phase 2, if necessary

In-Situ Access to Contaminants
Treatment Areas & Performance MWs
2017 Injection
Area
2019 Injection
Area

In-Situ Access to Contaminants
Treatment Areas & Results
COC concentrations below goals
Only 1,1-DCA concentration above goal
2019 Injection
Area
2017 Injection
Area

In-Situ Access to Contaminants
Treatment Areas & Results
COC concentrations below goals
Only 1,1-DCA concentration above goal
2019 Injection
Area
2017 Injection
Area

In-Situ Access to Contaminants
Treatment Areas & Results
COC concentrations below goals
Only 1,1-DCA concentration above goal
2019 Injection
Area
2017 Injection
Area

In-Situ Access to Contaminants
Treatment Areas & Results
COC concentrations below goals
Only 1,1-DCA concentration above goal
2019 Injection
Area
2017 Injection
Area

Klozur® KP via Hydraulic Fracturing Conclusions
• Several case studies show the versatility, successful application, and treatment capabilities of Klozur® KP.
• Oxidant distribution via chemical diffusion is well-understood.
• Good fracture form is paramount. It can be attained with understanding of principles and application of proper techniques.
• Daylighting can be minimized or possibly eliminated.
• High-dose delivery of activated KP in low-k units is well-established.
• Treatment using this approach is cost effective. Total project costs are typically less than $85 per cubic yard.

48
Questions?Drew Baird, PGSenior GeologistFRx, [email protected]
Chapman Ross, PEDirector of TechnologyFRx, [email protected]
Brant Smith, PhD, PEDirector of TechnologyEvonik Active Oxygens, [email protected]@evonik.com
| September 22, 2021 | Klozur® KP Slurry Injection via Hydraulic Fracturing: Fundamentals, Methods, and Lessons Learned