Embed Size (px)
Citation preview

FISH TO 2030: THE ROLE & OPPORTUNITY FOR AQUACULTURE
Kobayashi, M., S. Msangi, M. Batka, S. Vannucini, M.M. Dey, and J. L. Anderson. 2015. Aquaculture Economics & Management 19(3):282-300.
DEFINITION OF REGIONS

0
50
100
150
20019
8419
8819
9219
9620
0020
0420
0820
1220
1620
2020
2420
28
Million MT
Total (Data)
Total (Model)
Capture (Data)
Total Fish Production: 1984-2030

Commodity Groups

N AmericaEurope
L AmericaChinaIndia
Other S AsiaSE AsiaJapan
Other Asia &…CWANA
Sub-Saharan…
0 10 20 30 40 50 60Million MT
2030 (Model) 2020 (Model)
› More than 50% increase 2006 to 2030 China India Other South Asia Cent./West Asia & N.
Africa › Less than 20% increase
2006 to 2030 Southeast Asia Sub-Saharan Africa North America Latin America
• Regions with little growth or decline Other Asia & Pacific Europe Japan
Consumption Growth

ShrimpCrustaceans
MollusksSalmon
DemersalTuna
Cobia/SwordEel/Sturgeon
TilapiaPangasius
CarpMullet
Other FreshOther Carp
Other PelagicOther Marine
0 10 20 30Million MT
2030 (Model) 2020 (Model)2008 (Data)
• More than 100% increase 2008 to 2030 Other marine Fish (152%) Demersal (131%) Tilapia (126%) Mullet (113%) Shrimp (110%)
• 40-100% increase 2008 to 2030 Pangasius (90%) Carp (89%) Crustaceans (82%) Molluscs (64%) Other fresh fish (63%) Eeel/sturgeon (58%) Salmon (53%) Other carp (50%) Tuna (48%) Cobia/swordfish (42%)
Sources of Aquaculture Supply Growth By Commodity

Projected Global Prices Fish Meal and Oil
0
1000
2000
3000
4000
500020
0020
0220
0420
0620
0820
1020
1220
1420
1620
1820
2020
2220
2420
2620
2820
30
prices ($ pe
r mt)
c-FshOil
Projected Prices ($/MT): Fish Meal, Fish Oil
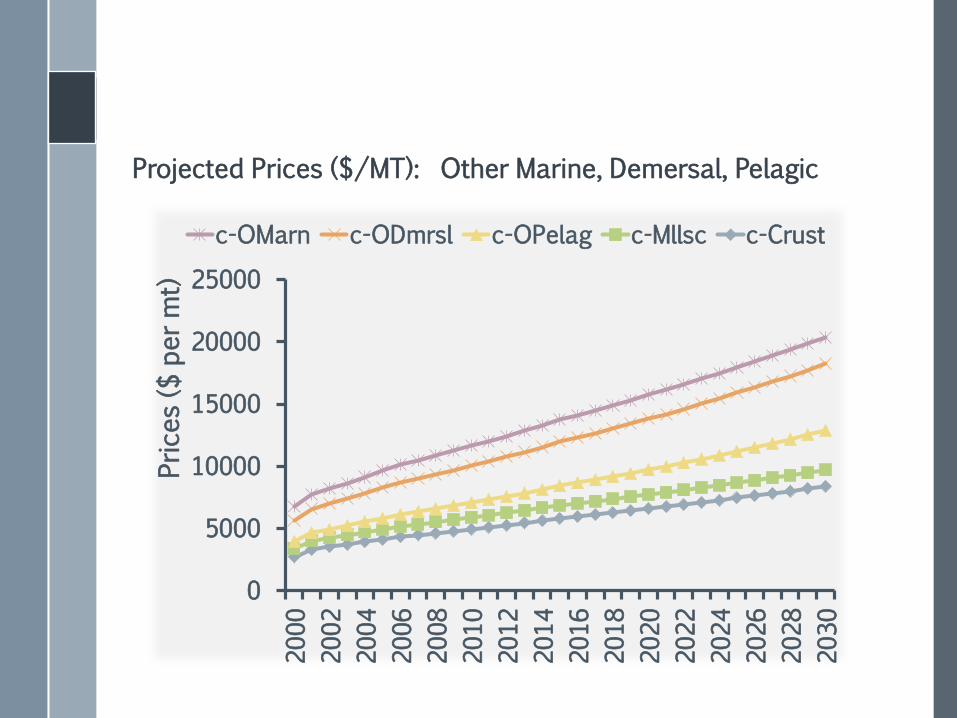
Projected Global Prices of Major Seafood Categories
0
5000
10000
15000
20000
2500020
0020
0220
0420
0620
0820
1020
1220
1420
1620
1820
2020
2220
2420
2620
2820
30
Prices ($ pe
r mt)
c-OMarn c-ODmrsl c-OPelag c-Mllsc c-Crust
Projected Prices ($/MT): Other Marine, Demersal, Pelagic

Projected Prices ($/MT): Shrimp, Salmon, Tuna, Freshwater
0100020003000400050006000700080009000
1000020
0020
0220
0420
0620
0820
1020
1220
1420
1620
1820
2020
2220
2420
2620
2820
30
prices ($ pe
r mt)
c-shrimp c-Salmon c-Tuna c-FrshD

-20.00 -10.00 0.00 10.00 20.00 30.00
North America
China
Latin America
SE Asia
Other E Asia
SS Africa
Europe
So Asia
Net trade (million mt)
2030 2010
Projected Net Trade in 2030 as Compared to 2010

SUPERMARKET SALES TRENDS FOR AQUACULTURE PRODUCTS
› In terms of value, restaurants account for about two-thirds of seafood sales
› However, in terms of quantity of seafood sold, grocery sector has almost equal share with restaurants (~50% each)
› Supermarkets are the fastest growing food-retailing businesses
› Supermarkets have: – Expanded seafood counters – Created separate seafood depts. – Established own brands of seafood.

What Is Retail Store Scanner Data?
INFORMATION COLLECTED THROUGH THE SCANNING OF UPC / BAR CODES
A very popular tool in marketing research; but not tried in seafood
marketing sector

Types of Stores Covered
Drug Stores
Gas Convenience Stores
Independent Food Stores
Supermarkets Mass Merchandisers
Chain Convenience Stores
Supercenters

Markets Covered
Portland
Seattle
Sacramento
San Francisco
Los Angeles
Salt Lake City/Boise Denver
PhoenixLas Vegas
San Diego West Texas/New Mexico
Oklahoma City/Tulsa
San Antonio
Dallas
Houston
Omaha Des Moines Minneapolis
TampaKansas City
Little Rock
Memphis
New Orleans/Mobile
Birmingham
Grand RapidsMilwaukee
St. LouisChicago
Cleveland
Detroit
Indianapolis
Cincinnati
ColumbusPittsburgh
Buffalo/Rochester
Nashville
Miami
Atlanta
Orlando
Louisville
Charlotte
Jacksonville
Richmond
Raleigh/Durham
Washington DC
BaltimorePhiladelphia
Hartford/New Haven
New York
Boston
Syracuse
Albany

Composition of Retail Seafood Sales
[CATEGORY NAME]
[PERCENTAGE]
[CATEGORY NAME]
[PERCENTAGE]
Frozen Unbreaded
Items 24%
Frozen Entrée Items 10%
Frozen Breaded Items 7%
Anchovy products <0.01%

The Three Frozen/Chilled Seafood Categories
Breaded seafood Seafood Entrée Unbreaded seafood Value-added products
16

% Shares of Product Categories (52 markets)
0
20
40
60
80
100
120
140
160
Y1 Y2 Y3 Y4 Y5
23 25 28 31 33
13 13 12 13 13 7 7 7 7 7
43 46 47
51 53
57 54 53
49 47
AllCannedItems
AllFrozenProducts
AllEntréeItems
AllBreadedItems
AllUnbreaded Items
17

Sales Volume of Frozen/chilled Products: Trends w.r.t 2005-06
-15-10-505
101520253035
Total fro
zen
seafoo
d
Brea
ded
froze
n
Froz
en E
ntrée
Unb
read
edfro
zen
4
-0.3
10 5 6
-6
1
13 8
-3 -8
18 17.9
-0.2
-10
33.8
% C
hang
e
Y2 Y3 Y4 Y5
18

WHAT’S WRONG WITH THIS PICTURE?
PRICES OF COD PRODUCTS: 12-OZ PACKS
0.001.002.003.004.005.006.007.008.009.00
10.00
Y1 Y2 Y3 Y4 Y5
B Cod fillet E Cod fillet U Cod fillet
Value-added products
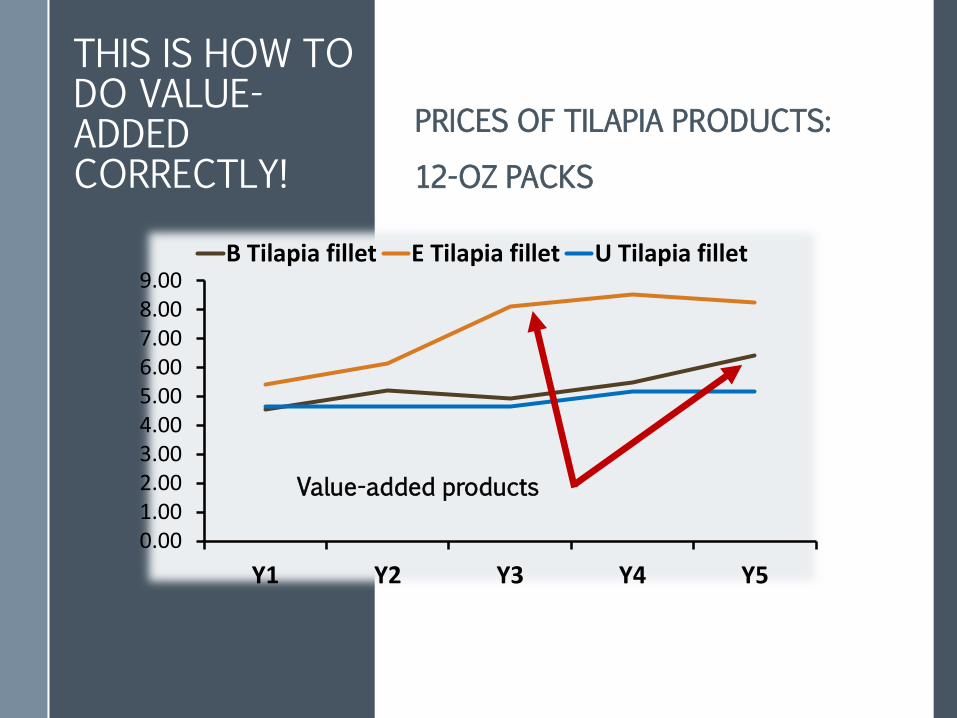
0.001.002.003.004.005.006.007.008.009.00
Y1 Y2 Y3 Y4 Y5
B Tilapia fillet E Tilapia fillet U Tilapia fillet
THIS IS HOW TO DO VALUE-ADDED CORRECTLY!
PRICES OF TILAPIA PRODUCTS: 12-OZ PACKS
Value-added products
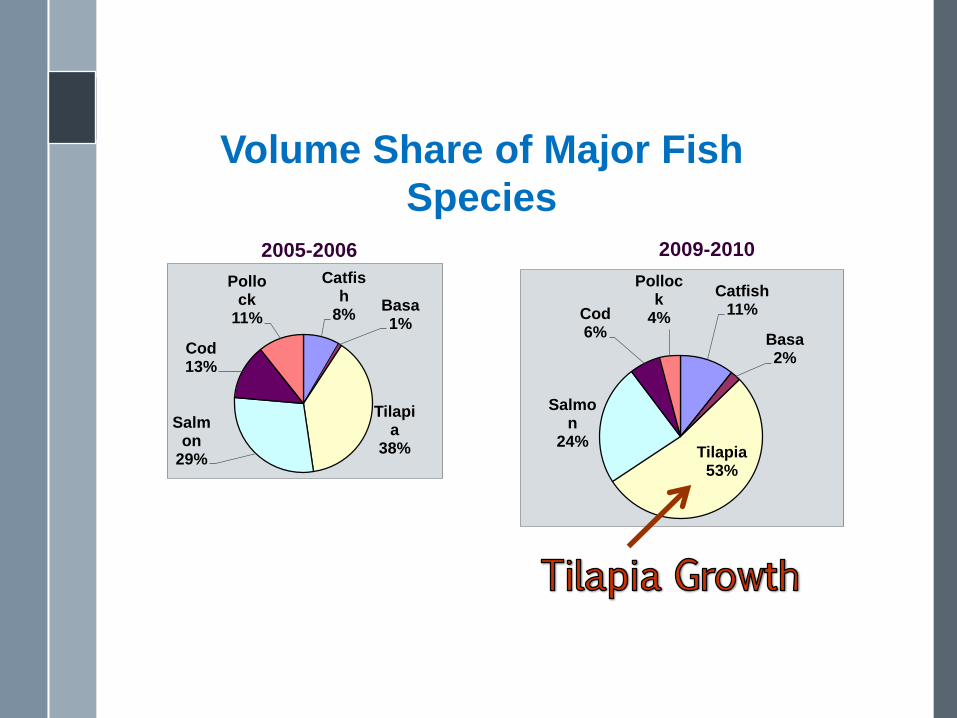
Volume Share of Major Fish Species
Catfish 11%
Basa 2%
Tilapia 53%
Salmon
24%
Cod 6%
Pollock
4%
Catfish
8% Basa 1%
Tilapia
38% Salm
on 29%
Cod 13%
Pollock
11%
2005-2006 2009-2010

Tortilla crusted chipotle lime W/pineapple, mango salsa
Gourmet with red pepper Stuffed with spinach & cheese
Parmesan crusted Tuscan herb
W/ adobo sauce
Herb crusted Parmesan W/ rolled scallop & red pepper
With artichoke & pesto Potato crunch Pecan encrusted W/chimichurri

Markets covered Atlanta, Boston, Chicago, Detroit, Los Angeles,
New York, Philadelphia, Pittsburgh, San Francisco & Washington D.C

05
1015202530354045 2009 2010 2011 2012
10 Markets: Top 10 Unbreaded Finfish % sa
les in
total s
ales

10 Markets for Unbreaded Salmon % sales in total
sales
05
1015202530354045 2009 2010 2011 2012
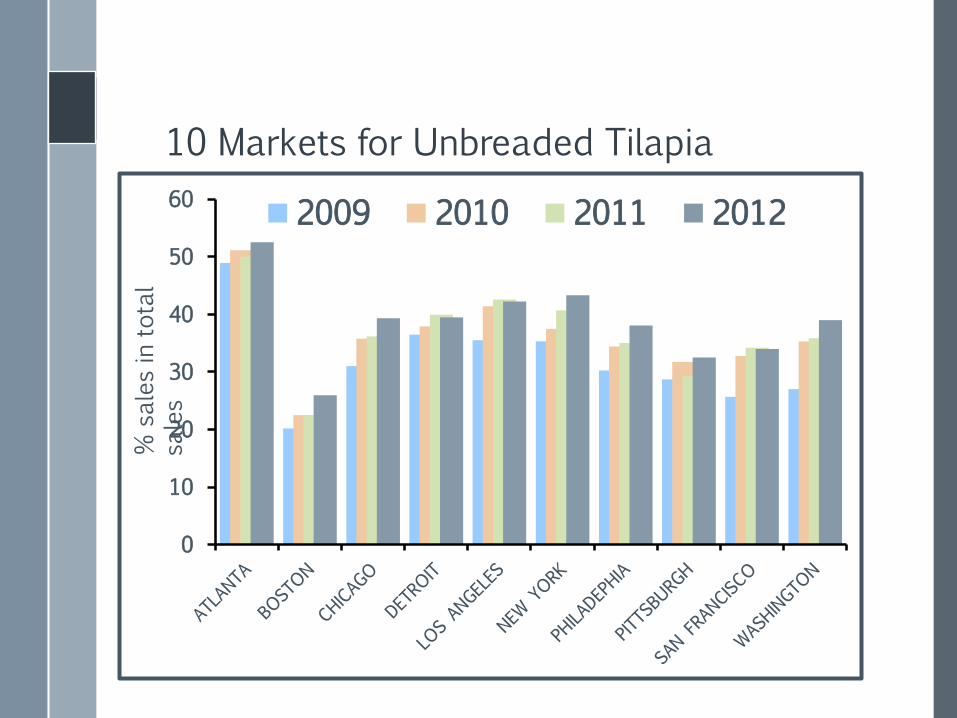
10 Markets for Unbreaded Tilapia % sales in total
sales
0
10
20
30
40
50
60 2009 2010 2011 2012

Tilapia Own-price elasticity Expenditure elasticity
-2.25 -1.75 -1.25 -0.75 -0.25 0.25
Nov-Jan
Feb-April
May-July
Aug-Oct
Mid Atlantic
South Atlantic
East South Central
New England
East North Central
West South Central
Mountain
West North Central
Pacific
0.00 0.50 1.00 1.50
Nov-Jan
Feb-April
May-July
Aug-Oct
Mid Atlantic
South Atlantic
East South Central
New England
East North Central
West South Central
Mountain
West North Central
Pacific
To talk about pricing strategies, we need to talk about elasticities

Salmon Own-price elasticity Expenditure elasticity
-2.25 -1.75 -1.25 -0.75 -0.25
Nov-Jan
Feb-April
May-July
Aug-Oct
Mid Atlantic
South Atlantic
East South Central
New England
East North Central
West South Central
Mountain
West North Central
Pacific
0.00 0.50 1.00
Nov-JanFeb-AprilMay-JulyAug-Oct
Mid AtlanticSouth Atlantic
East South CentralNew England
East North CentralWest South…
MountainWest North…
Pacific

-0.20
0.20.40.60.8
1Cr
oss p
rice
elas
ticity
(%) Salmon Whiting Catfish
Cross-price Elasticities of Tilapia (Substituting Tilapia for others) (substitute =
Positive value)

Cross-price Elasticities of Salmon (Substituting Salmon for others) (substitute = Positive value)
-1.5
-1
-0.5
0
0.5
1
1.5Cr
oss p
rice
elas
ticity
(%)
Tilapia Whiting Catfish

CONCLUDING REMARKS
Global trends indicate that North America has potential to reduce its seafood trade deficit as China becomes more of a net importer.
Degree of competition among products vary considerably across region
Substituting relationship in one region but complementary relationship in another region.

CONCLUDING REMARKS: MARKETING STRATEGIES
Not one uniform product/type/size
Regional variation in Trends Demand Substitutability
One- size- fits-all does not work
Importance of Market segmentation Product differentiation

CONCLUDING REMARKS: MARKETING STRATEGIES
Need to find ways to differentiate your product And continue to add new “value” to it; markets change constantly Does “local” matter?
• In some markets • May be a way to
differentiate your product • However, you have to tell
the story of why yours is better; not just assume that people will buy it because it’s local

Bottomline: More Important Than Ever to
Really Know Your Consumers
Carole R. Engle, Ph.D.
Questions?


![APRIL 1, 2014 WELCOME TO CARP @ [UNIV] “CARP America”](https://img.pdfslide.net/doc/110x75/56649ea45503460f94ba8f44/april-1-2014-welcome-to-carp-univ-carp-america-wwwcarplifeorg.jpg)