Embed Size (px)
Citation preview

Knowledge is Prudence:
How Entrepreneurs Benefit from Business Training
in a Field Experiment
Jun Huang∗
November 22, 2014
Abstract
Can entrepreneurship be learned, and if so, what is most useful for entrepreneurs to learn? These
issues have been difficult to address because of the endogeneity of learning and the lack of an empir-
ical strategy to unpack how it affects entrepreneurs. Using data from a field experiment where free
entrepreneurship training was randomly distributed, I show that entrepreneurs effectively improved their
financial performance by participating in training. To identify the primary mechanism for this effect, I
exploit the differet predictions of how training affects capital investment . Interestingly, the improve-
ment did not seem to be driven by increased production efficiency, but rather by entrepreneurs learning
to refine their business ideas and thus reducing excessive investment that arose from overconfidence.
As a result of learning, they invested less in business, hired fewer employees and grew their businesses
more slowly, but achieved better performance. This paper contributes a novel strategy for unpacking the
benefits of learning, and also provides a demand-side perspective for addressing entrepreneurs’ resource
constraints.
∗Columbia Business School, 7th Floor 3022 Broadway, New York, NY 10027 USA. Email: [email protected]. I thankAseem Kaul, Bruce Kogut, Mattia Landoni, Jiao Luo, Stephan Meier, Damon Phillips, Andrea Prat, Evan Rawley, David Ross,Robert Seamans, Zhan Shi and Scott Stern for helpful comments. Special thanks to Jacob Benus, Robert Fairlie and JonathanSimonetta for clarifications on the the GATE data. I am also grateful to the participants of the Atlanta Comparative AdvantageConference, the Consortium on Competitiveness and Cooperation, the NYU-Columbia Doctoral Conference and the Trans-AtlanticDoctoral Conference. Glamis Haro, Lawrence King and Natalie Moses at the Small Business Administration provided valuableinsights on the practice of business training. All errors are mine.

"The entrepreneurial mystique? It’s not magic, it’s not mysterious, . . . It’s a discipline. And,
like any discipline, it can be learned."
—Peter Drucker1
"The real discipline comes in saying no to the wrong opportunities."
—Peter Drucker2
1 Introduction
Can entrepreneurship be learned, and if so, what is most useful for entrepreneurs to learn? For many
pursuing an entrepreneurial career, it remains unclear as to learning what helps them the most: is it the
specific know-hows to increase competence, such as how to manage employees, or is it the more general
ability for business planning? As much as they are important for both the entrepreneurs and the broader
economy, these issues have been difficult to address not only because learning is endogenous, but also
because of the lack of an empirical strategy to unpack how it affects entrepreneurs.
This paper is aimed to fill this gap. Specifically, I study entrepreneurs’ learning in the context of a
field experiment where basic business training was randomly distributed. My research question is: How
do entrepreneurs benefit from entrepreneurship training? I break down this question into two parts that are
empirically testable: 1) Can entrepreneurs improve their performance by participating in training? 2) If so,
what is the primary mechanism? By identifying the primary mechansim, we can then understand what from
the training contributes the most to their improvement (if any).
Theoretically, the literature proposes two potential mechanisms whereby entrepreneurship training may
affect performance. The two mechanisms differ in whether they assume entrepreneurs are rational or bound-
edly rational. The first is the "productivity" mechanism rooted in neoclassical economics: training enhances
production efficiency, making it more profitable to expand the production scale. It follows that business
training improves financial performance and increases entrepreneurs’ capital investment in production. The
second is the "prudence" mechanism based on the behavioral decision theory: entrepreneurs are subject to
1Drucker (1985).2Boorstin (2005).
1

the overconfidence bias. Training refines entrepreneurs’ business ideas, i.e., it helps to scale down exces-
sive investment. In this case, training improves performance by preventing financial loss, and decreases
entrepreneurs’ capital investment.
To illustrate the two mechanisms, consider an example of the common business analytical tools such as
the SWOT matrix.3 Knowledge of those tools may help entrepreneurs to identify new opportunities, thus
motivating them to expand production in order to capture more market shares. It may also alert them to their
weaknesses and potential threats, thus reducing capital investment inspired by unrealistic expectations. In a
training program, both mechanisms may be in effect. This paper is aimed to identify the dominating one.
To empirically answer the research question, I draw on data from a training program titled "Growing
America through Entrepreneurship (GATE)". The program was designed as a field experiment, where free
training conducted by professionals was randomly granted to the applicants. The training taught basic
business skills, as well as provided counseling for starting and managing a small business. This experimental
design is valuable for identifying the causal effects, because receiving training is an endogenous decision
by the individuals. My overall strategy consists of four pieces of analyses. To investigate the issue of
"whether entrepreneurs can improve performance by taking training", Analysis 1 focuses on the average
monthly profit. Targeting the issue of "primary mechanism", my strategy considers both action- and opinion-
based evidence. First, I exploit the different predictions by the two mechanisms on capital investment.
Analysis 2 proxies capital investment by its antecedent—financing, and Analysis 3 proxies by its outcome—
production scale and its growth (both measured by employment). Second, through surveying and in-person
interviewing, Analysis 4 presents opinions from both trainees and trainers regarding how receiving training
helps entrepreneurs.
The results support prudence as the primary mechanism: by taking business training, entrepreneurs
mainly learn to mitigate overconfidence, which translates into better performance. Analysis 1 finds that
taking training improves financial performance, and the effect concentrates on loss prevention—receiving
training lowers the likelihood of operating loss, but has little impact on the right tail of the earnings distri-
bution. The results of the other anlayses suggest that "prudence" is the primary mechanism. First, training
reduces entrepreneurs’ capital investment in production. Analysis 2 finds that receiving training decreased
the business financing. Analysis 3 shows that the entrepreneurs with more training had smaller production
3SWOT stands for "strength, weakness, opportunity and threat." See Pickton and Wright (1998) for an introduction to the SWOTmatrix.
2

scale and slower business growth. Second, as Analysis 4 documents, the individuals reported "refining busi-
ness ideas" as a major way that training helped them. And the prudence mechanism was also confirmed by
two trainers at a sponsoring institution of GATE. In essence, the learning helped the average entrepreneur
by substituting for some possibility of "financial loss from overconfidence-driven investment" with the pos-
sibility of "higher performance based on reasonable planning".
Furthermore, I conduct three sets of robustness checks on the empirical results. First, I use weighted
regressions to show that the empirical findings are not driven by differential sample attrition. Second, I show
that the results are robust to alternative sampling strategies. Third, based on additional statistical evidence,
I find little evidence for training improving the entrepreneurs’ production efficiency. In other words, it does
not seem to be the case that entrepreneurs can effectively learn to increase efficiency by taking training.
Overall, this paper highlights improved cognitive ability as the primary contributor to the benefits of en-
trepreneurs’ learning, and thus suggests that it is most useful for entrepreneurs to learn skills or knowledge,
such as business planning tools, that mitigate overconfidence and foster prudence.
This paper contributes an innovative strategy to unpack the mechanims of entrepreneurs’ learning. By
doing so, it provides the first answer to the question of what is most useful for entrepreneurs to learn. The
answer sheds light on how to improve the quality of entrepreneurship. This not only has implications for
individuals, but also helps policy makers to design better training programs (McKenzie and Woodruff, 2012).
By identifying prudence as the primary mechanism, this paper also contributes to an ongoing debate in
the literature on new venture strategy. Previous research argues that "nascent entrepreneurs should aggres-
sively pursue opportunities in the short-term"(Carter et al., 1996). To counter that argument, some studies
highlight the benefits of business planning (e.g. Delmar and Shane (2003)), but none has directly shown that
being less aggressive contributes to nascent entrepreneurship. This paper fills this gap. In contrast to aggres-
sive investment, the results suggest that smaller scale and slower growth may represent a more sustainable
strategy for new ventures.
2 Two Theories, Different Predictions
Drawing on two strands of related literature, I develop the theoretical predictions of how receiving business
training affects entrepreneurs’ performance. As detailed below, the theories generally agree on the effect on
the performance, but disagree on the mechanism. The disagreement is rooted in the assumption of whether
3

entrepreneurs have the cognitive ability to accurately assess themselves and the environment (Simon, 1955).
Each strand of the literature contributes a potential mechanism, which I term "productivity" and "prudence"
respectively.
In this section, I use a simple formal model to illustrate the two mechanisms and derive the propositions.
The model is based on the original work by Stein (2003) and consists of a single agent (entrepreneur) and
two stages. At stage 1, the entrepreneur invests amount I of financial capital into business production.
She has endowment W and needs to borrow max[I−W,0]. At stage 2, the investment yields financial return
m ·Iα where α ∈ (0,1) denotes the diminishing return to investment and m> 0 denotes the actual managerial
capability of the entrepreneur (Evans and Jovanovic, 1989).
The agent aims to maximize the net present value of the actual return to entrepreneurship:
πA(I)≡m · Iα
1+ r− I−C(max[I−W,0])
where r > 0 is the risk-adjusted interest rate and C(·) is the cost of using debt financing. Naturally, C(0) = 0.
We also assume C′(·) > 0 and C′′(·) ≥ 0 to reflect the positive and non-decreasing marginal cost of debt
financing.4
2.1 The Productivity Mechanism
From the perspective of neoclassical economics, human beings are "rational"—they are able to access com-
plete information for making the optimal decision.5 In this sense, rational entrepreneurs possess accurate
knowledge of themselves and the environment, and optimize their behavior according to such accurate
knowledge. Learning benefits them mainly through increasing the production efficiency, as defined by the
marginal return to the production factors (e.g. labor or equipment). As a result, other things constant, en-
trepreneurs with training can obtain greater financial gains from employing the same amount of production
factors than those without training (e.g. Lucas (1978); Evans and Jovanovic (1989)). For example, better
management skills or better marketing strategies may increase the revenue per unit of labor.
Specifically, training may improve production efficiency in two ways. First, it facilitates the adoption
of know-hows, thereby strengthening the business competence. The strengthened competence makes en-
4A more general form of the utility function would be a weighted sum of the financial return and a constant term denoting thesubjective utility from being an entrepreneur. The analytical results are not sensitive to this variation.
5This perspective is also termed more generally as "rational choice theory".
4

trepreneurs capable of capturing greater market shares, and motivates them to expand production. This is
particularly the case for businesses at a growing stage. For example, Bloom et al. (2013) find that profes-
sional consultancy boosts factory productivity by 17 percent on average, and results in more plant openings.
Similarly, Ichniowski and Shaw (1999) show that adopting innovative practices of human resource manage-
ment significantly improves productivity. At an aggregate level, countries experiencing productivity growth
tend to accumulate savings to finance more entrepreneurial investment (Sandri, 2014). Second, training
streamlines the exploitation of market opportunities. That is, knowledge transfer expedites collecting and
processing the information needed to exploit new opportunities. For example, entrepreneurs with more ex-
posure to knowledge of doing business abroad are more likely to export (Filatotchev et al., 2009). New
market opportunties expand the demand for the product, thus lifting the marginal return to production fac-
tors.
In sum, training makes it more profitable for entrepreneurs to expand their production. In the model,
under the assumption of accurate knowledge, the entrepreneur aims to decide on the amount of investment
to maximize the actual return
maxI
πA(I).
Let IA be the investment amount that maximizes πA. Receiving training increases m. Then, the model
informs the following based on neoclassical economics:
Proposition 1. (the Productivity Mechanism): ∂ [πA(IA)]/∂m > 0 and ∂ IA/∂m > 0, i.e., receiving busi-
ness training improves financial performance, and increases entrepreneurs’ capital investment in their
businesses.6
2.2 The Prudence Mechanism
Drawing on insights from economics and social psychology, the behavioral decision theory emphasizes
the role of entrepreneurs’ cognitive ability in their decision making (Slovic et al., 1977; Simon, 1972).
This theory relaxes the assumption of perfect rationality, and instead argues that human beings are only
partially (or "boundedly") rational due to cognitive limitations. This implies that entrepreneurs tend to
make decisions under incomplete information. This is particularly true of nascent entrepreneurs due to two
6See Appendix I for proof.
5

reasons. First, a comprehensive set of information is either unavailable or too costly to gather. On the
contrary, heuristics based on information sourced from personal experience or observation provides a less
costly solution (Tversky and Kahneman, 1974). Second, nascent businesses typically do not have established
routines that can serve as guidance (Nelson and Winter, 1982; Kogut and Zander, 1992).
The most widely and consistently documented cognitive limitation is overconfidence. Overconfidence
is broadly defined in the literature as the tendency to: 1) overestimate the expected return to a project; or
2) underestimate the variance (risk) of the return to a project (Åstebro et al., 2014). Overconfidence is a
stylized fact about entrepreneurs in a longstanding stream of literature (e.g. Busenitz and Barney (1997);
Simon and Houghton (2002); Hayward et al. (2006); Koellinger et al. (2007); Pirinsky (2013)). Many enter
entrepreneurship because they perceive the return to be more favorable than those who do not enter. In
general, entrepreneurs tend to overestimate their skills and the odds of business success (Cooper et al.,
1988; de Meza and Southey, 1996; Wu and Knott, 2006). Compared with corporate employees, they are
more likely to be subject to "wishful thinking" of better financial outcomes but tend to have worse actual
performance (Arabsheibani et al., 2000).
Overconfidence has implications for entrepreneurs’ investment and performance. First, it leads to ex-
cessive capital investment. This may result from overestimating the demand for own products and under-
estimating customers’ likelihood of switching to competitors (Mahajan, 1992; Camerer and Lovallo, 1999;
Malmendier and Tate, 2005), or understimating the cost of carrying out a project (Baron, 1998). Second,
as overconfidence translates into unrealistic goals and misguided investment, it causes failures of individual
projects as well as harms entrepreneurs’ performance in general (Koellinger et al., 2007; Hmieleski and
Baron, 2009). For example, Simon and Houghton (2003) show that overconfident entrepreneurs feel more
optimistic about their products’ prospect, release more risky products but are less likely to succeed with
their release. The performance implications of overconfidence are gravely summarized in Barnes (1984),
"Unfortunately, overconfidence may cause the strategic planner to overlook or misjudge pathways to dis-
aster." In practice, investors are concerned about the negative consequences that arise from entrepreneurs’
overconfidence. Some venture capitalists even went so far as to devise psychometric test on entrepreneurs
to separate the "completely delusional" from the slightly overconfident.7
Business training mitigates entrepreneurs’ overconfidence. The knowledge of analytical tools and the
7http://www.economist.com/news/business/21618816-instead-romanticising-entrepreneurs-people-should-understand-how-hard-their-lives-can (ccessed Oct 10, 2014).
6

information exchange helps entrepreneurs to form a more realistic picture of their businesses and cut the
excessive investment (Mahajan, 1992). This way, training essentially accelerates the entrepreneurs’ learning
about themselves and their businesses (Jovanovic, 1982).
In the model, the behavioral decision theory argues that the entrepreneur may not perceive the actual
return function πA(I). Instead, due to cognitive limitations, the entrepreneur perceives the following payoff
function:
πP(I)≡(1+ τ) ·m · Iα
1+ r− I−C(max[I−W,0])
whereτ ≥ 0 is her degree of misperception of the investment return (Ben-David et al., 2013). A larger value
of τ indicates a higher level of overconfidence,8 and receiving training reduces τ . In deciding on the amount
of investment, the entrepreneur aims to maximize the perceived return:
maxI
πP(I).
Let IP be the investment amount that maximizes πP. The entrepreneurs invests IP and receives πA(IP) in
actual return. The model informs the following based on behavioral decision theory:
Proposition 2. (the Prudence Mechanism): ∂ [πA(IP)]/∂τ < 0 and ∂ IP/∂τ > 0, i.e., receiving business
training improves financial performance, and decreases entrepreneurs’ capital investment in their busi-
nesses.9
As a side note on the two propositions above, both mechanisms may possibly be in effect, and the
primary mechanism is likely to vary across individuals. For instance, those with better cogntive abilities
may benefit more through the productivity than the prudence mechanism. The goal of this paper, however,
is to identify the effect and its primary mechanism for the average entrepreneur in the given empirical
context.8The productivity mechanism is essentially a special case with τ = 0. In that case, πA(I) = πP(I) for any I ≥ 0.9See Appendix I for proof.
7

3 Data and Empirical Strategy
The empirical analysis of this paper draws on data from a experiment where free entrepreneurship training
was randomly distributed. The randomization is crucial for identifying the causal effect of training. This is
because factors that are unobserved by the researchers may affect both the receipt of training and the outcome
measures. Without randomization, causal inference is difficult because the effect of training could possibly
be confounded with the effect of those unobserved factors. An example of such factors is entrepreneurs’
motivation, which is often unobserved and positively influences both the training and the performance.
Analyses that fail to account for the unobserved motivation would overestimate the causal effect of training
on performance.
The experiment started in the year 2003. The Department of Labor (DOL) and the Small Business Ad-
ministration (SBA), in a joint effort with local organizations, launched a program titled "Growing America
through Entrepreneurship" (GATE) in three states (Benus et al., 2009).10 The program was aimed to up-
grade the business knowledge of those interested in enhancing their entrepreneurial career. Compared with
the handful of other government-sponsored entrepreneurship training programs in the U.S., GATE remains
the most comprehensive to date, in that its admission was not restricted to the unemployed and it was more
diverse geographically and demographically (Benus et al., 2009). The comprehensivenss and the random-
ization make GATE an attractive setting for causal inference with a high level of generalizability. Recently,
several studies have used the GATE sample. See Appendix II for a summary and how this paper differs from
them.11
GATE was advertised extensively both by media and at DOL-affiliated institutions to reach a broad audi-
ence. In order to participate in GATE, people first registered through one of the multiple channels including
phone, mail, internet and local One-Stop Career Centers. They then were asked to attend an orientation
session at a local One-Stop Career Center, where a video introducing the program was shown. A nine-page
application form was distributed to each attendee after the session was completed. The form asked each ap-
plicant to describe the idea of their current business or the one that they were about to start. On the last page
of the application form and right before the applicant’s signature, a note explicitly informed the applicant
that admission to GATE would be decided by a random lottery due to space constraints. Completing and
10The locations include Philadelphia and Pittsburg of Pennsylvania, Minneapolis/St. Paul and Duluth of Minnesota, and Bangor,Portland and Lewiston of Maine. They reflect a balance between urban and rural demographies.
11The GATE dataset and surveys are available at http://www.doleta.gov/reports/projectgate (accessed Oct 8, 2014).
8

submitting the form by mail concluded the application process. Anyone aged 18 or above, legally authorized
to work in the U.S., and with an appropriate business idea was eligible for GATE participation (Benus et al.,
2009).
GATE received around 4,000 complete applications. The applicants were randomly assigned to one
of two groups of roughly equal size. The control group did not receive any services from GATE, but was
free to seek training at their own expense. In contrast, the treatment group was offered the option of free
training by professional business consultants. The breadth of the training spanned across basic accounting,
finance, marketing, legal issues and commerce-related information technology. In addition to lectures, one-
on-one counseling sessions and peer group meetings were also available. After the random assignment, the
treatment group members initiated their training by meeting a business consultant. Based on the assessment
of the members’ capability and needs, the consultant advised on the content of a personalized training plan.
The average cost of training per treatment group member is estimated to be around $1,000 (Benus et al.,
2009).
Both groups were followed up with three waves of telephone surveys about 6, 18 and 60 months re-
spectively after the random group assignment. In this paper, I timestamp the group assignment as month 0.
Then the three waves of surveys took place at respectively months 6, 18 and 60. The three waves asked a
similar set of questions mainly concerning the individuals’ training and businesses. This paper focuses on
the information from the last wave (at month 60) to let the effects of training materialize more fully—In
fact, 27.3 percent of the sample continued to attend classes or one-on-one counseling after the second wave
(month 18); and of the 1,682 individuals that reported no entrepreneurial activities in the second survey, 299
(17.8 percent) of them entered entrepreneurship afterwards.
3.1 Empirical Strategy
I conduct four pieces of analyses to address the research question. In Analysis 1, I address the issue of
"whether entrepreneurs can improve performance by taking training" by focusing on the average monthly
profit. My strategy for addressing the issue of "primary mechanism" considers both action- and opinion-
based evidence. For action-based evidence, I exploit the different predictions of the effect on capital in-
vestment. As the GATE sample does not report direct measures of capital investment, I use two sets of
proxies. In Analysis 2, I proxy capital investment by its antecedent—financing. For nascent businesses,
their capital investment in business production generally equal their financing because they rarely invest in
9

non-production-related venues (e.g. financial securities). I further break down the start-up capital to debt
and entrepreneurs’ own money. In Analysis 3, I proxy capital investment by its outcome—business scale
and growth rate, both measured in terms of the number of employees. For opinion-based evidence, Analysis
4 studies both the trainees and the trainers: First, on a Likert scale, the trainees reported how much training
helped them with respect to a list of issues; Second, outside the context of GATE, I interviewed two trainers
at the SBA, regarding the common issues that they help entrepreneurs to address.
Model For each of Analyses 1-3, I specify two classes of regression models. The first class of models
estimate the average intent-to-treat (ITT) effects. They are specified as follows:
E(yi|Xi) = f (α + γ ·Treati +X>i ·β )
where the functional form f (·) may refer to Ordinary Least Squares (OLS), Logistic, Negative Binomial
models etc. i is the individual indicator. y is the dependent variable of interest. Treat is a binary indicator
for being assigned to the treatment group. X is a vector of control variables reported at application, including
the demographics and location fixed effects. The demographics include sex, race, age, years of education,
marital status, disability status, whether i was born in U.S., whether i had children in household, years
of self-employment experience, whether i worked for self-employed relatives or friends, whether i was
receiving unemployment insurance benefits, preferences for risk and for autonomy,12 and family income
fixed effects.13 The coefficient of main interest, γ , captures the ITT effect.
However, the ITT effects are not equivalent to the marginal effects of training, in that not all members
of the treatment group received training and some of the control group members sought training at their
own effort (as will be shown below). To directly estimate the marginal effects, I specify the second class of
models: the local average treatment effects (LATE) models (Imbens and Angrist, 1994). They are essentially
12Following Fairlie and Holleran (2012), the individuals’ preferences for risk and for autonomy are represented by respectiveindices. The risk tolerance index is constructed from the response to two psychometric statements in the application form. Thestatements are “I am only willing to take a risk if I am sure everything will work out." and “I am not prepared to risk my savingsfor my business." The applicants assess the extent to which each statement applies to themselves, and respond with an integerscore between 1 and 5 with 1 being “very true" and 5 being “ very untrue". The two scores are normalized and averaged into onemeasure for risk tolerance. The autonomy index is contructed from the (reversely coded) response to the statement "I enjoy workingindependently." The two indices are also used in Fairlie et al. (2012).
13I cannot include industry fixed effects, becasue the GATE dataset does not contain information on the industry of the businessesstarted after the random group assignment. However, training rarely changes an entrepreneur’s choice of industry. According to anexperienced professional business trainer, Glamis Haro (introduced in Section 7), the likelihood of training causing industry changeis about "one in a hundred cases".
10

two-stage instrumental variable models:
Traini = η +θ ·Treati +X>i ·ψ +µi
yi = α + γ · T̂raini +X>i ·β + εi
where Train is the total number of hours that individual i spent in participating in business training. In
this paper, I define "receiving business training" as attending workshops or one-on-one counseling sessions
(Fairlie et al., 2012). Here I use the time spent on receiving training to represent the intensity of treatment.
The rationale is that the longer one spends on training, the more useful information she gets, and thus the
stronger the treatment effect.14 The other variables are as specified in the ITT model. At the first stage,
Train is instrumented by Treat and the control variables. Its predicted value, T̂rain, enters the second stage
as the independent variable. The exclusion restriction criterion is satisfied because the group assignment
was randomized. The coefficient γ captures the average treatment effect for entrepreneurs whose receipt of
training is sensitive to the subsidy.15
Sample The statisical analyses are conducted on three samples. The first is based on the original sample
from the last wave of survey (at month 60). It consists of each entrepreneur’ most recent business, with
"entrepreneurs" defined empirically as business owners. This is the default sample for analyses in the main
text. In the survey, business-related information was recorded only if the respondent reported that she
had business ownership experience since the previous survey (at month 18). If an individual had no such
experience since month 18, she would not entrer this sample. Therefore, the first sample is a sample of the
entrepreneurs’ most recent business since month 18.
Whereas it seems natural to employ the original sample in the survey (Benus et al., 2009), the sampling
strategy above invites two issues. One issue is that it leaves out entrepreneurs whose most recent business
closed by month 18, potentially resulting in survivorship bias. To address this issue, I run the regressions
using the second sample, which consists of the entrepreneurs’ most recent business since the random group
assignment (at month 0). In this sample, if an individual had not been a business owner since month 18 but
had been so prior to that, I include her most recent business. If an individual had not been a business owner
14Alternatively, I define Train as a binary indicator of whether the individual received any training. The LATE results arequalitatively similar, and are available upon request.
15Here I specify linear probability for the second stage of the LATE model. This allows us to directly interpret the marginal effectsfrom the coefficient estimates. Alternatively, I also specify probit model for the second stage. The results remain qualitativelysimilar, and are available upon request.
11

since the random assignment, then she would not enter this sample.
The second issue is that business owners is only a subset of the full sample. Whereas the the full
sample was randomly assigned to the groups, this is not necessarily the case for its subsets. To make causal
inference using the first two samples, we need to assume that the business owners’ unobserved attributes
are identically distributed between the two groups.16 To relax this assumption, I run the regressions using
the third sample, which is the full sample consisting of all individuals regardless of their entrepreneurial
activities. It builds on the second sample and codes the business-related variables as 0 for those without
business-ownership experience since the random assignment. The regression results using the second and
third samples are presented in the robustness checks.
3.2 Sample Overview
Table 1 summarizes the demographic profile that was reported at application. As consistent with the ran-
domized design of the experiment, both the treatment and control groups shared very similar characteristics
overall. Panel (a) summarizes the full sample at application. Females accounted for slightly less than half of
each group. Blacks and Whites respectively made up 30 and 55 percent. On average, the participants were
around 42 years of age17 and had received 14 years of education. About 35 percent of them had family in-
come of less than $25,000. And 50 percent had annual family income between $25,000 and $75,000. About
one fifth of each group was already operating their businesses at the time of application. Of these people,
the industry distribution (untabulated) of their most recent businesses exhibited much diversity. The most
popular industry was professional or technological services (accounting for about 20 percent), followed by
retail trade and construction (each with a share of about 10 percent).
In the last wave of survey (month 60), the treatment and the control groups continued to share similar
demographic configuration in the full sample (Panel (b)). Both groups also had almost identical shares of
individuals with entrepreneurial experience. Of the full sample, about half had worked on entrepreneurship
since month 18, and slightly over 60 percent had done so since the random group assignment.
In Panel (c), the individuals with recent entrepreneurial experience in both groups are demographically
16In support of this assumption, I show below that an identical share of each group had business ownership, that the businessowners were observationally very similar between the two groups, and that the inter-group difference in investment is unlikely dueto selection. See Section 8.2 for details.
17The mean difference between the two groups is small (0.7 years). The statistical significance is likely due to "type I error" ofhypothesis testing, that is, true non-difference producing a small p-value by chance.
12

similar, and spent about the same amount of time (38 hours per week) working on their businesses.18 Their
businesses also shared similar lengths of operation. Compared with the full sample, the subsample of en-
trepreneurs features slightly fewer Black and more White people, and also fewer individuals with lower
family income.
In addition, in terms of demographics, the GATE sample is similar to the nationally representative
datasets of U.S. entrepreneurs (e.g. see Table I.1 of Benus et al. (2009) for a comparison with the Panel
Study of Entrepreneurial Dynamics (PSED) dataset). In terms of business characteristics, the GATE sample
demonstrates similar distributions to those of the Survey of Business Owners (SBO) administered by the
U.S. government (e.g. see Table 5 of Fairlie et al. (2012)). This lends strength to the generalizability of the
results in this paper.
Table 2 summarizes the training received by the entrepreneurs. The treatment group received substan-
tially more training than the control group at both the extensive and intensive margins. 93 percent of the
treatment group received training since the random group assignment, compared with only 77 percent of
the control group. On average, the treatment group members received 35 hours of training, compared with
27 hours for the control group. The comparisons are similar if we break down training to workshops and
one-on-one counseling sessions.
Training seemed to have cultivated business planning. As the table shows, 75 percent of the treatment
group had developed a business plan, compared with 67 percent of the control group. This is consistent with
the findings from other entrepreneurship training programs (Hiatt and Sine, 2014).
4 Analysis 1: Financial Performance
In Analysis 1, I show that entrepreneurs improved their financial performance by taking training. This is
consistent with the prediction of both propositions. A closer scrutiny suggests that the improvement was
driven mainly by loss prevention—receiving training lowers the likelihood of incurring financial loss, but
has little impact on the likelihood of achieving "good" performance (defined below).
The performance is measured by earnings. For entrepreneurs in general, earnings are an important
source of household income and of subsequent business growth.19 Specifically, I examine three types
18The finding that both groups spent similar amount of time on entrepreneurship mitigates the concern for the Hawthorne effect.The Hawthorne effect implies that the treatment group would be more motivated and spend more time on startup activities.
19Even for those pursuing entrepreneurship mainly for subjective utility (e.g. autonomy), earnings are an important indicator of
13

of earnings: operating profit, business profit and entrepreneurial income. The business profit is defined
as the difference between average monthly revenue and expenses for the most recent business. The op-
erating profit is the business profit plus business loan interest payments (if applicable).20 21 And the
entrepreneurial income is the business profit plus monthly salary and minus personal loan interest pay-
ment. Compared with the other two earnings measures, the entrepreneurial income is the direct mea-
sure of return to entrepreneurship, as it represents the amount of net earnings from participating in en-
trepreneurship. To account for the highly skewed nature of each earnings measure, I use the natural-log
form sign(earnings) · log(|earnings|+1).
Table 3 summarizes the earnings measures. The majority (about 60 percent) of the entrepreneurs had
positive earnings, and 15-20 percent incurred financial loss. The treatment group performed better than
the control group at both the extensive and intensive margins. The patterns are consistent for all the three
measures. The treatment group also paid themselves slightly more in salary (though the difference is not
statistically significant), and took out more non-salary transfer payment.
Figure 1 demonstrates the kernal density distribution of the earnings measures. It seems that receiving
training improves earnings not by shifting the entire distribution to the right, but by substituting for some
possibility of low earnings with the possibility of higher earnings. Hence the thickness of the left tail, which
represents the likelihood of incurring financial loss, is trimmed. On the other hand, training imparts a more
limited impact on the right tail. In other words, the high-achieving entrepreneurs did not seem to benefit
much from taking training.
Table 4 presents the regression results that confirm the patterns above. In Panel (a), the OLS estimates
suggest an improvement in the mean of the earnings. Panels (b) and (c) demonstrate the effects on the tails of
the earnings distribution. Following the empirical literature that study the second moments of distributions
(e.g. Chava et al. (2013)), I define the threshold for the left (right) tail as the 25-percent (75-percent) quantile
of the sample. In this sample, the threshold for the left tail coincides with 0 for all three earnings measures.
In the regressions, the dependent variables are binary indicators of the earnings being smaller (larger) than
performance as it determines whether the businesses can stay afloat.20The loan interest payment is computed as a product of loan amount and interest rate.21Strictly speaking, the operating profit should also include tax payment. Unfortunately the GATE dataset does not contain that
information. Whereas the measure being used in the anlaysis is approximate to the actual one (with tax included) in terms of theamount, the signs of the two are exactly the same. To see this, sign(actual operating profit) = sign(earnings before tax (EBT) +business loan interest payment) = sign(net profit + tax payment + business loan interest payment) = sign(net profit + business loaninterest payment). The last equation holds because: if EBT ≤ 0, then tax payment is 0; if EBT > 0, then net profit is positivebecause it is a portion of EBT, and both sign(operating profit) and sign(net profit + business loan interest payment) are alwayspositive. This result establishes the accuracy of the statistical evidence on the likelihood of incurring operating loss (profit).
14

the threshold for the left (right) tail. The estimates from both the logistic and the two-stage instrumental
variable regressions suggest that taking training effectively reduced the likelihood of having earnings in the
left tail, but had little impact on achieving performance in the right tail. According to the LATE estimates,
an additional hour of training decreases the likelihood of financial loss by 0.6-0.8 percentage points.22 Using
linear projection, this translates into an effect of 6-8 percentage points for receiving 10 hours of training. This
effect is not trivial, considering that the sample’s likelihood of incurring financial loss is 15-20 percentage
points.
5 Analysis 2: Business Financing
In Analysis 2, I show that receiving training reduces the entrepreneurs’ capital investment in production. I
proxy capital investment by its antecedent—business financing. Financing is a valid proxy because small
businesses typically raise money to exclusively finance their production activities. The analysis shows that
taking training decreases the start-up financial capital. This is consistent with the prediction by the prudence
mechanism where entrepreneurs learned to reduce value-destroying investment.
For a general illustration, Figure 2(a) presents the kernal density of the total start-up capital. The two
groups shared a very similar left tail of the distribution, but the treatment group had a substaintially thinner
right tail. Whereas entrepreneurs with all levels of financing may be affected by the training, it was those
with a larger amount that seemed more sensitive.
Specifically in the analysis, I divide the total financial capital into debt financing and the entrepreneurs’
own-money input. The statistical evidence suggests: the entrepreneurs with more training were less likely
to borrow money for business; their own-money commitment and total start-up capital were also more
moderate, and the impacts of training were more pronounced on the larger amounts. Those with smaller
amount of start-up capital were more likely to be liquidity-constrained, and thus less likely to make excessive
investment.
I start by examining the entrepreneurs’ use of debt. Debt financing is a strong indicator of more ag-
gressive capital investment, because entrepreneurs generally would pursue external sources only after they
exhaust their own savings and external equity financing is very scarce for nascent businesses (Myers and
22In addition, I use simultaneous quantile regressions to estimate the effects of taking training on the 5, 10, 25, 75, 90 and 95percent quantiles of the earnings distribution. The results are consistent with those from the other regressions, and are availableupon request.
15

Majluf, 1984; Berger and Udell, 1998).
Table 5 shows that about a quarter of the entrepreneurs borrowed money over the history of their most
recent businesses, and that the treatment group was less likely to do so than the control group. This dif-
ference mainly manifests itself in personal loans (loans taken out in the name of the entrepreneurs). In
contrast, a smaller percentage of the entrepreneurs used business loans (loans issued to businesses) and the
percentages are virtually the same between the two groups. The lower popularity of business loans among
the entrepreneurs, as well as its insensibility to training, may possibly be attributed to the stricter criteria for
approval. The typical criteria on cash flow, collateral (e.g. patents) and financial performance pose a par-
ticularly harsh barrier for nascent entrepreneurs.23 Those applying to business loans tended to satisfy such
criteria, and were better entrepreneurs than the general, thus their financing decisions were less likely to be
affected by either the productivity or prudence mechanism.24 On the other hand, personal loans, such as
those provided by the individuals’ credit cards, families or friends, are more accessible and seldom require
close scrutiny over the entrepreneurs’ businesses before approval.
Both the logistic and two-stage instrumental variable regressions confirm the effects of receiving training
on loan use. The LATE coefficient suggests that receiving an additional hour of training decreases the
likelihood of debt financing by 0.7 percent.
Conditional on borrowing, the cost of debt financing (interest rate) does not seem to vary with the amount
of the entrepreneurs’ training. Table 6 profiles the the personal loans in the upper panel and the business
loans in the lower one. The characteristics being examined include loan amount, duration, interest rate and
sources.
For both personal and business loans, the two groups differ very little in duration and interest rate. And
the average annual interest rates are around 8 percent. This suggests that the reduced borrowing by the
treatment group was unlikely to be driven by aversion from usurious loans, for if that were the case, the
treatment group should on average have paid a lower interest rate than the control group, and the control
group’s average interest rate should have been significantly higher than its current level. The annual interest
rates for the usurious loans are typically higher than 8 percent by orders of magnitude. For example, the
23A professional business trainer with extensive experience in small business financing, Glamis Haro (introudced in Section 7),confirmed that it is difficult for nascent businesses to obtain business loans. She said, "Most banks consider only businesses that areat least three years old and profitable."
24The average operating profit (log) of the entrepreneurs with business loans is 4.392, higher than the sample average (3.188).The difference is statistically significant (t-statistic = 2.168). It is also higher than the average of the entrepreneurs that borrowedpersonal loans for business (2.859). The difference is also statistically significant (t-statistic = 2.206).
16

payday loans charge over 400 percent for annual interest rate (Bertrand and Morse, 2011).
In addition, the treatment group seemed to borrow less in loan amount than the control group. The
difference is non-trivial in magnitude, but is not statistically significant (possibly due to low statistical power
from the small number of loans.). The difference in the average amount is about 8,000 USD for personal
loans and 20,000 USD for business loans.
Echoing findings by Robb and Robinson (2012), services provided by traditional financial institutions,
such as credit cards, personal mortgage and bank loans, represent the major sources of credit. To a lesser
extent, entrepreneurs also borrowed from family, friends, government agencies and investment companies.
Both groups shared similar distributions of financing sources, except that the treatment group was more
likely to use SBA-backed loans in lieu of regular bank loans.25 This finding seems reasonable (and natural),
as SBA is a major provider of the GATE training services.
Next, I examine the entrepreneurs’ own-money commitment and the total financial capital for their most
recent businesses. For each entrepreneur, the total amount of financial capital in her business is computed as
(I+G+O+D)/p+B, where I denotes the amount of the entrepreneurs’ own-money input, G the amount of
money from grants, O the amount of non-debt capital from other sources (e.g. gifts), D the amount borrowed
from personal loan, B the amount from business loan and p the share of her equity in the business.
In Table 7, I show that the treatment group committed less of their own money and also raised less total
capital for the business.26 In Panel (a), receiving training decreases the average amount of financing. Panels
(b) and (c) confirm that the effects of training are more pronounced for the right tail of the distribution. The
estimates from logistic regressions in Panel (b) suggest that the treatment group was significantly less likely
to commit a large amount of their own money or raise a large amount of total capital, "large" being defined
as exceeding the 75-percent quantile of the sample. But the effects on the left tail (below 25-percent of the
sample) appear small, implying the smaller amounts of financing may be less sensitive to receiving training.
In Panel (c), the two-stage instrumental variable regressions estimate the marginal effects: receiving 10
additional hours of training reduces the likelihood of large-amount financing by 5 percentage points.27
25The SBA offers an array of loan-guarantee programs aimed at helping small businesses to grow and survive diasters. For a listof their programs, see http://www.sba.gov/loanprograms (accessed Oct 10, 2014).
26To account for the skewed nature of the amounts, I use theri natural-log form: log(original +1).27About 10 percent of both the treatment and the control groups had zero total financial capital and own-money input (hence the
"hump" at the left tail in Figure 2(a)). Their revenue distribution is similar to that of the others. As only fewer than 10 entrepreneursreceived their business as heritage or gift, the null capital raises concern about mis-reporting (perhaps due to memory decay, asstart-up capital was mostly committed at the birth of the businesses). The mis-reporting is likely to bias the estimated effect towards0 as the actual financing is likely to be larger for the control group. Therefore, the regressions in Table 7 exclude those null-capitalbusinesses.
17

6 Analysis 3: Production Scale and Its Growth
In Analysis 3, I proxy the capital investment in production with its consequence—the production scale and
its growth, and show that receiving training decreases both. The production scale increases with the amount
of capital investment. In the analysis, the scale is measured by the number of employees in the business
(excluding the entrepreneurs themselves). And the growth is defined by the increase in their employment
size since the previous survey. This increase reflects the size of the incremental capital invested in produc-
tion, as well as the amount of new employment created. The results from this analysis support the prudence
mechanism.
Figure 2(b) compares the distribution of the employment size between the treatment and the control
groups. The quantile-quantile plot suggests that the treatment group had fewer employees, and the difference
is driven mainly by the control group having a fatter right tail.28 This is consistent with the aforementioned
findings on the financing scale, and further supports the prudence mechanism where entrepreneurs learned
to reduce their overconfident investments.
The statistical evidence is presented in Table 8. In Panel (a), the entrepreneurs in the treatment group are
shown to have had a lower average employment size than those in the control group. Receiving training also
leads to a more moderate increase in employment size. Moverover, the differential changes in the employ-
ment size seems to be driven primarily by the growth of continuing businesses than the new entrepreneurial
entries. A minority (about 25 percent) of the entrepreneurs in both groups were new, i.e., reporting no
entrepreneurial experience in the 2nd survey. Those continuing businesses in both groups had similar and
small employment sizes in the second survey. This is likely due to their very young age back then (median
age equal to 18 months at the second survey date). At that stage, most entrepreneurs either did not have a
plan for expansion, or had not raised sufficient money even if they already developed an expansion plan.
Panels (b) and (c) present the regression results. The results confirm the negative effects of receiving
training on the production scale and its growth. To account for the discrete, non-negative and over-dispersed
nature of the employment size, poisson and negative binomial models are fitted.29 The two-stage instrumen-
28To see this, if two distributions were identical, then all the dots would reside on the 45-degree line. In this plot, however, thedots on the left are on or closely below that line, and the dots on the right are below that line by a wider margin. This implies thatfor a given small percentage (e.g. 10 percent), the corresponding quantile in the treatment group’s distribution is similar to the samequantile in the control group’s; for a given large percentage (e.g. 90 percent), the corresponding quantile in the treatment group’sdistribution is significantly smaller than the same quantile in the control group’s. The same pattern appears in a cumulative densitygraph (available upon request). The quantile-quantile plot is displayed here because a large portion of the entrepreneurs did nothave employees, making the comparison less clear visually in a density graph.
29In addition, I also run an OLS regression and obtain qualitatively similar results. The coefficient estimate for the treatment
18

tal variable models suggest that receiving an additional 10 hours of training decreases the production scale
and slows its growth by about one employee.
7 Analysis 4: Opinion-Based Evidence
In Analysis 4, I present some direct evidence on the primary mechanism—the opinions of the trainees and
the trainers. The opinions support the prudence mechanism—the individuals reported "refining business
ideas" as a major way that training helped them, and the trainers reported "unrealistic expectations", "lack
of focus" and "underestimating costs" as common issues that challenged entrepreneurs.
To elaborate, the evidence is two-fold. First, in the GATE sample, the individuals that received training
were asked to rate how much training helped with each of 13 issues. For each issue, the question in the
survey is "I am going to read a list of ways self-employment services you received in the past 12 months
may have helped you. Please tell me whether self-employment services helped you a lot, somewhat, or not at
all in [issue]." As shown in Table 9, I classify the 13 issues into 3 categories. Category 1 relates to business
planning and includes 3 issues "developing a business plan", "deciding whether to pursue self-employment"
and "refining business idea". Category 2 relates to specific functions in business operation and includes 8
issues: "applying for loans", "dealing with credit issues", "developing marketing strategy", "dealing with
legal issues" and "dealing with accounting issues" etc. Category 3 includes the remaining 2 issues that do
not fall under the previous 2 categories: "networking" and "providing psychological support". For each
issue, the individuals’ response is recorded on a Likert scale with 3 values: "a lot", "somewhat" and "not at
all". Table 9 presents the distribution over these 3 values.
The individuals were substantially more (less) likely to report training helping them "a lot" ("not at all")
with the business planning issues than with the functions in business operation. This echoes the finding
that the entrepreneurs with more training were more likely to have written business plans. In particular,
37 percent of the individuals reported training helping "a lot" with "refining business idea", compared with
around 20 percent or less for the skills for business operation; and 25 percent of the individuals reported
training helping "not at all" with "refining business idea", compared with 34-75 percent for the skills for
business operation.30
In addition, training was most helpful with "refining business idea" and "networking". Combining this
dummy is -0.906 with standard deviation of 0.355.30These differences are statistically significant. Results of the F-tests are available upon request.
19

with the findings from previous analyses, the refining and networking seemed to have revised down the
entrepreneurs’ investment. This is consistent with the prudence mechanism where knowledge gained from
the trainers or peers mitigates overconfidence.
Second, I also interviewed two business trainers at a small business development center in New York
City. The center is one of the many operated by the SBA that offer training services similar to those in
GATE. Part of the GATE training was conducted in local small business development centers.
The two trainers were intervewed separately. The first trainer, Lawrence King, has over twenty years’
experience in advising entrepreneurs. When asked what were the common issues addressed by the coun-
seling sessions, he talked about two issues. The first is that nascent entrepreneurs tend to hold unrealistic
expectations:
"Many people are aggressive with their financial analysis. Even at the start, some expect to
launch their businesses on a national basis and make a million dollars. I often have to be
blunt with them, manage their expectations and tell them to cut back on the fancy chairs and
refrigerators."
The second issue is that nascent entrepreneurs often lack focus:
"Seventy-five percent of people have no clue, no plan and no consideration of cost. In one case,
the person wanted to blend floral shop, ice-cream and locksmith into one business . . . Many
just have not thought about the details, need to put a dollar sign on their thinking. I’m here to
help them get a long-term view."
The second trainer, Glamis Haro, specializes in business plan development, credit management and mi-
croenterprise financing. She commented on the entrepreneurs’ underestimation of costs:
"They’re often confused about the obligations as employers, such as employment tax obliga-
tions, medical insurance and others according to the regulations. A lot of business owners don’t
know they have to provide those things for their employees."
In addition, she provided more details on how training helps with entrepreneurs’ forecasting:
"They don’t know the importance of a cash flow statement evaluation and what it means for their
business. Money comes in, money goes . . . We ask them to bring their cash flow numbers,
20

then we’ll run the projection using our model. We also check the industry statistics. Sometimes
they get eager when forecasting their revenue, and over project their profits."
8 Robustness Checks
In this section, I conduct three sets of robustness checks on the empirical results presented above. First,
I check that the results are not driven by the heterogeneous attrition rates between the treatment and the
control groups. Second, I show that the results are robust to alternative sampling strategies. And third,
additional statistical analyses suggest that the empirical findings are unlikely driven by improved production
efficiency.
8.1 Heterogeneous Attrition
The treatment group was more likely to complete the survey than the control group, as evidenced by the
number of observations in each group. This raises the concern that the differential attrition rates may be
potentially driven by unobserved characterisitics, such as interest in entrepreneurship, that would also affect
the indivduals’ behavior and performance. This issue may potentially affect the consistency of the regression
estimators. To address this, I use weighted regressions, where the sample weights are constructed in a way
that compensates for the absence of the attriters (Fairlie et al., 2012). A logistic model with only the control
variables (specified in Section 3.1) on the right hand side is estimated to predict the likelihood of response.
The predicted probability is then inversed to be used as sample weights. Then the regressions in Analyses
1-3 are re-run with the sample weights. As Table 10 summarizes, the estimates remain very similar to the
original ones. This suggests that heterogeneous attrition is unlikely a driver of the empirical findings.
8.2 Alternative Sampling Strategy
I run the regressions in Analyses 1-3 using the two alternative samples as defined in Section 3.1. As summa-
rized in Tables 11 and 12, the results remain similar to the ones using the default sample. The results based
on the full sample suggest that by taking training, the average individual with a business idea can expect to
decrease investment but improve entrepreneurial performance. And her chances of entering business own-
ership would not be changed by training (Table 1). In addition, the estimates using the Heckman selection
model suggest that the effects hold if all the individuals in the full sample had been business owners.
21
Analyses based on the three samples consistently suggest the causal effect: receiving training produces
smaller but better performing businesses. The results also suggest that this causal effect is due to mitigat-
ing overconfidence conditional on business ownership, rather than training selecting the less overconfident
individuals into entrepreneurship. The rationale is three-fold. First, both groups had almost identical rate
of business ownership. If receiving training screens out the very overconfident, then we should observe a
lower entry rate for the treatment group (Lerner and Malmendier, 2013). Second, business owners in both
groups were observationally very similar. As overconfidence is related to demographics (Barber and Odean,
2001), the selection would have resulted in inter-group difference. Third, if the effect had been driven by
selection, then the two groups should differ at both tails of the distributions in Figure 2. However, we only
observe difference at the right tail. This is consistent with the prudence mechanism: compared with samller
investments, the larger ones are more likely to be driven by overconfidence, and thus are more likely to be
reduced by training.
8.3 Alternative Explanation: Efficiency
A possible alternative explanation for the empirical results would be that receiving training improves pro-
duction efficiency, thereby motivating entrepreneurs to scale down the production factors for cost reduction.
However, I show that this explanation is unlikely to drive the empirical results. The rationale is two-fold.
First, for nascent and growing businesses, improved productivity opens up the opportunity to capture
greater market shares and to reap higher profit, making it unlikely for entrepreneurs to shrink their production
scale. Thus the substitution between productivity and production factors does not seem intuitive, as it is
inconsistent with the entrepreneurs’ financial incentive. Since the vast majority of the GATE sample cannot
be considered wealthy and thus are likely to rely on entrepreneurship as a source of income,31 it seems
reasonable to expect that they had incentive to gain financially. In addition, by applying to participate in the
training program, they revealed their motivation to enhance their entrepreneurial performance.
Second, the statistical evidence in Table 14 suggests that receiving training had little impact on the
production efficiency of the GATE entrepreneurs. The efficiency is measured by the ratio of average monthly
revenue over the total number of workers (including the entrepreneurs).32 In Panel (a), OLS regressions
31About 80 percent of the sample had annual family income of $75,000 or less. See Table 1.32For measuring efficiency, revenue is chosen over profit for two reasons. First, productivity is commonly measured as the ratio
of revenue over labor units in the literature (e.g. Griliches and Regev (1995)). Second, profit per worker is not consistent withefficiency when the profit is negative. For a given amount of negative profit, a larger number of workers would not imply higherefficiency, but profit per worker would increase with the number for workers. In addition, the results are qualitatively similar when I
22

show that receiving training does not significantly affect the mean of the efficiency; And Panel (b) shows
that receiving training also does not alter the likelihood of being in either the left or right tail of the efficiency
distribution.
The findings confirm that the GATE sample could not significantly improve their production efficiency
by taking training. But this does not suggest that entrepreneurs do not need to improve efficiency, or imply
that all the practices taught in the training sessions are of limited value. Rather, it means that entrepreneurs
cannot effectively learn to increase efficiency by taking training. The reason for that needs further investiga-
tion. Whereas it is possible that some skills taught by the training may not be relevant, it is also possible that
the trainees could not effectively absorb or apply what was taught (Drexler et al., 2010). More fine-grained
data are needed to distinguish the two.
9 Conclusion and Implications
Entrepreneurship can be learned, and it would be most useful for entrepreneurs to learn skills or knowl-
edge that mitigates overconfidence and foster prudence. Using data from a randomized field experiement,
I show that by participating in business training, entrepreneurs reduce their value-destorying investment.
Thus, learning reduces their business financing, production scale and business growth but boosts financial
performance.
This paper is among the first to focus on the mechanism whereby entrepreneurs benefit from learning. It
remains to be studied whether the insights from this paper can be generalized beyond its empirical context.
The context here is characterized by two dimensions. The first is the type of learning. Although the content
and format of the training in GATE are common in the U.S.,33 future work may extend our understandings
by exploring other forms of learning, such as other training programs, observational learning, experiential
learning and so on (Tucker and Zhang, 2011; Nadler et al., 2003; Sun et al., 2012; Waguespack and Flem-
ing, 2009). The second dimension is the type of entrepreneurs. The GATE sample consists mostly of the
"main-street"-type of entrepreneurs, who own and manage brick-and-mortar micro-enterprises to provide
for their families (Chandy and Narasimhan, 2011). Another focus in the literature is the "technology"-type
of entrepreneurs (start-up founders in the high-technology industry). To the extent that the cognitive limi-
measure efficiency using the total factor productivity (TFP). TFP is the residual term from regressing revenue (log) on total financialcapital (log), number of workers (log) and the control variables specified in Section 3.1.
33For example, the SBA provides similar training through its 1,000 small business development centers in the U.S. Seehttp://www.asbdc-us.org/About_Us/aboutus.html (accessed Oct 8, 2014).
23

tations are widely documented in the population of broadly-defined entrepreneurs, the "technology"-type of
entrepreneurs may also benefit from prudence.34
Besides the strategic implication that individual entrepreneurs should spend more effort in refining their
business ideas, this paper also has policy implications. It shows that entrepreneurs’ demand for resources is
a function of their cognitive ability. This adds a demand-side perspective to the discussion for addressing en-
trepreneurs’ resource constraints (Bruhn et al., 2010). Resource constraints, particularly in terms of financial
assets, remains a critical barrier to entrepreneurship in many economies (e.g. Evans and Jovanovic (1989)).
Previous research and policies largely focus on the supply side of the issue. Governments have committed
billions of dollars to facilitate lending to small businesses, on the premise that a more entrepreneur-friendly
financial system can stimulate innovation and economic growth (e.g. King and Levine (1993); Rajan and
Zingales (1998)).35 This paper adds that whether more generous supply translates into better performance
depends on entrepreneurs’ cognitive ability. Whereas an increase in resource supply facilitates investing in
viable ideas, it also aggravates the hazards of value-destroying investment due to the individuals’ inaccurate
assessment (Jensen et al., 2014). Policies aimed to address the issue of resource constraints may mitigate
the hazards through integrating training or counseling services.36
34In addition, it is possible that the insights from this paper also apply to managers at larger organizations. This possibilityremains to be empirically verified, as managers at larger organizations (e.g. corporate executives) can use more organizationalroutines or professional consultancy in their decision-making process.
35For instance, the U.S. Jumpstart Our Business Startups (JOBS) Act was recently signed into law to provide over 12 billiondollars in loan support for small businesses (U.S. Small Business Administration, 2010).
36This echoes the view in Fafchamps et al. (2011) that the provision of financial capital alone is not enough to boost en-trepreneurial success. Note that by highlighting the benefits of training or counseling services, I am not advocating exact replicationof the GATE program. The content and the scale of implementation should be subject to more detailed cost-benefit analysis.
24

Appendix I: Proof of Propositions 1 and 2
Proposition 1. (the Productivity Mechanism): ∂ [πA(IA)]/∂m > 0 and ∂ IA/∂m > 0.
Proof. Define function F(·)≡ ∂πA(·)/∂ I. Then, the first-order condition for the profit-optimization problem
requires that
F(IA) =mα
1+ rIα−1A −1−C′(IA−W ) · I(IA−W ) = 0
whereI(·) is the index function. By implicit function theorem,
∂ IA
∂m=−∂F(IA)/∂m
∂F(IA)/∂ I> 0.
And,
∂ [πA(IA)]
∂m=
IαA
1+ r+F(IA)
∂ IA
∂m> 0.
Proposition 2. (the Prudence Mechanism): ∂ [πA(IP)]/∂τ < 0 and ∂ IP/∂τ > 0.
Proof. Define functionG(·)≡ ∂πP(·)/∂ I. Then, the first-order condition for the profit-optimization problem
requires that
G(IP) = mα1+ τ
1+ rIα−1P −1−C′(IP−W ) · I(IP−W ) = 0
whereI(·) is the index function. By implicit function theorem,
∂ IP
∂τ=−∂G(IP)/∂τ
∂G(IP)/∂ I> 0.
And,
25

∂ [πA(IP)]
∂τ= [G(IP)−
mτIα
1+ r]∂ IP
∂τ< 0.
26

Appendix II: Comparison with Previous Studies Using the GATE Sample
This paper builds on four studies that have analyzed the GATE sample. Two of them focus on the deter-
minants of entrepreneurs’ entry decision, and the others are intended as program evaluations from a public
policy perspective. Specifically, Michaelides and Benus (2012) find that receiving training motivates the
unemployed to enter into entrepreneurship. And Fairlie and Holleran (2012) further show moderation ef-
fects by the individuals’ attributes. Extending the analysis to a broader range of outcome dimensions, Benus
et al. (2009) and Fairlie et al. (2012) find little impact except that GATE is effective in inducing entry by the
unemployed in the very short term (within months after the random assignment). Benus et al. conclude that
"GATE had no impact on the earnings of the self-employed." (Pp. vi of "Executive Summary"). Fairelie et
al. conclude that "Our estimates of average treatment effects across the entire sample suggest that GATE
had limited impacts on ultimate outcomes." (Pp. 3).
Those four studies have greatly helped me to understand the experiment and the sample. However, this
paper differs from the previous studies in two notable ways.
First, in terms of the purpose, this paper seeks to understand how individual entrepreneurs may improve
their businesses through learning. To serve this purpose, I investigate not only the effect of training on the
individuals’ performance, but also the mechanisms whereby that effect channels. The focus of this paper is
not on understanding entrepreneurial entry, nor do I intend to provide a comprehensive cost-benefit analysis
of the GATE program. And my investigation into the mechanisms, both theoretical and empirical, is not in
any of those previous studies.
Second, in terms of the empirics, I present new results related to entrepreneurs’ performance, financing
and employment that contrast with the non-findings in Benus et al. (2009) and Fairlie et al. (2012). Such
difference is due to different empirical approaches, as elaborated below.
Specifically, this paper differs from Benus et al. (2009) mainly in the variables being examined. Benus
et al. (2009) measure financial performance by the ratio of revenue over expenses (Pp. 77), and the count of
businesses in each size category (Pp. 108-109). These analyese do not yield statistically significant results .
They also examine the financing variables up till the second wave of survey (month 18) (Pp. 87). In contrast,
this paper employs more conventional measures, computing net profit as revenue minus expenses and using
the raw number of employees. I also investigate the financing of each individual’s most recent business,
with the majority of the businesses operating after the second wave of survey.
27

This paper differs from Fairlie et al. (2012) mainly in two ways. The first is the sampling strategy. Fairlie
et al. focus on the surviving businesses on the survey date. In their sample, the business-related variables are
coded as 0 for closed businesses. This may potentially cause the issue of survivorship bias which eclipses
the effects. To overcome this issue, this paper uses the individuals’ the most recent business (surviving or
closed). I also show that the results hold in both the full sample and the samples conditional on business
ownership. Second, the variables and models used in the analyses are also largely different: (1) Instead of
analyzing the raw business profit, I take log of all the earnings measures to account for their skewed nature;
(2) Fairlie et al. do not examine the entrepreneurs’ use of personal loans and own-money financing; (3) In
studying the effect on employment size, besides OLS, I also use negative binomial regressions to account
for the discrete, non-negative and over-dispersed nature.
Finally, in addition to examining the effects on the variables’ mean, as in Benus et al. (2009) and Fairlie
et al. (2012), I also study the impact of training on the distribution of the variables. This provides a more
fine-grained understanding of the impact. For example, examining the tails of the earnings distribution in
Analysis 1 suggests that the performance-boosting effect of receiving training mainly lies in loss prevention.
28

References
Arabsheibani, G., D. de Meza, J. Maloney, and B. Pearson (2000). And a vision appeared unto them of a
great profit: evidence of self-deception among the self-employed. Economics Letters 67(1), 35 – 41.
Åstebro, T., H. Herz, R. Nanda, and R. A. Weber (2014). Seeking the roots of entrepreneurship: Insights
from behavioral economics. The Journal of Economic Perspectives 28(3), 49–69.
Barber, B. M. and T. Odean (2001). Boys will be boys: Gender, overconfidence, and common stock invest-
ment. Quarterly journal of Economics, 261–292.
Barnes, J. H. (1984). Cognitive biases and their impact on strategic planning. Strategic Management
Journal 5(2), 129–137.
Baron, R. A. (1998). Cognitive mechanisms in entrepreneurship: Why and when enterpreneurs think differ-
ently than other people. Journal of Business Venturing 13(4), 275 – 294.
Ben-David, I., J. R. Graham, and C. R. Harvey (2013). Managerial miscalibration. The Quarterly Journal
of Economics.
Benus, J., T. Shen, S. Zhang, M. Chan, and B. Hansen (2009). Growing america through entrepreneurship:
Final evaluation of project gate. Evaluation report, IMPAQ.
Berger, A. N. and G. F. Udell (1998). The economics of small business finance: The roles of private equity
and debt markets in the financial growth cycle. Journal of Banking and Finance 22, 613 – 673.
Bertrand, M. and A. Morse (2011). Information disclosure, cognitive biases, and payday borrowing. The
Journal of Finance 66(6), 1865–1893.
Bloom, N., B. Eifert, A. Mahajan, D. McKenzie, and J. Roberts (2013). Does management matter? evidence
from india. The Quarterly Journal of Economics 128(1), 1–51.
Boorstin, J. (2005, March 21). The best advice i ever got. Fortune Magazine VOL. 151(NO. 6).
Bruhn, M., D. Karlan, and A. Schoar (2010). What capital is missing in developing countries? The American
Economic Review Papers and Proceedings 100(2), pp. 629–633.
29

Busenitz, L. W. and J. B. Barney (1997). Differences between entrepreneurs and managers in large orga-
nizations: Biases and heuristics in strategic decision-making. Journal of Business Venturing 12(1), 9 –
30.
Camerer, C. and D. Lovallo (1999). Overconfidence and excess entry: An experimental approach. The
American Economic Review 89(1), pp. 306–318.
Carter, N. M., W. B. Gartner, and P. D. Reynolds (1996). Exploring start-up event sequences. Journal of
business venturing 11(3), 151–166.
Chandy, R. and O. Narasimhan (2011). How micro-entrepreneurs could change the world. Business Strategy
Review 22(1), 52–55.
Chava, S., A. Oettl, A. Subramanian, and K. V. Subramanian (2013). Banking deregulation and innovation.
Journal of Financial Economics 109(3), 759 – 774.
Cooper, A. C., C. Y. Woo, and W. C. Dunkelberg (1988). Entrepreneurs’ perceived chances for success.
Journal of Business Venturing 3(2), 97 – 108.
de Meza, D. and C. Southey (1996). The borrower’s curse: Optimism, finance and entrepreneurship. The
Economic Journal 106(435), pp. 375–386.
Delmar, F. and S. Shane (2003). Does business planning facilitate the development of new ventures? Strate-
gic Management Journal 24(12), 1165–1185.
Drexler, A., G. Fischer, and A. Schoar (2010). Keeping it simple: Financial literacy and rules of thumb.
Cepr discussion paper.
Drucker, P. F. (1985). Innovation and Entrepreneurship. New York: Harper & Row.
Evans, D. S. and B. Jovanovic (1989). An estimated model of entrepreneurial choice under liquidity con-
straints. Journal of Political Economy 97(4), pp. 808–827.
Fafchamps, M., D. McKenzie, S. R. Quinn, and C. Woodruff (2011, July). When is capital enough to get
female microenterprises growing? evidence from a randomized experiment in ghana. Working Paper
17207, National Bureau of Economic Research.
30

Fairlie, R. W. and W. Holleran (2012). Entrepreneurship training, risk aversion and other personality traits:
Evidence from a random experiment. Journal of Economic Psychology 33(2), 366 – 378. Personality and
Entrepreneurship.
Fairlie, R. W., D. Karlan, and J. Zinman (2012, February). Behind the gate experiment: Evidence on effects
of and rationales for subsidized entrepreneurship training. Working Paper 17804, National Bureau of
Economic Research.
Filatotchev, I., X. Liu, T. Buck, and M. Wright (2009). The export orientation and export performance of
high-technology smes in emerging markets: The effects of knowledge transfer by returnee entrepreneurs.
Journal of International Business Studies 40(6), pp. 1005–1021.
Griliches, Z. and H. Regev (1995). Firm productivity in israeli industry 1979-1988. Journal of Economet-
rics 65(1), 175 – 203.
Hayward, M. L., D. A. Shepherd, and D. Griffin (2006). A hubris theory of entrepreneurship. Management
Science 52(2), 160–172.
Hiatt, S. R. and W. D. Sine (2014). Clear and present danger: Planning and new venture survival amid
political and civil violence. Strategic Management Journal 35(5), 773–785.
Hmieleski, K. M. and R. A. Baron (2009). Entrepreneurs’ optimism and new venture performance: A social
cognitive perspective. Academy of management Journal 52(3), 473–488.
Ichniowski, C. and K. Shaw (1999). The effects of human resource management systems on economic
performance: An international comparison of u.s. and japanese plants. Management Science 45(5), 704–
721.
Imbens, G. W. and J. D. Angrist (1994). Identification and estimation of local average treatment effects.
Econometrica 62(2), pp. 467–475.
Jensen, T., S. Leth-Petersen, and R. Nanda (2014). Housing collateral, credit constraints and entrepreneur-
ship - evidence from a mortgage reform.
Jovanovic, B. (1982). Selection and the evolution of industry. Econometrica: Journal of the Econometric
Society, 649–670.
31

King, R. G. and R. Levine (1993). Finance, entrepreneurship and growth. Journal of Monetary Eco-
nomics 32(3), 513 – 542.
Koellinger, P., M. Minniti, and C. Schade (2007). I think i can, i think i can: Overconfidence and en-
trepreneurial behavior. Journal of Economic Psychology 28(4), 502 – 527.
Kogut, B. and U. Zander (1992). Knowledge of the firm, combinative capabilities, and the replication of
technology. Organization Science 3(3), pp. 383–397.
Lerner, J. and U. Malmendier (2013). With a little help from my (random) friends: Success and failure in
post-business school entrepreneurship. Review of Financial Studies.
Lucas, Robert E., J. (1978). On the size distribution of business firms. The Bell Journal of Economics 9(2),
pp. 508–523.
Mahajan, J. (1992). The overconfidence effect in marketing management predictions. Journal of Marketing
Research (JMR) 29(3).
Malmendier, U. and G. Tate (2005). Ceo overconfidence and corporate investment. The Journal of Fi-
nance 60(6), 2661–2700.
McKenzie, D. and C. Woodruff (2012). What are we learning from business training and entrepreneurship
evaluations around the developing world? Iza discussion paper.
Michaelides, M. and J. Benus (2012). Are self-employment training programs effective? evidence from
project gate. Labour Economics 19(5), 695 – 705. Special Section on: Price, Wage and Employment
Adjustments in 2007-2008 and Some Inferences for the Current European Crisis.
Myers, S. C. and N. S. Majluf (1984). Corporate financing and investment decisions when firms have
information that investors do not have. Journal of financial economics 13(2), 187–221.
Nadler, J., L. Thompson, and L. V. Boven (2003). Learning negotiation skills: Four models of knowledge
creation and transfer. Management Science 49(4), 529–540.
Nelson, R. R. and S. G. Winter (1982). An Evolutionary Theory of Economic Change. Cambridge, MA:
Harvard University Press.
32

Pickton, D. W. and S. Wright (1998). What’s swot in strategic analysis? Strategic change 7(2), 101–109.
Pirinsky, C. (2013). Confidence and economic attitudes. Journal of Economic Behavior & Organiza-
tion 91(0), 139 – 158.
Rajan, R. G. and L. Zingales (1998). Financial dependence and growth. The American Economic Re-
view 88(3), pp. 559–586.
Robb, A. M. and D. T. Robinson (2012). The capital structure decisions of new firms. Review of Financial
Studies.
Sandri, D. (2014). Growth and capital flows with risky entrepreneurship. American Economic Journal:
Macroeconomics 6(3), 102–23.
Simon, H. A. (1955). A behavioral model of rational choice. The Quarterly Journal of Economics 69(1),
pp. 99–118.
Simon, H. A. (1972). Theories of bounded rationality. Decision and organization 1, 161–176.
Simon, M. and S. M. Houghton (2002). The relationship among biases, misperceptions, and the introduction
of pioneering products: Examining differences in venture decision contexts. Entrepreneurship Theory and
Practice 27(2), 105–124.
Simon, M. and S. M. Houghton (2003). The relationship between overconfidence and the introduction of
risky products: Evidence from a field study. Academy of Management Journal 46(2), 139–149.
Slovic, P., B. Fischhoff, and S. Lichtenstein (1977). Behavioral decision theory. Annual review of psychol-
ogy 28(1), 1–39.
Stein, J. C. (2003). Chapter 2 agency, information and corporate investment. In M. H. G.M. Constantinides
and R. Stulz (Eds.), Corporate Finance, Volume 1, Part A of Handbook of the Economics of Finance, pp.
111 – 165. Elsevier.
Sun, M., X. M. Zhang, and F. Zhu (2012). To belong or to be different? evidence from a large-scale field
experiment in china. Technical report.
Tucker, C. and J. Zhang (2011). How does popularity information affect choices? a field experiment.
Management Science 57(5), 828–842.
33

Tversky, A. and D. Kahneman (1974). Judgment under uncertainty: Heuristics and biases. Sci-
ence 185(4157), 1124–1131.
U.S. Small Business Administration (2010). Small business jobs act of 2010.
Waguespack, D. M. and L. Fleming (2009). Scanning the commons? evidence on the benefits to startups
participating in open standards development. Management Science 55(2), 210–223.
Wu, B. and A. M. Knott (2006). Entrepreneurial risk and market entry. Management Science 52(9), 1315–
1330.
34

Figure 1: Treatment Group Had Better Financial Performance
35

Figure 2: Receiving Training Leads to Smaller Financing and Production Scale
(a)
(b)
36

Table 1: Participants’ Characteristics Reported at Application
(a) Full Sample at Application
Treatment Control F-test
mean st. dev N mean st. dev N p-value
Binary Indicators:
Female 0.472 0.499 2094 0.457 0.498 2103 0.319
Black 0.305 0.460 2094 0.306 0.461 2102 0.905
White 0.552 0.497 2094 0.555 0.497 2102 0.814
Family Income < $25,000 0.363 0.481 2080 0.348 0.477 2090 0.323
Family Income $25,000-75,000 0.506 0.500 2080 0.510 0.500 2090 0.806
Business Owner 0.183 0.387 2046 0.195 0.396 2045 0.334
Continuous Measures:
Age (Years) 42.076 10.197 2092 42.772 10.211 2101 0.028
Education (Years) 14.389 2.208 2094 14.515 2.240 2103 0.067
(b) Full Sample in Last Survey (Month 60)
Treatment Control F-test
mean st. dev N mean st. dev N p-value
Binary Indicators:
Female 0.481 0.500 1274 0.471 0.499 1176 0.618
Black 0.253 0.435 1274 0.260 0.439 1175 0.699
White 0.625 0.484 1274 0.628 0.484 1175 0.867
Family Income < $25,000 0.310 0.463 1268 0.320 0.467 1169 0.596
Family Income $25,000-75,000 0.521 0.500 1268 0.517 0.500 1169 0.850
Worked on Entrepreneurship
Since Month 18 0.489 0.500 1274 0.491 0.500 1176 0.902
Since Random Assignment 0.639 0.480 1274 0.628 0.484 1176 0.559
Continuous Measures:
Age (Years) 43.912 9.906 1272 44.157 9.980 1175 0.544
Education (Years) 14.751 2.153 1274 14.777 2.191 1176 0.767
(c) Sample with Business Ownership since Month 18
Treatment Control F-test
mean st. dev N mean st. dev N p-value
Binary Indicators:
Female 0.443 0.497 623 0.472 0.500 578 0.309
Black 0.205 0.404 623 0.215 0.411 578 0.700
White 0.669 0.471 623 0.680 0.467 578 0.696
Family Income < $25,000 0.266 0.442 620 0.297 0.458 575 0.230
Family Income $25,000-75,000 0.526 0.500 620 0.508 0.500 575 0.535
Continuous Measures:
Age (Years) 43.743 9.829 622 44.163 9.781 578 0.459
Education (Years) 15.056 2.045 623 14.993 2.115 578 0.599
Weekly Hours on Entrepreneurship 37.755 25.682 609 37.977 27.188 568 0.886
Business Age (Years) 61.491 62.926 570 61.086 60.915 509 0.915
37

Table 2: Training Received by Entrepreneurs since Random Assigment
Treatment Control F-test
mean st. dev N mean st. dev N p-value
Binary Indicators:
Received Any Training 0.929 0.256 623 0.765 0.425 578 0.000
Attended Any Workshop 0.831 0.375 623 0.696 0.461 578 0.000
Attended Any Counseling 0.709 0.454 623 0.443 0.497 578 0.000
Developed Any Business Plan 0.751 0.433 623 0.671 0.470 578 0.002
Number of Hours Spent on:
Training 35.136 48.242 623 26.692 42.590 578 0.001
Workshop 30.914 45.541 623 23.640 40.164 578 0.004
Counseling 4.222 9.348 623 3.051 6.945 578 0.015
38

Table 3: Financial Performance: Treatment vs. Control Group
Treatment Control F-test
mean st. dev N mean st. dev N p-value
Binary Indicators:
Had Positive Operating Profit 0.648 0.477 520 0.594 0.492 475 0.077
Had Positive Business Profit 0.633 0.483 520 0.568 0.496 475 0.039
Had Positive Entrepreneurial Income 0.685 0.465 520 0.619 0.486 475 0.030
Had Negative Operating Profit 0.144 0.352 520 0.200 0.400 475 0.020
Had Negative Business Profit 0.150 0.357 520 0.204 0.404 475 0.025
Had Negative Entrepreneurial Income 0.162 0.368 520 0.240 0.428 475 0.002
Amount (Log $):
Monthly Business Revenue 6.914 2.662 544 6.741 2.866 502 0.314
Monthly Business Expenses 6.588 2.451 548 6.665 2.369 495 0.609
Monthly Operating Profit 3.492 4.983 520 2.854 5.321 475 0.052
Monthly Business Profit 3.370 5.033 520 2.681 5.341 475 0.037
Monthly Entrepreneurial Income 3.828 5.085 520 2.983 5.644 475 0.013
Monthly Salary for Self and Family 1.821 3.228 590 1.599 3.126 555 0.239
Total Non-Salary Transfer 1.589 3.378 615 1.203 2.961 576 0.037
Notes:
[i] Net profit equals business revenue minus expenses.
[ii] Operating profit equals net profit plus business loan interest payments (if any).
[iii] Entrepreneurial income equals net profit plus salary and minus personal loan interest payment.
39

Table 4: The Improvement on Earnings Concentrates on Loss Prevention
(a) OLS Regressions
Operating Profit Business Profit Entrepreneurial Income
(1) (2) (3)
Treatment 0.617* 0.657* 0.728**
(0.341) (0.344) (0.352)
Log Likelihood -2836.940 -2845.234 -2869.701
N 935 935 935
(b) Logistic Regressions
Operating Profit Business Profit Entrepreneurial Income
< 25% Sample > 75% Sample < 25% Sample > 75% Sample < 25% Sample > 75% Sample
(Quantile = 0) (Quantile = 1415) (Quantile = 0) (Quantile = 1300) (Quantile = 0) (Quantile = 2000)
(1) (2) (3) (4) (5) (6)
Treatment -0.472*** 0.090 -0.439** 0.064 -0.565*** -0.124
(0.181) (0.160) (0.179) (0.160) (0.173) (0.160)
Log Likelihood -403.088 -491.749 -411.421 -494.597 -434.464 -491.287
N 935 932 935 932 935 935
(c) Two-Stage Least Squares Instrumental Variable Regressions
Operating Profit Business Profit Entrepreneurial Income
< 25% Sample > 75% Sample < 25% Sample > 75% Sample < 25% Sample > 75% Sample
(Quantile = 0) (Quantile = 1415) (Quantile = 0) (Quantile = 1300) (Quantile = 0) (Quantile = 2000)
(1) (2) (3) (4) (5) (6)
Second Stage:
Hours of Training -0.006** 0.002 -0.006* 0.001 -0.008** -0.002
(0.003) (0.003) (0.003) (0.003) (0.004) (0.003)
First Stage:
Treatment 9.920*** 9.920*** 9.920*** 9.920*** 9.920*** 9.920***
(2.980) (2.980) (2.980) (2.980) (2.980) (2.980)
F-stat (Treatment = 0) 11.084 11.084 11.084 11.084 11.084 11.084
R-squared 0.065 0.065 0.065 0.065 0.065 0.065
N 935 935 935 935 935 935
Notes:
[i] Heteroskedasticity-consistent standard errors are in parentheses.
[ii] * p < 0.10, ** p < 0.05, *** p < 0.01.
[iii] All regressions control for demographics and site fixed effects. See Section 3.1 for details.
40

Table 5: Receiving Training Reduces the Likelihood of Debt Financing
(a) Descriptive Statistics
Treatment Control F-test
mean st. dev N mean st. dev N p-value
Binary Indicators:
Used Any Loan for Business 0.226 0.419 619 0.283 0.451 576 0.024
Used Personal Loan for Business 0.143 0.350 616 0.209 0.407 573 0.003
Used Business Loan 0.117 0.322 616 0.119 0.324 573 0.924
(b) Logistic Regressions
Used Any Loan Used Personal Loan Used Business Loan
(1) (2) (3)
Treatment -0.376*** -0.543*** -0.100
(0.144) (0.167) (0.195)
Log Likelihood -606.343 -490.915 -382.104
N 1112 1106 1105
(c) Two-Stage Least Squares Instrumental Variable
Used Any Loan Used Personal Loan Used Business Loan
(1) (2) (3)
Second Stage:
Hours of Training -0.007** -0.008** -0.001
(0.004) (0.003) (0.002)
First Stage:
Treatment 9.294*** 9.301*** 9.301***
(2.694) (2.700) (2.700)
F-stat (Treatment = 0) 11.905 11.868 11.868
R-squared 0.054 0.054 0.054
N 1116 1110 1110
Notes:
[i] Heteroskedasticity-consistent standard errors are in parentheses.
[ii] * p < 0.10, ** p < 0.05, *** p < 0.01.
[iii] All regressions control for demographics and site fixed effects. See Section 3.1 for details.
41

Table 6: Loan Characteristics Conditional on Borrowing
(a) Personal Loans
Treatment Control F-test
mean st. dev N mean st. dev N p-value
Loan Amount ($1000) 62.349 152.790 77 70.622 169.037 104 0.735
Loan Duration (years) 9.229 9.508 59 10.558 10.550 77 0.449
Annual Interest Rate (%) 8.532 6.089 62 8.253 6.463 87 0.790
Sources:
Credit Cards (%) 28.409 45.356 88 27.500 44.839 120 0.886
Personal Mortgages (%) 42.045 49.646 88 36.667 48.391 120 0.434
Family (%) 19.318 39.706 88 21.667 41.370 120 0.681
Friends (%) 10.227 30.474 88 12.500 33.211 120 0.614
Others (%) 13.636 34.514 88 20.000 40.167 120 0.233
(b) Business Loans
Treatment Control F-test
mean st. dev N mean st. dev N p-value
Loan Amount ($1000) 82.340 151.480 63 101.612 186.307 60 0.529
Loan Duration (years) 7.232 5.337 50 9.091 9.008 52 0.210
Annual Interest Rate (%) 7.727 3.385 44 7.220 2.636 50 0.417
Sources:
Regular Bank Loans (%) 62.500 48.752 72 80.882 39.615 68 0.016
SBA-Backed Loans (%) 15.278 36.230 72 5.882 23.704 68 0.073
Other Gov’t Agency Loans (%) 4.167 20.123 72 1.471 12.127 68 0.342
Investment Companies (%) 1.389 11.785 72 0.000 0.000 68 0.333
Others (%) 15.278 36.230 72 11.765 32.459 68 0.548
42

Table 7: Receiving Training Decreases Own-Money Financing and Total Capital in Business
(a) OLS Regressions
Own-Money Input Total Financial Capital
(1) (2)
Treatment -0.394** -0.300**
(0.171) (0.126)
R-squared 0.088 0.161
N 862 862
(b) Logistic Regressions
Own-Money Input Total Financial Capital
< 25% Sample > 75% Sample < 25% Sample > 75% Sample
(Quantile = 2000) (Quantile = 20000) (Quantile = 3000) (Quantile = 40000)
(1) (2) (3) (4)
Treatment 0.058 -0.377** 0.017 -0.390**
(0.201) (0.175) (0.209) (0.167)
Log Likelihood -334.908 -466.277 -308.015 -448.636
N 858 862 858 862
(c) Two-Stage Least Squares Instrumental Variable Regressions
Own-Money Input Total Financial Capital
< 25% Sample > 75% Sample < 25% Sample > 75% Sample
(Quantile = 2000) (Quantile = 20000) (Quantile = 3000) (Quantile = 40000)
(1) (2) (3) (4)
Second Stage:
Hours of Training 0.001 -0.005* 0.000 -0.005*
(0.002) (0.003) (0.002) (0.003)
First Stage:
Treatment 12.212*** 12.212*** 12.212*** 12.212***
(3.095) (3.095) (3.095) (3.095)
F-stat (Treatment = 0) 15.570 15.570 15.570 15.570
R-squared 0.075 0.075 0.075 0.075
N 862 862 862 862
Notes:
[i] The regressions exclude businesses with 0 total capital due to concern for mis-reporting.
[ii] Heteroskedasticity-consistent standard errors are in parentheses.
[iii] * p < 0.10, ** p < 0.05, *** p < 0.01.
[iv] All regressions control for demographics and site fixed effects. See Section 3.1 for details.
43

Table 8: Receiving Training Decreases Production Scale and Its Growth
(a) Descriptive Statistics
Treatment Control F-test
mean st. dev N mean st. dev N p-value
Number of Employees 1.016 3.760 617 1.748 7.566 575 0.033
Change in Employment
of all entrepreneurs 0.246 2.894 609 1.028 6.803 564 0.010
of continuing entrepreneurs 0.102 2.897 469 0.663 5.276 412 0.048
of new entrepreneurs 0.729 2.843 140 2.020 9.769 152 0.133
(b) Intent-to-Treat Effects
Number of Employees Employment Change
(Poisson) (Negative Binomial) (OLS)
(1) (2) (3)
Treatment -0.676*** -0.516*** -0.779**
(0.207) (0.161) (0.318)
Log Likelihood -2941.663 -1307.684
R-squared 0.052
N 1114 1114 1097
(c) Two-Stage Least Squares Instrumental Variable
Number of Employees Employment Change
(1) (2)
Second Stage:
Hours of Training -0.095** -0.079**
(0.046) (0.040)
First Stage:
Treatment 9.568*** 9.851***
(2.715) (2.735)
F-stat (Treatment = 0) 12.423 12.970
R-squared 0.057 0.059
N 1114 1097
Notes:
[i] Heteroskedasticity-consistent standard errors are in parentheses.
[ii] * p < 0.10, ** p < 0.05, *** p < 0.01.
[iii] All regressions control for demographics and site fixed effects. See Section 3.1 for details.
44

Table 9: How Much did Training Help with the Following Issues?
Percentage for Each
"A lot." "Somewhat." "Not at all." N
Business Planning:
Developing business plan 27.79 38.30 33.91 637
Deciding whether to pursue self-employment 31.23 31.72 37.06 618
Refining business idea 37.42 37.73 24.85 652
Specific Functions in Business Operation:
Applying for loans 7.52 17.66 74.83 572
Dealing with credit issues 12.40 25.94 61.66 613
Developing marketing strategy 27.58 43.91 28.51 649
Dealing with legal issues 14.06 33.39 52.56 626
Dealing with accounting issues 15.70 32.81 51.49 637
Hiring and dealing with employees 10.98 27.70 61.32 592
Using computer and other technology 24.41 28.95 46.64 639
Dealing with clients 26.36 39.53 34.11 645
Other Issues:
Networking 38.28 39.36 22.36 653
Providing psychological support 18.11 31.34 50.55 635
Notes:
Responses were provided by individuals that had received business training over the past 12 months.
45

Table 10: Weighted Regressions to Address Heteogeneous Attrition
(a) Likelihood of Loss (Logistic Regressions)
Operating Business Entrepreneurial
Profit Profit Income
was Negative was Negative was Negative
(a1) (a2) (a3)
Treatment -0.372** -0.345* -0.495**
(0.189) (0.186) (0.179)
Log Likelihood -401.485 -408.811 -429.195
N 935 935 935
(b) Financing (Logistic Regressions)
Used Any Loan Own-Money Input Total Financial Capital
Above 75% of Sample Above 75% of Sample
(b1) (b2) (b3)
Treatment -0.319** -0.377** -0.390**
(0.150) (0.175) (0.167)
Log Likelihood -598.021 -415.219 -448.636
N 1112 862 862
(c) Production Scale and Growth
Number of Employees Change in
Number of Employees
(Poisson) (Neg Binomial) (OLS)
(c1) (c2) (c3)
Treatment -0.717*** -0.453*** -0.888**
(0.217) (0.158) (0.410)
R-Squared 0.038
Log Likelihood -4919.200 -2205.030
N 1114 1114 1097
Notes:
[i] Heteroskedasticity-consistent standard errors are in parentheses.
[ii] * p < 0.10, ** p < 0.05, *** p < 0.01.
[iii] All regressions control for demographics and site fixed effects. See Section 3.1 for details.
[iv] All regressions are weighted. The weights are inverse predicted probability of continuing to
be surveyed. See Section 8.1 for details.
[v] Regressions (b2) and (b3) exclude businesses with 0 total capital due to concern for mis-reporting.
46

Table 11: Regressions Using Sample of Entrepreneurs since Random Assignment
(a) Likelihood of Loss (Logistic Regressions)
Operating Business Entrepreneurial
Profit Profit Income
was Negative was Negative was Negative
(a1) (a2) (a3)
Treatment -0.363** -0.343** -0.441***
(0.153) (0.152) (0.148)
Log Likelihood -547.681 -554.938 -576.733
N 1168 1168 1168
(b) Financing (Logistic Regressions)
Used Any Loan Own-Money Input Total Financial Capital
Above 75% of Sample Above 75% of Sample
(b1) (b2) (b3)
Treatment -0.300** -0.456*** -0.299**
(0.131) (0.153) (0.146)
Log Likelihood -738.872 -534.198 -583.773
N 1428 1033 1033
(c) Production Scale and Growth
Number of Employees Change in
Number of Employees
(Poisson) (Neg Binomial) (OLS)
(c1) (c2) (c3)
Treatment -0.442* -0.394** -0.698**
(0.237) (0.163) (0.275)
R-Squared 0.022
Log Likelihood -3555.487 -1495.472
N 1367 1367 1269
Notes:
[i] Heteroskedasticity-consistent standard errors are in parentheses.
[ii] * p < 0.10, ** p < 0.05, *** p < 0.01.
[iii] All regressions control for demographics and site fixed effects. See Section 3.1 for details.
[iv] Regressions (b2) and (b3) exclude businesses with 0 total capital due to concern for mis-reporting.
47

Table 12: Regressions Using Full Sample Regardless of Entrepreneurial Experience
(a) Likelihood of Loss (Logistic Regressions)
Operating Business Entrepreneurial
Profit Profit Income
was Negative was Negative was Negative
(a1) (a2) (a3)
Treatment -0.342** -0.323** -0.412***
(0.145) (0.144) (0.140)
Log Likelihood -680.022 -690.044 -724.177
N 2046 2046 2046
(b) Financing (Logistic Regressions)
Used Any Loan Own-Money Input Total Financial Capital
Above 75% of Sample Above 75% of Sample
(b1) (b2) (b3)
Treatment -0.251** -0.191* -0.193*
(0.125) (0.112) (0.113)
Log Likelihood -875.143 -981.034 -970.222
N 2213 1860 1824
(c) Production Scale and Growth
Number of Employees Change in
Number of Employees
(Poisson) (Neg Binomial) (OLS)
(c1) (c2) (c3)
Treatment -0.488* -0.312* -0.544***
(0.252) (0.165) (0.201)
R-Squared 0.005
Log Likelihood -4282.727 -1674.684
N 2225 2225 2162
Notes:
[i] Heteroskedasticity-consistent standard errors are in parentheses.
[ii] * p < 0.10, ** p < 0.05, *** p < 0.01.
[iii] All regressions control for demographics and site fixed effects. See Section 3.1 for details.
[iv] Regressions (b2) and (b3) exclude owners of businesses with 0 total capital due to concern for mis-reporting.
48
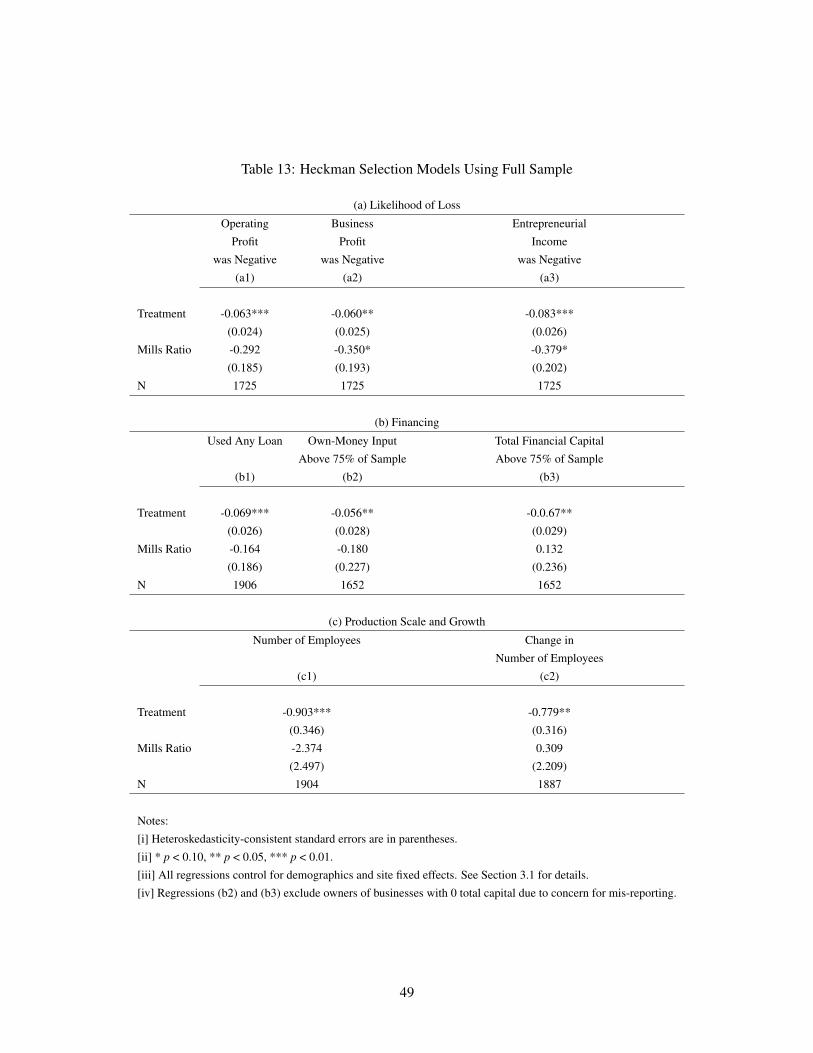
Table 13: Heckman Selection Models Using Full Sample
(a) Likelihood of Loss
Operating Business Entrepreneurial
Profit Profit Income
was Negative was Negative was Negative
(a1) (a2) (a3)
Treatment -0.063*** -0.060** -0.083***
(0.024) (0.025) (0.026)
Mills Ratio -0.292 -0.350* -0.379*
(0.185) (0.193) (0.202)
N 1725 1725 1725
(b) Financing
Used Any Loan Own-Money Input Total Financial Capital
Above 75% of Sample Above 75% of Sample
(b1) (b2) (b3)
Treatment -0.069*** -0.056** -0.0.67**
(0.026) (0.028) (0.029)
Mills Ratio -0.164 -0.180 0.132
(0.186) (0.227) (0.236)
N 1906 1652 1652
(c) Production Scale and Growth
Number of Employees Change in
Number of Employees
(c1) (c2)
Treatment -0.903*** -0.779**
(0.346) (0.316)
Mills Ratio -2.374 0.309
(2.497) (2.209)
N 1904 1887
Notes:
[i] Heteroskedasticity-consistent standard errors are in parentheses.
[ii] * p < 0.10, ** p < 0.05, *** p < 0.01.
[iii] All regressions control for demographics and site fixed effects. See Section 3.1 for details.
[iv] Regressions (b2) and (b3) exclude owners of businesses with 0 total capital due to concern for mis-reporting.
49
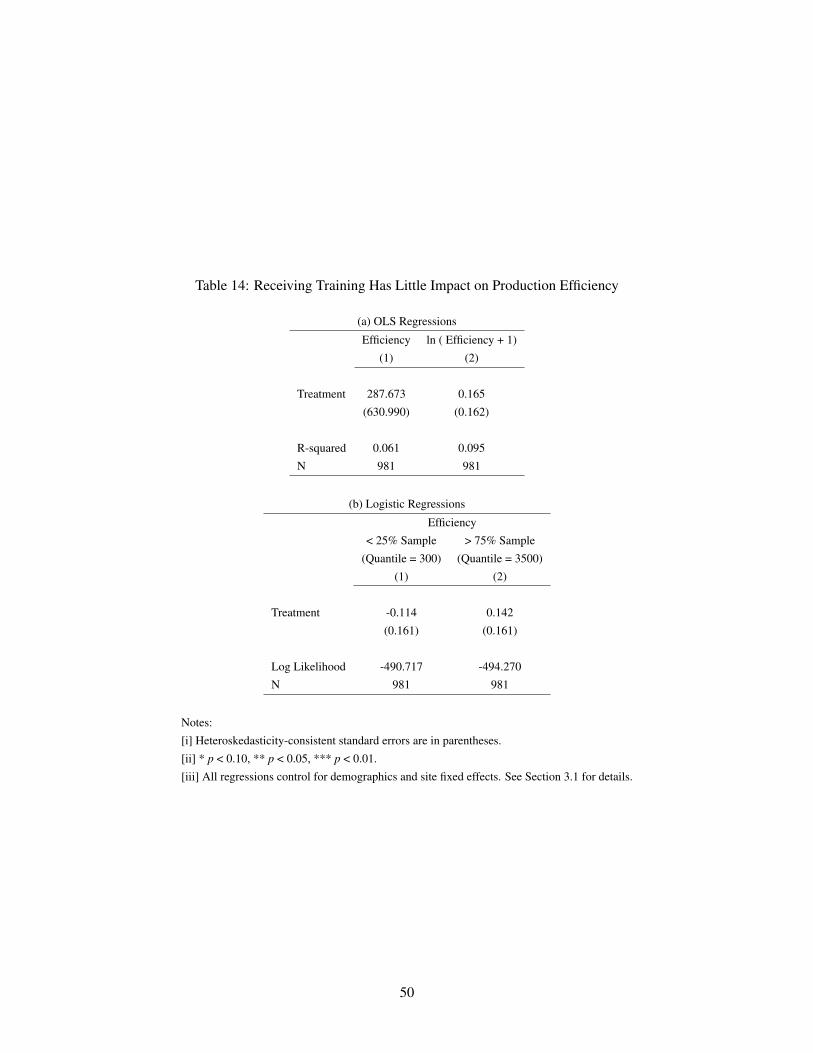
Table 14: Receiving Training Has Little Impact on Production Efficiency
(a) OLS Regressions
Efficiency ln ( Efficiency + 1)
(1) (2)
Treatment 287.673 0.165
(630.990) (0.162)
R-squared 0.061 0.095
N 981 981
(b) Logistic Regressions
Efficiency
< 25% Sample > 75% Sample
(Quantile = 300) (Quantile = 3500)
(1) (2)
Treatment -0.114 0.142
(0.161) (0.161)
Log Likelihood -490.717 -494.270
N 981 981
Notes:
[i] Heteroskedasticity-consistent standard errors are in parentheses.
[ii] * p < 0.10, ** p < 0.05, *** p < 0.01.
[iii] All regressions control for demographics and site fixed effects. See Section 3.1 for details.
50


![looselywoven.orglooselywoven.org/concerts/prudence/music/Prudence Music Maria Full... · The colour of Prudence [July 2009] Please don’t disturb Dear Prudence](https://img.pdfslide.net/doc/110x75/5ac0c5187f8b9aca388c4f0c/music-maria-fullthe-colour-of-prudence-july-2009-please-dont-disturb-dear.jpg)