Embed Size (px)
Citation preview
Knowledge management, learning and communication in value chains
A case analysis of the speciality coffee value chain
of FAPECAFES, Ecuador
FINAL REPORT
Reinhild Bode Centro Internacional de Agricultura Tropial (CIAT)
A.A. 6713, Cali, Colombia
Tel.: +57(2)4450000 Ext.
Content
CONTENT
ABSTRACT INTRODUCTION
PART I: CONCEPTUAL FRAMEWORK
1. INTRODUCTION 1
2. KNOWLEDGE MANAGEMENT, COMMUNICATION AND LEARNING – DEFINITIONS AND TERMS
1
2.1 Knowledge management 1
2.2 Communication 3
2.3 Learning 4
3. VALUE CHAINS 5
4. KNOWLEDGE MANAGEMENT, COMMUNICATION AND LEARNING IN VALUE CHAINS 6
PART II: CASE STUDY
5. DESCRIPTION OF THE COFFEEGROWERS’ ORGANIZATION AND IT’S VALUE CHAIN 8
5.1 Introduction 8
5.2 Development of FAPECAFES 8
5.3 The coffee value chain and its dynamics 9
5.4 Communication and knowledge management emerging 10
6. ASSESSMENT OF KNOWLEDGE MANAGEMENT PRACTICES IN FAPECAFES 11
6.1 Information and knowledge needs 11
6.2 Information and knowledge assets 14
6.3 Flow of information and knowledge 16
6.3.1 Internal information and knowledge flows 16
6.3.2 External information and knowledge flows 18
6.4 Transaction and opportunity costs analysis 22
6.4.1 Geographical distances 22
6.4.2 Transaction and opportunity costs 23
6.4.3 Costs of the media and communication team 24
6.4.4 Costs of a quality and price differentiation 25
6.4.5 Perceptions of the benefits of medias used and quality and price differentiation 25
7. KNOWLEDGE MANAGEMENT, COMMUNICATION AND LEARNING IN FAPECAFES 26
7.1 Constraints of knowledge management, communication and learning in FAPECAFES 26
7.2 Unexplored opportunities 28
7.3 Governance and impact of knowledge management 29
PART III: INSTRUMENTS AND TOOLS
8. ANALYSIS TOOLS 34
8.1 The knowledge landscape 34
8.2 Assessment of information and knowledge flows 36
Content
8.3 Assessment of information and knowledge needs 38
8.4 Assessment of transaction and opportunity costs 39
9. ACTION ORIENTED TOOLS 40
9.1 Development of incentives through quality and price differentiation 40
9.2 Design and use of media 41
9.3 Capacity building of local leaders 42
9.4 Regional coffee growers’ forum 42
10. LITERATURE 43
ANNEX:
A.1 FAPECAFES’ ACTION PLAN FOR KNOWLEDGE MANAGEMENT 44
A.2 DESIGN OF THE ACTION RESEARCH PROCESS 45
A.3 METHODOLOGICAL DESIGN OF FIELDWORK 46
A.4 TRANSACTION AND OPPORTUNITY COSTS OF FAPECAFES AND APECAP 47
A.5 COSTS OF MEDIA AND COMMUNICATORS IN FAPECAFES (2006) 48
A.6 OPPORTUNITY COSTS OF MEMBERS AND LEADERS OF GRASSROOTS GROUPS 49
LIST OF FIGURES:
Figure 1: Corner stones of knowledge management, according to Probst (1999). 1
Figure 2: Gradual distinction between information and knowledge 3
Figure 3: Communication model according to Berlo (Berlo 1960) 3
Figure 4: The message square, according to Schultz von Thun (Schulz von Thun 1981) 4
Figure 5: Single and double loop learning (Argyris and Schön, 1978) 4
Figure 6: Governance types and key determinants of global value chain governance (Gereffi
and Humphrey 2005: 87) 6
Figure 7: Simplified concept of knowledge management in value chains 6
Figure 8: Geographical position of FAPECAFES 8
Figure 9: Characteristics of FAPECAFES’ basis organizations 9
Figure 10: Development of export volumes according to qualities (2001 – 2005) 10
Figure 11: Information and knowledge needs 11
Figure 12: Effects of week information and knowledge flows 14
Figure 13: Information and knowledge assets at different levels of FAPECAFES 15
Figure 14: Frequency of meetings and media used at different levels of FAPECAFES 17
Figure 15: Disturbances in communication flows 18
Figure 16: Quality sanctions and rewards 19
Figure 17: Circulation of produce, quality related knowledge and prices along the value chain,
proposed for FAPECAFES.
21
Figure 18: Transaction and opportunity costs of FAPECAFES (2006) 24
Content
Figure 19: Transaction and opportunity costs of APECAP (2006) 24
Figure 20: Costs of communication strategy FAPECAFES (2006) 25
Figure 21: Key determinants of global value chain governance, according to the type of
information and knowledge in the case of FAPECAFES
30
Figure 22: Knowledge landscape of the farmers’ group Chito, association APECAP. 35
Figure 23: Quality related flows of information and knowledge within FAPECAFES and APECAP
and gaps of communication.
37
Figure 24: Identification of information and knowledge needs 38
LIST OF MAPS:
Map 1: Geographical distances between FAPECAFES and it’s associaton 22
Abstract
ABSTRACT
The study focuses on the theoretical background of knowledge management in value chains and the application of the concepts on the case of FAPECAFES (Ecuador). The purpose was to formulate a better understanding of the role and costs of knowledge management, learning and communication in value chains and their impact on farmers’ ability to integrate successfully into high value markets. FAPECAFES is a smallholder coffee growers’ association in the southern highlands of Ecuador. The case study contains the analysis of information needs, know-how, communication and knowledge flows, as well as the assessment of transaction and opportunity costs. The main results of the study are summed up as follows: Different stakeholders of the value chain “coffee” have different information needs in
order to take strategic decisions. The understanding of the other’s information needs is limited. A gradual distinction can be made between more explicit or data-like information (e.g. data about expected volumes, prices, number of certified farms) and more implicit or knowledge-like information (e.g. knowledge about negotiation strategies, experiences in organic production techniques, assessment of organoleptic / subjective quality criteria). Consequently, not all information needs can easily be fulfilled, as implicit knowledge is difficult to codify. Incomplete information needs may lead to serious problems in the commercial relationship between producers and buyers.
There exists a broad pool of information and knowledge that is poorly managed. Most knowledge holders, like farmers or skilled local promoters, are not recognized and rather replaced by external technical staff than integrated into the formal service provision system. A lot of knowledge is accumulated in the heads of few leaders, but not handed over to successors or young staff.
Knowledge and communication flows are often interrupted or disturbed. The internal communication flows within farmers’ organizations tend to slow down at the farmers’ side, ending up in a dead-end street. Information about product quality is often not handed over to those who should take decisions and define actions (e.g. farmers, technical staff). Different languages and perceptions, e.g. regarding product quality, complicate communication and understanding along the value chain. Producers’ organizations lack regular feedback on quality of their produce and are disadvantaged in the negotiation process with the clients.
Due to geographical distances and poor communication and transport infrastructure, transaction costs tend to be relatively high in FAPECAFES. Transaction costs of the umbrella organization to keep members informed and take decisions account for about 1,15 USD/qq of coffee, which represent 21% of administrative and 7% of total costs. The transaction costs of the farmers’ organizations must be added. They amount to 0,50 USD/qq coffee, representing about 28% of administrative and 12% of total costs. These costs still do not include the opportunity costs of farmers and grassroots group’s leaders: a regular member, producing about 10qq coffee/ha, invests between 9% and 13% (depending on quality and certifications) of his total net income for attending organizational meetings. This amounts to approximately 7 working days per year. A farmer, producing only 5qq coffee/ha (the reality for most of the organization’s members), invests between 19% and 26% of his returns. This investment of time is much higher, if a farmer assumes leading positions within his group and has to attend about 13 meetings per year: a leader invests between 17% and 24% of his returns if he is producing about 10qq coffee /ha, and between 35% and 48% when producing only about 5qq coffee /ha. It is therefore for unattractive smallholders with low productivity and little capital to invest in improved farm management practices (like renovation of plantations or fertilization or soils) to be actively involved in meetings – even if they are certified and receive a premium. The costs to be informed and be part of the decision making process, plus the costs of the organization to inform and involve it’s members, seems to exceed the expected (economic) benefits of both. This is even more true for the leaders of grassroots groups, who are not compensated moneywise.
Abstract
Consequently, knowledge management costs that further increase the actual transaction costs, are critical. An assessment of the actual costs of the communication strategy recently implemented by FAPECAFES, including the use of media like radio programs, newsletters and the employment of communicators in each of the four associations, add up to 1,54 USD per qq of coffee. This would double the normal transaction costs of FAPECAFES and it’s associations. However, it is too early to assess the final benefits of the communication strategy and the feasibility to sustain it in the future. An increased number of members and a solid compromise of members to deliver their produce may increase FAPECAFES’ export volumes and create extra profits due to economies of scale.
Final considerations and recommendations:
Closed communication loops are essential to feed back key information and enhance strategic decision making. Quality related information is highly important in order to get access to and maintain the integration of speciality coffee into high value supply chains. The identification of key persons along the chain, as well as the facilitation of understanding and the use of information circulating is part of effective management of knowledge and information within value chains.
The use of media in rural areas can be very costly and may even multiply the actual transaction costs for farmers’ organizations. However, economic and non-economic benefits of the use of media should be analysed in detail in order to assess the impact and the sustainability of the communication strategy. Instead of introducing new media or implementing new organizational structures, existing forms of knowledge sharing should be explored and functions and positions of local leaders should be strengthened.
Farmers’ decision to participate and take part as an active member of their organization is determined by economy of scale: low productivity rates and volumes increase the investment costs of farmers and their organizations. Knowledge management in value chains without focusing on the actual problems of the value chain run the risk to miss the target. They may just increase costs for both farmers and their organizations. Consequently, strengthening knowledge management practices in value chains should focus on the identified priority problems in view of improvement of the overall chain performance.
INTRODUCTION The study at hand is a collaboration between the GTZ Sector Project, "Agriservices - Knowledge Systems in Rural Areas", the GTZ Program “Sustainable Management of Natural Resources” / Component “Sustainable Production and Commercialisation” in Ecuador and the “Diversification Agriculture Project Alliance” (DAPA) of the CIAT in Cali / Colombia.
Purpose and objectives of this study The purpose of this study is to formulate a better understanding of the role and costs of knowledge management, learning and communication in value chains and its impact on farmers’ ability to integrate successfully into markets. The main objective is to analyze the internal and external knowledge and communication flows of a selected smallholder farmers’ organization.
The following sub-objectives were defined:
(1) work out a theoretical concept of knowledge management in value chains;
(2) apply this concept as a case study of one selected value chain
(3) quantify transaction costs of information and knowledge sharing
(4) select useful and successful instruments and tools, applied in the case study.
Structure of this work This study is divided into three parts: The first part is a short overview of the most important terms and concepts related to knowledge management, learning and communication of farmers’ organizations and value chains to create a solid framework for the study.
The second part provides the results of the case study: information and knowledge needs, different knowledge forms, “carriers” of knowledge, use of information and knowledge, and transaction costs of knowledge transfer etc. A differentiation is made between the organization’s internal knowledge system and it’s external relationships and communication flows with other stakeholders of the value chain. The transaction costs could only be estimated, as reliable data do not exist.
Part three presents selected instruments and tools, which were useful to analyze the knowledge system and / or to enhance farmers’ organizations to improve knowledge management practices.
Part I: Conceptual framework
1
PART I: CONCEPTUAL FRAMEWORK 1. INTRODUCTION This part of the study conceptualises knowledge management, learning and communication in value chains, based on literature review and empirical research. The initial theory-biased concept has been revisited after the first research cycle and revised according to the experiences gained in the field. First, some basic definitions of knowledge management, communication and learning will be given. Although the term value chain is expected to be well known, a short introduction will be given. Finally, a proposal of knowledge management, learning and communication in value chains will be presented, in attempt to benefit other farmers in similar cases.
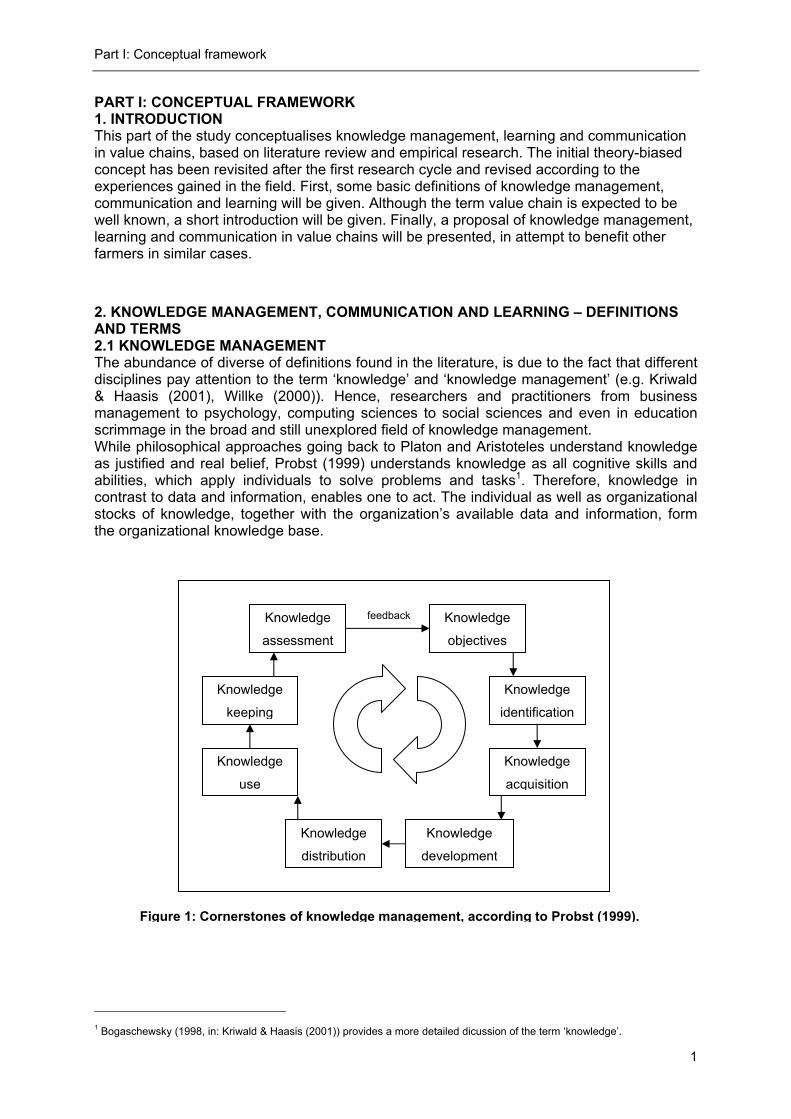
2. KNOWLEDGE MANAGEMENT, COMMUNICATION AND LEARNING – DEFINITIONS AND TERMS 2.1 KNOWLEDGE MANAGEMENT The abundance of diverse of definitions found in the literature, is due to the fact that different disciplines pay attention to the term ‘knowledge’ and ‘knowledge management’ (e.g. Kriwald & Haasis (2001), Willke (2000)). Hence, researchers and practitioners from business management to psychology, computing sciences to social sciences and even in education scrimmage in the broad and still unexplored field of knowledge management. While philosophical approaches going back to Platon and Aristoteles understand knowledge as justified and real belief, Probst (1999) understands knowledge as all cognitive skills and abilities, which apply individuals to solve problems and tasks1. Therefore, knowledge in contrast to data and information, enables one to act. The individual as well as organizational stocks of knowledge, together with the organization’s available data and information, form the organizational knowledge base.
1 Bogaschewsky (1998, in: Kriwald & Haasis (2001)) provides a more detailed dicussion of the term ‘knowledge’.
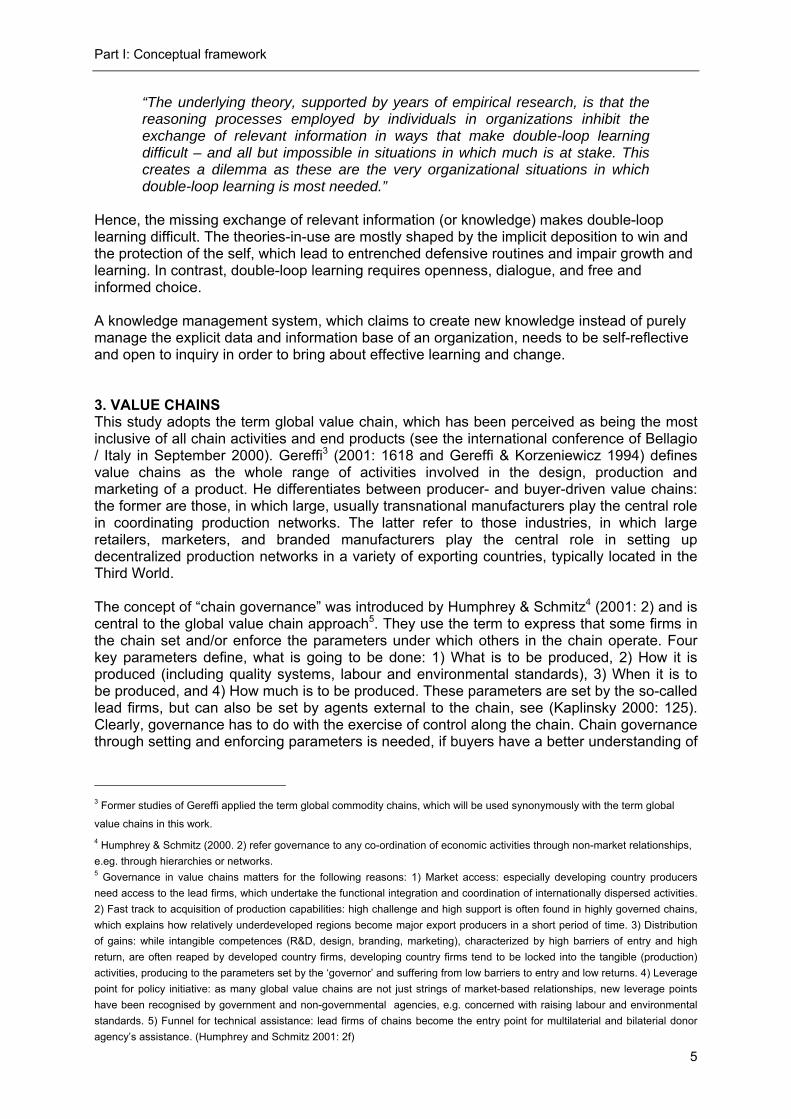
Figure 1: Cornerstones of knowledge management, according to Probst (1999).
feedback Knowledge
objectives
Knowledge
identification
Knowledge
acquisition
Knowledge
development
Knowledge
distribution
Knowledge
use
Knowledge
keeping
Knowledge
assessment
Part I: Conceptual framework
2
Probst identifies eight elements, which form the corner stones of his knowledge management model (see figure 1): (1) knowledge objectives, (2) knowledge identification, (3) knowledge acquisition, (4) knowledge development, (5) knowledge distribution, (6) knowledge use, (7) knowledge keeping and (8) knowledge assessment. In contrast to this model, Nonaka & Takeuchi (1997)2 developed their knowledge creation model, based on case studies of Japanese companies, which have been very successful in developing innovations in a dynamic and competitive environment. The key element for these authors is ‘implicit’/‘tacit’ knowledge and its transformation and mobilization into ‘explicit’ knowledge in order to make it accessible and useful for others. They perceive western philosophy as concentrating on the management of external knowledge, which can be measured and articulated, while personal convictions, values and intuitions are underestimated. According to Nonaka & Takeuchi (1997), most of the existing economic, management and organizational theories dealing with the topic of knowledge, are missing a clear concept of knowledge creation, a connection with learning processes and/or require an artificial intervention from outside. Soukup (2000: 198ff) critically comments, that in most of the knowledge management literature knowledge is considered as a resource, regarded as the forth production factor next to raw materials, work and capital. Hence, knowledge is a commodity, which must be maximized and can be transported elsewhere in order to be used most effectively. The charm of this view is the ability of entrepreneurs to manage their knowledge resources with existing and well known management methods. However, knowledge is context specific and needs a common experiential background to be externalized and used (ibid: 204ff). Supporting this conclusion, Hilse (2000) introduces the concept of ‘communities of practice’, which have created a common context due to joint activities and dense interactions. Moreover, Seufert et al. (2000: 136ff) show the potential of networks for overcoming knowledge barriers and bridging islands of knowledge, referring to experiences of Powell, Koput and Smith-Doerr (1996, in: Seufert et al. 2000: 139) with improving learning processes through network building. Fried and Baitsch (2000) note another critical appraisal of knowledge management: They identify knowledge management as a part of a much broader and deeper field of organizational learning. While organizational learning contains the possibilities of unpredictable, uncontrollable, and hence fundamental change, knowledge management is more stable, managed by certain persons with defined responsibilities, and optimising existing processes and structures rather than challenging them. In accordance to definitions of knowledge management and its critiques noted above, I adopt the following conclusions:
knowledge, rather then being a static asset or a commodity-like resource, is dynamic and induces the ability to act; the verb “knowing” is much more likely to express these characteristics;
due to its tacit dimension, knowledge is context and person specific and needs to be shared in order to become (at least partially) explicit and useful for others;
creating knowledge means learning and hence inducing change, which is not free of interests and independent of power relations;
thus, solving the problem of managing knowledge by a pure technological approach is only the tip of the iceberg; as it is more likely to be a socio-organizational and cultural issue, approaches to organizational communication and learning are required (see also Allix 2003).
2 See also the article of Nonaka, Toyama and Konno (2000) and Nonaka and Konno (1998).
Part I: Conceptual framework
3
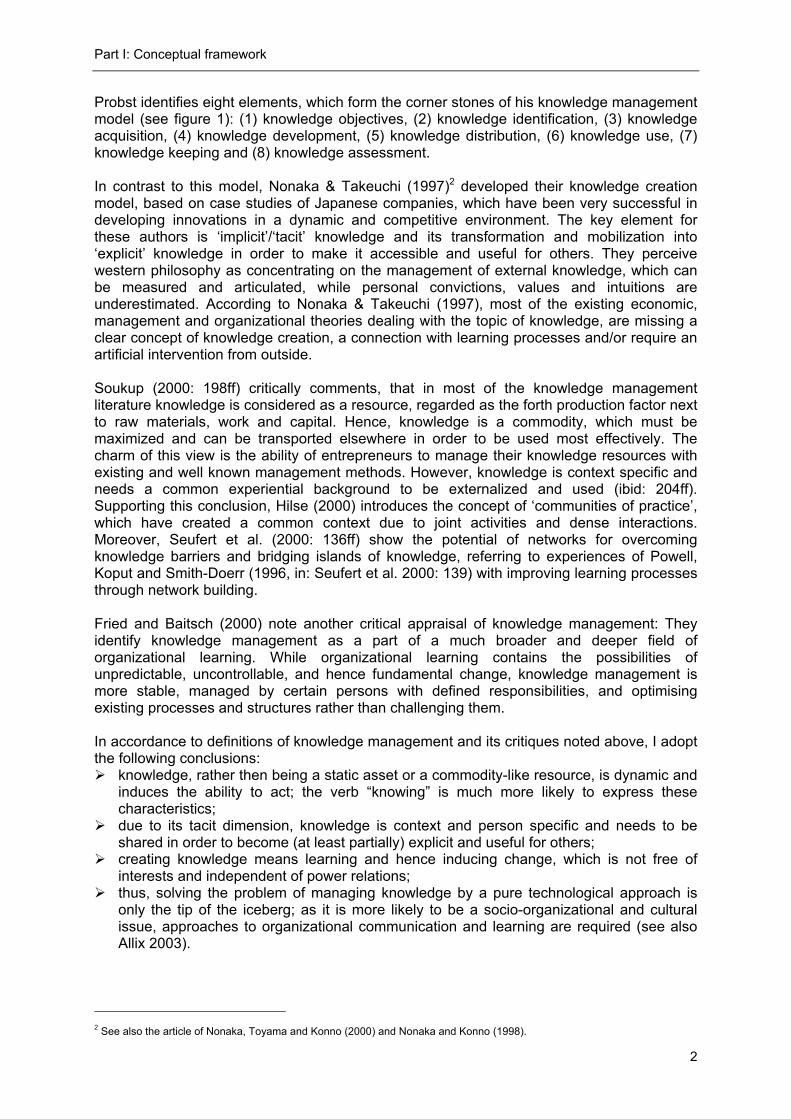
Figure 2 expresses the gradual distinction between information, which is highly explicit, and knowledge, which is highly implicit. The identification of the type of knowledge or information, which is needed, which should be managed or which should be shared, is relevant for the appropriate definition of forms and media.
Figure 2: Gradual distinction between information and knowledge Type Information-like Knowledge-like
Character explicit implicit
widely applicable person and context specific
can be codified difficult to codify
2.2 COMMUNICATION Communication is human contact and interaction with the aim to agree on something. Communication models shape the complex reality, trying to comprehend the relevant factors of the communication process. Therefore, they only represent a simplified model of reality, not reality itself.
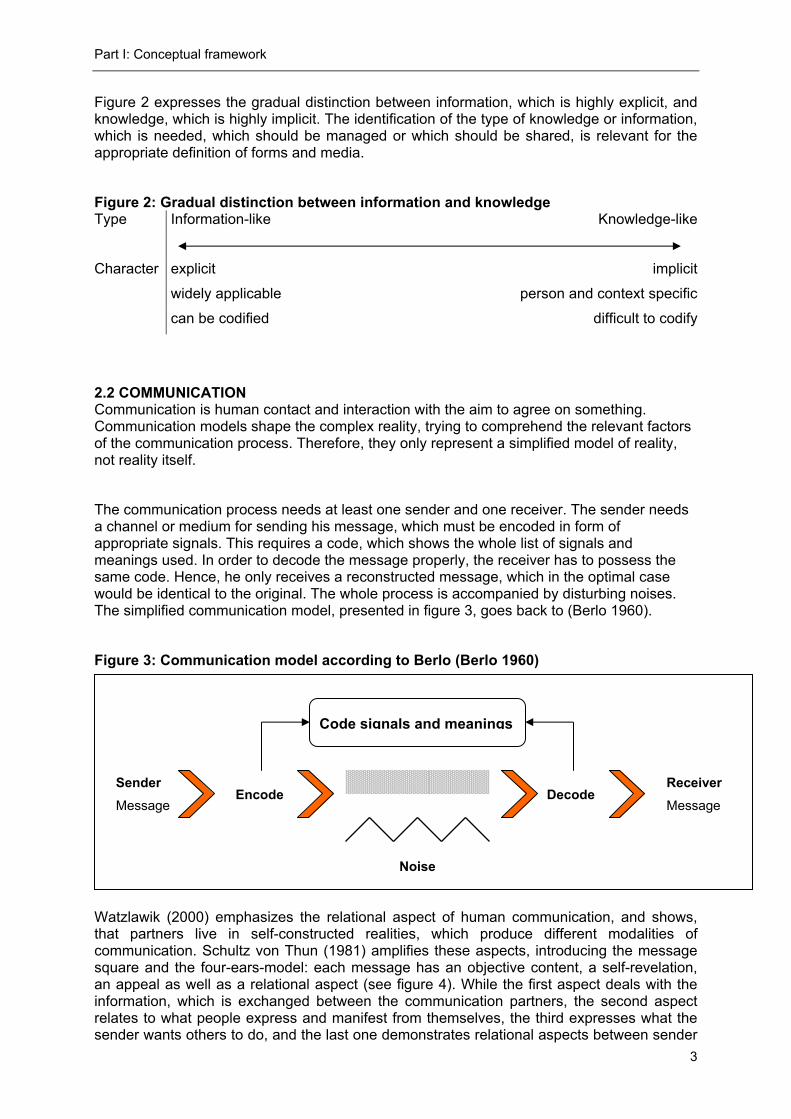
The communication process needs at least one sender and one receiver. The sender needs a channel or medium for sending his message, which must be encoded in form of appropriate signals. This requires a code, which shows the whole list of signals and meanings used. In order to decode the message properly, the receiver has to possess the same code. Hence, he only receives a reconstructed message, which in the optimal case would be identical to the original. The whole process is accompanied by disturbing noises. The simplified communication model, presented in figure 3, goes back to (Berlo 1960).
Figure 3: Communication model according to Berlo (Berlo 1960)
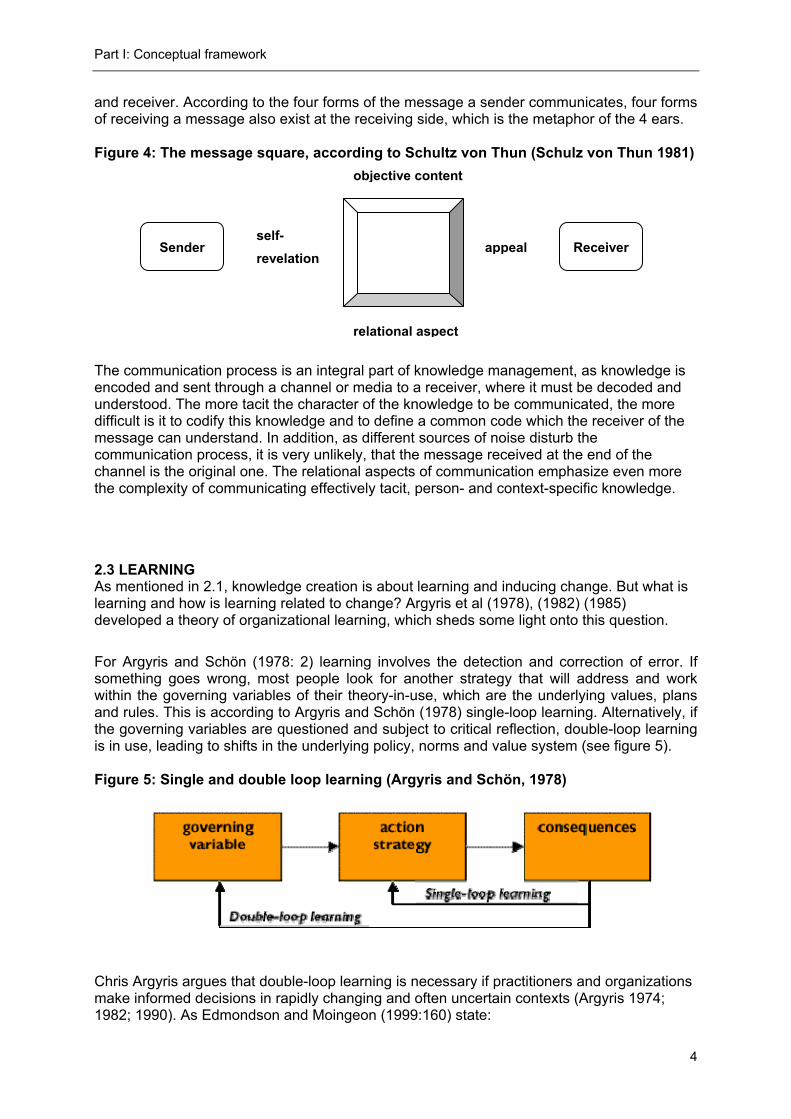
Watzlawik (2000) emphasizes the relational aspect of human communication, and shows, that partners live in self-constructed realities, which produce different modalities of communication. Schultz von Thun (1981) amplifies these aspects, introducing the message square and the four-ears-model: each message has an objective content, a self-revelation, an appeal as well as a relational aspect (see figure 4). While the first aspect deals with the information, which is exchanged between the communication partners, the second aspect relates to what people express and manifest from themselves, the third expresses what the sender wants others to do, and the last one demonstrates relational aspects between sender
Sender Message
Encode Receiver Message
Decode
Code signals and meanings
Noise
Part I: Conceptual framework
4
and receiver. According to the four forms of the message a sender communicates, four forms of receiving a message also exist at the receiving side, which is the metaphor of the 4 ears. Figure 4: The message square, according to Schultz von Thun (Schulz von Thun 1981)
The communication process is an integral part of knowledge management, as knowledge is encoded and sent through a channel or media to a receiver, where it must be decoded and understood. The more tacit the character of the knowledge to be communicated, the more difficult is it to codify this knowledge and to define a common code which the receiver of the message can understand. In addition, as different sources of noise disturb the communication process, it is very unlikely, that the message received at the end of the channel is the original one. The relational aspects of communication emphasize even more the complexity of communicating effectively tacit, person- and context-specific knowledge.
2.3 LEARNING As mentioned in 2.1, knowledge creation is about learning and inducing change. But what is learning and how is learning related to change? Argyris et al (1978), (1982) (1985) developed a theory of organizational learning, which sheds some light onto this question.
For Argyris and Schön (1978: 2) learning involves the detection and correction of error. If something goes wrong, most people look for another strategy that will address and work within the governing variables of their theory-in-use, which are the underlying values, plans and rules. This is according to Argyris and Schön (1978) single-loop learning. Alternatively, if the governing variables are questioned and subject to critical reflection, double-loop learning is in use, leading to shifts in the underlying policy, norms and value system (see figure 5). Figure 5: Single and double loop learning (Argyris and Schön, 1978) Chris Argyris argues that double-loop learning is necessary if practitioners and organizations make informed decisions in rapidly changing and often uncertain contexts (Argyris 1974; 1982; 1990). As Edmondson and Moingeon (1999:160) state:
objective content
relational aspect
appealself-revelation
Sender Receiver
Part I: Conceptual framework
5
“The underlying theory, supported by years of empirical research, is that the reasoning processes employed by individuals in organizations inhibit the exchange of relevant information in ways that make double-loop learning difficult – and all but impossible in situations in which much is at stake. This creates a dilemma as these are the very organizational situations in which double-loop learning is most needed.”
Hence, the missing exchange of relevant information (or knowledge) makes double-loop learning difficult. The theories-in-use are mostly shaped by the implicit deposition to win and the protection of the self, which lead to entrenched defensive routines and impair growth and learning. In contrast, double-loop learning requires openness, dialogue, and free and informed choice. A knowledge management system, which claims to create new knowledge instead of purely manage the explicit data and information base of an organization, needs to be self-reflective and open to inquiry in order to bring about effective learning and change. 3. VALUE CHAINS This study adopts the term global value chain, which has been perceived as being the most inclusive of all chain activities and end products (see the international conference of Bellagio / Italy in September 2000). Gereffi3 (2001: 1618 and Gereffi & Korzeniewicz 1994) defines value chains as the whole range of activities involved in the design, production and marketing of a product. He differentiates between producer- and buyer-driven value chains: the former are those, in which large, usually transnational manufacturers play the central role in coordinating production networks. The latter refer to those industries, in which large retailers, marketers, and branded manufacturers play the central role in setting up decentralized production networks in a variety of exporting countries, typically located in the Third World. The concept of “chain governance” was introduced by Humphrey & Schmitz4 (2001: 2) and is central to the global value chain approach5. They use the term to express that some firms in the chain set and/or enforce the parameters under which others in the chain operate. Four key parameters define, what is going to be done: 1) What is to be produced, 2) How it is produced (including quality systems, labour and environmental standards), 3) When it is to be produced, and 4) How much is to be produced. These parameters are set by the so-called lead firms, but can also be set by agents external to the chain, see (Kaplinsky 2000: 125). Clearly, governance has to do with the exercise of control along the chain. Chain governance through setting and enforcing parameters is needed, if buyers have a better understanding of
3 Former studies of Gereffi applied the term global commodity chains, which will be used synonymously with the term global
value chains in this work. 4 Humphrey & Schmitz (2000. 2) refer governance to any co-ordination of economic activities through non-market relationships, e.eg. through hierarchies or networks. 5 Governance in value chains matters for the following reasons: 1) Market access: especially developing country producers need access to the lead firms, which undertake the functional integration and coordination of internationally dispersed activities. 2) Fast track to acquisition of production capabilities: high challenge and high support is often found in highly governed chains, which explains how relatively underdeveloped regions become major export producers in a short period of time. 3) Distribution of gains: while intangible competences (R&D, design, branding, marketing), characterized by high barriers of entry and high return, are often reaped by developed country firms, developing country firms tend to be locked into the tangible (production) activities, producing to the parameters set by the ‘governor’ and suffering from low barriers to entry and low returns. 4) Leverage point for policy initiative: as many global value chains are not just strings of market-based relationships, new leverage points have been recognised by government and non-governmental agencies, e.g. concerned with raising labour and environmental standards. 5) Funnel for technical assistance: lead firms of chains become the entry point for multilaterial and bilaterial donor agency’s assistance. (Humphrey and Schmitz 2001: 2f)
Part I: Conceptual framework
6
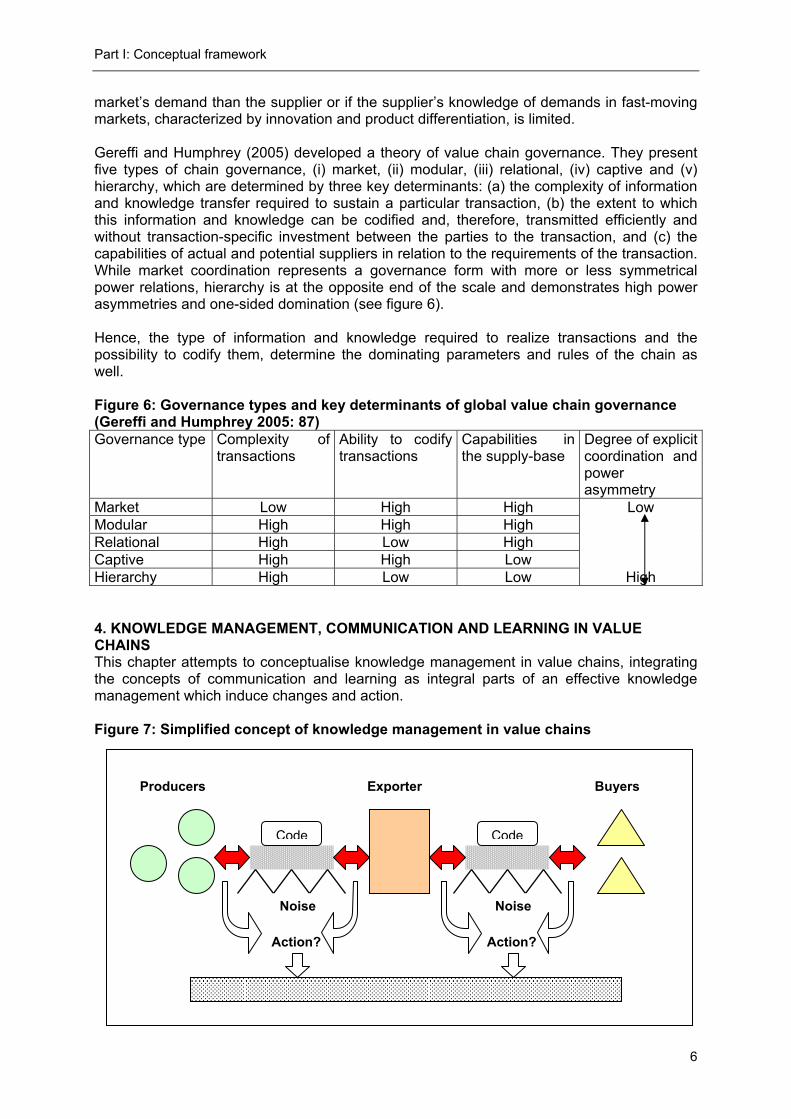
market’s demand than the supplier or if the supplier’s knowledge of demands in fast-moving markets, characterized by innovation and product differentiation, is limited. Gereffi and Humphrey (2005) developed a theory of value chain governance. They present five types of chain governance, (i) market, (ii) modular, (iii) relational, (iv) captive and (v) hierarchy, which are determined by three key determinants: (a) the complexity of information and knowledge transfer required to sustain a particular transaction, (b) the extent to which this information and knowledge can be codified and, therefore, transmitted efficiently and without transaction-specific investment between the parties to the transaction, and (c) the capabilities of actual and potential suppliers in relation to the requirements of the transaction. While market coordination represents a governance form with more or less symmetrical power relations, hierarchy is at the opposite end of the scale and demonstrates high power asymmetries and one-sided domination (see figure 6). Hence, the type of information and knowledge required to realize transactions and the possibility to codify them, determine the dominating parameters and rules of the chain as well. Figure 6: Governance types and key determinants of global value chain governance (Gereffi and Humphrey 2005: 87) Governance type Complexity of
transactions Ability to codify transactions
Capabilities in the supply-base
Degree of explicit coordination and power asymmetry
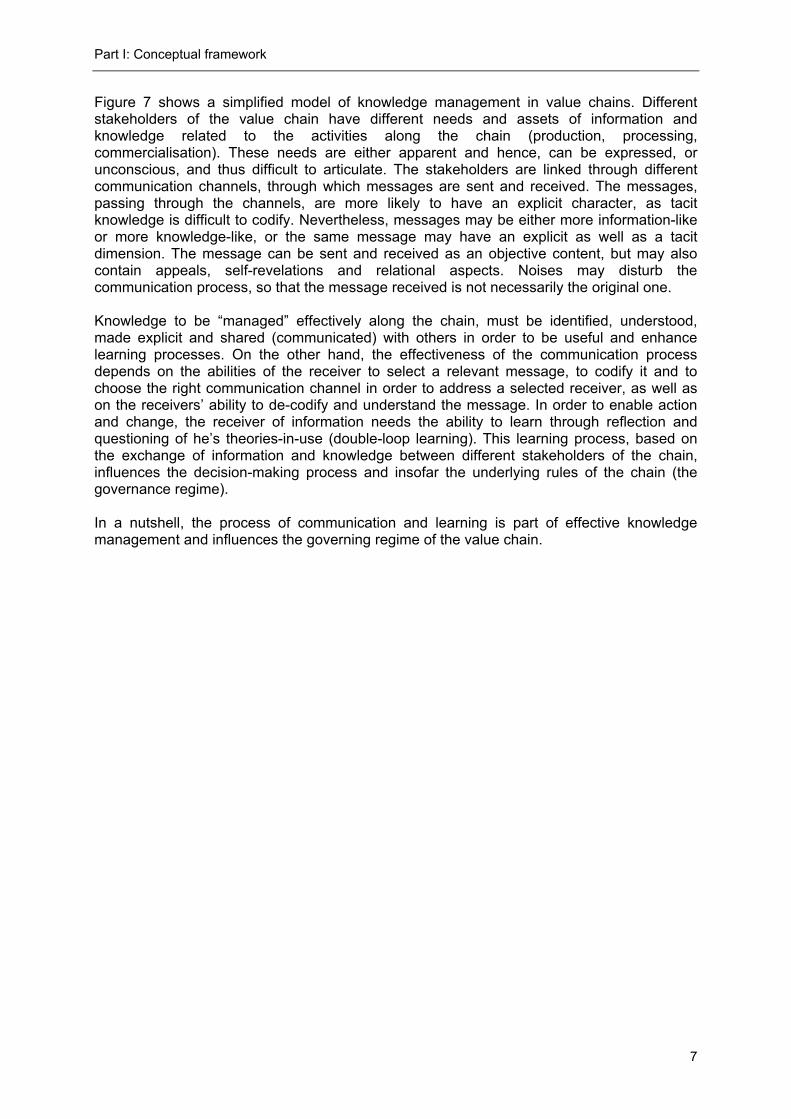
Market Low High High Low Modular High High High Relational High Low High Captive High High Low Hierarchy High Low Low High 4. KNOWLEDGE MANAGEMENT, COMMUNICATION AND LEARNING IN VALUE CHAINS This chapter attempts to conceptualise knowledge management in value chains, integrating the concepts of communication and learning as integral parts of an effective knowledge management which induce changes and action. Figure 7: Simplified concept of knowledge management in value chains
Action?
Noise
Code Code
Noise
Action?
Producers Exporter Buyers
Part I: Conceptual framework
7
Figure 7 shows a simplified model of knowledge management in value chains. Different stakeholders of the value chain have different needs and assets of information and knowledge related to the activities along the chain (production, processing, commercialisation). These needs are either apparent and hence, can be expressed, or unconscious, and thus difficult to articulate. The stakeholders are linked through different communication channels, through which messages are sent and received. The messages, passing through the channels, are more likely to have an explicit character, as tacit knowledge is difficult to codify. Nevertheless, messages may be either more information-like or more knowledge-like, or the same message may have an explicit as well as a tacit dimension. The message can be sent and received as an objective content, but may also contain appeals, self-revelations and relational aspects. Noises may disturb the communication process, so that the message received is not necessarily the original one. Knowledge to be “managed” effectively along the chain, must be identified, understood, made explicit and shared (communicated) with others in order to be useful and enhance learning processes. On the other hand, the effectiveness of the communication process depends on the abilities of the receiver to select a relevant message, to codify it and to choose the right communication channel in order to address a selected receiver, as well as on the receivers’ ability to de-codify and understand the message. In order to enable action and change, the receiver of information needs the ability to learn through reflection and questioning of he’s theories-in-use (double-loop learning). This learning process, based on the exchange of information and knowledge between different stakeholders of the chain, influences the decision-making process and insofar the underlying rules of the chain (the governance regime). In a nutshell, the process of communication and learning is part of effective knowledge management and influences the governing regime of the value chain.
Part II: Case study
8
PART II: CASE STUDY 5. DESCRIPTION OF THE COFFEEGROWERS’ ORGANIZATION AND ITS VALUE CHAIN 5.1 INTRODUCTION The second part of this report embodies the results of the case study. First, the farmers organization FAPECAFES in Ecuador and it’s value chain will be described. Then, the different variables of knowledge management, learning and communication in the value chain, conceptualised in part one, will be analyzed and discussed. Finally, recommendations and lessons learned from the study will be presented.
A participatory action plan was elaborated at the end of the first research cycle and implemented by the farmers’ organization in order to reduce an uneven extraction of information. This action plan has been monitored and evaluated during a second field phase, which allowed the deduction of important lessons learned (see annex 1). A detailed description of the methodological steps and the interviews and workshops conducted can be find in annex 2.
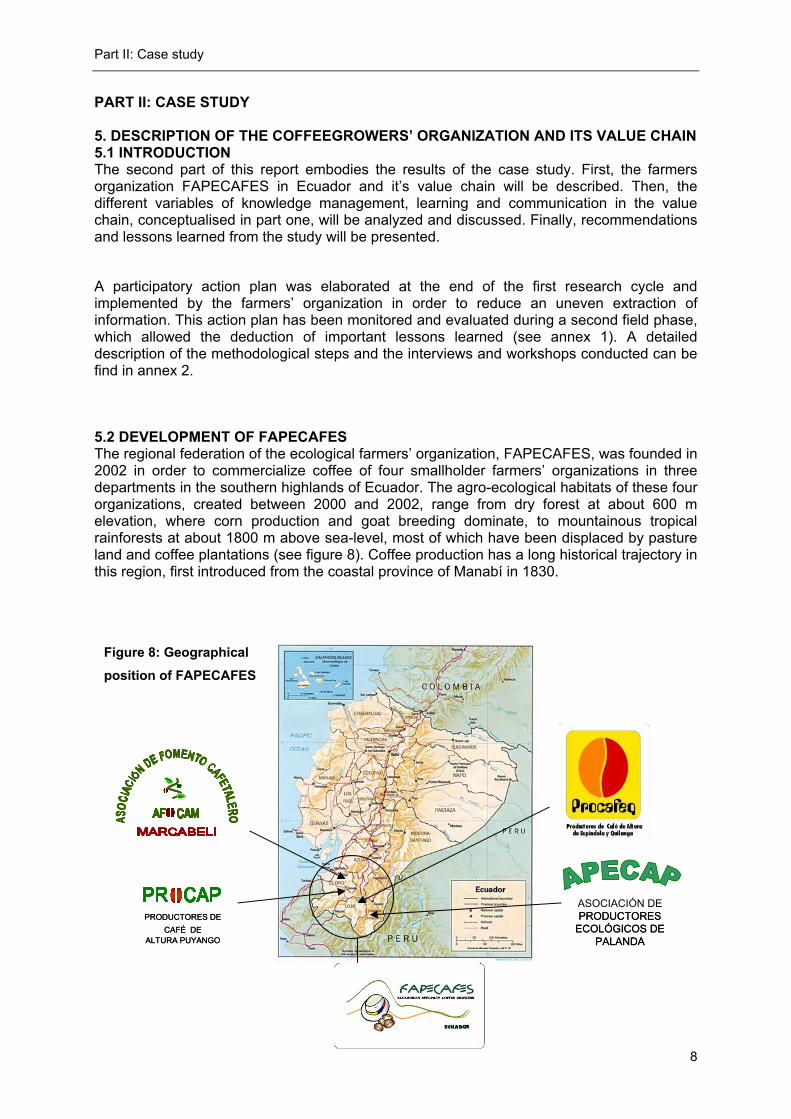
5.2 DEVELOPMENT OF FAPECAFES The regional federation of the ecological farmers’ organization, FAPECAFES, was founded in 2002 in order to commercialize coffee of four smallholder farmers’ organizations in three departments in the southern highlands of Ecuador. The agro-ecological habitats of these four organizations, created between 2000 and 2002, range from dry forest at about 600 m elevation, where corn production and goat breeding dominate, to mountainous tropical rainforests at about 1800 m above sea-level, most of which have been displaced by pasture land and coffee plantations (see figure 8). Coffee production has a long historical trajectory in this region, first introduced from the coastal province of Manabí in 1830.
ASOCIACIÓN DE
PRODUCTORES ECOLÓGICOS DE
PALANDA
ASOCIACIÓN DE PRODUCTORES
ECOLÓGICOS DE PALANDA
PRODUCTORES DE CAFÉ DE
ALTURA PUYANGO
PRODUCTORES DE CAFÉ DE
ALTURA PUYANGO
Figure 8: Geographical
position of FAPECAFES
Part II: Case study
9
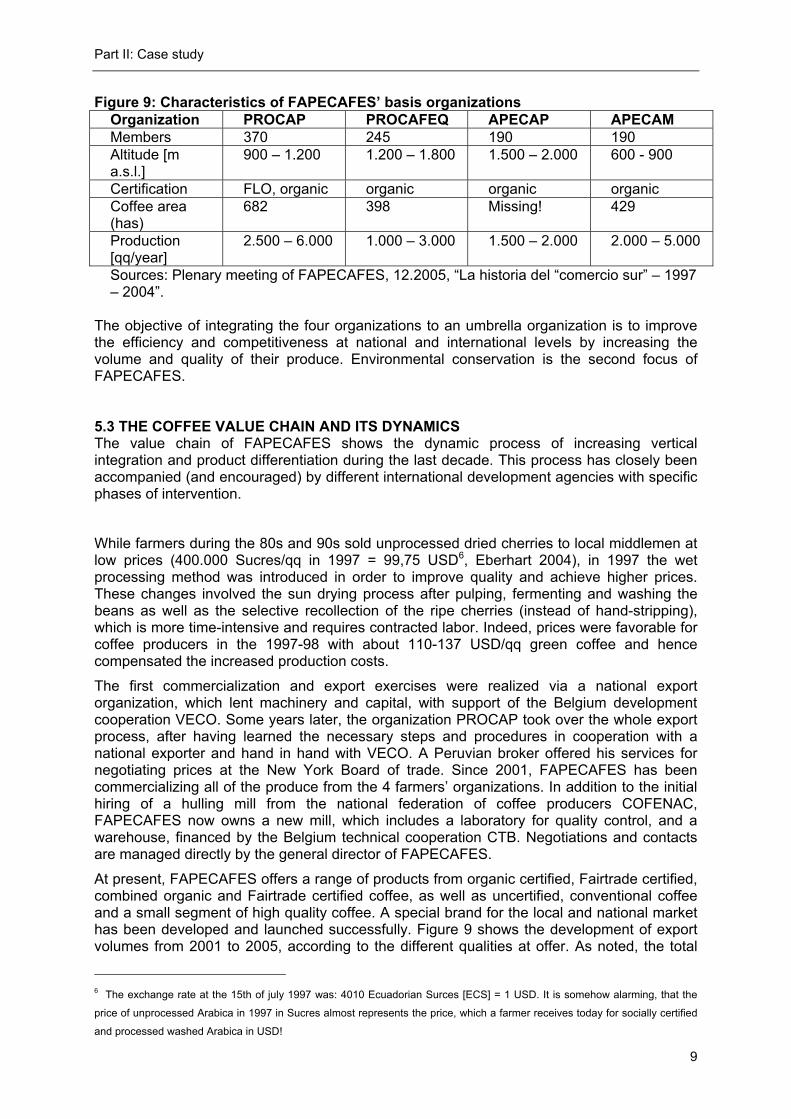
Figure 9: Characteristics of FAPECAFES’ basis organizations Organization PROCAP PROCAFEQ APECAP APECAM Members 370 245 190 190 Altitude [m a.s.l.]
900 – 1.200 1.200 – 1.800 1.500 – 2.000 600 - 900
Certification FLO, organic organic organic organic Coffee area (has)
682 398 Missing! 429
Production [qq/year]
2.500 – 6.000 1.000 – 3.000 1.500 – 2.000 2.000 – 5.000
Sources: Plenary meeting of FAPECAFES, 12.2005, “La historia del “comercio sur” – 1997 – 2004”.
The objective of integrating the four organizations to an umbrella organization is to improve the efficiency and competitiveness at national and international levels by increasing the volume and quality of their produce. Environmental conservation is the second focus of FAPECAFES. 5.3 THE COFFEE VALUE CHAIN AND ITS DYNAMICS The value chain of FAPECAFES shows the dynamic process of increasing vertical integration and product differentiation during the last decade. This process has closely been accompanied (and encouraged) by different international development agencies with specific phases of intervention.
While farmers during the 80s and 90s sold unprocessed dried cherries to local middlemen at low prices (400.000 Sucres/qq in 1997 = 99,75 USD6, Eberhart 2004), in 1997 the wet processing method was introduced in order to improve quality and achieve higher prices. These changes involved the sun drying process after pulping, fermenting and washing the beans as well as the selective recollection of the ripe cherries (instead of hand-stripping), which is more time-intensive and requires contracted labor. Indeed, prices were favorable for coffee producers in the 1997-98 with about 110-137 USD/qq green coffee and hence compensated the increased production costs.
The first commercialization and export exercises were realized via a national export organization, which lent machinery and capital, with support of the Belgium development cooperation VECO. Some years later, the organization PROCAP took over the whole export process, after having learned the necessary steps and procedures in cooperation with a national exporter and hand in hand with VECO. A Peruvian broker offered his services for negotiating prices at the New York Board of trade. Since 2001, FAPECAFES has been commercializing all of the produce from the 4 farmers’ organizations. In addition to the initial hiring of a hulling mill from the national federation of coffee producers COFENAC, FAPECAFES now owns a new mill, which includes a laboratory for quality control, and a warehouse, financed by the Belgium technical cooperation CTB. Negotiations and contacts are managed directly by the general director of FAPECAFES.
At present, FAPECAFES offers a range of products from organic certified, Fairtrade certified, combined organic and Fairtrade certified coffee, as well as uncertified, conventional coffee and a small segment of high quality coffee. A special brand for the local and national market has been developed and launched successfully. Figure 9 shows the development of export volumes from 2001 to 2005, according to the different qualities at offer. As noted, the total
6 The exchange rate at the 15th of july 1997 was: 4010 Ecuadorian Surces [ECS] = 1 USD. It is somehow alarming, that the
price of unprocessed Arabica in 1997 in Sucres almost represents the price, which a farmer receives today for socially certified
and processed washed Arabica in USD!
Part II: Case study
10
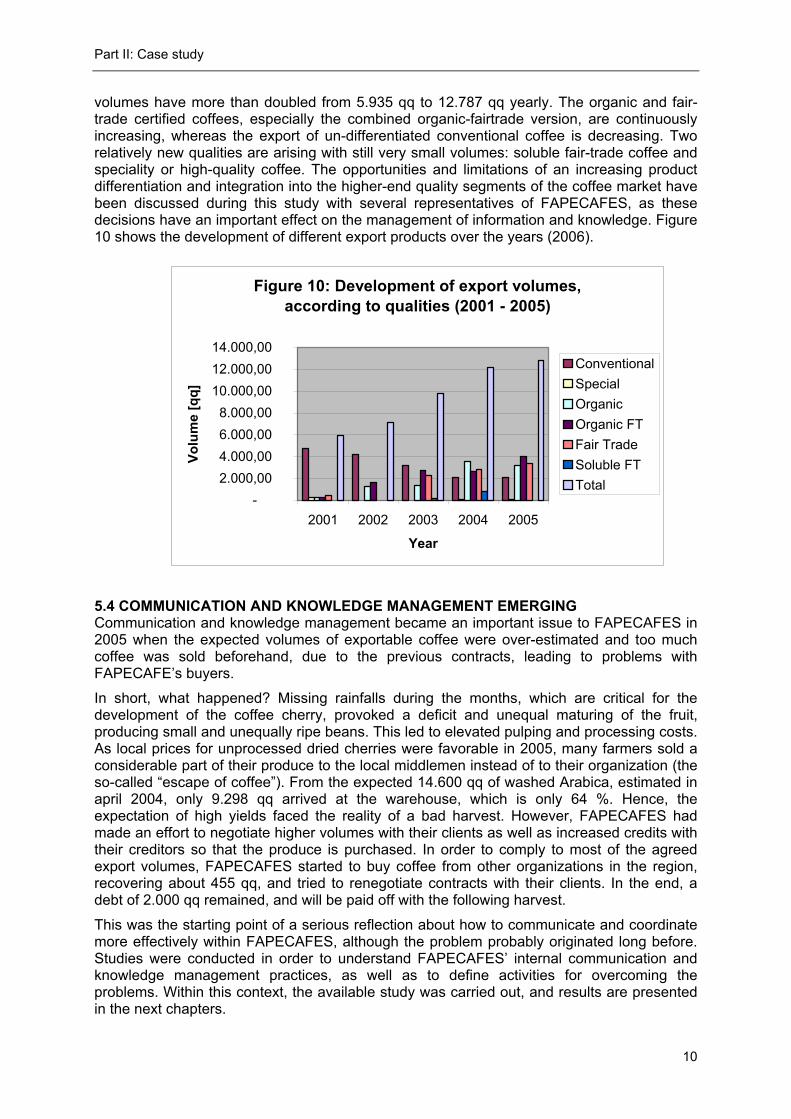
volumes have more than doubled from 5.935 qq to 12.787 qq yearly. The organic and fair-trade certified coffees, especially the combined organic-fairtrade version, are continuously increasing, whereas the export of un-differentiated conventional coffee is decreasing. Two relatively new qualities are arising with still very small volumes: soluble fair-trade coffee and speciality or high-quality coffee. The opportunities and limitations of an increasing product differentiation and integration into the higher-end quality segments of the coffee market have been discussed during this study with several representatives of FAPECAFES, as these decisions have an important effect on the management of information and knowledge. Figure 10 shows the development of different export products over the years (2006).
5.4 COMMUNICATION AND KNOWLEDGE MANAGEMENT EMERGING Communication and knowledge management became an important issue to FAPECAFES in 2005 when the expected volumes of exportable coffee were over-estimated and too much coffee was sold beforehand, due to the previous contracts, leading to problems with FAPECAFE’s buyers.
In short, what happened? Missing rainfalls during the months, which are critical for the development of the coffee cherry, provoked a deficit and unequal maturing of the fruit, producing small and unequally ripe beans. This led to elevated pulping and processing costs. As local prices for unprocessed dried cherries were favorable in 2005, many farmers sold a considerable part of their produce to the local middlemen instead of to their organization (the so-called “escape of coffee”). From the expected 14.600 qq of washed Arabica, estimated in april 2004, only 9.298 qq arrived at the warehouse, which is only 64 %. Hence, the expectation of high yields faced the reality of a bad harvest. However, FAPECAFES had made an effort to negotiate higher volumes with their clients as well as increased credits with their creditors so that the produce is purchased. In order to comply to most of the agreed export volumes, FAPECAFES started to buy coffee from other organizations in the region, recovering about 455 qq, and tried to renegotiate contracts with their clients. In the end, a debt of 2.000 qq remained, and will be paid off with the following harvest.
This was the starting point of a serious reflection about how to communicate and coordinate more effectively within FAPECAFES, although the problem probably originated long before. Studies were conducted in order to understand FAPECAFES’ internal communication and knowledge management practices, as well as to define activities for overcoming the problems. Within this context, the available study was carried out, and results are presented in the next chapters.
Figure 10: Development of export volumes, according to qualities (2001 - 2005)
- 2.000,00 4.000,00 6.000,00 8.000,00
10.000,00 12.000,00 14.000,00
2001 2002 2003 2004 2005
Year
Volu
me
[qq]
ConventionalSpecialOrganicOrganic FTFair TradeSoluble FTTotal
Part II: Case study
11
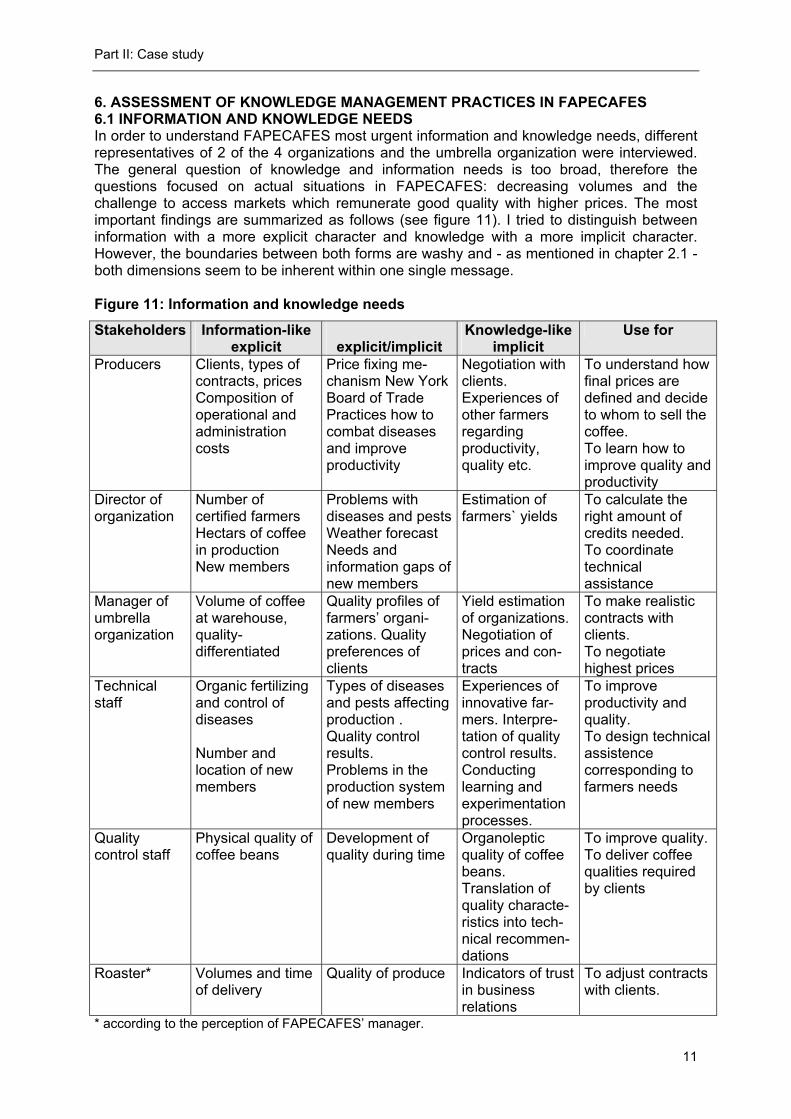
6. ASSESSMENT OF KNOWLEDGE MANAGEMENT PRACTICES IN FAPECAFES 6.1 INFORMATION AND KNOWLEDGE NEEDS In order to understand FAPECAFES most urgent information and knowledge needs, different representatives of 2 of the 4 organizations and the umbrella organization were interviewed. The general question of knowledge and information needs is too broad, therefore the questions focused on actual situations in FAPECAFES: decreasing volumes and the challenge to access markets which remunerate good quality with higher prices. The most important findings are summarized as follows (see figure 11). I tried to distinguish between information with a more explicit character and knowledge with a more implicit character. However, the boundaries between both forms are washy and - as mentioned in chapter 2.1 - both dimensions seem to be inherent within one single message. Figure 11: Information and knowledge needs
Stakeholders Information-like explicit
explicit/implicit
Knowledge-like implicit
Use for
Producers Clients, types of contracts, prices Composition of operational and administration costs
Price fixing me-chanism New York Board of Trade Practices how to combat diseases and improve productivity
Negotiation with clients. Experiences of other farmers regarding productivity, quality etc.
To understand how final prices are defined and decide to whom to sell the coffee. To learn how to improve quality and productivity
Director of organization
Number of certified farmers Hectars of coffee in production New members
Problems with diseases and pestsWeather forecast Needs and information gaps of new members
Estimation of farmers` yields
To calculate the right amount of credits needed. To coordinate technical assistance
Manager of umbrella organization
Volume of coffee at warehouse, quality-differentiated
Quality profiles of farmers’ organi-zations. Quality preferences of clients
Yield estimation of organizations. Negotiation of prices and con-tracts
To make realistic contracts with clients. To negotiate highest prices
Technical staff
Organic fertilizing and control of diseases Number and location of new members
Types of diseases and pests affecting production . Quality control results. Problems in the production system of new members
Experiences of innovative far-mers. Interpre-tation of quality control results. Conducting learning and experimentation processes.
To improve productivity and quality. To design technical assistence corresponding to farmers needs
Quality control staff
Physical quality of coffee beans
Development of quality during time
Organoleptic quality of coffee beans. Translation of quality characte-ristics into tech-nical recommen-dations
To improve quality. To deliver coffee qualities required by clients
Roaster* Volumes and time of delivery
Quality of produce Indicators of trust in business relations
To adjust contracts with clients.
* according to the perception of FAPECAFES’ manager.
Part II: Case study
12
First of all, it must be said that most of the interviewed persons were not aware of their information and knowledge needs, especially those with a more implicit character. Hence, the way to understand the underlying needs was not only to ask directly, but also to deduce the needs from analyzing the most crucial problems, supposing that information and knowledge is needed for problem solving.
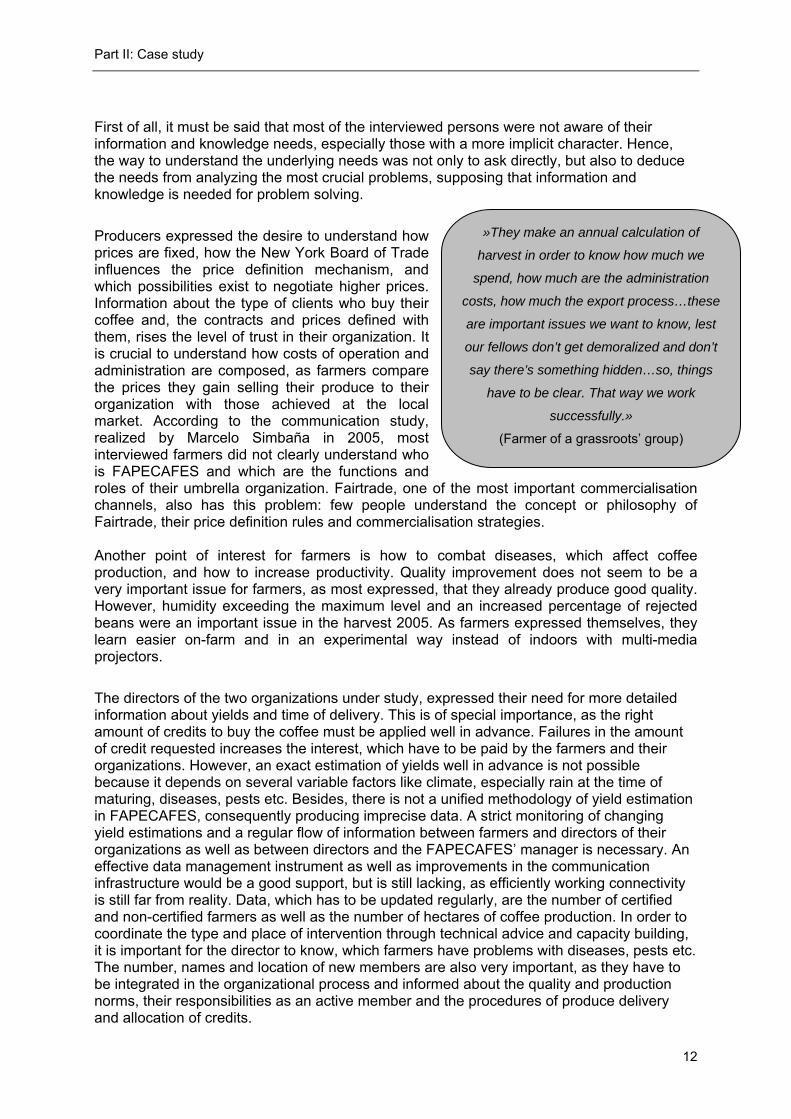
Producers expressed the desire to understand how prices are fixed, how the New York Board of Trade influences the price definition mechanism, and which possibilities exist to negotiate higher prices. Information about the type of clients who buy their coffee and, the contracts and prices defined with them, rises the level of trust in their organization. It is crucial to understand how costs of operation and administration are composed, as farmers compare the prices they gain selling their produce to their organization with those achieved at the local market. According to the communication study, realized by Marcelo Simbaña in 2005, most interviewed farmers did not clearly understand who is FAPECAFES and which are the functions and roles of their umbrella organization. Fairtrade, one of the most important commercialisation channels, also has this problem: few people understand the concept or philosophy of Fairtrade, their price definition rules and commercialisation strategies. Another point of interest for farmers is how to combat diseases, which affect coffee production, and how to increase productivity. Quality improvement does not seem to be a very important issue for farmers, as most expressed, that they already produce good quality. However, humidity exceeding the maximum level and an increased percentage of rejected beans were an important issue in the harvest 2005. As farmers expressed themselves, they learn easier on-farm and in an experimental way instead of indoors with multi-media projectors.
The directors of the two organizations under study, expressed their need for more detailed information about yields and time of delivery. This is of special importance, as the right amount of credits to buy the coffee must be applied well in advance. Failures in the amount of credit requested increases the interest, which have to be paid by the farmers and their organizations. However, an exact estimation of yields well in advance is not possible because it depends on several variable factors like climate, especially rain at the time of maturing, diseases, pests etc. Besides, there is not a unified methodology of yield estimation in FAPECAFES, consequently producing imprecise data. A strict monitoring of changing yield estimations and a regular flow of information between farmers and directors of their organizations as well as between directors and the FAPECAFES’ manager is necessary. An effective data management instrument as well as improvements in the communication infrastructure would be a good support, but is still lacking, as efficiently working connectivity is still far from reality. Data, which has to be updated regularly, are the number of certified and non-certified farmers as well as the number of hectares of coffee production. In order to coordinate the type and place of intervention through technical advice and capacity building, it is important for the director to know, which farmers have problems with diseases, pests etc. The number, names and location of new members are also very important, as they have to be integrated in the organizational process and informed about the quality and production norms, their responsibilities as an active member and the procedures of produce delivery and allocation of credits.
»They make an annual calculation of
harvest in order to know how much we
spend, how much are the administration
costs, how much the export process…these
are important issues we want to know, lest
our fellows don’t get demoralized and don’t
say there’s something hidden…so, things
have to be clear. That way we work
successfully.»
(Farmer of a grassroots’ group)
Part II: Case study
13
The manager of the umbrella organization has similar needs related to the estimation of yields of the four organizations. As he has to make contracts with buyers well in advance, he must obtain regularly updated information of each organization. During the harvest time, he has to carefully monitor the volumes of coffee bags, delivered to the warehouse, differentiated according to different qualities. Any changes of volumes or qualities delivered require adjustments in the preparation of charges to be exported. If quality preferences of clients and quality profiles of the different production regions are known, blends can be offered according to the client’s request and qualities with similar characteristics can replace each other. However, it is difficult to find a common code for coffee quality, if not only related to physical data of bean size, colour and defects, as will be shown later. For the technical staff it is highly important to know, which kind of diseases and pests affect the coffee production and farmers experiences with combating them. Most of the technical staff, which the farmers’ organizations can afford to pay, are inexperienced and come directly form university, hence they may provide farmers with new scientific information, but their abilities to conduct experimental learning processes with the farmers, using their knowledge based on years of experiences, is very low. Unfortunately, their knowledge about innovative farmers and their experiences with the adoption and adaptation of technologies is limited. The technical staff responsible for the quality control needs to understand and interpret data resulting from physical and organoleptic quality control. As organoleptic quality characteristics have a highly implicit dimension, it is not an easy task to translate this information into a kind of technical information, which can be understood and used by the technical advisors and the farmers in order to improve quality and address problems in the production and post harvest system. Access to and analysis of historical quality data allow the quality control staff to monitor the quality development over time and influence strategic decisions, like financing technical staff. It was still not possible to interview directly a roaster of FAPECAFES, but the perception of the FAPECAFES’ manager about the roaster’ information and knowledge needs as well as interviews with other roasters of other farmers’ organizations may give some hints. For the roaster information about the quality of produce, based on the physical and organoleptic assessment of samples, is highly relevant to make the decision of purchasing the final product. A second major issue is exact information about volumes and time of delivery in order to adjust contracts with the clients. According to speciality coffee buyers, who invest a lot in the search for high quality coffee, it is highly relevant to get information about the farmers’ organization, which indicate a high probability of build-up to a trustful business relationship.
Part II: Case study
14
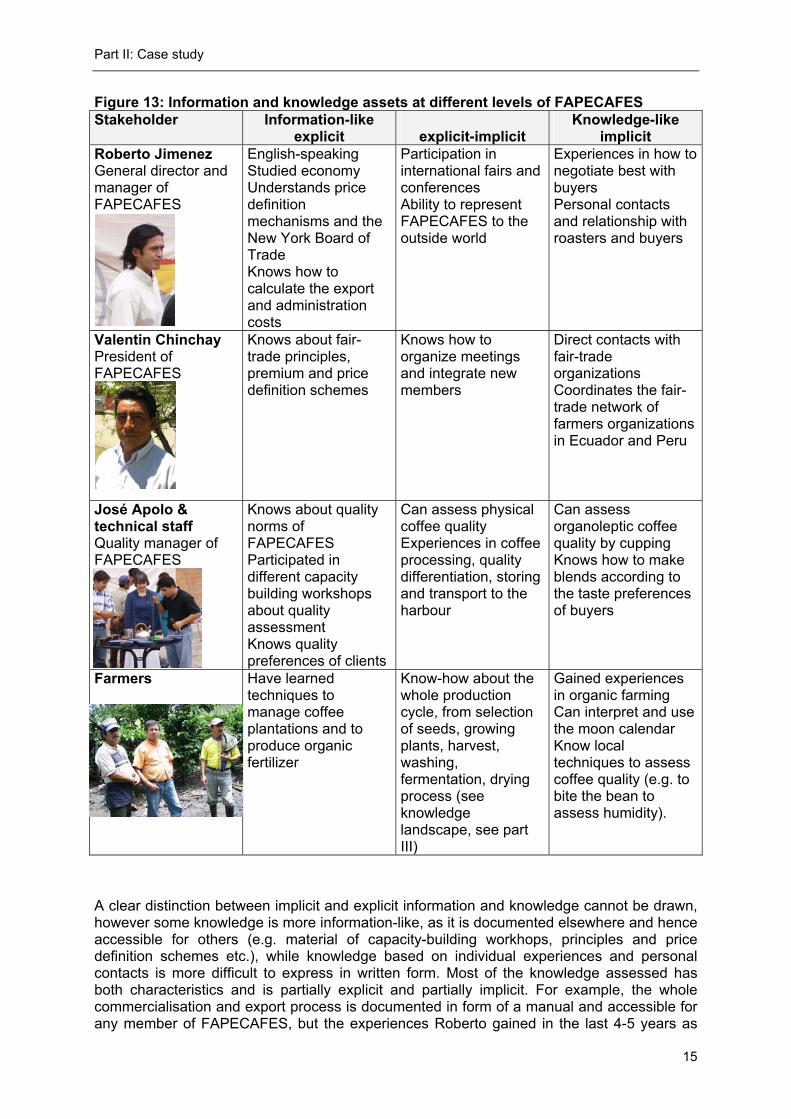
6.2 INFORMATION AND KNOWLEDGE ASSETS The next question in the assessment of knowledge management practices was, which type of information and knowledge do different stakeholders possess and who are the “holders” of this knowledge?
There are many representatives and leaders of FAPECAFES, who have huge amounts of experiences gained and knowledge accumulated. Some of them are recognized as important knowledge carriers, especially those in leading positions. But most of them are neither recognized nor aware of the knowledge they have. The next figure gives an overview of the stock of knowledge within FAPECAFES:
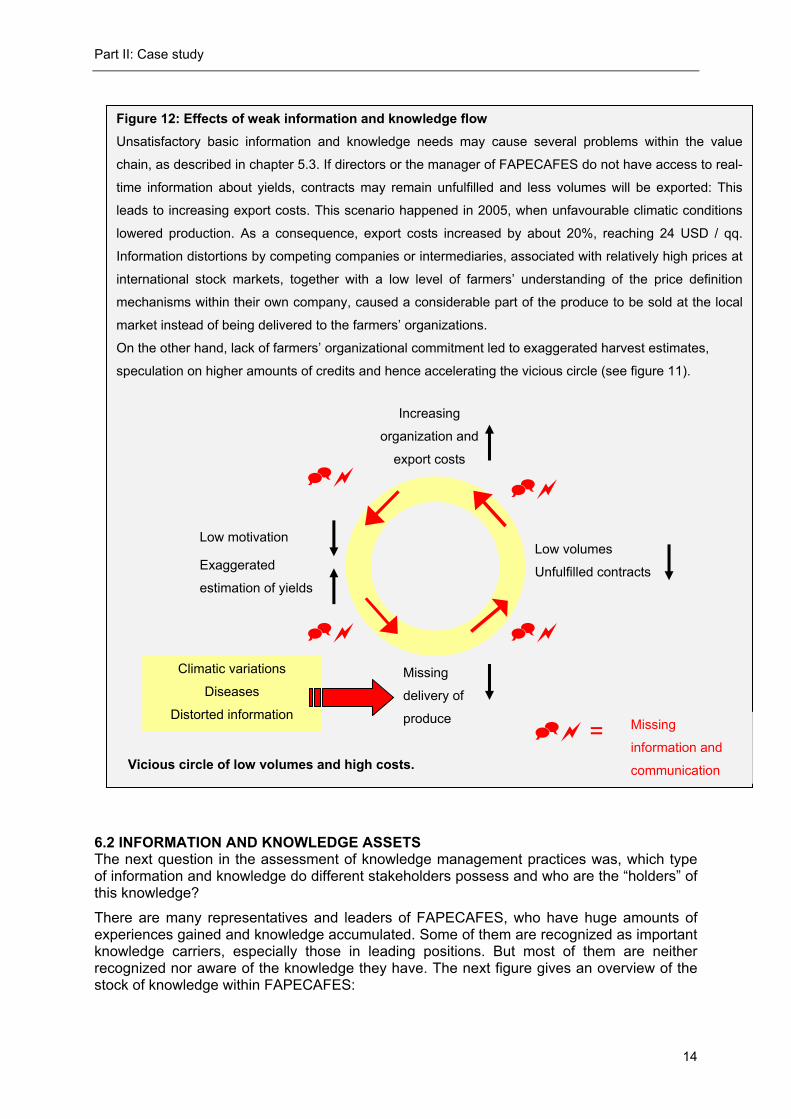
Figure 12: Effects of weak information and knowledge flow Unsatisfactory basic information and knowledge needs may cause several problems within the value
chain, as described in chapter 5.3. If directors or the manager of FAPECAFES do not have access to real-
time information about yields, contracts may remain unfulfilled and less volumes will be exported: This
leads to increasing export costs. This scenario happened in 2005, when unfavourable climatic conditions
lowered production. As a consequence, export costs increased by about 20%, reaching 24 USD / qq.
Information distortions by competing companies or intermediaries, associated with relatively high prices at
international stock markets, together with a low level of farmers’ understanding of the price definition
mechanisms within their own company, caused a considerable part of the produce to be sold at the local
market instead of being delivered to the farmers’ organizations.
On the other hand, lack of farmers’ organizational commitment led to exaggerated harvest estimates,
speculation on higher amounts of credits and hence accelerating the vicious circle (see figure 11).
Vicious circle of low volumes and high costs.
Missing
delivery of
produce
Increasing
organization and
export costs
Low volumes
Unfulfilled contracts Exaggerated
estimation of yields
Low motivation
Climatic variations
Diseases
Distorted information Missing
information and
communication
=
Part II: Case study
15
Figure 13: Information and knowledge assets at different levels of FAPECAFES Stakeholder Information-like
explicit
explicit-implicit Knowledge-like
implicit Roberto Jimenez General director and manager of FAPECAFES
English-speaking Studied economy Understands price definition mechanisms and the New York Board of Trade Knows how to calculate the export and administration costs
Participation in international fairs and conferences Ability to represent FAPECAFES to the outside world
Experiences in how to negotiate best with buyers Personal contacts and relationship with roasters and buyers
Valentin Chinchay President of FAPECAFES
Knows about fair-trade principles, premium and price definition schemes
Knows how to organize meetings and integrate new members
Direct contacts with fair-trade organizations Coordinates the fair-trade network of farmers organizations in Ecuador and Peru
José Apolo & technical staff Quality manager of FAPECAFES
Knows about quality norms of FAPECAFES Participated in different capacity building workshops about quality assessment Knows quality preferences of clients
Can assess physical coffee quality Experiences in coffee processing, quality differentiation, storing and transport to the harbour
Can assess organoleptic coffee quality by cupping Knows how to make blends according to the taste preferences of buyers
Farmers
Have learned techniques to manage coffee plantations and to produce organic fertilizer
Know-how about the whole production cycle, from selection of seeds, growing plants, harvest, washing, fermentation, drying process (see knowledge landscape, see part III)
Gained experiences in organic farming Can interpret and use the moon calendar Know local techniques to assess coffee quality (e.g. to bite the bean to assess humidity).
A clear distinction between implicit and explicit information and knowledge cannot be drawn, however some knowledge is more information-like, as it is documented elsewhere and hence accessible for others (e.g. material of capacity-building workhops, principles and price definition schemes etc.), while knowledge based on individual experiences and personal contacts is more difficult to express in written form. Most of the knowledge assessed has both characteristics and is partially explicit and partially implicit. For example, the whole commercialisation and export process is documented in form of a manual and accessible for any member of FAPECAFES, but the experiences Roberto gained in the last 4-5 years as
Part II: Case study
16
FAPECAFES’ manager with lots of unforeseen things happened, are neither easy to write down nor are easily accessible off-hand.
A major problem is that most of the knowledge carriers are not recognized and consequently their knowledge is under valuated. For example, farmers have gained lots of experiences in organic farm management as well as coffee production and processing methods and could contribute to close information gaps between themselves and new members. In contrast, technical staff often do not have this kind of practical experiences which in turn leads to inefficient and cost-intensive technology-transfer practices, while horizontal knowledge sharing between farmers could be much more efficient. Another problem is, that the leaders with expert knowledge do not have successors, therefore if they fail, the whole organization is in danger. This is the case of Valentín Chinchay, FAPECAFES’ president during the last 4 years, who will hand-over his responsibilities in 2007. However, a new leader is still not in sight. 6.3 FLOW OF INFORMATION AND KNOWLEDGE This chapter analyzes the flow of information and knowledge and the type of media used within FAPECAFES as well as to the outside world.
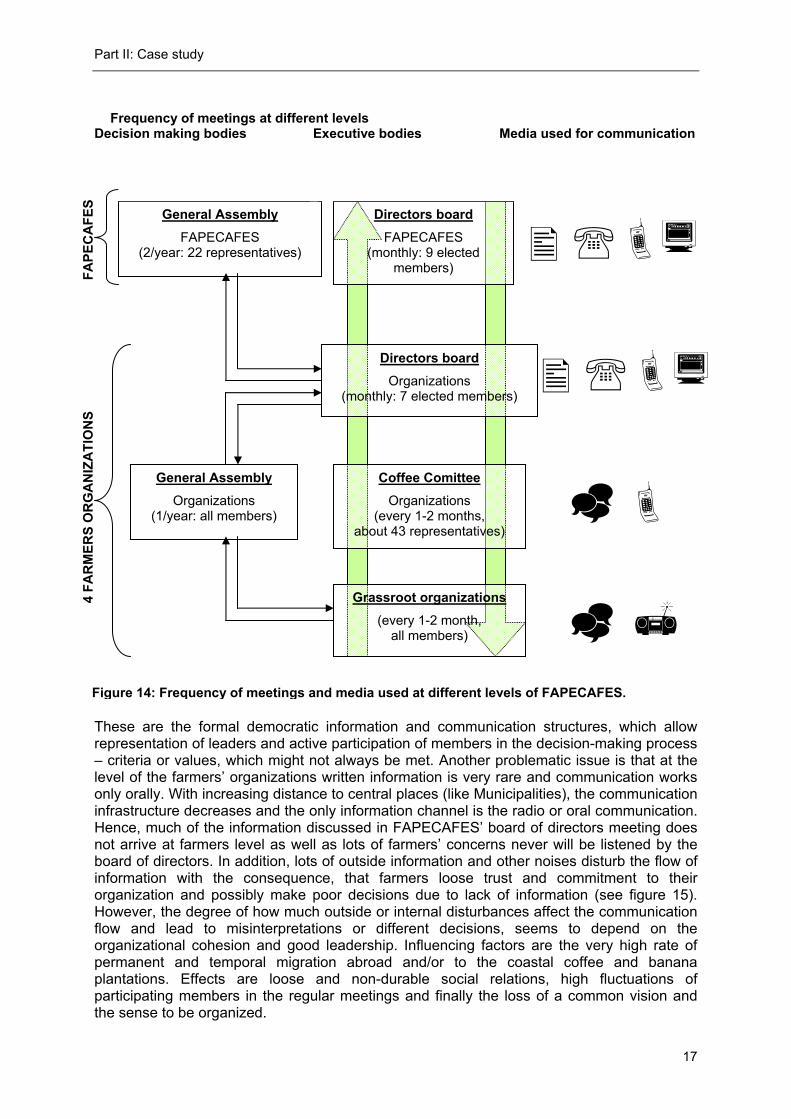
6.3.1 Internal information and knowledge flows Within FAPECAFES, the most important way of distributing information and knowledge is through meetings held at different levels and with different frequencies (see figure 14): FAPECAFES and it’s organizations are structured democratically. The General Assembly held twice a year is the highest decision-making body. Four representatives of each organization participate in this assembly, where decisions are made about budget, investments, amount of capitalization, admission of new member organizations, distribution and use of premiums, revision and acceptance of financial and commercialisation reports etc. A board of directors of FAPECAFES with two representatives per organization is elected, which meets monthly in order to coordinate and organize daily business activities. The administrative department of FAPECAFES is responsible for the execution of these activities. It is composed of the general director or manager, the financial and the technical unit. At this organizational level the use of internet, telephone, mobile phones and fax is frequent.
The representatives of the four organizations are the “brokers” who bridge the different organizational levels: FAPECAFES and it’s organizations. These representatives inform their organization’s elected board of directors, which meets monthly (directly after the meeting of FAPECAFES’ board of directors), as well as the “Coffee Committee”, which meets bimonthly and is composed of two representatives of each grassroots group. The number of grassroots groups of each organization varies between 14 and 35, according to the number of members and the geographical distances. The representatives of the grassroots groups transfer the information given in the Coffee Committee to their grassroots group, which meets also bimonthly directly after the Coffee Committee. Each of the four organizations holds a yearly general assembly as the maximum decision-making body, where information about prices, contracts and exported volumes is disseminated, decisions are taken, e.g. regarding the use of the fair-trade premium. Decisions, problems and opinions are transferred back to FAPECAFES by the organization’s director. Figure 14 displays the frequency of meetings at the different levels of FAPECAFES, from the Director´s Board to the grassroot organizations.
Part II: Case study
17
Frequency of meetings at different levels
Decision making bodies Executive bodies Media used for communication
These are the formal democratic information and communication structures, which allow representation of leaders and active participation of members in the decision-making process – criteria or values, which might not always be met. Another problematic issue is that at the level of the farmers’ organizations written information is very rare and communication works only orally. With increasing distance to central places (like Municipalities), the communication infrastructure decreases and the only information channel is the radio or oral communication. Hence, much of the information discussed in FAPECAFES’ board of directors meeting does not arrive at farmers level as well as lots of farmers’ concerns never will be listened by the board of directors. In addition, lots of outside information and other noises disturb the flow of information with the consequence, that farmers loose trust and commitment to their organization and possibly make poor decisions due to lack of information (see figure 15). However, the degree of how much outside or internal disturbances affect the communication flow and lead to misinterpretations or different decisions, seems to depend on the organizational cohesion and good leadership. Influencing factors are the very high rate of permanent and temporal migration abroad and/or to the coastal coffee and banana plantations. Effects are loose and non-durable social relations, high fluctuations of participating members in the regular meetings and finally the loss of a common vision and the sense to be organized.
Figure 14: Frequency of meetings and media used at different levels of FAPECAFES.
Directors board FAPECAFES
(monthly: 9 elected members)
Coffee Comittee Organizations
(every 1-2 months, about 43 representatives)
Grassroot organizations (every 1-2 month,
all members)
℡
Directors board Organizations
(monthly: 7 elected members)
General Assembly FAPECAFES
(2/year: 22 representatives)
General Assembly Organizations
(1/year: all members)
FAPE
CA
FES
4 FA
RM
ERS
OR
GA
NIZ
ATI
ON
S
℡
Part II: Case study
18
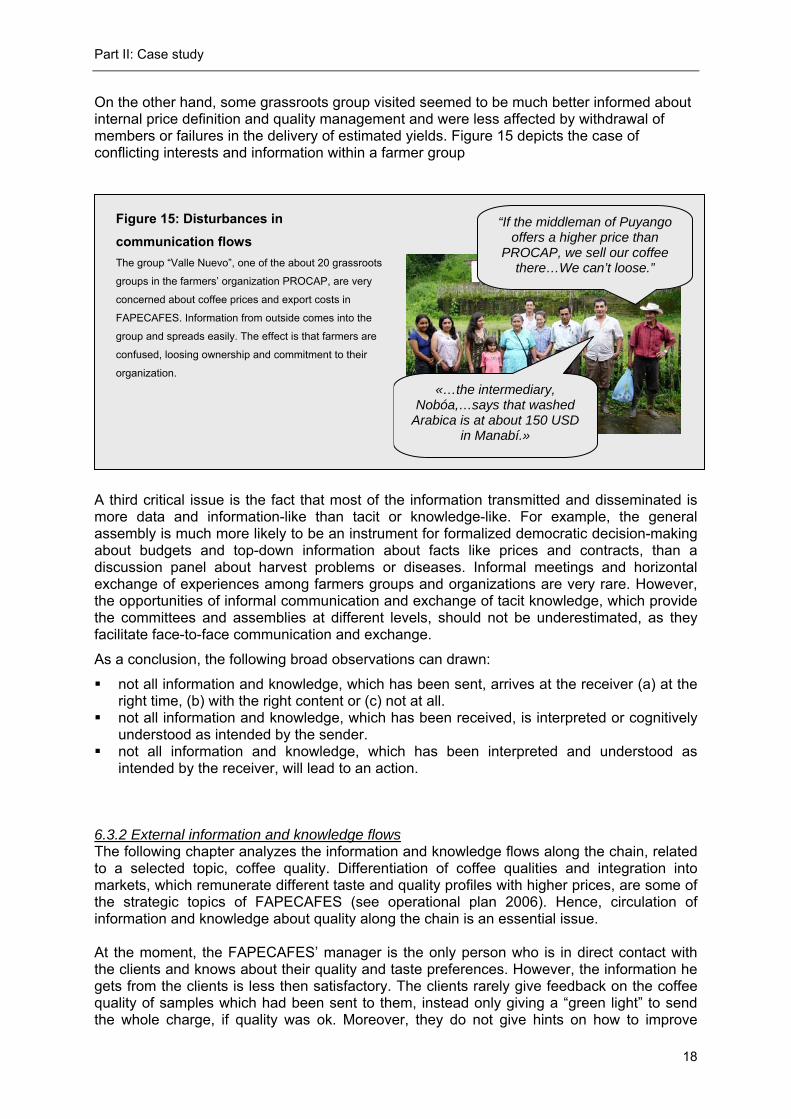
On the other hand, some grassroots group visited seemed to be much better informed about internal price definition and quality management and were less affected by withdrawal of members or failures in the delivery of estimated yields. Figure 15 depicts the case of conflicting interests and information within a farmer group
A third critical issue is the fact that most of the information transmitted and disseminated is more data and information-like than tacit or knowledge-like. For example, the general assembly is much more likely to be an instrument for formalized democratic decision-making about budgets and top-down information about facts like prices and contracts, than a discussion panel about harvest problems or diseases. Informal meetings and horizontal exchange of experiences among farmers groups and organizations are very rare. However, the opportunities of informal communication and exchange of tacit knowledge, which provide the committees and assemblies at different levels, should not be underestimated, as they facilitate face-to-face communication and exchange.
As a conclusion, the following broad observations can drawn:
not all information and knowledge, which has been sent, arrives at the receiver (a) at the right time, (b) with the right content or (c) not at all.
not all information and knowledge, which has been received, is interpreted or cognitively understood as intended by the sender.
not all information and knowledge, which has been interpreted and understood as intended by the receiver, will lead to an action.
6.3.2 External information and knowledge flows The following chapter analyzes the information and knowledge flows along the chain, related to a selected topic, coffee quality. Differentiation of coffee qualities and integration into markets, which remunerate different taste and quality profiles with higher prices, are some of the strategic topics of FAPECAFES (see operational plan 2006). Hence, circulation of information and knowledge about quality along the chain is an essential issue. At the moment, the FAPECAFES’ manager is the only person who is in direct contact with the clients and knows about their quality and taste preferences. However, the information he gets from the clients is less then satisfactory. The clients rarely give feedback on the coffee quality of samples which had been sent to them, instead only giving a “green light” to send the whole charge, if quality was ok. Moreover, they do not give hints on how to improve
“If the middleman of Puyango offers a higher price than
PROCAP, we sell our coffee there…We can’t loose.”
«…the intermediary, Nobóa,…says that washed
Arabica is at about 150 USD in Manabí.»
Figure 15: Disturbances in communication flows The group “Valle Nuevo”, one of the about 20 grassroots
groups in the farmers’ organization PROCAP, are very
concerned about coffee prices and export costs in
FAPECAFES. Information from outside comes into the
group and spreads easily. The effect is that farmers are
confused, loosing ownership and commitment to their
organization.
Part II: Case study
19
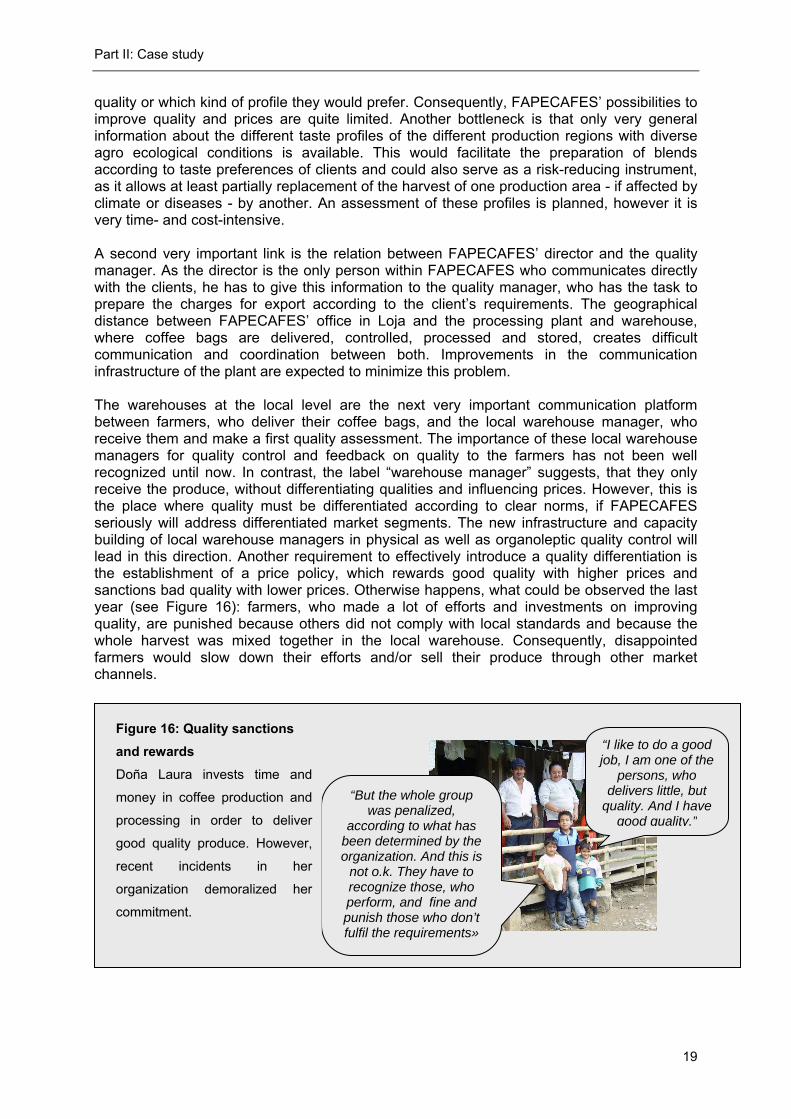
quality or which kind of profile they would prefer. Consequently, FAPECAFES’ possibilities to improve quality and prices are quite limited. Another bottleneck is that only very general information about the different taste profiles of the different production regions with diverse agro ecological conditions is available. This would facilitate the preparation of blends according to taste preferences of clients and could also serve as a risk-reducing instrument, as it allows at least partially replacement of the harvest of one production area - if affected by climate or diseases - by another. An assessment of these profiles is planned, however it is very time- and cost-intensive. A second very important link is the relation between FAPECAFES’ director and the quality manager. As the director is the only person within FAPECAFES who communicates directly with the clients, he has to give this information to the quality manager, who has the task to prepare the charges for export according to the client’s requirements. The geographical distance between FAPECAFES’ office in Loja and the processing plant and warehouse, where coffee bags are delivered, controlled, processed and stored, creates difficult communication and coordination between both. Improvements in the communication infrastructure of the plant are expected to minimize this problem. The warehouses at the local level are the next very important communication platform between farmers, who deliver their coffee bags, and the local warehouse manager, who receive them and make a first quality assessment. The importance of these local warehouse managers for quality control and feedback on quality to the farmers has not been well recognized until now. In contrast, the label “warehouse manager” suggests, that they only receive the produce, without differentiating qualities and influencing prices. However, this is the place where quality must be differentiated according to clear norms, if FAPECAFES seriously will address differentiated market segments. The new infrastructure and capacity building of local warehouse managers in physical as well as organoleptic quality control will lead in this direction. Another requirement to effectively introduce a quality differentiation is the establishment of a price policy, which rewards good quality with higher prices and sanctions bad quality with lower prices. Otherwise happens, what could be observed the last year (see Figure 16): farmers, who made a lot of efforts and investments on improving quality, are punished because others did not comply with local standards and because the whole harvest was mixed together in the local warehouse. Consequently, disappointed farmers would slow down their efforts and/or sell their produce through other market channels.
“But the whole group was penalized,
according to what has been determined by the organization. And this is
not o.k. They have to recognize those, who perform, and fine and punish those who don’t fulfil the requirements»
“I like to do a good job, I am one of the
persons, who delivers little, but
quality. And I have good quality.”
Figure 16: Quality sanctions and rewards Doña Laura invests time and
money in coffee production and
processing in order to deliver
good quality produce. However,
recent incidents in her
organization demoralized her
commitment.
Part II: Case study
20
Finally, an important link between farmers, warehouse manager and technical staff needs to be created: results of the quality assessment realized by the warehouse manager are a prime source of information for the technical staff, as they should focus their technical assistance on actual problems that affect coffee quality. However, experiential mental learning and horizontal exchange of experiences concerning good quality production and management between farmers groups and technical staff are not common. In contrast, the technical assistance program is characterized by a traditional “transfer-of-technology” approach, which lacks a clear orientation towards farmers real needs, and depends highly on external funding, causing little space for manoeuvre and change.
The following conclusions can be drawn: Much quality related knowledge and information is lacking and must be assessed at both
sides of the chain: at the level of the production sites (quality profiles) and at the level of the roasters (taste preferences).
Different languages, deficient communication infrastructure and a reduced awareness about the powerful meaning of quality related information difficult the direct links between roasters, quality manager and local warehouse managers.
The technical staff – possibly as a consequence of the years long period of donor-funded assistance by external NGO’s - seems to work parallel to the chain instead of as an integrated part. Consequently, the programming of technical assistance does not respond to the problems arising within the chain, nor is it linked with the relevant nodes of the chain.
Missing clear price policies within FAPECAFES, differentiated according to qualities, break with farmers’ commitment to invest in quality improvements and hence thwart any efforts to integrate into speciality markets.
Part II: Case study
21
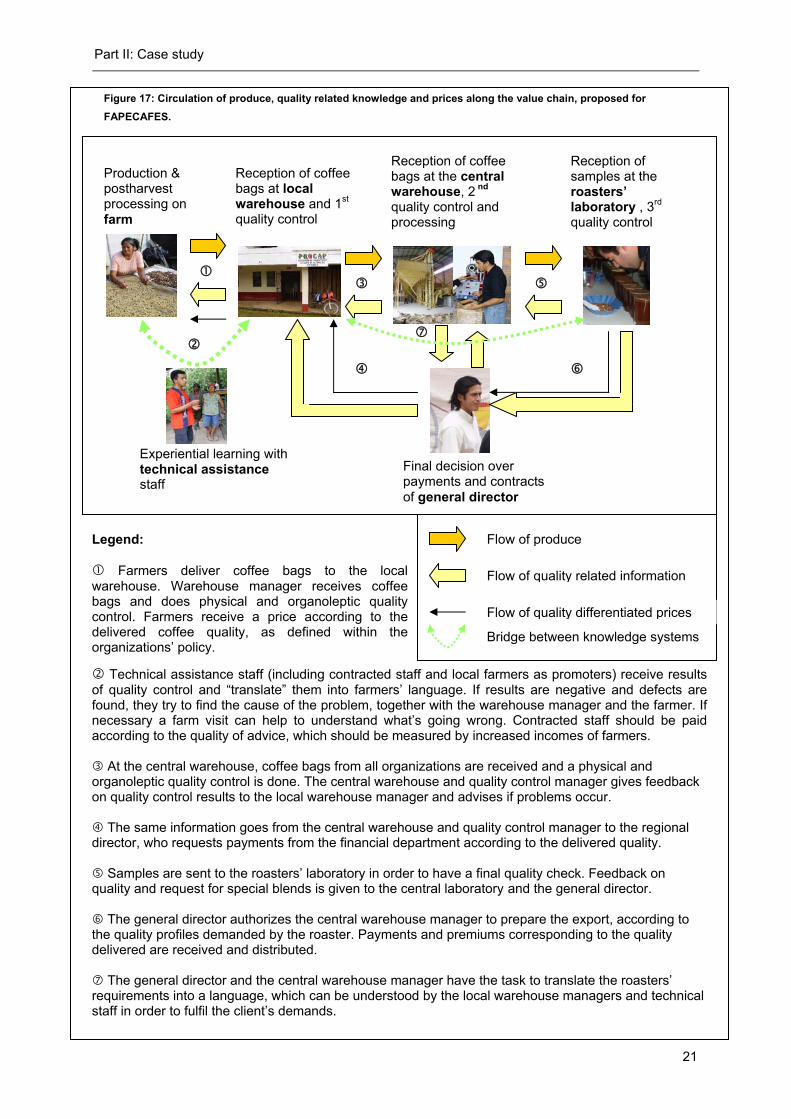
Figure 17: Circulation of produce, quality related knowledge and prices along the value chain, proposed for FAPECAFES.
Production & postharvest processing on farm
Reception of coffee bags at local warehouse and 1st quality control
Reception of coffee bags at the central warehouse, 2 nd quality control and processing
Reception of samples at the roasters’ laboratory , 3rd quality control
Experiential learning with technical assistance staff
Final decision over payments and contracts of general director
Legend:
Farmers deliver coffee bags to the local warehouse. Warehouse manager receives coffee bags and does physical and organoleptic quality control. Farmers receive a price according to the delivered coffee quality, as defined within the organizations’ policy.
Technical assistance staff (including contracted staff and local farmers as promoters) receive results of quality control and “translate” them into farmers’ language. If results are negative and defects are found, they try to find the cause of the problem, together with the warehouse manager and the farmer. If necessary a farm visit can help to understand what’s going wrong. Contracted staff should be paid according to the quality of advice, which should be measured by increased incomes of farmers.
At the central warehouse, coffee bags from all organizations are received and a physical and organoleptic quality control is done. The central warehouse and quality control manager gives feedback on quality control results to the local warehouse manager and advises if problems occur.
The same information goes from the central warehouse and quality control manager to the regional director, who requests payments from the financial department according to the delivered quality.
Samples are sent to the roasters’ laboratory in order to have a final quality check. Feedback on quality and request for special blends is given to the central laboratory and the general director.
The general director authorizes the central warehouse manager to prepare the export, according to the quality profiles demanded by the roaster. Payments and premiums corresponding to the quality delivered are received and distributed.
The general director and the central warehouse manager have the task to translate the roasters’ requirements into a language, which can be understood by the local warehouse managers and technical staff in order to fulfil the client’s demands.
Flow of produce
Flow of quality related information
Bridge between knowledge systems
Flow of quality differentiated prices
Part II: Case study
22
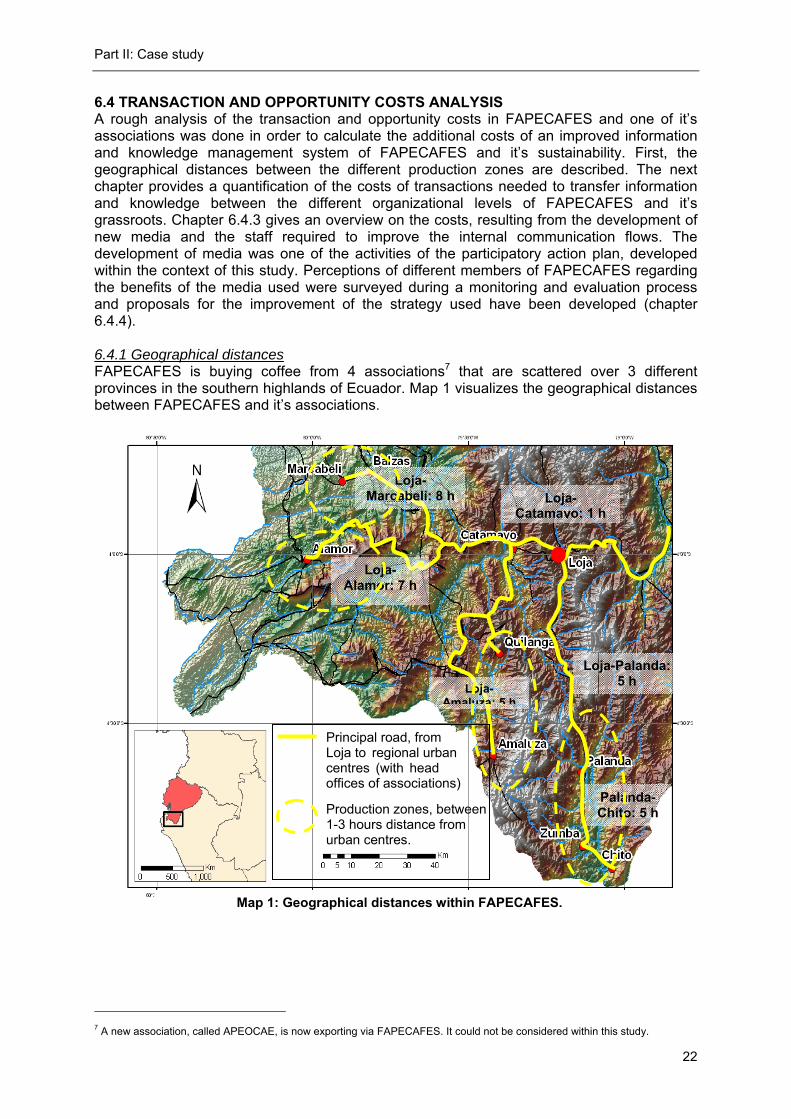
6.4 TRANSACTION AND OPPORTUNITY COSTS ANALYSIS A rough analysis of the transaction and opportunity costs in FAPECAFES and one of it’s associations was done in order to calculate the additional costs of an improved information and knowledge management system of FAPECAFES and it’s sustainability. First, the geographical distances between the different production zones are described. The next chapter provides a quantification of the costs of transactions needed to transfer information and knowledge between the different organizational levels of FAPECAFES and it’s grassroots. Chapter 6.4.3 gives an overview on the costs, resulting from the development of new media and the staff required to improve the internal communication flows. The development of media was one of the activities of the participatory action plan, developed within the context of this study. Perceptions of different members of FAPECAFES regarding the benefits of the media used were surveyed during a monitoring and evaluation process and proposals for the improvement of the strategy used have been developed (chapter 6.4.4). 6.4.1 Geographical distances FAPECAFES is buying coffee from 4 associations7 that are scattered over 3 different provinces in the southern highlands of Ecuador. Map 1 visualizes the geographical distances between FAPECAFES and it’s associations.
7 A new association, called APEOCAE, is now exporting via FAPECAFES. It could not be considered within this study.
Map 1: Geographical distances within FAPECAFES.
Loja-Palanda: 5 h
Palanda-Chito: 5 h
Loja-Amaluza: 5 h
Loja-Alamor: 7 h
Loja-Marcabeli: 8 h Loja-
Catamayo: 1 h
Principal road, from Loja to regional urban centres (with head offices of associations)
Production zones, between 1-3 hours distance from urban centres.
Part II: Case study
23
As transport and communication infrastructure are still poor, long journeys are usual in order to make transactions or to get access to services: bus drive from Loja to the associations’ headquarter, mostly based in the province capital, takes about 5 – 10 hours, generating costs between 5 and 10 USD8. Travel from the association’s headquarters to the different farms takes about 1-5 hours using available transport means: bus, local “chiva”, pick-up, motorbike, donkey’s back or on foot. Especially during the rainy season transport is often hampered due to heavy landslides and destroyed bridges9. At the capitals’ level, phone boxes with national and international connections exist, as well as providers of mobile phones and internet services. However, connectivity decreases rapidly with increasing geographic distance within the rural areas, where the isolated farms are widespread. The associations mostly have only poor communication means: APECAP has one telephone line and can only use the Municipality’s internet access. PROCAP is at the moment totally disconnected, as the office and warehouse moved and still wait for new lines. The only outside connection is the mobile phone of one of the staff members or the public phone boxes, about 15 minutes walk from the office, which affects a fluent and bilateral communication. Problematic is the missing connectivity between the central warehouse and laboratory, where coffee quality is assessed, samples are prepared for the clients and bags are prepared for export. The warehouse and quality control manager are waiting the last 6 months for a telephone line and internet connection to be able to communicate directly with the general director and the clients. 6.4.2 Transaction and opportunity costs Transaction costs - as used in this study - are understood as all the costs, generated by organizational and communicative actions. Hence, they include telephone and internet costs as well as the costs of all meetings and assemblies held at the different levels of the federation: mobilization to the place of meetings, alimentation, accommodation of the participating members as well as the remuneration of frequently travelling staff, which represent the opportunity costs of the working day.
At the moment, these costs of organization at the level of FAPECAFES, add up to 10.732 USD in 2006, which is equivalent to 1,15 USD/qq (calculated on the base of 9.250 qq coffee exported, see figure 18). These costs represent about 21% of the administration costs and about 7% of the total costs (which include the export process, administration, certification and interest = 17,05 USD/qq in 2006). In addition to the costs at FAPECAFES’ level, each association has their own transaction costs for the internal meetings and field trips (not including the technical assistance!). In the case of APECAP these costs add up to 5.393 USD in 2006, which is equivalent to 0,504 USD/qq (see figure 19). These costs represent about 28% of APECAP’s administration costs and about 11,5 % of the total costs at the associations’ level (including transport, administration and interests = 4,39 USD/qq in 2006). See annex 4 for more detailed data of transaction and opportunity costs. The transaction costs by FAPECAFES and the associations do not include the opportunity costs of farmers, joining the regular meetings of their groups (bi-monthly) and of the general assembly (once a year), nor do they regard the opportunity costs of the group’s leaders, who additionally have to assist the Coffee Committee (bi-monthly). Hence, a normal member has to invest 7 and a leader 13 working days. This means, if calculated by 7 USD/day10, a cost of 49 and 91 USD/year respectively. A farmer, who produces 10 qq/ha, will have a yearly net income of about 525,60 USD (organic fair-trade coffee) or 375,60 USD (conventional fair- 8 The minimum loan for one working day is between 6 and 8 USD/day (=8 hours). 9 During my fieldtrip in april 2006, about 50 landslides blocked the road between Loja and Zumba and stopped any traffic for 5
days. 10 An 8 hours working day (=”jornal”) for a labourer ranges between 6 and 8 USD/day.
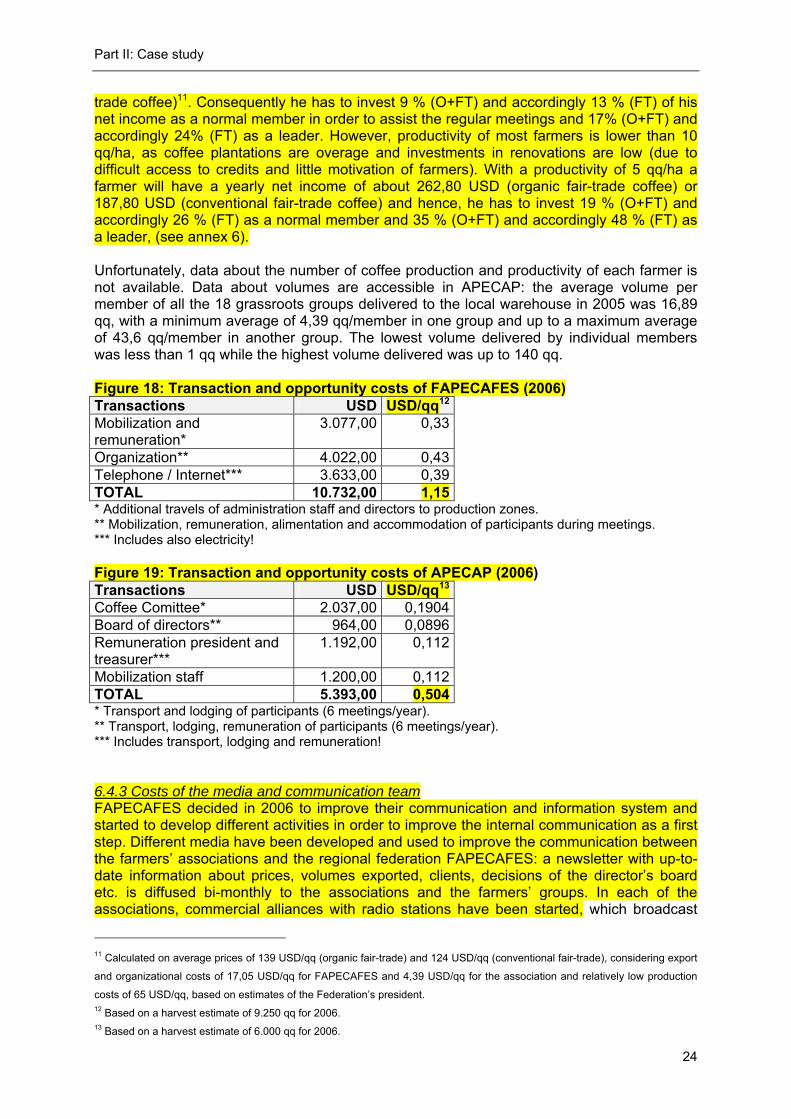
Part II: Case study
24
trade coffee)11. Consequently he has to invest 9 % (O+FT) and accordingly 13 % (FT) of his net income as a normal member in order to assist the regular meetings and 17% (O+FT) and accordingly 24% (FT) as a leader. However, productivity of most farmers is lower than 10 qq/ha, as coffee plantations are overage and investments in renovations are low (due to difficult access to credits and little motivation of farmers). With a productivity of 5 qq/ha a farmer will have a yearly net income of about 262,80 USD (organic fair-trade coffee) or 187,80 USD (conventional fair-trade coffee) and hence, he has to invest 19 % (O+FT) and accordingly 26 % (FT) as a normal member and 35 % (O+FT) and accordingly 48 % (FT) as a leader, (see annex 6). Unfortunately, data about the number of coffee production and productivity of each farmer is not available. Data about volumes are accessible in APECAP: the average volume per member of all the 18 grassroots groups delivered to the local warehouse in 2005 was 16,89 qq, with a minimum average of 4,39 qq/member in one group and up to a maximum average of 43,6 qq/member in another group. The lowest volume delivered by individual members was less than 1 qq while the highest volume delivered was up to 140 qq. Figure 18: Transaction and opportunity costs of FAPECAFES (2006) Transactions USD USD/qq12
Mobilization and remuneration*
3.077,00 0,33
Organization** 4.022,00 0,43Telephone / Internet*** 3.633,00 0,39TOTAL 10.732,00 1,15* Additional travels of administration staff and directors to production zones. ** Mobilization, remuneration, alimentation and accommodation of participants during meetings. *** Includes also electricity! Figure 19: Transaction and opportunity costs of APECAP (2006) Transactions USD USD/qq13
Coffee Comittee* 2.037,00 0,1904Board of directors** 964,00 0,0896Remuneration president and treasurer***
1.192,00 0,112
Mobilization staff 1.200,00 0,112TOTAL 5.393,00 0,504* Transport and lodging of participants (6 meetings/year). ** Transport, lodging, remuneration of participants (6 meetings/year). *** Includes transport, lodging and remuneration! 6.4.3 Costs of the media and communication team FAPECAFES decided in 2006 to improve their communication and information system and started to develop different activities in order to improve the internal communication as a first step. Different media have been developed and used to improve the communication between the farmers’ associations and the regional federation FAPECAFES: a newsletter with up-to-date information about prices, volumes exported, clients, decisions of the director’s board etc. is diffused bi-monthly to the associations and the farmers’ groups. In each of the associations, commercial alliances with radio stations have been started, which broadcast
11 Calculated on average prices of 139 USD/qq (organic fair-trade) and 124 USD/qq (conventional fair-trade), considering export
and organizational costs of 17,05 USD/qq for FAPECAFES and 4,39 USD/qq for the association and relatively low production
costs of 65 USD/qq, based on estimates of the Federation’s president. 12 Based on a harvest estimate of 9.250 qq for 2006. 13 Based on a harvest estimate of 6.000 qq for 2006.
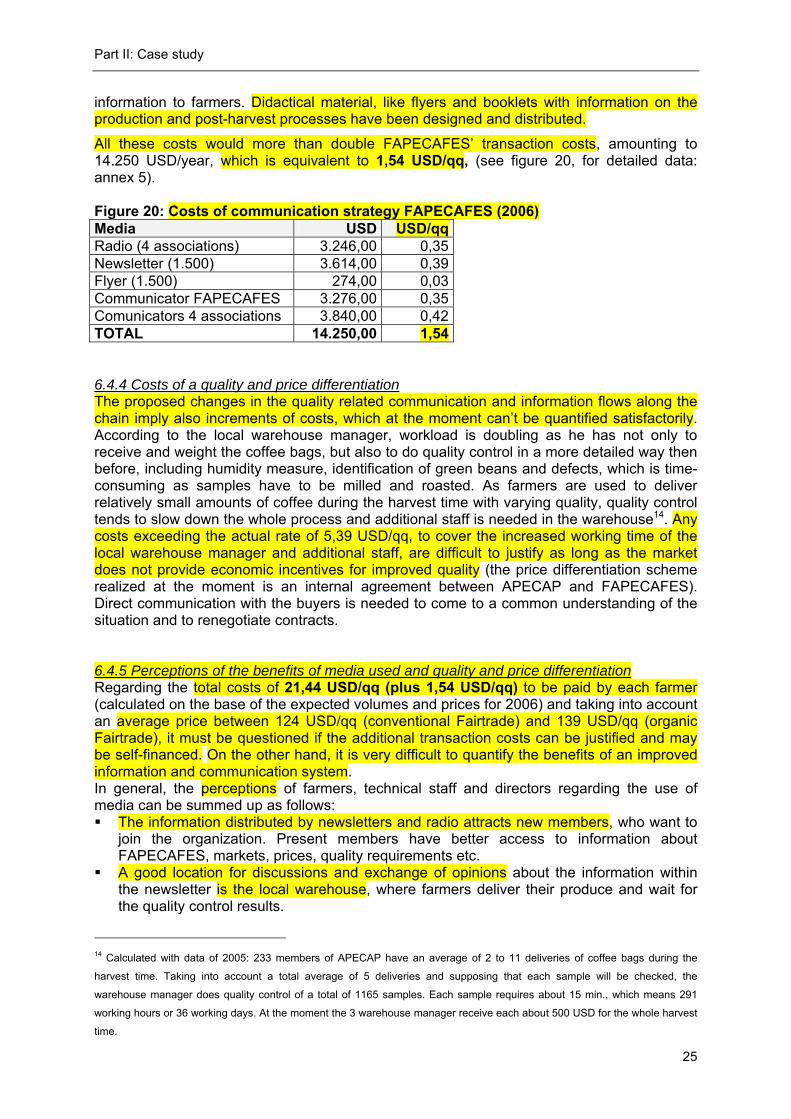
Part II: Case study
25
information to farmers. Didactical material, like flyers and booklets with information on the production and post-harvest processes have been designed and distributed.
All these costs would more than double FAPECAFES’ transaction costs, amounting to 14.250 USD/year, which is equivalent to 1,54 USD/qq, (see figure 20, for detailed data: annex 5). Figure 20: Costs of communication strategy FAPECAFES (2006) Media USD USD/qqRadio (4 associations) 3.246,00 0,35Newsletter (1.500) 3.614,00 0,39Flyer (1.500) 274,00 0,03Communicator FAPECAFES 3.276,00 0,35Comunicators 4 associations 3.840,00 0,42TOTAL 14.250,00 1,54 6.4.4 Costs of a quality and price differentiation The proposed changes in the quality related communication and information flows along the chain imply also increments of costs, which at the moment can’t be quantified satisfactorily. According to the local warehouse manager, workload is doubling as he has not only to receive and weight the coffee bags, but also to do quality control in a more detailed way then before, including humidity measure, identification of green beans and defects, which is time-consuming as samples have to be milled and roasted. As farmers are used to deliver relatively small amounts of coffee during the harvest time with varying quality, quality control tends to slow down the whole process and additional staff is needed in the warehouse14. Any costs exceeding the actual rate of 5,39 USD/qq, to cover the increased working time of the local warehouse manager and additional staff, are difficult to justify as long as the market does not provide economic incentives for improved quality (the price differentiation scheme realized at the moment is an internal agreement between APECAP and FAPECAFES). Direct communication with the buyers is needed to come to a common understanding of the situation and to renegotiate contracts. 6.4.5 Perceptions of the benefits of media used and quality and price differentiation Regarding the total costs of 21,44 USD/qq (plus 1,54 USD/qq) to be paid by each farmer (calculated on the base of the expected volumes and prices for 2006) and taking into account an average price between 124 USD/qq (conventional Fairtrade) and 139 USD/qq (organic Fairtrade), it must be questioned if the additional transaction costs can be justified and may be self-financed. On the other hand, it is very difficult to quantify the benefits of an improved information and communication system. In general, the perceptions of farmers, technical staff and directors regarding the use of media can be summed up as follows: The information distributed by newsletters and radio attracts new members, who want to
join the organization. Present members have better access to information about FAPECAFES, markets, prices, quality requirements etc.
A good location for discussions and exchange of opinions about the information within the newsletter is the local warehouse, where farmers deliver their produce and wait for the quality control results.
14 Calculated with data of 2005: 233 members of APECAP have an average of 2 to 11 deliveries of coffee bags during the
harvest time. Taking into account a total average of 5 deliveries and supposing that each sample will be checked, the
warehouse manager does quality control of a total of 1165 samples. Each sample requires about 15 min., which means 291
working hours or 36 working days. At the moment the 3 warehouse manager receive each about 500 USD for the whole harvest
time.
Part II: Case study
26
The radio program seems to fit farmers’ interests, as topics of their interests (like soil conservation methodologies) are sent.
On the other hand farmers claimed, that the information distributed has been centred on FAPECAFES and does not include farmers experiences and needs. It seems, that too much focus has been put on the media instead of on the message.
In general, written media are more difficult to use and culturally inadequate, as farmers are not used to read much. Hence, the distribution of the newsletter (as well as any other information from the directors’ board) needs to be improved. This challenges the facilitation skills of the farmers’ groups’ leaders.
However, low coffee prices combined with poor productivity, loose social relations due to the migration process in the southern highlands and increasing interventions of intermediaries offering relatively high prices for unprocessed dried coffee, seem to weaken the groups’ cohesion and thwart any communication strategy. In any case, the present strategy needs to be adapted and a reduction of costs nmeeds to be sought to achieve financial sustainability. As discussed with FAPECAFES and cooperating partners, improving the efficiency of the existing communication and information system is dealing with attitudinal changes of people and is much more about clarification of roles and functions than about technology or media. Regarding the quality and price differentiation policy, most farmers and technical staff expressed, that Farmers are more motivated to deliver good quality, pay more attention to their work and
are more responsible with their organization. Quality control results give good hints for the orientation provided by the technical staff. The feedback of the quality control results to the farmers and the technical staff still
suffers logistical problems and will be facilitated by a software, which links different information sources (like credits handed out, volumes and quality delivered per member).
However, the benefits expected – improved coffee quality rewarded by higher prices – must be evaluated later on. These benefits should more than exceed the additional costs generated by the increased workload of the warehouse manager. 7. KNOWLEDGE MANAGEMENT, COMMUNICATION AND LEARNING IN FAPECAFES This last chapter of part II will work out the most important findings regarding the concept of knowledge management, communication and learning applied on the case of FAPECAFES. It will look at the most important constraints limiting the knowledge management capacities, points out the most promising opportunities and finishes with some thoughts regarding the impacts of knowledge management on the chain governance regime.
7.1 CONSTRAINTS OF KNOWLEDGE MANAGEMENT, COMMUNICATION AND LEARNING IN FAPECAFES If success and benefit of value chain stakeholders depends (amongst others) on the mutual satisfaction of information needs, what hinders the information flow? In the following, the major limitations of knowledge management in the case of FAPECAFES will be summed up and discussed. Most of them are interrelated in a systemic way.
Part II: Case study
27
(a) Limitations within FAPECAFES: Deficiencies in the transmission and translation of information: Translating complex issues, like price fixing mechanisms or composition of export costs
in simple and understandable phrases is not an easy task. Leaders of farmers’ groups are used to represent their group politically, but their abilities to communicate and transmit information in a didactical way and the skills to facilitate a reflection process are almost deficient. In FAPECAFES the main communication problem seems to be more likely a problem of cognitive understanding of complex issues by leaders and farmers than missing access to information sources. At different organizational levels and along the chain, different languages are spoken and leaders have the difficult task to translate technical issues into commonly understandable expressions.
Missing culture of reading and reflection: The lack of written information at the level of farmers’ groups, due to a limited access to
copying machines and funds to pay the copies, contributes to a loss of information along the chain and at the different hierarchical levels of FAPECAFERS. As communication at farmers’ level is almost only orally, misleading information from outside can easily distort the organizational communication channels. However, even though written information is accessible, people are not used to read and to search for new information sources. Besides, existing information and data (like number of members, names of new members, number of has with coffee, number of coffee bags delivered etc.) is disperse, in most cases not used for statistical analysis and reflection about the organizational development and seems to be only collected to satisfy the certification requirements (e.g. the internal control system).
The experiences with the design and distribution of newsletters showed that information in a written form at the grassroots level needs to be adapted to the farmers’ needs and facilitated in order to be understood. The best way to improve the use of existing media is to include farmers in the design and development of media. Alternative places at community level (as shops, the church, women’s groups, the football ground etc.), adequate for the distribution of information, should be explored with them.
Centralization of information in a few heads: As in many farmers’ organizations, the whole knowledge of the organizational history,
export practices, management of commercial relations etc. is concentrated in the heads of a few leaders with the most important functions within the organization, who are irreplaceable. The overload of ongoing daily activities and a lack of an organizational policy to build up young new leaders prevent the externalisation of this knowledge. As most of the knowledge has a more implicit character, the possibilities to write it down and make it explicit are limited. Internships of farmers’ children at the board of directors board in order to grow up young leaders would create a space for experimental learning.
Limited teamwork and missing incentives to offer good services: At the moment, links between the technical assistance and the quality control staff and a
kind of teamwork between them are missing. Both seems to have different goals and are at least partially financed by external donors. Hence, there are no incentives for doing a good job, as services are not directly integrated into the chain. The introduction of a quality and price differentiation mechanism in APECAP showed that technical staff and warehouse manager get more involved in quality control and are aware about the usefulness of such information.
Missing valuation of farmers’ knowledge: On the other hand, farmers are highly dependent on agricultural engineers, supervising
their farm work. Although they have plenty of knowledge, based on own experiences and experiments in their farms and enriched through years of capacity building processes, they don’t value their own knowledge. They trust rather someone with a university degree
Part II: Case study
28
than themselves and need a motivator from outside. Shifts in the paradigms of farmers and the organization’s leaders as well as of the cooperating NGO’s and international cooperation in order to opt for a horizontal exchange of experiences between farmers instead of a top-down vertical transfer of technology model are necessary. Some associations already experienced independently very cost-effective visits to coffee farms in the neighbouring Peru, which encouraged farmers to apply new production and post harvest techniques.
(b) Along the whole chain: Limited access to clients’ information: Although there are direct relationships with the buyers, some of them even visit the
farms, the access to crucial information, like the consumers’ / clients’ quality demands or detailed quality reports of samples delivered, is limited. In order to reach out into the higher quality market segments, access to the speciality coffee industry networks is crucial. The relatively poor reputation of Ecuador as coffee producing country makes the process to build these kind of relationships difficult.
Missing understanding of the others’ information needs: It seems that most of the value chain actors are not aware of the information needs of
others and the interdependencies of these needs along the chain. Producers don’t know that the estimate of yields is highly important to the director and influences export costs. Nor does the director’s board understand the information needs of producers. They perceive the existing information and communication channels as sufficient.
Linguistic and cultural barriers: The communication gap between producers and buyers seems to be still bigger, as
language and cultural influences come in. Interviews with different value chain stakeholders in Colombia demonstrated that the understanding of the term coffee quality of each stakeholder relates to that part of the chain, which is controllable for them. Hence, farmers’ definition of coffee quality relates to physical aspects, like bean size, colour and defects, while roasters control taste and aroma. Consequently, communication about quality is difficult as long as farmers or their organizations don’t have access to sensorial quality control data and aren’t able to analyse and understand them.
7.2 UNEXPLORED OPPORTUNITIES
Market led price differentiation Unless FAPECAFES will be able to establish market relationships that remunerate good
quality with higher prices, any efforts to improve quality - and intrinsically linked with productivity – will be short-termed and unsustainable. Access to knowledge about quality profiles required in the speciality coffee market, about price premiums and roasters willing to co-invest in improvements at farm level, like the establishment of irrigation system or post-harvest infrastructure, is crucial for FAPECAFES. On the other hand, buyers are often not aware of the problems at farm level and hence don’t know how these problems affect the overall performance of the value chain. As a consequence, they don’t know how to act in order to achieve significant impacts along the whole chain.
Horizontal farmer-to-farmer extension As mentioned above, the potential of farmers’ knowledge and capacities to innovate are
neither recognized nor explored. On the other hand, there exist a wide range of methodologies, which propose a more horizontal, low-budget and learning-oriented form of extension (Farmers’ Field Schools, farmer-to-farmer extension, innovation groups for rural agro-enterprises GIAR etc.). However, the adoption of participatory methodologies requires a shift of paradigm by leaders and decision-makers.
Part II: Case study
29
Participatory low-cost media development Traditional forms of cooperation between community members, like “mingas” and “presta
manos”, are old forms of communication and exchange of experiences. The Inkas sent so-called “chasquis” throughout their empire to deliver weather forecasts, sowing and harvest times or other important messages. Although the recuperation of these traditional communication forms is difficult, spaces for communication and exchange still exists at local level, e.g. the church, the school, the football ground, shops, the warehouse etc. These meeting points could be used for the delivery of messages from FAPECAFES and would allow all family members to access relevant information sources. New media, such as radio programs, newsletters, flyers etc. should be developed with the participation of the different users of information. The sustainability of the communication strategy depends on the local leaders’ capacity to establish alliances with local institutions and business men in order to co-finance these media affect.
7.3 GOVERNANCE AND IMPACT OF KNOWLEDGE MANAGEMENT This last sub-chapter analyses how information and knowledge management impacts on chain governance. According to the analytical framework developed by Gereffi and Humphrey (2005), presented in chapter 3, the type of chain governance is determined by three key determinants: (a) the complexity of information and knowledge transfer required to sustain a particular transaction, (b) the extent to which this information and knowledge can be codified and, therefore, transmitted efficiently and without transaction-specific investment between the parties and (c) the capabilities of actual and potential suppliers in relation to the requirements of the transaction.
In the case of FAPECAFES, these determinants will be checked regarding the most important types of information and knowledge required within the chain: volumes, quality and prices15, see figure 18. Volumes: (a) complexity of information and knowledge transfer: as volumes, which are to be produced and delivered, underlie productivity and hence climatic variability, as well as farmers’ commitment to deliver to their organization instead of local middlemen, both difficult to predict, the complexity of transaction of this kind of information is qualified as high. For roasters it is much easier to send the information on how much tons or containers are needed.
(b) ability to codify transaction: in order to codify information about volumes expected to be produced, several estimates must be done at farm level before harvest time, which are very time-consuming, as technical staff has to accompany and check this process. The experiences of FAPECAFES showed, that these estimates were not very reliable in recent years, due to opportunistic behaviour of farmers and unexpected periods of drought, which caused high export costs of FAPECAFES. Again, for a roaster it is relatively easy to send the message on volumes required. (c) capabilities in the supply base: the capabilities in the supply base to fulfil requirements of the market seem to be different in FAPECAFES’ associations, according to the number of 15 Adopted from Humphrey and Schmitz (2001). How much is to be produced and how (quality and labour/environmental
standards) are important issues in FAPECAFES’ value chain. I add the category prices, as this is a crucial issue for farmers.
The parameters what is to be produced and when, seems to be clear in the coffee value chain, as unprocessed green beans is
the only product, which is bargained, and as the time of delivery is less relevant than in fresh vegetable or fruit supply chains,
where punctuality is crucial.
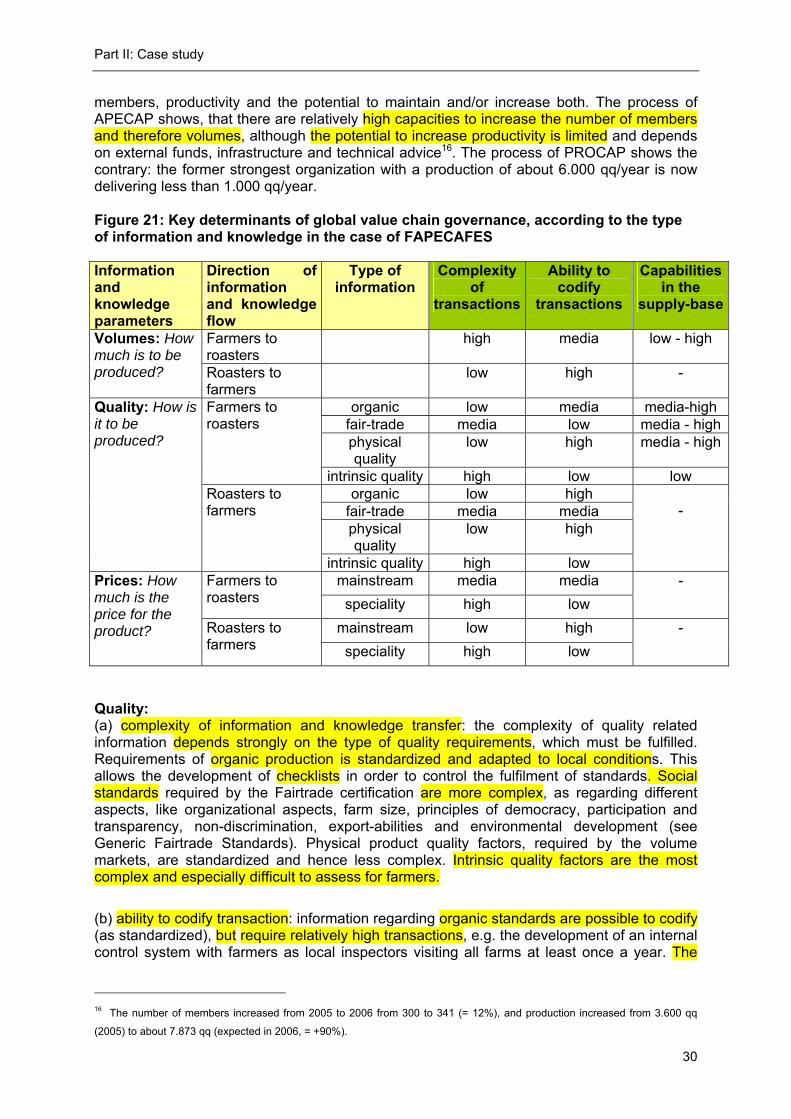
Part II: Case study
30
members, productivity and the potential to maintain and/or increase both. The process of APECAP shows, that there are relatively high capacities to increase the number of members and therefore volumes, although the potential to increase productivity is limited and depends on external funds, infrastructure and technical advice16. The process of PROCAP shows the contrary: the former strongest organization with a production of about 6.000 qq/year is now delivering less than 1.000 qq/year. Figure 21: Key determinants of global value chain governance, according to the type of information and knowledge in the case of FAPECAFES
Quality: (a) complexity of information and knowledge transfer: the complexity of quality related information depends strongly on the type of quality requirements, which must be fulfilled. Requirements of organic production is standardized and adapted to local conditions. This allows the development of checklists in order to control the fulfilment of standards. Social standards required by the Fairtrade certification are more complex, as regarding different aspects, like organizational aspects, farm size, principles of democracy, participation and transparency, non-discrimination, export-abilities and environmental development (see Generic Fairtrade Standards). Physical product quality factors, required by the volume markets, are standardized and hence less complex. Intrinsic quality factors are the most complex and especially difficult to assess for farmers.
(b) ability to codify transaction: information regarding organic standards are possible to codify (as standardized), but require relatively high transactions, e.g. the development of an internal control system with farmers as local inspectors visiting all farms at least once a year. The
16 The number of members increased from 2005 to 2006 from 300 to 341 (= 12%), and production increased from 3.600 qq
(2005) to about 7.873 qq (expected in 2006, = +90%).
Information and knowledge parameters
Direction of information and knowledge flow
Type of information
Complexity of
transactions
Ability to codify
transactions
Capabilities in the
supply-base
Farmers to roasters
high media low - high Volumes: How much is to be produced? Roasters to
farmers low high -
organic low media media-high fair-trade media low media - highphysical quality
low high media - high
Farmers to roasters
intrinsic quality high low low organic low high
fair-trade media media physical quality
low high
Quality: How is it to be produced?
Roasters to farmers
intrinsic quality high low
-
mainstream media media Farmers to roasters speciality high low
-
mainstream low high
Prices: How much is the price for the product? Roasters to
farmers speciality high low -
Part II: Case study
31
costs for the internal control system in APECAP is about 0,60 USD/qq17 and the external inspection costs about 0,71 USD/qq. At FAPECAFES’ level there is an additional cost of 0,24 USD/qq for the organic certification and 0,59 USD/qq for the Fairtrade certification18. Due to the wide range of aspects of the social certification, especially aspects which are subjective and therefore difficult to assess or control (like democracy, participation, non-discrimination), the abilities to codify are relatively low. As physical quality factors are standardized in the mainstream market (regarding the bean size and number and type of defects) and mechanical selection permits a quite objective control, this information can easily be codified and transmitted without additional transaction costs. However, the situation changes completely within the speciality market, which values the organoleptic quality factors. For farmers it is almost impossible to codify information regarding the organoleptic characteristics of their beans, unless they don’t have the skills and physical conditions (like a laboratory) to assess cup quality and the logistical and organizational capacities to separate qualities. Even if they would be able to offer a quality differentiated produce, the ability to put this information into the roasters’ language, to address it for a selected number of receivers and to find the right channel to send the message, is very difficult. Almost the same happens at the roasters’ side: while it is relatively easy for them to demand certain organic and social standards as well as the ever assessed physical quality requirements, the ability to codify their own quality profile and transmit it in an understandable way to a potential supply base is difficult. Consequently, high transaction costs in order to search the right supply base and develop commercial relationships are required. On the websites of speciality coffee roasters the term “coffee hunting” is common and stands for the new task of roasters to travel around the globe in order to find the coffee profile with special characteristics, demanded by their clients. (c) capabilities in the supply base: the capabilities of farmers to fulfil organic and social standards are high, depending on the organizational performance and the technical capacities farmers to apply organic production techniques. In the case of FAPECAFS’ associations, organic production is relatively easy as farmers are used to produce without chemicals or at least with low input. However, access to and especially the use of technical know-how to improve soil fertility, control erosion, apply biological disease and pest control and maintain productivity of coffee trees through trimming and revitalization cuts seems to be limited. The capacity to fulfil the physical quality requirements depends on the parameters set by the roasters. At the moment, as most of the produce enters the organic and Fair-Trade market, which does not exceed the mainstream market requirements, the capacities to fulfil them are relatively high19. However, farmers’ capacities to fulfil quality requirements of the speciality market are relatively low: firstly because quality (and price) differentiation is logistically complicated, secondly because coffee quality at farm level is still unknown and third because even if coffee quality has been assessed successfully and qualified as special, farmers’ motivation to maintain or improve quality is very low due to marginal cost-effectiveness as a consequence of very low productivity and missing infrastructure (like irrigation systems adopted to the local conditions)20. 17 Including the internal inspection and the internal control committee (Comité interna de control, CIC). 18 All data are based on budget calculations of FAPECAFES and associations for 2006, with an expected export volume of
11.230 qq. 19 Mainstream requirements are e.g.: 10 % of bean size below and above an indicated screen size of 15, equal or less than 10
defects and clean cup. Some roasters require very basic cup parameters, as “good taste”, “good balance” or “low acidity”. 20 A rapid cost-benefit analysis of speciality coffee production of one of FAPECAFES’ farmers’ groups showed disappointing
results: although prices are the highest ever achieved in the whole federation and above the organic and fair-trade prices (about
153 USD/qq), farmers still struggle to survive and can’t invest in their production system. Farmers only gain, if they undercharge
(or even don’t charge) their family labour. Investments in the renovation of coffee plantations as well as irrigation systems are
much needed in order to increase the percentage of coffee beans qualified as speciality, contributing to increased economic
benefits and the possibilities to reinvest in the farming system.
Part II: Case study
32
Prices: (a) complexity of information and knowledge transfer: information about production costs at farm level is relatively complex, depending on different variables (productivity, farm size, number of hired labour, charge of family labour) and interrelating with the production system. Still more complex is the information and knowledge regarding the costs involved by speciality coffee production: first, farmers lack concrete information about how to improve intrinsic bean quality and hence don’t know what to do in order to get price premiums. Second, the whole process of high quality production and processing does not differ significantly from the usual steps of green washed Arabica production, but all steps must be done much more carefully and conscious: labourers collecting the red beans must be trained to pick only the ripe cherries, as just one green cherry can damage the cup, and should be remunerated accordingly to quality instead of volume delivered. Pulping, fermentation and washing is to be done soon after the collection of cherries, which means, that the whole harvest process is better to be done in several steps, which requires more time. The selection of defects (first in the fermentation tank and then during the drying process) is also very time consuming and usually done by family members in the evening. Finally, differentiation of qualities at farm level requires adequate space to store the coffee bags for delivery to the warehouse. The production costs in average coffee plantations increases, as productivity is lower and variability of bean size is higher. Summed up, the production costs for speciality coffee is very complex and difficult to assess.
On the other hand, almost the same is valid for roasters: as mainstream prices are defined by the New York Board of Trade, the complexity of coffee prices in this sector is relatively low. However, in the speciality sector there are no clear rules and price definition schemes and the wide range of prices offered by the speciality coffee industry underlies subjective taste preferences and is neither transparent nor understandable21.
(b) ability to codify transaction: while mainstream coffee prices can relatively easily be codified and sent through the traditional information channels of the coffee industry, getting to the grassroots through the intermediaries’ communication channels and causing competition between local traders within a limited range, speciality coffee prices are difficult to codify and transmit. Until producers are able to quantify their increased production costs for speciality produce, they won’t be able to codify and transmit this information to the roasters. As mentioned above, the quantification of speciality produce is highly complex and depends on a range of different variables. On the other hand, price definition is in the hand of roasters and subject to individual negotiation skills of farmers’ organizations and their managers, as long as no clear information regarding production costs (including the costs to maintain and improve coffee quality, which is intrinsically linked with productivity) is being signalled. The ability and willingness of consumers to pay high prices for good quality (especially in Japan) shows the still unexplored potential of increased incomes for smallholder farmers.
21 Jamaican Blue Mountain Coffee is purchased in Japan up to 62 USD per pound and is so highly prized that is sold for as
much as 15 USD per cup to Japanese consumers (see http://www.tastesoftheworld.net/Jamaican-coffee-prices.html) .
Part II: Case study
33
Final considerations Although I am still far away from being able to draw a clear and correct picture of the governance regime of FAPECAFES’ value chain, a distinction can be made between the governance regime of the volume market and the speciality market model.
According to Gereffi and Humphrey (2005), low complexity of transactions, high ability to codify transactions and high capabilities in the supply-base is classified as a market driven chain with a low degree of explicit coordination and power asymmetry. In contrast, high complexity of transactions, low abilities to codify transactions and low capabilities in the supply-base characterize a hierarchical value chain model, with a high degree of explicit coordination and power asymmetry. Other market niches, such as organic and Fair-Trade, are somewhere in between these two extremes. I want to stress the influence the different types of information and knowledge, as well as their explicit or implicit dimensions, exercise on the governance regime and the degree of power asymmetry. Roasters and farmers are both affected by high transaction costs due to the complexity of information and codification problems. Roasters are able to benefit more, if they address clients able and willing to pay. Farmers are subject to a top-down definition of prices and quality requirements, without the chance to negotiate according to their real production costs and investment needs, in order to maintain and improve quality. This is the case of the FAPECAFES’ value chain at the moment. Changes are expected depending on their capacity to assess and differentiate their qualities and link with speciality coffee roasters. Other smallholder organizations of coffee growers in Colombia already gained experiences in this area and seem to be on the way of developing a relational model of value chain governance.
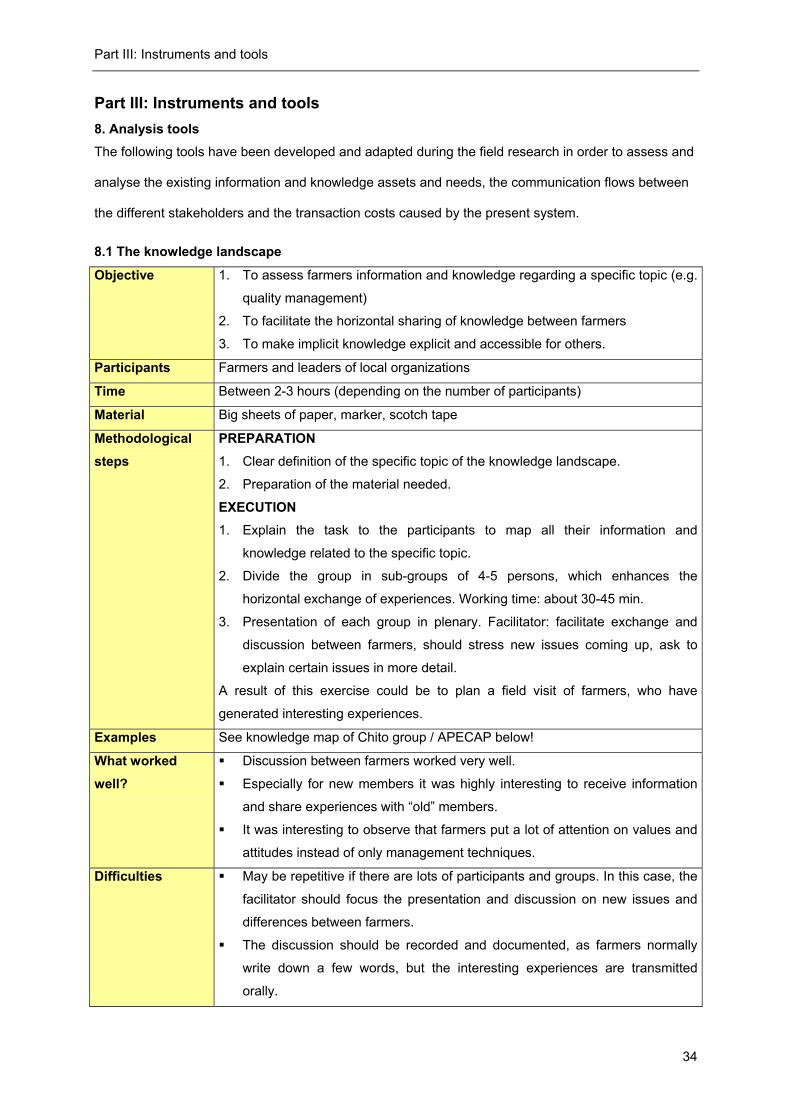
Part III: Instruments and tools
34
Part III: Instruments and tools 8. Analysis tools The following tools have been developed and adapted during the field research in order to assess and
analyse the existing information and knowledge assets and needs, the communication flows between
the different stakeholders and the transaction costs caused by the present system.
8.1 The knowledge landscape
Objective 1. To assess farmers information and knowledge regarding a specific topic (e.g.
quality management)
2. To facilitate the horizontal sharing of knowledge between farmers
3. To make implicit knowledge explicit and accessible for others.
Participants Farmers and leaders of local organizations
Time Between 2-3 hours (depending on the number of participants)
Material Big sheets of paper, marker, scotch tape
Methodological steps
PREPARATION 1. Clear definition of the specific topic of the knowledge landscape.
2. Preparation of the material needed.
EXECUTION 1. Explain the task to the participants to map all their information and
knowledge related to the specific topic.
2. Divide the group in sub-groups of 4-5 persons, which enhances the
horizontal exchange of experiences. Working time: about 30-45 min.
3. Presentation of each group in plenary. Facilitator: facilitate exchange and
discussion between farmers, should stress new issues coming up, ask to
explain certain issues in more detail.
A result of this exercise could be to plan a field visit of farmers, who have
generated interesting experiences.
Examples See knowledge map of Chito group / APECAP below!
What worked well?
Discussion between farmers worked very well.
Especially for new members it was highly interesting to receive information
and share experiences with “old” members.
It was interesting to observe that farmers put a lot of attention on values and
attitudes instead of only management techniques.
Difficulties May be repetitive if there are lots of participants and groups. In this case, the
facilitator should focus the presentation and discussion on new issues and
differences between farmers.
The discussion should be recorded and documented, as farmers normally
write down a few words, but the interesting experiences are transmitted
orally.
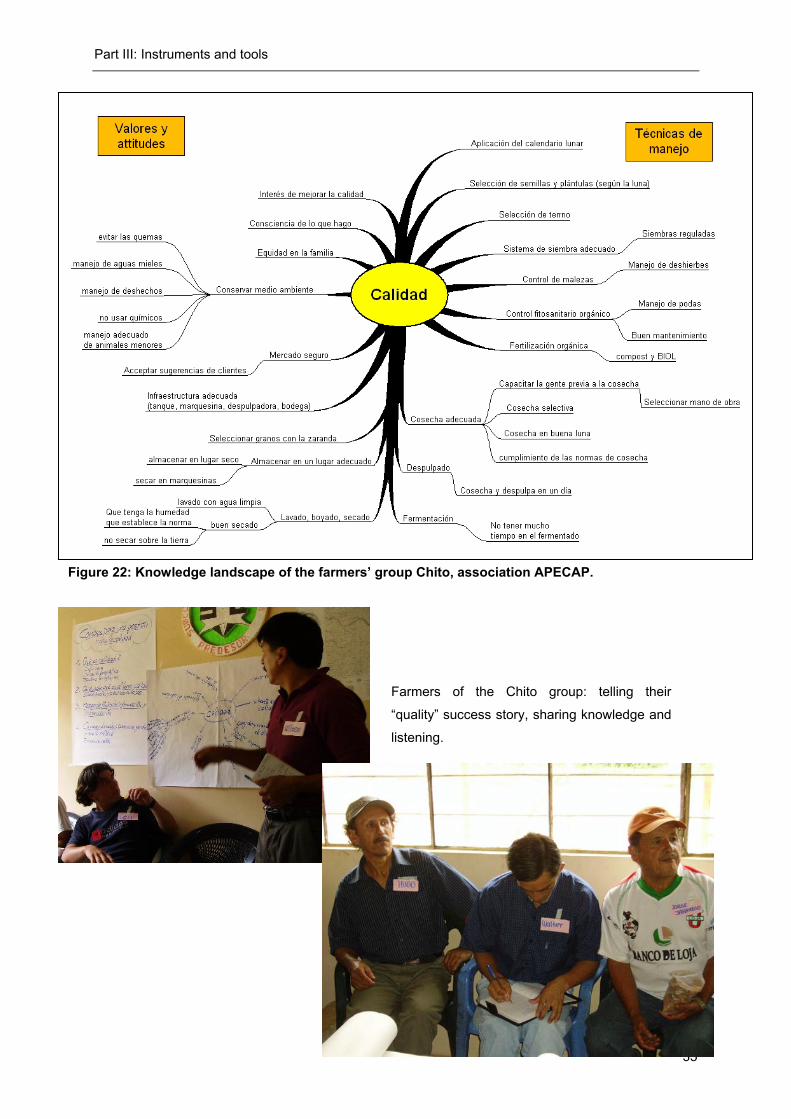
Part III: Instruments and tools
35
Figure 22: Knowledge landscape of the farmers’ group Chito, association APECAP.
Farmers of the Chito group: telling their
“quality” success story, sharing knowledge and
listening.
Part III: Instruments and tools
36
8. 2 Assessment of information and knowledge flows
Objective 1. To assess the flow of information and knowledge within a certain system and
regarding a specific topic.
2. To identify communication gaps and analyze their effects on the whole
system.
3. To define activities in order to close the gaps and make communication more
efficient.
Participants Farmers and leaders of local organizations
Time About 1-2 hours (depending on the number of participants)
Material Big sheets of paper, cards, markers, scotch tape
Methodological steps
PREPARATION 1. Clear definition of the specific topic of information and knowledge, which is to
be communicated.
2. To identify the system, within the communication flow is to be analysed (e.g.
the farmers organization, FAPECAFES, the value chain).
3. Preparation of the material needed.
EXECUTION 1. Explain the task to the participants to draw a diagram of information and
knowledge flows with an identified system and related to the specific topic.
2. To split the group in different sub-groups if there is a facilitator for each
group. Otherwise work in plenary.
3. Identification of the most important stakeholders of the system (e.g. farmers,
directors of groups, president, warehouse manager, technical staff,
FAPECAFES’ director etc.).
4. Definition of symbols for different types of flows: e.g. uni-lateral, bi-lateral,
weak flows, gaps.
5. Drawing of arrows between the identified stakeholders, using the symbols.
6. Indicate which kind of information and knowledge is communicated.
7. Identification of gaps of information and knowledge flows. Analyse, which are
the effects of these gaps regarding the whole system.
8. Define specific actions in order to link stakeholders and improve
communication; define their roles and functions regarding the communication
process.
9. Ask the group if there are any political decisions to be taken in order to make
the action plan work. .
Examples See flow diagram of Chito group / APECAP below!
What worked good?
Communication gaps could clearly be identifed.
Attention should paid on what farmers don’t express: e.g. if important
stakeholders are not mentioned, this is a very important message for the
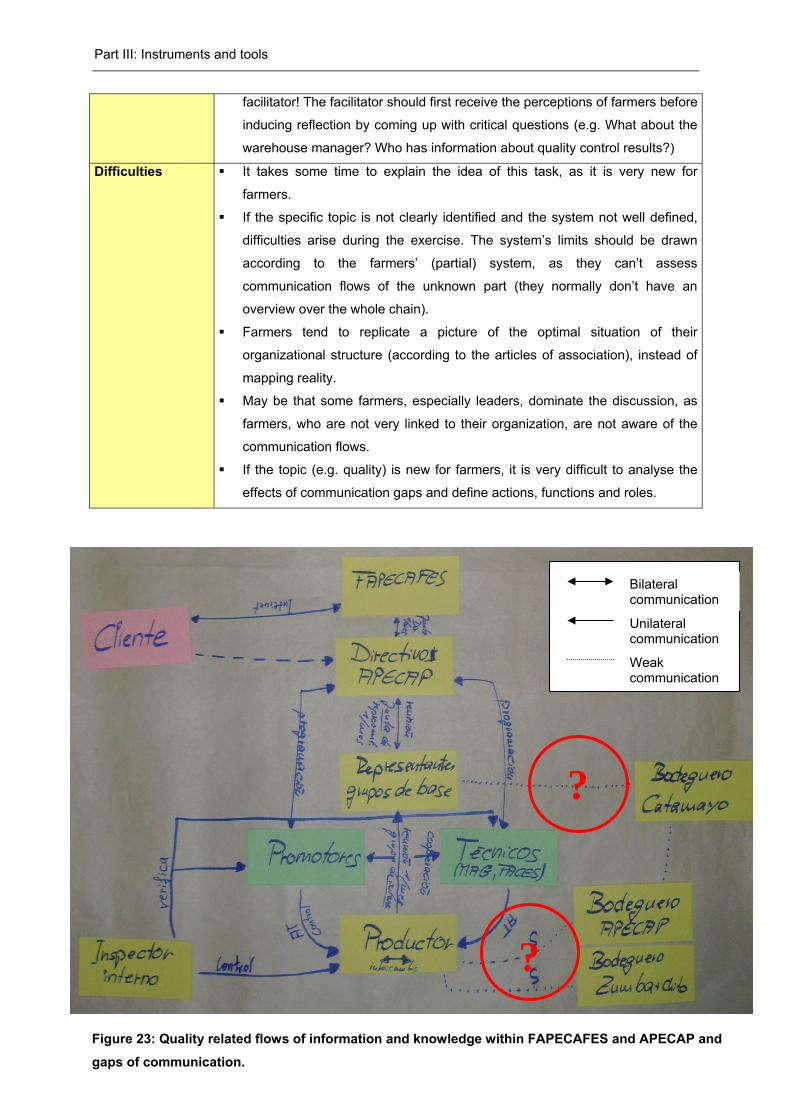
Part III: Instruments and tools
37
facilitator! The facilitator should first receive the perceptions of farmers before
inducing reflection by coming up with critical questions (e.g. What about the
warehouse manager? Who has information about quality control results?)
Difficulties It takes some time to explain the idea of this task, as it is very new for
farmers.
If the specific topic is not clearly identified and the system not well defined,
difficulties arise during the exercise. The system’s limits should be drawn
according to the farmers’ (partial) system, as they can’t assess
communication flows of the unknown part (they normally don’t have an
overview over the whole chain).
Farmers tend to replicate a picture of the optimal situation of their
organizational structure (according to the articles of association), instead of
mapping reality.
May be that some farmers, especially leaders, dominate the discussion, as
farmers, who are not very linked to their organization, are not aware of the
communication flows.
If the topic (e.g. quality) is new for farmers, it is very difficult to analyse the
effects of communication gaps and define actions, functions and roles.
Bilateral communication
Weak communication
Unilateral communication
?
?
Figure 23: Quality related flows of information and knowledge within FAPECAFES and APECAP and
gaps of communication.
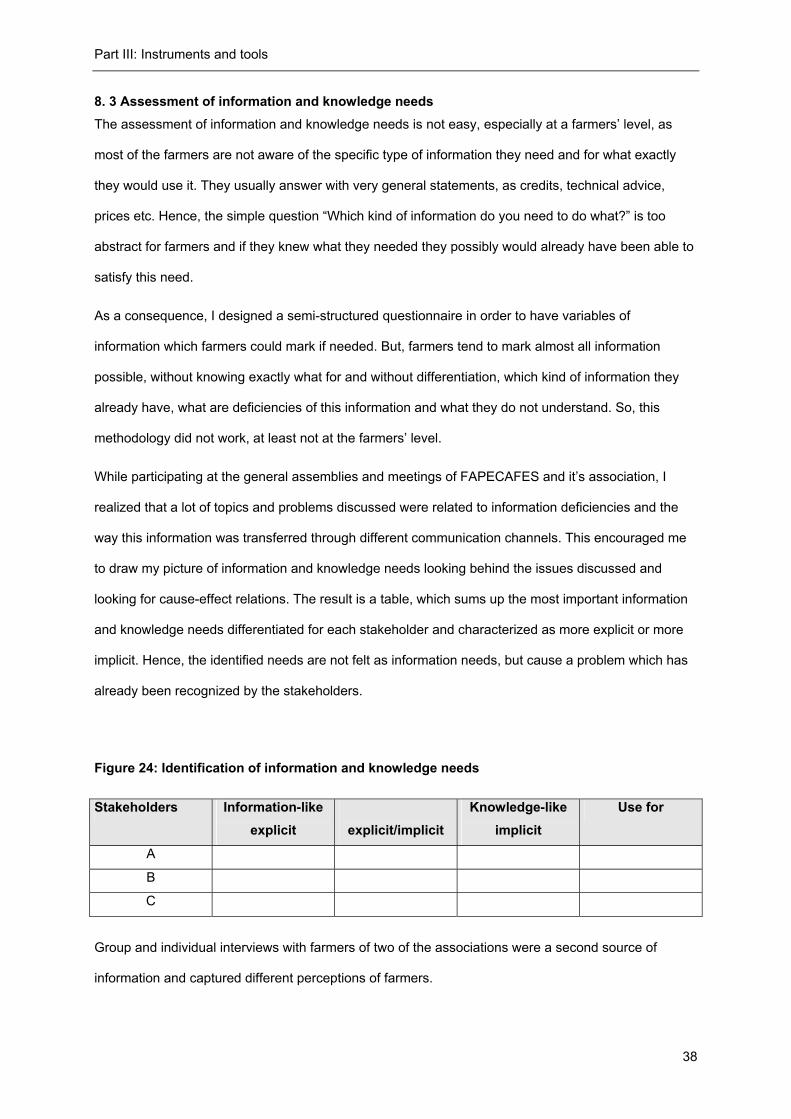
Part III: Instruments and tools
38
8. 3 Assessment of information and knowledge needs The assessment of information and knowledge needs is not easy, especially at a farmers’ level, as
most of the farmers are not aware of the specific type of information they need and for what exactly
they would use it. They usually answer with very general statements, as credits, technical advice,
prices etc. Hence, the simple question “Which kind of information do you need to do what?” is too
abstract for farmers and if they knew what they needed they possibly would already have been able to
satisfy this need.
As a consequence, I designed a semi-structured questionnaire in order to have variables of
information which farmers could mark if needed. But, farmers tend to mark almost all information
possible, without knowing exactly what for and without differentiation, which kind of information they
already have, what are deficiencies of this information and what they do not understand. So, this
methodology did not work, at least not at the farmers’ level.
While participating at the general assemblies and meetings of FAPECAFES and it’s association, I
realized that a lot of topics and problems discussed were related to information deficiencies and the
way this information was transferred through different communication channels. This encouraged me
to draw my picture of information and knowledge needs looking behind the issues discussed and
looking for cause-effect relations. The result is a table, which sums up the most important information
and knowledge needs differentiated for each stakeholder and characterized as more explicit or more
implicit. Hence, the identified needs are not felt as information needs, but cause a problem which has
already been recognized by the stakeholders.
Figure 24: Identification of information and knowledge needs
Stakeholders Information-like explicit
explicit/implicit
Knowledge-like implicit
Use for
A
B
C
Group and individual interviews with farmers of two of the associations were a second source of
information and captured different perceptions of farmers.
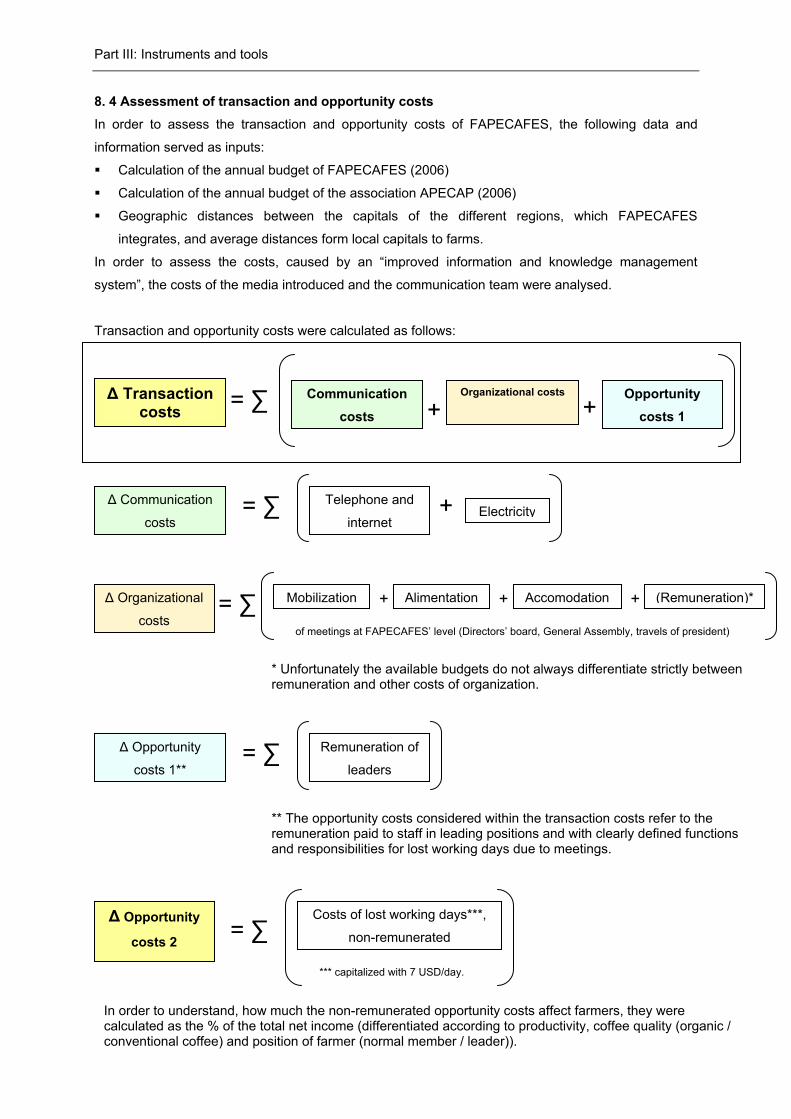
Part III: Instruments and tools
39
8. 4 Assessment of transaction and opportunity costs In order to assess the transaction and opportunity costs of FAPECAFES, the following data and
information served as inputs:
Calculation of the annual budget of FAPECAFES (2006)
Calculation of the annual budget of the association APECAP (2006)
Geographic distances between the capitals of the different regions, which FAPECAFES
integrates, and average distances form local capitals to farms.
In order to assess the costs, caused by an “improved information and knowledge management
system”, the costs of the media introduced and the communication team were analysed.
Transaction and opportunity costs were calculated as follows:
Δ Communication
costs
Telephone and
internet Electricity = ∑ +
Δ Organizational
costs
Mobilization Alimentation = ∑ + Accomodation + (Remuneration)*+
of meetings at FAPECAFES’ level (Directors’ board, General Assembly, travels of president)
* Unfortunately the available budgets do not always differentiate strictly between remuneration and other costs of organization.
Δ Opportunity
costs 1**
Remuneration of
leaders = ∑
** The opportunity costs considered within the transaction costs refer to the remuneration paid to staff in leading positions and with clearly defined functions and responsibilities for lost working days due to meetings.
Δ Transaction costs = ∑ Communication
costs
Organizational costs Opportunity costs 1+ +
Δ Opportunity
costs 2 = ∑ Costs of lost working days***,
non-remunerated
*** capitalized with 7 USD/day.
In order to understand, how much the non-remunerated opportunity costs affect farmers, they were calculated as the % of the total net income (differentiated according to productivity, coffee quality (organic / conventional coffee) and position of farmer (normal member / leader)).
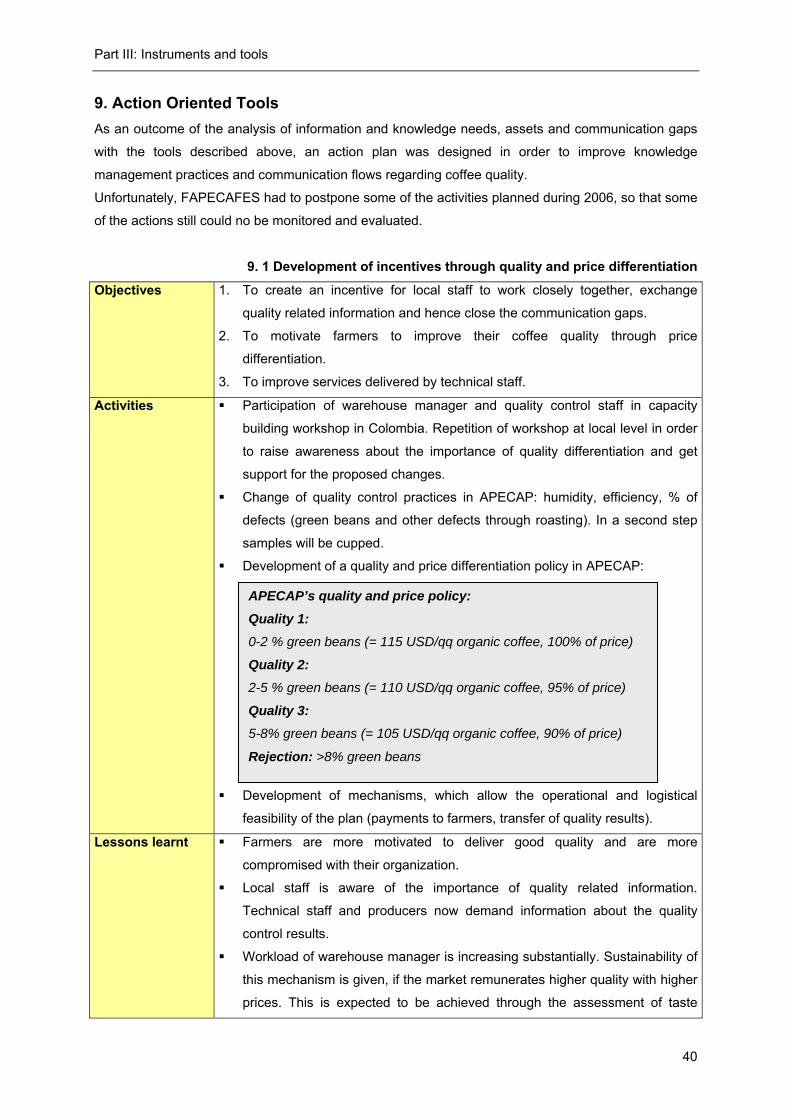
Part III: Instruments and tools
40
9. Action Oriented Tools As an outcome of the analysis of information and knowledge needs, assets and communication gaps
with the tools described above, an action plan was designed in order to improve knowledge
management practices and communication flows regarding coffee quality.
Unfortunately, FAPECAFES had to postpone some of the activities planned during 2006, so that some
of the actions still could no be monitored and evaluated.
9. 1 Development of incentives through quality and price differentiation
Objectives 1. To create an incentive for local staff to work closely together, exchange
quality related information and hence close the communication gaps.
2. To motivate farmers to improve their coffee quality through price
differentiation.
3. To improve services delivered by technical staff.
Activities Participation of warehouse manager and quality control staff in capacity
building workshop in Colombia. Repetition of workshop at local level in order
to raise awareness about the importance of quality differentiation and get
support for the proposed changes.
Change of quality control practices in APECAP: humidity, efficiency, % of
defects (green beans and other defects through roasting). In a second step
samples will be cupped.
Development of a quality and price differentiation policy in APECAP:
Development of mechanisms, which allow the operational and logistical
feasibility of the plan (payments to farmers, transfer of quality results).
Lessons learnt Farmers are more motivated to deliver good quality and are more
compromised with their organization.
Local staff is aware of the importance of quality related information.
Technical staff and producers now demand information about the quality
control results.
Workload of warehouse manager is increasing substantially. Sustainability of
this mechanism is given, if the market remunerates higher quality with higher
prices. This is expected to be achieved through the assessment of taste
APECAP’s quality and price policy:
Quality 1: 0-2 % green beans (= 115 USD/qq organic coffee, 100% of price)
Quality 2: 2-5 % green beans (= 110 USD/qq organic coffee, 95% of price)
Quality 3: 5-8% green beans (= 105 USD/qq organic coffee, 90% of price)
Rejection: >8% green beans
Part III: Instruments and tools
41
profiles and their geographical location in FAPECAFES’ production zones.
Farmers will be more convinced if they see the quality control process in the
laboratory. APECAP planned to invite the groups’ representatives to the
laboratory.
Improvement of services provided by the technical assistance due to the
direct use of quality control results should be monitored in the medium to
long run.
9. 2 Design and use of media
Objectives 1. Improve the information and communication flows between FAPECAFES
and associations.
2. Facilitate horizontal exchange of information and knowledge between
associations and farmers’ groups.
3. Improve communication from the grassroots to the top.
Activities Development of a bi-monthly newsletter with, which circulates between
FAPECAFES and association. The newsletter contains the following
information, identified as strategically: definition and variability of coffee
prices, type of contracts with clients, volumes exported, costs of exportation,
quality requirements, travel reports of general director and quality control
staff (participation in specialty coffee trade fairs, capacity building workshops,
etc.).
Distribution of the newsletter using the meetings at the different
organizational levels of FAPCAFES.
Commercial alliances with radio stations in each of the four associations.
Development of one radio program, which is broadcasted twice the week via
the radio stations. Information included: technical information about
production methods, soil conservation techniques, information of the
associations etc.
Development and distribution of didactical material about post-harvest
techniques for an improved quality management.
Lessons learnt The newsletter should incorporate more information about the associations
and farmers’ experiences, knowledge and needs. Otherwise, the media is
only a top-down information channel from the top executives of FAPECAFES
to the grassroots. Hence, information incorporated into the newsletter should
be defined and raised in a more participatory way, e.g. during the farmers’
groups meetings.
The diffusion of the newsletter must be improved at the level of the farmers’
groups: local leaders should facilitate the reading and understanding of the
newsletter, as some information is quite complex and difficult to analyse for
farmers (e.g. prices definition and fluctuation). Especially for illiterate farmers
Part III: Instruments and tools
42
the lecture should be facilitated.
The transmission of the radio program must be better adjusted to the
farmers’ time. More knowledge and experiences as well as life interviews of
farmers should be incorporated.
Differences of information needs and priorities of the four associations in
three different provinces should be recognized and the use of the media
should be adapted to these regional differences.
The design of didactical material does not automatically imply changes in the
methodological approach of the technical assistance. In order to guarantee a
good use of these materials, the technical assistance system should be
revised in it’s appropriateness to farmers’ needs and it’s ability to facilitate
horizontal exchange between farmers.
In order to strengthen the information and communication flow from the
bottom up to the top, the local leaders’ capacity to facilitate the members’
participation and to represent their needs should be strengthened.
Activities to be realized and monitored: The following activities are going to be realized from November 2006 to February 2007.
9. 3 Capacity building of local leaders Based on the monitoring workshop in October 2006, the terms of reference have been elaborated in order to search a local NGO which can offer the service of capacity building for local leaders and FAPECAFES’ communication team. Strategic topics are: Definition of roles and functions of local leaders in the area of communication. Prioritisation of types of information, which leaders should communicate to farmers.
Reflection of democratic principles: participation, decision-making, transparency etc. Definition of
strategies to enhance the application of democratic principles.
Tools and instruments to improve the efficiency of meetings.
Definition of mechanisms in order to strengthen the horizontal exchange of experiences between
farmers.
Use of media, design of messages to be transferred, selection of a diffusion strategy (including
local places, like church, shops, football ground, warehouse etc.).
Design of a sustainability strategy for the use of media.
9. 4 Regional coffee growers’ forum (8./9.11.2006): The regional forum has three major pillars:
Exchange of experiences between farmers in three important topics: communication, coffee
quality and technical assistance.
Identification of farmers as innovators and gratification of the best innovator.
Competition of the best cup of the associations.
Annex
43
10. LITERATURE
Allix, N. M. (2003). "Epistemology and knowledge management concepts and practices." Journal of
Knowledge Management Practice.
Argyris, C. (1982). Reasoning, learning and action. Individual and organizational. San Francisco,
Washington, London, Jossey-Bass Publishers.
Argyris, C., R. Putnam, et al. (1985). Action Science. San Francisco, London, Jossey-Bass Publishers.
Berlo, D. K. (1960). The Process of Communication. An Introduction to Theory and Practice. New
York, Holt, Rinehart and Wiston, Inc.
Eberhard, N. (2006): La comercialización Asociativa de Café en el Sur de Ecuador. Quito, VECO
Ecuador. Unpublished
Fried, A. and C. Baitsch (2000). Mutmaßungen zu einem überraschenden Erfolg. Zum Verhältnis von
Wissensmanagement und organisationalem Lernen. Wissensmanagement. Zwischen Wissen
und Nichtwissen. K. Götz. München und Mering, Rainer Hampp Verlag: 33-45.
Gereffi, G. and J. Humphrey (2005). "The governance of global value chains." Review of International
Political Economy 12(1): 78-104.
Hilse, H. (2000). Wissen, Sinn und Strategie: Skizze zu einem prozessorientierten
Wissensmanagement. Wissensmanagement. Zwischen Wissen und Nichtwissen. K. Götz.
München und Mering, Rainer Hampp Verlag: 157-175.
Humphrey, J. and H. Schmitz (2000). Governance and upgrading in global value chains. Paper for the
Bellagio Value Chain Workshop. Brighton, UK, Institute for Development Studies.
Humphrey, J. and H. Schmitz (2001). "Governance in global value chains." IDS Bulletin 32(3): 14.
Kaplinsky, R. (2000). "Spreading the gains from globalisation: What can be learned form value chain
analysis?" Journal of Development Studies 37(2).
Kriwald, T. and H.-D. Haasis (2001). Betriebliches Wissensmanagement in Produktion und
Umweltschutz. Wissensmanagement in Produktion und Umweltschutz. H.-D. Haasis and T.
Kriwald. Berlin, Heidelberg, New York, Springer-Verlag: 1-19.
Nonaka, I. and N. Konno (1998). "The concept of "Ba": Building a foundation for knowledge creation."
California management review 40(3): 40-54.
Nonaka, I. and H. Takeuchi (1997). Die Organisation des Wissens. Wie japanische Unternehmen eine
brachliegende Ressource nutzbar machen. Frankfurt/Main; New York, Campus.
Nonaka, I., R. Toyama, et al. (2000). "SECI, Ba and leadership: a unified model of dynamic knowledge
creation." Long Range Planning 33: 5-34.
Probst, G., S. Raub, et al. (1999). Wissen managen. Wie Unternehmen Ihre wertvollsten Ressourcen
optimal nutzen. Frankfurt a.M., Frankfurter Allgemeine Zeitung GmbH.
Schulz von Thun, F. (1981). Miteinander Reden. Störungen und Klärungen 1. Reinbek bei Hamburg,
Rowohlt Taschenbuchverlag.
Seufert, A., A. Back, et al. (2000). Wissensnetzwerke: Vision - Referenzmodell - Archetypen und
Fallbeispiele. Wissensmanagement. Zwischen Wissen und Nichtwissen. K. Götz. München
und Mering, Rainer Hampp Verlag: 133-156.

Annex
44
Soukup, C. (2000). Zu Risiken und Nebenwirkungen von Wissensmanagement. Wie Unternehmen
sich vor allzu viel Wissen schützen können. Wissensmanagement. Zwischen Wissen und
Nichtwissen. K. Götz. München und Mering, Rainer Hampp Verlag.
Watzlawick, P. (2000). Die erfundene Wirklichkeit. Wie wissen wir, was wir zu wissen glauben?
Beiträge zum Konstruktivismus. München, PIPER Verlag GmbH.
Willke, H. (2000). Nagelprobe des Wissensmanagements: Zum Zusammenspiel von personalem und
organisationalem Wissen. Wissensmanagement. Zwischen Wissen und Nichtwissen. K. Götz.
München und Mering, Rainer Hampp Verlag: 15-31.
Annex
45
ANNEX
Annex 1: FAPECAFES’ action plan for knowledge management Based on the results of the case study and considering the priorities of FAPECAFES, a short- to
medium-term action plan was developed in order to overcome some of the difficulties identified.
First, a clear objective of knowledge management in FAPECAFES was identified: the improvement of
coffee quality and the integration into high value markets.
In the following, the most important activities are presented, which will be carried out until the end of
2006:
• Individual quality control and price differentiation: the quality control manager of FAPECAFES will
transmit his knowledge on quality management and control to the local quality managers and to
the technical staff, in order to create a common understanding on quality. As from now, local
quality managers and the technical staff will work closely together, so that technical assistance
can be programmed according to quality problems identified during harvest time. Local quality
managers will provide individual quality reports to each farmers’ group, so that they will be able to
fine-tune their management practices. Some associations will develop a software in order to
facilitate the elaboration and diffusion of the reports.
• Regional competition of the “best cup”: in order to incentive farmers to improve quality, a
competition will be held and the best cups will be awarded.
• Communication and media for quality improvement: In order to inform farmers about the new rules
on quality control and price differentiation for this year’s harvest, a didactic flyer will be designed
and disseminated. Recently, FAPECAFES developed a newsletter as one internal information
strategy. The next edition will consider information on quality, prices and commercial relations. In
the near future, the development of a radio program in alliance with local radio stations is planned.
• Horizontal exchange of experiences: As the actual dependency on technical assistance is seen
very critically, the exchange of experiences and local knowledge on quality management between
farmers’ groups will be enhanced. In a first meeting, technical staff and local assistants will define
their new roles and tasks as facilitators of learning processes. Pilot workshops will be held in two
associations and at the end of the learning cycle, experiences will be evaluated.
• Identification of quality profiles: a medium-term goal is the identification of the different taste
profiles of the four associations, which shall enable FAPECAFES to offer different profiles
according to the preferences of the specialty coffee industry.
Results and lessons learned of this action plan have been analysed during a monitoring workshop in
October 2006 and activities have been redesigned according to the lessons learnt.
Documents available in Spanish are:
Budget calculation (first and second after the monitoring workshop)
Technical report for GTZ-Ecuador
Financial report for GTZ-Ecuador
Different field trip reports
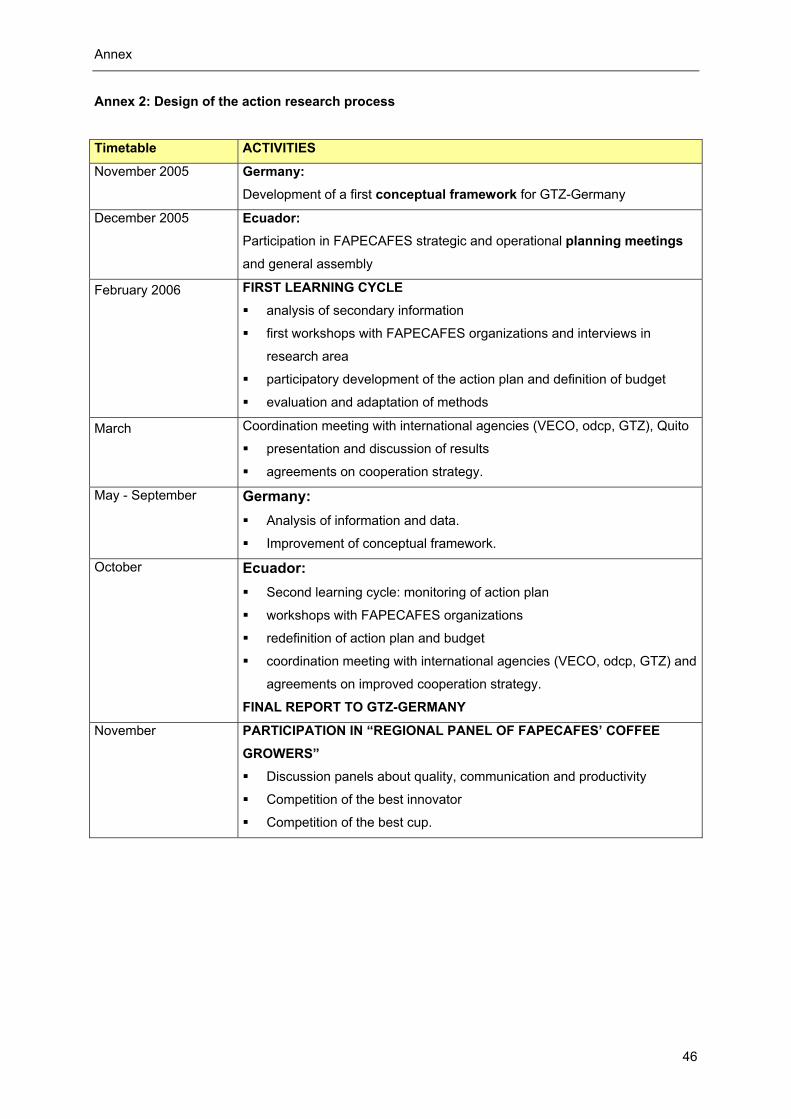
Annex
46
Annex 2: Design of the action research process
Timetable ACTIVITIES
November 2005 Germany: Development of a first conceptual framework for GTZ-Germany
December 2005 Ecuador: Participation in FAPECAFES strategic and operational planning meetings
and general assembly
February 2006 FIRST LEARNING CYCLE analysis of secondary information
first workshops with FAPECAFES organizations and interviews in
research area
participatory development of the action plan and definition of budget
evaluation and adaptation of methods
March Coordination meeting with international agencies (VECO, odcp, GTZ), Quito
presentation and discussion of results
agreements on cooperation strategy.
May - September Germany: Analysis of information and data.
Improvement of conceptual framework.
October Ecuador: Second learning cycle: monitoring of action plan
workshops with FAPECAFES organizations
redefinition of action plan and budget
coordination meeting with international agencies (VECO, odcp, GTZ) and
agreements on improved cooperation strategy.
FINAL REPORT TO GTZ-GERMANY
November PARTICIPATION IN “REGIONAL PANEL OF FAPECAFES’ COFFEE GROWERS” Discussion panels about quality, communication and productivity
Competition of the best innovator
Competition of the best cup.
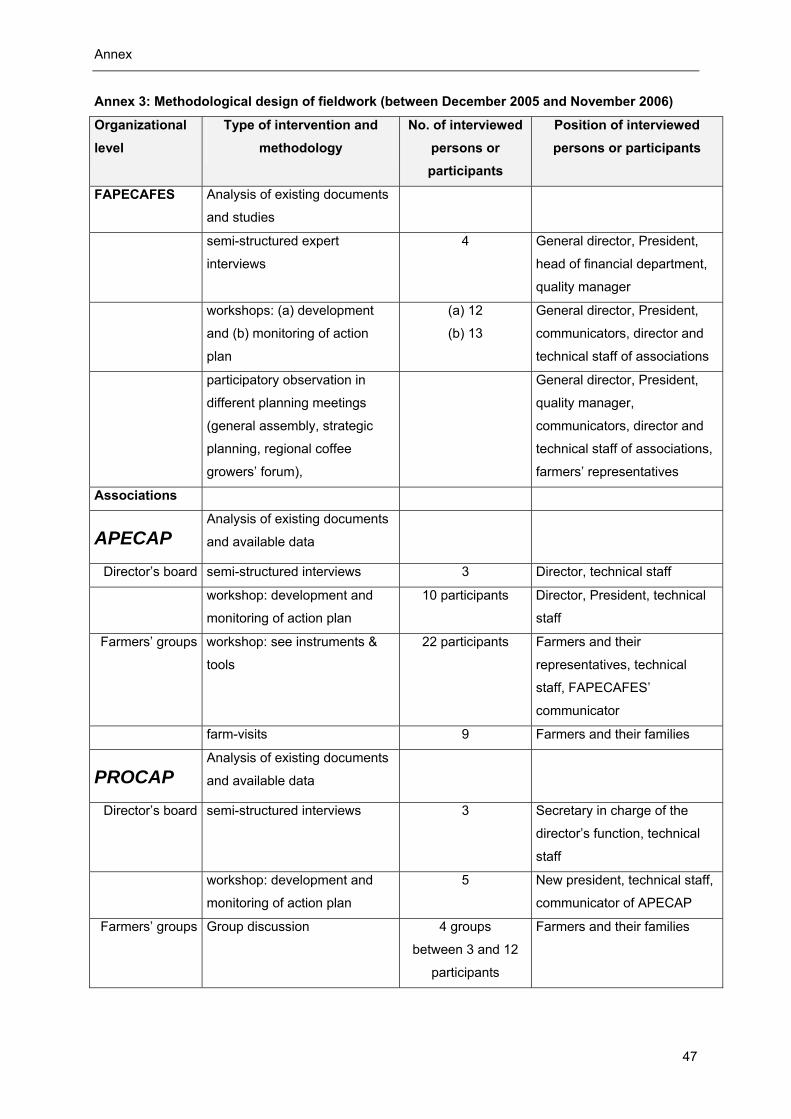
Annex
47
Annex 3: Methodological design of fieldwork (between December 2005 and November 2006)
Organizational level
Type of intervention and methodology
No. of interviewed persons or participants
Position of interviewed persons or participants
FAPECAFES Analysis of existing documents
and studies
semi-structured expert
interviews
4 General director, President,
head of financial department,
quality manager
workshops: (a) development
and (b) monitoring of action
plan
(a) 12
(b) 13
General director, President,
communicators, director and
technical staff of associations
participatory observation in
different planning meetings
(general assembly, strategic
planning, regional coffee
growers’ forum),
General director, President,
quality manager,
communicators, director and
technical staff of associations,
farmers’ representatives
Associations
APECAP Analysis of existing documents
and available data
Director’s board semi-structured interviews 3 Director, technical staff
workshop: development and
monitoring of action plan
10 participants Director, President, technical
staff
Farmers’ groups workshop: see instruments &
tools
22 participants Farmers and their
representatives, technical
staff, FAPECAFES’
communicator
farm-visits 9 Farmers and their families
PROCAP Analysis of existing documents
and available data
Director’s board semi-structured interviews 3 Secretary in charge of the
director’s function, technical
staff
workshop: development and
monitoring of action plan
5 New president, technical staff,
communicator of APECAP
Farmers’ groups Group discussion 4 groups
between 3 and 12
participants
Farmers and their families
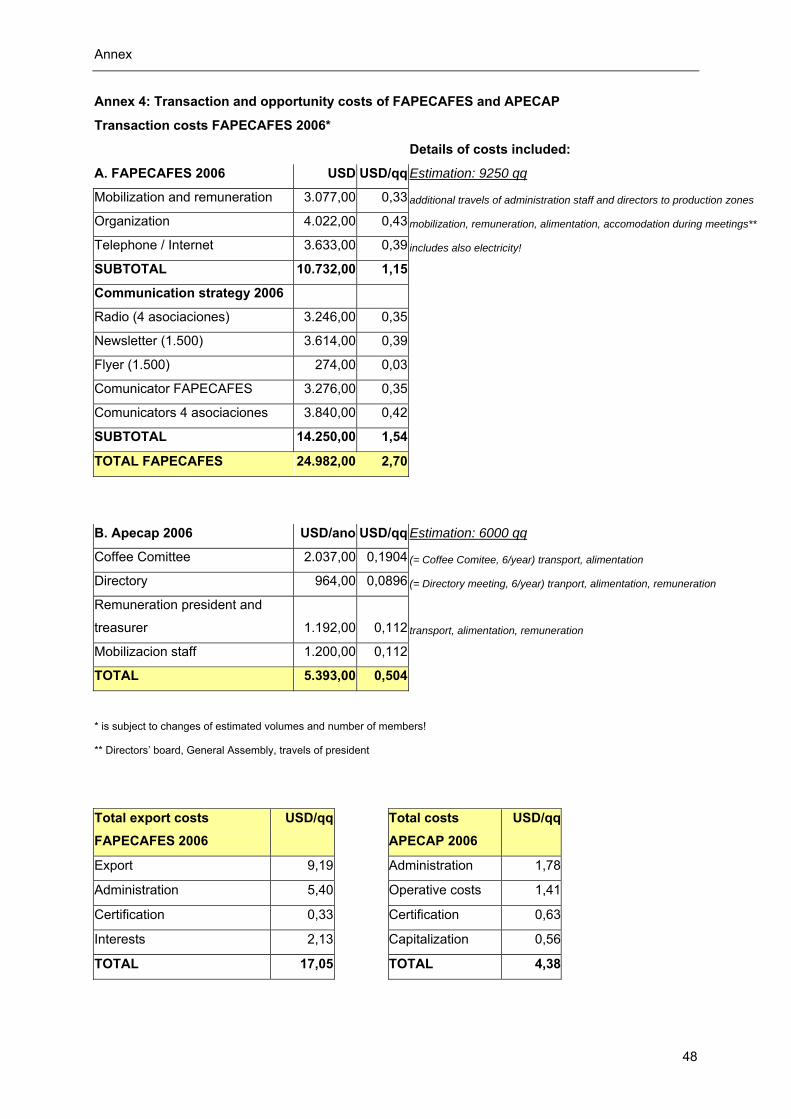
Annex
48
Annex 4: Transaction and opportunity costs of FAPECAFES and APECAP
Transaction costs FAPECAFES 2006*
Details of costs included:
A. FAPECAFES 2006 USD USD/qq Estimation: 9250 qq
Mobilization and remuneration 3.077,00 0,33 additional travels of administration staff and directors to production zones
Organization 4.022,00 0,43 mobilization, remuneration, alimentation, accomodation during meetings**
Telephone / Internet 3.633,00 0,39 includes also electricity!
SUBTOTAL 10.732,00 1,15
Communication strategy 2006
Radio (4 asociaciones) 3.246,00 0,35
Newsletter (1.500) 3.614,00 0,39
Flyer (1.500) 274,00 0,03
Comunicator FAPECAFES 3.276,00 0,35
Comunicators 4 asociaciones 3.840,00 0,42
SUBTOTAL 14.250,00 1,54
TOTAL FAPECAFES 24.982,00 2,70
B. Apecap 2006 USD/ano USD/qq Estimation: 6000 qq
Coffee Comittee 2.037,00 0,1904 (= Coffee Comitee, 6/year) transport, alimentation
Directory 964,00 0,0896 (= Directory meeting, 6/year) tranport, alimentation, remuneration
Remuneration president and
treasurer 1.192,00 0,112 transport, alimentation, remuneration
Mobilizacion staff 1.200,00 0,112
TOTAL 5.393,00 0,504
* is subject to changes of estimated volumes and number of members!
** Directors’ board, General Assembly, travels of president
Total export costs FAPECAFES 2006
USD/qq Total costs APECAP 2006
USD/qq
Export 9,19 Administration 1,78
Administration 5,40 Operative costs 1,41
Certification 0,33 Certification 0,63
Interests 2,13 Capitalization 0,56
TOTAL 17,05 TOTAL 4,38
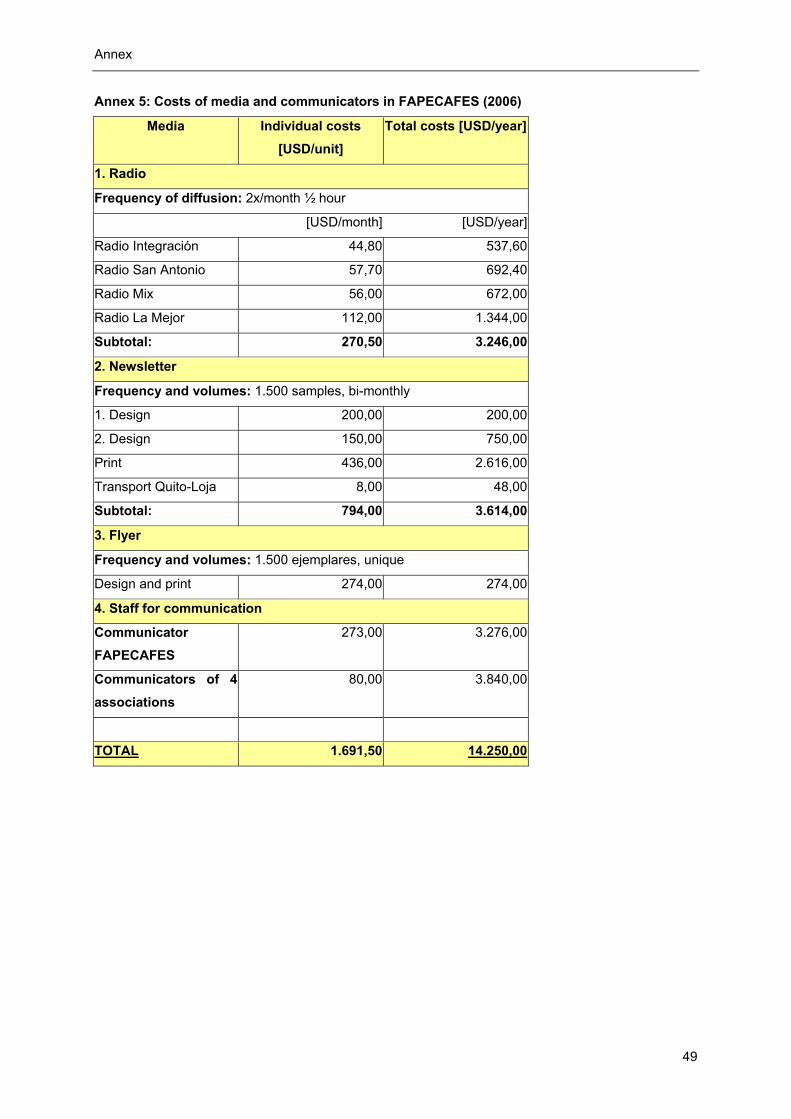
Annex
49
Annex 5: Costs of media and communicators in FAPECAFES (2006)
Media Individual costs [USD/unit]
Total costs [USD/year]
1. Radio
Frequency of diffusion: 2x/month ½ hour
[USD/month] [USD/year]
Radio Integración 44,80 537,60
Radio San Antonio 57,70 692,40
Radio Mix 56,00 672,00
Radio La Mejor 112,00 1.344,00
Subtotal: 270,50 3.246,00
2. Newsletter
Frequency and volumes: 1.500 samples, bi-monthly
1. Design 200,00 200,00
2. Design 150,00 750,00
Print 436,00 2.616,00
Transport Quito-Loja 8,00 48,00
Subtotal: 794,00 3.614,00
3. Flyer
Frequency and volumes: 1.500 ejemplares, unique
Design and print 274,00 274,00
4. Staff for communication
Communicator FAPECAFES
273,00 3.276,00
Communicators of 4 associations
80,00 3.840,00
TOTAL 1.691,50 14.250,00
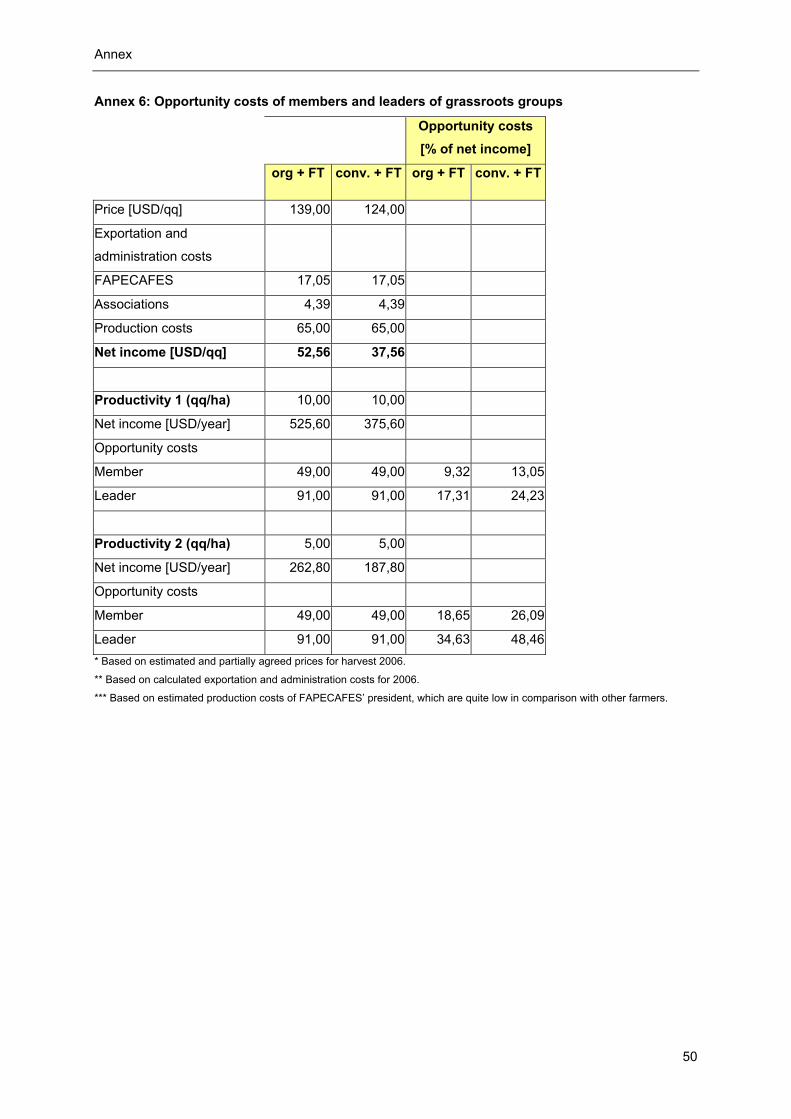
Annex
50
Annex 6: Opportunity costs of members and leaders of grassroots groups
Opportunity costs [% of net income]
org + FT conv. + FT org + FT conv. + FT
Price [USD/qq] 139,00 124,00
Exportation and
administration costs
FAPECAFES 17,05 17,05
Associations 4,39 4,39
Production costs 65,00 65,00
Net income [USD/qq] 52,56 37,56
Productivity 1 (qq/ha) 10,00 10,00
Net income [USD/year] 525,60 375,60
Opportunity costs
Member 49,00 49,00 9,32 13,05
Leader 91,00 91,00 17,31 24,23
Productivity 2 (qq/ha) 5,00 5,00
Net income [USD/year] 262,80 187,80
Opportunity costs
Member 49,00 49,00 18,65 26,09
Leader 91,00 91,00 34,63 48,46* Based on estimated and partially agreed prices for harvest 2006.
** Based on calculated exportation and administration costs for 2006.
*** Based on estimated production costs of FAPECAFES’ president, which are quite low in comparison with other farmers.