Embed Size (px)
Citation preview
Knowledge of Real Fluid Behaviour –the Key to Successful Gas Processing Systems
Lars Henrik Gjertsen, Manager Gas Processing
StatoilHydro Research Centre Trondheim
2
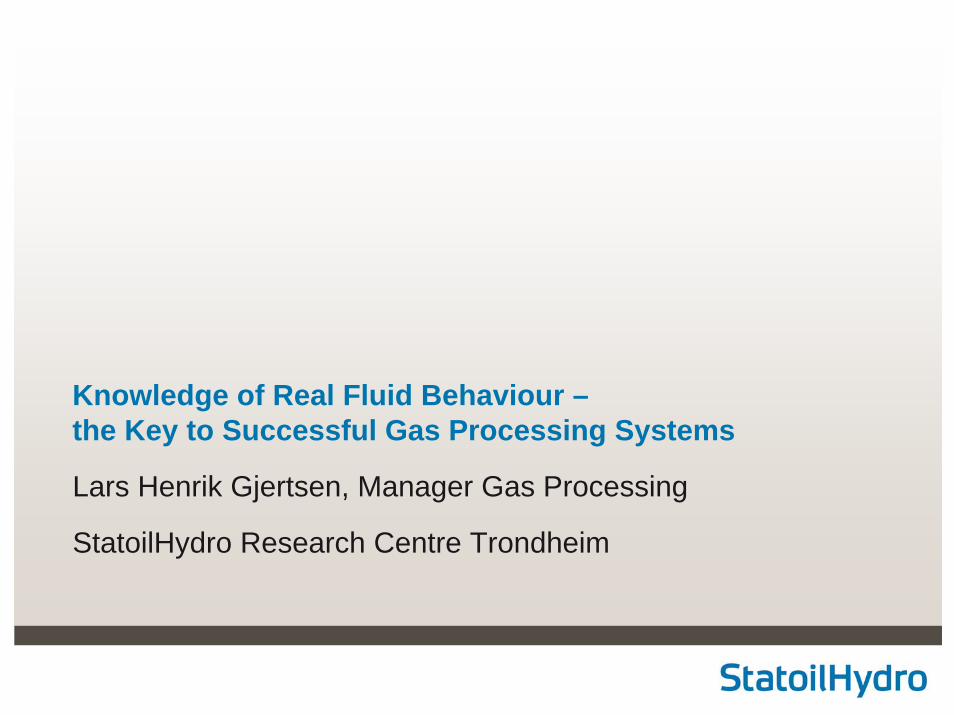
Outline• Definition Gas Processing
• Some Challenges Gas Processing
• Gas-Liquid Separation
• Solubility challenges
– Glycol Solubility in Gas
– Salt Solubility in Glycol

3
Gas Processing - elements
2 phase flowor Multiphaseflow
Sales gasPipeline transportation
Gas conversion
LNG production
•Gas-liquid separation•Dehydration•Gas sweetening (CO2 and H2S removal)•Trace component removal and handling•Glycol reclaiming and regeneration•Heat exchange•Compression/expansion

4
Some ChallengesGas-liquid separation•Compressor breakdown•Upsets in contactors and absorbers•Low efficiency/malfunction of adsorbers and absorbers•Off-spec gas product
Absorption processes•Absorbent capacity and kinetics •Foaming•Emulsions due to additives•Loss of absorbent
Solubility of trace components•Changes with process parameters•Accumulates and deposits
5
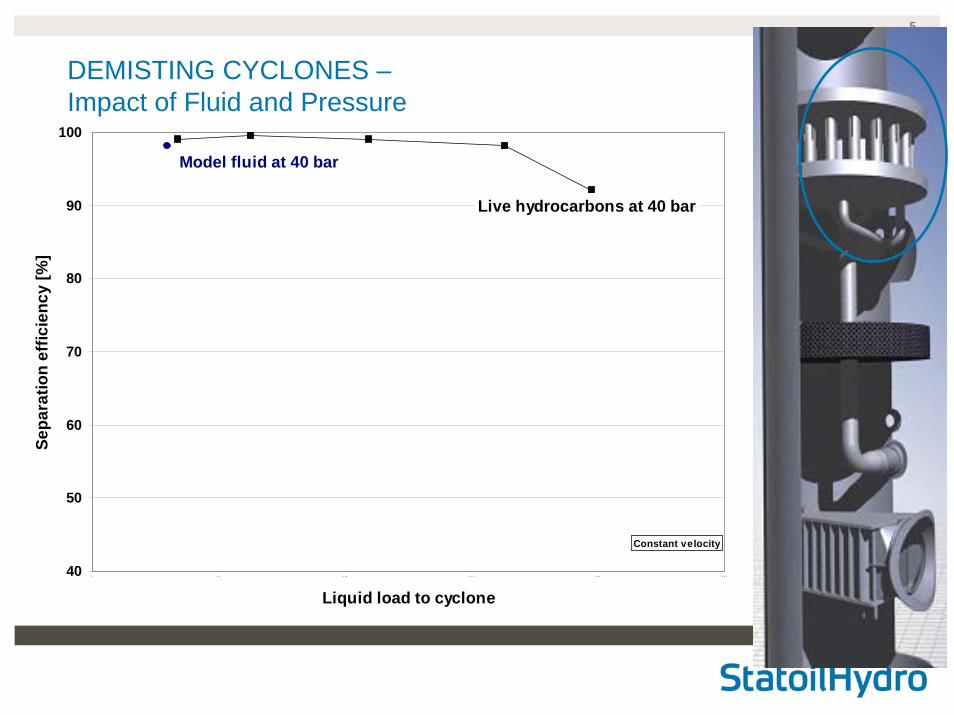
DEMISTING CYCLONES –Impact of Fluid and Pressure
40
50
60
70
80
90
100
0 5 0 1 0 0 1 5 0 2 0 0 2 5 0
Liquid load to cyclone
Sepa
ratio
n ef
ficie
ncy
[%]
Constant velocity
Model fluid at 40 bar
Live hydrocarbons at 40 bar

6
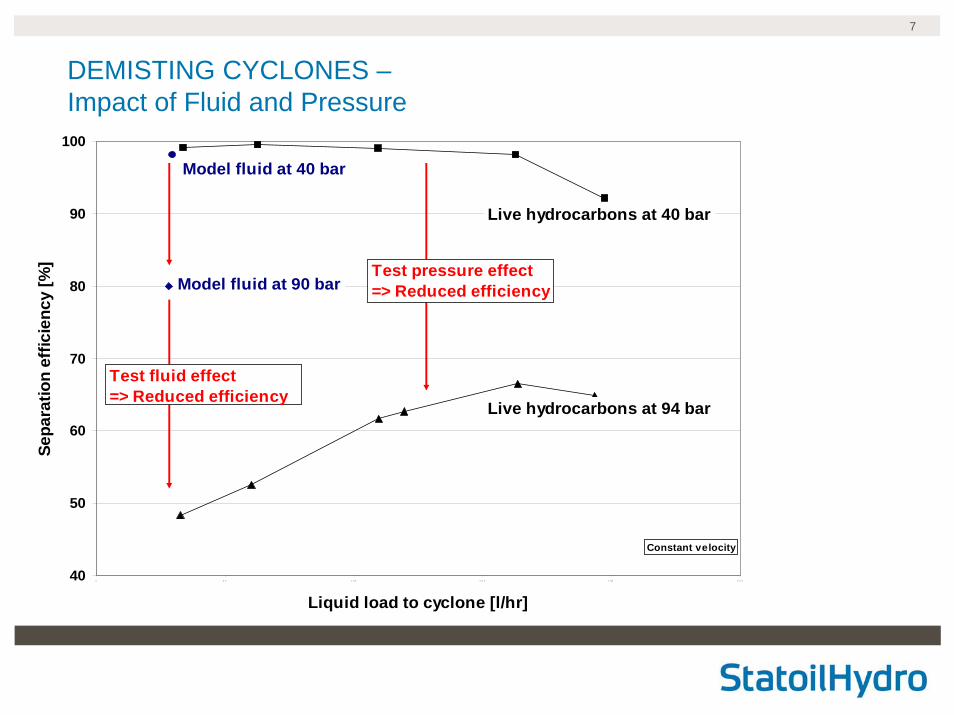
40
50
60
70
80
90
100
0 5 0 1 0 0 1 5 0 2 0 0 2 5 0
Liquid load to cyclone
Sepa
ratio
n ef
ficie
ncy
[%]
Live hydrocarbons at 40 bar
Model fluid at 90 bar
Constant velocity
Model fluid at 40 bar
Test pressure effect=> Reduced efficiency
Scaling rule important
Velocity not proper for impact of increased pressure
DEMISTING CYCLONES –Impact of Fluid and Pressure
7
40
50
60
70
80
90
100
0 5 0 1 0 0 1 5 0 2 0 0 2 5 0
Liquid load to cyclone [l/hr]
Sepa
ratio
n ef
ficie
ncy
[%]
Live hydrocarbons at 40 bar
Live hydrocarbons at 94 bar
Model fluid at 90 bar
Test fluid effect=> Reduced efficiency
Test pressure effect=> Reduced efficiency
Constant velocity
Model fluid at 40 bar
DEMISTING CYCLONES –Impact of Fluid and Pressure
8
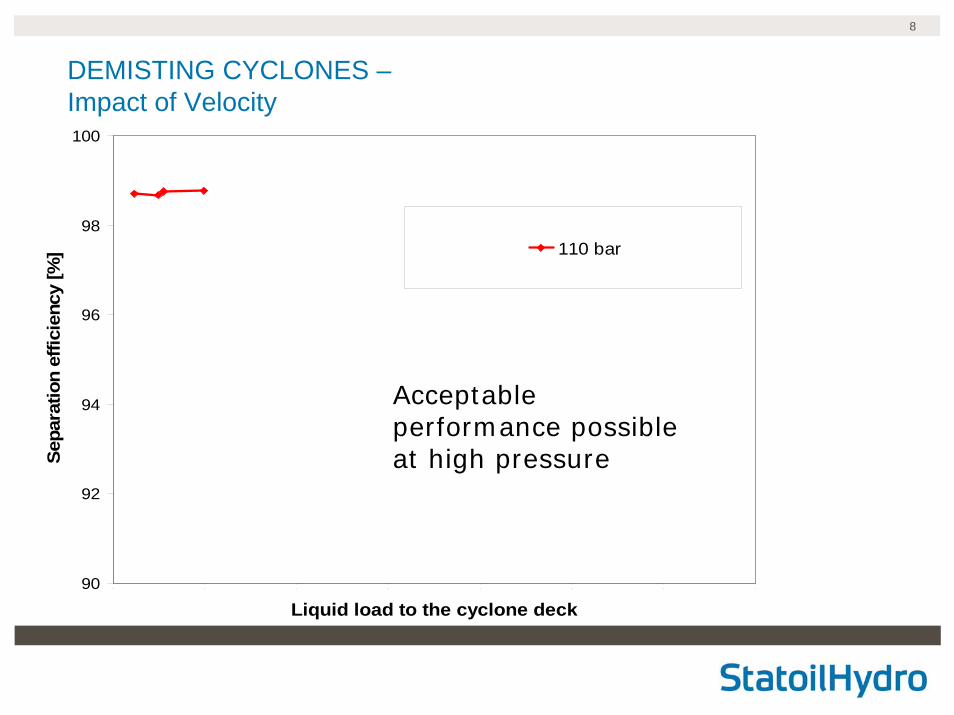
90
92
94
96
98
100
0 .0 0 .1 0 .2 0 .3 0 .4 0 .5 0 .6 0 .7
Liquid load to the cyclone deck
Sepa
ratio
n ef
ficie
ncy
[%] 110 bar
DEMISTING CYCLONES –Impact of Velocity
Acceptable performance possible at high pressure
9
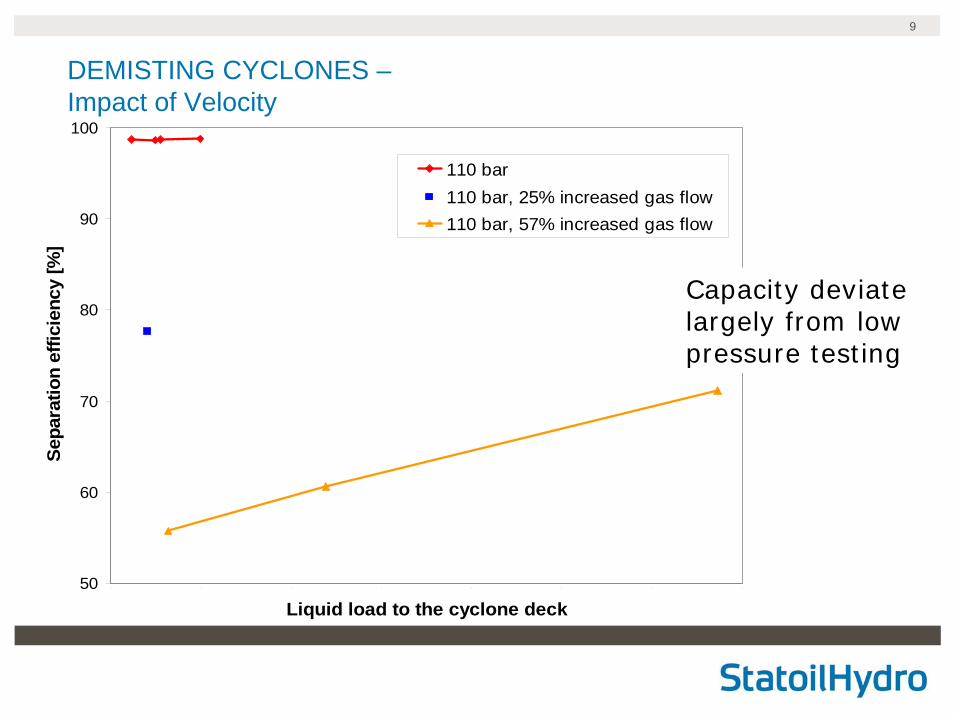
DEMISTING CYCLONES –Impact of Velocity
50
60
70
80
90
100
0 .0 0 .1 0 .2 0 .3 0 .4 0 .5 0 .6 0 .7
Liquid load to the cyclone deck
Sepa
ratio
n ef
ficie
ncy
[%]
110 bar110 bar, 25% increased gas flow110 bar, 57% increased gas flow
Capacity deviate largely from low pressure testing

10
Fluid Behaviour – Gas–Liquid Separation
• Fluid impact– Water not representative for hydrocarbon systems
– Large impact of fluid properties such as surface tension
• High pressure separation– Large impact of pressure
• Scrubber elements–Large variation in characteristics
Testing: basis for fundamental understanding and establishment of proper scaling rules
11
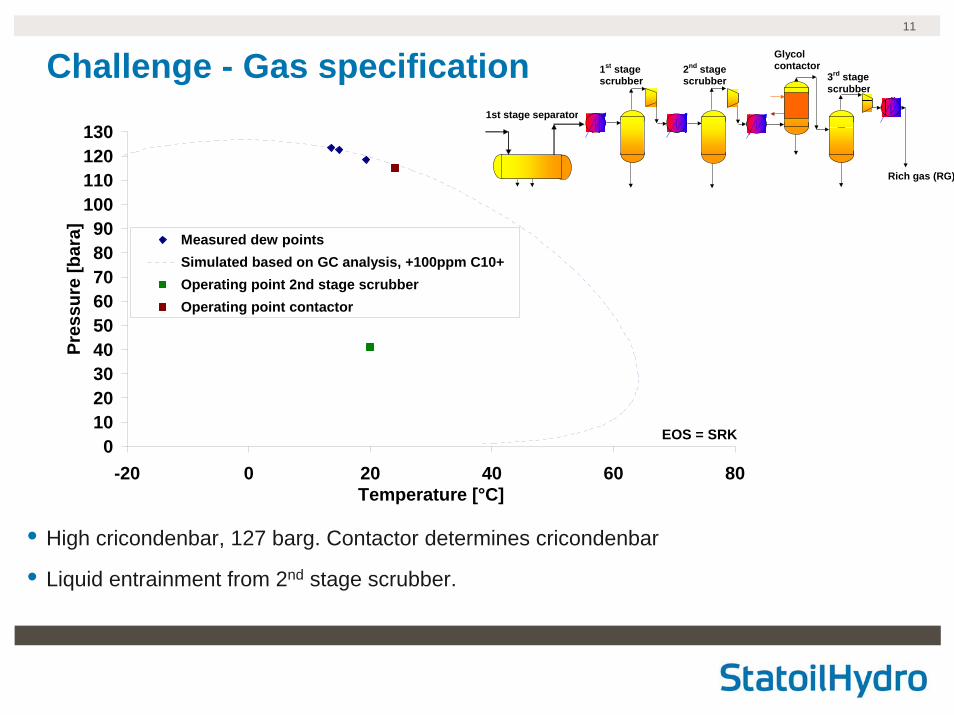
Challenge - Gas specification
• High cricondenbar, 127 barg. Contactor determines cricondenbar
• Liquid entrainment from 2nd stage scrubber.
0102030405060708090
100110120130
-20 0 20 40 60 80Temperature [°C]
Pres
sure
[bar
a] Measured dew pointsSimulated based on GC analysis, +100ppm C10+Operating point 2nd stage scrubberOperating point contactor
EOS = SRK
1st stage separator
2nd stage scrubber
1st stage scrubber
Glycol contactor
3rd stage scrubber
Rich gas (RG)
12
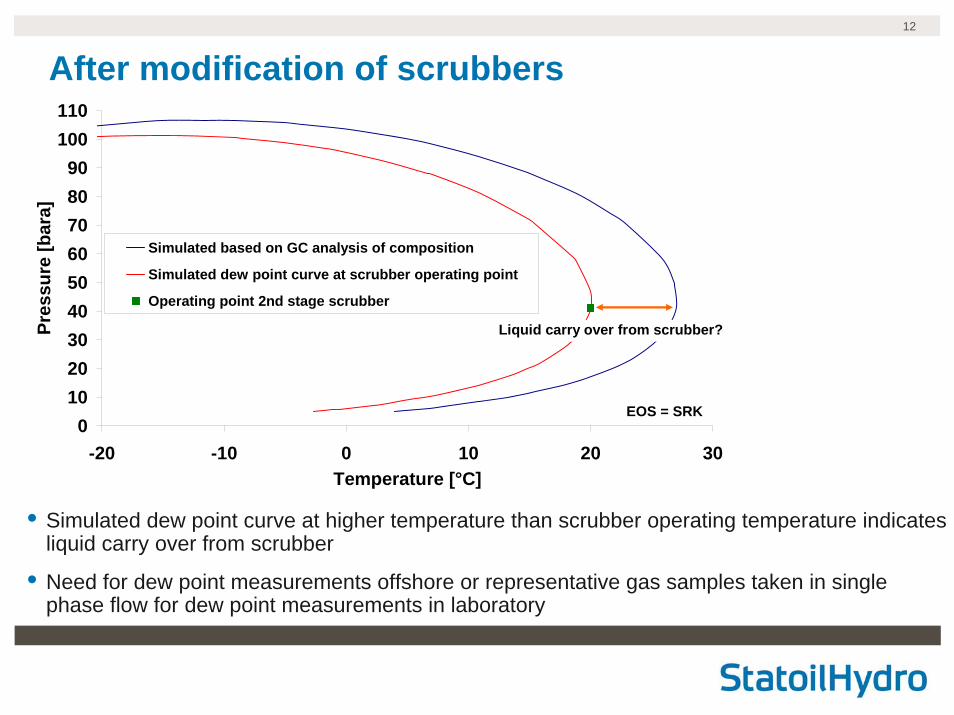
After modification of scrubbers
• Simulated dew point curve at higher temperature than scrubber operating temperature indicates liquid carry over from scrubber
• Need for dew point measurements offshore or representative gas samples taken in single phase flow for dew point measurements in laboratory
0102030405060708090
100110
-20 -10 0 10 20 30Temperature [°C]
Pres
sure
[bar
a]
Simulated based on GC analysis of composition
Simulated dew point curve at scrubber operating point
Operating point 2nd stage scrubber
Liquid carry over from scrubber?
EOS = SRK
13
0102030405060708090
100110
-20 -10 0 10 20 30Temperature [°C]
Pres
sure
[bar
a]
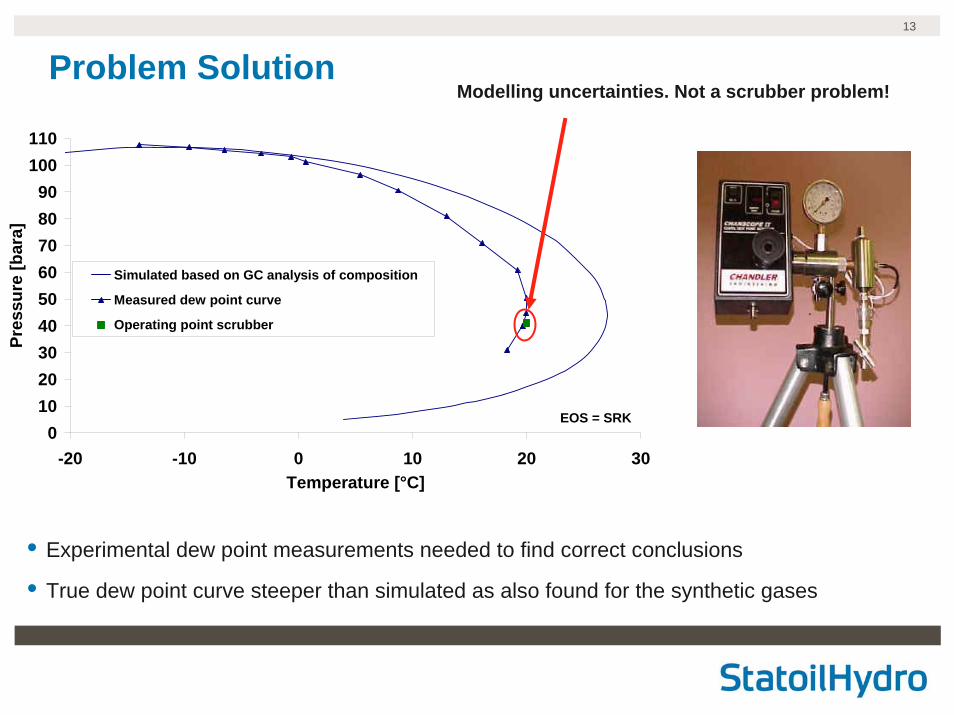
Simulated based on GC analysis of composition
Measured dew point curve
Operating point scrubber
EOS = SRK
Problem Solution
• Experimental dew point measurements needed to find correct conclusions
• True dew point curve steeper than simulated as also found for the synthetic gases
Modelling uncertainties. Not a scrubber problem!

14
Phase behaviour
Phase behaviour of natural gas with traces of water (40 ppm(mole)),NG composition (mole): 85 % C1, 10 % C2, 4 % C3, 0.5 % nC4, 0.5 % iC4
0
10
20
30
40
50
60
70
80
90
100
-60 -40 -20 0 20 40
Temperature [ºC]
Pres
sure
[bar
]
Hydrocarbon dew pointHydrocarbon buble pointwater dew pointfrost pointhydrate point
CPA-EoS (Cubic-plus-Association equation of state)
Can calculate dew point, frost point and hydrate pointAlso well applicable for aqueous dew point
15
0
10
20
30
40
50
60
70
80
90
100
-60 -40 -20 0 20 40
Temperature [ºC]
Pres
sure
[bar
]
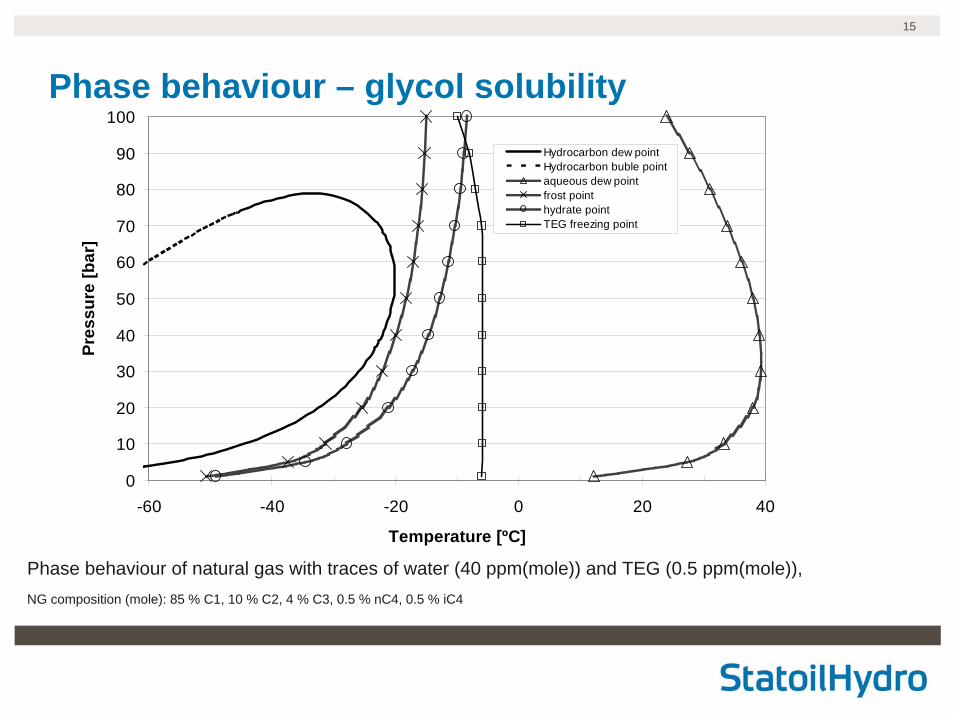
Hydrocarbon dew pointHydrocarbon buble pointaqueous dew pointfrost pointhydrate pointTEG freezing point
Phase behaviour – glycol solubility
Phase behaviour of natural gas with traces of water (40 ppm(mole)) and TEG (0.5 ppm(mole)),NG composition (mole): 85 % C1, 10 % C2, 4 % C3, 0.5 % nC4, 0.5 % iC4

16
Challenge – Contamination of absorbent
0
1
2
3
4
5
6
7
8
9
10
06 .08 .2 007 1 4 .1 1 .2 007 2 2 .02 .2 008 01 .06 .2 008 09 .09 .2 008 1 8 .1 2 .2 008 2 8 .03 .2 009 06 .07 .2 009 1 4 .1 0.2 009 2 2 .01 .2 01 0
Date
Gly
col i
n A
min
e (%
)
Analysed No effect limit Linear (Analysed)
Glycol dehydration unit in upstream process
Glycol soluble in gas
Accumulates in Amine
Amine capacity affected
17
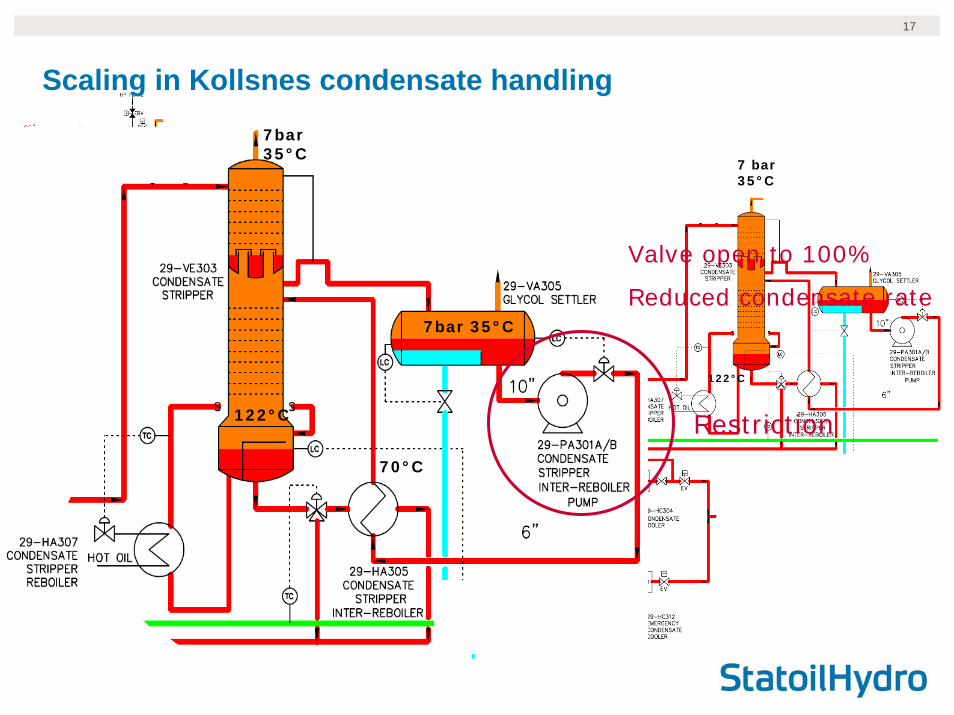
Scaling in Kollsnes condensate handling
93 bar5°C
25 bar25°C
122°C
7 bar35°C
7bar35°C
7bar 35°C
70°C
122°C Restriction
Valve open to 100%
Reduced condensate rate

18
Questions to task force• Why scale in a condensate system?
• Why now after several years of operation?
• Why NaHCO3 – a salt with high solubility?
• How to remove it without shutting down the production?
– A wash/replace will require 8-12 hours -> loss of 50-70 MSm3 gas
• Which chemicals can we use that will not contaminate the condensate?And please hurry!
The valve is about to get plugged once more!
19
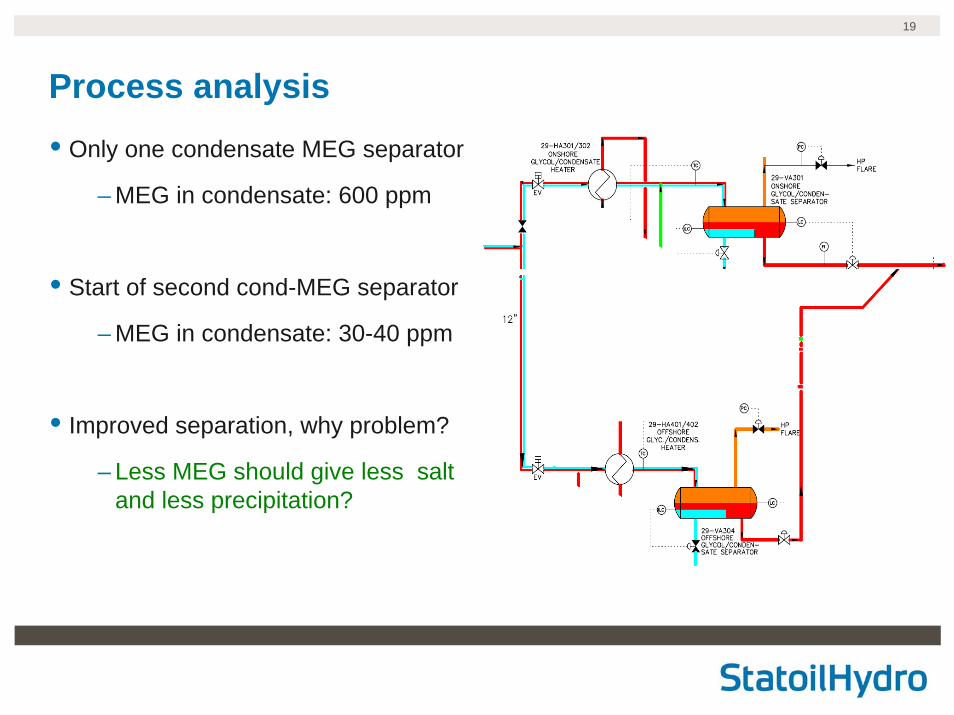
Process analysis• Only one condensate MEG separator
– MEG in condensate: 600 ppm
• Start of second cond-MEG separator
– MEG in condensate: 30-40 ppm
• Improved separation, why problem?
– Less MEG should give less salt and less precipitation?

20
0
10
20
30
40
50
60
70
80
90
100
0 200 400 600 800 1000MEG in condensate (ppm)
MEG
as
liqui
d (%
)MEG evaporation in stripper column• MEG is depressurised to 7 bar and heated to 35°C
– Solubility of MEG and water in gas increases
• What happens when MEG in condensate is reduced from 600 to 30-40 ppm?
600 ppm:50% of water/MEG still as liquid
2-300 ppm:No more liquid water/MEGComplete evaporation
30-40 ppm

21
Scale removal options
• Open/replace valve
– Require shutdown, loss of 50-70 MSm3 gas
• Carbonate salt -> Use an acid (suggested by a service company)
– Require shutdown as acid would contaminate condensate
• Water – NaHCO3 is highly soluble
– Possible, but will increase water content in condensate
– May cause hydrate formation in condensate transfer line
• What about using MEG?
22
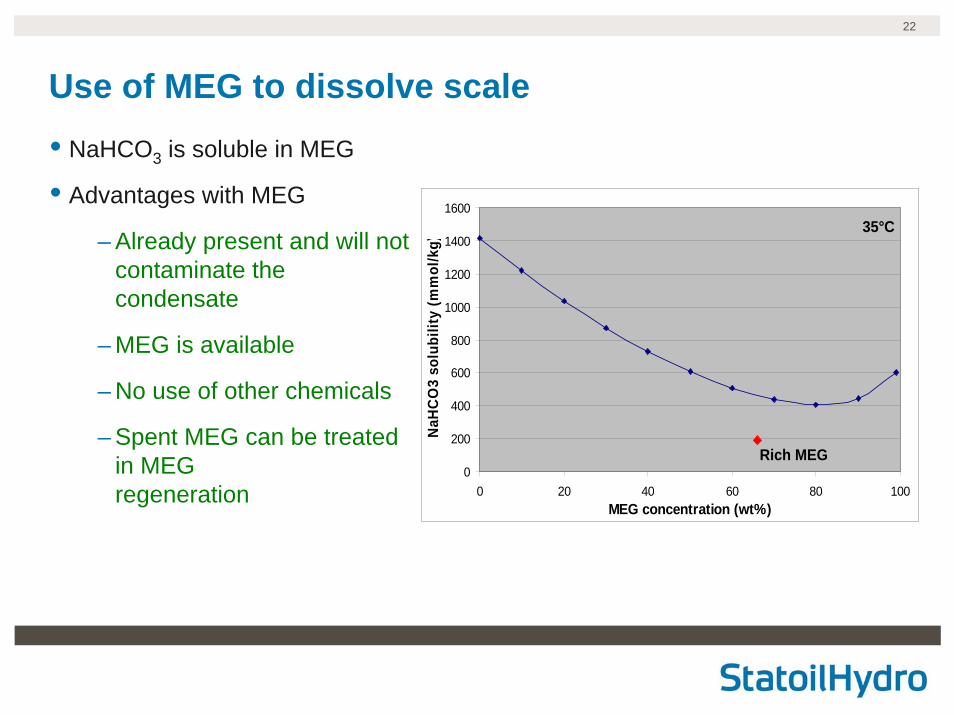
Use of MEG to dissolve scale• NaHCO3 is soluble in MEG
• Advantages with MEG
– Already present and will not contaminate the condensate
– MEG is available
– No use of other chemicals
– Spent MEG can be treated in MEG regeneration
0
200
400
600
800
1000
1200
1400
1600
0 20 40 60 80 100MEG concentration (wt%)
NaH
CO
3 so
lubi
lity
(mm
ol/k
g)
35°C
Rich MEG
23
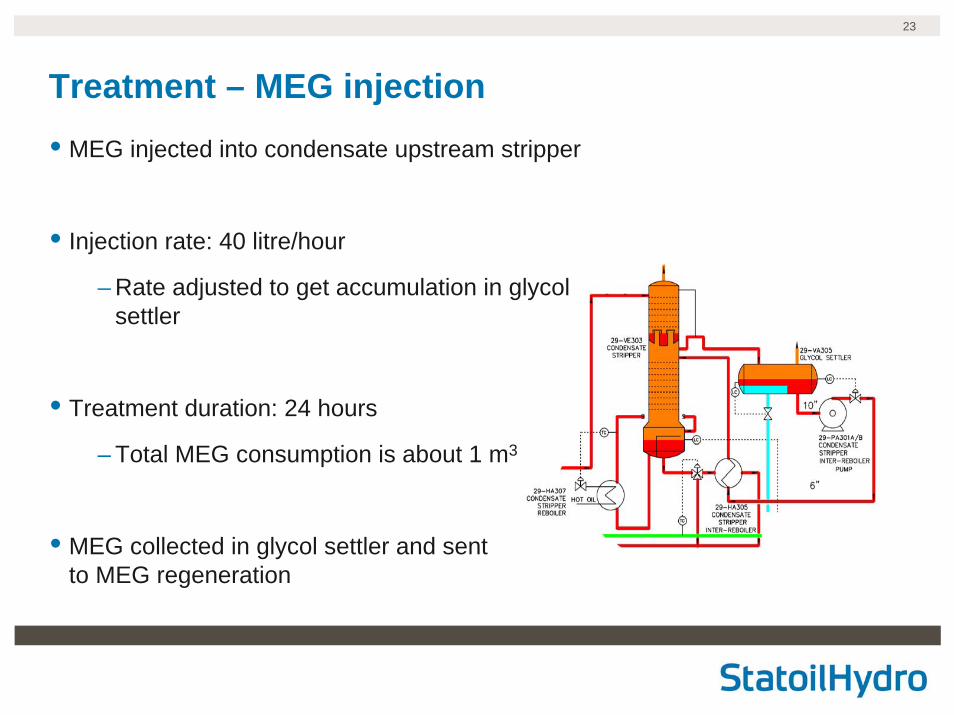
Treatment – MEG injection• MEG injected into condensate upstream stripper
• Injection rate: 40 litre/hour
– Rate adjusted to get accumulation in glycol settler
• Treatment duration: 24 hours
– Total MEG consumption is about 1 m3
• MEG collected in glycol settler and sentto MEG regeneration
24
Summary – key to success• Experimental evaluations
– Evaluations have to be carried out with real fluid systems – model systems will deviate from real systems
– Large impact of pressure; high pressure processing is a challenge
– Establish fundamental data and knowledge of mechanisms
– Developing improved design and solutions
• Modelling
– Experimental data and experiences need to be incorporated into models
– Models to be used in combination with best practices
• Operational experience and problem definition
– Important to identify where data/knowledge is needed
– Combination with experimental experience proven to be successful