Embed Size (px)
Citation preview

Kodak C
olor Control P
atches B
lue G
reen Y
ellow
Red
White
Kodak G
ray Scate
A
1 2
s 4
· s

CD
Study of reaction mechanisms for (p, n) and (p, p') quasi elastic scatterings
Doctoral Thesis
by
Hideaki Otsu
Department of Physics, School of Science,
University of Tokyo
Bunkyo-ku, Tokyo 113, Japan
December, 1995, revised in March, 1997

Abstract
This thesis deals with the experiment of quasi elastic scattering using polarized proton beam
at around 400 MeV. We have aimed at clarifying the systematic features, such as q dependence
or A dependence, of the proton induced quasi elastic scattering by measuring the cross sections
and the analyzing powers. We measured these observables for the (p, n) reaction at 392(295) MeV and for the (p , p')
reaction at 400 MeV. From the comparison with these observables for free NN scattering, we
have derived the systematic deviations of those for quasi elastic scattering. The peak positions
in the cross section spectra systematically shift towards high energy transfer for both the (p, n) and (p, p1) reactions. The analyzing powers for the (p, p') reaction are reduced while those for
the (p, n) reaction are enhanced. We have discussed how simple models are able to give satisfactory explanations about these
deviations simultaneously. We have tested a framework of the relativistic plane wave impulse
approximation. It is found that the framework reproduces the tendency of the deviations qual
itatively. We have concluded that the relativistic framework is one of the candidates available to explain simply the mechanism of the measured deviation of the observables for quasi elastic
scattering.

CONTENTS
Contents
1 Introduction
1.1 What is quasi elastic scattering
1.2 Response functions of the nucleus .
1.3 How to probe the modification of the response function experimentally
1.4 Historical review
1.5 Thesis objectives
1.6 Thesis outline ..
2 Experiment and Data analysis
2.1 Overview
2.2 Experiment . ...
2.3 Experimental setup for (p, n) measurement
2.4 Data analysis for (p, n) measurement
2.5 Experimental setup for the (p, p') measurement
2.6 Data analysis for the (p, p') measurement
2. 7 Systematic errors
3 Experimental results
3.1 Spectra . . 3.2 Peak position and analyzing power at the peak position
4 Discussion
4.1 Standard reaction model .
4.2 Fermi gas model
4.3 Kinematic effect of the Fermi motion
4.4 Relativistic PWIA
5 Summary
6 Conclusion
Reference
Appendix A Response function by the Fermi gas model . B Projectile energy dependence of peak shifts by the PWIA calculation .
C Parameterization of NN amplitude
D Expansion of the G I au ber theory
E Other results : 13C(p, n) reaction
Acknowledgement
1
2 4
6 7
9
9
11
11
22 28 32
42
44
44 57
65
65
69 77
86
93
95
96
100
100
106
109
111
113
115
List of Figures
List of Figures
1- 1 Expected response of the quasi elastic scattering
1- 2 Modification of R1- and Rr .
1- 3 Probe dependence of peak positions
1- 4 Energy dependence of the total NN cross sect ions .
2- 1 RCNP ring cyclotron facility 2- 2 Time of flight spectrum of the 7 Li(p, n) reaction at 0°.
2- 3 Beam line polarimeter
2- 4 Beam polarization
2-5 Beam pulsing device
2- 6 NO room .
2- 7 eutron polarimeter system 2-8 Circuit for neutron singles event
2- 9 Schematic view for timing information
2-10 Timing monitor results . 2- 11 Calibration of the light outputs of the neutron detectors
2- 12 Neutron detection efficiency 2-13 Subtraction of carbon contribution from the CD2(p, n)spectrum .
2- 14 LAS .
2- 15 Definition of the coordinate frames
2-16 Focal plane counter. 2- 17 Event selection by trigger counter .
2-18 A cluster of one plane in the VDC 2- 19 Method obtaining efficiency of the VDC planes
2- 20 Efficiency of each plane
2- 21 LAS solid angle 2- 22 Cross section for the 12C(p,p) elastic scattering
2- 23 Consistency among three magnetic fie ld sets . 2- 24 Subtraction of carbon contribution from the CD2(p, p') spectrum
3- 1 2H(p,p') at proton energy of400 MeV 3- 2 2H(p, n) at proton energy of 392 MeV
3- 3 6Li(p, p') at proton energy of 400 MeV
3- 4 6Li(p, n) at proton energy of 392 MeV
3- 5 7 Li(p, p') at proton energy of 400 MeV
3- 6 7 Li(p, n) at proton energy of 392 MeV
3- 7 9Be(p, p') at proton energy of 400 MeV .
3- 8 9 Be(p, n) at proton energy of 392 MeV
3- 9 12 C(p, p') at proton energy of 400 MeV .
3- 10 12 C(p,n) at proton energy of 392 MeV
3- 11 13 C(p,p') at proton energy of 400 MeV.
3- 12 13 C(p, n) at proton energy of 392 MeV
3- 13 ""'Ca(p, p') at proton energy of 400 MeV .
ii
1
3
7
10
12
14
15
16
18 19 20
23
24
25 26
27 28
30 31
33 35
36 37
38
39 40
41
45 45
46 46
47 47 48
48
49
49
50
50
51
List of Figures
3- 14 na<ca(p, n) at proton energy of 392 MeV .
3- 15 l8 1Ta(p,p') at proton energy of 400 MeV.
3- 16 181 Ta(p, n) at proton energy of 392 MeV .
3- 17 208Pb(p, p') at proton energy of 400 MeV
3- 18 natpb(p, n) at proton energy of 392 MeV
iii
51
52
52
53
53
3-19 na<cu(p,p) at proton energy of400 MeV 54
3- 20 2H(p, n) at proton energy of 295 MeV 54
3- 21 12 C(p, n) at proton energy of 295 MeV . 55 3- 22 na<ca(p, n) at proton energy of 295 MeV 55
3- 23 Peak position for the 12C(p, n) spectrum at 20° 59
3- 24 Peak position for the 12 C(p,p') spectrum at 28° 59 3- 25 Momentum transfer dependence of peak positions and analyzing powers for 12 C 60
3- 26 Momentum transfer dependence of peak positions and analyz ing powers for na<ca 61
3-27 Momentum transfer dependence of peak positions and analyzing powers for Pb 61
3- 28 Momentum transfer dependence of peak positions and analyzing powers for 2H 62
3-29 Mass number dependence of the peak positions at 20° 62
3-30 Mass number dependence of the analyzing powers at 20° and 28° 63 4-1 Schematic diagram of the impulse approximation for the quasi elastic scattering. 65
4- 2 Schematic picture for describing the Glauber model .
4- 3 The response function of Fermi gas model
4- 4 The deviation of the peak position
4- 5 Result of 6w of the FGM
4- 6 Neff 4- 7 Aeff 4-8 Schematic diagram of kinematics 4-9 Quasi- elastic scattering kinematics
4- 10 NN cross section at 400 MeV 4- 11 Energy dependence of the NN cross section around 400 MeV
4- 12 Kinematic effects at 400 MeV 4- 13 Peak position by the PWIA calculation .
4- 14 RPWIA calculation(m*/m=0.7) 4- 15 1N amplitude for the (p,n) and (p,p') reaction
A- 1 The response function with non- relativistic kinematics
B- 1 NN cross section around 200 MeV
B- 2 Kinematic effects at 200 MeV
B- 3 N cross section around 800 MeV
B-4 Kinematic effects at 800 MeV E- 1 Comparison between 13 C and 12C .
67
69 71
72
75 75
77
79
80
81 82
84
91
91
101
106
106
107
107
113
List of Tables
List of Tables
1 1 The QES measurements ..
2- 1 Summary of experimental conditions 2- 2 Beam energy for the (p, n) experiment derived from the time difference between
the 7 flush and the 7Li(p, nj1Be(g.s.+0.43 MeV) reaction.
2- 3 Analyzing powers of the H(p ,p) reaction for the beam line polarimeter
2- 4 The dynamic range of neutron energy
2- 5 Target thickness and energy loss for the (p, n) experiment
2- 6 Specifications of LAS and VDC counters . 2- 7 Target thickness for the (p, p') reaction measurement and calculated energy loss
of the 400 MeV protons in the target .
2- 8 Magnetic field set .
3- 1 Figure list for the reaction
4- 1 The kp, Aerr (N.rr), and 6w results from the Fermi gas model.
4- 2 Average masses and Fermi momenta C- 1 Parameters in matrix elements .
iv
6
11
12
15
17
21
29
32
40 44
73
88 108
INTRODUCTION
1 Introduct ion
1.1 What is quasi e lastic scattering
At intermediate energies where the bombarding energy EN is greater than 100 MeV, the quasi
free scattering (QFS) process becomes the dominant nucleon- nucleus scatte ring process . It is
considered to be a one-step process where a projectile nucleon makes a single collision with a
nucleon inside the nucleus. Because the wave length of the projectile at these energies is of the
same order as the nucleon size ( ~ 1.2 fm), the projectile interacts directly with a nucleon inside
the target nucleus .
The reaction process looks almost like a free nucleon- nucleon (NN) scattering process. In
the QFS process, a process which does not excite nucleon degrees of freedom is called a quasi
elastic scattering (QES) process. Besides the QES process, for example, a 6. excitation becomes
possible at sufficiently high bombarding energies. This is called a quasi free 6. production (QF6.)
process.
Suppose the nucleus is excited with momentum transfer q and energy transfer w, then the
QES process is expected to be observed as a bump in the cross section spectrum as a function
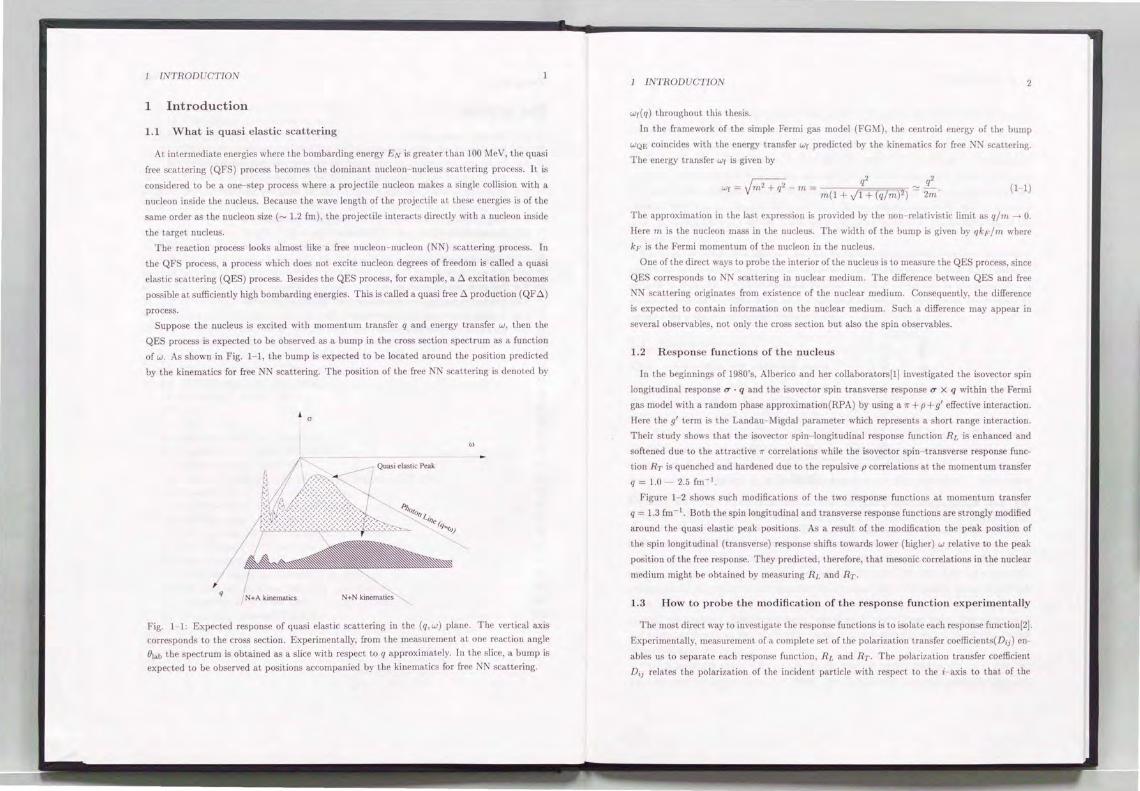
of w. As shown in Fig. 1- 1, the bump is expected to be located around the position predicted
by the kinematics for free NN scattering. The position of the free NN scattering is denoted by
• 0
w
N+A ki nematics N+N kinematics
Fig. 1 I: Expected response of quasi elastic scattering in the (q,w) plane. The vertical axis
corresponds to the cross section. Experimentally, from the measurement at one reaction angle
Blab the spectrum is obtained as a slice with respect to q approximate ly. In the sl ice, a bum p is
expected to be observed at positions accompanied by the kinematics for free 1 N scattering.
INTRODUCTION
wr(q) throughout this thesis.
In the framework of the simple Fermi gas model (FGM), the centroid energy of the bump
WQE coincides with the energy transfer wr predicted by the kinematics for free NN scattering.
The energy transfer wr is given by
~ q2 q2 wr = m
2 + q
2- m = m(l + JI + (q/m)2) "' 2m· (1-1)
The approximation in the last expression is provided by the non- relativistic limit as qfm--> 0.
Herem is the nucleon mass in the nucleus. The width of the bump is given by qkF/m where
kF is the Fermi momentum of the nucleon in the nucleus.
One of the direct ways to probe the interior of the nucleus is to measure the QES process, since
QES corresponds to N scattering in nuclear medium. The difference between QES and free
NN scattering originates from existence of the nuclear medium. Consequently, the difference
is expected to contain information on the nuclear medium. Such a difference may appear in
several observables, not only the cross section but also the spin observables.
1.2 Response funct ions of t he nucleus
In the beginnings of 1980's, Alberico and her collaborators[!] investigated the isovector spin
longitudinal response u · q and the isovector spin transverse response u X q within the Fermi
gas model with a random phase approximation(RPA) by using a 1r + p + g' effective interaction .
Here the g' term is the Landau-Migdal parameter which represents a short range interaction.
Their study shows that the isovector spin-longitudinal response function RL is enhanced and
softened due to the attractive 1r correlations while the isovector spin- transverse response func
tion Rr is quenched and hardened due to the repulsive p correlations at the momentum transfer
q = 1.0 - 2.5 fm-l
Figure 1- 2 shows such modifications of the two response functions at momentum transfer
q = 1.3 fm - 1. Both the spin longitudinal and transverse response functions are strongly modified
aro und the quasi elastic peak positions. As a result of the modification the peak position of
the spin longitudinal (transverse) response shifts towards lower (higher) w relative to the peak
position of the free response. They predicted, therefore, that mesonic correlations in the nuclear
med ium might be obtained by measuring RL and Rr .
1.3 H ow to pro be the modification of t he r esponse function exp erimentally
The most direct way to investigate the response functions is to isolate each response function[2].
Experimentally, measurement of a complete set of the polarization transfer coefficients(D;j) en
ables us to separate each response function , RL and Rr. The polarization transfer coefficient
D,1 relates the polarization of the incident particle with respect to the i- axis to that of the

INTRODUCTION
0 .015
~
-;;,. 0.010 <!.>
6 0::
0.005
I I
I .'
I I
r' I \
I \
I I
' I '.I
'.1 '\
t 1'. I\
\ I-
I'. I\ \
20 40 60 80 100 120 <>J [MeV]
3
Fig. 1- 2: Results of calculations with the RPA correlation at q= l.3 fm - 1. The horizontal
axis indicates the energy transfer w. In the region around the bump, the spin longitudinal
response (dashed line) is en hanced and softened relative to the free Fermi response while the
spin transverse response (solid line) is reduced and hardened. The free Fermi gas response is
indicated by a dot- dashed line. This figure was taken from reference [1].
INTRODUCTION
scattered particle with respect to the j - axis. Such a complete set of D;j provides us with
information on the transferred spin direction relative to the ij direction.
Although polarization transfer coefficients have been measured for the (p, p') and (p, n) re
actions, such meas urements arc too time consuming. Therefore it is difficult to do systematic
surveys. An alternate way to study the response functions is to measure the cross section since
it is easy to do systematic studies. The cross section is given by a linear combination of the
response functions, RL , Rr, and R0 , where Ro is the response function of the spin independent
part. Therefore the cross section is also expected to be sensitive to the modification of the
respo nse functions.
The analyzing power Ay is another candidate for the systematic surveys because it is relatively
easy to be measured. The experimental difficulty might depend on what kind of experimental
equ ipment is needed. The cross sections and the analyzing powers can be measured when a
polarized beam is available, whi le both a polarized beam and a polarimeter are required to
measure the polarization transfer coefficients D;j.
1.4 Historical review
1.4.1 cross section and analyz ing power
In the beginning of 1980's, at the same time as the prediction by Alberico, the measurement
of the cross sect ion for proton induced quasi elastic scattering was already underway.
Chrien and his co llaborators measured cross sections of the (p, p') reaction for several targets
from 6Li through Pb at a proton bombarding energy of 800 Me V[3]. They identified not only
the QES peaks bu t also the QF 6 peaks. They investigated the peak position and mass number
dependence of the cross section at the peak. It was found that the shift of the QES peak
positions from wr predicted by the kinematics of the NN scattering is less than 2 MeV and that
the integrated cross section at the peak has a mass dependence of A 0A
Carey and his collaborators measured analyzing powers for the (p, p') QES for the Pb and
Ca targets[4] . They found that the analyzing powers at the quasi elastic peak are reduced to
60% of the free NN value both for the Pb and Ca targets.
T he predicted values of the analyzing powers based on the non- relativist ic model are es
sentially the same as those of the NN scattering[8]. Therefore the reduction of the analyzing
powers for the (p, p') QES is not explained by the non- relativistic models. In the relativ istic
model[9, 10], on the contrary, the NN amplitudes are modified in the nuclear med ium, and as
a result , the analyzing powers are reduced from those for free NN scattering. This reduction of
the analyzing powers for the (p, p') QES has been considered to be one of the clearest signa ls
of relativistic effects.
T he measurement of the QES process by the isovector probe, such as the (p, n) reaction ,
has been performed since the end of 1980's. The isovcctor probe excites purely the isovector

1 INTRODUCTION 5
200 0
* 12C(3He ,t) 0
0
150 0 12C(e,e') " 12c(p.p')
0 + 0 0 + ,---,
> • 12c(p,n) • otb •
*\ Q)
:::8 100 ~0" '--' e '* eo
w=q 2/2m 3 rltdt> * • oo
• -~o6' 50 +
0 +
0~------~----~L-----~L-----~ 3.0 1.0 1.5 2.5
Fig. 1- 3: The peak positions by the (e , e') (open circle) , (p ,p') (cross), [3He,t) (star) , and (p ,n) (solid circle) reactions. The solid line indicates the position predicted by the kinematics of the
NN scattering. This figure was taken from reference [2J.
responses while the (p, p') reaction excites both the isoscalar and isovector responses. For the
(p, n) measurements[ll, 12J, the peak position is located at 20 MeV above wr. Such a shift of
the peak position seems to indicate the strong repulsive correlation of the effective interaction.
The behavior of the peak shift is further complicated in the case of other probes such as the
[3He, t) [19J or (d, 2He) reactions [20 , 21, 23J. The peak positions are shifted to higher win the
regions of q < 2.0 fm- 1 while they are shifted to lower w in the region of q > 2.0 fm- 1 as shown
in Fig. 1- 3. A similar behavior is observed in pion single charge-exchange reactions[22J.
1.4.2 polarization transfer coefficients
A complete set of polarization transfer coefficients for the (p , p') reaction was measured at
500 MeV by Carey and his collaborators[4 , 5J. They derived the response functions R1" and
Rr separately. The ratio Rl) Rr is consistent with unity. The expected enhancement of t he
spin- longitudinal response is not observed from the results of the (p, j1) measurements. The
same conclusion has been derived from t he results of (p, ii) measurements. The ratio RL/ Rr is
again close to unity[12 , 17J. This result seems to indicate the sign ificant modifications of either
1r or p correlation in nuclei.
1 INTRODUCTION 6
Ep [MeVJ Facility I observables Target q [fm 1J Ref.
(p,p') QES
290 TRIUMF a, Ay 208pb 0.8 - 2.5 [8J 400 RCNP a, Ay 2H _ zospb 1.0 - 2.4 present data 420 TRIUMF a , Ay 208pb 0.8 - 2.5 [8J
500 LAMPF u, Ay, p y', Dii zH , •zc , 4aca, zospb 1.8 [4, 5J
800 LAMPF a zH 208 pb 0.8 - 3.0 [3J (p,n ) QES
186, 200 IUCF a , Ay zH _ •Jc 1.0 - 2.4 [15J 290 TRIUMF a , Ay •zc, s4Fe 1.4 [16J
295 RCNP a , A y zH,•zc,4aca 1.0 - 2.5 present data 346 RC P cr, A y , p y', Dij zH,6Li , •zc,4oca,zospb 1.7 [17J
392 RC P a , Ay 2H _ zospb 1.0 - 2.4 present data 420 TRIUMF a , Ay •zc 2.1 [16J 495 LAMPF a , Ay zH, •zc,zospb 1.0 - 2.1 [llJ
a , Ay, py' , Dii zH, •zc,4oca 1.75 [12J
795 LAMPF a , Ay zH, •zc,zospb 1.0 - 3.5 [11J other isovector probes
170 (n ,p) LAMPF a •zc 1.5 [24J
1600 (d , 2Hc) LNS a , Ay , Ai; 12C 2.1 [23J
2000 [3Hc, t) LNS a •zc 1.4 - 2.5 [19J
Table 1- 1: Summary of the QES measurements
1.4.3 summary of the historical review
The measurements of the QES process which have been reported up to now are listed in table
1- 1. Until now, questions related to proton induced QES may be categorized into three issues.
A. For the (p , n) QES, why are the peak positions located at higher energy transfer relative
to the position predicted by the kinematics for free NN scattering?
B. For the (p , p') QES, why is the reduction of the analyzing powers reduced relative to
that for free NN scattering.
C. \Vhy is the Rl) Rr ratio consistent with unity, which contradicts with the RPA predic·
tion.
1.5 Thesis objectives
In this thesis, we focus on a study of the QES process for both the (p,n) and (p , p') reactions.
The main aim is to answer the issues A and B by systematic measurements of the cross sections
- ------
,
I
I
; i ,I
I
~ ~
!

INTRODUCTION 7
and analyzing powers. We have measured the cross sections and the analyzing powers of the
QES region for the (p, p') reaction at 400 MeV and the (p, n) reaction at 295 and 392 MeV.
The advantage of these incident energies is that the total cross sections of the NN scatte ring
have their minimum values. Using the protons of such an initial energy, the one--step process
becomes dominant because the mean free path gets longer depending on the decrease of the
total cross sections. Fig. 1- 4 shows the energy dependence of the total cross sect ions of the
p + p and n + p scatterings. It clearly shows the minimum around 200 400 MeV.
aPP and anp
60
\ j -;:; \ aPP
..§, 50
\ J I \ • I c I :3 ~~~ u ~ 40
\~ •• .....-1' .. ,. . • " " \+,t. ~·t I E u anp
:§ 30 •I .3
20 0 200 400 600 600 1000 1200
Initial Energy (MeV]
Fig. 1- 4: As a function of the initial laboratory energy of protons, the total cross section app
(anp) of the p + p (n + p) reaction is indicated by solid (dashed) line. The total cross sections
have mi nimum values around 200 - 400 MeV.
Using the results of the cross sections and analyzing powers of t he (p, n) and (p, p') QES, we
investigate the q and A dependence of the peak positions and the analyzing powers at the peak
positions. We discuss how simple models are able to explain simultaneously the characteristic
features extracted from this investigation.
1.6 Thesis outline
We describe the experimental procedures and data analyses in section 2.
In section 3, all spectra taken in the measurements arc shown. From the spectra we derive
peak positions and analyzing powers at the peak positions.
In section 4, three models in wh ich the target nucleus is regarded as the Fermi gas arc
discussed. The results of the calculations of the models arc compared with the experimental
data. We search for a model which describes the cross sections and analyzing powers for both
INTRODUCTION 8
(p, n) and (p, p') reactions simultaneously. We summarize this work in section 5. Finally the
conclusions arc given in section 6.
~ I
I i

2 EXPERIMENT AND DATA ANALYSIS 9
2 Experiment and Data analysis
In this section experimental methods for both the (p, n) and (p , p') measurements arc de
scribed. Firstly, an overview of the experiments is given. Then instruments for measuring the
(p , n) reaction and methods of data analyses arc described. Lastly, instruments for measuring
the (p, p') reaction and methods of data analyses are described.
2.1 Overview
All experiments were carried out at the ring cyclotron facility at Research Center for Nuclear
Physics (RCNP). A schematic representation of cyclotrons, beam lines, and experimental halls
is shown in Fig. 2- 1.
The experiments measuring the (p , n) reaction were carried out at the NO beam line. The 'O
beam line consists of a target system in a swinger magnet, Neutron Time- Of- Flight (NTOF)
tunnel, and a neutron detector complex in the tunnel. The neutron detector complex was devel
oped as a Neutron POLarimeter (NPOL) for measurements of polarization transfer coefficients.
In the measurement described in this thesis, the NPOL was operated just as an efficient neutron
detector. Polarized protons are transported from an ion source to a beam dump as follows. The protons
(p) are produced by the polarized ion source, then are accelerated by the AVF cyclotron and
then by the ring cyclotron up to energies of 295 or 392 MeV. In an injection line to the ring
cyclotron a low energy beam-line polarimeter is located. This low energy polarimeter was used
for calibrating beam line polarimeters for high energy protons which are located at beam lines
downstream from the ring cyclotron. The protons are transported to the NO experimental hall
along the NO beam line. The polarization of the proton beam is monitored by the beam line
polarimeter located upstream from the target chamber in the NO experimental hall. Details of
the NO experimental hall, NTOF, and NPOL are described in subsection 2.3.5.
The experiment measuring the (p, p') reaction was carried out at the W N beam line using a
Large Acceptance Spectrograph (LAS) . The beam protons are produced in a similar manner
as the (p, n) measurements. Polarized protons were accelerated in the two cyclotrons up to
energy of 400 MeV. The polarization of the protons is monitored in a beam line polarimeter at
the entrance of the WN experimental hall. The protons are transported to a target chamber
and collected by a beam stopper in the target chamber. Scattered protons from the target are
momentum- analyzed by the spectrograph LAS and detected by the focal plane counters.
Each of the major instruments of the NO and WN beam lines will be briefly discussed. More
detailed information can be found in references [30, 32, 33j.
2 EXPERJMENT AND DATA ANALYSIS 10
NPOL
Fig. 2- 1: The ring cyclotron facility at RCNP is shown. The (p, n) experiments were performed
at the NO beam line and the (p, p') experiment was performed at the WN beam line.

2 EXPERIMENT AND DATA ANALYSIS 11
Table 2- 1: Summary of experimental parameters. Beam bunch intervals b.T arc inverted
numbers of radio frequencies of the AVF cyclotron.
Dates Program number Reaction
1992 5/2 - 5/4
1992 12/10 12/13
1994 2/24 - 2/26
1994 6/1 - 6/6
2 .2 Experime nt
A108
E17
E17
E58
(p,n)
(p,n)
(p,n)
(p,p')
Energy
[MeV]
295
392 392
400
Radio frequency b.T
[MHzj [ns]
15.41677 64.864
16.84535 59.364
16.84535 59.364
16.98420 58.878
In table 2- 1 a summary of experimental parameters for each measurement is listed including
the radio frequency (RF) of the AVF cyclotron and intervals between beam bunches.
The RF of the ring cyclotron is three times that of the AVF cyclotron[25].
2 .3 Exp erimenta l setup for (p, n) m easurem ent
We have constructed the neutron t ime-of- flight(NTOF) facility and the neutron polarimc
ter(NPOL) system[30]. All (p, n) experiments were performed using the NTOF facility.
2 .3.1 Proton ene rgy
Polarized protons were accelerated first by the AVF cyclotron and then by the ring cyclotron.
Radio frequencies for acceleration are shown in table 2- 1. An accurate beam energy in the
(p, n) experiments was obtained by using the time difference between -y flush originating from
7rO production in the target and neutrons from the 7Li(p, nj1Be(g.s .+0.43 MeV) peak. In Fig.
2- 2 a typical TOF spectrum is shown. The neutron kinetic energy (T,.) is given by
(2-1)
where the velocity of neutron f3n is given by
LP""(~ _ 1) = t:lt. C f3n
(2 2)
Tbis calibration was performed with the flight path Lpath = 78.2 m, which gave C:lt as 107.92
ns. The neutron energy of the 7Li(p, n) 7 Be(g.s.+0.43 MeV) was derived to be 389.64 MeV. The
Q- values of the reactions are - 2.07 MeV and - 1.65 MeV for the ground and Ex= 0.43 MeV
states, respectively. We estimated the average Q- value to be - 1.86 MeV. The average energy
loss in the target was calculated to be 0.65 MeV. Consequently, the incident proton energy was
found to be 392 .2 MeV. The uncertainty of the proton energy was main ly determined by the
time resolutions of the -y peak and the neutron peak. The t ime walk was constant wit hi n 50 ps
during the (p, n) measurement. Thus, the beam energy spread was less than 0.9 MeV shown in
the table 2- 2.
2 EXPERIMENT AND DATA ANALYSIS
lOOOOro-----------.-----------.----------~
5000
'"f 1000
"' "' 0 500 ~ c: ;:J 0
~ 100
50
10
L/Pn-L/c
5 ~0----------~10LO~--~~LLR2WO~O
t •• =...,.-tRF [ns] 300
12
Fig. 2- 2: Time of Aight spectrum of the 7Li(p, n) reaction at 0°. Two large peaks correspond to the 7Li(p, n) 7Bc(g.s.+0.43 MeV) reaction . The peak around 130 ns corresponds to -y rays.
These 'Y rays originate from the 1r0 produced in the target. The time difference between the
peak of the-y rays and the neutron peak of the 7Li(p, n) 7 Be reaction was used to calibrate the
neutron energy.
Table 2- 2: Beam energy for the (p, n) experiment derived from the time difference between the
-y flush and the 7 Li(p, n) 7 Be(g.s.+0.43 MeV) reaction.
C:lt [ns] E,. [MeV] - Q [MeV] Target [MeV]
value 107.92 389.64 1.86 0.65
spread 0.05 0.85 0.22 0.1
Beam energy [Me VJ
392.15
0.88

2 EXPERIMENT AND DATA ANALYSIS 13
2.3.2 Beam polarization
The polarization of the proton beam was monitored by the beam line polarimeters (BLP)[26] .
A polarization axis was parallel to the magnetic fie ld direction of the cyclotrons and of the beam
transport dipole magnets. The polarization direct ion was reversed between up and down with
an interval of 2 s or 10 s depending on the experiments.
One BLP was installed at the NO beam line upstream from the target. Note that anot her
BLP with the same configurat ion was installed at the WN beam line upstream from the target
for the (p, p') measurement.
Beam polarization py is given by
y u L
Yf{
yp
(2- 3)
(2- 4)
(2- 5)
(2- 6)
where YL(R) are the yields, ;!IT is the cross sect ion , Ay is the analyzing power, Q" is t he integrated
charge for polarization direction a, N is the target thickness, and nL(R) are the solid angles of
the left (right) counter. When plf equals top~, py is derived by
1 JY - 1 Py= AyJY+1
when yuyo
y _ L R - Yf{Yf
(2- 7)
In order to determine Py from the measurement, it is necessary to know the Ay value of the
react ion beforehand. We employed a H(p,p) react ion at 17° for polarimetry. At 400 MeV the
analyzing power for the H(p, p) scattering is maximum around the laboratory angle of 17°. A
forward scattered proton and a backward recoil proton were detected in coincidence by two
plastic scintillators. As depicted in Fig. 2- 3, two pairs of plastic scintillators were placed at
left and right sides of the beam line. In order to determine the reaction angle for the H(p,p)
reaction, the backward protons were collimated with sli ts which had a window of 5 mm x
20 mm. The length between the target and t he collimator was 250 mm. The opening angle
of the backward detector was therefore 1.14° which corresponds to the opening angle of the
forward detector of 0.98°. When the forward scattered proton is detected at 17°, the angle
of the backward scattered proton is determined by the projectile energy. The angles and the
analyzing powers used in the measurements are listed in table 2- 3.
We used a polyet hylene(CH2) sheet as the polarimeter target. Therefore the carbon contribu
tion to the analyzing power should be taken into account. The analyzing power of the CH2(p, p')
reaction was calibrated with the low energy polarimeter. For the low energy polarimeter , t he
12 C(P,p) 12 C(g.s.) reaction [27] which had been well calibrated was used.
2 EXPERIMENT AND DATA ANALYSIS
High Energy Polarimete~
RF...... \p
«-Faraday Cup
0
~~ LF .....,....- , P
200mm
...l
} CH2 P
7 IB
Cyclotron RF ~W 'P!M~ I 1 ' I d 1 1!§'9 llllllllllll/00 L
Pul sing RF J\/" ~ ~mr
Beam Line Polarimeter
LF RB ---+----~m-----~
RF LB ---+----~~----~
Ion Source
UP--~----------------~ DOWN ---+--------------------..J
Fig. 2- 3: Beam line polarimeter and assoc iated circuits
14

2 EXPERIMENT AND DATA ANALYSIS 15
The calibrated analyzing power was consistent with those for the H(p, p') reaction. The target
polyethylene(CH2 ) was inserted continuously in the BLP during experiments. The events of the
p + p reaction in the polarimeter were counted simultaneously during the (p, n) measurement .
For the (p, p') measurement the beam polarization was monitored in the same manner.
The beam polarization was stable within 0.7 ~ 0.8 for all experiments. The time dependence
of the beam polarization during the (p, p') measurement is shown as an example in Fig. 2 ·4.
Table 2- 3: Analyzing powers of the H(p , p) reaction for the beam line polarimeter
Particle Energy Or (Jb Oc.m. Ay
p
~ rf
[Me VJ [degree] [degree] [degree]
295 17.0 70.5 36.4 0.402
392 17.0 69.7 37.2 0.461
400 17.0 69.7 37.2 0.465
RCNP ESB (p,p')QES 1.0 ~---.----~~_:_~.:;-_:::::::.....;;:,.'-C.-=~
P = 0.746
08
0.6
0.4
0.2
0 ·0 OL----'2~0 ----',0---6:':0----;8~0---7,,00
Run Number (Arb. Time)
Fig. 2- 4: Beam polarization in the (p, p1) experiment. A horizontal axis indicates arbitrary
time.
2.3 .3 Beam current
Protons were transported to a Faraday- Cup after bombarding the target. The total charge
of protons was summed up by a current integrator which was connected to the Faraday Cup.
At the same time the beam line polarimeter also counted the number of scattered protons from
the CH2(p, p') reaction at ! 7°. Using the counts of the beam line po larimeter the total charge
2 EXPERIMENT AND DATA ANALYSIS 16
Q is derived by
Q, = Qo,JYt x Yfl. , (2- 8)
where a suffix a corresponds to the beam spin mode U or D.
Because of multiple scattering of beam protons in the target , especially in the target with
large mass number, beam protons partly hit the pole of the swinger magnet or other equipment .
As a result, total charge was not always collected by the Faraday cup at the beam dump. As
an alternate way to obtain the total charge, we used the counts by the BLP which was free from
such an ambiguity. The ratio Qo, is needed to derived the absolute value of the total charge
from the counts of the BLP. We calibrated the ratio before the measurements without targets
in the swinger magnet.
2. 3 .4 Beam t iming structu re
For the TOF technique, the time structure of the proton beam is of great importance. The
accelerators provide beam bunches with a pulse interval determined by the cyclotron radio
frequency. In order to detect lower energy neutrons by the TOF method, intervals of beam
bunches are required to be longer than those determined by the cyclotron acceleration frequency.
In other words, low energy neutrons are required to reach a neutron counter before high energy
neutrons from the next bunch reach the counter. Thus, a longer bunch interval enables us to
measure the larger energy range of neutrons using the TOF method.
A beam pulsing device is installed at the beam injection line shown in Fig. 2- 1 to enlarge
the bunch interval by sweeping out a part of beam bunches. A schematic picture of sweeping is
shown in Fig. 2- 5. Only bunches not deflected by the device pass through a slit downstream
and are injected to the ring cyclotron.
Pulsing Dev ice Pulsing RF
AVF cyclotron Dee RF
V\N\1\JV· '\ • lA xN Slit
Pulsing Cavity
AVFcyclotron Ring cyclonon
Fig. 2- 5: Schematic view of a pulsing device installed at an injection beam line to the ring
cyclotron. T he situat ion for a pu lsing number N equal to 9 is shown.
T he frequency of this device is set to 1/N of the acceleration frequency of the AVF cyclotron,

2 EXPERIMENT AND DATA ANALYSIS 17
Table 2- 4: The large dynamic range for neutron energy was provided by partly sweeping the
beam bunches by the pulsing device. Pulsing ratio 4 was used for the (p, n) measurements.
proton energy pulsing interval flight length neutron energy
[MeV] [ns] [m] lower limi t ]MeV]
392
295
4
4
238.456
259.456
78.2
5 .5
145
63
where N is an integer number. In case of even number ' ,two bunches on 0 and 1r of phase out
of N bunches are not deflected . In case of odd number N, only one bunch on 0 of phase out of
N bunches is not deflected.
Consequently, the bunch interval is enlarged to N/2 (N) times of the AVF frequency. For
the (p, n) measurement the ratio N was set to 8. The interval of the beam bunches was 4
times longer than the interval determined by the AVF cyclotron and 259.456 ns for 295 MeV
and 237.456 ns for 392 MeV, respectively. The experimental conditions specific to the beam
bunches are summarized in table 2-4.
In order to keep the interval obtained by the beam pulsing device, a single turn extraction
from the ring cyclotron is also required. The single turn extraction was steadily maintained
during the experiments.
2.3.5 NO room
Figure 2- 6 shows the beam line in the NO room. The main feature of this room is a target
system (C in Fig. 2- 6) in a swinger magnet (B ). The swinger magnet consists of two dipole
magnets each having a bending angle of 45°. The beam is transported through the swinger
magnet to a Faraday- cup (E ). The target is controlled to move along the central beam trajectory
in the swinger magnet. Scattered neutrons which pass th rough a collimator in a concrete shield
(D ) are detected by the neutron detector. The thickness of the shield is 1.5 m. The reaction
angle (Blab) is determined by setting a target at a corresponding position.
2.3.6 Neutron detector
'We used the neutron polarimeter NPOL as a neutron counter with high neutron detection
efficiency. As shown in Fig. 2- 7, the NPOL consisted of four planes 1 of neutron detectors each
with a volume of 100 x 100 x 10 cm3.
Two of them are made of liquid scintillators (Bicron BC- 519) and the rest of two are made
of plastic scint illators (Bicron BC- 408). Photo multiplier tubes with a diameter of 12.5 em
1The NPOL is now upgraded to six planes of the neutron counters. Extra two planes o f liquid scintillators have been added to increase the double scattering efficiency of the neutrons.
2 EXPERIMENT AND DATA ANALYSIS 18
Fig. 2- 6: Schematic view of NO room. A: Beam line polarimeter. B: Swinger magnet. C:
Target. D: Shield door made of concrete and neutron collimator. E: Faraday- cup.
- ----~~--

2 EXPERIMENT AND DATA ANALYSIS 19
are mounted at four corners of each neutron detector. Time signals from the photo multiplier
tubes are used to determine the time of arrival as well as the two- dimensional position at which
a neutron interacts with scintillator material in the neutron detector. In front of the neutron
detector, detectors for particle identificat ion are located. The detector consists of three 35 x
llO x 0.5 cm3 plastic scintillators. The block diagram of the electron ics is shown in Fig. 2.3.6.
For t he 392 MeV (295 MeV) experiment, the neutron counter was positioned at 78.2 m (58.5
m) from the 0° target position.
2.3.7 Targets
Side View POL NC I PD2 NC2 PDJ NCJ NC4
--CRV
~~------------~ 60m
Front Face
Fig. 2- 7: Neutron polarimeter system
lOOcm
'1 M1 ""I /VV\
POL.PD2.PD3
For t he (p, n) measurement, we used targets listed in table 2 5 ranging from 2H to ""'Pb in
order to investigate the mass number A-dependence of the QES response. The thickness was
determined from t he requirement that the energy loss of the beam proton was about 1 MeV.
The total energy resolution was determined mainly by the time resolution of the TOF methods,
typically 4 MeV for 400 MeV neutrons.
2 EXPERIMENT AND DATA ANALYSIS
Analog pulse
Timing Signal PDI · LU ,v
' Splitter CFD
LD
NCI
PD2: LU LD
PDI : M,R
PD2: M.R \
NC2 ~ ~Neutron Singles Event
PD3: LU LD
NCJ
NC4
CRV
Timing Signals
RF Signal
Analog Signals
PD3: M.R
~ L
~ ~>----D ----.._, ~
'r·
~LOGIC DELAY
Cable DELAY
Fig. 2 -8: Circu it for neutron singles event
> TDC
"" ADC /
- --~---
20

2 EXPERIMENT AND DATA ANALYSIS
Table 2- 5: Target thickness and energy loss for the (p, n) experiment
Target thickness [mg/cm2 ] energy loss [MeV]
CD2 380 1.3 924 3.0
6 Li 123.6 0.30 7 Li 379 0.91
534 1.3 9Be 278 0.67 t2c 342.5 0.93
685 1.9 t3c 450 1.2 natca 396 0.95
1108 2.7 natcu 1787 3.8 t81Ta 1331 2.2 na<pb 2270 3.4
21 2 EXPERIMENT AND DATA ANALYSIS
2.4 Data analysis for (p, n) measurement
2.4.1 Energy transfer and momentum transfer
The energy transfer w and the momentum transfer q are defined by
w
22
{2 9)
{2- 10)
where E;(Et) is the total energy and p;(ftt) is the momentum of the projectile (scattered
particle). In the (JJ, n) reaction, w and q can be denoted by
w Tp -Tn +mp -mn l
q J]J~ + ]J~ - 2]Jp]Jn COS lhAB ,
where T is kinet ic energy and OLAB is scattering angle in the laboratory frame.
2.4 .2 Cross section and Analyzing power
The double differential cross section d2<7/dl1dw is given as
dY"( ) = ( d2<7 ) " NQ"L:>ll dw W E dlldw .
{2- 11 )
{2- 12)
{2- 13)
Here the suffix a denotes the direction of polarization U or D of the beam. Neutron detection
efficiency E was calibrated before and after the (JJ, n) measurement for each counter by using the
reaction for which the cross section is known. The total charge Q" was monitored by the BLP.
The number of the target atoms N was obtained from the thickness of the target . The solid
angle covered 611 of the neutron counter was determined by t he flight path {Lpath ) and the
effective area (S) of the neut ron detector as L:>ll = S f L~at h· The yield dY" / dw is the number
of counts monitored by the neutron counter at energy transfer of w.
The analyzing power is given by
1 dYu jdw- dY 0 jdw
]Jy dYU j dw + dYD jdw '
where py is the polarization of the proton beam monitored by the BLP.
2.4.3 Neutron kinetic e nergy
{2- 14)
Neutron kineti c energy (Tn) i determined by the time of flight {TOF) method shown in Fig.
2 9 as
f3n Lpath/CtTQF, {2- 15)
1 {2- 16) Tn J1-(3r
Tn En- 111n = (Tn - l )nt,l. {2- 17)
\
I

2 EXPERIMENT AND DATA ANALYSIS 23
Here hor is the flight time from the target to the counter and determined by
tTOF tcounter- ttarget,
tlarget. (2- 18)
where t0
is the time for the beam to be transported from the AVF cyclotron to the target
position , and tcountec is derived from four timing signals (tLu , tLo , tRu , tRD) from the neutron
detector[30]. The time to = tcacget - tRr might fluctuate depending on the stability of the
cyclotrons and the beam transport. The time intervals tsLP- tRr were monitored continuously
by the BLP. The fluctuation of t0 was therefore monitored by the BLP as shown in Fig. 2- 10.
t · L.,," t
COU:;:n, -----t-T-AR-G?E-T~ ::,/ BLP lJlJiJit _.--- / B LP "'-NPOL Target \
• FC tn= L., .. ,JI),:._ n
ty=L.,&tJc :------- 'Y
Fig. 2- 9: Schematic view of timing relation. Details are described in the text.
The energy resolution is determined from the timing resolution. When the detector thickness
6.L is explicitly given, the energy resolution is
( tc.t ) 2 ( tc.L )
2
tToF + Lpath · (2- 19)
2.4.4 Neutron detect ion efficiency calibration
Neutron detection efficiency was calibrated before and after each run of measurements using
the 7Li(p, n?Be(g.s.+0.43 MeV) reaction at 0°. The cross section of this reaction is known
to be almost constant at bombarding energy from 80 MeV to 800 MeV[29]. The cross section
(M/dw) is reported to be 35.3 ± 2.4 mb/sr for 300 MeV and 35.8 ± 2.4 mb/sr for 400 MeV in
the laboratory frame. The neutron detection efficiency depends on the threshold E,h for the light output from the
counter as
(E ) _ Y(E,h)
E th - d(f , di!NQMl
(2- 20)
2 EXPERIMENT AND DATA ANALYSIS
4
2
0
8
6
4
43
43
43
42
42
43
432
430
428
428
434
432
430
428
426
434
432
430
428
426
434
432
430
428
426
RUN0007
~
RUNOOOB
~
RUNOOIO
~tJI!I~.-.
RUNOOll ~, .. ~ .....
~
RUN0012
~~
50 tOO t50 200
TIME [arb. unit, ~ x0.5 minite]
24
Fig. 2- 10: Typical timing monitoring results. The time intervals tsLP - tRF were monitored
with the BLP counter and were recorded simultaneously. The horizontal axis indicates a block
position of the magnetic tape which corresponds to the elapsed times after starting t he run.
One bin corresponds approximately to 0.5 minutes even though it depends on event rate. For
notations 1 see text.

2 EXPERIMENT AND DATA ANALYSIS
800
600
200
0
Liquid Scintillator BC-519 Plastic Scintillator BC-408
0
Neutron Source (4.1MeV •• )
~
200 400
Cosmic Ray (17.1MeV .. )
600 600 1000 0 200
ADC channel
400 600
25
Fig. 2- 11: Calibration of light outputs by using cosmic rays and 1 rays from a 241
Am 9
Be neutron source. Horizontal axes indicate ADC channels of the light outputs of liquid scintillator
(left) and plastic scintillators (right). Dot- dashed lines indicate the referred energies which
correspond to minimum ionization by the cosmic rays and a Compton edge by the 4.4 MeV 1
rays.
where the yield Y(Eth) is determined as a function of Eth· In this expression, we used the known da value for dfl. The detection efficiency of the neutron counter was about 3% with Eth = 32 MeV ce
as shown in Fig. 2- 12. The unit is defined in the next paragraph.
The light output LNc is derived from four ADC signals of the PMT outputs by taking
geometrical means as
(2- 21)
The geometrical means are approximately independent of 2- dimensional positions on the neu
tron counter where incident particles are detected. The LNc is calibrated using cosmic rays and
4.4 MeV 1 rays from a 241 Am- 9 Be neutron source. The energy deposited by the cosmic rays is
expect to be due to minimum ionization in the neutron counter. Therefore the light output by
the cosmic rays corresponds to 1.7 !MeV /g/cm2J x 10 lg/cm2
J in the electron light response.
This response is generally denoted by unit of MeV ce · We referred to the work by Cecil and
his collaborators 131] for converting the response to the proton response . Figure 2 11 shows
the results of the light output calibration for the liquid (left) and plastic (right) scint ill ators.
Both the peak of the cosmic rays and the Compton edge by the 4.4 MeV 1 rays can be clearly
recognized in the spectra.
2 EXPERIMENT AND DATA ANALYSIS 26
Fig. 2- 12: The calibrated neutron detection efficiency of the neutron detectors . Top(bottom)
frame indicates the efficiency of the liquid (plastic) scintillator. Open squares (crosses) indicate
the efficiency when the threshold is set at 16(32) MeV ee· We performed the calibration with
200, 295, and 392 MeV protons.
2 EXPERIMENT AND DATA ANALYSIS 27
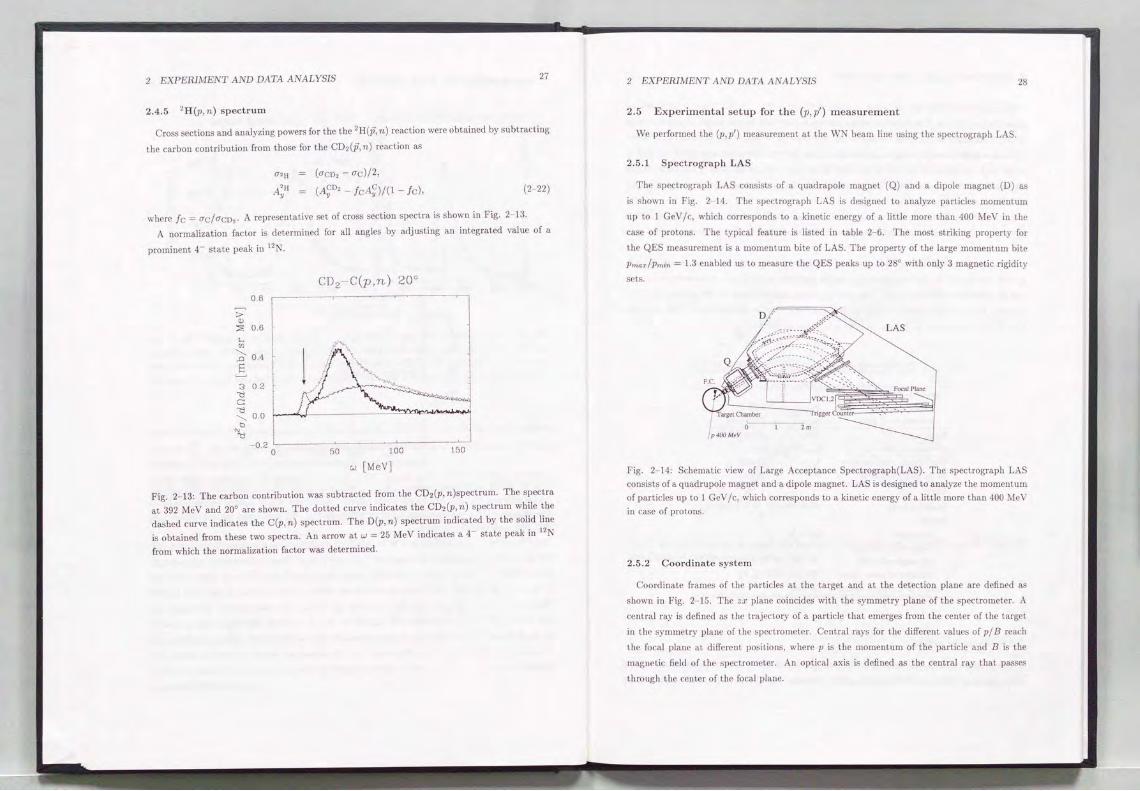
2.4.5 2 H(p, n) spectrum
Cross sections and analyzing powers for the the 2H(p, n) reaction were obtained by subtracting
the carbon contribution from those for the CD2(p, n) reaction as
(<reo, - <rc)/2,
(A~0' - JcA~)/(1- !c), (2- 22)
where Jc = <rc/<rco,. A representative set of cross section spectra is shown in Fig. 2- 13.
A normalization factor is determined for all angles by adjusting an integrated value of a
prominent 4- state peak in 12 N.
> Q)
0.8
2 0.6 <-.
"' ~ 0.4
e 3 0 .2
<:l c: <:l "'-.._ 0.0 b
~ - 0.2
0 50 100
w [MeV]
150
Fig. 2- 13: The carbon contribution was subtracted from the CD2(p, n)spectrum. The spectra
at 392 MeV and 20° are shown. The dotted curve indicates the CD2(p, n) spectrum while the
dashed curve indicates the C(p, n) spectrum. The D(p, n) spectrum indicated by the solid line
is obtained from these two spectra. An arrow at w = 25 MeV indicates a 4- state peak in 12
N
from which the normalization factor was determined.
2 EXPERIMENT AND DATA ANALYSIS 28
2.5 Experimental setup for the (p, p') measurement
We performed the (p, p') measurement at the WN beam line using the spectrograph LAS.
2.5.1 Spectrograph LAS
The spectrograph LAS consists of a quadrapole magnet (Q) and a dipole magnet (D) as
is shown in Fig. 2- 14. The spectrograph LAS is designed to analyze particles momentum
up to 1 GeV /c, which corresponds to a kinetic energy of a little more than 400 MeV in the
case of protons. The typical feature is listed in table 2- 6. The most striking property for
the QES measurement is a momentum bite of LAS. The property of the large momentum bite
Pmax!Pmin = 1.3 enabled us to measure the QES peaks up to 28° with only 3 magnetic rigidity
sets.
Fig. 2- 14: Schematic view of Large Acceptance Spectrograph(LAS). The spectrograph LAS
consists of a quadrupole magnet and a dipole magnet. LAS is designed to analyze the momentum
of particles up to 1 GeV /c, which corresponds to a kinetic energy of a little more than 400 MeV
in case of protons.
2.5.2 Coordinate system
Coordinate frames of the particles at the target and at the detection plane are defined as
shown in Fig. 2- 15. The zx plane coincides with the symmetry plane of the spectrometer. A
central ray is defined as the trajectory of a particle that emerges from the center of the target
in the symmetry plane of the spectrometer. Central rays for the different values of pf B reach
the focal plane at different positions, where p is the momentum of the particle and B is the
magnetic field of the spectrometer. An optical axis is defined as the central ray that passes
through the center of the focal plane.

2 EXPERIMENT AND DATA ANALYSIS 29
The coordinate frame at the target position is shown in Fig. 2- 158. The z axis is defined
along the optical axis. The direction of the particle is described by two angles ao and bo, where
ao (bo) is the angle between the z axis and the projection of the trajectory on the zx (yz) plane.
With these definitions, ao is the angle deviation from the central scattering angle (OLAS) and bo
is the angle deviation of the out- of- reaction- plane angle. All coordinates in the target frame
are denoted with the subscript "0" . It is convenient to denote the angles as their tangent values,
ao = dxo/dzo and bo = dyofdzo . The coordinate frame at the detection plane is shown in Fig. 2 15C. The z axis is defined
to the direction normal to the detection plane. The coordinates in this frame arc denoted with
the subscript "!". The optical axis satisfies x 1 = 0, y 1 = 0, and b 1 = 0 on the detection plane and ao = 0,
y0
= 0, and bo = 0 at the target position for the particles with to = 0. A momentum ratio to
will be defined in subsection 2.5.4. The angle a! has a nonzero value for the optical axis. The
angle a! for Xf = 0 (between the optical axis and the z axis) is denoted by\]). This angle for
LAS is 54.04° (listed in table 2- 6, together with other specifications.)
Table 2-6: Specifications of LAS and the VDC counters for LAS.
LAS
Dipole magnet maximum field
central orbit radius
Solid angle
Momentum bite Momentum resolution
Focal plane angle
VDC
Sensitive area
Anode Structure sense wire spacing
tilt angle of wires
number of sense wires
Anode to Cathode distance
2.5 .3 Detector system
Bmax 1.68 T
ro 1750 mm
6Sl 20 msr
Pmax/Pmin 1.3
opfp 1/5000 \]) 54.04°
1700 mm (x) x 350 mm (y)
X- U- V 6 mm (X), 7mm (U,V) 0° (X), 31 o (U) , -31 o (U)
272 (X), 256 (U,V)
10 mm
The detector system [32], located at the focal plane position of LAS, consists of two vertical
drift chambers (VDC1, VDC2) and two planes of trigger scintillator . A schemat ic layout of the
2 EXPERIMENT AND DATA ANALYSIS 30
A
/ .. ····"···---~
Bam
c
opticalu1s
'·
Fig. 2- 15: Definition of the coordinate frames of LAS. Overview (A), frames at the target (B)
and frames at the focal plane(C).

2 EXPERJMENT AND DATA ANALYSIS 31
system is shown in Fig. 2- 16.
Each VDC consists of three detection planes denoted by X, U, and V. The distances between
the X plane and the U plane and between the U plane and the V plane are 20 mm. Since
the wires of the X- planes are parallel to they- axis, the Xf and Uf coordinates of the particle
are determined by the X --channel numbers directly. The wires of the U(V)- planes are inclined
at an angle -y = -31°( --y) with respect to they- axis. Therefore the U(V)- channel numbers
themselves cannot determine theY! orb f coordinates. TheY! and bf coordinates of the particle
are determined from the combination of two of X, U, and V- channel numbers. With the
information of more than 4 planes, the position and the direction of the part icle (xf, Yf, af ,
bf) are obtained at the detection plane. The geometrical configuration of the VDC counter is
summarized in table 2- 6. Details are reported in Ref. [32].
Trigger Counter
u~~~· MIL
OIL
VDC
p
F ig. 2- 16: Focal plane counter system. The counter system is located at t he focal plane of
LAS. It consists of 2 planes of Yertical .Qrift Qhamber and 2 planes of trigger counter. Each
VDC consists of three detection planes denoted as X, U, and V. The wires in the X plane are
parallel to they axis while the wires in the U (V) plane are inclined at an angle of 31° ( - 31 °)
with respect to they axis.
2 .5 .4 Trace back technique
Using a trace back matrix, we obtain information (to, ao, yo, bo) of a scattered part icle at the
target position. A momentum rat io to is defined as t = pfpo - 1, where Po is a correspo ndi ng
momentum at the central trajectory determined by the LAS dipole magnetic fie ld Bo.
The trace back matrix was determined by Matsuoka and his collaborators [34] beforehand
2 EXPERIMENT AND DATA ANALYSIS 32
Table 2- 7: Target thickness for the (p,p') reaction measurement and calculated energy loss of
the 400 MeV protons in the target. ~T~ar=g=e~t 'f:t;"h~ic;=kn=e=s=s ';'[ m==g/7c=m=;2;;o] =e=n=e=rg=y=:l=os=s=:[:=k=e v==]:=
CH2 51.10 170
CD2 75.76 250 6Li 48.1 7 Li 41.5 9Be 99.41 12C 30 .89 13C 97.0 natca 39.7 natcu
181Ta 208pb
44.67
33.3
32.3
120
100
240
85
260
95
94
53
48
using protons from the H(p, p) reaction. The scattering angles were selected by the collimator
at the entrance of the LAS. Correlations between (t0 ,a0 ,y0 ,b0 ) and (x1, a1,y1, b1) were fitted
by up to 4th order polynomials.
2 .5 .5 Targets
The thicknesses of targets for the (p,p') experiments are shown in table 2- 7. The thickness
was determined from the requirement that the energy loss of the proton was less than 250 keV.
2 .6 D ata a n a lys is for the (p,p') m easure m e n t
2.6.1 E ve nt se lect ion in t he t r igger counter s
Proton events are selected by using two light outputs from the upstream and downstream
trigger scinti llators. The total light output in each trigger counter is derived by geometrical
means as
Lp = VL1LL1n,
Lo = J LnL2R· (2- 23)
Figure 2 17 shows the relation between the two light outputs. We can clearly recognize and
select the proton events.

2 EXPERIMENT AND DATA ANALYSIS 33
Protons
ACNP.Y .. N-l.AS V0C lrl94f06
TAGfil'
IICALLS·D 0 010 S-4111 192 / 0 89 5 HJ'.,.. INOY
50:TAG_A02
Fig. 2- 17: P roton events are selected by light output information from trigger scintillators.
The horizontal( vertical) axis in the right frame indicates a product of light outputs from both
sides of forward (backward) counter. The solid line indicates the gated area for proton events .
In t he left frame, an isometric picture for the same histogram is shown.
2 EXPERIMENT AND DATA ANALYSIS 34
2.6 .2 Eve nt se lection in t he VDC counters
The particles are expected to pass through the VDC counters with an angle of incidence
around the focal plane angle , W=54.04°. With the setting listed in table 2- 6, an averaged
number of wires wit h signal generated is expected to be 4.6 for the X plane as
10[mmJ x 2 x tan(54.04°)/6[mmj = 4.6. (2-24)
Figure 2 18 shows a schematic picture of signals generated and their typical drift times by
the protons passing through the VDC plane. Such a signal sequence is called a cluster. More
precisely, (1) more than 3 wi res have signals and are located sequentially, but (2) one wire
in the sequence is allowed not to have signals, and (3) the information has consistent residual
information which can be derived by fitt ing the drift t imes of more than 3 wires. The consistency
in (3) means the time structure from the wires in the sequence satisfies at least the relation
(2- 25)
where the ith wire is the nearest to the particle trajectory shown in the bottom frame of Fig.
2- 18.
The particle path is determined from the event with one or more clusters for each plane. The
residuals for position and direction of the Xl plane are given by
Jx1 - (x2- dx2/dz x (z2- zi))J,
jdxJ/dz- dx2/dzj, (2- 26)
where (x 1,z1,dx1fdz) is the position and the direction from the cluster in the X1 plane. The
left frame of Fig. 2- 19 shows results of the residual for position at X2. The event in wh ich one
of t he residuals rp has a larger value than ri:AX is rejected. In t his analysis we use 21 mm for
ri:AX which is indicated by arrows in the left frame of Fig. 2- 19.
When more than one clusters are detected, we select the cluster which has the minimum Tp
val ue.
2.6.3 Efficiency of the VDC counte rs
T he position dependent detect ion efficiency of the ind ividual VDC planes is obtained by using
the resid ual information. In general, the detection efficiency of each VDC planes is obtained
within the single VDC counter: the detection efficiency of the X plane is determined from
information of the U and V plane for the X- U· V configuration.
In the experiment , on the cont rary, two pairs (X1,U1 and X2,U2) of planes were used and
Vl and V2 plane were not used because of restrictions of circ uits for data taking. Therefore we
obtain the detect ion efficiency by the following way instead of the general method.

2 EXPERIMENT AND DATA ANALYSIS 35
IOmm
J 6mm
_._ Cluster
~ ;:: ~ C>
Wire
i-3 i-2 i-1 i+l i+2 i+3
Fig. 2- 18: Schematic view of the cluster and typical drift time sequence of the cluster. In the
upper frame, the cluster generated by a particle passing through the wire chamber is shown.
Expected angles of the particles with respect to the chamber are distributed arou nd 54.04° , the
angle between the central trajectory and the focal plane. In the lower frame, drift times of the
wires in the cluster shown in the upper frame is schematically described as a functton of the wtre
number. The drift time sequence, which is the relation of the drift time and the wire number
in the cluster, is expected to appear in the form of the letter "V" described in Eq. 2- 25.
2 EXPERIMENT AND DATA ANALYSIS 36
The efficiency is defined by the ratio of number of particles detected over the number of
particles passing through. The efficiency of the X2 plane at position x2 is defined as
( Nhit(X2)
fX2 x2) = N(x2) - (2 27)
Here N is a number of events in which the particle is detected in the X1 plane and is expected
to pass through at position x2 in the X2 plane. Nhit is a number of events in which the particle
is detected in the Xl plane and is a lso detected at position x2 in the X2 plane. The number N
is obtained from information of position and direction at the XI plane in this case.
XI
l:J fx2(Xz) Nhtt(xz)
'\ (% 1,dz,/dz) "'"' Ntrace(x2 +-x1 ,dx1 / d z}
? e' X2 8000
·~ 0000 N~:\ '<! !"" ...... - - ... -·-.~ 4000 Nbit
trigger >-2000
: 12C(p,p ' ) 28° B/11
IJW 0
>.O .... ~ 0.0 -11 0.8
- 60 - 40 -20 0 20 40 60 0,,
Xz hlt _ X2
lrece(x, ,dx,)J:z) 0.8 0 1000 ~2 (m~
Fig. 2- 19: A method to obtain the detection efficiency of the X2 plane from the information in
the X1 plane , and an example of the obtained efficiency.
In Fig. 2- 20, the efficiency for each plane is obtained using all data. The averaged value
of the efficiency was about 95% for each plane Consequently, the tracking efficiency was about
81%.
2.6.4 Solid angle
In- plane (a) and out - of- plane (b) angles are derived from information on the focal plane by
the trace back technique. Figure 2- 21 shows a sample of the (a, b) distribution. The distribution
seems to reproduce the designed solid angle of LAS which is indicated by regions surrounded
by solid lines. The solid angle of the detector has a large ambiguity of about 20% depending
on a cut- off value for b.
In order to investigate the solid angle precisely, we measured the CH2(p, p) reaction with
the same configurations of the LAS angles BLAS as other targets. We selected the same (a, b)

2 EXPERJMENT AND DATA ANALYSIS 37
1.001.00 0.8 0.8 .F 0.6 .It 0.6
0. 4 0. 4
0.2 0.2 0.0 0.0 0 500 1000 1500 0 500 1000 1500
x, [mm] :r:1 (mm]
1.001.00 0.8 0.6 .? 0.6 J 0.6
0.4 0.4
0.2 0.2 0.0 0.0 0 500 1000 1500 0 500 1000 1500
u, [mm] u.1 [mm]
Fig. 2- 20: Position dependence of detection efficiency of each plane, X1, U1, X2, and U2. The
detect ion effi ciency for each plane is obtained from Eq. 2-27 using all data availab le. The horizontal axes indicate posit ions in the planes. The averaged value of the efficiency is about
95% for each plane.
2 EXPERJMENT AND DATA ANALYSIS 38
regions surrounded by the dashed line in Fig. 2- 21. By comparing the experimental data of the
H(p, p) reaction with results of the phase shift analysis, the solid angle of the selected regions is
calibrated. In order to confirm the calibration of the solid angles, we compare cross sections of
the 12C(p,p) elastic scattering wit h experimental results obtained at LAMPF[35]. Figure 2- 22
shows the comparison. Our data agreed with the previous data within statistical uncertainties.
natPb(p,p) 26deg. Bl
ABI
-50 50 100
Fig. 2- 21 : An (a, b) distribution on the target is shown. The angle (a, b) is traced back from a detected position and direction of each particle at the focal plane. The unit for both horizontal
and vertical axes is milli- rad ian. The solid li ne indicates the designed solid angle. The dashed line indicates the selected solid angle.
2.6 .5 M agne tic rig id ity
The momentum analyzed range was covered by a series of sets, up to three sets, of magnetic
rigidities. The higher momentum boundary of the range was the elastic scattering region of
w ~ 0 MeV while the lower boundary is the region well above the QES peak which depends
on the scattering angle. In the case of measurements of the 28° scattering, the energy region is
about w ~ 250 1eV. The magnetic field sets are shown in table 2- 8.
For 12C, ""'Ca, and natpb targets, we used a B1 set for 12° and 16° measurements, B1 and
B n sets fo r 20° and 24°, and B 1, B 11 , and Bn1 sets fo r measurements of 28° scattering. For
the CD2 target, we use the same sets as for the measurement of the 12 C target except the
B 11 1 set for the 28° measurement because the QES peak of the 2H was well covered by the
measurements with the B1 and B 11 sets. For other targets, we used the B 1 set for each angle

2 EXPERIMENT AND DATA ANALYSIS
3 10
2 10
I 10
0 10
• Ourdata£p-400MeV
o 12C(p.p) £,-398 MeV
10
\ .... ·~ ·· ..
15 9c.m.jr:kgreej
20 25
39
30
Fig. 2- 22: Cross section for 12 C(p,p) elastic scatteri ng is compared with data measured at
LAMPF[35) for Ep = 398 MeV.
2 EXPERIMENT AND DATA ANALYSIS 40
because of limitation of the beam t ime.
Table 2- 8: Three magnetic field sets were used. Eref is the proton energy at the reference
trajectory. EMAX (EM IN) is the higher (lower) limit of proton energy in the magnetic field set.
set Bo Ere( EMAX EM IN
[T) [MeV) [MeV) [MeV)
p=l.9 m 2.0 m 1.5 m
BI 1.6728 400 435 264
Bn 1.4178 300 328 196
Btn 1.1906 220 240 142
Figure 2- 23 shows the ""Ca(p,p') spectrum at 28° obtained by the three magnetic field sets.
A vertical axis indicates yields normalized by the total charge. The yields are consistent with
each other at the region covered by neighboring two magnetic field sets, [B1, Bn) or [B11 , B 111 ),
within statistical uncertainties.
8.0·10- 7
6.0·10- 7
0' '-..
~ 4 .0·10- 7
;;: 2.0·10- 7
0
... 1.00 e 0.75 <J '-.. 0.50 c:: <J 0.25
0 .00
""'ca(p,p') 28°
Bl
0 100 200 300
(.)[MeV]
Fig. 2- 23: natca(p,p')spectrum at proton energy of 400 MeV and 28°. In order to obtain the
high energy transfer up to 250 MeV, we used three magnetic field sets. Yields normalized by
total charge from different field sets were consistent within the statistical uncertainty. For each
magnetic field set, the relative solid angles to that of the central trajectory arc schematically
shown in the lower frame.

2 EXPERIMENT AND DATA ANALYSIS 41
2.6 .6 S pectra for 1 H a nd 2H
Cross section spectra for the 1 H(p, p) and 2H(p, p') reactions were obtained by subtracting
the 12C contribution from the CH2, CD2(p, p') spectra. A normalization factor is adjusted for
all angles to produce the best subt raction of th ree prominent peaks in 12 C(g.s ., 4.44 MeV, and
9.65 MeV).
> Q)
:::;;: '-UJ
"-..0
E 3
"t:l c "t:l "-b
"' "t:l
2.0
1.5
1.0
0.5
0.0 I 0 50 100
w [MeV)
!50
Fig. 2- 24: Subtraction of carbon contribution from the CD2(p, p') spectrum at proton energy of
400 MeV and 20°. The dotted curve indicates the CD2(p, p') spectrum whi le the dashed curve
indicates the C(p, p') spectrum. The D(p, p') spectrum indicated by the solid line is obtained
from these two spectra.
2.6.7 H ydroge n conta mination
For the 6Li, 7Li , and natca targets, some su rface hydrogen contaminat ion, probably from hy
droxide, is evident on the cross section spectra. For the 13 C target, some hydrogen contamina
tion. probably bond for baking the 13 C powder, is a lso evident. Such a hydrogen contamination
appears as a narrow peak superimposed on the smoothly varying cross section. The resul t
ing incremental cross sect ion is readi ly identi fi ed and subtracted using t he measured 11-I(p, p)
spectra.
2 EXPERIMENT AND DATA ANALYSIS 42
2. 7 Systematic e r rors
2 .7 .1 C r oss sect ion for t he (p ,n) measure m e nts
T he main sources of systematic uncertainty for the (p, n) cross sections are the target thick
ness, the total charge, and the neutron detection efficiency of the neutron detector.
The ambiguity of the target thickness is less than 5% for all targets. The normalization
factors between the current integrator and the beam line polarimeter agrees within 3%. The
uncertainty of the neutron detection efficiency is determined from the uncertainty of the cross
section of the 7 Li(p, n) 7 Be(g.s. + 0.43 MeV) reaction which is used for the calibration. The
uncertainty of the cross section is 6.7%. We measured the cross section of the react ion within a
statistical error of 1%. Therefore, combining these three uncertainties, 5% for target thickness,
6. 7% for detection efficiency and 3% for the beam charge integration , the overall systematic
uncertainty is estimated to be less than 8.9% for all targets except for the 13C measurement.
For the 13C measurement an ambiguity which originates from subtraction methods is taken
into account. We subtract the 12C contribution from the 13C spectra with references of the
peak for the 12C(p,p) 12C(g.s) at 12°, 20° and 28°. The ambiguity of the normalization fac
tors obtained using the three angles is 8 %. By adding this ambiguity, the overall systematic
uncertainty is estimated to be less than 12%.
2 .7.2 C r oss sect io n fo r the (p,p' ) m easure m e nts
The main sources of a systematic uncertainty of the cross section for the (p, p') measurements
are the target thickness, the total charge, and the solid angle of LAS.
The ambiguity of the target thickness is less than 8% for all the targets. As is the case of the
(p, n) measurements, the ambiguity from the current monitor is within 3%. The uncertainty
of the solid angle, which comes from the uncertainty of the cross section of the H(p,p) of the
calibration reaction , is less than 1%. We measured cross sections of the reaction within a
statistical uncertainty of l %.
The systematic uncertainty was estimated to be less than 8.8% for all targets.
2.7.3 Ana lyz ing powe rs
The source of a systematic error for the analyzing powers of the (p, n) and (p,p' ) reactions
is the uncertainty of polarizat ion of the beam. T he beam polarization was determined with a
statistical error less than 2% for every run. The uncertainty of the analyzing power of the beam
line polarimeter is less than 2.5% which originates from the solutions of the phase shift analysis.
T he overall systematic uncertainty of the analyzing power is estimated to be less than 3.2 %.

3 EXPERIMENTAL RESULTS 43
3 Experimental results
In this section we present the experimental results. First, double differential cross sections
d2u /dl!dw and analyzing powers Ay for the (p, n) and (p, p') measurements are shown. Then,
peak positions for the QES process are derived from the double differential cross section spec
tra. Analyzing powers at the peak position are derived from analyzing power spectra. We
compare the peak positions and the analyzing powers at the peak position with those for free
NN scattering.
3.1 Spectra
The cross section and analyzing power spectra for the (p, n) and (p, p') reaction are presented.
Correspondence between figures and reactions is shown in table 3- l. In every figure, the double
differential cross sections (the analyzing powers) are shown in the left (right) frame as a function
of the energy transfer w. For the 400 MeV and 392 MeV measurements, the spectra for 12°,
16°, 20°, 24°, and 28° are shown from the top to the bottom in each frame. For the 295
MeV measurements, the spectra for 15°, 20°, 25°, 30°, and 35° are shown. Vertical dotted
lines in both the cross section and analyzing power frames indicate positions predicted by the
kinematics of free NN scattering. Dotted lines in the cross section frames indicate the results of
Fermi gas model calculations. Dotted lines in the analyz ing power frames indicate the result of
EFGM calculations described in section 4.3 in which the kinematics between two nucleons are
explicitly taken into account. Solid (dot- dashed) lines in both the cross section and analyzing
power frames indicate the results of the RPWIA calculations with a pseudovector (pseudoscalar)
parameterization of the 1r N coupling. We describe the details of these calculations in section
4.4 . The peaks around w ~ 230 MeV found in the cross section spectra of the (p,n) reactions
correspond to the 'Y flush which originates from the 1ro production in the target. The number
of the peaks is generally equal to the number of the neutron counters . The length of the flight
path is slightly different for every counter.
3 EXPERIMENTAL RESULTS
Table 3- 1· Figure list for the reaction
target
zH 6 Li 7Li 9Be 12C
13C
natca
natcu
181Ta natpb
208pb
(p,p') 400 MeV
Figure 3- 1
3- 3
3- 5
3- 7 3- 9
3- 11
3- 13
3- 19
3- 15
3 17
reactions
(p,n) 392 MeV (p ,n) 295 MeV
Figure 3- 2 Figure 3- 20 3- 4
3- 6
3- 8
3- 10 3- 21
3- 12
3- 14 3- 22
3- 16
3- 18
44

3 EXPERJMENTAL RESULTS 45
2H(p,p') 0.5
8 Ep=400MeV 0.0
12° 0.5 >
Q)
::!a ... 16° 0.0 "' " 0.5 .D s < 20° 34 0.0 "d c 0.5 "d
" 24° b .. "d2 0.0
0.5 28°
0 0.0
50 100 150 0 50 100 150
w [MeV] w [MeV]
Fig. 3- 1: 2 H(p, p') at proton energy of 400 MeV
2H(jJ,n)
0.5
4 Ep=392MeV 0.0
12° 0.5
... 16° 0.0 "' " 0.5
.D s 20° <
32 0.0 "d c 0.5 "d
" 24° b .. "d1 0.0
0.5 28°
0 .0 0
0 50 100 150 0 50 100 150
"' [MeV] "' [MeV]
Fig. 3- 2: 2H(p, n) at proton energy of 392 MeV
3 EXPERJMENTAL RESULTS
8
> Q)
::!e ... "' " .D s 34
"d c "d
" b
~2
0
4
> Q)
::!3 ... "' " .D s 32
"d c "d
" b
~I
0
6Li(p,p')
Ep=400MeV
12°
16°
20°
24°
28°
50 100 150 200 250
w [MeV]
0 .5
0.0
0.5
0.0
0.5
< 0.0
0 .5
0.0
0.5
0.0
50 100 150 200 250
w [MeV]
Fig. 3- 3: 6Li(p , p' ) at proton energy of 400 MeV
~i(jJ,n) 0.5 12
Ep=392MeV 0.0
0.5
•. • -~· • :. c.:.·.:.. - -- -
0.0
0.5
20° < • - - ~ :~ - ~ !~- ~ - ~ -= : ~ : ~ . ~ ~ . ----
0.0
0.5
24° ------ - - -~ - -----·--- ···---- -- . ---·
0.0
0 .5 28°
. --- - --- - 0.0
50 100 150 200 250 50 100 150 200 250
"' [MeV] "' [MeV]
Fig. 3- 4: 6Li (p, n ) at proton energy of 392 MeV
46

3 EXPERIMENTAL RESULTS
B
.... "' '-.0
..§.
4
.... "' '-.0
..§. 32
"!::1 c "!::1 '-b
"tl1
0 0
7Li(p,p') 0.5
Ep=400 MeV 0.0
1Z0
0.5 . -- ~- ··-··-- ..• -
16° 0 .0
0.5 zoo
zoo -.!' 0.0
0 .5 Z4°
Z4°
0.0
0.5 Z8°
0.0
50 100 150 200 250 0 50 100 150 200 250
"'[MeV] "'[MeV]
Fig. 3- 5: 7Li(p, p') at proton energy of 400 MeV
7Li(p,n) Ep=39ZMeV
1Z0
16°
zoo
Z4°
Z8°
---------- ---··-----50 100 150 200 250
"'[MeV]
0.5
0 .0
0 .5
0 .0
0.5
-.!' 0 .0
0 .5
0.0
0 .5
0 .0
1Z
I If"·····-····
16°
l • zoo
Z4"
················· .... ..... . . :-:-:-:..,
28°
f'(:·.e :·;:.: ~->
50 100 150 200 250
"'[MeV]
Fig. 3- 6: 7Li (p, n) at proton energy of 392 MeV
47 3 EXPERIMENTAL RESULTS 48
9Be(p,p') 0.5
B Ep = 400MeV 0.0
1Z0
0.5 > "' ~B .... "'
16° 0.0
'- 0.5 .0
..§. zoo -.!' 3 4 0.0 "!::1 c "!::1
0.5
'- Z4° b
"' "!::12 0.0
0.5 Z8°
0.0 0
0 50 100 150 200 250 0 50 100 150 200 250
"'[MeV] "'[MeV]
Fig. 3- 7: 9 Be(p,p') at proton energy of 400 MeV
9Be(p,n) 0.5
4 Ep=39ZMeV 0.0
1Z0
0.5
1~
16"
.... "'
16° 0.0
'- 0.5 .0 zo· ..§. zoo -.!' 32 0.0
"!::1 c 0.5 "!::1
~--·''···-'·- ~· Z4~
'- 24° b
"tll 0.0 ...... :· ..... .... ... ":::::-,
0.5 28° Z8°
.. ~- :: .. ""' .. -- .. _._ .... . . :::-:-:-0.0
0 0 50 100 150 200 250 0 50 100 150 200 250
"'[MeV] "'[MeV]
F ig. 3- 8: 9Be(p, n) at proton energy of 392 MeV
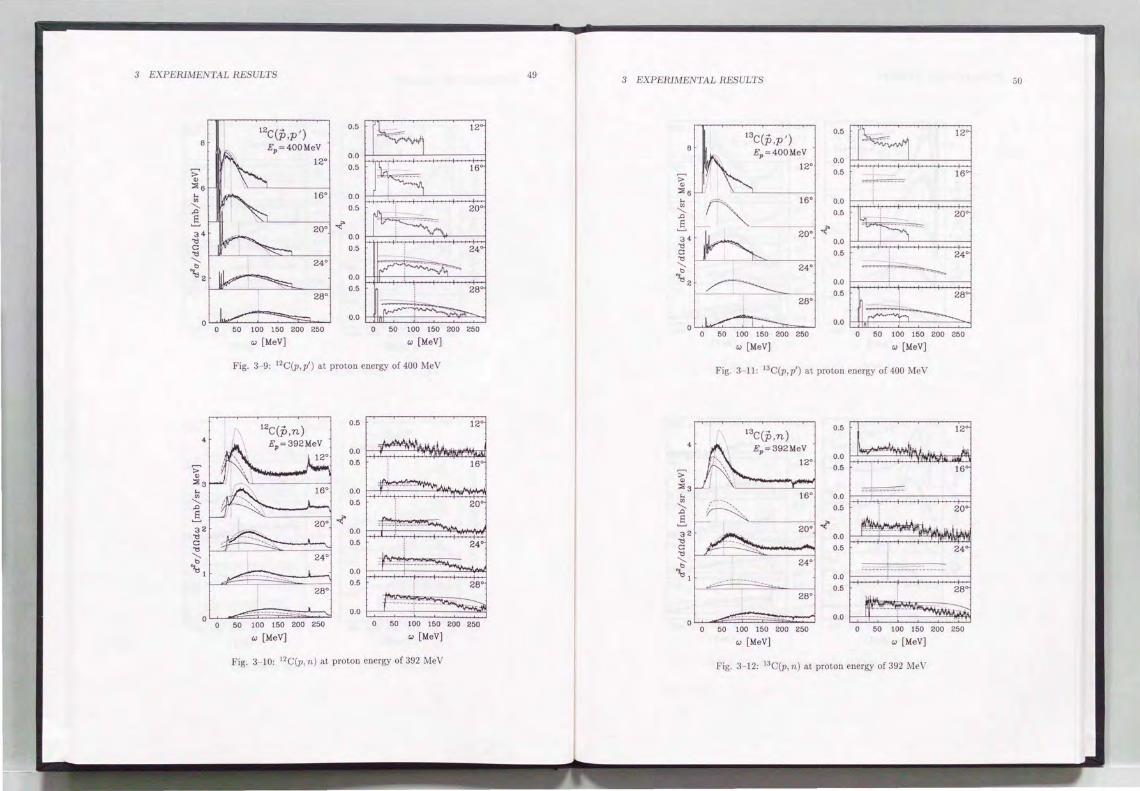
3 EXPERIMENTAL RESULTS
12C(i),p') 0.5
8 E,.=400MeV 0.0
1Z0
0.5 > Q)
::!a ... ., 16° 0 .0
'- 0 .5 .0 s zoo ..( 34 0.0 "d c 0.5 "d '- Z4° b
'\,2 0 .0
0.5 Z8°
0.0 0
0 50 100 150 200 250 50 100 150
"'(MeV) "'[MeV)
Fig. 3- 9: 12C(p, p') at proton energy of 400 MeV
12C(p,n) 0.5
4
0 .0
0 .5
... 0.0 ., '-.0
0.5
s zoo ..( 32 0.0
"d c 0.5 "d '- Z4° b .. "d1 0 .0
0 .5 Z8°
0 .0 0
50 100 150 200 250 50 100 150
"' (MeV) "' (MeV)
Fig. 3- 10: 12C(p, n) at proton energy of 392 MeV
49
200 250
200 250
3 EXPERIMENTAL RESULTS
... ., '-.0 s 32 "d c "d '-b
'\,!
13C(p ,p')
E,. = 400MeV
1Z0
~--------1-6~0
zoo
Z4°
Z8°
0 50 100 150 200 250
"'(MeV)
0.5
..( 0.0
0 .5
0 .0
0.5
0.0
50 100 150 200 250
"'(MeV)
Fig. 3- 11: 13C(p,p') at proton energy of 400 MeV
13C(p,n) 0 .5
E,. = 39ZMeV 0.0
1Z0
0.5
16° 0.0
0.5
zoo ..( 0.0
0.5
Z4°
0.0
0.5 Z8°
0.0
50 !00 150 200 250 0 50 100 150 200 250
"'(MeV) "'[MeV)
Fig. 3- 12: 13C(p, n) at proton energy of 392 MeV
50

3 EXPERJMENTAL RESULTS 51 3 EXPERJMENTAL RESULTS 52
natca(p .p ') 0.5
181Ta(p,p') 0.5
8 Ep=400MeV Ep = 400MeV 0.0 15 0.0 1Z0
0.5 1Z0
0.5 > > " " :>:a ::>: ... 16° 0.0 ... 16° 0.0 "' "' -...... 0.5 :;;-10 0.5 ..c s zoo ..f' s zoo < 34 0.0 3 0.0 ""' ""' c 0.5 c 0 .5 ""' ""' -...... -...... Z4° b
~ 5 "' ""'2 0.0 0.0
0.5 0.5
0.0 0.0
0 50 100 ! 50 200 250 0 0 50 100 !50 200 250
0 50 100 !50 200 250 0 50 100 !50 200 250
w [MeV] w [MeV] w [MeV] w [MeV]
Fig. 3- 13: ""'Ca(p,p') at proton energy of 400 MeV Fig. 3- 15: 181Ta(p, p') at proton energy of 400 MeV
0.5 12 0.5 1Z~ natca(p,n)
181Ta(p,n) 4 Ep =39ZMeV
f\ Ep=39ZMeV ··········-·-0.0
10 0.0 1Z0
0.5 12° 1 6~ 0.5 > .
" -:>:a ... 0.0 ... 16° 0.0 "' 0.5 "' L .... "" 20~
-...... -...... 0.5 ..c ..c s ..f' Sa < I· - --~- . -- ·~ 0.0 3 0.0
0.5 ""' c ~4
0 .5 Z4°
b -----------···· ··········0 "'<:! 0.0 0.0
0.5 2 0.5 ·~ Z8° 28°
I······ .. : .. ::~ 0.0 0.0 0
250 0 50 100 150 200 250 0 200 0 50 100 !50 200 250
50 100 !50 200 0 50 100 150 250
w [MeV] w [MeV] w [MeV] w [MeV]
Fig. 3- 14: natca(p, n) at proton energy of 392 MeV Fig. 3- 16: 1
B1Ta(p, n) at proton energy of 392 MeV

3 EXPERIMENTAL RESULTS
15
208pb(p,p')
Ep=400MeV
12'
16'
20'
0 .5
0 .0
0.5
..( 0.0
0.5
0 .0
0.5
0.0 t:::::::::;===~~~~ 0 50 100 150 200 250
"'[MeV]
Fig. 3- 17: 208Pb(p,p') at proton energy of 400 MeV
> " ::Sa ... Ul
....... .D
§ 3 't! c ~4 ~--------~------~
~
o.o c:::::;==±:::::::::::::==~ 0 50 100 150 200 250 0 50 100 150 200 250
"'[MeV] "'[MeV]
Fig. 3- 18: ""'Pb(p, n) at proton energy of 392 MeV
53 3 EXPERIMENTAL RESULTS 54
12
nalcu(p,p') 0.5
10 EP = 400MeV
0.0 12'
0.5 > " ::Sa ... Ul
16' 0.0 ....... 0.5 .D
§ 20' ..(
3 0.0 't! c 0.5 ~4
24' b '\, 0.0
2 0.5 28'
0.0
0 50 100 150 200 250 50 100 150 200 250
"'[MeV] "'[MeV]
Fig. 3- 19: ""'Cu(p,p) at proton energy of 400 MeV
2H(p,n) 0.5
Ep=295MeV 0.0
4
15' 0.5
20' 0 .0 ... Ul
0.5 ....... .D
25' ..( 0.0
..§. 32 't! c 0.5 't!
30' ....... b .. 't!1 0.0
0.5 35'
0.0 0
0 50 100 150 50 100 150
"' [MeV] "'[MeV]
Fig. 3- 20: 2 H(p, n) at proton energy of 295 MeV

3 EXPERIMENTAL RESULTS
12c(p,n) 0 .5
Ep=295MeV 0 .0 ~~
15° 0.5
... "'
20° 0.0 w;· ~-~
'- 0.5 .0 s 25° .,('
32 0.0 jjj_···' ·::>,
"<:l c "<:l
0.5
'- 30° b J··-'·-~----~ ..
"<:31 0.0
0 .5 35°
0.0 IF·--· -··~~ 50 100 150 200 250 50 100 150 200
w [MeV] w [MeV]
Fig. 3- 21: 12C(p, n) at proton energy of 295 MeV
> " ::>14 ... "' '.0
S3 3
"<:l
natca(p ,n) Ep = 295MeV
15°
c ~2r-L-~----~~w-----4
30° b '\l
35°
0.5
0.0
0.5
.,('
0.0
0.5
0.0
0 .5
0 .0
15~
zo~
25°
30~
35~
250
50 100 150 200 250
w [MeV] 0 50 100 150 200 250
w [MeV]
Fig. 3- 22: natca(p, n) at proton energy of 295 MeV
55 3 EXPERIMENTAL RESULTS 56
3.2 Peak position and analyzing power at the p eak position
3.2.1 Method to de termine peak positions
From the double differential cross section spectrum, we derive the peak positions. Figures
3 23 and 3-24 show how to determine the peak positions. In order to dete rmine the peak
position, we use the Gaussian function , instead of the Fermi gas response function which will
be discussed in section 4.2, since the shape of the Fermi gas response function around the peak
can be well- approximated by the shape of the Gaussian function.
The peak position is determined in the following way. Firstly, we use the Gaussian function.
We select the region to fit around the peak where the cross section is larger than that of 0. 75
times of the maximum of cross section. For example, the selected region is 55 MeV < w < 105
MeV for the 12C(p,n) reaction at 20°, and 70 MeV< w < 130 1eV for the 12 C(p , p') reaction
at 28°. The width of Gaussian shape is sensitive to the fitted region , while the centroid is
insensitive.
Secondly, we estimate the contribution of the cross section from other mechanisms besides
QES. The contribution comes mainly from a multi- step process. The cross section from the
multi- step process is generally sensitive to the total cross section in medium (see appendix
D) and it is difficult to estimate not only the shape but also the amplitude of the response
quantitatively. In t his work we investigate the sensitivity of the peak position to additional
functions which are assumed to represent the multi- step process . We have used a polynomial
fu nct ion and a step function. The region to fit with these two functions was selected as follows.
The lower boundary is set at next to the inelastic discrete peak with highest w . The higher
bounda ry is set at sufficiently high w region where the slope of the cross section is equal to
zero. As a result, the regions are 35 MeV< w < 185 MeV for the 12 C(p, n) reaction at 20° and
40 MeV < w < 210 MeV for the 12 C(p, p1) reaction at 28°. The results are insensitive to the
selection of the higher boundaries.
It is found for all targets that the change of the peak position by using the different functions
for fitting is within 2 MeV for the spectra at 20° and 5 MeV for the spectra at 28°. We treat
these ambiguities as systematic uncertainties.
After determining the peak position, we derive analyz ing powers at the peak positions aver
aging over 20 MeV aro und the peak position using Eq. 2- 14.
3 .2.2 q d epende nce
In Figs. 3- 25 - 3- 28, the peak positions (left frame) and the analyzing powers at the peak
positions (right frame) are shown as a funct ion of the momentum transfer q. Erro r bars reflect
the statist ical uncertainties on ly.
First of all , it is worth mentioning that t he results for the 2H target in Fig. 3 28 are consistent
with the free NN scattering except for the analyzing powers for the (p, n) reaction. The analyzing

3 EXPERIMENTAL RESULTS 57
powers for the free N scattering, denoted as A~ce, are obtained by the phase shift analysis[28].
We use the solution of SM89 throughout this thesis. The experimental results of the analyzing
powers for the 2H(p, n) reactions are enhanced from A~••.
Secondly, it is found that the peak positions for the (p, n) reaction of other targets are lo
cated at WQE higher than the position wr (dotted line ) predicted by the kinematics of free NN
scattering.
The peak shifts from wr are almost constant with respect to q and the values are 25 MeV for 12C, 28 MeV for natca, and 23 MeV for ""'Pb.
The peak positions for the ""'Pb(p,p1) reactions almost agree with wr. The peak positions
for 12 C and natca are located at slightly higher w than wr. The global A dependence of the
peak shifts is also almost constant with respect to q, but for specific case the shifts for 12 C are
7 MeV and those for ""'Ca are 3 MeV .
It is found that the analyzing powers for the (p, p1) reactions are systematically reduced
from A~ee. Note that the referred value for the (p,p') scattering is obtained by averaging the
p + p -+ p + p and p + n -+ p + n reactions.
On the other hand, the analyzing powers for the (p, n) reactions are slightly enhanced from
A~ce , and they are consistent with the analyzing powers for the 2H(p, n) reactions for region of
q < 2.0 fm-l
3.2.3 A dependence
The mass number (A) dependence of the peak position at 20° is shown in Fig. 3- 29.
For the (p, n) reaction the peak shifts from the value of wr increase as a function of mass
number from 2 to 12. For the region of A > 12 , the size of the peak sh ifts is almost constant .
For the (p , p1) reaction the peak shifts from the val ue of wr increase as a function of mass number
from 2 to 12 in a similar manner with the (p, n) results. For the region of A > 12, the size of
the peak shifts decreases slightly as a function of mass number from 12 to 208.
The mass number dependence of the analyzing powers at 20° and 28° is shown in Fig. 3- 30
For the (p, p') reaction, the analyzing powers are reduced from the values of A~ce at regions of
A > 12. The ratio Ay/ A~ee decreases as the mass number increases from 2 to 12 and is almost
constant in mass number larger than 12.
For the (p, n) reaction, the analyzing powers are almost constant at both 20°(filled diamonds)
and 28°(open squares) as a function of A from 2 to 208. Comparing the resu lts of the phase
shift analysis at 20° which are indicated by a dotted line, the experimental results are slight ly
enhanced over all regions of A from 2 through 208. The experimental results are consistent with
the results of the phase sh ift analysis at 28° which are indicated by a dot- dashed line.
It is found that the peak positions and the analyz ing powers of the QES are independent
of mass number for A > 12, except for the decreasing relation with respect to A for the peak
3 EXPERIMENTAL RESULTS 58
positions for the (p, p') reactions. In the region of 2 < A < 12, the peak positions and the
analyzing powers change gradually.

3 EXPERIMENTAL RESULTS 59
1 . 5 r------~--~--~----,
-~ "c(p,n) zo·
i'. ..... II ,•' .·· . :.-··-J!'.c-J-.. •"•"''\,"'...., ' -~ I 0 ··-• -: - -._.,....4 ...-- :-.-,..,-~- ·---·
50 100 !50 200 250
w [MeV]
Fig. 3- 23: The peak position is investigated using Gaussian (upper frame) , Gaussian plus
2nd order polynomial function (middle), and Gaussian plus step function (lower). The dashed
histogram is the experimental data and the dotted one is the difference from the fitted function.
The fitted function indicated by the solid line is a summation of several functions (dashed or dotted lines). Note that the results using the exponential function are almost identical to t hose
of the polynomial function.
1.5
3 , 1.0 c: ,
' b
"" 0.5
00
50 100 150 200 250
w [MeV]
Fig. 3- 24: Same figure as 3- 24, but fo r the 12 C(p,p') react ion at 400 MeV and 28o .
3 EXPERIMENTAL RESULTS
150
+ 12C(p,p') 400 MeV
125 0 12C{p,n) 392 MeV
100
> v ~ 75
3
50
Free
25 RPWIA(p,p ')
RPWIA(p,n)
0 0 .5 1.5 2 2.5
[lm - 1]
0.6
0.5
0.4
.,('03
0.2
0 .1
0.0 0.5
Free
RPWIA(PS)
RPWIA(PV)
'"·.,, ,, .. ,.',
. .............. ..
1.5 2 2.5 q [lm- 1
]
60
Fig. 3- 25: The left frame shows peak positions (wQE) versus momentum transfer (q) for 12 C. The right frame shows momentum transfer dependence for analyzing powers around the peak
positions. Filled diamonds indicate the 12 C(p, p' ) reaction at 400 MeV while opened diamonds indicate the 12C(p, n) reaction at 392 MeV. In the left frame , the dotted line indicates the peak
position for the Fermi gas model calculations. The solid line indicates the peak position for the
(p, n) reaction calculated by the RPWIA. The dashed line indicates the peak position for the
(p, p') reaction. The selectivity between a pseudoscalar coupling and a pseudovector coupling
for the rrN coupling does not influence the peak positions but only the amplitude of the cross section. In the right frame dotted lines indicate FGM results for analyz ing powers around peak
positions for the (p, n) and (p, p') reactions. Solid (dashed ) lines indicate the RPWIA results
with the pseudovecto r (pseudoscalar) coupling.

3 EXPERJMENTAL RESULTS
150
125
100
> v 6 75
3
50
25
0 0 .5
150
125
100
> v 6 75
3
50
25
0 0.5
0.6
• -tca{p,p ') 400 MeV
o~'ca(p,n) 392 Mevf Free
0.5 RPWIA(PS)
RPWlA(PV)
0.4
..(' 0.3
~ 0.2
Free --~~~SJ>.p') ----"-
0.1
RPWlA(p,n)
0 .0 1.5 2 2.5 0.5 1.5 2 2.5
q [fm-'] q [fm- 1]
Fig. 3- 26: Same figure as 3- 25, but for na'Ca.
+""'?b(p,p ') 400 ldeV
Free
RPWIA(p ,p ')
RPWIA(p ,n)
1.5 2 2.5 q [fm- 1]
0.6
0.5
0.4
..('0.3
0 .2
0.1
0.0 0 .5
Free
RPWIA(PS)
RPWlA(PV)
Fig. 3- 27: Same fig ure as 3- 25, but for Pb.
61 3 EXPERJMENT'AL RESULTS
> v 6
• tH(p.p') 400 MeV
<>2 H{p,n) 392 MeV 125
100
75 ' 50
:
. •
• Free
25 • 0 0.5 l.O 1.5 2.0 2.5
[fm- 1]
62
Free
0.4
..(' ~(p.p') ~
0.2 . • l (p,n)
0.0 3 .0 0.5 l.O 1.5 2.0 2.5 3 .0
q [fm- 1]
Fig. 3- 28: Peak positions and analyzing powers versus momentum transfer for 2H. The dotted
line in the left frame indicates the peak position predicted by kinematics of free NN scattering.
The dotted lines in the right frame indicate the analyzing powers of free NN scattering using a
phase shift analysis for the (p, p' ) and (p, n) reactions.
80 0 (p,n) 392 MeV 20° t t . ----(p,p') 400 MeV 20°
1 I j
-------------------L----#J--------t-J-----It----.. .. .. f 50
3 60
10 I
A
Fig. 3- 29: Mass number dependence of the peak position at 20° for the (p, n) and (p,p') reactions. The NN kinematics for the (p, n) reaction at 20° and the (p, p') reaction at 20° yield
di fferent positions mainly because the initial proton energies are slightly different, 392 MeV and
400 MeV, from each other.

3 EXPERIMENTAL RESULTS
..('
0 .4 ... •
0 .3
0 .2
0 .1
• • . .. . . - !II_ . - . - . - . - . - . - . - . -
m m m m
m
(p,p ') 400 MeV
m
• ••
m
O.B 1---+---+-4--f---+---+-4---lf---H
• 0.4 0
0 .3
1)1 · rn · _ aJ _ _ - . _ rn_
0 .2 + . .~ • •• .. • ........ ·· · ···· · ·· · ····.
0 .1
(p,n) 392 MeV 0 .0 L___..__........, __ ...__..._ _ _,_ _ ____, __ ~
1 2 5 10 20 50 100 200
A
63
Fig. 3-30: Mass number dependence of the analyzing powers at zoo and Z8° for the (p, n) (lower)
and (p, p') (upper) reactions. In each frame the analyzing powers at zoo (fi lled diamonds) and at
Z8° (open squares) are shown with respect to A on a logarithmic scale. The dotted (dot dashed)
line for each frame indicates the result of a phase shift analysis for each react ion at zoo (Z8°).
4 DISCUSSION 64
4 Discussion
In this section we discuss the quasi elastic response within a standard reaction model based
on the Glauber model, which uses the nuclear response function calcu lated in the Fermi gas
model.
After describing the standard reaction model, we start from a simplified Fermi gas model
(SFGl\1 or only FGM) in which the NN amplitudes do not depend on the kinematics but have
constant values in the laboratory frame. 1 ext , we describe the PWIA which is equivalent to
the extension of the simple Fermi gas model (EFGM). Finally, we describe the PWIA with the
relativistic treatment (RPWIA) .
We compare the experimental data with results of the FGM calculation and the RPWIA
calculation, especially concentrating on the peak position of the cross section and the analyzing
power at the peak position.
4.1 Standard reaction mode l
In electron scattering, the inclusive cross section given by the plane wave impulse approxima
tion (PWIA) is proportional to the two- body (Mott) cross section times the nuclear response
function R (q ,w). This model works very well for describing quasi elastic (e, e') scattering [41).
In the case of a nucleon (or composite particle) scattering, a similar formula is expected to hold
for the cross section, modified only by a constant reduction factor to account for the attenuation
of the projectile particle in the target nucleus. The nucleon- nucleus cross section then has the
simple factorized structure,
d2u k' dr:ldw = A.rr L fTrU1r,s(<i, s)fr.s(<i, s)) Rr,s(q,w),
T ,S 1 (4- 1)
where the sum is over spin (S) and isospin (T) transferred to the nucleus . Rr,s is the response
function in the (T, S) channel, and Jr,s is the corresponding free NN amplitude. An invariant
energy s for particles 1 and Z is given by the Lorentz invariant form as
(4- 2)
where (E;, k;) arc the energy and momentum of the particle i. The momentum k\ is that of the
scattered particle 1'. The trace is taken over both projectile and target nucleon spins . Aerr is the
effective number of nucleons interacting with the projectile, and is calculated by the Glauber
model.
pin obscrvables are given as the ratio between the trace with corresponding spin operators
and the trace without spiu operators. Based on the assumption Aerr is constant among individual
spin responses, the spin observablcs arc not different from those of free NN scattering. Thus,

4 DISCUSSION
the analyzing power is given by
A _ Lr,s TrU1r,s@ay/r,s(Q)} Y- Lr,sTrU1r,s(<1J!r,s(Q)) .
4.1.1 Impulse A p prox ima tio n for N - Nuc le us scatte ring
65
(4 3)
The formalism for the Impulse Approximation (IA) is based on Ref. [9]. Tn th is approx imat ion
one nucleon in the nucleus which is denoted by "2" is involved in the reaction. Other nucleons,
3 through A+1, act as the spectators.
projectile (1)
(w ,q)
target (2 ~ A+l)
Fig. 4- 1: Schematic diagra m of t he impulse approximation for t he quasi elastic scattering.
4.1.2 Forma lis m for the NN amplitude
We employ the notat ion of Bystricky, Lebar, and Wintern itz [38] for t he NN amplitude which
is given by
i = ~ {a+ b +(a- b)81 · ft82 · n + (c + d)Bt · miT2 · m + (c- d)Bt · ia2 · i + ie(Bt + 82) · n}.
(4-4)
Here i is the non-relativ istic t- matrix and a, b, c, d, and e are t he NN am plitudes. T he
coord inate system (i, m, n) is:
(K: + K:')/IR + K:'l,
4 DISCUSSION 66
(K:- K:')/IR- R'l, (4- 5)
n _ (R x K:')/IR x R'l,
where K:(K:') is the incident (final) momentum in the NN c.m. frame.
Using the t- matrix, the cross section and the analyzing power of the free NN scattering are
given by
Tr(iii) = ~ (1al2 + IW + [c[2 + [d[2 + [el2), (4-6)
Tr(iiayi) Re(a"e) Tr(it i) = ~ ([a[2 + IW + [c[2 + [d[2 + [e[2)'
(4-7)
where the vector n coincides with the unit vector perpendicular to the scattering plane.
4 .1.3 Effect ive nucleon numbe r
The effective nucleon number is determined from calculations based on the Glauber model
from the total NN cross section a as
x(b) (4- 8)
Here x(b) is the total absorption along the projecti le's path at impact parameter b, which is
schematically shown in Fig. 4- 2. p(r) is the density distribution of nuclear matter given by Eq.
4- 9. Thus Aerr is the probability, averaged over impact parameters, that the projectile finds a
nucleon in the target to interact with and is free from absorption by the other nucleons. The
expansion fo r Eq. 4- 8 to 2nd order components is described in Appendix D.
When the experi mental results are compared with the effective nucleon numbers, it is con
venient to treat the effective proton number and the effect ive neutron number separately. In
this subsection, we describe total cross sections D"pp and O"np for the p + p and n + p reactions,
respect ively. Correspondingly the one- nucleon densities Pp and Pn are defined by
J d3rpp(n)(T),
Zpp(r) + Npn(r).
Using these densities, the total absorption x(b) in Eq. 4 8 is evaluated as
'(pp(b) Z I: dza1,1,pp(b),
x,m(b) N I: dZO"npP~,(b), x(b) Xpp(b) + Xpn(b).
(4-9)
(4- 10)
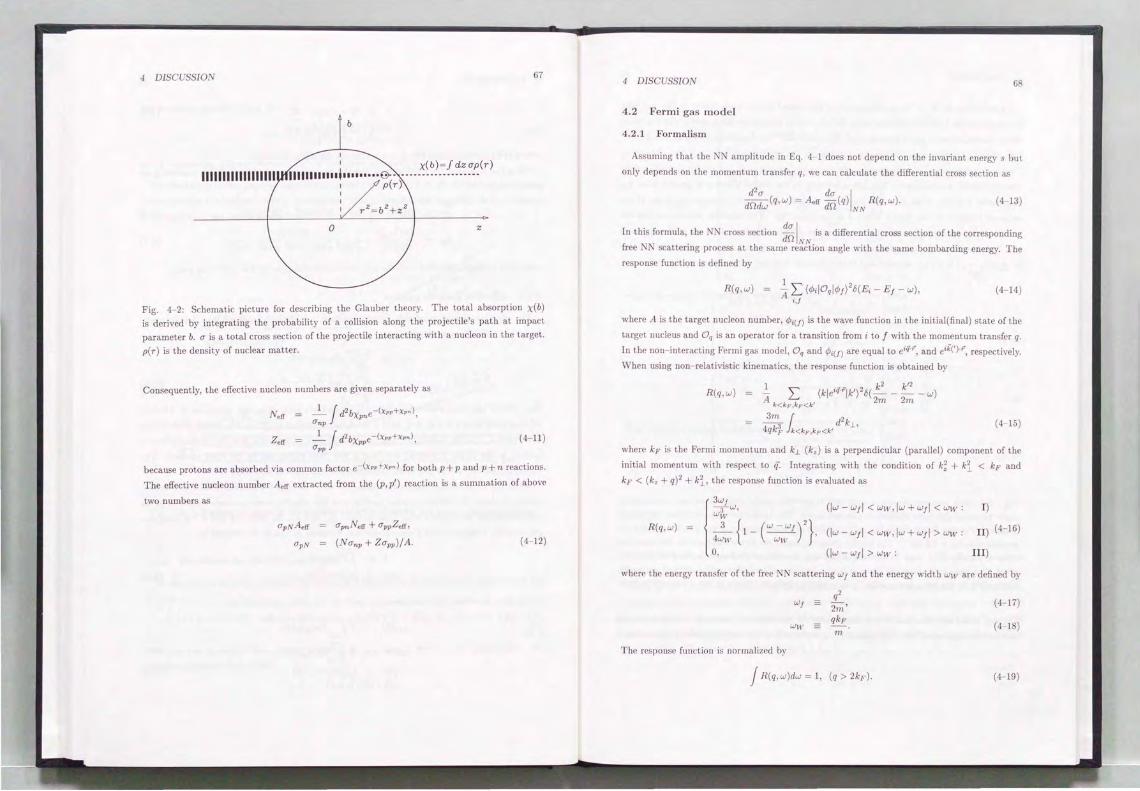
4 DISCUSSION 67
I
111111111111111111 I x(b)=fdzcrp(r)
111111111111,111111 .. •&- -- --- ---- ----- --- --1 p(r)
z
Fig. 4- 2: Schematic picture for describing the Glauber theory. The to ta l absorption x(b) is derived by integrating the probability of a collision along the projectile's path at impact
parameter b. cr is a total cross section of the projectile interacting with a nucleon in the target.
p(r) is the density of nuclear matter.
Consequently, the effective nucleon numbers are given separately as
Neff ....!:_ J d2bXpne-(x,,+x,.), Gnp
Zetr = __1:__ J d2bXppe-(x,,+x,.), Cfpp
(4- 11)
because protons are absorbed via common factor e-(x,,+x, .. ) for both p + p and p + n react ions.
The effective nucleon number Aetr extracted from the (p, p') reaction is a summation of above
two numbers as
(4-12)
4 DISCUSSION 68
4.2 Fe rmi gas mode l
4.2.1 Formalis m
Assu mi ng t hat the NN ampli tude in Eq. 4- 1 does not depend on the invariant energy 8 but
only depends on the momentum transfer q, we can calculate the differential cross section as
d2
cr da I dfld)q,w) = Aetr dO(q) NN R (q,w). (4-13)
In this formula, the NN cross section dcr I is a differential cross section of the corresponding dfl NN
free N scattering process at the same reaction angle with the same bombarding energy. The
response function is defined by
(4- 14)
where A is the target nucleo n number, if>i(f) is the wave function in the initial( fi nal) state of the
target nucleus and Oq is an operator for a transition from i to f with the momentum transfer q.
In the non- interacting Fermi gas model, Oq and if>i(f) are equal to eiif-r, and eik(')·r, respectively.
When using non- relativistic kinematics, the response function is obtained by
k2 k'2 L (k!e'F!k') 26(---- w) A k<kF.kF<k' 2m 2m
R(q,w) =
3~ r d2kl., 4qkp Jk <kF,kF<k'
(4- 15)
where kp is the Fermi momentum and k1. (kz) is a perpendicular (parallel) component of the
initial momentum with respect to q. Integrating with the condition of k~ + ki < kp and
kp < (k, + q) 2 + ki, the response function is evaluated as
R(q ,w)
1
3Wj -3-w, ww
3 1
W- Wj 2
4ww { - ( ~) } '
0,
(!w-wJ! <ww,!w+wJ! <ww : I)
(!w- WJ! < ww, !w + w1! > w111 : II) (4- 16)
(!w- WJ! > ww : III)
where the energy transfer of the free NN scattering w1 and the energy width ww are defined by
Wj q2
2m ,
W l\1 qkp
m
The response function is normalized by
j R(q,w)dw = 1, (q > 2kp) .
(4-17)
(4- 18)
(4-19)

DISCUSSION 69
Three regions in Eq. 4- 16 are illustrated by the dashed lines in every frame in Fig. 4- 3 with
the results of the FGM calcu lations using the relativistic kinematics (solid lines). The top frame
shows the response for the condition of q < kp, q=l.O fm - 1 for the nucleus with kF = 1.2 fm - 1.
The middle (bottom) frame shows the response for the condition of kp < q < 2kF (2kF < q).
The peak positions of the response function coincide exactly with the positions predicted by
non- relativistic kinematics for free NN scattering at the region where q is greater than kF.
Expression I in Eq. 4- 16 describes the Pauli blocking effect which changes the shape of the
response function at the region where q is less than 2kp. The response function at the low
energy side is reduced at region of w < ww- w1 = .f!n(2kF- q) . Note that the QES response is
free from the Pauli blocking effect at the region where q is greater than 2kpbecause the value
of .f!n(2kF- q) is always negative and thus reduction does not occur at region of w > 0.
0.025 kF=1.2 fm - 1
Ill ll III 0.020
q =l.O fm- 1
0.015
0 .010
0.005 ' > 0.000 ~
~ q=l.5 fm - 1
3.: 0.015 m n III
.,. 0.010
~ 0.005
0.000 q=2.5 rm- 1
0.010 Ill II
0.005 lll
0.000 100 200 300 w [MeV]
Fig. 4- 3: The response functions with relativistic kinematics (solid lines) are compared to
those for non- relativistic kinematics (dashed lines). The horizontal axis represents the energy
transfer. The top frame shows the response for the condition of q < kp, q= l.O fm - 1 for the
nucleus with kp = 1.2 fm - 1 The middle (bottom) frame shows the response for the condition
of kF < q < 2kp (2kp < q). In the case of 2kp < q, the response is free from the Pauli blocking
effect. One can see the large deviation at larger w region , which ind icates the effect of relativisti c
kinematics. In the low q spectra the Pauli blocking effects are shown at low w side of the peak.
Using relativistic kinematics, the expressions for the response function arc not so simple
as those for non relativistic kinematics. The response function with relativistic kinematics is
4 DISCUSSION
expressed by
R(q,w)
0, :III)
where the energy Ep and Em are defined by
Jm2 + k~.
The momentum km is the minimum momentum depending on (q,w) and is given by
The Lorentz invariant momentum transfer Q2 is given by
In the limit of
2mw
q
m + "'!!:(w- WJ) 2, 2q
70
(4-20)
(4- 21)
(4- 22)
(4-23)
(4- 24)
Eqs. 4- 20 become equivalent to the non- relativistic formulae of Eqs. 4- 16. These equations
are derived in appendix A.
Due to the Fermi momentum, the peak positions of the FGM calculation with relativistic
kinematics do not coincide with the positions wr predicted by relativistic kinematics of free N:'-i
scatteri ng. The positions are located at higher w than wr, which are shown in Fig. 4- 4. The
shifts of the peak positions from wr depend on q. The value of the shifts increases from 2 i\leV
to 8 MeV as q increases from 1.2 fm - 1 to 3.0 fm- 1 .

4 DISCUSSION 71
150 R free
> --R FGM
~ 100 --- NR FGM
3 50
kF=1.2 fm -1
0
15 I I
I
<>: /
3 10 /
/
I /
/
"' " 5 / :f /
/
0 . . . . . . . . . . .
0 2 3
g [fm- 1]
Fig. 4- 4: The peak positions of the response for a Fermi gas nucleus with kF = 1.2 fm- 1 are
shown in the top frame. The solid (dashed) line indicates the FGM response with relativistic
(non-relativistic) kinematics. The dotted line indicates the position predicted by relativistic
kinematics for free NN scattering. In order to emphasize the deviation from the position wf predicted by relativistic kinematics for free NN scattering, the peak shifts from wf are shown
in the bottom frame. The peak positions of the FGM response with relativistic kinematics are
located at 2- 8 MeV higher than those for free N scattering. The dotted line in the bottom
frame indicates the position predicted by non- relativistic kinematics.
4 .2.2 Comparison of the experimental data to the result of the FGM calc ulation
When comparing the experimental data with results of the FGM calculations using relativistic
kinematics, we use the response functions which are shifted along energy transfer as
R (q,w)-> R (q,w- C.w),
in order to reproduce the peak positions.
We search for three parameters, Aeff, kF, and Llw by minimizing
{ d
2a da I }
2
{ ( d2a ) }2
F=L_ drldw(q,w)-Aerrdrl(q)NNR(q,w - Llw;kp) / 6. drldw . (4 25)
Here the statist ical uncertainties 6. (d2a/drldw) are taken into account. The summation is
done over the regions around the peaks of the cross sections for all q sim ultaneously. For each
q spectrum we select the fitting region where the cross section is larger than 0. 75 times of the
maximum of cross section , in a manner similar to procedure described in section 3.2.1.
4 DISCUSSION 72
40
0 (p,n) 295 MeV
30 0 (p,n) 392 MeV
0
• (p,p ') 400 MeV
'>2o 0 0
Q) 0 ::E
0
3 10 o<>
<I ~
•• • • 8 ••
- 1 oL--1~oo~----------1o~1-----------1-o~2----~
A
Fig. 4- 5: Result of tlw for the FGM calculation. Although tlw is derived using all q spectra,
the results are almost equivalent to the results for the peak positions at 20° shown in Fig. 3- 29.
The best- fit parameters are listed in table 4- 1. For all targets the results are shown in Figs.
3- 1 through 3- 22, respectively. Figure 4- 5 shows the results of the parameter tlw with respect
to A. Although tlw is derived using all q spectra, the results are almost equivalent to the results
for the peak positions at 20° shown in Fig. 3- 29.
4.2.3 Comparison of Neff and Aeff with the Glauber model
The effective nucleon numbers evaluated from the FGM calculation can be compared with
the calculations based on the Glauber model [43]. The proton distribution is derived from the
charge distribution of nuclei [44, 45] by deconvoluting the charge distribution of the nucleon
itsel f. We assume that the charge distribution of the nucleon itself is same with the matter
distribution of the nucleon. In this calculation we assume that the shape of the neutron density
distribution is equal to that of the proton density distribution for all nuclei as
(4 26)
or
(4- 27)
We usc two candidates for the total NN cross section. One is the cross section for free NN
scattering, a,,,= 32.5 mb and a,,= 26.5 mb at 400 MeV. The other is the cross section in the
nuclear medium, CJNN oe 21 mb at 400 MeV which is derived from the imaginary part of the
optical potential [46].

4 DISCUSSION
Table 4- 1: The kF, Aetr (N.rr), and 6.w results from the Fermi gas model.
Reaction Target I kF Aerr (N.rr) 6.w
(p,p') 400 MeV 2H 0.32 ± 0.05 1.0 ± 0.1 0.4 ± 1.1 6Li 0.74 ± 0.15 3.0 ± 0.3 3.0 ± 0.5 7Li 0.78 ± 0.13 3.4 ± 0.3 3.8 ± 1.0 9Be 0.83 ± 0.14 3.8 ± 0.5 3.3 ± 1.1 12c 0.97 ± 0.12 4.4 ± 0.4 6.7 ± 0.8 'Jc 1.03 ± 0.20 4.8 ± 0.6 5.9 ± 1.2 nat.ca 1.08 ± 0.10 8.8 ± 0.9 4.3 ± 1.0 natcu 1.04 ± 0.15 9.8 ± 1.4 3.9 ± 1.2 tSlTa 1.19 ± 0.15 17.9 ± 2.4 - 0.5 ± 1.4 208pb 1.15 ± 0.12 20.6 ± 2.1 0.8 ± 1.2
(p,n) 392 MeV 2H 0.35 ± 0.05 1.0 ± 0.1 1.1±1.1 7Li 0.73 ± 0.15 2.1 ± 0.2 9.3 ± 2.0 9Be 0.72 ± 0.13 2.4 ± 0.2 10.3 ± 2.0 12c 1.09 ± 0.12 2.5 ± 0.3 21.0 ± 1.8 J3c 1.05 ± 0.25 2.5 ± 0.8 16.9 ± 4.2 natca 1.03±0.10 4.2 ± 0.5 25 .2 ± 1.8 JSITa 1.05 ± 0. 15 10.6 ± 1.5 24.4 ± 2.3 208pb 1.17 ± 0.15 11.2 ± 1.4 19.3 ± 1.7
(p,n) 295 MeV 2H 0.31 ± 0.06 0.57 ± 0.2 - 0.7 ± 1.1 12c 1.07 ± 0.16 3.3 ± 0.5 20.6 ± 1.6 natca 1.01 ± 0.14 7.0 ± 0.9 26 .8 ± 1.3
73 4 DISCUSSION 74
Figures 4- 6 and 4- 7 show the results of N.rr and A.rr, respectively. The experimental results
for the (p ,n) and (p,p') reactions can be approximated by N.rr = N°·5 and Aerr = 1.3A0·5 ,
respectively.
The results of the calculations by the Glauber model are indicated by the regions surrounded
by dotted (dashed) lines for the total cross sections of <Tnp=32.5 mb and <Tpp=26.5 mb (uf.IN = 21
mb). The uncertainties of the calculations originate from uncertainties in the charge distribution
of the nucleus. The results using the total cross section of CrNN = 21 mb overestimate both
Ncrr and Aerr at the region of N < 20 and A < 64, respectively. In such regions the results
using the total cross sect ions for free NN scattering reproduce the experimental results of Nerr
and Aelf· In other regions, the results by using the total cross sections for free NN scattering
underestimate the effective nucleon numbers while the results using the total cross sections of
CrNN = 21 mb reproduce the experimental results.

4 DISCUSSION
~1.0
(p,n)QES at Ep=392MeV
'H
-- -- -- -- &'NN • 2J.Qmb
Ju .. ,. :32.5mb, {a" -26.5mb
N : Neutron Number
75
Fig. 4- 6: Filled diamonds indicate the results of the QES process for the (p, n) reaction. It is consistent with the line for Neff = N°·5 which is indicated by a dot- dashed line. Dotted lines
(dashed lines) indicate the results of calculations based on the Glauber model in which the total
cross section is adopted as the value in the free space (modified value in the nuclear medium).
The width comes from the difference of shape of the nucleus used in the calculation.
c 0 ~
0 ~ . z
(p,p') QES at EP = 400 MeV • ••T'f~ . . ot.:J;l
... /'''~:'[
,..
,I /j~: •·· ~'"9 //T'~~~tf::c
\ l¥' "c
.. ··/:Z 'u"Be ..... /
,..
- -- - - - - - &'NN""21.0mb
Ja,.,. =32.5mb,
{u., =26.5mb
. .. A : Nucleon Number
Fig. 4- 7: Opened diamonds ind icate the results of the QES process for t he (p, p') react ion. It
is consistent with the line for Aerr = l.3A0·5 which is indicated by a dot- dashed line except for 2H.
4 DISCUSSION 76
4 .3 Kinematic e ffect o f the Fer m i motion
In this section, we discuss a kinematic effect caused by the Fermi motion in the target nucleus.
Within the framework of the Fermi gas model described in the previous section, we use the NN
cross sections as a constant value which is determined by the projectile energy and the scattering
angle. Nucleons in the target nucleus, however, have momenta within the Fermi momentum.
Therefore the bombarding energy and the reaction angle between the two nucleons should be
modified according to the momentum of the nucleon in the target nucleus. When the Nl\ cross
sections is independent of w, the QES peak shape is not modified from the FG i\l response. On
the contrary, when the N cross sections depend on w through the bombarding energy and the
reaction angle, the kinematic effect may modify the peak shape.
The kinematic effect should have already been taken into account in ordinary Plane Wave
Impulse Approximation (PWIA). In order to emphasize the effect in this thesis, we call the
model including the kinematic effect as an Extended Fermi Gas Model (EFGM).
4 .3.1 Kine m atics
As shown in the top frame of Fig. 4- 8, we assume that the scattering occurs between the
nucleons 1 and 2, where "1" is a projectile nucleon and "2" i a nucleon in the target nucleus.
In the final state, the nucleons are denoted as 1' and 2' , respectively. The momenta k1 and
k2 are those of the projectile and target nucleon , respectively. The energy and momentum
conservations are given by
Et' +E2',
kt' + k2'> (4- 28)
where the momentum of the nucleon 2 is distributed with fk2 f < kp in the Fermi gas model.
T he notation was given in the previous subsection and was shown in Fig. 4- l. The energy
transfer and the momentum transfer are given by
The scattered nucleon 1' is observed at Btab , which is given by
(4- 29)
(4- 30)
(4-31)
From Eqs. 4- 28 and 4 31, the energy and momentum of the scattered nucleons 1' and 2'
(E~ , f;, E~, k2) arc determined.
T he NN amplitude depends on an effective laboratory kinetic energy T.rr as well as a scattering
angle Bcrn· T.rr is defined as the bombarding energy in the two body laboratory frame (in the

4 DISCUSSION 77
I'(E, .. k,.)
L:....I(E,.k,) ~ /'7"
..___,__ 2(E,,kiJ!"t
Lorentz boos/(~
e,.,
Laboratory Frame
L(v,)
TwoBody c.m. Frame
L(v,)
TwoBody lab. Frame
Fig. 4-8: Definitions of the frames used. For QES kinematics, not on ly a projectile nucleon but
also a target nucleon have the kinetic energy in the initial state. Within the frame of the Fermi
gas model, the QES kinematics are equivalent to those of the two nucleon scattering. From top
to bottom, a laboratory frame, a two- body center of mass frame, and a two- body laboratory
frame are shown. In the top frame, nucleon 1 is a projectile and nucleon 2 is a target nucleon
which has a momentum k2 < kF in the nucleus. Scattered nucleons are denoted as 1' and 2'.
The nucleon 1' is detected at the laboratory angle ()lab· The two- body center of mass frame
is defined by a Lorentz boost L(vJ) which transforms kt + k2 to 0. The reaction angle ()em is
shown. The two- body laboratory frame is defined by a Lorentz boost L(v2 ) which transforms
k2 to 0. An effective laboratory kinetic energy T.rr is defined as the bombarding energy in this
frame.
DISCUSSION 78
bottom of the Fig. 4 8) in which the nucleon 2 has the momentum ii by a Lorentz boost L(v2 ).
The angle Oem is defined as the scattering angle in the two body center of mass frame (in the
middl of the Fig. 4 8) in which the sum k1 + k2 is transformed to zero by L(vJ).
Figure 4 9 shows the relation between Tcrr and Oem for the QES process in which the projectile
nucleon energy is 400 MeV and the scattering angle is 20° in the laboratory frame. The most
important aspect of the scattering is that the invariant energy s varies with respect tow through
its dependence on k2, and it can be modified from the energy in the two- body laboratory frame.
7~rr is given by
(4- 32)
This relation is plotted in the right top frame of Fig. 4 9 as a function of w. Terr agrees with
the true kinetic energy (shown by the vertical dotted line at 400 l\leV) at the quasi elastic point
w = ~- m, which corresponds to k2=0 in the two-body laboratory frame. However,
away from this point, it varies as much as± 200 MeV. Such a variation will clearly have a large
effect on the NN cross section.
The reaction angle Oem is given by
(4 33)
Using Eqs. 4- 32 and 4- 33, the relation between Terr and Oem is obtained and shown in the
right bottom frame of Fig. 4- 9. At the quasi elastic point indicated by the cross point of the
dotted lines, Terr and ()em are equal to the kinetic energy and the reaction angle of the free NN
scattering, respectively.
The right- bottom frame in Fig. 4- 9 shows the relation between T.rr and Oem· In the region
of higher (lower) Tcrr than that of the quasi elastic point, the angle Oem is smaller (larger) than
that of the quasi elastic point.
4 .3.2 (T.rr,O..,, ) dependence of NN cross section
In this subsect ion , the (T.rr, Oem) dependence of the NN cross sections is discussed.
Figure 4- 10 shows the cross sections of the NN scattering at Terr = 400 MeV.
Top two frames show the cross sections in the center of mass (c . m.) frame. One is the p + ]J
scatteri ng (left ) and the other is the n + p scattering (right). The cross section of the p + p
scattering is symmetric with respect to Ocm = 90° because of the identical particle scattering.
On the other hand, the cross sect ion of the n + p scattering deviates from the symmetric shape
as the bombard ing energy becomes higher than 300 MeV shown in Fig. B 1.
For the proton induced reaction, there are the three types of the reactions in the laboratory
frame, p(p, p)p, n(p, p)n, and n(p, n)p. Bottom three frames in Fig. 4- 10 show the cross sections
in the laboratory frame as a function of the laboratory scattering angle ()lab· For example of the

DISCUSSION 79
200 4 E0•m+-400 [WeV]
s,.. -2o• 150 ll,l<1.25 tm- 1
, :;:'100
! ! .of 50 .
-2
-4 -50
-2 0 2 4 0 200 400 600 BOO 1:, [rm-1] r., [lleV]
80 80
80
···~ ...,. :!' ~ 40
.,1 20 20
0 0 0 100 200 300 0 200 400 600 600
e., [deg.] T.., (lleV]
Fig. 4- 9: Relation between effective bombarding energy Tetr and scattering angle Bcm for QES
at 400 MeV and 20° in the FGM calculat ion. k~ is the momentum of the projectile and k2 is the momentum of the nucleon in the target nucleus with the Fermi momentum k2 < kp . Sol id
and dashed lines indicate the conditions that lk2l equal to 0.25(solid), 0.5(dashed), 0.75(solid),
l.O(dashed), 1.25(solid ) fm - 1
(left top) Momentum conservation k~ + k~ = k\ + k1 within the constraint that the opening
angle between k~ and k\ is 20°. The horizontal axis indicates a momentum component parallel to the projecti le momentum k1
while the vertical axis indicates a momentum component perpendicular to k1 in the reaction
plane. (left bottom) The react ion angle Bcm depends on the Fermi motion k2 .
(right top) T.rr dependence of w. T.rr is determined from k~ and k; while w is determined from
l k~ I and lk\ I (right bottom) The relat ion between T.rr and Bcm is derived by combining the left botto m frame and the right top frame. The typical tendency of the distribution is that relative to
the k2 = 0 point, t he higher T.tr corresponds to the smaller Bcrn while the lowe: T.rr to the
larger Bcm · Open circles are exemplified to explain Blab dependence shown in Fig. 4- 11. They
correspond to filled circles in Fig. 4 11.
4 DISCUSSION
20.0
10.0
5.0
2.0
1.0
p p
TI~ n+p
400 MeV--
0. 5 l-..jf--o.-.--'---~_._L~~..____...J
100 50
10 5
1
0 50 100 150
p(p,p)p
0 20 40 60 80 0 20 40 60 80 0 20 40 60 80
elab [deg.]
80
Fig. 4- 10: The p+p and n+p cross sections in the c. m. frame at 400 MeV are shown in top two
frames. From left to right in the bottom frames, thep(p,p)p, n(p,p)n, and n(p,n)p reactions in the laboratory frame are shown. Correspondence between the reactions in the laboratory frame
and those in the c. m. frame is indicated by arrows for the example of Blab~ 20°. The p(p, p)p
and n(p, p )n reactions at these angles correspond to the p + p and n + p reactions at Bcm ~ 40°. respectively. On the other hand, the n(p, n)p react ion at those angles corresponds to then+ p
reactions at Bcm ~ 180° - 40°.
laboratory angles around 20° shown in Fig. 4- 10 by arrows, the laboratory angles of the p(p, p)p
and n(p ,p)n reactions, correspond to Bcm :::-: 40° of the p + p and n + p reactions, respectively.
Tn t he n(p, n)p reaction, on the other hand , t hese angles correspond to Bcm :::-: 180°-40° = 140°
in the n + p reaction.
Note that the QES process for the (p,p') reaction is formed by the summation of the p(p, p)p
and n(p, p)n reactions wh ile the QE process for the (p, n) reaction is formed by the n(p, n)p
reaction.
The NN cross sections for projecti le energies of 200, 400, and 600 MeV are shown in Fig.
11. Three filled circles in each frame for the laboratory cross sections represent the QES

4 DISCUSSION 81
20.0 p +p n+p 10.0
a 5 .0 /
d' / "tl 2.0 600 MeV--- ,. ·- I '-.,._
' I b 1.0 400 MeV--
'- / "tl 200 MeV ··
0 .5
0 50 100 150 0 50 100 150
(}em [deg .]
.0 100 p(p,p)p n(p,p)n n(p,n)p
tt c:- 50 ~- .. "tl '·. '-.,._ 10 b "tl 5 ' " 1 L.............J..............JL............J...............l....> L.~L..............L-..........I~...J....-'l L.............J..............I~..J..............J...JJ
0 20 40 60 80 0 20 40 60 80 0 20 40 60 80
elab [de g .]
Fig. 4- 11: Same figure as Fig. 4-10 but with bombarding energies of 200, 400, and 600 MeV.
Above 300 MeV, the cross section of n + p scattering deviates from the symmetric shape with
respect to the IJcm = 90°. These deviations make the tendencies different between the (p, p)
reactions (left and middle frames in the bottom) and the (p, n) reaction (right frame in the
bottom) around the QES kinematics. Three dots in each frame of laboratory cross sections
represent the QES kinematics at Otab = 20° which is also shown in the bottom right frame of
Fig.4- 9. Relative to the p(p,p)p or n(p,p)n reactions, the slope of these three dots is small for
the n(p, n)p reaction.
4 DISCUSSION 82
"" p(p,p)p
.A to tl ,. ,
r.,, (MeV] <.>(MeV] <.> (MeV]
Fig. 4- 12: Terr and w dependence of the NN cross sections at 400 MeV and q = 1.65 fm- 1. The
left three frames indicate the Tetr dependence of the cross sections. The middle three frames show thew dependence of the cross sections. For the p(p,p)p (top) and n(p,p)n (middle) reactions,
components with large cross sections are located at lower w regions than wr- Considering
products of the response and the cross section, consequently, the peak positions of the products
are sh ifted downward of w for these reactions shown in right- top and right middle frames. On
the other hands, the cross section for the n(p, n)p reaction is almost constant (middle-bottom).
As a result, the peak position of the product of the response and the cross section is nearly the
same as that of the pure response (right- bottom).
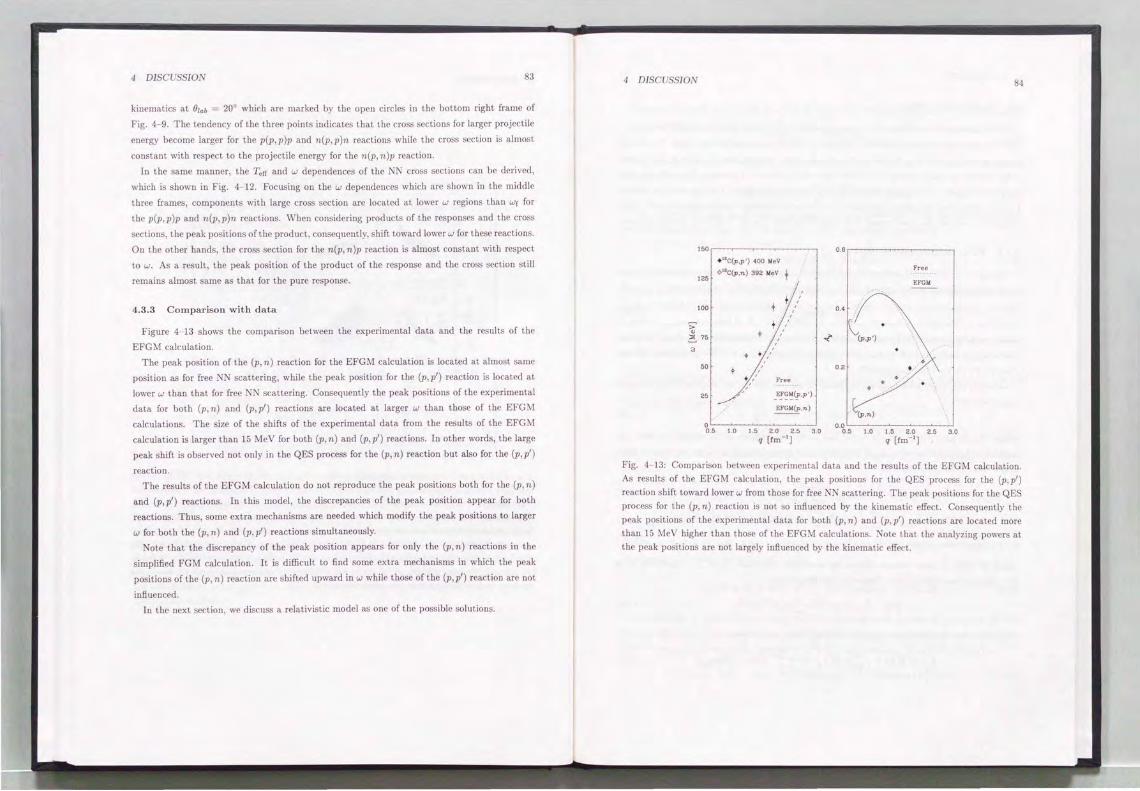
DISCUSSION 83
kinematics at Otab = 20° which are marked by the open circles in the bottom right frame of
Fig. 4- 9. The tendency of the three points indicates that the cross sections for larger projecti le
energy become larger for the p(p, p)p and n(p,p)n reactions while the cross section is almost
constant with respect to the projectile energy for the n(p, n)p reaction.
In the same manner, the Terr and w dependences of the NN cross sections can be derived,
which is shown in Fig. 4- 12. Focusing on thew dependences which arc shown in the midd le
three frames , components with large cross section are located at lower w regions than wr for
the p(p, p )p and n(p, p )n reactions. When considering products of the responses and the cross
sections, the peak positions of the product, consequently, shift toward lower w for these reactions.
On the other hands, the cross section for the n(p, n)p reaction is almost constant with respect
to w. As a result, the peak position of the product of the response and the cross section still
remains almost same as that for the pure response.
4.3 .3 Compa rison wit h d ata
Figure 4- 13 shows the comparison between the experimental data and the results of the
EFGM calculation.
The peak position of the (p, n) reaction for the EFGM calculation is located at almost same
position as for free NN scattering, while the peak position for the (p, p') reaction is located at
lower w than that for free 1N scattering. Consequently the peak positions of the experimental
data for both (p ,n) and (p,p') reactions are located at larger w than those of the EFGM
calculations. The size of the shifts of the experimental data from the results of the EFGM
calculation is larger than 15 MeV for both (p,n) and (p,p') reactions. In other words, the large
peak shift is observed not only in the QES process for the (p, n) reaction but also for the (p, p')
reaction.
T he results of the EFGM calculation do not reprod uce the peak posit ions both for the (p, n)
and (p, p1) reactions. In this model, the discrepancies of the peak position appear for both
reactions. T hus, some extra mechanisms are needed which modify the peak posit ions to larger
w for both the (p, n) and (p, p') reactions simultaneously.
ote that the discrepancy of the peak position appears for only the (p, n) reactions in the
simplified FG M calculation. It is difficult to find some extra mechanisms in which the peak
positions of the (p , n) reaction arc shifted upward in w while those of the (p, p') reaction arc not
influenced.
In the next section, we discuss a relativistic model as one of the possible solutions.
4 DISCUSSION 84
150 0 .6
+12C(p,p') 400 MeV
0 12C(p,n) 392 MeV Free
125 EFGM
100 0.4
> c . v 6 75 -< (p,p')
3 .. 50 0.2
~
25
EFGM(p,n) (p,n)
0 0.0 0 .5 1.0 1.5 2.0 2 .5 3.0 0.5 1.0 1.5 2.0 2 .5 3.0
q [rm- 1] q [fm - 1]
Fig. 4- 13: Comparison between experimental data and the results of the EFGM calculation.
As results of the EFGM calculation , the peak positions for the QES process for the (p, p1)
reaction shift toward lower w from those for free NN scattering. The peak positions for the QES
process for the (p, n) reaction is not so influenced by the kinematic effect. Consequently the
peak positions of the experimental data for both (p , n) and (p , p') reactions are located more than 15 MeV higher than those of the EFGM calculations. Note that the analyzing powers at the peak positions are not largely influenced by the kinematic effect.

4 DISCUSSION 85
4.4 Relativistic PWIA
In this subsection we calculate the cross section and the analyzing power in a relativis tic plane
wave impulse approximation (RPWIA) assuming a Fermi gas model for t he target. We discuss
projectile and target wave functions at an appropriate average density. First ly, the sq uare
of the scattering matrix element is written with spin projection operators. Secondly, we take
traces of the square of the matrix element to calculate the cross section and the analyzing power.
Finally, a numerical integration over the Fermi- motion of the target nucleons is performed. This
integrat ion involves the experimental N N amplitudes over a range of effective kinetic energies.
4 .4.1 Dirac impulse approximation
We begin by considering uniform nuclear matter with appropriate four- component spinors
for the projectile and target nucleons. The spinors are solutions to a Dirac equation,
[P - m - U] 1/Jk,s = 0, (4- 34)
in an optical potential U(r, E) which generally depends on both posit ion and energy. The four
momentum p consists of (E, iJJ and consequently p is given by p = -yO E- i · p. Here 7° and
7 = (r1, 72,73) a re Dirac matrices[47].
Assuming the target nucleus as a spin saturated nucleus, the optical potentia l U(r, E) can be
described as[37]
U(r, E ) = S(r, E) + 7°V(r , E), (4- 35)
where S(r, E) and V(r, E) are the scalar and vector components of the optical potential, re
spect ively. The solution of Eq. 4- 34 is writ ten as an integral equation and an asymptotic limit
of this wave function is given by
eik·ru,(k)+ jd3r' (ij 2
p+;n+. lf')(i''IU(r,E)I 1/Ji,;,) (4- 36) p -m "7 '
eikru,(k) + :~~ { -(E7°- kf · i + m) j d3r'e-ik' ,_. (f']U(r, E )l1/li,;) },
(4- 37)
where the term in curly brackets defines the scattering amplitude F,.,(k' , k; E) and k' = M is
the outgoing wave momentum. Employing the identity[47]
E7° - k' . i + m = 2m L u,• (k')u,• (k'), (4 38) s'
we can extract the scattering amplitude from Eq. 4 37 in the form:
(4 39)
4 DISCUSSION 86
A Dirac T matrix appropriate to clastic p-nucleus scattering is introd uced by the definition:
(4- 40)
where ]k)!t,(k) is the incoming plane wave state. From Eqs. 4- 39 a nd 4- 40, the Dirac scattering
amplitude is given by
(4- 41)
The central point in a single scattering approximation is that the T matrix is t he expectation
value of a sum of two-body N N t matrices in the nuclear ground state ]0) as
A+l
(k']T]k) =(OJ L (k' ]i;]k)]O). (4- 42) i=2
Here i, is t he t matrix for the incident proton to scatter from an ith nucleon of the target
nucleus and A is the mass number of the nucleus. In the impulse approximation, the N N
t- matrix clements needed in Eq. 4- 42 are equal to the on- shell N N amplitude for momentum
transfer q = k - k'. The Lorentz- invariant N N amplitude between two scattering particles 1
and 2 is described as
l = ts + r~(l)r~(2)tv + O"~v(l)o-~"(2)tr + rs( l )rs(2)r,( l )r"(2)lA + rs( 1)rs(2) tp. (4- 43)
Then the N N t matrix is given by
(4- 44)
where the J: and the components F; are simply related respectively to i and t ; by kinematic
factors as
- 41fk -t(q, s) = -:;:;:;::F(q, s),
47rk t; (q, s) = -:;:;:;:F;(q, s). (4- 45)
Combin ing Eqs. 4- 41,4 42, and 4- 44, the following relation for the s ingle-scattering amplitude
for the proton nucleus scattering is deduced :
.4+1
F,•,(k', k; E)= 2iku,.(k') L (O]:F(q) ex p(iq · f";)]O)u,(k). (4-46) i=2
Notice t hat for a spin satura ted nucleus, this matrix element involves a trace over struck
nucleon spins which eliminates all but the scalar(Fs) and time component of vector (r0(l )Fv )
terms from the Dirac scattering amplit ude of Eq. 4- 43. Thus, Eq. 4- 46 is simplified to
F,.,(k', k; E)= 2ik·u,.(k') [Fs(q)ps(q) + , 0( l )Fv (q)pv(q)j u,(k), (4-47)

4 DISCUSSION
where the scalar and vector form factors of the nucleus are defined by
A+l
Ps(q) = (0[ L exp(iq· ii)[O), i=2
A+l
Pv(q) = (0[ L -y0(i) exp(iq · fi)[O). i=2
87
(4 48)
(4-49)
Equation 4- 47 defines the Dirac impulse approximation. I t consists of a scalar and a vector
term which a re fully determined by the N N ampli tudes and the nuclear density. This proce
dure neglects nuclear- medium modification of the N N interaction , off-shell effects and intrinsic
corrections of order A - 1 to the optical potential. Implicitly we assume the operator form of the
N N amplitudes in Dirac representation to obtain
(k'[U[k) ""(k' [T[k) =-4~k [Fs(q)ps(q) + -y0 (1)Fv(q)pv(q)j. (4- 50)
The coord inate-space optical potential is found by the Fourier transformation as
U(r,E) S(r, E)+ -y0 (l) V (r, E)
4i7rk [ 0 l -~ Fsps(r) + 1 (1)Fvpv(r) , (4- 51)
We assume the components S and V are approximately proportional to the baryon density:
p(r) p(r) S(r,E) ""S0(E)-, V(r,E)"" Vo(E)-.
Po Po (4- 52)
Here S0(E) and Vo(E) a re t he depth of the potential at the origin where t he density is Po·
4.4.2 Effect ive mass
In the work of Ref. [9[ relativist ic effects were examined using the projectile effect ive mass
mj and t he effective mass m2 for the nucleon in the nucleus, separately. mj is slightly larger
than m2 due to a small energy dependence of S (r, E ). In this work, however, we ignore the
difference for s implicity.
We s imply evaluate Eq. 4- 52 at an average density p which is calculated by the Glauber
approximation:
f d2 bx(b) J dzp(r) 2
J d2bx(b) f dzp(r) '
(3 2 -)! 2" p , (4- 53)
where the absorption x(b) is given by Eq. 4- 8. Using Eq. 4- 52 we define an average scalar fie ld
(4- 54)
S(E) as - p S(E) = So (E )-.
Po
4 DISCUSSION
Table 4- 2: Average masses and Fermi momenta
Target Tlab m'/m kF [MeV[ fm - 1
12C 400 0.85 0.9 4°Ca 400 0.82 1.05 208pb 400 0.84 0.98
The four- component spinor for the nucleon of momentum k in these potentials is
u(k , s) = ( E'2::"') 4
[ / k ] Xs·
E' +m' Here X is a Pauli spinor. The effective mass m* is given by
m' =m+ S (E).
88
(4- 55)
(4- 56)
As a res ult , E " = Jk 2 + m'2 is given. The ratio of lower components to upper ones for given k is determined by m•. As m• decreases, the lower components are enhanced. T ypical values of
m· are 0.82 - 0.85 m, which are listed in table 4- 2. Note that the vector component vanishes
when a trace is taken over the spinor.
Between the two representations of the NN amplitude, the non- relativistic one of Eq. 4- 4
and t he relativistic one 4- 43, the relation
(4- 57)
is req uired in the free space where m* equals tom. T he matrix which transforms between dif
ferent representations is shown in detail in appendix C. In t he relat ivistic model the parameters
of ls , t,, , tr , lA and tp are not modified. Instead, the NN amplitude is modified through the
modificat ion of spino rs which depend on the effective mass m'.
4.4.3 Pse udovector model
Considering the degrees of fr~edom of t he NN amplitude, five parameters are required in the
free space . In the nuclear medium, another parameter depend ing on (1- ';;;) might be added
to the five parameters of the NN ampli t ude in the free space. Therefore we emphasize that the
representation in Eq. 4- 43 is not unique in t he nuclear medium where m' is not always equal
tom. In th is thes is, the model using the pseudovector parameterization for the 1rN coupling is
cons idered as another representation for Eq. 4- 43. In the pseudovector model, the pse udoscalar
coupling "'s is replaced with
(4- 58)

4 DISCUSSION 89
where q is the four momentum transfer (w, if). According to the effective mass, Eq. 4- 58 gives
the modification by ';;," for the 1rN coupling in the nuclear medium as
(4 59)
In the free spinors of mass m, the 1rN coupling is confirmed to be equal with each other.
For the pscudovcctor model we simply multiply tp by
(m')2
tpv = m tp , (4- 60)
to get the pseudovector amplitude.
4.4.4 Cross section and analyzing power
By summing over the unobserved spin of the target nucleon with appropriate kinematic
factors, tbe cross section with one nucleon in the nucleus is calculated from Eq. 4- 42. The cross
section is averaged over a Fermi ga momentum distribution for k2 up to kF and given by
()
{ d3k2IJ L i(u'1(k\,s\M(k2,s2)1ilut(kt,st)u2(kz,sz))i2
, Jk2<kp I I s2 ,s 1 ,s2,s 1
3 k\E\ , 2 m'2 6(Et + £2- E\ - E2) 41fk} ktEJ m E2Ez (21r)2 .
The analyzing power is given by
(4- 61)
The results of the cross sections and the analyzing powers calculated with the model are
shown in Figs. 3- 3 through 3- 22 by the dot- dashed lines. The peak positions are derived from
the results of the cross section. In left frames of Figs. 3- 25 through 3- 27, the peak positions
for the (p,n) ((p,p')) reaction are shown by the solid (dashed) lines. In the right frames of
these figures the a nalyzing powers at the peak positions are shown by the dashed lines for both
(p, n) and (p, p') reactions. The amplitudes of the cross sections arc scaled by appropriate Aerr
and Nerr for the (p,p') and (p,n) reactions, respect ively.
4.4.5 Mod ification by the effect ive mass and the pseudovector mode l
peak pos ition
Peak positions of the cross sections are modified depending approximately on ( ~) -1
irre
spective of the (p, n) or (p,p') reaction. Consequently, the effective mass shifts the peak positions
towards higher w. On the other hand , the kinematic correction of the NN ampl itude shifts the
peak positions towards lower w. We take these two effects into account for the RPW!A calcu
lation simultaneously. The relative position between the (p, n) reaction and the (J>, p') reaction
4 Di SCUSSION 90
is reproduced by the combination of the two effects. The peak positions themselves, however,
are not sufficiently reproduced. When we employ m• = 0.7m instead of 0.85m, it is found that
the peak positions arc well reproduced at q > l.Sfm- 1, which is shown in Fig. 4- 14. We need
more complicated models which are not discussed in this thesis for explaining the region q < 1.5 rm- 1•
analyzing power
Analyzing powers depend on the effective mass as
Ay = 2siniJ(~j2Im(t5-t 11 ) _ siniJ (m')2 cos2 IJ(~ )41ts- 3tvi 2 - cos2 1J k '
(4- 63)
where only the scalar and vector terms are taken into account[48]. \Ve can ignore the pseu
doscalar tp term because the a and e terms which appear in the numerator of Eq. 4- 6 do not
depend on tp. Note that only c and d terms depend on the tp term, as shown in Eq. 4.
Thus, the analyzing powers are reduced by ( ';;," j2 for both the (p, p1) and (p, n) reactions.
Next, the dependence of the 1rN coupling is considered. The effect of the pseudovector
coupling (PV) instead of the pseudoscalar coupling (PS) appears on only c and d terms by
(4- 64)
Other terms, a, band e are not influenced by the selection of the 1rN coupling. As a result ,
only the denominator which represents the cross section in Eq. 4-6 is influenced. Therefore,
the analyzing powers are modified through the modification of the cross sections. For the (p, p')
reactions the analyzing powers are not strongly modified by the replacement to the PV coupling.
It is because c and d are not the dominant terms in the region of interest about the reaction
angles, which i shown in Fig. 4- 15. For tbe (p, n) reaction, on the contrary, the cross sections
arc dominated by the squares of the amplit udes, lcl2 and ldl2, and therefore reduced by ( ';;,") 4
when only these two terms are only taken into account. Even considering together with the
modification by the m' effect of ( '~,' )2 , the analyzing powers are enhanced as a total.
Thus, the experimental results of the analyzing powers, the reduction for the (p,p') reac
tions and the enhancement for the (p, n) reactions, are reproduced simultaneously by using the
pseudovector representation within the RPWIA model.

4 DISCUSSION
+12C(p.p') 400 MeV
o 12C(p,n) 392 MeV 125 :
100
> v ~ 75
3
50
,_. m'/m=0.7 f~ ··
+ ....+ ' Free
_R_:~_(p.p ')
RPW!A(p.n)
1.0 1.5 2.0 2.5 3.0 q (fm-1
]
0.4
Free
RPW!A(PS)
RPW!A(PV)
0·~.5 1.0 1.5 2.0 2.5 3.0 q (fm- 1
]
91
Fig. 4-14: The results of the RPWIA calculation using the effective mass m• Jm=0,.7 . In the
region of q > 1.5 fm-1, the peak positions are well reproduced for the (p,n) and (p,p) reactwn
simultaneously. For the analyzing powers, modifications by the effective mass are too large to
explain the experimental data.
(p,p') 0.500 ,.~..;.....::........:..,---...---...----:
0.100
0.050 >A.<--··· ;.
·--/'
0.010 i '·
0.005 i
·····----- ..... _o-·~-
.-. /'\._ ..........
I
:.i:
o.oo 1 ol........---'20--4-'-0--6-'-o--8'-:'o~ o 20
ecm [degree]
T=400 MeV ---a'a ---- b'b - · - · - ·- c" c ......... d ' d
-··-----·- e" e
40 60 80
Fig. 4-15: The NN amplitudes corresponding to the (p,n) and (p,p') reactions. In the left and
right frames, the squares of the individual NN amplitudes for the (p, 7/) and {p, n) reactions are
shown, respectively. In the regions of Bcm c= 40°, which corresponds to the reg10ns of Blab "='
20°, the dominant terms for the (p, p') reaction are a, b, and e terms whil those for the (p, n)
reaction are c and d terms.
5 SUMMARY 92
5 Summary
In this work we have aimed at revealing the systematic features, q dependence and A depen
dence, of the proton induced quasi elastic scattering by measuring the cross sections and the
analyzing powers.
We measured the cross section and the analyzing power of the QES for the (p, n) reaction
at 392(295) MeV and for the (p,p') reaction at 400 MeV. The spectra were obtained for the
several targets from 2H through natpb at laboratory angles 12° to 2 ° (15° to 35° at 295 ll leV)
which correspond to the momentum transfer q from 1.0 fm- 1 through 2.4 fm- 1•
The results can be summarized as:
i) We have compared the peak positions of the QES process with the positions wr(q) pre
dicted by kinematics of free NN scattering. The positions of the QES peaks for the {p, n)
reactions for targets heavier than 12 C are located at w about 25 MeV larger than wr. The
size of the peak shifts from wr is almost irrespect ive of momentum transfer (q = 1.0 -
2.4 fm- 1) and bombarding energies (295 MeV and 392 MeV).
ii) The QES peaks for the (p,p') reactions for 12 C and natca targets are also located at
w about 5 MeV larger than wr. The size of the peak shifts from wr slightly decreases
according to the increase of mass number A.
1ii) The analyzing powers at the QES peak for the {p, p') reactions with targets beyond
A=12 are reduced to 60% from those for free 1 scattering.
iv) The analyzing powers at the QES peak for the {p, n) reactions are sl ightly larger than
those of free NN scattering for all targets studied .
Using the FGM, EFGM and RPWIA in which the target nucleus is regarded as the Fermi
gas, we show how the peak positions and the analyzing powers are modified.
Some of the important results as for the peak positions are:
v) With the non relativistic kinematics, the peak position from the simplified model (de
noted as FGM) exactly equals to the position predicted by the non- relativistic kinematics
of free NN scattering. When we apply the relativistic kinematics for the FG!Il, the peak
position is shifted to higher w by the effect of the Fermi momentum. For the target with
Fermi momentum kF=l.2 fm- 1, the size of the shift increases gradually from 2 MeV for
q=l.2 fm - 1 to 8 MeV for q=3.0 rm- 1. The size is not sufficiently large to explain the peak
positions for the (p, n) reactions. Thus, the FGM calculation is unable to reproduce the
peak positions for the (p, n) and (p, p') reactions simultaneously. Furthermore, this model
implies no mechanisms which make difference of the peak positions between the (p, n)
reaction and the (p, p') reaction. Thus, the model cannot reproduce ( I ) the experimental

5 SUMMARY 93
results of the QES peak positions both for the (p, n) and (p, p') reactions and (2) relative
positions between the QES peaks for the (p, n) reactions and those for the (p, p') reactions.
vi) The momentum of nucleons in the nucleus, Fermi motion, is taken into account for the
NN amplitude. We have de noted th is model as EFGM. The peak positions calculated
by this model are sh ifted to lower w because the NN amplitudes at the lower w regions
have relatively larger values than those at high w regions. The size of the peak shifts
is different between the (p , n) reaction and the (p, p') reaction. The difference originates
from the asymmetrical shape of differe ntial cross sections for the n + p reactions. Note
that the asymmetrical shape becomes obvious when the projectile proton energy is larger
than 300 MeV. Thus, although the experi mental result of the peak positions cannot be
reproduced , the difference between the peak positions for the (p, n) reactions and for the
(p, p') reactions can be reproduced. It is also mentioned that the peak shifts towards the
higher w may be able to be explained within some concurrent ways for both the (p, n) and
(p, p') reactions.
vii) As one of t he solut ions to explain the peak shifts simultaneously, we have employed
the relativistic model in the PWIA calculation. In t his model the mass of nucleon in the
nucleus is modified to the effective mass m• which depends on the nuclear density. The
peak position is shifted to larger w as t he effective mass becomes smaller. Taking the
effective mass of 0.7m, the peak position can be reproduced at q > 1.5 fm - 1.
Considering the experimental results of the peak positions from this point of view, the
positions are governed by both the m• effect and the kinematic effect. For the (p, p') reac
tions the two effects compensate each other, while, for the (p, n) reactions, the kinematic
effect makes smaller shifts than those for t he (p, p') reactions. As results, the peak shifts
for the (p, n) react ions from wr arc larger than those for the (p, p') reactions.
The results for the analyz ing powers are:
viii) Because the analyzing powers for FGM and EFGM do not deviate noticeably from
those of free NN scattering, we focus only on the results of the RPWIA calculation.
The analyzing powers for the (p, p') and (p, n) reactions arou nd the QES peaks are re
duced in the same manner by the effective mass effect . T he analyzing powers for the
(p , n) reactions are also sensitive to the parameterization of the -rrN coupling, while those
for the (p, p') reactions are insensitive. Using the pseudovector coupling instead of th
pseudoscalar coupling, the analyzing powers for the (p, n) reactions are enhanced. The
enhancement by the pseudovector coupling model compensates the reduction by the effec
tive mass . Thus, the reduction in the (p, p' ) QES and the slight enhancement in the (p, n)
QES are reproduced simultaneously by incorporating the pseudovector parameterizat ion
into the RPWIA model.
6 CONCLUSION 94
We have shown one more feature for the QES process about the effective nucleon numbers ~~~~ ,
ix) From the (p, n) reactions at 392 MeV, N.rr can be represented by N.rr = N0.5 for a
wide mass range from 2H to 208 Pb. From the (p,p') reactions at 400 MeV, Aerr can be
represented by Aerr = 1.3 x A0·5 for from 6Li to 208 Pb. These relations are well reproduced
by calculations based on Glauber theory.
6 Conclusion
In this thesis experimental investigations on quasi elastic scattering have been reported by
measuring the cross sections and the analyzing powers for the (p , n) and (p , p') reactions. We
have focused on the two observables, the position of the QES peak and the analyzing power
around the peak position.
We have derived the systematic deviations of the observables from those for free NN scattering,
the shifts of the peak positions for both the (p, n) and (p, p') reactions and reduction and
enhancement of the analyzing powers for the (p,p') and (p, n) reaction, respectively.
We have discussed how simple models are able to give sat isfactory explanations about these
deviations simultaneously. We have compared the peak positions of the experimental results
with the results by the calculations of the Fermi gas model. As a result of the comparison,
we have emphasized the necessities of both the kinematic correction of the ~N amplitude and
the mechanism which shifts the peak positions towards higher w, such as the effect by the
effective mass, within the framework of the Fermi gas model. In the RPWIA model the mass
of the nucleon in the nuclear medium is taken into account as the effective mass. Therefore,
the feature of the peak shift is qualitatively explained within the model. From the comparison
of analyzing powers between the experimental results and the results of the calculation of the
RPWIA model, we have concluded that the pseudovector representation should be incorporated
with the effect ive mass . As a result, it is found that the peak positions and the analyzing powers
for both the (p, n) and (p, p') reactions are well reproduced simultaneously at regions of q > 1.5
rm - 1 by the RPWIA model.

References 95
References
[1] W. N. Alberico, M. Ericson and A. Molinari , Nucl. Phys. A379, 429 (1982).
[2] M. Ichimura, K. Kawahigashi , T. S. Jorgensen, and C. Gaarde, Phys. Rev. C39, 1446
(1989).
[3] R. E. Chrien, T. J. Krieger, R. J. Sutter, M. May, H. Palevsky, R. L. Stearns,T. Kozlowski,
and T. Bauer, Phys. Rev. C21 , 1014 (1980). R. D. Smith, "Spin Observables of Nuclear
Probes", edited by C. J. Horowitz, C. D. Goodman , and G. E. Walker, Plenum, New York ,
1988, p.15.
[4] T. A. Carey, K. W. Jones, J. B. McClelland, J. M. Moss, L. B. Rees, N. Tanaka, and
A. D. Bacher, Phys. Rev. Lett 53, 144 (1984).
[5] L. B. Rees, J. M. Moss, T. A. Carey, K. W. Jones, J. B. McClelland, N. Tanaka,
A. D. Bacher, and H. Esbensen Phys. Rev. C34, 627 (19 6).
[6] 0. Hausser, R. Abegg, R. G. Jeppesen, R. Sawafta, A. Celler, A. Green, R. L. Helmer,
R. Henderson, I<. Hicks, K. P. Jackson , J .Mildenberger, C. A. Miller, M. C. Vetterli , S. Yen ,
M. J. Iqbal , and R. D .Smith, Phys. Rev. Lett. 61, 822 (19 8).
[7] C. Chan, T. E. Drake, R. Abegg, D. Frekers, 0. Hausser, K. Hicks , D. A. Hutcheon, L. Lee,
C. A. Miller, R. Schubank, and S. Yen, Nucl. Phys . A510, 713 (1990).
[8] R. D. Smith and S. J. Wallace, Phys. Rev C32 , 1654 (1985).
[9] C. J. Horowitz and D. P. Murdock, Phys. Rev. C 37, 2032 (1988).
[10] C. J. Horowitz and M. J. Iqbal, Phys. Rev. C 33, 2059 (1986).
[11] D. L. Prout, C. Zafiratos, T. N. Taddeucci, J. Ull mann, R. C. Byrd, T. A. Carey,
P. Lisowski, J . B. McClelland, L. J. Rybarcyk , W. Sailor, W. Amian, M. Braunstein,
D. Lind, D. J . Mercer, D. Cooper, S. DeLucia, B. Luther, D. G. Marchlenski , E. Sugar
baker, J. Rapaport , B. I<. Park , E. Gulmez, C. A. Whitten , Jr. , C. D. Goodman , W. Huang,
D. Ciskowski, and W. P. Alford, Phys. Rev. C52, 228 (1995).
[12] T. N. Taddeucci, R. C. Byrd, T. A. Carey, D. E. Ciskowski, C. D. Goodman, E. Gulmez,
W. Huang, D. Marchlenski , J. B. McClelland, D. Prout, J . Rapaport , L. J. Rybarcyk ,
W. C. Sailor, and E. Sugarbaker, Nuc l. Phys. A527, 393c (1991).
[13] X. Y. Chen, T. N. Taddeucci, J. B. McClelland, T. A. Carey, R. C. Byrd, L. J. Rybar
cyk, W. C. Sailor, D. J. Mercer, D. L. Prout , S. DeLucia, B. Luther, D. G. Marchlenski ,
E. Sugarbaker, J. Rapaport , E. Gulmez, C. A. Whitten, Jr. , C. D. Goodman, W. Huang,
Y. Wang, and W. P. Alford , Phys. Rev. C47, 2159 (1993).
References 96
[14] T. N. Tadeucci , in Polarization Phenomena in Nuclear Physics, edited by E. J. Stephenson,
and S. E. Vigdor (AlP Conference Proceedings 339, New York , 1995) p. 371.
[15] L. Wang, X. Yang, J. Rapaport , C. D. Goodman, C. C. Foster, Y. Wang, J. Piekarewicz,
E. Sugarbaker, D. Marchlenski , S. de Lucia, B. Luther, L. Rybarcyk, T. N. Taddeucci , and
B. K. Park , Phys. Rev. C50, 2438 (1994).
[16] I<. H. Hicks, W. P. Alford , A. Celler, R. S. Henderson, I<. P. Jackson , C. A. Miller,
M. C. Vetterli , S. Yen , F. Brieva, C. J. Horowitz, and J. Piekarewicz, Phys. Rev. C47, 260
(1993).
[17] T. Wakasa, Ph.D Thesis , University of Tokyo, 1997.
[18] P. Barreau, M. Bernheim, J. Duclos, J. M. Finn, Z. Meziani , J. Morgenstern , J. Mougey,
D. Royer, B. Saghai , D. Tarnowski, S. Turck-Chieze, M. Brussel , G. P. Capitani, E. De
Sanctis, S. Frullani, F. Garibaldi , D. B. Isabelle , E. Jans, I. Sick , and P. D. Zimmerman ,
Nucl. Phys. A402, 515 (1983).
[19] I. Bergqvist , A. Brockstedt, L. Carlen, L. P. Ekstrom, B. Jakobsson, C. Ellegaard,
C. Gaarde, J. S. Larsen, C. D. Goodman, M. Bedjidian, D. Contardo, J. Y. Grossiord,
A. Guichard , R. Haroutunian , J. R. Pizzi , D. Bachelier, J. L. Boyard , T. Hennino,
J. C. Jourdain , M. Roy-Stephan, M. Boivin, and P. Radvanyi, Nucl. Phys. A469, 648
(1987).
[20] D. V. Bugg and C. Wilkin, 1ucl. Phys. A467, 565 (1987).
[21] C .Ellegaard , C .Gaarde, T .S. Jorgensen, J. S. Larsen , C. D. Goodman, I. Bergqvist,
A. Brockstedt , P. Ekstrom, M. Bedjidian , D. Contardo, J. Y. Grossiord, A. Guichard ,
D. Bachelier, J. L. Boyard, T. Hennino, J. C. Jourdain, M. Roy-Stephan, P. Radvanyi , and
J. Tinsley, Phys. Rev. Lett. 59, 974 (1987).
[22] R. J. Peterson, S. Hoibraten, J. Ouyang, M. R. Braunstein , X. Y. Chen, M. D. Kohler,
B. J. Kriss, D. J. Mercer, D. S. Oakley, D. L. Prout, and W. Fong, Phys. Lett. B 297, 238
(1992).
[23] T. Sams, in Spin and Isospin in Nuclear Intemctions, edited by S. W. Wissink, C. D. Good
man, and G. E. Walker (Plenum , New York, 1991 ) p. 497.
[24] T. Rapaport, in Spin and Isospin in NucleaT Jntem ctwns, edited by S. W. Wissink,
C. D. Goodman, and G. E. Walker (Plenum, New York, 1991 ) p. 433.
[25] I. Miura, T. Yamazaki, A. Shimizu, K. Hosono, T. ltahashi. T. Saito, A. Ando, H. Ogata ,
I. Katayama, M. Tosaki, M. Kondo , and H. Ikegami, RCNP Annual Report (1987) p.125

References 97
[26] M. W. McNaughton and E. P. Chamberlin, Phys. Rev. C24, 1778 (1981).
[27] M. Ieiri, H. Sakaguchi, M. Nakamura, H. Sakamoto, H. Ogawa, M. Yosoi , T. Ichihara,
N. Isshiki , Y. Takeuchi, H. Togawa, T. Tsutsumi, S. Hirata, T. Nakano, S. Kobayashi,
T. Noro , and H. Ikegami, Nucl. Instrum. Methods Phys. Res. A257, 253 (1987).
[28] R. A. Arndt and L. D. Roper, Scattering Analyses Interactive Dial- in(SAID) program,
Virginia Polytechnic Institute and State University (unpublished).
[29] T. N. Taddeucci , W. P. Alford , M. Barlett, R. C. Byrd, T. A. Carey, D. E. Ciskowski,
C. C. Foster, C. Gaarde, C. D. Goodman, C. A. Goulding, E. Gulmez, W. Huang,
D. J. Horen, J. Larsen, D. Marchlenski , J. B. McClelland , D. Prout , J. Rapaport, L. J. Ry
barcyk, W. C. Sailor, E. Sugarbaker, C. A. Whitten Jr, Phys. Rev C41, 2548 (1990).
[30] H. Sakai, H. Okamura, H. Otsu, T. Wakasa, S. Ishida, N. Sakamoto, T. Uesaka, Y. Satou,
S. Fujita, K. Hatanaka, Nucl. Instrum. Methods, A369, 120 (1996).
[31] K. A. Cecil, B. D. Anderson, and R. Madey, Nucl. Instrum. Methods, 161 , 439 (1979).
[32] N. Matsuoka, T. Noro, K. Sagara, S. Morinobu, A. Okihana, and K. Hatanaka, RCNP
Annual Report, p186 , (1991)
[33] A. Okihana, N. Matsuoka, T .. oro, and M. Yoshimura, RC 'P Annual Report, p150, (1994 )
[34] A. Okihana, . Matsuoka, T. Nora , K. Sagara, H. Akiyoshi , H. Utsunomiya, and
M. Yoshimura, RCNP Annual Report, p178, (1992), A. Okihana, T. Nora, private commu
nication.
[35] L. Rikus, K. Nakano and H. V. Von Geramb, Nucl. Phys. A414, 413 (1984).
[36] T. Uchida, N. Ohtsuka, Y. Nara and A. Ohnishi, in preparation
[37] J. A. McNeil, L. Ray, and S. J. Wallace, Phys Rev. C 27, 2123 (1983).
[38] J. Bystricky, F. Lebar, and P. Winternitz, J. Phys. (Paris) 39, 1 (1978)/.
[39] A. N. James, W. J. McDonald , J. M. Cameron, C. A. Miller, D. A. Hutcheon, P. Kitching,
G. C. Neilson, G. M. Stinson, and E. D. Earle, Nucl. Phys. A324, 253 (1979).
[40] J.D. Walecka, Ann. Phys. (N.Y.) 83 , 491 (1974).
[41] E. J. Moniz, 1. Sick, R. R. Whitney, J. R. Ficenec, R. D. Kephart , and W. P. Trower, Phys.
Rev. Lett. 26, 445 (1971).
[42] T. Suzuki, private communication.
References 98
[43] G. F. Bertsch and 0. Scholten , Phys. Rev. C25, 804 (1982).
[44] H. De Vries, C. W. De Jager, and C. De Vries, Atom. Nucl. Data. Tab!. 36, 495 (1987).
[45] C. W. De Jager, H. De Vries, and C. De Vries, Atom. Nucl. Data. Tab!. 14 , 479 (1974).
[46] R. D. Smith and J. Wambach, Phys. Rev. C36, 2704.
[47] J.D. Bjorken and S.D. Drell , "Relativistic Quantum Mechanics," McGraw hill , New York ,
1964.
[48] Y. Miyama and T. Suzuki , RCNP (Osaka), Ann.Rept. , 1991 , p.ll5 (1992).

APPENDIX
Appendix
A Response function by the Fermi gas model
In a non- interacting Fermi gas model, the wave function is given by
IF) = IT &trslvacuum) , p<kF,S
99
(A- 1)
where &Ips is the creation operator of the nucleon with momentum p and spin s . The response
function W with respect to energy and momentum transfer q = (q, w) is defined as:
W(q) = N j d4 x eiqx (Fip(x )p(o )I F ), (A 2)
where N is a normalization constant, xis equivalent to (t, x), and pis a density operator. The
density operator with respect to x is defined as
where
1/J(x ) is a nucleon field operator.
p(x) = p(x)- Po,
p(x )
Po
: ,pl(x ),P(x) :,
(Fif>(x)IF).
A.l Non- relativistic kinematics
(A- 3)
(A- 4)
In a non- relativistic formulation , a free nucleon field operato r is expanded wit h respect to
the creation operator as,
,P(x) L J d3fJ'Pps(x )bp, s
'Pps(x) (27r)-312 exp( -ipx )x, (A 5)
where p is equivalent to (Ep, if) and Xs is a Pauli spinor. The density operators P and Po are
therefore calculated as
L J dpdfJ<p;. ,.(x) <pp8(x )blp's' b1, ,
s,s'
(A 6)
Po (Fip(x)IF)
I:: J dp0(kp - p) s
(A 7)
APPENDIX 100
with the help of,
(A- 8)
0(x) is t he t heta fun ction and defined as
0(x)= ' { 1 (x 2': 0)
0. (x < 0) (A- 9)
Consequently, the non relativistic response funct ion W N 11 is calcu lated as,
W NR(q ) = ' ' f d·lxe'qx "' Jd'f!tdfitd~djhe-•(P~-p,)x c '< ' J V f- I (27r)6 USI,StUS2,S2
S!,SpS2,S2
X (Fiblp2 s2 bp~s~blp',s', bp1s 1 IF)p, ;'p;,p,;'p~. (A- 10)
The condition Pt ol p\ ,p2 op p~ originates from the subtraction of Po in the density operator
which is given by Eq. A 7. Analogous to Eq. A- 8, the density operator is substituted to one 6 function and two e functions as
N j d4 x I:: j dfJdf! e-i(q+p - p'Jxe(kF- p)G(p' - kp ) s (27r)6
2~ j dfJdp64 (q + p - p1)0(kF- p)G(p'- kp) 47r
::2 j dfJo(w + Ep- EP+o)G(kF - IP1)0(1fJ + qj - k p ), (A- ll )
-2
where Ep is defined by !!..____ The Pau li blocking effect is provided by the two 0 functions . The 2m
former 0 function in Eq. A- ll indicates the initial state in which the nucleon in the nucleus has
momentum p less than the Fermi momentum kp of the nucleus. In the final state, the scattered
nucleon needs to have the momentum larger than the Fermi momentum, which is described in
the latter e function.
The integration can be done a naly tically. Then, the res ponse funct ion is evaluated as
-3-w, Wtv
(lw- wt l < ww,lw+wJI < ww: I)
1
3Wj
3 I w- Wj 2
4ww { - ( ~) } •
0,
(lw- WJI < ww , lw + w/1 > ww: II) (A- 12)
(lw- w/1 > ww :III)
where the energy transfer and t he energy width are defined as
q2
Wf 2m' qkp
ww m
The normali7.ation factor ;V is determined by
j dwWNR __, I when q __, 00 .
(A- 13)
(A- 14)
(A- 15)

APPENDIX 101
The top expression (I) corresponds to the region with the Pauli blocking effect while the middle
expression (II) corresponds to the region without the Pauli blocking effect. Exemplified spectra
of the response function are shown in Fig. A- 1.
0.025
0 .020
0.015
0.010
I 0 .005 > Q) 0.000 6 3: 0.015
~ 0.010 0: .,: 0.005
0.000
0.010
0.005
0 .000
lii
I
I I
lii
lii
0
II lii
II III
II
100 "'[MeV)
kF = 1.2 fm - 1
q= l.O fm- 1
q =1.5 fm- 1
q=2.5 fm- 1
III
200 300
Fig. A- 1: The responses calculated with the non- relativistic kinematics a re shown for several
q conditions of q < kF(top),kF < q < 2kF(middle), and 2kF < q(bottom). Regions of " I", "II",
and "III" correspond to each expression in Eq. A- 12. Dashed lines indicate responses when
Pauli blocking effect is not considered.
A .2 Relativistic kinematics
In a relativistic formulation , the equat ion A-5 which describes the free nucleon field operator
is modified as
(A 16)
where dl is the creation operator of anti- nucleon and u, v are Dirac spinors. The spinors u, v
sat isfy the following equations:
(p- m)u(p, s)
(p + m)v(p, s)
u(p, s )u(p, s)
0,
0,
1 = -v(p, s)v(p, s),
(A 17)
(A 18)
(A 19)
APPENDIX
where
p(x)
Xs ) Xs
1
+cpp•s•(x)cp;,(x)vl(p', s')v(p, s)dp•s•dlps
+cp;.,.(x)cp;,(x )ul(p1, s')v(p, s)blp's'dlps
+<pp•s•(x)<pps(x)vl(p', s')u(p, s)dp•s•bp5 ].
b1 dl and db terms are vanished in subtracting vacuum components, which is shown as
(F]p(x)p(O)IF) (F](p(x)- Po(x))(p(O)- Po(O))IF) (F]p( x )p(O)]F) (F]p(x)]F)(F]p(O)IF)
(F]p(x)]F)(F]p(O)]F) + (F]p(x)]F)(F]p(O)]F)
(F]p(x)p(OJIF) (F]p(x)]F)(F]p(O)]F).
Consequently, the response function is given by
IV(q) N jd''x L j dp1df!1 dfhd~ m4
e-i(p : - p ,)x s,s' (2rr)6 Ep,Ep\EP,EP~
x ul(p'1, s;)u(pl, sJ)ul(pz, sz)u(p2, s2)(F]bl p,s,bp0,2btP',s', bp,,,IF).
The Pauli Blocking effects are represented in the last bra- ket:
Thus ,
W(q)
where
M L ul(p', s')u(p, s)ul(p, s)u(p1, s1
)
s,s'
s,s'
102
(A- 20)
(A- 21)
(A- 22)
(A- 23)
(A- 24)
(A- 26)
(A 27)

APPENDIX 103
W(q) =
(A- 28)
(A- 29)
where Q2 is defined as Q2 = q2 - w2 In order to satisfy the equation f 6dx = 1, the following
conditions are required.
2Epw- Q2
-1 < < 1, 2pq
Q2 - 2pq < 2Epw < Q 2 + 2pq.
i) In the case of Q2 > 2pq, this expression is equivalent to:
Q2 > 2pq,
-+ q(q- 2p) > w2
Therefore the condition q > 2p is required. The formula A- 30 becomes:
(Q2- 2pq )2 < 4E~w2 < (Q2 + 2pq)2
-+(2p-q)2< t:,.2 <(2p+q)2,
where D. is defined by
D. = wJ1 + 4m2/Q2
Combined with Eq. A- 31, the condition is denoted by
w2 - < q- 2p < D. < q+2p q
It:.- ql < Q2 p <-.
2 2q
ii) In the case of 2pq > Q2 > 0, the formula A- 30 becomes:
The condition is therefore given by
0 < 4E~w2 < (Q2 + 2pd,
D. < q + 2p.
p >
p >
(A-30)
(A- 31 )
(A- 32)
(A- 33)
(A- 34)
(A- 35)
(A- 36)
(A 37)
APPENDIX 104
From i) and ii) considerations, the response function is given by
N l "" W (q) = 2 dE{(2E + w?- ;f)8(Er- E)8(E + w- Er)8(E- Em), (A 38) 4rr o
where Em is defined by
(A- 39)
(A- 40)
From the equation A- 38, the response function for relativistic Fermi gas is expressed by
W( q ) (A--41 )
(A- 42)
0, :III)
This equation becomes equivalent to the non- relativistic formula A- 10 in the limit of
~ 2mw D. = wv 1 -r (j2 -+ - q-. (A- 43)
The result of the FGM calculation with the relativistic kinemat ics are shown in Fig. 4- 3.
The positions are located at higher w than wr, which is shown in Fig. 4- 4.

APPENDIX 105
B Proj ect ile en ergy dep endence of p eak shifts by the PWIA calculation
In this appendix we describe the energy dependence of the peak positions of the calculation
described in section 4.3. Fig. B- 1, 4- 11, and B- 3 show t he differential cross sections for the
p + p and n + p reactions in the center of mass frame with respect to the scattering angle
(upper frame) around laboratory energies of 200, 400, and 800 MeV, respective ly. In add it ion,
the differential cross sections for the p(p, p)p, n(p, p)n, and n(p, n)p reactions in the laboratory
frame are shown.
The differential cross section for the p + p reaction is symmetric with respect to Bern = goo
at all energies because of scattering between identical particles. For the n + p reaction, on the
contrary, the shape of the differential cross section deviates from the symmetrical shape above
300 MeV.
The laboratory angle from 0° to goo corresponds to the center of mass angle from 0° to 180°
for both the p(p,p)p and n(p,p)n reactions. For the n(p,n)p reaction, the laboratory angle
fro m oo to goo corresponds to the center of mass angle from 180° to 0° because direction of the
Lorentz boost is opposite to that for the n(p, p )n reaction.
Thus the non-symmetric shape for th n + p results in t he difference of peak position of the
quasi elastic scattering between the (p, n) and (p, p') reactions.
At 400 and 800 MeV, large differences of the peak positions between the (71, n) and (p, p')
reaction are indicated.
For example at Btab = 20°, the difference is more than 10 MeV. It is noticeable that the
difference does not cause the shift upward for the (p, n) reaction but the shift downward for the
(p,p') reaction. At 200 MeV, on the contrary, small differences occur.
These features wi ll be confi rmed by the comparison of the peak position usi ng the (p, p') and
(p, n) quasi elastic scattering spectra at 200 MeV or lower.
APPENDIX
a d' "tl
" b "tl
2 0 .0
10 .0
5 .0
2 .0
1.0
p +p
100 MeV ·· 200 MeV--300 MeV---
50 100 150 0 50
ecm [deg.]
50 · ..
1g ·. • " . -~ ~ .:_
n +p
100 150
n(p,n)p
---·· "
lOOE;J. p(p ,p)p ~(p,p)n
1 L-~~~_u
0 20 40 60 80 0 20 40 60 80 0 20 40 60 80
elab [ deg .]
Fig. B- 1: Angular distribution of the ~N cross section at 100, 200, and 300 MeV.
""r-p~(p-.~p)-p~~-. GJ ao
·~· : 20
~~~(p,p)n ' [J Ei'-'------'---1~ ~-----'----'--'\ j :g 5 • • -· --- ~ 20 ,'\
t) ~~
~ n(pn)p []~~~·' ••••• •
oo ~~ ----......... 40 ~~--- 20 I \
0 0 0 100 200 300 .4 00 ~ 0 50 100 150 0 50 \00 150
200 MeV
"(MeV) "(MeV]
Fig. B 2: Tcrr and w dependrnce of the NN cross sect ions at 200 MeV and q = 1.65 fm - 1.
106

APPENDIX
2 0 .0 , p +p 10.0
5.0
s 2.0 d'
"1:l 1.0 ......._
\ b "1:l 0 .5
0 50
·t
'-I
, n +p 1100 MeV --' 800 MeV -
500 MeV
I ·.
\ I \ I
I
I I
100 150 0 50 100 150
ocm [deg .]
100.0 \ -:: 50 .0
c: p(p,p)p n(p,n)p
~ 10.0 b 5.0
"1:l \ ,/
1.0 0 ·5 OL.....2...._0~4'-0-6-'-0--'80-'0 20 40 60 80 0
01ab [deg .]
20 40 60 80
Fig. B- 3: Angular distribution of the NN cross section at 500, 800, and 1100 MeV.
=w(p.p)p ~·· :: /'"'' •• / · ' .. 1/---------
,,
·rn~· ~~~lZSJ ~M • i ~. e : :o ... ;' . ~~ - . ~ c - .
i.. . : . - ~ M r-- ---------
~LJD1:J 0 200 ~ 7~0 1000 1260 0 50 100 ! 50 0 50 100 160
r ... [MeV] w (MeV] "' (MeV]
Fig. B- 4: Same figure with B- 2, but bombarding energy is 800 MeV.
107 APPENDIX 108
C Parameterization of NN amplitude
We use two representations for the NN ampl itude in section 4. In this appendix we show the
relation between them.
With the notation of Bystricky, Lebar, and Winternitz [38) the NN amplitude is given by
t = ~ {a+ b +(a- b)iTI · M2 · n + (c +d) iT! · mu2 · m + (c- d) iT! · LiT2 · [ + ie(iTI + 0'2) · n.}
(C- 1) The parameters depend on isospin T and are explicitly denoted as ar,br,cr,dr and eT Thus
the free N scattering can be parameterized by 10 parameters.
In the work by J. A. McNei l, L. Ray, and S. J. Wallace, on the other hand , They use the
notation of
These parameters also depend on isospin T in this notation.
The two representations arc related by the equation:
This can be written explicitly using matrix notation as
a cosO cosO cosfi - cosfi -4sinfi b
im2 -1 0 c
8rrEc -1 0
d -1 0 e -isin 0 -isinfi -isinfi i sin fi -4i cos fi
(> w+p(J 0 p<:> + e(J -2{3
-e-y --y -n -6 2(p + e)6) X (> (p+ e)<:> 0 -(p +e)<:> 2<:>
Cf -y -p-y --y 2-y
-! - ! 0 -2!
Table C- 1: Parameters in matrix elements of Eq. C- 4.
e E~ 2jm' p k~ 2Jm'=e-l a cos2
;
(J 1 + sin2 ~ -y sin2 ~ 6 1 + cos2 ~
f. sin~ cos~
ts
tv
tp
tA
tr
(C- 2)
(C- 3)
(C- 4)

APPENDIX 109
The energy Ec = Jm2 + k~ and scattering angle 0 are represented in the center of mass
frame of the two nucleon system. The first matrix gives the transformation from the helicity
representation to the Bystricky representation. In the second matrix, the parameters e and
p depend on the energy and momentum while the parameters o:, {3, "(, 8, and f depend on the
scattering angles listed in Table C- 1.
APPENDIX
D Expansion of t he G la uber t h eory
The total cross section a is expanded as the summation of n- step cross section as
u = u{l) + U{2) + ... + u(A).
Each component is approximately denoted by
U(n) ACn J d 2b(Xpp + Xpnt{1- (Xpp + Xpn))(A - n)
:oe J d2b (Xpp + Xpn)n e-<x •• +x •• ) n! .
The n=1 term is identical to Eq. 4- 8.
110
(D- 1)
(D- 2)
In order to investigate the probe dependence of the multi- step contribution, we examine the
ratio u<2) /u{l) for the (p, n) and (p,p') reactions using Eq. D- 2. The single-step cross sections
u{!) for the (p, p' ) and (p, n) reaction are described by
{I) (J(p,p')
{I) U(p,n)
J d2b (Xpp + Xpn)e -<x •• +x •• )'
J d2b Xpne-(x •• +x •• ).
T he two-step cross section u<2) are descri bed by
(2) j d2b (Xpp + Xpn)2
e-(x •• +x •• ) (J(p ,p') 2 '
u{2) j d2b (~x2 +X X ) e-<x •• +x •• ) (p,n) 2 pn pn pp ·
(D- 3)
(D- 4)
In t he a<2) for the (p, n) reaction only the X~p/2 component is excluded because no neutrons is
detected from the component. Using the averaged values, which are denoted as X and so on,
the ratio can be derived by (2)
(J(p,p') -(-1)(J(p,p')
{2) a(p,n) -{-1)(J(p,n)
(D- 5)
Consequent ly, it is found that the ratio of the (p, n) reaction is larger than that of the (p, p')
reaction. T he two- step component relative to the single-step component is expected to appears
larger for the (p, n) reaction than the (p,p') reaction. In t his simple model we ignore cross
sections for the NN inelastic channel, such as 1r meson production or C;. excitation, which are
opened with initial proton energy above 280 MeV. When the inelast ic cross sections are taken
in account , t he equation 4-8 needs to be modified as
Aerr _ 1_ roo d2 b XN( b)e-(XN(b)+xw(b)), Uciastic Jo
XN(b) J dZUeJasticP(r),
J dzainelasticP( T) · (D- 6)

APPENDIX 111
One must be more careful in this energy region because the fraction of the single- step scattering
becomes smaller, which originates from the factor e-(XN(b)+xw(b)) .
APPENDIX 112
E O t her resul ts : 13 C(p, n) reaction
We compared the energy spectra of the 13 C(p, n) reaction with those of the 12 C(p, n) reaction,
which is shown in Fig. E- 1. As is shown in the top frame of the figure, the cross sect ion of tJc is
identical with t hat of 12 C at energy transfer greater than 90 MeV at 20° . Differences at energy
transfer less than 90 MeV comes from one of the neutrons in 13C. We describe this neutron
which makes the difference as n•. The n"(p, n) reactions are shown in the middle frame of the
Fig. E-1. The energy distribution of the reaction is located around the expected position by
kinematics for free NN scattering. Consequently, the peak position for the 13C (p, n) reaction
is influenced by the valence neutron. The peak shift is therefore is much smaller than that of
the 12C(p, n) reaction.
The difference between the 13C(p, p') reaction and the 12 C(p, p') reaction is less clearly identi
fied than that of the (p, n) reaction. The difference for the (p, n) reaction is due to one nucleon
out of seven neutrons while the difference for the (p, p') reaction is due to one nucleon out of
13 nucleons. Although quality is poor, the peak position for the n"(p,p') reaction is shifted to
lower w.
As one of methods to investigate the motion of nucleons in the nucleus, the measurements of
cross section and analyzing power for the (p,p') and (p, n) QES is strongly suggested. In order
to clarify this issue, sufficiently small statistics uncertainty is required especially for t he (p, p1)
reaction.

APPENDIX 113
~~f1\I~IN ::nll 3 02~~LLL_] ~ 00~ ~ ::[]: ill(]: [l]: ;:~~[ ~ O.Ofl \ I 1 "tj 006 :
0 .08 I . :
0.04 l ! 0.~ 0.02 l ! I 0 .02 :
I I 0.00
o.oo :: ~ o w ~Me,;) '"
< 0.1 . 0.0 - 0.1
0 50 100 !50
w [MeV]
Fig. E-l: Comparison of the cross sections for the 13 C and 12C QES. Left seven frames indicate
the (p, n) reaction while the right two frames indicate the (p, p') reaction. For the (p, n) reaction ,
the spectra for 12°, 20°, and 28° are shown from left to right . The top frames show the cross
sections for the 13C and 12 C. The differences are deri ved and shown in the midd le frames.
Vertical dashed line indicates the positions of t he kinematic of the NN scattering. The peak
positions of the differences are consistent with that of the NN kinematics.
ACKNOWLEDGEMENT 114
Acknowledgement
I am deeply indebted to many people who offered me encouragement, stimulat ing discussions,
decisive suggestions and excellent technical supports in the course of the present invest igation .
I wi sh to express my gratitude to my supervisor, Professor Hideyuki Sakai, who introduced
me to this fi eld. He has given me continuous supports, encouragement, advice, and discus
sions t hroughout the graduate course. Nothi ng could have delivered me the significant gains on
physics and the experimental techniques than the discussions with him. I have called the dis
cussions namely the "battles" . I am also grateful to Dr. Hiroyuki Okamura for useful discussions
not only on physics but on computer programming techniques as well. I wish to thank Professor
Kichiji Hatanaka not only for discussions and suggest ions on physics but also for continuous
encouragement and general assistances in carrying out the experiments at RCNP.
Without t heir invaluable helps this work would not have been realized .
All of the work presented here have been done in collaborat ion with the members of the
RCNP- El7 /E58 collaboration. I acknowledge the aids of the collaborators; Professor Mark
B. Greenfield, Professor Norihiko Koori , Professor Akira Okihana, Mr. Satoru Ishida, Dr.
Naruhiko Sakamoto, Dr. Tomotsugu Wakasa, Mr. Tomohiro Uesaka, Mr. Yoshiteru Satou, Mr.
Satoshi Fujita, Mr. Tetsuya Ohnishi , and Mr. Takamasa Nonaka. Especially, I would like to
appreciate Dr. Tomotsugu Wakasa for his daily collaboration, friendship, and his support on data taking system at RCNP.
I would like to thank Professor Munetake Ichimura and Dr. Ken Kawahigashi for t heir
useful advice and theoretical supports. I acknowledge Professor Toru Suzuki for his helpful
suggest ions and discussions. I also acknowledge Dr. Akira Oonishi and his collaborators for
their suggestions. Thanks are due to Dr. Greg Hillhouse for his helpful advice.
Special thanks are due to all RCNP staffs and engineers for their warm- hearted encourage
ment not only throughout the experiments but also on the daily life. Firstly, I would like to
thank to accelerato r staffs for their kindness and their great effo rts for providing stable beam.
Especially my grateful thank is due to Professor Kazuhiko Hosono for his daily encouragement
and useful advice. I am also indebted to Dr. Nobuyuki Matsuoka and Mr. Masato Yoshimura
for their supports on the experiment using the spectrograph LAS. I wish to thank Professor
Tetsuo 1oro and Dr. Hidetoshi Akimune for helpful advice on the VDC counter. Also I would
like to thank Mr. Masaru Yoso i, Dr. Yasuhiro Sakemi for discussions and their suggestions on
the ex periments.
I would like to thank people in RlKEN where I stayed for the analyses throughout my graduate
student days. 1 am indebted to Dr. Yasushi Watanabe and Dr. Takashi lchihara for their
supports on computers and their computer code libraries. I am also indebted to Dr. Hiroyoshi
Sakurai for his useful advice. I would like to express great regards to Dr. Nobuhisa Fukunishi
and Mr. Naohito lnabe for their stimulat ing suggest ions.
Numeri cal calcu lations were carried out with RCN PAX cluster system at RCNP and a
ni l{AXP cluste r system at the Institute of Physica l and Chemical Research(RlKEN).
l am indebted to Fellowships of the Japan Society for the Promot ion of Science for Japanese
Junior Scientists.


![[XLS] · Web viewwms project management wms implementation service kodak imaglnk scnr 900s_ kodak imaglnk scnr 900d_ kodak imaglnk semiauto fdr kodak imaglnk patch rdr ac](https://img.pdfslide.net/doc/110x75/5ab639c47f8b9a86428d8207/xls-viewwms-project-management-wms-implementation-service-kodak-imaglnk-scnr-900s.jpg)