Embed Size (px)
Citation preview

Brussels – November 9, 2017
Third quarter 2017 results
Analyst callKoen Van Gerven, CEO Koen Beeckmans, CFO

2
Investor presentation - Interim financial report 3Q17
DisclaimerThis presentation is based on information published by bpost in its Third Quarter 2017 Interim Financial Report, made available on November, 8th 2017 at 5.45pm CET oncorporate.bpost.be/investors. This information forms regulated information as defined in the Royal Decree of 14 November 2007. The information in this document may include forward-looking statements1, which are based on current expectations and projections of management about future events. By their nature, forward-looking statements are not guarantees offuture performance and involve known and unknown risks, uncertainties, assumptions and other factors because they relate to events and depend on circumstances that will occur in thefuture whether or not outside the control of the Company. Such factors may cause actual results, performance or developments to differ materially from those expressed or implied bysuch forward-looking statements. Accordingly, no assurance is given that such forward-looking statements will prove to have been correct. They speak only as at the date of thePresentation and the Company undertakes no obligation to update these forward-looking statements contained herein to reflect actual results, changes in assumptions or changes infactors affecting these statements. This material is not intended as and does not constitute an offer to sell any securities or a solicitation of any offer to purchase any securities.
1 as defined among others under the U.S. Private Securities Litigation Reform Act of 1995
Financial Calendar
04.12.2017(17:45 CET)Interim dividend 2017 announcement
07.12.2017Ex-dividend date (interim dividend)
11.12.2017Dividend payment date
13.03.2018 (17:45 CET)Annual results FY2017
02.05.2018(17:45 CET)Quarterly results 1Q18
09.05.2018Ordinary General Meeting of Shareholders
15.05.2018Ex-dividend date
17.05.2018Payment date of the dividend
08.08.2018(17:45 CET)Quarterly results 2Q18
07.11.2018(17:45 CET)Quarterly results 3Q18
03.12.2018(17:45 CET)Interim dividend 2018 announcement
More on corporate.bpost.be/investors

33Q17
Highlights of 3Q17
Domestic Mail underlying evolution as expected• Continued e-substitution but overall underlying volume trend in line with
guidance
Organic cost evolution on track• Opex influenced by acquisitions (€ +103.3m)
• Increase in transport cost in line with international business evolution
Very strong parcels performance • Domestic: very strong reported volume increase driven by strong
e-commerce growth and C2C; price/mix effect of -7.1% fully mix related• International: mainly driven by increase in flows from Asia
-5.3%
+32.8%
+ € 9.1m
+ € 109.3m
Revenues up 20.4%• Driven by very strong growth in Parcels and acquisitions partly offset by
lower Domestic Mail revenues in line with guidance€ 647.6m
EBITDA perfectly in line with last year and guidance
BGAAP net profit of bpost SA/NV up € 1.5m
2017 outlook reconfirmed
€ 110.3m
€ 52.0m

4
110.3110.1
66.4
55.3
EBITDA 3Q16
-14.5
CorporateParcels
2.3
Additional sources of revenues
Domestic Mail EBITDA 3Q17
-109.3
Costs
EBITDA slightly up and driven by very strong Parcels growth and acquisitions
3Q17
Total operating income (revenues)
€ +0.2m / +0.2%
€ million

5
Summary of key financials 3Q17
3Q17
€ million
3Q16 3Q17 % ΔTotal operating income (revenues) 538.1 647.6 20.4%Operating expenses 428.0 537.3 25.5%EBITDA 110.1 110.3 0.2%Margin (%) 20.5% 17.0%EBIT 87.8 87.2 -0.7%Margin (%) 16.3% 13.5%Profit before tax 89.0 91.4 2.7%Income tax expense 28.2 31.4Net profit 60.8 60.0 -1.3%FCF (71.9) (76.3)bpost S.A./N.V. net profit (BGAAP) 50.5 52.0 3.0%Net Debt/ (Net cash), at 30 September (657.7) (518.6) -21.1%

6
Total operating income (revenues)
3Q17
€ million
1 Defined as domestic and Belgian in- and outbound
3Q16 comparable ∆ 3Q17 % ∆
Transactional mail 190.6 -13.3 177.4 -7.0%Advertising mail 55.7 -0.1 55.6 -0.2%Press 68.9 -1.1 67.8 -1.6%
Domestic parcels1 42.4 10.1 52.5 23.7%International parcels 42.7 9.1 51.8 21.4%Logistic solutions 2.7 36.0 38.7 -
International mail 36.7 -1.5 35.3 -4.0%Value added services 23.8 1.4 25.2 5.9%Banking and financial 46.1 -1.4 44.8 -2.9%Distribution - 21.9 21.9 -Retail & Other 23.9 46.0 69.9 192.2%
Corporate 4.4 2.3 6.7 52.8%
538.1 109.5 647.6 20.4%
Domestic mail
Parcels
Additional sourcesof revenues
TOTAL

73Q17
Total operating income (revenues), € million
1 3Q17 had 1 working day less than 3Q16 for franking machines and 2 less for stamps
• Transactional Mail: continued e-substitution.• Advertising Mail: continued growth of focus segments in
unaddressed, slight decrease in direct mail.• Press: newspapers witness a stable trend vs. 1H17 while
periodicals will benefit from volume shift towards 4Q17.
• Impacted by regulatory decision on small user basket pricing and shift towards cheaper products.
FY16 1Q17 2Q17 3Q17 YTD17 FY16 1Q17 2Q17 3Q17 YTD17Transactional mail -5.9% -6.0% -11.0% -7.3% -7.9% -5.9% -7.0% -9.9% -6.5% -7.7%Advertising mail -3.0% 2.7% 4.5% -1.6% 1.8% -3.0% 2.3% 4.5% -1.6% 1.8%Press -2.8% -3.1% -5.0% -4.3% -4.1% -2.8% -3.1% -5.0% -4.3% -4.1%Domestic Mail -5.0% -3.9% -7.4% -5.9% -5.6% -5.0% -4.7% -6.7% -5.3% -5.5%
Reported Underlying 1
Domestic Mail underlying volume trend at -5.3% in line with guidance
315.2
3Q17
Price/Mix 2.4
Volume -15.3
Working dayimpact
300.7
-1.6
3Q16
-14.5
8
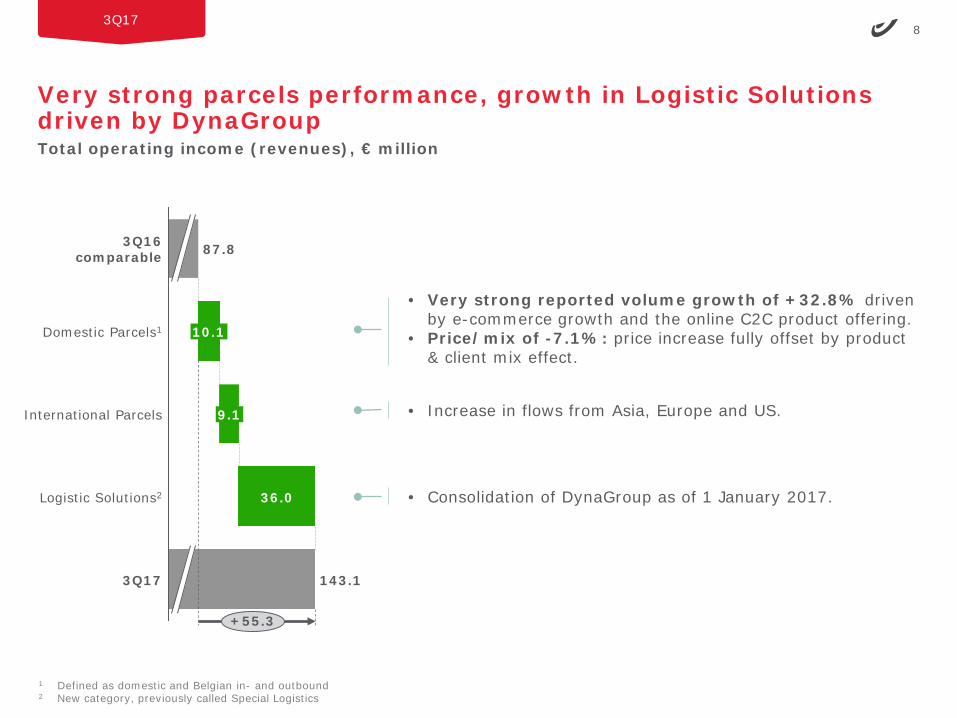
Very strong parcels performance, growth in Logistic Solutions driven by DynaGroup
3Q17
Total operating income (revenues), € million
143.1
+55.3
3Q17
Logistic Solutions2 36.0
International Parcels 9.1
Domestic Parcels1 10.1
3Q16comparable 87.8
1 Defined as domestic and Belgian in- and outbound2 New category, previously called Special Logistics
• Very strong reported volume growth of +32.8% driven by e-commerce growth and the online C2C product offering.
• Price/mix of -7.1%: price increase fully offset by product & client mix effect.
• Increase in flows from Asia, Europe and US.
• Consolidation of DynaGroup as of 1 January 2017.

9
Additional sources of revenues driven by the acquisition of Ubiway
3Q17
Total operating income (revenues), € million
1.4
3Q16comparable
International Mail
197.1
+66.4
Retail & Other1
Distribution1 21.9
3Q17
Banking & Financial
-1.5
46.0
-1.4
VAS
130.6
1 New category
• Business mail volume decline.
• Consists of Ubiway press distribution as well as convenience distribution through Alvadis (pre-paid services) and Burnonville (impulse products).
• Lower revenues from bpost bank savings accounts due to low interest rate environment and lower revenue from financial transactions managed on behalf of the State.
• Consists of Ubiway proximity and convenience retail as well as other revenues.
• Mainly driven by management of cross-border fines on behalf of the Belgian State.
10
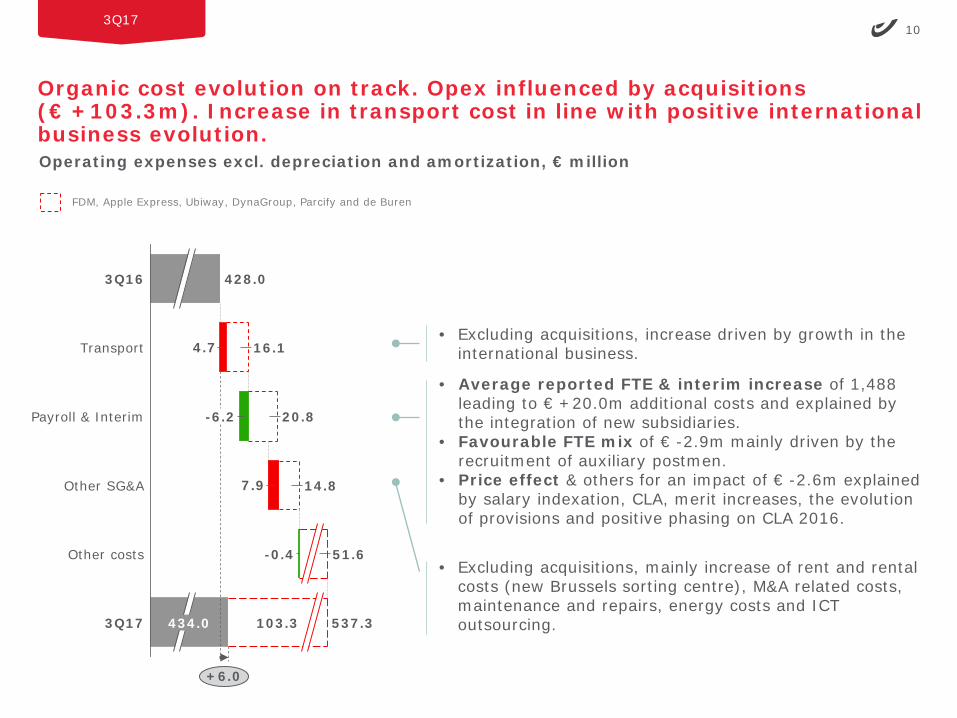
Organic cost evolution on track. Opex influenced by acquisitions (€ +103.3m). Increase in transport cost in line with positive international business evolution.
3Q17
Operating expenses excl. depreciation and amortization, € million
FDM, Apple Express, Ubiway, DynaGroup, Parcify and de Buren
7.9
4.7
428.0
-0.4
434.0
Transport
Payroll & Interim
103.3
Other costs
537.3
+6.0
20.8
16.1
3Q17
3Q16
Other SG&A
51.6
14.8
-6.2
• Excluding acquisitions, increase driven by growth in the international business.
• Average reported FTE & interim increase of 1,488 leading to € +20.0m additional costs and explained by the integration of new subsidiaries.
• Favourable FTE mix of € -2.9m mainly driven by the recruitment of auxiliary postmen.
• Price effect & others for an impact of € -2.6m explained by salary indexation, CLA, merit increases, the evolution of provisions and positive phasing on CLA 2016.
• Excluding acquisitions, mainly increase of rent and rental costs (new Brussels sorting centre), M&A related costs, maintenance and repairs, energy costs and ICT outsourcing.

113Q17
1 Operating free cash flow = cash flow from operating activities + cash flow from investing activities
Lower operating FCF1 due to higher capex
CF from operating activities in line with 3Q16, excluding:• Terminal dues payment, phasing in 3Q16: € +16.8m• Lower tax prepayment in 3Q17: € +10.0m
• Proceeds from sale of buildings: € -3.0m• Higher capex: € -23.8m mainly explained by Vision 2020• Cash outflow Apple Express in 2017: € -2.7m
€ million 3Q16 3Q17 Delta
Cash flow from operating activities -64.2 -38.9 +25.2Cash flow from investing activities -7.8 -37.3 -29.5Operating free cash flow -71.9 -76.3 -4.3Financing activities -0.1 -0.1 +0.0Net cash movement -72.0 -76.3 -4.3
Capex -11.3 -35.1 -23.8

12
Strong balance sheet structure
3Q17
€ million
Assets Equity and liabilities
PPE & intangibleassets
Inventories
Trade & otherreceivables
Investments inassociates
Other assets
Cash, cashequivalents
& investmentsecurities
Sept 30, 2017
2,348.9
896.5
40.9
438.4
336.7
47.9
588.6
Dec 31, 2016
2,290.3
786.0
36.7
484.6
373.7
58.4
550.9 Provisions
Interest-bearingloans & borrowings
Sept 30, 2017
2,348.9
930.2
323.4
978.0
47.4 69.9
Dec 31, 2016
2,290.3
779.3
356.7
1,037.5
58.7 58.0
Employee benefits
Total equity
Trade & otherpayables

133Q17
Outlook for 2017 – reconfirmed
1 4Q17 1 less on franking machines and 1 more on stamps vs. the same quarters of 2016
Recurring EBITDA and dividend payment at the same level as 2016
RevenuesIncrease driven by:• Growth in domestic parcels: volume double
digit, around -5% price/mix effect• Continued growth in international parcels
supported by newly acquired businesses• Growing Ubiway Retail revenues• Partly offset by decrease in domestic mail1:
volume between -5% and -6%, average domestic mail price increase of 1.5%
Operating expensesIncrease driven by:• Increase in transport cost (reflecting growth in
International Parcels) • Consolidation of acquired businesses • Salary indexation confirmed as of July 2017• Partly compensated by continued productivity
improvements and optimized FTE mix, and• Continued cost optimization
Capex• Recurring and Vision 2020 investments ~€ 90m• Business development investments: Ubiway < € 10m

New Brussels Sorting Centre fully operational• Total surface: 103,000 m²• Working area: 80,000 m²• Letter sorting hall: 50,000 m² (2 floors)• Parcel sorting hall: 25,000 m²• Parking on the roof: 25,000 m²• Offices: 5,800 m²• 1,500 FTEs• 1 high-tech parcel sorting machine (PSM)• Operational 24/7 with 30 high-tech
machines• Capacity: 300,000 parcels/day & 2,500,000
letters/day

Brussels – November 9, 2017
Appendix:
Additional information Radial

16
Radial is offering integrated e-commerce logistics services
Radial
% based on normalized 2017 expected revenues
Omnichannel technology
Payment, tax, & fraud protection
services
Warehouse management &
fulfillment services
Transport management &
last-mile delivery and
returns
CustomerCare
Services&
Technology
~70-75% ~10%
Optimizing efficiency of order
management, ship-from-store and in-
store pick up
Processing global payments, maximizing
successful authorization and
reconciling tax districts and global
duties
Adapting warehouse
management and parcels preparation
to e-commerce with pragmatic
automation
Managing a large network of carriers
for a seamless customer
experience
Having a single view of customer’s history and profile
combined with leading self-service tech
~15-20%

17
Radial is the product of the 2016 integration of eBay Entreprise(eCommerce) and Innotrac (fulfillment)
Radial
Source: Press search, Management presentation
Specializes in creating, developingand runningonline shopping sites for brick and mortar brands and retailers
Specialized in order processing, order fulfillment, and customer support contact center services
1998lnnotrac
goes public
onNasdaq
2000GSI
acquiresFogDog
2000lnnotracacquiresUSDS
2001lnnotracacquires
iFulfillment
2006lnnotracacquires
the fulfillmentdivision of
Clientlogic Corp
2005GSI
acquiresAspherio
2007GSI acquires
Accretive Commerce and
Zender.com
2009-10GSI raises
$ 500m acrossthree equity
raises to fund expansion
2010GSI acquiresVendorNet
(Omnichannel)
2011eBay Inc.acquires GSI &
renamed to eBay
Enterprise
Building GSI / eBay Enterprise
Building lnnotrac
1995Global Sports Incorporated
("GSI") founded
1984lnnotracfounded
2015SterlingPartnersacquires
2014SterlingPartnersprivatizes
2016$ 976m norm.
revenues$ 61m
norm. EBITDA
2017$ 970-1,020m norm. expected
revenues$ 65-70m
norm. expectedEBITDA
April 2016

18
Market dynamics in the US
Radial
$ 20m
$ 2,000m
$ 400bn US online retail revenue in 2016
$ 25-35bnaddressable e-commerce logistics
Radial’s target audiencee-commerce revenue$ 135-140bn
~$ 400bn total US e-commerce
Radial’s target audience ($ 20m – 2bn revenues)• Mid-market
segment ($ 20-200m online revenue)
• Enterprise segment ($ 200-600m)
• Some selected key accounts ($ 600m-$ 2bn)
• Total US e-commerce logistics sector represents around $ 400bn
• From this, the target audience of Radial (players with revenues between $ 20m - $ 2bn) represents $ 135-140bn
• As logistics accounts for ~20-25% of the revenues, addressable market represents $ 25-35bn
Online revenue e-tailers, US Addressable e-commerce logistics sector

19
Radial’s competitive landscape
Radial
E2E integrated players
Offers services across the full value chain (including warehousing, fulfillment, payments, claims handling), some focus on 1 specific industry
Insourcing Insources (part of) e-commerce logistics
Dominates e-commerce (logistics) sector across entire value chain (incl. market place)
Value chain specialists
Focuses on specific parts of the value chain (e.g. only web services & digital marketing or only logistics & customer services)
How does Radial differentiate itself from Amazon?
• Product offeringSome brands and retailers only offer selected products on Amazon and the rest via own webstore
• Customer relationshipRetailers/brands increasingly want to own the customer relationship themselves
• Brand valueSome brands and retailers do not want to be compared with Amazon’s suggestions for other brands
• FulfillmentSome customers want to use Amazon’s marketplace but use Radial for fulfillment and warehousing
Type of player DescriptionExamples US not exhaustive
Examples EU not exhaustive

20
Background information about the integration plans
Radial
Radial is the result of an integration of Innotrac and eBay Enterprise. Radial’s management has already made significant progress, i.e.
• Operations unified and standardized, operating procedures have been put in place
• IT platforms have been or are in the process of being unified and upgraded
• Product offering and marketing refreshed and refocused
• HR processes and systems have been unified and improved
• Some strategic decisions taken in the past (e.g. webstore closure) are being implemented
Ongoing business integration plans will continue, incurring an impact on reported EBIT mainly in 2018 with a tail in 2019 for an estimated total between $ 35m and $ 40m relating to:
• Elimination of remaining fixed costs and the related implementation costs for closing the webstorebusiness which exit was announced in 2014. This process will be fully completed in 2018.
• One-off program costs to successfully roll-out strategy horizon 2021 related to:
• Building scale in operations (e.g. scale client onboarding teams, continue technology harmonization)
• Growing the technology business (growth will come from cross-selling and from developing products that solve certain needs of clients)
• Enhancing the go to market strategy (strengthening of the sales force, increase focus on mid-market, increase cross-selling)

21
Key contacts
Baudouin de Hepcée
Director External Communication, Investor Relations & Public Affairs
• Email: [email protected]• Direct: +32 (0) 2 276 22 28• Mobile: +32 (0) 476 49 69 58• Address: bpost, Centre Monnaie, 1000 Brussels, Belgium
Saskia Dheedene
Manager Investor Relations
• Email: [email protected]• Direct: +32 (0) 2 276 76 43• Mobile: +32 (0) 477 92 23 43• Address: bpost, Centre Monnaie, 1000 Brussels, Belgium