Embed Size (px)
Citation preview
KOF BulletinNo. 79, November 2014
ECONOMY AND RESEARCHKOF Business Tendency Surveys: KOF Business Situation Indicator Declines >>Health Spending Forecast: Health Spending Set to Rise Further >>The Anti-Mass Immigration Initiative and its Impact on Swiss Companies’ Investment Plans >>KOF Autumn Forecast: Waiting for the Upturn >>A Weak Global Economy >>
KOF INDICATORSKOF Employment Indicator: Labour Market Is Losing Momentum >>KOF Economic Barometer: Again Close to its Long-run Average >>Further KOF Publications >>
AGENDAKOF Events >>Other Events >>
CUSTOMER SERVICE >>
IMPRINT >>
2Copyright © ETH Zürich, KOF Swiss Economic Institute, 2014
KOF BulletinNo. 79, November 2014
ECONOMY AND RESEARCH <<
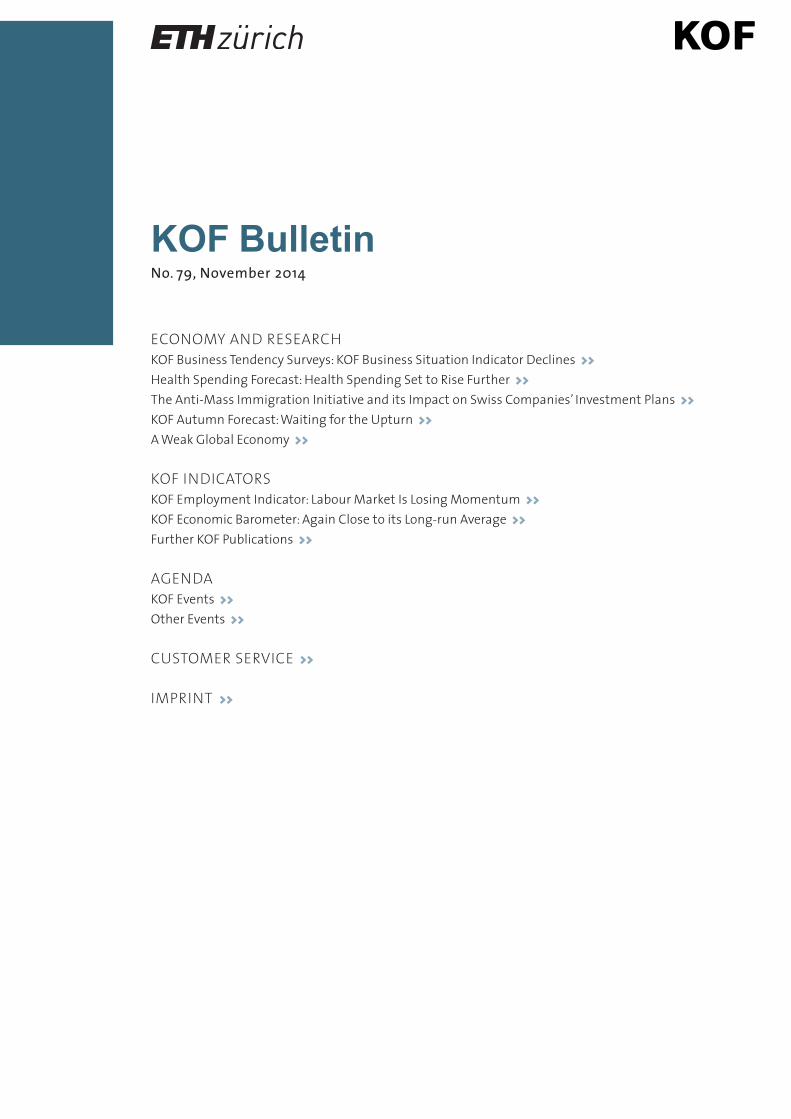
KOF BUSINESS TENDENCY SURVEYS: KOF BUSINESS SITUATION INDICATOR DECLINESAccording to the answers given by 5,900 companies active in industry, construction and the mainservices, companies in Switzerland found their business situation substantially less positive inOctober. For the first time in four months, the Business Situation Indicator declined significantly(see G 1). On the other hand, the companies’ expectations for the coming six months are almost unchanged and assessments of the further business outlook are cautiously positive. Nevertheless,the Swiss economy is encountering some headwinds this autumn.
The business situation in the processing industrydid not changed much in October. As in the previousmonth, it improved slightly and is generally consi-dered to be satisfactory. Although the assessmentwas somewhat more positive among domes tically-oriented companies than among export-orientedcompanies, there is currently no pronounced disso-nance between the two groups. Capacity utilisa-tion of appliances and machines was up slightlycompared to the previous quarter although, at82.4 per cent, capacity utilisation is still belowaverage. The trend in order books was more favourable than before and companies are increasinglyplanning to step up production in the near future. These plans have progressed to the degree thatintermediate product warehouses have been filled and more intermediate products will be orderedin the coming months. Although pressure on selling prices may not relent, business expectations remain confident.
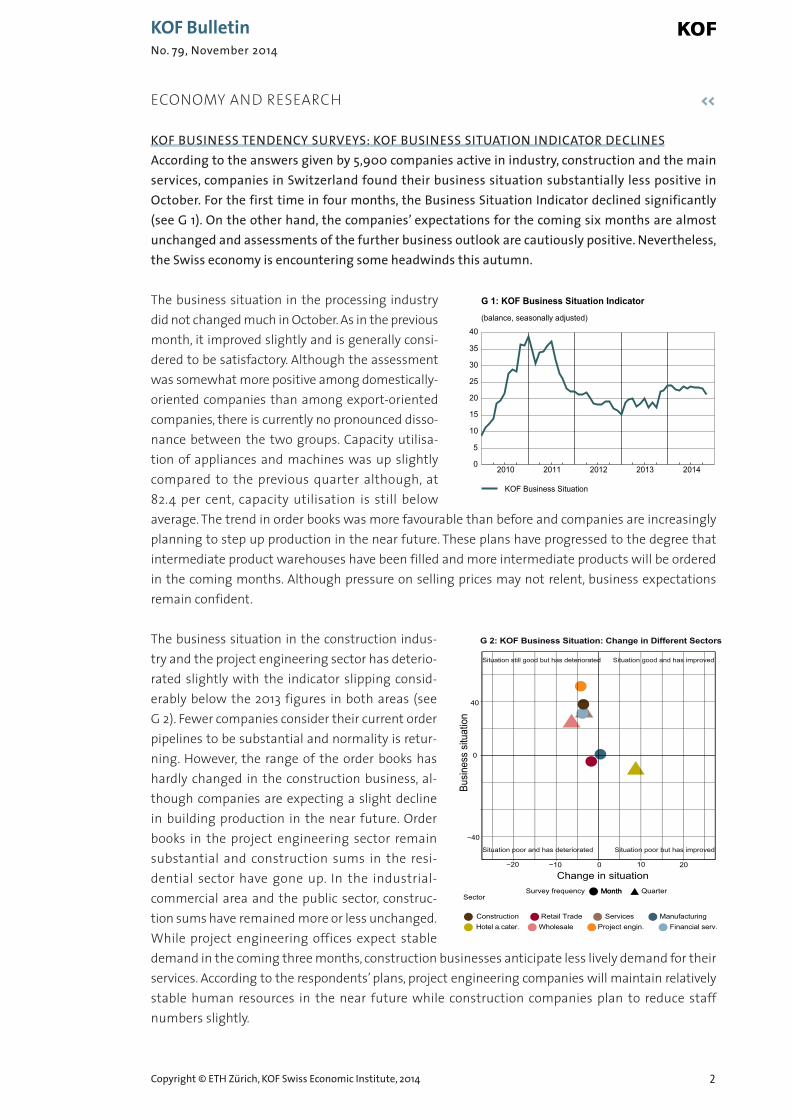
The business situation in the construction indus -try and the project engineering sector has deterio-rated slightly with the indicator slipping consid -erably below the 2013 figures in both areas (see G 2). Fewer companies consider their current orderpipelines to be substantial and normality is retur-ning. However, the range of the order books hashardly changed in the construction business, al -though companies are expecting a slight declinein building production in the near future. Orderbooks in the project engineering sector remainsubstantial and construction sums in the resi-dential sector have gone up. In the industrial-commercial area and the public sector, construc-tion sums have remained more or less unchanged.While project engineering offices expect stabledemand in the coming three months, construction businesses anticipate less lively demand for theirservices. According to the respondents’ plans, project engineering companies will maintain relativelystable human resources in the near future while construction companies plan to reduce staffnumbers slightly.
2010 2011 2012 2013 20140
5
10
15
20
25
30
35
40
KOF Business Situation
G 1: KOF Business Situation Indicator
(balance, seasonally adjusted)
Situation still good but has deteriorated Situation good and has improved
Situation poor and has deteriorated Situation poor but has improved
Change in situation
Busin
ess
situa
tion
MonthSurvey frequency QuarterSector
Construction Retail Trade Services Financial serv. Hotel a. cater. Wholesale Project engin.
Manufacturing
G 2: KOF Business Situation: Change in Different Sectors
Month
−40
0
40
−20 −10 0 10 20
3
SITUATION LESS FAVOURABLE IN THE RETAIL TRADE BUT MORE FAVOURABLE IN THE HOTEL AND CATERING SECTORSatisfaction with the business situation has gone down again in the retail trade. Neither customerfrequency nor turnover came up to the previous year’s figures. Although results have gone down,retail companies are not planning to shed jobs in the near future. As regards the trend in the comingthree months, respondents are confident that turnover will increase. However, with prices stillunder pressure, optimism regarding the overall business outlook has become more cautious. Thebusiness situation in the wholesale trade has deteriorated noticeably for the first time in threemonths. All in all, however, the companies’ assessment is still predominantly positive. Demand isno longer rising and sales of goods have declined compared to the previous year’s period. Deliverytimes have become shorter while results are no longer on an upward trend. Wholesalers still expect an increase in demand in the near future. However, since they also anticipate a combina-tion of rising purchasing prices and stable selling prices, their general business expectations arenow less positive than before.
The business situation assessment in the hotel and catering industry is less desolate than in thefirst three quarters of the year. Both restaurant and hotel businesses complained less about theunfavourable business situation although, all in all, they are still dissatisfied. Hotels did not suf-fer any further decline in turnover compared to the previous year and their results did not subsidefurther. In contrast, turnover and results have gone down in the catering industry. Hotels expectan increase in demand in the near future while catering companies anticipate stable demand.The number of employees is likely to decline slightly in both areas. All in all, the catering businessesare noticeably more confident when it comes to their business outlook.
The business situation among financial and insurance companies has deteriorated slightly com-pared to the previous month. Nevertheless, the situation remains favourable and is more positivethan at the beginning of the third quarter. The current decline in the business situation indicatorresults from the downward correction in the insurance companies’ assessment. Nevertheless, improved business expectations among insurers show that they expect an interim lull. Banks report that their business situation is more favourable than before. They still maintain a confidentoutlook, albeit slightly less so than in the previous month. The banks anticipate a considerable increase in domestic demand. Their business expectations regarding foreign demand is less negative than before. Both banks and insurance companies consider the number of staff to be almost adequate. Staff plans in both areas indicate stable staff numbers in the near future.
The favourable business situation among the other service providers has deteriorated somewhat.In particular transport, information and communications service providers report that their situation is no longer quite as positive as in the previous quarter. However, all in all, the surveyedservice companies confirm a stable rise in demand in the past three months and expect a furtherincrease in the near future. Their HR plans thus include further recruitment, not least becausetheir business expectations for the coming six months are more confident than in the summer.
Copyright © ETH Zürich, KOF Swiss Economic Institute, 2014
KOF BulletinNo. 79, November 2014
4Copyright © ETH Zürich, KOF Swiss Economic Institute, 2014
KOF BulletinNo. 79, November 2014
HEALTH SPENDING FORECAST: HEALTH SPENDING SET TO RISE FURTHERFollowing above-average growth in 2012, a further substantial increase in health spending is expected for 2013. The significant rise in spending is mainly due to the hospital financing conver-sion to case-based lump sum financing. In the current year, growth is expected to level out andstart rising again moderately in the coming years.
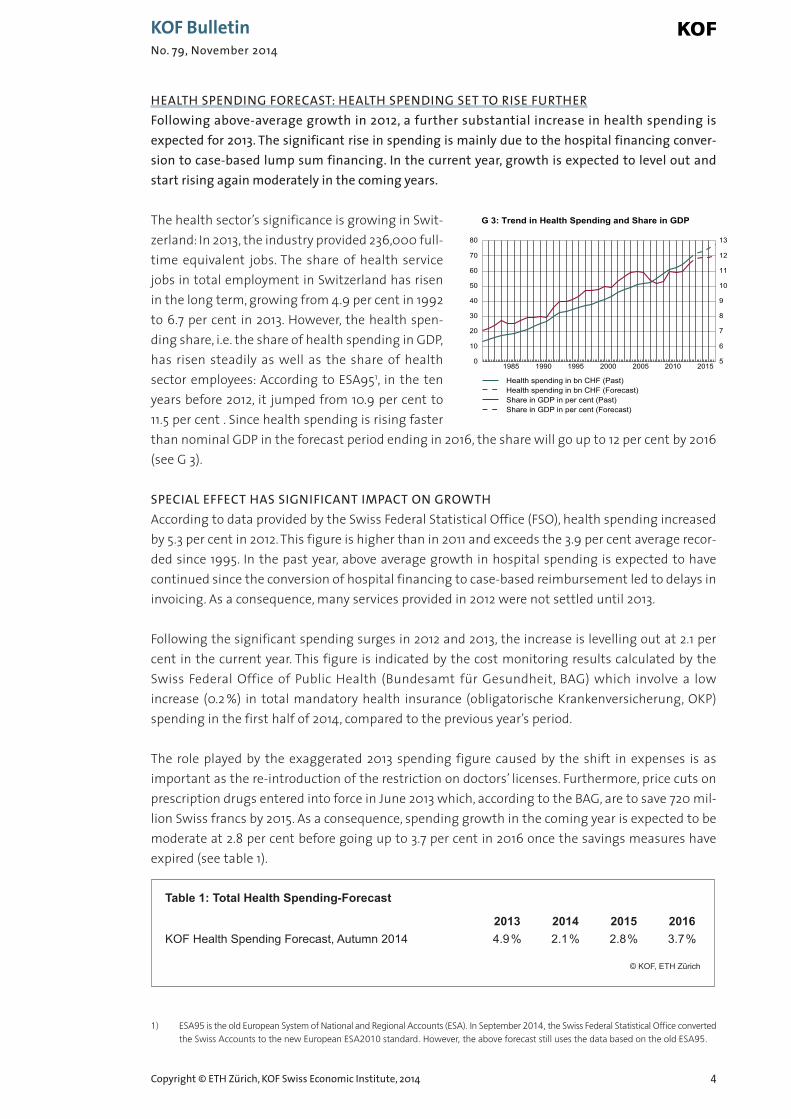
The health sector’s significance is growing in Swit-zerland: In 2013, the industry provided 236,000 full-time equivalent jobs. The share of health servicejobs in total employment in Switzerland has risenin the long term, growing from 4.9 per cent in 1992to 6.7 per cent in 2013. However, the health spen-ding share, i.e. the share of health spending in GDP,has risen steadily as well as the share of healthsector employees: According to ESA951, in the tenyears before 2012, it jumped from 10.9 per cent to11.5 per cent . Since health spending is rising fasterthan nominal GDP in the forecast period ending in 2016, the share will go up to 12 per cent by 2016(see G 3).
SPECIAL EFFECT HAS SIGNIFICANT IMPACT ON GROWTHAccording to data provided by the Swiss Federal Statistical Office (FSO), health spending increasedby 5.3 per cent in 2012. This figure is higher than in 2011 and exceeds the 3.9 per cent average recor-ded since 1995. In the past year, above average growth in hospital spending is expected to havecontinued since the conversion of hospital financing to case-based reimbursement led to delays ininvoicing. As a consequence, many services provided in 2012 were not settled until 2013.
Following the significant spending surges in 2012 and 2013, the increase is levelling out at 2.1 percent in the current year. This figure is indicated by the cost monitoring results calculated by theSwiss Federal Office of Public Health (Bundesamt für Gesundheit, BAG) which involve a low increase (0.2 %) in total mandatory health insurance (obligatorische Krankenversicherung, OKP)spending in the first half of 2014, compared to the previous year’s period.
The role played by the exaggerated 2013 spending figure caused by the shift in expenses is as important as the re-introduction of the restriction on doctors’ licenses. Furthermore, price cuts onprescription drugs entered into force in June 2013 which, according to the BAG, are to save 720 mil-lion Swiss francs by 2015. As a consequence, spending growth in the coming year is expected to bemoderate at 2.8 per cent before going up to 3.7 per cent in 2016 once the savings measures have expired (see table 1).
1985 1990 1995 2000 2005 2010 20150
10
20
30
40
50
60
70
80
5
6
7
8
9
10
11
12
13
Health spending in bn CHF (Past)Health spending in bn CHF (Forecast)Share in GDP in per cent (Past)Share in GDP in per cent (Forecast)
G 3: Trend in Health Spending and Share in GDP
Table 1: Total Health Spending-Forecast
2013 2014 2015 2016KOF Health Spending Forecast, Autumn 2014 4.9% 2.1% 2.8% 3.7%
© KOF, ETH Zürich
1) ESA95 is the old European System of National and Regional Accounts (ESA). In September 2014, the Swiss Federal Statistical Office convertedthe Swiss Accounts to the new European ESA2010 standard. However, the above forecast still uses the data based on the old ESA95.
5Copyright © ETH Zürich, KOF Swiss Economic Institute, 2014
KOF BulletinNo. 79, November 2014
IMPACT OF THE NEW HOSPITAL FINANCING SCHEMEAlthough it had been announced that the conversion to case-based reimbursement was to be implemented without causing further costs, a cost surge occurred as early as 2012. In the past year,a further significant increase in health spending is expected. With the OKP figures for the first sixmonths of 2014 indicating stagnation, a shift in level appears to have occurred. Nevertheless, detailedanalysis is not possible before the final figures are published for 2013 and 2014.
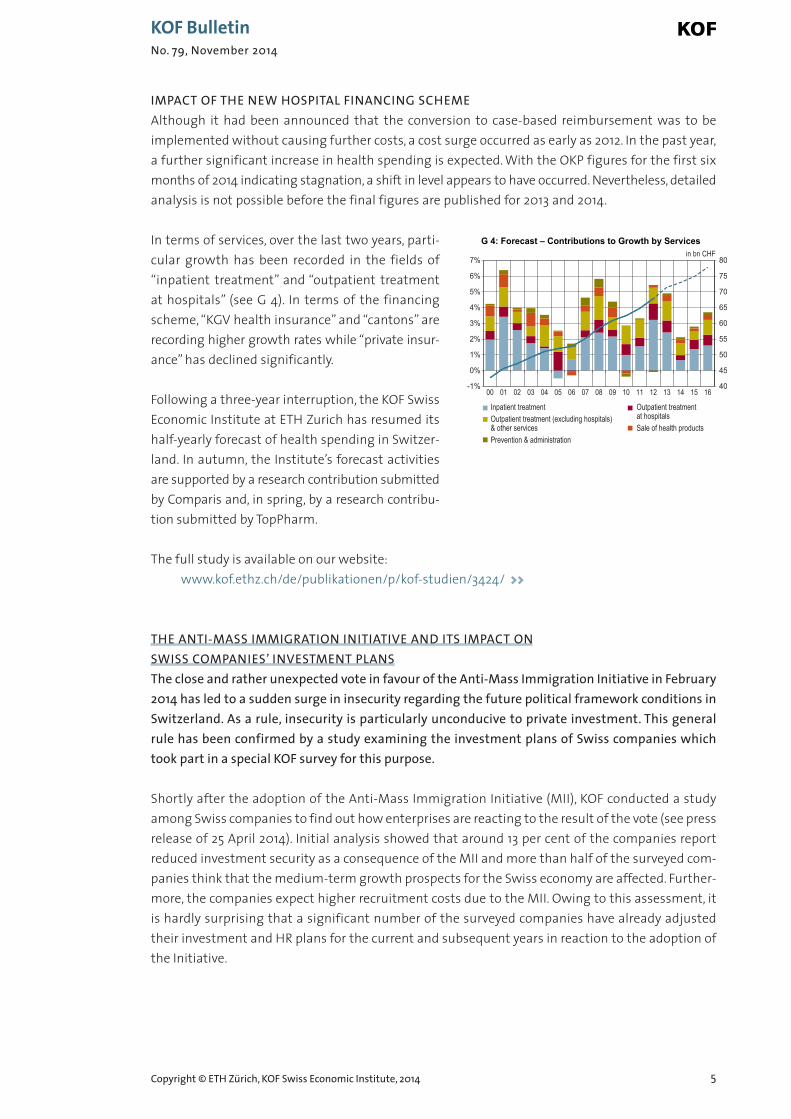
In terms of services, over the last two years, parti-cular growth has been recorded in the fields of“inpatient treatment” and “outpatient treatmentat hospitals” (see G 4). In terms of the financingscheme, “KGV health insurance” and “cantons” arerecording higher growth rates while “private insur -ance” has declined significantly.
Following a three-year interruption, the KOF SwissEconomic Institute at ETH Zurich has resumed itshalf-yearly forecast of health spending in Switzer-land. In autumn, the Institute’s forecast activitiesare supported by a research contribution submittedby Comparis and, in spring, by a research contribu-tion submitted by TopPharm.
The full study is available on our website:www.kof.ethz.ch/de/publikationen/p/kof-studien/3424/ >>
THE ANTI-MASS IMMIGRATION INITIATIVE AND ITS IMPACT ON SWISS COMPANIES’ INVESTMENT PLANSThe close and rather unexpected vote in favour of the Anti-Mass Immigration Initiative in February2014 has led to a sudden surge in insecurity regarding the future political framework conditions inSwitzerland. As a rule, insecurity is particularly unconducive to private investment. This generalrule has been confirmed by a study examining the investment plans of Swiss companies whichtook part in a special KOF survey for this purpose.
Shortly after the adoption of the Anti-Mass Immigration Initiative (MII), KOF conducted a studyamong Swiss companies to find out how enterprises are reacting to the result of the vote (see pressrelease of 25 April 2014). Initial analysis showed that around 13 per cent of the companies report reduced investment security as a consequence of the MII and more than half of the surveyed com-panies think that the medium-term growth prospects for the Swiss economy are affected. Further-more, the companies expect higher recruitment costs due to the MII. Owing to this assessment, itis hardly surprising that a significant number of the surveyed companies have already adjustedtheir investment and HR plans for the current and subsequent years in reaction to the adoption ofthe Initiative.
40
45
50
55
60
65
70
75
80
-1%
0%
1%
2%
3%
4%
5%
6%
7%
00 01 02 03 04 05 06 07 08 09 10 11 12 13 14 15 16
Inpatient treatment Outpatient treatment at hospitalsOutpatient treatment (excluding hospitals)
& other services Sale of health productsPrevention & administration
in bn CHFG 4: Forecast – Contributions to Growth by Services
6
12 HYPOTHESES REGARDING THE IMPACT OF THE MIIKOF has analysed the special survey in detail taking economic literature on the correlation betweeninsecurity and investment as the main basis. By means of 12 hypotheses, the authors Klaus Abberger,Andreas Dibiasi, Michael Siegenthaler and Jan-Egbert Sturm present the potential effects of theMII on companies’ investment and HR planning. In this context, the assumption has been con -firmed that higher insecurity has already led to a reduction in investment plans and cuts in futureemployment before the actual mode of implementation has been determined. For instance, theprobability of companies reducing their investments in 2016 has risen by 18 percentage points incases whereby companies report that insecurity has risen.
In addition, the authors attempt to convert the insecurity effect arising from the adoption of theInitiative into concrete figures. For this purpose, they use current investment figures provided bythe companies. Their evaluation indicates that the adoption of the Initiative has reduced the private investment volume at the macroeconomic level by 0.9 percentage points in 2014.
The results also show that the negative impact on HR plans caused by the adoption of the Initiativeis similar to the negative effect on investment plans. It was also found that companies which assume a larger decrease in investment security appear to adjust their investment plans more significantly than their HR plans.
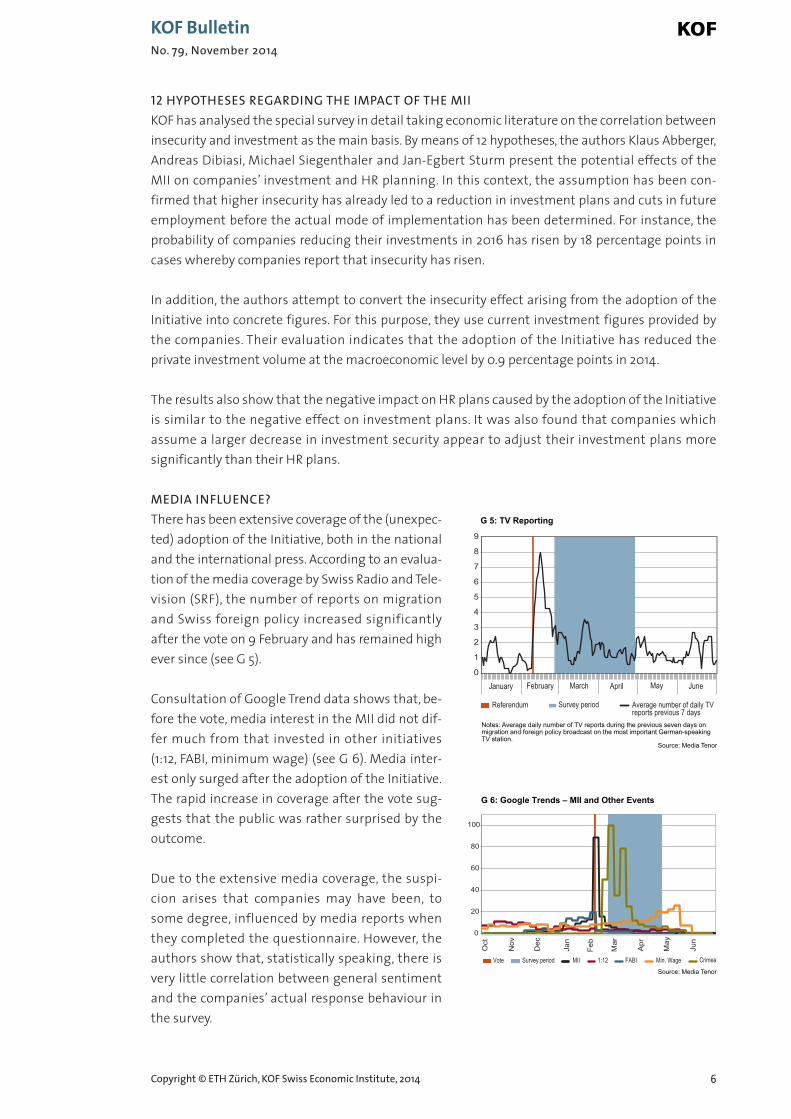
MEDIA INFLUENCE?There has been extensive coverage of the (unexpec-ted) adoption of the Initiative, both in the nationaland the international press. According to an evalua-tion of the media coverage by Swiss Radio and Tele-vision (SRF), the number of reports on migrationand Swiss foreign policy increased significantly after the vote on 9 February and has remained highever since (see G 5).
Consultation of Google Trend data shows that, be-fore the vote, media interest in the MII did not dif-fer much from that invested in other initiatives(1:12, FABI, minimum wage) (see G 6). Media inter -est only surged after the adoption of the Initiative.The rapid increase in coverage after the vote sug-gests that the public was rather surprised by theoutcome.
Due to the extensive media coverage, the suspi-cion arises that companies may have been, tosome degree, influenced by media reports whenthey completed the questionnaire. However, theauthors show that, statistically speaking, there isvery little correlation between general sentimentand the companies’ actual response behaviour inthe survey.
Copyright © ETH Zürich, KOF Swiss Economic Institute, 2014
KOF BulletinNo. 79, November 2014
June
Average number of daily TV reports previous 7 days
0
1
2
3
4
5
6
7
8
9
Referendum Survey period
Notes: Average daily number of TV reports during the previous seven days on migration and foreign policy broadcast on the most important German-speaking TV station.
MayAprilMarchFebruaryJanuary
G 5: TV Reporting
Source: Media Tenor
0
20
40
60
80
100
Oct
Nov
Dec
Jan
Feb
Mar
Apr
May
Jun
Vote Survey period MII 1:12 FABI Min. Wage Crimea
G 6: Google Trends – MII and Other Events
Source: Media Tenor
7
TO BE CONTINUEDThe debate about investment (in)security will continue as soon as the implementation of the Initiative commences. That effects can already be discerned today is not least due to companiespreferring to wait out periods of insecurity rather than making substantial investments which mayturn out to be wrong or misguided depending on the actual implementation of the MII. The problemis exacerbated by the fact that investments are usually to a large degree irreversible.
Klaus Abberger, Andreas Dibiasi, Michael Siegenthaler and Jan-Egbert Sturm (2014): The Swiss Mass Immigration Initiative: The impact of increased policy uncertainty on expectedfirm behaviour, KOF Studies, 53, Zurich. >>
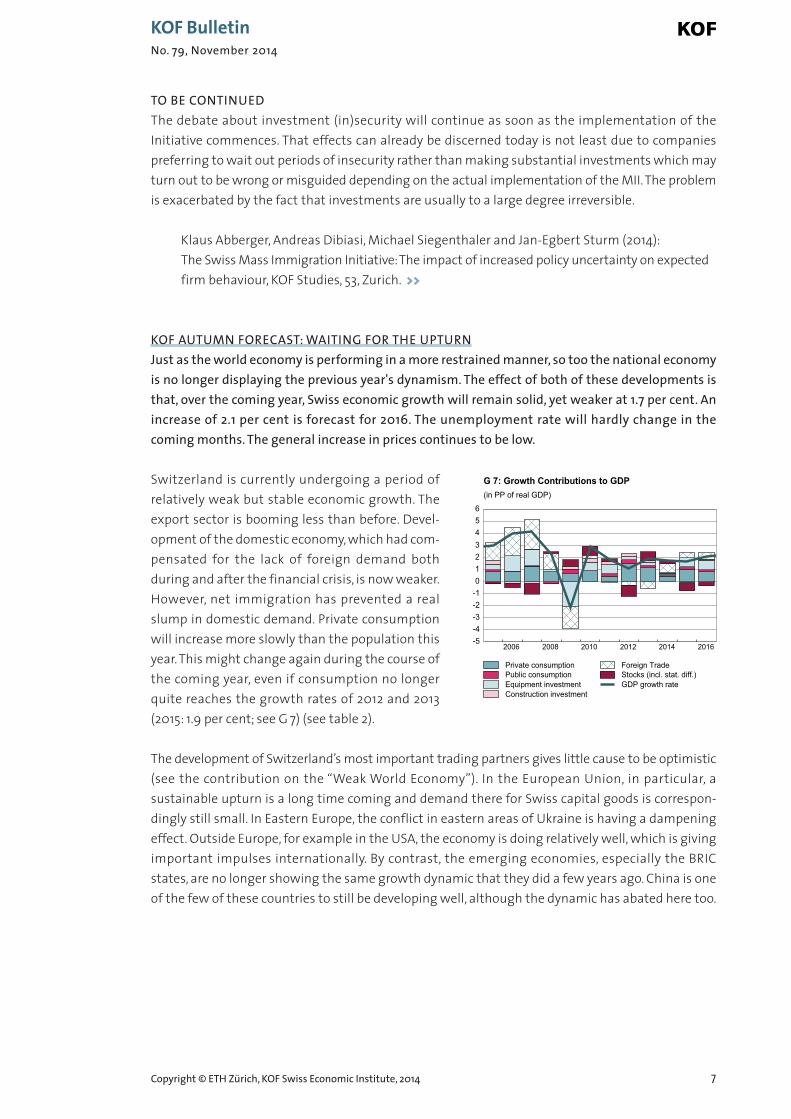
KOF AUTUMN FORECAST: WAITING FOR THE UPTURNJust as the world economy is performing in a more restrained manner, so too the national economyis no longer displaying the previous year's dynamism. The effect of both of these developments isthat, over the coming year, Swiss economic growth will remain solid, yet weaker at 1.7 per cent. Anincrease of 2.1 per cent is forecast for 2016. The unemployment rate will hardly change in the coming months. The general increase in prices continues to be low.
Switzerland is currently undergoing a period of relatively weak but stable economic growth. Theexport sector is booming less than before. Devel -opment of the domestic economy, which had com-pensated for the lack of foreign demand both during and after the financial crisis, is now weaker.However, net immigration has prevented a realslump in domestic demand. Private consumptionwill increase more slowly than the population thisyear. This might change again during the course ofthe coming year, even if consumption no longerquite reaches the growth rates of 2012 and 2013(2015: 1.9 per cent; see G 7) (see table 2).
The development of Switzerland’s most important trading partners gives little cause to be optimistic(see the contribution on the “Weak World Economy”). In the European Union, in particular, asustain able upturn is a long time coming and demand there for Swiss capital goods is correspon-dingly still small. In Eastern Europe, the conflict in eastern areas of Ukraine is having a dampeningeffect. Outside Europe, for example in the USA, the economy is doing relatively well, which is givingimportant impulses internationally. By contrast, the emerging economies, especially the BRICstates, are no longer showing the same growth dynamic that they did a few years ago. China is oneof the few of these countries to still be developing well, although the dynamic has abated here too.
Copyright © ETH Zürich, KOF Swiss Economic Institute, 2014
KOF BulletinNo. 79, November 2014
2006 2008 2010 2012 2014 2016-5-4-3-2-10123456
Private consumptionPublic consumptionEquipment investmentConstruction investment
Foreign TradeStocks (incl. stat. diff.)GDP growth rate
G 7: Growth Contributions to GDP(in PP of real GDP)
8
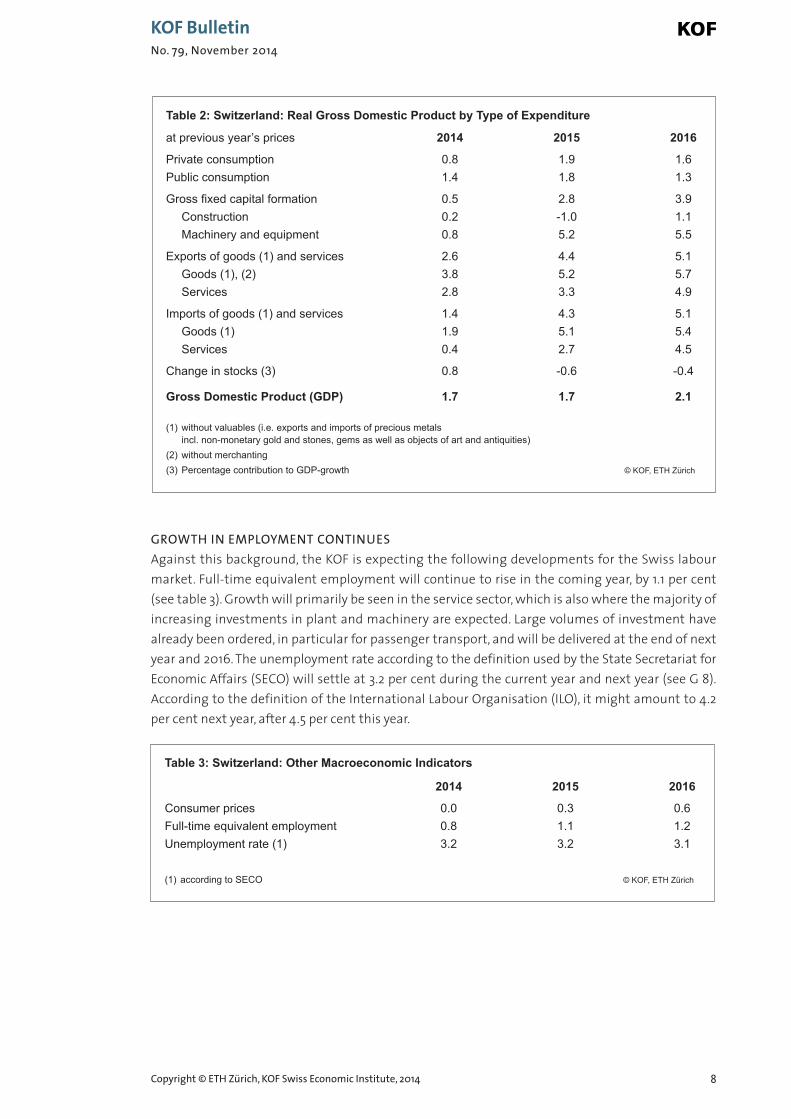
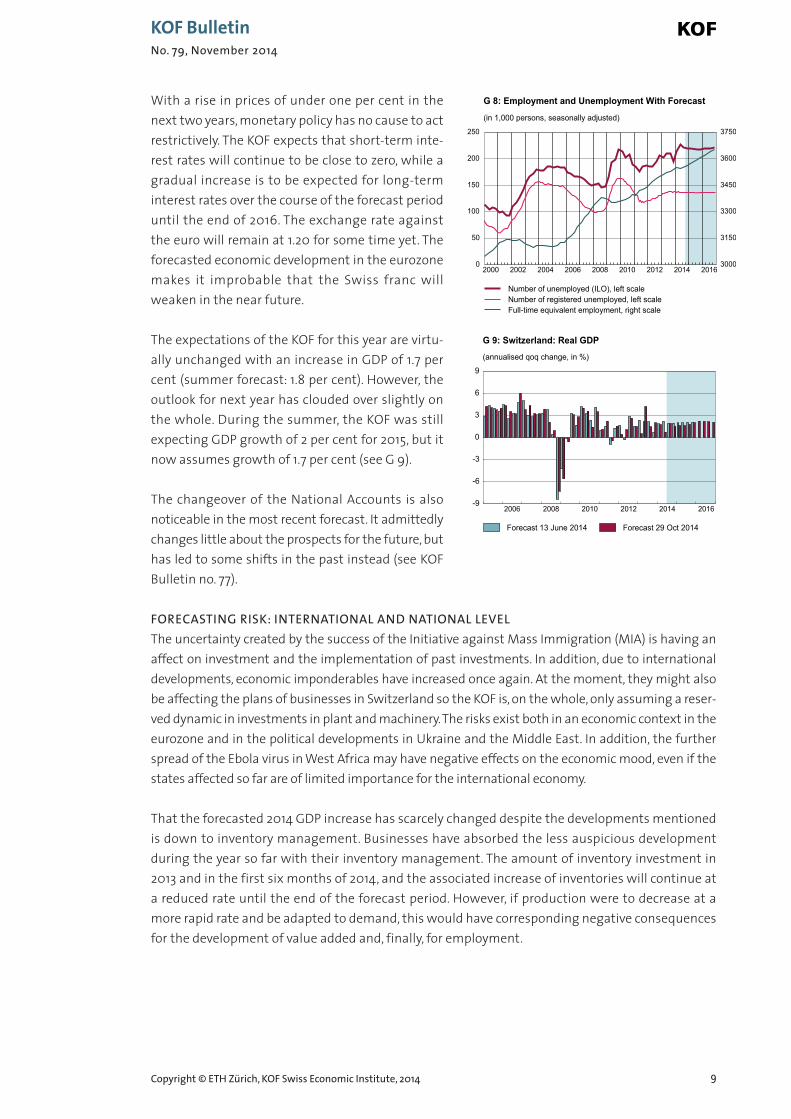
GROWTH IN EMPLOYMENT CONTINUESAgainst this background, the KOF is expecting the following developments for the Swiss labourmarket. Full-time equivalent employment will continue to rise in the coming year, by 1.1 per cent(see table 3). Growth will primarily be seen in the service sector, which is also where the majority ofincreasing investments in plant and machinery are expected. Large volumes of investment have already been ordered, in particular for passenger transport, and will be delivered at the end of nextyear and 2016. The unemployment rate according to the definition used by the State Secretariat forEconomic Affairs (SECO) will settle at 3.2 per cent during the current year and next year (see G 8). According to the definition of the International Labour Organisation (ILO), it might amount to 4.2per cent next year, after 4.5 per cent this year.
Copyright © ETH Zürich, KOF Swiss Economic Institute, 2014
KOF BulletinNo. 79, November 2014
Table 2: Switzerland: Real Gross Domestic Product by Type of Expenditure
at previous year’s prices 2014 2015 2016
Private consumption 0.8 1.9 1.6 Public consumption 1.4 1.8 1.3
Gross fixed capital formation 0.5 2.8 3.9 Construction 0.2 -1.0 1.1 Machinery and equipment 0.8 5.2 5.5
Exports of goods (1) and services 2.6 4.4 5.1 Goods (1), (2) 3.8 5.2 5.7 Services 2.8 3.3 4.9
Imports of goods (1) and services 1.4 4.3 5.1 Goods (1) 1.9 5.1 5.4 Services 0.4 2.7 4.5
Change in stocks (3) 0.8 -0.6 -0.4
Gross Domestic Product (GDP) 1.7 1.7 2.1
(1) without valuables (i.e. exports and imports of precious metals incl. non-monetary gold and stones, gems as well as objects of art and antiquities)
(2) without merchanting(3) Percentage contribution to GDP-growth © KOF, ETH Zürich
T
Table 3: Switzerland: Other Macroeconomic Indicators
2014 2015 2016
Consumer prices 0.0 0.3 0.6 Full-time equivalent employment 0.8 1.1 1.2 Unemployment rate (1) 3.2 3.2 3.1
(1) according to SECO © KOF, ETH Zürich
T
9
With a rise in prices of under one per cent in thenext two years, monetary policy has no cause to actrestrictively. The KOF expects that short-term inte-rest rates will continue to be close to zero, while agradual increase is to be expected for long-term interest rates over the course of the forecast perioduntil the end of 2016. The exchange rate againstthe euro will remain at 1.20 for some time yet. Theforecasted economic development in the eurozonemakes it improbable that the Swiss franc willweaken in the near future.
The expectations of the KOF for this year are virtu-ally unchanged with an increase in GDP of 1.7 percent (summer forecast: 1.8 per cent). However, theoutlook for next year has clouded over slightly onthe whole. During the summer, the KOF was stillexpecting GDP growth of 2 per cent for 2015, but itnow assumes growth of 1.7 per cent (see G 9).
The changeover of the National Accounts is also noticeable in the most recent forecast. It admittedlychanges little about the prospects for the future, buthas led to some shifts in the past instead (see KOFBulletin no. 77).
FORECASTING RISK: INTERNATIONAL AND NATIONAL LEVELThe uncertainty created by the success of the Initiative against Mass Immigration (MIA) is having anaffect on investment and the implementation of past investments. In addition, due to internationaldevelopments, economic imponderables have increased once again. At the moment, they might alsobe affecting the plans of businesses in Switzerland so the KOF is, on the whole, only assuming a reser-ved dynamic in investments in plant and machinery. The risks exist both in an economic context in theeurozone and in the political developments in Ukraine and the Middle East. In addition, the furtherspread of the Ebola virus in West Africa may have negative effects on the eco nomic mood, even if thestates affected so far are of limited importance for the international economy.
That the forecasted 2014 GDP increase has scarcely changed despite the developments mentionedis down to inventory management. Businesses have absorbed the less auspicious development during the year so far with their inventory management. The amount of inventory investment in2013 and in the first six months of 2014, and the associated increase of inventories will continue ata reduced rate until the end of the forecast period. However, if production were to decrease at amore rapid rate and be adapted to demand, this would have corresponding negative consequencesfor the development of value added and, finally, for employment.
Copyright © ETH Zürich, KOF Swiss Economic Institute, 2014
KOF BulletinNo. 79, November 2014
2006 2008 2010 2012 2014 2016-9
-6
-3
0
3
6
9
Forecast 13 June 2014 Forecast 29 Oct 2014
G 9: Switzerland: Real GDP(annualised qoq change, in %)
2000 2002 2004 2006 2008 2010 2012 2014 20160
50
100
150
200
250
3000
3150
3300
3450
3600
3750
Number of unemployed (ILO), left scaleNumber of registered unemployed, left scaleFull-time equivalent employment, right scale
G 8: Employment and Unemployment With Forecast
(in 1,000 persons, seasonally adjusted)
10
Future measures as part of the MIA are not taken into consideration to the full extent in the fore-cast since there are currently still too many uncertainties about when and in which way the Initia-tive will be implemented. However, existing uncertainty has been factored into the forecast. In itsforecast, the KOF also assumes the status quo, which implies that the “Ecopop Initiative” will be rejected. Adoption of the initiative would, in the short term, greatly increase uncertainty with regard to the future development of demand, recruitment costs and access to the internal EU mar-ket. Investments by businesses in Switzerland might be distinctly reduced as a result. Growth inSwitzerland in previous years was determined to a considerable extent by immigration, free move-ment of persons and bilateral agreements. Accordingly, it is practically impossible to make empiri-cally based, quantitative statements about the future development of the Swiss national economywhen initiatives are being adopted.
A WEAK GLOBAL ECONOMYIt is almost a truism, yet no less accurate for this reason: growth in the Swiss economy is signifi-cantly affected also by the international economy. What prospects are there for growth in the mostimportant economic regions around the world? Europe is growing rather weakly, whilst the USA isdoing well by contrast. Economic growth for the BRIC countries is a mixed bag.
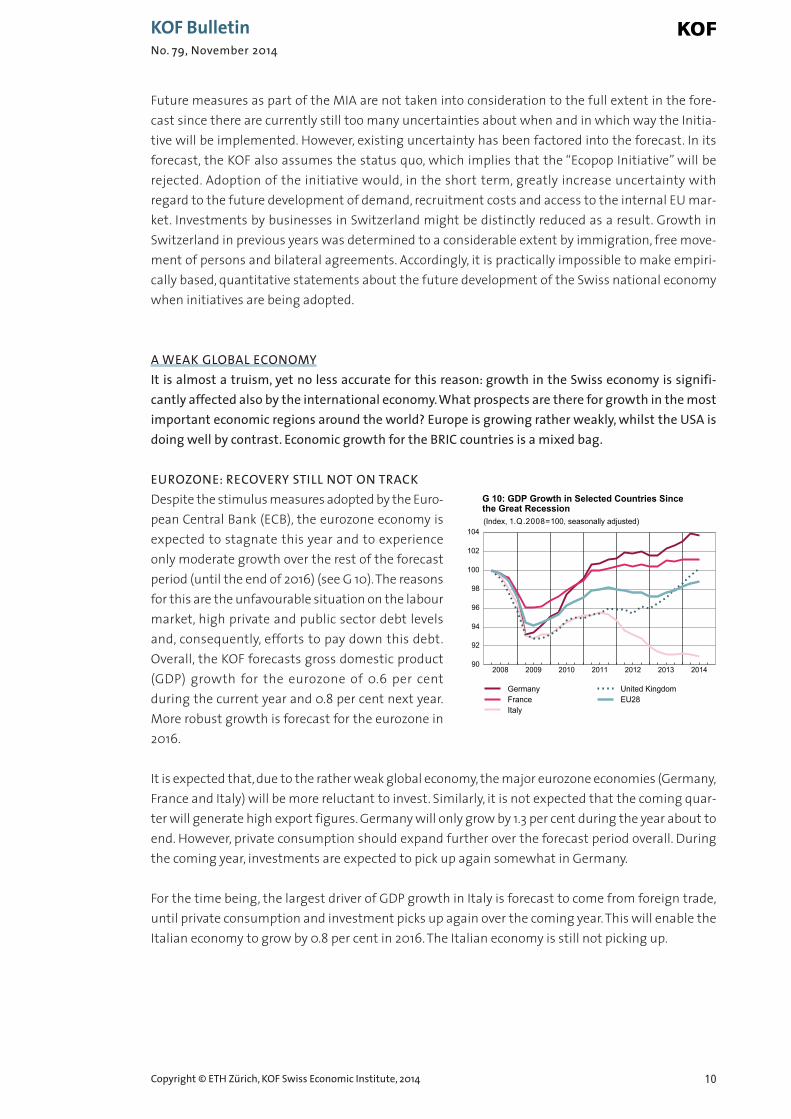
EUROZONE: RECOVERY STILL NOT ON TRACKDespite the stimulus measures adopted by the Euro-pean Central Bank (ECB), the eurozone economy isexpected to stagnate this year and to experienceonly moderate growth over the rest of the forecastperiod (until the end of 2016) (see G 10). The reasonsfor this are the unfavourable situation on the labourmarket, high private and public sector debt levelsand, consequently, efforts to pay down this debt.Overall, the KOF forecasts gross domestic product(GDP) growth for the eurozone of 0.6 per cent during the current year and 0.8 per cent next year.More robust growth is forecast for the eurozone in2016.
It is expected that, due to the rather weak global economy, the major eurozone economies (Germany,France and Italy) will be more reluctant to invest. Similarly, it is not expected that the coming quar-ter will generate high export figures. Germany will only grow by 1.3 per cent during the year about toend. However, private consumption should expand further over the forecast period overall. Duringthe coming year, investments are expected to pick up again somewhat in Germany.
For the time being, the largest driver of GDP growth in Italy is forecast to come from foreign trade,until private consumption and investment picks up again over the coming year. This will enable theItalian economy to grow by 0.8 per cent in 2016. The Italian economy is still not picking up.
Copyright © ETH Zürich, KOF Swiss Economic Institute, 2014
KOF BulletinNo. 79, November 2014
2008 2009 2010 2011 2012 2013 201490
92
94
96
98
100
102
104
GermanyFranceItaly
United KingdomEU28
G 10: GDP Growth in Selected Countries Since the Great Recession(Index, 1.Q.2008=100, seasonally adjusted)
France appears to be being weighed down by the weak economic environment and the generalslump in confidence. A recovery should take hold next year, although it will be weaker than in Germany with growth of 0.8 per cent. Even in 2016, the recovery in France will be trailing Germanywith GDP growth of 1.5 per cent.
By contrast, in the United Kingdom the economy has been expanding since the start of 2013, drivenon by the domestic market. The KOF expects production to increase by three per cent overall in2014. Production growth is forecast to slow to 2.4 per cent over the coming year, above all due tothe Bank of England’s restrictive monetary policy.
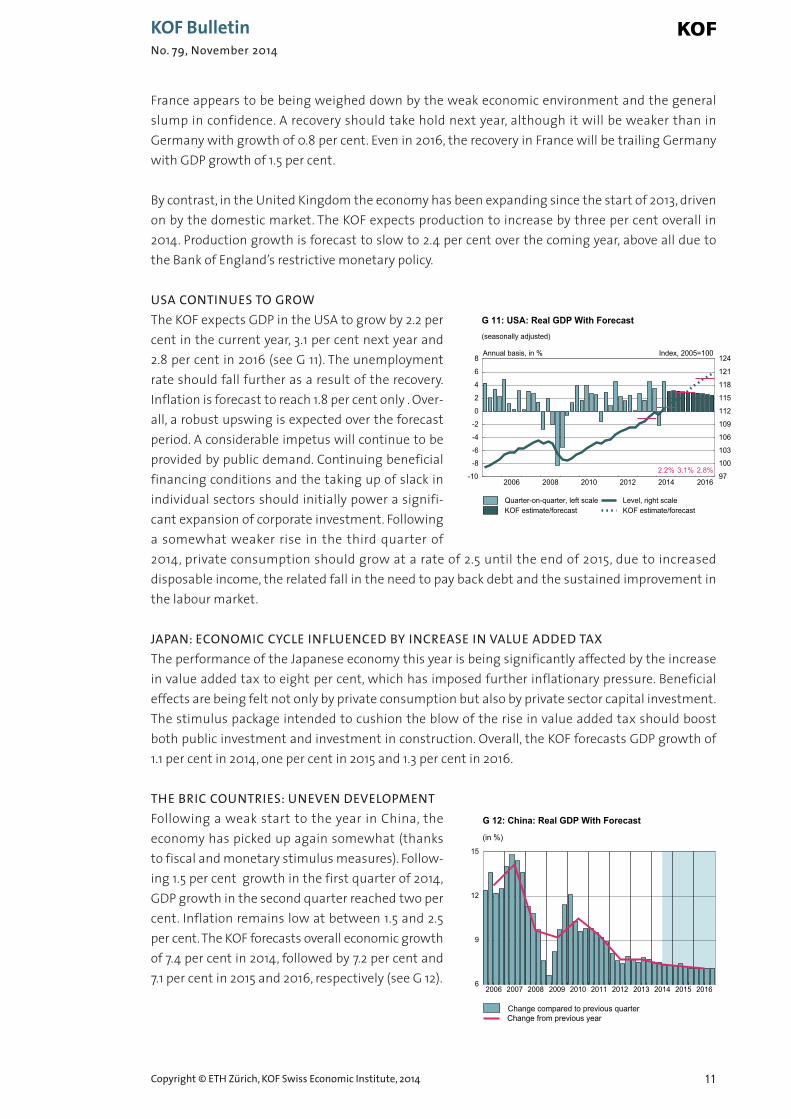
USA CONTINUES TO GROWThe KOF expects GDP in the USA to grow by 2.2 percent in the current year, 3.1 per cent next year and2.8 per cent in 2016 (see G 11). The unemploymentrate should fall further as a result of the recovery.Inflation is forecast to reach 1.8 per cent only . Over-all, a robust upswing is expected over the forecastperiod. A considerable impetus will continue to beprovided by public demand. Continuing beneficialfinancing conditions and the taking up of slack inindividual sectors should initially power a signifi-cant expansion of corporate investment. Followinga somewhat weaker rise in the third quarter of2014, private consumption should grow at a rate of 2.5 until the end of 2015, due to increaseddispos able income, the related fall in the need to pay back debt and the sustained improvement inthe labour market.
JAPAN: ECONOMIC CYCLE INFLUENCED BY INCREASE IN VALUE ADDED TAXThe performance of the Japanese economy this year is being significantly affected by the increasein value added tax to eight per cent, which has imposed further inflationary pressure. Beneficial effects are being felt not only by private consumption but also by private sector capital investment.The stimulus package intended to cushion the blow of the rise in value added tax should boostboth public investment and investment in construction. Overall, the KOF forecasts GDP growth of1.1 per cent in 2014, one per cent in 2015 and 1.3 per cent in 2016.
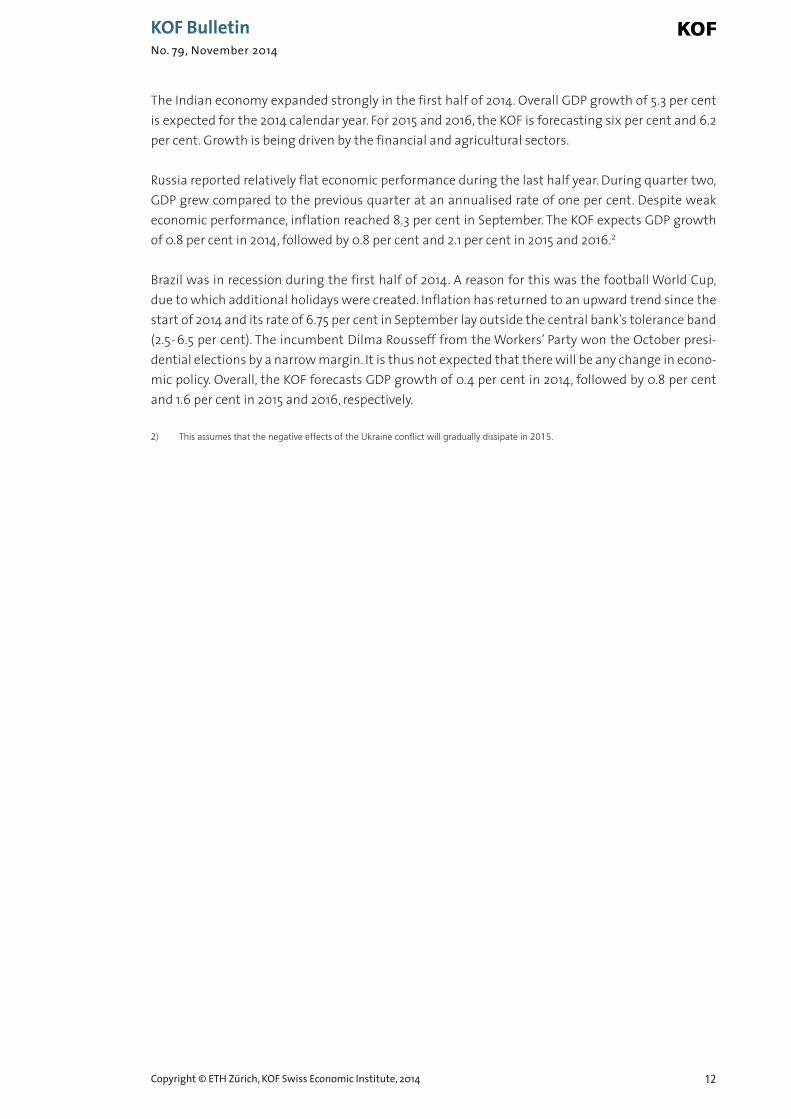
THE BRIC COUNTRIES: UNEVEN DEVELOPMENTFollowing a weak start to the year in China, theeconomy has picked up again somewhat (thanksto fiscal and monetary stimulus measures). Follow -ing 1.5 per cent growth in the first quarter of 2014,GDP growth in the second quarter reached two percent. Inflation remains low at between 1.5 and 2.5per cent. The KOF forecasts overall economic growthof 7.4 per cent in 2014, followed by 7.2 per cent and7.1 per cent in 2015 and 2016, respectively (see G 12).
11Copyright © ETH Zürich, KOF Swiss Economic Institute, 2014
KOF BulletinNo. 79, November 2014
2006 2008 2010 2012 2014 2016-10
-8
-6
-4
-2
0
2
4
6
8
97
100
103
106
109
112
115
118
121
124001=5002 ,xednI Annual basis, in %
2.2% 3.1% 2.8%
Quarter-on-quarter, left scaleKOF estimate/forecast
Level, right scaleKOF estimate/forecast
G 11: USA: Real GDP With Forecast(seasonally adjusted)
2006 2007 2008 2009 2010 2011 2012 2013 2014 2015 20166
9
12
15
Change from previous yearChange compared to previous quarter
G 12: China: Real GDP With Forecast
(in %)
12
The Indian economy expanded strongly in the first half of 2014. Overall GDP growth of 5.3 per centis expected for the 2014 calendar year. For 2015 and 2016, the KOF is forecasting six per cent and 6.2per cent. Growth is being driven by the financial and agricultural sectors.
Russia reported relatively flat economic performance during the last half year. During quarter two,GDP grew compared to the previous quarter at an annualised rate of one per cent. Despite weakeconomic performance, inflation reached 8.3 per cent in September. The KOF expects GDP growthof 0.8 per cent in 2014, followed by 0.8 per cent and 2.1 per cent in 2015 and 2016.2
Brazil was in recession during the first half of 2014. A reason for this was the football World Cup,due to which additional holidays were created. Inflation has returned to an upward trend since thestart of 2014 and its rate of 6.75 per cent in September lay outside the central bank’s tolerance band(2.5-6.5 per cent). The incumbent Dilma Rousseff from the Workers’ Party won the October presi-dential elections by a narrow margin. It is thus not expected that there will be any change in econo-mic policy. Overall, the KOF forecasts GDP growth of 0.4 per cent in 2014, followed by 0.8 per centand 1.6 per cent in 2015 and 2016, respectively.
2) This assumes that the negative effects of the Ukraine conflict will gradually dissipate in 2015.
Copyright © ETH Zürich, KOF Swiss Economic Institute, 2014
KOF BulletinNo. 79, November 2014
13
KOF INDICATORS <<
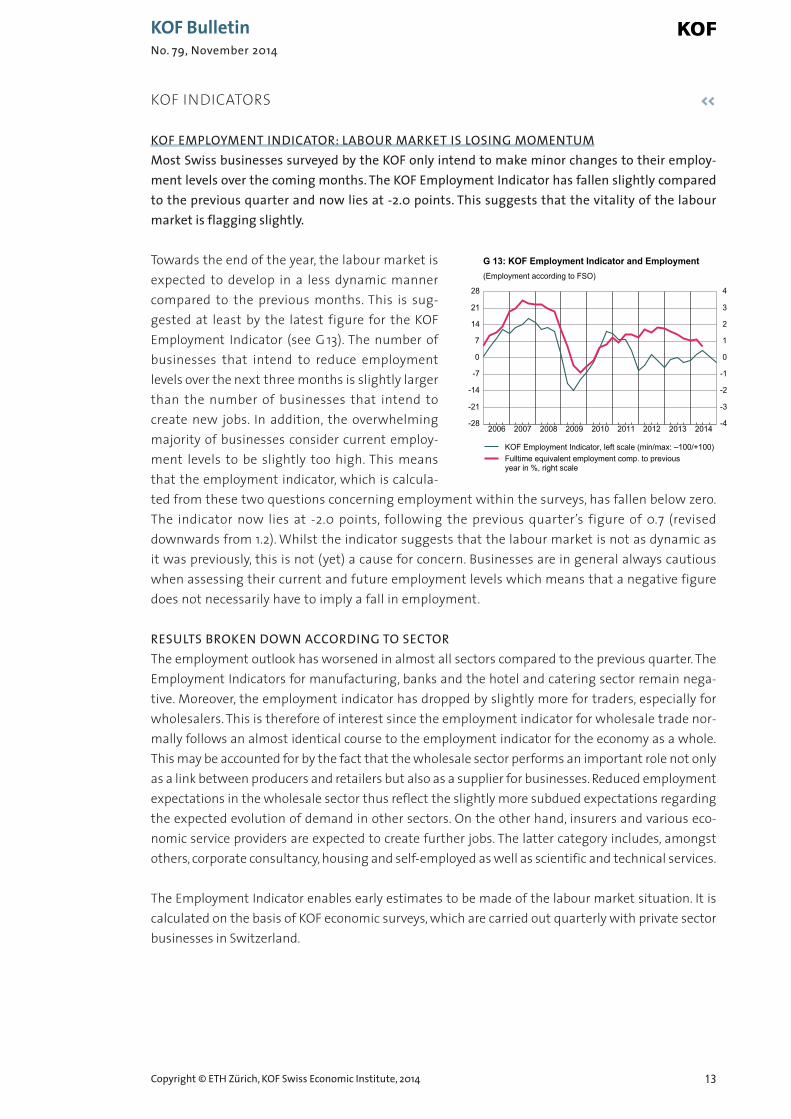
KOF EMPLOYMENT INDICATOR: LABOUR MARKET IS LOSING MOMENTUMMost Swiss businesses surveyed by the KOF only intend to make minor changes to their employ-ment levels over the coming months. The KOF Employment Indicator has fallen slightly comparedto the previous quarter and now lies at -2.0 points. This suggests that the vitality of the labourmarket is flagging slightly.
Towards the end of the year, the labour market isexpected to develop in a less dynamic mannercompared to the previous months. This is sug -gested at least by the latest figure for the KOF Employment Indicator (see G 13). The number ofbusinesses that intend to reduce employment levels over the next three months is slightly largerthan the number of businesses that intend tocreate new jobs. In addition, the overwhelmingmajority of businesses consider current employ-ment levels to be slightly too high. This meansthat the employment indicator, which is calcula-ted from these two questions concerning employment within the surveys, has fallen below zero.The indicator now lies at -2.0 points, following the previous quarter’s figure of 0.7 (reviseddownwards from 1.2). Whilst the indicator suggests that the labour market is not as dynamic asit was previously, this is not (yet) a cause for concern. Businesses are in general always cautiouswhen assessing their current and future employment levels which means that a negative figuredoes not necessarily have to imply a fall in employment.
RESULTS BROKEN DOWN ACCORDING TO SECTORThe employment outlook has worsened in almost all sectors compared to the previous quarter. TheEmployment Indicators for manufacturing, banks and the hotel and catering sector remain nega-tive. Moreover, the employment indicator has dropped by slightly more for traders, especially forwholesalers. This is therefore of interest since the employment indicator for wholesale trade nor-mally follows an almost identical course to the employment indicator for the economy as a whole.This may be accounted for by the fact that the wholesale sector performs an important role not onlyas a link between producers and retailers but also as a supplier for businesses. Reduced employmentexpectations in the wholesale sector thus reflect the slightly more subdued expectations regardingthe expected evolution of demand in other sectors. On the other hand, insurers and various eco -nomic service providers are expected to create further jobs. The latter category includes, amongst others, corporate consultancy, housing and self-employed as well as scientific and technical services.
The Employment Indicator enables early estimates to be made of the labour market situation. It iscalculated on the basis of KOF economic surveys, which are carried out quarterly with private sectorbusinesses in Switzerland.
Copyright © ETH Zürich, KOF Swiss Economic Institute, 2014
KOF BulletinNo. 79, November 2014
2006 2007 2008 2009 2010 2011 2012 2013 2014-28
-21
-14
-7
0
7
14
21
28
-4
-3
-2
-1
0
1
2
3
4
KOF Employment Indicator, left scale (min/max: –100/+100)Fulltime equivalent employment comp. to previous year in %, right scale
G 13: KOF Employment Indicator and Employment(Employment according to FSO)
14
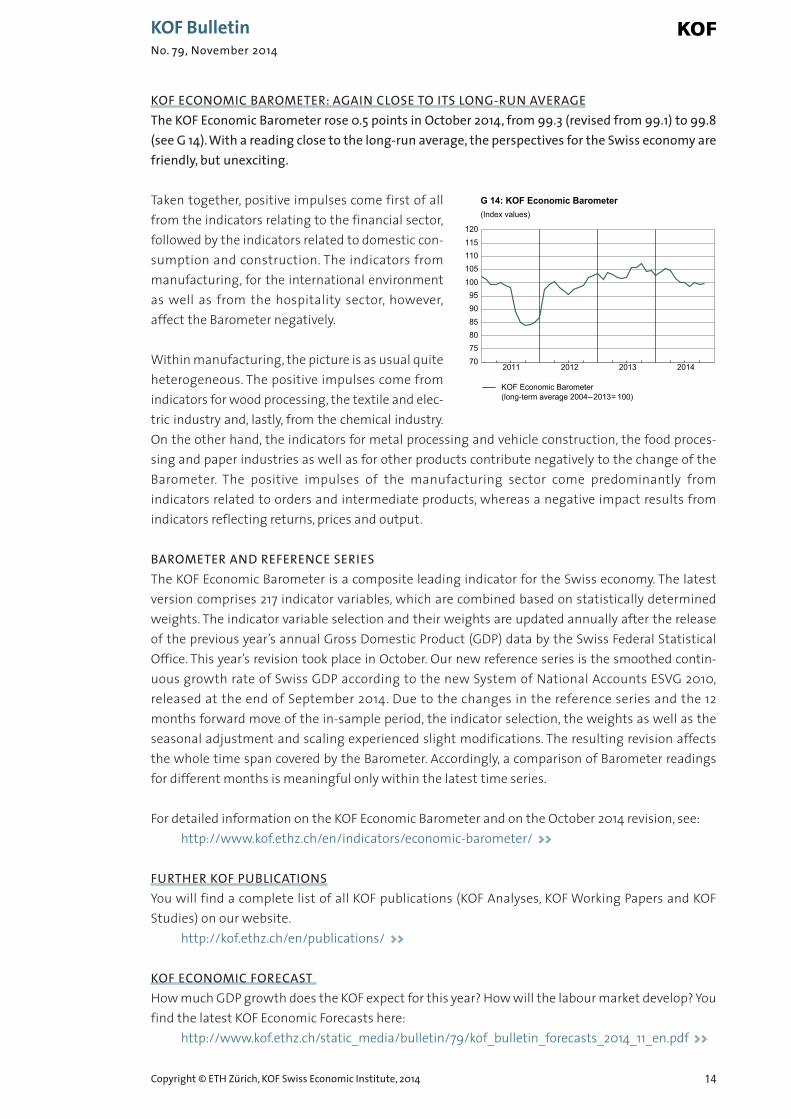
KOF ECONOMIC BAROMETER: AGAIN CLOSE TO ITS LONG-RUN AVERAGEThe KOF Economic Barometer rose 0.5 points in October 2014, from 99.3 (revised from 99.1) to 99.8(see G 14). With a reading close to the long-run average, the perspectives for the Swiss economy arefriendly, but unexciting.
Taken together, positive impulses come first of allfrom the indicators relating to the financial sector,followed by the indicators related to domestic con-sumption and construction. The indicators frommanufacturing, for the international environmentas well as from the hospitality sector, however, affect the Barometer negatively.
Within manufacturing, the picture is as usual quiteheterogeneous. The positive impulses come fromindicators for wood processing, the textile and elec-tric industry and, lastly, from the chemical industry.On the other hand, the indicators for metal processing and vehicle construction, the food proces-sing and paper industries as well as for other products contribute negatively to the change of theBarometer. The positive impulses of the manufacturing sector come predominantly from indicators related to orders and intermediate products, whereas a negative impact results from indicators reflecting returns, prices and output.
BAROMETER AND REFERENCE SERIESThe KOF Economic Barometer is a composite leading indicator for the Swiss economy. The latestversion comprises 217 indicator variables, which are combined based on statistically determinedweights. The indicator variable selection and their weights are updated annually after the releaseof the previous year’s annual Gross Domestic Product (GDP) data by the Swiss Federal Statistical Office. This year’s revision took place in October. Our new reference series is the smoothed contin -uous growth rate of Swiss GDP according to the new System of National Accounts ESVG 2010, released at the end of September 2014. Due to the changes in the reference series and the 12months forward move of the in-sample period, the indicator selection, the weights as well as theseasonal adjustment and scaling experienced slight modifications. The resulting revision affectsthe whole time span covered by the Barometer. Accordingly, a comparison of Barometer readingsfor different months is meaningful only within the latest time series.
For detailed information on the KOF Economic Barometer and on the October 2014 revision, see:http://www.kof.ethz.ch/en/indicators/economic-barometer/ >>
FURTHER KOF PUBLICATIONSYou will find a complete list of all KOF publications (KOF Analyses, KOF Working Papers and KOFStudies) on our website.
http://kof.ethz.ch/en/publications/ >>
KOF ECONOMIC FORECAST How much GDP growth does the KOF expect for this year? How will the labour market develop? Youfind the latest KOF Economic Forecasts here:
http://www.kof.ethz.ch/static_media/bulletin/79/kof_bulletin_forecasts_2014_11_en.pdf >>
Copyright © ETH Zürich, KOF Swiss Economic Institute, 2014
KOF BulletinNo. 79, November 2014
2011 2012 2013 2014707580859095
100105110115120
G 14: KOF Economic Barometer(Index values)
KOF Economic Barometer (long-term average 2004–2013= 100)
15
AGENDA <<
KOF EVENTS
KOF WirtschaftsforumThema «Innovationsökonomik»ETH Zurich, 14 November 2014
CER-ETH/KOF LectureProgram Evaluation with High-Dimensional DataProf. Christian Hansen, University of ChicagoETH Zurich, 28 November 2014
KOF Research Seminar:Social Networks and Tax Avoidance: Evidence from a Well-defined Norwegian Tax Shelter
Annette Alstadsæter, University of OsloETH Zurich, 12 November 2014
tbaTommaso Nanncini, Bocconi UniversityETH Zurich, 3 December 2014
Environmental Standards and Trade: Evidence from a Natural ExperimentPavel Chakraborty, University of OxfordETH Zurich, 10 December 2014
tbaHartmut Egger, University of BayreuthETH Zurich, 16 December 2014
Do Higher Corporate Taxes Reduce Wages? Micro Evidence from GermanyAndreas Peichl, University of Mannheim, ZERETH Zurich, 17 December 2014
www.kof.ethz.ch/de/veranstaltungen/k/kof-research-seminar/ >>
Copyright © ETH Zürich, KOF Swiss Economic Institute, 2014
KOF BulletinNo. 79, November 2014
16
KOF-ETH-UZH International Economic Policy Seminar:No Price Like Home: Global House Prices, 1870 – 2012
Thomas Steger, University of LeipzigETH Zurich, 13 November 2014
tbaRoland Hodler, University of St. GallenETH Zurich, 4 December 2014Alejandro Cunat, University of ViennaETH Zurich, 11 December 2014
Non-Tariff Barriers, Integration, and the Trans-Atlantic EconomyDoug Nelson – Tulane UniversityETH Zurich, 18 December 2014
www.kof.ethz.ch/de/veranstaltungen/k/kof-eth-uzh-seminar-in-international-economic-policy/ >>
KOF Media Agenda:www.kof.ethz.ch/en/medien/agenda/ >>
OTHER EVENTSSNB: Workshop on Foreign Currency Lending since the Financial Crisis
Zurich (Switzerland), 21 November 2014www.snb.ch/en/ifor/research/conf/id/sem_2014_11_21 >>
8th Annual Conference on the Political Economy of International OrganizationsBerlin (Germany), 12 – 14 February 2015www.peio.me/ >>
Young Swiss Economists Meeting – YSEM 2015(Call for Papers: 10 November 2014)Zurich (Switzerland), 12 – 13 February 2015www.kof.ethz.ch/de/veranstaltungen/d/251/ >>
Annual Meeting Swiss Society of Economics and StatisticsThe Solvency of Pension SystemsBasel (Switzerland), 2 – 3 June 2015sgvs.ch/ >>
Add event: www.kof.ethz.ch/publications/bulletin/event/index_en >>
Copyright © ETH Zürich, KOF Swiss Economic Institute, 2014
KOF BulletinNo. 79, November 2014
17
CUSTOMER SERVICE <<
The KOF Bulletin is a free service by e-mail which informs you about the latest developments relatingto the economy, our research and important events on a monthly basis. Register: www.kof.ethz.ch/publications/bulletin/registration/en >>
For previous KOF Bulletins, visit our archive:www.kof.ethz.ch/publications/bulletin/archive/en >>
Visit us at: www.kof.ethz.ch >>
You can also extract time series from our extensive database via the KOF data service (in German):www.kof.ethz.ch/de/ueber-uns/services/datenservice/ >>
The reproduction of this Bulletin (including excerpts thereof) is permitted only with the written permission of the publisher and with the citation of the original source.ISSN 1662-4289
IMPRINT <<
PUBLISHERETH Zurich, KOF Swiss Economic Institute, LEE G 116, Leonhardstrasse 21, 8092 ZurichPhone +41 44 632 53 44 I Fax +41 44 632 12 18 I [email protected]
EDITORIAL TEAMAnne Stücker I David [email protected]
NEXT PUBLICATION DATES5 December 2014 I 29 December 2014
Copyright © ETH Zürich, KOF Swiss Economic Institute, 2014
KOF BulletinNo. 79, November 2014
18Copyright © ETH Zürich, KOF Swiss Economic Institute, 2014
KOF BulletinNo. 79, November 2014
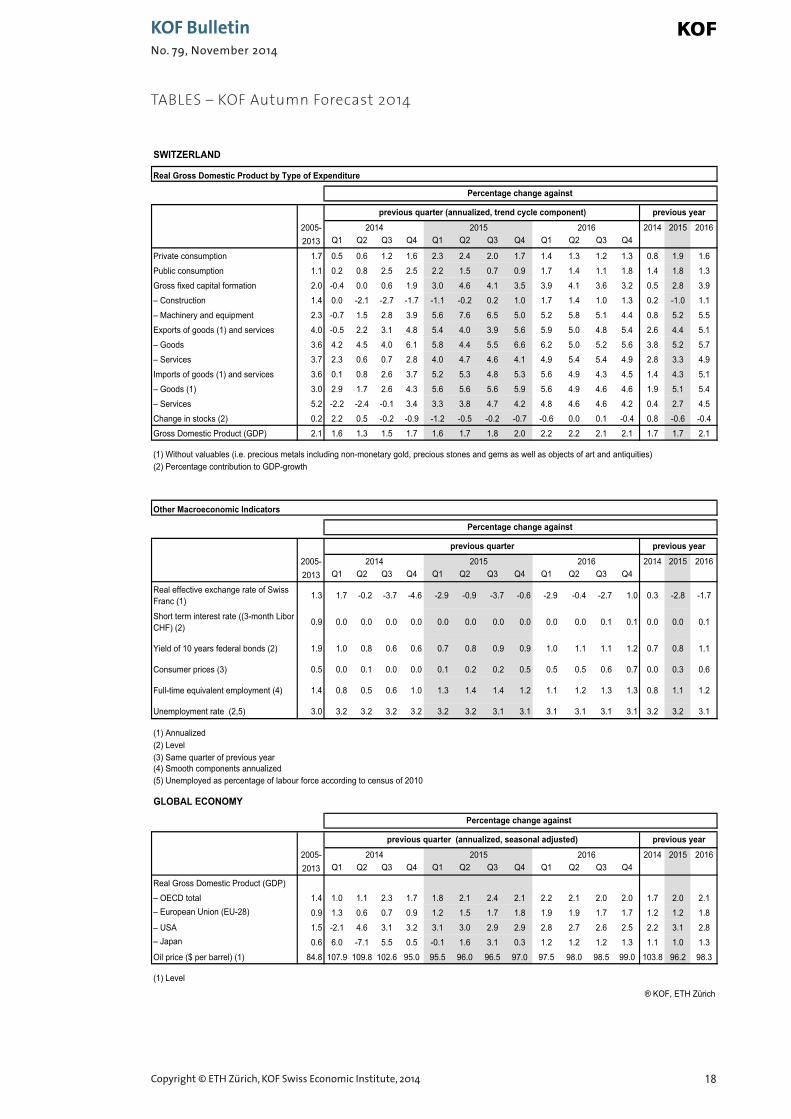
TABLES – KOF Autumn Forecast 2014
SWITZERLAND
Real Gross Domestic Product by Type of Expenditure
2005- 2014 2015 20162013 Q1 Q2 Q3 Q4 Q1 Q2 Q3 Q4 Q1 Q2 Q3 Q4
Private consumption 1.7 0.5 0.6 1.2 1.6 2.3 2.4 2.0 1.7 1.4 1.3 1.2 1.3 0.8 1.9 1.6
Public consumption 1.1 0.2 0.8 2.5 2.5 2.2 1.5 0.7 0.9 1.7 1.4 1.1 1.8 1.4 1.8 1.3
Gross fixed capital formation 2.0 -0.4 0.0 0.6 1.9 3.0 4.6 4.1 3.5 3.9 4.1 3.6 3.2 0.5 2.8 3.9
– Construction 1.4 0.0 -2.1 -2.7 -1.7 -1.1 -0.2 0.2 1.0 1.7 1.4 1.0 1.3 0.2 -1.0 1.1
– Machinery and equipment 2.3 -0.7 1.5 2.8 3.9 5.6 7.6 6.5 5.0 5.2 5.8 5.1 4.4 0.8 5.2 5.5
Exports of goods (1) and services 4.0 -0.5 2.2 3.1 4.8 5.4 4.0 3.9 5.6 5.9 5.0 4.8 5.4 2.6 4.4 5.1
– Goods 3.6 4.2 4.5 4.0 6.1 5.8 4.4 5.5 6.6 6.2 5.0 5.2 5.6 3.8 5.2 5.7
– Services 3.7 2.3 0.6 0.7 2.8 4.0 4.7 4.6 4.1 4.9 5.4 5.4 4.9 2.8 3.3 4.9
Imports of goods (1) and services 3.6 0.1 0.8 2.6 3.7 5.2 5.3 4.8 5.3 5.6 4.9 4.3 4.5 1.4 4.3 5.1
– Goods (1) 3.0 2.9 1.7 2.6 4.3 5.6 5.6 5.6 5.9 5.6 4.9 4.6 4.6 1.9 5.1 5.4
– Services 5.2 -2.2 -2.4 -0.1 3.4 3.3 3.8 4.7 4.2 4.8 4.6 4.6 4.2 0.4 2.7 4.5
Change in stocks (2) 0.2 2.2 0.5 -0.2 -0.9 -1.2 -0.5 -0.2 -0.7 -0.6 0.0 0.1 -0.4 0.8 -0.6 -0.4
Gross Domestic Product (GDP) 2.1 1.6 1.3 1.5 1.7 1.6 1.7 1.8 2.0 2.2 2.2 2.1 2.1 1.7 1.7 2.1
(1) Without valuables (i.e. precious metals including non-monetary gold, precious stones and gems as well as objects of art and antiquities) (2) Percentage contribution to GDP-growth
Other Macroeconomic Indicators
2005- 2014 2015 20162013 Q1 Q2 Q3 Q4 Q1 Q2 Q3 Q4 Q1 Q2 Q3 Q4
Real effective exchange rate of Swiss Franc (1) 1.3 1.7 -0.2 -3.7 -4.6 -2.9 -0.9 -3.7 -0.6 -2.9 -0.4 -2.7 1.0 0.3 -2.8 -1.7
Short term interest rate ((3-month Libor CHF) (2) 0.9 0.0 0.0 0.0 0.0 0.0 0.0 0.0 0.0 0.0 0.0 0.1 0.1 0.0 0.0 0.1
Yield of 10 years federal bonds (2) 1.9 1.0 0.8 0.6 0.6 0.7 0.8 0.9 0.9 1.0 1.1 1.1 1.2 0.7 0.8 1.1
Consumer prices (3) 0.5 0.0 0.1 0.0 0.0 0.1 0.2 0.2 0.5 0.5 0.5 0.6 0.7 0.0 0.3 0.6
Full-time equivalent employment (4) 1.4 0.8 0.5 0.6 1.0 1.3 1.4 1.4 1.2 1.1 1.2 1.3 1.3 0.8 1.1 1.2
Unemployment rate (2,5) 3.0 3.2 3.2 3.2 3.2 3.2 3.2 3.1 3.1 3.1 3.1 3.1 3.1 3.2 3.2 3.1
(1) Annualized(2) Level(3) Same quarter of previous year(4) Smooth components annualized(5) Unemployed as percentage of labour force according to census of 2010
GLOBAL ECONOMY
2005- 2014 2015 20162013 Q1 Q2 Q3 Q4 Q1 Q2 Q3 Q4 Q1 Q2 Q3 Q4
Real Gross Domestic Product (GDP)
– OECD total 1.4 1.0 1.1 2.3 1.7 1.8 2.1 2.4 2.1 2.2 2.1 2.0 2.0 1.7 2.0 2.1– European Union (EU-28) 0.9 1.3 0.6 0.7 0.9 1.2 1.5 1.7 1.8 1.9 1.9 1.7 1.7 1.2 1.2 1.8
– USA 1.5 -2.1 4.6 3.1 3.2 3.1 3.0 2.9 2.9 2.8 2.7 2.6 2.5 2.2 3.1 2.8– Japan 0.6 6.0 -7.1 5.5 0.5 -0.1 1.6 3.1 0.3 1.2 1.2 1.2 1.3 1.1 1.0 1.3
Oil price ($ per barrel) (1) 84.8 107.9 109.8 102.6 95.0 95.5 96.0 96.5 97.0 97.5 98.0 98.5 99.0 103.8 96.2 98.3
(1) Level
® KOF, ETH Zürich
Percentage change against
previous quarter (annualized, seasonal adjusted) previous year2014 2015 2016
Percentage change against
previous quarter previous year2014 2015 2016
Percentage change against
previous quarter (annualized, trend cycle component)2014 2015 2016
previous year