Embed Size (px)
Citation preview

Kolkata Traffic PoliceLogistics & Road Safety
Sumit Kumar IPS
Deputy Commissioner of Police
Traffic Department, Kolkata

Period Fatal Non-Fatal
2014 450 3604
2015 422 3317
2016 407 3182
2016
(till 31st July)239 1917
2017 329 2559
2017
(till 31st July)200 1731
2018
(till 31st July)173 1259
Comparative Fatal – Non Fatal

AJC Bose Road Flyover CGR Road Flyover Maa Flyover Vidyasagar Setu
2016 5 2 7 12
2017 0 0 2 1
2018 1 0 2 2
0
2
4
6
8
10
12
14
Fatal Accidents on Flyovers
2016
2017
2018

% of Road Users who are Victims of RTAs
2 Wheeler
users
28%
Oth…
Passenger
12%
Pedestrian
51%
Slow Moving
Users
5%
More that 50% of the victims are PEDESTRIANS

Installation of Speed Cameras and
modern equipments
High speed corridors where Speed Cameras and
Speed Signages were placed, which led to massive
reduction in RTAs
Contactless Prosecution with instant messaging strategy works.
Can be made more effective by improving database
of actual vehicle owners and mobile numbers

Ambulan
ce
1%
Auto
2%
Goods
Vehicle
25%
Bus
27%
Taxi/ L-
Taxi
6%
Private
Car
10%
2
wheeler
15%
Unknown
14%
% of all
vehicles
involved
in RTAs
Buses comprise 1% of the total vehicles registered
They cause 27% of all RTAs
Goods Vehicle comprise 8% of the total vehicles registered
They cause 25% of all RTAs
2 Wheelers are responsible for
15% of all RTAs
Auto
2%
Goods
Vehicle
8%
Bus
1%
Taxi/L-
Taxi
2%
Private
Car
22%
2 wheeler
65%
% of all
vehicles
registered
around
Kolkata

% of Offending Vehicles causing RTAs
Bigger vehicles - BUSES & GOODS VEHICLES contribute to more than 50% of RTAs
Reason Remedy
1. Buses compete for passengers2. Poor compliance to payment of fine3. Blind spot issues4. Vehicle Fitness issues (Poor Control)5. Buses not stopping at designated
places6. Pedestrian management
1. Enforcement (Sending violation messages to drivers. Reward Punishment)
2. Linking of FC to clearing pending cases3. PIS at Designated Bus stops4. Putting up Boom Barriers etc5. Education of Drivers
Bigger vehicles have a BLIND SPOT to the
left of the driver
Pilot Project on KP vehicles to have
CONVEX MIRRORS or CAMERA to aid the
vision of the drivers

27 2631
2621
42
56
42
5448
59
70
5861
6468 69
87
0
10
20
30
40
50
60
70
80
90
100
00:00 - 04:00 04:01 - 08:00 08:01 - 12:00 12:01 - 16:00 16:01 - 20:00 20:01 - 00:00
Trend in RTAs at different hours of the day
2018 2017 2016

Initiatives taken to curb RTAs
Education
Emergency Response
Enforcement
Engineering

Education
Mass education programme – Jaaago Kolkata
Total number of Schools 366
Total number of School Students 96,932
Total number of Traffic Guard 25
Total number of Drivers 86,486
Total School Session conducted in School 1,860
Total Drivers Session conducted in Traffic
Guards6,622
Driver Type Enrolment Count
App Cabs 10,451
Auto Driver 15,074
Bus Driver 2,499
Taxi Driver 16,060
Truck (HGV) 2,514
Truck (LGV) 18.117
Truck (MGV) 2,916
Truck Driver 2,673
Two Wheeler 16,182

Emergency Response
KARMA
Kolkata Accident Rescue And Medical Assistance
➢ 29 Ambulances
➢ 15 strategic locations
➢ 24 X 7
Person
Attended
Released After
First Aid
Admitted to
Hospital
Patients Transported
in addition to the call
2010 - 2012 3,280 421 2,859
2012 2,570 458 2,112
2013 2,965 531 2,434
2014 2,752 404 2,348
2015 2,538 386 2,152
2016 3,388 952 2,740 304
2017 3,961 1,072 3,237 348
2018
(till 31.07.18)2047 536 1643 138
Total 23,495 4,760 19,479 790
Response

Period183 MV Act
(Over Speeding)
185 MV Act
(Drunken Driving)
2015 7,309 1,755
2016 16,583 1,829
2017
01/01/17
to
30/04/17
44,511
3,88701/05/17
to
31/12/17
4,71,433
Speed Signage & Camera
Installed for the first time in 2017
2018
(31st July)3,45,288 2,681
Enforcement
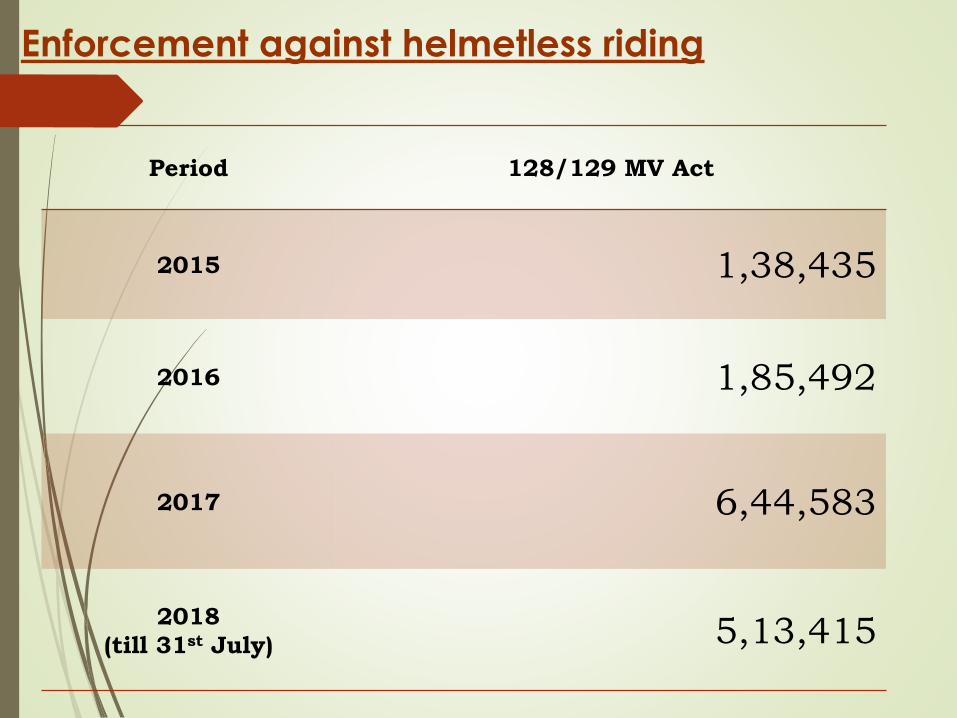
Enforcement against helmetless riding
Period 128/129 MV Act
2015 1,38,435
2016 1,85,492
2017 6,44,583
2018
(till 31st July) 5,13,415

Suspension of Driving Licence
D/Ls suspension for Over speeding >100
20172018
(31st July)
Total DL Suspended 2456 1231
Notices issued for over
speeding9588 5090

Engineering Interventions
Creation of Bus Lanes using Spring posts
Putting up Median Dividers
Identification of engineering issues with vehicles
Conducting Pilot with cheap retrofit solutions and
proposing policy intervention.
Passenger Information System to encourage
passengers to board/get down at designated bus
stops
Boom Barriers for safe crossing from designated points

Pedestrian Management
Boom Barriers - Pilot Project
Pilot locations
AJC Bose Rd – Chowringhee Rd X-ing – Exide X-
ing
Strand Rd – Raja Woodmunt Street (Burrabazar)
Sync with Pedestrian Green Time
Foot Over Bridges
Working closely with allied agencies – KMC/
KMDA etc. for setting up Foot Over Bridges
with Escalators at both ends, for convenience
of passengers


Centrally Managed Network Signalling System
Signal on
Road
Signal on
Road
Signal on
Road
Central
Command &
Control
Live Traffic Data
Time offset
Suggestion
PVD – Database of Actual Vehicle owners mapped with
their mobile numbers need to be cleaned up. Simplifying
vehicle transfer procedure
Fitness for Buses & other public carriers – good condition
Tyre, Brake etc.
Installation of convex mirror/CCTV in front of driver may be
useful to make viewable the blind spots.
In order to avoid competition in buses, the number of buses
plying on a route need to be rationalised depending on
the demand along that route.