Embed Size (px)
Citation preview
KONE CMD 2017
Driving shareholder valueILKKA HARA, CFO
SEPTEMBER 29, 2017
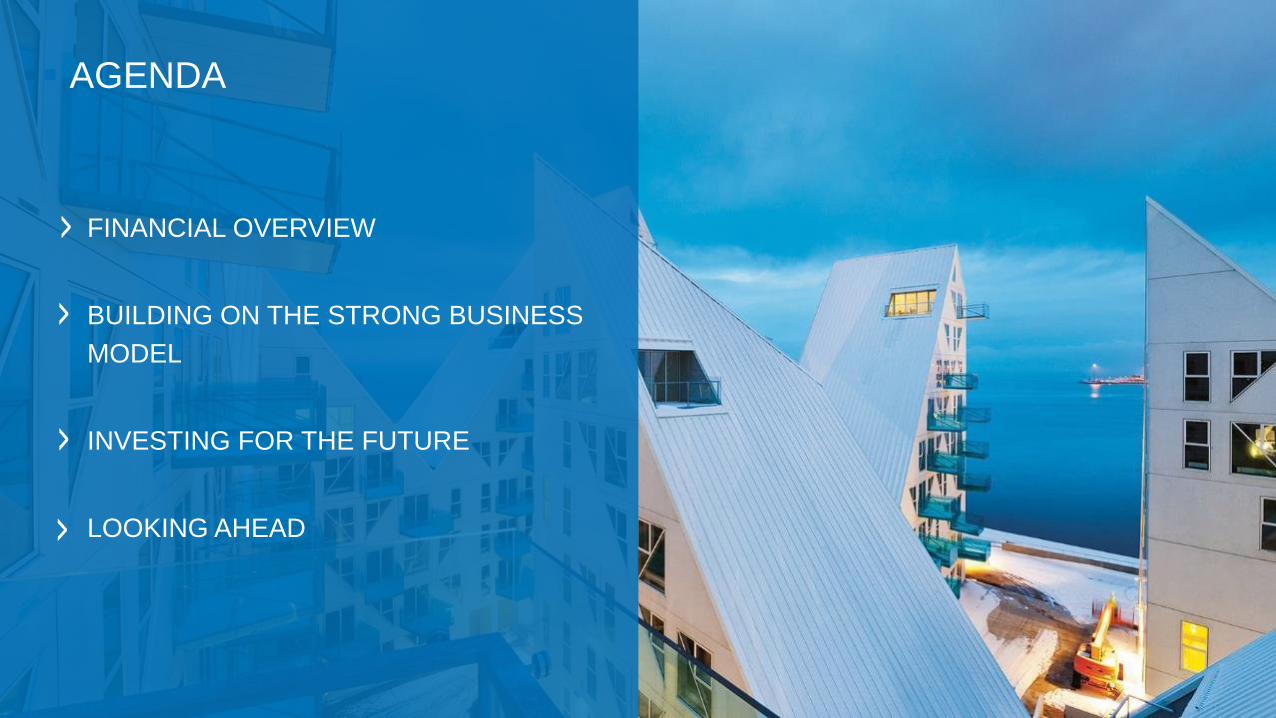
FINANCIAL OVERVIEW
BUILDING ON THE STRONG BUSINESS
MODEL
INVESTING FOR THE FUTURE
LOOKING AHEAD
▪ AGENDA
September 29, 2017 Ilkka Hara | KONE Capital Markets Day | © KONE Corporation3
Financial overview
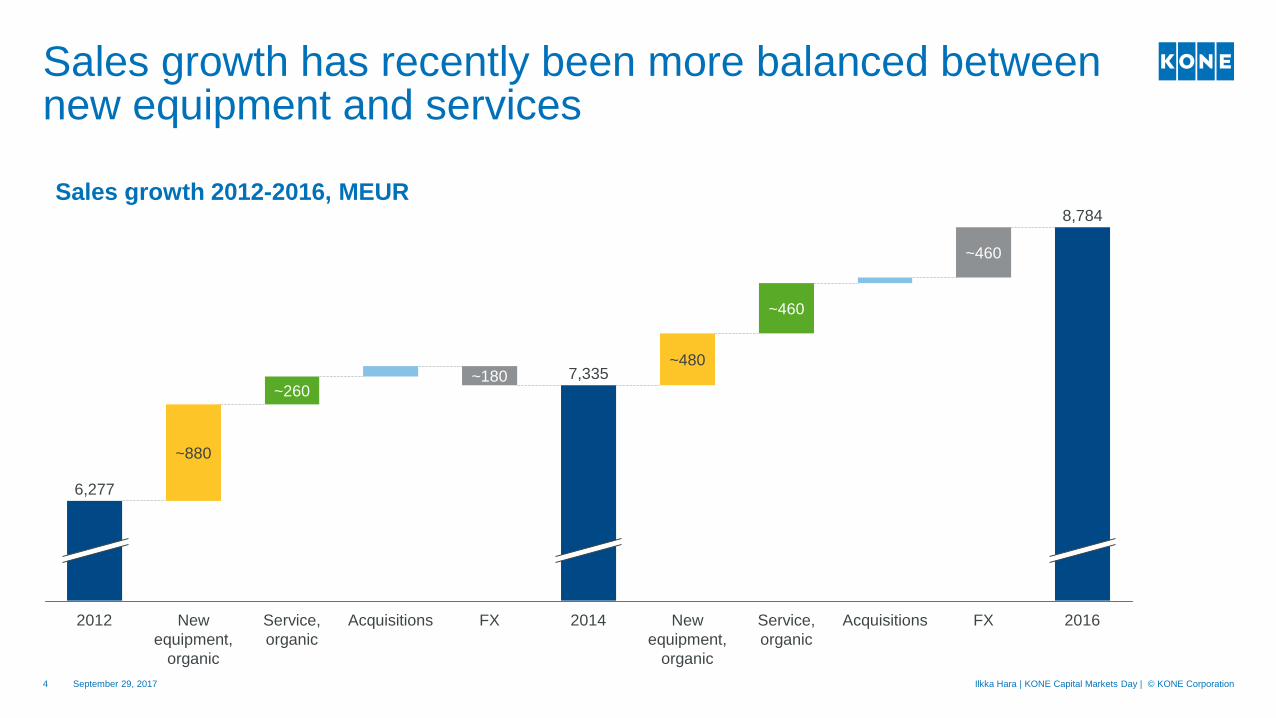
Sales growth has recently been more balanced between new equipment and services
September 29, 20174 Ilkka Hara | KONE Capital Markets Day | © KONE Corporation
Sales growth 2012-2016, MEUR
2016
8,784
FX
~460
AcquisitionsService,
organic
~460
New
equipment,
organic
~480
2014
7,335
FX
~180
AcquisitionsService,
organic
~260
New
equipment,
organic
~880
2012
6,277
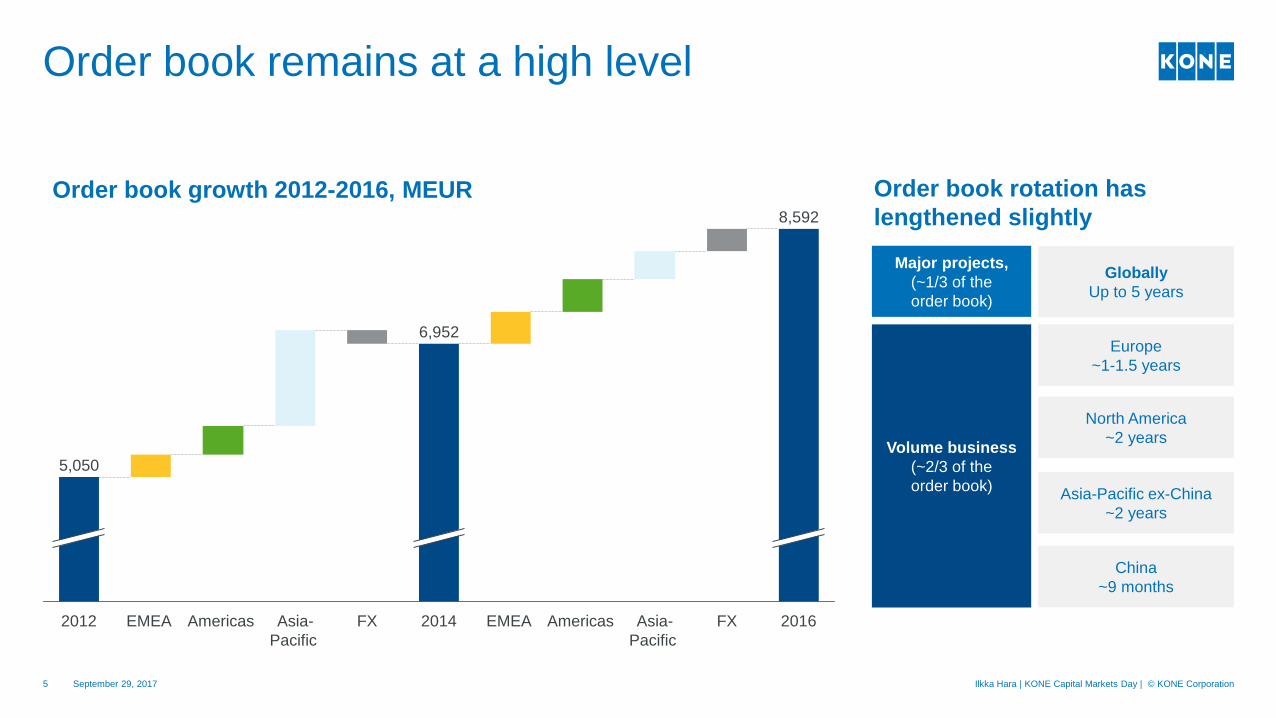
Order book remains at a high level
September 29, 2017 Ilkka Hara | KONE Capital Markets Day | © KONE Corporation5
Order book rotation has
lengthened slightly
Major projects,
(~1/3 of the
order book)
Globally
Up to 5 years
Volume business
(~2/3 of the
order book)
Europe
~1-1.5 years
North America
~2 years
Asia-Pacific ex-China
~2 years
China
~9 months
Order book growth 2012-2016, MEUR8,592
FXAsia-
Pacific
AmericasEMEA2014
6,952
FXAsia-
Pacific
AmericasEMEA2012
5,050
2016
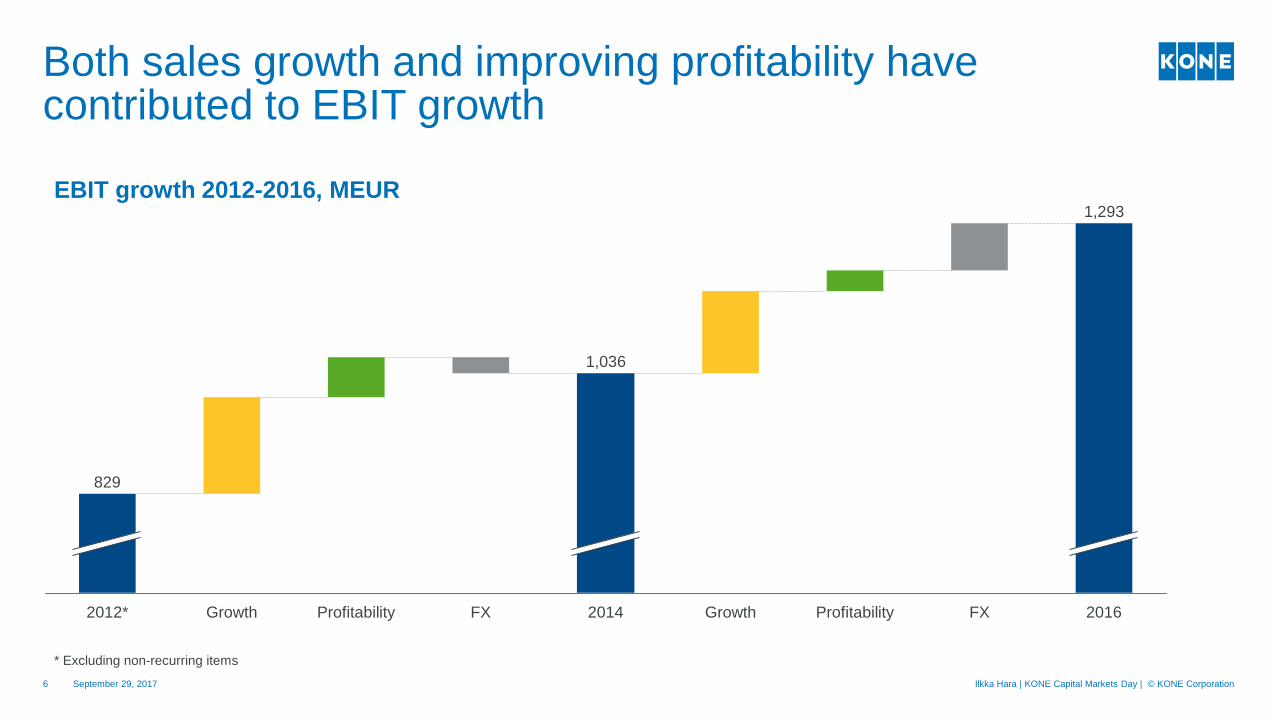
Both sales growth and improving profitability have contributed to EBIT growth
September 29, 20176 Ilkka Hara | KONE Capital Markets Day | © KONE Corporation
EBIT growth 2012-2016, MEUR
2016
1,293
FXProfitabilityGrowth2014
1,036
FXProfitabilityGrowth2012*
829
* Excluding non-recurring items
September 29, 2017 Ilkka Hara | KONE Capital Markets Day | © KONE Corporation7
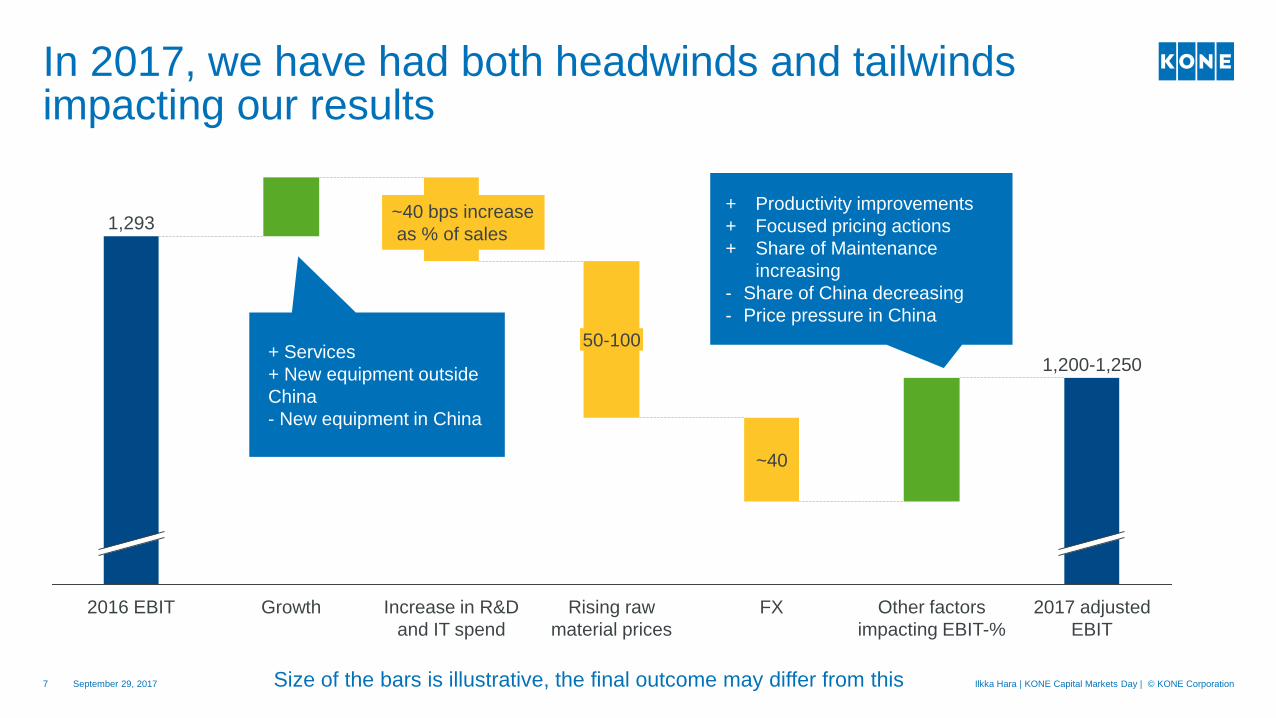
In 2017, we have had both headwinds and tailwinds impacting our results
1,293
FX
~40
2017 adjusted
EBIT
1,200-1,250
Increase in R&D
and IT spend
Other factors
impacting EBIT-%
2016 EBIT Growth
50-100
Rising raw
material prices
+ Productivity improvements
+ Focused pricing actions
+ Share of Maintenance
increasing
- Share of China decreasing
- Price pressure in China
+ Services
+ New equipment outside
China
- New equipment in China
Size of the bars is illustrative, the final outcome may differ from this
~40 bps increase
as % of sales
Accounts receivable
Inventories-Advance payments
Net working capital continues to contribute positively to cash flow
September 29, 20178 Ilkka Hara | KONE Capital Markets Day | © KONE Corporation
Cash flow after investing activities
2012-2016, MEUR
-749
-439
2012 2016
-1,054
2014
Net working capital 2012-2016,
MEUR
Accounts payable
Other
-128-108 -206
-331
226
-116-113-82
110185
870
1,120
2012
706
2016
981
1,400
2014
990
-52-98
Acquisitions
Other incl. financing items and taxes
Capex
Change in NWC
EBITDA
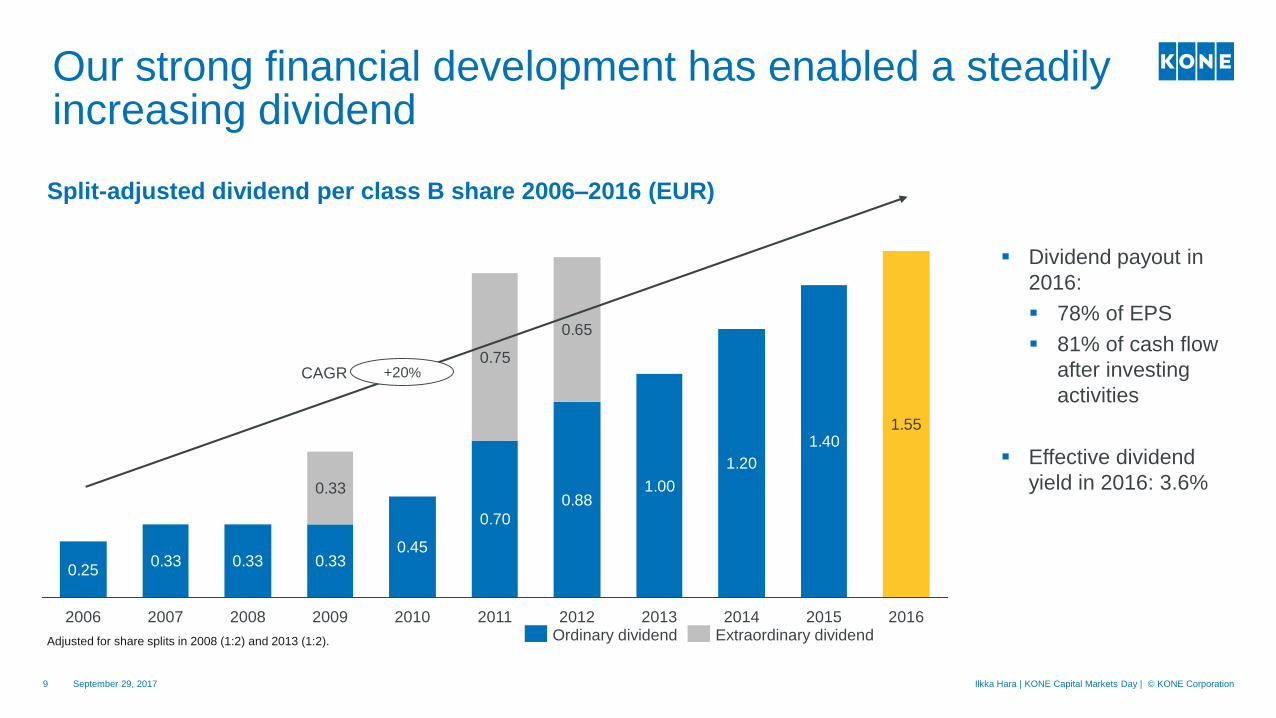
Split-adjusted dividend per class B share 2006–2016 (EUR)
Adjusted for share splits in 2008 (1:2) and 2013 (1:2).
Our strong financial development has enabled a steadily increasing dividend
September 29, 20179
▪ Dividend payout in
2016:
▪ 78% of EPS
▪ 81% of cash flow
after investing
activities
▪ Effective dividend
yield in 2016: 3.6%
0.250.33 0.33 0.33
0.45
0.70
0.881.00
1.20
1.40
0.33
0.75
0.65
1.55
20132012201120102009 201620152014200820072006
Ilkka Hara | KONE Capital Markets Day | © KONE Corporation
Extraordinary dividendOrdinary dividend
CAGR +20%
September 29, 2017 Ilkka Hara | KONE Capital Markets Day | © KONE Corporation10
Building on the strong business model
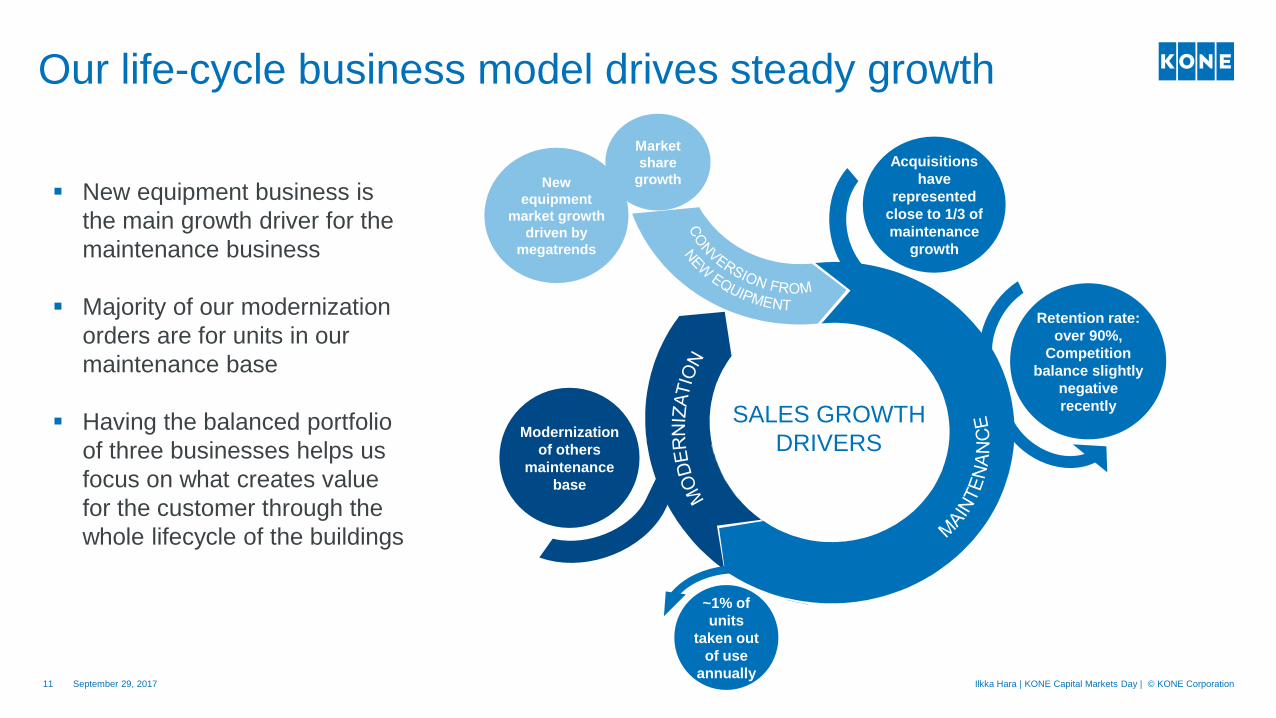
Our life-cycle business model drives steady growth
Ilkka Hara | KONE Capital Markets Day | © KONE Corporation11 September 29, 2017
Acquisitions
have
represented
close to 1/3 of
maintenance
growth
Retention rate:
over 90%,
Competition
balance slightly
negative
recently
Modernization
of others
maintenance
base
SALES GROWTH
DRIVERS
~1% of
units
taken out
of use
annually
Market
share
growthNew
equipment
market growth
driven by
megatrends
▪ New equipment business is
the main growth driver for the
maintenance business
▪ Majority of our modernization
orders are for units in our
maintenance base
▪ Having the balanced portfolio
of three businesses helps us
focus on what creates value
for the customer through the
whole lifecycle of the buildings
September 29, 2017 Ilkka Hara | KONE Capital Markets Day | © KONE Corporation12
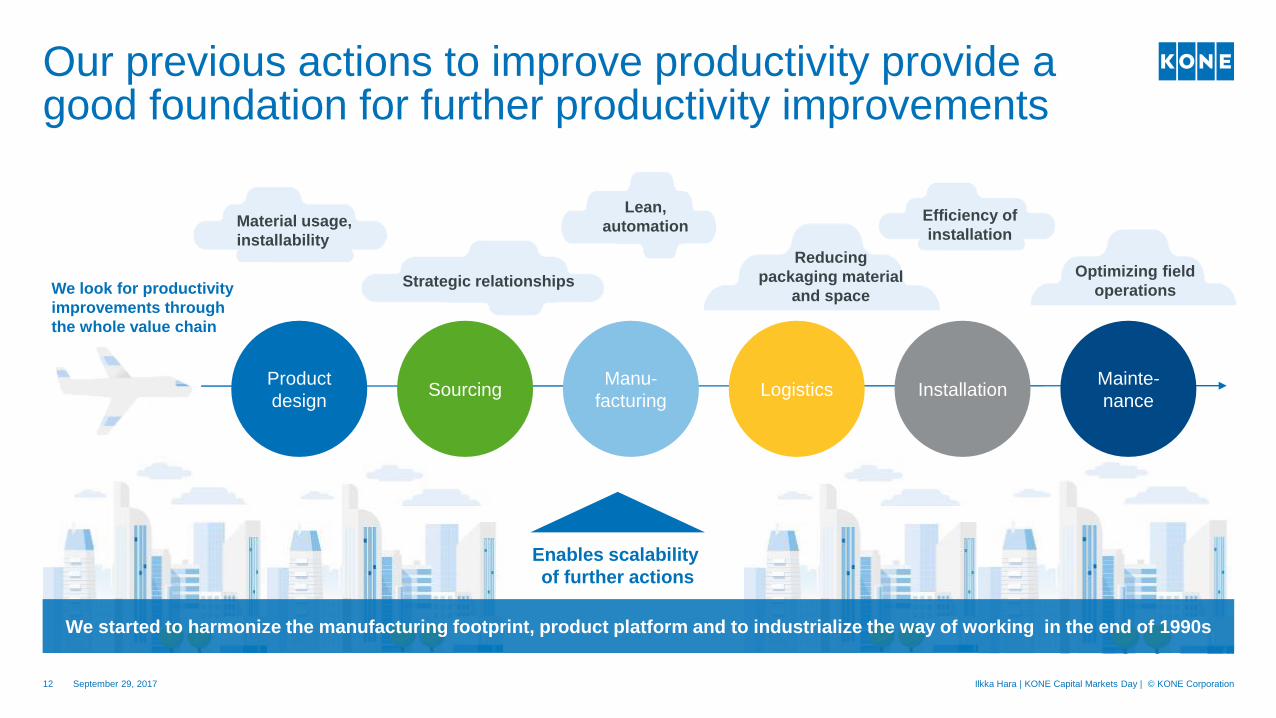
Our previous actions to improve productivity provide a good foundation for further productivity improvements
We look for productivity
improvements through
the whole value chain
Product
designSourcing
Manu-
facturingLogistics Installation
Mainte-
nance
Strategic relationships
Material usage,
installability
Lean,
automation
Reducing
packaging material
and space
Efficiency of
installation
Optimizing field
operations
We started to harmonize the manufacturing footprint, product platform and to industrialize the way of working in the end of 1990s
Enables scalability
of further actions
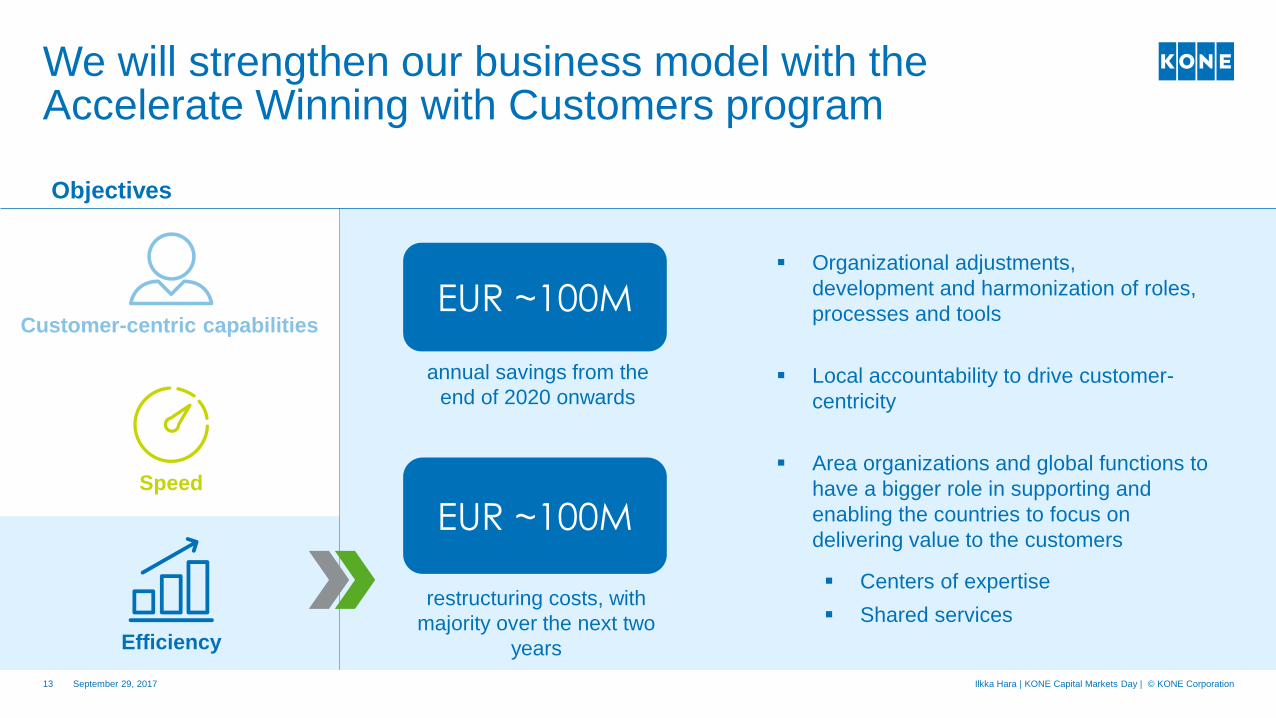
We will strengthen our business model with the Accelerate Winning with Customers program
▪ Organizational adjustments,
development and harmonization of roles,
processes and tools
▪ Local accountability to drive customer-
centricity
▪ Area organizations and global functions to
have a bigger role in supporting and
enabling the countries to focus on
delivering value to the customers
▪ Centers of expertise
▪ Shared services
EUR ~100M
annual savings from the
end of 2020 onwards
EUR ~100M
restructuring costs, with
majority over the next two
years
Objectives
Efficiency
Customer-centric capabilities
Speed
Ilkka Hara | KONE Capital Markets Day | © KONE Corporation13 September 29, 2017
Investing for the future
Ilkka Hara | KONE Capital Markets Day | © KONE Corporation15
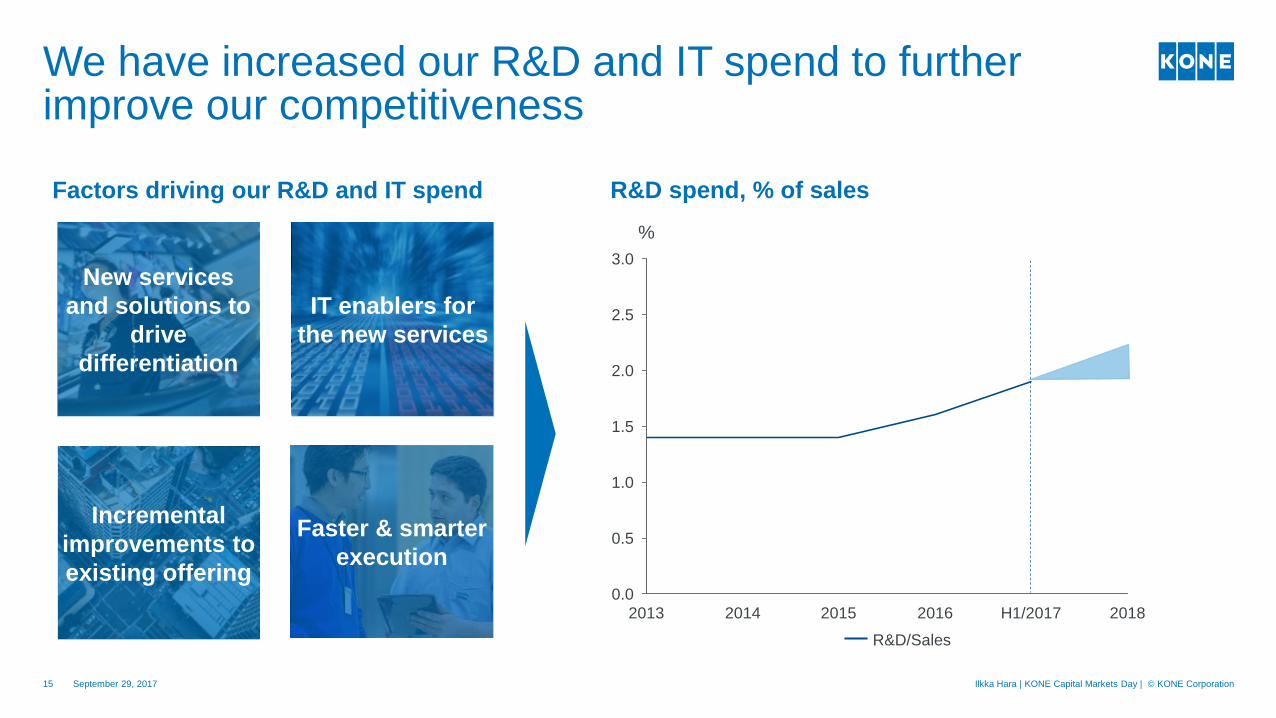
We have increased our R&D and IT spend to further improve our competitiveness
R&D spend, % of sales
3.0
2.5
2.0
1.5
1.0
0.5
0.0
%
2018H1/20172016201520142013
R&D/Sales
Factors driving our R&D and IT spend
New services
and solutions to
drive
differentiation
IT enablers for
the new services
Incremental
improvements to
existing offering
Faster & smarter
execution
September 29, 2017
September 29, 2017 Ilkka Hara | KONE Capital Markets Day | © KONE Corporation16
We have an agile R&D process and we want to further increase the speed of bringing new solutions to market
IDEAS
INVESTMENT
VALUE-CREATING
BUSINESS IDEAS
PILOT
ROLL-OUT
UP-FRONT INVESTMENTS
RELATIVELY SMALL
MAJOR PART OF PROJECT
COSTS OCCUR DURING THE
ROLL-OUT
Co-
creation
with
customers
Partner-
ship deve-
lopment
CONCEPT & PRODUCT
DEVELOPMENT
Internal
R&D
September 29, 2017 Ilkka Hara | KONE Capital Markets Day | © KONE Corporation17
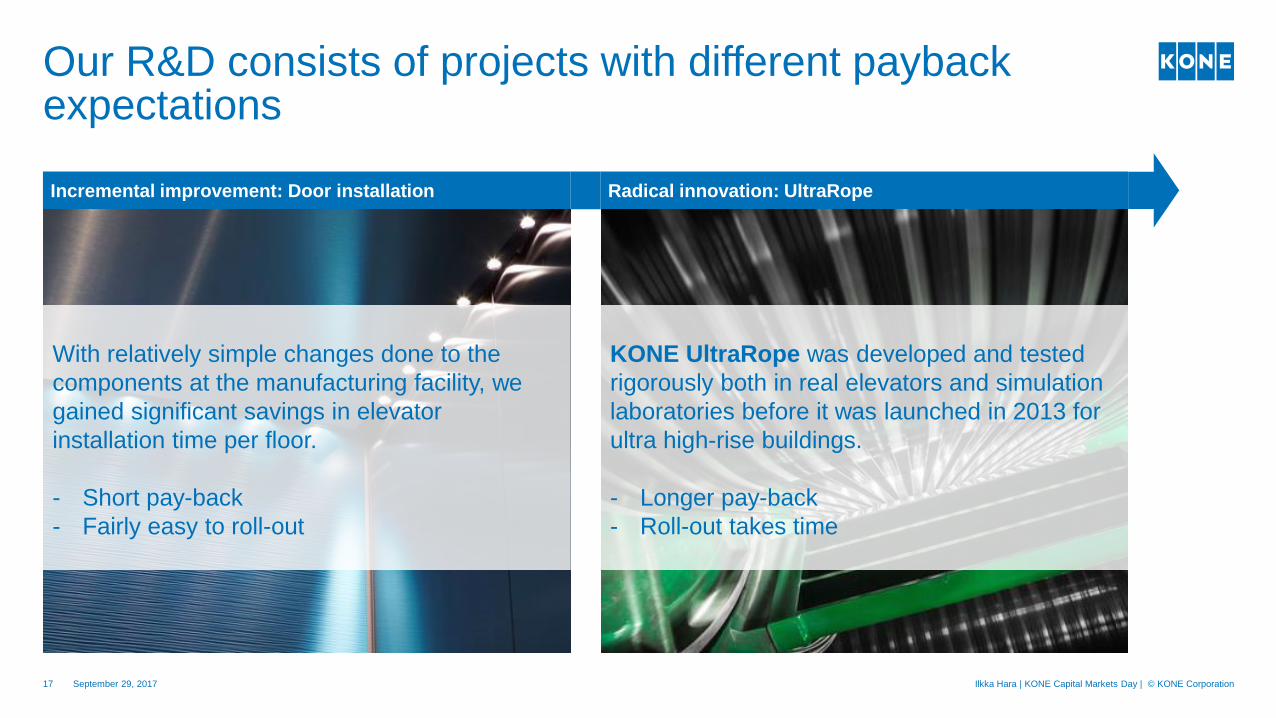
Radical innovation: UltraRopeIncremental improvement: Door installation
Our R&D consists of projects with different payback expectations
KONE UltraRope was developed and tested
rigorously both in real elevators and simulation
laboratories before it was launched in 2013 for
ultra high-rise buildings.
- Longer pay-back
- Roll-out takes time
With relatively simple changes done to the
components at the manufacturing facility, we
gained significant savings in elevator
installation time per floor.
- Short pay-back
- Fairly easy to roll-out
September 29, 2017 Ilkka Hara | KONE Capital Markets Day | © KONE Corporation18
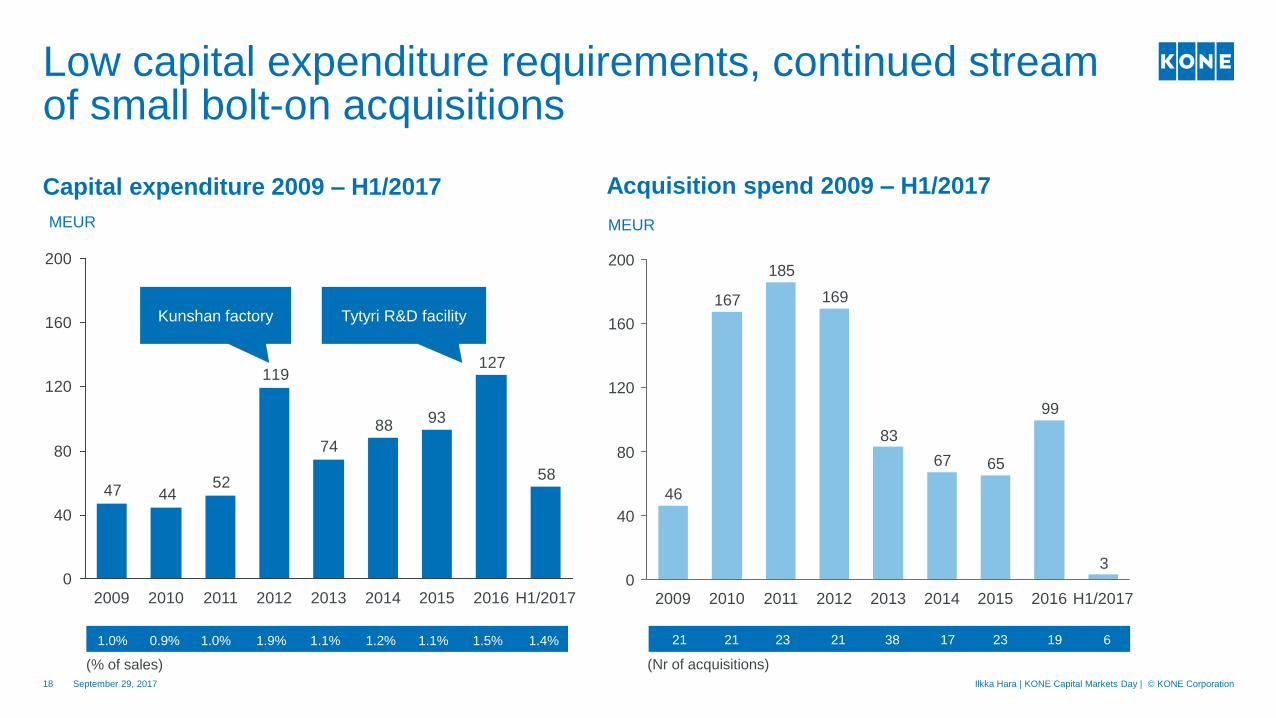
Low capital expenditure requirements, continued stream of small bolt-on acquisitions
58
127
9388
74
119
524447
0
40
80
120
160
200
2009 2013201220112010 H1/2017201620152014
Capital expenditure 2009 – H1/2017
MEUR
3
99
6567
83
169
185
167
46
0
40
80
120
160
200
20122011 20142013 H1/201720102009 20162015
Acquisition spend 2009 – H1/2017
21 21 23 21 38 17 23 19
MEUR
(Nr of acquisitions)
6
Tytyri R&D facilityKunshan factory
(% of sales)
1.0% 0.9% 1.0% 1.9% 1.1% 1.2% 1.1% 1.5% 1.4%
Looking ahead
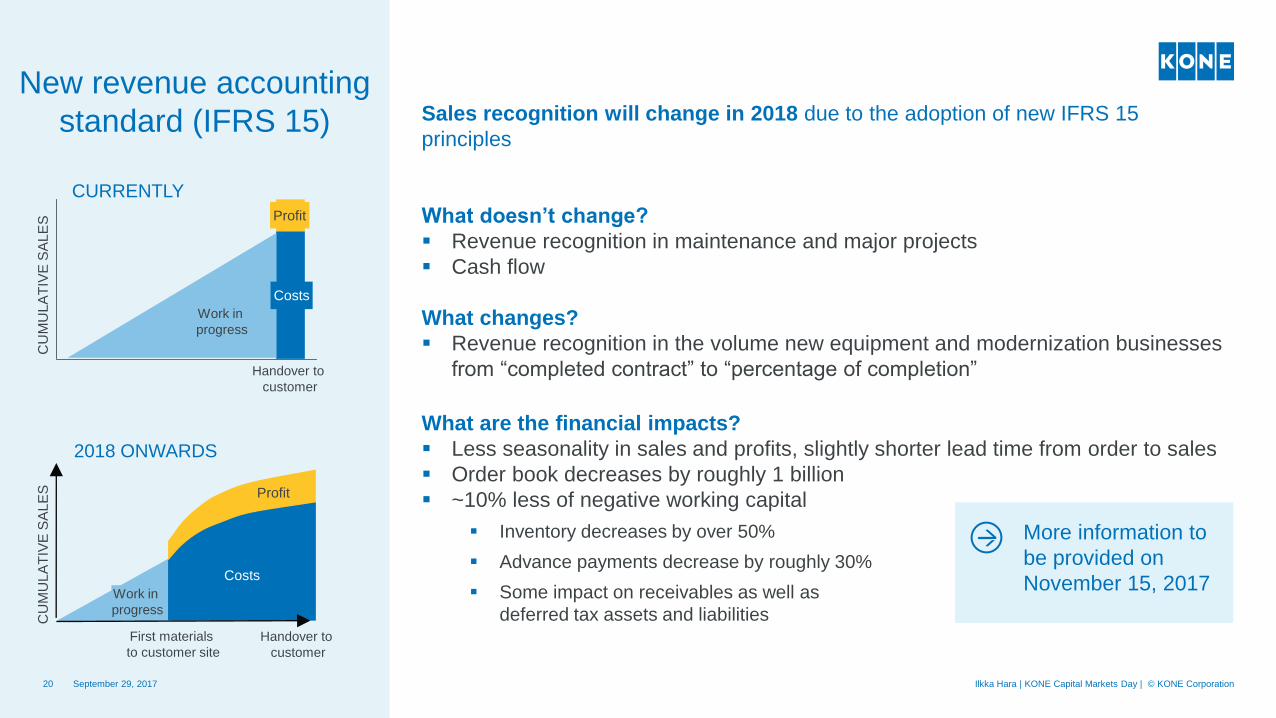
New revenue accounting
standard (IFRS 15)
Handover to
customer
CU
MU
LA
TIV
E S
AL
ES
CURRENTLY
Work in
progress
Costs
Profit
Work in
progress
2018 ONWARDS
CU
MU
LA
TIV
E S
AL
ES
First materials
to customer site
Handover to
customer
Costs
Profit
September 29, 201720
Sales recognition will change in 2018 due to the adoption of new IFRS 15
principles
What doesn’t change?
▪ Revenue recognition in maintenance and major projects
▪ Cash flow
What changes?
▪ Revenue recognition in the volume new equipment and modernization businesses
from “completed contract” to “percentage of completion”
What are the financial impacts?
▪ Less seasonality in sales and profits, slightly shorter lead time from order to sales
▪ Order book decreases by roughly 1 billion
▪ ~10% less of negative working capital
▪ Inventory decreases by over 50%
▪ Advance payments decrease by roughly 30%
▪ Some impact on receivables as well as
deferred tax assets and liabilities
Ilkka Hara | KONE Capital Markets Day | © KONE Corporation
More information to
be provided on
November 15, 2017
September 29, 2017 Ilkka Hara | KONE Capital Markets Day | © KONE Corporation21
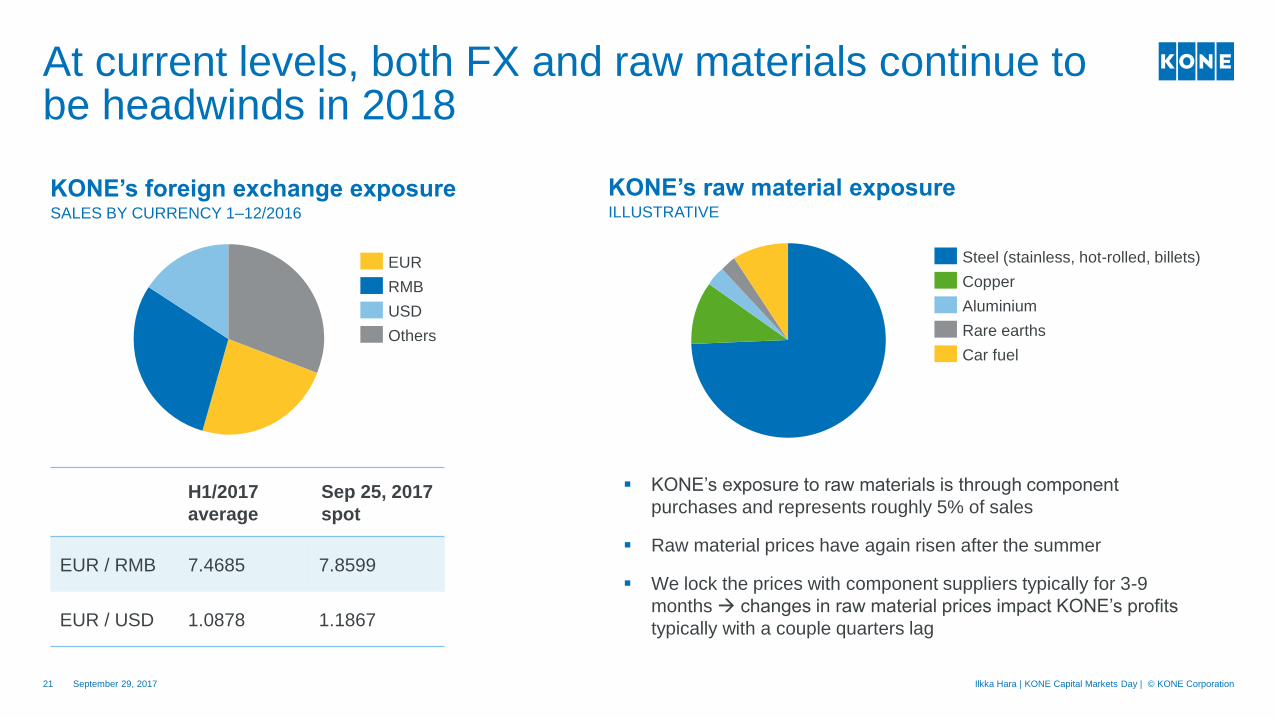
At current levels, both FX and raw materials continue to be headwinds in 2018
SALES BY CURRENCY 1–12/2016
KONE’s foreign exchange exposure
USD
Others
RMB
EUR
H1/2017
average
Sep 25, 2017
spot
EUR / RMB 7.4685 7.8599
EUR / USD 1.0878 1.1867
KONE’s raw material exposureILLUSTRATIVE
Steel (stainless, hot-rolled, billets)
Car fuel
Rare earths
Aluminium
Copper
▪ KONE’s exposure to raw materials is through component
purchases and represents roughly 5% of sales
▪ Raw material prices have again risen after the summer
▪ We lock the prices with component suppliers typically for 3-9
months changes in raw material prices impact KONE’s profits
typically with a couple quarters lag
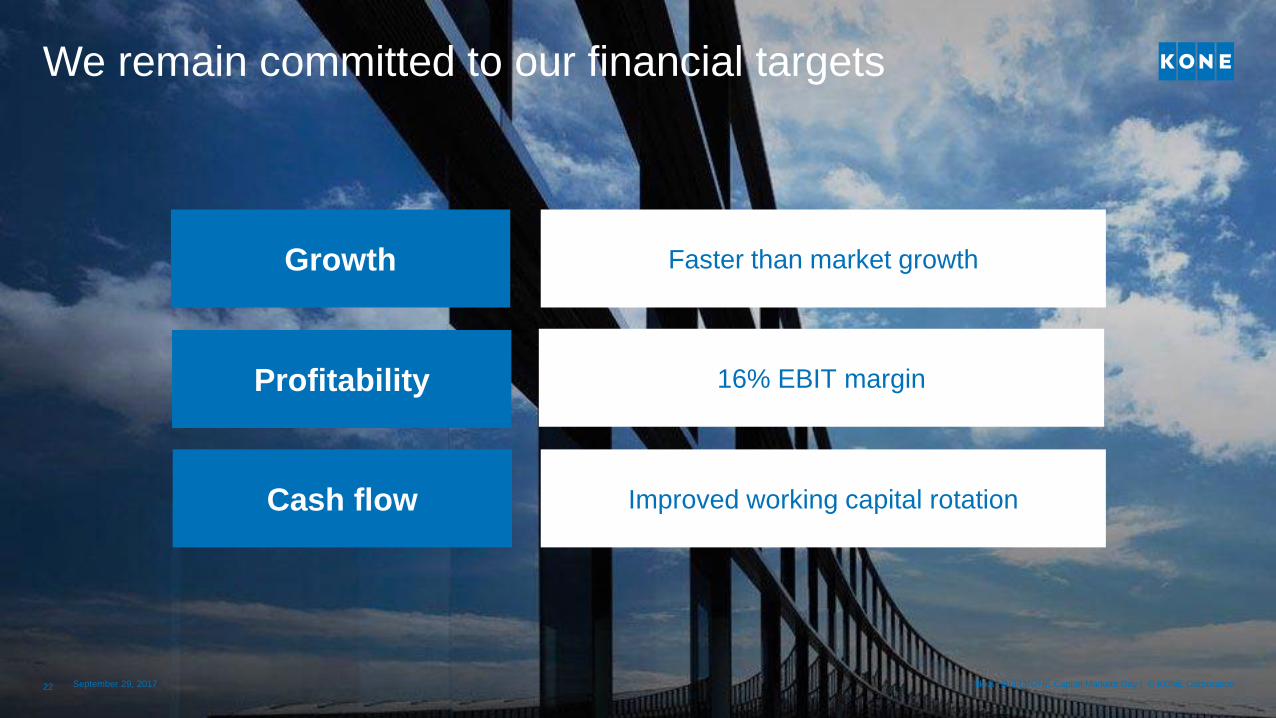
We remain committed to our financial targets
September 29, 2017 Ilkka Hara | KONE Capital Markets Day | © KONE Corporation22
Growth
Profitability
Cash flow
Faster than market growth
16% EBIT margin
Improved working capital rotation
September 29, 2017 Ilkka Hara | KONE Capital Markets Day | © KONE Corporation23
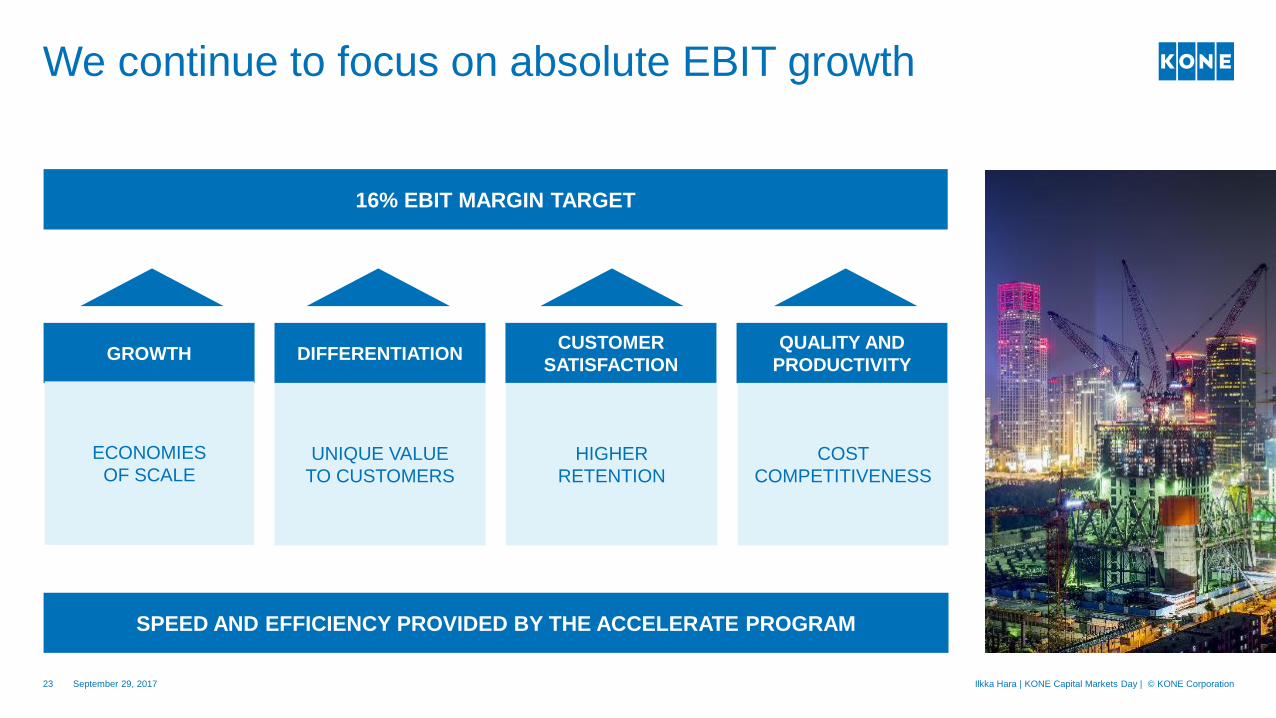
We continue to focus on absolute EBIT growth
SPEED AND EFFICIENCY PROVIDED BY THE ACCELERATE PROGRAM
16% EBIT MARGIN TARGET
CUSTOMER
SATISFACTION
QUALITY AND
PRODUCTIVITYGROWTH DIFFERENTIATION
HIGHER
RETENTION
COST
COMPETITIVENESS
ECONOMIES
OF SCALEUNIQUE VALUE
TO CUSTOMERS
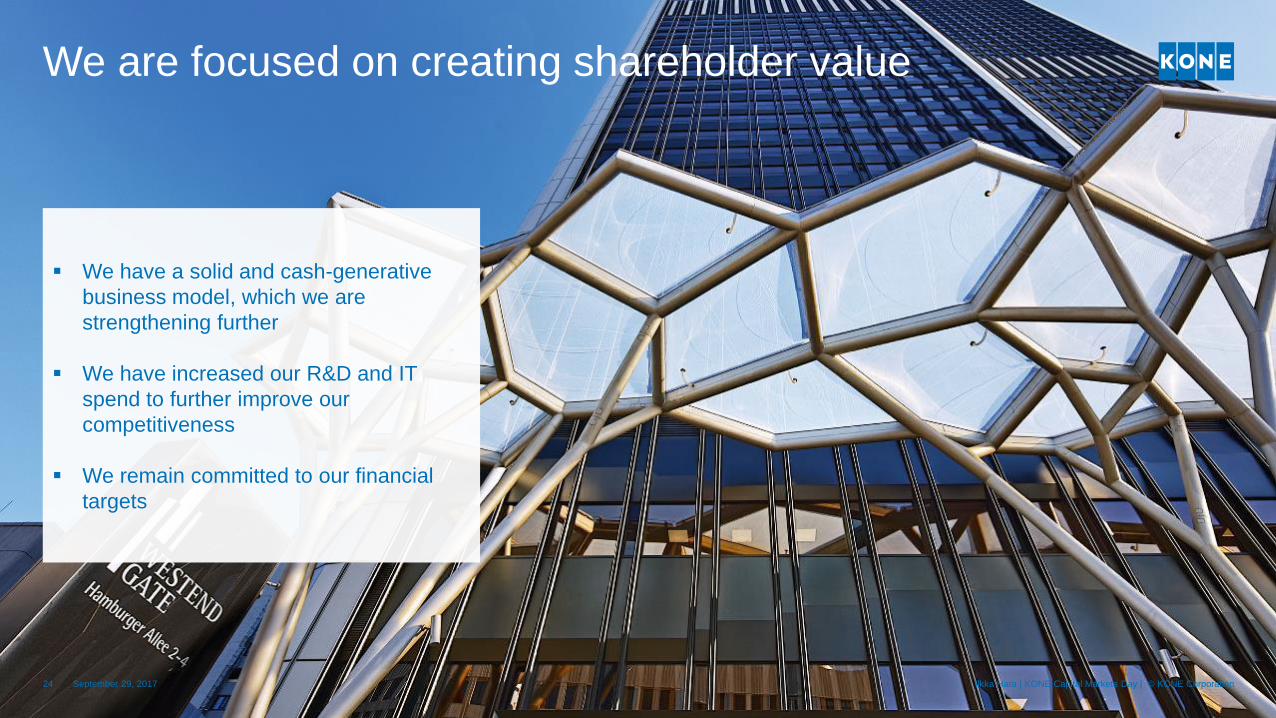
We are focused on creating shareholder value
September 29, 2017 Ilkka Hara | KONE Capital Markets Day | © KONE Corporation24
▪ We have a solid and cash-generative
business model, which we are
strengthening further
▪ We have increased our R&D and IT
spend to further improve our
competitiveness
▪ We remain committed to our financial
targets