Embed Size (px)
DESCRIPTION
Kongsberg Automotive. Presentation to DNB Market SME Conference. A brief introduction. Kongsberg Automotive provides world class products to the global vehicle industry Our products enhance the driving experience making it safer, more comfortable and sustainable - PowerPoint PPT Presentation
Citation preview

11
Kongsberg AutomotivePresentation to DNB Market SME Conference

2
A brief introduction
▸ Kongsberg Automotive provides world class products to the global vehicle industry
▸ Our products enhance the driving experience – making it safer, more comfortable and sustainable
▸ Revenues of close to EUR 1.0 billion
▸ Over 10.000 employees
▸ Global presence– Over 40 locations in 20 countries worldwide
▸ Listed on the Oslo Stock Exchange – Ticker symbol (KOA)
2

3
Our mission statement
3
Kongsberg Automotive provides world class products to the global vehicle industry
Our products are enhancing the driving experience, making it safer, more
comfortable and sustainable
Kongsberg Automotive provides world class products to the global vehicle industry
Our products are enhancing the driving experience, making it safer, more
comfortable and sustainable

4
Continuous improvement
Global reach
Strategic suppliers Offer end user value
Drive innovations
Competence partner
STAKEHOLDER
VALUE
Our Business Concept
4
Three levers to create stakeholder value
MARKET POSITION
INTERN
AL
EFFIC
IEN
CY U
NIQ
UE S
OLU
TIO
NS
Hold a leading position in our segmentsWork with the most demanding global customers

5
KEY FIGURES
Financials and history
5

6
2013 Group financial highlights
▸ 2013 revenues of EUR 991 million
▸ EBITDA of EUR 97 million (9.8%) – up EUR 21 mill. from 2012, despite
lower revenues
▸ Gearing ratio further reduced
– to 2.5 x NIBD/EBITDA
▸ Improved financial flexibility
6

7
Historical sales development
7
0
100
200
300
400
500
600
700
800
900
1.000
1.100
1987 1995 2000 2001 2002 2003 2004 2005 2006 2007 2008 2009 2010 2011 2012 2013
EU
R M
illi
on
GMS acquisition
Since 1996: 7 strategic acquisitionsStrengthening portfolio and market share, while expanding a global low cost manufacturing footprint

9
Top 20 Customers (KA Group)
9Figures are percentage of total KA sales in 2013
Ford
Chrys
ler
Volvo
Gro
up
GMPSA
RSA/Nis
san
VCC/Gee
lyJL
RBRP
VW G
roup
Scani
aBM
W
Indu
stria
l
PACCAR Gro
up
Diam
ler G
roup
MAN G
roup
Navis
tar G
roup
John
Dee
re
IVECO g
roup
FIAT
Indu
stria
l0%
1%
2%
3%
4%
5%
6%
7%
8%
9%
10%

10
Combining global reach with local support
10
Employees by area % of total
10.100 employees
Others 26 %
China 10 %
Mexico 29 %
11 %
24 %Low cost
Medium cost
High cost

1111
Markets and Products
OUR BUSINESS

12
Safety and comfort related products for vehicle interiors
Interior
MARKET
12
Gear shift systems for light duty vehicles
Driveline
MARKET
Fluid handling systems for commercial vehicles and passenger cars
MARKET
Business areas
30% of revenues 28% of revenues
Fluid Transfer17% of revenues
Driver control systems, cabin suspension and vehicle dynamics for commercial vehicles
Driver Control
MARKET
25% of revenues
EB
ITD
A-m
arg
in

1313
Gear shift systems for light duty vehicles
DRIVELINE
#1 global supplier of seat
comfort features
#2 globally on seat climate
systems
#Top 3 globally Gear shift systems
#1 in North America
Shift cables
Segment position Main competitors

1414
#1 global supplier of seat
comfort features
#2 globally on seat climate
systems
Safety and comfort related products for vehicle interiors
INTERIOR
#1 global supplier
Seat comfort features
#2 globally Seat climate
systems
Segment position Main competitors

15
#1 in Europe Clutch
actuation manual
transmissions
#1 in Europe Gearshift systems manual
transmissions
15
Driver control systems and chassis related products to commercial- and
off-highway vehicles
DRIVER CONTROLDRIVER CONTROL
Segment position Main competitors

1616
Fluid handling systems for light duty, industrial and commercial vehicles
FLUID TRANSFER
# 1 in Europe Air brake couplings
#1 in North America
High temperature oil- and fuel
line
Segment position Main competitors

1717Source: European Road Transport Research Advisory Council, J.D.Power, Shell, Roland Berger KPMG International, EU Commission, IBM Global Business Service, Oliver Wyman
Reduced fuelconsumption
ConnectivitySafety Comfort BRIC/ Globalization
Key growth trends

18
Energy efficient drivelines - Hybrid systems
▸ Bringing innovations to the market
▸ First contract for On-Board Chargers to European OEM
– Based on technology developed by JV company e-Power
– For use in in Plug-in Hybrid City Buses, later other vehicles to be sold worldwide
– Value 10 million Euros, SOP Q4 2015 in Mullsjö, Sweden
– e-Power focuses on power electronics for hybrid and electric vehicles
MEUR 10 value contract

19
Energy efficient drivelines - Shift by wire for Volvo Cars Concept Estate
▸ Innovative KA technology and expertise in Shift by wire systems for VCC’s Concept Estate
▸ Shifter equipped with state of the art technology. Sets a new standard in terms of
– safety,– weight– packaging– styling
19

20
Comfort products
▸ Lower segment cars taking more and more comfort features (heat and support)
▸ Improved standard seat content and features in mid segment vehicles (heat, ventilation and support)
▸ EU OEMs setting the standard for comfort innovations (BMW, JLR, VCC, Audi and Daimler). Seat and interior features being real differentiators in the premium market
20
BMW 7 Series
Europe
Chevrolet Malibu
Audi A6 & A7
ChinaEurope
Seat Comfort Systems – selected programs

21
Ultimate comfort systems across platforms throughscalability & modularity
▸ Based on in-house developed and manufactured standardized
building blocks; pumps, valves, seat heat elements, fans etc.
▸ All are scalable for ultimate comfort control, cost and packaging
needs
▸ Fully programmable features
▸ Can be fitted to any type of seat
21

22
Global
Significant booked business in BRIC in 2013
40 %
8 %
22 %
30 %
FY 2013: 200 MEUR
* Per annum value
‣ 30 % of total new business in last 12 months booked in BRIC countries vs. current BRIC revenue of MEUR 90‣ KA continues to grow in the emerging markets
22

23
KA an innovative technology partner for global OEMs
▸ KA providing SBW solutions to both the Automotive and Truck OEMs▸ KA focuses on power electronics for hybrid and electric vehicles▸ Providing leading safety and comfort features within our segments▸ Developing strong global teams to grow with its customer
23
OEM growth
• TRIAD OEMs to turn attention to emerging market to capture growth
Total cost of ownership
• Reducing fuel consumption is key
Environmental pressure
• Emission legislation in all markets requires OEMs to invest in more R&D
• Stricter safety regulations in TRIAD & emerging markets
• Comfort features to increase in emerging marktes
Comfort &safety

24
MARKET & TRENDS
24

25
0
20000000
40000000
60000000
80000000
100000000
120000000
China India Russia Brazil Rest Europe North America Japan/Korea
Global passenger car - production per regionNear-term volatility, Long-term growth trajectory
CAGR 2013-18
BRIC 7.3 %TRIAD 1.5 %
Source: IHS
‣ Weak growth in TRIAD markets (Europe, North America and Japan/Korea)
‣ Growing industry in BRIC countries & emerging markets (Thailand, Indonesia, Iran and Turkey)25

26
2012 2013 2014 2015 2016 2017 2018.000
500000.000
1000000.000
1500000.000
2000000.000
2500000.000
3000000.000
3500000.000
4000000.000
China India Russia Brasil Rest Europe Japan/ Korea North America
Trucks with GVW above 6t
Source: L.M.C.
CAGR 2013-18
BRIC 7.7 %TRIAD 5.0 %
Growth of global CV market is going to accelerate compared to last decade
26
Millions
Global Commercial Vehicle production per regionGrowth industry in spite of temporary market fluctuations
Brazil

27
• China outlook is good with some risks linked to ownership level restriction
• Forecasted GDP growth to be similar to 2013, combined with increased need for replacements, should see good growth in 2014
Market summary and outlookGlobal industry growth
27Source: LMC Automotive – Jan 2014
Country/region Expected 2014 growth rate
Outlook
• With the positive turn of GDP growth, we expect a slightly positive development, but still far off reaching 2008 levels.
• Europe looks to be turning the corner, but some time before reaching 2008 levels
• Favorable outlook but various threats to the forecast remain
• North American market expected to continue good development from H2-13 into 2014.

2828
FINANCIALS

29
Consolidated income statement
► Revenue run rate in line with full
year guiding
► EBITDA for the year improved by
EUR 20 million, despite lower
sales
► Net profit influenced by unrealized
FX effects
31.12.12 31.03.13 30.06.13 30.09.13 31.12.13
1001.1 985.4 985.8 981.5 990.9
-924.1 -906.6 -898.3 -884.5 -893.8
77.0 78.9 87.5 97.0 97.1
7.7% 8.0% 8.9% 9.9% 9.8%
-46.3 -47.5 -45.2 -44.6 -43.9
30.7 31.4 42.3 52.5 53.2
3.1% 3.2% 4.3% 5.3% 5.4%
-18.7 -31.1 -29.6 -35.3 -40.4
11.9 0.3 12.7 17.2 12.8
-6.7 -3.6 -6.9 -8.1 -6.2
5.3 -3.4 5.8 9.1 6.6
Twelve months ending
Revenues
OPEX
EBITDA
EBITDA (%)
EUR Million
Financial items
Profit before taxes
Tax
Net profit
D&A
EBIT
EBIT (%)

30
ROCE (Ltm)
75.3
1,001985 986 982
991
Q4 2012 Q1 2013 Q2 2013 Q3 2013 Q4 2013
Revenues (Ltm)
EUR million
5.8% 5.9%
8.1%10.3% 10.9%
Q4 2012 Q1 2013 Q2 2013 Q3 2013 Q4 2013
ROCE (Ltm)
Percent
30.7 31.442.3
52.5 53.2
3.1% 3.2%4.3%
5.3% 5.4%
Q4 2012 Q1 2013 Q2 2013 Q3 2013 Q4 2013
EBIT and EBIT margin (Ltm)
EUR million and percent
530532 520
508486
1.89 1.851.90 1.93
2.04
Q4 2012 Q1 2013 Q2 2013 Q3 2013 Q4 2013
Avg. Capital Employed and turnover (Ltm)
EUR million and Times

31
Available funds and utilization
57.1 54.4
76.4
52.1
-2.7
-24.3Restricted cash
Cash reserve
Cash
-40
-20
0
20
40
60
80
100
120
140
GrossQ4 2012
NetQ4 2013
Liquidity reserveEUR million
Restricted cash
Overdraft
Unutilized facility
Unutilized revolving
credit facility
338318
298278
258261
0
50
100
150
200
250
300
350
400
450
Q4 2013 Q2 2014 Q4 2014 Q2 2015 Q4 2015
Credit utilization RRCFEUR Million
Changes in facility agreement
Available credit
Drawn credit

32
Financial ratios
289 297 275 265 241
Q4 2012 Q1 2013 Q2 2013 Q3 2013 Q4 2013
NIBDEUR million
24.8% 24.8% 25.2%
27.4% 27.6%
Q4 2012 Q1 2013 Q2 2013 Q3 2013 Q4 2013
Equity ratioPercent
3.8 3.83.1
2.7 2.5
Q4 2012 Q1 2013 Q2 2013 Q3 2013 Q4 2013
NIBD/EBITDATimes
184.7
189.0 189.4
193.4
189.6
Q4 2012 Q1 2013 Q2 2013 Q3 2013 Q4 2013
EquityEUR million
33
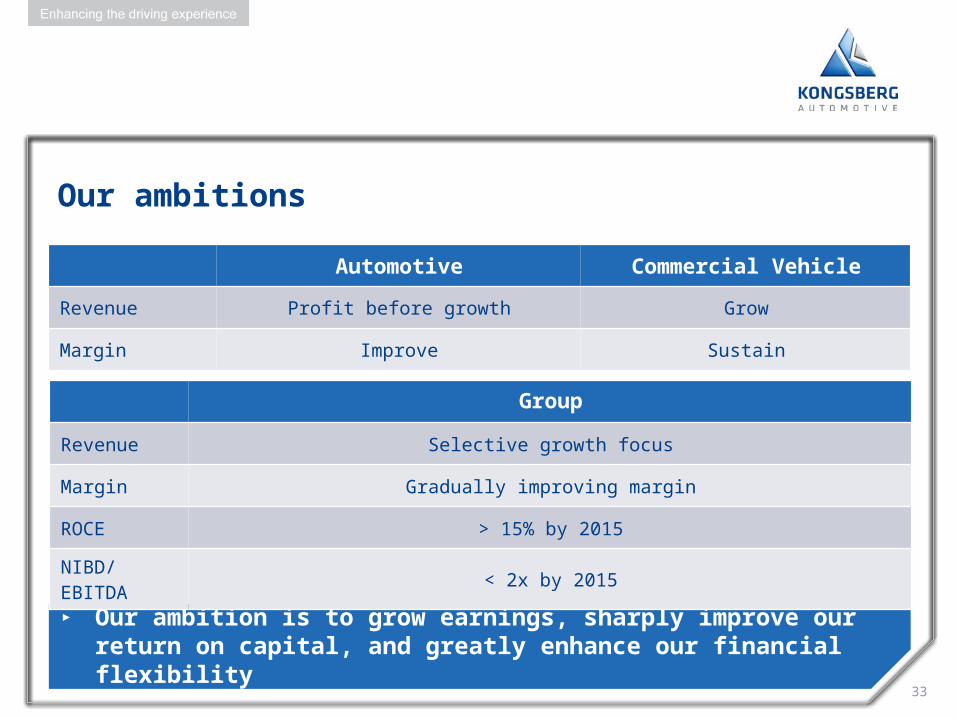
Our ambitions
Automotive Commercial Vehicle
Revenue Profit before growth Grow
Margin Improve Sustain
▸ Our ambition is to grow earnings, sharply improve our return on capital, and greatly enhance our financial flexibility
Group
Revenue Selective growth focus
Margin Gradually improving margin
ROCE > 15% by 2015
NIBD/EBITDA < 2x by 2015