Embed Size (px)
Citation preview

Foreign Agricultural Service
GAIN ReportGlobal Agriculture Information Network
Required Report - public distribution Date: 7/11/2001
GAIN Report #KS1041
Korea, Republic of
Solid Wood Products
Annual
2001
Approved by: Grant A. PettrieU.S. Embassy, Seoul
Prepared by: Sunchul Choi
Report Highlights: Despite the strong dollar, the growth rate of Korean exports for thefirst quarter 2001 was negative. GDP growth rate in 2001 is forecast between 3.5 - 4percent, sharply below the 8.8 percent level of 2000. Korean self-sufficiency rate ofwood products is expected to remain unchanged at 5 percent from the previous year. Limited local resources of wood products make Korea rely on heavily imported woodproducts. The U.S. industry continues to face strong competition with major exportingcountries in this price-centered-market. Echoes from the economic slump haveprolonged the recession in the housing construction, furniture and interior sectors.The economic slowdown has encouraged the substitution of the panel products laminatedby veneer for lumber. The wood frame housing market is also affected by the economicslump but the outlook for two-by-four construction is encouraging as deregulationinitiatives and building code revisions are favorable for single family and low rise multi-
family unit facilities.
Includes PSD changes: YesIncludes Trade Matrix: Yes
Annual ReportSeoul [KS1], KS
SECTION I. SITUATION AND OUTLOOK . . . . . . . . . . . . . . . . . . . . . . . . . . . . . . . . . 2

SECTION II. NARRATIVE ON SUPPLY AND DEMAND, POLICY & MARKETING. . . . . . . . . . . . . . . . . . . . . . . . . . . . . . . . . . . . . . . . . . . . . . . . . . . . . . . . . . . . . . . . . . . . . 4
Production . . . . . . . . . . . . . . . . . . . . . . . . . . . . . . . . . . . . . . . . . . . . . . . . . . . . . . . . . . . . 4Forest Situation/Outlook . . . . . . . . . . . . . . . . . . . . . . . . . . . . . . . . . . . . . . . . . . . . 4Solid Wood Products Situation/Outlook . . . . . . . . . . . . . . . . . . . . . . . . . . . . . . . . 4
Trade . . . . . . . . . . . . . . . . . . . . . . . . . . . . . . . . . . . . . . . . . . . . . . . . . . . . . . . . . . . . . . . . . 4Overview/Outlook . . . . . . . . . . . . . . . . . . . . . . . . . . . . . . . . . . . . . . . . . . . . . . . . . 4Competition . . . . . . . . . . . . . . . . . . . . . . . . . . . . . . . . . . . . . . . . . . . . . . . . . . . . . . 5Market Development Strategies . . . . . . . . . . . . . . . . . . . . . . . . . . . . . . . . . . . . . . . 6
MARKET SEGMENT ANALYSIS . . . . . . . . . . . . . . . . . . . . . . . . . . . . . . . . . . . . . . . . . 7Construction Sector . . . . . . . . . . . . . . . . . . . . . . . . . . . . . . . . . . . . . . . . . . . . . . . . . . . . . 7
Overview . . . . . . . . . . . . . . . . . . . . . . . . . . . . . . . . . . . . . . . . . . . . . . . . . . . . . . . . 7Marketing . . . . . . . . . . . . . . . . . . . . . . . . . . . . . . . . . . . . . . . . . . . . . . . . . . . . . . . . 8The Fabricated Structural Members Market . . . . . . . . . . . . . . . . . . . . . . . . . . . . . 9Policy . . . . . . . . . . . . . . . . . . . . . . . . . . . . . . . . . . . . . . . . . . . . . . . . . . . . . . . . . . . 9Trade . . . . . . . . . . . . . . . . . . . . . . . . . . . . . . . . . . . . . . . . . . . . . . . . . . . . . . . . . . 9
Furniture & Interiors Sector . . . . . . . . . . . . . . . . . . . . . . . . . . . . . . . . . . . . . . . . . . . . . . 10Overview . . . . . . . . . . . . . . . . . . . . . . . . . . . . . . . . . . . . . . . . . . . . . . . . . . . . . . . 10Marketing . . . . . . . . . . . . . . . . . . . . . . . . . . . . . . . . . . . . . . . . . . . . . . . . . . . . . . . 10Policy . . . . . . . . . . . . . . . . . . . . . . . . . . . . . . . . . . . . . . . . . . . . . . . . . . . . . . . . . . 11Trade . . . . . . . . . . . . . . . . . . . . . . . . . . . . . . . . . . . . . . . . . . . . . . . . . . . . . . . . . . 11
Material Handling Industry . . . . . . . . . . . . . . . . . . . . . . . . . . . . . . . . . . . . . . . . . . . . . . . 11
SECTION III. STATISTICAL TABLES . . . . . . . . . . . . . . . . . . . . . . . . . . . . . . . . . . . . 12Strategic Indicator Tables . . . . . . . . . . . . . . . . . . . . . . . . . . . . . . . . . . . . . . . . . . . . . . . . 12
STRATEGIC INDICATOR TABLE: FOREST AREA . . . . . . . . . . . . . . . . . . . 12STRATEGIC INDICATOR TABLE: CONSTRUCTION MARKET . . . . . . . . 13STRATEGIC INDICATORS TABLE: FURNITURE & INTERIORS MARKET
. . . . . . . . . . . . . . . . . . . . . . . . . . . . . . . . . . . . . . . . . . . . . . . . . . . . . . . . . 15STRATEGIC INDICATOR TABLE: MATERIAL HANDLING MARKET . . 17STRATEGIC INDICATOR TABLE: WOOD PRODUCTS SUBSIDIES . . . . . 18STRATEGIC INDICATOR TABLE: FOREST PRODUCT TARIFFS AND
TAXES . . . . . . . . . . . . . . . . . . . . . . . . . . . . . . . . . . . . . . . . . . . . . . . . . . . 20PS&D Tables and Trade Matrices . . . . . . . . . . . . . . . . . . . . . . . . . . . . . . . . . . . . . . . . . 21
Temperate Hardwood Logs PSD . . . . . . . . . . . . . . . . . . . . . . . . . . . . . . . . . . . . . 21Import Trade Matrix- Temperate Hardwood Logs . . . . . . . . . . . . . . . . . . . . . . . 21Tropical Hardwood Logs PSD . . . . . . . . . . . . . . . . . . . . . . . . . . . . . . . . . . . . . . . 22Import Trade Matrix- Tropical Hardwood Logs . . . . . . . . . . . . . . . . . . . . . . . . . 22Softwood Logs PSD . . . . . . . . . . . . . . . . . . . . . . . . . . . . . . . . . . . . . . . . . . . . . . . 23Import Trade Matrix- Softwood Logs . . . . . . . . . . . . . . . . . . . . . . . . . . . . . . . . . 23Value of Logs Imports per Country . . . . . . . . . . . . . . . . . . . . . . . . . . . . . . . . . . . 24Temperate Hardwood Lumber PSD . . . . . . . . . . . . . . . . . . . . . . . . . . . . . . . . . . . 25Import Trade Matrix- Temperate Hardwood Lumber . . . . . . . . . . . . . . . . . . . . . 25Hardwood Lumber Imports From U.S. . . . . . . . . . . . . . . . . . . . . . . . . . . . . . . . . 26Tropical Hardwood Lumber PSD . . . . . . . . . . . . . . . . . . . . . . . . . . . . . . . . . . . . 27Import Trade Matrix- Tropical Hardwood Lumber . . . . . . . . . . . . . . . . . . . . . . . 27Softwood Lumber PSD . . . . . . . . . . . . . . . . . . . . . . . . . . . . . . . . . . . . . . . . . . . . 28Import Trade Matrix- Softwood Lumber . . . . . . . . . . . . . . . . . . . . . . . . . . . . . . . 28Softwood Lumber Imports From the U. S. . . . . . . . . . . . . . . . . . . . . . . . . . . . . . 29

GAIN Report #KS1041
Value of Lumber Imports per Country . . . . . . . . . . . . . . . . . . . . . . . . . . . . . . . . . 30Veneer PSD . . . . . . . . . . . . . . . . . . . . . . . . . . . . . . . . . . . . . . . . . . . . . . . . . . . . . 31Import Trade Matrix- Veneer . . . . . . . . . . . . . . . . . . . . . . . . . . . . . . . . . . . . . . . . 31Value of Veneer Imports per Country . . . . . . . . . . . . . . . . . . . . . . . . . . . . . . . . . 32
Other Tables . . . . . . . . . . . . . . . . . . . . . . . . . . . . . . . . . . . . . . . . . . . . . . . . . . . . . . . . . . 33Supply of Domestic Roundwood . . . . . . . . . . . . . . . . . . . . . . . . . . . . . . . . . . . . 33Wood Products Production . . . . . . . . . . . . . . . . . . . . . . . . . . . . . . . . . . . . . . . . . 33Government Investment for Infrastructure . . . . . . . . . . . . . . . . . . . . . . . . . . . . . . 34Value of Domestic Construction Orders Comparison for 1999 and 2000 . . . . . . 35Building Construction Permits by Structure . . . . . . . . . . . . . . . . . . . . . . . . . . . . 36Building Construction Permits by Use . . . . . . . . . . . . . . . . . . . . . . . . . . . . . . . . . 36Housing Starts per Type . . . . . . . . . . . . . . . . . . . . . . . . . . . . . . . . . . . . . . . . . . . . 37Import of Wood Frame Housing Per Country . . . . . . . . . . . . . . . . . . . . . . . . . . . 37Production of Wood-Based Products . . . . . . . . . . . . . . . . . . . . . . . . . . . . . . . . . . 38Value of Total Forest Product Imports . . . . . . . . . . . . . . . . . . . . . . . . . . . . . . . . 39Value Comparison of Forest Product Import for January-April . . . . . . . . . . . . . 40Volume of Forest Product Imports . . . . . . . . . . . . . . . . . . . . . . . . . . . . . . . . . . . 41
GAIN Report #KS1041 Page 2 of 41
UNCLASSIFIED Foreign Agricultural Service/USDA
SECTION I. SITUATION AND OUTLOOK
GDP growth rate in 2001 is forecast between 3.5 - 4 percent, sharply below the 8.8 percent level of 2000. Inthe first quarter of 2001, the delayed restructuring of financial and business sectors has weakened the Koreaneconomy. Despite the strong dollar, the growth rate of Korean exports for the first quarter 2001 was negative. Korean imports also registered a steep decline as the import demand of raw materials for processing and capitalgoods dropped.
Forestry Administration estimates the CY 2001 total consumption of wood products at 25 million CUM on thebasis of roundwood, composed of the imported wood products of 24 million CUM and 1.4 million CUM oflocal wood products.
Limited local resources of wood products make Korea heavily rely on imported wood products. The U. S.market share, based on value, in 2000 dropped to 11 percent mostly because of competition in temperatehardwood lumber from China. The U.S. industry continues to face strong competition, particularly from NewZealand, Chile, Russia and Australia in roundwood, and Malaysia, Indonesia, China, Canada and Chile inlumber, as Korea still buys products based on price, not quality and durability.
The lumber processing industry is experiencing a lack of demand because of slow growth in construction andfurniture. However, the panel products industries continue expanding their capacities to meet a greater demandof particle board and MDF from interior and furniture industries, who prefer to substitute the processed productslaminated by veneer for lumber to save costs.
In the first four months of CY2001, wood products imports declined by 13 percent to US$448 million comparedto the same period in CY2000. The United States exports slightly declined by 2 percent for the period asKorea’s decreased imports of logs, lumber, particle board, door/windows and plywood has been partly offset bythe increased imports of wood chips and fiberboard. The imports of prepackaged homes increased 6 percent ona year-over-year basis, with increases in orders reported from Finland and Canada while the U. S. declined 38percent for the period. In CY 2000, total wood products imports increased 12 percent due to a greater demand of veneer and panelproducts such as particle board and MDF from interior and furniture industries. The economic slowdown hasencouraged the substitution of the panel products laminated by veneer for lumber. U.S. export value of softwood lumber increased 17 percent while quantity remained unchanged from theprevious year. The sluggish housing and furniture sectors has discouraged the import of temperate hardwoodlumber. U.S. exports of temperate hardwood lumber declined 20 percent from the previous year and continue todecline 19 percent for the first four months of CY2001 because of high inventory in the stockyard. U. S. veneerexports to Korea rose 19 percent and temperate hardwood log regarded as veneer peeling rose 30 percent fromthe previous year’s. The prolonged slump in the housing construction and interior sectors has led veneerlaminated wood products to replace for solid wood products.
The Ministry of Construction and Transportation (MOCT) has set the CY 2001 goal for new housing starts at500,000 units. New housing starts in CY2000 totaled 433,488 units, up 7 percent from 1999. However, echoesfrom the economic slump have prolonged the recession in the housing and construction sector. For the firstquarter 2001, the recession in the housing and construction sector has worsened due to restructuring of largeconstruction companies which has in turn seriously affected other firms. Building starts for the first four
GAIN Report #KS1041 Page 3 of 41
UNCLASSIFIED Foreign Agricultural Service/USDA
months in 2001 dropped 22.2 percent to 90,674 units from last year’s 116,516 units.
The wood frame housing market is also affected by the slump. Building permits of wood frame housing forJanuary - February of 2001 increased 38 percent to 25,876 square meters but actual starts are estimated to besubstantially decreased due to the weakened demand. Wholesalers of wood house building materials estimatethat the sales volume plummeted in the first quarter but showed a gradual rebound in April, 2001. This trendshould provide a greater potential for the wood frame housing market in the future. Imports of prepackagedwood frame houses for the first quarter increased 15.1 percent over the same period. Though U.S. sharedropped to 34 percent of total imports, far below from the 55 percent of last year’s, the outlook for two-by-fourconstruction is encouraging as deregulation initiatives and building code revisions are favorable for singlefamily and low rise multi-family unit facilities. Revision of the building code, a priority in the woodconstruction industry, is expected to be enacted by early 2002.
The furniture and interior sectors have traditionally been the largest users of U.S. hardwoods. However, theeconomic slowdown in construction has made furniture sales slow while the demand for renovation materialshas increased. Korea’s furniture industry has suffered in line with the slump in the housing and constructionsectors since the second half of 2000. Furniture manufacturers still in operation have substituted wood veneerwith artificial veneer due to cost savings. The interior industry shows better prospects for near by growth thanfurniture. Korea Construction Association estimates the potential of the renovation market is growing year-by-year as more old buildings are being renovated. Flooring, wall and ceiling panels, built-in furniture and doorsand windows are areas in the greater opportunities. Veneer has the greatest potential in this market becausecomposite products laminated by veneer have substituted lumber to save the cost of interior and furniture.
The total pallet market hovered around 50 million units. Market share of wood pallets is at 70 percent, plasticpallets at 25 percent and other pallets such as iron and paper at 5 percent, respectively. Since 1998, palletproduction grew at an annual 14 percent rate, according to the tri-annual Korea Pallet Association’s (KPA)survey. In CY 2001, the KPA expects the growth rate of pallet production to be lower than previous years dueto a decrease in Korean exports since the second half of last year. Local pallet producers continue to increasethe production of plastic pallets which have longer durability than wood and minimizes damage caused by nailsin wood pallets. Spurring on demand for plastic pallets are requests from Australian and French importers forKorean exporters use plastic pallets to eliminate potential quarantine problems. KPA anticipates the marketshare of plastic pallet to grow to 30 percent in 5 years.
Over the next 3-5 years, trade volume is expected to rebound step by step in tandem with the expandingeconomy boosted by the construction sector. Significant expansion in this market is not foreseen over theintermediate period unless tariffs are reduced.

GAIN Report #KS1041 Page 4 of 41
UNCLASSIFIED Foreign Agricultural Service/USDA
SECTION II. NARRATIVE ON SUPPLY AND DEMAND, POLICY & MARKETING
Production
Forest Situation/Outlook
Total forested area, about 6.43 million hectares (HA), accounts for 65 percent of the total land area. Korea'sforests are located predominantly in the cool-temperate zone with a small section in the warm-temperate zonealong the southern coast.
Most of the domestic growing stock is under 30 years old with the greatest production made up of coniferoustrees between 11-30 years old. Small diameter logs (below 30 centimeters) represent 97 percent of total logproduction. Because timber quality is low and the majority of trees are of small diameter, domesticroundwood is primarily processed into pitprop, lumber for crates, fiberboard, and wood chips for pulping.
The CY 2001 roundwood harvest is projected at 1.5 million CUM. Softwoods comprise 60 percent of theharvest followed by temperate hardwoods at 40 percent. For CY 2002, the outlook for domestic roundwoodproduction is 1.6 million CUM, with softwoods (60 percent) and temperate hardwoods (40 percent)maintaining the dominant species harvested. With proper management, Korea projects that sustainabledomestic production could satisfy more than 50 percent of total demand by the 2030s.
Forestry Administration estimates the CY 2001 total consumption of wood products at 25 million CUM on thebasis of roundwood, composed of the imported wood products of 24 million CUM and 1.4 million CUM oflocal wood products. Total imports of round wood equivalent are classified into 7 million CUM for logs and16 million CUM roundwood equivalent for lumbers and processed wood products. Korean self-sufficiencyrate of wood products is expected to remain unchanged at 5 percent from the previous.
Solid Wood Products Situation/Outlook
The Korean economy remained sluggish for the first quarter of CY2001, the lumber processing industry isexperiencing a lack of demand because of slow growth in construction and furniture. However, the panelproducts industries continue expanding their capacities to meet a greater demand of particle board and MDFfrom interior and furniture industries, who prefer to substitute the processed products laminated by veneer forlumber to save costs. Based on the first three months of 2001, the panel industry is operating at more than 80percent of capacity. They expect the strong dollar to make their processed wood products more competitivethan imports. For CY 2002, the outlook for the panel processing industry is expected to grow in accordancewith economic growth boosted by deregulation of the construction sector in CY2001.
Trade
Overview/Outlook
During the first four months of CY2001, wood products imports declined by 13 percent to US$448 millioncompared to the same period in CY2000. The United States exports slightly declined by 2 percent for theperiod as Korea’s decreased imports of logs, lumber, particle board, door/windows and plywood has beenpartly offset by the increased imports of wood chips and fiberboard.

GAIN Report #KS1041 Page 5 of 41
UNCLASSIFIED Foreign Agricultural Service/USDA
During this same period, the imports of prepackaged homes under H. S. code of 9406 increased 6 percent on ayear-over-year basis, with increases in orders reported from Finland and Canada while the U. S. declined 38percent for the period. U. S. dimension lumber is not widely used in the wood frame housing market becauseKorean market is centered on price. Canadian SPF, a mixed species of Spruce, Pine and Fir is much morecompetitive than US dimension lumber, particularly given the exchange rate over the past year. Finlandcontinues increasing her export of log homes and chemical treated lumber for the purpose of decking. In CY 2000, total wood products imports increased 12 percent due to a greater demand of veneer and panelproducts such as particle board and MDF from interior and furniture industries. The economic slowdown hasencouraged the substitution of the panel products laminated by veneer for lumber. However, U.S. exports to Korea decreased 3 percent because of more competitive prices of logs and panelproducts from Southeast Asia, New Zealand, Chile and Russia.
In CY2000, U.S. export value of softwood lumber increased 17 percent while quantity remained unchangedfrom the previous year. Spruce lumber has been the major species used for piano soundboard and douglas firand hemlock have been used for doors/windows and furniture. Korean importers continue to take notice of theexport quotas listed in the U.S./ Canada softwood lumber agreement which will be reportedly abolished in2001. When the export quota is removed, U.S. softwood lumber is expected to become more competitive andgain more share in the Korean market.
The sluggish housing and furniture sectors has discouraged the import of temperate hardwood lumber. InCY2000, U.S. exports of temperate hardwood lumber declined 20 percent from the previous year and continueto decline 19 percent for the first four months of CY2001. High inventory in the stockyard caused by thecontinued economic downturn has prevented importers from making new buying contracts since the secondhalf of CY2000.
In CY2000, U. S. veneer exports to Korea rose 19 percent and temperate hardwood log regarded as veneerpeeling rose 30 percent from the previous year’s. The prolonged slump in the housing construction andinterior sectors has led veneer laminated wood products to replace for solid wood products. Combined withthe growing demand of flooring, veneer imports are expected to increase in CY2001. Consumers’ preferencesfor veneer are cherry, hard maple and beech.
Korea’s position of the early voluntary sectorial liberalization (EVSL) remains unchanged from the previousstance aligned with Japanese position in the Asian-Pacific Economic Council (APEC). It is expected for themto submit the unchanged agenda to the fourth Cabinet meeting of WTO early November 2001. Localprocessors remain vocal against Korea’s early liberalization of this sector.
Over the next 3-5 years, trade volume is expected to rebound step by step in tandem with the expandingeconomy boosted by the construction sector. Significant expansion in this market is not foreseen over theintermediate period unless tariffs are reduced.
Competition
Limited local resources of wood products make Korea heavily rely on imported wood products. The U. S.market share, based on value, in 2000 dropped to 11 percent mostly because of competition in temperatehardwood lumber from China. The U.S. industry continues to face strong competition, particularly from New

GAIN Report #KS1041 Page 6 of 41
UNCLASSIFIED Foreign Agricultural Service/USDA
Zealand, Chile, Russia and Australia in roundwood, and Malaysia, Indonesia, China, Canada and Chile inlumber, as Korea still buys products based on price, not quality and durability.
The primary competition for U.S. softwood logs are the radiata pine from New Zealand and Chile. Russiansoftwood is also entering the market, mainly through barter deals with Korean trading companies. TheRussian government has decided to encourage the export of lumber and value added wood products whilereducing the export of logs. We understand that their national target is to export the 30 percent of finishedlumber products out of total wood exports in 2001 and 50 percent in 2002. Russia is reportedly unlikely topermit the export of logs from 2003 on.
Finland and Canada are aggressively challenging the United States in this market. The Canadian industryhad a strong presence with a big pavilion composed of 12 companies in the Seoul Home DevelopersExposition(HOMDEX) for March 2001. Korea International Building Exposition (KIBEX), held in December2000, had 135 companies from 13 foreign countries, such as Sweden, Austria, Australia, Italy, Canada andSpain. The Canadian Housing Mortgage Corporation (CHMC) has an agreement with the Korea HousingInstitute (KHI) to transfer technology and to develop 2X4 housing, new golf courses, and on green-belt areas.
Wood product exporting countries - New Zealand, Canada, Australia and the Scandinavian countries - activelyparticipated in the Kyoung Hyang Housing Fair and Seoul living Design Fair as annual events in Korea. Theirexhibition extends to wood samples and technical publications.
Market Development Strategies
The overall size of the domestic market is expected to expand along with the economic recovery of theconstruction sector boosted by government support programs. Government deregulation on housingconstruction should encourage local wood related industries to meet higher demand of structural material,furniture and interior.
The government claims that because of a May 2001 tax break the number of unsold housing units fell from65,000 to 13,000 by early June 2001 over the year earlier. The housing construction industries are planningto increase the housing supply for the second half of 2001.
Remodeling and reconstruction for old buildings have led to greater demand for hardwood veneer laminatedproducts by developers who are increasingly using veneer based wood products to save construction costs. Their use of veneer based products is generating demand for particle board and MDF interior accessories, suchas kitchen cabinets, doors, window and interior trimmings.
Zoning restrictions were removed allowing construction on land previously zoned for golf courses and forgreen-belt preservation. Green belts are undeveloped land along river systems - similar to urban flood zonesin the U.S. A new town project located at Pan-Gyo near Seoul is expected to be a good opportunity for woodframe house construction during 2005 - 2008. The housing site has at 3 million square meters, composed of40 percent for single family houses, 18 percent for multi family houses and 42 percent for high riseapartments.
The success of burn test on major structural systems of light weight wood frame houses is expected for theKorean building code to allow multi family food frame housing. Wood frame housing circles expect the

GAIN Report #KS1041 Page 7 of 41
UNCLASSIFIED Foreign Agricultural Service/USDA
building code to be revised year in order.
The steel home industry has been successful in obtaining government recognition for light frame steel homebuilding technology. They expect to build 1,200 units for 2001. The development of steel house constructionis closely related with the greater demand of wood products for interior.
MARKET SEGMENT ANALYSIS
Construction Sector
Overview
GDP growth rate in 2001 is forecast between 3.5 - 4 percent, sharply below the 8.8 percent level of 2000. Inthe first quarter of 2001, the delayed restructuring of financial and business sectors has weakened the Koreaneconomy. Despite the strong dollar, the growth rate of Korean exports for the first quarter 2001 was negative. Korean imports also registered a steep decline as the import demand of raw materials for processing andcapital goods dropped.
The Ministry of Construction and Transportation (MOCT) has set the CY 2001 goal for new housing starts at500,000 units. New housing starts in CY2000 totaled 433,488 units, up 7 percent from 1999. However,echoes from the economic slump have prolonged the recession in the housing and construction sector. For thefirst quarter 2001, the recession in the housing and construction sector has worsened due to restructuring oflarge construction companies which has in turn seriously affected other firms. Building starts for the first fourmonths in 2001 dropped 22.2 percent to 90,674 units from last year’s 116,516 units.
Building permits in CY 2000 rose 12 percent over the 1999. The increase of commercial construction permitsoffset the decrease of dwelling permits. So far in 2001, building permits remain unchanged from the level ofprevious year.
While demand for new homes weakened, the renovation market targeting old apartments and office buildingshas emerged as a new business for large developers since 2000. Older apartments are now rebuilding orrenovating. The Ministry of Construction and Transportation has provided a support plan to stimulate therenovation market. Though official data is not available, the Korea Construction Association (KCA)estimated the remodeling market at US$ 5 billion in 2000 and is expected to grow in the years to come.
Remodeling increases greater market opportunities for such wood products as flooring, wall panel, built-infurniture, door/window and trimming of ceiling parts. However, solid wood is not likely to be a major rawmaterial in this market because of its higher price than composite products laminated by veneer. Veneer hasgreat potential in this market because of the greater demand of composite products such as plywood, particleboard and MDF is essential to use veneer as lamination.
The wood frame housing market is also affected by the slump. Building permits of wood frame housing forJanuary - February of 2001 increased 38 percent to 25,876 square meters but actual starts are estimated to besubstantially decreased due to the weakened demand. Wholesalers of wood house building materials estimatethat the sales volume plummeted in the first quarter but showed a gradual rebound in April.

GAIN Report #KS1041 Page 8 of 41
UNCLASSIFIED Foreign Agricultural Service/USDA
This trend should provide a greater potential for the wood frame housing market in the future. Imports ofprepackaged wood frame houses for the first quarter increased 15.1 percent over the same period of 2000. However, the U.S. share dropped to 34 percent of total imports, far below from the 55 percent of last year’sannual market share. The outlook for two-by-four construction is encouraging as deregulation initiatives andbuilding code revisions are favorable for single family and low rise multi-family unit facilities.
Korea is a market with sizable potential for wood products considering current development projects for woodframe housing units, the application of wood products in hybrid buildings and low-rise commercial buildings,the construction for World Cup stadiums across the nation, and other construction using structural lumber andpanel products, including glulam such as church buildings, training centers, restaurants, resort developmentand sports center.
Marketing
The MOCT recently announced a comprehensive plan to establish a new town at Pan-Gyo near Seoul during2005-2008. The new town is planning to build total 20,000 units aimed at low density of population balancedbetween development and the environment. There will be 6,000 single family and low rise multi-family units.
AF&PA Seoul office has actively participated in housing exhibitions to promote wood frame housingconstruction: Kyung-Hyang Housing Fair in Seoul (February), in Pusan (September) and in Chonju (October);Country Home Developers and Builders Trade Fair (September); Korea International Building Expo (earlyDecember); to be participated in Remodeling Show (May). Since 1996, the AF&PA has organized an annualtwo-week training program for Korean carpenters in an attempt to improve Korean carpenters’ skill andknowledge on wood house construction.
AF&PA’s technical assistance encouraged the Habitat for Humanity Korea to change its policy to use 2x4wood system from steel structure for Jimmy Carter Work Project 2001 of Korea (JCWP2001). The programcalls for 120 units in six locations with two story multi-family home style in 2001. The plan for 2002 is tobuild 300 units. JCWP delivered 24 containers of dimension lumber purchased from the United States inMay. This year project will be a very important to promote multi family wood frame construction in Korea interms of building code restriction.
A Street of Dream Project launched in December 2000 plans to build 34 units of single detached wood framehouse as a pilot project in Yangpyong, Kyunggi province. If the project is successful, the developer will build100 units per annum from 2002 on.
The Korean steel home industry led by the Pohang Steel Company was successful in obtaining the governmentrecognition for light frame steel home building technology. The MOCT recently designated steel houseconstruction as a new technology. This should increase consumer’s confidence for wood frame house asalternative construction technologies are becoming more widely accepted.
It is now estimated that there are twenty colleges and universities across the nation that teach the technology ofwood frame construction. This is thanks to U. S. efforts to transfer the technology of wood frame housingconstruction. The curriculum of wood frame construction was taught by only one university five years ago. Ithas extended to most professors and instructors of universities who had participated in the AF&PA technical

GAIN Report #KS1041 Page 9 of 41
UNCLASSIFIED Foreign Agricultural Service/USDA
training programs. Moreover, there are about ten wood frame training academies operated by private industryor vocational schools.
The Fabricated Structural Members Market
A government agency responsible for preserving cultural properties has decided to build a cultural museum bythe application of glulam structure. The decision was apparently affected from AF&PA’s technology transferprograms. The size of the building is 9,250 square feet with 3 stories. AF&PA technical assistance providedthe concerned staff with design information and helped to identify glulam exporters from the United States. Once this project is successful, several more museums will be of constructed glulam, the government officialsaid. So far glulam is seen as a structural member mainly for church buildings. This will be the first glulambuilding if the museum is built.
The use of engineered wood products such as composite lumber, I-joists and laminated veneer lumber(LVL)are growing along with the expansion of wood frame construction and interior sectors. The U.S. market share of dimension lumber and OSB is low due to higher price. Non-existence of buildingcodes to regulate inspection and standards for materials are major reasons for low market share of the U.S.products.
Policy
The Korean building code restricts building height and total allowable floor area. Revision of the buildingcode, a priority in the wood construction industry, is expected to be enacted by early 2002. The proposedrevision would allow wood frame constructed multi-unit buildings of up to three stories.
AF&PA has contracted with the Fire Insurers Laboratory of Korea (FILK) to conduct a burn test on majorstructural systems of light weight wood frame houses. The test on walls and floor systems took place in May2001. The test result is supposed to refer to the change of the Korean building code to allow multi family foodframe housing. Wood frame housing circles expect to the revised building code effective next year in order.
In CY 2001, the Korean government plans to invest 14.63 trillion Korean won (equivalent to US$ 12 billion)into infrastructure projects, up 4 percent from the previous year. Major projects include: completion of theInternational Airport in Inchon; a Seoul-Pusan high-speed railway line; a new container terminal near the portcity of Pusan; and two new harbor expansion works aimed at making Korea an international shipping hub.
To boost the construction sector, the Korean government has deregulated the height restriction of housingconstruction in green-belt area to four stories from the current two stories. The revised regulation is expectedto offer greater opportunity for multi-story-and-multi-family wood frame houses. Korea has kept about 16,500square kilometers designated as green-belt to protect the environment and prevent urban sprawl.
Trade
The housing slump discouraged imports of temperate hardwood lumber. U.S. exports of temperate hardwoodlumber declined 20 percent in 2000 from the previous year and has declined 19 percent further in the first fourmonths 2001. High inventory in the stockyard has prevented importers from buying new contracts.

GAIN Report #KS1041 Page 10 of 41
UNCLASSIFIED Foreign Agricultural Service/USDA
In 2000, U. S. veneer exports to Korea rose 19 percent over 1999 and veneer log 30 percent, respectively. Theprolonged slump in the housing construction and interior sector has led veneer laminated wood products toreplace solid wood products. Combined with the growing demand of flooring, veneer imports are expected tocontinue increasing in 2001. The preferred species for veneer are cherry, hard maple and beech.
Furniture & Interiors Sector
Overview
The furniture and interior sectors have traditionally been the largest users of U.S. hardwoods. However, theeconomic slowdown in construction has made furniture sales slow while the demand for renovation materialshas increased. After recovering slightly from the economic crisis of 1998, Korea’s furniture industry hassuffered in line with the slump in the housing and construction sectors since the second half of 2000. Reduceddemand, relatively high prices, strong competition from Southeast Asia and China led to the almostdismantling of Korea’s furniture manufacturing industry. Furniture manufacturers still in operation havesubstituted wood veneer with artificial veneer due to cost savings.
The interior industry shows better prospects for near by growth than furniture. Opportunities for U.S.hardwood products abound in the interiors/renovations sector. Korea Construction Association estimates thepotential of the renovation market is growing year-by-year as more old buildings are being renovated. Flooring, wall and ceiling panels, built-in furniture and doors and windows are areas in the greateropportunities. Veneer has the greatest potential in this market because composite products laminated byveneer have substituted lumber to save the cost of interior and furniture. The Korea Federation of Furniture Industry Cooperatives (KFFIC) put the growth rate of CY2001 furnitureproduction at zero, in response to the current slow economy in the construction sector.
The Interior Contractors Committee (ICC) forecasts the CY 2001 Korean interior market will only slightlyincrease from the previous year because of slow growth in the construction sector. The 2001 projection isbased on the interior industry’s expanding in remodeling and reconstruction from commercial building toresidential apartments.
Marketing
Prospects for the furniture market are closely linked to the economy which most sources expect to grow onlyslowly over the next 12 months. Consumer’s furniture preference shows younger couples focusing on modernfashion with simplicity and the middle aged going for classic style natural wood furniture like stand-alonestyle furniture. However, local manufacturers have substituted artificial coated paper for wood veneer tocompete with lower priced furniture imported from the Southeast Asian countries.
For the promotion of hardwood, AF&PA Seoul continues holding the Biennial Furniture Design Competitionto improve familiarity among local design students. During the fair of Seoul Living Design, AF&PA Seoulheld a round table meeting with hardwood importers and local trade journalists to hear about buyers’ concern,constraints and complaints on U. S. wood products. Their general concern was the high cost upon importingU.S. hardwood products.

GAIN Report #KS1041 Page 11 of 41
UNCLASSIFIED Foreign Agricultural Service/USDA
Leading kitchen cabinet manufacturers influenced by the Living Design Fair initiated by the AHEC held theirown design contest events. They call for applications in three categories to include design for multi familyhomes, interior design and furniture design.
Policy
The consumption tax on furniture was reduced early in 2001 to boost high end furniture consumption. Underthe revised law, the value of furniture subject to the special consumption tax has been raised from 3 millionWon to 5 million Won per piece and from 5 million Won to 8 million Won per set.
Trade
While the slump in the furniture sector continued for the first quarter, the renovation market expanded but notenough to spur demand of solid wood products due to price factor. As an effort to get out of the slump,Korean industries started to use cheaper priced non-wood products for furniture and interior decoration. American hardwood lumber was hit hard by such a substitution of non-wood materials for renovation andinterior sectors.
For the first four months of 2001, as a result, overall imports of wood products decreased 15 percent from thesame period of 2000 along with the 2 percent decrease from the U.S. Import value of hardwood lumberdropped 20 percent for this period. Major species are cherry, maple and white oak followed by aspen and ash.
In 2001, the furniture industry estimates the furniture production to remain unchanged from the previous yeardue to the slow growth of housing construction. Furniture trade is expected to stay around at the similar levelof 2000 in line with the development of housing construction economy.
Material Handling Industry
Since 1998, pallet production grew at an annual 14 percent rate, according to the tri-annual Korea PalletAssociation’s (KPA) survey. The 2000 pallet production reached at the range of 10 - 11 million units worth250-300 billion Korean won ( equivalent to US$210-250 million). In CY 2001, the KPA expects the growthrate of pallet production to be lower than previous years due to a decrease in Korean exports since the secondhalf of last year. In the long run, the KPA predicts annual pallet production to reach to the level of 20 millionunits in 5 years.
The total pallet market hovered around 50 million units. Market share of wood pallets is at 70 percent, plasticpallets at 25 percent and other pallets such as iron and paper at 5 percent, respectively. Local pallet producerscontinue to increase the production of plastic pallets which have longer durability than wood and minimizesdamage caused by nails in wood pallets. Spurring on demand for plastic pallets are requests from Australianand French importers for Korean exporters use plastic pallets to eliminate potential quarantine problems. KPAanticipates the market share of plastic pallet to grow to 30 percent in 5 years.SECTION III. STATISTICAL TABLES
Strategic Indicator Tables

GAIN Report #KS1041 Page 12 of 41
UNCLASSIFIED Foreign Agricultural Service/USDA
STRATEGIC INDICATOR TABLE: FOREST AREASTRATEGIC INDICATOR TABLE: FOREST AREA (million hectares/million cum)
Country: Korea, Republic of Previous Current FollowingReport Year: 2001 Calendar Year Calendar Year Calendar YearTotal Land Area 9.94 9.94 9.94Total Forest Area 6.43 6.425 6.42--of which, Commercial 4.994 5.003 5.008----of commercial, tropical hardwood 0 0 0----of commercial, temperate hardwood 1.303 1.3 1.3----of commercial, softwood 2.117 2.1 2.1--of forest area, non-commercial 1.436 1.405 1.38Forest Type--Of which, virgin 3.63 3.625 3.62--Of which, plantation 2.3 2.3 2.3--Of which, other commercial (regrowth) 0.5 0.5 0.5Forest Ownership--Nationally owned and no commercial access 0.32 0.32 0.32--Nationally owned, commercial loggingpermitted
1.106 1.11 1.11
--Other publicly owned land, no commercialaccess
0.111 0.116 0.116
--Other publicly owned, logging permitted 0.376 0.37 0.37--privately owned commercial forest 3.512 3.512 3.512Total Volume of Standing Timber 387.8 412 436--Of which, Commercial Timber 301.1 321 340Annual Timber Removal 1.6 1.5 1.5Annual Timber Growth Rate 6 6 6Annual Allowable Cut 1.6 1.5 1.5
Source: Korea Forestry Administration

GAIN Report #KS1041 Page 13 of 41
UNCLASSIFIED Foreign Agricultural Service/USDA
STRATEGIC INDICATOR TABLE: CONSTRUCTION MARKET
STRATEGIC INDICATOR TABLE: CONSTRUCTION MARKET
Country:Korea, Republic of Previous Current FollowingReport Year:2001 Calendar Year Calendar Year Calendar YearTotal Housing Starts (number of units) 433,488 400,000 450,000--Of which, wood frame 1,309 1,500 2,000--Of which, steel, masonry, other materials 432,179 398,500 448,000--Of total starts, residential 433,488 400,000 450,000----Of residential, single family 34,777 32,000 38,000----Of residential, multi-family 398,777 368,000 412,000--Of total starts, commercial 433,488 400,000 450,000Total Value of Commercial Construction Market($US million)
24,133 24,000 25,000
Total Value of Repair and Remodeling Market($US million)
na na na
Are tariffs on softwood from the United Stateshigher, equal or lower than softwood importedfrom other countries? 1/
equal equal equal
Are tariffs on plywood from the United Stateshigher, equal or lower than plywood importedfrom other countries? 1/
equal equal equal
Are non-tariff barriers on softwood from theUnited States higher, equal or lower than softwoodimported from other countries? 1/
equal equal equal
Are non-tariff barriers on plywood from theUnited States higher, equal or lower than plywoodimported from other countries? 1/
equal equal equal
Are there market development programs forconstruction, softwood or plywood imports fundedby foreign governments?
no no no
If yes, identify the following: --Country(ies) --Form(s) of competition: Export subsidy, tradeshow, trade servicing, permanent marketrepresentative (number), permanent office(location), or other. 2/
na na na
--Estimated annual market expansion outlay ($USmillion) by country
na na na

GAIN Report #KS1041 Page 14 of 41
UNCLASSIFIED Foreign Agricultural Service/USDA
Is the acceptability of U.S. style timber frameconstruction (i.e., per building codes, mortgageavailabity, etc.) high, medium or low? 3/
low low low
Are consumer preferences for solid wood materialsvis-a-vis non-wood materials in construction high,medium or low? 3/
high high high
From Post's experience, is the willingness of U.S.suppliers to deliver product per importers'specifications low, medium or high? 3/
medium medium medium
If price quotes for construction and structuralwood products are available, identify the leadingsource(s)
Traders,ForestryAdministration
1/ If other than equal, explain in report text.2/ If "other", then explain in report text.3/ If low or medium, explain in report text.Source: Post’s Estimate, Ministry of Construction and Transportation (MOCT)

GAIN Report #KS1041 Page 15 of 41
UNCLASSIFIED Foreign Agricultural Service/USDA
STRATEGIC INDICATORS TABLE: FURNITURE & INTERIORS MARKET
STRATEGIC INDICATORS TABLE: FURNITURE & INTERIORS MARKET
Country: Korea, Republic of Previous Current FollowingReport Year:2001 Calendar Year Calendar Year Calendar YearTotal Housing Starts (number of units) 433,488 400,000 450,000Total Number of Households) 14,318 14,478 14,638Furniture Production ($US million) 3,100 2,800 3,000Interiors Market Size ($US million) 2,600 2,700 2,800Total Furniture Imports ($US million) 318 300 320Total Furniture Exports ($US million) 275 280 285Are tariffs on hardwood from the United Stateshigher, equal or lower than hardwood importedfrom other countries? 1/
equal equal equal
Are non-tariff barriers on hardwood from theUnited States higher, equal or lower thanhardwood imported from other countries? 1/
equal equal equal
Are there market development programs forfurniture or interiors market expansion funded byforeign governments?
none none none
If yes, identify the following: na na na--Country(ies) 2/ na na na--Form(s) of competition: Export subsidy, tradeshow, trade servicing, permanent marketrepresentative (number), permanent office(location), or other. 3/
na na na
--Estimated annual market expansion outlay ($USmillion) by country
na na na
From Post's experience, is the willingness of U.S.suppliers to deliver product per importers'specifications low, medium or high? 4/
high high high
If price quotes for furniture and interiors productsare available, identify the leading source(s)
na na na
1/ If other than equal, explain in text.2/ If more than one country, report each countryindividually.3/ If "other", explain form of subsidy in text.

GAIN Report #KS1041 Page 16 of 41
UNCLASSIFIED Foreign Agricultural Service/USDA
4/ If low or medium, explain in test.Source: Agricultural Affairs

GAIN Report #KS1041 Page 17 of 41
UNCLASSIFIED Foreign Agricultural Service/USDA
STRATEGIC INDICATOR TABLE: MATERIAL HANDLING MARKET
STRATEGIC INDICATOR TABLE: MATERIAL HANDLING MARKET
Country: Korea, Republic of Previous Current FollowingReport Year:2001 Calendar Year Calendar Year Calendar YearTotal Value of Industrial Output ($US million) 550 600 650New Pallet Production (million units) 10 11 12Are consumer preferences for solid wood palletsand packaging materials vis-a-vis non-woodmaterials high, medium or low? 1/
high high high
Are industry/trade preferences forrepaired/recycled pallets over new pallets low,medium or high? 1/
high high high
From Post's experience, is the willingness of U.S.suppliers to deliver product per importers'specifications low, medium or high? 1/
na na na
Identify leading source(s) of price quotes: producers producers producersAre there market development programs for thematerials handling market expansion funded byforeign governments?
no no no
If yes, identify the following: na na na--Which Countries? na na na--Form(s) of competition: Export subsidy, tradeshow, trade servicing, permanent marketrepresentative (number), permanent office(location), or other. 2/
na na na
--Estimated annual market expansion outlay ($USmillion) by country
na na na
1/ If low or medium, explain in text of report.2/ If "other", explain in text of report.Source: Agricultural Affairs
STRATEGIC INDICATOR TABLE: WOOD PRODUCTS SUBSIDIES
GAIN Report #KS1041 Page 18 of 41
UNCLASSIFIED Foreign Agricultural Service/USDA
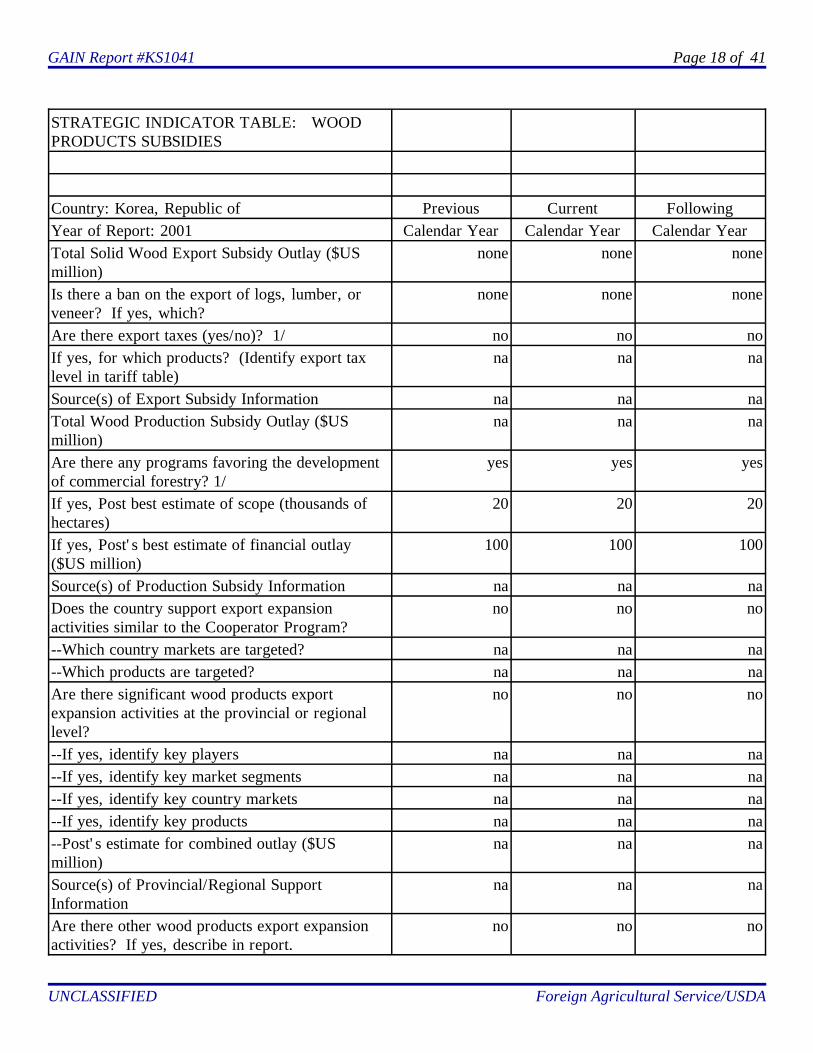
STRATEGIC INDICATOR TABLE: WOODPRODUCTS SUBSIDIES
Country: Korea, Republic of Previous Current FollowingYear of Report: 2001 Calendar Year Calendar Year Calendar YearTotal Solid Wood Export Subsidy Outlay ($USmillion)
none none none
Is there a ban on the export of logs, lumber, orveneer? If yes, which?
none none none
Are there export taxes (yes/no)? 1/ no no noIf yes, for which products? (Identify export taxlevel in tariff table)
na na na
Source(s) of Export Subsidy Information na na naTotal Wood Production Subsidy Outlay ($USmillion)
na na na
Are there any programs favoring the developmentof commercial forestry? 1/
yes yes yes
If yes, Post best estimate of scope (thousands ofhectares)
20 20 20
If yes, Post's best estimate of financial outlay($US million)
100 100 100
Source(s) of Production Subsidy Information na na naDoes the country support export expansionactivities similar to the Cooperator Program?
no no no
--Which country markets are targeted? na na na--Which products are targeted? na na naAre there significant wood products exportexpansion activities at the provincial or regionallevel?
no no no
--If yes, identify key players na na na--If yes, identify key market segments na na na--If yes, identify key country markets na na na--If yes, identify key products na na na--Post's estimate for combined outlay ($USmillion)
na na na
Source(s) of Provincial/Regional SupportInformation
na na na
Are there other wood products export expansionactivities? If yes, describe in report.
no no no

GAIN Report #KS1041 Page 19 of 41
UNCLASSIFIED Foreign Agricultural Service/USDA
Source: Agricultural Affairs

GAIN Report #KS1041 Page 20 of 41
UNCLASSIFIED Foreign Agricultural Service/USDA
STRATEGIC INDICATOR TABLE: FOREST PRODUCT TARIFFS AND TAXES
STRATEGIC INDICATOR TABLE: FOREST PRODUCT TARIFFS AND TAXES(PERCENT)Tariff Tariff Other
Country:Korea, Repof
Product Current Following Import Total Cost Export
Report Year:2001 Description Year Year Taxes/Fees
of Import Tax
4401 Wood Chips, fuel wood 1/ 2 2 12 na4403 Tropical Roundwood 2/ 1 1 12 na4403 Other Roundwood 2/ 2 2 12 na4404 Sticks etc 5 5 12 na4405 Wood wool 5 5 12 na4406 Railway ties 5 5 12 na4407 Lumber 5 5 12 na4408 Veneer 5 5 12 na4409 Fihished Lumber 8 8 12 na4410 Particle board 8 8 12 na4411 Fiberboard 8 8 12 na4412 Plywood 3/ 8 8 12 na4413 Densified wood 8 8 12 na4414 Wooden frames 8 8 12 na4415 Packing cases 8 8 12 na4416 Casks 8 8 12 na4417 Tools 8 8 12 na4418 Builders' joinery 8 8 12 na4419 Tableware/Kitchenware 8 8 12 na4420 Wood marquetry 8 8 12 na4421 Other articles of wood 8 8 12 na4422 na na na 12 na4423 na na na 12 na4424 na na na 12 na4425 na na na 12 na
9406 Pre-fabricated Houses 8 8 12 na1/ Quota tariff reduced to one percent for temperate hardwood chips (for pulp).2/ Quota tariff reduced to zero percent for all imported logs.3/ Quota tariff reduced to 2.5 percent for all imported veneer thicker than 0.5 mm.4/ Adjusted tariff increased to 14 percent for thicker than 6 mm.Source: Korea Customs Service (KCS), Agricultural Affairs.

GAIN Report #KS1041 Page 21 of 41
UNCLASSIFIED Foreign Agricultural Service/USDA
PS&D Tables and Trade Matrices
Temperate Hardwood Logs PSDPSD TableCountry Korea, Republic ofCommodity Temperate Hardwood Logs 1000 CUBIC METERS
Revised 2000 Preliminary
2001 Forecast 2002
Old New Old New Old NewMarket Year Begin 01/2000 01/2001 01/2002
Production 450 733 450 680 0 700Imports 250 249 280 260 0 280TOTAL SUPPLY 700 982 730 940 0 980Exports 0 0 0 0 0 0Domestic Consumption 700 982 730 940 0 980TOTAL DISTRIBUTION 700 982 730 940 0 980
Import Trade Matrix- Temperate Hardwood Logs
Import Trade MatrixCountry Korea, Republic ofCommodity Temperate Hardwood LogsTime period JAN/DEC Units: 1,000 CUMImports for: 1999 2000U.S. 24 U.S. 31Others OthersRussia 17 Russia 17Malaysia 41 Malaysia 8PNG 118 PNG 141China 8 China 12
Solomon 21
Total for Others 184 199Others not Listed 23 19Grand Total 231 249Source:Korea Customs Service(KCS)

GAIN Report #KS1041 Page 22 of 41
UNCLASSIFIED Foreign Agricultural Service/USDA
Tropical Hardwood Logs PSD
PSD TableCountry Korea, Republic ofCommodity Tropical Hardwood Logs 1000 CUBIC METERS
Revised 2000 Preliminary
2001 Forecast 2002
Old New Old New Old NewMarket Year Begin 01/2000 01/2001 01/2001
Production 0 0 0 0 0 0Imports 1000 682 1200 600 0 600TOTAL SUPPLY 1000 682 1200 600 0 600Exports 0 0 0 0 0 0Domestic Consumption 1000 682 1200 600 0 600TOTAL DISTRIBUTION 1000 682 1200 600 0 600
Import Trade Matrix- Tropical Hardwood Logs
Import TradeMatrixCountry Korea, Republic ofCommodity Tropical Hardwood LogsTime period JAN/DEC Units: 1000CUMImports for: 1999 2000U.S. 7 U.S. 0Others OthersMalaysia 310 Malaysia 311PNG 262 PNG 175Solomon Is. 90 Solomon Is. 112New Zealand 140 New Zealand 10Russia 34 Russia 11
Total for Others 836 619Others not Listed 35 63Grand Total 878 682Source:Korea Customs Service(KCS))

GAIN Report #KS1041 Page 23 of 41
UNCLASSIFIED Foreign Agricultural Service/USDA
Softwood Logs PSD
PSD TableCountry Korea, Republic ofCommodity Softwood Logs 1000 CUBIC METERS
Revised 2000 Preliminary
2001 Forecast 2002
Old New Old New Old NewMarket Year Begin 01/2000 01/2001 01/2002
Production 1100 859 1100 800 0 900Imports 6000 5940 6500 6000 0 6500TOTAL SUPPLY 7100 6799 7600 6800 0 7400Exports 0 0 0 0 0 0Domestic Consumption 7100 6799 7600 6800 0 7400TOTAL DISTRIBUTION 7100 6799 7600 6800 0 7400
Import Trade Matrix- Softwood Logs
Import TradeMatrixCountry Korea, Republic ofCommodity Softwood LogsTime period JAN/DEC Units: 1,000 CUMImports for: 1999 2000U.S. 326 U.S. 361Others Others New Zealand 3216 New Zealand 3364Russia 1144 Russia 1511Australia 381 Australia 550Chile 356 Chile 92
Total for Others 5097 5517Others not Listed 38 62Grand Total 5461 5940Source:Korea Customs Service(KCS)

GAIN Report #KS1041 Page 24 of 41
UNCLASSIFIED Foreign Agricultural Service/USDA
Value of Logs Imports per Country
Korea: Value of Logs Imports per CountryUnit: 1,000US$
Country 1998 1999 2000
United States 49,433 70,768 77,208
New Zealand 133,883 200,932 211,352
Russia 44,737 72,988 98,253
Malaysia 33,271 51,812 51,479
PNG 28,124 45,647 38,033
Chile 25,350 24,051 6,473
Australia 16,029 22,871 36,337
Solomon Is. 10,496 13,075 18,045
Others 8,332 18,511 23,213
Total 349,655 520,655 560,393
Source: Forest Administration

GAIN Report #KS1041 Page 25 of 41
UNCLASSIFIED Foreign Agricultural Service/USDA
Temperate Hardwood Lumber PSD
PSD TableCountry Korea, Republic ofCommodity Temperate Hardwood Lumber 1000 CUBIC METERS
Revised 2000 Preliminary
2001 Forecast 2002
Old New Old New Old NewMarket Year Begin 01/2000 01/2001 01/2002
Production 73 73 82 76 0 82Imports 260 223 290 200 0 250TOTAL SUPPLY 333 296 372 276 0 332Exports 1 5 1 5 0 5Domestic Consumption 332 291 371 271 0 327TOTAL DISTRIBUTION 333 296 372 276 0 332
Import Trade Matrix- Temperate Hardwood Lumber
Import TradeMatrixCountry Korea, Republic ofCommodity Temperate Hardwood LumberTime period JAN/DEC Units: 1000 CUMImports for: 1999 2000U.S. 65 U.S. 48Others OthersChina 79 China 95Canada 8 Canada 12Malaysia 23 Malaysia 16EU 5 EU 4Indonesia 36 Indonesia 40
Total for Others 151 167Others not Listed 15 8Grand Total 231 223Source: Korea Customs Service(KCS)

GAIN Report #KS1041 Page 26 of 41
UNCLASSIFIED Foreign Agricultural Service/USDA
Hardwood Lumber Imports From U.S.
Korea: Hardwood Lumber Imports From U.S. (CUM and US$ Thousand)
Species 1998 1999 2000
Volume Value Volume Value Volume Value
Oak 14,212 8,716 24,545 14,610 16,345 10,447
Maple 12,943 8,517 21,000 14,992 13,547 10,484
Poplar 991 504 2,301 1,031 1,889 1,002
Basswood 697 512 1,794 1,057 1,543 975
Ash 916 630 3,727 2,033 3,815 2,306
Other 6,152 3,643 11,912 8,728 11,071 8,641
Total 35,911 22,522 65,279 42,451 48,210 33,855
Source: Korea Customs Service (KCS)
Korea: Hardwood Lumber Imports From U.S. (CUM and US$ Thousand)
Species 2000(1-3) 2001(1-3)
Volume Value Volume Value
Oak 5,186 3,376 3,153 2,076
Maple 3,996 2,793 2,823 2,063
Poplar 439 221 340 173
Basswood 596 337 163 138
Ash 826 496 757 498
Other 2,980 2,301 2,637 2,771
Total 14,023 9,524 9,873 7,719
Source: Korea Customs Service (KCS)

GAIN Report #KS1041 Page 27 of 41
UNCLASSIFIED Foreign Agricultural Service/USDA
Tropical Hardwood Lumber PSD
PSD TableCountry Korea, Republic ofCommodity Tropical Hardwood Lumber 1000 CUBIC METERS
Revised 2000 Preliminary
2001 Forecast 2002
Old New Old New Old NewMarket Year Begin 01/2000 01/2001 01/2001
Production 219 142 292 146 0 140Imports 370 299 400 300 0 300TOTAL SUPPLY 589 441 692 446 0 440Exports 0 3 0 3 0 3Domestic Consumption 589 438 692 443 0 437TOTAL DISTRIBUTION 589 441 692 446 0 440
Import Trade Matrix- Tropical Hardwood Lumber
Import TradeMatrixCountry Korea, Republic ofCommodity Tropical Hardwood LumberTime period JAN/DEC Units: 1000CUMImports for: 1999 2000U.S. 0 U.S. 0Others OthersMalaysia 149 Malaysia 147Indonesia 158 Indonesia 139
Total for Others 307 286Others not Listed 14 13Grand Total 321 299Source: Korea Customs Service(KCS)

GAIN Report #KS1041 Page 28 of 41
UNCLASSIFIED Foreign Agricultural Service/USDA
Softwood Lumber PSD
PSD TableCountry Korea, Republic ofCommodity Softwood Lumber 1000 CUBIC METERS
Revised 2000 Preliminary
2001 Forecast 2002
Old New Old New Old NewMarket Year Begin 01/2000 01/2001 01/2001
Production 4030 4044 4322 4070 0 4200Imports 280 216 320 200 0 250TOTAL SUPPLY 4310 4260 4642 4270 0 4450Exports 10 13 15 15 0 15Domestic Consumption 4300 4247 4627 4255 0 4435TOTAL DISTRIBUTION 4310 4260 4642 4270 0 4450
Import Trade Matrix- Softwood Lumber
Import TradeMatrixCountry Korea, Republic ofCommodity Softwood LumberTime period JAN/DEC Units: 1,000 CUMImports for: 1999 2000U.S. 13 U.S. 13Others OthersCanada 62 Canada 43New Zealand 52 New Zealand 39Chile 59 Chile 42Indonesia 10 Indonesia 2Brazil 16 Brazil 28China 10 China 13South Africa 7 South Africa 5Russia 10 Russia 24
Total for Others 226 196Others not Listed 6 7Grand Total 245 216Source: Korea Customs Service(KCS)

GAIN Report #KS1041 Page 29 of 41
UNCLASSIFIED Foreign Agricultural Service/USDA
Softwood Lumber Imports From U.S.
Korea: Softwood Lumber Imports From U.S.(CUM and US$ Thousand)
Species 1998 1999 2000
Volume Value Volume Value Volume Value
Cedar 82 39 232 92 300 131
Douglas Fir 27 10 1,453 361 401 155
Whitewood or Fir 1,066 547 996 460 2000 791
Spruce 3,721 4,682 9,409 5,696 9,559 7,143
Other 1,424 2,777 1,424 2,777 885 1,022
Total 6,320 8,055 13,216 7,975 13,145 9,242
Source: Korea Customs Service (KCS)
Korea: Softwood Lumber Imports From U.S.(CUM and US$ Thousand)
Species 2000(1-3) 2001(1-3)
Volume Value Volume Value
Cedar 9 20 69 32
Douglas Fir 122 43 0 0
Whitewood or Fir 658 279 359 107
Spruce 2,609 1,361 1,311 1,401
Other 199 159 258 499
Total 3,597 1,862 1,997 2,039
Source: Korea Customs Service (KCS)

GAIN Report #KS1041 Page 30 of 41
UNCLASSIFIED Foreign Agricultural Service/USDA
Value of Lumber Imports per Country
Korea: Value of Lumber Imports per Country(Unit: 1,000US$)
Country 1998 1999 2000
United States 30,630 51,099 43,695
Malaysia 39,896 47,328 42,298
Indonesia 31,149 60,715 56,026
Chile 17,668 21,765 13,731
China 17,068 26,130 31,179
New Zealand 7,806 10,381 5,586
Canada 6,927 14,849 21,001
Brazil 5,117 14,906 17,823
Others 9,362 13,780 13,859
Total 165,523 260,953 245,198
Source: Forest Administration

GAIN Report #KS1041 Page 31 of 41
UNCLASSIFIED Foreign Agricultural Service/USDA
Veneer PSD
PSD TableCountry Korea, Republic ofCommodity Hardwood Veneer 1000 CUBIC METERS
Revised 2000 Preliminary
2001 Forecast 2002
Old New Old New Old NewMarket Year Begin 01/2000 01/2001 01/2002
Production 0 0 0 0 0 0Imports 220 190 325 185 0 200TOTAL SUPPLY 220 190 325 185 0 200Exports 0 0 0 0 0 0Domestic Consumption 220 190 325 185 0 200TOTAL DISTRIBUTION 220 190 325 185 0 200Note: Included softwood veneer in import data.
Import Trade Matrix- Veneer
Import TradeMatrixCountry Korea, Republic ofCommodity Hardwood VeneerTime period JAN/DEC Units: 1000 CUMImports for: 1999 2000U.S. 5 U.S. 5Others OthersMalaysia 87 Malaysia 148Brazil 10 Brazil 18Chile 9 Chile 7China 4 China 4Indonesia 1 Indonesia 0
Total for Others 111 177Others not Listed 5 8Grand Total 121 190Note: Included softwood veneer.Source: Korea Customs Service(KCS)

GAIN Report #KS1041 Page 32 of 41
UNCLASSIFIED Foreign Agricultural Service/USDA
Value of Veneer Imports per Country
Korea: Value of Veneer Imports per CountryUnit: 1,000US$
Country 1998 1999 2000
United States 8,217 11,065 13,084
Malaysia 10,604 17,688 30,376
Chile 5,671 2,235 1,927
Brazil 5,525 2,861 5,943
China 5,172 5,416 6,559
EU 4,214 6,062 9,474
Others 3,222 6,714 8,594
Total 42,625 52,041 75,957
Source: Forest Administration

GAIN Report #KS1041 Page 33 of 41
UNCLASSIFIED Foreign Agricultural Service/USDA
Other Tables
Supply of Domestic Roundwood
Korea: Supply of Domestic Roundwood(1,000 CUM)
Year Pit props Pulp Lumber/Board Total
1995 139 405 512 1,055
1996 109 392 694 1,195
1997 104 367 591 1,062
1998 110 406 912 1,428
1999 117 410 1,167 1,694
2000 112 552 928 1,592
2001 1/ 110 500 890 1,500
1/ ProjectionSource: Korea Forestry Administration Wood Products Production
Korea: Wood Products Production (1,000 CUM)
Items 1998 1999 2000
Softwood Lumber 2,680 3,857 4,044
Tropical Hardwood Lumber 177 244 142
Temperate Hardwood Lumber 49 67 73
Sub Total, Lumber 2,906 4,168 4,259
Plywood 641 734 747
Fiberboard 583 844 943
Particle board 507 672 722
Grand Total 4,637 6,418 6,671
Source: Agricultural Affairs, Korea Plywood Industry Association (KPIA)
Government Investment for Infrastructure

GAIN Report #KS1041 Page 34 of 41
UNCLASSIFIED Foreign Agricultural Service/USDA
KOREA: Government Investment for Infrastructure(Billion Korean Won)
Item 2000 2001
Roads 7,341 7,637
Railways 2,189 2,462
Subway 1,175 919
Airports 741 341
Water Resources 1,087 1,277
Harbors 964 1,012
Others 580 984
Total 14,077 14,632
Source: Ministry of Construction and Transportation(MOCT)

GAIN Report #KS1041 Page 35 of 41
UNCLASSIFIED Foreign Agricultural Service/USDA
Value of Domestic Construction Orders Comparison for 1999 and 2000
Korea: Value of Domestic Construction Orders Comparison for 1999 and 2000(Billion Korean Won, By the Type of Construction )
Sector 1999 2000 Changes(%)
Building, subtotal 22,455 27,285 22
-Dwelling 17,402 20,031 15
-Office & Stores 1,648 3,461 110
-Factory & Storage 716 1,031 44
-Public Office 1/ 1,253 1,299 4
-Others 1,436 1,463 2
Civil Engineering, subtotal 13,650 14,354 5
-Forestry Conservancy & Water Control 78 301 286
-Agriculture & Fisheries 268 324 21
-Roads & Bridge 5,058 6,793 34
-Harbors& Airports 1,182 827 -30
-Railways & Track 2,002 1,097 -45
-Water Supply & Sewage 1,462 1,116 -24
-Generation of Electricity 2/ 631 744 18
-Land Development 3/ 737 1,427 94
-Dams 57 2 -96
-Installation of Machinery 1,951 1,465 -25
-Others 224 258 15
Other Construction, subtotal 192 139 -28
Grand Total 36,297 41,778 15
1/ Including schools and hospitals2/ Including transmission, transformation and distribution3/ Including gardens and groundsSource: National Statistical Office (NSA)

GAIN Report #KS1041 Page 36 of 41
UNCLASSIFIED Foreign Agricultural Service/USDA
Building Construction Permits by Structure
Korea: Building Construction Permits by Structure(Floor area, Thousand Square meters)
Year Total Ferro-Concrete Brick & Stone Wooden Others
1995 117,327 103,134 9,086 89 5,022
1996 113,820 101,940 7,193 131 4,557
1997 113,374 104,214 5,105 173 3,881
1998 50,965 46,701 1,889 113 2,263
1999 72,534 66,192 2,340 142 3,858
2000 81,059 75,292 2,056 178 3,532
Source: Ministry of Construction and Transportation (MOCT)
Building Construction Permits by Use
Korea: Building Construction Permits by Use(Floor area, Thousand Square meters)
Year Total Dwelling Commercial Factory Educational&Social
Other
1995 117,327 62,614 28,549 13,727 6,281 6,157
1996 113,820 61,062 26,862 11,921 6,289 7,682
1997 113,374 62,677 27,918 8,796 6,603 7,379
1998 50,965 31,156 8,753 2,796 3,983 4,279
1999 72,534 44,606 11,746 7,824 4,478 3,882
2000 81,059 41,283 18,882 11,646 5,126 4,121
2001 1/ 80,991 40,045 17,466 13,510 5,536 4,434
1/ Estimated by Agricultural Affairs.Source: Ministry of Construction and Transportation (MOCT)

GAIN Report #KS1041 Page 37 of 41
UNCLASSIFIED Foreign Agricultural Service/USDA
Housing Starts per Type
Korea: Housing Starts per Type ('000 units)
Year Total Apartment Single Family Tenement Rowhouse
1996 592,132 462,548 61,263 18,210 5,011
1997 596,435 484,949 52,948 19,219 39,319
1998 306,031 262,879 23,773 7,363 12,016
1999 404,715 345,345 33,772 7,640 17,958
2000 433,488 331,579 34,777 10,242 56,890
2001 1/ 500,000 NA NA NA NA
1/ ProjectionSource: Ministry of Construction and Transportation
Import of Wood Frame Housing Per Country
Korea: Import of Wood Frame Housing Per Country(Unit: 1,000 US$ on a CIF basis)
Country 1998 1999 2000 2000 (1-4) 2001 (1-4)
United States 2,754 3,501 4,462 1,401 870
Canada 2,357 934 1,872 342 620
Finland 878 651 1,030 217 442
Sweden 19 0 72 0 0
New Zealand 0 302 0 0 24
Australia 176 0 115 0 0
Russia 17 61 107 65 0
EU 37 101 114 27 191
Others 14 60 289 74 103
Total 6,252 5,610 8,061 2,126 2,250
Source: Korea Customs Service

GAIN Report #KS1041 Page 38 of 41
UNCLASSIFIED Foreign Agricultural Service/USDA
Production of Wood-Based Products
Korea: Production of Wood-Based Products(1,000 pieces)
Year Vehicle 1/ Furniture 2/ Sinkboard Musical Instrument
Pianos Guitars 3/
1995 624 1,303 3,013 212 1,500
1996 625 1,213 2,808 166 1,400
1997 563 1,162 2,718 134 1,300
1998 438 NA 2,327 92 1,150
1999 731 NA 2,741 95 1,800
2000 911 NA 2,492 96 1,430
1/ Bus, truck, and shipping container2/ Freestanding wood-based furniture3/ KMIIA's estimated data because official statistics do not include the number of guitar products made bysmall-medium sized companies.Source: National Statistical Office Korea Musical Instrument Industry Association (KMIIA)

GAIN Report #KS1041 Page 39 of 41
UNCLASSIFIED Foreign Agricultural Service/USDA
Value of Total Forest Product Imports
Korea:Value of Total Forest Product Imports(US$ Million on a CIF)
Description (H.S. No.) From the World From the United States
1999 2000 % 1999 2000 %
Chips (4401) 91 84 -8.6 24 23 -2.8
Logs (4403) 521 560 7.6 71 77 9.1
Lumber (4407) 261 245 -6.0 51 44 -14.5
Veneer (4408) 52 76 46 11 13 18.2
Finished Lumber (4409) 28 33 17.3 2 1 -20.5
Particle Board (4410) 55 71 29.4 2 1 -43.2
Fiberboard (4411) 42 81 95.0 4 3 -27.8
Plywood (4412) 260 307 17.9 2 2 38.8
Door and Windows (4418) 32 29 -10.6 8 3 -59.3
Other Articles of Wood 62 82 32.5 2 2 12.5
Total 1,404 1,568 11.7 177 171 -3.2
Source: Korea Customs Service(KCS)

GAIN Report #KS1041 Page 40 of 41
UNCLASSIFIED Foreign Agricultural Service/USDA
Value Comparison of Forest Product Import for January-April
Korea: Value Comparison of Forest Product Import for January-April (US$ Million on a CIF)
Description (H.S. No.) From the World From the United States
2000 2001 % 2000 2001 %
Chips (4401) 27 33 22 6 10 67
Logs (4403) 190 164 -14 24 23 -4
Lumber (4407) 88 64 -27 15 12 -20
Veneer (4408) 23 24 4 4 4 0
Finished Lumber (4409) 10 10 0 0.4 0 na
Particle Board (4410) 24 19 -21 0.3 0.1 -67
Fiberboard (4411) 28 18 -36 0.5 0.8 60
Plywood (4412) 96 83 -14 0.9 0.6 -33
Door and Windows (4418) 7 7 0 0.8 0.6 -25
Other Articles of Wood 26 26 0 1.1 0.9 -18
Total 529 448 -15 53 52 -1.9
Source: Korea Customs Service(KCS)

GAIN Report #KS1041 Page 41 of 41
UNCLASSIFIED Foreign Agricultural Service/USDA
Volume of Forest Product Imports
Korea: Volume of Forest Product Imports (1,000CUM)
Description (H.S. No.) From the World From the United States
1998 1999 2000 1998 1999 2000
Chips (4401) 1/ 573 1,180 1,025 108 312 285
Logs (4403) 4,563 6,570 6,871 308 356 392
Lumber (4407) 535 827 738 42 79 62
Veneer (4408) 101 121 191 5 5 5
Finished Lumber (4409) 1/ 36 29 33 0.6 0.7 0.5
Particle Board (4410) 149 377 485 8 10 5
Fiberboard (4411) 36 217 380 6 17 10
Plywood (4412) 494 791 980 2 3 2
Door and Windows (4418) 1/ 29 26 21 5 5 1
1/ Metric TonsSource: Korea Customs Service (KCS) Agricultural Affairs readjusted the number of logs and lumber based on the KCS’ statistics.