Embed Size (px)
Citation preview
Please refer to page 20 for important disclosures and analyst certification, or on our website
www.macquarie.com/research/disclosures.
KOREA
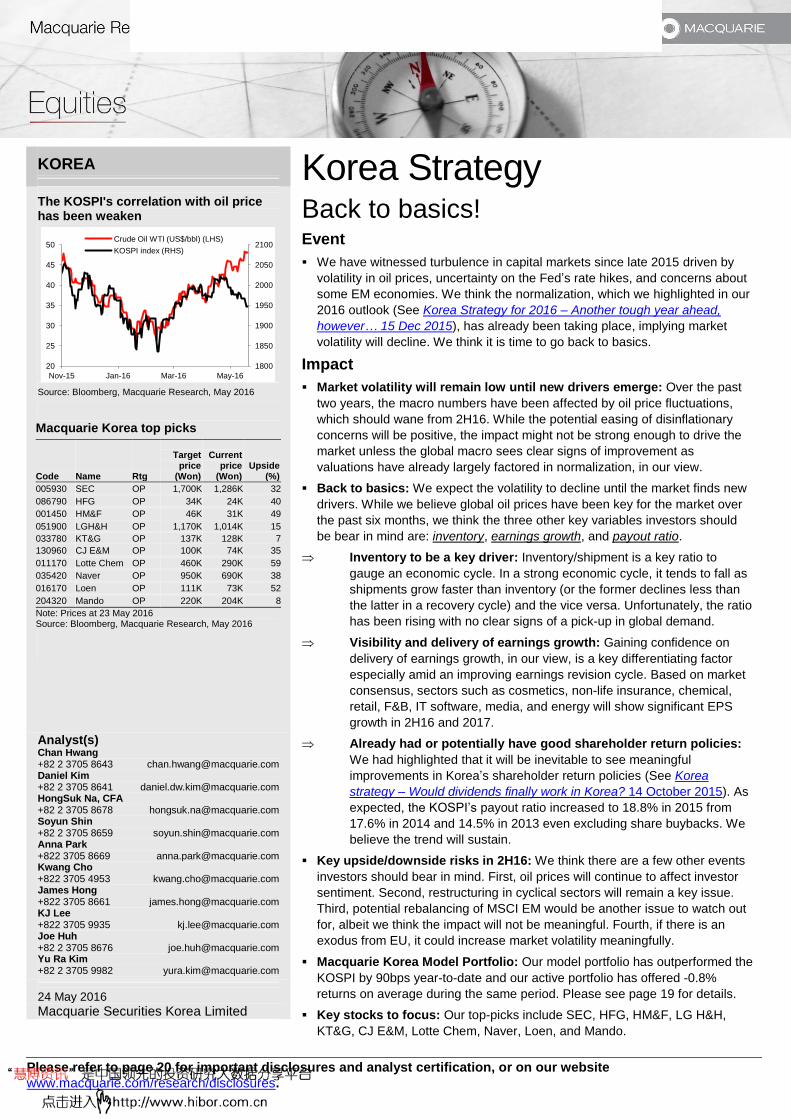
The KOSPI's correlation with oil price has been weaken
Source: Bloomberg, Macquarie Research, May 2016
Macquarie Korea top picks
Code Name Rtg
Target price
(Won)
Current price
(Won) Upside
(%)
005930 SEC OP 1,700K 1,286K 32
086790 HFG OP 34K 24K 40
001450 HM&F OP 46K 31K 49
051900 LGH&H OP 1,170K 1,014K 15
033780 KT&G OP 137K 128K 7
130960 CJ E&M OP 100K 74K 35
011170 Lotte Chem OP 460K 290K 59
035420 Naver OP 950K 690K 38
016170 Loen OP 111K 73K 52
204320 Mando OP 220K 204K 8
Note: Prices at 23 May 2016 Source: Bloomberg, Macquarie Research, May 2016
Analyst(s) Chan Hwang +82 2 3705 8643 [email protected] Daniel Kim +82 2 3705 8641 [email protected] HongSuk Na, CFA +82 2 3705 8678 [email protected] Soyun Shin +82 2 3705 8659 [email protected] Anna Park +822 3705 8669 [email protected] Kwang Cho +822 3705 4953 [email protected] James Hong +822 3705 8661 [email protected] KJ Lee +822 3705 9935 [email protected] Joe Huh +82 2 3705 8676 [email protected] Yu Ra Kim +82 2 3705 9982 [email protected]
24 May 2016 Macquarie Securities Korea Limited
Korea Strategy Back to basics! Event
We have witnessed turbulence in capital markets since late 2015 driven by
volatility in oil prices, uncertainty on the Fed’s rate hikes, and concerns about
some EM economies. We think the normalization, which we highlighted in our
2016 outlook (See Korea Strategy for 2016 – Another tough year ahead,
however… 15 Dec 2015), has already been taking place, implying market
volatility will decline. We think it is time to go back to basics.
Impact
Market volatility will remain low until new drivers emerge: Over the past
two years, the macro numbers have been affected by oil price fluctuations,
which should wane from 2H16. While the potential easing of disinflationary
concerns will be positive, the impact might not be strong enough to drive the
market unless the global macro sees clear signs of improvement as
valuations have already largely factored in normalization, in our view.
Back to basics: We expect the volatility to decline until the market finds new
drivers. While we believe global oil prices have been key for the market over
the past six months, we think the three other key variables investors should
be bear in mind are: inventory, earnings growth, and payout ratio.
Inventory to be a key driver: Inventory/shipment is a key ratio to
gauge an economic cycle. In a strong economic cycle, it tends to fall as
shipments grow faster than inventory (or the former declines less than
the latter in a recovery cycle) and the vice versa. Unfortunately, the ratio
has been rising with no clear signs of a pick-up in global demand.
Visibility and delivery of earnings growth: Gaining confidence on
delivery of earnings growth, in our view, is a key differentiating factor
especially amid an improving earnings revision cycle. Based on market
consensus, sectors such as cosmetics, non-life insurance, chemical,
retail, F&B, IT software, media, and energy will show significant EPS
growth in 2H16 and 2017.
Already had or potentially have good shareholder return policies:
We had highlighted that it will be inevitable to see meaningful
improvements in Korea’s shareholder return policies (See Korea
strategy – Would dividends finally work in Korea? 14 October 2015). As
expected, the KOSPI’s payout ratio increased to 18.8% in 2015 from
17.6% in 2014 and 14.5% in 2013 even excluding share buybacks. We
believe the trend will sustain.
Key upside/downside risks in 2H16: We think there are a few other events
investors should bear in mind. First, oil prices will continue to affect investor
sentiment. Second, restructuring in cyclical sectors will remain a key issue.
Third, potential rebalancing of MSCI EM would be another issue to watch out
for, albeit we think the impact will not be meaningful. Fourth, if there is an
exodus from EU, it could increase market volatility meaningfully.
Macquarie Korea Model Portfolio: Our model portfolio has outperformed the
KOSPI by 90bps year-to-date and our active portfolio has offered -0.8%
returns on average during the same period. Please see page 19 for details.
Key stocks to focus: Our top-picks include SEC, HFG, HM&F, LG H&H,
KT&G, CJ E&M, Lotte Chem, Naver, Loen, and Mando.
1800
1850
1900
1950
2000
2050
2100
20
25
30
35
40
45
50
Nov-15 Jan-16 Mar-16 May-16
Crude Oil WTI (US$/bbl) (LHS)
KOSPI index (RHS)
Macquarie Research Korea Strategy
24 May 2016 2
Back to basics! Six months ago, most market participants were capitulated on significant dips in global oil prices,
uncertainty over Fed’s rate hikes, and concerns about some EM economies (including China). Hence,
we have only to see turbulence in capital markets since late 2015. Now, we believe the normalization,
which we highlighted in our 2016 outlook (See Korea Strategy for 2016 – Another tough year ahead,
however… 15 Dec 2015), has already been taking place.
What does this mean? We believe market volatility would decline or stay low in the foreseeable
future. Hence, while the normalization would become more obvious from 2H16, we do not think it will
be a strong driver for the market as we think it has already been somewhat reflected in valuations.
Hence, we believe that investors should be selective on stocks based on few simple criteria until we
find new drivers.
In our 2016 outlook, we highlighted oil prices, FX, and the pace of China slowdown as three key
variables for the market. Now, although still important, we believe these indicators will not be as
important as before unless there is another significant fluctuation. Vikas Dwivedi, Macquarie’s Global
Oil & Gas Strategist, estimates WTI of $49/bbl in 2H16 and $57/bbl in 2017. We believe inventory,
visibility and delivery of earnings, and payout potential will be the three key criteria for investors to
bear in mind in 2H16. Until there is a clear direction in inventory/shipment (a key indicator for global
demand), we think visibility and delivery of earnings, and payout potential will be the key
differentiating factors for share price performance.
We went through a historically horrible earnings revision cycle from 2012 to early 2015 when the
earnings revision ratio remained sluggish near -40%. However, we have seen meaningful
improvements in both the earnings revision cycle and the earnings hit ratio (earnings beat/miss ratio)
since 2H15. Hence, we believe gaining confidence on the delivery of earnings growth will be a key
differentiating factor for the share performance especially amid declining market volatility. Based on
market consensus and our intuitive judgements, we believe that cosmetics, non-life insurance,
chemical, retail, food & beverage, IT software (Internet), media, energy, and banks will deliver solid
earnings growth with relatively high confidence.
In addition, we highlight that Korea will undergo significant structural changes, with the most
important being the growing importance of cash flows rather than capital gains. Hence, it will be
inevitable to see meaningful improvements in Korea’s shareholder return policies (See Korea
strategy – Would dividends finally work in Korea? 14 October 2015). The KOSPI’s payout ratio
increased to 18.8% in 2015 from 17.6% in 2014 and 14.5% in 2013. In addition, total share buybacks
increased to Won10tn in 2015 versus Won4.5tn in 2014. Even if we exclude share buybacks from
Samsung Electronics (005930 KS, Won1,269,000, Outperform, TP: Won1,700,000, Daniel Kim), total
shareholder return for the KOSPI has been rapidly increasing and we think the trend will sustain.
Hence, we believe companies with great potential to raise their payout ratios (or maintain good
payout ratio policies) with reasonable earnings growth should be the key stocks investors should
watch out for. Fig 37 and Fig 38 in the following section show the companies that already offer
reasonably high dividend yields or with greater potential for dividend yields.
Aside the abovementioned three key drivers, some key events could provide upside/downside risks to
the market. First, as discussed above, oil prices will continue to affect investor sentiment if there is
another meaningful fluctuation. Second, restructuring in cyclical sectors such as shipbuilders, shippers,
and constructors remains an uncertainty. Third, MSCI is expected to rebalance its emerging market
index. While not meaningful, in our view, a potential lower weight for Korea (via inclusion of China-A
shares) will incur short-term outflows from the market. Fourth, if there is an exodus from EU, it will
meaningfully increase market volatility via lower risk appetite (or higher risk premium).
We maintain our 12-month KOSPI target of 2150. Major overweights in our model portfolio include
chemical, non-life insurance, internet, media, banks, and refiners. On the other hand, we maintain
our underweight position on deep cyclical (i.e., shipbuilding, construction, machinery, and auto) until
we become more confident on global demand pick-up.
Our top picks include SEC, HFG, HM&F, LG H&H, KT&G, CJ E&M, Lotte Chem, Naver, Loen, and
Mando. On the other hand, we are cautious on LG Display, Cheil WW, Industrial Bank of Korea,
Hanwha Life, Kakao, Hyundai Wia, Samsung Heavy Industry, and Daelim Industrial.

Macquarie Research Korea Strategy
24 May 2016 3
Fig 1 Macquarie Korea strategy track record
Source: Bloomberg, Macquarie Research, May 2016
Fig 2 Comparable valuations for major indices 2015 2016E 2017E
Country P/E P/B ROE
DIV Yield
Payout ratio P/E P/B ROE
DIV Yield
Payout ratio P/E P/B ROE
DIV Yield
Payout ratio
KOSPI 14.1 0.9 6.9 1.3 18.8 10.9 0.9 8.7 1.8 19.5 10.0 0.9 8.6 2.0 19.8 MSCI Korea 10.6 0.9 8.7 1.4 17.4 10.3 0.9 8.7 1.9 20.0 9.6 0.8 8.6 2.1 20.4 Taiwan 12.4 1.6 13.0 4.1 50.3 12.9 1.5 14.2 4.2 54.2 11.8 1.4 14.2 4.5 52.5 HK 12.2 1.2 11.5 3.1 35.2 14.5 1.0 8.3 3.5 50.7 13.7 1.0 8.7 3.7 50.4 Singapore 13.6 1.2 8.6 4.4 50.2 12.1 1.1 9.6 4.3 51.9 11.5 1.0 9.8 4.4 50.8 Thailand 16.4 1.7 10.8 3.5 58.9 14.8 1.8 10.7 3.1 45.4 13.0 1.6 11.3 3.4 44.2 Malaysia 17.7 1.7 10.0 3.0 53.0 15.8 1.6 10.3 3.1 49.6 14.5 1.5 10.5 3.4 49.3 Indonesia 17.3 2.8 17.1 2.6 42.1 15.4 2.5 18.1 2.5 38.5 13.5 2.2 18.3 2.9 38.6 India 23.2 3.0 13.6 1.4 32.1 17.2 2.6 14.2 1.7 29.3 14.2 2.3 15.2 2.0 27.7
Source: Bloomberg, Macquarie Research, May 2016. Note: Price as of 23 May 2016 and based on MSCI Index
Technology – upstream (O/W, Daniel Kim): DRAM’s 2H16 business outlook is a sharp contrast to
that of LCD. While DRAM’s profitability will likely improve in 2H16, considering the end of inventory
consumption, the new server CPU, and the launch of iPhone 7 preparations, the LCD market is likely
to dip sharply, since the capacity troubles in early 2016 should return to the market and the TV
companies’ inventory build-up for a couple of sports events should be over. The overall NAND
market should remain healthy, with SEC’s technology leadership in 3D NAND more pronounced as
the mass production of its 3rd
Gen (48-layer) 3D NAND will start. Our top pick is Samsung Electronics
(005930 KS, Won1,286,000, Outperform, TP: Won1,700,000), while we are cautious on LG Display
(034220 KS, Won25,450, Underperform, TP: Won23,000)
Technology – downstream (U/W: Soyun Shin): We would be selective on the downstream tech
supply chain due to: 1) slower growth in smartphone shipments, 2) a more competitive landscape in
handset components because of Chinese component-makers, and 3) a lack of substantial form factor
upgrades excluding the adoption of plastic OLED in smartphones. Our top pick is SFA Engineering
(056190 KS, Won56,200, Outperform, TP: Won73,000) as we think it is most immune to any
technological changes in the plastic AMOLED industry. SFA supplies clean logistics equipment with
a more than 90% share in Samsung Display with after-sales services. We forecast EBIT growth of
more than 50% YoY in 2016 due to rising new orders from both SDC and Chinese panel-makers.
1,000
1,100
1,200
1,300
1,400
1,500
1,600
1,700
1,800
1,900
2,000
2,100
2,200
2,300
Sep-10 Jan-11 May-11 Sep-11 Jan-12 May-12 Sep-12 Jan-13 May-13 Sep-13 Jan-14 May-14 Sep-14 Jan-15 May-15 Sep-15 Jan-16 May-16
KOSPI: 1815.25 "From inventory to capex: Be brave" (Sep 14)
KOSPI: 1878.94 "FX: Delayed reflection of fundamentals" (Oct 05)
KOSPI: 2180.59 "Yes, we are still bullish" (Jul 7)
KOSPI: 2080.81 "Strong and healthy rally to continue" (Jan 10)
KOSPI: 1801.35 "Panic dumping is overdone" (Aug 09)
KOSPI: 1929.48 "Is it just a bear market rally?" (Oct 28)
KOSPI: 2003.69 "Do not waver on short-term quietude" (Feb 28)
KOSPI: 1808.62 "Near the end of short-term quietude" (May 23)
KOSPI: 1891.52 "Before the dawn" (Oct 29)
KOSPI: 1925.2 "Reality check on domestic property" (Nov 27)
KOSPI: 1924.2 "Stay tuned for better momentum" (Apr 12)
KOSPI: 1980.41 "Momentum to slow in short-term" (Jan 24)
KOSPI: 1913.03 "Enjoy the volatility rather than escape" (Aug 13)
KOSPI: 2040.61 "Is consumption returing?" (Oct 17)
KOSPI: 1993.45 "KOSPI to stand out" (Dec 10)
KOSPI: 1932.54 "Still confused?" (Mar 12)
KOSPI: 2063.22 "Stimulus policies to drive the KOSPI" (Aug 15)
KOSPI: 2039.27 "Chaebols: Untangling the spider web" (Sep 22)
KOSPI: 1904.13 "Battling with uncertainties" (Dec 16)
KOSPI: 2072.86 "Juggling between domestic recovery and weak exports" (June 4)
KOSPI: 2009.55 "Would dividends finally work in Korea" (Oct 14)
KOSPI: 1932.97 "Another tough year ahead, however" (Dec 15)

Macquarie Research Korea Strategy
24 May 2016 4
Consumer (O/W, HongSuk Na): Korean consumer stocks will likely enjoy better earnings
momentum in 2H16 on the back of a low earnings base due to the MERS outbreak last year. We are
optimistic on the sector: (1) high income bracket consumers’ spending remains robust due to
increased rental income; (2) general consumers still want to spend on experiences (e.g., overseas
travels, foreign cars, etc); and (3) Chinese visitation growth should accelerate in 2H16E. Our top
picks are: (1) Hyundai Department Store (069960 KS, Won133,500, Outperform, TP: Won180,000)
(earnings turnaround); (2) Hana Tour Service (039130 KS, Won94,200, Outperform, TP:
Won113,000) (travel demand and expected profits from its DFS); (3) LG Household & Health Care
(051900 KS, Won1,014,000, Outperform, TP: Won1,170,000) (robust cosmetic DFS sales and
cheaper valuations); and (4) KT&G (033780 KS, Won127,500, Outperform, TP: Won137,000) (robust
consumer demand for cigarettes, solid exports, and ginseng recovery).
Media (O/W, Soyun Shin): While major sports events in 2H16 (e.g., UEFA Euro in Jun-Jul and Rio
Olympic in Aug) should be positive for the overall ad market, we believe that Korean ad spending
growth will remain at a low 2% in 2H16-2017 due to the uncertain macro outlook and a sluggish
business cycle. We believe few selective names will outperform the overall market benefiting from
overseas expansion and a structural shift in the domestic market. CJ E&M (130960 KS, Won74,000,
Outperform, TP: Won100,000) and Innocean Worldwide (214320 KS, Won86,300, Outperform, TP:
Won106,000) are our top picks among media names. Cheil WW (030000 KS, Won15,700,
Underperform, TP: Won14,500) is our least preferred stock due to its weaker earnings momentum
and uncertainty about potential changes in the shareholding structure.
Banks (O/W, Chan Hwang): We remain positive on the Korea banks sector in the short to medium
term. First, the financial authority’s decision to set the counter cyclical buffer at 0% should ease
investor concerns about the banks with weak capital position. Second, according to the BOK, the
spread between new loans and deposits bottomed in December 2015 and improved meaningfully in
the first three months of 2016. We believe it will eventually result in NIM improving from 2H16. Third,
valuations seem fully reflecting potential risks/negatives related to potential provisioning in some
troubled cyclical sectors. KB Financial Group (105560 KS, Won33,200, Outperform, TP: Won45,000)
and Shinhan Financial Group (055550 KS, Won39,550, Outperform, TP: Won54,000) remain our
long-term top picks, while HFG (086790 KS, Won24,250, Outperform, TP: Won34,000) is more
attractive for the short to medium term.
Brokerage (U/W, Joe Huh): We expect Korean brokers’ earnings momentum to remain unexciting
through 2016 as we see a lack of catalysts from traditional operations such as brokerage and net
interest income. Considering the new leverage regulation, from the beginning of 2016, impacts
brokers’ ELS/RP product sales, growth in interest earning assets will slow, too, negatively affecting
the net interest income growth from 2016. Although additional rate cuts by the BOK, if any, will be
positive for brokers’ trading operations, the impact should be limited compared to that in 2015. Our
top pick is Korea Investment Holdings (071050 KS, Won43,150, Outperform, TP: Won60,000) as it is
best geared to potential long-term growth in the wealth management business. Our least preferred
stock is NH Investment Securities (005940 KS, Won9,150, Underperform, TP: Won8,500).
Insurance (O/W, Chan Hwang): We believe that non-life insurers’ earnings momentum will remain
strong in 2H16-2017 (at least until 1H18) on the back of improvement in underwriting profitability.
While the pressure on investment yields should sustain for both non-lifers and lifers, improvement in
the underwriting cycle should be strong enough to offset the negatives for non-lifers. However,
prolonged low interest rates and the potential capital burden due to the adoption of IFRS 4 from 2020
will put a pressure on lifers, in our view. We thus prefer non-lifers. Our top pick among non-lifers is
Hyundai Marine & Fire (001450 KS, Won30,950, Outperform, TP: Won46,000) on the back of its
highest leverage to the improving auto loss ratio and cheap valuation.
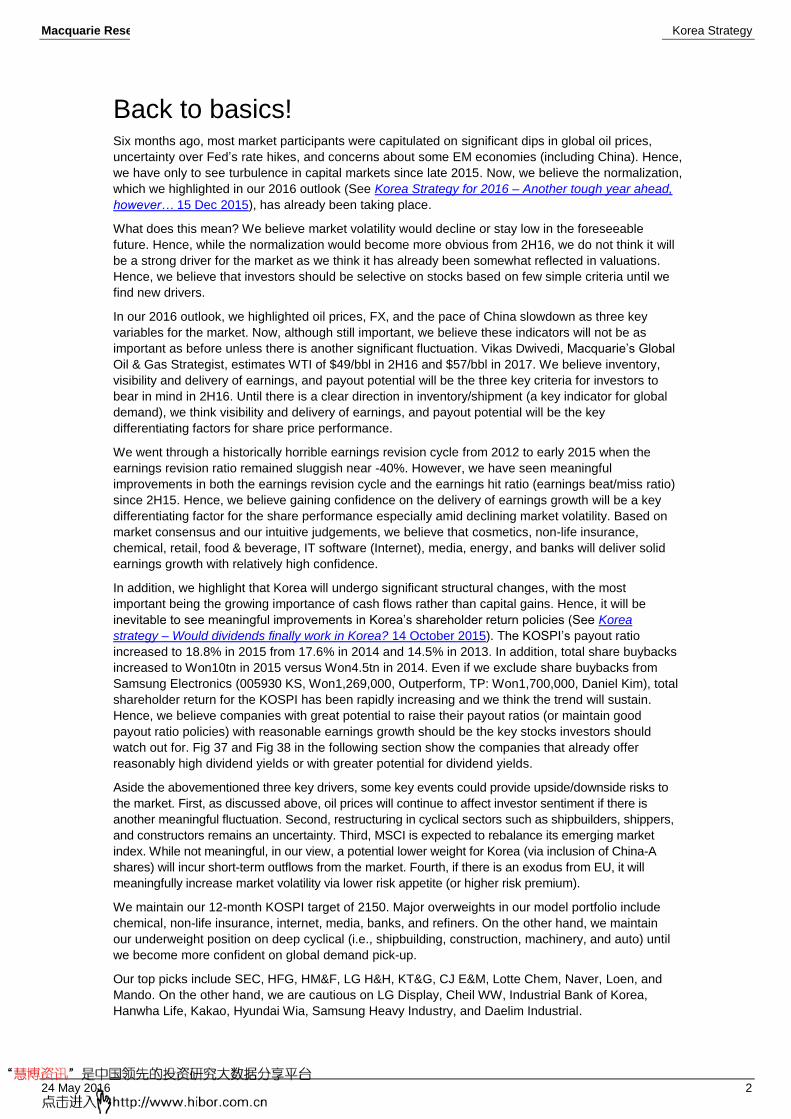
Petrochemicals (O/W, Anna Park): We believe the sector will continue to enjoy good times. Into
2H16, we have carefully reviewed the global new capacity start-up schedule, and reiterate our view
that the polyethylene margin will stay high until the end of FY17. More importantly, we finally see a
turnaround in non-polyethylene products, including PX and butadiene, on the slowing of new capacity
additions. Our top pick is Lotte Chemical (011170 KS, Won289,500, Outperform, TP: Won460,000),
which has greater-than-60% exposure to non-polyethylene products. In addition, its two bottom-up
growth projects will add to the strong earnings momentum. The acquisition of Samsung SDI (006400
KS, Won107,500, Underperform, TP: Won90,000)’s chemical division and the completion of new MX
project will be the other major OP contributors, in our view.
Macquarie Research Korea Strategy
24 May 2016 5
Fig 3 Non-polyethylene margin (60% of total) seems to be turning around…
Fig 4 …plus, Samsung SDI’s ABS/PC margin has picked up strongly
*Note: Non-ethylene margin is weighted average of Polypropylene, Butadiene and Paraxylene margin. Source: Bloomberg, Macquarie Research, May 2016
*ABS: Acrylonitrile-Butadiene-Styrene Source: Bloomberg, Macquarie Research, May 2016
Oil refining (O/W, Anna Park): We see spot refining margins as slowly peaking at $6.5/bbl in 2016
from $7.3/bbl last year. We are entering a period of gradually rising oil prices, which mean higher
refinery costs from own fuel use. However, lower normalized crude prices will keep retail prices low,
supporting healthy demand. Global new capacity addition in FY2H16-18 remains light at 0.2m bpd
vs. FY16E Asia demand growth of 0.8m bpd. Plus, PX – a petrochemical product – will be provide a
new earnings stream, as we believe PX margin continues to turn around from its FY15 low. Our
FY16/17/18E PX margin forecasts were lifted to US$400/420/440/t from US$360/370/370/t (Link).
Our top pick is SK Innovation (096770 KS, Won153,000, Outperform, TP: Won220,000).
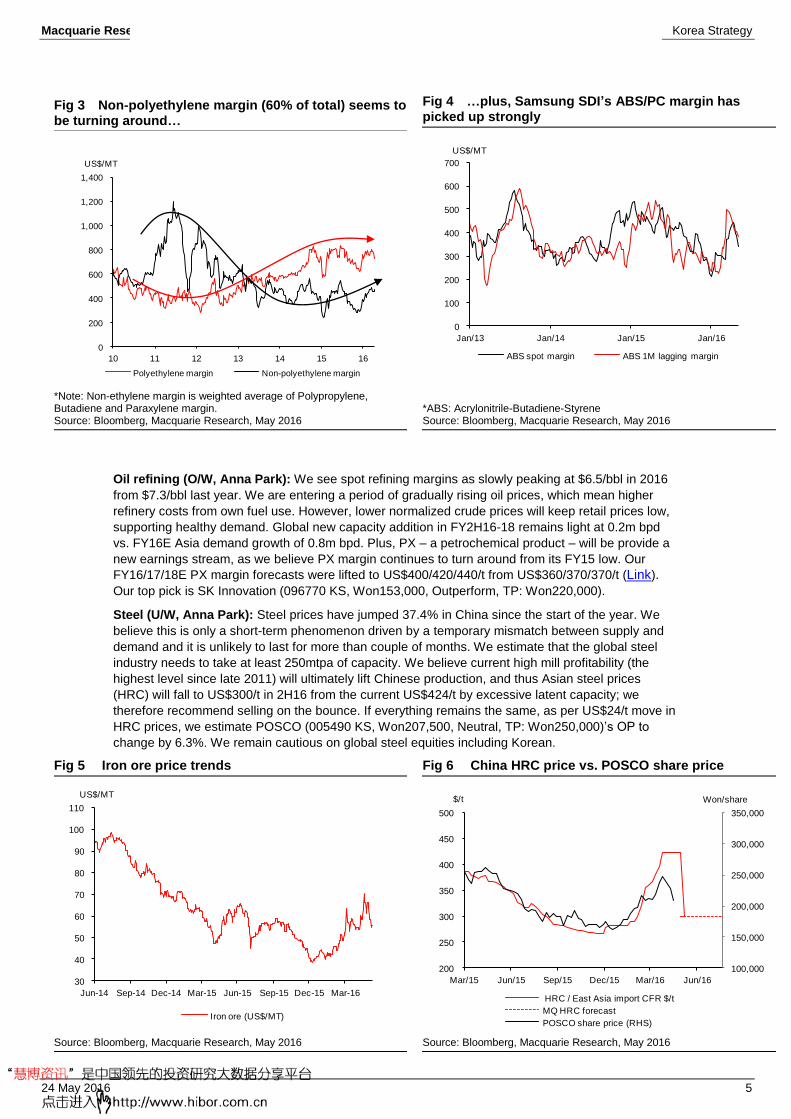
Steel (U/W, Anna Park): Steel prices have jumped 37.4% in China since the start of the year. We
believe this is only a short-term phenomenon driven by a temporary mismatch between supply and
demand and it is unlikely to last for more than couple of months. We estimate that the global steel
industry needs to take at least 250mtpa of capacity. We believe current high mill profitability (the
highest level since late 2011) will ultimately lift Chinese production, and thus Asian steel prices
(HRC) will fall to US$300/t in 2H16 from the current US$424/t by excessive latent capacity; we
therefore recommend selling on the bounce. If everything remains the same, as per US$24/t move in
HRC prices, we estimate POSCO (005490 KS, Won207,500, Neutral, TP: Won250,000)’s OP to
change by 6.3%. We remain cautious on global steel equities including Korean.
Fig 5 Iron ore price trends Fig 6 China HRC price vs. POSCO share price
Source: Bloomberg, Macquarie Research, May 2016 Source: Bloomberg, Macquarie Research, May 2016
0
200
400
600
800
1,000
1,200
1,400
10 11 12 13 14 15 16
US$/MT
Polyethylene margin Non-polyethylene margin
0
100
200
300
400
500
600
700
Jan/13 Jan/14 Jan/15 Jan/16
ABS spot margin ABS 1M lagging margin
US$/MT
30
40
50
60
70
80
90
100
110
Jun-14 Sep-14 Dec-14 Mar-15 Jun-15 Sep-15 Dec-15 Mar-16
US$/MT
Iron ore (US$/MT)
100,000
150,000
200,000
250,000
300,000
350,000
200
250
300
350
400
450
500
Mar/15 Jun/15 Sep/15 Dec/15 Mar/16 Jun/16
Won/share$/t
HRC / East Asia import CFR $/t
MQ HRC forecast
POSCO share price (RHS)

Macquarie Research Korea Strategy
24 May 2016 6
Korea Emerging Leaders & Internet (O/W, Kwang Cho): Our top picks in Korea internet and small
cap sectors are Naver (035420 KS, Won690,000, Outperform, TP: Won950,000) and Loen (016170
KS, Won73,200, Outperform, TP: Won111,000). We think NAVER is a key beneficiary of rapidly
growing mobile commerce in Korea, from Won6.6tn in 2013 to Won24.4tn in 2015. NAVER Pay,
launched in June 2015, has made NAVER’s shopping platform even more competitive against
traditional e-commerce players. The closure of loss-making MixRadio and monetization of LINE’s
timeline will further contribute to its earnings growth. Loen, which runs Korea’s largest digital music
streaming platform MelOn, is another stock that will see strong earnings growth from 2H16. Post
price hike in early March, we project net profit to grow 26% in 2016 and 46% in 2017. Loen’s
acquisition by Kakao will provide further upside as it can generate synergies by capitalizing on
Kakao’s 41mn MAUs in Korea.
Our top sell idea is Kakao Corp (035720 KS, Won100,200, Underperform, TP: Won71,000). Although
the acquisition of Loen is EPS accretive, our 2016E earnings are still 42% and 2017E are 29% below
consensus’. Kakao continues to lose market share in the Korea internet ad market (23% in 2014 ->
19% in 2016E), as its Daum portal fails to make a transition to mobile and the Kakao game platform
is being bypassed by game developers. In addition, operating expenses will balloon on new hiring
and marketing spending related to the launch of O2O services. Its expensive valuation (93x/48x PER
for 2016/17) continues to be a challenge for us.
Auto & auto components sector (U/W, James Hong): Large inventory build-up from strong ex-
factory sales in 4Q15 has been weighing on YTD volumes of Hyundai Motor Company (005380 KS,
Won133,000, Neutral, TP: Won140,000) and Kia Motors (000270 KS, Won45,950, Outperform, TP:
Won57,000) resulting falls their global sales volumes (down 6.2% and 7.5%, respectively). The
pressure to meet the annual sales target should see a pick-up in the OEMs’ ex-factory volumes,
albeit at the cost of rising incentive spending, in our view. Instead, auto component-makers should
benefit from the QoQ momentum in HMC’s and Kia’s volume, in general, and we prefer companies
with sequential margin improvement and structural growth.
Our top pick is Mando (204320 KS, Won203,500, Outperform, TP: Won220,000), whose profitability
improvement should accelerate on 1) a utilization recovery in HMC/Kia, and 2) ADAS volume pick-
up. We expect ADAS profitability to turn positive from mid-2016. Furthermore, medium- to longer-
term growth opportunities are intact on mass adoption of ADAS systems and customer
diversification. On the other hand, we are cautious on Hyundai Wia (011210 KS, Won90,900, Neutral,
TP: Won100,000) as we believe its earnings momentum is the weakest among components
suppliers.
Construction (U/W, James Hong): We expect the domestic property market to remain solid,
especially in the Seoul-Metro area. Presale rates on YTD pre-sales volumes are strong, and ASPs
are rising steadily, despite market’s oversupply concerns. However, the completion risk in the
overseas business should still weigh on overall profitability. Iranian order wins should remain the
main focus on the overseas side, but we believe some obstacles, including financing, will surface
before order intakes are materialized. Our top pick is Hyundai Development (012630 KS,
Won42,050, Outperform, TP: Won70,000), which should enjoy both revenue growth and profitability
improvement driven by strong in-house order backlog. However, we are cautious on Daelim (000210
KS, Won77,800, Underperform, TP: Won74,000) as we believe its 1Q16 earnings were the peak in
2016 as the company faces 1) completion risk in overseas toxic projects, and 2) a weakening
earnings momentum in the petrochemical business.
Shipbuilding (U/W, James Hong): We see a divergence in the earnings recovery as volatility in the
big 3 Korean shipbuilders is likely to persist through 2016, exacerbated by a continual discussion on
the sector restructuring. Our top pick is Hyundai Mipo Dockyard (010620 KS, Won65,100,
Outperform, TP: Won98,000), which should be the largest beneficiary of the sector restructuring on
easing competition in the PC tanker market. We believe order intake will pick up from mid-2016 and
the earnings recovery will accelerate and sustain on improving revenue mix. On the other hand, we
are cautious on Samsung Heavy (010140 KS, Won8,740, Underperform, TP: Won5,500), whose
potential recovery should be weighed by further downside to the offshore/LNG capex cycle. With
completion schedule delays, SHI’s balance sheet should further deteriorate on rising working capital
burden.

Macquarie Research Korea Strategy
24 May 2016 7
What happened over the past six months?
We have witnessed turbulence in capital markets since late 2015 driven by volatility in oil prices,
uncertainty over Fed’s rate hikes, and concerns about a few EM economies. While there was a
capitulation in the market until February 2016, the normalization of these indicators has made
investors comfortable and risk appetite return. WTI declined to $26/bbl in Feb 2016 from $46/bbl but
has recovered to $48/bbl now. The KRW depreciated to 1,239/US$ in Feb 2016 from 1,141/US$ and
has appreciated to 1,190/US$. The KOSPI fell to 1,835pt from 2,029pt and recovered to 1,947pt. The
KOSPI has remained flat (-0.7%) YTD, outperforming MSCI Asia Ex-Japan by 4.4%. We think the
normalization, which we highlighted in our 2016 outlook (See Korea Strategy for 2016 – Another
tough year ahead, however… 15 Dec 2015), has already been taking place. Hence without clear
signs of improvements in the global macro outlook or meaningful deteriorations in key indicators, we
believe market volatility would decline or remain low in the foreseeable future.
Fig 7 Normalization 1. Oil price has returned to the level in Nov 15
Fig 8 Normalization 2. Korean Won is still weaker than the level in Nov 15 but fears of meaningful depreciation disappeared
Source: Bloomberg, Macquarie Research, May 2016 Source: Bloomberg, Macquarie Research, May 2016
Fig 9 Normalization 3. The KOSPI recovered up to 1950-2000 level
Fig 10 The KOSPI has outperformed MSCI Asia ex-Japan
Source: Bloomberg, Macquarie Research, May 2016 Source: Bloomberg, Macquarie Research, May 2016
The normalization would become more obvious from 2H16, but…
Over the past two years, many macro figures have been affected by fluctuations in global commodity
prices (especially from global oil prices) and created disinflation fears in the market. CPI has
decreased to 0-1% and Korea’s exports continued to report negative growth (although it has also
been affected by weak global demand as well as global trade). With a recovery in global oil prices,
we believe Korea’s CPI will recover to near 2.0% growth and exports will show positive growth from
2H16. We believe that fears on the disinflationary environment would start disappearing, which
should be positive for investor sentiment on the Korea macro outlook as well as the KOSPI.
15
23
31
39
47
55
Nov-15 Dec-15 Jan-16 Feb-16 Mar-16 Apr-16 May-16
Crude Oil WTI (US$/bbl)
1100
1140
1180
1220
1260
Nov-15 Dec-15 Jan-16 Feb-16 Mar-16 Apr-16 May-16
KRW/USD
1750
1800
1850
1900
1950
2000
2050
2100
Nov-15 Dec-15 Jan-16 Feb-16 Mar-16 Apr-16 May-16
KOSPI index
80
85
90
95
100
105
Nov-15 Dec-15 Jan-16 Feb-16 Mar-16 Apr-16 May-16
KOSPI MSCI ex-Japan
(100 at Nov 2015)

Macquarie Research Korea Strategy
24 May 2016 8
Fig 11 CPI is expected to normalize at near 2% level soon
Fig 12 Korea's export growth to turn positive from late 2H16
Source: BOK, Macquarie Research, May 2016 Source: KITA, Macquarie Research, May 2016
Fig 13 We expect Korea’s exports to start showing positive growth from 2H16
Fig 14 Composition of Korea’s exports (2015)
Source: KITA, Macquarie Research, May 2016; Note: Export amount based on KRW
Source: KITA, Macquarie Research, May 2016
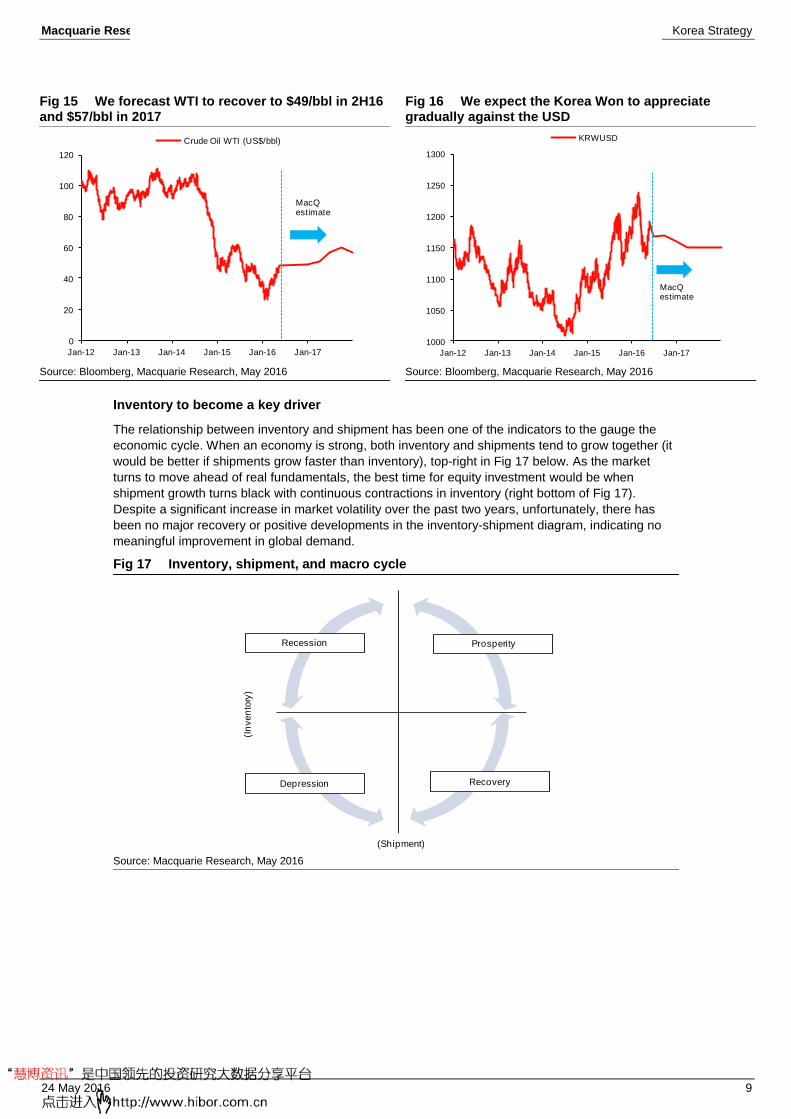
Along with global oil prices, we have highlighted FX and the pace of China slowdown as key
variables for the market. These drivers will continue to affect investor sentiment on the market.
However, the influence would not as big as before as we do not expect the volatility of these drivers
to be as high as before. Vikas Dwivedi, Macquarie’s Global Oil & Gas Strategist, estimates WTI of
$49/bbl in 2H16 and $57/bbl in 2017. In addition, we expect the Korea Won to gradually appreciate
against the USD although US fed rate hikes could provide some volatility in the short term. More
importantly, we think the normalization of these drivers has been somewhat reflected in current
valuations. Hence, we believe these drivers’ impact on the market will not be as strong as before.
What does this mean? We believe 1) market volatility will decline further or remain low, and 2)
investors should be selective on stocks based on few simple criteria until we find new drivers for the
market.
-2.0%
-1.0%
0.0%
1.0%
2.0%
3.0%
1Q13 4Q13 3Q14 2Q15 1Q16 4Q16E 3Q17E
CPI Core CPI
MacQestimate
-16%
-12%
-8%
-4%
0%
4%
8%
100
110
120
130
140
150
160
1Q13 3Q13 1Q14 3Q14 1Q15 3Q15 1Q16
Export (US$bn) YoY
-15%
-10%
-5%
0%
5%
10%
15%
20%
Jul-13 Jan-14 Jul-14 Jan-15 Jul-15 Jan-16
Stated export growth
Daily average export growth
Export growth adjusted for oil prices
Petroleum products
6% Chemical products
11%
Steel6%
Metal2%
Machinery10%
Automobiles9%
Auto Parts5%
Vessels7%
Electronic devices
34%
Plastic2%
Textiles3%
Others5%
Macquarie Research Korea Strategy
24 May 2016 9
Fig 15 We forecast WTI to recover to $49/bbl in 2H16 and $57/bbl in 2017
Fig 16 We expect the Korea Won to appreciate gradually against the USD
Source: Bloomberg, Macquarie Research, May 2016 Source: Bloomberg, Macquarie Research, May 2016
Inventory to become a key driver
The relationship between inventory and shipment has been one of the indicators to the gauge the
economic cycle. When an economy is strong, both inventory and shipments tend to grow together (it
would be better if shipments grow faster than inventory), top-right in Fig 17 below. As the market
turns to move ahead of real fundamentals, the best time for equity investment would be when
shipment growth turns black with continuous contractions in inventory (right bottom of Fig 17).
Despite a significant increase in market volatility over the past two years, unfortunately, there has
been no major recovery or positive developments in the inventory-shipment diagram, indicating no
meaningful improvement in global demand.
Fig 17 Inventory, shipment, and macro cycle
Source: Macquarie Research, May 2016
0
20
40
60
80
100
120
Jan-12 Jan-13 Jan-14 Jan-15 Jan-16 Jan-17
Crude Oil WTI (US$/bbl)
MacQestimate
1000
1050
1100
1150
1200
1250
1300
Jan-12 Jan-13 Jan-14 Jan-15 Jan-16 Jan-17
KRWUSD
MacQestimate
Recession
Recovery
Prosperity
Depression
(Shipment)
(In
ven
tory
)
Macquarie Research Korea Strategy
24 May 2016 10
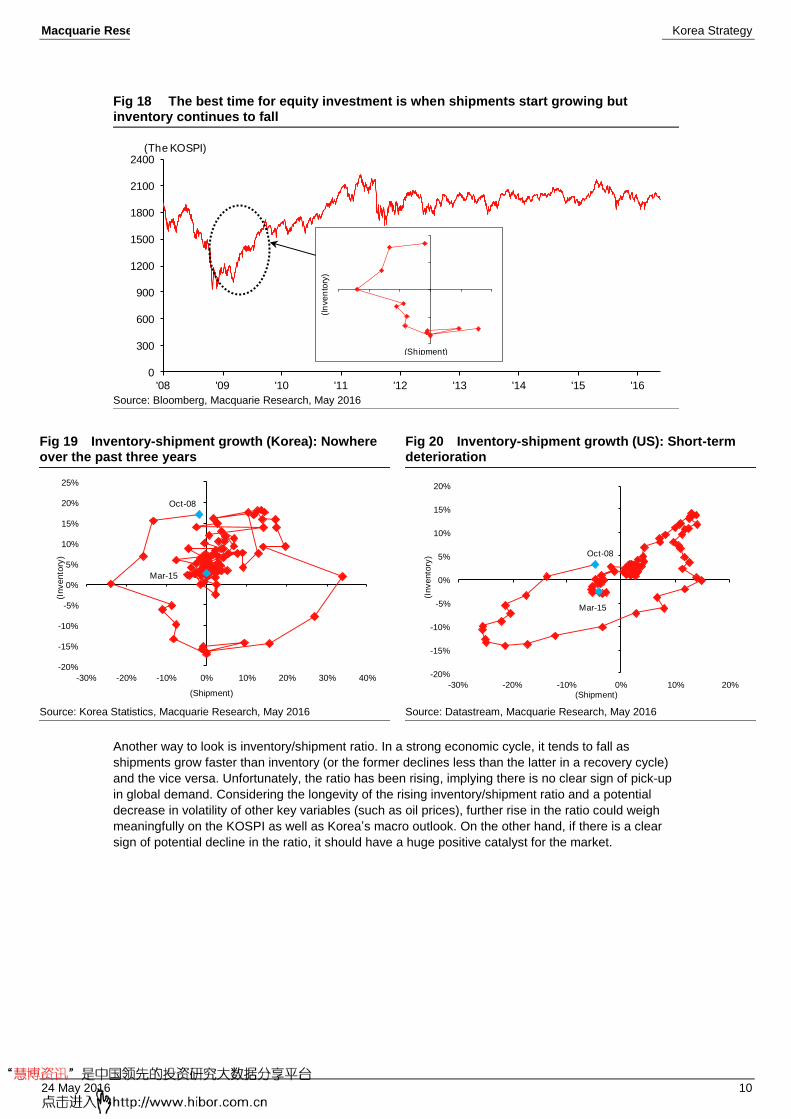
Fig 18 The best time for equity investment is when shipments start growing but inventory continues to fall
Source: Bloomberg, Macquarie Research, May 2016
Fig 19 Inventory-shipment growth (Korea): Nowhere over the past three years
Fig 20 Inventory-shipment growth (US): Short-term deterioration
Source: Korea Statistics, Macquarie Research, May 2016 Source: Datastream, Macquarie Research, May 2016
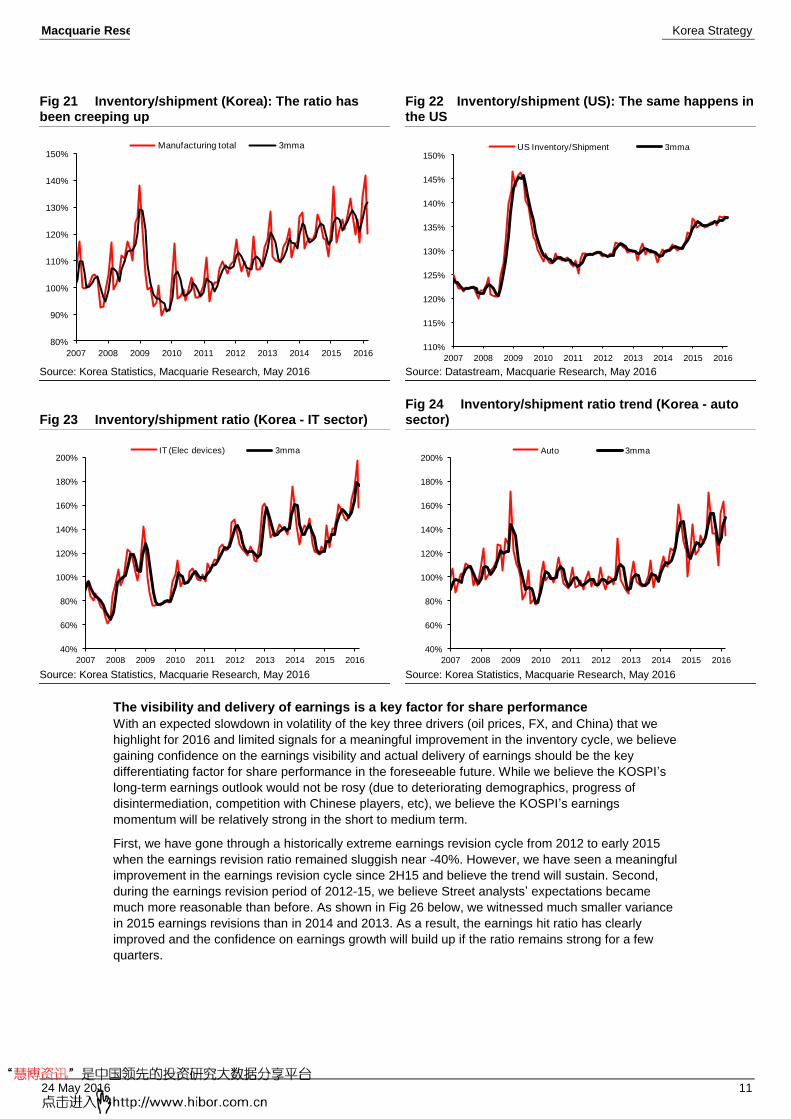
Another way to look is inventory/shipment ratio. In a strong economic cycle, it tends to fall as
shipments grow faster than inventory (or the former declines less than the latter in a recovery cycle)
and the vice versa. Unfortunately, the ratio has been rising, implying there is no clear sign of pick-up
in global demand. Considering the longevity of the rising inventory/shipment ratio and a potential
decrease in volatility of other key variables (such as oil prices), further rise in the ratio could weigh
meaningfully on the KOSPI as well as Korea’s macro outlook. On the other hand, if there is a clear
sign of potential decline in the ratio, it should have a huge positive catalyst for the market.
0
300
600
900
1200
1500
1800
2100
2400
'08 '09 '10 '11 '12 '13 '14 '15 '16
-20%
-10%
0%
10%
20%
-30% -20% -10% 0% 10% 20%
(In
ve
nto
ry)
(Shipment)
(The KOSPI)
-20%
-15%
-10%
-5%
0%
5%
10%
15%
20%
25%
-30% -20% -10% 0% 10% 20% 30% 40%
(In
ve
nto
ry)
(Shipment)
Oct-08
Mar-15
-20%
-15%
-10%
-5%
0%
5%
10%
15%
20%
-30% -20% -10% 0% 10% 20%
(Invento
ry)
(Shipment)
Oct-08
Mar-15
Macquarie Research Korea Strategy
24 May 2016 11
Fig 21 Inventory/shipment (Korea): The ratio has been creeping up
Fig 22 Inventory/shipment (US): The same happens in the US
Source: Korea Statistics, Macquarie Research, May 2016 Source: Datastream, Macquarie Research, May 2016
Fig 23 Inventory/shipment ratio (Korea - IT sector)
Fig 24 Inventory/shipment ratio trend (Korea - auto sector)
Source: Korea Statistics, Macquarie Research, May 2016 Source: Korea Statistics, Macquarie Research, May 2016
The visibility and delivery of earnings is a key factor for share performance
With an expected slowdown in volatility of the key three drivers (oil prices, FX, and China) that we
highlight for 2016 and limited signals for a meaningful improvement in the inventory cycle, we believe
gaining confidence on the earnings visibility and actual delivery of earnings should be the key
differentiating factor for share performance in the foreseeable future. While we believe the KOSPI’s
long-term earnings outlook would not be rosy (due to deteriorating demographics, progress of
disintermediation, competition with Chinese players, etc), we believe the KOSPI’s earnings
momentum will be relatively strong in the short to medium term.
First, we have gone through a historically extreme earnings revision cycle from 2012 to early 2015
when the earnings revision ratio remained sluggish near -40%. However, we have seen a meaningful
improvement in the earnings revision cycle since 2H15 and believe the trend will sustain. Second,
during the earnings revision period of 2012-15, we believe Street analysts’ expectations became
much more reasonable than before. As shown in Fig 26 below, we witnessed much smaller variance
in 2015 earnings revisions than in 2014 and 2013. As a result, the earnings hit ratio has clearly
improved and the confidence on earnings growth will build up if the ratio remains strong for a few
quarters.
80%
90%
100%
110%
120%
130%
140%
150%
2007 2008 2009 2010 2011 2012 2013 2014 2015 2016
Manufacturing total 3mma
110%
115%
120%
125%
130%
135%
140%
145%
150%
2007 2008 2009 2010 2011 2012 2013 2014 2015 2016
US Inventory/Shipment 3mma
40%
60%
80%
100%
120%
140%
160%
180%
200%
2007 2008 2009 2010 2011 2012 2013 2014 2015 2016
IT (Elec devices) 3mma
40%
60%
80%
100%
120%
140%
160%
180%
200%
2007 2008 2009 2010 2011 2012 2013 2014 2015 2016
Auto 3mma

Macquarie Research Korea Strategy
24 May 2016 12
Fig 25 Earnings revision cycle has shown meaningful improvement
Fig 26 The variance in earnings revisions was much smaller in 2015 than in 2014 and 2013
Source: MSCI, Macquarie Research, May 2016 Source: Bloomberg, Macquarie Research, May 2016
Fig 27 Earnings hit ratio has clearly improved
Fig 28 Confidence on earnings growth will build up if the earnings hit ratio remains strong
Source: Wisefn, Macquarie Research, May 2016 Source: Wisefn, Macquarie Research, May 2016
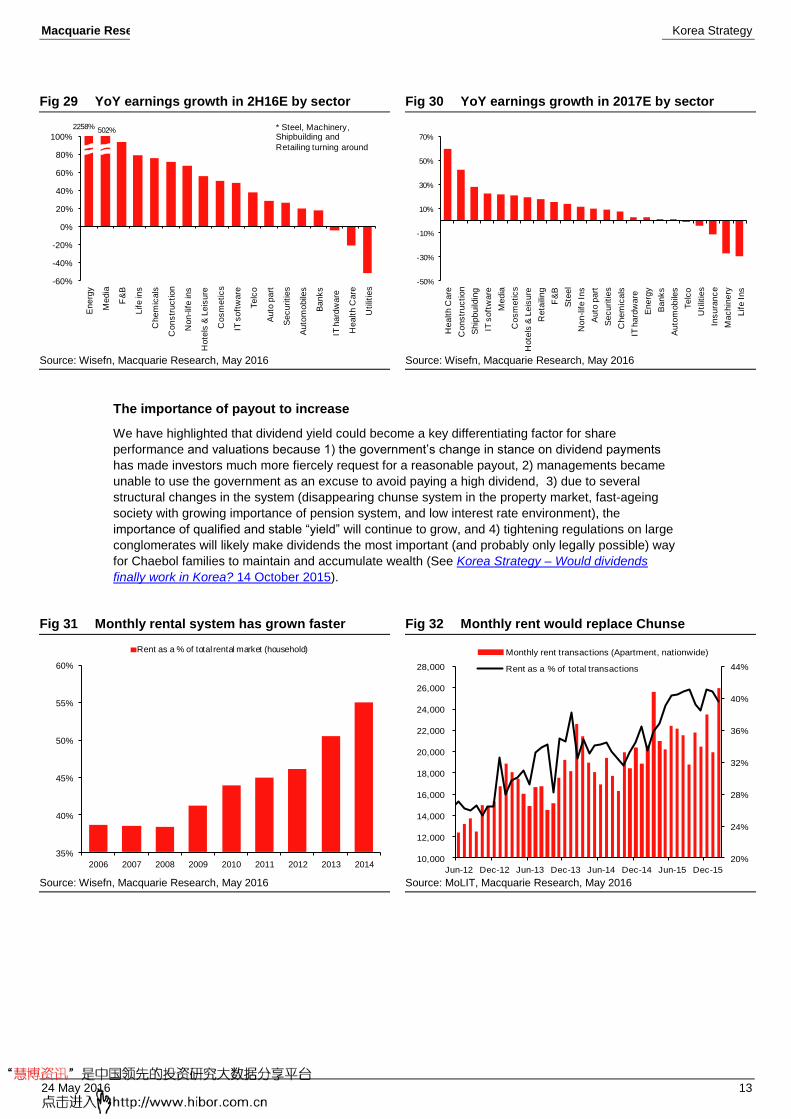
Based on market consensus and our intuitive judgements, we believe that cosmetics, non-life
insurance, chemical, retail, food & beverage, IT software (Internet), media, energy, and banks should
deliver solid earnings growth with relatively high confidence. While shipbuilders, shippers, and
constructors are expected to deliver exponential growth in EPS in 2017, it would be mainly due to
extremely low base effect and the visibility of delivery would remain low until the market become
confident on the potential pick-up in global demand.
-80%
-60%
-40%
-20%
0%
20%
40%
60%
2006 2007 2008 2009 2010 2011 2012 2013 2014 2015 2016
MSCI Korea earnings revision ratio 3MMA
-25%
-20%
-15%
-10%
-5%
0%
5%
Jan Feb Mar May Jun Aug Sep Oct Dec
2015 Earnings revision 2014 Earnings revision
2013 Earnings revision
0%
20%
40%
60%
80%
100%
120%
140%
160%
1Q
12
3Q
12
1Q
13
3Q
13
1Q
14
3Q
14
1Q
15
3Q
15
1Q
16
Beat/Miss
0%
5%
10%
15%
20%
25%
30%
35%
40%
1Q
12
3Q
12
1Q
13
3Q
13
1Q
14
3Q
14
1Q
15
3Q
15
1Q
16
Beat/Total
Macquarie Research Korea Strategy
24 May 2016 13
Fig 29 YoY earnings growth in 2H16E by sector Fig 30 YoY earnings growth in 2017E by sector
Source: Wisefn, Macquarie Research, May 2016 Source: Wisefn, Macquarie Research, May 2016
The importance of payout to increase
We have highlighted that dividend yield could become a key differentiating factor for share
performance and valuations because 1) the government’s change in stance on dividend payments
has made investors much more fiercely request for a reasonable payout, 2) managements became
unable to use the government as an excuse to avoid paying a high dividend, 3) due to several
structural changes in the system (disappearing chunse system in the property market, fast-ageing
society with growing importance of pension system, and low interest rate environment), the
importance of qualified and stable “yield” will continue to grow, and 4) tightening regulations on large
conglomerates will likely make dividends the most important (and probably only legally possible) way
for Chaebol families to maintain and accumulate wealth (See Korea Strategy – Would dividends
finally work in Korea? 14 October 2015).
Fig 31 Monthly rental system has grown faster Fig 32 Monthly rent would replace Chunse
Source: Wisefn, Macquarie Research, May 2016 Source: MoLIT, Macquarie Research, May 2016
-60%
-40%
-20%
0%
20%
40%
60%
80%
100%
Energ
y
Me
dia
F&
B
Life
ins
Ch
em
ica
ls
Co
ns
tru
ctio
n
No
n-life
ins
Hote
ls &
Leis
ure
Co
sm
eti
cs
IT s
oft
wa
re
Te
lco
Auto
part
Se
cu
ritie
s
Auto
mo
bile
s
Banks
IT h
ard
wa
re
He
alth
Ca
re
Uti
litie
s
2258%502% * Steel, Machinery,
Shipbuilding and
Retailing turning around
-50%
-30%
-10%
10%
30%
50%
70%
He
alt
h C
are
Co
ns
tru
cti
on
Ship
build
ing
IT s
oft
wa
re
Me
dia
Co
sm
etics
Ho
tels
& L
eis
ure
Re
taili
ng
F&
B
Ste
el
No
n-life
In
s
Au
to p
art
Se
cu
riti
es
Ch
em
ica
ls
IT h
ard
wa
re
En
erg
y
Banks
Au
tom
obile
s
Te
lco
Utilit
ies
Ins
ura
nc
e
Ma
ch
ine
ry
Lif
e I
ns
35%
40%
45%
50%
55%
60%
2006 2007 2008 2009 2010 2011 2012 2013 2014
Rent as a % of total rental market (household)
10,000
12,000
14,000
16,000
18,000
20,000
22,000
24,000
26,000
28,000
Jun-12 Dec-12 Jun-13 Dec-13 Jun-14 Dec-14 Jun-15 Dec-15
20%
24%
28%
32%
36%
40%
44%
Monthly rent transactions (Apartment, nationwide)
Rent as a % of total transactions
Macquarie Research Korea Strategy
24 May 2016 14
Fig 33 Korea has been ageing faster Fig 34 Pensions to grow exponentially
Source: Korea Statistics, Ministry of the Interior, Macquarie Research, May 2016
Source: FSS, Ministry of Employment and Labor, NPS, Macquarie Research, May 2016
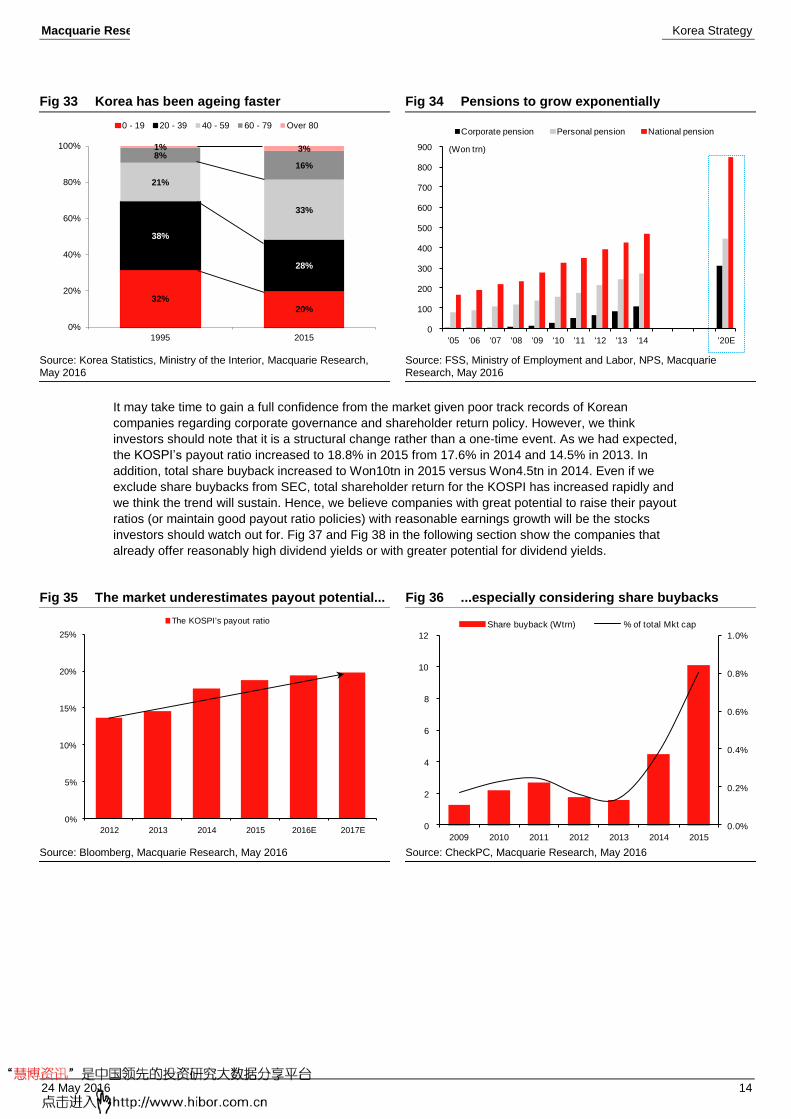
It may take time to gain a full confidence from the market given poor track records of Korean
companies regarding corporate governance and shareholder return policy. However, we think
investors should note that it is a structural change rather than a one-time event. As we had expected,
the KOSPI’s payout ratio increased to 18.8% in 2015 from 17.6% in 2014 and 14.5% in 2013. In
addition, total share buyback increased to Won10tn in 2015 versus Won4.5tn in 2014. Even if we
exclude share buybacks from SEC, total shareholder return for the KOSPI has increased rapidly and
we think the trend will sustain. Hence, we believe companies with great potential to raise their payout
ratios (or maintain good payout ratio policies) with reasonable earnings growth will be the stocks
investors should watch out for. Fig 37 and Fig 38 in the following section show the companies that
already offer reasonably high dividend yields or with greater potential for dividend yields.
Fig 35 The market underestimates payout potential... Fig 36 ...especially considering share buybacks
Source: Bloomberg, Macquarie Research, May 2016 Source: CheckPC, Macquarie Research, May 2016
32%
20%
38%
28%
21%
33%
8%16%
1% 3%
0%
20%
40%
60%
80%
100%
1995 2015
0 - 19 20 - 39 40 - 59 60 - 79 Over 80
0
100
200
300
400
500
600
700
800
900
'05 '06 '07 '08 '09 '10 '11 '12 '13 '14 '20E
Corporate pension Personal pension National pension
(Won trn)
0%
5%
10%
15%
20%
25%
2012 2013 2014 2015 2016E 2017E
The KOSPI's payout ratio
0.0%
0.2%
0.4%
0.6%
0.8%
1.0%
0
2
4
6
8
10
12
2009 2010 2011 2012 2013 2014 2015
Share buyback (Wtrn) % of total Mkt cap
Macquarie Research Korea Strategy
24 May 2016 15
Fig 37 Top dividend plays with current estimates Fig 38 Top potential dividend plays
Code Name
Dividend yield (%) Payout ratio (%)
16E 17E 18E 16E 17E 18E
088980 MKIF 5.6 6.0 7.0 104 112 99
017670 SKT 4.8 4.8 4.8 52 55 52
008060 Dae Duck Elec 4.1 4.1 N/A 51 44 N/A
001430 SeAH Besteel 4.0 4.1 4.1 33 31 28
005490 POSCO 3.9 4.0 4.0 46 40 37
000080 Hitejinro 3.9 3.9 3.9 91 80 75
139130 DGB FG 3.7 4.1 4.5 18 19 20
114090 GKL 3.5 3.8 3.9 54 53 54
042700 Hanmi Semi 3.4 3.6 3.7 35 38 38
021240 Coway 2.9 3.1 3.6 57 59 64
033780 KT&G 2.7 2.8 2.8 44 42 41
Code Name
Payout ratio (%)
Dividend yield (%) Potential
16E 17E 16E 17E 16E 17E
015760 KEPCO 16 17 3.5 3.9 22.1 22.5
005380 HMC 20 21 3.4 3.8 17.6 18.0
000270 Kia 16 16 2.6 2.8 16.3 17.1
012330 Mobis 10 11 1.5 1.6 14.0 14.9
010950 S-Oil 26 28 3.4 3.5 13.2 12.7
096770 SKI 20 20 2.6 2.6 13.0 13.2
161390 HKT 7 7 0.9 0.9 11.8 12.6
005930 SEC 19 20 1.9 2.1 9.9 10.2
000240 HKT WW 14 13 1.3 1.3 9.5 10.3
000660 SK Hynix 21 21 1.9 2.3 9.1 10.5
030200 KT 27 30 2.3 2.8 8.3 9.2
105560 KB FG 25 27 3.4 3.7 13.6 13.9
055550 Shinhan FG 25 28 3.2 3.7 12.8 13.1
003690 Kre 21 21 2.6 2.9 12.5 13.5
005830 DBI 27 26 2.5 2.7 9.1 10.4
Source: Wisefn, Macquarie Research, May 2016; Note: estimates based on Wisefn consensus
Source: Wisefn, Macquarie Research, May 2016; Note: estimates based on Wisefn consensus
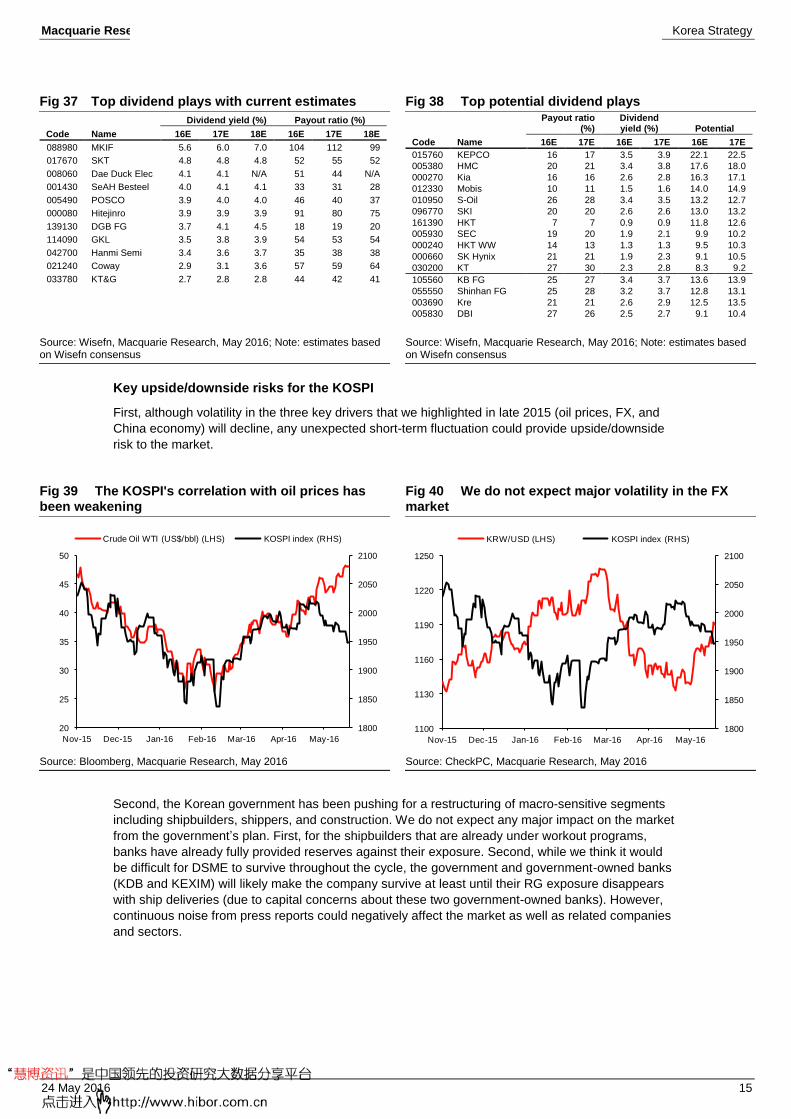
Key upside/downside risks for the KOSPI
First, although volatility in the three key drivers that we highlighted in late 2015 (oil prices, FX, and
China economy) will decline, any unexpected short-term fluctuation could provide upside/downside
risk to the market.
Fig 39 The KOSPI's correlation with oil prices has been weakening
Fig 40 We do not expect major volatility in the FX market
Source: Bloomberg, Macquarie Research, May 2016 Source: CheckPC, Macquarie Research, May 2016
Second, the Korean government has been pushing for a restructuring of macro-sensitive segments
including shipbuilders, shippers, and construction. We do not expect any major impact on the market
from the government’s plan. First, for the shipbuilders that are already under workout programs,
banks have already fully provided reserves against their exposure. Second, while we think it would
be difficult for DSME to survive throughout the cycle, the government and government-owned banks
(KDB and KEXIM) will likely make the company survive at least until their RG exposure disappears
with ship deliveries (due to capital concerns about these two government-owned banks). However,
continuous noise from press reports could negatively affect the market as well as related companies
and sectors.
1800
1850
1900
1950
2000
2050
2100
20
25
30
35
40
45
50
Nov-15 Dec-15 Jan-16 Feb-16 Mar-16 Apr-16 May-16
Crude Oil WTI (US$/bbl) (LHS) KOSPI index (RHS)
1800
1850
1900
1950
2000
2050
2100
1100
1130
1160
1190
1220
1250
Nov-15 Dec-15 Jan-16 Feb-16 Mar-16 Apr-16 May-16
KRW/USD (LHS) KOSPI index (RHS)

Macquarie Research Korea Strategy
24 May 2016 16
Fig 41 Shipbuilders will not pose a major threat to the banking system
Fig 42 BDI still remains low
Worst case scenario CET1 (%)
Expos
ure Loa
ns RG
30% loss
on loans
10% loss
on RG Total loss 1Q16
After loss from
DSME Chg
KB FG
599
161
438
48
44
92 13.53 13.49
-0.04%
SFG
291
18
272
6
27
33 10.93 10.92 -
0.01%
Woori
466
326
139
98
14
112 8.64 8.58 -
0.05%
HFG
818
704
114
211
11
223 10.35 10.26 -
0.09%
IBK
81
58
22
17
2
20 8.45 8.44 -
0.01%
BNK FG
25
6
20
2
2
4 8.17 8.17 0.00%
Source: Company data, Macquarie Research, May 2016 Source: Bloomberg, Macquarie Research, May 2016
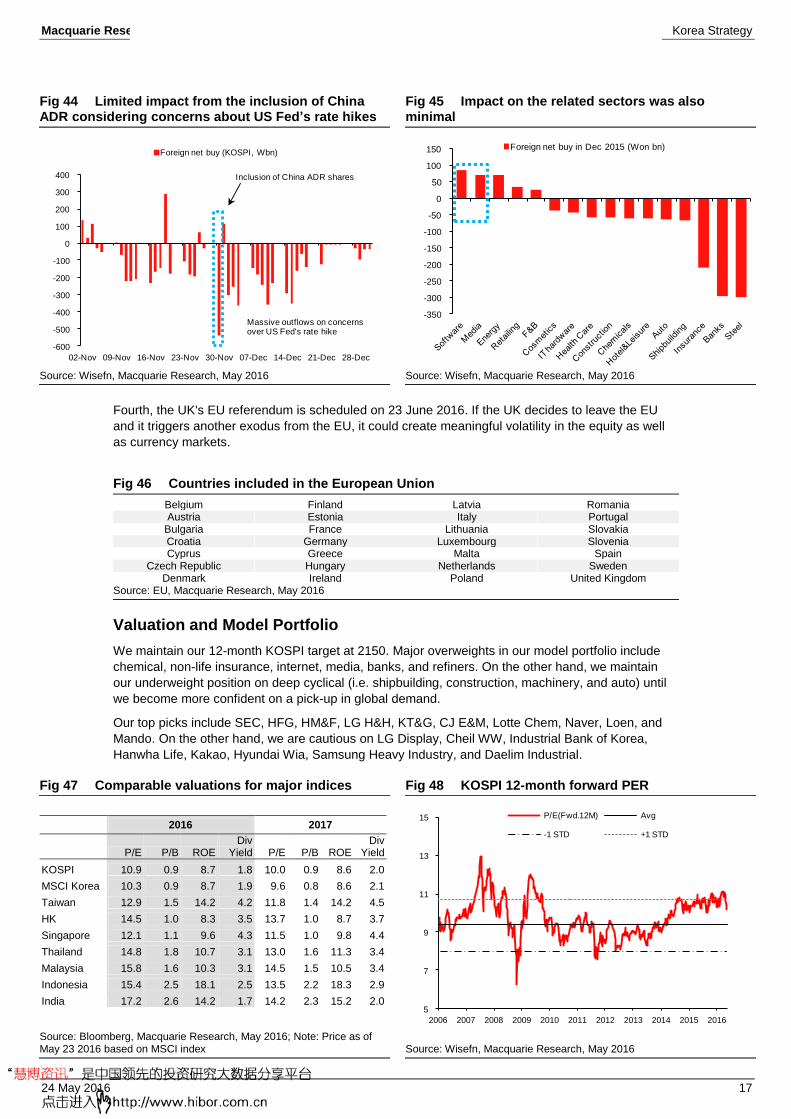
Third, MSCI is expected to rebalance its emerging market index. MSCI announced on 30 March that
it was reopening its investor consultation on the partial inclusion of China A-shares in the MSCI
Emerging Market Index. MSCI is scheduled to release its verdict in early June. If MSCI decides to
include 5% of China A-shares, Korea’s weights in MSCI EM would contract by 30bps. In addition,
potential 100% inclusion of China ADR shares in end May would be negative for foreign flows in
Korea. While the potential rebalancing of the MSCI EM index could be negative for the KOSPI, we do
not think the impact will be material because 1) foreign investors have already massively
underweighted Korea (which means that actual impact on their weights would not be as big as the
market fears), and 2) despite the inclusion of 50% China ADR shares in November 2015, actual
impact on related sectors (mainly software and services) was limited (instead, considering the
massive outflows due to concerns about US fed rate hikes, the actual impact of the inclusion of
China ADR was very limited). However, if market participants are concerned too much about the
rebalancing and trade ahead of the result, it could increase market volatility.
Fig 43 Possible index inclusion roadmap of China A-shares
Source: MSCI, Macquarie Research, May 2016
0
500
1000
1500
2000
2500
Jan-13 Jul-13 Jan-14 Jul-14 Jan-15 Jul-15 Jan-16
BDI Index
Macquarie Research Korea Strategy
24 May 2016 17
Fig 44 Limited impact from the inclusion of China ADR considering concerns about US Fed’s rate hikes
Fig 45 Impact on the related sectors was also minimal
Source: Wisefn, Macquarie Research, May 2016 Source: Wisefn, Macquarie Research, May 2016
Fourth, the UK's EU referendum is scheduled on 23 June 2016. If the UK decides to leave the EU
and it triggers another exodus from the EU, it could create meaningful volatility in the equity as well
as currency markets.
Fig 46 Countries included in the European Union
Belgium Finland Latvia Romania Austria Estonia Italy Portugal
Bulgaria France Lithuania Slovakia Croatia Germany Luxembourg Slovenia Cyprus Greece Malta Spain
Czech Republic Hungary Netherlands Sweden Denmark Ireland Poland United Kingdom
Source: EU, Macquarie Research, May 2016
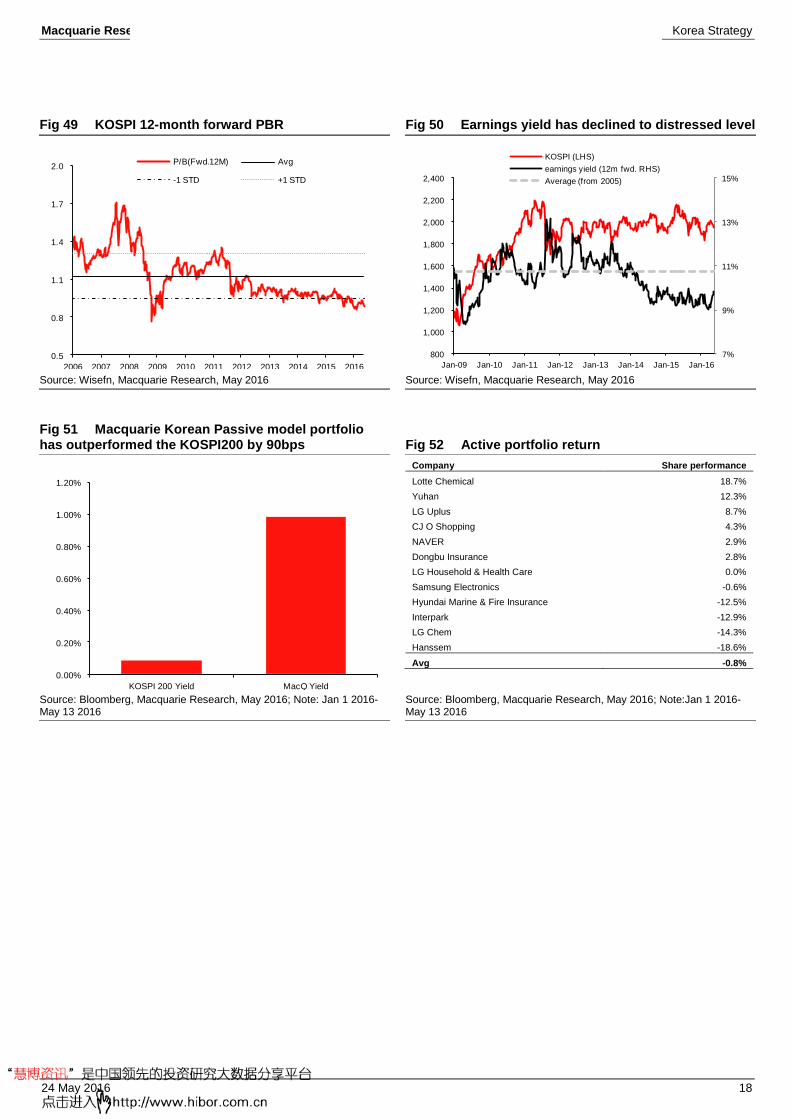
Valuation and Model Portfolio
We maintain our 12-month KOSPI target at 2150. Major overweights in our model portfolio include
chemical, non-life insurance, internet, media, banks, and refiners. On the other hand, we maintain
our underweight position on deep cyclical (i.e. shipbuilding, construction, machinery, and auto) until
we become more confident on a pick-up in global demand.
Our top picks include SEC, HFG, HM&F, LG H&H, KT&G, CJ E&M, Lotte Chem, Naver, Loen, and
Mando. On the other hand, we are cautious on LG Display, Cheil WW, Industrial Bank of Korea,
Hanwha Life, Kakao, Hyundai Wia, Samsung Heavy Industry, and Daelim Industrial.
Fig 47 Comparable valuations for major indices
Fig 48 KOSPI 12-month forward PER
2016 2017
P/E P/B ROE Div
Yield P/E P/B ROE Div
Yield
KOSPI 10.9 0.9 8.7 1.8 10.0 0.9 8.6 2.0
MSCI Korea 10.3 0.9 8.7 1.9 9.6 0.8 8.6 2.1
Taiwan 12.9 1.5 14.2 4.2 11.8 1.4 14.2 4.5
HK 14.5 1.0 8.3 3.5 13.7 1.0 8.7 3.7
Singapore 12.1 1.1 9.6 4.3 11.5 1.0 9.8 4.4
Thailand 14.8 1.8 10.7 3.1 13.0 1.6 11.3 3.4
Malaysia 15.8 1.6 10.3 3.1 14.5 1.5 10.5 3.4
Indonesia 15.4 2.5 18.1 2.5 13.5 2.2 18.3 2.9
India 17.2 2.6 14.2 1.7 14.2 2.3 15.2 2.0
Source: Bloomberg, Macquarie Research, May 2016; Note: Price as of May 23 2016 based on MSCI index
Source: Wisefn, Macquarie Research, May 2016
-600
-500
-400
-300
-200
-100
0
100
200
300
400
02-Nov 09-Nov 16-Nov 23-Nov 30-Nov 07-Dec 14-Dec 21-Dec 28-Dec
Foreign net buy (KOSPI, Wbn)
Inclusion of China ADR shares
Massive outflows on concerns over US Fed's rate hike
-350
-300
-250
-200
-150
-100
-50
0
50
100
150 Foreign net buy in Dec 2015 (Won bn)
5
7
9
11
13
15
2006 2007 2008 2009 2010 2011 2012 2013 2014 2015 2016
P/E(Fwd.12M) Avg
-1 STD +1 STD
Macquarie Research Korea Strategy
24 May 2016 18
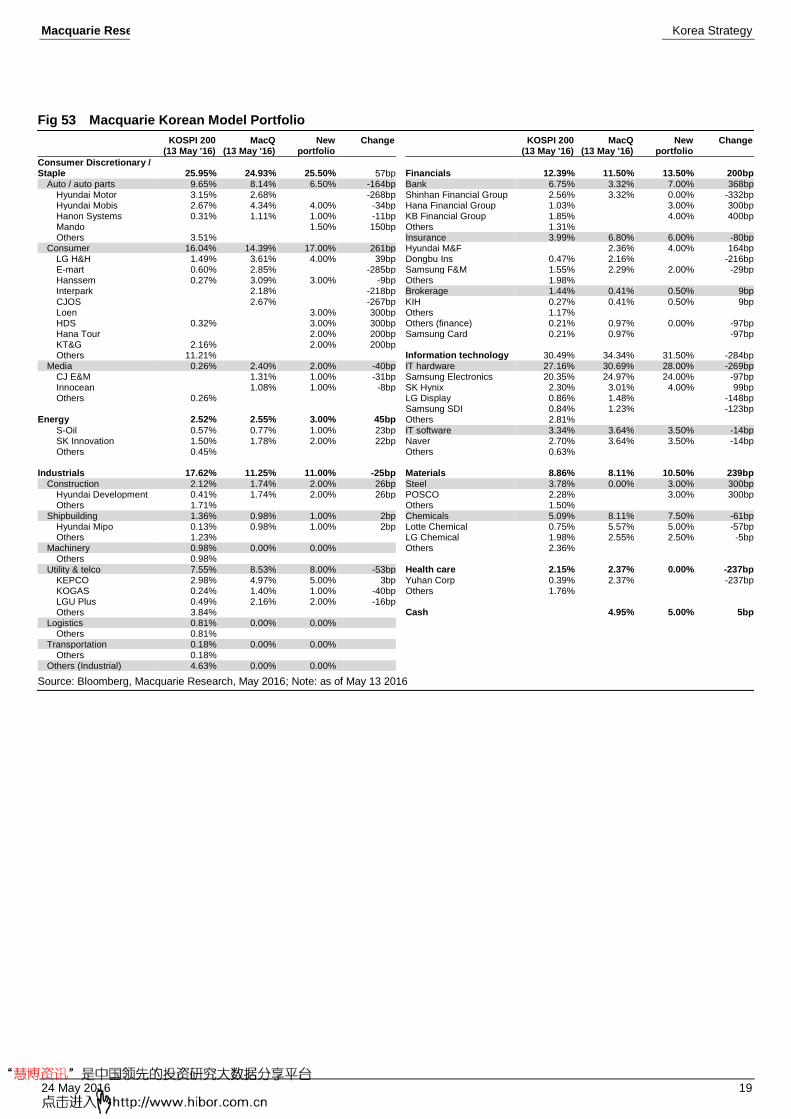
Fig 49 KOSPI 12-month forward PBR Fig 50 Earnings yield has declined to distressed level
Source: Wisefn, Macquarie Research, May 2016 Source: Wisefn, Macquarie Research, May 2016
Fig 51 Macquarie Korean Passive model portfolio has outperformed the KOSPI200 by 90bps
Fig 52 Active portfolio return
Company Share performance
Lotte Chemical 18.7%
Yuhan 12.3%
LG Uplus 8.7%
CJ O Shopping 4.3%
NAVER 2.9%
Dongbu Insurance 2.8%
LG Household & Health Care 0.0%
Samsung Electronics -0.6%
Hyundai Marine & Fire Insurance -12.5%
Interpark -12.9%
LG Chem -14.3%
Hanssem -18.6%
Avg -0.8%
Source: Bloomberg, Macquarie Research, May 2016; Note: Jan 1 2016-May 13 2016
Source: Bloomberg, Macquarie Research, May 2016; Note:Jan 1 2016-May 13 2016
0.5
0.8
1.1
1.4
1.7
2.0
2006 2007 2008 2009 2010 2011 2012 2013 2014 2015 2016
P/B(Fwd.12M) Avg
-1 STD +1 STD
7%
9%
11%
13%
15%
800
1,000
1,200
1,400
1,600
1,800
2,000
2,200
2,400
Jan-09 Jan-10 Jan-11 Jan-12 Jan-13 Jan-14 Jan-15 Jan-16
KOSPI (LHS)
earnings yield (12m fwd. RHS)
Average (from 2005)
0.00%
0.20%
0.40%
0.60%
0.80%
1.00%
1.20%
KOSPI 200 Yield MacQ Yield
Macquarie Research Korea Strategy
24 May 2016 19
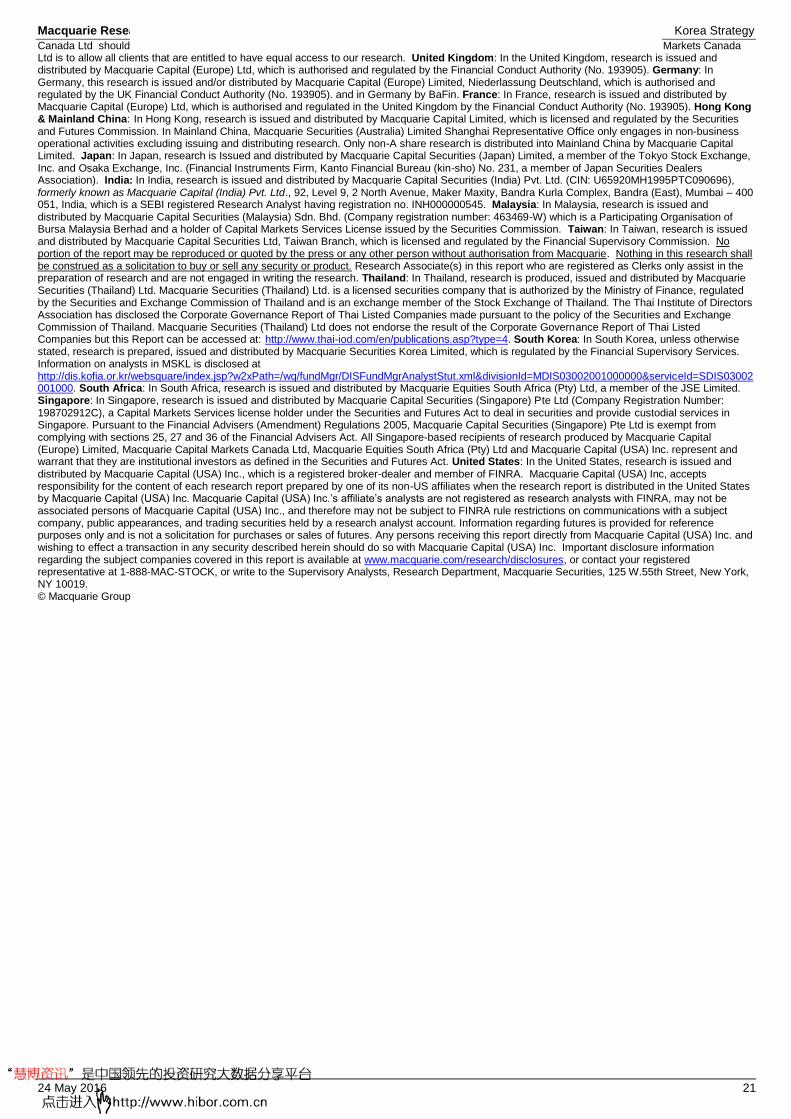
Fig 53 Macquarie Korean Model Portfolio
KOSPI 200 (13 May '16)
MacQ (13 May '16)
New portfolio
Change KOSPI 200 (13 May '16)
MacQ (13 May '16)
New portfolio
Change
Consumer Discretionary / Staple 25.95% 24.93% 25.50% 57bp
Financials 12.39% 11.50% 13.50% 200bp
Auto / auto parts 9.65% 8.14% 6.50% -164bp Bank 6.75% 3.32% 7.00% 368bp Hyundai Motor 3.15% 2.68% -268bp Shinhan Financial Group 2.56% 3.32% 0.00% -332bp Hyundai Mobis 2.67% 4.34% 4.00% -34bp Hana Financial Group 1.03% 3.00% 300bp Hanon Systems 0.31% 1.11% 1.00% -11bp KB Financial Group 1.85% 4.00% 400bp Mando 1.50% 150bp Others 1.31% Others 3.51% Insurance 3.99% 6.80% 6.00% -80bp
Consumer 16.04% 14.39% 17.00% 261bp Hyundai M&F 2.36% 4.00% 164bp LG H&H 1.49% 3.61% 4.00% 39bp Dongbu Ins 0.47% 2.16% -216bp E-mart 0.60% 2.85% -285bp Samsung F&M 1.55% 2.29% 2.00% -29bp Hanssem 0.27% 3.09% 3.00% -9bp Others 1.98% Interpark 2.18% -218bp Brokerage 1.44% 0.41% 0.50% 9bp CJOS 2.67% -267bp KIH 0.27% 0.41% 0.50% 9bp Loen 3.00% 300bp Others 1.17% HDS 0.32% 3.00% 300bp Others (finance) 0.21% 0.97% 0.00% -97bp Hana Tour 2.00% 200bp Samsung Card 0.21% 0.97% -97bp KT&G 2.16% 2.00% 200bp Others 11.21% Information technology 30.49% 34.34% 31.50% -284bp
Media 0.26% 2.40% 2.00% -40bp IT hardware 27.16% 30.69% 28.00% -269bp CJ E&M 1.31% 1.00% -31bp Samsung Electronics 20.35% 24.97% 24.00% -97bp Innocean 1.08% 1.00% -8bp SK Hynix 2.30% 3.01% 4.00% 99bp Others 0.26% LG Display 0.86% 1.48% -148bp
Samsung SDI 0.84% 1.23% -123bp Energy 2.52% 2.55% 3.00% 45bp Others 2.81%
S-Oil 0.57% 0.77% 1.00% 23bp IT software 3.34% 3.64% 3.50% -14bp SK Innovation 1.50% 1.78% 2.00% 22bp Naver 2.70% 3.64% 3.50% -14bp Others 0.45% Others 0.63%
Industrials 17.62% 11.25% 11.00% -25bp Materials 8.86% 8.11% 10.50% 239bp
Construction 2.12% 1.74% 2.00% 26bp Steel 3.78% 0.00% 3.00% 300bp Hyundai Development 0.41% 1.74% 2.00% 26bp POSCO 2.28% 3.00% 300bp Others 1.71% Others 1.50%
Shipbuilding 1.36% 0.98% 1.00% 2bp Chemicals 5.09% 8.11% 7.50% -61bp Hyundai Mipo 0.13% 0.98% 1.00% 2bp Lotte Chemical 0.75% 5.57% 5.00% -57bp Others 1.23% LG Chemical 1.98% 2.55% 2.50% -5bp
Machinery 0.98% 0.00% 0.00% Others 2.36% Others 0.98%
Utility & telco 7.55% 8.53% 8.00% -53bp Health care 2.15% 2.37% 0.00% -237bp KEPCO 2.98% 4.97% 5.00% 3bp Yuhan Corp 0.39% 2.37% -237bp KOGAS 0.24% 1.40% 1.00% -40bp Others 1.76% LGU Plus 0.49% 2.16% 2.00% -16bp Others 3.84% Cash 4.95% 5.00% 5bp
Logistics 0.81% 0.00% 0.00% Others 0.81%
Transportation 0.18% 0.00% 0.00% Others 0.18%
Others (Industrial) 4.63% 0.00% 0.00%
Source: Bloomberg, Macquarie Research, May 2016; Note: as of May 13 2016

Macquarie Research Korea Strategy
24 May 2016 20
Important disclosures:
Recommendation definitions
Macquarie - Australia/New Zealand Outperform – return >3% in excess of benchmark return Neutral – return within 3% of benchmark return Underperform – return >3% below benchmark return Benchmark return is determined by long term nominal GDP growth plus 12 month forward market dividend yield
Macquarie – Asia/Europe Outperform – expected return >+10% Neutral – expected return from -10% to +10% Underperform – expected return <-10%
Macquarie – South Africa Outperform – expected return >+10% Neutral – expected return from -10% to +10% Underperform – expected return <-10%
Macquarie - Canada
Outperform – return >5% in excess of benchmark return Neutral – return within 5% of benchmark return Underperform – return >5% below benchmark return
Macquarie - USA Outperform (Buy) – return >5% in excess of Russell 3000 index return Neutral (Hold) – return within 5% of Russell 3000 index return Underperform (Sell)– return >5% below Russell 3000 index return
Volatility index definition*
This is calculated from the volatility of historical price movements. Very high–highest risk – Stock should be
expected to move up or down 60–100% in a year – investors should be aware this stock is highly speculative. High – stock should be expected to move up or down at least 40–60% in a year – investors should be aware this stock could be speculative. Medium – stock should be expected to move up or down at least 30–40% in a year. Low–medium – stock should be expected to move up or down at least 25–30% in a year. Low – stock should be expected to move up or down at least 15–25% in a year. * Applicable to Asia/Australian/NZ/Canada stocks only
Recommendations – 12 months Note: Quant recommendations may differ from Fundamental Analyst recommendations
Financial definitions
All "Adjusted" data items have had the following adjustments made: Added back: goodwill amortisation, provision for catastrophe reserves, IFRS derivatives & hedging, IFRS impairments & IFRS interest expense Excluded: non recurring items, asset revals, property revals, appraisal value uplift, preference dividends & minority interests EPS = adjusted net profit / efpowa* ROA = adjusted ebit / average total assets ROA Banks/Insurance = adjusted net profit /average total assets ROE = adjusted net profit / average shareholders funds Gross cashflow = adjusted net profit + depreciation *equivalent fully paid ordinary weighted average number of shares All Reported numbers for Australian/NZ listed stocks are modelled under IFRS (International Financial Reporting Standards).
Recommendation proportions – For quarter ending 31 March 2016
AU/NZ Asia RSA USA CA EUR Outperform 50.34% 59.09% 46.67% 44.76% 60.66% 46.12% (for global coverage by Macquarie, 3.72% of stocks followed are investment banking clients)
Neutral 34.14% 25.66% 32.00% 49.90% 30.33% 35.10% (for global coverage by Macquarie, 4.79% of stocks followed are investment banking clients)
Underperform 15.52% 15.26% 21.33% 5.33% 9.02% 18.78% (for global coverage by Macquarie, 2.31% of stocks followed are investment banking clients)
Company-specific disclosures: Important disclosure information regarding the subject companies covered in this report is available at www.macquarie.com/research/disclosures.
Analyst certification: We hereby certify that all of the views expressed in this report accurately reflect our personal views about the subject company or companies and its or their securities. We also certify that no part of our compensation was, is or will be, directly or indirectly, related to the specific recommendations or views expressed in this report. The Analysts responsible for preparing this report receive compensation from Macquarie that is based upon various factors including Macquarie Group Ltd total revenues, a portion of which are generated by Macquarie Group’s Investment Banking activities. General disclaimers: Macquarie Securities (Australia) Ltd; Macquarie Capital (Europe) Ltd; Macquarie Capital Markets Canada Ltd; Macquarie Capital Markets North America Ltd; Macquarie Capital (USA) Inc; Macquarie Capital Limited and its Taiwan branch; Macquarie Capital Securities (Singapore) Pte Ltd; Macquarie Securities (NZ) Ltd; Macquarie Equities South Africa (Pty) Ltd; Macquarie Capital Securities (India) Pvt Ltd; Macquarie Capital Securities (Malaysia) Sdn Bhd; Macquarie Securities Korea Limited and Macquarie Securities (Thailand) Ltd are not authorized deposit-taking institutions for the purposes of the Banking Act 1959 (Commonwealth of Australia), and their obligations do not represent deposits or other liabilities of Macquarie Bank Limited ABN 46 008 583 542 (MBL) or MGL. MBL does not guarantee or otherwise provide assurance in respect of the obligations of any of the above mentioned entities. MGL provides a guarantee to the Monetary Authority of Singapore in respect of the obligations and liabilities of Macquarie Capital Securities (Singapore) Pte Ltd for up to SGD 35 million. This research has been prepared for the general use of the wholesale clients of the Macquarie Group and must not be copied, either in whole or in part, or distributed to any other person. If you are not the intended recipient you must not use or disclose the information in this research in any way. If you received it in error, please tell us immediately by return e-mail and delete the document. We do not guarantee the integrity of any e-mails or attached files and are not responsible for any changes made to them by any other person. MGL has established and implemented a conflicts policy at group level (which may be revised and updated from time to time) (the "Conflicts Policy") pursuant to regulatory requirements (including the FCA Rules) which sets out how we must seek to identify and manage all material conflicts of interest. Nothing in this research shall be construed as a solicitation to buy or sell any security or product, or to engage in or refrain from engaging in any transaction. In preparing this research, we did not take into account your investment objectives, financial situation or particular needs. Macquarie salespeople, traders and other professionals may provide oral or written market commentary or trading strategies to our clients that reflect opinions which are contrary to the opinions expressed in this research. Macquarie Research produces a variety of research products including, but not limited to, fundamental analysis, macro-economic analysis, quantitative analysis, and trade ideas. Recommendations contained in one type of research product may differ from recommendations contained in other types of research, whether as a result of differing time horizons, methodologies, or otherwise. Before making an investment decision on the basis of this research, you need to consider, with or without the assistance of an adviser, whether the advice is appropriate in light of your particular investment needs, objectives and financial circumstances. There are risks involved in securities trading. The price of securities can and does fluctuate, and an individual security may even become valueless. International investors are reminded of the additional risks inherent in international investments, such as currency fluctuations and international stock market or economic conditions, which may adversely affect the value of the investment. This research is based on information obtained from sources believed to be reliable but we do not make any representation or warranty that it is accurate, complete or up to date. We accept no obligation to correct or update the information or opinions in it. Opinions expressed are subject to change without notice. No member of the Macquarie Group accepts any liability whatsoever for any direct, indirect, consequential or other loss arising from any use of this research and/or further communication in relation to this research. Clients should contact analysts at, and execute transactions through, a Macquarie Group entity in their home jurisdiction unless governing law permits otherwise. The date and timestamp for above share price and market cap is the closed price of the price date. #CLOSE is the final price at which the security is traded in the relevant exchange on the date indicated. Country-specific disclaimers: Australia: In Australia, research is issued and distributed by Macquarie Securities (Australia) Ltd (AFSL No. 238947), a participating organisation of the Australian Securities Exchange. New Zealand: In New Zealand, research is issued and distributed by Macquarie Securities (NZ) Ltd, a NZX Firm. Canada: In Canada, research is prepared, approved and distributed by Macquarie Capital Markets Canada Ltd, a participating organisation of the Toronto Stock Exchange, TSX Venture Exchange & Montréal Exchange. Macquarie Capital Markets North America Ltd., which is a registered broker-dealer and member of FINRA, accepts responsibility for the contents of reports issued by Macquarie Capital Markets Canada Ltd in the United States and sent to US persons. Any US person wishing to effect transactions in the securities described in the reports issued by Macquarie Capital Markets
Macquarie Research Korea Strategy
24 May 2016 21
Canada Ltd should do so with Macquarie Capital Markets North America Ltd. The Research Distribution Policy of Macquarie Capital Markets Canada Ltd is to allow all clients that are entitled to have equal access to our research. United Kingdom: In the United Kingdom, research is issued and distributed by Macquarie Capital (Europe) Ltd, which is authorised and regulated by the Financial Conduct Authority (No. 193905). Germany: In Germany, this research is issued and/or distributed by Macquarie Capital (Europe) Limited, Niederlassung Deutschland, which is authorised and regulated by the UK Financial Conduct Authority (No. 193905). and in Germany by BaFin. France: In France, research is issued and distributed by Macquarie Capital (Europe) Ltd, which is authorised and regulated in the United Kingdom by the Financial Conduct Authority (No. 193905). Hong Kong & Mainland China: In Hong Kong, research is issued and distributed by Macquarie Capital Limited, which is licensed and regulated by the Securities and Futures Commission. In Mainland China, Macquarie Securities (Australia) Limited Shanghai Representative Office only engages in non-business operational activities excluding issuing and distributing research. Only non-A share research is distributed into Mainland China by Macquarie Capital Limited. Japan: In Japan, research is Issued and distributed by Macquarie Capital Securities (Japan) Limited, a member of the Tokyo Stock Exchange, Inc. and Osaka Exchange, Inc. (Financial Instruments Firm, Kanto Financial Bureau (kin-sho) No. 231, a member of Japan Securities Dealers Association). India: In India, research is issued and distributed by Macquarie Capital Securities (India) Pvt. Ltd. (CIN: U65920MH1995PTC090696), formerly known as Macquarie Capital (India) Pvt. Ltd., 92, Level 9, 2 North Avenue, Maker Maxity, Bandra Kurla Complex, Bandra (East), Mumbai – 400 051, India, which is a SEBI registered Research Analyst having registration no. INH000000545. Malaysia: In Malaysia, research is issued and distributed by Macquarie Capital Securities (Malaysia) Sdn. Bhd. (Company registration number: 463469-W) which is a Participating Organisation of Bursa Malaysia Berhad and a holder of Capital Markets Services License issued by the Securities Commission. Taiwan: In Taiwan, research is issued and distributed by Macquarie Capital Securities Ltd, Taiwan Branch, which is licensed and regulated by the Financial Supervisory Commission. No portion of the report may be reproduced or quoted by the press or any other person without authorisation from Macquarie. Nothing in this research shall be construed as a solicitation to buy or sell any security or product. Research Associate(s) in this report who are registered as Clerks only assist in the preparation of research and are not engaged in writing the research. Thailand: In Thailand, research is produced, issued and distributed by Macquarie Securities (Thailand) Ltd. Macquarie Securities (Thailand) Ltd. is a licensed securities company that is authorized by the Ministry of Finance, regulated by the Securities and Exchange Commission of Thailand and is an exchange member of the Stock Exchange of Thailand. The Thai Institute of Directors Association has disclosed the Corporate Governance Report of Thai Listed Companies made pursuant to the policy of the Securities and Exchange Commission of Thailand. Macquarie Securities (Thailand) Ltd does not endorse the result of the Corporate Governance Report of Thai Listed Companies but this Report can be accessed at: http://www.thai-iod.com/en/publications.asp?type=4. South Korea: In South Korea, unless otherwise stated, research is prepared, issued and distributed by Macquarie Securities Korea Limited, which is regulated by the Financial Supervisory Services. Information on analysts in MSKL is disclosed at http://dis.kofia.or.kr/websquare/index.jsp?w2xPath=/wq/fundMgr/DISFundMgrAnalystStut.xml&divisionId=MDIS03002001000000&serviceId=SDIS03002001000. South Africa: In South Africa, research is issued and distributed by Macquarie Equities South Africa (Pty) Ltd, a member of the JSE Limited. Singapore: In Singapore, research is issued and distributed by Macquarie Capital Securities (Singapore) Pte Ltd (Company Registration Number: 198702912C), a Capital Markets Services license holder under the Securities and Futures Act to deal in securities and provide custodial services in Singapore. Pursuant to the Financial Advisers (Amendment) Regulations 2005, Macquarie Capital Securities (Singapore) Pte Ltd is exempt from complying with sections 25, 27 and 36 of the Financial Advisers Act. All Singapore-based recipients of research produced by Macquarie Capital (Europe) Limited, Macquarie Capital Markets Canada Ltd, Macquarie Equities South Africa (Pty) Ltd and Macquarie Capital (USA) Inc. represent and warrant that they are institutional investors as defined in the Securities and Futures Act. United States: In the United States, research is issued and distributed by Macquarie Capital (USA) Inc., which is a registered broker-dealer and member of FINRA. Macquarie Capital (USA) Inc, accepts responsibility for the content of each research report prepared by one of its non-US affiliates when the research report is distributed in the United States by Macquarie Capital (USA) Inc. Macquarie Capital (USA) Inc.’s affiliate’s analysts are not registered as research analysts with FINRA, may not be associated persons of Macquarie Capital (USA) Inc., and therefore may not be subject to FINRA rule restrictions on communications with a subject company, public appearances, and trading securities held by a research analyst account. Information regarding futures is provided for reference purposes only and is not a solicitation for purchases or sales of futures. Any persons receiving this report directly from Macquarie Capital (USA) Inc. and wishing to effect a transaction in any security described herein should do so with Macquarie Capital (USA) Inc. Important disclosure information regarding the subject companies covered in this report is available at www.macquarie.com/research/disclosures, or contact your registered representative at 1-888-MAC-STOCK, or write to the Supervisory Analysts, Research Department, Macquarie Securities, 125 W.55th Street, New York, NY 10019. © Macquarie Group

Asia Research Head of Equity Research
Peter Redhead (Global – Head) (852) 3922 4836
Matt Nacard (Asia – Head) (852) 3922 1362
Jake Lynch (Asia – Head) (852) 3922 3583
Automobiles/Auto Parts
Janet Lewis (China) (852) 3922 5417
Zhixuan Lin (China) (8621) 2412 9006
Amit Mishra (India) (9122) 6720 4084
Lyall Taylor (Indonesia) (6221) 2598 8489
Takuo Katayama (Japan) (813) 3512 7856
James Hong (Korea) (822) 3705 8661
Banks and Non-Bank Financials
Matthew Smith (China) (8621) 2412 9022
Suresh Ganapathy (India) (9122) 6720 4078
Lyall Taylor (Indonesia) (6221) 2598 8489
Keisuke Moriyama (Japan) (813) 3512 7476
Leo Nakada (Japan) (813) 3512 6050
Chan Hwang (Korea) (822) 3705 8643
Gilbert Lopez (Philippines) (632) 857 0892
Thomas Stoegner (Singapore) (65) 6601 0854
Dexter Hsu (Taiwan) (8862) 2734 7530
Passakorn Linmaneechote (Thailand) (662) 694 7728
Conglomerates
Gilbert Lopez (Philippines) (632) 857 0892
Consumer and Gaming
Linda Huang (China, Hong Kong) (852) 3922 4068
Zibo Chen (Hong Kong) (852) 3922 1130
Amit Mishra (India) (9122) 6720 4084
Fransisca Widjaja (Singapore) (65) 6601 0847
Hendy Soegiarto (Indonesia) (6221) 2598 8369
Toby Williams (Japan) (813) 3512 7392
HongSuk Na (Korea) (822) 3705 8678
Karisa Magpayo (Philippines) (632) 857 0899
Emerging Leaders
Jake Lynch (China, Asia) (852) 3922 3583
Aditya Suresh (Asia) (852) 3922 1265
Neel Sinha (ASEAN) (65) 6601 0562
Timothy Lam (Hong Kong) (852) 3922 1086
Mike Allen (Japan) (813) 3512 7859
Kwang Cho (Korea) (822) 3705 4953
Industrials
Janet Lewis (Asia) (852) 3922 5417
Patrick Dai (China) (8621) 2412 9082
Inderjeetsingh Bhatia (India) (9122) 6720 4087
Lyall Taylor (Indonesia) (6221) 2598 8489
Kenjin Hotta (Japan) (813) 3512 7871
James Hong (Korea) (822) 3705 8661
Insurance
Scott Russell (Asia, Japan) (852) 3922 3567
Thomas Stoegner (ASEAN) (65) 6601 0854
Leo Nakada (Japan) (813) 3512 6050
Chan Hwang (Korea) (822) 3705 8643
Dexter Hsu (Taiwan) (8862) 2734 7530
Passakorn Linmaneechote (Thailand) (662) 694 7728
Software and Internet
Wendy Huang (Asia) (852) 3922 3378
David Gibson (Asia) (813) 3512 7880
Hillman Chan (China, Hong Kong) (852) 3922 3716
Nitin Mohta (India) (9122) 6720 4090
Nathan Ramler (Japan) (813) 3512 7875
Prem Jearajasingam (Malaysia) (603) 2059 8989
Oil, Gas and Petrochemicals
James Hubbard (Asia) (852) 3922 1226
Aditya Suresh (Asia) (852) 3922 1265
Duke Suttikulpanich (ASEAN) (65) 6601 0148
Abhishek Agarwal (India) (9122) 6720 4079
Polina Diyachkina (Japan) (813) 3512 7886
Anna Park (Korea) (822) 3705 8669
Isaac Chow (Malaysia) (603) 2059 8982
Pharmaceuticals and Healthcare
Wei Li (China, Hong Kong) (852) 3922 5494
Abhishek Singhal (India) (9122) 6720 4086
Property
Tuck Yin Soong (Asia, Singapore) (65) 6601 0838
David Ng (China, Hong Kong) (852) 3922 1291
Raymond Liu (China, Hong Kong) (852) 3922 3629
Wilson Ho (China) (852) 3922 3248
Abhishek Bhandari (India) (9122) 6720 4088
William Montgomery (Japan) (813) 3512 7864
Aiman Mohamad (Malaysia) (603) 2059 8986
Kervin Sisayan (Philippines) (632) 857 0893
Corinne Jian (Taiwan) (8862) 2734 7522
Patti Tomaitrichitr (Thailand) (662) 694 7727
Resources / Metals and Mining
Coria Chow (China) (852) 3922 1181
Rakesh Arora (India) (9122) 6720 4093
Stanley Liong (Indonesia) (6221) 2598 8381
Polina Diyachkina (Japan) (813) 3512 7886
Anna Park (Korea) (822) 3705 8669
Technology
Damian Thong (Asia, Japan) (813) 3512 7877
Allen Chang (852) 3922 1136 (China, Hong Kong, Taiwan)
Nitin Mohta (India) (9122) 6720 4090
David Gibson (Japan) (813) 3512 7880
George Chang (Japan) (813) 3512 7854
Daniel Kim (Korea) (822) 3705 8641
Soyun Shin (Korea) (822) 3705 8659
Patrick Liao (Taiwan) (8862) 2734 7515
Louis Cheng (Taiwan) (8862) 2734 7526
Kaylin Tsai (Taiwan) (8862) 2734 7523
Telecoms
Nathan Ramler (Asia, Japan) (813) 3512 7875
Danny Chu (852) 3922 4762 (China, Hong Kong, Taiwan)
Abhishek Agarwal (India) (9122) 6720 4079
Prem Jearajasingam (Malaysia, Singapore) (603) 2059 8989
Kervin Sisayan (Philippines) (632) 857 0893
Transport & Infrastructure
Janet Lewis (Asia) (852) 3922 5417
Azita Nazrene (ASEAN) (603) 2059 8980
Corinne Jian (Taiwan) (8862) 2734 7522
Utilities & Renewables
Alan Hon (Hong Kong) (852) 3922 3589
Inderjeetsingh Bhatia (India) (9122) 6720 4087
Prem Jearajasingam (Malaysia) (603) 2059 8989
Karisa Magpayo (Philippines) (632) 857 0899
Commodities
Colin Hamilton (Global) (4420) 3037 4061
Ian Roper (65) 6601 0698
Jim Lennon (4420) 3037 4271
Lynn Zhao (8621) 2412 9035
Matthew Turner (4420) 3037 4340
Rakesh Arora (9122) 6720 4093
Economics
Peter Eadon-Clarke (Global) (813) 3512 7850
Larry Hu (China, Hong Kong) (852) 3922 3778
Tanvee Gupta Jain (India) (9122) 6720 4355
Quantitative / CPG
Gurvinder Brar (Global) (4420) 3037 4036
Woei Chan (Asia) (852) 3922 1421
Anthony Ng (Asia) (852) 3922 1561
Danny Deng (Asia) (852) 3922 4646
Per Gullberg (Asia) (852) 3922 1478
Strategy/Country
Viktor Shvets (Asia, Global) (852) 3922 3883
Chetan Seth (Asia) (852) 3922 4769
Peter Eadon-Clarke (Japan) (813) 3512 7850
David Ng (China, Hong Kong) (852) 3922 1291
Erwin Sanft (China, Hong Kong) (852) 3922 1516
Rakesh Arora (India) (9122) 6720 4093
Lyall Taylor (Indonesia) (6221) 2598 8489
Chan Hwang (Korea) (822) 3705 8643
Gilbert Lopez (Philippines) (632) 857 0892
Conrad Werner (Singapore) (65) 6601 0182
Jeffrey Ohlweiler (Taiwan) (8862) 2734 7512
Alastair Macdonald (Thailand) (662) 694 7753
Find our research at Macquarie: www.macquarie.com.au/research Thomson: www.thomson.com/financial Reuters: www.knowledge.reuters.com Bloomberg: MAC GO Factset: http://www.factset.com/home.aspx CapitalIQ www.capitaliq.com Email [email protected] for access
Asia Sales Regional Heads of Sales
Miki Edelman (Global) (1 212) 231 6121
Jeffrey Chung (Asia) (852) 3922 2074
Jeff Evans (Boston) (1 617) 598 2508
Jeffrey Shiu (China, Hong Kong) (852) 3922 2061
Thomas Renz (Geneva) (41) 22 818 7712
Riaz Hyder (Indonesia) (6221) 2598 8486
Nick Cant (Japan) (65) 6601 0210
John Jay Lee (Korea) (822) 3705 9988
Nik Hadi (Malaysia) (603) 2059 8888
Eric Roles (New York) (1 212) 231 2559
Gino C Rojas (Philippines) (632) 857 0861
Regional Heads of Sales cont’d
Paul Colaco (San Francisco) (1 415) 762 5003
Amelia Mehta (Singapore) (65) 6601 0211
Angus Kent (Thailand) (662) 694 7601
Ben Musgrave (UK/Europe) (44) 20 3037 4882
Julien Roux (UK/Europe) (44) 20 3037 4867
Sales Trading
Adam Zaki (Asia) (852) 3922 2002
Stanley Dunda (Indonesia) (6221) 515 1555
Sales Trading cont’d
Suhaida Samsudin (Malaysia) (603) 2059 8888
Michael Santos (Philippines) (632) 857 0813
Chris Reale (New York) (1 212) 231 2555
Marc Rosa (New York) (1 212) 231 2555
Justin Morrison (Singapore) (65) 6601 0288
Isaac Huang (Taiwan) (8862) 2734 7582
Brendan Rake (Thailand) (662) 694 7707
Mike Keen (UK/Europe) (44) 20 3037 4905


![[Cc Korea]License Usages In Korea](https://img.pdfslide.net/doc/110x75/5554f617b4c90566278b5408/cc-korealicense-usages-in-korea.jpg)