Embed Size (px)
Citation preview
KOREA AND THE WORLD ECONOMY, III
A Joint AKES-RCIE and KDI International Conference
Sungkyunwan University, Seoul, Korea 3-4 July 2004
Korea’s Trade, Growth of Trade and the World Economy in Post-crisis ASEAN+3 Free Trade Agreement:
An Econometric and Policy Analysis
Tran Van Hoa
Department of Economics University of Wollongong
Wollongong, NSW 2522, Australia
Email: [email protected] Website: www.uow.edu.au/~tvheco/tvh.htm
ABSTRACT The Asia crisis starting in Thailand in July 1997 has had devastating impact on the ‘once miracle’ economies in ASEAN and East Asia in general and in Korea in particular, and its contagion has been spread, to a lesser extent, to beyond Asia (Tran Van Hoa, 2000, 2001). Nearly seven years on, the damaging impact is still lingering in many aspects and numerous rescue policies and reforms put forward by international organizations such as the IMF and adopted by national governments have not been that effective in restarting these crisis economies or in achieving a sustained and strong economic recovery path for the majority of these economies (Tran Van Hoa, 2002). The challenges are further compounded by a current global economic slowdown with hesitant recovery (IMF, 2004), 2001-2004 terrorist attacks, the effects of the Afghanistan and Iraq wars, the 2003 SARS and 2004 avian flu outbreaks in Asia, and domestic and global uncertainty ahead. What are the opportunities and prospects for growth and trade with the world (or its select trading blocs) then for the specific economy of Korea in this climate and in the face of ASEAN+3 and the proposed Australia-Korea free trade agreements? Some earlier studies on Asia crisis have postulated that the ‘once miracle’ economies in Asia such as Korea had achieved their high development and growth rates over the past decades mainly through good industrial policies (see for example Wong, 2000) or more recently through what has become known as the ASEAN or East

2
Asian economic models (see for example Harvie and Lee, 2002). In the latter models, not a single instrument but a set of monetary and fiscal policies and other (for example, science and technology and labour market) reforms had been consistently adopted over the years by national governments in Asia to promote development and growth. While this type of models is attractive in analysing a cohort of factors contributing to the success of Korea’s high-growth for example, it does not parsimoniously focus on the country’s principal growth determinants and has not been rigorously tested with econometric causality modelling using decades-long data for its empirical validity or for comparison with other competing causal or explanatory models. The paper first adopts the fundamental postulates of an extended gravity theory in the sense of Frankel and Romer (1999) to construct a simple function-free (Tran Van Hoa, 1992) simultaneous-equation econometric model of trade and growth for Korea and its major trading partners (the US, the EU, Japan, the ASEAN and Australia). It then uses Japan’s ICSEAD international trade time-series data and recent World Bank SNA93 statistics to provide empirical results on the trade-development or trade-growth causality and trade determination in Korea with its major trading partners over the past 20 years or so. The model is a theoretically plausible and data-consistent competing paradigm to explain the determinants of Korea’s development and growth. Economic policy challenges can then be targeted for study and solution development once the causal effects are optimally identified. Our preliminary findings indicate not surprisingly that Korea’s decades-long development and growth depended crucially and principally on its trade and growth of trade and much less on its other monetary and fiscal policies or reforms. The latter had however relevant impact on trade. Major crises in recent years did severely affect the country’s development and growth but the transmission mechanism was mainly through a decline in trade and growth of trade. Policies to promote, facilitate and liberalise trade between Korea and its major trading blocs are then argued to be the preferred policies to be adopted by Korea to restart and sustain its economy and to recover high and sustainable pre-crisis development and growth. However, in the face of a benign neglect from North America and the EU on Asian economic crisis woes and the slow-down or even recent stagnant state of these two economies and the almost paralysis of the WTO on world trade issues resolution, the setting-up of a regional economic integration such as the ASEAN+3 to promote and expand Korea’s trade and investment in particular and that of ASEAN+China, Korea, Japan and Australia-Korea in general seems to be a plausible, viable and data-consistent policy initiative. These FTAs are expected to provide good prospects for Korea’s future development and growth. Keywords: New Asian Regionalism, Free Trade Agreement, Economic Integration and Relations, ASEAN, ASEAN+3, Trade and Growth, Gravity Theory, Causality, Economic Modelling, Estimation Methods, de Finetti and Lindley Estimation, Economic and Trade Policy. JEL: C32, C51, C52, F02, F14, F15, F42, O11, O41, O53

3
1 Introduction The recent emergence of new Asian regionalisms (NARs) especially in the post-1997 crisis period and their potential substantial impact on member and non-member countries requires not only official dialogues but also extensive analysis and supporting research. These NARS include ASEAN, AFTA, ASEAN+3 (i.e., 10 ASEAN countries plus China, Korea and Japan) and other bilateral, plurilateral and multilateral free trade agreements (FTAs) such as Australia-US, Australia-Japan, Australia-Singapore, Japan-Singapore, Korea-Chile, the ministerial high-level sought-after ASEAN+5 (ASEAN+3 plus Australia and New Zealand), the currently proposed Australia-Indonesia, Australia-China and Australia-Korea as well as the Cotonou-type regional economic integration agreements (EIAs) advocated by the European Union (EU) in order to promote ‘organic’ growth and ‘normal’ opportunities (see Barker, 2002). In spite of this proliferation of NARs, new and vigorous research into the fundamental issues and impact of trade and growth, integration, and the viability, sustainability or expansion of these important regional developments are still in their infancy on even non-existent. More important is perhaps the question of “Is there substantive empirical evidence to support the ‘academic’ or ‘government officials and advisors’ assumption that trade is mercantilistically good for development in LDCs and for growth in developed economies?”. In the specific case of Korea, its trade with the world’s major trading blocs, especially the US, the European Union (EU), Japan, and the ASEAN has been substantial both in volume and in share in the past decades. For example, in 2002, Korea posted 20.3 per cent (or $US32.0 billion) of its total exports ($US157.9 billion) to the US, 13.3 per cent ($US20.9 billion) to the EU, 11.5 per cent ($US18.1 billion) to the ASEAN, and 9.3 per cent ($US18.1 billion) to Japan. In comparison, the share of Korea’s total imports ($US147.3 billion) for the same year was 16.6 per cent ($US24.4 billion) from the US, 12.1 per cent ($US17.8 billion) from the EU, 11.5 per cent ($US16.9 billion) from the ASEAN, and 19.9 per cent ($US14.8 billion) from Japan. Also in 2002, Korea’s export share to Australia were only 1.4 per cent ($US2.3 billion) and its import share from Australia 4.2 per cent ($US6.1 billion) (ICSEAD, 2003). In this context, the post-crisis emergence of ASEAN+3 (with Korea as a member) with expected subsequent trade and services diversion, may have a deep impact on Korea’s trade, investment, growth and, through less trade in goods and services, regional economic relations and cooperation in non-trade (such as security and stability) areas with ASEAN+3 (eg, Japan) and other non-ASEAN+3 (eg, the US and the EU) regional trading partners. To date however, only limited and negligible work in this area has been done and reported on the causal and quantitative significance of the factors giving rise to ASEAN+3, and its potential impact in general (see ASEAN, 2002, and also Tran Van Hoa, 2003) or, within the post-crisis framework, with specific reference to Korea trade with the world or more specifically with its select trading blocs such as the US, the EU and Japan.. The paper is focused on this trade issue. It should be noted that while an apparent reason for the emergence of the FTAs and EIAs mentioned above in the Asian region may be the member countries’ proximity (distance, size and area), other economic (for example, the ‘flying geese’ pattern and other external and internal crises and, to a lesser extent in the case of China, the economic and financial crisis that started on 2 July 1997 in Thailand) and non-
4
economic (for example, social, cultural and religious and slow WTO agenda progress) factors may regionally and globally also play an important and interdependent part (see below). It would be more appropriate in this case to investigate the impact of NARs (or ASEAN+3 members) on our focus: Korea trade with its select trading blocs, primarily from this new and comprehensive perspective. Methodologically, the paper departs from the existing standard, but restrictive, CGE/GTAP method (which deals statically and only with trade in goods in its coverage and essentially uses no econometrics or historical time-series data) and proposes instead a new approach with data-based quantitative and substantive policy outcomes to empirically validating recent the ASEAN+3 FTA’s raison d’etre, and to investigating their potential impact on partners’ trade more comprehensively (that is, in goods, as well as in services and investment). The new approach has four new innovative features. First, it proposes to extend the standard gravity theory [for the foundation of this theory, see for example Linneman (1966), Harrison (1996), Frankel and Romer (1999)], to construct appropriate simultaneous-equation trade-growth models in flexible functional form (Tran Van Hoa, 1992a) for our trading blocs of interest, namely, Korea, the US, the EU, and Japan their relationships. Second, it uses recent World Bank World Tables national accounts and France’s CHELEM or ICSEAD trade time-series data, and improved 2SHI (that is, two-stage hierarchical information in the sense of de Finetti and Lindley) estimation methodologies (Tran Van Hoa, 1985, 1986b, 1986c, 1997, and Tran Van Hoa and Chaturvedi, 1997, and Namba, 2000 and 2001) to fit these models to provide more reliable empirical evidence on trade-growth causality and historical support (or a lack of it) for Korea, the US, the EU and Japan, and their trade-growth linkages. Third, based on these findings, trade and growth policy implications for Korea and its 3 trading blocs will be discussed. Finally, applications of our new modelling and impact study approach to, for example, ASEAN+5, ASEAN+India or the recently proposed Australia-China, Australia-Indonesia, Australia-Korea and other regional, plurilateral or multilateral FTAs and EIAs will be briefly suggested. 2 Emergence of New Asian Regionalisms and ASEAN+3 The ASEAN+3 proposal was discussed in the mid- and especially late-1990s by ASEAN leaders, and implemented notably through the Hanoi Plan of Action in 1998 for ASEAN Vision 2020 (ASEAN, 2002). A number of factors can be attributed to its recent emergence. First, it was the result of decades of fast growth and a number of economic, financial and restructuring developments in North East Asia and in other major trading blocs in the world. Second, it was the result of developments and shifts in focus in North America and the EU in the aftermath of the damaging Asia crisis starting in Thailand in July 1997, and its subsequent contagion to a number of ‘once miracle’ economies in East and South East Asia, the former USSR, and, to a lesser extent, North and South America and the EU (Tran Van Hoa, 2000a). Third, it was the result of a benign neglect from such international organisations as the International Monetary Fund (IMF) or the economic power of North America and the EU on the plight of crisis countries in Asia, and the of lack of interest of the former in seriously helping to solve the economic, financial and social problems arising from the Asia crisis (Tran Van Hoa, 2002d).
5
In 2001, and early in 2002, other new developments in East and South East Asia gained prominence and assisted in giving rise to a number of new Asian economic integrations or regionalisms and Asian FTAs. These developments included the quick recovery and recurring growth in Korea, the emergence of China as a fast post-Asia crisis growing economy, and the continuing stagnant state of the world’s second largest economy (namely Japan). The recent recovery and growth of Korea has also been put forward by some authors as a leader in the post-crisis ‘flying geese’ theory for ASEAN+3 economies (see Harvie and Lee, 2002). The NARs and FTAs including customs unions and EIAs (which are accepted exceptions, subject to strict conditions, to the WTO principle of the Most Favoured Nations under Article XXIV of GATT and Article V of GATS) are indeed numerous and proliferating at an amazing speed at the behest of government leaders especially in the Asian region. They include plurilateral and bilateral FTAs such as first ASEAN, ASEAN+3, then ASEAN+5, ASEAN+5+Taiwan, Japan+Singapore, Japan+Korea, Japan+Mexico, Korea+Mexico+Chile, Singapore+New Zealand, China+Japan+Korea, Hong Kong+New Zealand, Australia-Japan (NARA), Australia-Singapore, and last, but not the least, Vietnam+US. Currently there is even a discussion on the setting up of a North Asian FTA in which Japan will play an important part. In mid-2003, a protocol was also being negotiated between Washington and Canberra to address key US complaints about the Australian market and to prepare for the setting up of a sweeping US-Australia FTA, as proposed by the Australian government (Hartcher, 2002), to the dismay of New Zealand which wanted, on the other hand, a trilateral US-CER (Close Economic Relations – an EIA - between Australia and New Zealand). The USAFTA was signed in January 2004 but at the time of writing it was still to be ratified by both the US Congress and Australia’s Senate amid strong protests by various sectors of the economy in Australia. In mid-2002, there was a suggestion by New Zealand Prime Minister Helen Clark to set up Australia-New Zealand Economic Cooperation (ANZEC) to boost the low-activity 21-year old CER. An Australia-Thailand CER Agreement – the first between Thailand and a developed country – was also proposed in mid-2003 and finally signed in November 2003 (DFAT, 2004). The EU has also been strongly advocating regional integration and liberalisation for the Pacific nations to create EU-type transnational economic partnerships (an EIA) within the Cotonou framework, to stimulate trade and create growth among them (Barker, 2002). The main focus and objective of the NARs and Asian FTAs (as separate from currency or customs unions and EIAs) are to promote trade and living standard either among the Asian economies themselves or with the membership of other economies outside Asia such as the US, Mexico and Chile in the Americas, and Australia and New Zealand in Oceania. Prominent among these NARs and Asian FTAs is the ASEAN+3 proposal above and, part of it, the ASEAN+1 or ASEAN+China FTA with a 1,700 million people market, a US$2 trillion GDP, and trade worth US$1.2 trillion. ASEAN+China was endorsed by the 10 leaders of ASEAN in Brunei in November 2001, and its details were worked out at a negotiating meeting in Beijing in May 2002. 3 ASEAN+3, Other FTAs and Gravity Theory: The Link

6
Since the primary objectives of FTAs are trade liberalisation and welfare improvement, as well as economic partnerships (that were officially included in all FTAs but not explicitly dealt with in international trade theory) generally, for member countries, the FTA premises that directly trade (international and domestic) and indirectly other determinants of trade significantly and causally affect: economic welfare (see Raimondos-Moller and Woodland, 2002); real wages (see Ruffin and Jones, 2003); growth (for developed countries see Frankel and Rose, 1998, Frankel and Romer, 1999); and development (for developing countries, see Harrison (for all countries), 1996, Frankel et. al., (for 10 East and South East Asian countries), 1996, and Tran Van Hoa (for ASEAN, China, Korea and Japan), 2002a). The outcomes also are mutually beneficial in many other non-economic aspects (e.g. closer regional and international cooperation and collaboration, social harmony, political stability and prosperity), and, in the context of globalisation and enhancing international competitiveness, conducive to regional or international economic integration (ASEAN, 1999). In view of the expectation that FTAs will enhance trade and produce final outcomes of higher growth and higher real wages or better economic development improvement for trading partners or FTA member countries, a useful causality concept in the form of a gravity theory using geographical, demographic and other common or concurrent attributes (see for example Linneman, 1966 and the specification in Table 3 in Frankel et. al., 1996) to explain trade flows (liberalisation) between countries may be appropriate in empirical studies of this trade-growth nexus (for another more restrictive justification, see Rose, 2000). Some extensions to this theory’s determinants using OECD country data have also been attempted to deal with trade correlations and output fluctuations (see for example, Otto et. al., 2002). The data used in these important studies of the gravity theory have been singularly cross-sectional and therefore unable to deal with recent temporal developments in the Asian or other non-Asian regions. In the case of Asian economies, or especially the member countries in the ASEAN+3 FTA, and their impact in a bilateral trade context with ASEAN+3 member and non-member countries, not much research both of a qualitative or quantitative kind has been done or reported on the validity of the required premises underlying the foundation of this ASEAN+3 FTA (namely, given their regional proximity but diverse culture, history, religion and development features, does more trade cause higher growth in the member countries and over time?) and its trade-growth linkage to other non-member countries or regions. 4 A Trade-Growth Model for Studying the Impact of Korea Trade with Its Major Trading Blocs Consider, for convenience and without loss of generality, a simple model of two simultaneous implicit functions (extension to more functions is straightforward when more variables or disaggregated tradable commodities are considered and endogenised) comprising and extending the basics of the standard cross-section-data-based gravity theory linking trade and growth between two trading countries or blocs. This extended gravity theory comprises not only the standard gravity theory’s geographic or demographic attributes (for ASEAN, Japan and Korea) but also, significantly, economic factors, and the requirements or protocol conditions of a

7
regional FTA or EIA. Since the geographical attributes (such as distance and area) in the ASEAN+3 regions are a priori assumed to be a rationale for setting up ASEAN and ASEAN+3, we can then focus on other relevant demographic (e.g, population as a proxy for size – see Frankel and Romer, 1999), economic and non-economic determinants of trade and growth in our model. In this model, trade (named T) may be defined as exports or imports or openness (exports plus imports) as well as services and investment (which are imperative in all FTAs) and may include domestic trade (Frankel and Romer, 1999), and growth (Y) may be defined as GNP or, by more popular convention, GDP. The two countries may be comprehensively all possible pairs of the 13 ASEAN+3 members and the US and the EU or, more specifically and within the interest of our present study, as pair-wise (bilateral) combinations of Korea-US, Korea-EU and Korea-Japan. Thus F1 (α,Y,T) = 0 (1)
F2 (β,T,Y,X,W) = 0 (2) where F1 and F2 are two arbitrary functionals linking trade and growth and their theoretically plausible determinants, α and β are parameter vectors, X and W denote, respectively, other economic (fiscal, monetary, trade and industry policy – see Sala-i-Martin, 1991) and non-economic (e.g, distance, area, size, policy shifts and external shocks – see Johansen, 1982) variables, relevant to a country or a group of countries’ growth or development. Importantly for our study, in addition to T and Y, data for X and W must be available and consistent with published time-series data in a standard Kuznets-type accounting framework (e.g, SNA93), or the accounting system of Stone (1988), or the recent World Bank World Tables and trade databases. Taking the total differentials of (1) and (2), and neglecting terms of second and higher–order (see for example Allen, 1960, and Tran Van Hoa, 1992a), the 2-equation model (1)-(2) can be written in stochastic form and in terms of the rates of change (Y%, T%, X% and W%) of all the included econometrically exogenous and endogenous variables (Y, T, X and W) as: Y% = α1 + α2T% + u1 (3) T% = β1 + β2Y% + β3X% + β4W% + u2 (4) In (3)-(4), the equations are linear and interdependent in the sense of Marshall or Haavelmo, α’s and β’s are the elasticities, and u’s other unknown factors outside the model (Frankel and Romer, 1999) or the disturbances with standard statistical properties. In (3)-(4) circular and instantaneous causality in the sense of Granger (1969) or Engle-Granger (1987) exists or is regarded as a testable hypothesis. In their non-stochastic forms (in which all disturbances are idealistically zero), these equations form the basic structure of the applied or computable general equilibrium (CGE/GTAP) models of the Johansen class, in which all required elasticities are usually assumed to be given or known a priori and the impact of endogenous or endogenised variables (say T) on Y is dependent on the exogenous variables and calculated system-wise using such iterative procedures as the Gauss-Euler algorithm with a known sparse matrix of elasticities.

8
It can be verified that our so-called flexible (or function-free) trade-output growth equation (3) in the model above is econometrically identified in the sense of mathematical consistency. An impact study of endogenous trade (or exogenous X and W) on growth can be analysed directly via its 2SLS (or reduced-form adjusted) form structurally given in (5) below or indirectly via its reduced form given in (6) in terms of all the exogenous economic and non-economic variables in the model. It is well-known in the theory of econometrics that the use of OLS to estimate equation (3) for example will, in this case, produce biased parameter estimates. These two equations can be written as Y% = a1 + a2 Ť% + v1 (5) Y% = p1 + p2X% + p3W% + v2 (6) where Ť is T as estimated by the OLS of its reduced form equation [that is (6) with T% replacing Y%] and v’s the new disturbances with standard statistical properties. An important feature of our modelling approach is that, contrary to the CGE/GTAP restrictive (dealing with goods only) and a priori (i.e., the values for elasticities are assumed or subjectively or dogmatically given) approach, our impact study is data-consistent as all required elasticities are estimated from the model and from available data and have asymptotically and statistically desirable and consistent properties (an important issue in the gravity theory’s empirical applications – see Frankel and Romer, 1999) when suitable estimation and forecasting methods (eg, 2SLS or other instrumental variables (IV) methods) are employed. Another important feature is that, contrary to other SNA93-based or Keynesian system-wide approaches, our impact study has the general flexibility in modelling specification rationale and implementation in assuming explicitly no a priori functional forms for the equations in the model, and it can handle data on trade or budget deficits and real rates of interest when inflation exceeds the nominal interest rate. The usual method of routine log transformations for all variables in an econometric model cannot do this. To implement the model, equations (3)-(4), above to empirically investigate the causal relationship between, for example, trade and growth between Korea, the US, the EU and Japan, we can use, given fixed geographical components (distance and area) as discussed, and, for time-series data, population (a proxy for size), conventional economic determinants of trade (see for example Frankel and Rose, 1998, Frankel and Romer, 1999, and Rose, 2000, and Otto et. al., 2002) and/or other relevant factors (e.g, external or internal shocks – Johansen, 1982) when such data are available. One such extended model relevant to our focus of study on the possible causality (impact) between Korea trade and the US, the EU and Japan economies may be written in either the reduced-form adjusted equation (7), and supplemented by the full reduced-form equation for T (8) (and similarly for growth Y) as Y% = a1 + a2 Ť% + a3ST + v1 (7) T% = p1 + p2 YT% + p3 FT% + p4 MT + p5 PT + p6ERT
+ p7IT + p8POT + p9ST + v2 (8) In equations (7)-(8), Korea trade (T%) with its trading partner (the US, the EU or Japan) for example is assumed to cause, together with crises or shocks (ST), Korea growth (Y%) but this trade is also affected by economic activities, trade-related

9
policies and external or internal shocks in Korea and its trading partner. Assuming for convenience that Korea trade (traditionally defined as its exports (or imports, see Barro and Helpman, 1991)) with its trading partner is affected by this partner’s GDP and other major economic activities, trade-related policies (see Coe and Helpman, 1993 for this approach) or external or internal shocks in its trading partner, then Equation (8) in its reduced form simply assumes that Korea’s partner’s trade is simply affected by the exogenous factors such as GDP (named YT), inflation (PT) – see Romer (1993), fiscal policy (FT), monetary policy (MT), trade policy and exchange rates (ERT) – see Rose (2000), industry structure (IT) – see Otto et. al. (2002), population (POT) – see Frankel and Romer (1999), and internal or external shocks (ST) – see Johansen (1982) - of its trading partner. Equation (8) is in fact a derived demand equation for tradable goods (or even transacted services and investment when T is defined approrpaitely to include them) reflecting essentially its supply and demand components postulated in standard microeconomic and trade theory. In deriving equations (7) and (8) for 2 trading countries (or blocs) above, we assume that Country 1’s trade affecting its growth is a testable hypothesis and this trade itself is essentially a demand equation for either imports (from Country 2) and exports (to Country 2) or vice versa or both. For the economies of the ASEAN+3, geographic attributes (that is, being in the neighbouring region) are assumed to be the prime facie reason for setting up that FTA, and the distance and area characteristics are omitted and proxied by population as all of our variables are expressed in terms of time-series (distance and area may also not be appropriate even for cross-section studies with high-trade countries like Singapore and Brunei in ASEAN+3). All variables in the model, that is, Y, T, YT, FT, MT, PT, ERT, IT and POT are expressed as their rates of change so the units of measurement (i.e., $billion or $million, ratios or index numbers) for the trading countries’ variables are irrelevant. ST is a qualitative time-series variable representing internal or external shocks having either one-off effects or temporally permanent effects (autoregressive and non-stationary) on trade and growth with discrete values. The implications of our model above are important for studying the transmission mechanism or relationship between trade and growth of Korea in relation to the US, the EU and Japan, and their trade-growth linkages. This relationship, if empirically substantiated, can provide powerful evidence on the trade, investment and welfare enhancement relationship premises of these countries as trading partners, and, as a result, it would lend crucial support for the viability, sustainability and promising prospects of the new Asian regionalism, namely, ASEAN+3 (or other FTAs), as well as providing empirical evidence for specifically quantifying the impact of Korea trade with its trading partners and suggesting robust and credible trade policy. 5 New Advances in Estimation, Forecasting and Impact Study Methodologies The importance of using a suitable estimation method for our model (or similar models) to get more accurate or unbiased results has been emphasised in previous trade-growth studies using standard gravity theory (see for example Frankel and Romer, 1999). These studies deal mainly with the OLS and IV (instrumental-variables) estimation methods. In this section, we briefly survey the various new and improved estimation, forecasting and impact study methods that are available, and

10
their appropriate use can produce more accurate econometric outcomes on the trade-growth causal relationship and subsequently on economic and trade policies and regional integration. More specifically, in our model, the equations in differential and reduced form as given in equation (8) for Y% (or, similarly, for T% to provide Ť% in equation (7)) can be written more generally with a sampling size T and k independent variables (possible causal components) in matrix notation as: y = Z ß + u (9) (Tx1) (Txk) (kx1) (Tx1) where y = Y%, Z = the rate of changes of the exogenous and predetermined variables (both static and dynamic), ß = the parameters, and u the disturbance satisfying all standard statistical assumptions. We now define our evaluation criterion (in terms of average MSE or Wald risks) for an arbitrary estimator β̂ a for β in equation (9) as Wald risk ≡ MSE( β̂ a) = ( β̂ a-β)’W( β̂ a-β) where W is a positive definite. Under Wald risks, we can estimate equation (9), which is essentially a general linear model for structural or behavioural analysis or for direct forecasting and policy studies (see Pindyck and Rubinfeld, 1998), by using the OLS or, at a more statistically efficient level, any of the explicit (Baranchik, 1973) Stein or Stein-rule methods as described below. More specifically, using equation (9), the basic and most well-known and used method to produce estimates and forecasts of y (or Y%) is the OLS estimator of ß (denoted by β̂ ) and written as β̂ = (Z'Z)-1Z'y (10) A more efficient method is the explicit Stein estimator of ß (Baranchik, 1973) and given by β̂ s = [1 - c(y-Zb)'(y-Zb)/b'Z'Zb] β̂ = [1 - c(1-R²)/R²] β̂ (11) where c is a characterising scalar and defined in the range 0 < c < 2(k-2)/(T-k+2), and R² is the square of the sample multiple correlation coefficient. A still more efficient method (to avoid, in one respect, implausible results derived from plausible OLS parameter estimates) is the explicit positive-part Stein estimator of ß (Anderson, 1984). This estimator is defined as β̂ +s = [1 - min{1 , c(y-Z β̂ )'(y-Z β̂ )/ β̂ 'Z'Z β̂ }] β̂ = [1 - min{1 , c(1-R²)/R²}] β̂ (12)

11
A new method to obtain estimates and forecasts of ß in equation (9) with better properties in Wald risks has been proposed (see Tran Van Hoa, 1985, Tran Van Hoa and Chaturvedi, 1988, 1990, 1997). It is in a class of explicit improved Stein-rule or empirical Bayes (also known as the two-stage hierarchical information or 2SHI estimators for linear regression models in the sense of de Finetti and Lindley). This estimator includes the explicit Stein and the double k-class (Ullah and Ullah, 1978) estimators as subsets (Tran Van Hoa, 1993a). Other applications of the Stein, Stein-rule, and 2SHI estimators to linear regression models with non-spherical disturbances and to Zellner’s seemingly unrelated regression model have also been made (see Tran Van Hoa et al, 1993, in the case of regressions with non-spherical disturbances, and Tran Van Hoa, 1992b, 1992c, and 1992d, in the case of seemingly unrelated regressions). The explicit 2SHI estimator is a bona fide or fully operational (in statistical theory terminology) estimator and defined as β̂ h = [1 - c(1-R²)/R²} - c(1-R²)/{R²(1+c(1-R²)/R²)}] β̂ (13) and its positive-part counterpart (Tran Van Hoa, 1986a) is given by β̂ +h = [1 - min{1 , c(1-R²)/R²} - {1/((R²/c(1-R²)) + 1)}] β̂ (14) While all the estimators given above can be applied to the general linear model equation (9) for structural and forecasting analysis, their relative performance in terms of historical, ex post or ex ante (Pindyck and Rubinfeld, 1998), forecasting MSE can differ. Thus, it is well-known that, in MSE and for k ≥ 3 and T ≥ k + 2, β̂ s dominates (that is, it performs better in forecasting MSE) β̂ , and β̂ s is dominated by β̂ +s (Baranchik, 1973, Anderson, 1984). However, it has also been demonstrated (Tran Van Hoa, 1985, Tran Van Hoa and Chaturvedi, 1988) that, in MSE, β̂ h dominates both β̂ and β̂ s, and more importantly, β̂ +h dominates β̂ +s (Tran Van Hoa, 1986a). A further important result of the 2SHI theory has recently been proved (see Tran Van Hoa and Chaturvedi, 1997): the dominance of the 2SHI over the OLS and Stein exists anywhere in the range 0 < c < 2(k-1)/(T-k). This indicates that the 2SHI produces better (in terms of smaller Walk risk or generalized Pitman nearness) estimates and forecasts even if the estimating and forecasting equation has only one independent variable in it. The condition for the optimal Stein dominance in the linear equation up to now requires that 0 < c < 2(k-2)/(T-k+2) (see Anderson, 1984). Further MSE-dominance properties of the 2SHI estimators and their extensions over the positive-part Stein estimator in regression equations have been given by Namba (2000, 2001). Remarks First, since one of the best known IV estimators, namely the 2SLS, has been demonstrated to be dominated in MSE by the 2SHI in errors-in-variables models and in identified structural equations of simultaneous-equation models (see Tran Van Hoa, 1986b and 1986c) such as equation (7), the so-called IV (see Frankel and Romer,

12
1999) impact of the trading partner’s (say ASEAN) trade on Australia growth can be directly studied via the application of the 2SHI to equation (7). Second, while some application of the 2SHI forecasting methods to predictions of economic activities in some developed countries such as Australia (see Tran Van Hoa, 1992d) has been made, these methods have not been investigated explicitly within an open trade-growth theoretical framework and an empirical context using more recent economic data for the major economies in ASEAN and the Asia 3. This issue is taken up in the study below for some of the fastest growth economies or group of economies in the world in recent years (even after the Asia crisis of 1997), but with highly fluctuating investment and being very sensitive to foreign trade and capital flows in the region (see Tran Van Hoa and Harvie, 1998). Third, an interesting feature of our study is that the 2SHI estimators are finite-sample estimators (which converge to the OLS or 2SLS when T -> ∞ ) with optimal MSE properties (see above). Since all time-series data used here are necessarily annual and have, as usual, a small sample size, the study outcomes are therefore finite-sample optimal. Finally, it has been demonstrated that the 2SHI dominates other conventional estimators when measurement errors exist (Tran Van Hoa, 1986b). Since the poor quality of economic data from the Asian countries and other less developed countries economies is well known, one by-product of our study is that the findings are also optimal in errors-in-variables cases. 6 Econometric Evidence on Korea Trade with the World and its Impact on
Growth This section reports substantive results for a number of trade-growth simultaneous-equation models which are based on several plausible extensions to the standard gravity theory: such as planar approximation to any arbitrary functionals (see below), to time-series data, and incorporating micro/macroeconomic factors and external and internal shocks, and given in equations (7) and (8) above. For comparison with the findings of previous studies in standard gravity theory applications, these results are obtained by the OLS, 2SLS and 2SHI for the structural equation of growth, equation (7). Data – Due to the limitation of the required data in our studies, especially dealing with developing economies, all original data are obtained as annual and then transformed to their ratios (when appropriate). The ratio variables include trade (exports and imports), government budget, and money supply (M2) all divided by GDP, and unemployment rates. Other non-ratio variables include interest rates, exchange rates in relation to the US dollar, population and binary variables representing the occurrence of the economic, financial and other major crises over the period 1981 to 2002. All non-binary variables are then converted to their percentage rate of changes. The use of this percentage measurement is a main feature of our modelling and impact approach and avoids the problem of a priori known functional forms (see above) and also of logarithmic transformations for negative data [such as budget (fiscal) or current account deficits]. As the average micro/macroeconomic data for the countries in the EU are difficult (if not impossible) to measure, we have

13
reversed the direction of trade below in a ‘dual – Korea trade to EU for example or, equivalently, the EU trade to Korea’ context. The data for regional (e.g, the EU) and national (e.g, Korea, the US and Japan) trade (exports (X) to and imports (IM) from, respectively), GDP and estimated mean population (named POP) are retrieved from ICSEAD’s 2003 regional trade databases. Openness between 2 trading countries is defined as T=X+IM. All trade and economic data are at current prices in US dollars. Fiscal, monetary, trade and industry policy data for Australia was obtained from the 2003 OECD database and approximated, respectively, by government budget/GDP (BY), M2/GDP (M2Y), interest rates, exchange rates per US dollars (XR), and unemployment rate (UR). In addition to the usual demographic and economic components in our model, we also identified (due to ICSEAD data unavailability before 1980) 4 major world crises that had affected the ASEAN+3 economies (and other economies) during our sampling period and included them as 4 dummy variables with persistent effects after their occurrence (one-off effects were postulated but discarded as implausible in the study). These are the stock market crash of 1987 (C87), the China turmoil (C89), the Gulf War of 1991 (C91), and the Asia crisis of 1997 (C97). The outbreaks of SARS in 2003 and the avian flu early in 2004 have been omitted due to lack of sufficient data. Various modelling experiments in our study also show that these crises all have an econometrically permanent or non-decayed effect (reflecting autoregressiveness or non-stationarity) on growth in ASEAN and China. The Estimated Models - The various bilateral trade-growth models for Korea’s 3 selected trading partners are based on these data. The 2-simultaneous equation trade-growth model for Korea and the US in our studies, for example, that is based on equations (7)-(8), can be written fully using mnemonic notation for estimation and impact analysis as: YKR% = α1 + α2TUS2KRY% + α3C75 + α4C87 + α5C91 + α6C97 +v1
(15) TUS2KR% = β1 + β12YUS% + β3BY% + β4M2Y% + β5R% + β6IPD%
+ β7XR% + β8UR% + β9POP% + β10C75 + β11C87 + β12C91 + β13C97 + v2 (16)
where, in percentages, YKR = Korea’s GDP, TUS2KRY = Korea’s total trade (exports + imports or openness) with the US divided by Korea’s GDP, and YUS = US’s GDP. The variables BY, M2Y, R, IPD, XR, UR and POP denote, respectively, fiscal, monetary and interest rate, inflation, exchange rate, industry policy and population in Korea. The v’s are the disturbances representing other unknown factors but with effects on YKR and TUS2KR respectively (see Frankel and Romer, 1999 for this rationale). The trade-growth models for Korea, the EU and Japan can be similarly constructed. Substantive Findings – Three sets of empirical findings for 2 trade-growth models and based on equations (15)-(16) above for Korea, the US, the EU and Japan, and are given in Table 1. Due to the importance of the estimation methods used that can provide greatly different results even for the same model (see further detail in Frankel and Romer, 1999) and also for the purpose of statistical efficiency comparison, three types of estimated structural parameters have been calculated for each model. These

14
are the OLS, the 2SLS and the 2SHI (applied on the 2SLS). For testing the hypothesis, the 2SHI has approximately the same asymptotic properties as OLS and 2SLS.
Table 1 Korea Trade with the World’s Major Blocs and Its Impact on Korea Growth
Extended Gravity Theory in Flexible Structural Form 1983 to 2002
_________________________________________________________________________________ Korea and US Korea and Europe Korea and Japan Variables OLS 2SLS 2SHI OLS 2SLS 2SHI OLS 2SLS 2SHI ___________________________________________________________________________________________ Constant 9.69** 10.07** 3.37** 9.32** 9.38** 4.80** 8.11** 7.82** 2.84** Openness/GDP -0.16* -0.27** -0.09** -0.16** -0.20** -0.10** 0.14 0.19** 0.07** Stock Crash 87 1.05 0.68 0.23 2.24 2.39 1.22 2.41 2.64 0.96 China Turmoil 89 -5.31 -6.67@ -2.24@ -4.89 -5.32@ -2.72@ -1.47 -0.94 -0.34 Gulf War 91 1.14 2.00 0.67 0.62 0.83 0.42 -1.03 -1.29 -0.47 Asia Crisis 97 -1.45 -0.54 -0.18 -2.34 -2.16 -1.11 -3.59@ -4.43 -1.61 R2 0.37 0.35 0.59# 0.49 0.49 0.70# 0.34 0.36 0.58 F 1.65 1.82 1.51 2.53* 2.89** 2.50** 1.44 1.41 1.58 DW 2.37 2.09 0.80& 2.31 2.25 1.02& 2.53 2.62 0.89& ___________________________________________________________________________________ Sources of data: World Bank (2002), ICSEAD Trade Data (2003). Notes: ** significant at the 5% level, * significant at the 10% level @ significant at the 15% level. # correlation coefficient between Australia growth and its estimate by 2SHI. & DW s calculated as DW=2(1-ρ). Tests on 2SHI estimates are based on their asymptotic properties as T -> ∞.
From the results given in Table 1, we note four important findings. First, while having high success in modelling output (GDP) has been fairly easy, modelling growth (GDP rate of change) has been internationally accepted as difficult, all three estimated models of growth vis-à-vis trade for Korea, the US, the EU and Japan have higher modelling performance (that is, R2 reaching up to 70 per cent) relative to other trade-growth causality models as reported in previous international studies. As R2 is an average number for the whole sample size used in estimation, it may not be able to give a detailed period-by-period success of the estimated models. A graph of the observed and estimated growth fluctuations in our estimated models for the period (1983-2002) under study would give a better measurement of modelling success. The graphs for these growth data and their forecasts have also been done (not reported here) and the results indicate that the peaks, troughs and turning points of the growth observations are accurately predicted for almost all of the period under study. Second, when we look at the dynamic features of the estimated models using either plots or standard diagnostic tests, all estimated models also appear free from serious autocorrelation-induced inefficiency problems. Third, trade, as defined by total trade/GDP between Korea, the US, the EU and Japan, does not have uniformly acceptable (as expected by trade theory) results for all models. In fact the benefit of trade is obtained only for the Korea-Japan model. Both the Korea-US and Korea-EU models are characterised by significant (at the 5% level) and negative impact elasticities for all three types of estimated parameters. Fourth, for all three models under study, the impact of the stock market crash of 1987, the China internal turmoil in 1989, the Gulf War of 1991, and the 1997 Asia economic and financial crisis, all have different effects on Korea trade-growth over the period 1983 to 2002. More specifically, while the stock market crash of 1987 had a ‘black Friday’

15
impact on most developed countries world-wide, it was found to a beneficial effect on Korea growth for all three trading partners. The 1991 domestic turmoil in China and the 1997 Asia crisis both however have damaging effects on Korea growth in all models. 7 Implications for Trade Policy and Economic Relations for Korea, the US,
the EU and Japan While the models we used for study above may be simple in their structure, they contain the main and conventional ingredients of and analysis on trade and growth and their relationships for countries under study. They are also fairly consistent with similar previous studies for comparative purposes. The empirical findings reported in the preceding section also provide a number of interesting results on trade-growth causation and with important international trade or co-operation policy implications for Korea and its three select trading partners inside and outside the ASEAN+3 FTA with similar interest and objectives in general. Some of these trade initiatives include as we mentioned earlier the Australia-Indonesia and Australia-Korea FTAs or the currently ministerially mooted Australia-Mexico (for South America), Australia-Emirates and Australia Kuwait (for the Middle East or West Asia) FTAs (ABC, 2004). Some of our findings may also be useful in providing significant evidence and information for trade-growth analysis, discussions and policy consideration. In addition, while some of the previous trade-growth analysis is based purely on cross-section data or a mix of panel data (see earlier citations and also PC, 2002), our studies are based completely on time-series data due to our interest in recent economic development in the Asian region and its potential impact on the non-Asian regions. These two approaches of gravity analysis or similar concepts and objectives are however complementary. Does Korea Trade with the World Cause Its Growth and Differently? Trade-to-growth is an important causal topic in economics that has attracted some of the best minds in the field over the last ten years or so (see for example Frankel and Romer, 1999, for a survey), and the conclusions have not been finalised for all cases. Our empirical results above show that in the specific case of Korea trade vis-a-vis its trading partners in the world, namely the US, the EU and Japan, its trade, when defined as its relative size of openness to the trading partners, has, unlike other similar studies for other Asian or Oceanic countries (see Tran Van Hoa, 2003), an unusually strong (statistically significant) impact on its growth. The impact direction is however not uniform. More specifically, while Korea trade with the US and the EU over the period 1982-2002 has an impact of –0.27 and –0.20 percentage points (based on the 2SLS) respectively, this same trade has an impact of 0.19 percentage points vis-à-vis Japan. Since Japan seems to have had a trade surplus with Korea, we can ask whether this positive effect was due to this trade balance or technology transfer generated by Japan’s imports. Do Crises Affect Korea Growth? Yes and No When openness is used as a proxy for trade between Korea, the US, the EU and Japan, the recent crises such as the stock market crash of 1987, the China internal turmoil of 1989, the Gulf War in 1991, and the 1997 Asia meltdown all do appear to affect

16
Korea growth but in different directions and at different levels of significance. Strong damaging effects (of up to –6.67 for the Korea-US case) are obtained for example for all three models for the 1989 and 1997 crises, but the significance test passes only for the 1989 crisis for the Korea-US and Korea-EU models. Crises that are regarded as important for developed countries world-wide (eg, the stock marker crash of 1987 and the Gulf War) do not seem to have made any significant impact on Korea growth during this period. Since the 1989 China crisis has been regarded as essentially a domestic problem for China, the finding that it also had deep impact on Korea growth is a new piece of evidence on the underestimation of China’s domestic issue that have in fact affected its international trading partners’ welfare and development. On the other hand, it is interesting to note from our findings that while the Gulf War was essentially a US, Western and Australia alliance problem with perceived severe damaging crowding out impact on the Gulf war allies’ economies, this war was external and peripheral to East Asia. Another derivative conclusion from our findings is that a contemporary trade-growth model for Korea (or China and Japan or even for other regions or countries) studies, without the inclusion of these recent shock factors (as implied by Frankel and Romer, 1999 but not dealt with in standard gravity theory or CGE/GATP impact evaluation studies, or as stipulated by Johansen for policy analysis, 1982), may have serious and biased results on the causation and subsequent policies being explored and formulated for governments and national and international trade agencies. Are Trade-Growth Causation Results Affected by Estimation Methodologies? In previous studies of trade-growth, OLS results of trade-growth models based on the gravity or similar theory seem to indicate an underestimation of the trade effect. IV estimates of the trade effect are usually found to be larger in general than OLS estimates. This is supported in all our trade-growth models using openness and the underestimation can be as high as 69 per cent (Korea-US). Four reasons have been put forward to support the underestimation of the OLS and two explanations for the overestimation of the 2SLS (see Frankel and Romer, 1999, for a brief survey). It is well known from the bias –βCov(Vu) of the OLS in errors-in-variables models (that is, y=βX*+u, but X* is unobserved and proxied by observed X with X=X*+V, where V is measurement errors) or, equivalently, simultaneous-equation models, that the specification of the model or the instruments (as captured through Cov(Xu)) solely determines a downward or upward bias of the OLS. In our view, it is the nature of the model and the characteristics of the instruments and collected data that determine the estimation bias. A general conclusion may not be made in this case. When we are focused on higher efficiency for the estimates of the models that are subject to misspecification (e.g, omitted relevant variables) or measurement errors or simultaneity bias, then the 2SHI estimates should be used. In this case the impact based on the OLS and 2SLS is overestimated and that on the 2SHI should be used. Are Reduced-form Estimates of Trade a Good Proxy for Trade in our Models? This is a question on the accuracy and reliability of the trade-growth model and the instruments used (a point often raised in the literature, see Frankel and Romer, 1999).

17
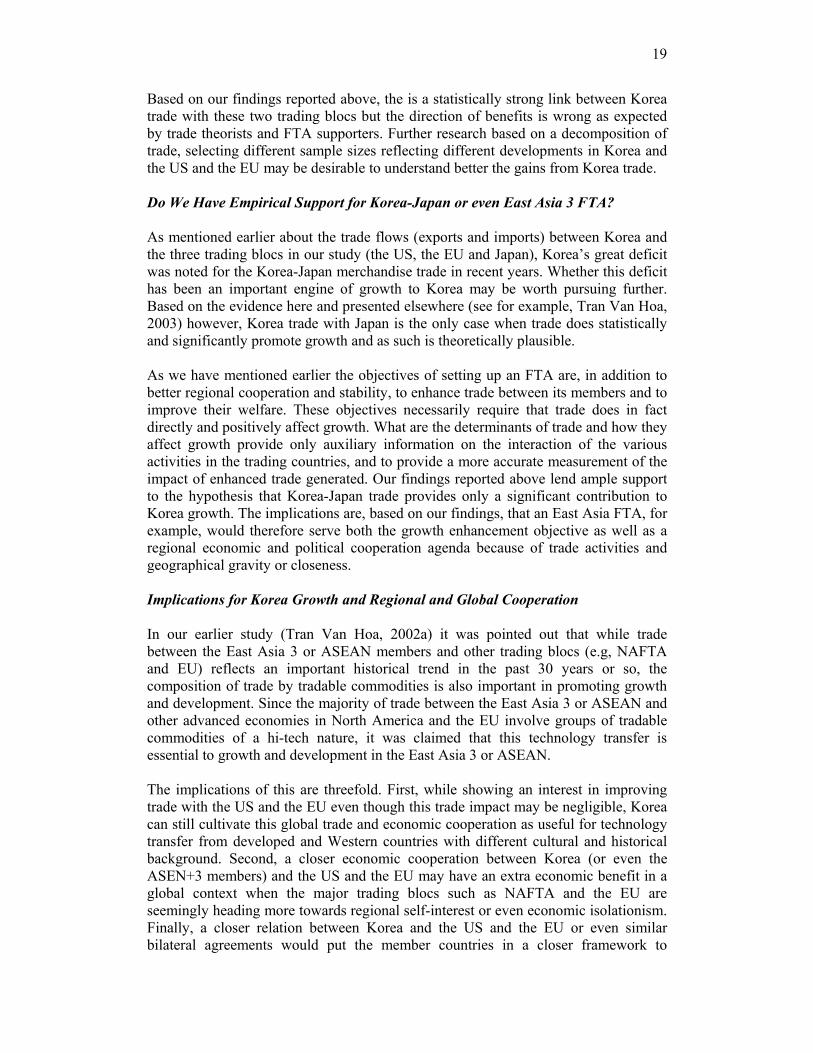
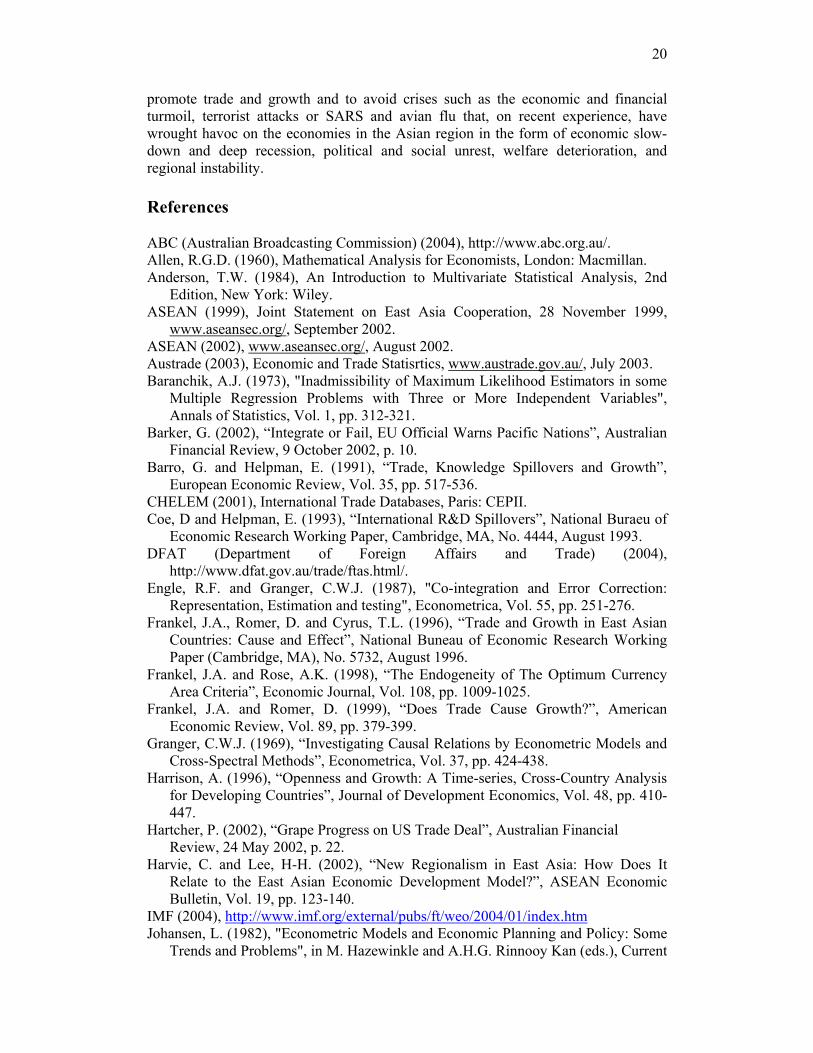
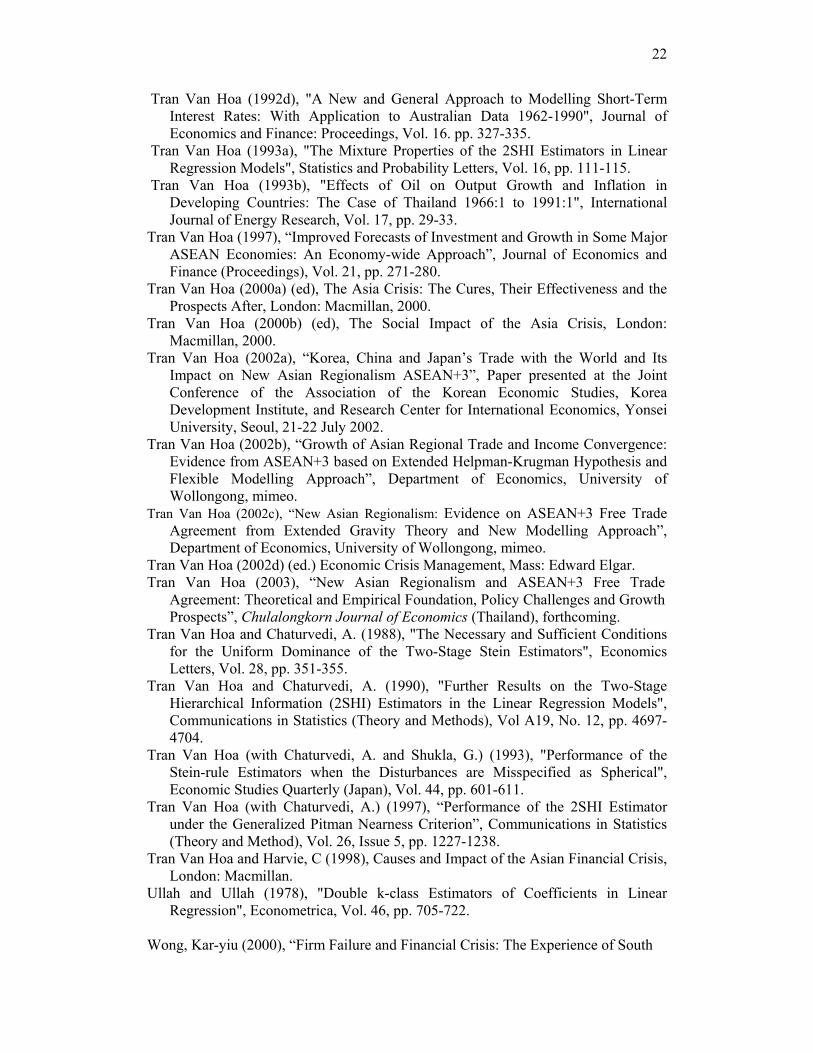
The answer in this case has to be relative, as different models will have different instruments and therefore different accuracy or reliability outcomes. To answer this question for our models, we have calculated the proxy for T, namely Ť, from its reduced form for each of the estimations requiring a knowledge of Ť. Standard evaluation criteria such as the correlation coefficient and the Theil-MSE-decomposition Um (bias), Us (variation) and Uc (covariance) are then used to evaluate the proxy performance of Ť as compared to its actual T in each model reported in Table 1. The graphical results of this evaluation are given in Figures 1-3 and of the Theil-MSE-decompositions in Table 2.
Figure 1: Modelling Korea-US Trade, 1983-2001
-20
-10
0
10
20
30
1 3 5 7 9 11 13 15 17 19
1983 to 2001
Perc
enta
ge
KRUSTYC
KRUSTYCF
Figure 2: Modelling Korea-EU Trade, 1983-2001
-30
-20
-10
0
10
20
30
40
1 3 5 7 9 11 13 15 17 19
1983 to 2001
Perc
enta
ge
KREUTYC
KREUTYCF
Figure 3: Modelling Korea-Japan Trade, 1983-2001
-20-15-10-505
101520
1 3 5 7 9 11 13 15 17 19
1983 to 2001
Perc
enta
ge
KRJPTYC
KRJPTYCF

18
We first note from Figures 1-3 2 that, as in the earlier applications of our new modelling approach, the Ť very accurately emulates all (except a 2 or 3 early years in Korea-Japan trade) troughs, peaks and turning points of the actual T in all three models – Korea-US, Korea-EU and Korea-Japan. In addition, the results in Table 2 indicate that, according to the evaluation criteria reported, the Ť seems to be a very good estimated proxy to T also in all models. This finding would enhance the robustness of our estimation of the impact of Korea trade with the world’s major trading blocs on Korea growth and related policy recommendations and for important implication for further study in the subject matter.
Table 2 Reliability of Trade Proxy in
Korea-US, Korea-Europe and Korea-Japan Trade-Growth Models Openness (Exports+Imports)/GDP
1983 to 2002
Model Korea from US Korea from Europe Korea from Japan (1983-2001) (1983-2001) (1983-2000) Correlation Coefficient 0.91 0.94 0.89 RMSE 4.03 4.23 4.08 Mean Error 0.00 0.00 0.00 Um 0.00 0.00 0.01 Uc 0.05 0.03 0.05 Us 0.95 0.97 0.95 _____________________________________________________________________ Notes. Ub+Us+Uc = 1. See Pindyck and Rubinfeld (1998) for further detail on these evaluation criteria. The estimates are based on TSP calculation. Do We Have Empirical Support for the Role of Industry Policy and the East Asian Development Model in Explaining Korea’s Growth? Due to the very good fit of our growth-of-trade model above incorporating unemployment and macroeconomic policy variables, it is reasonable to infer that Korea’s industry policy (affecting employment, growth and trade) and what has become known as the East Asia Development Model (EADM) may have some relevance in explaining Korea’s trade with its trading partners and subsequently its high growth in recent years. While the EADM is to some authors not exactly a model but we can take the position that it can be interpreted in fact as a sustained sequence of plausible and successful micro (eg, industry policy, Wong, 2000) and macroeconomic (Harvie and Lee, 2002) policies that has been developed and adopted by successive governments in Korea over the years. As our models integrated in a number of ways these policies in their fundamental simultaneous-equation specification, the modelling performance confirm to some extent the existence of an EADM or its contribution to Korea’s trade and growth in recent years. Do We Have Empirical Support for Korea-US or Korea-EU FTA?
19
Based on our findings reported above, the is a statistically strong link between Korea trade with these two trading blocs but the direction of benefits is wrong as expected by trade theorists and FTA supporters. Further research based on a decomposition of trade, selecting different sample sizes reflecting different developments in Korea and the US and the EU may be desirable to understand better the gains from Korea trade. Do We Have Empirical Support for Korea-Japan or even East Asia 3 FTA? As mentioned earlier about the trade flows (exports and imports) between Korea and the three trading blocs in our study (the US, the EU and Japan), Korea’s great deficit was noted for the Korea-Japan merchandise trade in recent years. Whether this deficit has been an important engine of growth to Korea may be worth pursuing further. Based on the evidence here and presented elsewhere (see for example, Tran Van Hoa, 2003) however, Korea trade with Japan is the only case when trade does statistically and significantly promote growth and as such is theoretically plausible. As we have mentioned earlier the objectives of setting up an FTA are, in addition to better regional cooperation and stability, to enhance trade between its members and to improve their welfare. These objectives necessarily require that trade does in fact directly and positively affect growth. What are the determinants of trade and how they affect growth provide only auxiliary information on the interaction of the various activities in the trading countries, and to provide a more accurate measurement of the impact of enhanced trade generated. Our findings reported above lend ample support to the hypothesis that Korea-Japan trade provides only a significant contribution to Korea growth. The implications are, based on our findings, that an East Asia FTA, for example, would therefore serve both the growth enhancement objective as well as a regional economic and political cooperation agenda because of trade activities and geographical gravity or closeness. Implications for Korea Growth and Regional and Global Cooperation In our earlier study (Tran Van Hoa, 2002a) it was pointed out that while trade between the East Asia 3 or ASEAN members and other trading blocs (e.g, NAFTA and EU) reflects an important historical trend in the past 30 years or so, the composition of trade by tradable commodities is also important in promoting growth and development. Since the majority of trade between the East Asia 3 or ASEAN and other advanced economies in North America and the EU involve groups of tradable commodities of a hi-tech nature, it was claimed that this technology transfer is essential to growth and development in the East Asia 3 or ASEAN. The implications of this are threefold. First, while showing an interest in improving trade with the US and the EU even though this trade impact may be negligible, Korea can still cultivate this global trade and economic cooperation as useful for technology transfer from developed and Western countries with different cultural and historical background. Second, a closer economic cooperation between Korea (or even the ASEN+3 members) and the US and the EU may have an extra economic benefit in a global context when the major trading blocs such as NAFTA and the EU are seemingly heading more towards regional self-interest or even economic isolationism. Finally, a closer relation between Korea and the US and the EU or even similar bilateral agreements would put the member countries in a closer framework to
20
promote trade and growth and to avoid crises such as the economic and financial turmoil, terrorist attacks or SARS and avian flu that, on recent experience, have wrought havoc on the economies in the Asian region in the form of economic slow-down and deep recession, political and social unrest, welfare deterioration, and regional instability. References ABC (Australian Broadcasting Commission) (2004), http://www.abc.org.au/. Allen, R.G.D. (1960), Mathematical Analysis for Economists, London: Macmillan. Anderson, T.W. (1984), An Introduction to Multivariate Statistical Analysis, 2nd
Edition, New York: Wiley. ASEAN (1999), Joint Statement on East Asia Cooperation, 28 November 1999,
www.aseansec.org/, September 2002. ASEAN (2002), www.aseansec.org/, August 2002. Austrade (2003), Economic and Trade Statisrtics, www.austrade.gov.au/, July 2003. Baranchik, A.J. (1973), "Inadmissibility of Maximum Likelihood Estimators in some
Multiple Regression Problems with Three or More Independent Variables", Annals of Statistics, Vol. 1, pp. 312-321.
Barker, G. (2002), “Integrate or Fail, EU Official Warns Pacific Nations”, Australian Financial Review, 9 October 2002, p. 10.
Barro, G. and Helpman, E. (1991), “Trade, Knowledge Spillovers and Growth”, European Economic Review, Vol. 35, pp. 517-536.
CHELEM (2001), International Trade Databases, Paris: CEPII. Coe, D and Helpman, E. (1993), “International R&D Spillovers”, National Buraeu of
Economic Research Working Paper, Cambridge, MA, No. 4444, August 1993. DFAT (Department of Foreign Affairs and Trade) (2004),
http://www.dfat.gov.au/trade/ftas.html/. Engle, R.F. and Granger, C.W.J. (1987), "Co-integration and Error Correction:
Representation, Estimation and testing", Econometrica, Vol. 55, pp. 251-276. Frankel, J.A., Romer, D. and Cyrus, T.L. (1996), “Trade and Growth in East Asian
Countries: Cause and Effect”, National Buneau of Economic Research Working Paper (Cambridge, MA), No. 5732, August 1996.
Frankel, J.A. and Rose, A.K. (1998), “The Endogeneity of The Optimum Currency Area Criteria”, Economic Journal, Vol. 108, pp. 1009-1025.
Frankel, J.A. and Romer, D. (1999), “Does Trade Cause Growth?”, American Economic Review, Vol. 89, pp. 379-399.
Granger, C.W.J. (1969), “Investigating Causal Relations by Econometric Models and Cross-Spectral Methods”, Econometrica, Vol. 37, pp. 424-438.
Harrison, A. (1996), “Openness and Growth: A Time-series, Cross-Country Analysis for Developing Countries”, Journal of Development Economics, Vol. 48, pp. 410-447.
Hartcher, P. (2002), “Grape Progress on US Trade Deal”, Australian Financial Review, 24 May 2002, p. 22.
Harvie, C. and Lee, H-H. (2002), “New Regionalism in East Asia: How Does It Relate to the East Asian Economic Development Model?”, ASEAN Economic Bulletin, Vol. 19, pp. 123-140.
IMF (2004), http://www.imf.org/external/pubs/ft/weo/2004/01/index.htm Johansen, L. (1982), "Econometric Models and Economic Planning and Policy: Some
Trends and Problems", in M. Hazewinkle and A.H.G. Rinnooy Kan (eds.), Current

21
Developments in the Interface: Economics, Econometrics, Mathematics, Boston: Reidel.
Linneman, H. (1966), An Econometric Study of International Trade Flows, Amsterdam: North-Holland.
Namba, A (2000), “MSE Dominance of the PT-2SHI Estimator over the Positive-part Stein-rule Estimator in Regression”, Journal of Statistical Planning and Inference, No. 89, pp. 175-85.
Namba, A. (2001), “MSE Performance of the 2SHI Estimator in a Regression Model with Multivariate-t Error Terms. Statistical Papers, Vol. 42(1): pp.81-96.
Otto, G., Voss, G. and Willard, L. (2002), “Understanding OECD Output Correlations”, Seminar Paper, Department of Economics, University of Wollongong, May 2002.
Pindyck, R.S. and Rubinfeld, D.L. (1998), Econometric Models and Economic Forecasts, Sydney: McGraw-Hill.
PC (2002) Productivity Commission, http://www.pc.gov.au/researchproject/2001/010202.html .
Romer, D. (1993), “Openness and Inflation: Theory and Evidence”, Quarterly Journal of Economics, Vol. 108, pp. 869-903.
Rose, A.K. (2000), “One Money, One Market: The Effect of Common Currencies on Trade”, Economic Policy, Vol. 30, pp. 9-33.
Sala-I-Martin, X. (1991), “Comment”, in Blanchard, O.J. and Fischer, S. (eds), NBER Macroeconomic Annual 1991, Cambridge, MA: MIT Press, 1991, pp. 368-78.
Raimondos-Moller, P. and Woodland, A. D. (2002), “A Note on Two Elementary Propositions on Customs Unions”, International Conference on WTO and World Trade, III: Challenges in a New Area, Gerhard-Mercator University, Duisburg, Germany, 29-30 June 2002.
Ruffin, R J and R W Jones (2003), “Real Wages and Trade: Insights from Extreme Examples”, Paper presented at Festschrift Workshop in Honour of Peter Lloyd, Department of Economics, University of Melbourne, 23-24 January 2003.
Stone, R (1988), “Progress in Balancing the National Accounts”, in Ironmonger, D S, Perkins, J O N and Tran Van Hoa (eds), National Income and Economic Progress: Essays in Honour of Colin Clark, London: Macmillan.
Tran Van Hoa (1985), "The Inadmissibility of the Stein Estimator in Normal Multiple Regression Equations", Economics Letters, Vol. 19, pp. 39-42.
Tran Van Hoa (1986a), "The Inadmissibility of the Stein Estimator in Normal Multiple Regression Models: Analytical and Simulation Results", 15th Anniversary of the NBER-NSF Seminar on Bayesian Inference in Econometrics, ITAM, Mexico City, 16-18 January 1986.
Tran Van Hoa (1986b), "Improved Estimators in Some Linear Errors-in-Variables Models in Finite Samples", Economics Letters, Vol.20 (1986), pp. 355-358.
Tran Van Hoa (1986c), "The Inadmissibility of the 2SLS Estimator in some Linear Structural Equations", Economics Letters, Vol. 21 (1986), pp. 337-341. Tran Van Hoa (1992a), "Modelling Output Growth: A New Approach", Economics
Letters, Vol. 38, pp. 279-284. Tran Van Hoa (1992b) "Energy Consumption in Thailand: Estimated Structure and
Improved Forecasts to 2000" (in Thai), Thammasat Economic Journal (Thailand), Vol. 10, pp. 55-63.
Tran Van Hoa (1992c), "A Multi-equation Model of Energy Consumption in Thailand", International Journal of Energy Research, Vol. 16, pp. 381-385.
22
Tran Van Hoa (1992d), "A New and General Approach to Modelling Short-Term Interest Rates: With Application to Australian Data 1962-1990", Journal of Economics and Finance: Proceedings, Vol. 16. pp. 327-335.
Tran Van Hoa (1993a), "The Mixture Properties of the 2SHI Estimators in Linear Regression Models", Statistics and Probability Letters, Vol. 16, pp. 111-115.
Tran Van Hoa (1993b), "Effects of Oil on Output Growth and Inflation in Developing Countries: The Case of Thailand 1966:1 to 1991:1", International Journal of Energy Research, Vol. 17, pp. 29-33.
Tran Van Hoa (1997), “Improved Forecasts of Investment and Growth in Some Major ASEAN Economies: An Economy-wide Approach”, Journal of Economics and Finance (Proceedings), Vol. 21, pp. 271-280.
Tran Van Hoa (2000a) (ed), The Asia Crisis: The Cures, Their Effectiveness and the Prospects After, London: Macmillan, 2000.
Tran Van Hoa (2000b) (ed), The Social Impact of the Asia Crisis, London: Macmillan, 2000.
Tran Van Hoa (2002a), “Korea, China and Japan’s Trade with the World and Its Impact on New Asian Regionalism ASEAN+3”, Paper presented at the Joint Conference of the Association of the Korean Economic Studies, Korea Development Institute, and Research Center for International Economics, Yonsei University, Seoul, 21-22 July 2002.
Tran Van Hoa (2002b), “Growth of Asian Regional Trade and Income Convergence: Evidence from ASEAN+3 based on Extended Helpman-Krugman Hypothesis and Flexible Modelling Approach”, Department of Economics, University of Wollongong, mimeo.
Tran Van Hoa (2002c), “New Asian Regionalism: Evidence on ASEAN+3 Free Trade Agreement from Extended Gravity Theory and New Modelling Approach”, Department of Economics, University of Wollongong, mimeo.
Tran Van Hoa (2002d) (ed.) Economic Crisis Management, Mass: Edward Elgar. Tran Van Hoa (2003), “New Asian Regionalism and ASEAN+3 Free Trade
Agreement: Theoretical and Empirical Foundation, Policy Challenges and Growth Prospects”, Chulalongkorn Journal of Economics (Thailand), forthcoming.
Tran Van Hoa and Chaturvedi, A. (1988), "The Necessary and Sufficient Conditions for the Uniform Dominance of the Two-Stage Stein Estimators", Economics Letters, Vol. 28, pp. 351-355.
Tran Van Hoa and Chaturvedi, A. (1990), "Further Results on the Two-Stage Hierarchical Information (2SHI) Estimators in the Linear Regression Models", Communications in Statistics (Theory and Methods), Vol A19, No. 12, pp. 4697-4704.
Tran Van Hoa (with Chaturvedi, A. and Shukla, G.) (1993), "Performance of the Stein-rule Estimators when the Disturbances are Misspecified as Spherical", Economic Studies Quarterly (Japan), Vol. 44, pp. 601-611.
Tran Van Hoa (with Chaturvedi, A.) (1997), “Performance of the 2SHI Estimator under the Generalized Pitman Nearness Criterion”, Communications in Statistics (Theory and Method), Vol. 26, Issue 5, pp. 1227-1238.
Tran Van Hoa and Harvie, C (1998), Causes and Impact of the Asian Financial Crisis, London: Macmillan.
Ullah and Ullah (1978), "Double k-class Estimators of Coefficients in Linear Regression", Econometrica, Vol. 46, pp. 705-722.
Wong, Kar-yiu (2000), “Firm Failure and Financial Crisis: The Experience of South

23
Korea”, Journal of the Korean Economy, Vol. 1, pp. 23-51. World Bank, (2002), World Tables, World Bank, Washington DC,