Embed Size (px)
Citation preview
KOREAN AIR
1Q18 Financial Results
2
Disclaimer
This presentation is for informational purposes only, contains preliminary financial and other
information about Korean Air Lines Co., Ltd. and is subject to updating, revision, amendment and
completion. This presentation does not and is not intended to constitute or contain any offer of
securities for sale or a solicitation of an offer to purchase any securities of Korean Air Lines Co.,
Ltd. or any other company and neither this presentation nor anything contained herein shall form the
basis of any contract or commitment. Certain statements contained in this presentation may be
statements of future expectations and other forward-looking statements or trend information that are
based on management's current views and assumptions and involve known and unknown risks and
uncertainties that could cause actual results, performance or events to differ materially from those in
the forward-looking statements in this presentation. In addition to statements which are forward-
looking by reason of context, including without limitation, statements referring to risk limitations,
operational profitability, financial strength, performance targets, profitable growth opportunities, and
risk adequate pricing, the words "may, will, should, expects, plans, intends, anticipates, believes,
estimates, predicts, or continue", "potential, future, or further", and similar expressions are intended
to identify forward-looking statements. Korean Air Lines Co., Ltd. assumes no obligation to update
or revise any such statements or any other information contained herein to reflect events or
circumstances that may arise after the date of this presentation.
3
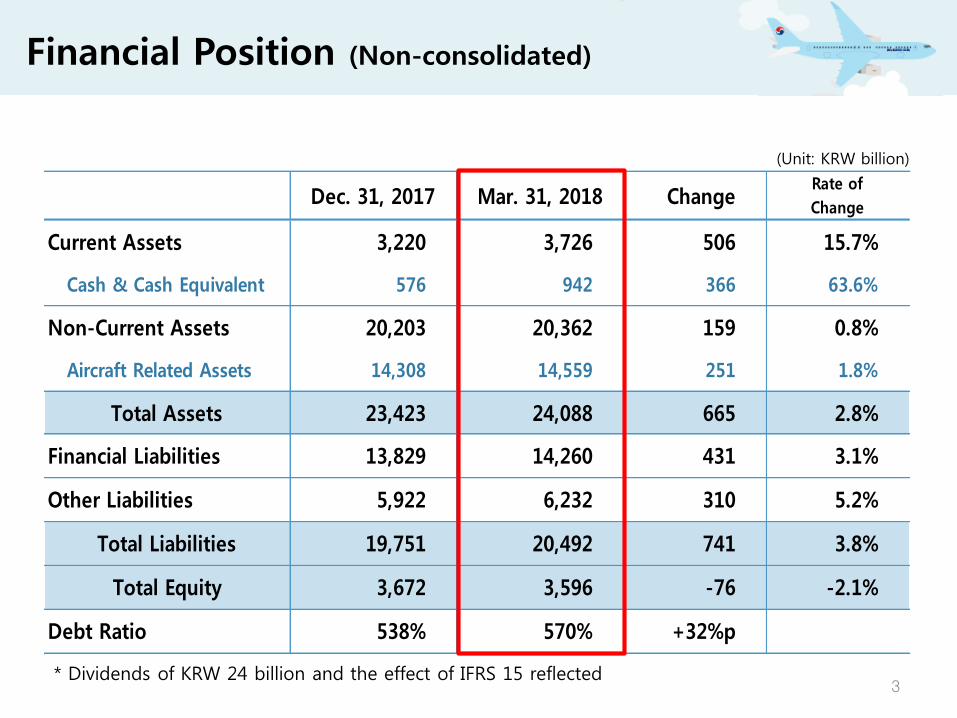
Dec. 31, 2017 Mar. 31, 2018 ChangeRate of
Change
Current Assets 3,220 3,726 506 15.7%
Cash & Cash Equivalent 576 942 366 63.6%
Non-Current Assets 20,203 20,362 159 0.8%
Aircraft Related Assets 14,308 14,559 251 1.8%
Total Assets 23,423 24,088 665 2.8%
Financial Liabilities 13,829 14,260 431 3.1%
Other Liabilities 5,922 6,232 310 5.2%
Total Liabilities 19,751 20,492 741 3.8%
Total Equity 3,672 3,596 -76 -2.1%
Debt Ratio 538% 570% +32%p
Financial Position (Non-consolidated)
* Dividends of KRW 24 billion and the effect of IFRS 15 reflected
(Unit: KRW billion)
4
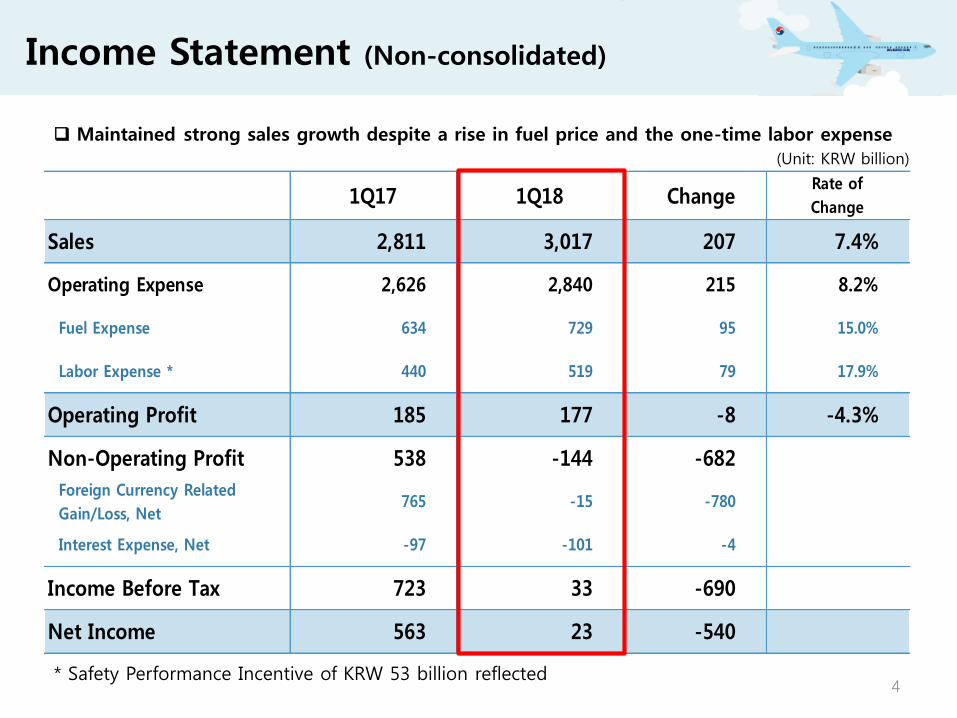
1Q17 1Q18 ChangeRate of
Change
Sales 2,811 3,017 207 7.4%
Operating Expense 2,626 2,840 215 8.2%
Fuel Expense 634 729 95 15.0%
Labor Expense * 440 519 79 17.9%
Operating Profit 185 177 -8 -4.3%
Non-Operating Profit 538 -144 -682
Foreign Currency Related
Gain/Loss, Net765 -15 -780
Interest Expense, Net -97 -101 -4
Income Before Tax 723 33 -690
Net Income 563 23 -540
(Unit: KRW billion)
Income Statement (Non-consolidated)
Maintained strong sales growth despite a rise in fuel price and the one-time labor expense
* Safety Performance Incentive of KRW 53 billion reflected
5
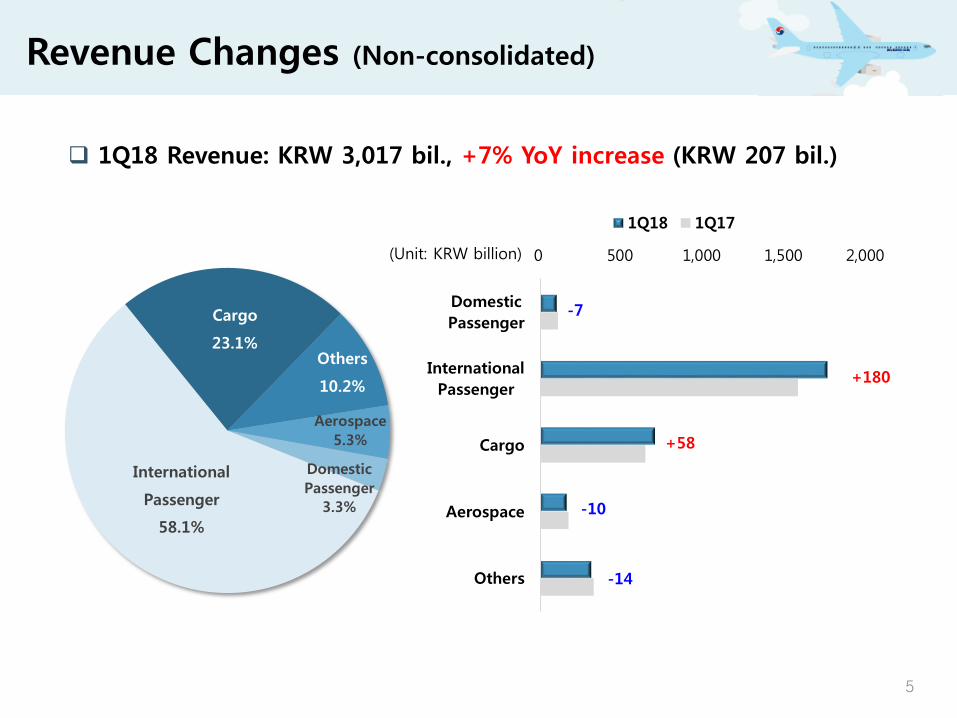
Revenue Changes (Non-consolidated)
0 500 1,000 1,500 2,000
Domestic
Passenger
International
Passenger
Cargo
Aerospace
Others
1Q18 1Q17
+58
-10
-14
1Q18 Revenue: KRW 3,017 bil., +7% YoY increase (KRW 207 bil.)
-7
+180
(Unit: KRW billion)
Domestic
Passenger
3.3%
International
Passenger
58.1%
Cargo
23.1%Others
10.2%
Aerospace
5.3%
Domestic
5%
Japan
13%China
12%
SEA
25%
Oceania
5%
Americas
25%
Europe
15%
1Q18
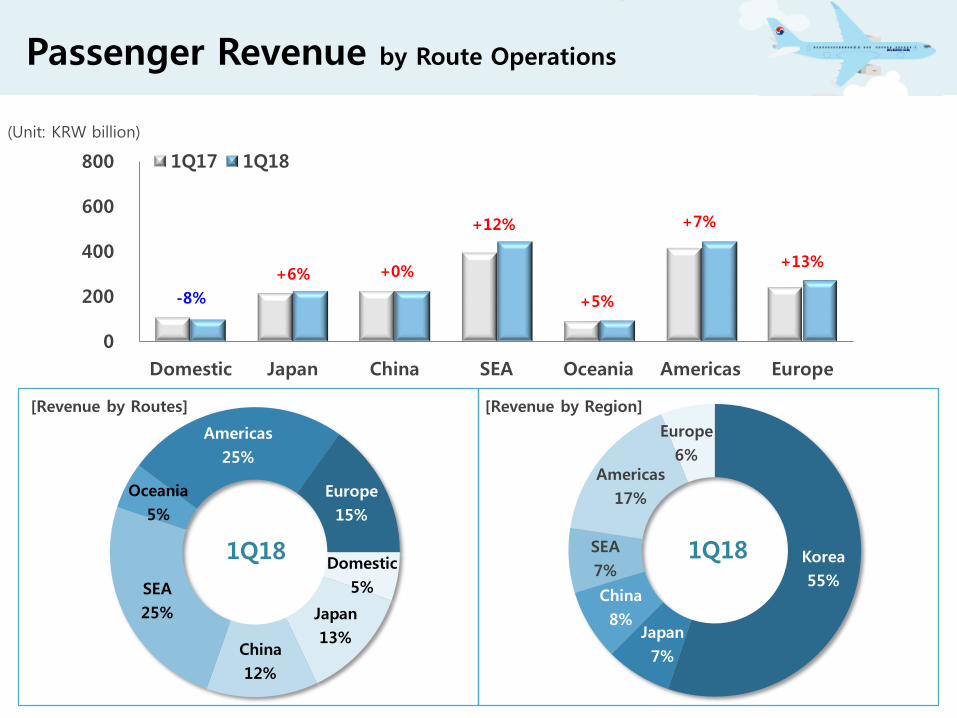
Passenger Revenue by Route Operations
0
200
400
600
800
Domestic Japan China SEA Oceania Americas Europe
1Q17 1Q18
-8%
+6%
+12%
+5%
+7%
+0%
(Unit: KRW billion)
+13%
[Revenue by Routes]
Korea
55%
Japan
7%
China
8%
SEA
7%
Americas
17%
Europe
6%
1Q18
[Revenue by Region]
7
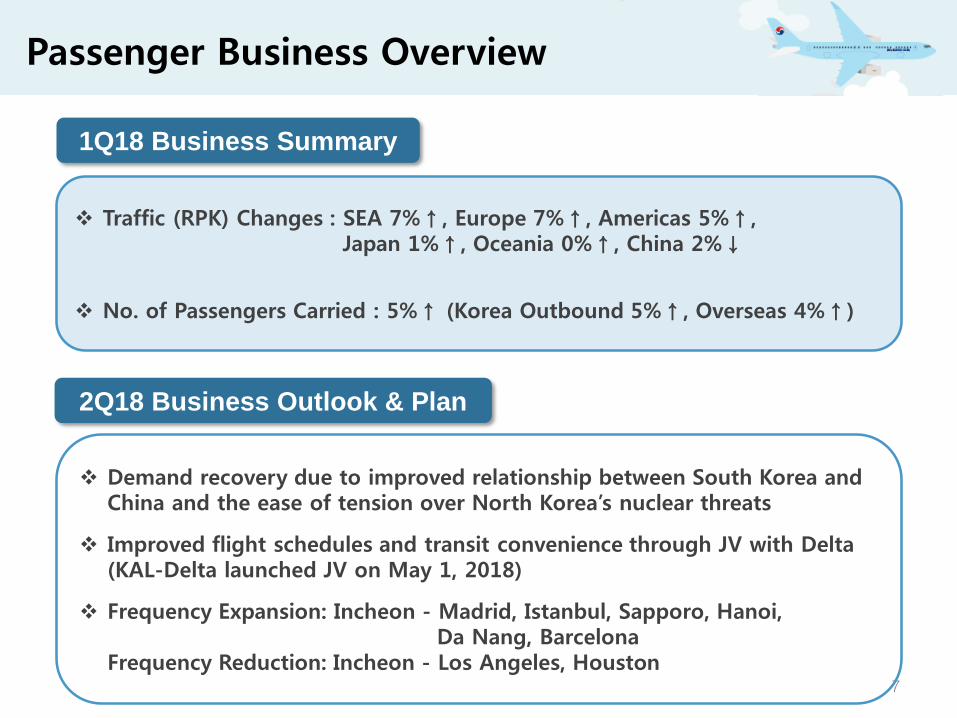
Passenger Business Overview
1Q18 Business Summary
Traffic (RPK) Changes : SEA 7%↑, Europe 7%↑, Americas 5%↑,Japan 1%↑, Oceania 0%↑, China 2%↓
No. of Passengers Carried : 5%↑ (Korea Outbound 5%↑, Overseas 4%↑)
2Q18 Business Outlook & Plan
Demand recovery due to improved relationship between South Korea and China and the ease of tension over North Korea’s nuclear threats
Improved flight schedules and transit convenience through JV with Delta (KAL-Delta launched JV on May 1, 2018)
Frequency Expansion: Incheon - Madrid, Istanbul, Sapporo, Hanoi, Da Nang, Barcelona
Frequency Reduction: Incheon - Los Angeles, Houston
8
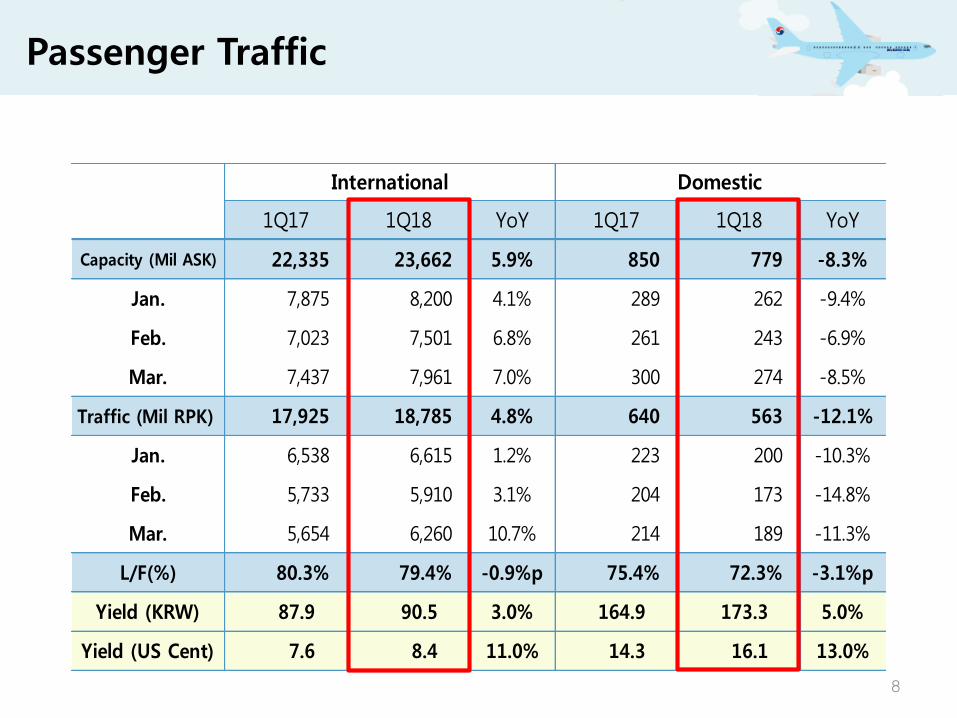
Passenger Traffic
1Q17 1Q18 YoY 1Q17 1Q18 YoY
Capacity (Mil ASK) 22,335 23,662 5.9% 850 779 -8.3%
Jan. 7,875 8,200 4.1% 289 262 -9.4%
Feb. 7,023 7,501 6.8% 261 243 -6.9%
Mar. 7,437 7,961 7.0% 300 274 -8.5%
Traffic (Mil RPK) 17,925 18,785 4.8% 640 563 -12.1%
Jan. 6,538 6,615 1.2% 223 200 -10.3%
Feb. 5,733 5,910 3.1% 204 173 -14.8%
Mar. 5,654 6,260 10.7% 214 189 -11.3%
L/F(%) 80.3% 79.4% -0.9%p 75.4% 72.3% -3.1%p
Yield (KRW) 87.9 90.5 3.0% 164.9 173.3 5.0%
Yield (US Cent) 7.6 8.4 11.0% 14.3 16.1 13.0%
International Domestic
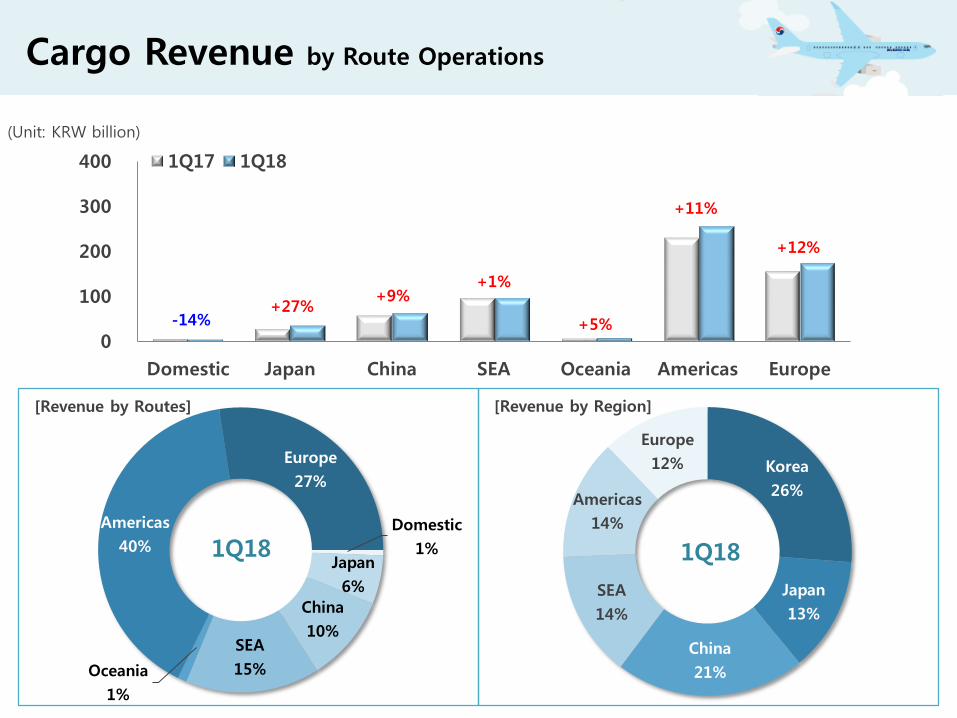
Domestic
1%Japan
6%
China
10%SEA
15%Oceania
1%
Americas
40%
Europe
27%
1Q18
0
100
200
300
400
Domestic Japan China SEA Oceania Americas Europe
1Q17 1Q18
-14%+27%
+1%
+5%
+11%
+9%
+12%
[Revenue by Routes] [Revenue by Region]
Korea
26%
Japan
13%
China
21%
SEA
14%
Americas
14%
Europe
12%
1Q18
Cargo Revenue by Route Operations
(Unit: KRW billion)
10
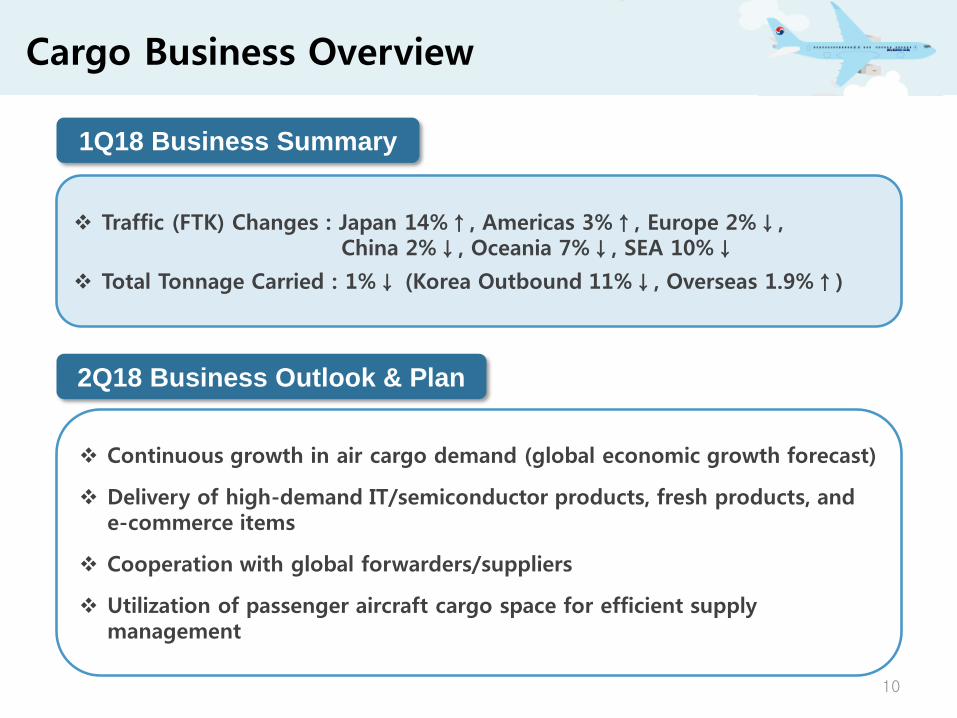
Cargo Business Overview
1Q18 Business Summary
Traffic (FTK) Changes : Japan 14%↑, Americas 3%↑, Europe 2%↓,China 2%↓, Oceania 7%↓, SEA 10%↓
Total Tonnage Carried : 1%↓ (Korea Outbound 11%↓, Overseas 1.9%↑)
2Q18 Business Outlook & Plan
Continuous growth in air cargo demand (global economic growth forecast)
Delivery of high-demand IT/semiconductor products, fresh products, and e-commerce items
Cooperation with global forwarders/suppliers
Utilization of passenger aircraft cargo space for efficient supply management
11
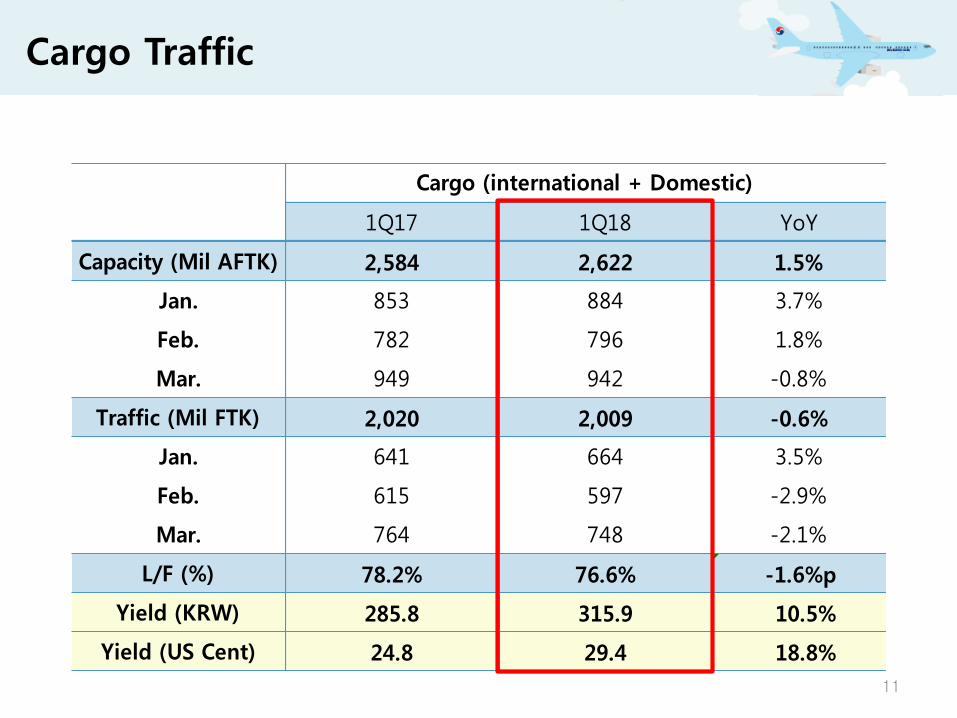
Cargo Traffic
1Q17 1Q18 YoY
Capacity (Mil AFTK) 2,584 2,622 1.5%
Jan. 853 884 3.7%
Feb. 782 796 1.8%
Mar. 949 942 -0.8%
Traffic (Mil FTK) 2,020 2,009 -0.6%
Jan. 641 664 3.5%
Feb. 615 597 -2.9%
Mar. 764 748 -2.1%
L/F (%) 78.2% 76.6% -1.6%p
Yield (KRW) 285.8 315.9 10.5%
Yield (US Cent) 24.8 29.4 18.8%
Cargo (international + Domestic)
12
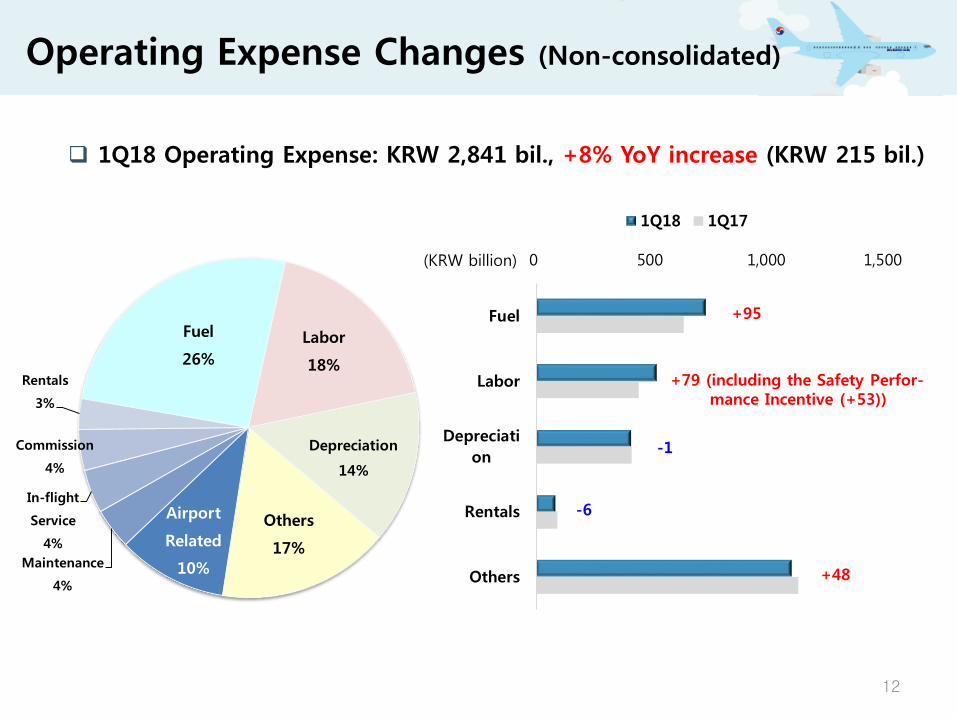
Operating Expense Changes (Non-consolidated)
Fuel
26%
Labor
18%
Depreciation
14%
Others
17%
Airport
Related
10%Maintenance
4%
In-flight
Service
4%
Commission
4%
Rentals
3%
1Q18 Operating Expense: KRW 2,841 bil., +8% YoY increase (KRW 215 bil.)
0 500 1,000 1,500
Fuel
Labor
Depreciati
on
Rentals
Others
1Q18 1Q17
+95
-6
+48
+79 (including the Safety Perfor-mance Incentive (+53))
-1
(KRW billion)
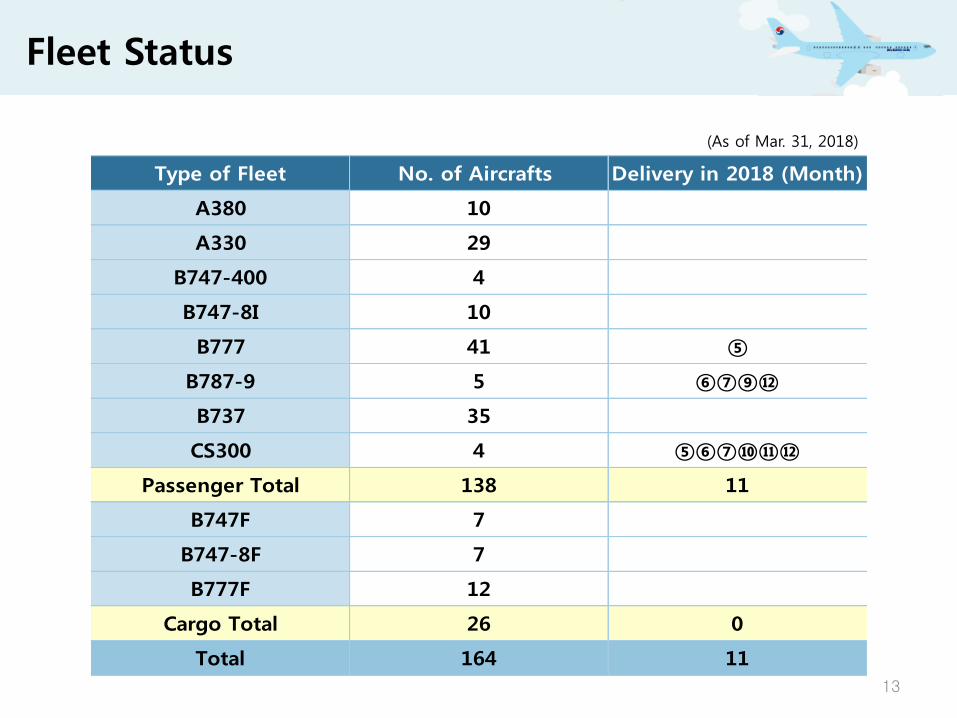
Type of Fleet No. of Aircrafts Delivery in 2018 (Month)
A380 10
A330 29
B747-400 4
B747-8I 10
B777 41 ⑤
B787-9 5 ⑥⑦⑨⑫
B737 35
CS300 4 ⑤⑥⑦⑩⑪⑫
Passenger Total 138 11
B747F 7
B747-8F 7
B777F 12
Cargo Total 26 0
Total 164 11
13
Fleet Status
(As of Mar. 31, 2018)
14
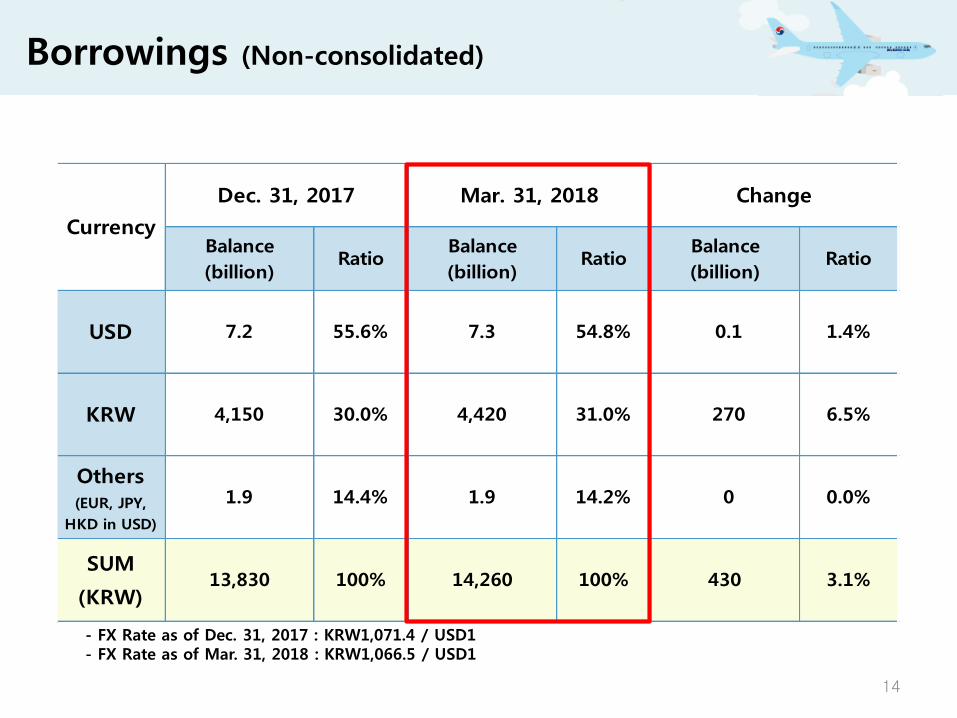
Borrowings (Non-consolidated)
- FX Rate as of Dec. 31, 2017 : KRW1,071.4 / USD1- FX Rate as of Mar. 31, 2018 : KRW1,066.5 / USD1
Balance
(billion)Ratio
Balance
(billion)Ratio
Balance
(billion)Ratio
USD 7.2 55.6% 7.3 54.8% 0.1 1.4%
KRW 4,150 30.0% 4,420 31.0% 270 6.5%
Others(EUR, JPY,
HKD in USD)
1.9 14.4% 1.9 14.2% 0 0.0%
SUM
(KRW)13,830 100% 14,260 100% 430 3.1%
Currency
Dec. 31, 2017 ChangeMar. 31, 2018
15
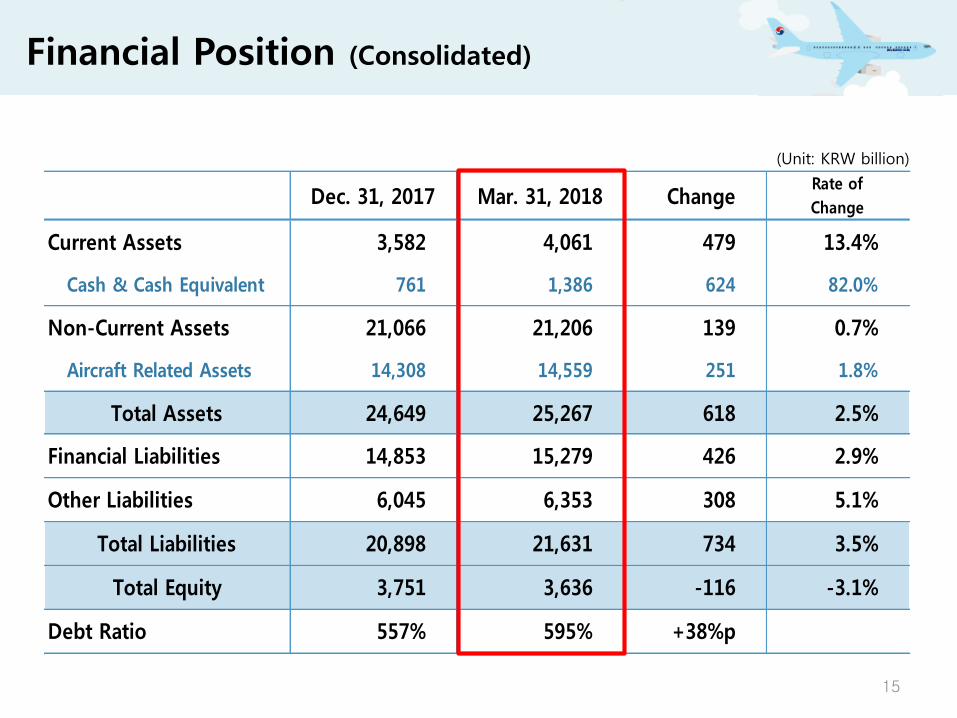
Dec. 31, 2017 Mar. 31, 2018 ChangeRate of
Change
Current Assets 3,582 4,061 479 13.4%
Cash & Cash Equivalent 761 1,386 624 82.0%
Non-Current Assets 21,066 21,206 139 0.7%
Aircraft Related Assets 14,308 14,559 251 1.8%
Total Assets 24,649 25,267 618 2.5%
Financial Liabilities 14,853 15,279 426 2.9%
Other Liabilities 6,045 6,353 308 5.1%
Total Liabilities 20,898 21,631 734 3.5%
Total Equity 3,751 3,636 -116 -3.1%
Debt Ratio 557% 595% +38%p
Financial Position (Consolidated)
(Unit: KRW billion)
16
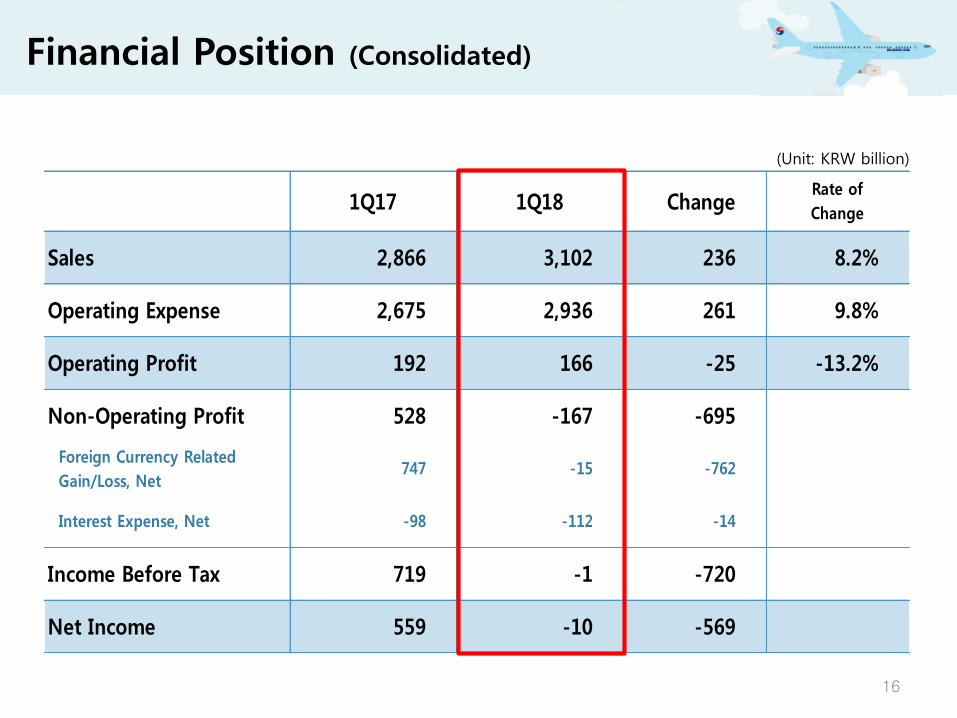
1Q17 1Q18 ChangeRate of
Change
Sales 2,866 3,102 236 8.2%
Operating Expense 2,675 2,936 261 9.8%
Operating Profit 192 166 -25 -13.2%
Non-Operating Profit 528 -167 -695
Foreign Currency Related
Gain/Loss, Net747 -15 -762
Interest Expense, Net -98 -112 -14
Income Before Tax 719 -1 -720
Net Income 559 -10 -569
Financial Position (Consolidated)
(Unit: KRW billion)

17
Thank you


![B747 DVA Manual[1]](https://img.pdfslide.net/doc/110x75/552c58ac550346e8198b4728/b747-dva-manual1.jpg)