Embed Size (px)
Citation preview
Kosrae State Census Report
2000 FSM Census of Population and Housing
December 2002
Kosrae Branch Statistics Office Division of Statistics
Department of Economic Affairs National Government Tofol, Kosrae 96944
Federated States of Micronesia

i
2000 FSM Census of Population
and Housing
Kosrae State Census Report
December 2002
Kosrae Branch Statistics Office Division of Statistics
Department of Economic Affairs National Government
Tofol, Kosrae State Federated States of Micronesia

iii

v

vii

ix
x

Kosrae Branch Statistics Office, Division of Statistics, FSM Department of Economic Affairs xi
TABLE OF CONTENTS CONTENTS PAGE PRESIDENT'S MESSAGE ................................................................................................................................................. iii GOVERNOR'S MESSAGE.................................................................................................................................................. v ACKNOWLEDGEMENT MESSAGE.............................................................................................................................. vii PREFACE………………………………………………………………………………………………………………ix TABLE OF CONTENTS..................................................................................................................................................... xi LIST OF TEXT TABLES................................................................................................................................................... xv LIST OF FIGURES............................................................................................................................................................ xxi LIST OF BASIC TABLES .............................................................................................................................................. xxiii SYMBOLS ....................................................................................................................................................................... xxiii MAPS ................................................................................................................................................................................ xxv EXECUTIVE SUMMARY ............................................................................................................................................ xxvii CHAPTER 1. INTRODUCTION...................................................................................................................................... 1 Geographical Location, Climate and Physical Features...................................................................................... 1 Kosrae: A brief History of Census Taking .......................................................................................................... 1 Spanish Administration......................................................................................................................... 2 German Administration......................................................................................................................... 2 Japanese Administration ....................................................................................................................... 3 American Administration...................................................................................................................... 4 The 2000 FSM Census ........................................................................................................................................... 5 Planning and Preparation ...................................................................................................................... 5 Enumeration .......................................................................................................................................... 5 Editing, Coding and Data Processing ................................................................................................... 6 Data Analysis and Report Writing........................................................................................................ 6 Geographic Distribution....................................................................................................................................... 6 Population Distribution Overtime......................................................................................................... 6 Population Density Overtime................................................................................................................. 8 Conclusion............................................................................................................................................................. 8 CHAPTER 2. AGE AND SEX STRUCTURE.................................................................................................................. 9 Introduction ........................................................................................................................................................... 9 Data Description..................................................................................................................................................... 9 Analysis of Age and Sex Data ............................................................................................................................... 9 Population Change and Intercensal Growth .......................................................................................................... 9 Age and Sex Distribution ..................................................................................................................................... 10 Median Age ........................................................................................................................................... 13 Sex Ratio................................................................................................................................................ 14 Dependency Ratio ................................................................................................................................. 14 Accuracy of Age Reporting .................................................................................................................. 15 Conclusion............................................................................................................................................................ 15
Table of Content 2000 FSM Census of Kosrae
Kosrae Branch Statistics Office, Division of Statistics, FSM Department of Economic Affairs xii
CHAPTER 3. HOUSEHOLD, FAMILIES, AND MARITAL STATUS........................................................................ 17 Introduction .......................................................................................................................................................... 17 Definition............................................................................................................................................................. 17 Analysis of Household and Marital Status .......................................................................................................... 19 Households (and Family) ..................................................................................................................... 19 Marital Status......................................................................................................................................... 21 Conclusion............................................................................................................................................................ 22 CHAPTER 4. FERTILITY ............................................................................................................................................... 23 Introduction .......................................................................................................................................................... 23 Data Description................................................................................................................................................... 23 Analysis of Fertility Data ..................................................................................................................................... 23 Crude Birth Rate.................................................................................................................................... 23 Age Specific Fertility ............................................................................................................................ 25 Fertility of Population Subgroups......................................................................................................... 27 Conclusion............................................................................................................................................................ 29 CHAPTER 5. MORTALITY............................................................................................................................................ 31 Introduction .......................................................................................................................................................... 31 Data Description................................................................................................................................................... 31 Analysis of Mortality Data................................................................................................................................... 31 Conclusion............................................................................................................................................................ 36 CHAPTER 6. MIGRATION ............................................................................................................................................ 37 Introduction .......................................................................................................................................................... 37 Data Description................................................................................................................................................... 37 Analysis of Migration Data.................................................................................................................................. 38 Birthplace............................................................................................................................................... 38 Citizenship and Legal Residence .......................................................................................................... 40 Continuous Residence........................................................................................................................... 41 Residence in 1995 (Five Years Prior to the Census)........................................................................... 42 Conclusion............................................................................................................................................................ 44 CHAPTER 7. RELIGION, ETHNICITY AND LANGUAGE....................................................................................... 45 Introduction .......................................................................................................................................................... 45 Definitions ............................................................................................................................................................ 45 Analysis of Data on Religion, Ethnicity, and Language ..................................................................................... 45 Religion…………................................................................................................................................. 45 Ethnicity ................................................................................................................................................. 46 Language ............................................................................................................................................... 47 Conclusion............................................................................................................................................................ 50 CHAPTER 8. EDUCATION AND LITERACY............................................................................................................. 51 Introduction .......................................................................................................................................................... 51 Data Description................................................................................................................................................... 51 Analysis of Education Data.................................................................................................................................. 52 School Attendance by Level of Enrollment.......................................................................................... 52 School Attendance by Age and Sex...................................................................................................... 53 Educational Attainment by Age and Sex.............................................................................................. 56 Educational Attainment by Place of Birth ............................................................................................ 59 Literacy Status by Age and Sex ........................................................................................................... 60 Vocational Training............................................................................................................................... 61 Conclusion............................................................................................................................................................ 62 CHAPTER 9. ECONOMIC ACTIVITY.......................................................................................................................... 63 Introduction .......................................................................................................................................................... 63
2000 FSM Census of Kosrae Table of Content
Kosrae Branch Statistics Office, Division of Statistics, FSM Department of Economic Affairs xiii
Definitions ............................................................................................................................................................ 63 Analysis of Economic Activity Data ................................................................................................................... 64 Labor Force Participation...................................................................................................................... 64 Unemployment ...................................................................................................................................... 67 Labor Force Status by Citizenship........................................................................................................ 70 Labor Force Status by English Language Ability ................................................................................ 70 Labor Force Status by Educational Attainment.................................................................................... 71 Work Experience................................................................................................................................... 73 Subsistence Activity .............................................................................................................................. 73 Other Labor Force Characteristics ........................................................................................................ 75 Commuting............................................................................................................................. 75 Armed Forces ......................................................................................................................... 76 Conclusion............................................................................................................................................................ 76 CHAPTER 10. INDUSTRY AND OCCUPATION......................................................................................................... 77 Introduction .......................................................................................................................................................... 77 Data Description................................................................................................................................................... 77 Analysis of Industry and Occupation Data.......................................................................................................... 79 Industry ................................................................................................................................................. 79 Occupation............................................................................................................................................. 82 Class of Worker..................................................................................................................................... 86 Conclusion............................................................................................................................................................ 88 CHAPTER 11. INCOME................................................................................................................................................... 89 Introduction .......................................................................................................................................................... 89 Definitions ............................................................................................................................................................ 89 Analysis of Income Data...................................................................................................................................... 90 Cash Income .......................................................................................................................................... 90 Conclusions .......................................................................................................................................................... 98 CHAPTER 12. HOUSING CHARACTERISTICS......................................................................................................... 99 Introduction .......................................................................................................................................................... 99 Data Description................................................................................................................................................... 99 Analysis of Housing Data .................................................................................................................................. 102 General Housing Characteristics......................................................................................................... 102 Structural Characteristics .................................................................................................................... 103 Utilities ............................................................................................................................................... 106 Conclusion.......................................................................................................................................................... 114 Bibliography...................................................................................................................................................................... 115 Appendix A. Basic Tables ............................................................................................................................................... 119 Appendix B. Questionnaire - 2000 FSM Census of Population and Housing ............................................................... 149

Kosrae Branch Statistics Office, Division of Statistics, FSM Department of Economic Affairs xv
LIST OF TEXT TABLES CHAPTER ONE
Table 1.1 Population of Kosrae During the Spanish Administration for Selected Years .................................................2
Table 1.2. Population of Kosrae During the German Administration for Selected Years .................................................3
Table 1.3. Population of Kosrae During the Japanese Administration for Selected Years................................................4
Table 1.4. Population of Kosrae During the American Administration for Selected Years ..............................................5
Table 1.5. Proportional Distribution by Municipality, Kosrae State: Selected Census Years ...........................................7
Table 1.6. Population Distribution by Municipality, Kosrae State: 1994 and 2000 ..........................................................7
Table 1.7. Persons per Square Mile by Municipality, Kosrae State: 1925 to 2000............................................................8
CHAPTER TWO
Table 2.1. Population Change and Annual Growth Rate by Age Group for Kosrae State: 1973 to 2000........................10
Table 2.2. Selected Demographic Indicators from Kosrae and Other Micronesian Countries: Various Years ..............10
Table 2.3. Percentage Distribution of the Population by Age Group and Sex, Kosrae State: 1973 to 2000....................11
Table 2.4. Population by Age Group and Sex, Kosrae State: 1994 and 2000..................................................................13
Table 2.5. Median Age by Municipality and Sex, Kosrae State: 1973 to 2000 ...............................................................13
Table 2.6. Males per 100 Females by Municipality, Kosrae State: 1973 to 2000............................................................14
Table 2.7. Males per 100 Females by Age Group and Municipality, Kosrae State: 1994 and 2000 ...............................14
Table 2.8. Dependency Ratio by Municipality, Kosrae State: 1973 to 2000 ...................................................................15
Table 2.9. Myers and Bachi Methods of Measuring Digit Preference, Kosrae State: 1973 to 2000................................15
CHAPTER THREE
Table 3.1. Type of Living Quarters in Kosrae State: 1973 to 2000 .................................................................................20
Table 3.2. Household Composition, Kosrae State: 1973 to 2000 ....................................................................................20
Table 3.3. Household Composition by Municipality, Kosrae State: 1994 and 2000 .......................................................20
Table 3.4. Persons per Household by Municipality, Kosrae State: 1994 and 2000 .........................................................21
Table 3.5. Number of Households by Household Size, Kosrae State: 1986 and 2000 ....................................................21
Table 3.6. Marital Status for Aged 15 Years and Over by Municipality, Kosrae State: 1973 to 2000 ............................22
Table 3.7. Singulate Mean Age at Marriage for Aged 15 Years and Over by Municipality and Sex, Kosrae State: 1986 and 2000 ..........................................................................................................................22
CHAPTER FOUR
Table 4.1. Crude Birth Rate, Kosrae State: 1993 to 2000................................................................................................24
Table 4.2. Estimation of Crude Birth Rates, Kosrae State: 1979 to 2000........................................................................24
Table 4.3. Adjustment of Births in Year Prior to the Census, Kosrae State: 1994 and 2000...........................................25
Table 4.4. Calculation of Total Fertility Rate with P/F Ratio, Kosrae State: 1994 and 2000 ..........................................26
Table 4.5. Age-Specific Fertility Rates, Kosrae State: 1973 to 2000 ..............................................................................27
Table 4.6. Age-Specific Fertility Rates by Mother's Educational Attainment, Kosrae State: 1994 and 2000 .................28
Table 4.7. Age-Specific Fertility Rates by Labor Force Participation, Kosrae State: 1994 and 2000 .............................28
Table 4.8. Summary of Adjusted Fertility Rates by Municipality, Kosrae State: 1994 and 2000 ...................................28
Table 4.9. Children Ever Born per Woman by Municipality, Kosrae State: 1994 and 2000...........................................29
CHAPTER FIVE
List of Text Tables 2000 FSM Census of Kosrae
Kosrae Branch Statistics Office, Division of Statistics, FSM Department of Economic Affairs xvi
Table 5.1. Average Age-Specific Mortality Rates, Kosrae State: 1986 to 1989, and 1990 to 1993................................ 32
Table 5.2. Number of Children Ever Born (CEB) and Children Surviving (CS) and Proportion Surviving (PS) by Age Group of Mother, Kosrae State: 1973 to 2000................................................................................... 33
Table 5.3. Indirect Estimates of Early Age Mortality CEB/CS, Kosrae State: 1973 to 2000 ......................................... 33
Table 5.4. Summary Indicators from Indirect Estimation of Early Age Mortality, Kosrae State: 1969 to 1990 ............ 34
Table 5.5. Mortality Data from Other Pacific Island Nations: Various Years ................................................................ 34
Table 5.6. Life Table as Implied by Coale & Demeny Model Life Table for the West Pattern of Females and Males, Kosrae State: 1991 to 1992............................................................................................ 35
CHAPTER SIX
Table 6.1. Birthplace of Kosrae State Residents by Sex: 1986 and 2000........................................................................ 38
Table 6.2. Birthplace Kosrae Residents by Municipality: 1994 and 2000 ...................................................................... 39
Table 6.3. Municipality and State of Birth of Kosrae Residence, Kosrae State: 1994 and 2000 .................................... 39
Table 6.4. Internal Lifetime Migration by Municipality, Kosrae State: 1994 and 2000 ................................................. 40
Table 6.5. Usual Residence by Citizenship, Kosrae State: 1994 and 2000 ..................................................................... 41
Table 6.6. State/Municipality of Legal Residence by Municipality of Usual Residence, Kosrae State: 1994 and 2000.......................................................................................................................... 41
Table 6.7. Distribution of Non-movers and Previous Residence by Municipality, Kosrae State: 1994 and 2000 .......... 41
Table 6.8. Movers by Place of Residence, Kosrae State: 1994 and 2000 ....................................................................... 42
Table 6.9. Residence 5 Years Ago by Usual Residence for Persons Aged 5 Years and Over, Kosrae State: 1994 and 2000 ......................................................................................................... 42
Table 6.10. Internal Migration Rate by Municipality, Kosrae State: 1994 and 2000........................................................ 43
Table 6.11. Educational Attainment of Internal Migrants by Sex, Kosrae State: 1994 and 2000 ..................................... 43
Table 6.12. Labor Force Participation of Internal Migrants, Kosrae State: 1994 and 2000 .............................................. 43
Table 6.13. Labor Force Participation of Internal Migrant by Sex, Kosrae State: 1994 and 2000.................................... 44
CHAPTER SEVEN
Table 7.1. Religion by Sex, Kosrae State: 1973 and 2000 .............................................................................................. 46
Table 7.2. Religion by Municipality, Kosrae State: 1994 and 2000................................................................................ 46
Table 7.3. Religion by Age Group, Kosrae State: 1994 and 2000 .................................................................................. 46
Table 7.4. Ethnic Origin of Kosrae Residents by Municipality, Kosrae State: 1994 and 2000....................................... 47
Table 7.5. Ethnicity by Place of Birth, Kosrae State: 1994 and 2000 ............................................................................. 47
Table 7.6. Languages Spoken at Home by Ethnicity, Kosrae State: 1994 and 2000....................................................... 48
Table 7.7. Languages Spoken at Home by Place of Birth, Kosrae State: 1994 and 2000 ............................................... 48
Table 7.8. Frequency of English Use by Municipality, Kosrae State: 1994 and 2000.................................................... 49
Table 7.9. English Speakers at Home by Age Group, Kosrae State: 1994 and 2000 ...................................................... 49
CHAPTER EIGHT
Table 8.1. School Attendance for Aged 3 Years and Over by Level and Type, Kosrae State: 1973 to 2000 ................. 52
Table 8.2. School Attendance for Aged 3 Years and Over by Level and Type, Kosrae State: 1994 and 2000............... 53
Table 8.3. Age-specific Enrollment Ratio per 100 by Age and Sex, Kosrae State: 1994 and 2000................................ 54
Table 8.4. Age-specific Enrollment Ratio by Age, Kosrae State: 1994 and 2000 .......................................................... 55
Table 8.5. Gross Enrollment Ratio by Sex, Kosrae State: 1994 and 2000 ...................................................................... 56
2000 FSM Census of Kosrae List of Text Tables
Kosrae Branch Statistics Office, Division of Statistics, FSM Department of Economic Affairs xvii
Table 8.6. Educational Attainment for Aged 25 Years and Over by Sex, Kosrae State: 1980 and 2000.........................57
Table 8.7. Educational Attainment for Aged 25 Years and Over by Sex, Kosrae State: 1994 and 2000.........................57
Table 8.8. Educational Attainment for Aged 25 Years and Over by Municipality, Kosrae State: 1994 and 2000..........58
Table 8.9. Educational Attainment for Aged 25 Years and Over by Age Group and Sex, Kosrae State: 1994 and 2000 ..........................................................................................................................59
Table 8.10. Educational Attainment for Aged 25 Years and Over by Place of Birth, Kosrae State: 1994 and 2000 ........60
Table 8.11. Literate Population by Age Group and Sex, Kosrae State: 1980 and 2000 ....................................................60
Table 8.12. Illiterate Population for Aged 10 Years and Over by Age Group and Sex, Kosrae State: 1980 and 2000 .....61
Table 8.13. Vocational Training by Age Group, Kosrae State: 1980 and 2000.................................................................62
CHAPTER NINE
Table 9.1. Distribution of Working Age Population for Aged 15 Years and Over by Municipality, Kosrae State: 1994 and 2000....................................................................................................65
Table 9.2. Distribution of Working Age Population for Aged 15 Years and Over by Sex, Kosrae State: 1994 and 2000 ..........................................................................................................................65
Table 9.3. Labor Force Distribution by Sex and Municipality, Kosrae State: 1994 and 2000 ........................................66
Table 9.4. Labor Force Participation Rates (Percent Aged 15 Years and Over in the Labor Force) by Age Group and Sex, Kosrae State: 1994 and 2000 ................................................................................................66
Table 9.5. Labor Force Participation Rates (Percent Aged 15 Years and Over in the Labor Force) by Age Group and Municipality, Kosrae State: 1994 and 2000 ..........................................................................67
Table 9.6. Unemployment Rates (Percent of Labor Force Unemployed) by Age Group and Sex, Kosrae State: 1994 and 2000 ..........................................................................................................................68
Table 9.7. Unemployment Rates (Percent of Labor Force Unemployed) by Age Group and Municipality, Kosrae State: 1994 and 2000 ..........................................................................................................................68
Table 9.8. Unemployed Persons by Age Group and Previous Work Experience, Kosrae State: 1994 and 2000 ............69
Table 9.9. Unemployment by Municipality, Kosrae State: 1994 and 2000 .....................................................................69
Table 9.10. Labor Force Status for Aged 15 Years and Over by Citizenship, Kosrae State: 1994 and 2000 ....................70
Table 9.11. Labor Force Status for Aged 15 Years and Over by Language Ability, Kosrae State: 1994 and 2000 ..........71
Table 9.12. Educational Attainment for Aged 15 Years and Over by Labor Force Status, Kosrae State: 1994 and 2000 ..........................................................................................................................72
Table 9.13. Year of Last Worked for Aged 15 Years and Over Not in the Labor Force, Kosrae State: 1994 and 2000 ...73
Table 9.14. Percent of Population in Subsistence Work by Municipality, Kosrae State: 1994 and 2000..........................73
Table 9.15. Percent of Population in Subsistence Work by Age Group, Sex, and Municipality, Kosrae State: 1994 and 2000 ..........................................................................................................................74
Table 9.16. Type of Subsistence Activities by Municipality, Kosrae State: 1994 and 2000 .............................................75
Table 9.17. Subsistence Activities for Aged 15 Years and Over by Educational Attainment, Kosrae State: 1994 and 2000 ..........................................................................................................................75
Table 9.18. Subsistence Activities by Search for Cash Employment, Kosrae State: 1994 and 2000 ................................75
Table 9.19. Location of Work Last Week by Municipality, Kosrae State: 1994...............................................................76
CHAPTER TEN
Table 10.1. Industry of Employment for Aged 15 Years and Over, Kosrae State: 1980 and 2000 ...................................79
Table 10.2. Detailed Breakdown of Industry by Sex, Kosrae State: 1994 and 2000 .........................................................80
List of Text Tables 2000 FSM Census of Kosrae
Kosrae Branch Statistics Office, Division of Statistics, FSM Department of Economic Affairs xviii
Table 10.3. Industry by Percent of Persons with High School Diploma and Vocational Training, Kosrae State: 1994 and 2000.......................................................................................................................... 81
Table 10.4. Industry by Occupation, Kosrae State: 1994 and 2000 .................................................................................. 82
Table 10.5. Occupations of Experienced Work Force, Kosrae State: 1980 and 2000....................................................... 82
Table 10.6. Occupations of Experienced Work Force for Aged 15 Years and Over Who Worked in 5 Years Previous to Census by Sex, Kosrae State: 1994 and 2000 ............................................................................. 83
Table 10.7. Age Groups for Aged 15 Years and Over by Occupation, Kosrae State: 1994 and 2000 .............................. 83
Table 10.8. Occupation for Aged 15 Years and Over by Age Group, Kosrae State: 1994 and 2000................................ 84
Table 10.9. Occupation for Aged 15 Years and Over by Place of Birth, Kosrae State: 1994 and 2000 ........................... 84
Table 10.10. Occupation for Aged 15 Years and Over by Municipality, Kosrae State: 1994 and 2000............................. 85
Table 10.11. Educational Attainment of the Experienced Work Force for Aged 25 Years and Over by Occupation and Sex, Kosrae State: 1994 and 2000........................................................................................ 86
Table 10.12. Type of Work for Aged 15 Years and Over by Municipality and Sex, Kosrae State: 1994 and 2000 ........... 87
Table 10.13. Type of Work for Aged 15 Years and Over by Age Group, Kosrae State: 1994 and 2000 ........................... 87
Table 10.14. Educational Attainment for Aged 25 Years and Over by Class of Worker, Kosrae State: 1994 and 2000.... 88
CHAPTER ELEVEN
Table 11.1. Household, Family, and Individual Income in 1993 by Municipality, Kosrae State: 1994 and 2000............ 90
Table 11.2. Median Household Income Change, Kosrae State: 1980 and 2000 ............................................................... 91
Table 11.3. Percent Distribution of Individual Income in 1993 by Municipality, Kosrae State: 1994 and 2000.............. 91
Table 11.4. Individual Income in 1993 by Age Group and Sex, Kosrae State: 1994 and 2000 ........................................ 93
Table 11.5. Individual Income in 1993 by Sex, Kosrae State: 1994 and 2000.................................................................. 93
Table 11.6. Median Income by Type of Family and Municipality, Kosrae State: 1994 and 2000.................................... 94
Table 11.7. Individual Income in 1993 by Educational Attainment, Kosrae State: 1994 and 2000.................................. 95
Table 11.8. Individual Median Income in 1993 by Economic Status the Week Before the Census, Kosrae State: 1994 and 2000.......................................................................................................................... 95
Table 11.9. Median Individual Income in 1993 by Occupation, Kosrae State: 1994 and 2000 ........................................ 96
Table 11.10. Individual Income in 1993 by Class of Work, Kosrae State: 1994 and 2000................................................. 96
Table 11.11. Median Income by Source and Municipality, Kosrae State: 1994 and 2000 ................................................. 97
Table 11.12. Income Source in 1993 by Sex, Kosrae State: 1994 and 2000....................................................................... 97
CHAPTER TWELVE
Table 12.1. Total Housing Units, Occupied Housing Units, and Vacants, Kosrae State: 1980 and 2000....................... 102
Table 12.2. Total Housing Units, Occupied Housing Units and Tenure by Municipality, Kosrae State: 1994 and 2000........................................................................................................................ 102
Table 12.3. Year of Construction of all Housing Units by Municipality, Kosrae State: 1994 and 2000 ........................ 103
Table 12.4. Occupied Housing Units by Number of Units per Structure, Kosrae State: 1994 and 2000 ........................ 103
Table 12.5. Occupied Housing Units by Number of Units per Structure and Municipality, Kosrae State: 1994 and 2000........................................................................................................................ 103
Table 12.6. Rooms per Occupied Housing Units, Kosrae State: 1980 and 2000 ............................................................ 104
Table 12.7. Number of Rooms per Occupied Housing Unit by Municipality, Kosrae State: 1994 and 2000................. 104
Table 12.8. Number of Bedrooms per Housing Unit of All Units, Kosrae State: 1980 and 2000................................... 104
Table 12.9. Number of Bedrooms of All Housing Units by Municipality, Kosrae State: 1994 and 2000 ...................... 105
2000 FSM Census of Kosrae List of Text Tables
Kosrae Branch Statistics Office, Division of Statistics, FSM Department of Economic Affairs xix
Table 12.10. Materials Used for Roof of All Housing Units, Kosrae State: 1980 and 2000 .............................................105
Table 12.11. Materials Used for Roof by Municipality, Kosrae State: 1994 and 2000 .....................................................105
Table 12.12. Materials Used for Outside Walls of All Housing Units, Kosrae State: 1980 and 2000...............................106
Table 12.13. Materials Used for Outside Walls of All Housing Units by Municipality, Kosrae State: 1994 and 2000 ....106
Table 12.14. Materials Used for Foundation of All Housing Units by Municipality, Kosrae State: 1994 and 2000.........106
Table 12.15. Electric Power of All Housing Units, Kosrae State: 1980 and 2000 ............................................................107
Table 12.16. Electricity and Air Conditioning of All Housing Units by Municipality, Kosrae State: 1994 and 2000......107
Table 12.17. Piped Water of All Housing Units, Kosrae State: 1980 and 2000 ................................................................107
Table 12.18. Water Supply of All Housing Units by Municipality, Kosrae State: 1994 and 2000 ...................................108
Table 12.19. Source of Drinking Water of All Housing Units, Kosrae State: 1980 and 2000...........................................108
Table 12.20. Source of Drinking Water of All Housing Units by Municipality, Kosrae State: 1994 and 2000 ................108
Table 12.21. Sewage Disposal of All Housing Units, Kosrae State: 1980 and 2000.........................................................109
Table 12.22. Sewage Disposal of All Housing Units by Municipality, Kosrae State: 1994 and 2000 ..............................109
Table 12.23. Plumbing Facilities of All Housing Units, Kosrae State: 1980 and 2000.....................................................109
Table 12.24. Plumbing Facilities of Occupied Housing Units by Municipality, Kosrae State: 1994 and 2000 ................110
Table 12.25. Toilet Facilities of All Housing Units, Kosrae State: 1980 and 2000...........................................................110
Table 12.26. Toilet Facilities of All Housing Units by Municipality, Kosrae State: 1994 and 2000 ................................110
Table 12.27. Bathtub or Shower Facilities of All Housing Units, Kosrae State: 1980 and 2000 ......................................111
Table 12.28. Bathtub or Shower Facilities of All Housing Units by Municipality, Kosrae State: 1994 and 2000............111
Table 12.29. Cooking Facilities Inside of Occupied Housing Units by Municipality, Kosrae State: 1994 and 2000 .......111
Table 12.30. Cooking Facilities Outside of Occupied Housing Unit by Municipality, Kosrae State: 1994 and 2000 ......112
Table 12.31. Vehicles and Boats Owned by Municipality, Kosrae State: 1994 and 2000.................................................112
Table 12.32. Monthly Cost of Electricity by Municipality, Kosrae State: 1994 and 2000 ................................................113
Table 12.33. Monthly Cost of Kerosene by Municipality, Kosrae State: 1994 and 2000..................................................113
Table 12.34. Monthly Cost of Water by Municipality, Kosrae State: 1994 and 2000.......................................................113
Table 12.35. Monthly Cost of Other Fuel by Municipality, Kosrae State: 1994 and 2000 ...............................................114
Table 12.36. Value of House by Municipality, Kosrae State: 1994 and 2000...................................................................114
Kosrae Branch Statistics Office, Division of Statistics, FSM Department of Economic Affairs
xxi
LIST OF FIGURES
Figure 1.1. Population Distribution by Municipality, Kosrae State: 1925 to 2000 .............................................................7
Figure 1.2. Kosrae Population Distribution for 1994 and 2000 ..........................................................................................8
Figure 2.1. Population Structure for Kosrae State: 1973 to 2000......................................................................................12
Figure 4.1. Unadjusted Age-Specific Fertility Rates, Kosrae State: 1973 to 2000 ...........................................................27
Figure 4.2. Unadjusted Age-Specific Fertility Rates by Municipality, Kosrae State: 1994 and 2000 ..............................29
Figure 6.1. Internal Lifetime Net-migration Flows, Kosrae State: 1994 and 2000 ...........................................................39
Figure 8.1. Age-Specific Enrollment Rates by Age and Sex, Kosrae State: 1994 and 2000 ............................................54
Figure 8.2. Age-Specific Enrollment Rates by Age and Municipality, Kosrae State: 1994 and 2000..............................55
Figure 8.3. Literate Population by Age and Sex, Kosrae State: 1994 and 2000................................................................61
Figure 9.1. Labor Force Participation Rates by Age and Sex, Kosrae State: 1994 and 2000 ...........................................66
Figure 9.2. Labor Force Participation Rates by Age and Municipality, Kosrae State: 1994 and 2000.............................67
Figure 11.1. Individual Income by Municipality, Kosrae State: 1994 and 2000.................................................................91
Kosrae Branch Statistics Office, Division of Statistics, FSM Department of Economic Affairs xxiii
LIST OF BASIC TABLES Table B01. Age by Municipality of Usual Residence, Kosrae State: 2000 .....................................................................125
Table B02. Household and Family Characteristics by Municipality of Usual Residence, Kosrae State: 2000...............126
Table B03. Household Size and Fertility by Municipality of Usual Residence, Kosrae State: 2000 ..............................127
Table B03A. Fertility by Age of Mother and Sex of Child by Usual Residence, Kosrae State: 2000 ...............................128
Table B04. Single Years of Age by Municipality of Usual Residence, Kosrae State: 2000 ...........................................129
Table B04A. Female Single Years of Age by Municipality of Usual Residence, Kosrae State: 2000...............................130
Table B05. Place of Birth by Municipality of Usual Residence, Kosrae State: 2000......................................................131
Table B06. Legal Residence and Year of Entry by Municipality of Usual Residence, Kosrae State: 2000....................132
Table B07. Length of Continuous Residence and Place of Previous Residence by Municipality of Usual Residence, Kosrae State: 2000 ...........................................................................................................133
Table B08. Residence 5 Years Ago by Municipality of Usual Residence, Kosrae State: 2000 ......................................134
Table B09. Ethnicity by Municipality of Usual Residence, Kosrae State: 2000 .............................................................135
Table B10. Marital Status and Religion by Municipality of Usual Residence, Kosrae State: 2000................................136
Table B11. Languages Spoken and Spoken at Home by Municipality of Usual Residence, Kosrae State: 2000 ...........137
Table B12. School Enrollment and Educational Attainment by Municipality of Usual Residence, Kosrae State: 2000........................................................................................................................................138
Table B13. Literacy, Vocational Training, and Veteran Status by Municipality of Usual Residence, Kosrae State: 2000........................................................................................................................................139
Table B14. Labor Force Characteristics by Municipality of Usual Residence, Kosrae State: 2000................................140
Table B15. Activity and Place of Work in Week Before Census and Work Status in 1993 by Municipality of Usual Residence, Kosrae State: 1994..................................................................................141
Table B16. Occupation by Municipality of Usual Residence, Kosrae State: 2000 .........................................................142
Table B17. Industry by Municipality of Usual Residence, Kosrae State: 2000 ..............................................................142
Table B18. Class of Worker and Commuting Characteristics by Municipality of Usual Residence, Kosrae State: 2000........................................................................................................................................143
Table B19. Income in 1993 and 1999 by Municipality of Usual Residence, Kosrae State: 2000 ...................................144
Table H01. Structural Characteristics, Kosrae State: 2000..............................................................................................145
Table H02. Utilization Characteristics, Kosrae State: 2000 ............................................................................................146
Table H03. Plumbing and Water Source Characteristics, Kosrae State: 2000.................................................................147
Table H04. Cooking Facilities and Appliances, Kosrae State: 2000 ...............................................................................148
Table H05. Vehicles and Monthly Costs, Kosrae State: 2000.........................................................................................149
Table H06. Tenure and Financial Characteristics, Kosrae State: 2000............................................................................150
SYMBOLS
• A dash "–" represents zero or a percent which rounds to less than 0.1 • Three dots "..." means not applicable, or information suppressed for reasons of confidentiality
• "NA" means not available
xxv
xxvi
Kosrae Branch Statistics Office, Division of Statistics, FSM Department of Economic Affairs xxvii
EXECUTIVE SUMMARY
This report presents the 2000 Kosrae State Census of Population and Housing data, along with historical data from recent censuses. The 2000 Kosrae State Census Report is the second volume published by the Statistics Office, Kosrae Branch under the FSM Department of Economic Affairs. It is organized into 13 chapters, which summarizes information on the population's demographic, social, economic and housing conditions. Apart from the obvious use of the report in planning, policy formulation, and in administration processes, the data presented in the report can also serve as a benchmark information in monitoring and evaluation activities. The size of a population refers to the total number of people in a given area. In looking at structure, we talk about the basic composition of the population by gender (sex) and age. The population development refers to changes in size and structure, as well as the process or the specific population dynamic, with the changes that may take place. The three basic parameters that determine population size, structure and processes are births, deaths and migration. Further details on their importance and influence will be discussed in chapters 4, 5 and 6. Demographic Characteristics Population size and projections. The population of Kosrae State increased from about 3,984 in 1973 to 7,317 in 1994 and to about 7,686 in the year 2000. The population by municipality in 2000 was 2,591 in Lelu, 1,571 in Malem, 1,067 in Utwe and 2,457 in Tafunsak. In 1994, the population by municipality was 2,404 in Lelu, 1,430 in Malem, 1,056 in Utwe and 2,427 in Tafunsak. Between the two-Census period in 1994 and 2000, the population grew by about 0.98 percent per year, which is much lower than the 3.9 percent per year for the period 1973 to 1986 and by about 1.3 percent per year since 1986. If this growth rate of 0.98 continues, the population of Kosrae State will double in about 21 years. Using an assumption of moderately declining fertility and declining in-migration, the population of Kosrae State is projected to reach about 11,000 by the year 2014. Population density. Describes the number of people living in a specific geographic area (country, island, province) divided by the landmass of this geographic area. The population density (persons per square mile) in the State of Kosrae in 2000 was about 181 persons per square mile (Lelu with 312, Malem 242, Utwe 97 and Tafunsak 149). In 1994, the population density of Kosrae State was about 173 persons per square mile. Median Age. The median age — the age at which half of the population is younger and half older — in the State of Kosrae in 2000 was 19.2 years, an increase of about 4 years from the 14.9 years in 1973. The median age divides a population in exactly two equal halves. Sex Ratio. Describes the proportion of males to females, usually expressed “X”males per 100females. Most human populations have slightly more male than female births. As the population ages, the difference decreases because of higher male mortality. The sex ratio (number of males per 100 females) for Kosrae State in 2000 was about 108 (about 98 in Lelu, 104 in Malem, Utwe about 98 and about 102 in Tafunsak). Households. The total number of households increased from about 964 in 1994 to over 1,087 in 2000. By municipality, the total number of households reached 357 in Lelu, 248 in Malem, 156 in Utwe and 326 in Tafunsak. The average number of persons per household in Kosrae decreased from about 7.9 in 1973 to about 7.0 in 2000. Persons per household in 2000 were 7.2 in Lelu, 6.3 in Malem, 6.8 in Utwe, and 7.4 in Tafunsak. Marital status. Adults in the State of Kosrae increasingly delay marriage. The average age at first marriage in Kosrae increased from about 25.3 years in 1986 to about 27.1 years in 2000. The proportion of married population decreased from about 61 percent in 1973 to about 54 percent in 2000. In 2000, proportions married were highest in Tafunsak (56 percent) and Lelu and Malem (54 percent) and lowest in Utwe (47 percent). Fertility. Fertility decreased in the State of Kosrae in these decades before the 2000 Census. The crude birth rate was about 27 per 1,000 in 1994. The total fertility rate seems to have decreased from just over 7.6 children per women in 1973 to about 4.2 children per women in 1994 and further reduced to 3.8 in 2000. The rate at which fertility declined in the municipalities was not uniform. The Total Fertility Rate (TFR) in 1994 varied from a low 3.2 in Utwe to 3.5 in Tafunsak, 4.1 in Malem and to 4.5 in Lelu. The 2000 data showed that TFR increased in Utwe and Tafunsak while the other two municipalities experienced decline in the TFR. The results suggest that the use of family planning services, female educational attainment and female participation in the labor force contributed to the differences in the level and pattern of fertility.
Executive Summary 2000 FSM Census of Kosrae
xxviii Kosrae Branch Statistics Office, Division of Statistics, FSM Department of Economic Affairs
Mortality. With the introduction of modern health care, mortality continued to decline, resulting in longer life and lower infant, childhood and maternal mortality. Nevertheless, census data suggest that these improvements might have slowed down in mid 1980's. For the State of Kosrae, the 1994 Census indirectly estimated an Infant Mortality Rate (IMR) of 49 per thousand life births and a life expectancy at birth of 65.2 years. The 2000 Census showed that estimated Infant Mortality rate for Kosrae State was declined to 44 per thousand and a life expectancy at birth of 66 years. Birthplace. About 91 percent of Kosrae residents in 1994 were born in the State of Kosrae. The remaining 9 percent constituted the immigrants to Kosrae State. The results of the 2000 Census showed that 90 percent of the Kosrae residents were born in the State of Kosrae. The largest proportion of foreign-born individuals came from Asia in 1994 whereas in 2000, the largest proportion of foreign-born individuals was from elsewhere. The proportion of foreign born was highest in Tafunsak (about 14 percent) and lowest in Utwe (slightly over 1 percent). Residence 5 years before the census. The population's residence 5 years before the FSM 2000 Census shows the level and pattern of short-term migration. Among the 1994 residents aged 5 years and over, slightly 7.5 percent lived outside Kosrae in 1989 (3.5 percent for Lelu, 2.9 percent for Malem, 1 percent for Utwe, and 16.8 percent for Tafunsak). The result also provided an estimation of interstate migration per year. In the preceding 5 years before the Census, the annual interstate migration rate was about 3 per 1000 net out-migration. For internal migration, Tafunsak and Malem experienced net in-migration (1.4 per 100 and .3 per 100, respectively) while Utwe had a net loss (2.8 per 100) in the total number of the resident population. Lelu had zero net migration within this period. Residents Outside of the FSM. The emigration rate for Kosrae State was estimated to be about 5 per thousand per year. Using the 1994 Census results on family members residing outside of the FSM and results of the surveys of Micronesians in Guam and CNMI, about 1,100 person lived outside of the FSM. Social Characteristics Religion. The Protestant Church has been the major religion in Kosrae, with Congregational church as the dominating sect. About 88 percent of the Kosrae population in 1994 was Congregationalists (92.4 percent in Lelu, 89.5 percent in Malem, 94.9 percent in Utwe, and 82.2 percent in Tafunsak). The 2000 Census showed that more than 89 percent of the Kosrae population was Congregationalists. Other Protestants constituted about 3 percent. Ethnicity and Language Spoken at Home. About 92 percent of the Kosrae residents had native ethnicity. Over 93 percent reported the local language as their most commonly used language. English was reported by about 90 percent as their second most commonly used language. School Enrollment. As the population of Kosrae increased, the number of persons attending school in Kosrae also increased from about 2,500 in 1994 to about 2,600 in 2000. About 2 percent of the enrollment at elementary and .3 percent of those in high school were in private schools. Enrollment reached its peak at the age of 10. Dropout rates were quite high in Kosrae starting from the age of 20 years. Educational Attainment. The 2000 Census data showed that over 68 percent of all persons 25 years old and over had high school and higher level of educational attainment, an increase from about 40 percent in 1980. The proportion of the population with no schooling decreased from about 13 percent in 1980 to about 6 percent in 1994 and continued to decline to 2 percent in 2000. Economic Characteristics Labor Force Participation. Labor force participation was compiled based on the current economic activity (that is, economic activities during a seven day reference period). The overall labor forces participation rate of person’s 15 years and over during the week before the Census in Kosrae in 1994 was about 50 percent while the 2000 Census data showed that labor forces participation rate in Kosrae was 60 percent. The male participation rate (65 percent) was nearly twice that of females (31 percent). The unemployment rate in Kosrae in 1994, based on UN classification, was 15.1 percent while the 2000 Census showed that the unemployment rate for Kosrae state was 2 percent. By municipality in 1994, unemployment was 10.4 percent for Lelu, 24.4 percent for Malem, 27.7 percent for Utwe and 10.2 percent for Tafunsak. By municipality in 2000, unemployment was 1.9 percent for Lelu, 0.9 percent for Malem, 0.6 percent for Utwe and 0.8 percent for Tafunsak.
2000 FSM Census of Kosrae Executive Summary
Kosrae Branch Statistics Office, Division of Statistics, FSM Department of Economic Affairs xxix
Subsistence. Out of about 1,800 employed persons in 1994, about 400 persons (that is, nearly 22 percent) were engaged in agricultural, fishery or related activities. About 74 percent were engaged in market oriented agricultural, fishery, or related activities while the remaining 26 percent were in pure subsistence (did subsistence for household consumption only and did not sell). The 2000 Census showed that out of the 1,962 employed persons, about 25 percent of the subsistence workers reported fishing as their main production and a combination of gardening and fishing was reported 18 percent. Industry and Occupation. The formal experienced work force in Kosrae in 1994 was about 1,900 (nearly a 200 percent increase from 1980). About 14 percent of the employed persons 15 years and over in Kosrae were managerial and professional workers. Technicians and associate professionals (about 17 percent) and administrative support (about 15 percent) were also reported as major occupations. As for the 2000 Census data, the largest portions of the economically active worked in wholesale and retail trade (about 21 percent) followed by public administration (about 18 percent) and education (14 percent) and skilled agricultural and fishery workers constituted about 7 percent of all experienced workers. Class of Worker. The percentage share of private workers in Kosrae in 1994 and 2000 was close to that of the public sector. In 2000, the majority of males were employed in the public sector while the majority of females were employed in the private sector. Household Income. Out of the 964 households in Kosrae in 1994, about 907 reported some cash income during 1993. The median household income was about $6,700. The mean household income was higher at about $9,700. The median income of individuals was about $3,300. By municipality, median household income varied from about $8,700 in Lelu to about $4,800 in Utwe. As for the 2000 Census data, 1,087 households in Kosrae more than 1,000 reported with some cash income during 1999. The median household income was $7,600 while the mean household income was higher at more than $12,000. Housing. The total number of housing units increased from about 600 in 1980 to over 1,000 in 1994 and to almost 1,100 in 2000. Around 94 percent of all housing units were reported occupied during 1980, 1994 and 2000 Censuses. The number of housing units with 5 or more rooms increased from about 12 percent in 1980 to about 29 percent in 1994 and to about 28 percent in 2000. Housing conditions in Kosrae improved over the two decades. More than half of all housing units were built between 1985 and 2000. In the 1994 and 2000 Censuses, more than 90 percent of the housing units had electricity compared to 34 percent in 1980. About 92 percent of all housing units had piped water as compared to about 36 percent in 1980. Similarly, of all housing units in 1994, over 85 percent had flush toilet and about 83 percent had bathtubs while the 1980 data showed that about 37 percent of the housing units reported flush toilet and about 8 percent with bathtubs or shower. Lastly, a set of basic tables is presented at the end of the report. A set of detailed tables is also available in a separate publication. The tables provide a breakdown of data by municipality. These serve as a basic source of data on Kosrae's population and housing characteristics.
Kosrae Branch Statistics Office, Division of Statistics, FSM Department of Economic Affairs 1
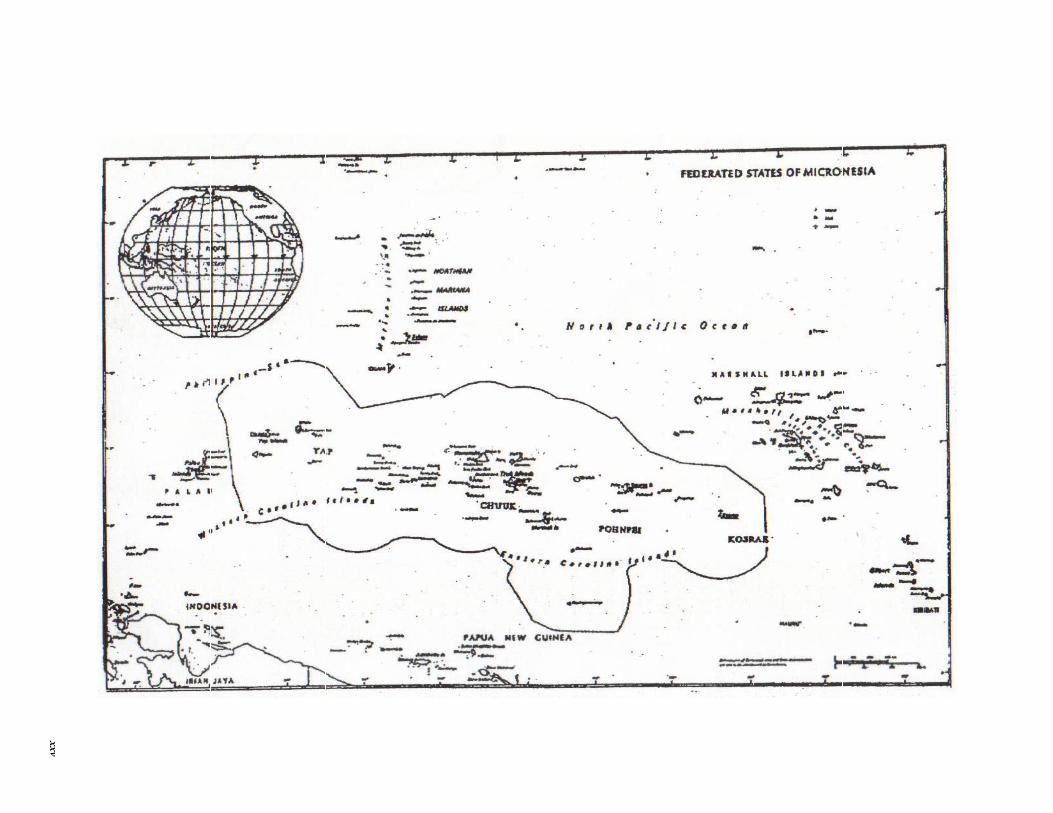
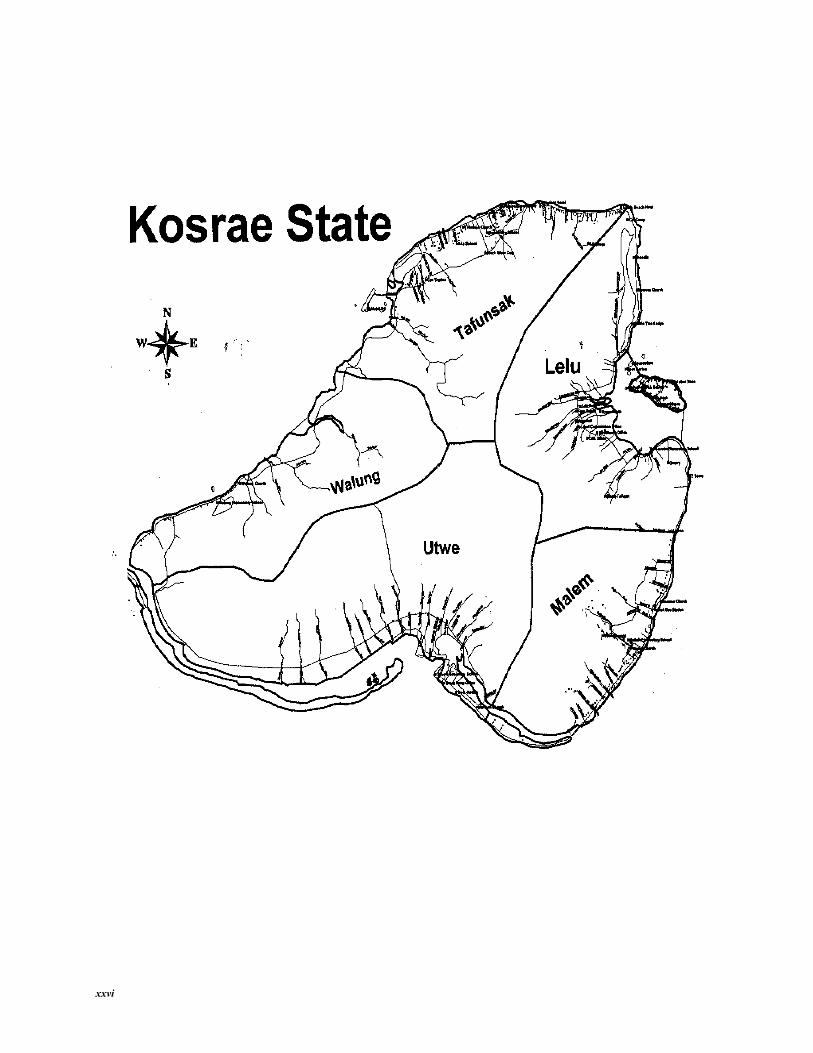
CHAPTER 1 INTRODUCTION The creation of the independent and sovereign nation of the Federated States of Micronesia (FSM) under the Compact of Free Association with the United States caused a growing need for social and economic development planning. Consequently, as in many developing countries, administrators and planners in the FSM, in their quest for social and economic development often contend with incomplete or unavailable information when it is needed. The 1994 and 2000 FSM Censuses were thus conducted as part of the overall effort to provide current and updated information required for planning and administrative purposes. This report presents basic analysis of the 2000 FSM Census data, including comparison against the 1994 FSM Census. This report provides the basic analysis of the 2000 FSM Census for Kosrae State. Chapter 1 locates Kosrae geographically and presents a brief history of census taking and the population distribution of Kosrae in selected census years, along with some background on the 2000 FSM Census. Chapter 2 presents population change and structure. Chapter 3 presents the household and marital status. Chapters 4 to 6 discuss the population dynamics (fertility, mortality, and migration) of the Kosrae. Chapters 7 to 11 provide the basic analysis of social and economic characteristics. Chapter 12 discusses the housing characteristics. A separate publication presenting detailed tabulations of the 2000 FSM Census results has also been compiled and disseminated by the Division of Statistics. Supplemental information and data from previous selected censuses (1973, 1980, the mid 1986 State Censuses, and 1994) are to compare with and to present changes over time. Geographical Location, Climate and Physical Features Kosrae State is the eastern-most state in the Federated States of Micronesia (FSM), about 5 degrees north latitude and 163 degrees east longitude. With an area of 42.3 square miles, it is the second largest single island in the FSM (after Pohnpei). It is the southeastern-most state of the Federated States of Micronesia and is located 347 southwest of Kwajelein in the Marshall Islands, and 2,813 miles southwest of Honolulu. Kosrae State is made up of four municipalities known as Lelu, Malem, Utwe and Tafunsak. The Capital of Kosrae is Lelu and it is known that the island is the home of the sleeping lady. Kosrae is a volcanic high island, roughly triangular in shape, associated with surrounding reefs. The reefs vary in distance from the shoreline from only a few hundred feet at some points to a mile in other places. Heavy rainfall has carved out eroded river valleys and deep-water harbors. Most of the interior of the island is rough and rugged, with Mount Finkol elevated at 2064 feet as Kosrae's highest point. Rainfall occurs throughout the year and yields about 180 inches on the East Coast and more than 250 inches in the west. The trade winds blow predominantly from the northeast. The mean annual temperature is about 80 degrees Fahrenheit year round. The rugged interior makes up about 70 percent of the landmass. It is densely forested with native tropical vegetation. Outside the rugged interior are the lower hillsides and the flat areas. They are suitable for cultivation of citrus, breadfruit and bananas. The island is known for the fresh water swamps for raising the giant swamp taro. Mangrove swamps surround most of the island. Kosrae: A brief History of Census Taking in Kosrae: The arrival of European explorers in Micronesia nearly five centuries ago opened the way for many changes in this portion of Oceania. One of the most important was demographic change. Although the particulars varied between islands, a basic pattern persisted throughout most of the region. An initial period of depopulation, usually due to diseases introduced by explorers, whalers, and missionaries from outside Micronesia; and a subsequent period of population growth resulting from improved health care and frequently leading to modern population larger than any known in the past (Taeuber 1963; Gorenflo and Levin 1992). The precise nature of these changes often varied. For the State of Kosrae, depopulation was particularly severe — nearly eradicating native inhabitants during the nineteenth century (Ritter 1981:22-24). Sustained demographic growth followed throughout most of the twentieth century, producing a population in 1994 greater than any previously documented. Although the Spanish explorer Saavedra possibly sighted Kosrae in 1529 (Sarfert 1919:1; Office of the Chief of Naval Operations 1944:17; Lewis 1949:26), the first certain sighting by non-Micronesians was by the American ship Hope in 1801 (Hezel 1983:84). Kosrae was inhabited sometime after 1000 B.C. (Hezel 1983:3), though sparse evidence throughout the Carolines limits our understanding of the earliest phases of habitation (Campbell 1989:36) Three years later another American vessel, the Nancy, also sighted Kosrae, the captain naming it Strong's Island after the governor of Massachusetts
Chapter 1: Introduction 2000 FSM Census of Kosrae
2 Kosrae Branch Statistics Office, Division of Statistics, FSM Department of Economic Affairs
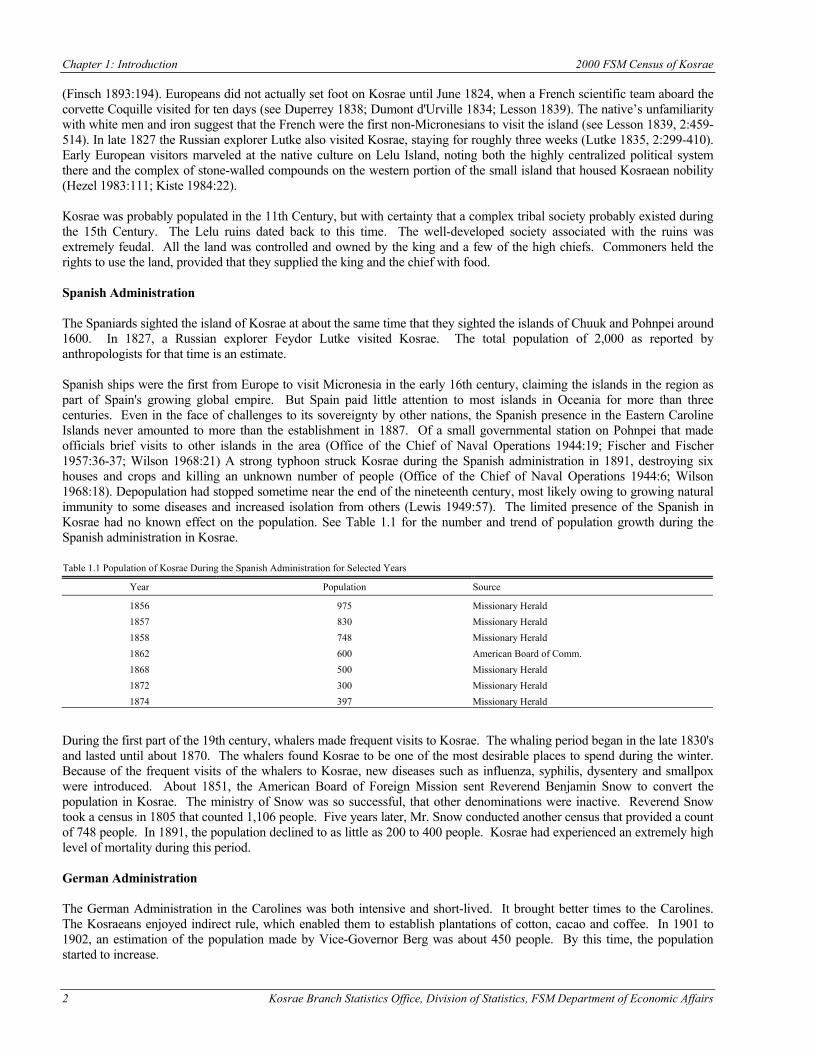
(Finsch 1893:194). Europeans did not actually set foot on Kosrae until June 1824, when a French scientific team aboard the corvette Coquille visited for ten days (see Duperrey 1838; Dumont d'Urville 1834; Lesson 1839). The native’s unfamiliarity with white men and iron suggest that the French were the first non-Micronesians to visit the island (see Lesson 1839, 2:459-514). In late 1827 the Russian explorer Lutke also visited Kosrae, staying for roughly three weeks (Lutke 1835, 2:299-410). Early European visitors marveled at the native culture on Lelu Island, noting both the highly centralized political system there and the complex of stone-walled compounds on the western portion of the small island that housed Kosraean nobility (Hezel 1983:111; Kiste 1984:22). Kosrae was probably populated in the 11th Century, but with certainty that a complex tribal society probably existed during the 15th Century. The Lelu ruins dated back to this time. The well-developed society associated with the ruins was extremely feudal. All the land was controlled and owned by the king and a few of the high chiefs. Commoners held the rights to use the land, provided that they supplied the king and the chief with food. Spanish Administration The Spaniards sighted the island of Kosrae at about the same time that they sighted the islands of Chuuk and Pohnpei around 1600. In 1827, a Russian explorer Feydor Lutke visited Kosrae. The total population of 2,000 as reported by anthropologists for that time is an estimate. Spanish ships were the first from Europe to visit Micronesia in the early 16th century, claiming the islands in the region as part of Spain's growing global empire. But Spain paid little attention to most islands in Oceania for more than three centuries. Even in the face of challenges to its sovereignty by other nations, the Spanish presence in the Eastern Caroline Islands never amounted to more than the establishment in 1887. Of a small governmental station on Pohnpei that made officials brief visits to other islands in the area (Office of the Chief of Naval Operations 1944:19; Fischer and Fischer 1957:36-37; Wilson 1968:21) A strong typhoon struck Kosrae during the Spanish administration in 1891, destroying six houses and crops and killing an unknown number of people (Office of the Chief of Naval Operations 1944:6; Wilson 1968:18). Depopulation had stopped sometime near the end of the nineteenth century, most likely owing to growing natural immunity to some diseases and increased isolation from others (Lewis 1949:57). The limited presence of the Spanish in Kosrae had no known effect on the population. See Table 1.1 for the number and trend of population growth during the Spanish administration in Kosrae. Table 1.1 Population of Kosrae During the Spanish Administration for Selected Years
Year Population Source
1856 975 Missionary Herald 1857 830 Missionary Herald 1858 748 Missionary Herald 1862 600 American Board of Comm. 1868 500 Missionary Herald 1872 300 Missionary Herald 1874 397 Missionary Herald
During the first part of the 19th century, whalers made frequent visits to Kosrae. The whaling period began in the late 1830's and lasted until about 1870. The whalers found Kosrae to be one of the most desirable places to spend during the winter. Because of the frequent visits of the whalers to Kosrae, new diseases such as influenza, syphilis, dysentery and smallpox were introduced. About 1851, the American Board of Foreign Mission sent Reverend Benjamin Snow to convert the population in Kosrae. The ministry of Snow was so successful, that other denominations were inactive. Reverend Snow took a census in 1805 that counted 1,106 people. Five years later, Mr. Snow conducted another census that provided a count of 748 people. In 1891, the population declined to as little as 200 to 400 people. Kosrae had experienced an extremely high level of mortality during this period. German Administration The German Administration in the Carolines was both intensive and short-lived. It brought better times to the Carolines. The Kosraeans enjoyed indirect rule, which enabled them to establish plantations of cotton, cacao and coffee. In 1901 to 1902, an estimation of the population made by Vice-Governor Berg was about 450 people. By this time, the population started to increase.
2000 FSM Census of Kosrae Chapter 1. Introduction
Kosrae Branch Statistics Office, Division of Statistics, FSM Department of Economic Affairs 3
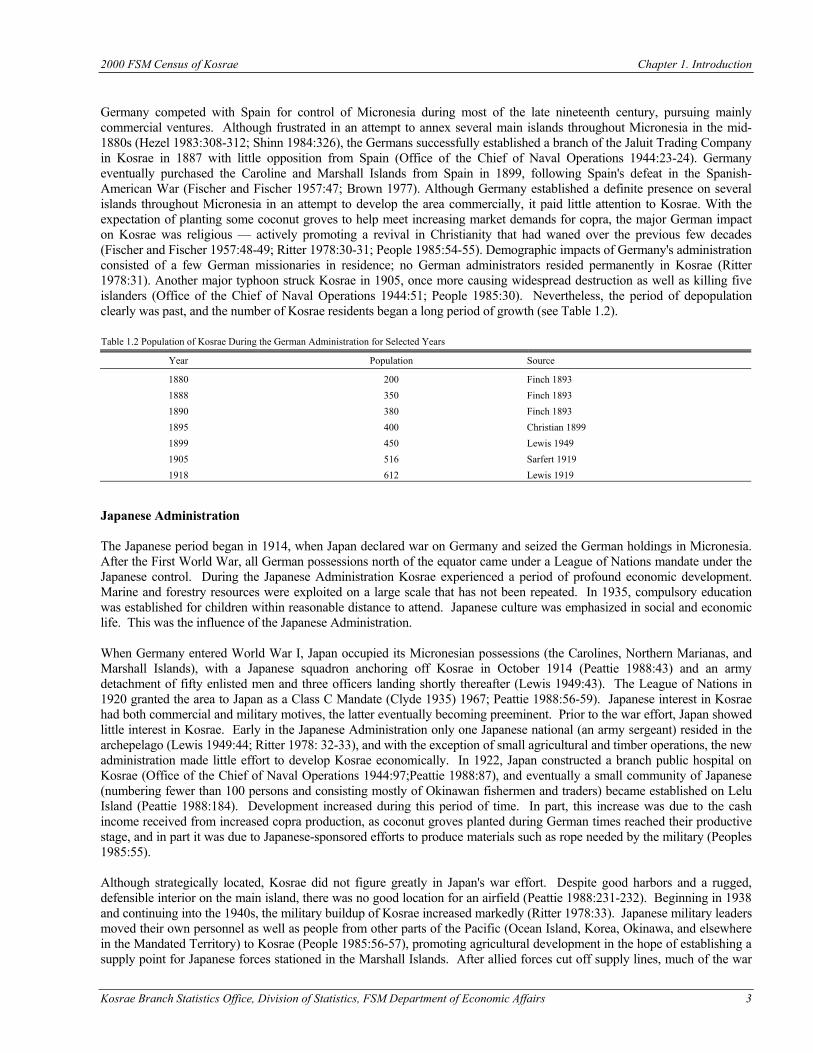
Germany competed with Spain for control of Micronesia during most of the late nineteenth century, pursuing mainly commercial ventures. Although frustrated in an attempt to annex several main islands throughout Micronesia in the mid-1880s (Hezel 1983:308-312; Shinn 1984:326), the Germans successfully established a branch of the Jaluit Trading Company in Kosrae in 1887 with little opposition from Spain (Office of the Chief of Naval Operations 1944:23-24). Germany eventually purchased the Caroline and Marshall Islands from Spain in 1899, following Spain's defeat in the Spanish-American War (Fischer and Fischer 1957:47; Brown 1977). Although Germany established a definite presence on several islands throughout Micronesia in an attempt to develop the area commercially, it paid little attention to Kosrae. With the expectation of planting some coconut groves to help meet increasing market demands for copra, the major German impact on Kosrae was religious — actively promoting a revival in Christianity that had waned over the previous few decades (Fischer and Fischer 1957:48-49; Ritter 1978:30-31; People 1985:54-55). Demographic impacts of Germany's administration consisted of a few German missionaries in residence; no German administrators resided permanently in Kosrae (Ritter 1978:31). Another major typhoon struck Kosrae in 1905, once more causing widespread destruction as well as killing five islanders (Office of the Chief of Naval Operations 1944:51; People 1985:30). Nevertheless, the period of depopulation clearly was past, and the number of Kosrae residents began a long period of growth (see Table 1.2). Table 1.2 Population of Kosrae During the German Administration for Selected Years
Year Population Source
1880 200 Finch 1893 1888 350 Finch 1893 1890 380 Finch 1893 1895 400 Christian 1899 1899 450 Lewis 1949 1905 516 Sarfert 1919 1918 612 Lewis 1919
Japanese Administration The Japanese period began in 1914, when Japan declared war on Germany and seized the German holdings in Micronesia. After the First World War, all German possessions north of the equator came under a League of Nations mandate under the Japanese control. During the Japanese Administration Kosrae experienced a period of profound economic development. Marine and forestry resources were exploited on a large scale that has not been repeated. In 1935, compulsory education was established for children within reasonable distance to attend. Japanese culture was emphasized in social and economic life. This was the influence of the Japanese Administration. When Germany entered World War I, Japan occupied its Micronesian possessions (the Carolines, Northern Marianas, and Marshall Islands), with a Japanese squadron anchoring off Kosrae in October 1914 (Peattie 1988:43) and an army detachment of fifty enlisted men and three officers landing shortly thereafter (Lewis 1949:43). The League of Nations in 1920 granted the area to Japan as a Class C Mandate (Clyde 1935) 1967; Peattie 1988:56-59). Japanese interest in Kosrae had both commercial and military motives, the latter eventually becoming preeminent. Prior to the war effort, Japan showed little interest in Kosrae. Early in the Japanese Administration only one Japanese national (an army sergeant) resided in the archepelago (Lewis 1949:44; Ritter 1978: 32-33), and with the exception of small agricultural and timber operations, the new administration made little effort to develop Kosrae economically. In 1922, Japan constructed a branch public hospital on Kosrae (Office of the Chief of Naval Operations 1944:97;Peattie 1988:87), and eventually a small community of Japanese (numbering fewer than 100 persons and consisting mostly of Okinawan fishermen and traders) became established on Lelu Island (Peattie 1988:184). Development increased during this period of time. In part, this increase was due to the cash income received from increased copra production, as coconut groves planted during German times reached their productive stage, and in part it was due to Japanese-sponsored efforts to produce materials such as rope needed by the military (Peoples 1985:55). Although strategically located, Kosrae did not figure greatly in Japan's war effort. Despite good harbors and a rugged, defensible interior on the main island, there was no good location for an airfield (Peattie 1988:231-232). Beginning in 1938 and continuing into the 1940s, the military buildup of Kosrae increased markedly (Ritter 1978:33). Japanese military leaders moved their own personnel as well as people from other parts of the Pacific (Ocean Island, Korea, Okinawa, and elsewhere in the Mandated Territory) to Kosrae (People 1985:56-57), promoting agricultural development in the hope of establishing a supply point for Japanese forces stationed in the Marshall Islands. After allied forces cut off supply lines, much of the war
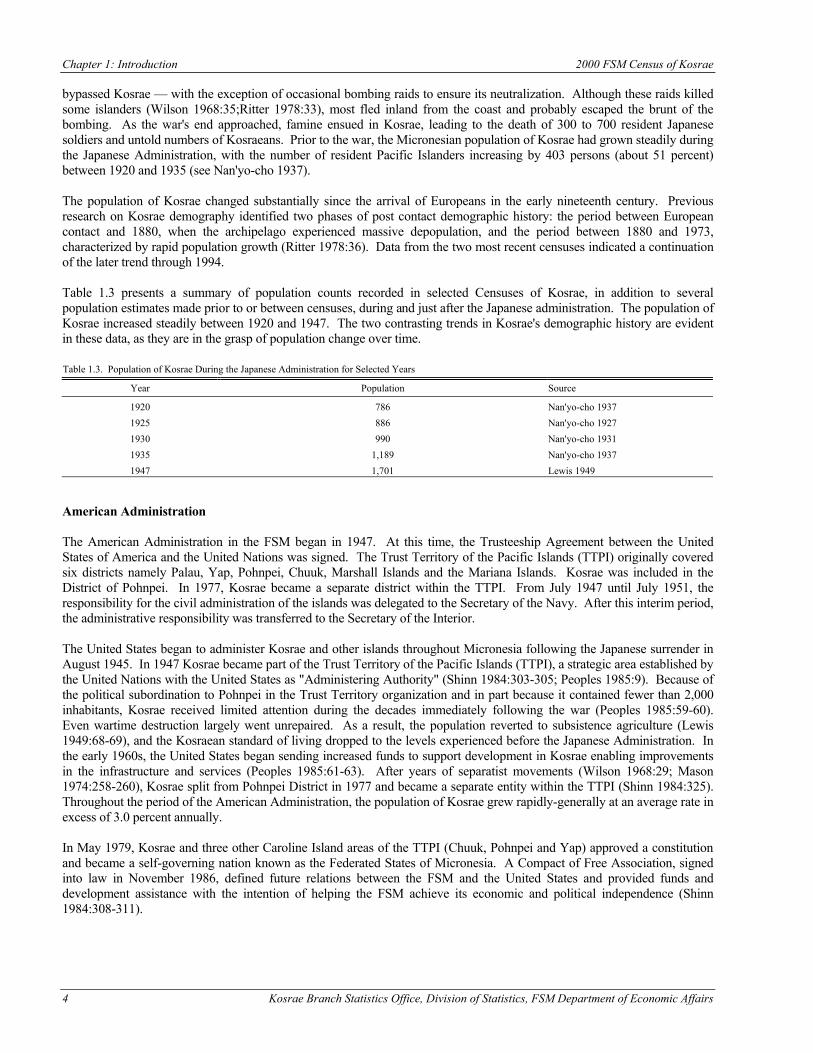
Chapter 1: Introduction 2000 FSM Census of Kosrae
4 Kosrae Branch Statistics Office, Division of Statistics, FSM Department of Economic Affairs
bypassed Kosrae — with the exception of occasional bombing raids to ensure its neutralization. Although these raids killed some islanders (Wilson 1968:35;Ritter 1978:33), most fled inland from the coast and probably escaped the brunt of the bombing. As the war's end approached, famine ensued in Kosrae, leading to the death of 300 to 700 resident Japanese soldiers and untold numbers of Kosraeans. Prior to the war, the Micronesian population of Kosrae had grown steadily during the Japanese Administration, with the number of resident Pacific Islanders increasing by 403 persons (about 51 percent) between 1920 and 1935 (see Nan'yo-cho 1937). The population of Kosrae changed substantially since the arrival of Europeans in the early nineteenth century. Previous research on Kosrae demography identified two phases of post contact demographic history: the period between European contact and 1880, when the archipelago experienced massive depopulation, and the period between 1880 and 1973, characterized by rapid population growth (Ritter 1978:36). Data from the two most recent censuses indicated a continuation of the later trend through 1994. Table 1.3 presents a summary of population counts recorded in selected Censuses of Kosrae, in addition to several population estimates made prior to or between censuses, during and just after the Japanese administration. The population of Kosrae increased steadily between 1920 and 1947. The two contrasting trends in Kosrae's demographic history are evident in these data, as they are in the grasp of population change over time. Table 1.3. Population of Kosrae During the Japanese Administration for Selected Years
Year Population Source
1920 786 Nan'yo-cho 1937 1925 886 Nan'yo-cho 1927 1930 990 Nan'yo-cho 1931 1935 1,189 Nan'yo-cho 1937 1947 1,701 Lewis 1949
American Administration The American Administration in the FSM began in 1947. At this time, the Trusteeship Agreement between the United States of America and the United Nations was signed. The Trust Territory of the Pacific Islands (TTPI) originally covered six districts namely Palau, Yap, Pohnpei, Chuuk, Marshall Islands and the Mariana Islands. Kosrae was included in the District of Pohnpei. In 1977, Kosrae became a separate district within the TTPI. From July 1947 until July 1951, the responsibility for the civil administration of the islands was delegated to the Secretary of the Navy. After this interim period, the administrative responsibility was transferred to the Secretary of the Interior. The United States began to administer Kosrae and other islands throughout Micronesia following the Japanese surrender in August 1945. In 1947 Kosrae became part of the Trust Territory of the Pacific Islands (TTPI), a strategic area established by the United Nations with the United States as "Administering Authority" (Shinn 1984:303-305; Peoples 1985:9). Because of the political subordination to Pohnpei in the Trust Territory organization and in part because it contained fewer than 2,000 inhabitants, Kosrae received limited attention during the decades immediately following the war (Peoples 1985:59-60). Even wartime destruction largely went unrepaired. As a result, the population reverted to subsistence agriculture (Lewis 1949:68-69), and the Kosraean standard of living dropped to the levels experienced before the Japanese Administration. In the early 1960s, the United States began sending increased funds to support development in Kosrae enabling improvements in the infrastructure and services (Peoples 1985:61-63). After years of separatist movements (Wilson 1968:29; Mason 1974:258-260), Kosrae split from Pohnpei District in 1977 and became a separate entity within the TTPI (Shinn 1984:325). Throughout the period of the American Administration, the population of Kosrae grew rapidly-generally at an average rate in excess of 3.0 percent annually. In May 1979, Kosrae and three other Caroline Island areas of the TTPI (Chuuk, Pohnpei and Yap) approved a constitution and became a self-governing nation known as the Federated States of Micronesia. A Compact of Free Association, signed into law in November 1986, defined future relations between the FSM and the United States and provided funds and development assistance with the intention of helping the FSM achieve its economic and political independence (Shinn 1984:308-311).
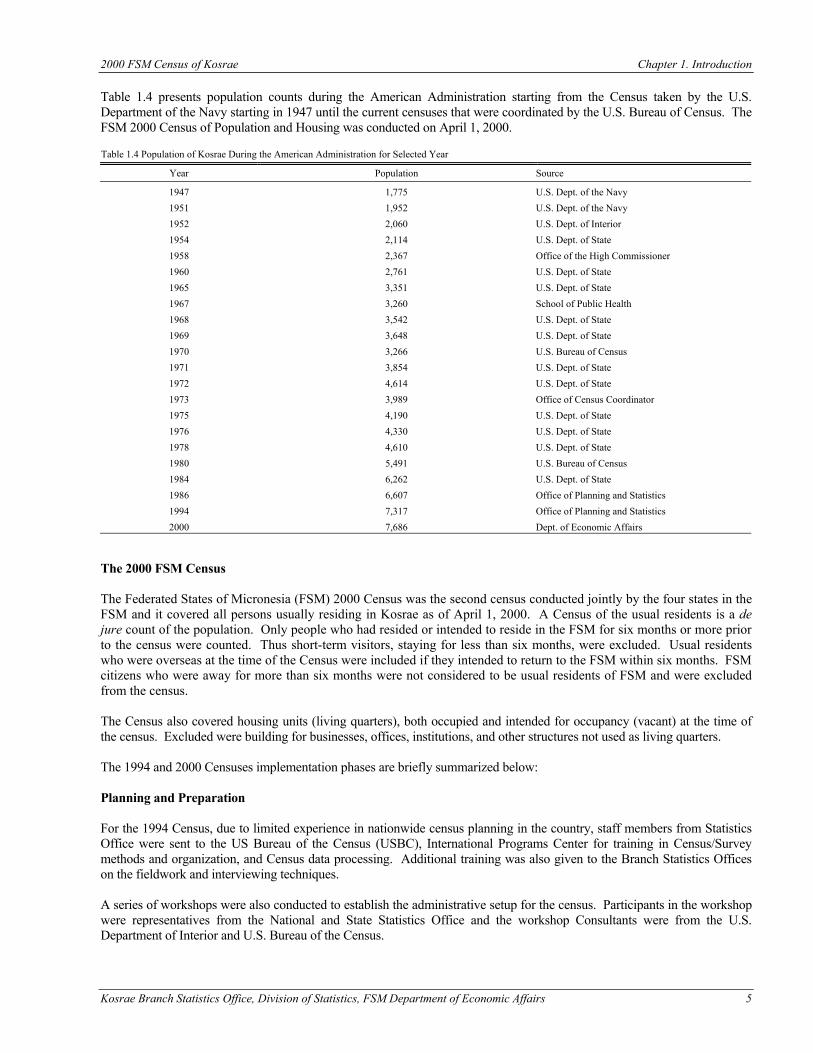
2000 FSM Census of Kosrae Chapter 1. Introduction
Kosrae Branch Statistics Office, Division of Statistics, FSM Department of Economic Affairs 5
Table 1.4 presents population counts during the American Administration starting from the Census taken by the U.S. Department of the Navy starting in 1947 until the current censuses that were coordinated by the U.S. Bureau of Census. The FSM 2000 Census of Population and Housing was conducted on April 1, 2000. Table 1.4 Population of Kosrae During the American Administration for Selected Year
Year Population Source
1947 1,775 U.S. Dept. of the Navy 1951 1,952 U.S. Dept. of the Navy 1952 2,060 U.S. Dept. of Interior 1954 2,114 U.S. Dept. of State 1958 2,367 Office of the High Commissioner 1960 2,761 U.S. Dept. of State 1965 3,351 U.S. Dept. of State 1967 3,260 School of Public Health 1968 3,542 U.S. Dept. of State 1969 3,648 U.S. Dept. of State 1970 3,266 U.S. Bureau of Census 1971 3,854 U.S. Dept. of State 1972 4,614 U.S. Dept. of State 1973 3,989 Office of Census Coordinator 1975 4,190 U.S. Dept. of State 1976 4,330 U.S. Dept. of State 1978 4,610 U.S. Dept. of State 1980 5,491 U.S. Bureau of Census 1984 6,262 U.S. Dept. of State 1986 6,607 Office of Planning and Statistics 1994 7,317 Office of Planning and Statistics 2000 7,686 Dept. of Economic Affairs
The 2000 FSM Census The Federated States of Micronesia (FSM) 2000 Census was the second census conducted jointly by the four states in the FSM and it covered all persons usually residing in Kosrae as of April 1, 2000. A Census of the usual residents is a de jure count of the population. Only people who had resided or intended to reside in the FSM for six months or more prior to the census were counted. Thus short-term visitors, staying for less than six months, were excluded. Usual residents who were overseas at the time of the Census were included if they intended to return to the FSM within six months. FSM citizens who were away for more than six months were not considered to be usual residents of FSM and were excluded from the census. The Census also covered housing units (living quarters), both occupied and intended for occupancy (vacant) at the time of the census. Excluded were building for businesses, offices, institutions, and other structures not used as living quarters. The 1994 and 2000 Censuses implementation phases are briefly summarized below: Planning and Preparation For the 1994 Census, due to limited experience in nationwide census planning in the country, staff members from Statistics Office were sent to the US Bureau of the Census (USBC), International Programs Center for training in Census/Survey methods and organization, and Census data processing. Additional training was also given to the Branch Statistics Offices on the fieldwork and interviewing techniques. A series of workshops were also conducted to establish the administrative setup for the census. Participants in the workshop were representatives from the National and State Statistics Office and the workshop Consultants were from the U.S. Department of Interior and U.S. Bureau of the Census.
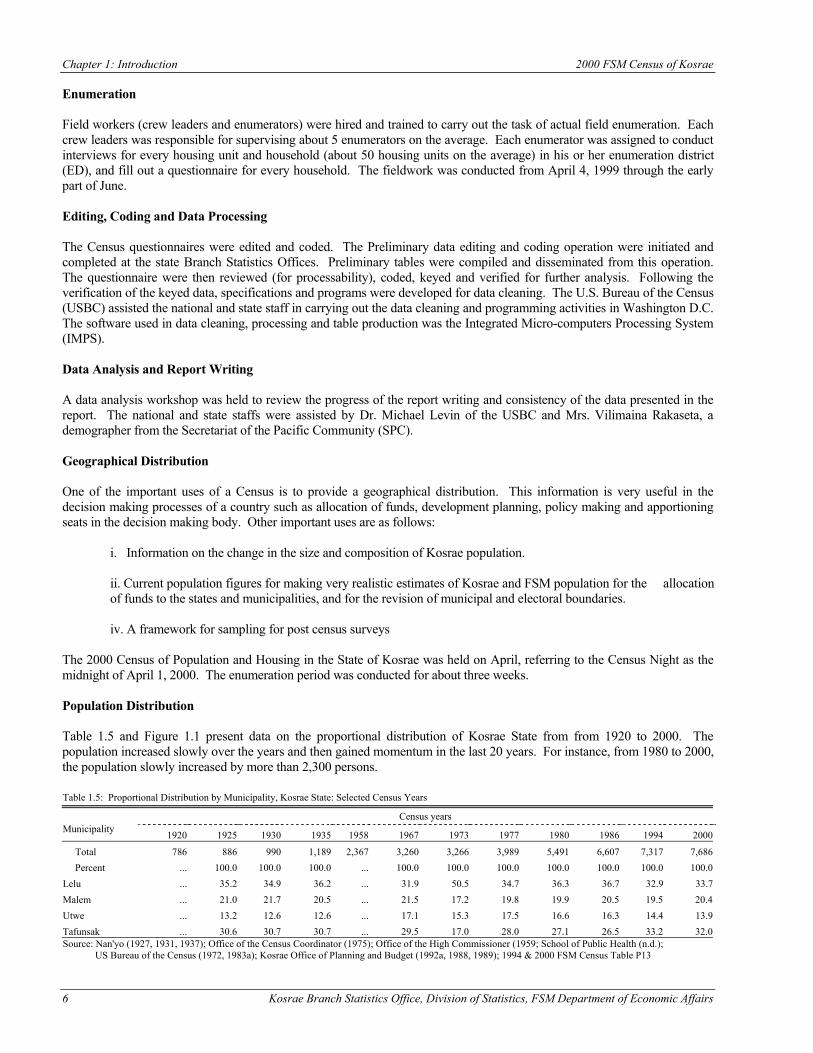
Chapter 1: Introduction 2000 FSM Census of Kosrae
6 Kosrae Branch Statistics Office, Division of Statistics, FSM Department of Economic Affairs
Enumeration Field workers (crew leaders and enumerators) were hired and trained to carry out the task of actual field enumeration. Each crew leaders was responsible for supervising about 5 enumerators on the average. Each enumerator was assigned to conduct interviews for every housing unit and household (about 50 housing units on the average) in his or her enumeration district (ED), and fill out a questionnaire for every household. The fieldwork was conducted from April 4, 1999 through the early part of June. Editing, Coding and Data Processing The Census questionnaires were edited and coded. The Preliminary data editing and coding operation were initiated and completed at the state Branch Statistics Offices. Preliminary tables were compiled and disseminated from this operation. The questionnaire were then reviewed (for processability), coded, keyed and verified for further analysis. Following the verification of the keyed data, specifications and programs were developed for data cleaning. The U.S. Bureau of the Census (USBC) assisted the national and state staff in carrying out the data cleaning and programming activities in Washington D.C. The software used in data cleaning, processing and table production was the Integrated Micro-computers Processing System (IMPS). Data Analysis and Report Writing A data analysis workshop was held to review the progress of the report writing and consistency of the data presented in the report. The national and state staffs were assisted by Dr. Michael Levin of the USBC and Mrs. Vilimaina Rakaseta, a demographer from the Secretariat of the Pacific Community (SPC). Geographical Distribution One of the important uses of a Census is to provide a geographical distribution. This information is very useful in the decision making processes of a country such as allocation of funds, development planning, policy making and apportioning seats in the decision making body. Other important uses are as follows: i. Information on the change in the size and composition of Kosrae population. ii. Current population figures for making very realistic estimates of Kosrae and FSM population for the allocation
of funds to the states and municipalities, and for the revision of municipal and electoral boundaries. iv. A framework for sampling for post census surveys The 2000 Census of Population and Housing in the State of Kosrae was held on April, referring to the Census Night as the midnight of April 1, 2000. The enumeration period was conducted for about three weeks. Population Distribution Table 1.5 and Figure 1.1 present data on the proportional distribution of Kosrae State from from 1920 to 2000. The population increased slowly over the years and then gained momentum in the last 20 years. For instance, from 1980 to 2000, the population slowly increased by more than 2,300 persons. Table 1.5: Proportional Distribution by Municipality, Kosrae State: Selected Census Years
Census years Municipality 1920 1925 1930 1935 1958 1967 1973 1977 1980 1986 1994 2000
Total 786 886 990 1,189 2,367 3,260 3,266 3,989 5,491 6,607 7,317 7,686 Percent ... 100.0 100.0 100.0 ... 100.0 100.0 100.0 100.0 100.0 100.0 100.0 Lelu ... 35.2 34.9 36.2 ... 31.9 50.5 34.7 36.3 36.7 32.9 33.7 Malem ... 21.0 21.7 20.5 ... 21.5 17.2 19.8 19.9 20.5 19.5 20.4 Utwe ... 13.2 12.6 12.6 ... 17.1 15.3 17.5 16.6 16.3 14.4 13.9 Tafunsak ... 30.6 30.7 30.7 ... 29.5 17.0 28.0 27.1 26.5 33.2 32.0 Source: Nan'yo (1927, 1931, 1937); Office of the Census Coordinator (1975); Office of the High Commissioner (1959; School of Public Health (n.d.); US Bureau of the Census (1972, 1983a); Kosrae Office of Planning and Budget (1992a, 1988, 1989); 1994 & 2000 FSM Census Table P13
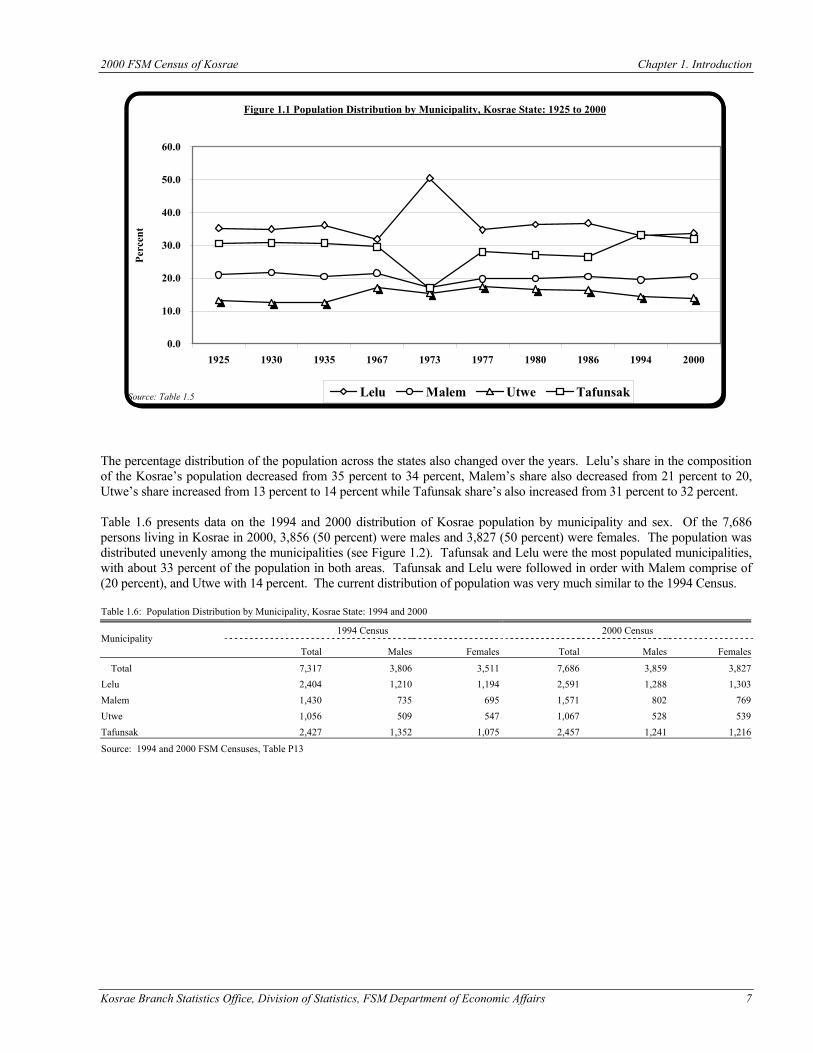
2000 FSM Census of Kosrae Chapter 1. Introduction
Kosrae Branch Statistics Office, Division of Statistics, FSM Department of Economic Affairs 7
The percentage distribution of the population across the states also changed over the years. Lelu’s share in the composition of the Kosrae’s population decreased from 35 percent to 34 percent, Malem’s share also decreased from 21 percent to 20, Utwe’s share increased from 13 percent to 14 percent while Tafunsak share’s also increased from 31 percent to 32 percent. Table 1.6 presents data on the 1994 and 2000 distribution of Kosrae population by municipality and sex. Of the 7,686 persons living in Kosrae in 2000, 3,856 (50 percent) were males and 3,827 (50 percent) were females. The population was distributed unevenly among the municipalities (see Figure 1.2). Tafunsak and Lelu were the most populated municipalities, with about 33 percent of the population in both areas. Tafunsak and Lelu were followed in order with Malem comprise of (20 percent), and Utwe with 14 percent. The current distribution of population was very much similar to the 1994 Census. Table 1.6: Population Distribution by Municipality, Kosrae State: 1994 and 2000
1994 Census 2000 Census Municipality
Total Males Females Total Males Females
Total 7,317 3,806 3,511 7,686 3,859 3,827 Lelu 2,404 1,210 1,194 2,591 1,288 1,303 Malem 1,430 735 695 1,571 802 769 Utwe 1,056 509 547 1,067 528 539 Tafunsak 2,427 1,352 1,075 2,457 1,241 1,216
Source: 1994 and 2000 FSM Censuses, Table P13
Figure 1.1 Population Distribution by Municipality, Kosrae State: 1925 to 2000
0.0
10.0
20.0
30.0
40.0
50.0
60.0
1925 1930 1935 1967 1973 1977 1980 1986 1994 2000
Source: Table 1.5
Perc
ent
Lelu Malem Utwe Tafunsak
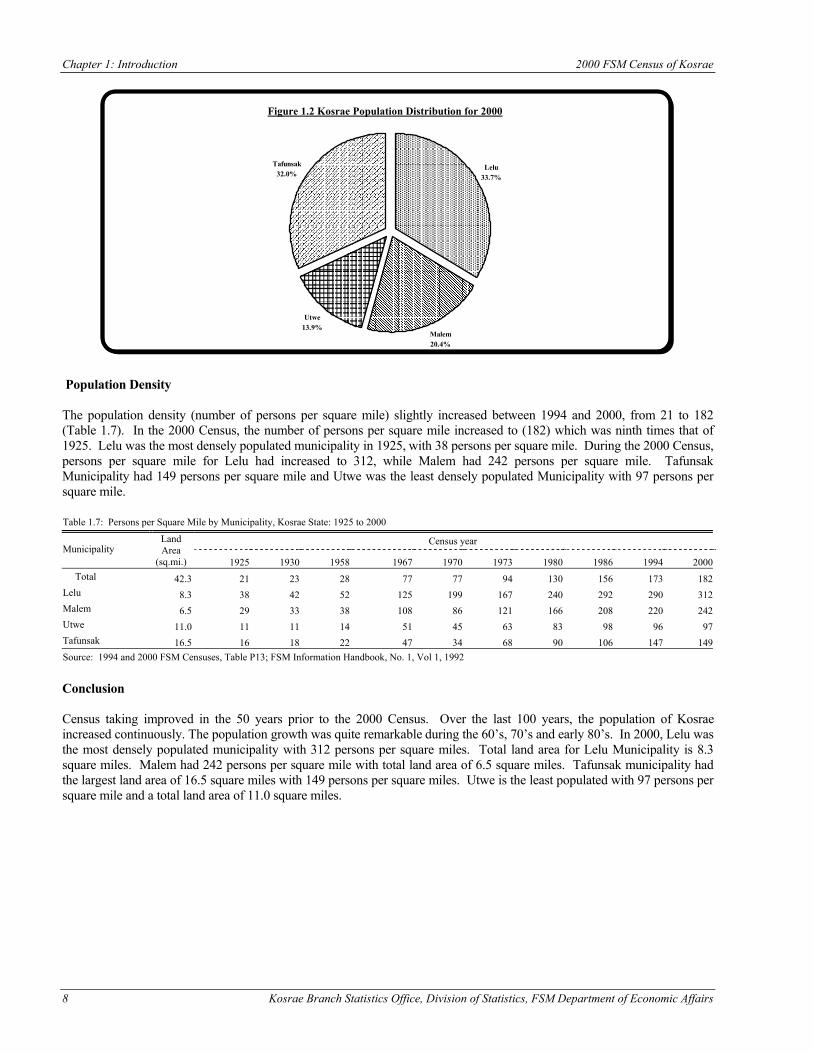
Chapter 1: Introduction 2000 FSM Census of Kosrae
8 Kosrae Branch Statistics Office, Division of Statistics, FSM Department of Economic Affairs
Population Density The population density (number of persons per square mile) slightly increased between 1994 and 2000, from 21 to 182 (Table 1.7). In the 2000 Census, the number of persons per square mile increased to (182) which was ninth times that of 1925. Lelu was the most densely populated municipality in 1925, with 38 persons per square mile. During the 2000 Census, persons per square mile for Lelu had increased to 312, while Malem had 242 persons per square mile. Tafunsak Municipality had 149 persons per square mile and Utwe was the least densely populated Municipality with 97 persons per square mile. Table 1.7: Persons per Square Mile by Municipality, Kosrae State: 1925 to 2000
Census year Municipality
Land Area
(sq.mi.) 1925 1930 1958 1967 1970 1973 1980 1986 1994 2000 Total 42.3 21 23 28 77 77 94 130 156 173 182 Lelu 8.3 38 42 52 125 199 167 240 292 290 312 Malem 6.5 29 33 38 108 86 121 166 208 220 242 Utwe 11.0 11 11 14 51 45 63 83 98 96 97 Tafunsak 16.5 16 18 22 47 34 68 90 106 147 149 Source: 1994 and 2000 FSM Censuses, Table P13; FSM Information Handbook, No. 1, Vol 1, 1992
Conclusion Census taking improved in the 50 years prior to the 2000 Census. Over the last 100 years, the population of Kosrae increased continuously. The population growth was quite remarkable during the 60’s, 70’s and early 80’s. In 2000, Lelu was the most densely populated municipality with 312 persons per square miles. Total land area for Lelu Municipality is 8.3 square miles. Malem had 242 persons per square mile with total land area of 6.5 square miles. Tafunsak municipality had the largest land area of 16.5 square miles with 149 persons per square miles. Utwe is the least populated with 97 persons per square mile and a total land area of 11.0 square miles.
Figure 1.2 Kosrae Population Distribution for 2000
Lelu33.7%
Malem20.4%
Utwe13.9%
Tafunsak32.0%
Kosrae Branch Statistics Office, Division of Statistics, FSM Department of Economic Affairs 9
CHAPTER 2 AGE AND SEX STRUCTURE Introduction The age and sex distribution of a population provides basic information necessary for planning and for analyzing the social and economic characteristics. Age composition helps identify populations for schooling, employment, voting, retirement, and etc. Sex distribution is important for social characteristics, trends in community structure and the population's economic potential. Data Description Age The 2000 Census obtained information on age from the response to the date of birth question and the age reported in questionnaire item 4a and 4b. The age was in completed years as of April 1, 2000. In cases where age was not reported or clearly appeared to be incorrect, the Census Office employees imputed age according to relationship, marital status and other related characteristics of other individuals. Sex Information on sex was asked of all persons in the census. In cases where sex was not reported, Census personnel determined it from the person’s name. Otherwise, sex was imputed according to relationship, marital status and other related variables. Limitation and Comparability. There is no limitation to the 2000 age and sex data. Every Census conducted in Kosrae State collected age and sex data. Analysis of Age and Sex Data Some important measures derived from the age and sex data will be analyzed in this chapter, namely the sex ratio, dependency ratio, intercensal growth rate, and median age. Also, we will look at the changes in the population distribution and age-sex structure and some probable causes for these changes. Population Change and Intercensal Growth One of the most important uses of any census is to throw light on the rate at which the population is growing annually (the intercensal growth). The intercensal growth between 1994 and 2000 falls within the range of 0.9 to 1.1 percent annually (Table 2.1). The current rate places Kosrae among other states having the highest population growth rate in the FSM (Table 2.2). The annual change from 1973 to 1989 was 2.6 percent. The annual growth rate in 1973 to 1980 period was highest at 4.6 percent, then declined to 0.8 percent during 1994 and 2000. In addition, it should be noted that the intercensal growth rate would have been much higher had it not been for the effect of increasing emigration. The annual growth rate varied significantly by age group. In the 30 years prior to the current Census, the growth rate for the very young (0 to 4 age group) declined from 4.4 between 1973 and 1980 to 1.8 between 1994 and 2000. The annual growth rate of the very old (75 and over) age group also declined from 6.9 percent between 1973 to 1980 to 3.5 percent in 1994 to 2000. The difference in growth may be due to the combined effect of a decline in fertility rates (lowering in the growth rate of the young) and declining rates of mortality (increasing the proportion of the old age population).
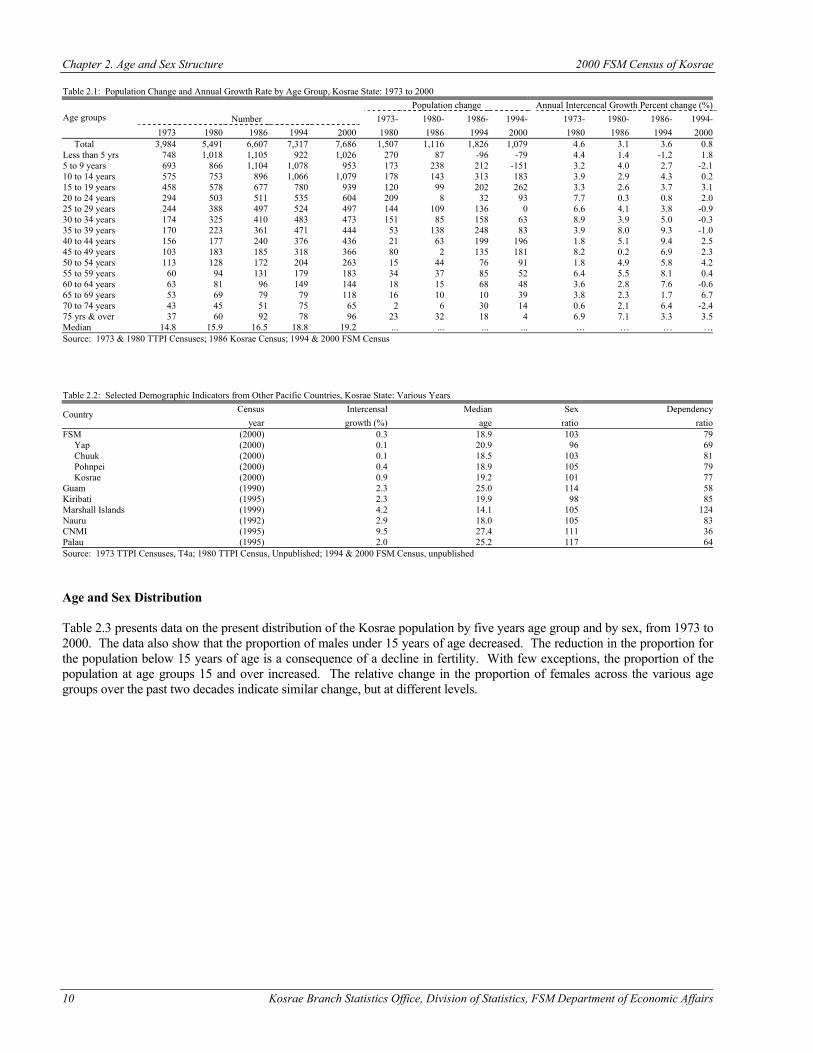
Chapter 2. Age and Sex Structure 2000 FSM Census of Kosrae
10 Kosrae Branch Statistics Office, Division of Statistics, FSM Department of Economic Affairs
Table 2.1: Population Change and Annual Growth Rate by Age Group, Kosrae State: 1973 to 2000 Population change Annual Intercencal Growth Percent change (%)
Number 1973- 1980- 1986- 1994- 1973- 1980- 1986- 1994- Age groups 1973 1980 1986 1994 2000 1980 1986 1994 2000 1980 1986 1994 2000
Total 3,984 5,491 6,607 7,317 7,686 1,507 1,116 1,826 1,079 4.6 3.1 3.6 0.8 Less than 5 yrs 748 1,018 1,105 922 1,026 270 87 -96 -79 4.4 1.4 -1.2 1.8 5 to 9 years 693 866 1,104 1,078 953 173 238 212 -151 3.2 4.0 2.7 -2.1 10 to 14 years 575 753 896 1,066 1,079 178 143 313 183 3.9 2.9 4.3 0.2 15 to 19 years 458 578 677 780 939 120 99 202 262 3.3 2.6 3.7 3.1 20 to 24 years 294 503 511 535 604 209 8 32 93 7.7 0.3 0.8 2.0 25 to 29 years 244 388 497 524 497 144 109 136 0 6.6 4.1 3.8 -0.9 30 to 34 years 174 325 410 483 473 151 85 158 63 8.9 3.9 5.0 -0.3 35 to 39 years 170 223 361 471 444 53 138 248 83 3.9 8.0 9.3 -1.0 40 to 44 years 156 177 240 376 436 21 63 199 196 1.8 5.1 9.4 2.5 45 to 49 years 103 183 185 318 366 80 2 135 181 8.2 0.2 6.9 2.3 50 to 54 years 113 128 172 204 263 15 44 76 91 1.8 4.9 5.8 4.2 55 to 59 years 60 94 131 179 183 34 37 85 52 6.4 5.5 8.1 0.4 60 to 64 years 63 81 96 149 144 18 15 68 48 3.6 2.8 7.6 -0.6 65 to 69 years 53 69 79 79 118 16 10 10 39 3.8 2.3 1.7 6.7 70 to 74 years 43 45 51 75 65 2 6 30 14 0.6 2.1 6.4 -2.4 75 yrs & over 37 60 92 78 96 23 32 18 4 6.9 7.1 3.3 3.5 Median 14.8 15.9 16.5 18.8 19.2 ... ... ... ... … … … … Source: 1973 & 1980 TTPI Censuses; 1986 Kosrae Census; 1994 & 2000 FSM Census Table 2.2: Selected Demographic Indicators from Other Pacific Countries, Kosrae State: Various Years
Census Intercensal Median Sex Dependency Country year growth (%) age ratio ratio
FSM (2000) 0.3 18.9 103 79 Yap (2000) 0.1 20.9 96 69 Chuuk (2000) 0.1 18.5 103 81 Pohnpei (2000) 0.4 18.9 105 79 Kosrae (2000) 0.9 19.2 101 77 Guam (1990) 2.3 25.0 114 58 Kiribati (1995) 2.3 19.9 98 85 Marshall Islands (1999) 4.2 14.1 105 124 Nauru (1992) 2.9 18.0 105 83 CNMI (1995) 9.5 27.4 111 36 Palau (1995) 2.0 25.2 117 64 Source: 1973 TTPI Censuses, T4a; 1980 TTPI Census, Unpublished; 1994 & 2000 FSM Census, unpublished Age and Sex Distribution Table 2.3 presents data on the present distribution of the Kosrae population by five years age group and by sex, from 1973 to 2000. The data also show that the proportion of males under 15 years of age decreased. The reduction in the proportion for the population below 15 years of age is a consequence of a decline in fertility. With few exceptions, the proportion of the population at age groups 15 and over increased. The relative change in the proportion of females across the various age groups over the past two decades indicate similar change, but at different levels.
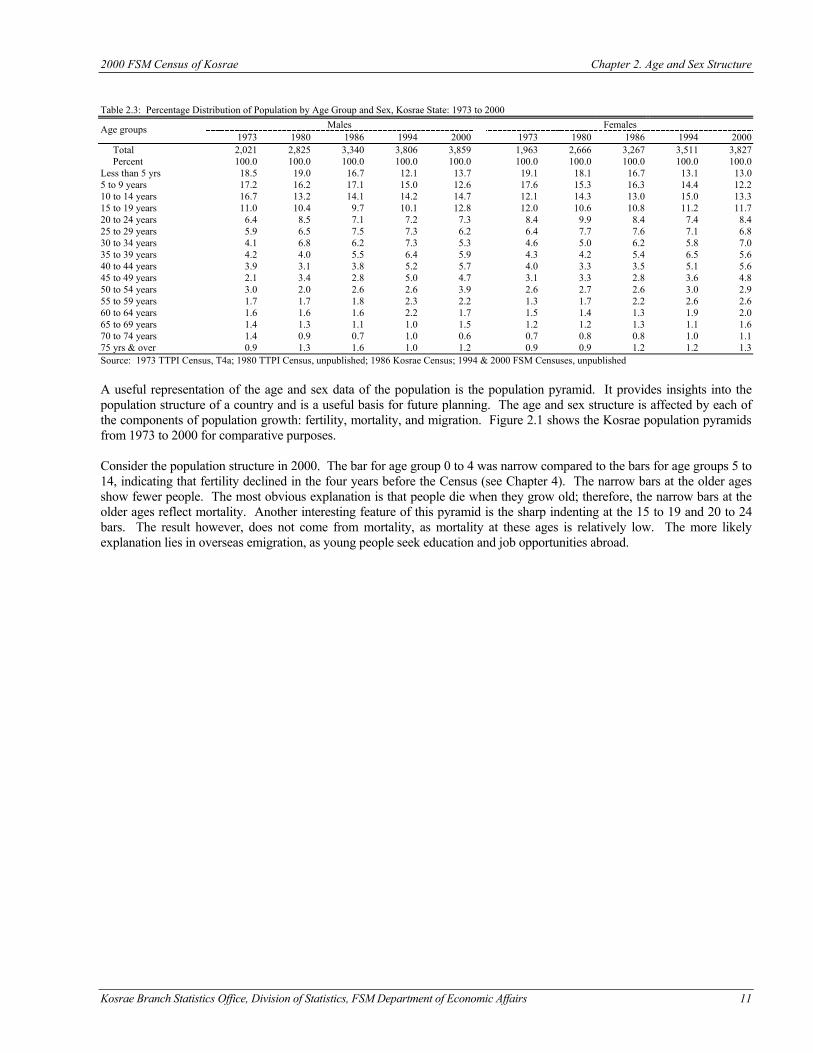
2000 FSM Census of Kosrae Chapter 2. Age and Sex Structure
Kosrae Branch Statistics Office, Division of Statistics, FSM Department of Economic Affairs 11
Table 2.3: Percentage Distribution of Population by Age Group and Sex, Kosrae State: 1973 to 2000
Males Females Age groups 1973 1980 1986 1994 2000 1973 1980 1986 1994 2000
Total 2,021 2,825 3,340 3,806 3,859 1,963 2,666 3,267 3,511 3,827 Percent 100.0 100.0 100.0 100.0 100.0 100.0 100.0 100.0 100.0 100.0 Less than 5 yrs 18.5 19.0 16.7 12.1 13.7 19.1 18.1 16.7 13.1 13.0 5 to 9 years 17.2 16.2 17.1 15.0 12.6 17.6 15.3 16.3 14.4 12.2 10 to 14 years 16.7 13.2 14.1 14.2 14.7 12.1 14.3 13.0 15.0 13.3 15 to 19 years 11.0 10.4 9.7 10.1 12.8 12.0 10.6 10.8 11.2 11.7 20 to 24 years 6.4 8.5 7.1 7.2 7.3 8.4 9.9 8.4 7.4 8.4 25 to 29 years 5.9 6.5 7.5 7.3 6.2 6.4 7.7 7.6 7.1 6.8 30 to 34 years 4.1 6.8 6.2 7.3 5.3 4.6 5.0 6.2 5.8 7.0 35 to 39 years 4.2 4.0 5.5 6.4 5.9 4.3 4.2 5.4 6.5 5.6 40 to 44 years 3.9 3.1 3.8 5.2 5.7 4.0 3.3 3.5 5.1 5.6 45 to 49 years 2.1 3.4 2.8 5.0 4.7 3.1 3.3 2.8 3.6 4.8 50 to 54 years 3.0 2.0 2.6 2.6 3.9 2.6 2.7 2.6 3.0 2.9 55 to 59 years 1.7 1.7 1.8 2.3 2.2 1.3 1.7 2.2 2.6 2.6 60 to 64 years 1.6 1.6 1.6 2.2 1.7 1.5 1.4 1.3 1.9 2.0 65 to 69 years 1.4 1.3 1.1 1.0 1.5 1.2 1.2 1.3 1.1 1.6 70 to 74 years 1.4 0.9 0.7 1.0 0.6 0.7 0.8 0.8 1.0 1.1 75 yrs & over 0.9 1.3 1.6 1.0 1.2 0.9 0.9 1.2 1.2 1.3 Source: 1973 TTPI Census, T4a; 1980 TTPI Census, unpublished; 1986 Kosrae Census; 1994 & 2000 FSM Censuses, unpublished A useful representation of the age and sex data of the population is the population pyramid. It provides insights into the population structure of a country and is a useful basis for future planning. The age and sex structure is affected by each of the components of population growth: fertility, mortality, and migration. Figure 2.1 shows the Kosrae population pyramids from 1973 to 2000 for comparative purposes. Consider the population structure in 2000. The bar for age group 0 to 4 was narrow compared to the bars for age groups 5 to 14, indicating that fertility declined in the four years before the Census (see Chapter 4). The narrow bars at the older ages show fewer people. The most obvious explanation is that people die when they grow old; therefore, the narrow bars at the older ages reflect mortality. Another interesting feature of this pyramid is the sharp indenting at the 15 to 19 and 20 to 24 bars. The result however, does not come from mortality, as mortality at these ages is relatively low. The more likely explanation lies in overseas emigration, as young people seek education and job opportunities abroad.
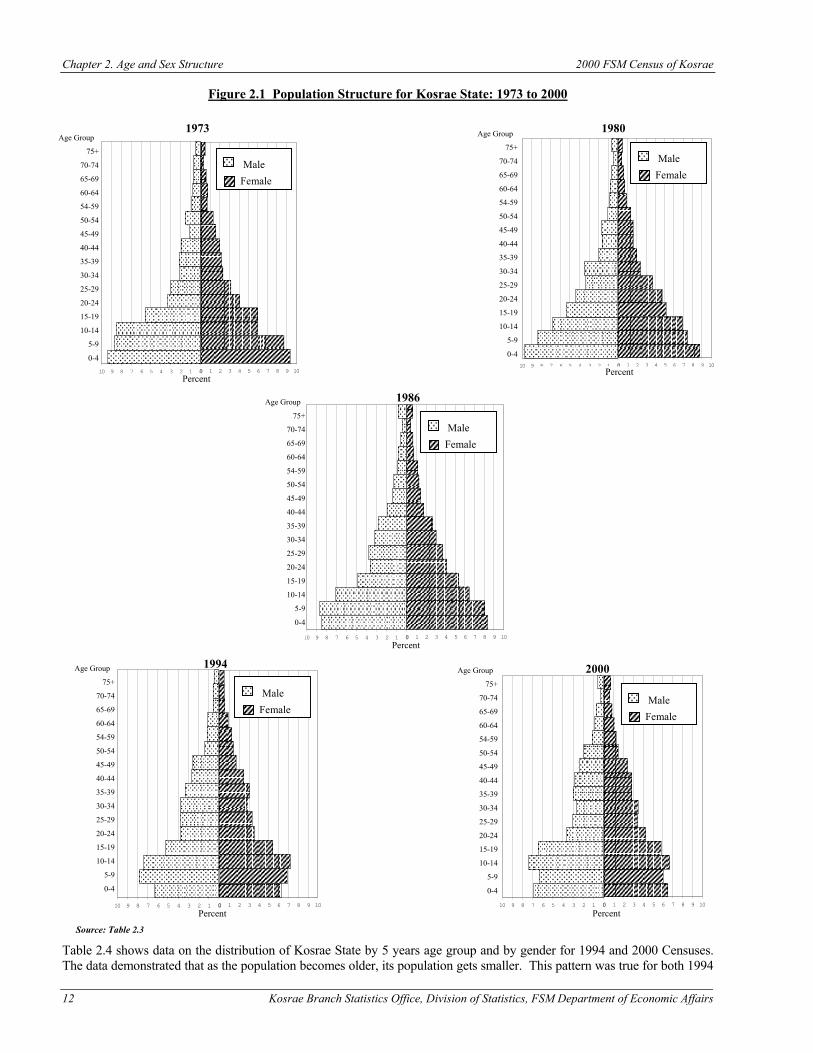
Chapter 2. Age and Sex Structure 2000 FSM Census of Kosrae
12 Kosrae Branch Statistics Office, Division of Statistics, FSM Department of Economic Affairs
0 1 2 3 4 5 6 7 8 9 10012345678910
2000 Age Group
75+
70-74
65-69
60-64
54-59
50-54
45-49
40-44
35-39
30-34
25-29
20-24
15-19
10-14
5-9
0-4
Percent
Male Female
0 1 2 3 4 5 6 7 8 9 10012345678910
Age Group
75+
70-74
65-69
60-64
54-59
50-54
45-49
40-44
35-39
30-34
25-29
20-24
15-19
10-14
5-9
0-4
1973
Male Female
Percent 0 1 2 3 4 5 6 7 8 9 10012345678910
Male Female
Age Group
75+
70-74
65-69
60-64
54-59
50-54
45-49
40-44
35-39
30-34
25-29
20-24
15-19
10-14
5-9
0-4
1980
Percent
0 1 2 3 4 5 6 7 8 9 10012345678910
1994 Age Group
75+
70-74
65-69
60-64
54-59
50-54
45-49
40-44
35-39
30-34
25-29
20-24
15-19
10-14
5-9
0-4
Percent
Male Female
0 1 2 3 4 5 6 7 8 9 10012345678910
1986 Age Group
75+
70-74
65-69
60-64
54-59
50-54
45-49
40-44
35-39
30-34
25-29
20-24
15-19
10-14
5-9
0-4
Percent
Male Female
Figure 2.1 Population Structure for Kosrae State: 1973 to 2000 Table 2.4 shows data on the distribution of Kosrae State by 5 years age group and by gender for 1994 and 2000 Censuses. The data demonstrated that as the population becomes older, its population gets smaller. This pattern was true for both 1994
Source: Table 2.3
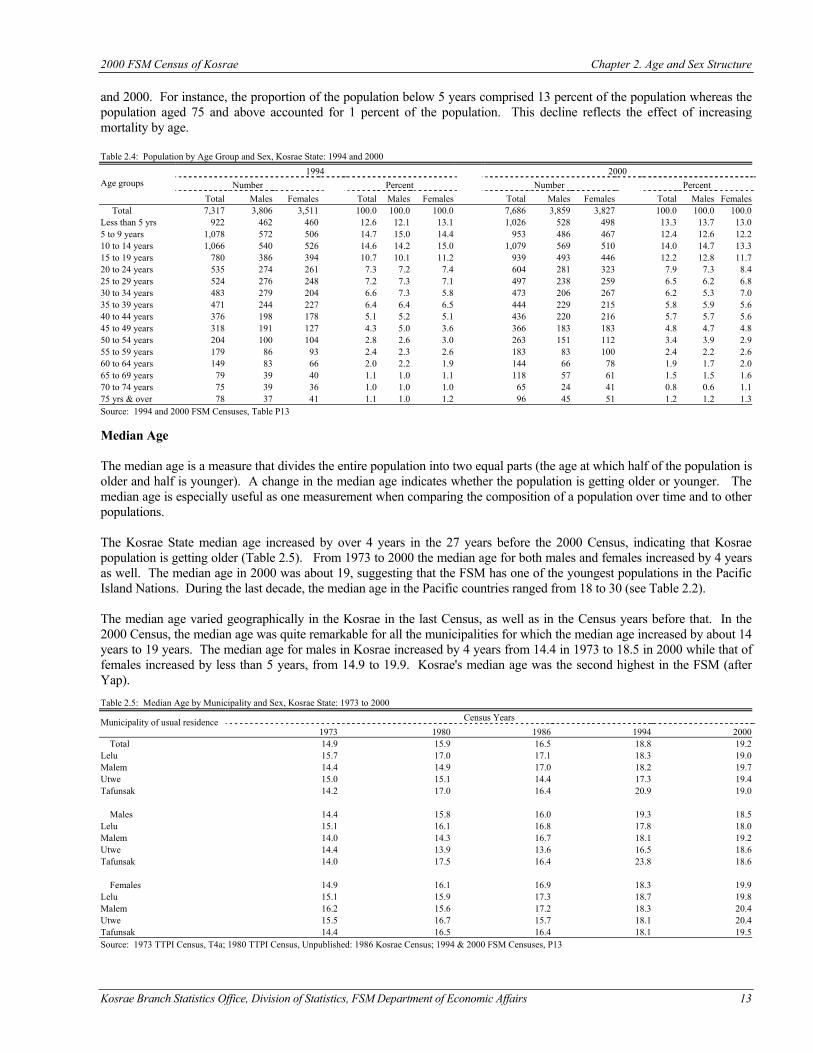
2000 FSM Census of Kosrae Chapter 2. Age and Sex Structure
Kosrae Branch Statistics Office, Division of Statistics, FSM Department of Economic Affairs 13
and 2000. For instance, the proportion of the population below 5 years comprised 13 percent of the population whereas the population aged 75 and above accounted for 1 percent of the population. This decline reflects the effect of increasing mortality by age. Table 2.4: Population by Age Group and Sex, Kosrae State: 1994 and 2000
1994 2000 Number Percent Number Percent Age groups
Total Males Females Total Males Females Total Males Females Total Males Females Total 7,317 3,806 3,511 100.0 100.0 100.0 7,686 3,859 3,827 100.0 100.0 100.0 Less than 5 yrs 922 462 460 12.6 12.1 13.1 1,026 528 498 13.3 13.7 13.0 5 to 9 years 1,078 572 506 14.7 15.0 14.4 953 486 467 12.4 12.6 12.2 10 to 14 years 1,066 540 526 14.6 14.2 15.0 1,079 569 510 14.0 14.7 13.3 15 to 19 years 780 386 394 10.7 10.1 11.2 939 493 446 12.2 12.8 11.7 20 to 24 years 535 274 261 7.3 7.2 7.4 604 281 323 7.9 7.3 8.4 25 to 29 years 524 276 248 7.2 7.3 7.1 497 238 259 6.5 6.2 6.8 30 to 34 years 483 279 204 6.6 7.3 5.8 473 206 267 6.2 5.3 7.0 35 to 39 years 471 244 227 6.4 6.4 6.5 444 229 215 5.8 5.9 5.6 40 to 44 years 376 198 178 5.1 5.2 5.1 436 220 216 5.7 5.7 5.6 45 to 49 years 318 191 127 4.3 5.0 3.6 366 183 183 4.8 4.7 4.8 50 to 54 years 204 100 104 2.8 2.6 3.0 263 151 112 3.4 3.9 2.9 55 to 59 years 179 86 93 2.4 2.3 2.6 183 83 100 2.4 2.2 2.6 60 to 64 years 149 83 66 2.0 2.2 1.9 144 66 78 1.9 1.7 2.0 65 to 69 years 79 39 40 1.1 1.0 1.1 118 57 61 1.5 1.5 1.6 70 to 74 years 75 39 36 1.0 1.0 1.0 65 24 41 0.8 0.6 1.1 75 yrs & over 78 37 41 1.1 1.0 1.2 96 45 51 1.2 1.2 1.3 Source: 1994 and 2000 FSM Censuses, Table P13 Median Age The median age is a measure that divides the entire population into two equal parts (the age at which half of the population is older and half is younger). A change in the median age indicates whether the population is getting older or younger. The median age is especially useful as one measurement when comparing the composition of a population over time and to other populations. The Kosrae State median age increased by over 4 years in the 27 years before the 2000 Census, indicating that Kosrae population is getting older (Table 2.5). From 1973 to 2000 the median age for both males and females increased by 4 years as well. The median age in 2000 was about 19, suggesting that the FSM has one of the youngest populations in the Pacific Island Nations. During the last decade, the median age in the Pacific countries ranged from 18 to 30 (see Table 2.2). The median age varied geographically in the Kosrae in the last Census, as well as in the Census years before that. In the 2000 Census, the median age was quite remarkable for all the municipalities for which the median age increased by about 14 years to 19 years. The median age for males in Kosrae increased by 4 years from 14.4 in 1973 to 18.5 in 2000 while that of females increased by less than 5 years, from 14.9 to 19.9. Kosrae's median age was the second highest in the FSM (after Yap). Table 2.5: Median Age by Municipality and Sex, Kosrae State: 1973 to 2000
Census Years Municipality of usual residence 1973 1980 1986 1994 2000
Total 14.9 15.9 16.5 18.8 19.2 Lelu 15.7 17.0 17.1 18.3 19.0 Malem 14.4 14.9 17.0 18.2 19.7 Utwe 15.0 15.1 14.4 17.3 19.4 Tafunsak 14.2 17.0 16.4 20.9 19.0 Males 14.4 15.8 16.0 19.3 18.5 Lelu 15.1 16.1 16.8 17.8 18.0 Malem 14.0 14.3 16.7 18.1 19.2 Utwe 14.4 13.9 13.6 16.5 18.6 Tafunsak 14.0 17.5 16.4 23.8 18.6 Females 14.9 16.1 16.9 18.3 19.9 Lelu 15.1 15.9 17.3 18.7 19.8 Malem 16.2 15.6 17.2 18.3 20.4 Utwe 15.5 16.7 15.7 18.1 20.4 Tafunsak 14.4 16.5 16.4 18.1 19.5 Source: 1973 TTPI Census, T4a; 1980 TTPI Census, Unpublished: 1986 Kosrae Census; 1994 & 2000 FSM Censuses, P13
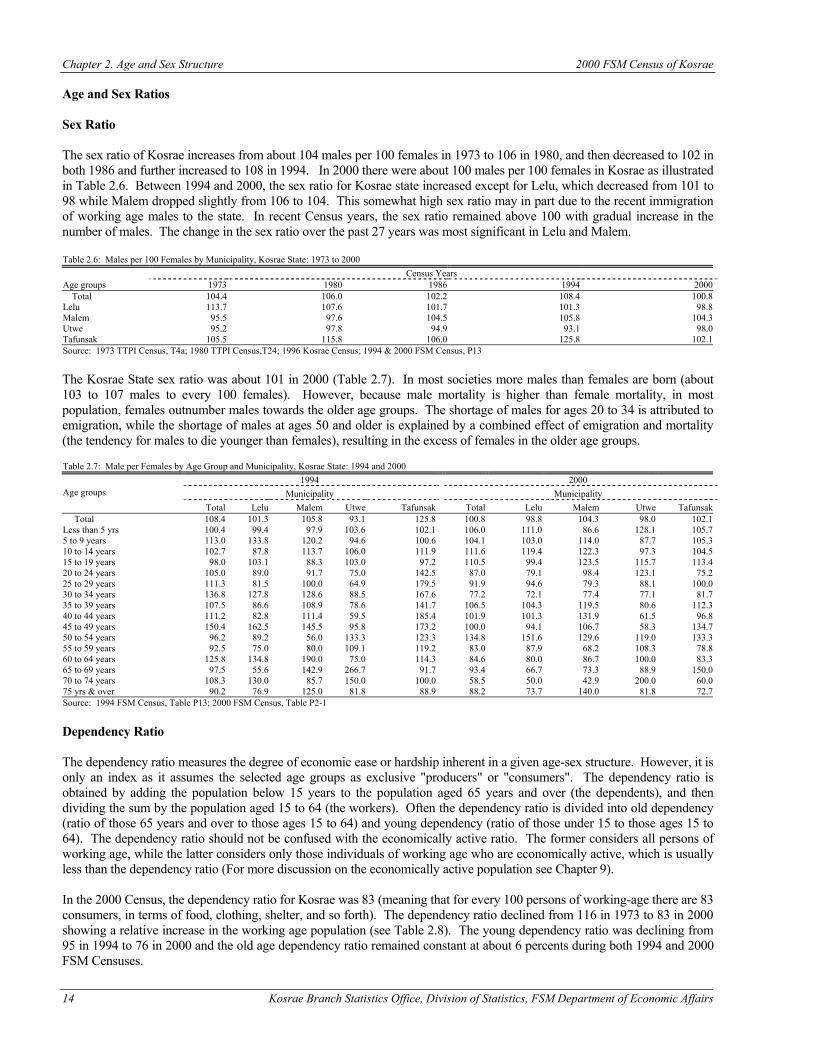
Chapter 2. Age and Sex Structure 2000 FSM Census of Kosrae
14 Kosrae Branch Statistics Office, Division of Statistics, FSM Department of Economic Affairs
Age and Sex Ratios Sex Ratio The sex ratio of Kosrae increases from about 104 males per 100 females in 1973 to 106 in 1980, and then decreased to 102 in both 1986 and further increased to 108 in 1994. In 2000 there were about 100 males per 100 females in Kosrae as illustrated in Table 2.6. Between 1994 and 2000, the sex ratio for Kosrae state increased except for Lelu, which decreased from 101 to 98 while Malem dropped slightly from 106 to 104. This somewhat high sex ratio may in part due to the recent immigration of working age males to the state. In recent Census years, the sex ratio remained above 100 with gradual increase in the number of males. The change in the sex ratio over the past 27 years was most significant in Lelu and Malem. Table 2.6: Males per 100 Females by Municipality, Kosrae State: 1973 to 2000 Census Years Age groups 1973 1980 1986 1994 2000 Total 104.4 106.0 102.2 108.4 100.8 Lelu 113.7 107.6 101.7 101.3 98.8 Malem 95.5 97.6 104.5 105.8 104.3 Utwe 95.2 97.8 94.9 93.1 98.0 Tafunsak 105.5 115.8 106.0 125.8 102.1 Source: 1973 TTPI Census, T4a; 1980 TTPI Census,T24; 1996 Kosrae Census; 1994 & 2000 FSM Census, P13 The Kosrae State sex ratio was about 101 in 2000 (Table 2.7). In most societies more males than females are born (about 103 to 107 males to every 100 females). However, because male mortality is higher than female mortality, in most population, females outnumber males towards the older age groups. The shortage of males for ages 20 to 34 is attributed to emigration, while the shortage of males at ages 50 and older is explained by a combined effect of emigration and mortality (the tendency for males to die younger than females), resulting in the excess of females in the older age groups. Table 2.7: Male per Females by Age Group and Municipality, Kosrae State: 1994 and 2000
1994 2000 Municipality Municipality Age groups
Total Lelu Malem Utwe Tafunsak Total Lelu Malem Utwe Tafunsak Total 108.4 101.3 105.8 93.1 125.8 100.8 98.8 104.3 98.0 102.1 Less than 5 yrs 100.4 99.4 97.9 103.6 102.1 106.0 111.0 86.6 128.1 105.7 5 to 9 years 113.0 133.8 120.2 94.6 100.6 104.1 103.0 114.0 87.7 105.3 10 to 14 years 102.7 87.8 113.7 106.0 111.9 111.6 119.4 122.3 97.3 104.5 15 to 19 years 98.0 103.1 88.3 103.0 97.2 110.5 99.4 123.5 115.7 113.4 20 to 24 years 105.0 89.0 91.7 75.0 142.5 87.0 79.1 98.4 123.1 75.2 25 to 29 years 111.3 81.5 100.0 64.9 179.5 91.9 94.6 79.3 88.1 100.0 30 to 34 years 136.8 127.8 128.6 88.5 167.6 77.2 72.1 77.4 77.1 81.7 35 to 39 years 107.5 86.6 108.9 78.6 141.7 106.5 104.3 119.5 80.6 112.3 40 to 44 years 111.2 82.8 111.4 59.5 185.4 101.9 101.3 131.9 61.5 96.8 45 to 49 years 150.4 162.5 145.5 95.8 173.2 100.0 94.1 106.7 58.3 134.7 50 to 54 years 96.2 89.2 56.0 133.3 123.3 134.8 151.6 129.6 119.0 133.3 55 to 59 years 92.5 75.0 80.0 109.1 119.2 83.0 87.9 68.2 108.3 78.8 60 to 64 years 125.8 134.8 190.0 75.0 114.3 84.6 80.0 86.7 100.0 83.3 65 to 69 years 97.5 55.6 142.9 266.7 91.7 93.4 66.7 73.3 88.9 150.0 70 to 74 years 108.3 130.0 85.7 150.0 100.0 58.5 50.0 42.9 200.0 60.0 75 yrs & over 90.2 76.9 125.0 81.8 88.9 88.2 73.7 140.0 81.8 72.7 Source: 1994 FSM Census, Table P13; 2000 FSM Census, Table P2-1 Dependency Ratio The dependency ratio measures the degree of economic ease or hardship inherent in a given age-sex structure. However, it is only an index as it assumes the selected age groups as exclusive "producers" or "consumers". The dependency ratio is obtained by adding the population below 15 years to the population aged 65 years and over (the dependents), and then dividing the sum by the population aged 15 to 64 (the workers). Often the dependency ratio is divided into old dependency (ratio of those 65 years and over to those ages 15 to 64) and young dependency (ratio of those under 15 to those ages 15 to 64). The dependency ratio should not be confused with the economically active ratio. The former considers all persons of working age, while the latter considers only those individuals of working age who are economically active, which is usually less than the dependency ratio (For more discussion on the economically active population see Chapter 9). In the 2000 Census, the dependency ratio for Kosrae was 83 (meaning that for every 100 persons of working-age there are 83 consumers, in terms of food, clothing, shelter, and so forth). The dependency ratio declined from 116 in 1973 to 83 in 2000 showing a relative increase in the working age population (see Table 2.8). The young dependency ratio was declining from 95 in 1994 to 76 in 2000 and the old age dependency ratio remained constant at about 6 percents during both 1994 and 2000 FSM Censuses.
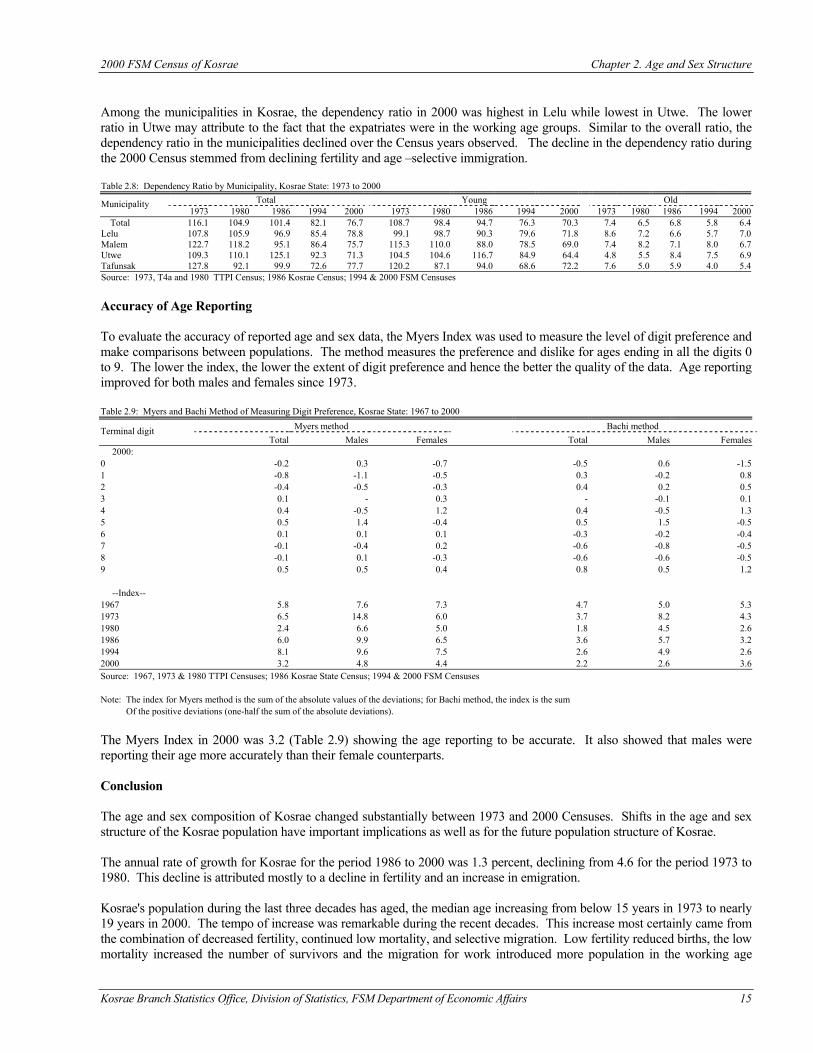
2000 FSM Census of Kosrae Chapter 2. Age and Sex Structure
Kosrae Branch Statistics Office, Division of Statistics, FSM Department of Economic Affairs 15
Among the municipalities in Kosrae, the dependency ratio in 2000 was highest in Lelu while lowest in Utwe. The lower ratio in Utwe may attribute to the fact that the expatriates were in the working age groups. Similar to the overall ratio, the dependency ratio in the municipalities declined over the Census years observed. The decline in the dependency ratio during the 2000 Census stemmed from declining fertility and age –selective immigration. Table 2.8: Dependency Ratio by Municipality, Kosrae State: 1973 to 2000
Total Young Old Municipality 1973 1980 1986 1994 2000 1973 1980 1986 1994 2000 1973 1980 1986 1994 2000
Total 116.1 104.9 101.4 82.1 76.7 108.7 98.4 94.7 76.3 70.3 7.4 6.5 6.8 5.8 6.4 Lelu 107.8 105.9 96.9 85.4 78.8 99.1 98.7 90.3 79.6 71.8 8.6 7.2 6.6 5.7 7.0 Malem 122.7 118.2 95.1 86.4 75.7 115.3 110.0 88.0 78.5 69.0 7.4 8.2 7.1 8.0 6.7 Utwe 109.3 110.1 125.1 92.3 71.3 104.5 104.6 116.7 84.9 64.4 4.8 5.5 8.4 7.5 6.9 Tafunsak 127.8 92.1 99.9 72.6 77.7 120.2 87.1 94.0 68.6 72.2 7.6 5.0 5.9 4.0 5.4 Source: 1973, T4a and 1980 TTPI Census; 1986 Kosrae Census; 1994 & 2000 FSM Censuses Accuracy of Age Reporting To evaluate the accuracy of reported age and sex data, the Myers Index was used to measure the level of digit preference and make comparisons between populations. The method measures the preference and dislike for ages ending in all the digits 0 to 9. The lower the index, the lower the extent of digit preference and hence the better the quality of the data. Age reporting improved for both males and females since 1973. Table 2.9: Myers and Bachi Method of Measuring Digit Preference, Kosrae State: 1967 to 2000
Myers method Bachi method Terminal digit Total Males Females Total Males Females
2000: 0 -0.2 0.3 -0.7 -0.5 0.6 -1.5 1 -0.8 -1.1 -0.5 0.3 -0.2 0.8 2 -0.4 -0.5 -0.3 0.4 0.2 0.5 3 0.1 - 0.3 - -0.1 0.1 4 0.4 -0.5 1.2 0.4 -0.5 1.3 5 0.5 1.4 -0.4 0.5 1.5 -0.5 6 0.1 0.1 0.1 -0.3 -0.2 -0.4 7 -0.1 -0.4 0.2 -0.6 -0.8 -0.5 8 -0.1 0.1 -0.3 -0.6 -0.6 -0.5 9 0.5 0.5 0.4 0.8 0.5 1.2 --Index-- 1967 5.8 7.6 7.3 4.7 5.0 5.3 1973 6.5 14.8 6.0 3.7 8.2 4.3 1980 2.4 6.6 5.0 1.8 4.5 2.6 1986 6.0 9.9 6.5 3.6 5.7 3.2 1994 8.1 9.6 7.5 2.6 4.9 2.6 2000 3.2 4.8 4.4 2.2 2.6 3.6 Source: 1967, 1973 & 1980 TTPI Censuses; 1986 Kosrae State Census; 1994 & 2000 FSM Censuses Note: The index for Myers method is the sum of the absolute values of the deviations; for Bachi method, the index is the sum Of the positive deviations (one-half the sum of the absolute deviations). The Myers Index in 2000 was 3.2 (Table 2.9) showing the age reporting to be accurate. It also showed that males were reporting their age more accurately than their female counterparts. Conclusion The age and sex composition of Kosrae changed substantially between 1973 and 2000 Censuses. Shifts in the age and sex structure of the Kosrae population have important implications as well as for the future population structure of Kosrae. The annual rate of growth for Kosrae for the period 1986 to 2000 was 1.3 percent, declining from 4.6 for the period 1973 to 1980. This decline is attributed mostly to a decline in fertility and an increase in emigration. Kosrae's population during the last three decades has aged, the median age increasing from below 15 years in 1973 to nearly 19 years in 2000. The tempo of increase was remarkable during the recent decades. This increase most certainly came from the combination of decreased fertility, continued low mortality, and selective migration. Low fertility reduced births, the low mortality increased the number of survivors and the migration for work introduced more population in the working age
Chapter 2. Age and Sex Structure 2000 FSM Census of Kosrae
16 Kosrae Branch Statistics Office, Division of Statistics, FSM Department of Economic Affairs
group. The change in the population structure was mainly accounted for by declining fertility. The distribution of males and females was fairly even in Lelu and Malem municipalities. The male population outnumbered the female population in Tafunsak while females outnumbered males in Utwe in Kosrae, in 2000. Unlike in the previous Censuses, the overall sex ratio for 2000 showed an excess of males in the population (with 101 males per 100 females). This was mainly because of the male- dominated foreign workers in the State, in 2000 than in any other census year. The dependency ratio for Kosrae was 83, which means for every 100 persons in the working age group (the population aged 15-64 years) looked after 83 children (aged 0-14 years) and elderly (aged 65 years and over). Although the decrease in the dependency ratio can be considered a positive change (more people of working-age and fewer to support), it also implies a greater need for employment.
Kosrae Branch Statistics Office, Division of Statistics, FSM Department of Economic Affairs 17
CHAPTER 3 HOUSEHOLDS AND MARITAL STATUS Introduction This chapter presents a summary of analysis on size and composition of households and families in the state. The household and family structures in the Kosrae, in most cases, are similar. The determining factor for household is sharing meals by a group of people living together. But for family, the determining factor is relationship by blood, marriage, or adoption. In Kosrae, most people live together because they are related. Households with unrelated members are usually found in the town centers where unrelated people may share housing temporarily to minimize financial burden. Extended families and households consisting of a householder, perhaps a spouse, children, parents, grandparents, grandchildren, siblings and other relatives have always been the norm in Kosrae State. By 2000, extended families had become somewhat less common, as fertility and family size decreased, more people became employed in the cash (rather than subsistence) economy, and increasing numbers of immigrants arrived with different family structures. Demographic changes and socioeconomic shifts affect changes in household and family structure. Since marital status affects the households and family structure it is included in this chapter. As married couples tend to have their own family, marriages increase the number of households and families in the state. The data on marital status provided in this chapter examine the change in the marital status and the effects on the demographic and other socio-cultural pattern. Definition Household Type and Relationship Question 2 on the 2000 Census questionnaire asked for relationship of every household member to the householder. The major relationships were: householder, husband/wife, natural son/daughter, adopted son/daughter, brother/sister, father/mother, other relatives, and non-relatives. The other relative category was later re-coded to include son/dauther in-law, father/mother in-law, niece/nephew, grandparent, uncle/aunt, and cousin. Household was defined during the census as a person or a group of people living together in a housing unit and sharing meals together. These people did not need to be related but as long as they shared their meals, they were considered a household for census purposes. A housing unit was a house, apartment, mobile home, group of rooms, or single room that was occupied as a separate living quarters. A unit may have had more than one household if the occupants did not share their meals together. There were two types of living quarters used in the census: regular household and group quarters. Regular households were those where the occupants may have been a single family, one person living alone, two or more families living together, or any other group of related or unrelated persons who shared living arrangements. Group quarters were those places where people either lived or stayed other than their usual house or apartment such as schools, hotels or motels, hospitals, prisons, etc. Persons per household were obtained by dividing the number of persons in households by the number of households (householders). In cases where persons in households are classified by ethnic origin or race, persons in the household are classified by the ethnic origin or race of the householder rather than the ethnic origin or race of each individual. Persons per family were obtained by dividing the number of persons in family household (householders where two or more members were related to the householder) by the number family households. Householder and relationship to householder were defined as follows: - Householder -- the person (or one of the persons) in whose name was the owner, being bought, or rented
and who was listed as person 1 on the census questionnaire. If there was no such person in the household, any adult household member 15 years old and over could be designed as the householder. Households were classified by type according to the sex of the householder and the presence of relatives to the householder. The census distinguished two types of householders: a "family householder" and a "nonfamily householder." A family householder and all persons in the household related to him or her
Chapter 3. Households, Families and Marital Status 2000 FSM Census of Kosrae
Kosrae Branch Statistics Office, Division of Statistics, FSM Department of Economic Affairs 18
were family members. A nonfamily householder was a householder living alone or with nonrelatives only.
- Spouse -- a person married to and living with a householder. This category included persons in formal
marriages, as well persons in common-law marriages. The number of spouses was equal to the number of "married-couple families" or married couple households." The number of spouses, however, generally be less than half the number of married persons with spouse present, since more than one married couple could in a household but only spouses of householders were specifically identified as spouse. The number of spouses, however, generally was less than half the number of married persons with spouse present, since more than one married couple could live in a household but only spouses of householders were specifically identified as spouse. The number of married persons with spouse present included married-couple subfamilies and married-couple families.
- Child -- sons or daughters by birth, stepchildren, or adopted children of the householder, regardless of the
child's age or marital status. The category excluded sons-in-law and daughters-in-law. - Natural Born or adopted son/daughter -- a son or daughter by birth, regardless of the age of the child.
This category also included sons or daughters of the householder by legal adoption, regardless of the age of the child. If a householder had legally adopted a stepson or stepdaughter, the child still was classified as a stepchild.
- Stepson/Stepdaughter -- a son or daughter of the householder through marriage but not by birth. If the
householder had legally adopted a stepson or stepdaughter, the child was still classified as a stepchild. - Own Child -- a never-married child under 18 years who was a son or a daughter by birth, a stepchild, or an
adopted child of the householder. In certain tabulations, own children were further classified as living with two parents or with one parent only. Own children of the householder living with two parents by definition were found only in married-couple families. In a subfamily, an own child was a never-married child under 18 years of age who was a son, daughter, stepchild, or an adopted child of a mother in a mother-child subfamily, a father in a father-child subfamily, or either spouse in a married-couple subfamily.
- Related children -- own children and all other persons under 18 years of age in the household, regardless
of marital status, which are related to the householder (except the spouse of the householder). - Other Relatives -- a person who was related to the householder by blood, marriage, or adoption. (Other
relatives are considered as nephew, aunt, uncle, cousin, in-laws, and so forth). - Grandchild -- the grandson or daughter of the householder. - Brother/Sister -- the brother or sister of the householder, including stepbrothers, stepsisters and brothers
and sisters by adoption. Brother-in-law and sister-in-law are included in the "other relative" category on the questionnaire.
- Parent -- the father and mother of the householder, including a stepparent or adoptive parent. Fathers-in-
law and mother-in-law are included in the "other relative" category on the questionnaire. - Other Relatives -- anyone not listed in a reported category above that was related to the householder by
birth, marriage, or adoption (brother-in-law, grandparent, nephew, aunt, mother-in-law, daughter-in-law, cousin, and so forth).
- Nonrelatives -- any household member not related to the householder by birth, marriage, or adoption. The following categories may be presented in more detailed tabulations: roomer, boarder, housemate or roommate; unmarried partner; and other nonrelatives.
2000 FSM Census of Kosrae Chapter 3. Households, Families and Marital Status
Kosrae Branch Statistics Office, Division of Statistics, FSM Department of Economic Affairs 19
Marital Status
Question 5 asked for marital status of all residents. However, data were tabulated for persons aged 15 years and older. The marital status referred to the status at the time of enumeration. Traditional marriages were classified under now married. The five marital categories were: never married, now married, widowed, divorced, and separated. They are defined below: Never married – persons who never had been married, including persons whose only marriages were annulled. Now married – all persons whose current marriage had not ended by widowhood or divorce and regardless of whether his or her spouse was living in the household, unless they were separated. Widowed – person whose spouse had died. Divorced – person who had legally divorced his or her spouse. Separated – persons legally separated or otherwise absent from their spouse because of marital discord. Included were persons how had been deserted or who had parted because they no longer wanted to live together but who had not obtained a divorce. When a person did not report his or her marital status, the marital status was imputed according to the relationship to the householder and sex and age of the person. Limitations and Comparability: The results from the 1973 and 1994 Censuses are used in the 2000 FSM Census analysis because the data are comparable.
Analysis of Household and Marital Status Household (and Families) Table 3.1 shows data on the type of living quarters in Kosrae from 1973 to 2000. Over the 27 years, the population increased from 4,305 in 1973 to about 7,686 in 2000. The average number of persons per family (7.2 percent per family) was higher than the average number of persons per household by only about 0.3 people per household, showing there were only few cases of one-person or unrelated member households in Kosrae. The results for persons per family in the previous Censuses could not be presented here because of the difference in the definitions used during previous Censuses. As the total number of persons grew in Kosrae, the number of people living in the regular households increased as well. Thus, the proportion of people living in regular households slowly increased from 92 percent in 1973 to 95 percent in 1994 and to 99 percent in 2000. The proportion of person’s in-group quarters, on the other hand, decreased from 2 percent in 1973 to less than 1 percent in 2000. The average family size for Kosrae State was about 7.9 in 1973 while the 1994 Census data showed a decline to 7.2 and further declined to 7.1 in 2000. The average family size was reported at 5.8 persons per family in 1973 and increased to 7.2 persons in 2000. Table 3.1: Type of Living Quarters in Kosrae State: 1973 to 2000
Census years Characteristics 1973 1986 1994 2000
Total persons 4,305 6,607 7,317 7,686 In regular households 3,948 6,496 6,984 7,615 Percent 91.7 98.3 95.4 99.1 In group quarters 68 111 333 71 Percent 1.6 1.7 4.6 0.9 Persons per household 7.9 7.5 7.2 7.1 Persons per family 5.8 - 7.5 7.2 Source: 1973 TTPI Census, Table T3; 1986 Kosrae Census; 1994 FSM Census, Table P14; 2000 FSM Census, Table P2-2
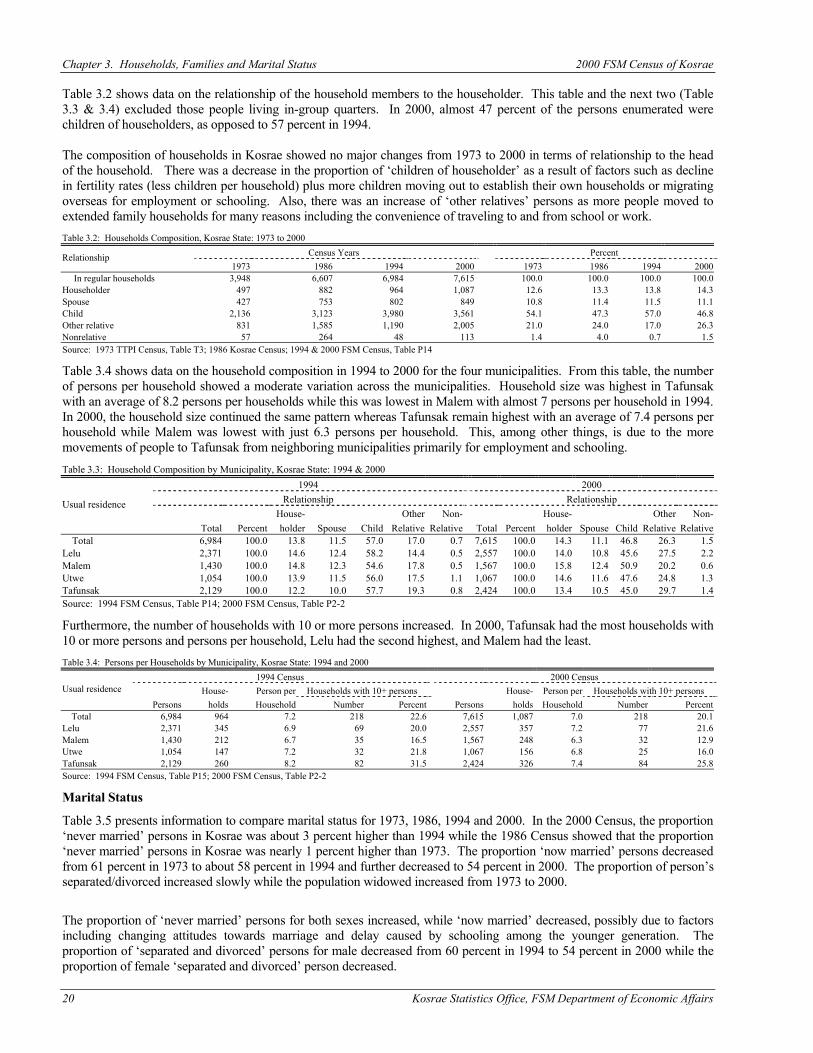
Chapter 3. Households, Families and Marital Status 2000 FSM Census of Kosrae
20 Kosrae Statistics Office, FSM Department of Economic Affairs
Table 3.2 shows data on the relationship of the household members to the householder. This table and the next two (Table 3.3 & 3.4) excluded those people living in-group quarters. In 2000, almost 47 percent of the persons enumerated were children of householders, as opposed to 57 percent in 1994. The composition of households in Kosrae showed no major changes from 1973 to 2000 in terms of relationship to the head of the household. There was a decrease in the proportion of ‘children of householder’ as a result of factors such as decline in fertility rates (less children per household) plus more children moving out to establish their own households or migrating overseas for employment or schooling. Also, there was an increase of ‘other relatives’ persons as more people moved to extended family households for many reasons including the convenience of traveling to and from school or work. Table 3.2: Households Composition, Kosrae State: 1973 to 2000
Census Years Percent Relationship 1973 1986 1994 2000 1973 1986 1994 2000
In regular households 3,948 6,607 6,984 7,615 100.0 100.0 100.0 100.0 Householder 497 882 964 1,087 12.6 13.3 13.8 14.3 Spouse 427 753 802 849 10.8 11.4 11.5 11.1 Child 2,136 3,123 3,980 3,561 54.1 47.3 57.0 46.8 Other relative 831 1,585 1,190 2,005 21.0 24.0 17.0 26.3 Nonrelative 57 264 48 113 1.4 4.0 0.7 1.5 Source: 1973 TTPI Census, Table T3; 1986 Kosrae Census; 1994 & 2000 FSM Census, Table P14
Table 3.4 shows data on the household composition in 1994 to 2000 for the four municipalities. From this table, the number of persons per household showed a moderate variation across the municipalities. Household size was highest in Tafunsak with an average of 8.2 persons per households while this was lowest in Malem with almost 7 persons per household in 1994. In 2000, the household size continued the same pattern whereas Tafunsak remain highest with an average of 7.4 persons per household while Malem was lowest with just 6.3 persons per household. This, among other things, is due to the more movements of people to Tafunsak from neighboring municipalities primarily for employment and schooling. Table 3.3: Household Composition by Municipality, Kosrae State: 1994 & 2000
1994 2000 Relationship Relationship
House- Other Non- House- Other Non- Usual residence
Total Percent holder Spouse Child Relative Relative Total Percent holder Spouse Child Relative Relative Total 6,984 100.0 13.8 11.5 57.0 17.0 0.7 7,615 100.0 14.3 11.1 46.8 26.3 1.5 Lelu 2,371 100.0 14.6 12.4 58.2 14.4 0.5 2,557 100.0 14.0 10.8 45.6 27.5 2.2 Malem 1,430 100.0 14.8 12.3 54.6 17.8 0.5 1,567 100.0 15.8 12.4 50.9 20.2 0.6 Utwe 1,054 100.0 13.9 11.5 56.0 17.5 1.1 1,067 100.0 14.6 11.6 47.6 24.8 1.3 Tafunsak 2,129 100.0 12.2 10.0 57.7 19.3 0.8 2,424 100.0 13.4 10.5 45.0 29.7 1.4 Source: 1994 FSM Census, Table P14; 2000 FSM Census, Table P2-2
Furthermore, the number of households with 10 or more persons increased. In 2000, Tafunsak had the most households with 10 or more persons and persons per household, Lelu had the second highest, and Malem had the least. Table 3.4: Persons per Households by Municipality, Kosrae State: 1994 and 2000
1994 Census 2000 Census House- Person per Households with 10+ persons House- Person per Households with 10+ persons Usual residence
Persons holds Household Number Percent Persons holds Household Number Percent Total 6,984 964 7.2 218 22.6 7,615 1,087 7.0 218 20.1 Lelu 2,371 345 6.9 69 20.0 2,557 357 7.2 77 21.6 Malem 1,430 212 6.7 35 16.5 1,567 248 6.3 32 12.9 Utwe 1,054 147 7.2 32 21.8 1,067 156 6.8 25 16.0 Tafunsak 2,129 260 8.2 82 31.5 2,424 326 7.4 84 25.8 Source: 1994 FSM Census, Table P15; 2000 FSM Census, Table P2-2
Marital Status
Table 3.5 presents information to compare marital status for 1973, 1986, 1994 and 2000. In the 2000 Census, the proportion ‘never married’ persons in Kosrae was about 3 percent higher than 1994 while the 1986 Census showed that the proportion ‘never married’ persons in Kosrae was nearly 1 percent higher than 1973. The proportion ‘now married’ persons decreased from 61 percent in 1973 to about 58 percent in 1994 and further decreased to 54 percent in 2000. The proportion of person’s separated/divorced increased slowly while the population widowed increased from 1973 to 2000.
The proportion of ‘never married’ persons for both sexes increased, while ‘now married’ decreased, possibly due to factors including changing attitudes towards marriage and delay caused by schooling among the younger generation. The proportion of ‘separated and divorced’ persons for male decreased from 60 percent in 1994 to 54 percent in 2000 while the proportion of female ‘separated and divorced’ person decreased.
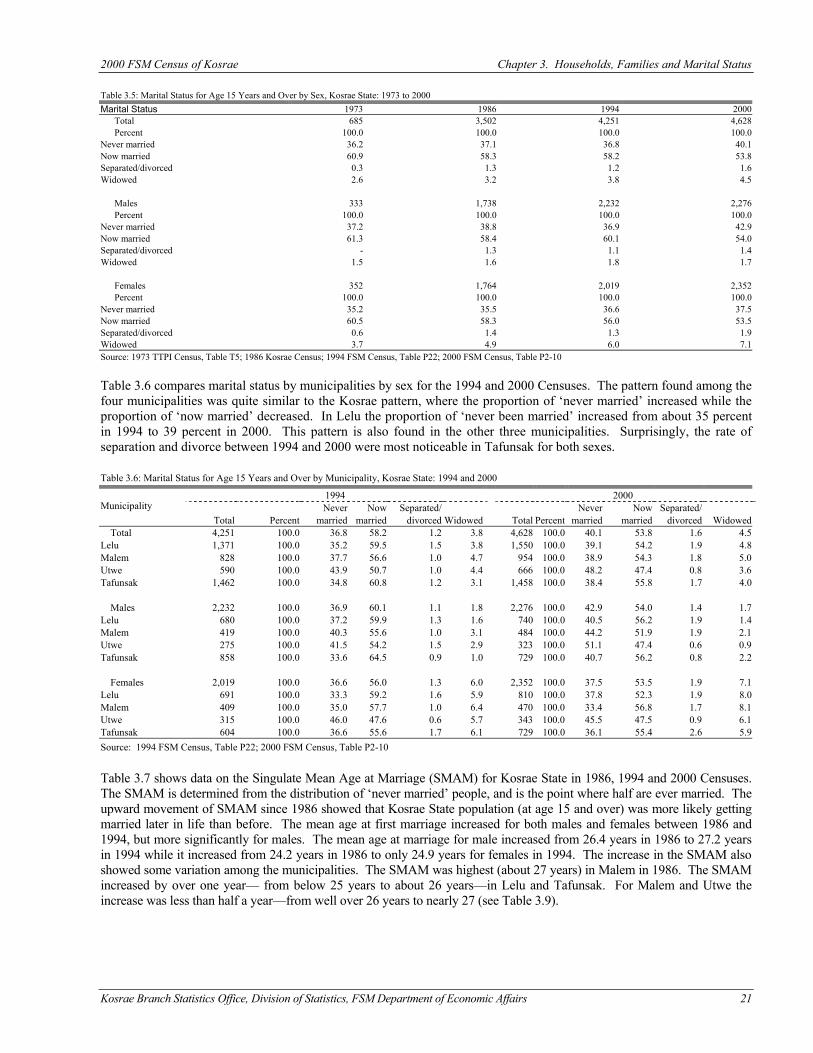
2000 FSM Census of Kosrae Chapter 3. Households, Families and Marital Status
Kosrae Branch Statistics Office, Division of Statistics, FSM Department of Economic Affairs 21
Table 3.5: Marital Status for Age 15 Years and Over by Sex, Kosrae State: 1973 to 2000 Marital Status 1973 1986 1994 2000 Total 685 3,502 4,251 4,628 Percent 100.0 100.0 100.0 100.0 Never married 36.2 37.1 36.8 40.1 Now married 60.9 58.3 58.2 53.8 Separated/divorced 0.3 1.3 1.2 1.6 Widowed 2.6 3.2 3.8 4.5 Males 333 1,738 2,232 2,276 Percent 100.0 100.0 100.0 100.0 Never married 37.2 38.8 36.9 42.9 Now married 61.3 58.4 60.1 54.0 Separated/divorced - 1.3 1.1 1.4 Widowed 1.5 1.6 1.8 1.7 Females 352 1,764 2,019 2,352 Percent 100.0 100.0 100.0 100.0 Never married 35.2 35.5 36.6 37.5 Now married 60.5 58.3 56.0 53.5 Separated/divorced 0.6 1.4 1.3 1.9 Widowed 3.7 4.9 6.0 7.1 Source: 1973 TTPI Census, Table T5; 1986 Kosrae Census; 1994 FSM Census, Table P22; 2000 FSM Census, Table P2-10 Table 3.6 compares marital status by municipalities by sex for the 1994 and 2000 Censuses. The pattern found among the four municipalities was quite similar to the Kosrae pattern, where the proportion of ‘never married’ increased while the proportion of ‘now married’ decreased. In Lelu the proportion of ‘never been married’ increased from about 35 percent in 1994 to 39 percent in 2000. This pattern is also found in the other three municipalities. Surprisingly, the rate of separation and divorce between 1994 and 2000 were most noticeable in Tafunsak for both sexes. Table 3.6: Marital Status for Age 15 Years and Over by Municipality, Kosrae State: 1994 and 2000
1994 2000 Never Now Separated/ Never Now Separated/ Municipality
Total Percent married married divorced Widowed Total Percent married married divorced Widowed Total 4,251 100.0 36.8 58.2 1.2 3.8 4,628 100.0 40.1 53.8 1.6 4.5 Lelu 1,371 100.0 35.2 59.5 1.5 3.8 1,550 100.0 39.1 54.2 1.9 4.8 Malem 828 100.0 37.7 56.6 1.0 4.7 954 100.0 38.9 54.3 1.8 5.0 Utwe 590 100.0 43.9 50.7 1.0 4.4 666 100.0 48.2 47.4 0.8 3.6 Tafunsak 1,462 100.0 34.8 60.8 1.2 3.1 1,458 100.0 38.4 55.8 1.7 4.0 Males 2,232 100.0 36.9 60.1 1.1 1.8 2,276 100.0 42.9 54.0 1.4 1.7 Lelu 680 100.0 37.2 59.9 1.3 1.6 740 100.0 40.5 56.2 1.9 1.4 Malem 419 100.0 40.3 55.6 1.0 3.1 484 100.0 44.2 51.9 1.9 2.1 Utwe 275 100.0 41.5 54.2 1.5 2.9 323 100.0 51.1 47.4 0.6 0.9 Tafunsak 858 100.0 33.6 64.5 0.9 1.0 729 100.0 40.7 56.2 0.8 2.2 Females 2,019 100.0 36.6 56.0 1.3 6.0 2,352 100.0 37.5 53.5 1.9 7.1 Lelu 691 100.0 33.3 59.2 1.6 5.9 810 100.0 37.8 52.3 1.9 8.0 Malem 409 100.0 35.0 57.7 1.0 6.4 470 100.0 33.4 56.8 1.7 8.1 Utwe 315 100.0 46.0 47.6 0.6 5.7 343 100.0 45.5 47.5 0.9 6.1 Tafunsak 604 100.0 36.6 55.6 1.7 6.1 729 100.0 36.1 55.4 2.6 5.9 Source: 1994 FSM Census, Table P22; 2000 FSM Census, Table P2-10 Table 3.7 shows data on the Singulate Mean Age at Marriage (SMAM) for Kosrae State in 1986, 1994 and 2000 Censuses. The SMAM is determined from the distribution of ‘never married’ people, and is the point where half are ever married. The upward movement of SMAM since 1986 showed that Kosrae State population (at age 15 and over) was more likely getting married later in life than before. The mean age at first marriage increased for both males and females between 1986 and 1994, but more significantly for males. The mean age at marriage for male increased from 26.4 years in 1986 to 27.2 years in 1994 while it increased from 24.2 years in 1986 to only 24.9 years for females in 1994. The increase in the SMAM also showed some variation among the municipalities. The SMAM was highest (about 27 years) in Malem in 1986. The SMAM increased by over one year— from below 25 years to about 26 years—in Lelu and Tafunsak. For Malem and Utwe the increase was less than half a year—from well over 26 years to nearly 27 (see Table 3.9).
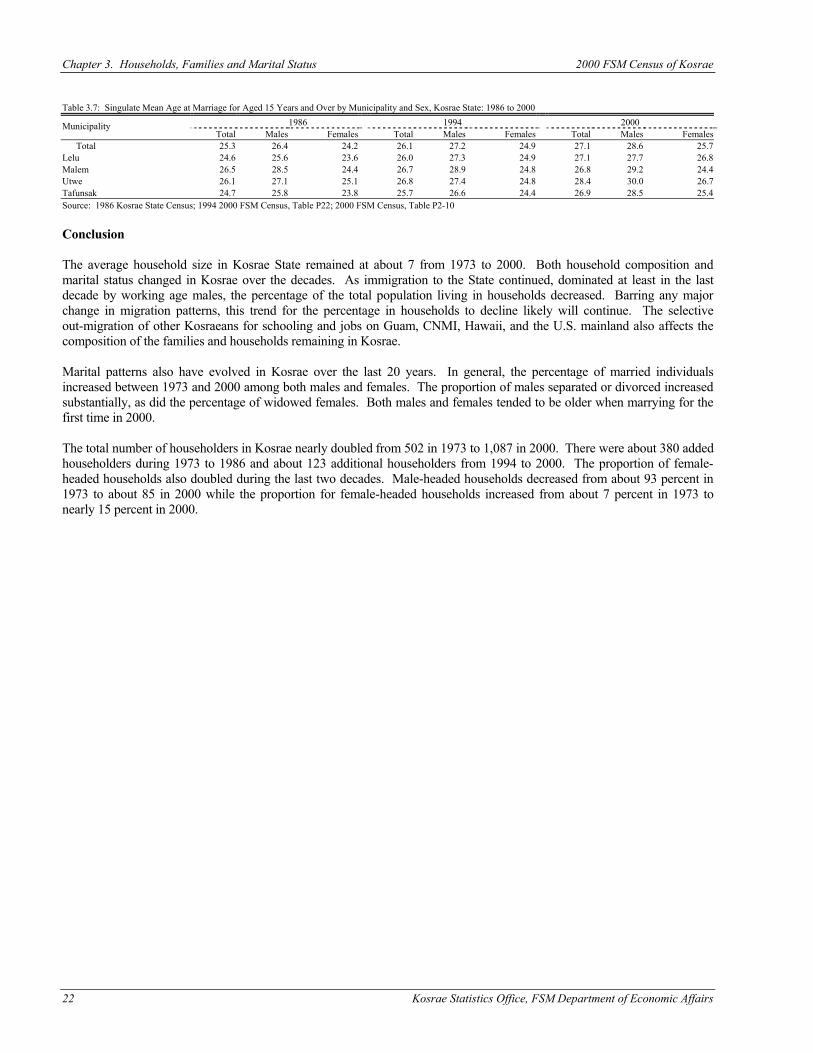
Chapter 3. Households, Families and Marital Status 2000 FSM Census of Kosrae
22 Kosrae Statistics Office, FSM Department of Economic Affairs
Table 3.7: Singulate Mean Age at Marriage for Aged 15 Years and Over by Municipality and Sex, Kosrae State: 1986 to 2000
1986 1994 2000 Municipality Total Males Females Total Males Females Total Males Females
Total 25.3 26.4 24.2 26.1 27.2 24.9 27.1 28.6 25.7 Lelu 24.6 25.6 23.6 26.0 27.3 24.9 27.1 27.7 26.8 Malem 26.5 28.5 24.4 26.7 28.9 24.8 26.8 29.2 24.4 Utwe 26.1 27.1 25.1 26.8 27.4 24.8 28.4 30.0 26.7 Tafunsak 24.7 25.8 23.8 25.7 26.6 24.4 26.9 28.5 25.4 Source: 1986 Kosrae State Census; 1994 2000 FSM Census, Table P22; 2000 FSM Census, Table P2-10 Conclusion The average household size in Kosrae State remained at about 7 from 1973 to 2000. Both household composition and marital status changed in Kosrae over the decades. As immigration to the State continued, dominated at least in the last decade by working age males, the percentage of the total population living in households decreased. Barring any major change in migration patterns, this trend for the percentage in households to decline likely will continue. The selective out-migration of other Kosraeans for schooling and jobs on Guam, CNMI, Hawaii, and the U.S. mainland also affects the composition of the families and households remaining in Kosrae. Marital patterns also have evolved in Kosrae over the last 20 years. In general, the percentage of married individuals increased between 1973 and 2000 among both males and females. The proportion of males separated or divorced increased substantially, as did the percentage of widowed females. Both males and females tended to be older when marrying for the first time in 2000. The total number of householders in Kosrae nearly doubled from 502 in 1973 to 1,087 in 2000. There were about 380 added householders during 1973 to 1986 and about 123 additional householders from 1994 to 2000. The proportion of female-headed households also doubled during the last two decades. Male-headed households decreased from about 93 percent in 1973 to about 85 in 2000 while the proportion for female-headed households increased from about 7 percent in 1973 to nearly 15 percent in 2000.
Kosrae Branch Statistics Office, Division of Statistics, FSM Department of Economic Affairs 23
CHAPTER 4 FERTILITY Introduction Before large-scale international migration became common, population growth was determined mostly by the difference between the number of people being born and the number of people dying. At present, births are not the only contributing factor to population growth, but they make up a significant portion, especially in the Pacific region where most families are characterized by a high level of fertility. Fertility refers to the reproductive behavior of a population, relating to the number of live births a woman has had. The fertility of a population depends on various factors:
• Demographic composition of the population (particularly number/age of women); • Fecundity (ability to reproduce); • Age of cohabitation/marriage; • Availability and use of family planning; • Psycho-social and cultural concept (breastfeeding, family size preference/value of children); • Level of economic development; • Status of women (place in society, level of education, work status).
Birth or fertility rates measure the impact that births have on population structure and growth. As a rule, Censuses do quite well in estimating fertility as questions and techniques have been refined over the years. The two approaches for measuring fertility — direct measures and indirect measures —can both be applied to the 2000 FSM Census. Since both methods can be used, a useful starting point is to compare the results obtained from each. If the results differ widely, it suggests that the data used in one or both methods are incorrect, or the indirect method does not apply. Changes in fertility patterns and levels are often due to the availability and usage of family planning methods (contraceptives), women's educational background, and rate of women's participation in the labor force. Census data on fertility provide benchmark information on fertility to look for changes in patterns and levels. In most countries, family planning methods, such as contraceptives, usually lower fertility levels of older women first. Data Description Vital registration in Kosrae is not complete, making estimates on fertility reliant on estimates derived from a census or survey. The 2000 FSM Census asked 4 questions on fertility in order to get information on recent births, previous births, and child mortality. Fertility questions were asked to all females born before April 1, 2000 (all women aged 13 and over) but were tabulated for women aged 15 and over. Questions asked included how many children born to each woman were living at home, living elsewhere or dead and categorized by sex. Also asked was the date and sex of the last child born alive and whether that child was still alive. Limitations and comparability. Accurate fertility data are sometimes difficult to capture because of poor recollection by mothers on number of births or dates of births of their children. Indirect methods of measuring fertility help to compensate for these weaknesses in the data. The 1973 TTPI Census asked questions on children ever born children still alive and date of the last child born, by sex, to women aged 14 and over. The 1980 Census asked women 15 and over for number of children ever born and surviving and babies born in the 12 months before the census. The 1980 collection technique would have caught women who had multiple births in the year while the 1973, 1994 and 2000 only considered most recent births, missing those women who had multiple births in the year before the Census. Fertility data editing techniques for the earlier Censuses were slightly different than the 1994 and 2000 FSM Censuses. Analysis of Fertility Data Crude Birth Rate The crude birth rate (CBR) is the number of births in a year divided by the mid-period population. Note that the mid-period population is not the Census population, that is, the reported births refer to the last 12 months while the population refers to
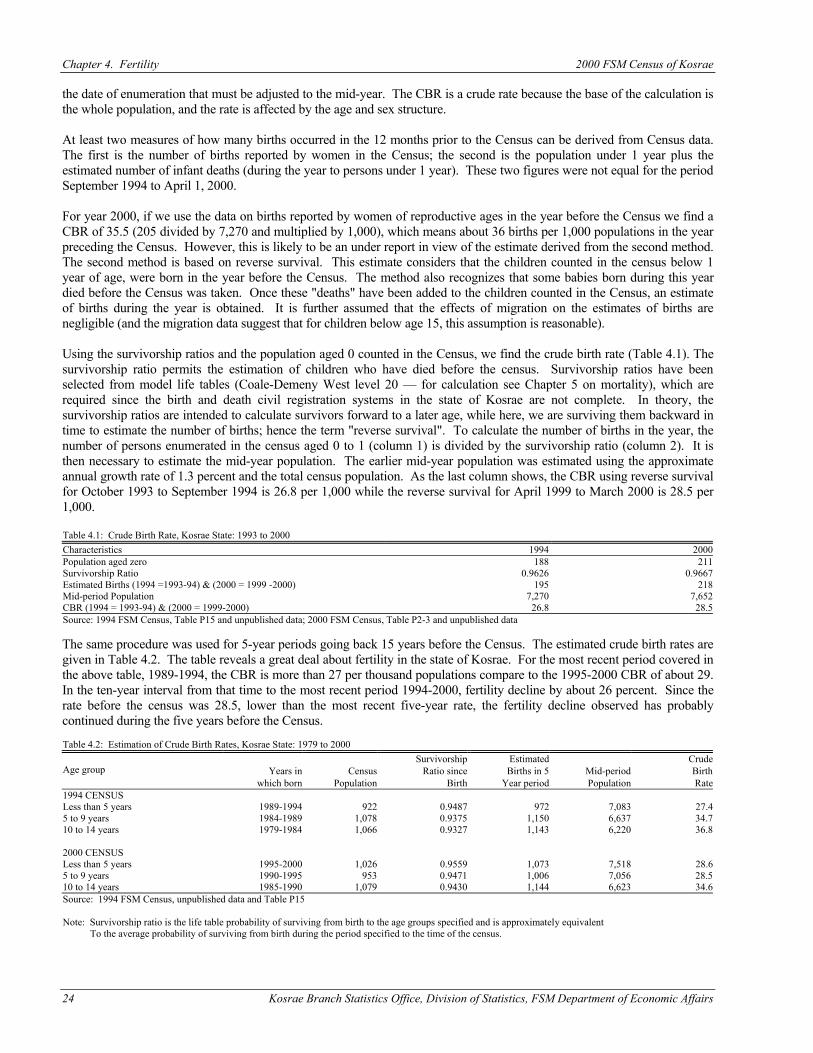
Chapter 4. Fertility 2000 FSM Census of Kosrae
24 Kosrae Branch Statistics Office, Division of Statistics, FSM Department of Economic Affairs
the date of enumeration that must be adjusted to the mid-year. The CBR is a crude rate because the base of the calculation is the whole population, and the rate is affected by the age and sex structure. At least two measures of how many births occurred in the 12 months prior to the Census can be derived from Census data. The first is the number of births reported by women in the Census; the second is the population under 1 year plus the estimated number of infant deaths (during the year to persons under 1 year). These two figures were not equal for the period September 1994 to April 1, 2000. For year 2000, if we use the data on births reported by women of reproductive ages in the year before the Census we find a CBR of 35.5 (205 divided by 7,270 and multiplied by 1,000), which means about 36 births per 1,000 populations in the year preceding the Census. However, this is likely to be an under report in view of the estimate derived from the second method. The second method is based on reverse survival. This estimate considers that the children counted in the census below 1 year of age, were born in the year before the Census. The method also recognizes that some babies born during this year died before the Census was taken. Once these "deaths" have been added to the children counted in the Census, an estimate of births during the year is obtained. It is further assumed that the effects of migration on the estimates of births are negligible (and the migration data suggest that for children below age 15, this assumption is reasonable). Using the survivorship ratios and the population aged 0 counted in the Census, we find the crude birth rate (Table 4.1). The survivorship ratio permits the estimation of children who have died before the census. Survivorship ratios have been selected from model life tables (Coale-Demeny West level 20 — for calculation see Chapter 5 on mortality), which are required since the birth and death civil registration systems in the state of Kosrae are not complete. In theory, the survivorship ratios are intended to calculate survivors forward to a later age, while here, we are surviving them backward in time to estimate the number of births; hence the term "reverse survival". To calculate the number of births in the year, the number of persons enumerated in the census aged 0 to 1 (column 1) is divided by the survivorship ratio (column 2). It is then necessary to estimate the mid-year population. The earlier mid-year population was estimated using the approximate annual growth rate of 1.3 percent and the total census population. As the last column shows, the CBR using reverse survival for October 1993 to September 1994 is 26.8 per 1,000 while the reverse survival for April 1999 to March 2000 is 28.5 per 1,000. Table 4.1: Crude Birth Rate, Kosrae State: 1993 to 2000 Characteristics 1994 2000 Population aged zero 188 211 Survivorship Ratio 0.9626 0.9667 Estimated Births (1994 =1993-94) & (2000 = 1999 -2000) 195 218 Mid-period Population 7,270 7,652 CBR (1994 = 1993-94) & (2000 = 1999-2000) 26.8 28.5 Source: 1994 FSM Census, Table P15 and unpublished data; 2000 FSM Census, Table P2-3 and unpublished data The same procedure was used for 5-year periods going back 15 years before the Census. The estimated crude birth rates are given in Table 4.2. The table reveals a great deal about fertility in the state of Kosrae. For the most recent period covered in the above table, 1989-1994, the CBR is more than 27 per thousand populations compare to the 1995-2000 CBR of about 29. In the ten-year interval from that time to the most recent period 1994-2000, fertility decline by about 26 percent. Since the rate before the census was 28.5, lower than the most recent five-year rate, the fertility decline observed has probably continued during the five years before the Census. Table 4.2: Estimation of Crude Birth Rates, Kosrae State: 1979 to 2000
Survivorship Estimated Crude Years in Census Ratio since Births in 5 Mid-period Birth Age group
which born Population Birth Year period Population Rate 1994 CENSUS Less than 5 years 1989-1994 922 0.9487 972 7,083 27.4 5 to 9 years 1984-1989 1,078 0.9375 1,150 6,637 34.7 10 to 14 years 1979-1984 1,066 0.9327 1,143 6,220 36.8 2000 CENSUS Less than 5 years 1995-2000 1,026 0.9559 1,073 7,518 28.6 5 to 9 years 1990-1995 953 0.9471 1,006 7,056 28.5 10 to 14 years 1985-1990 1,079 0.9430 1,144 6,623 34.6 Source: 1994 FSM Census, unpublished data and Table P15 Note: Survivorship ratio is the life table probability of surviving from birth to the age groups specified and is approximately equivalent To the average probability of surviving from birth during the period specified to the time of the census.
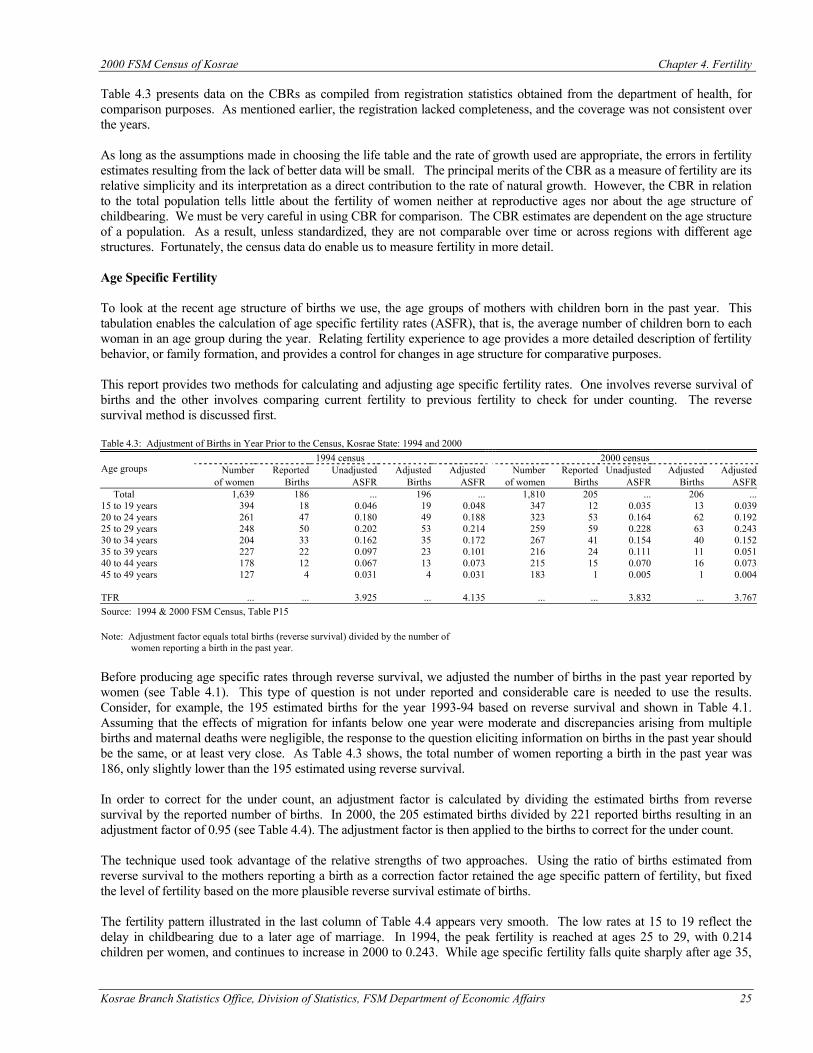
2000 FSM Census of Kosrae Chapter 4. Fertility
Kosrae Branch Statistics Office, Division of Statistics, FSM Department of Economic Affairs 25
Table 4.3 presents data on the CBRs as compiled from registration statistics obtained from the department of health, for comparison purposes. As mentioned earlier, the registration lacked completeness, and the coverage was not consistent over the years. As long as the assumptions made in choosing the life table and the rate of growth used are appropriate, the errors in fertility estimates resulting from the lack of better data will be small. The principal merits of the CBR as a measure of fertility are its relative simplicity and its interpretation as a direct contribution to the rate of natural growth. However, the CBR in relation to the total population tells little about the fertility of women neither at reproductive ages nor about the age structure of childbearing. We must be very careful in using CBR for comparison. The CBR estimates are dependent on the age structure of a population. As a result, unless standardized, they are not comparable over time or across regions with different age structures. Fortunately, the census data do enable us to measure fertility in more detail. Age Specific Fertility To look at the recent age structure of births we use, the age groups of mothers with children born in the past year. This tabulation enables the calculation of age specific fertility rates (ASFR), that is, the average number of children born to each woman in an age group during the year. Relating fertility experience to age provides a more detailed description of fertility behavior, or family formation, and provides a control for changes in age structure for comparative purposes. This report provides two methods for calculating and adjusting age specific fertility rates. One involves reverse survival of births and the other involves comparing current fertility to previous fertility to check for under counting. The reverse survival method is discussed first. Table 4.3: Adjustment of Births in Year Prior to the Census, Kosrae State: 1994 and 2000
1994 census 2000 census Number Reported Unadjusted Adjusted Adjusted Number Reported Unadjusted Adjusted Adjusted Age groups
of women Births ASFR Births ASFR of women Births ASFR Births ASFR Total 1,639 186 ... 196 ... 1,810 205 ... 206 ... 15 to 19 years 394 18 0.046 19 0.048 347 12 0.035 13 0.039 20 to 24 years 261 47 0.180 49 0.188 323 53 0.164 62 0.192 25 to 29 years 248 50 0.202 53 0.214 259 59 0.228 63 0.243 30 to 34 years 204 33 0.162 35 0.172 267 41 0.154 40 0.152 35 to 39 years 227 22 0.097 23 0.101 216 24 0.111 11 0.051 40 to 44 years 178 12 0.067 13 0.073 215 15 0.070 16 0.073 45 to 49 years 127 4 0.031 4 0.031 183 1 0.005 1 0.004 TFR ... ... 3.925 ... 4.135 ... ... 3.832 ... 3.767 Source: 1994 & 2000 FSM Census, Table P15 Note: Adjustment factor equals total births (reverse survival) divided by the number of women reporting a birth in the past year. Before producing age specific rates through reverse survival, we adjusted the number of births in the past year reported by women (see Table 4.1). This type of question is not under reported and considerable care is needed to use the results. Consider, for example, the 195 estimated births for the year 1993-94 based on reverse survival and shown in Table 4.1. Assuming that the effects of migration for infants below one year were moderate and discrepancies arising from multiple births and maternal deaths were negligible, the response to the question eliciting information on births in the past year should be the same, or at least very close. As Table 4.3 shows, the total number of women reporting a birth in the past year was 186, only slightly lower than the 195 estimated using reverse survival. In order to correct for the under count, an adjustment factor is calculated by dividing the estimated births from reverse survival by the reported number of births. In 2000, the 205 estimated births divided by 221 reported births resulting in an adjustment factor of 0.95 (see Table 4.4). The adjustment factor is then applied to the births to correct for the under count. The technique used took advantage of the relative strengths of two approaches. Using the ratio of births estimated from reverse survival to the mothers reporting a birth as a correction factor retained the age specific pattern of fertility, but fixed the level of fertility based on the more plausible reverse survival estimate of births. The fertility pattern illustrated in the last column of Table 4.4 appears very smooth. The low rates at 15 to 19 reflect the delay in childbearing due to a later age of marriage. In 1994, the peak fertility is reached at ages 25 to 29, with 0.214 children per women, and continues to increase in 2000 to 0.243. While age specific fertility falls quite sharply after age 35,
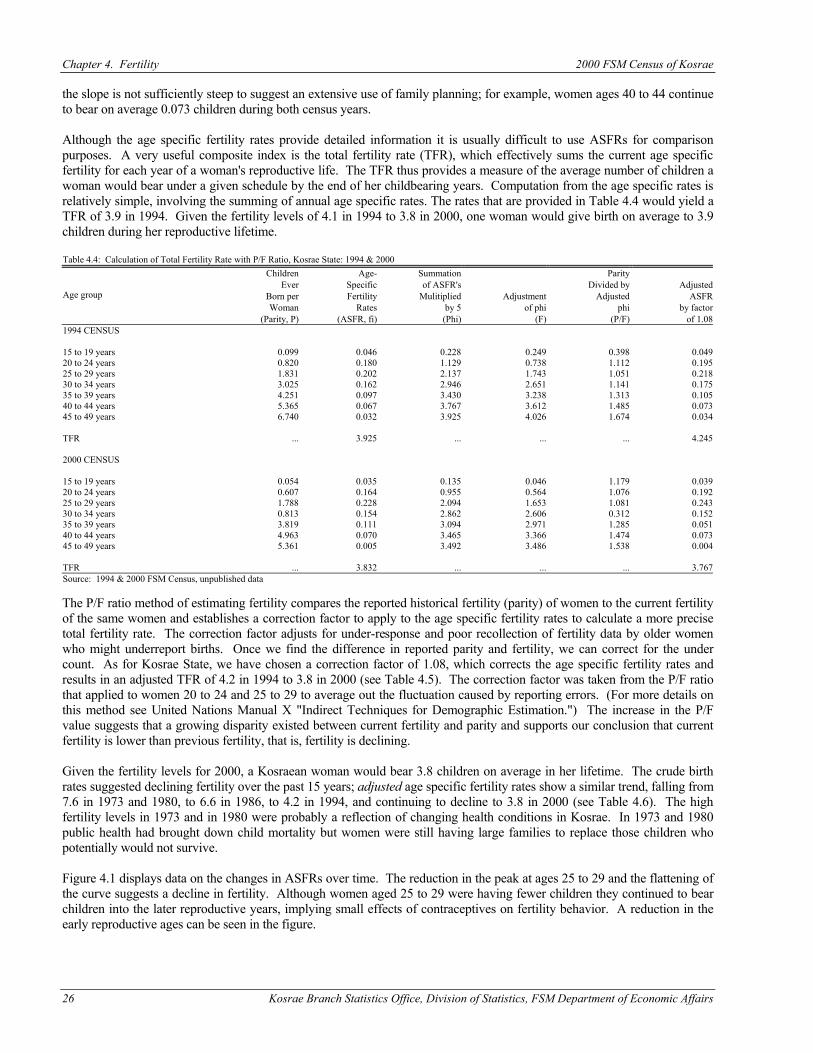
Chapter 4. Fertility 2000 FSM Census of Kosrae
26 Kosrae Branch Statistics Office, Division of Statistics, FSM Department of Economic Affairs
the slope is not sufficiently steep to suggest an extensive use of family planning; for example, women ages 40 to 44 continue to bear on average 0.073 children during both census years. Although the age specific fertility rates provide detailed information it is usually difficult to use ASFRs for comparison purposes. A very useful composite index is the total fertility rate (TFR), which effectively sums the current age specific fertility for each year of a woman's reproductive life. The TFR thus provides a measure of the average number of children a woman would bear under a given schedule by the end of her childbearing years. Computation from the age specific rates is relatively simple, involving the summing of annual age specific rates. The rates that are provided in Table 4.4 would yield a TFR of 3.9 in 1994. Given the fertility levels of 4.1 in 1994 to 3.8 in 2000, one woman would give birth on average to 3.9 children during her reproductive lifetime. Table 4.4: Calculation of Total Fertility Rate with P/F Ratio, Kosrae State: 1994 & 2000
Children Age- Summation Parity Ever Specific of ASFR's Divided by Adjusted
Born per Fertility Mulitiplied Adjustment Adjusted ASFR Woman Rates by 5 of phi phi by factor
Age group
(Parity, P) (ASFR, fi) (Phi) (F) (P/F) of 1.08 1994 CENSUS 15 to 19 years 0.099 0.046 0.228 0.249 0.398 0.049 20 to 24 years 0.820 0.180 1.129 0.738 1.112 0.195 25 to 29 years 1.831 0.202 2.137 1.743 1.051 0.218 30 to 34 years 3.025 0.162 2.946 2.651 1.141 0.175 35 to 39 years 4.251 0.097 3.430 3.238 1.313 0.105 40 to 44 years 5.365 0.067 3.767 3.612 1.485 0.073 45 to 49 years 6.740 0.032 3.925 4.026 1.674 0.034 TFR ... 3.925 ... ... ... 4.245 2000 CENSUS 15 to 19 years 0.054 0.035 0.135 0.046 1.179 0.039 20 to 24 years 0.607 0.164 0.955 0.564 1.076 0.192 25 to 29 years 1.788 0.228 2.094 1.653 1.081 0.243 30 to 34 years 0.813 0.154 2.862 2.606 0.312 0.152 35 to 39 years 3.819 0.111 3.094 2.971 1.285 0.051 40 to 44 years 4.963 0.070 3.465 3.366 1.474 0.073 45 to 49 years 5.361 0.005 3.492 3.486 1.538 0.004 TFR ... 3.832 ... ... ... 3.767 Source: 1994 & 2000 FSM Census, unpublished data The P/F ratio method of estimating fertility compares the reported historical fertility (parity) of women to the current fertility of the same women and establishes a correction factor to apply to the age specific fertility rates to calculate a more precise total fertility rate. The correction factor adjusts for under-response and poor recollection of fertility data by older women who might underreport births. Once we find the difference in reported parity and fertility, we can correct for the under count. As for Kosrae State, we have chosen a correction factor of 1.08, which corrects the age specific fertility rates and results in an adjusted TFR of 4.2 in 1994 to 3.8 in 2000 (see Table 4.5). The correction factor was taken from the P/F ratio that applied to women 20 to 24 and 25 to 29 to average out the fluctuation caused by reporting errors. (For more details on this method see United Nations Manual X "Indirect Techniques for Demographic Estimation.") The increase in the P/F value suggests that a growing disparity existed between current fertility and parity and supports our conclusion that current fertility is lower than previous fertility, that is, fertility is declining. Given the fertility levels for 2000, a Kosraean woman would bear 3.8 children on average in her lifetime. The crude birth rates suggested declining fertility over the past 15 years; adjusted age specific fertility rates show a similar trend, falling from 7.6 in 1973 and 1980, to 6.6 in 1986, to 4.2 in 1994, and continuing to decline to 3.8 in 2000 (see Table 4.6). The high fertility levels in 1973 and in 1980 were probably a reflection of changing health conditions in Kosrae. In 1973 and 1980 public health had brought down child mortality but women were still having large families to replace those children who potentially would not survive. Figure 4.1 displays data on the changes in ASFRs over time. The reduction in the peak at ages 25 to 29 and the flattening of the curve suggests a decline in fertility. Although women aged 25 to 29 were having fewer children they continued to bear children into the later reproductive years, implying small effects of contraceptives on fertility behavior. A reduction in the early reproductive ages can be seen in the figure.
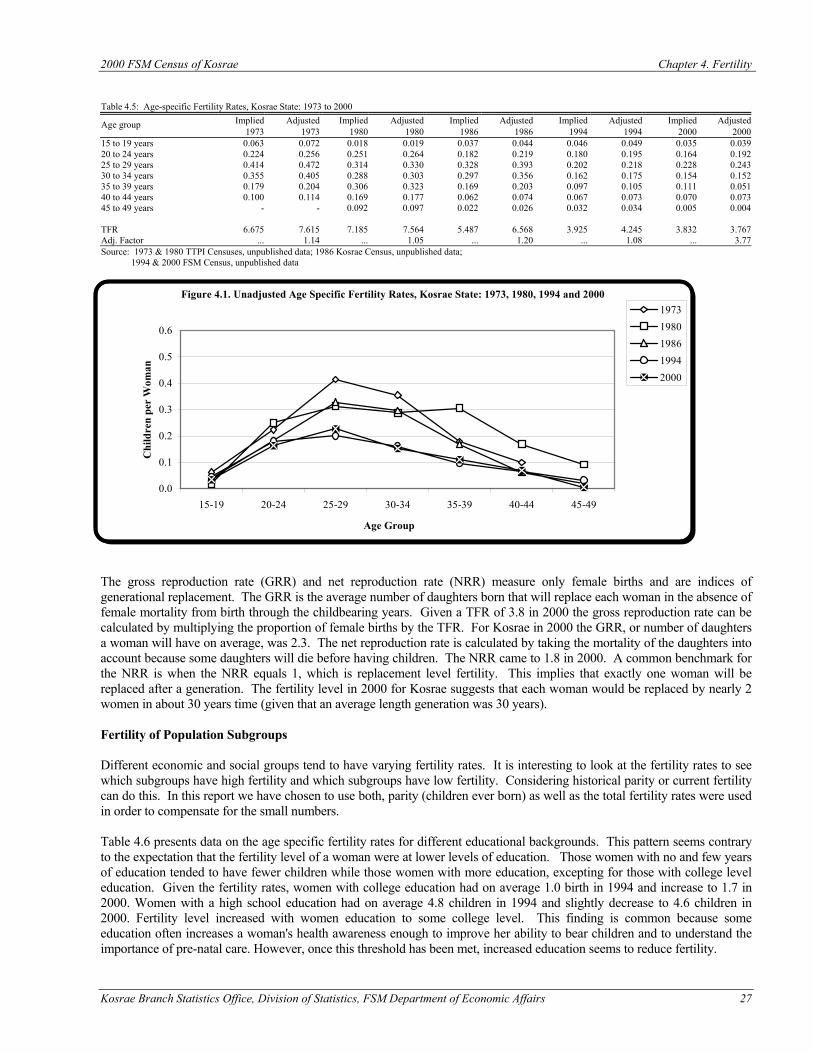
2000 FSM Census of Kosrae Chapter 4. Fertility
Kosrae Branch Statistics Office, Division of Statistics, FSM Department of Economic Affairs 27
Figure 4.1. Unadjusted Age Specific Fertility Rates, Kosrae State: 1973, 1980, 1994 and 2000
0.0
0.1
0.2
0.3
0.4
0.5
0.6
15-19 20-24 25-29 30-34 35-39 40-44 45-49
Age Group
Chi
ldre
n pe
r W
oman
19731980198619942000
Table 4.5: Age-specific Fertility Rates, Kosrae State: 1973 to 2000
Implied Adjusted Implied Adjusted Implied Adjusted Implied Adjusted Implied Adjusted Age group 1973 1973 1980 1980 1986 1986 1994 1994 2000 2000
15 to 19 years 0.063 0.072 0.018 0.019 0.037 0.044 0.046 0.049 0.035 0.039 20 to 24 years 0.224 0.256 0.251 0.264 0.182 0.219 0.180 0.195 0.164 0.192 25 to 29 years 0.414 0.472 0.314 0.330 0.328 0.393 0.202 0.218 0.228 0.243 30 to 34 years 0.355 0.405 0.288 0.303 0.297 0.356 0.162 0.175 0.154 0.152 35 to 39 years 0.179 0.204 0.306 0.323 0.169 0.203 0.097 0.105 0.111 0.051 40 to 44 years 0.100 0.114 0.169 0.177 0.062 0.074 0.067 0.073 0.070 0.073 45 to 49 years - - 0.092 0.097 0.022 0.026 0.032 0.034 0.005 0.004 TFR 6.675 7.615 7.185 7.564 5.487 6.568 3.925 4.245 3.832 3.767 Adj. Factor ... 1.14 ... 1.05 ... 1.20 ... 1.08 ... 3.77 Source: 1973 & 1980 TTPI Censuses, unpublished data; 1986 Kosrae Census, unpublished data; 1994 & 2000 FSM Census, unpublished data The gross reproduction rate (GRR) and net reproduction rate (NRR) measure only female births and are indices of generational replacement. The GRR is the average number of daughters born that will replace each woman in the absence of female mortality from birth through the childbearing years. Given a TFR of 3.8 in 2000 the gross reproduction rate can be calculated by multiplying the proportion of female births by the TFR. For Kosrae in 2000 the GRR, or number of daughters a woman will have on average, was 2.3. The net reproduction rate is calculated by taking the mortality of the daughters into account because some daughters will die before having children. The NRR came to 1.8 in 2000. A common benchmark for the NRR is when the NRR equals 1, which is replacement level fertility. This implies that exactly one woman will be replaced after a generation. The fertility level in 2000 for Kosrae suggests that each woman would be replaced by nearly 2 women in about 30 years time (given that an average length generation was 30 years). Fertility of Population Subgroups Different economic and social groups tend to have varying fertility rates. It is interesting to look at the fertility rates to see which subgroups have high fertility and which subgroups have low fertility. Considering historical parity or current fertility can do this. In this report we have chosen to use both, parity (children ever born) as well as the total fertility rates were used in order to compensate for the small numbers. Table 4.6 presents data on the age specific fertility rates for different educational backgrounds. This pattern seems contrary to the expectation that the fertility level of a woman were at lower levels of education. Those women with no and few years of education tended to have fewer children while those women with more education, excepting for those with college level education. Given the fertility rates, women with college education had on average 1.0 birth in 1994 and increase to 1.7 in 2000. Women with a high school education had on average 4.8 children in 1994 and slightly decrease to 4.6 children in 2000. Fertility level increased with women education to some college level. This finding is common because some education often increases a woman's health awareness enough to improve her ability to bear children and to understand the importance of pre-natal care. However, once this threshold has been met, increased education seems to reduce fertility.
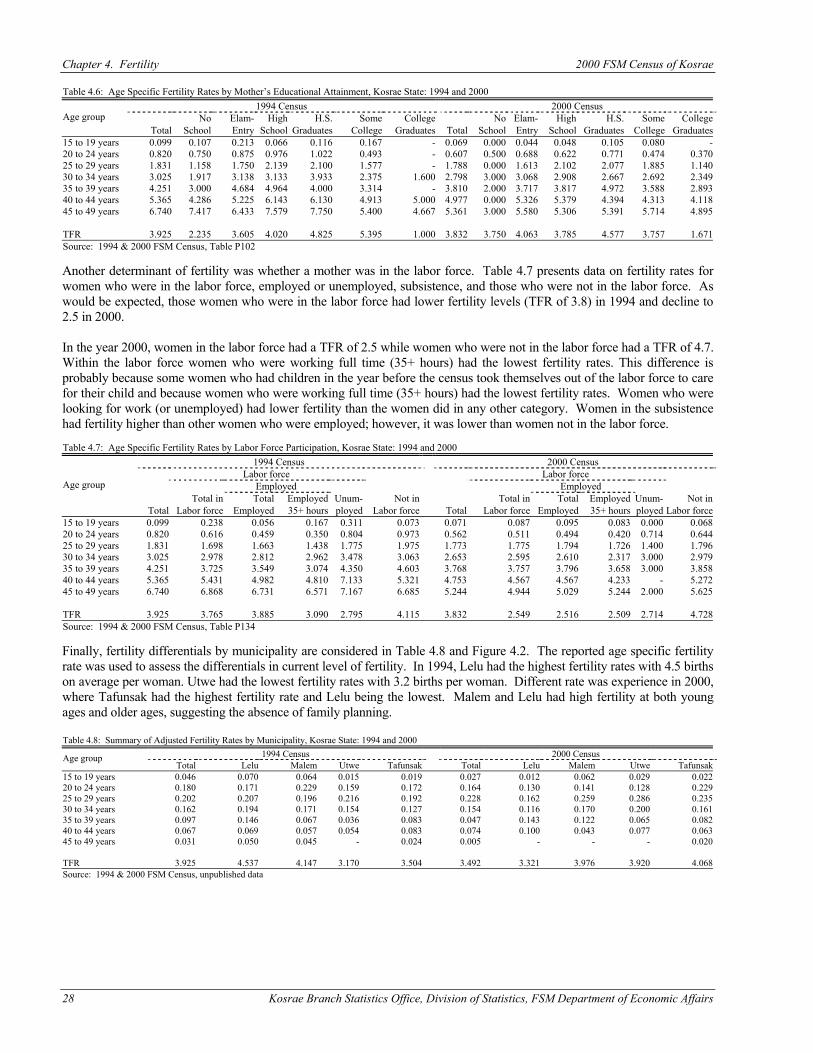
Chapter 4. Fertility 2000 FSM Census of Kosrae
28 Kosrae Branch Statistics Office, Division of Statistics, FSM Department of Economic Affairs
Table 4.6: Age Specific Fertility Rates by Mother’s Educational Attainment, Kosrae State: 1994 and 2000 1994 Census 2000 Census
No Elam- High H.S. Some College No Elam- High H.S. Some College Age group Total School Entry School Graduates College Graduates Total School Entry School Graduates College Graduates
15 to 19 years 0.099 0.107 0.213 0.066 0.116 0.167 - 0.069 0.000 0.044 0.048 0.105 0.080 - 20 to 24 years 0.820 0.750 0.875 0.976 1.022 0.493 - 0.607 0.500 0.688 0.622 0.771 0.474 0.370 25 to 29 years 1.831 1.158 1.750 2.139 2.100 1.577 - 1.788 0.000 1.613 2.102 2.077 1.885 1.140 30 to 34 years 3.025 1.917 3.138 3.133 3.933 2.375 1.600 2.798 3.000 3.068 2.908 2.667 2.692 2.349 35 to 39 years 4.251 3.000 4.684 4.964 4.000 3.314 - 3.810 2.000 3.717 3.817 4.972 3.588 2.893 40 to 44 years 5.365 4.286 5.225 6.143 6.130 4.913 5.000 4.977 0.000 5.326 5.379 4.394 4.313 4.118 45 to 49 years 6.740 7.417 6.433 7.579 7.750 5.400 4.667 5.361 3.000 5.580 5.306 5.391 5.714 4.895 TFR 3.925 2.235 3.605 4.020 4.825 5.395 1.000 3.832 3.750 4.063 3.785 4.577 3.757 1.671 Source: 1994 & 2000 FSM Census, Table P102 Another determinant of fertility was whether a mother was in the labor force. Table 4.7 presents data on fertility rates for women who were in the labor force, employed or unemployed, subsistence, and those who were not in the labor force. As would be expected, those women who were in the labor force had lower fertility levels (TFR of 3.8) in 1994 and decline to 2.5 in 2000. In the year 2000, women in the labor force had a TFR of 2.5 while women who were not in the labor force had a TFR of 4.7. Within the labor force women who were working full time (35+ hours) had the lowest fertility rates. This difference is probably because some women who had children in the year before the census took themselves out of the labor force to care for their child and because women who were working full time (35+ hours) had the lowest fertility rates. Women who were looking for work (or unemployed) had lower fertility than the women did in any other category. Women in the subsistence had fertility higher than other women who were employed; however, it was lower than women not in the labor force. Table 4.7: Age Specific Fertility Rates by Labor Force Participation, Kosrae State: 1994 and 2000
1994 Census 2000 Census Labor force Labor force Employed Employed Total in Total Employed Unum- Not in Total in Total Employed Unum- Not in
Age group
Total Labor force Employed 35+ hours ployed Labor force Total Labor force Employed 35+ hours ployed Labor force 15 to 19 years 0.099 0.238 0.056 0.167 0.311 0.073 0.071 0.087 0.095 0.083 0.000 0.068 20 to 24 years 0.820 0.616 0.459 0.350 0.804 0.973 0.562 0.511 0.494 0.420 0.714 0.644 25 to 29 years 1.831 1.698 1.663 1.438 1.775 1.975 1.773 1.775 1.794 1.726 1.400 1.796 30 to 34 years 3.025 2.978 2.812 2.962 3.478 3.063 2.653 2.595 2.610 2.317 3.000 2.979 35 to 39 years 4.251 3.725 3.549 3.074 4.350 4.603 3.768 3.757 3.796 3.658 3.000 3.858 40 to 44 years 5.365 5.431 4.982 4.810 7.133 5.321 4.753 4.567 4.567 4.233 - 5.272 45 to 49 years 6.740 6.868 6.731 6.571 7.167 6.685 5.244 4.944 5.029 5.244 2.000 5.625 TFR 3.925 3.765 3.885 3.090 2.795 4.115 3.832 2.549 2.516 2.509 2.714 4.728 Source: 1994 & 2000 FSM Census, Table P134 Finally, fertility differentials by municipality are considered in Table 4.8 and Figure 4.2. The reported age specific fertility rate was used to assess the differentials in current level of fertility. In 1994, Lelu had the highest fertility rates with 4.5 births on average per woman. Utwe had the lowest fertility rates with 3.2 births per woman. Different rate was experience in 2000, where Tafunsak had the highest fertility rate and Lelu being the lowest. Malem and Lelu had high fertility at both young ages and older ages, suggesting the absence of family planning. Table 4.8: Summary of Adjusted Fertility Rates by Municipality, Kosrae State: 1994 and 2000
1994 Census 2000 Census Age group Total Lelu Malem Utwe Tafunsak Total Lelu Malem Utwe Tafunsak
15 to 19 years 0.046 0.070 0.064 0.015 0.019 0.027 0.012 0.062 0.029 0.022 20 to 24 years 0.180 0.171 0.229 0.159 0.172 0.164 0.130 0.141 0.128 0.229 25 to 29 years 0.202 0.207 0.196 0.216 0.192 0.228 0.162 0.259 0.286 0.235 30 to 34 years 0.162 0.194 0.171 0.154 0.127 0.154 0.116 0.170 0.200 0.161 35 to 39 years 0.097 0.146 0.067 0.036 0.083 0.047 0.143 0.122 0.065 0.082 40 to 44 years 0.067 0.069 0.057 0.054 0.083 0.074 0.100 0.043 0.077 0.063 45 to 49 years 0.031 0.050 0.045 - 0.024 0.005 - - - 0.020 TFR 3.925 4.537 4.147 3.170 3.504 3.492 3.321 3.976 3.920 4.068 Source: 1994 & 2000 FSM Census, unpublished data
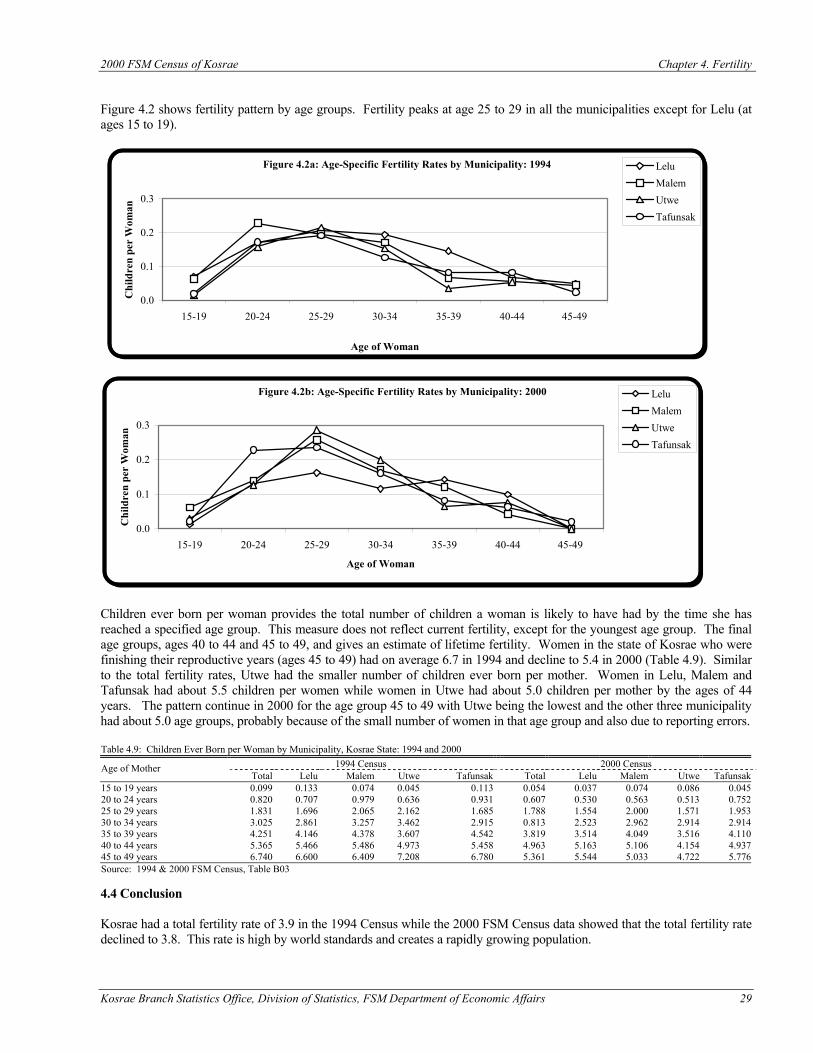
2000 FSM Census of Kosrae Chapter 4. Fertility
Kosrae Branch Statistics Office, Division of Statistics, FSM Department of Economic Affairs 29
Figure 4.2a: Age-Specific Fertility Rates by Municipality: 1994
0.0
0.1
0.2
0.3
15-19 20-24 25-29 30-34 35-39 40-44 45-49
Age of Woman
Chi
ldre
n pe
r W
oman
LeluMalemUtweTafunsak
Figure 4.2b: Age-Specific Fertility Rates by Municipality: 2000
0.0
0.1
0.2
0.3
15-19 20-24 25-29 30-34 35-39 40-44 45-49
Age of Woman
Chi
ldre
n pe
r W
oman
LeluMalemUtweTafunsak
Figure 4.2 shows fertility pattern by age groups. Fertility peaks at age 25 to 29 in all the municipalities except for Lelu (at ages 15 to 19). Children ever born per woman provides the total number of children a woman is likely to have had by the time she has reached a specified age group. This measure does not reflect current fertility, except for the youngest age group. The final age groups, ages 40 to 44 and 45 to 49, and gives an estimate of lifetime fertility. Women in the state of Kosrae who were finishing their reproductive years (ages 45 to 49) had on average 6.7 in 1994 and decline to 5.4 in 2000 (Table 4.9). Similar to the total fertility rates, Utwe had the smaller number of children ever born per mother. Women in Lelu, Malem and Tafunsak had about 5.5 children per women while women in Utwe had about 5.0 children per mother by the ages of 44 years. The pattern continue in 2000 for the age group 45 to 49 with Utwe being the lowest and the other three municipality had about 5.0 age groups, probably because of the small number of women in that age group and also due to reporting errors. Table 4.9: Children Ever Born per Woman by Municipality, Kosrae State: 1994 and 2000
1994 Census 2000 Census Age of Mother Total Lelu Malem Utwe Tafunsak Total Lelu Malem Utwe Tafunsak
15 to 19 years 0.099 0.133 0.074 0.045 0.113 0.054 0.037 0.074 0.086 0.045 20 to 24 years 0.820 0.707 0.979 0.636 0.931 0.607 0.530 0.563 0.513 0.752 25 to 29 years 1.831 1.696 2.065 2.162 1.685 1.788 1.554 2.000 1.571 1.953 30 to 34 years 3.025 2.861 3.257 3.462 2.915 0.813 2.523 2.962 2.914 2.914 35 to 39 years 4.251 4.146 4.378 3.607 4.542 3.819 3.514 4.049 3.516 4.110 40 to 44 years 5.365 5.466 5.486 4.973 5.458 4.963 5.163 5.106 4.154 4.937 45 to 49 years 6.740 6.600 6.409 7.208 6.780 5.361 5.544 5.033 4.722 5.776 Source: 1994 & 2000 FSM Census, Table B03 4.4 Conclusion Kosrae had a total fertility rate of 3.9 in the 1994 Census while the 2000 FSM Census data showed that the total fertility rate declined to 3.8. This rate is high by world standards and creates a rapidly growing population.
Chapter 4. Fertility 2000 FSM Census of Kosrae
30 Kosrae Branch Statistics Office, Division of Statistics, FSM Department of Economic Affairs
Fertility levels in Kosrae continue to decrease, as they have been for the past two decades. Furthermore, the TFR had declined from about 8 in 1973 to about 4 in 2000, a decline of about 1 child in 12 years. The decline was, however, faster since 1986. The TFR decreased by more than 2 children during 1986 throughout 1994. Fertility rates were lower for those women with higher education and those women who were in the labor force. It also appears that the current age specific fertility rate was lower partly because of the use of family planning method. Fertility planning in Kosrae State is therefore yet to have its desired effect.
Kosrae Branch Statistics Office, Division of Statistics, FSM Department of Economic Affairs 31
CHAPTER 5 MORTALITY Introduction As reported in Chapter 4, fertility rates in the State of Kosrae are declining. However, mortality rates in Kosrae have been brought to a low level, and thus little decline occurred in the recent past. This has contributed to the moderation of the growth rate. In this chapter we estimate mortality indirectly for the state of Kosrae, to find the effect of mortality reduction on growth and to compare mortality over time. Data Description Mortality cannot be estimated through direct methods from the 1994 and 2000 FSM Censuses because no direct questions were asked regarding deaths. Indirect estimates of early age mortality can be derived from the questions concerning children ever born and children still alive (questionnaire items 17a & b). The proportion of children surviving can be applied to model life tables to produce basic mortality rates. Children ever born and surviving were asked to women in the 1973 and 1980 Censuses as well and data are provided for comparison. Mortality indices of interest are crude death rate, infant mortality rate, child mortality rate, and life expectancy at birth. The crude death rate (CDR) is the most common direct measure of mortality and is defined as the number of deaths per 1,000 persons. Similar to the crude birth rate, the crude death rate is dependent on the age-sex structure, thus it is a crude measure. An adjustment must be made before any attempt can compare mortality over time or for different regions or countries. The infant mortality rate (IMR) is defined as the number of infant deaths per 1,000 live births during the year. The IMR is a good indicator of the quality of health care in a nation because mortality is high during the first months of life and small improvements can be measured. It is also an adjusted measure that is not dependent on the age-sex structure of a region. The child mortality rate is defined as the probability of dying between ages 1 and 5. Life expectancy at birth is the average number of years a newborn baby can expect to live, given the current level and pattern of mortality. Unlike the crude birth rate this measure is independent of the age structure of a nation and is thus a good measure for comparison between countries or regions. Life expectancy is obtained from a life table constructed based on a set of age specific death rate, from which probability of surviving to a specific age is determined. These survival probabilities are applied to an assumed cohort of births that occurred in the same year, following the survivors as they reach successive ages until all have eventually died. From the total number of all years lived, the probability of survival from one age to another and the life expectancies at the various ages are estimated (see Arriaga, 1994 pp 74 – 83 for details on the derivation). In Kosrae, however, deaths are under-registered, making it difficult to obtain the life table from age specific death rates calculated from registration data. As an alternative, a life table implied by childhood survivorship ratios has been presented in this chapter. Analysis of Mortality Data Crude Death Rate (CDR) Direct measures of mortality are calculated using deaths registered with the Department of Health. Unfortunately these events are under-registered and inconsistently covered, providing only a guide to the patterns of mortality but not to the level. To compensate for the different levels of coverage and to smooth some erratic patterns, Table 5.1 presents three four-year averages of mortality rates. In both cases the CDR comes to approximately 5 per 1,000 persons, which, as we will see is under reported. The CDR is calculated using the total number of deaths in a year divided by the estimated mid-year population. Age-specific mortality rates in the case of the Kosrae were erratic and inaccurate because of the small number of persons and deaths and because of inaccuracies in reporting. The reported age specific death rates also shows that the coverage problem was significant for childhood mortality. Direct estimation of mortality is not possible without an accurate and complete vital registration system. Kosrae State must make greater efforts to improve the coverage of the vital registration program.
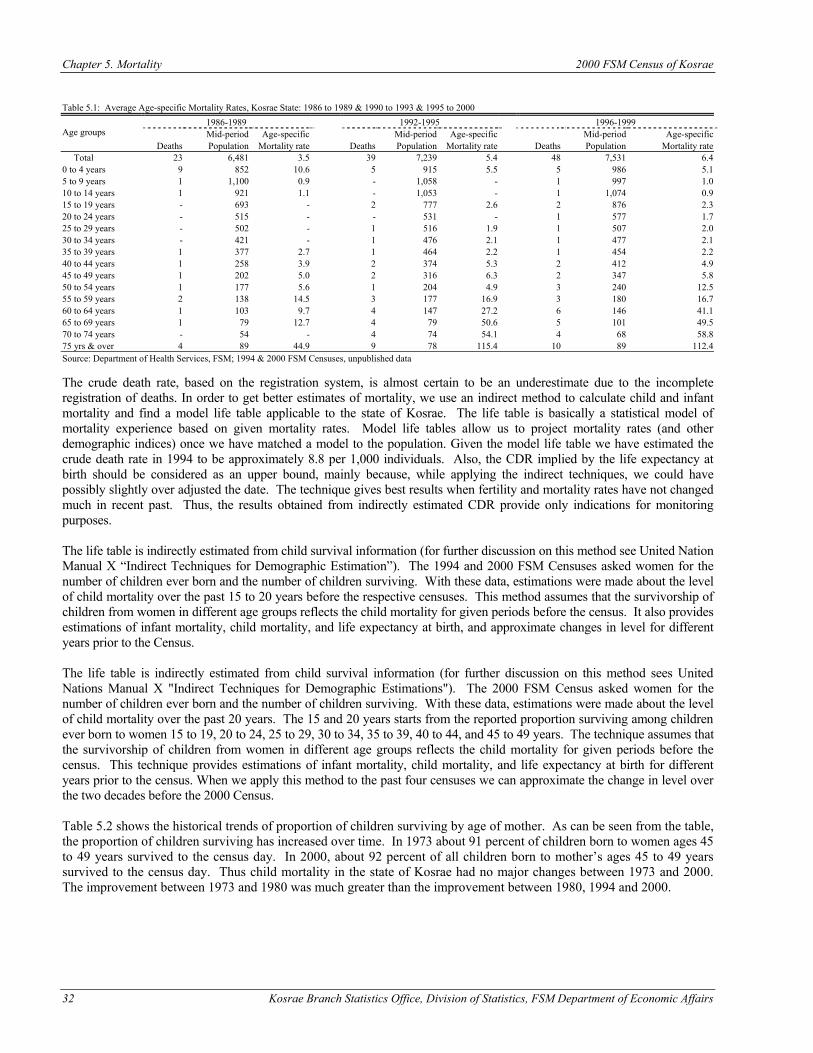
Chapter 5. Mortality 2000 FSM Census of Kosrae
32 Kosrae Branch Statistics Office, Division of Statistics, FSM Department of Economic Affairs
Table 5.1: Average Age-specific Mortality Rates, Kosrae State: 1986 to 1989 & 1990 to 1993 & 1995 to 2000
1986-1989 1992-1995 1996-1999 Mid-period Age-specific Mid-period Age-specific Mid-period Age-specific Age groups
Deaths Population Mortality rate Deaths Population Mortality rate Deaths Population Mortality rate Total 23 6,481 3.5 39 7,239 5.4 48 7,531 6.4 0 to 4 years 9 852 10.6 5 915 5.5 5 986 5.1 5 to 9 years 1 1,100 0.9 - 1,058 - 1 997 1.0 10 to 14 years 1 921 1.1 - 1,053 - 1 1,074 0.9 15 to 19 years - 693 - 2 777 2.6 2 876 2.3 20 to 24 years - 515 - - 531 - 1 577 1.7 25 to 29 years - 502 - 1 516 1.9 1 507 2.0 30 to 34 years - 421 - 1 476 2.1 1 477 2.1 35 to 39 years 1 377 2.7 1 464 2.2 1 454 2.2 40 to 44 years 1 258 3.9 2 374 5.3 2 412 4.9 45 to 49 years 1 202 5.0 2 316 6.3 2 347 5.8 50 to 54 years 1 177 5.6 1 204 4.9 3 240 12.5 55 to 59 years 2 138 14.5 3 177 16.9 3 180 16.7 60 to 64 years 1 103 9.7 4 147 27.2 6 146 41.1 65 to 69 years 1 79 12.7 4 79 50.6 5 101 49.5 70 to 74 years - 54 - 4 74 54.1 4 68 58.8 75 yrs & over 4 89 44.9 9 78 115.4 10 89 112.4 Source: Department of Health Services, FSM; 1994 & 2000 FSM Censuses, unpublished data The crude death rate, based on the registration system, is almost certain to be an underestimate due to the incomplete registration of deaths. In order to get better estimates of mortality, we use an indirect method to calculate child and infant mortality and find a model life table applicable to the state of Kosrae. The life table is basically a statistical model of mortality experience based on given mortality rates. Model life tables allow us to project mortality rates (and other demographic indices) once we have matched a model to the population. Given the model life table we have estimated the crude death rate in 1994 to be approximately 8.8 per 1,000 individuals. Also, the CDR implied by the life expectancy at birth should be considered as an upper bound, mainly because, while applying the indirect techniques, we could have possibly slightly over adjusted the date. The technique gives best results when fertility and mortality rates have not changed much in recent past. Thus, the results obtained from indirectly estimated CDR provide only indications for monitoring purposes. The life table is indirectly estimated from child survival information (for further discussion on this method see United Nation Manual X “Indirect Techniques for Demographic Estimation”). The 1994 and 2000 FSM Censuses asked women for the number of children ever born and the number of children surviving. With these data, estimations were made about the level of child mortality over the past 15 to 20 years before the respective censuses. This method assumes that the survivorship of children from women in different age groups reflects the child mortality for given periods before the census. It also provides estimations of infant mortality, child mortality, and life expectancy at birth, and approximate changes in level for different years prior to the Census. The life table is indirectly estimated from child survival information (for further discussion on this method sees United Nations Manual X "Indirect Techniques for Demographic Estimations"). The 2000 FSM Census asked women for the number of children ever born and the number of children surviving. With these data, estimations were made about the level of child mortality over the past 20 years. The 15 and 20 years starts from the reported proportion surviving among children ever born to women 15 to 19, 20 to 24, 25 to 29, 30 to 34, 35 to 39, 40 to 44, and 45 to 49 years. The technique assumes that the survivorship of children from women in different age groups reflects the child mortality for given periods before the census. This technique provides estimations of infant mortality, child mortality, and life expectancy at birth for different years prior to the census. When we apply this method to the past four censuses we can approximate the change in level over the two decades before the 2000 Census. Table 5.2 shows the historical trends of proportion of children surviving by age of mother. As can be seen from the table, the proportion of children surviving has increased over time. In 1973 about 91 percent of children born to women ages 45 to 49 years survived to the census day. In 2000, about 92 percent of all children born to mother’s ages 45 to 49 years survived to the census day. Thus child mortality in the state of Kosrae had no major changes between 1973 and 2000. The improvement between 1973 and 1980 was much greater than the improvement between 1980, 1994 and 2000.
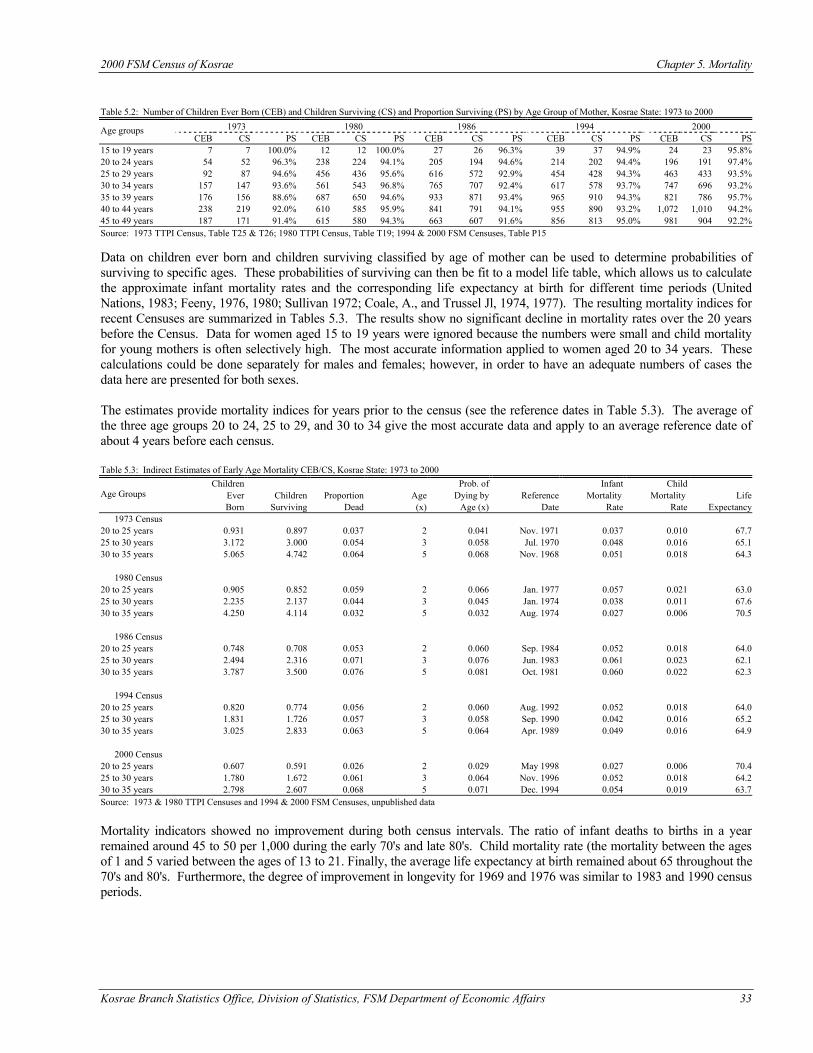
2000 FSM Census of Kosrae Chapter 5. Mortality
Kosrae Branch Statistics Office, Division of Statistics, FSM Department of Economic Affairs 33
Table 5.2: Number of Children Ever Born (CEB) and Children Surviving (CS) and Proportion Surviving (PS) by Age Group of Mother, Kosrae State: 1973 to 2000
1973 1980 1986 1994 2000 Age groups CEB CS PS CEB CS PS CEB CS PS CEB CS PS CEB CS PS
15 to 19 years 7 7 100.0% 12 12 100.0% 27 26 96.3% 39 37 94.9% 24 23 95.8% 20 to 24 years 54 52 96.3% 238 224 94.1% 205 194 94.6% 214 202 94.4% 196 191 97.4% 25 to 29 years 92 87 94.6% 456 436 95.6% 616 572 92.9% 454 428 94.3% 463 433 93.5% 30 to 34 years 157 147 93.6% 561 543 96.8% 765 707 92.4% 617 578 93.7% 747 696 93.2% 35 to 39 years 176 156 88.6% 687 650 94.6% 933 871 93.4% 965 910 94.3% 821 786 95.7% 40 to 44 years 238 219 92.0% 610 585 95.9% 841 791 94.1% 955 890 93.2% 1,072 1,010 94.2% 45 to 49 years 187 171 91.4% 615 580 94.3% 663 607 91.6% 856 813 95.0% 981 904 92.2% Source: 1973 TTPI Census, Table T25 & T26; 1980 TTPI Census, Table T19; 1994 & 2000 FSM Censuses, Table P15 Data on children ever born and children surviving classified by age of mother can be used to determine probabilities of surviving to specific ages. These probabilities of surviving can then be fit to a model life table, which allows us to calculate the approximate infant mortality rates and the corresponding life expectancy at birth for different time periods (United Nations, 1983; Feeny, 1976, 1980; Sullivan 1972; Coale, A., and Trussel Jl, 1974, 1977). The resulting mortality indices for recent Censuses are summarized in Tables 5.3. The results show no significant decline in mortality rates over the 20 years before the Census. Data for women aged 15 to 19 years were ignored because the numbers were small and child mortality for young mothers is often selectively high. The most accurate information applied to women aged 20 to 34 years. These calculations could be done separately for males and females; however, in order to have an adequate numbers of cases the data here are presented for both sexes. The estimates provide mortality indices for years prior to the census (see the reference dates in Table 5.3). The average of the three age groups 20 to 24, 25 to 29, and 30 to 34 give the most accurate data and apply to an average reference date of about 4 years before each census. Table 5.3: Indirect Estimates of Early Age Mortality CEB/CS, Kosrae State: 1973 to 2000
Children Prob. of Infant Child Ever Children Proportion Age Dying by Reference Mortality Mortality Life Age Groups Born Surviving Dead (x) Age (x) Date Rate Rate Expectancy
1973 Census 20 to 25 years 0.931 0.897 0.037 2 0.041 Nov. 1971 0.037 0.010 67.7 25 to 30 years 3.172 3.000 0.054 3 0.058 Jul. 1970 0.048 0.016 65.1 30 to 35 years 5.065 4.742 0.064 5 0.068 Nov. 1968 0.051 0.018 64.3 1980 Census 20 to 25 years 0.905 0.852 0.059 2 0.066 Jan. 1977 0.057 0.021 63.0 25 to 30 years 2.235 2.137 0.044 3 0.045 Jan. 1974 0.038 0.011 67.6 30 to 35 years 4.250 4.114 0.032 5 0.032 Aug. 1974 0.027 0.006 70.5 1986 Census 20 to 25 years 0.748 0.708 0.053 2 0.060 Sep. 1984 0.052 0.018 64.0 25 to 30 years 2.494 2.316 0.071 3 0.076 Jun. 1983 0.061 0.023 62.1 30 to 35 years 3.787 3.500 0.076 5 0.081 Oct. 1981 0.060 0.022 62.3 1994 Census 20 to 25 years 0.820 0.774 0.056 2 0.060 Aug. 1992 0.052 0.018 64.0 25 to 30 years 1.831 1.726 0.057 3 0.058 Sep. 1990 0.042 0.016 65.2 30 to 35 years 3.025 2.833 0.063 5 0.064 Apr. 1989 0.049 0.016 64.9 2000 Census 20 to 25 years 0.607 0.591 0.026 2 0.029 May 1998 0.027 0.006 70.4 25 to 30 years 1.780 1.672 0.061 3 0.064 Nov. 1996 0.052 0.018 64.2 30 to 35 years 2.798 2.607 0.068 5 0.071 Dec. 1994 0.054 0.019 63.7 Source: 1973 & 1980 TTPI Censuses and 1994 & 2000 FSM Censuses, unpublished data Mortality indicators showed no improvement during both census intervals. The ratio of infant deaths to births in a year remained around 45 to 50 per 1,000 during the early 70's and late 80's. Child mortality rate (the mortality between the ages of 1 and 5 varied between the ages of 13 to 21. Finally, the average life expectancy at birth remained about 65 throughout the 70's and 80's. Furthermore, the degree of improvement in longevity for 1969 and 1976 was similar to 1983 and 1990 census periods.
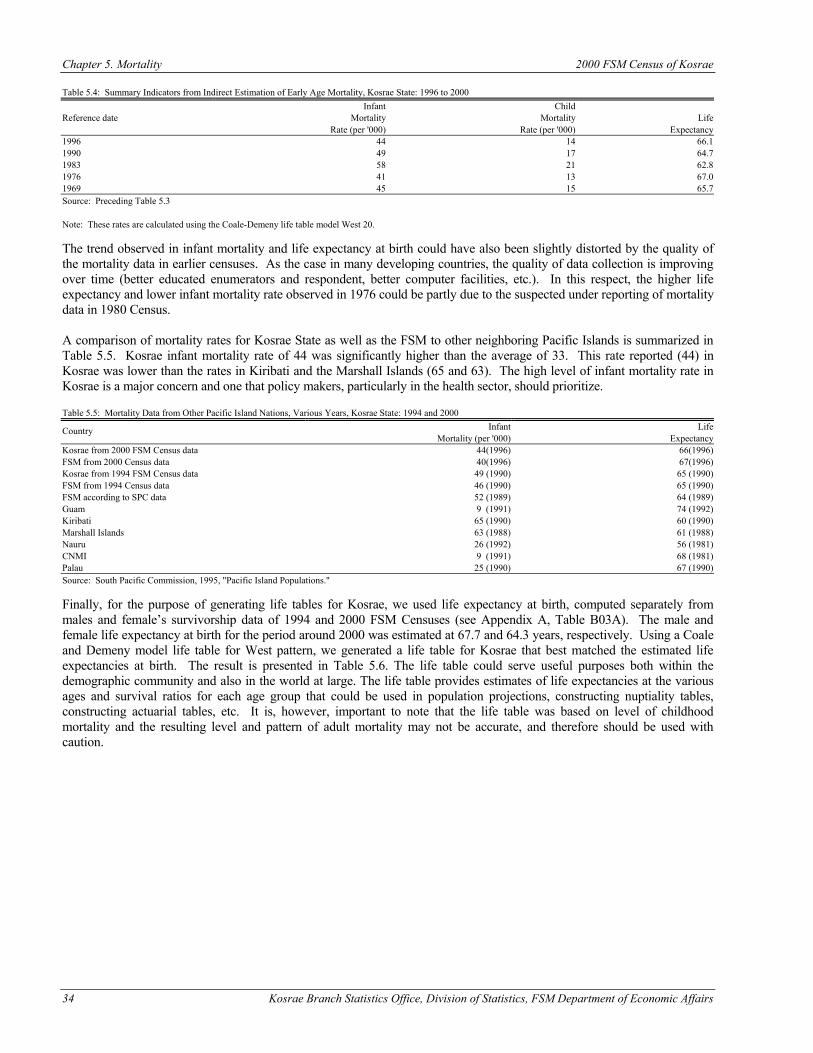
Chapter 5. Mortality 2000 FSM Census of Kosrae
34 Kosrae Branch Statistics Office, Division of Statistics, FSM Department of Economic Affairs
Table 5.4: Summary Indicators from Indirect Estimation of Early Age Mortality, Kosrae State: 1996 to 2000 Infant Child Reference date Mortality Mortality Life Rate (per '000) Rate (per '000) Expectancy 1996 44 14 66.1 1990 49 17 64.7 1983 58 21 62.8 1976 41 13 67.0 1969 45 15 65.7 Source: Preceding Table 5.3 Note: These rates are calculated using the Coale-Demeny life table model West 20. The trend observed in infant mortality and life expectancy at birth could have also been slightly distorted by the quality of the mortality data in earlier censuses. As the case in many developing countries, the quality of data collection is improving over time (better educated enumerators and respondent, better computer facilities, etc.). In this respect, the higher life expectancy and lower infant mortality rate observed in 1976 could be partly due to the suspected under reporting of mortality data in 1980 Census. A comparison of mortality rates for Kosrae State as well as the FSM to other neighboring Pacific Islands is summarized in Table 5.5. Kosrae infant mortality rate of 44 was significantly higher than the average of 33. This rate reported (44) in Kosrae was lower than the rates in Kiribati and the Marshall Islands (65 and 63). The high level of infant mortality rate in Kosrae is a major concern and one that policy makers, particularly in the health sector, should prioritize. Table 5.5: Mortality Data from Other Pacific Island Nations, Various Years, Kosrae State: 1994 and 2000
Infant Life Country Mortality (per '000) Expectancy
Kosrae from 2000 FSM Census data 44(1996) 66(1996) FSM from 2000 Census data 40(1996) 67(1996) Kosrae from 1994 FSM Census data 49 (1990) 65 (1990) FSM from 1994 Census data 46 (1990) 65 (1990) FSM according to SPC data 52 (1989) 64 (1989) Guam 9 (1991) 74 (1992) Kiribati 65 (1990) 60 (1990) Marshall Islands 63 (1988) 61 (1988) Nauru 26 (1992) 56 (1981) CNMI 9 (1991) 68 (1981) Palau 25 (1990) 67 (1990) Source: South Pacific Commission, 1995, "Pacific Island Populations." Finally, for the purpose of generating life tables for Kosrae, we used life expectancy at birth, computed separately from males and female’s survivorship data of 1994 and 2000 FSM Censuses (see Appendix A, Table B03A). The male and female life expectancy at birth for the period around 2000 was estimated at 67.7 and 64.3 years, respectively. Using a Coale and Demeny model life table for West pattern, we generated a life table for Kosrae that best matched the estimated life expectancies at birth. The result is presented in Table 5.6. The life table could serve useful purposes both within the demographic community and also in the world at large. The life table provides estimates of life expectancies at the various ages and survival ratios for each age group that could be used in population projections, constructing nuptiality tables, constructing actuarial tables, etc. It is, however, important to note that the life table was based on level of childhood mortality and the resulting level and pattern of adult mortality may not be accurate, and therefore should be used with caution.
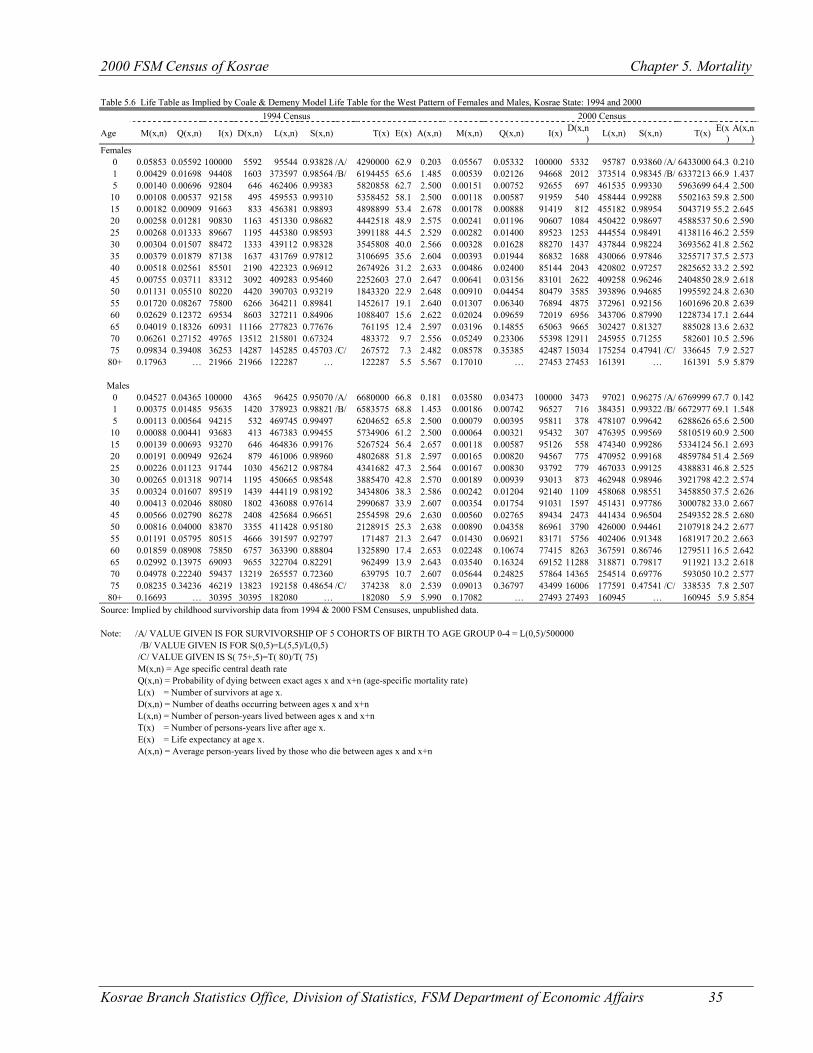
2000 FSM Census of Kosrae Chapter 5. Mortality
Kosrae Branch Statistics Office, Division of Statistics, FSM Department of Economic Affairs 35
Table 5.6 Life Table as Implied by Coale & Demeny Model Life Table for the West Pattern of Females and Males, Kosrae State: 1994 and 2000 1994 Census 2000 Census
Age M(x,n) Q(x,n) I(x) D(x,n) L(x,n) S(x,n) T(x) E(x) A(x,n) M(x,n) Q(x,n) I(x) D(x,n) L(x,n) S(x,n) T(x) E(x
) A(x,n
) Females
0 0.05853 0.05592 100000 5592 95544 0.93828 /A/ 4290000 62.9 0.203 0.05567 0.05332 100000 5332 95787 0.93860 /A/ 6433000 64.3 0.210 1 0.00429 0.01698 94408 1603 373597 0.98564 /B/ 6194455 65.6 1.485 0.00539 0.02126 94668 2012 373514 0.98345 /B/ 6337213 66.9 1.437 5 0.00140 0.00696 92804 646 462406 0.99383 5820858 62.7 2.500 0.00151 0.00752 92655 697 461535 0.99330 5963699 64.4 2.500
10 0.00108 0.00537 92158 495 459553 0.99310 5358452 58.1 2.500 0.00118 0.00587 91959 540 458444 0.99288 5502163 59.8 2.500 15 0.00182 0.00909 91663 833 456381 0.98893 4898899 53.4 2.678 0.00178 0.00888 91419 812 455182 0.98954 5043719 55.2 2.645 20 0.00258 0.01281 90830 1163 451330 0.98682 4442518 48.9 2.575 0.00241 0.01196 90607 1084 450422 0.98697 4588537 50.6 2.590 25 0.00268 0.01333 89667 1195 445380 0.98593 3991188 44.5 2.529 0.00282 0.01400 89523 1253 444554 0.98491 4138116 46.2 2.559 30 0.00304 0.01507 88472 1333 439112 0.98328 3545808 40.0 2.566 0.00328 0.01628 88270 1437 437844 0.98224 3693562 41.8 2.562 35 0.00379 0.01879 87138 1637 431769 0.97812 3106695 35.6 2.604 0.00393 0.01944 86832 1688 430066 0.97846 3255717 37.5 2.573 40 0.00518 0.02561 85501 2190 422323 0.96912 2674926 31.2 2.633 0.00486 0.02400 85144 2043 420802 0.97257 2825652 33.2 2.592 45 0.00755 0.03711 83312 3092 409283 0.95460 2252603 27.0 2.647 0.00641 0.03156 83101 2622 409258 0.96246 2404850 28.9 2.618 50 0.01131 0.05510 80220 4420 390703 0.93219 1843320 22.9 2.648 0.00910 0.04454 80479 3585 393896 0.94685 1995592 24.8 2.630 55 0.01720 0.08267 75800 6266 364211 0.89841 1452617 19.1 2.640 0.01307 0.06340 76894 4875 372961 0.92156 1601696 20.8 2.639 60 0.02629 0.12372 69534 8603 327211 0.84906 1088407 15.6 2.622 0.02024 0.09659 72019 6956 343706 0.87990 1228734 17.1 2.644 65 0.04019 0.18326 60931 11166 277823 0.77676 761195 12.4 2.597 0.03196 0.14855 65063 9665 302427 0.81327 885028 13.6 2.632 70 0.06261 0.27152 49765 13512 215801 0.67324 483372 9.7 2.556 0.05249 0.23306 55398 12911 245955 0.71255 582601 10.5 2.596 75 0.09834 0.39408 36253 14287 145285 0.45703 /C/ 267572 7.3 2.482 0.08578 0.35385 42487 15034 175254 0.47941 /C/ 336645 7.9 2.527
80+ 0.17963 … 21966 21966 122287 … 122287 5.5 5.567 0.17010 … 27453 27453 161391 … 161391 5.9 5.879
Males 0 0.04527 0.04365 100000 4365 96425 0.95070 /A/ 6680000 66.8 0.181 0.03580 0.03473 100000 3473 97021 0.96275 /A/ 6769999 67.7 0.142 1 0.00375 0.01485 95635 1420 378923 0.98821 /B/ 6583575 68.8 1.453 0.00186 0.00742 96527 716 384351 0.99322 /B/ 6672977 69.1 1.548 5 0.00113 0.00564 94215 532 469745 0.99497 6204652 65.8 2.500 0.00079 0.00395 95811 378 478107 0.99642 6288626 65.6 2.500
10 0.00088 0.00441 93683 413 467383 0.99455 5734906 61.2 2.500 0.00064 0.00321 95432 307 476395 0.99569 5810519 60.9 2.500 15 0.00139 0.00693 93270 646 464836 0.99176 5267524 56.4 2.657 0.00118 0.00587 95126 558 474340 0.99286 5334124 56.1 2.693 20 0.00191 0.00949 92624 879 461006 0.98960 4802688 51.8 2.597 0.00165 0.00820 94567 775 470952 0.99168 4859784 51.4 2.569 25 0.00226 0.01123 91744 1030 456212 0.98784 4341682 47.3 2.564 0.00167 0.00830 93792 779 467033 0.99125 4388831 46.8 2.525 30 0.00265 0.01318 90714 1195 450665 0.98548 3885470 42.8 2.570 0.00189 0.00939 93013 873 462948 0.98946 3921798 42.2 2.574 35 0.00324 0.01607 89519 1439 444119 0.98192 3434806 38.3 2.586 0.00242 0.01204 92140 1109 458068 0.98551 3458850 37.5 2.626 40 0.00413 0.02046 88080 1802 436088 0.97614 2990687 33.9 2.607 0.00354 0.01754 91031 1597 451431 0.97786 3000782 33.0 2.667 45 0.00566 0.02790 86278 2408 425684 0.96651 2554598 29.6 2.630 0.00560 0.02765 89434 2473 441434 0.96504 2549352 28.5 2.680 50 0.00816 0.04000 83870 3355 411428 0.95180 2128915 25.3 2.638 0.00890 0.04358 86961 3790 426000 0.94461 2107918 24.2 2.677 55 0.01191 0.05795 80515 4666 391597 0.92797 171487 21.3 2.647 0.01430 0.06921 83171 5756 402406 0.91348 1681917 20.2 2.663 60 0.01859 0.08908 75850 6757 363390 0.88804 1325890 17.4 2.653 0.02248 0.10674 77415 8263 367591 0.86746 1279511 16.5 2.642 65 0.02992 0.13975 69093 9655 322704 0.82291 962499 13.9 2.643 0.03540 0.16324 69152 11288 318871 0.79817 911921 13.2 2.618 70 0.04978 0.22240 59437 13219 265557 0.72360 639795 10.7 2.607 0.05644 0.24825 57864 14365 254514 0.69776 593050 10.2 2.577 75 0.08235 0.34236 46219 13823 192158 0.48654 /C/ 374238 8.0 2.539 0.09013 0.36797 43499 16006 177591 0.47541 /C/ 338535 7.8 2.507
80+ 0.16693 … 30395 30395 182080 … 182080 5.9 5.990 0.17082 … 27493 27493 160945 … 160945 5.9 5.854 Source: Implied by childhood survivorship data from 1994 & 2000 FSM Censuses, unpublished data. Note: /A/ VALUE GIVEN IS FOR SURVIVORSHIP OF 5 COHORTS OF BIRTH TO AGE GROUP 0-4 = L(0,5)/500000 /B/ VALUE GIVEN IS FOR S(0,5)=L(5,5)/L(0,5) /C/ VALUE GIVEN IS S( 75+,5)=T( 80)/T( 75) M(x,n) = Age specific central death rate Q(x,n) = Probability of dying between exact ages x and x+n (age-specific mortality rate) L(x) = Number of survivors at age x. D(x,n) = Number of deaths occurring between ages x and x+n L(x,n) = Number of person-years lived between ages x and x+n T(x) = Number of persons-years live after age x. E(x) = Life expectancy at age x. A(x,n) = Average person-years lived by those who die between ages x and x+n
Chapter 5. Mortality 2000 FSM Census of Kosrae
36 Kosrae Branch Statistics Office, Division of Statistics, FSM Department of Economic Affairs
Conclusion Census information collected from the 2000 FSM Census suggests that Kosrae State life expectancy increased by less than 2 years in 1983 and 1990. The results for 1973 and 1980 Censuses indicated even higher life expectancy than the recent Census. The result for the earlier Census, however, was based on fewer cases, whereby omission of one or two cases could distort the overall mortality estimate. Direct estimation of mortality is not possible without an accurate and complete vital registration system. The state of Kosrae must make greater efforts to improve the coverage of the vital registration program. The level of mortality was second highest in FSM (that is, next to Chuuk). It has also been indicated that Kosrae mortality level was still among the highest compared to the neighboring Pacific Island nations (both in terms of life expectancy and infant mortality) and the decline in infant mortality rate was not satisfactory. Given the result of the 2000 Census alone, the high level of Infant mortality rate should be a real worry for Kosrae state policy makers, particularly in the Health sector.
Kosrae Branch Statistics Office, Division of Statistics, FSM Department of Economic Affairs 37
CHAPTER 6 MIGRATION
Introduction In previous chapters we discussed several demographic topics including population structure, fertility, and mortality. From these discussions, it is very clear that migration plays an important role in the population dynamics of the Kosrae. Migration is one of the main determinants of population size and growth (the others are fertility and mortality). Some people migrate for employment, others for education, vacationing, visiting, and so forth. Migration involves movement from one place to another. In the case of Kosrae, three types of migration are present; internal migration (within Kosrae state), interstate migration (between Kosrae and other FSM states), and international migration (between Kosrae and outside Kosrae—including the other FSM states). A person who migrates is referred to as an immigrant or in-migrant with respect to the area of destination, and an emigrant or out-migrant with respect to the place of origin (in each case the former term is used for international migration and the latter for internal migration). Censuses, as we shall see, are not the most reliable sources for measuring international migration. Data from other sources will be used in this report to provide at least some insight into emigration from Kosrae. On the other hand, the census is a reliable source for measuring internal and interstate migration. Migration has emerged as an extremely important factor shaping the demography of the Pacific (Connell, 1990). This is true for Kosrae, although the levels and patterns of migration differ in many respects from other parts of the Pacific. Because the Census asks different questions about migration, it actually defines migration in different ways for different purposes. This is an important point for census data users to understand because it means that different migration figures presented in the different tables may not be strictly comparable with each other. For example, even though data on birthplace and residence 5 years ago provide a basis for measuring migration, the measures so obtained are defined differently, serve different purposes, and are not comparable. For the same reason, unlike with fertility or mortality, it is not easy to make comparisons of levels of internal migration between different countries. Data Description Birthplace The 1994 and 2000 Censuses asked everyone for details of place of birth and recorded island/village, municipality, and FSM state if a person was born in the FSM. When a person's birthplace was outside FSM, the name of the foreign country was recorded. This was obtained from questionnaire item P8. Citizenship and Legal Residence Details of citizenship were obtained for all persons in the FSM. The question requested the municipality and state of legal residence (place where a person is a registered voter) for FSM citizens. For non-FSM citizens, the country of citizenship was recorded. Continuous Residence Continuous residence was obtained from questionnaire item P11a and P11b asked of all persons residing in Kosrae. The question requested respondents to provide the month and year they started living continuously at the present place of residence. If respondents had not been living continuously in the present residence since birth, they were requested to provide the name of the municipality, FSM State, or foreign country in which they previously resided. Residence in 1995 All individuals who responded that they lived in a different municipality or overseas on April 1, 1995 (five years prior to the census) were requested to give the name of the municipality and FSM State, or foreign country of residence. Limitations and Comparability. Due to changes in the boundaries of foreign countries over the past decades, some persons may have reported their place of birth in terms of boundaries that existed at the time of their birth but have since changed. Not all migratory moves in the five years before the census were covered. For example, some persons may have resided in the same place in the 1995 and 2000 but moved in the interim. This migration was not taken into account. The migratory
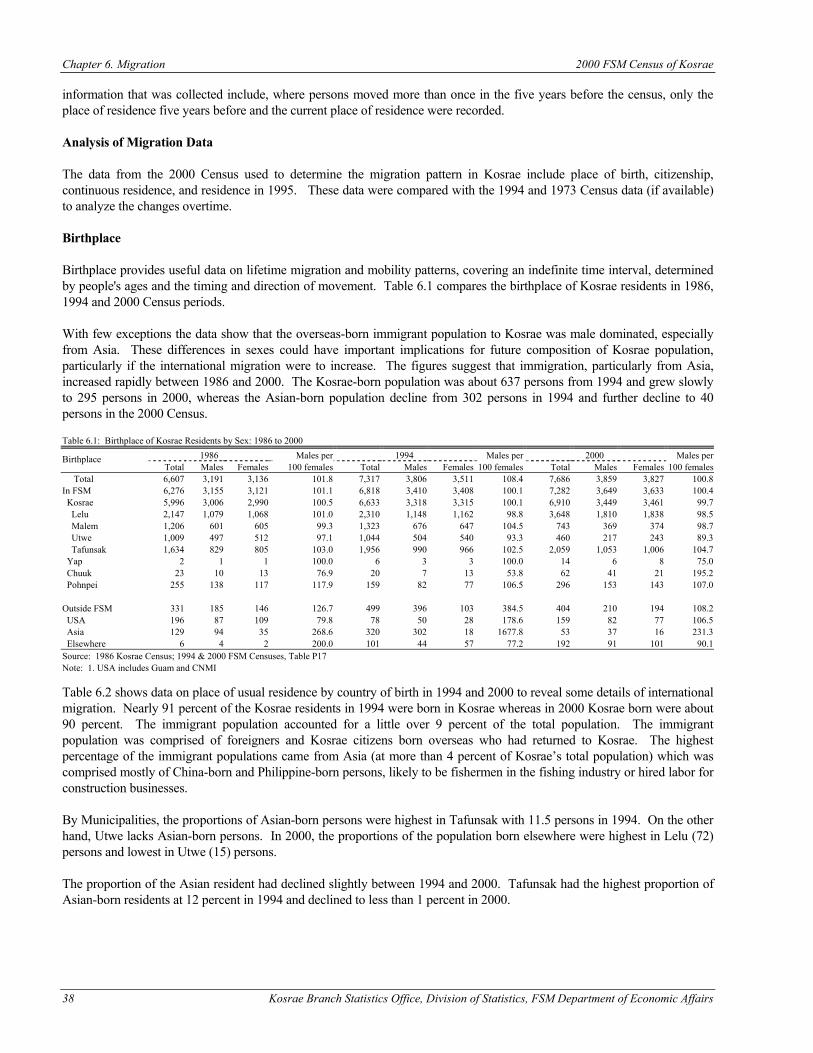
Chapter 6. Migration 2000 FSM Census of Kosrae
38 Kosrae Branch Statistics Office, Division of Statistics, FSM Department of Economic Affairs
information that was collected include, where persons moved more than once in the five years before the census, only the place of residence five years before and the current place of residence were recorded. Analysis of Migration Data The data from the 2000 Census used to determine the migration pattern in Kosrae include place of birth, citizenship, continuous residence, and residence in 1995. These data were compared with the 1994 and 1973 Census data (if available) to analyze the changes overtime. Birthplace Birthplace provides useful data on lifetime migration and mobility patterns, covering an indefinite time interval, determined by people's ages and the timing and direction of movement. Table 6.1 compares the birthplace of Kosrae residents in 1986, 1994 and 2000 Census periods. With few exceptions the data show that the overseas-born immigrant population to Kosrae was male dominated, especially from Asia. These differences in sexes could have important implications for future composition of Kosrae population, particularly if the international migration were to increase. The figures suggest that immigration, particularly from Asia, increased rapidly between 1986 and 2000. The Kosrae-born population was about 637 persons from 1994 and grew slowly to 295 persons in 2000, whereas the Asian-born population decline from 302 persons in 1994 and further decline to 40 persons in the 2000 Census. Table 6.1: Birthplace of Kosrae Residents by Sex: 1986 to 2000
1986 Males per 1994 Males per 2000 Males per Birthplace Total Males Females 100 females Total Males Females 100 females Total Males Females 100 females
Total 6,607 3,191 3,136 101.8 7,317 3,806 3,511 108.4 7,686 3,859 3,827 100.8 In FSM 6,276 3,155 3,121 101.1 6,818 3,410 3,408 100.1 7,282 3,649 3,633 100.4 Kosrae 5,996 3,006 2,990 100.5 6,633 3,318 3,315 100.1 6,910 3,449 3,461 99.7 Lelu 2,147 1,079 1,068 101.0 2,310 1,148 1,162 98.8 3,648 1,810 1,838 98.5 Malem 1,206 601 605 99.3 1,323 676 647 104.5 743 369 374 98.7 Utwe 1,009 497 512 97.1 1,044 504 540 93.3 460 217 243 89.3 Tafunsak 1,634 829 805 103.0 1,956 990 966 102.5 2,059 1,053 1,006 104.7 Yap 2 1 1 100.0 6 3 3 100.0 14 6 8 75.0 Chuuk 23 10 13 76.9 20 7 13 53.8 62 41 21 195.2 Pohnpei 255 138 117 117.9 159 82 77 106.5 296 153 143 107.0 Outside FSM 331 185 146 126.7 499 396 103 384.5 404 210 194 108.2 USA 196 87 109 79.8 78 50 28 178.6 159 82 77 106.5 Asia 129 94 35 268.6 320 302 18 1677.8 53 37 16 231.3 Elsewhere 6 4 2 200.0 101 44 57 77.2 192 91 101 90.1 Source: 1986 Kosrae Census; 1994 & 2000 FSM Censuses, Table P17 Note: 1. USA includes Guam and CNMI Table 6.2 shows data on place of usual residence by country of birth in 1994 and 2000 to reveal some details of international migration. Nearly 91 percent of the Kosrae residents in 1994 were born in Kosrae whereas in 2000 Kosrae born were about 90 percent. The immigrant population accounted for a little over 9 percent of the total population. The immigrant population was comprised of foreigners and Kosrae citizens born overseas who had returned to Kosrae. The highest percentage of the immigrant populations came from Asia (at more than 4 percent of Kosrae’s total population) which was comprised mostly of China-born and Philippine-born persons, likely to be fishermen in the fishing industry or hired labor for construction businesses. By Municipalities, the proportions of Asian-born persons were highest in Tafunsak with 11.5 persons in 1994. On the other hand, Utwe lacks Asian-born persons. In 2000, the proportions of the population born elsewhere were highest in Lelu (72) persons and lowest in Utwe (15) persons. The proportion of the Asian resident had declined slightly between 1994 and 2000. Tafunsak had the highest proportion of Asian-born residents at 12 percent in 1994 and declined to less than 1 percent in 2000.
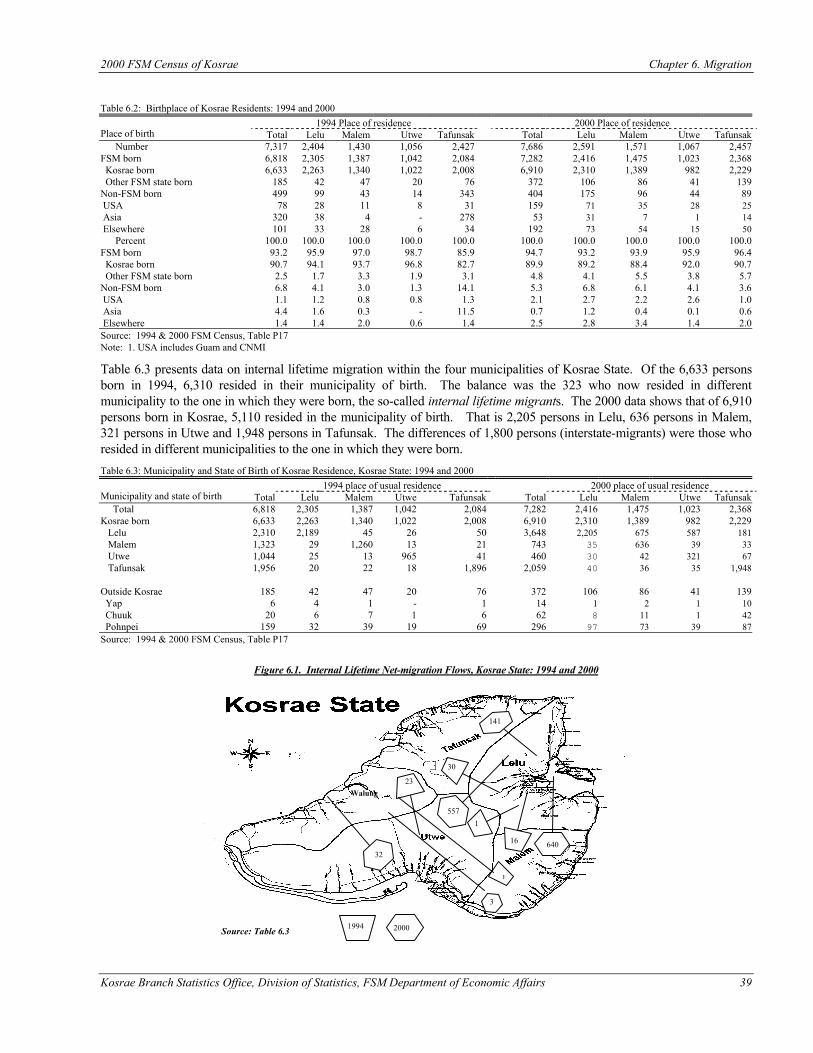
2000 FSM Census of Kosrae Chapter 6. Migration
Kosrae Branch Statistics Office, Division of Statistics, FSM Department of Economic Affairs 39
1994
1
16
23
30
1
2000
141
557
32 640
3
Table 6.2: Birthplace of Kosrae Residents: 1994 and 2000
1994 Place of residence 2000 Place of residence Place of birth Total Lelu Malem Utwe Tafunsak Total Lelu Malem Utwe Tafunsak Number 7,317 2,404 1,430 1,056 2,427 7,686 2,591 1,571 1,067 2,457 FSM born 6,818 2,305 1,387 1,042 2,084 7,282 2,416 1,475 1,023 2,368 Kosrae born 6,633 2,263 1,340 1,022 2,008 6,910 2,310 1,389 982 2,229 Other FSM state born 185 42 47 20 76 372 106 86 41 139 Non-FSM born 499 99 43 14 343 404 175 96 44 89 USA 78 28 11 8 31 159 71 35 28 25 Asia 320 38 4 - 278 53 31 7 1 14 Elsewhere 101 33 28 6 34 192 73 54 15 50 Percent 100.0 100.0 100.0 100.0 100.0 100.0 100.0 100.0 100.0 100.0 FSM born 93.2 95.9 97.0 98.7 85.9 94.7 93.2 93.9 95.9 96.4 Kosrae born 90.7 94.1 93.7 96.8 82.7 89.9 89.2 88.4 92.0 90.7 Other FSM state born 2.5 1.7 3.3 1.9 3.1 4.8 4.1 5.5 3.8 5.7 Non-FSM born 6.8 4.1 3.0 1.3 14.1 5.3 6.8 6.1 4.1 3.6 USA 1.1 1.2 0.8 0.8 1.3 2.1 2.7 2.2 2.6 1.0 Asia 4.4 1.6 0.3 - 11.5 0.7 1.2 0.4 0.1 0.6 Elsewhere 1.4 1.4 2.0 0.6 1.4 2.5 2.8 3.4 1.4 2.0 Source: 1994 & 2000 FSM Census, Table P17 Note: 1. USA includes Guam and CNMI
Table 6.3 presents data on internal lifetime migration within the four municipalities of Kosrae State. Of the 6,633 persons born in 1994, 6,310 resided in their municipality of birth. The balance was the 323 who now resided in different municipality to the one in which they were born, the so-called internal lifetime migrants. The 2000 data shows that of 6,910 persons born in Kosrae, 5,110 resided in the municipality of birth. That is 2,205 persons in Lelu, 636 persons in Malem, 321 persons in Utwe and 1,948 persons in Tafunsak. The differences of 1,800 persons (interstate-migrants) were those who resided in different municipalities to the one in which they were born. Table 6.3: Municipality and State of Birth of Kosrae Residence, Kosrae State: 1994 and 2000
1994 place of usual residence 2000 place of usual residence Municipality and state of birth Total Lelu Malem Utwe Tafunsak Total Lelu Malem Utwe Tafunsak Total 6,818 2,305 1,387 1,042 2,084 7,282 2,416 1,475 1,023 2,368 Kosrae born 6,633 2,263 1,340 1,022 2,008 6,910 2,310 1,389 982 2,229 Lelu 2,310 2,189 45 26 50 3,648 2,205 675 587 181 Malem 1,323 29 1,260 13 21 743 35 636 39 33 Utwe 1,044 25 13 965 41 460 30 42 321 67 Tafunsak 1,956 20 22 18 1,896 2,059 40 36 35 1,948 Outside Kosrae 185 42 47 20 76 372 106 86 41 139 Yap 6 4 1 - 1 14 1 2 1 10 Chuuk 20 6 7 1 6 62 8 11 1 42 Pohnpei 159 32 39 19 69 296 97 73 39 87 Source: 1994 & 2000 FSM Census, Table P17
Figure 6.1. Internal Lifetime Net-migration Flows, Kosrae State: 1994 and 2000
Source: Table 6.3
Walung
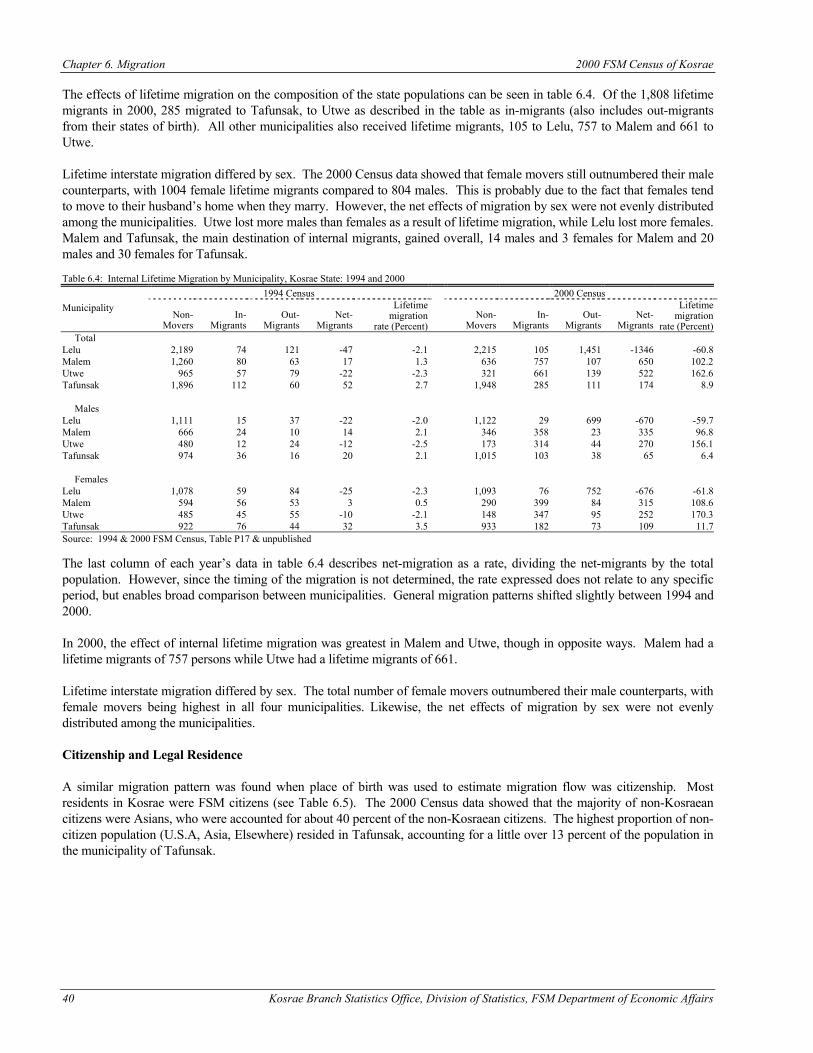
Chapter 6. Migration 2000 FSM Census of Kosrae
40 Kosrae Branch Statistics Office, Division of Statistics, FSM Department of Economic Affairs
The effects of lifetime migration on the composition of the state populations can be seen in table 6.4. Of the 1,808 lifetime migrants in 2000, 285 migrated to Tafunsak, to Utwe as described in the table as in-migrants (also includes out-migrants from their states of birth). All other municipalities also received lifetime migrants, 105 to Lelu, 757 to Malem and 661 to Utwe. Lifetime interstate migration differed by sex. The 2000 Census data showed that female movers still outnumbered their male counterparts, with 1004 female lifetime migrants compared to 804 males. This is probably due to the fact that females tend to move to their husband’s home when they marry. However, the net effects of migration by sex were not evenly distributed among the municipalities. Utwe lost more males than females as a result of lifetime migration, while Lelu lost more females. Malem and Tafunsak, the main destination of internal migrants, gained overall, 14 males and 3 females for Malem and 20 males and 30 females for Tafunsak. Table 6.4: Internal Lifetime Migration by Municipality, Kosrae State: 1994 and 2000
1994 Census 2000 Census Municipality
Non- Movers
In- Migrants
Out- Migrants
Net- Migrants
Lifetime migration
rate (Percent) Non-
Movers In-
Migrants Out-
Migrants Net-
Migrants
Lifetime migration
rate (Percent) Total Lelu 2,189 74 121 -47 -2.1 2,215 105 1,451 -1346 -60.8 Malem 1,260 80 63 17 1.3 636 757 107 650 102.2 Utwe 965 57 79 -22 -2.3 321 661 139 522 162.6 Tafunsak 1,896 112 60 52 2.7 1,948 285 111 174 8.9 Males Lelu 1,111 15 37 -22 -2.0 1,122 29 699 -670 -59.7 Malem 666 24 10 14 2.1 346 358 23 335 96.8 Utwe 480 12 24 -12 -2.5 173 314 44 270 156.1 Tafunsak 974 36 16 20 2.1 1,015 103 38 65 6.4 Females Lelu 1,078 59 84 -25 -2.3 1,093 76 752 -676 -61.8 Malem 594 56 53 3 0.5 290 399 84 315 108.6 Utwe 485 45 55 -10 -2.1 148 347 95 252 170.3 Tafunsak 922 76 44 32 3.5 933 182 73 109 11.7 Source: 1994 & 2000 FSM Census, Table P17 & unpublished The last column of each year’s data in table 6.4 describes net-migration as a rate, dividing the net-migrants by the total population. However, since the timing of the migration is not determined, the rate expressed does not relate to any specific period, but enables broad comparison between municipalities. General migration patterns shifted slightly between 1994 and 2000. In 2000, the effect of internal lifetime migration was greatest in Malem and Utwe, though in opposite ways. Malem had a lifetime migrants of 757 persons while Utwe had a lifetime migrants of 661. Lifetime interstate migration differed by sex. The total number of female movers outnumbered their male counterparts, with female movers being highest in all four municipalities. Likewise, the net effects of migration by sex were not evenly distributed among the municipalities. Citizenship and Legal Residence A similar migration pattern was found when place of birth was used to estimate migration flow was citizenship. Most residents in Kosrae were FSM citizens (see Table 6.5). The 2000 Census data showed that the majority of non-Kosraean citizens were Asians, who were accounted for about 40 percent of the non-Kosraean citizens. The highest proportion of non-citizen population (U.S.A, Asia, Elsewhere) resided in Tafunsak, accounting for a little over 13 percent of the population in the municipality of Tafunsak.
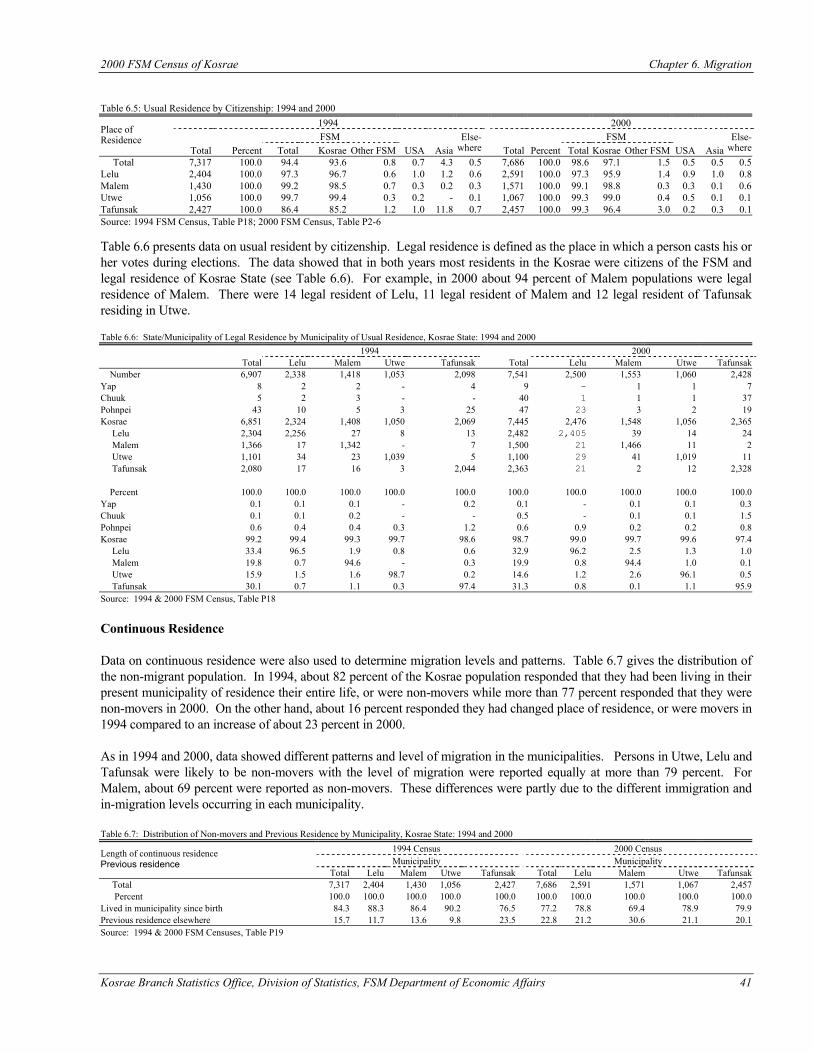
2000 FSM Census of Kosrae Chapter 6. Migration
Kosrae Branch Statistics Office, Division of Statistics, FSM Department of Economic Affairs 41
Table 6.5: Usual Residence by Citizenship: 1994 and 2000
1994 2000 FSM FSM
Place of Residence
Total Percent Total Kosrae Other FSM USA Asia Else-
where Total Percent Total Kosrae Other FSM USA Asia Else-
where Total 7,317 100.0 94.4 93.6 0.8 0.7 4.3 0.5 7,686 100.0 98.6 97.1 1.5 0.5 0.5 0.5 Lelu 2,404 100.0 97.3 96.7 0.6 1.0 1.2 0.6 2,591 100.0 97.3 95.9 1.4 0.9 1.0 0.8 Malem 1,430 100.0 99.2 98.5 0.7 0.3 0.2 0.3 1,571 100.0 99.1 98.8 0.3 0.3 0.1 0.6 Utwe 1,056 100.0 99.7 99.4 0.3 0.2 - 0.1 1,067 100.0 99.3 99.0 0.4 0.5 0.1 0.1 Tafunsak 2,427 100.0 86.4 85.2 1.2 1.0 11.8 0.7 2,457 100.0 99.3 96.4 3.0 0.2 0.3 0.1 Source: 1994 FSM Census, Table P18; 2000 FSM Census, Table P2-6 Table 6.6 presents data on usual resident by citizenship. Legal residence is defined as the place in which a person casts his or her votes during elections. The data showed that in both years most residents in the Kosrae were citizens of the FSM and legal residence of Kosrae State (see Table 6.6). For example, in 2000 about 94 percent of Malem populations were legal residence of Malem. There were 14 legal resident of Lelu, 11 legal resident of Malem and 12 legal resident of Tafunsak residing in Utwe. Table 6.6: State/Municipality of Legal Residence by Municipality of Usual Residence, Kosrae State: 1994 and 2000
1994 2000 Total Lelu Malem Utwe Tafunsak Total Lelu Malem Utwe Tafunsak
Number 6,907 2,338 1,418 1,053 2,098 7,541 2,500 1,553 1,060 2,428 Yap 8 2 2 - 4 9 - 1 1 7 Chuuk 5 2 3 - - 40 1 1 1 37 Pohnpei 43 10 5 3 25 47 23 3 2 19 Kosrae 6,851 2,324 1,408 1,050 2,069 7,445 2,476 1,548 1,056 2,365 Lelu 2,304 2,256 27 8 13 2,482 2,405 39 14 24 Malem 1,366 17 1,342 - 7 1,500 21 1,466 11 2 Utwe 1,101 34 23 1,039 5 1,100 29 41 1,019 11 Tafunsak 2,080 17 16 3 2,044 2,363 21 2 12 2,328 Percent 100.0 100.0 100.0 100.0 100.0 100.0 100.0 100.0 100.0 100.0 Yap 0.1 0.1 0.1 - 0.2 0.1 - 0.1 0.1 0.3 Chuuk 0.1 0.1 0.2 - - 0.5 - 0.1 0.1 1.5 Pohnpei 0.6 0.4 0.4 0.3 1.2 0.6 0.9 0.2 0.2 0.8 Kosrae 99.2 99.4 99.3 99.7 98.6 98.7 99.0 99.7 99.6 97.4 Lelu 33.4 96.5 1.9 0.8 0.6 32.9 96.2 2.5 1.3 1.0 Malem 19.8 0.7 94.6 - 0.3 19.9 0.8 94.4 1.0 0.1 Utwe 15.9 1.5 1.6 98.7 0.2 14.6 1.2 2.6 96.1 0.5 Tafunsak 30.1 0.7 1.1 0.3 97.4 31.3 0.8 0.1 1.1 95.9 Source: 1994 & 2000 FSM Census, Table P18
Continuous Residence Data on continuous residence were also used to determine migration levels and patterns. Table 6.7 gives the distribution of the non-migrant population. In 1994, about 82 percent of the Kosrae population responded that they had been living in their present municipality of residence their entire life, or were non-movers while more than 77 percent responded that they were non-movers in 2000. On the other hand, about 16 percent responded they had changed place of residence, or were movers in 1994 compared to an increase of about 23 percent in 2000. As in 1994 and 2000, data showed different patterns and level of migration in the municipalities. Persons in Utwe, Lelu and Tafunsak were likely to be non-movers with the level of migration were reported equally at more than 79 percent. For Malem, about 69 percent were reported as non-movers. These differences were partly due to the different immigration and in-migration levels occurring in each municipality. Table 6.7: Distribution of Non-movers and Previous Residence by Municipality, Kosrae State: 1994 and 2000
1994 Census 2000 Census Municipality Municipality
Length of continuous residence Previous residence
Total Lelu Malem Utwe Tafunsak Total Lelu Malem Utwe Tafunsak Total 7,317 2,404 1,430 1,056 2,427 7,686 2,591 1,571 1,067 2,457 Percent 100.0 100.0 100.0 100.0 100.0 100.0 100.0 100.0 100.0 100.0 Lived in municipality since birth 84.3 88.3 86.4 90.2 76.5 77.2 78.8 69.4 78.9 79.9 Previous residence elsewhere 15.7 11.7 13.6 9.8 23.5 22.8 21.2 30.6 21.1 20.1 Source: 1994 & 2000 FSM Censuses, Table P19
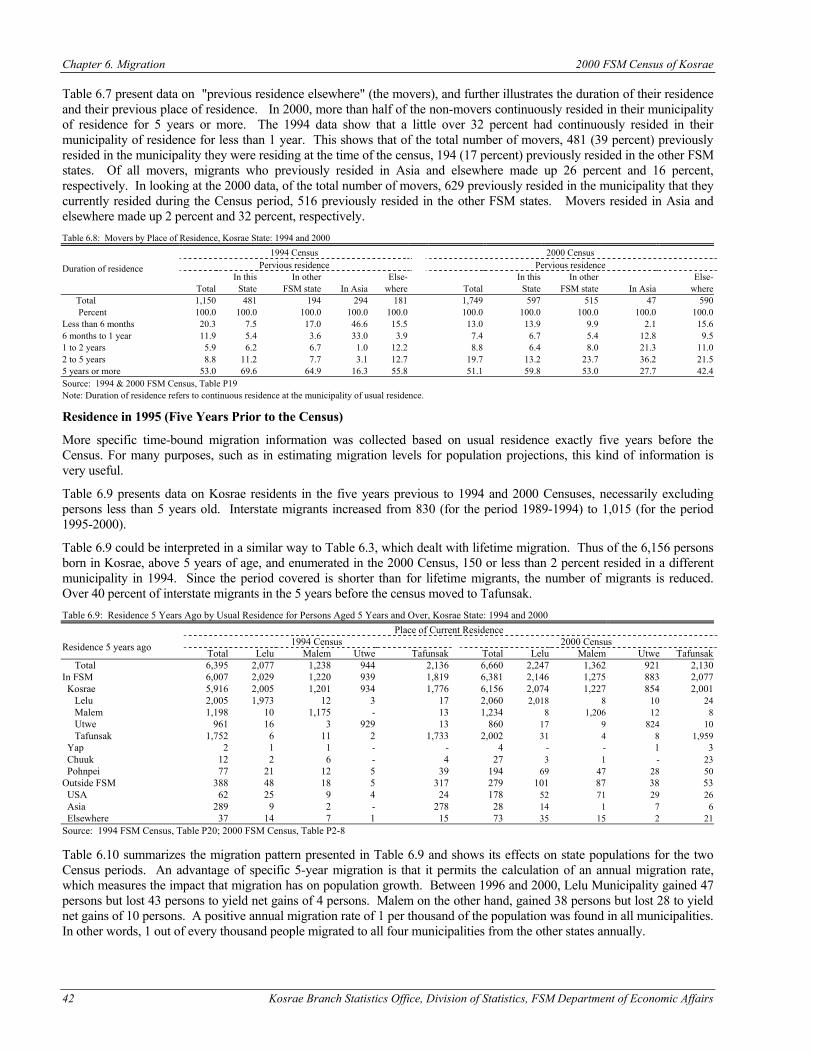
Chapter 6. Migration 2000 FSM Census of Kosrae
42 Kosrae Branch Statistics Office, Division of Statistics, FSM Department of Economic Affairs
Table 6.7 present data on "previous residence elsewhere" (the movers), and further illustrates the duration of their residence and their previous place of residence. In 2000, more than half of the non-movers continuously resided in their municipality of residence for 5 years or more. The 1994 data show that a little over 32 percent had continuously resided in their municipality of residence for less than 1 year. This shows that of the total number of movers, 481 (39 percent) previously resided in the municipality they were residing at the time of the census, 194 (17 percent) previously resided in the other FSM states. Of all movers, migrants who previously resided in Asia and elsewhere made up 26 percent and 16 percent, respectively. In looking at the 2000 data, of the total number of movers, 629 previously resided in the municipality that they currently resided during the Census period, 516 previously resided in the other FSM states. Movers resided in Asia and elsewhere made up 2 percent and 32 percent, respectively. Table 6.8: Movers by Place of Residence, Kosrae State: 1994 and 2000
1994 Census 2000 Census Pervious residence Pervious residence
In this In other Else- In this In other Else- Duration of residence
Total State FSM state In Asia where Total State FSM state In Asia where Total 1,150 481 194 294 181 1,749 597 515 47 590 Percent 100.0 100.0 100.0 100.0 100.0 100.0 100.0 100.0 100.0 100.0 Less than 6 months 20.3 7.5 17.0 46.6 15.5 13.0 13.9 9.9 2.1 15.6 6 months to 1 year 11.9 5.4 3.6 33.0 3.9 7.4 6.7 5.4 12.8 9.5 1 to 2 years 5.9 6.2 6.7 1.0 12.2 8.8 6.4 8.0 21.3 11.0 2 to 5 years 8.8 11.2 7.7 3.1 12.7 19.7 13.2 23.7 36.2 21.5 5 years or more 53.0 69.6 64.9 16.3 55.8 51.1 59.8 53.0 27.7 42.4 Source: 1994 & 2000 FSM Census, Table P19 Note: Duration of residence refers to continuous residence at the municipality of usual residence.
Residence in 1995 (Five Years Prior to the Census)
More specific time-bound migration information was collected based on usual residence exactly five years before the Census. For many purposes, such as in estimating migration levels for population projections, this kind of information is very useful.
Table 6.9 presents data on Kosrae residents in the five years previous to 1994 and 2000 Censuses, necessarily excluding persons less than 5 years old. Interstate migrants increased from 830 (for the period 1989-1994) to 1,015 (for the period 1995-2000).
Table 6.9 could be interpreted in a similar way to Table 6.3, which dealt with lifetime migration. Thus of the 6,156 persons born in Kosrae, above 5 years of age, and enumerated in the 2000 Census, 150 or less than 2 percent resided in a different municipality in 1994. Since the period covered is shorter than for lifetime migrants, the number of migrants is reduced. Over 40 percent of interstate migrants in the 5 years before the census moved to Tafunsak. Table 6.9: Residence 5 Years Ago by Usual Residence for Persons Aged 5 Years and Over, Kosrae State: 1994 and 2000 Place of Current Residence
1994 Census 2000 Census Residence 5 years ago Total Lelu Malem Utwe Tafunsak Total Lelu Malem Utwe Tafunsak Total 6,395 2,077 1,238 944 2,136 6,660 2,247 1,362 921 2,130 In FSM 6,007 2,029 1,220 939 1,819 6,381 2,146 1,275 883 2,077 Kosrae 5,916 2,005 1,201 934 1,776 6,156 2,074 1,227 854 2,001 Lelu 2,005 1,973 12 3 17 2,060 2,018 8 10 24 Malem 1,198 10 1,175 - 13 1,234 8 1,206 12 8 Utwe 961 16 3 929 13 860 17 9 824 10 Tafunsak 1,752 6 11 2 1,733 2,002 31 4 8 1,959 Yap 2 1 1 - - 4 - - 1 3 Chuuk 12 2 6 - 4 27 3 1 - 23 Pohnpei 77 21 12 5 39 194 69 47 28 50 Outside FSM 388 48 18 5 317 279 101 87 38 53 USA 62 25 9 4 24 178 52 71 29 26 Asia 289 9 2 - 278 28 14 1 7 6 Elsewhere 37 14 7 1 15 73 35 15 2 21 Source: 1994 FSM Census, Table P20; 2000 FSM Census, Table P2-8 Table 6.10 summarizes the migration pattern presented in Table 6.9 and shows its effects on state populations for the two Census periods. An advantage of specific 5-year migration is that it permits the calculation of an annual migration rate, which measures the impact that migration has on population growth. Between 1996 and 2000, Lelu Municipality gained 47 persons but lost 43 persons to yield net gains of 4 persons. Malem on the other hand, gained 38 persons but lost 28 to yield net gains of 10 persons. A positive annual migration rate of 1 per thousand of the population was found in all municipalities. In other words, 1 out of every thousand people migrated to all four municipalities from the other states annually.
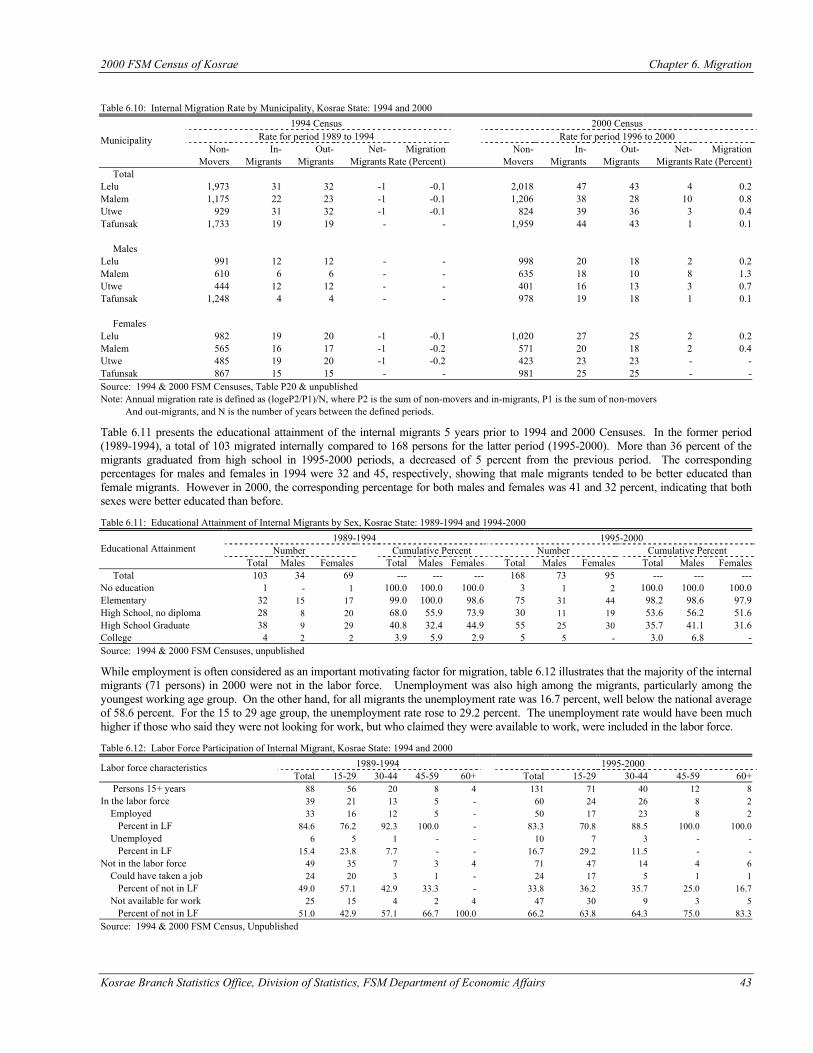
2000 FSM Census of Kosrae Chapter 6. Migration
Kosrae Branch Statistics Office, Division of Statistics, FSM Department of Economic Affairs 43
Table 6.10: Internal Migration Rate by Municipality, Kosrae State: 1994 and 2000
1994 Census 2000 Census Rate for period 1989 to 1994 Rate for period 1996 to 2000
Non- In- Out- Net- Migration Non- In- Out- Net- Migration Municipality
Movers Migrants Migrants Migrants Rate (Percent) Movers Migrants Migrants Migrants Rate (Percent) Total Lelu 1,973 31 32 -1 -0.1 2,018 47 43 4 0.2 Malem 1,175 22 23 -1 -0.1 1,206 38 28 10 0.8 Utwe 929 31 32 -1 -0.1 824 39 36 3 0.4 Tafunsak 1,733 19 19 - - 1,959 44 43 1 0.1 Males Lelu 991 12 12 - - 998 20 18 2 0.2 Malem 610 6 6 - - 635 18 10 8 1.3 Utwe 444 12 12 - - 401 16 13 3 0.7 Tafunsak 1,248 4 4 - - 978 19 18 1 0.1 Females Lelu 982 19 20 -1 -0.1 1,020 27 25 2 0.2 Malem 565 16 17 -1 -0.2 571 20 18 2 0.4 Utwe 485 19 20 -1 -0.2 423 23 23 - - Tafunsak 867 15 15 - - 981 25 25 - - Source: 1994 & 2000 FSM Censuses, Table P20 & unpublished Note: Annual migration rate is defined as (logeP2/P1)/N, where P2 is the sum of non-movers and in-migrants, P1 is the sum of non-movers And out-migrants, and N is the number of years between the defined periods.
Table 6.11 presents the educational attainment of the internal migrants 5 years prior to 1994 and 2000 Censuses. In the former period (1989-1994), a total of 103 migrated internally compared to 168 persons for the latter period (1995-2000). More than 36 percent of the migrants graduated from high school in 1995-2000 periods, a decreased of 5 percent from the previous period. The corresponding percentages for males and females in 1994 were 32 and 45, respectively, showing that male migrants tended to be better educated than female migrants. However in 2000, the corresponding percentage for both males and females was 41 and 32 percent, indicating that both sexes were better educated than before.
Table 6.11: Educational Attainment of Internal Migrants by Sex, Kosrae State: 1989-1994 and 1994-2000 1989-1994 1995-2000
Number Cumulative Percent Number Cumulative Percent Educational Attainment Total Males Females Total Males Females Total Males Females Total Males Females
Total 103 34 69 --- --- --- 168 73 95 --- --- --- No education 1 - 1 100.0 100.0 100.0 3 1 2 100.0 100.0 100.0 Elementary 32 15 17 99.0 100.0 98.6 75 31 44 98.2 98.6 97.9 High School, no diploma 28 8 20 68.0 55.9 73.9 30 11 19 53.6 56.2 51.6 High School Graduate 38 9 29 40.8 32.4 44.9 55 25 30 35.7 41.1 31.6 College 4 2 2 3.9 5.9 2.9 5 5 - 3.0 6.8 - Source: 1994 & 2000 FSM Censuses, unpublished
While employment is often considered as an important motivating factor for migration, table 6.12 illustrates that the majority of the internal migrants (71 persons) in 2000 were not in the labor force. Unemployment was also high among the migrants, particularly among the youngest working age group. On the other hand, for all migrants the unemployment rate was 16.7 percent, well below the national average of 58.6 percent. For the 15 to 29 age group, the unemployment rate rose to 29.2 percent. The unemployment rate would have been much higher if those who said they were not looking for work, but who claimed they were available to work, were included in the labor force.
Table 6.12: Labor Force Participation of Internal Migrant, Kosrae State: 1994 and 2000 1989-1994 1995-2000 Labor force characteristics
Total 15-29 30-44 45-59 60+ Total 15-29 30-44 45-59 60+ Persons 15+ years 88 56 20 8 4 131 71 40 12 8 In the labor force 39 21 13 5 - 60 24 26 8 2 Employed 33 16 12 5 - 50 17 23 8 2 Percent in LF 84.6 76.2 92.3 100.0 - 83.3 70.8 88.5 100.0 100.0 Unemployed 6 5 1 - - 10 7 3 - - Percent in LF 15.4 23.8 7.7 - - 16.7 29.2 11.5 - - Not in the labor force 49 35 7 3 4 71 47 14 4 6 Could have taken a job 24 20 3 1 - 24 17 5 1 1 Percent of not in LF 49.0 57.1 42.9 33.3 - 33.8 36.2 35.7 25.0 16.7 Not available for work 25 15 4 2 4 47 30 9 3 5 Percent of not in LF 51.0 42.9 57.1 66.7 100.0 66.2 63.8 64.3 75.0 83.3 Source: 1994 & 2000 FSM Census, Unpublished
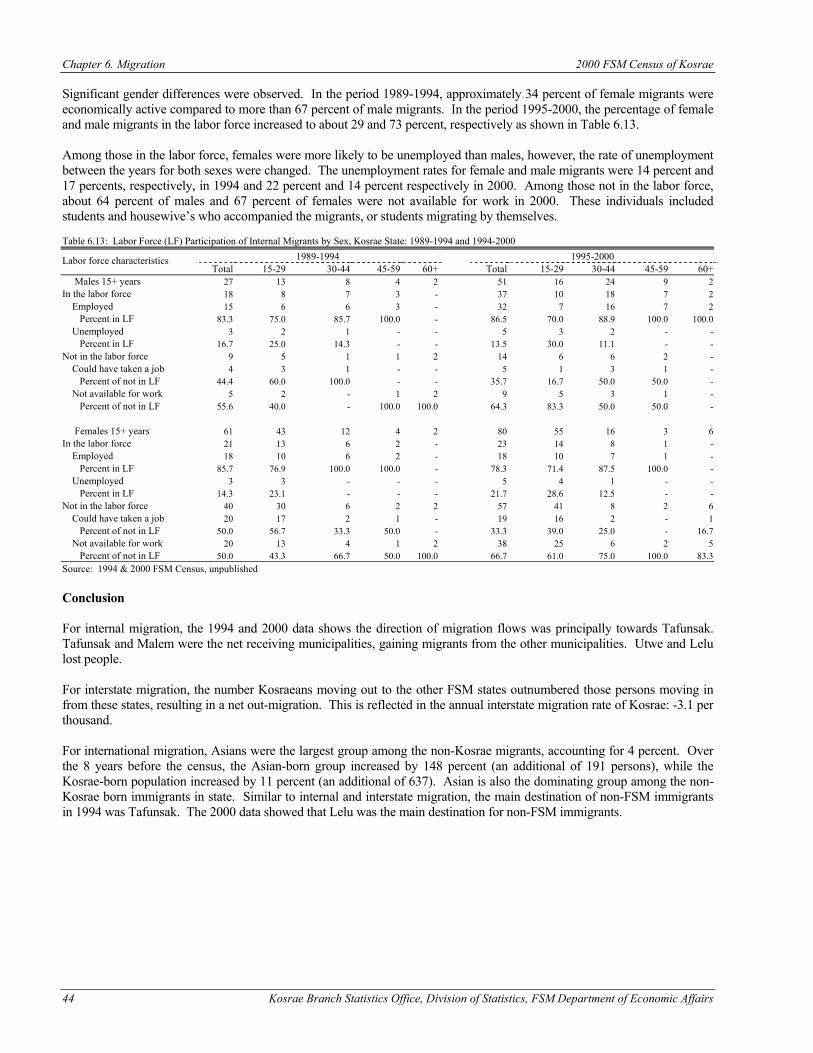
Chapter 6. Migration 2000 FSM Census of Kosrae
44 Kosrae Branch Statistics Office, Division of Statistics, FSM Department of Economic Affairs
Significant gender differences were observed. In the period 1989-1994, approximately 34 percent of female migrants were economically active compared to more than 67 percent of male migrants. In the period 1995-2000, the percentage of female and male migrants in the labor force increased to about 29 and 73 percent, respectively as shown in Table 6.13. Among those in the labor force, females were more likely to be unemployed than males, however, the rate of unemployment between the years for both sexes were changed. The unemployment rates for female and male migrants were 14 percent and 17 percents, respectively, in 1994 and 22 percent and 14 percent respectively in 2000. Among those not in the labor force, about 64 percent of males and 67 percent of females were not available for work in 2000. These individuals included students and housewive’s who accompanied the migrants, or students migrating by themselves. Table 6.13: Labor Force (LF) Participation of Internal Migrants by Sex, Kosrae State: 1989-1994 and 1994-2000
1989-1994 1995-2000 Labor force characteristics Total 15-29 30-44 45-59 60+ Total 15-29 30-44 45-59 60+
Males 15+ years 27 13 8 4 2 51 16 24 9 2 In the labor force 18 8 7 3 - 37 10 18 7 2 Employed 15 6 6 3 - 32 7 16 7 2 Percent in LF 83.3 75.0 85.7 100.0 - 86.5 70.0 88.9 100.0 100.0 Unemployed 3 2 1 - - 5 3 2 - - Percent in LF 16.7 25.0 14.3 - - 13.5 30.0 11.1 - - Not in the labor force 9 5 1 1 2 14 6 6 2 - Could have taken a job 4 3 1 - - 5 1 3 1 - Percent of not in LF 44.4 60.0 100.0 - - 35.7 16.7 50.0 50.0 - Not available for work 5 2 - 1 2 9 5 3 1 - Percent of not in LF 55.6 40.0 - 100.0 100.0 64.3 83.3 50.0 50.0 - Females 15+ years 61 43 12 4 2 80 55 16 3 6 In the labor force 21 13 6 2 - 23 14 8 1 - Employed 18 10 6 2 - 18 10 7 1 - Percent in LF 85.7 76.9 100.0 100.0 - 78.3 71.4 87.5 100.0 - Unemployed 3 3 - - - 5 4 1 - - Percent in LF 14.3 23.1 - - - 21.7 28.6 12.5 - - Not in the labor force 40 30 6 2 2 57 41 8 2 6 Could have taken a job 20 17 2 1 - 19 16 2 - 1 Percent of not in LF 50.0 56.7 33.3 50.0 - 33.3 39.0 25.0 - 16.7 Not available for work 20 13 4 1 2 38 25 6 2 5 Percent of not in LF 50.0 43.3 66.7 50.0 100.0 66.7 61.0 75.0 100.0 83.3 Source: 1994 & 2000 FSM Census, unpublished Conclusion For internal migration, the 1994 and 2000 data shows the direction of migration flows was principally towards Tafunsak. Tafunsak and Malem were the net receiving municipalities, gaining migrants from the other municipalities. Utwe and Lelu lost people. For interstate migration, the number Kosraeans moving out to the other FSM states outnumbered those persons moving in from these states, resulting in a net out-migration. This is reflected in the annual interstate migration rate of Kosrae: -3.1 per thousand. For international migration, Asians were the largest group among the non-Kosrae migrants, accounting for 4 percent. Over the 8 years before the census, the Asian-born group increased by 148 percent (an additional of 191 persons), while the Kosrae-born population increased by 11 percent (an additional of 637). Asian is also the dominating group among the non-Kosrae born immigrants in state. Similar to internal and interstate migration, the main destination of non-FSM immigrants in 1994 was Tafunsak. The 2000 data showed that Lelu was the main destination for non-FSM immigrants.
Kosrae Branch Statistics Office, Division of Statistics, FSM Department of Economic Affairs 45
CHAPTER 7 RELIGION, ETHNICITY AND LANGUAGE
Introduction In Kosrae religion-related organizations, like youth programs, play an important role in the community, making data on religion necessary for planning purposes. The data provided in this chapter show one major religious affiliation: Protestant. Protestants have several sects and Congregational was the largest group. The Protestant first came to Micronesia in 1852, beginning work on Pohnpei and Kosrae, and soon afterwards expanding to Chuuk. Although the mission sending organization was interdenominational, most of the missionaries represented the Congregational Church. The Roman Catholics arrived later, beginning their work in Yap in 1886 and Pohnpei, a year later. In the early 20th century, a German Liebenzell missionary began work in the area, eventually moving to Yap. From the 1960's on, other religions entered the area—SDA, Assembly of God, Baptist, Jehovah's Witnesses, and Bahai (Hezel, 1983). Data on ethnicity are useful in planning policy. The largest foreign (non-local) ethnic group in Kosrae was the Asians, which include Filipinos and Chinese. The second largest non-local ethnic group was the category termed as white. This group encompassed persons from Europe, U.S., Australia, and New Zealand. In the history of Kosrae, different second languages were taught in school depending on the administering country. During the Japanese Administration (from 1914 to 1945) Japanese was used as the common language in schools, offices, etc. And when the U.S took over at the end of the World War II, English became the main language for the government. At present, the medium of official communication at the government offices and even in the private sector is English. Definitions Religion For census purposes, religion was defined as a religious or spiritual belief or preference, regardless of whether or not this belief was represented by an organized group. Information regarding religious affiliation for all persons in the 2000 Census was collected questionnaire item 7. The TTPI Census in 1973 and the 1994 and 2000 FSM Censuses included a question on religion and the data are compared in this chapter. Ethnicity Data on different ethnicities in Kosrae were collected in 2000 Census by questionnaire item 6. Ethnic identity of a person is traced through his or her tribal origin. Respondents had an option of reporting up to two ethnic groups that they belonged to. Some of the common ethnicities were Chuukese/Mortlockese, Yapese, Outer Island Yapese, Pohnpeian, or Kosraean. Language Data on language spoken and on language spoken at home came from answers to questionnaire items 15a and 15b. The questions were asked only of persons 5 years old and over. For those persons that spoke more than 3 languages, they were only to provide the three most common ones in question 15a while in question 15b they were to provide the language that they usually spoke at home. Analysis of Data on Religion, Ethnicity, and Language Religion The first 3 tables in this chapter provide data on religion. Only three censuses (1973, 1994 and 2000) asked about religion, and the results are compared in Table 7.1. Although new religions were introduced after the 1973 Census, the majority of the population remained either Roman Catholic or Protestant. The proportion of Roman Catholics increased slightly for each sex while the proportion Protestant decreased over the decades. In absolute numbers, both religions increased. In 2000, over 9 percent of the population claimed to have “other religion”, was increased from 1 percent in 1994. Since 1973, more or less of a percent of the total population either refused to claim their religion or had no religion.
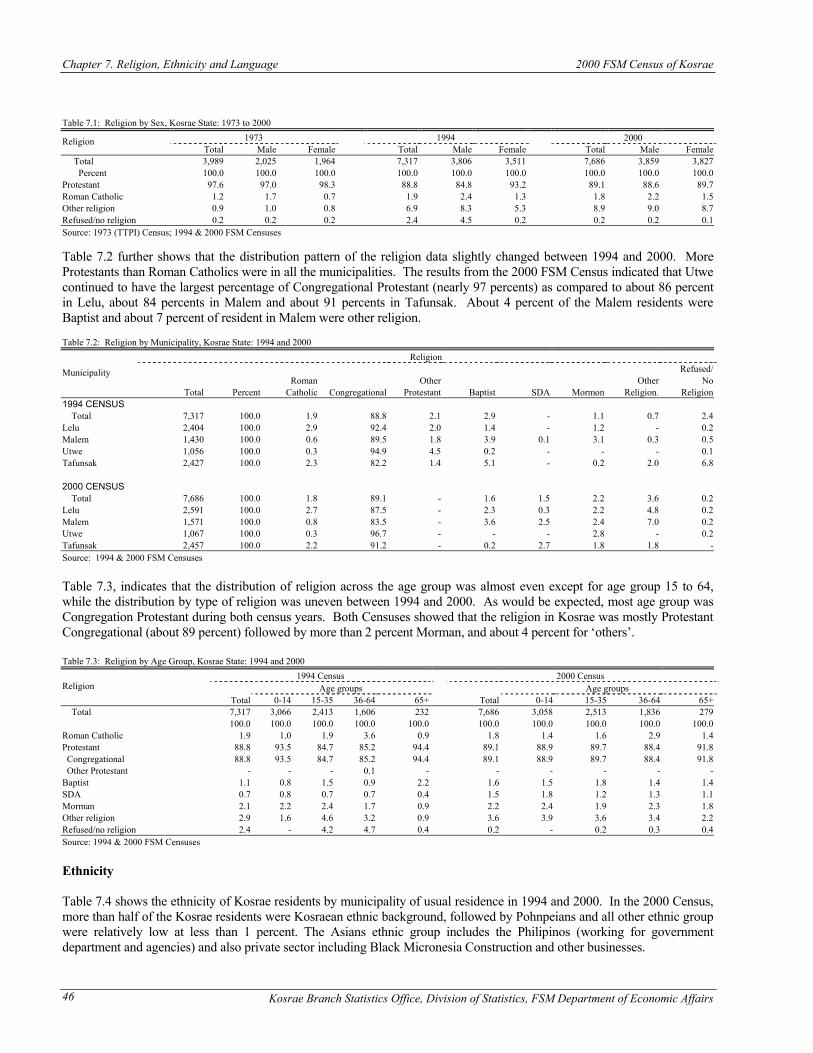
Chapter 7. Religion, Ethnicity and Language 2000 FSM Census of Kosrae
Kosrae Branch Statistics Office, Division of Statistics, FSM Department of Economic Affairs 46
Table 7.1: Religion by Sex, Kosrae State: 1973 to 2000
1973 1994 2000 Religion Total Male Female Total Male Female Total Male Female
Total 3,989 2,025 1,964 7,317 3,806 3,511 7,686 3,859 3,827 Percent 100.0 100.0 100.0 100.0 100.0 100.0 100.0 100.0 100.0 Protestant 97.6 97.0 98.3 88.8 84.8 93.2 89.1 88.6 89.7 Roman Catholic 1.2 1.7 0.7 1.9 2.4 1.3 1.8 2.2 1.5 Other religion 0.9 1.0 0.8 6.9 8.3 5.3 8.9 9.0 8.7 Refused/no religion 0.2 0.2 0.2 2.4 4.5 0.2 0.2 0.2 0.1 Source: 1973 (TTPI) Census; 1994 & 2000 FSM Censuses Table 7.2 further shows that the distribution pattern of the religion data slightly changed between 1994 and 2000. More Protestants than Roman Catholics were in all the municipalities. The results from the 2000 FSM Census indicated that Utwe continued to have the largest percentage of Congregational Protestant (nearly 97 percents) as compared to about 86 percent in Lelu, about 84 percents in Malem and about 91 percents in Tafunsak. About 4 percent of the Malem residents were Baptist and about 7 percent of resident in Malem were other religion. Table 7.2: Religion by Municipality, Kosrae State: 1994 and 2000
Religion Refused/ Roman Other Other No
Municipality
Total Percent Catholic Congregational Protestant Baptist SDA Mormon Religion. Religion 1994 CENSUS Total 7,317 100.0 1.9 88.8 2.1 2.9 - 1.1 0.7 2.4 Lelu 2,404 100.0 2.9 92.4 2.0 1.4 - 1.2 - 0.2 Malem 1,430 100.0 0.6 89.5 1.8 3.9 0.1 3.1 0.3 0.5 Utwe 1,056 100.0 0.3 94.9 4.5 0.2 - - - 0.1 Tafunsak 2,427 100.0 2.3 82.2 1.4 5.1 - 0.2 2.0 6.8 2000 CENSUS Total 7,686 100.0 1.8 89.1 - 1.6 1.5 2.2 3.6 0.2 Lelu 2,591 100.0 2.7 87.5 - 2.3 0.3 2.2 4.8 0.2 Malem 1,571 100.0 0.8 83.5 - 3.6 2.5 2.4 7.0 0.2 Utwe 1,067 100.0 0.3 96.7 - - - 2.8 - 0.2 Tafunsak 2,457 100.0 2.2 91.2 - 0.2 2.7 1.8 1.8 - Source: 1994 & 2000 FSM Censuses Table 7.3, indicates that the distribution of religion across the age group was almost even except for age group 15 to 64, while the distribution by type of religion was uneven between 1994 and 2000. As would be expected, most age group was Congregation Protestant during both census years. Both Censuses showed that the religion in Kosrae was mostly Protestant Congregational (about 89 percent) followed by more than 2 percent Morman, and about 4 percent for ‘others’. Table 7.3: Religion by Age Group, Kosrae State: 1994 and 2000
1994 Census 2000 Census Age groups Age groups Religion
Total 0-14 15-35 36-64 65+ Total 0-14 15-35 36-64 65+ Total 7,317 3,066 2,413 1,606 232 7,686 3,058 2,513 1,836 279 100.0 100.0 100.0 100.0 100.0 100.0 100.0 100.0 100.0 100.0 Roman Catholic 1.9 1.0 1.9 3.6 0.9 1.8 1.4 1.6 2.9 1.4 Protestant 88.8 93.5 84.7 85.2 94.4 89.1 88.9 89.7 88.4 91.8 Congregational 88.8 93.5 84.7 85.2 94.4 89.1 88.9 89.7 88.4 91.8 Other Protestant - - - 0.1 - - - - - - Baptist 1.1 0.8 1.5 0.9 2.2 1.6 1.5 1.8 1.4 1.4 SDA 0.7 0.8 0.7 0.7 0.4 1.5 1.8 1.2 1.3 1.1 Morman 2.1 2.2 2.4 1.7 0.9 2.2 2.4 1.9 2.3 1.8 Other religion 2.9 1.6 4.6 3.2 0.9 3.6 3.9 3.6 3.4 2.2 Refused/no religion 2.4 - 4.2 4.7 0.4 0.2 - 0.2 0.3 0.4 Source: 1994 & 2000 FSM Censuses Ethnicity Table 7.4 shows the ethnicity of Kosrae residents by municipality of usual residence in 1994 and 2000. In the 2000 Census, more than half of the Kosrae residents were Kosraean ethnic background, followed by Pohnpeians and all other ethnic group were relatively low at less than 1 percent. The Asians ethnic group includes the Philipinos (working for government department and agencies) and also private sector including Black Micronesia Construction and other businesses.
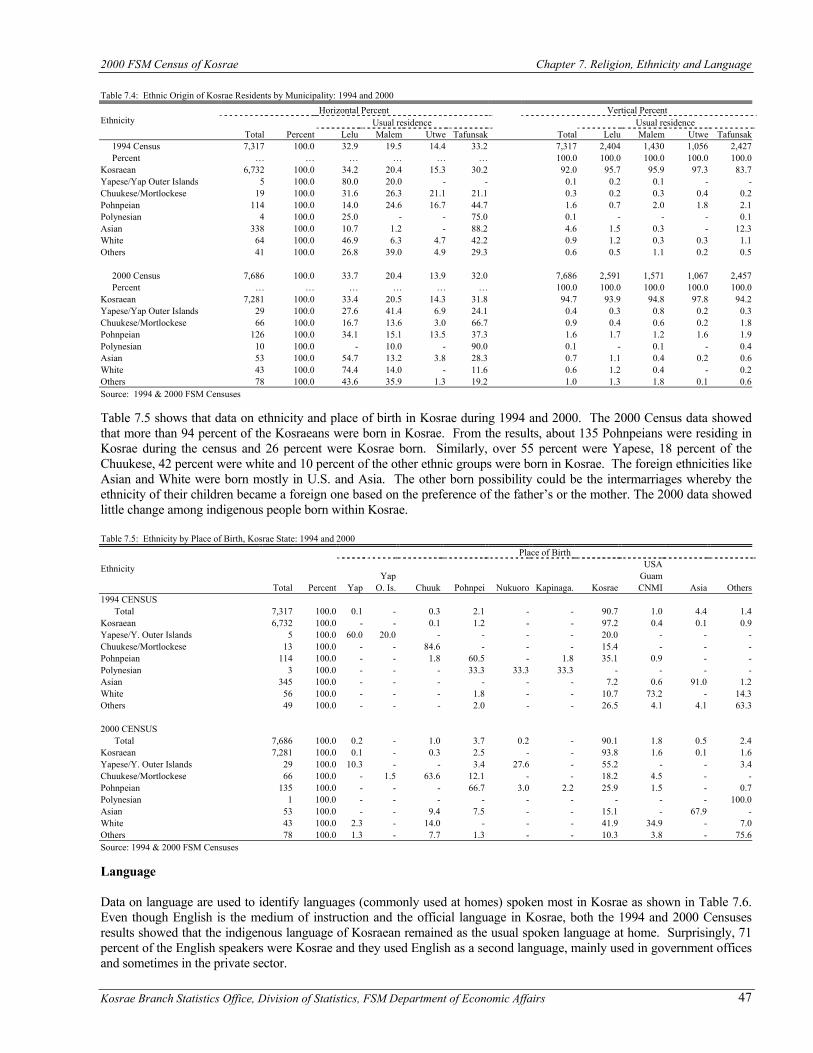
2000 FSM Census of Kosrae Chapter 7. Religion, Ethnicity and Language
Kosrae Branch Statistics Office, Division of Statistics, FSM Department of Economic Affairs 47
Table 7.4: Ethnic Origin of Kosrae Residents by Municipality: 1994 and 2000 Horizontal Percent Vertical Percent
Usual residence Usual residence Ethnicity Total Percent Lelu Malem Utwe Tafunsak Total Lelu Malem Utwe Tafunsak
1994 Census 7,317 100.0 32.9 19.5 14.4 33.2 7,317 2,404 1,430 1,056 2,427 Percent … … … … … … 100.0 100.0 100.0 100.0 100.0 Kosraean 6,732 100.0 34.2 20.4 15.3 30.2 92.0 95.7 95.9 97.3 83.7 Yapese/Yap Outer Islands 5 100.0 80.0 20.0 - - 0.1 0.2 0.1 - - Chuukese/Mortlockese 19 100.0 31.6 26.3 21.1 21.1 0.3 0.2 0.3 0.4 0.2 Pohnpeian 114 100.0 14.0 24.6 16.7 44.7 1.6 0.7 2.0 1.8 2.1 Polynesian 4 100.0 25.0 - - 75.0 0.1 - - - 0.1 Asian 338 100.0 10.7 1.2 - 88.2 4.6 1.5 0.3 - 12.3 White 64 100.0 46.9 6.3 4.7 42.2 0.9 1.2 0.3 0.3 1.1 Others 41 100.0 26.8 39.0 4.9 29.3 0.6 0.5 1.1 0.2 0.5 2000 Census 7,686 100.0 33.7 20.4 13.9 32.0 7,686 2,591 1,571 1,067 2,457 Percent … … … … … … 100.0 100.0 100.0 100.0 100.0 Kosraean 7,281 100.0 33.4 20.5 14.3 31.8 94.7 93.9 94.8 97.8 94.2 Yapese/Yap Outer Islands 29 100.0 27.6 41.4 6.9 24.1 0.4 0.3 0.8 0.2 0.3 Chuukese/Mortlockese 66 100.0 16.7 13.6 3.0 66.7 0.9 0.4 0.6 0.2 1.8 Pohnpeian 126 100.0 34.1 15.1 13.5 37.3 1.6 1.7 1.2 1.6 1.9 Polynesian 10 100.0 - 10.0 - 90.0 0.1 - 0.1 - 0.4 Asian 53 100.0 54.7 13.2 3.8 28.3 0.7 1.1 0.4 0.2 0.6 White 43 100.0 74.4 14.0 - 11.6 0.6 1.2 0.4 - 0.2 Others 78 100.0 43.6 35.9 1.3 19.2 1.0 1.3 1.8 0.1 0.6 Source: 1994 & 2000 FSM Censuses Table 7.5 shows that data on ethnicity and place of birth in Kosrae during 1994 and 2000. The 2000 Census data showed that more than 94 percent of the Kosraeans were born in Kosrae. From the results, about 135 Pohnpeians were residing in Kosrae during the census and 26 percent were Kosrae born. Similarly, over 55 percent were Yapese, 18 percent of the Chuukese, 42 percent were white and 10 percent of the other ethnic groups were born in Kosrae. The foreign ethnicities like Asian and White were born mostly in U.S. and Asia. The other born possibility could be the intermarriages whereby the ethnicity of their children became a foreign one based on the preference of the father’s or the mother. The 2000 data showed little change among indigenous people born within Kosrae. Table 7.5: Ethnicity by Place of Birth, Kosrae State: 1994 and 2000
Place of Birth USA Yap Guam
Ethnicity
Total Percent Yap O. Is. Chuuk Pohnpei Nukuoro Kapinaga. Kosrae CNMI Asia Others 1994 CENSUS Total 7,317 100.0 0.1 - 0.3 2.1 - - 90.7 1.0 4.4 1.4 Kosraean 6,732 100.0 - - 0.1 1.2 - - 97.2 0.4 0.1 0.9 Yapese/Y. Outer Islands 5 100.0 60.0 20.0 - - - - 20.0 - - - Chuukese/Mortlockese 13 100.0 - - 84.6 - - - 15.4 - - - Pohnpeian 114 100.0 - - 1.8 60.5 - 1.8 35.1 0.9 - - Polynesian 3 100.0 - - - 33.3 33.3 33.3 - - - - Asian 345 100.0 - - - - - - 7.2 0.6 91.0 1.2 White 56 100.0 - - - 1.8 - - 10.7 73.2 - 14.3 Others 49 100.0 - - - 2.0 - - 26.5 4.1 4.1 63.3 2000 CENSUS Total 7,686 100.0 0.2 - 1.0 3.7 0.2 - 90.1 1.8 0.5 2.4 Kosraean 7,281 100.0 0.1 - 0.3 2.5 - - 93.8 1.6 0.1 1.6 Yapese/Y. Outer Islands 29 100.0 10.3 - - 3.4 27.6 - 55.2 - - 3.4 Chuukese/Mortlockese 66 100.0 - 1.5 63.6 12.1 - - 18.2 4.5 - - Pohnpeian 135 100.0 - - - 66.7 3.0 2.2 25.9 1.5 - 0.7 Polynesian 1 100.0 - - - - - - - - - 100.0 Asian 53 100.0 - - 9.4 7.5 - - 15.1 - 67.9 - White 43 100.0 2.3 - 14.0 - - - 41.9 34.9 - 7.0 Others 78 100.0 1.3 - 7.7 1.3 - - 10.3 3.8 - 75.6 Source: 1994 & 2000 FSM Censuses Language Data on language are used to identify languages (commonly used at homes) spoken most in Kosrae as shown in Table 7.6. Even though English is the medium of instruction and the official language in Kosrae, both the 1994 and 2000 Censuses results showed that the indigenous language of Kosraean remained as the usual spoken language at home. Surprisingly, 71 percent of the English speakers were Kosrae and they used English as a second language, mainly used in government offices and sometimes in the private sector.
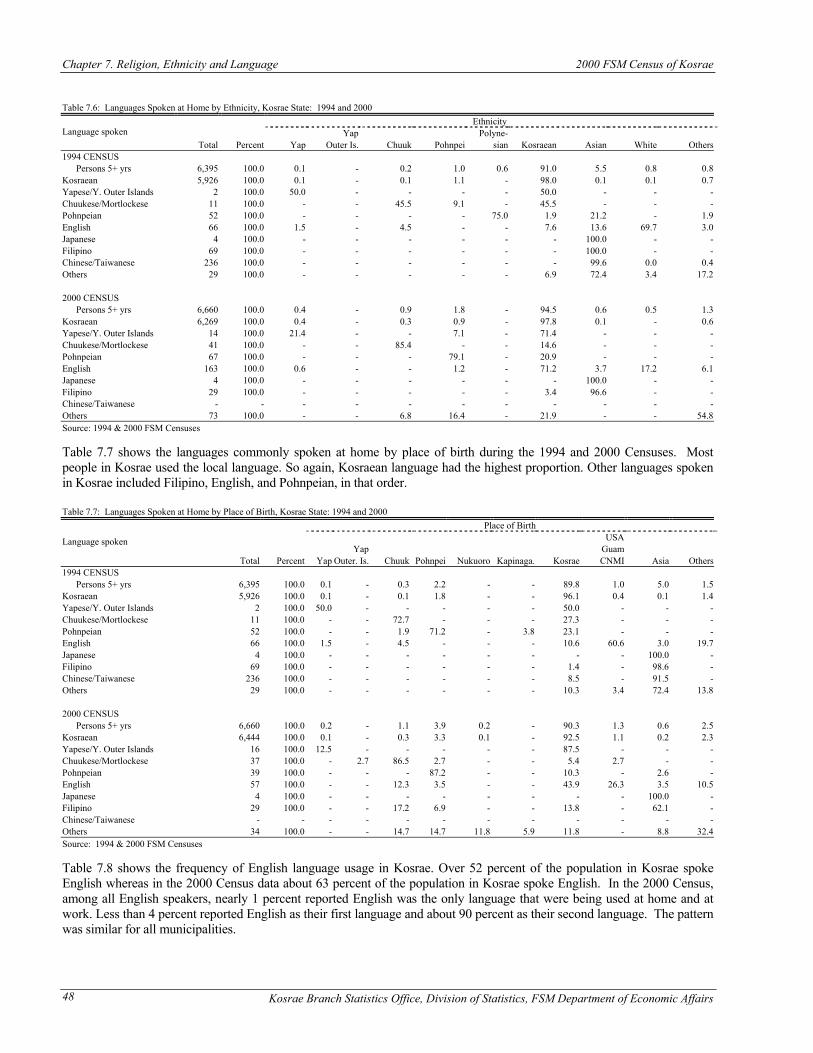
Chapter 7. Religion, Ethnicity and Language 2000 FSM Census of Kosrae
Kosrae Branch Statistics Office, Division of Statistics, FSM Department of Economic Affairs 48
Table 7.6: Languages Spoken at Home by Ethnicity, Kosrae State: 1994 and 2000
Ethnicity Yap Polyne- Language spoken
Total Percent Yap Outer Is. Chuuk Pohnpei sian Kosraean Asian White Others 1994 CENSUS Persons 5+ yrs 6,395 100.0 0.1 - 0.2 1.0 0.6 91.0 5.5 0.8 0.8 Kosraean 5,926 100.0 0.1 - 0.1 1.1 - 98.0 0.1 0.1 0.7 Yapese/Y. Outer Islands 2 100.0 50.0 - - - - 50.0 - - - Chuukese/Mortlockese 11 100.0 - - 45.5 9.1 - 45.5 - - - Pohnpeian 52 100.0 - - - - 75.0 1.9 21.2 - 1.9 English 66 100.0 1.5 - 4.5 - - 7.6 13.6 69.7 3.0 Japanese 4 100.0 - - - - - - 100.0 - - Filipino 69 100.0 - - - - - - 100.0 - - Chinese/Taiwanese 236 100.0 - - - - - - 99.6 0.0 0.4 Others 29 100.0 - - - - - 6.9 72.4 3.4 17.2 2000 CENSUS Persons 5+ yrs 6,660 100.0 0.4 - 0.9 1.8 - 94.5 0.6 0.5 1.3 Kosraean 6,269 100.0 0.4 - 0.3 0.9 - 97.8 0.1 - 0.6 Yapese/Y. Outer Islands 14 100.0 21.4 - - 7.1 - 71.4 - - - Chuukese/Mortlockese 41 100.0 - - 85.4 - - 14.6 - - - Pohnpeian 67 100.0 - - - 79.1 - 20.9 - - - English 163 100.0 0.6 - - 1.2 - 71.2 3.7 17.2 6.1 Japanese 4 100.0 - - - - - - 100.0 - - Filipino 29 100.0 - - - - - 3.4 96.6 - - Chinese/Taiwanese - - - - - - - - - - - Others 73 100.0 - - 6.8 16.4 - 21.9 - - 54.8 Source: 1994 & 2000 FSM Censuses Table 7.7 shows the languages commonly spoken at home by place of birth during the 1994 and 2000 Censuses. Most people in Kosrae used the local language. So again, Kosraean language had the highest proportion. Other languages spoken in Kosrae included Filipino, English, and Pohnpeian, in that order. Table 7.7: Languages Spoken at Home by Place of Birth, Kosrae State: 1994 and 2000
Place of Birth USA Yap Guam
Language spoken
Total Percent Yap Outer. Is. Chuuk Pohnpei Nukuoro Kapinaga. Kosrae CNMI Asia Others 1994 CENSUS Persons 5+ yrs 6,395 100.0 0.1 - 0.3 2.2 - - 89.8 1.0 5.0 1.5 Kosraean 5,926 100.0 0.1 - 0.1 1.8 - - 96.1 0.4 0.1 1.4 Yapese/Y. Outer Islands 2 100.0 50.0 - - - - - 50.0 - - - Chuukese/Mortlockese 11 100.0 - - 72.7 - - - 27.3 - - - Pohnpeian 52 100.0 - - 1.9 71.2 - 3.8 23.1 - - - English 66 100.0 1.5 - 4.5 - - - 10.6 60.6 3.0 19.7 Japanese 4 100.0 - - - - - - - - 100.0 - Filipino 69 100.0 - - - - - - 1.4 - 98.6 - Chinese/Taiwanese 236 100.0 - - - - - - 8.5 - 91.5 - Others 29 100.0 - - - - - - 10.3 3.4 72.4 13.8 2000 CENSUS Persons 5+ yrs 6,660 100.0 0.2 - 1.1 3.9 0.2 - 90.3 1.3 0.6 2.5 Kosraean 6,444 100.0 0.1 - 0.3 3.3 0.1 - 92.5 1.1 0.2 2.3 Yapese/Y. Outer Islands 16 100.0 12.5 - - - - - 87.5 - - - Chuukese/Mortlockese 37 100.0 - 2.7 86.5 2.7 - - 5.4 2.7 - - Pohnpeian 39 100.0 - - - 87.2 - - 10.3 - 2.6 - English 57 100.0 - - 12.3 3.5 - - 43.9 26.3 3.5 10.5 Japanese 4 100.0 - - - - - - - - 100.0 - Filipino 29 100.0 - - 17.2 6.9 - - 13.8 - 62.1 - Chinese/Taiwanese - - - - - - - - - - - - Others 34 100.0 - - 14.7 14.7 11.8 5.9 11.8 - 8.8 32.4 Source: 1994 & 2000 FSM Censuses Table 7.8 shows the frequency of English language usage in Kosrae. Over 52 percent of the population in Kosrae spoke English whereas in the 2000 Census data about 63 percent of the population in Kosrae spoke English. In the 2000 Census, among all English speakers, nearly 1 percent reported English was the only language that were being used at home and at work. Less than 4 percent reported English as their first language and about 90 percent as their second language. The pattern was similar for all municipalities.
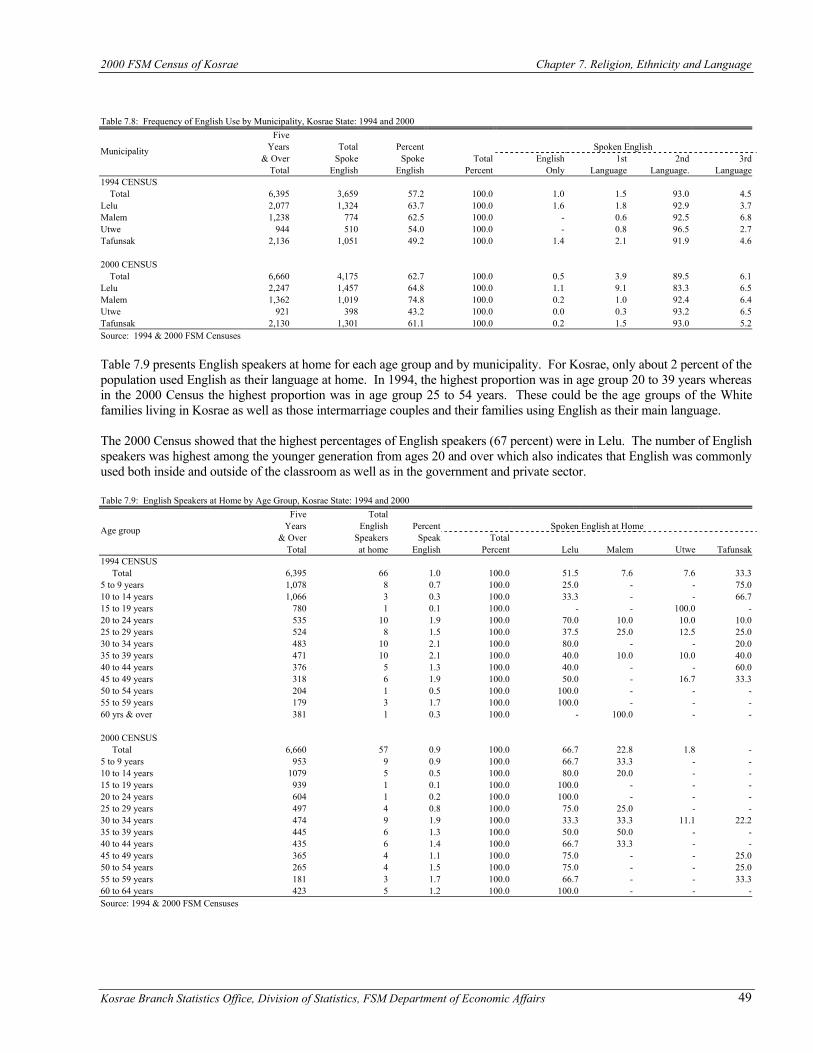
2000 FSM Census of Kosrae Chapter 7. Religion, Ethnicity and Language
Kosrae Branch Statistics Office, Division of Statistics, FSM Department of Economic Affairs 49
Table 7.8: Frequency of English Use by Municipality, Kosrae State: 1994 and 2000
Five Years Total Percent Spoken English
& Over Spoke Spoke Total English 1st 2nd 3rd Municipality
Total English English Percent Only Language Language. Language 1994 CENSUS Total 6,395 3,659 57.2 100.0 1.0 1.5 93.0 4.5 Lelu 2,077 1,324 63.7 100.0 1.6 1.8 92.9 3.7 Malem 1,238 774 62.5 100.0 - 0.6 92.5 6.8 Utwe 944 510 54.0 100.0 - 0.8 96.5 2.7 Tafunsak 2,136 1,051 49.2 100.0 1.4 2.1 91.9 4.6 2000 CENSUS Total 6,660 4,175 62.7 100.0 0.5 3.9 89.5 6.1 Lelu 2,247 1,457 64.8 100.0 1.1 9.1 83.3 6.5 Malem 1,362 1,019 74.8 100.0 0.2 1.0 92.4 6.4 Utwe 921 398 43.2 100.0 0.0 0.3 93.2 6.5 Tafunsak 2,130 1,301 61.1 100.0 0.2 1.5 93.0 5.2 Source: 1994 & 2000 FSM Censuses Table 7.9 presents English speakers at home for each age group and by municipality. For Kosrae, only about 2 percent of the population used English as their language at home. In 1994, the highest proportion was in age group 20 to 39 years whereas in the 2000 Census the highest proportion was in age group 25 to 54 years. These could be the age groups of the White families living in Kosrae as well as those intermarriage couples and their families using English as their main language. The 2000 Census showed that the highest percentages of English speakers (67 percent) were in Lelu. The number of English speakers was highest among the younger generation from ages 20 and over which also indicates that English was commonly used both inside and outside of the classroom as well as in the government and private sector. Table 7.9: English Speakers at Home by Age Group, Kosrae State: 1994 and 2000
Five Total Years English Percent Spoken English at Home
& Over Speakers Speak Total Age group
Total at home English Percent Lelu Malem Utwe Tafunsak 1994 CENSUS Total 6,395 66 1.0 100.0 51.5 7.6 7.6 33.3 5 to 9 years 1,078 8 0.7 100.0 25.0 - - 75.0 10 to 14 years 1,066 3 0.3 100.0 33.3 - - 66.7 15 to 19 years 780 1 0.1 100.0 - - 100.0 - 20 to 24 years 535 10 1.9 100.0 70.0 10.0 10.0 10.0 25 to 29 years 524 8 1.5 100.0 37.5 25.0 12.5 25.0 30 to 34 years 483 10 2.1 100.0 80.0 - - 20.0 35 to 39 years 471 10 2.1 100.0 40.0 10.0 10.0 40.0 40 to 44 years 376 5 1.3 100.0 40.0 - - 60.0 45 to 49 years 318 6 1.9 100.0 50.0 - 16.7 33.3 50 to 54 years 204 1 0.5 100.0 100.0 - - - 55 to 59 years 179 3 1.7 100.0 100.0 - - - 60 yrs & over 381 1 0.3 100.0 - 100.0 - - 2000 CENSUS Total 6,660 57 0.9 100.0 66.7 22.8 1.8 - 5 to 9 years 953 9 0.9 100.0 66.7 33.3 - - 10 to 14 years 1079 5 0.5 100.0 80.0 20.0 - - 15 to 19 years 939 1 0.1 100.0 100.0 - - - 20 to 24 years 604 1 0.2 100.0 100.0 - - - 25 to 29 years 497 4 0.8 100.0 75.0 25.0 - - 30 to 34 years 474 9 1.9 100.0 33.3 33.3 11.1 22.2 35 to 39 years 445 6 1.3 100.0 50.0 50.0 - - 40 to 44 years 435 6 1.4 100.0 66.7 33.3 - - 45 to 49 years 365 4 1.1 100.0 75.0 - - 25.0 50 to 54 years 265 4 1.5 100.0 75.0 - - 25.0 55 to 59 years 181 3 1.7 100.0 66.7 - - 33.3 60 to 64 years 423 5 1.2 100.0 100.0 - - - Source: 1994 & 2000 FSM Censuses
Chapter 7. Religion, Ethnicity and Language 2000 FSM Census of Kosrae
Kosrae Branch Statistics Office, Division of Statistics, FSM Department of Economic Affairs 50
Conclusion Most persons enumerated in both the 1994 and 2000 Censuses had a religion. The results of the 1973, 1994 and 2000 Censuses showed that Protestant Congregational remained as the major religions in Kosrae. While some new religions were being introduced, the 2000 data showed that Protestant Congregation still remained as the largest religious category with about 89 percent of the population being members. Kosraean was the universal ethnic group. Other than the local group, there were foreign ethnic groups such as Asians and Whites. The Asians were the largest non-Kosraean ethnic group, consisting mostly of fisherman working in the locally based fishing company, while the Whites included the Americans, Australians, Europeans, and the New Zealanders working or married in Kosrae. Language patterns in Kosrae were also similar to those of ethnicity. English was the second most common language. Lelu and Tafunsak had the highest proportion of English speakers, possibly because these were the urban centers in Kosrae.
Kosrae Branch Statistics Office, Division of Statistics, FSM Department of Economic Affairs 51
CHAPTER 8 EDUCATION AND LITERACY
Introduction A population's level of formal schooling is considered a good indicator of both social conditions and potential for economic success. For the State of Kosrae, which is moving from a more traditional economic system to a more Westernized system, data on education serve to provide a means to evaluate cultural change. Moreover, given the important role that education has come to play in various sectors of Kosraean's economy, results on this subject should provide insights on the direction of development and on the changing economic potential of the state. The 2000 FSM Census had two items for education: school enrollment and level of educational attainment. The Kosrae Department of Education collects statistical data annually to obtain information about school enrollment and to assess needs for special programs in bilingual education and special education. The census allows more in-depth analysis of schooling as well as educational attainment of the entire population to compare with the socio-economic characteristics of the population. Data Description School Enrollment and Type of School The 2000 Census obtained data on school enrollment from answers to questionnaire item 12. Persons were classified as enrolled in school if they reported attending a "regular" public or private school or college at any time between April 1, 2000 and the date of enumeration. The question included instructions to "include only pre-kindergarten, kindergarten, elementary school, and schooling which would lead to a high school diploma or a college degree" as regular school. Public and Private School A public school was defined as any school or college controlled and supported by the state or national government. The census defined schools supported and controlled primarily by religious organizations or other private groups as private. Level of School Enrolled The 2000 Census classified persons enrolled in school at the time of the census as enrolled in pre-primary school, elementary school, high school, or college according to their response to question 13 (years of school completed or highest degree received) in combination with the response to status of school attendance. Persons who were enrolled and reported completing pre-kindergarten school or less were classified as enrolled in pre-primary school, which included kindergarten. Similarly, enrolled persons who had completed at least kindergarten, but not eighth grade, were classified as enrolled in elementary school. Enrolled persons who completed at least the eighth grade, but who were not high school graduates, were classified as enrolled in high school. Enrolled persons who reported completing high school or some college or having received a post-secondary degree were classified as enrolled in college. Enrolled persons who reported completing the twelfth grade but receiving no diploma were classified as enrolled in high school. Educational Attainment The 2000 Census of the FSM obtained data on educational attainment from answers to questionnaire item 13. Persons were classified according to the highest grade of school completed or the highest degree received. For person’s currently enrolled in school, the question included instructions to report the level of the previous grade attended or the highest degree received. Enumerators were instructed that an estimated equivalent level in the regular American system should report grade level completed in foreign school systems. The vocational, trade, or business schools or colleges were not to be reported unless they were college-level degrees; and that honorary degrees were not to be reported. The instructions excluded "barber school, cosmetology, or other training for a specific trade" from the professional school degree category. Literacy The 2000 Census of the FSM obtained data on literacy — ability to read and write in any language — from responses to questionnaire item 14, asked of persons 3 years and over. In published reports based on the current census data, results generally are shown only for person’s 10 years old and over. Respondents were asked if they could read and write a paragraph, in any language. A person was not literate if he or she could read but not write, or if the writing ability was limited to writing the person's own name. Vocational Training. The 2000 Census obtained data on vocational training for all persons aged 15 years and over from responses to questionnaire item 18. "Vocational training" denotes a school program designed to prepare a person for work in
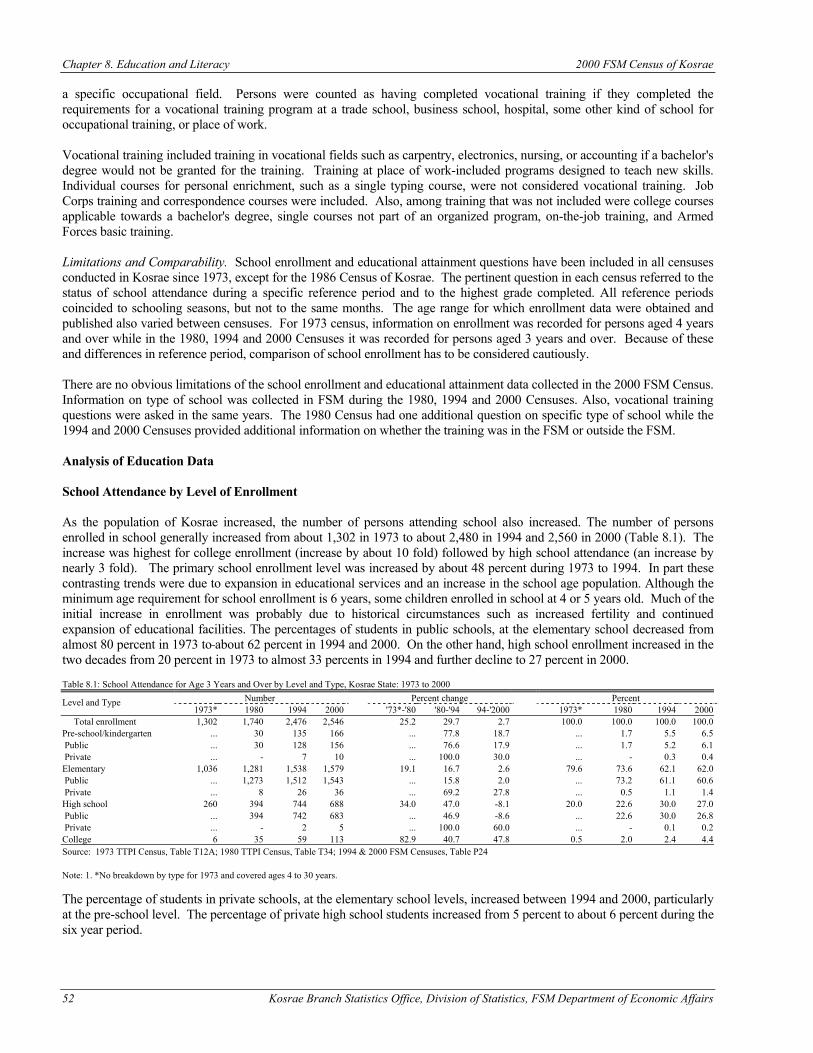
Chapter 8. Education and Literacy 2000 FSM Census of Kosrae
52 Kosrae Branch Statistics Office, Division of Statistics, FSM Department of Economic Affairs
a specific occupational field. Persons were counted as having completed vocational training if they completed the requirements for a vocational training program at a trade school, business school, hospital, some other kind of school for occupational training, or place of work. Vocational training included training in vocational fields such as carpentry, electronics, nursing, or accounting if a bachelor's degree would not be granted for the training. Training at place of work-included programs designed to teach new skills. Individual courses for personal enrichment, such as a single typing course, were not considered vocational training. Job Corps training and correspondence courses were included. Also, among training that was not included were college courses applicable towards a bachelor's degree, single courses not part of an organized program, on-the-job training, and Armed Forces basic training. Limitations and Comparability. School enrollment and educational attainment questions have been included in all censuses conducted in Kosrae since 1973, except for the 1986 Census of Kosrae. The pertinent question in each census referred to the status of school attendance during a specific reference period and to the highest grade completed. All reference periods coincided to schooling seasons, but not to the same months. The age range for which enrollment data were obtained and published also varied between censuses. For 1973 census, information on enrollment was recorded for persons aged 4 years and over while in the 1980, 1994 and 2000 Censuses it was recorded for persons aged 3 years and over. Because of these and differences in reference period, comparison of school enrollment has to be considered cautiously. There are no obvious limitations of the school enrollment and educational attainment data collected in the 2000 FSM Census. Information on type of school was collected in FSM during the 1980, 1994 and 2000 Censuses. Also, vocational training questions were asked in the same years. The 1980 Census had one additional question on specific type of school while the 1994 and 2000 Censuses provided additional information on whether the training was in the FSM or outside the FSM. Analysis of Education Data School Attendance by Level of Enrollment As the population of Kosrae increased, the number of persons attending school also increased. The number of persons enrolled in school generally increased from about 1,302 in 1973 to about 2,480 in 1994 and 2,560 in 2000 (Table 8.1). The increase was highest for college enrollment (increase by about 10 fold) followed by high school attendance (an increase by nearly 3 fold). The primary school enrollment level was increased by about 48 percent during 1973 to 1994. In part these contrasting trends were due to expansion in educational services and an increase in the school age population. Although the minimum age requirement for school enrollment is 6 years, some children enrolled in school at 4 or 5 years old. Much of the initial increase in enrollment was probably due to historical circumstances such as increased fertility and continued expansion of educational facilities. The percentages of students in public schools, at the elementary school decreased from almost 80 percent in 1973 to about 62 percent in 1994 and 2000. On the other hand, high school enrollment increased in the two decades from 20 percent in 1973 to almost 33 percents in 1994 and further decline to 27 percent in 2000. Table 8.1: School Attendance for Age 3 Years and Over by Level and Type, Kosrae State: 1973 to 2000
Number Percent change Percent Level and Type 1973* 1980 1994 2000 '73*-'80 '80-'94 94-'2000 1973* 1980 1994 2000
Total enrollment 1,302 1,740 2,476 2,546 25.2 29.7 2.7 100.0 100.0 100.0 100.0 Pre-school/kindergarten ... 30 135 166 ... 77.8 18.7 ... 1.7 5.5 6.5 Public ... 30 128 156 ... 76.6 17.9 ... 1.7 5.2 6.1 Private ... - 7 10 ... 100.0 30.0 ... - 0.3 0.4 Elementary 1,036 1,281 1,538 1,579 19.1 16.7 2.6 79.6 73.6 62.1 62.0 Public ... 1,273 1,512 1,543 ... 15.8 2.0 ... 73.2 61.1 60.6 Private ... 8 26 36 ... 69.2 27.8 ... 0.5 1.1 1.4 High school 260 394 744 688 34.0 47.0 -8.1 20.0 22.6 30.0 27.0 Public ... 394 742 683 ... 46.9 -8.6 ... 22.6 30.0 26.8 Private ... - 2 5 ... 100.0 60.0 ... - 0.1 0.2 College 6 35 59 113 82.9 40.7 47.8 0.5 2.0 2.4 4.4 Source: 1973 TTPI Census, Table T12A; 1980 TTPI Census, Table T34; 1994 & 2000 FSM Censuses, Table P24 Note: 1. *No breakdown by type for 1973 and covered ages 4 to 30 years. The percentage of students in private schools, at the elementary school levels, increased between 1994 and 2000, particularly at the pre-school level. The percentage of private high school students increased from 5 percent to about 6 percent during the six year period.
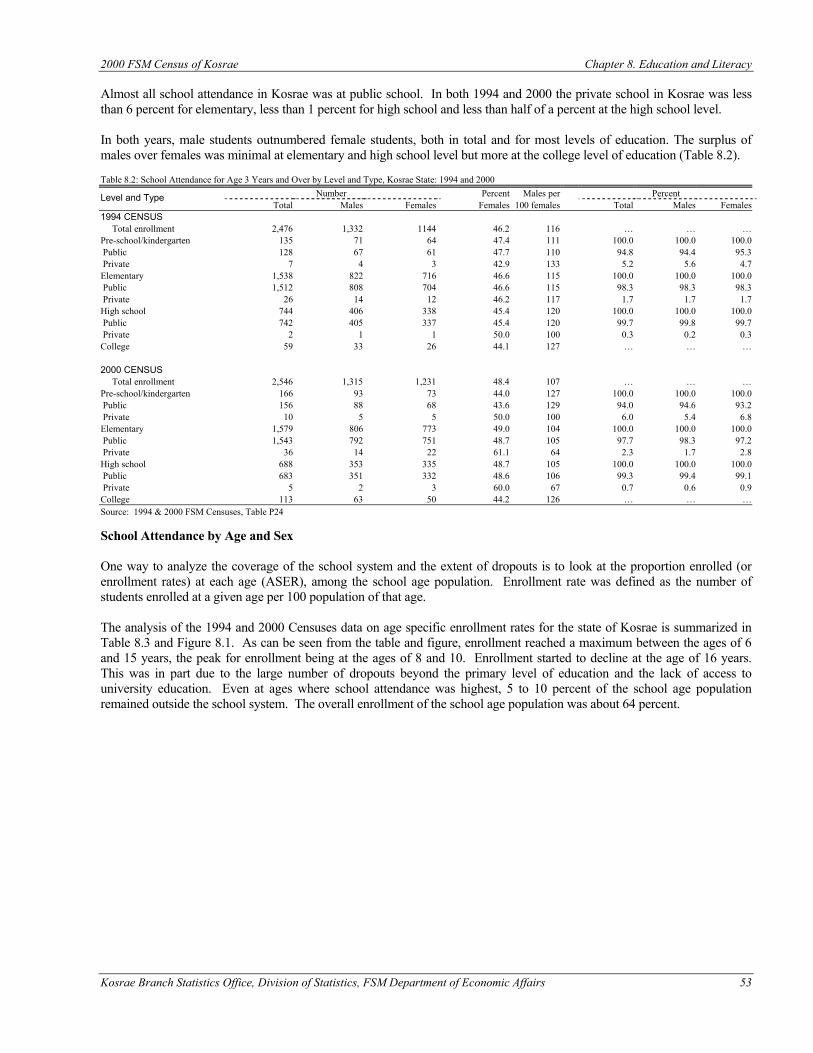
2000 FSM Census of Kosrae Chapter 8. Education and Literacy
Kosrae Branch Statistics Office, Division of Statistics, FSM Department of Economic Affairs 53
Almost all school attendance in Kosrae was at public school. In both 1994 and 2000 the private school in Kosrae was less than 6 percent for elementary, less than 1 percent for high school and less than half of a percent at the high school level. In both years, male students outnumbered female students, both in total and for most levels of education. The surplus of males over females was minimal at elementary and high school level but more at the college level of education (Table 8.2). Table 8.2: School Attendance for Age 3 Years and Over by Level and Type, Kosrae State: 1994 and 2000
Number Percent Males per Percent Level and Type Total Males Females Females 100 females Total Males Females
1994 CENSUS Total enrollment 2,476 1,332 1144 46.2 116 … … … Pre-school/kindergarten 135 71 64 47.4 111 100.0 100.0 100.0 Public 128 67 61 47.7 110 94.8 94.4 95.3 Private 7 4 3 42.9 133 5.2 5.6 4.7 Elementary 1,538 822 716 46.6 115 100.0 100.0 100.0 Public 1,512 808 704 46.6 115 98.3 98.3 98.3 Private 26 14 12 46.2 117 1.7 1.7 1.7 High school 744 406 338 45.4 120 100.0 100.0 100.0 Public 742 405 337 45.4 120 99.7 99.8 99.7 Private 2 1 1 50.0 100 0.3 0.2 0.3 College 59 33 26 44.1 127 … … … 2000 CENSUS Total enrollment 2,546 1,315 1,231 48.4 107 … … … Pre-school/kindergarten 166 93 73 44.0 127 100.0 100.0 100.0 Public 156 88 68 43.6 129 94.0 94.6 93.2 Private 10 5 5 50.0 100 6.0 5.4 6.8 Elementary 1,579 806 773 49.0 104 100.0 100.0 100.0 Public 1,543 792 751 48.7 105 97.7 98.3 97.2 Private 36 14 22 61.1 64 2.3 1.7 2.8 High school 688 353 335 48.7 105 100.0 100.0 100.0 Public 683 351 332 48.6 106 99.3 99.4 99.1 Private 5 2 3 60.0 67 0.7 0.6 0.9 College 113 63 50 44.2 126 … … … Source: 1994 & 2000 FSM Censuses, Table P24 School Attendance by Age and Sex One way to analyze the coverage of the school system and the extent of dropouts is to look at the proportion enrolled (or enrollment rates) at each age (ASER), among the school age population. Enrollment rate was defined as the number of students enrolled at a given age per 100 population of that age. The analysis of the 1994 and 2000 Censuses data on age specific enrollment rates for the state of Kosrae is summarized in Table 8.3 and Figure 8.1. As can be seen from the table and figure, enrollment reached a maximum between the ages of 6 and 15 years, the peak for enrollment being at the ages of 8 and 10. Enrollment started to decline at the age of 16 years. This was in part due to the large number of dropouts beyond the primary level of education and the lack of access to university education. Even at ages where school attendance was highest, 5 to 10 percent of the school age population remained outside the school system. The overall enrollment of the school age population was about 64 percent.
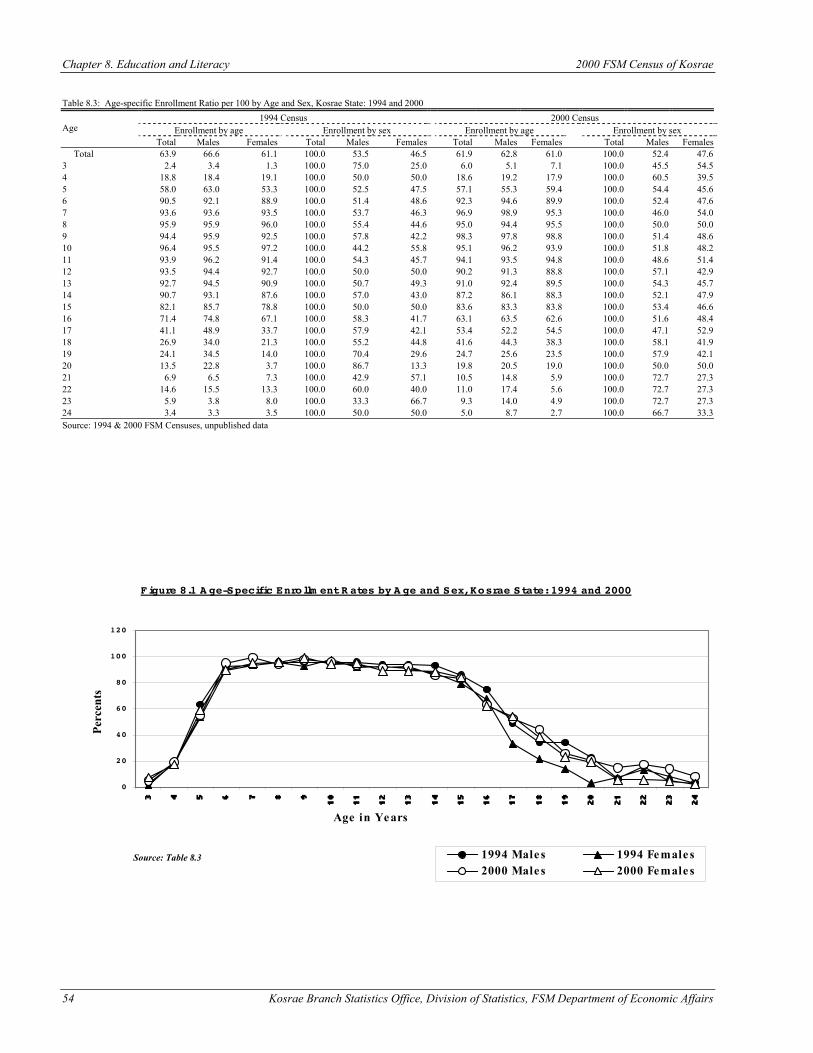
Chapter 8. Education and Literacy 2000 FSM Census of Kosrae
54 Kosrae Branch Statistics Office, Division of Statistics, FSM Department of Economic Affairs
Table 8.3: Age-specific Enrollment Ratio per 100 by Age and Sex, Kosrae State: 1994 and 2000
1994 Census 2000 Census Enrollment by age Enrollment by sex Enrollment by age Enrollment by sex Age
Total Males Females Total Males Females Total Males Females Total Males Females Total 63.9 66.6 61.1 100.0 53.5 46.5 61.9 62.8 61.0 100.0 52.4 47.6 3 2.4 3.4 1.3 100.0 75.0 25.0 6.0 5.1 7.1 100.0 45.5 54.5 4 18.8 18.4 19.1 100.0 50.0 50.0 18.6 19.2 17.9 100.0 60.5 39.5 5 58.0 63.0 53.3 100.0 52.5 47.5 57.1 55.3 59.4 100.0 54.4 45.6 6 90.5 92.1 88.9 100.0 51.4 48.6 92.3 94.6 89.9 100.0 52.4 47.6 7 93.6 93.6 93.5 100.0 53.7 46.3 96.9 98.9 95.3 100.0 46.0 54.0 8 95.9 95.9 96.0 100.0 55.4 44.6 95.0 94.4 95.5 100.0 50.0 50.0 9 94.4 95.9 92.5 100.0 57.8 42.2 98.3 97.8 98.8 100.0 51.4 48.6 10 96.4 95.5 97.2 100.0 44.2 55.8 95.1 96.2 93.9 100.0 51.8 48.2 11 93.9 96.2 91.4 100.0 54.3 45.7 94.1 93.5 94.8 100.0 48.6 51.4 12 93.5 94.4 92.7 100.0 50.0 50.0 90.2 91.3 88.8 100.0 57.1 42.9 13 92.7 94.5 90.9 100.0 50.7 49.3 91.0 92.4 89.5 100.0 54.3 45.7 14 90.7 93.1 87.6 100.0 57.0 43.0 87.2 86.1 88.3 100.0 52.1 47.9 15 82.1 85.7 78.8 100.0 50.0 50.0 83.6 83.3 83.8 100.0 53.4 46.6 16 71.4 74.8 67.1 100.0 58.3 41.7 63.1 63.5 62.6 100.0 51.6 48.4 17 41.1 48.9 33.7 100.0 57.9 42.1 53.4 52.2 54.5 100.0 47.1 52.9 18 26.9 34.0 21.3 100.0 55.2 44.8 41.6 44.3 38.3 100.0 58.1 41.9 19 24.1 34.5 14.0 100.0 70.4 29.6 24.7 25.6 23.5 100.0 57.9 42.1 20 13.5 22.8 3.7 100.0 86.7 13.3 19.8 20.5 19.0 100.0 50.0 50.0 21 6.9 6.5 7.3 100.0 42.9 57.1 10.5 14.8 5.9 100.0 72.7 27.3 22 14.6 15.5 13.3 100.0 60.0 40.0 11.0 17.4 5.6 100.0 72.7 27.3 23 5.9 3.8 8.0 100.0 33.3 66.7 9.3 14.0 4.9 100.0 72.7 27.3 24 3.4 3.3 3.5 100.0 50.0 50.0 5.0 8.7 2.7 100.0 66.7 33.3 Source: 1994 & 2000 FSM Censuses, unpublished data
Figure 8.1 A ge-Specific Enrollm ent R ates by A ge and Sex, Kosrae State: 1994 and 2000
0
20
40
60
80
100
120
Age in Years
Perc
ents
1994 Males 1994 Females2000 Males 2000 Females
Source: Table 8.3
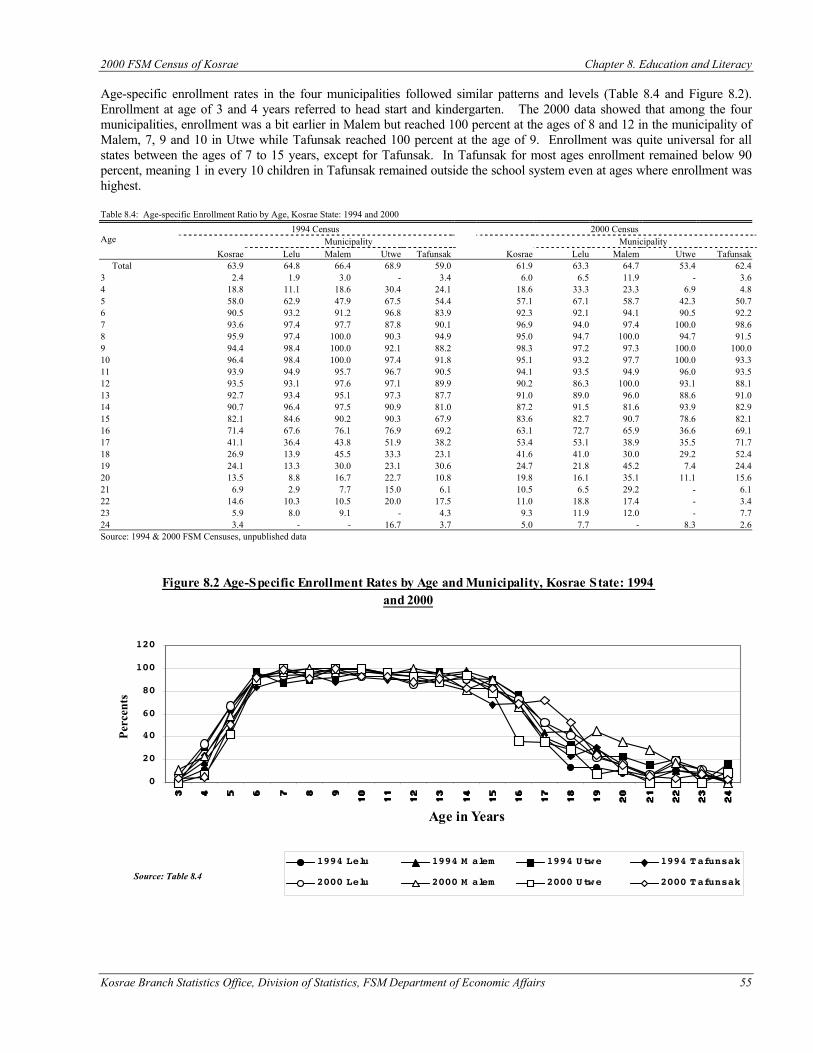
2000 FSM Census of Kosrae Chapter 8. Education and Literacy
Kosrae Branch Statistics Office, Division of Statistics, FSM Department of Economic Affairs 55
Age-specific enrollment rates in the four municipalities followed similar patterns and levels (Table 8.4 and Figure 8.2). Enrollment at age of 3 and 4 years referred to head start and kindergarten. The 2000 data showed that among the four municipalities, enrollment was a bit earlier in Malem but reached 100 percent at the ages of 8 and 12 in the municipality of Malem, 7, 9 and 10 in Utwe while Tafunsak reached 100 percent at the age of 9. Enrollment was quite universal for all states between the ages of 7 to 15 years, except for Tafunsak. In Tafunsak for most ages enrollment remained below 90 percent, meaning 1 in every 10 children in Tafunsak remained outside the school system even at ages where enrollment was highest. Table 8.4: Age-specific Enrollment Ratio by Age, Kosrae State: 1994 and 2000
1994 Census 2000 Census Municipality Municipality Age
Kosrae Lelu Malem Utwe Tafunsak Kosrae Lelu Malem Utwe Tafunsak Total 63.9 64.8 66.4 68.9 59.0 61.9 63.3 64.7 53.4 62.4 3 2.4 1.9 3.0 - 3.4 6.0 6.5 11.9 - 3.6 4 18.8 11.1 18.6 30.4 24.1 18.6 33.3 23.3 6.9 4.8 5 58.0 62.9 47.9 67.5 54.4 57.1 67.1 58.7 42.3 50.7 6 90.5 93.2 91.2 96.8 83.9 92.3 92.1 94.1 90.5 92.2 7 93.6 97.4 97.7 87.8 90.1 96.9 94.0 97.4 100.0 98.6 8 95.9 97.4 100.0 90.3 94.9 95.0 94.7 100.0 94.7 91.5 9 94.4 98.4 100.0 92.1 88.2 98.3 97.2 97.3 100.0 100.0 10 96.4 98.4 100.0 97.4 91.8 95.1 93.2 97.7 100.0 93.3 11 93.9 94.9 95.7 96.7 90.5 94.1 93.5 94.9 96.0 93.5 12 93.5 93.1 97.6 97.1 89.9 90.2 86.3 100.0 93.1 88.1 13 92.7 93.4 95.1 97.3 87.7 91.0 89.0 96.0 88.6 91.0 14 90.7 96.4 97.5 90.9 81.0 87.2 91.5 81.6 93.9 82.9 15 82.1 84.6 90.2 90.3 67.9 83.6 82.7 90.7 78.6 82.1 16 71.4 67.6 76.1 76.9 69.2 63.1 72.7 65.9 36.6 69.1 17 41.1 36.4 43.8 51.9 38.2 53.4 53.1 38.9 35.5 71.7 18 26.9 13.9 45.5 33.3 23.1 41.6 41.0 30.0 29.2 52.4 19 24.1 13.3 30.0 23.1 30.6 24.7 21.8 45.2 7.4 24.4 20 13.5 8.8 16.7 22.7 10.8 19.8 16.1 35.1 11.1 15.6 21 6.9 2.9 7.7 15.0 6.1 10.5 6.5 29.2 - 6.1 22 14.6 10.3 10.5 20.0 17.5 11.0 18.8 17.4 - 3.4 23 5.9 8.0 9.1 - 4.3 9.3 11.9 12.0 - 7.7 24 3.4 - - 16.7 3.7 5.0 7.7 - 8.3 2.6 Source: 1994 & 2000 FSM Censuses, unpublished data
Figure 8.2 Age-Specific Enrollment Rates by Age and Municipality, Kosrae State: 1994 and 2000
0
20
40
60
80
100
120
Age in Years
Perc
ents
1994 Lelu 1994 M alem 1994 Utwe 1994 Tafunsak
2000 Lelu 2000 M alem 2000 Utwe 2000 TafunsakSource: Table 8.4
Chapter 8. Education and Literacy 2000 FSM Census of Kosrae
56 Kosrae Branch Statistics Office, Division of Statistics, FSM Department of Economic Affairs
One way to measure the progress achieved over the years in regard to the proportion of eligible population entering the school system is to compare (or consider the rate of) enrollment in primary and high schools with the corresponding potential primary and high school age population. The result is usually referred as "Gross Enrollment Ratio" (Shryock, et al., 1976). This approach could also be considered as an indirect method to assess the potential of the present educational facilities in the nation. For Kosrae State, the age-level relationship was established as follows: for elementary level, enrollment in grades 1 to 8 is expected for the population aged 6 to 13 years, and for high school, enrollment in grades 9 to 12 is expected for the population aged 14 to 17 years. The results for Kosrae in 1994 and 2000 are summarized in Table 8.5. As can be seen from this table, gross enrollment ratio at primary and secondary level was about 72 to 83 percent in 2000. That is, in the State of Kosrae, pupils at primary and secondary level of education constituted 72 to 83 percent of the eligible population in 2000. According to this analysis, the coverage of the school system was better for high school than primary level education. It can also be seen from the table that the coverage of the eligible population at the primary level education was higher for females than males. This shows that in 2000 females tended to stay in school longer to complete a high school level education compared to the male counterparts. Table 8.5: Gross Enrollment Ratio by Sex, Kosrae State: 1994 and 2000
1994 Census 2000 Census Level Total Males Females Total Males Females
Elementary 90.4 93.3 87.3 71.8 69.6 74.2 High School 93.5 97.8 88.7 83.4 83.1 83.8 Source: 1994 & 2000 FSM Censuses, unpublished data Educational Attainment by Age and Sex Table 8.6 summarizes data on educational attainment for the population age 25 years and over. The absolute numbers of the population completing some level of education increased, while the proportion completing no schooling decreased significantly, over the years. The proportion for persons with no schooling declined from about 13 percent in 1980, 6 percent in 1994 and to about 2 percent in 2000. Also, the proportion of the population completing higher levels of education (high school and higher) increased from around 39 percent in 1980 to nearly 61 percent in 1994 and to about 68 percent in 2000. In general, educational attainment for males also increased consistently from 1980 to 2000. The proportion of males with no schooling decreased from over 11 percent in 1980 to less than 5 percent in 1994 and further decline to 2 percent in 2000. The proportion with only elementary level attainment declined significantly while that of high school and college levels increased significantly. The decline in the proportion of males with only elementary level education from 1980 to 2000 could have resulted from, among other things, the out migration of working age males during the second half of the 1980s and 1990s. Many of people emigrated to take jobs as laborers and may not have had higher-level education. The improvement in educational attainment for females in the State of Kosrae was more pronounced. The proportion of females with no school dropped from about 15 percent in 1980 to about 7 percent in 1994 and to 2 percent in 2000. In other words, in 1980 nearly 1 women in every 7 had no grade completed compared to 1 in 14 in 1994. This improvement held true for higher education level, as well. The proportion of females with at least high school education increased from just 25 percent in 1980 to about 45 percent in 1994 and increased to about 56 percent in 2000. On the other hand, the proportion of females with some college level education increased by about 8 percentage points (from about 6 to about 14 percent) from 1980 to 1994 and 2000.
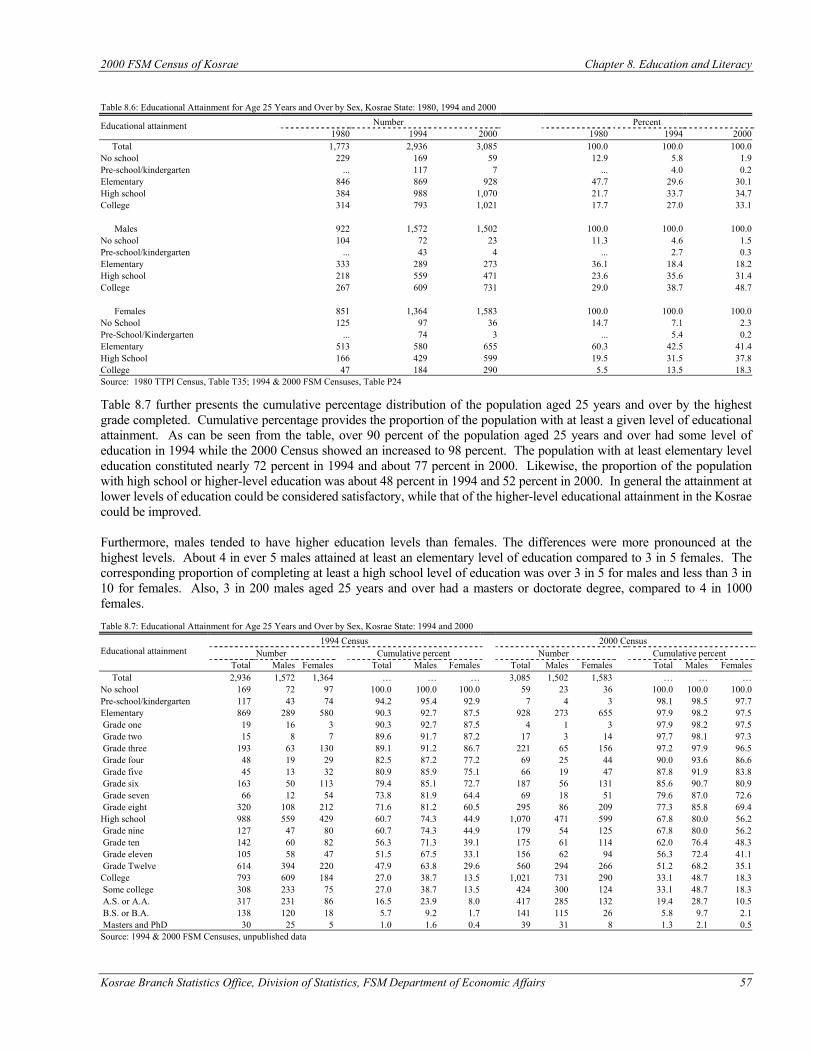
2000 FSM Census of Kosrae Chapter 8. Education and Literacy
Kosrae Branch Statistics Office, Division of Statistics, FSM Department of Economic Affairs 57
Table 8.6: Educational Attainment for Age 25 Years and Over by Sex, Kosrae State: 1980, 1994 and 2000
Number Percent Educational attainment 1980 1994 2000 1980 1994 2000
Total 1,773 2,936 3,085 100.0 100.0 100.0 No school 229 169 59 12.9 5.8 1.9 Pre-school/kindergarten ... 117 7 ... 4.0 0.2 Elementary 846 869 928 47.7 29.6 30.1 High school 384 988 1,070 21.7 33.7 34.7 College 314 793 1,021 17.7 27.0 33.1 Males 922 1,572 1,502 100.0 100.0 100.0 No school 104 72 23 11.3 4.6 1.5 Pre-school/kindergarten ... 43 4 ... 2.7 0.3 Elementary 333 289 273 36.1 18.4 18.2 High school 218 559 471 23.6 35.6 31.4 College 267 609 731 29.0 38.7 48.7 Females 851 1,364 1,583 100.0 100.0 100.0 No School 125 97 36 14.7 7.1 2.3 Pre-School/Kindergarten ... 74 3 ... 5.4 0.2 Elementary 513 580 655 60.3 42.5 41.4 High School 166 429 599 19.5 31.5 37.8 College 47 184 290 5.5 13.5 18.3 Source: 1980 TTPI Census, Table T35; 1994 & 2000 FSM Censuses, Table P24 Table 8.7 further presents the cumulative percentage distribution of the population aged 25 years and over by the highest grade completed. Cumulative percentage provides the proportion of the population with at least a given level of educational attainment. As can be seen from the table, over 90 percent of the population aged 25 years and over had some level of education in 1994 while the 2000 Census showed an increased to 98 percent. The population with at least elementary level education constituted nearly 72 percent in 1994 and about 77 percent in 2000. Likewise, the proportion of the population with high school or higher-level education was about 48 percent in 1994 and 52 percent in 2000. In general the attainment at lower levels of education could be considered satisfactory, while that of the higher-level educational attainment in the Kosrae could be improved. Furthermore, males tended to have higher education levels than females. The differences were more pronounced at the highest levels. About 4 in ever 5 males attained at least an elementary level of education compared to 3 in 5 females. The corresponding proportion of completing at least a high school level of education was over 3 in 5 for males and less than 3 in 10 for females. Also, 3 in 200 males aged 25 years and over had a masters or doctorate degree, compared to 4 in 1000 females. Table 8.7: Educational Attainment for Age 25 Years and Over by Sex, Kosrae State: 1994 and 2000
1994 Census 2000 Census Number Cumulative percent Number Cumulative percent Educational attainment
Total Males Females Total Males Females Total Males Females Total Males Females Total 2,936 1,572 1,364 … … … 3,085 1,502 1,583 … … … No school 169 72 97 100.0 100.0 100.0 59 23 36 100.0 100.0 100.0 Pre-school/kindergarten 117 43 74 94.2 95.4 92.9 7 4 3 98.1 98.5 97.7 Elementary 869 289 580 90.3 92.7 87.5 928 273 655 97.9 98.2 97.5 Grade one 19 16 3 90.3 92.7 87.5 4 1 3 97.9 98.2 97.5 Grade two 15 8 7 89.6 91.7 87.2 17 3 14 97.7 98.1 97.3 Grade three 193 63 130 89.1 91.2 86.7 221 65 156 97.2 97.9 96.5 Grade four 48 19 29 82.5 87.2 77.2 69 25 44 90.0 93.6 86.6 Grade five 45 13 32 80.9 85.9 75.1 66 19 47 87.8 91.9 83.8 Grade six 163 50 113 79.4 85.1 72.7 187 56 131 85.6 90.7 80.9 Grade seven 66 12 54 73.8 81.9 64.4 69 18 51 79.6 87.0 72.6 Grade eight 320 108 212 71.6 81.2 60.5 295 86 209 77.3 85.8 69.4 High school 988 559 429 60.7 74.3 44.9 1,070 471 599 67.8 80.0 56.2 Grade nine 127 47 80 60.7 74.3 44.9 179 54 125 67.8 80.0 56.2 Grade ten 142 60 82 56.3 71.3 39.1 175 61 114 62.0 76.4 48.3 Grade eleven 105 58 47 51.5 67.5 33.1 156 62 94 56.3 72.4 41.1 Grade Twelve 614 394 220 47.9 63.8 29.6 560 294 266 51.2 68.2 35.1 College 793 609 184 27.0 38.7 13.5 1,021 731 290 33.1 48.7 18.3 Some college 308 233 75 27.0 38.7 13.5 424 300 124 33.1 48.7 18.3 A.S. or A.A. 317 231 86 16.5 23.9 8.0 417 285 132 19.4 28.7 10.5 B.S. or B.A. 138 120 18 5.7 9.2 1.7 141 115 26 5.8 9.7 2.1 Masters and PhD 30 25 5 1.0 1.6 0.4 39 31 8 1.3 2.1 0.5 Source: 1994 & 2000 FSM Censuses, unpublished data
Chapter 8. Education and Literacy 2000 FSM Census of Kosrae
58 Kosrae Branch Statistics Office, Division of Statistics, FSM Department of Economic Affairs
Educational attainment of the population aged 25 years and over varied moderately among the four municipalities of the state (Table 8.8). In the 2000 Census, the proportion of higher-level educated persons (the population with educational attainment of high school or higher) was highest in Malem (about 60 percent), followed by Lelu (about 50 percent) and Tafunsak reported (about 44 percent). The corresponding proportion among residents of Utwe was about 37 percent. The proportion of college graduates was also highest in Malem (more than 26 percent), followed by Lelu (nearly 28 percent), Tafunsak (15 percent) and Utwe (about 16 percent). These patterns could have resulted from differences in educational facilities and attendance in the past as well as differences in inter-municipality and international migration patterns. Table 8.8: Educational Attainment for Aged 25 Years and Over by Municipality, Kosrae State: 1994 and 2000
1994 Census Educational attainment
Less than Elem- Some High School Some College Municipality
Total Percent Elementary Entary High.School Graduates College Graduates 1994 Census 2,650 100.0 20.7 12.1 21.6 15.7 11.6 18.3 Lelu 888 100.0 20.7 11.9 15.2 16.7 11.8 23.6 Malem 537 100.0 21.2 9.1 18.8 15.8 14.0 21.0 Utwe 322 100.0 26.4 14.3 24.8 10.2 8.7 15.5 Tafunsak 903 100.0 18.4 13.2 28.5 16.5 11.1 12.4 2000 Census 3,019 100.0 21.0 9.8 21.3 14.1 14.0 19.8 Lelu 1,006 100.0 23.0 8.2 19.8 13.7 13.7 21.7 Malem 634 100.0 17.5 5.0 18.1 17.2 15.6 26.5 Utwe 425 100.0 24.5 13.6 24.7 10.8 10.4 16.0 Tafunsak 954 100.0 19.6 12.9 23.5 14.0 15.0 15.0 Source: 1994 & 2000 FSM Censuses, Table P24 Educational attainment varied considerably with age (Table 8.9). In both 1994 and 2000, the proportion of the population with only an elementary level education was longer for the older age groups, while that with a high school and some college level of education was smaller as age increased, showing an improvement in educational attainment for the younger generations. The percentage of college educated persons reached its peak among the population aged 35 to 54 years old in both 1994 and 2000. This pattern may have been influenced both by persons being away at school, taking longer than in the past to finish schooling, and the effects of net out migration on the education statistics. Also in 2000, educational attainment for males in the State of Kosrae exceeded the attainment of females at all levels of schooling (See the middle section of Table 8.9). The patterns for all persons aged 25 years and over held for males as well. The decline in the proportion of males with bachelor's degrees for age groups 25 to 29 and 30 to 34 was particularly noticeable during the 1994 and 2000. Higher level educational attainment was slightly lower among females aged 25 years and over in the Kosrae compared to their male counterparts (See bottom panel of Table 8.9). The male and female pattern was similar, but the level was different. Nevertheless, the improvement of female educational attainment by age was much more pronounced. For example, among female with some educational attainment, 87 and 92 percent of females in the age group 55-64 and 65 and over had elementary level while this was true for only 23 percent among females in the age group 25 - 29 years during the 1994 Census. As for the 2000 Census, the data showed that female with some educational attainment, 81 and 97 percent of females in the age group of 55-64 and 65 and over had elementary level while this was true for the 12 percent among females in the age group 25-29 years. These data confirm that males used to be more privileged for school enrollment than females, differential has decreased in recent years.
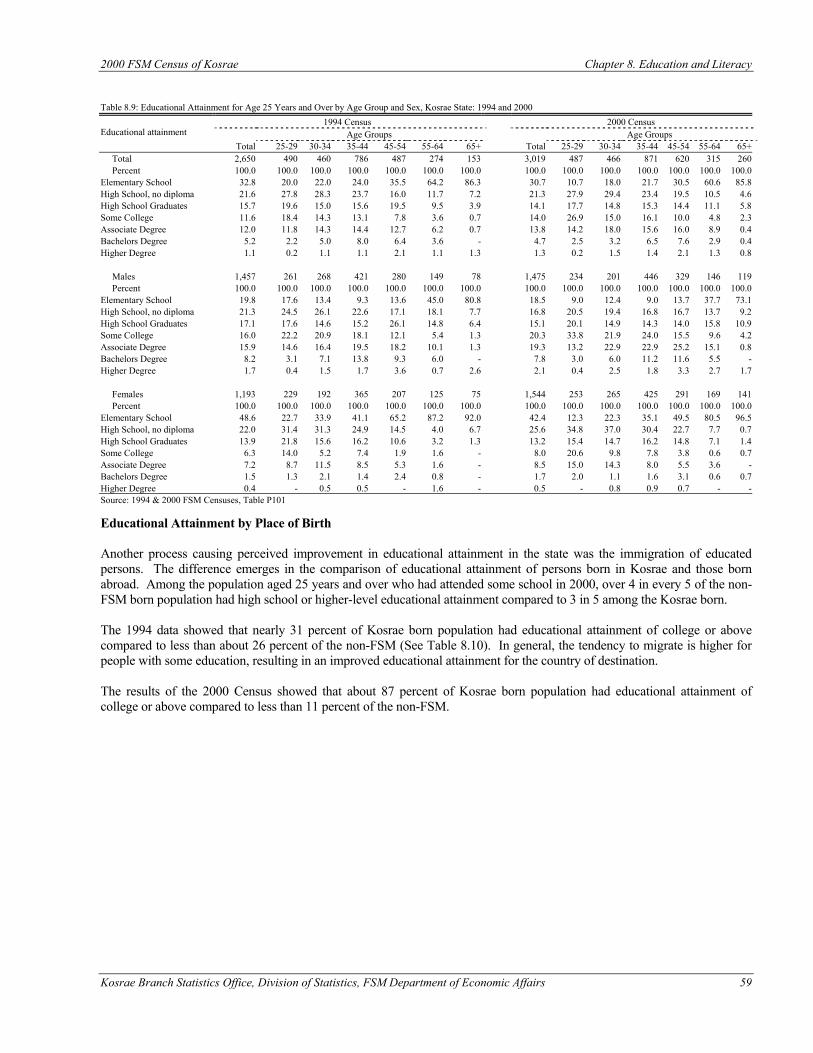
2000 FSM Census of Kosrae Chapter 8. Education and Literacy
Kosrae Branch Statistics Office, Division of Statistics, FSM Department of Economic Affairs 59
Table 8.9: Educational Attainment for Age 25 Years and Over by Age Group and Sex, Kosrae State: 1994 and 2000
1994 Census 2000 Census Age Groups Age Groups Educational attainment
Total 25-29 30-34 35-44 45-54 55-64 65+ Total 25-29 30-34 35-44 45-54 55-64 65+ Total 2,650 490 460 786 487 274 153 3,019 487 466 871 620 315 260 Percent 100.0 100.0 100.0 100.0 100.0 100.0 100.0 100.0 100.0 100.0 100.0 100.0 100.0 100.0 Elementary School 32.8 20.0 22.0 24.0 35.5 64.2 86.3 30.7 10.7 18.0 21.7 30.5 60.6 85.8 High School, no diploma 21.6 27.8 28.3 23.7 16.0 11.7 7.2 21.3 27.9 29.4 23.4 19.5 10.5 4.6 High School Graduates 15.7 19.6 15.0 15.6 19.5 9.5 3.9 14.1 17.7 14.8 15.3 14.4 11.1 5.8 Some College 11.6 18.4 14.3 13.1 7.8 3.6 0.7 14.0 26.9 15.0 16.1 10.0 4.8 2.3 Associate Degree 12.0 11.8 14.3 14.4 12.7 6.2 0.7 13.8 14.2 18.0 15.6 16.0 8.9 0.4 Bachelors Degree 5.2 2.2 5.0 8.0 6.4 3.6 - 4.7 2.5 3.2 6.5 7.6 2.9 0.4 Higher Degree 1.1 0.2 1.1 1.1 2.1 1.1 1.3 1.3 0.2 1.5 1.4 2.1 1.3 0.8 Males 1,457 261 268 421 280 149 78 1,475 234 201 446 329 146 119 Percent 100.0 100.0 100.0 100.0 100.0 100.0 100.0 100.0 100.0 100.0 100.0 100.0 100.0 100.0 Elementary School 19.8 17.6 13.4 9.3 13.6 45.0 80.8 18.5 9.0 12.4 9.0 13.7 37.7 73.1 High School, no diploma 21.3 24.5 26.1 22.6 17.1 18.1 7.7 16.8 20.5 19.4 16.8 16.7 13.7 9.2 High School Graduates 17.1 17.6 14.6 15.2 26.1 14.8 6.4 15.1 20.1 14.9 14.3 14.0 15.8 10.9 Some College 16.0 22.2 20.9 18.1 12.1 5.4 1.3 20.3 33.8 21.9 24.0 15.5 9.6 4.2 Associate Degree 15.9 14.6 16.4 19.5 18.2 10.1 1.3 19.3 13.2 22.9 22.9 25.2 15.1 0.8 Bachelors Degree 8.2 3.1 7.1 13.8 9.3 6.0 - 7.8 3.0 6.0 11.2 11.6 5.5 - Higher Degree 1.7 0.4 1.5 1.7 3.6 0.7 2.6 2.1 0.4 2.5 1.8 3.3 2.7 1.7 Females 1,193 229 192 365 207 125 75 1,544 253 265 425 291 169 141 Percent 100.0 100.0 100.0 100.0 100.0 100.0 100.0 100.0 100.0 100.0 100.0 100.0 100.0 100.0 Elementary School 48.6 22.7 33.9 41.1 65.2 87.2 92.0 42.4 12.3 22.3 35.1 49.5 80.5 96.5 High School, no diploma 22.0 31.4 31.3 24.9 14.5 4.0 6.7 25.6 34.8 37.0 30.4 22.7 7.7 0.7 High School Graduates 13.9 21.8 15.6 16.2 10.6 3.2 1.3 13.2 15.4 14.7 16.2 14.8 7.1 1.4 Some College 6.3 14.0 5.2 7.4 1.9 1.6 - 8.0 20.6 9.8 7.8 3.8 0.6 0.7 Associate Degree 7.2 8.7 11.5 8.5 5.3 1.6 - 8.5 15.0 14.3 8.0 5.5 3.6 - Bachelors Degree 1.5 1.3 2.1 1.4 2.4 0.8 - 1.7 2.0 1.1 1.6 3.1 0.6 0.7 Higher Degree 0.4 - 0.5 0.5 - 1.6 - 0.5 - 0.8 0.9 0.7 - - Source: 1994 & 2000 FSM Censuses, Table P101 Educational Attainment by Place of Birth Another process causing perceived improvement in educational attainment in the state was the immigration of educated persons. The difference emerges in the comparison of educational attainment of persons born in Kosrae and those born abroad. Among the population aged 25 years and over who had attended some school in 2000, over 4 in every 5 of the non-FSM born population had high school or higher-level educational attainment compared to 3 in 5 among the Kosrae born. The 1994 data showed that nearly 31 percent of Kosrae born population had educational attainment of college or above compared to less than about 26 percent of the non-FSM (See Table 8.10). In general, the tendency to migrate is higher for people with some education, resulting in an improved educational attainment for the country of destination. The results of the 2000 Census showed that about 87 percent of Kosrae born population had educational attainment of college or above compared to less than 11 percent of the non-FSM.
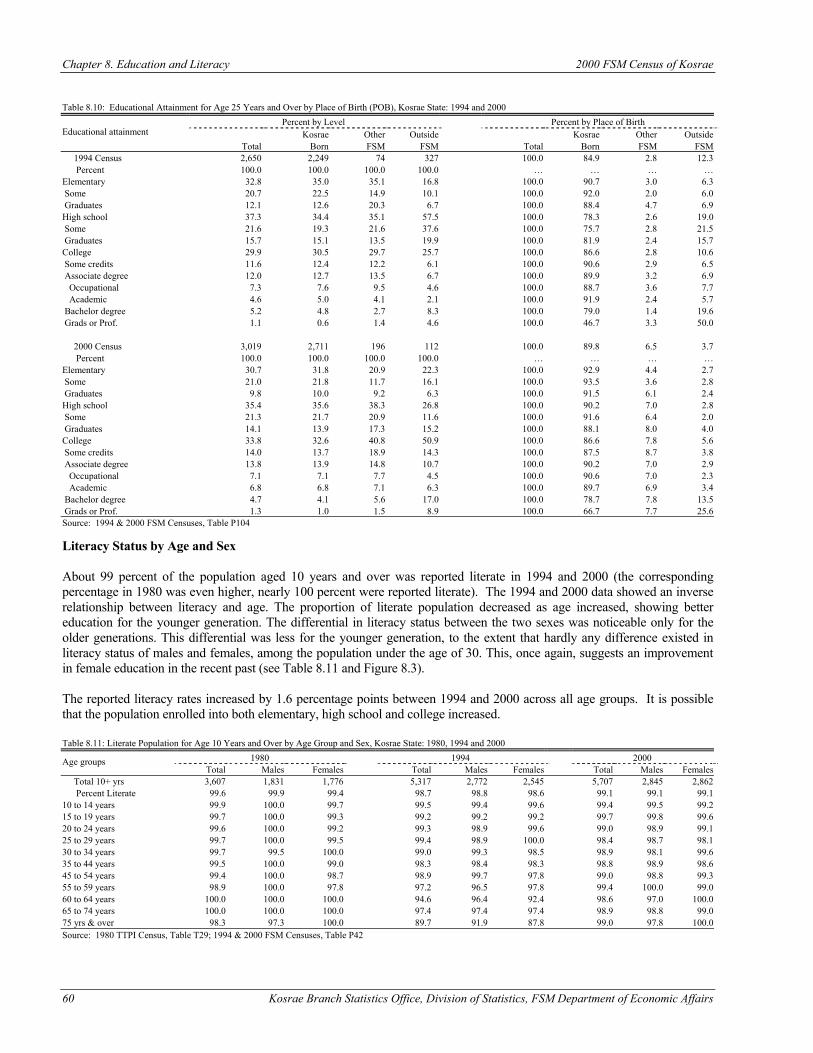
Chapter 8. Education and Literacy 2000 FSM Census of Kosrae
60 Kosrae Branch Statistics Office, Division of Statistics, FSM Department of Economic Affairs
Table 8.10: Educational Attainment for Age 25 Years and Over by Place of Birth (POB), Kosrae State: 1994 and 2000
Percent by Level Percent by Place of Birth Kosrae Other Outside Kosrae Other Outside Educational attainment
Total Born FSM FSM Total Born FSM FSM 1994 Census 2,650 2,249 74 327 100.0 84.9 2.8 12.3 Percent 100.0 100.0 100.0 100.0 … … … … Elementary 32.8 35.0 35.1 16.8 100.0 90.7 3.0 6.3 Some 20.7 22.5 14.9 10.1 100.0 92.0 2.0 6.0 Graduates 12.1 12.6 20.3 6.7 100.0 88.4 4.7 6.9 High school 37.3 34.4 35.1 57.5 100.0 78.3 2.6 19.0 Some 21.6 19.3 21.6 37.6 100.0 75.7 2.8 21.5 Graduates 15.7 15.1 13.5 19.9 100.0 81.9 2.4 15.7 College 29.9 30.5 29.7 25.7 100.0 86.6 2.8 10.6 Some credits 11.6 12.4 12.2 6.1 100.0 90.6 2.9 6.5 Associate degree 12.0 12.7 13.5 6.7 100.0 89.9 3.2 6.9 Occupational 7.3 7.6 9.5 4.6 100.0 88.7 3.6 7.7 Academic 4.6 5.0 4.1 2.1 100.0 91.9 2.4 5.7 Bachelor degree 5.2 4.8 2.7 8.3 100.0 79.0 1.4 19.6 Grads or Prof. 1.1 0.6 1.4 4.6 100.0 46.7 3.3 50.0 2000 Census 3,019 2,711 196 112 100.0 89.8 6.5 3.7 Percent 100.0 100.0 100.0 100.0 … … … … Elementary 30.7 31.8 20.9 22.3 100.0 92.9 4.4 2.7 Some 21.0 21.8 11.7 16.1 100.0 93.5 3.6 2.8 Graduates 9.8 10.0 9.2 6.3 100.0 91.5 6.1 2.4 High school 35.4 35.6 38.3 26.8 100.0 90.2 7.0 2.8 Some 21.3 21.7 20.9 11.6 100.0 91.6 6.4 2.0 Graduates 14.1 13.9 17.3 15.2 100.0 88.1 8.0 4.0 College 33.8 32.6 40.8 50.9 100.0 86.6 7.8 5.6 Some credits 14.0 13.7 18.9 14.3 100.0 87.5 8.7 3.8 Associate degree 13.8 13.9 14.8 10.7 100.0 90.2 7.0 2.9 Occupational 7.1 7.1 7.7 4.5 100.0 90.6 7.0 2.3 Academic 6.8 6.8 7.1 6.3 100.0 89.7 6.9 3.4 Bachelor degree 4.7 4.1 5.6 17.0 100.0 78.7 7.8 13.5 Grads or Prof. 1.3 1.0 1.5 8.9 100.0 66.7 7.7 25.6 Source: 1994 & 2000 FSM Censuses, Table P104 Literacy Status by Age and Sex About 99 percent of the population aged 10 years and over was reported literate in 1994 and 2000 (the corresponding percentage in 1980 was even higher, nearly 100 percent were reported literate). The 1994 and 2000 data showed an inverse relationship between literacy and age. The proportion of literate population decreased as age increased, showing better education for the younger generation. The differential in literacy status between the two sexes was noticeable only for the older generations. This differential was less for the younger generation, to the extent that hardly any difference existed in literacy status of males and females, among the population under the age of 30. This, once again, suggests an improvement in female education in the recent past (see Table 8.11 and Figure 8.3). The reported literacy rates increased by 1.6 percentage points between 1994 and 2000 across all age groups. It is possible that the population enrolled into both elementary, high school and college increased. Table 8.11: Literate Population for Age 10 Years and Over by Age Group and Sex, Kosrae State: 1980, 1994 and 2000
1980 1994 2000 Age groups Total Males Females Total Males Females Total Males Females
Total 10+ yrs 3,607 1,831 1,776 5,317 2,772 2,545 5,707 2,845 2,862 Percent Literate 99.6 99.9 99.4 98.7 98.8 98.6 99.1 99.1 99.1 10 to 14 years 99.9 100.0 99.7 99.5 99.4 99.6 99.4 99.5 99.2 15 to 19 years 99.7 100.0 99.3 99.2 99.2 99.2 99.7 99.8 99.6 20 to 24 years 99.6 100.0 99.2 99.3 98.9 99.6 99.0 98.9 99.1 25 to 29 years 99.7 100.0 99.5 99.4 98.9 100.0 98.4 98.7 98.1 30 to 34 years 99.7 99.5 100.0 99.0 99.3 98.5 98.9 98.1 99.6 35 to 44 years 99.5 100.0 99.0 98.3 98.4 98.3 98.8 98.9 98.6 45 to 54 years 99.4 100.0 98.7 98.9 99.7 97.8 99.0 98.8 99.3 55 to 59 years 98.9 100.0 97.8 97.2 96.5 97.8 99.4 100.0 99.0 60 to 64 years 100.0 100.0 100.0 94.6 96.4 92.4 98.6 97.0 100.0 65 to 74 years 100.0 100.0 100.0 97.4 97.4 97.4 98.9 98.8 99.0 75 yrs & over 98.3 97.3 100.0 89.7 91.9 87.8 99.0 97.8 100.0 Source: 1980 TTPI Census, Table T29; 1994 & 2000 FSM Censuses, Table P42
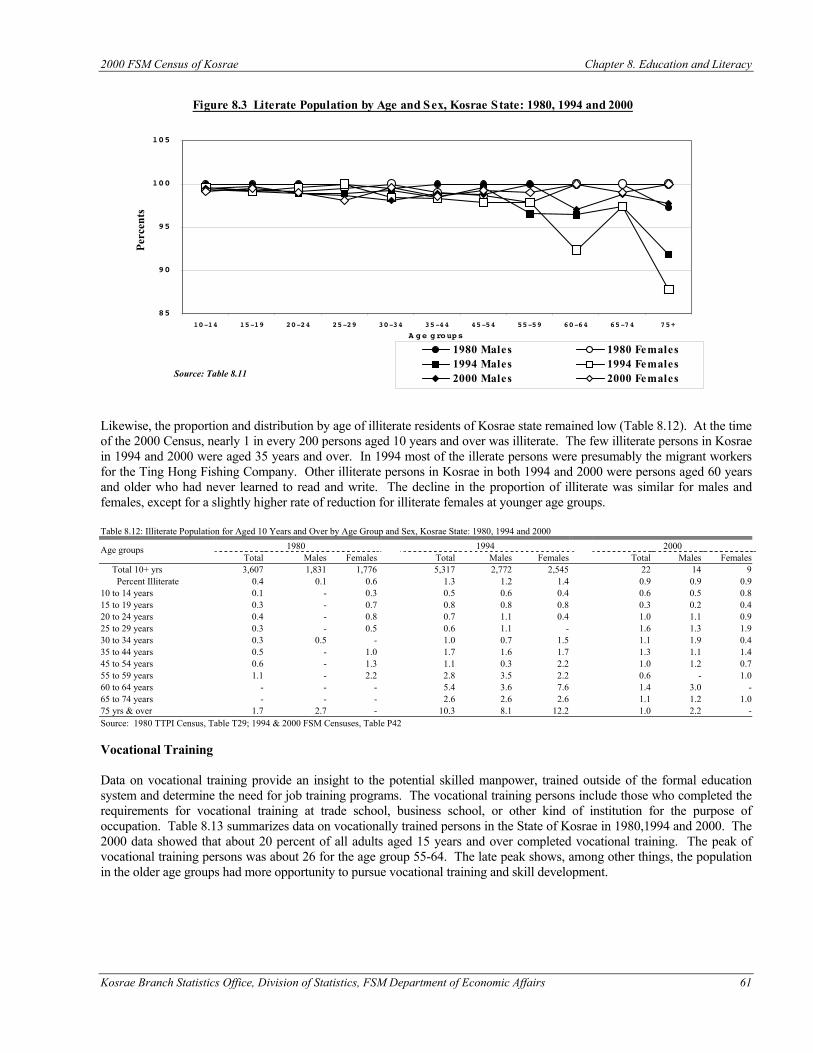
2000 FSM Census of Kosrae Chapter 8. Education and Literacy
Kosrae Branch Statistics Office, Division of Statistics, FSM Department of Economic Affairs 61
Likewise, the proportion and distribution by age of illiterate residents of Kosrae state remained low (Table 8.12). At the time of the 2000 Census, nearly 1 in every 200 persons aged 10 years and over was illiterate. The few illiterate persons in Kosrae in 1994 and 2000 were aged 35 years and over. In 1994 most of the illerate persons were presumably the migrant workers for the Ting Hong Fishing Company. Other illiterate persons in Kosrae in both 1994 and 2000 were persons aged 60 years and older who had never learned to read and write. The decline in the proportion of illiterate was similar for males and females, except for a slightly higher rate of reduction for illiterate females at younger age groups. Table 8.12: Illiterate Population for Aged 10 Years and Over by Age Group and Sex, Kosrae State: 1980, 1994 and 2000
1980 1994 2000 Age groups Total Males Females Total Males Females Total Males Females
Total 10+ yrs 3,607 1,831 1,776 5,317 2,772 2,545 22 14 9 Percent Illiterate 0.4 0.1 0.6 1.3 1.2 1.4 0.9 0.9 0.9 10 to 14 years 0.1 - 0.3 0.5 0.6 0.4 0.6 0.5 0.8 15 to 19 years 0.3 - 0.7 0.8 0.8 0.8 0.3 0.2 0.4 20 to 24 years 0.4 - 0.8 0.7 1.1 0.4 1.0 1.1 0.9 25 to 29 years 0.3 - 0.5 0.6 1.1 - 1.6 1.3 1.9 30 to 34 years 0.3 0.5 - 1.0 0.7 1.5 1.1 1.9 0.4 35 to 44 years 0.5 - 1.0 1.7 1.6 1.7 1.3 1.1 1.4 45 to 54 years 0.6 - 1.3 1.1 0.3 2.2 1.0 1.2 0.7 55 to 59 years 1.1 - 2.2 2.8 3.5 2.2 0.6 - 1.0 60 to 64 years - - - 5.4 3.6 7.6 1.4 3.0 - 65 to 74 years - - - 2.6 2.6 2.6 1.1 1.2 1.0 75 yrs & over 1.7 2.7 - 10.3 8.1 12.2 1.0 2.2 - Source: 1980 TTPI Census, Table T29; 1994 & 2000 FSM Censuses, Table P42 Vocational Training Data on vocational training provide an insight to the potential skilled manpower, trained outside of the formal education system and determine the need for job training programs. The vocational training persons include those who completed the requirements for vocational training at trade school, business school, or other kind of institution for the purpose of occupation. Table 8.13 summarizes data on vocationally trained persons in the State of Kosrae in 1980,1994 and 2000. The 2000 data showed that about 20 percent of all adults aged 15 years and over completed vocational training. The peak of vocational training persons was about 26 for the age group 55-64. The late peak shows, among other things, the population in the older age groups had more opportunity to pursue vocational training and skill development.
Figure 8.3 Literate Population by Age and Sex, Kosrae State: 1980, 1994 and 2000
85
90
95
100
105
10-14 15-19 20-24 25-29 30-34 35-44 45-54 55-59 60-64 65-74 75+
A ge groups
Perc
ents
1980 Males 1980 Females1994 Males 1994 Females2000 Males 2000 FemalesSource: Table 8.11
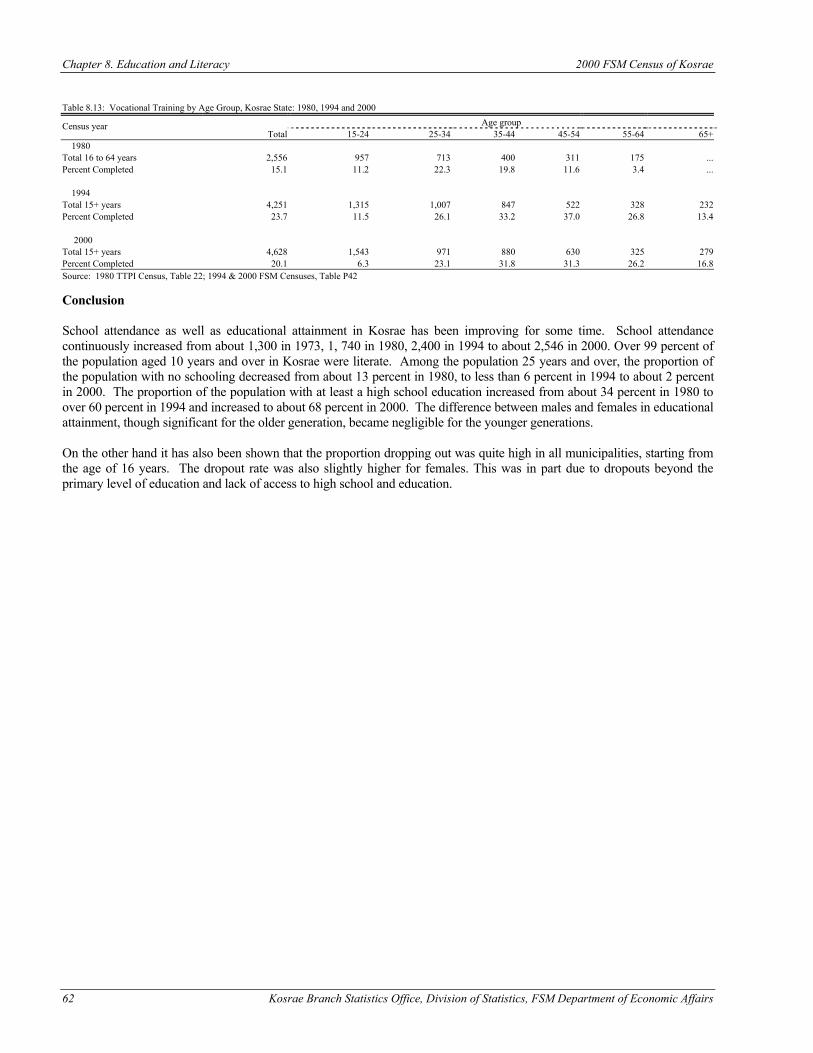
Chapter 8. Education and Literacy 2000 FSM Census of Kosrae
62 Kosrae Branch Statistics Office, Division of Statistics, FSM Department of Economic Affairs
Table 8.13: Vocational Training by Age Group, Kosrae State: 1980, 1994 and 2000
Age group Census year Total 15-24 25-34 35-44 45-54 55-64 65+
1980 Total 16 to 64 years 2,556 957 713 400 311 175 ... Percent Completed 15.1 11.2 22.3 19.8 11.6 3.4 ... 1994 Total 15+ years 4,251 1,315 1,007 847 522 328 232 Percent Completed 23.7 11.5 26.1 33.2 37.0 26.8 13.4 2000 Total 15+ years 4,628 1,543 971 880 630 325 279 Percent Completed 20.1 6.3 23.1 31.8 31.3 26.2 16.8 Source: 1980 TTPI Census, Table 22; 1994 & 2000 FSM Censuses, Table P42 Conclusion School attendance as well as educational attainment in Kosrae has been improving for some time. School attendance continuously increased from about 1,300 in 1973, 1, 740 in 1980, 2,400 in 1994 to about 2,546 in 2000. Over 99 percent of the population aged 10 years and over in Kosrae were literate. Among the population 25 years and over, the proportion of the population with no schooling decreased from about 13 percent in 1980, to less than 6 percent in 1994 to about 2 percent in 2000. The proportion of the population with at least a high school education increased from about 34 percent in 1980 to over 60 percent in 1994 and increased to about 68 percent in 2000. The difference between males and females in educational attainment, though significant for the older generation, became negligible for the younger generations. On the other hand it has also been shown that the proportion dropping out was quite high in all municipalities, starting from the age of 16 years. The dropout rate was also slightly higher for females. This was in part due to dropouts beyond the primary level of education and lack of access to high school and education.
Kosrae Branch Statistics Office, Division of Statistics, FSM Department of Economic Affairs 63
CHAPTER 9 ECONOMIC ACTIVITY
Introduction The changing economy of the State of Kosrae creates a demand for data on labor force characteristics and job activities. The following chapters provide insight into the adjustment that Kosrae State is making as it moves from subsistence to a cash-oriented economy. Information on economic activity, industries and occupations, and income are presented in the next three chapters. The potential labor force in the State of Kosrae conventionally defined as the population of working age 15 years and above, accounted for 4,251 persons, or 58 percent of Kosrae's population, at the time of the Census in 1994 while in the 2000 Census results potential labor force in the state of Kosrae accounted for 4,628 persons, or 60 percent of Kosrae’s population. However, many of these potential contributors to domestic production were not in the labor force because they were students, or housewives and looking after children, sick or retired. On the other hand, a large proportion of the population were working, or were seeking work, in the major sectors of economic activity, namely the government, the private sector, and subsistence, involving mainly agriculture and fishing. Definitions In order to determine the current labor force status, all respondents aged 15 to 64 years and over were asked whether they did any 'work' in the week before the census, including full-time or part-time work. Work also included full-time and part-time work in a family farm or business, with or without pay. Work did not include unpaid volunteer work. Series of questions on employment status were designed to identify several types of individuals in the FSM: persons who worked at a job or business or farm at any time during the reference week. Other questions were asked of persons who did not do such work during the reference week, but who had jobs or businesses from which they were temporarily absent; and persons who did not work during the reference week, but who were looking for work during the reference week. The labor force included the employed work force as well as the unemployed. The total employed labor force was made up of a number of constituent groups, including persons who worked full-time or part-time at a job or business, and persons who worked mainly in farming or fishing during the reference week regardless of whether any of their produce was sold or not. The latter group has been classified in agriculture and fishing and further sub-classified as market oriented and subsistence. A person was described as a subsistence worker if he/she mainly farmed or fished in the week before the census without selling, or intending to sell, any produce. Persons who did only some subsistence, but mainly worked at another job in the week before the census were not included as doing subsistence. Persons who farmed or fished and sold their produce were also in the agricultural/fishing group but were categorized as market oriented. Unemployed persons included persons who were looking and available for work in the four weeks preceding the census. The economically inactive working age population, those not in the labor force, were working age persons not classified as being employed or unemployed. A special group of inactive persons were not those who were employed nor looking for work but who said they could have taken a job if one had been offered to them. These persons were categorized as "could have taken a job". Labor force participation rates (LFPR) were calculated by dividing the number of persons in the labor force by the potential labor force of the group. For example a LFPR for women aged 15 to 19 would be calculated by dividing the number of women both employed and unemployed by the total number of women aged 15 to 19 and multiplied by 100 to make it a percentage. Unemployment rates, on the other hand, are calculated by dividing the number of persons defined as unemployed and by the number of persons in the labor force, and again multiplying by 100 to make it a percentage calculated. The current work force includes both formal workers and agricultural and fishing workers. The formal work force includes all persons at a paid job. Current workers are only those persons who responded about their jobs in the week before the census. Persons sick or temporarily absent from a job were not included in the experienced work force.
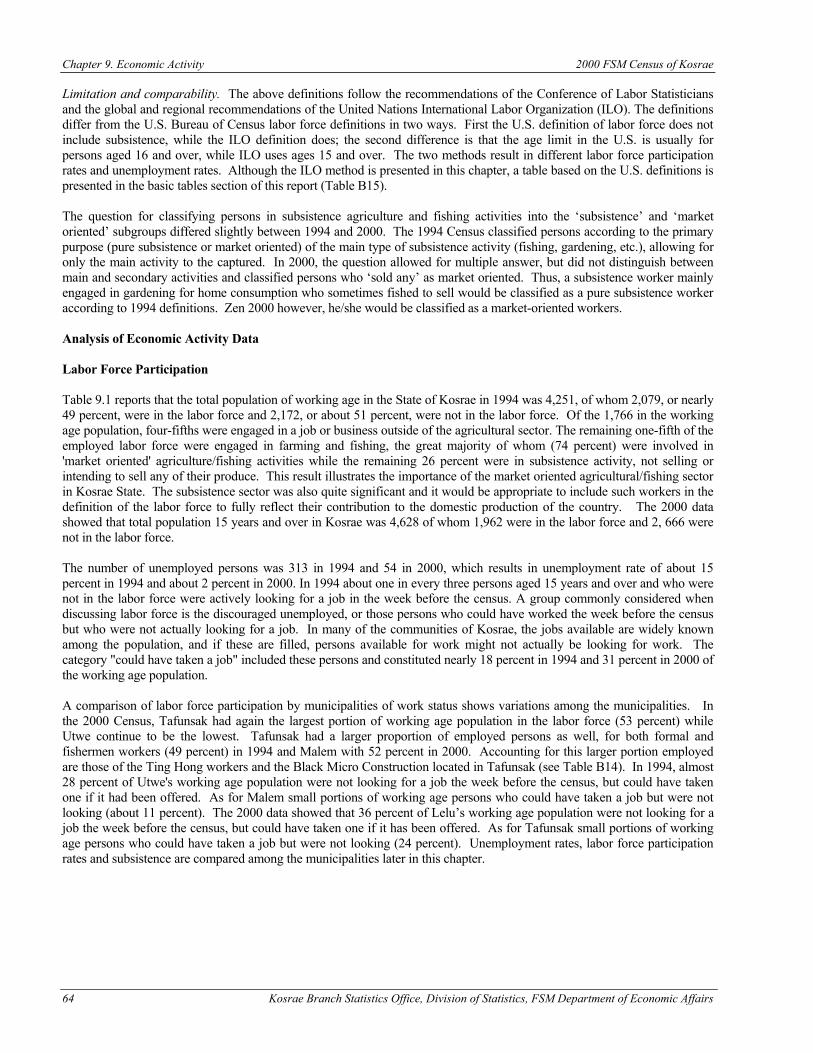
Chapter 9. Economic Activity 2000 FSM Census of Kosrae
64 Kosrae Branch Statistics Office, Division of Statistics, FSM Department of Economic Affairs
Limitation and comparability. The above definitions follow the recommendations of the Conference of Labor Statisticians and the global and regional recommendations of the United Nations International Labor Organization (ILO). The definitions differ from the U.S. Bureau of Census labor force definitions in two ways. First the U.S. definition of labor force does not include subsistence, while the ILO definition does; the second difference is that the age limit in the U.S. is usually for persons aged 16 and over, while ILO uses ages 15 and over. The two methods result in different labor force participation rates and unemployment rates. Although the ILO method is presented in this chapter, a table based on the U.S. definitions is presented in the basic tables section of this report (Table B15). The question for classifying persons in subsistence agriculture and fishing activities into the ‘subsistence’ and ‘market oriented’ subgroups differed slightly between 1994 and 2000. The 1994 Census classified persons according to the primary purpose (pure subsistence or market oriented) of the main type of subsistence activity (fishing, gardening, etc.), allowing for only the main activity to the captured. In 2000, the question allowed for multiple answer, but did not distinguish between main and secondary activities and classified persons who ‘sold any’ as market oriented. Thus, a subsistence worker mainly engaged in gardening for home consumption who sometimes fished to sell would be classified as a pure subsistence worker according to 1994 definitions. Zen 2000 however, he/she would be classified as a market-oriented workers. Analysis of Economic Activity Data Labor Force Participation Table 9.1 reports that the total population of working age in the State of Kosrae in 1994 was 4,251, of whom 2,079, or nearly 49 percent, were in the labor force and 2,172, or about 51 percent, were not in the labor force. Of the 1,766 in the working age population, four-fifths were engaged in a job or business outside of the agricultural sector. The remaining one-fifth of the employed labor force were engaged in farming and fishing, the great majority of whom (74 percent) were involved in 'market oriented' agriculture/fishing activities while the remaining 26 percent were in subsistence activity, not selling or intending to sell any of their produce. This result illustrates the importance of the market oriented agricultural/fishing sector in Kosrae State. The subsistence sector was also quite significant and it would be appropriate to include such workers in the definition of the labor force to fully reflect their contribution to the domestic production of the country. The 2000 data showed that total population 15 years and over in Kosrae was 4,628 of whom 1,962 were in the labor force and 2, 666 were not in the labor force. The number of unemployed persons was 313 in 1994 and 54 in 2000, which results in unemployment rate of about 15 percent in 1994 and about 2 percent in 2000. In 1994 about one in every three persons aged 15 years and over and who were not in the labor force were actively looking for a job in the week before the census. A group commonly considered when discussing labor force is the discouraged unemployed, or those persons who could have worked the week before the census but who were not actually looking for a job. In many of the communities of Kosrae, the jobs available are widely known among the population, and if these are filled, persons available for work might not actually be looking for work. The category "could have taken a job" included these persons and constituted nearly 18 percent in 1994 and 31 percent in 2000 of the working age population. A comparison of labor force participation by municipalities of work status shows variations among the municipalities. In the 2000 Census, Tafunsak had again the largest portion of working age population in the labor force (53 percent) while Utwe continue to be the lowest. Tafunsak had a larger proportion of employed persons as well, for both formal and fishermen workers (49 percent) in 1994 and Malem with 52 percent in 2000. Accounting for this larger portion employed are those of the Ting Hong workers and the Black Micro Construction located in Tafunsak (see Table B14). In 1994, almost 28 percent of Utwe's working age population were not looking for a job the week before the census, but could have taken one if it had been offered. As for Malem small portions of working age persons who could have taken a job but were not looking (about 11 percent). The 2000 data showed that 36 percent of Lelu’s working age population were not looking for a job the week before the census, but could have taken one if it has been offered. As for Tafunsak small portions of working age persons who could have taken a job but were not looking (24 percent). Unemployment rates, labor force participation rates and subsistence are compared among the municipalities later in this chapter.
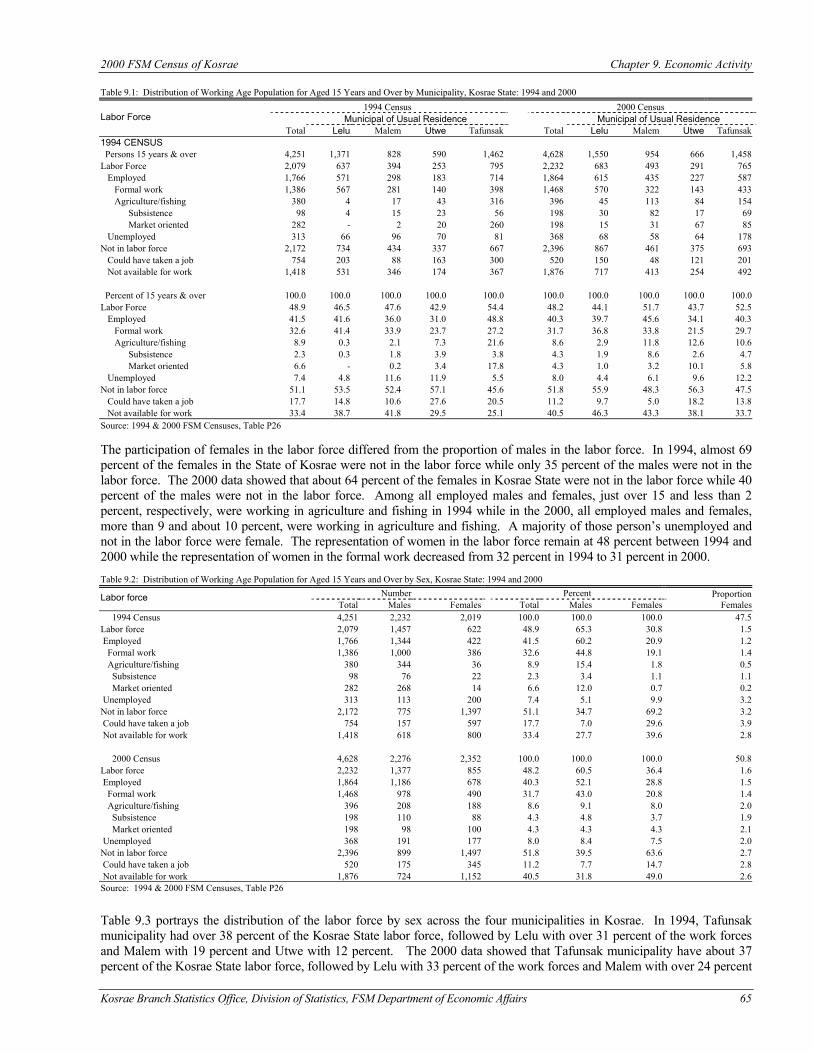
2000 FSM Census of Kosrae Chapter 9. Economic Activity
Kosrae Branch Statistics Office, Division of Statistics, FSM Department of Economic Affairs 65
Table 9.1: Distribution of Working Age Population for Aged 15 Years and Over by Municipality, Kosrae State: 1994 and 2000
1994 Census 2000 Census Municipal of Usual Residence Municipal of Usual Residence Labor Force
Total Lelu Malem Utwe Tafunsak Total Lelu Malem Utwe Tafunsak 1994 CENSUS Persons 15 years & over 4,251 1,371 828 590 1,462 4,628 1,550 954 666 1,458 Labor Force 2,079 637 394 253 795 2,232 683 493 291 765 Employed 1,766 571 298 183 714 1,864 615 435 227 587 Formal work 1,386 567 281 140 398 1,468 570 322 143 433 Agriculture/fishing 380 4 17 43 316 396 45 113 84 154 Subsistence 98 4 15 23 56 198 30 82 17 69 Market oriented 282 - 2 20 260 198 15 31 67 85 Unemployed 313 66 96 70 81 368 68 58 64 178 Not in labor force 2,172 734 434 337 667 2,396 867 461 375 693 Could have taken a job 754 203 88 163 300 520 150 48 121 201 Not available for work 1,418 531 346 174 367 1,876 717 413 254 492 Percent of 15 years & over 100.0 100.0 100.0 100.0 100.0 100.0 100.0 100.0 100.0 100.0 Labor Force 48.9 46.5 47.6 42.9 54.4 48.2 44.1 51.7 43.7 52.5 Employed 41.5 41.6 36.0 31.0 48.8 40.3 39.7 45.6 34.1 40.3 Formal work 32.6 41.4 33.9 23.7 27.2 31.7 36.8 33.8 21.5 29.7 Agriculture/fishing 8.9 0.3 2.1 7.3 21.6 8.6 2.9 11.8 12.6 10.6 Subsistence 2.3 0.3 1.8 3.9 3.8 4.3 1.9 8.6 2.6 4.7 Market oriented 6.6 - 0.2 3.4 17.8 4.3 1.0 3.2 10.1 5.8 Unemployed 7.4 4.8 11.6 11.9 5.5 8.0 4.4 6.1 9.6 12.2 Not in labor force 51.1 53.5 52.4 57.1 45.6 51.8 55.9 48.3 56.3 47.5 Could have taken a job 17.7 14.8 10.6 27.6 20.5 11.2 9.7 5.0 18.2 13.8 Not available for work 33.4 38.7 41.8 29.5 25.1 40.5 46.3 43.3 38.1 33.7 Source: 1994 & 2000 FSM Censuses, Table P26 The participation of females in the labor force differed from the proportion of males in the labor force. In 1994, almost 69 percent of the females in the State of Kosrae were not in the labor force while only 35 percent of the males were not in the labor force. The 2000 data showed that about 64 percent of the females in Kosrae State were not in the labor force while 40 percent of the males were not in the labor force. Among all employed males and females, just over 15 and less than 2 percent, respectively, were working in agriculture and fishing in 1994 while in the 2000, all employed males and females, more than 9 and about 10 percent, were working in agriculture and fishing. A majority of those person’s unemployed and not in the labor force were female. The representation of women in the labor force remain at 48 percent between 1994 and 2000 while the representation of women in the formal work decreased from 32 percent in 1994 to 31 percent in 2000. Table 9.2: Distribution of Working Age Population for Aged 15 Years and Over by Sex, Kosrae State: 1994 and 2000
Number Percent Proportion Labor force Total Males Females Total Males Females Females
1994 Census 4,251 2,232 2,019 100.0 100.0 100.0 47.5 Labor force 2,079 1,457 622 48.9 65.3 30.8 1.5 Employed 1,766 1,344 422 41.5 60.2 20.9 1.2 Formal work 1,386 1,000 386 32.6 44.8 19.1 1.4 Agriculture/fishing 380 344 36 8.9 15.4 1.8 0.5 Subsistence 98 76 22 2.3 3.4 1.1 1.1 Market oriented 282 268 14 6.6 12.0 0.7 0.2 Unemployed 313 113 200 7.4 5.1 9.9 3.2 Not in labor force 2,172 775 1,397 51.1 34.7 69.2 3.2 Could have taken a job 754 157 597 17.7 7.0 29.6 3.9 Not available for work 1,418 618 800 33.4 27.7 39.6 2.8 2000 Census 4,628 2,276 2,352 100.0 100.0 100.0 50.8 Labor force 2,232 1,377 855 48.2 60.5 36.4 1.6 Employed 1,864 1,186 678 40.3 52.1 28.8 1.5 Formal work 1,468 978 490 31.7 43.0 20.8 1.4 Agriculture/fishing 396 208 188 8.6 9.1 8.0 2.0 Subsistence 198 110 88 4.3 4.8 3.7 1.9 Market oriented 198 98 100 4.3 4.3 4.3 2.1 Unemployed 368 191 177 8.0 8.4 7.5 2.0 Not in labor force 2,396 899 1,497 51.8 39.5 63.6 2.7 Could have taken a job 520 175 345 11.2 7.7 14.7 2.8 Not available for work 1,876 724 1,152 40.5 31.8 49.0 2.6 Source: 1994 & 2000 FSM Censuses, Table P26 Table 9.3 portrays the distribution of the labor force by sex across the four municipalities in Kosrae. In 1994, Tafunsak municipality had over 38 percent of the Kosrae State labor force, followed by Lelu with over 31 percent of the work forces and Malem with 19 percent and Utwe with 12 percent. The 2000 data showed that Tafunsak municipality have about 37 percent of the Kosrae State labor force, followed by Lelu with 33 percent of the work forces and Malem with over 24 percent
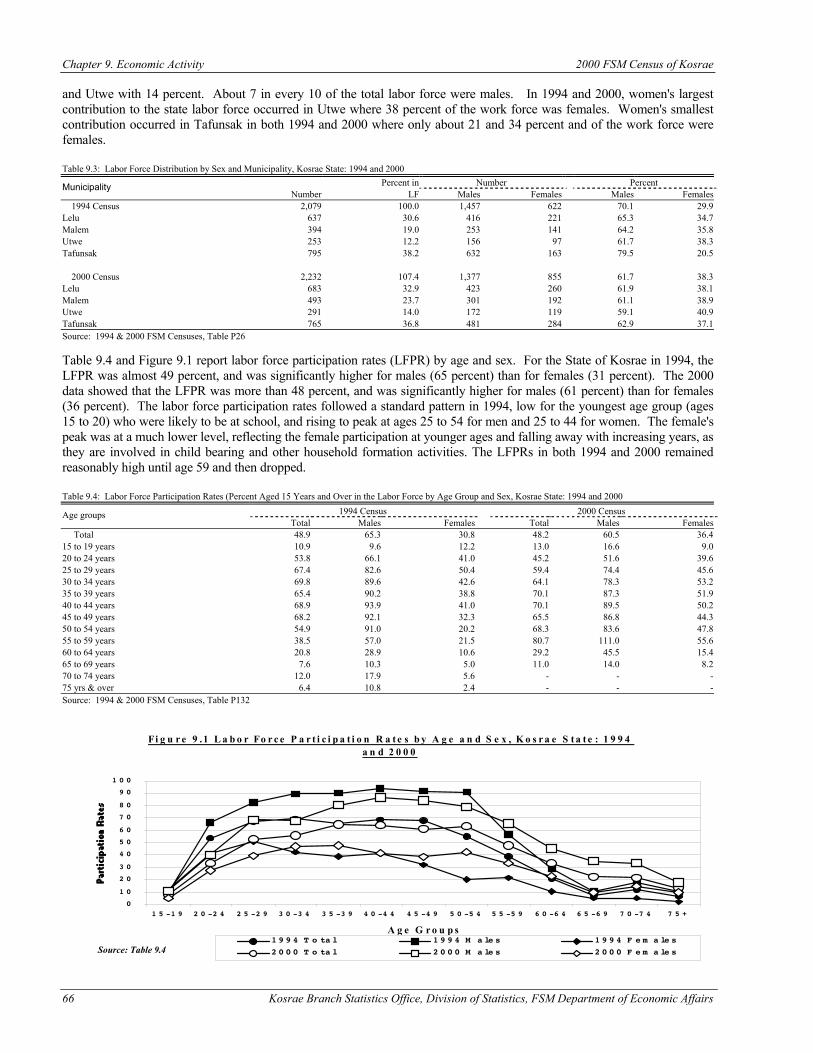
Chapter 9. Economic Activity 2000 FSM Census of Kosrae
66 Kosrae Branch Statistics Office, Division of Statistics, FSM Department of Economic Affairs
and Utwe with 14 percent. About 7 in every 10 of the total labor force were males. In 1994 and 2000, women's largest contribution to the state labor force occurred in Utwe where 38 percent of the work force was females. Women's smallest contribution occurred in Tafunsak in both 1994 and 2000 where only about 21 and 34 percent and of the work force were females. Table 9.3: Labor Force Distribution by Sex and Municipality, Kosrae State: 1994 and 2000
Percent in Number Percent Municipality Number LF Males Females Males Females
1994 Census 2,079 100.0 1,457 622 70.1 29.9 Lelu 637 30.6 416 221 65.3 34.7 Malem 394 19.0 253 141 64.2 35.8 Utwe 253 12.2 156 97 61.7 38.3 Tafunsak 795 38.2 632 163 79.5 20.5 2000 Census 2,232 107.4 1,377 855 61.7 38.3 Lelu 683 32.9 423 260 61.9 38.1 Malem 493 23.7 301 192 61.1 38.9 Utwe 291 14.0 172 119 59.1 40.9 Tafunsak 765 36.8 481 284 62.9 37.1 Source: 1994 & 2000 FSM Censuses, Table P26 Table 9.4 and Figure 9.1 report labor force participation rates (LFPR) by age and sex. For the State of Kosrae in 1994, the LFPR was almost 49 percent, and was significantly higher for males (65 percent) than for females (31 percent). The 2000 data showed that the LFPR was more than 48 percent, and was significantly higher for males (61 percent) than for females (36 percent). The labor force participation rates followed a standard pattern in 1994, low for the youngest age group (ages 15 to 20) who were likely to be at school, and rising to peak at ages 25 to 54 for men and 25 to 44 for women. The female's peak was at a much lower level, reflecting the female participation at younger ages and falling away with increasing years, as they are involved in child bearing and other household formation activities. The LFPRs in both 1994 and 2000 remained reasonably high until age 59 and then dropped. Table 9.4: Labor Force Participation Rates (Percent Aged 15 Years and Over in the Labor Force by Age Group and Sex, Kosrae State: 1994 and 2000
1994 Census 2000 Census Age groups Total Males Females Total Males Females
Total 48.9 65.3 30.8 48.2 60.5 36.4 15 to 19 years 10.9 9.6 12.2 13.0 16.6 9.0 20 to 24 years 53.8 66.1 41.0 45.2 51.6 39.6 25 to 29 years 67.4 82.6 50.4 59.4 74.4 45.6 30 to 34 years 69.8 89.6 42.6 64.1 78.3 53.2 35 to 39 years 65.4 90.2 38.8 70.1 87.3 51.9 40 to 44 years 68.9 93.9 41.0 70.1 89.5 50.2 45 to 49 years 68.2 92.1 32.3 65.5 86.8 44.3 50 to 54 years 54.9 91.0 20.2 68.3 83.6 47.8 55 to 59 years 38.5 57.0 21.5 80.7 111.0 55.6 60 to 64 years 20.8 28.9 10.6 29.2 45.5 15.4 65 to 69 years 7.6 10.3 5.0 11.0 14.0 8.2 70 to 74 years 12.0 17.9 5.6 - - - 75 yrs & over 6.4 10.8 2.4 - - - Source: 1994 & 2000 FSM Censuses, Table P132
Fi g u r e 9 .1 L a b o r Fo r c e P a r t i c i p a t i o n R a t e s b y A g e a n d S e x , K o s r a e S t a t e : 1 9 9 4 a n d 2 0 0 0
0
1 0
2 0
3 0
4 0
5 0
6 0
7 0
8 0
9 0
1 0 0
1 5 -1 9 2 0 -2 4 2 5 -2 9 3 0 -3 4 3 5 -3 9 4 0 -4 4 4 5 -4 9 5 0 -5 4 5 5 -5 9 6 0 -6 4 6 5 -6 9 7 0 -7 4 7 5 +
A g e G r o u p s1 9 9 4 T o ta l 1 9 9 4 M a le s 1 9 9 4 F e m a le s2 0 0 0 T o ta l 2 0 0 0 M a le s 2 0 0 0 F e m a le sSource: Table 9.4
2000 FSM Census of Kosrae Chapter 9. Economic Activity
Kosrae Branch Statistics Office, Division of Statistics, FSM Department of Economic Affairs 67
The municipality patterns of LFPRs followed the state trends with minor variations (Table 9.5 and Figure 9.2). What were notable in 1994, however, were the relatively low levels of labor force participation of both men and women in Utwe, perhaps suggesting fewer jobs in that municipality. Tafunsak had higher rates of participation than the state average at all ages. Lelu and Malem had rates about the state average at all ages except for the 20-39 age groups in Lelu and the 35-44 age groups in Malem. As for the 2000 data, Malem and Tafunsak had higher rates of participation than the state average of about 48 percent. Table 9.5: Labor Force Participation Rates (Percent Aged 15 Years and Over in the Labor Force by Age Group and Municipality, Kosrae State: 1994 and 2000
1994 Census 2000 Census Municipality Municipality Age groups
Total Lelu Malem Utwe Tafunsak Total Lelu Malem Utwe Tafunsak Total 48.9 46.5 47.6 42.9 54.4 48.2 44.1 51.7 43.7 52.5 15 to 19 years 10.9 9.6 12.4 10.4 11.5 13.0 11.2 13.8 11.3 15.4 20 to 24 years 53.8 51.6 53.3 42.9 59.7 45.2 43.7 38.6 40.2 53.8 25 to 29 years 67.4 64.1 76.1 57.4 69.1 59.4 58.3 57.7 53.2 64.1 30 to 34 years 69.8 70.1 63.8 65.3 73.2 64.1 60.1 71.3 56.5 66.5 35 to 39 years 65.4 66.0 71.3 60.0 63.2 70.1 70.8 71.1 66.1 70.3 40 to 44 years 68.9 64.2 73.0 54.2 76.6 70.1 66.3 80.7 57.1 70.2 45 to 49 years 68.2 68.6 68.5 72.3 66.1 65.5 59.8 64.5 63.2 73.7 50 to 54 years 54.9 57.1 46.2 64.3 53.7 68.3 62.5 72.6 67.4 71.4 55 to 59 years 38.5 30.2 38.9 43.5 45.6 50.8 41.7 54.1 68.0 50.8 60 to 64 years 20.8 14.8 27.6 33.3 17.8 37.5 25.9 53.6 44.4 38.6 65 to 69 years 7.6 3.6 11.8 9.1 8.7 24.6 11.4 30.8 35.3 27.5 70 to 74 years 12.0 - 7.7 40.0 18.8 20.0 9.1 60.0 - 25.0 75 yrs & over 6.4 4.3 - 15.0 5.9 13.5 3.0 25.0 15.0 15.8 Source: 1994 & 2000 FSM Censuses, Table P132 Unemployment The measurement of unemployment is problematic in Kosrae as well as the whole FSM, partly because the way in which unemployment is defined has a significant impact. In line with the presentation of this chapter using the ILO labor force definitions, this section presents unemployment using the ILO definition. However, there are issues that should be carefully considered in Kosrae situation. For example, people will not be classified as unemployed if they want paid work but are not actively looking for work. Also, people who are involved in subsistence work are defined as working and are not counted as unemployed, even if they are actively looking for paid work. Under U.S. definitions people in subsistence work are classified as ‘not in the labor force’, which results in higher unemployment rates. People involved in ‘market oriented’ subsistence are classified as working and therefore cannot be unemployed under both definitions. Using the ILO definition, the unemployment rate is calculated as the number of persons who were not working and were actively looking for work, divided by the number of persons in the labor force, multiplied by 100. Rates of unemployment by age and sex are reported in Table 9.6. According to the 1994 FSM Census, Kosrae State's unemployment rate was 15 percent while the 2000 Census showed that the state unemployment rate was about 17 percent. In 1994, the male unemployment rate in Kosrae was just about 8 percent while the female rate was just over 32 percent. The 2000 Census results showed that the unemployment rate for males was reported at 14 percent while the female unemployment rate was at 21 percent. The problem of youth (ages 15 to 19) unemployment in Kosrae was confirmed: youth had the highest rates, in
Fi g u re 9 .2 La bo r Fo rce P a rt i c i pa t i o n R a te s by A g e a n d M u n i c i pa l i ty , Ko s ra e S ta te : 1 9 9 4 a n d 2 0 0 0
0
2 0
4 0
6 0
8 0
1 0 0
1 5 -1 9 2 0 -2 4 2 5 -2 9 3 0 -3 4 3 5 -3 9 4 0 -4 4 4 5 -4 9 5 0 -5 4 5 5 -5 9 6 0 -6 4 6 5 -6 9 7 0 -7 4 7 5 +
A g e G ro u p s
1 9 9 4 Le l u 1 9 9 4 M a l e m 1 9 9 4 U tw e 1 9 9 4 Ta fu n s a k2 0 0 0 Le l u 2 0 0 0 M a l e m 2 0 0 0 U tw e 2 0 0 0 Ta fu n s a kSource: Table 9.5
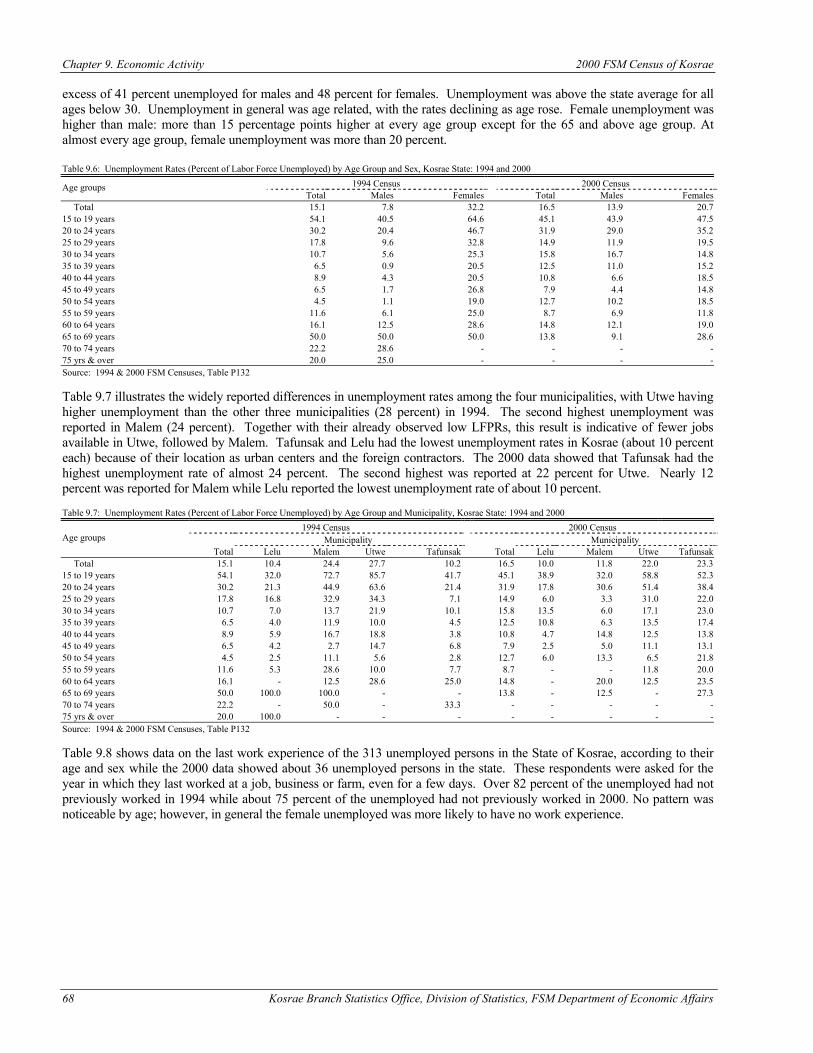
Chapter 9. Economic Activity 2000 FSM Census of Kosrae
68 Kosrae Branch Statistics Office, Division of Statistics, FSM Department of Economic Affairs
excess of 41 percent unemployed for males and 48 percent for females. Unemployment was above the state average for all ages below 30. Unemployment in general was age related, with the rates declining as age rose. Female unemployment was higher than male: more than 15 percentage points higher at every age group except for the 65 and above age group. At almost every age group, female unemployment was more than 20 percent. Table 9.6: Unemployment Rates (Percent of Labor Force Unemployed) by Age Group and Sex, Kosrae State: 1994 and 2000
1994 Census 2000 Census Age groups Total Males Females Total Males Females
Total 15.1 7.8 32.2 16.5 13.9 20.7 15 to 19 years 54.1 40.5 64.6 45.1 43.9 47.5 20 to 24 years 30.2 20.4 46.7 31.9 29.0 35.2 25 to 29 years 17.8 9.6 32.8 14.9 11.9 19.5 30 to 34 years 10.7 5.6 25.3 15.8 16.7 14.8 35 to 39 years 6.5 0.9 20.5 12.5 11.0 15.2 40 to 44 years 8.9 4.3 20.5 10.8 6.6 18.5 45 to 49 years 6.5 1.7 26.8 7.9 4.4 14.8 50 to 54 years 4.5 1.1 19.0 12.7 10.2 18.5 55 to 59 years 11.6 6.1 25.0 8.7 6.9 11.8 60 to 64 years 16.1 12.5 28.6 14.8 12.1 19.0 65 to 69 years 50.0 50.0 50.0 13.8 9.1 28.6 70 to 74 years 22.2 28.6 - - - - 75 yrs & over 20.0 25.0 - - - - Source: 1994 & 2000 FSM Censuses, Table P132 Table 9.7 illustrates the widely reported differences in unemployment rates among the four municipalities, with Utwe having higher unemployment than the other three municipalities (28 percent) in 1994. The second highest unemployment was reported in Malem (24 percent). Together with their already observed low LFPRs, this result is indicative of fewer jobs available in Utwe, followed by Malem. Tafunsak and Lelu had the lowest unemployment rates in Kosrae (about 10 percent each) because of their location as urban centers and the foreign contractors. The 2000 data showed that Tafunsak had the highest unemployment rate of almost 24 percent. The second highest was reported at 22 percent for Utwe. Nearly 12 percent was reported for Malem while Lelu reported the lowest unemployment rate of about 10 percent. Table 9.7: Unemployment Rates (Percent of Labor Force Unemployed) by Age Group and Municipality, Kosrae State: 1994 and 2000
1994 Census 2000 Census Municipality Municipality Age groups
Total Lelu Malem Utwe Tafunsak Total Lelu Malem Utwe Tafunsak Total 15.1 10.4 24.4 27.7 10.2 16.5 10.0 11.8 22.0 23.3 15 to 19 years 54.1 32.0 72.7 85.7 41.7 45.1 38.9 32.0 58.8 52.3 20 to 24 years 30.2 21.3 44.9 63.6 21.4 31.9 17.8 30.6 51.4 38.4 25 to 29 years 17.8 16.8 32.9 34.3 7.1 14.9 6.0 3.3 31.0 22.0 30 to 34 years 10.7 7.0 13.7 21.9 10.1 15.8 13.5 6.0 17.1 23.0 35 to 39 years 6.5 4.0 11.9 10.0 4.5 12.5 10.8 6.3 13.5 17.4 40 to 44 years 8.9 5.9 16.7 18.8 3.8 10.8 4.7 14.8 12.5 13.8 45 to 49 years 6.5 4.2 2.7 14.7 6.8 7.9 2.5 5.0 11.1 13.1 50 to 54 years 4.5 2.5 11.1 5.6 2.8 12.7 6.0 13.3 6.5 21.8 55 to 59 years 11.6 5.3 28.6 10.0 7.7 8.7 - - 11.8 20.0 60 to 64 years 16.1 - 12.5 28.6 25.0 14.8 - 20.0 12.5 23.5 65 to 69 years 50.0 100.0 100.0 - - 13.8 - 12.5 - 27.3 70 to 74 years 22.2 - 50.0 - 33.3 - - - - - 75 yrs & over 20.0 100.0 - - - - - - - - Source: 1994 & 2000 FSM Censuses, Table P132 Table 9.8 shows data on the last work experience of the 313 unemployed persons in the State of Kosrae, according to their age and sex while the 2000 data showed about 36 unemployed persons in the state. These respondents were asked for the year in which they last worked at a job, business or farm, even for a few days. Over 82 percent of the unemployed had not previously worked in 1994 while about 75 percent of the unemployed had not previously worked in 2000. No pattern was noticeable by age; however, in general the female unemployed was more likely to have no work experience.
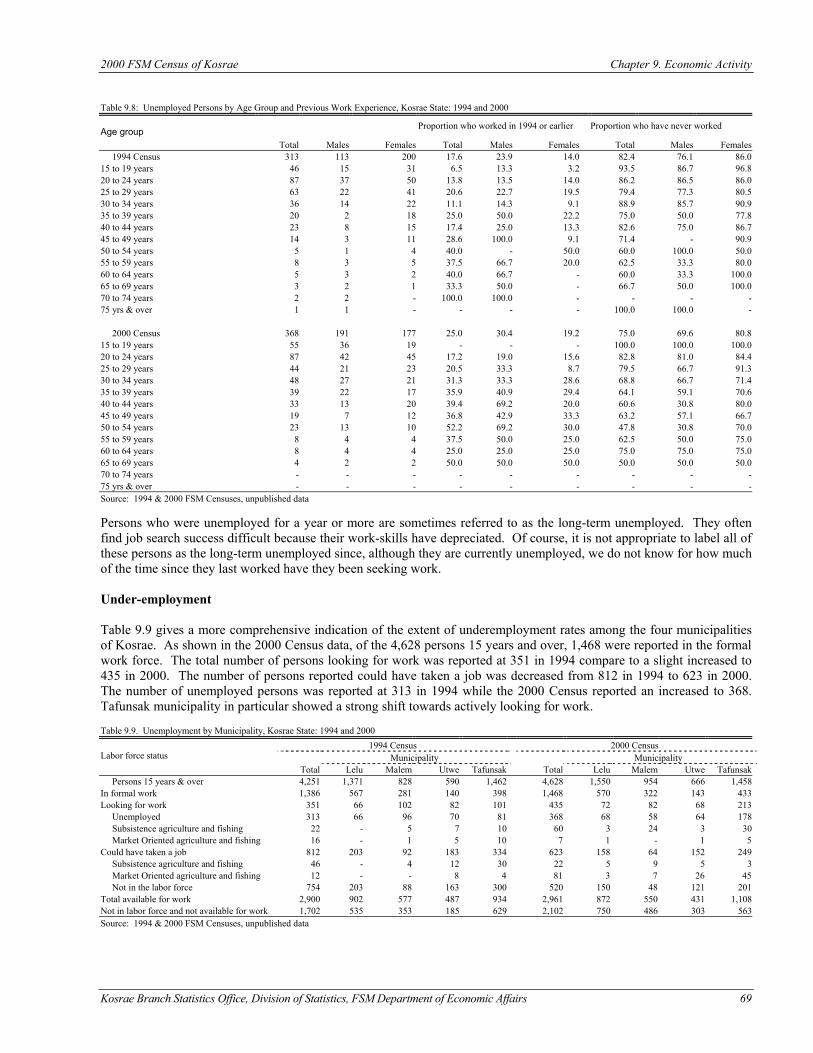
2000 FSM Census of Kosrae Chapter 9. Economic Activity
Kosrae Branch Statistics Office, Division of Statistics, FSM Department of Economic Affairs 69
Table 9.8: Unemployed Persons by Age Group and Previous Work Experience, Kosrae State: 1994 and 2000
Proportion who worked in 1994 or earlier
Proportion who have never worked Age group
Total Males Females Total Males Females Total Males Females 1994 Census 313 113 200 17.6 23.9 14.0 82.4 76.1 86.0 15 to 19 years 46 15 31 6.5 13.3 3.2 93.5 86.7 96.8 20 to 24 years 87 37 50 13.8 13.5 14.0 86.2 86.5 86.0 25 to 29 years 63 22 41 20.6 22.7 19.5 79.4 77.3 80.5 30 to 34 years 36 14 22 11.1 14.3 9.1 88.9 85.7 90.9 35 to 39 years 20 2 18 25.0 50.0 22.2 75.0 50.0 77.8 40 to 44 years 23 8 15 17.4 25.0 13.3 82.6 75.0 86.7 45 to 49 years 14 3 11 28.6 100.0 9.1 71.4 - 90.9 50 to 54 years 5 1 4 40.0 - 50.0 60.0 100.0 50.0 55 to 59 years 8 3 5 37.5 66.7 20.0 62.5 33.3 80.0 60 to 64 years 5 3 2 40.0 66.7 - 60.0 33.3 100.0 65 to 69 years 3 2 1 33.3 50.0 - 66.7 50.0 100.0 70 to 74 years 2 2 - 100.0 100.0 - - - - 75 yrs & over 1 1 - - - - 100.0 100.0 - 2000 Census 368 191 177 25.0 30.4 19.2 75.0 69.6 80.8 15 to 19 years 55 36 19 - - - 100.0 100.0 100.0 20 to 24 years 87 42 45 17.2 19.0 15.6 82.8 81.0 84.4 25 to 29 years 44 21 23 20.5 33.3 8.7 79.5 66.7 91.3 30 to 34 years 48 27 21 31.3 33.3 28.6 68.8 66.7 71.4 35 to 39 years 39 22 17 35.9 40.9 29.4 64.1 59.1 70.6 40 to 44 years 33 13 20 39.4 69.2 20.0 60.6 30.8 80.0 45 to 49 years 19 7 12 36.8 42.9 33.3 63.2 57.1 66.7 50 to 54 years 23 13 10 52.2 69.2 30.0 47.8 30.8 70.0 55 to 59 years 8 4 4 37.5 50.0 25.0 62.5 50.0 75.0 60 to 64 years 8 4 4 25.0 25.0 25.0 75.0 75.0 75.0 65 to 69 years 4 2 2 50.0 50.0 50.0 50.0 50.0 50.0 70 to 74 years - - - - - - - - - 75 yrs & over - - - - - - - - - Source: 1994 & 2000 FSM Censuses, unpublished data Persons who were unemployed for a year or more are sometimes referred to as the long-term unemployed. They often find job search success difficult because their work-skills have depreciated. Of course, it is not appropriate to label all of these persons as the long-term unemployed since, although they are currently unemployed, we do not know for how much of the time since they last worked have they been seeking work. Under-employment Table 9.9 gives a more comprehensive indication of the extent of underemployment rates among the four municipalities of Kosrae. As shown in the 2000 Census data, of the 4,628 persons 15 years and over, 1,468 were reported in the formal work force. The total number of persons looking for work was reported at 351 in 1994 compare to a slight increased to 435 in 2000. The number of persons reported could have taken a job was decreased from 812 in 1994 to 623 in 2000. The number of unemployed persons was reported at 313 in 1994 while the 2000 Census reported an increased to 368. Tafunsak municipality in particular showed a strong shift towards actively looking for work. Table 9.9. Unemployment by Municipality, Kosrae State: 1994 and 2000
1994 Census 2000 Census Municipality Municipality Labor force status
Total Lelu Malem Utwe Tafunsak Total Lelu Malem Utwe Tafunsak Persons 15 years & over 4,251 1,371 828 590 1,462 4,628 1,550 954 666 1,458 In formal work 1,386 567 281 140 398 1,468 570 322 143 433 Looking for work 351 66 102 82 101 435 72 82 68 213 Unemployed 313 66 96 70 81 368 68 58 64 178 Subsistence agriculture and fishing 22 - 5 7 10 60 3 24 3 30 Market Oriented agriculture and fishing 16 - 1 5 10 7 1 - 1 5 Could have taken a job 812 203 92 183 334 623 158 64 152 249 Subsistence agriculture and fishing 46 - 4 12 30 22 5 9 5 3 Market Oriented agriculture and fishing 12 - - 8 4 81 3 7 26 45 Not in the labor force 754 203 88 163 300 520 150 48 121 201 Total available for work 2,900 902 577 487 934 2,961 872 550 431 1,108 Not in labor force and not available for work 1,702 535 353 185 629 2,102 750 486 303 563 Source: 1994 & 2000 FSM Censuses, unpublished data
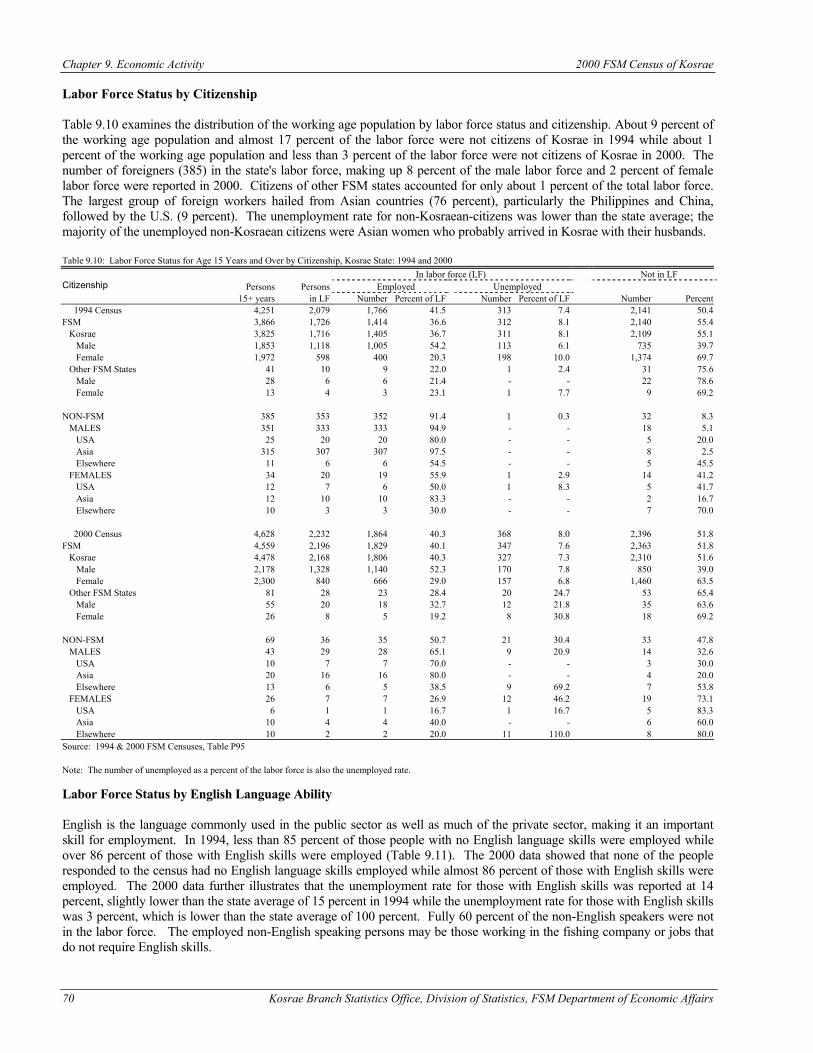
Chapter 9. Economic Activity 2000 FSM Census of Kosrae
70 Kosrae Branch Statistics Office, Division of Statistics, FSM Department of Economic Affairs
Labor Force Status by Citizenship Table 9.10 examines the distribution of the working age population by labor force status and citizenship. About 9 percent of the working age population and almost 17 percent of the labor force were not citizens of Kosrae in 1994 while about 1 percent of the working age population and less than 3 percent of the labor force were not citizens of Kosrae in 2000. The number of foreigners (385) in the state's labor force, making up 8 percent of the male labor force and 2 percent of female labor force were reported in 2000. Citizens of other FSM states accounted for only about 1 percent of the total labor force. The largest group of foreign workers hailed from Asian countries (76 percent), particularly the Philippines and China, followed by the U.S. (9 percent). The unemployment rate for non-Kosraean-citizens was lower than the state average; the majority of the unemployed non-Kosraean citizens were Asian women who probably arrived in Kosrae with their husbands. Table 9.10: Labor Force Status for Age 15 Years and Over by Citizenship, Kosrae State: 1994 and 2000
In labor force (LF) Not in LF Persons Persons Employed Unemployed Citizenship
15+ years in LF Number Percent of LF Number Percent of LF Number Percent 1994 Census 4,251 2,079 1,766 41.5 313 7.4 2,141 50.4 FSM 3,866 1,726 1,414 36.6 312 8.1 2,140 55.4 Kosrae 3,825 1,716 1,405 36.7 311 8.1 2,109 55.1 Male 1,853 1,118 1,005 54.2 113 6.1 735 39.7 Female 1,972 598 400 20.3 198 10.0 1,374 69.7 Other FSM States 41 10 9 22.0 1 2.4 31 75.6 Male 28 6 6 21.4 - - 22 78.6 Female 13 4 3 23.1 1 7.7 9 69.2 NON-FSM 385 353 352 91.4 1 0.3 32 8.3 MALES 351 333 333 94.9 - - 18 5.1 USA 25 20 20 80.0 - - 5 20.0 Asia 315 307 307 97.5 - - 8 2.5 Elsewhere 11 6 6 54.5 - - 5 45.5 FEMALES 34 20 19 55.9 1 2.9 14 41.2 USA 12 7 6 50.0 1 8.3 5 41.7 Asia 12 10 10 83.3 - - 2 16.7 Elsewhere 10 3 3 30.0 - - 7 70.0 2000 Census 4,628 2,232 1,864 40.3 368 8.0 2,396 51.8 FSM 4,559 2,196 1,829 40.1 347 7.6 2,363 51.8 Kosrae 4,478 2,168 1,806 40.3 327 7.3 2,310 51.6 Male 2,178 1,328 1,140 52.3 170 7.8 850 39.0 Female 2,300 840 666 29.0 157 6.8 1,460 63.5 Other FSM States 81 28 23 28.4 20 24.7 53 65.4 Male 55 20 18 32.7 12 21.8 35 63.6 Female 26 8 5 19.2 8 30.8 18 69.2 NON-FSM 69 36 35 50.7 21 30.4 33 47.8 MALES 43 29 28 65.1 9 20.9 14 32.6 USA 10 7 7 70.0 - - 3 30.0 Asia 20 16 16 80.0 - - 4 20.0 Elsewhere 13 6 5 38.5 9 69.2 7 53.8 FEMALES 26 7 7 26.9 12 46.2 19 73.1 USA 6 1 1 16.7 1 16.7 5 83.3 Asia 10 4 4 40.0 - - 6 60.0 Elsewhere 10 2 2 20.0 11 110.0 8 80.0 Source: 1994 & 2000 FSM Censuses, Table P95 Note: The number of unemployed as a percent of the labor force is also the unemployed rate. Labor Force Status by English Language Ability English is the language commonly used in the public sector as well as much of the private sector, making it an important skill for employment. In 1994, less than 85 percent of those people with no English language skills were employed while over 86 percent of those with English skills were employed (Table 9.11). The 2000 data showed that none of the people responded to the census had no English language skills employed while almost 86 percent of those with English skills were employed. The 2000 data further illustrates that the unemployment rate for those with English skills was reported at 14 percent, slightly lower than the state average of 15 percent in 1994 while the unemployment rate for those with English skills was 3 percent, which is lower than the state average of 100 percent. Fully 60 percent of the non-English speakers were not in the labor force. The employed non-English speaking persons may be those working in the fishing company or jobs that do not require English skills.
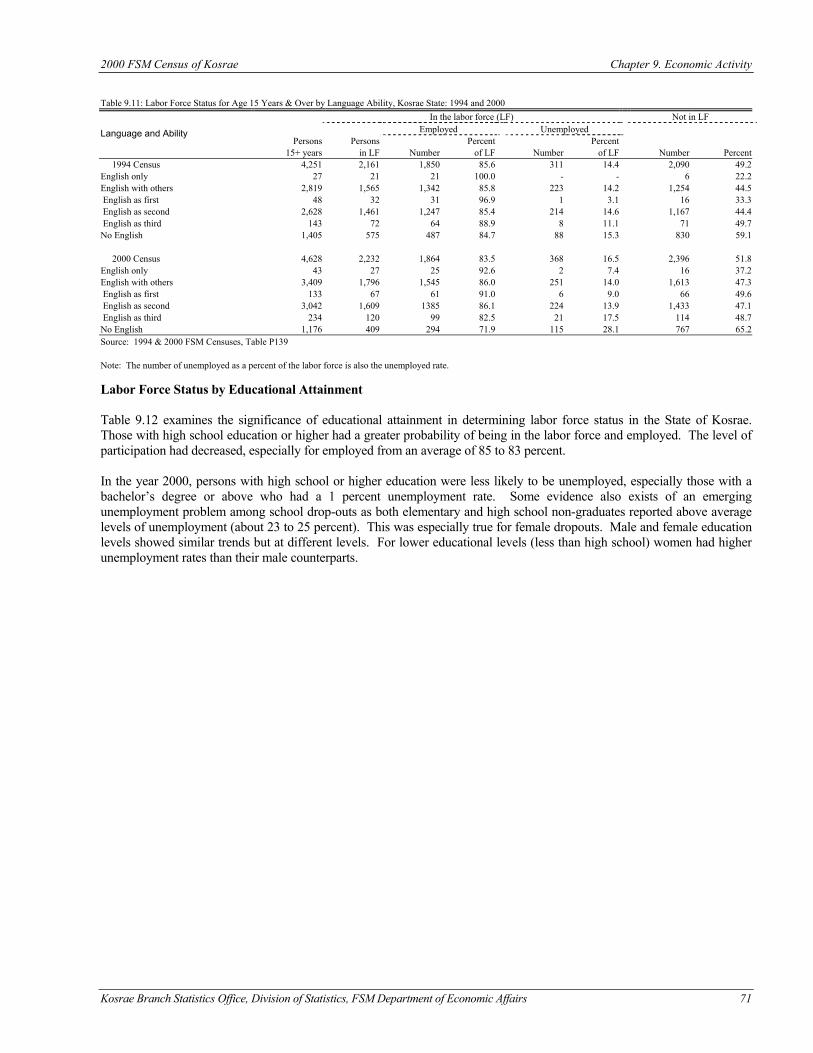
2000 FSM Census of Kosrae Chapter 9. Economic Activity
Kosrae Branch Statistics Office, Division of Statistics, FSM Department of Economic Affairs 71
Table 9.11: Labor Force Status for Age 15 Years & Over by Language Ability, Kosrae State: 1994 and 2000
In the labor force (LF) Not in LF Employed Unemployed
Persons Persons Percent Percent Language and Ability
15+ years in LF Number of LF Number of LF Number Percent 1994 Census 4,251 2,161 1,850 85.6 311 14.4 2,090 49.2 English only 27 21 21 100.0 - - 6 22.2 English with others 2,819 1,565 1,342 85.8 223 14.2 1,254 44.5 English as first 48 32 31 96.9 1 3.1 16 33.3 English as second 2,628 1,461 1,247 85.4 214 14.6 1,167 44.4 English as third 143 72 64 88.9 8 11.1 71 49.7 No English 1,405 575 487 84.7 88 15.3 830 59.1 2000 Census 4,628 2,232 1,864 83.5 368 16.5 2,396 51.8 English only 43 27 25 92.6 2 7.4 16 37.2 English with others 3,409 1,796 1,545 86.0 251 14.0 1,613 47.3 English as first 133 67 61 91.0 6 9.0 66 49.6 English as second 3,042 1,609 1385 86.1 224 13.9 1,433 47.1 English as third 234 120 99 82.5 21 17.5 114 48.7 No English 1,176 409 294 71.9 115 28.1 767 65.2 Source: 1994 & 2000 FSM Censuses, Table P139 Note: The number of unemployed as a percent of the labor force is also the unemployed rate. Labor Force Status by Educational Attainment Table 9.12 examines the significance of educational attainment in determining labor force status in the State of Kosrae. Those with high school education or higher had a greater probability of being in the labor force and employed. The level of participation had decreased, especially for employed from an average of 85 to 83 percent. In the year 2000, persons with high school or higher education were less likely to be unemployed, especially those with a bachelor’s degree or above who had a 1 percent unemployment rate. Some evidence also exists of an emerging unemployment problem among school drop-outs as both elementary and high school non-graduates reported above average levels of unemployment (about 23 to 25 percent). This was especially true for female dropouts. Male and female education levels showed similar trends but at different levels. For lower educational levels (less than high school) women had higher unemployment rates than their male counterparts.
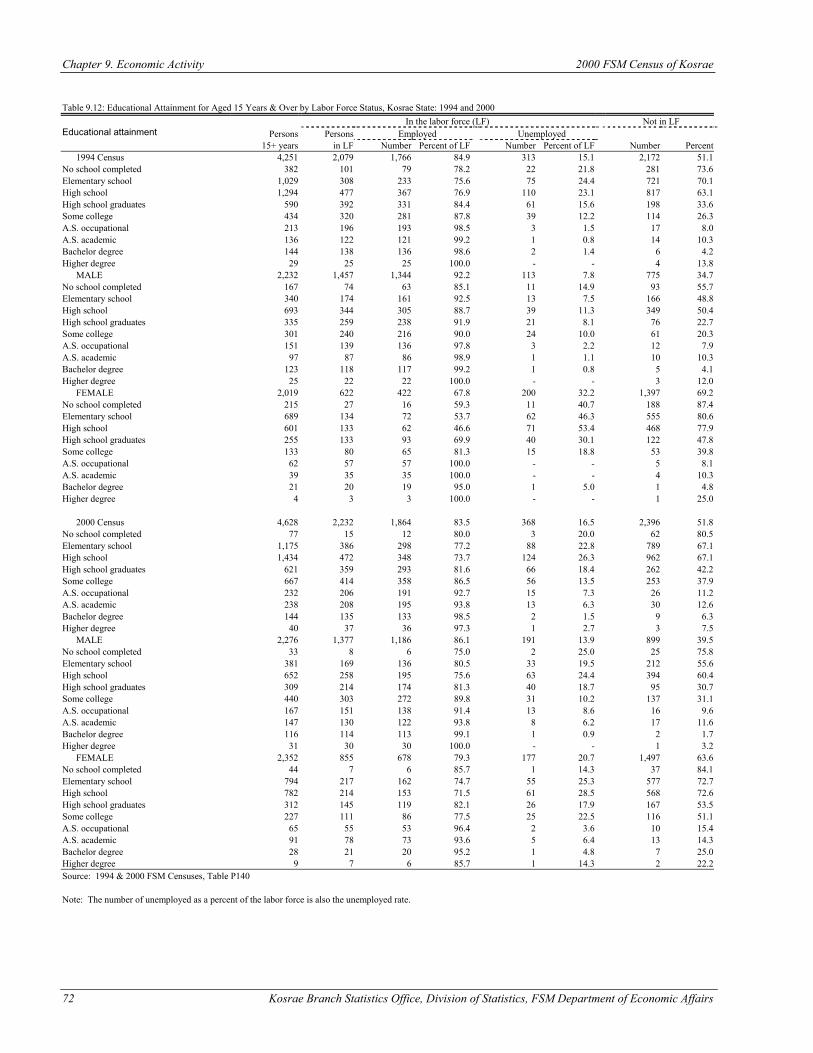
Chapter 9. Economic Activity 2000 FSM Census of Kosrae
72 Kosrae Branch Statistics Office, Division of Statistics, FSM Department of Economic Affairs
Table 9.12: Educational Attainment for Aged 15 Years & Over by Labor Force Status, Kosrae State: 1994 and 2000
In the labor force (LF) Not in LF Persons Persons Employed Unemployed Educational attainment
15+ years in LF Number Percent of LF Number Percent of LF Number Percent 1994 Census 4,251 2,079 1,766 84.9 313 15.1 2,172 51.1 No school completed 382 101 79 78.2 22 21.8 281 73.6 Elementary school 1,029 308 233 75.6 75 24.4 721 70.1 High school 1,294 477 367 76.9 110 23.1 817 63.1 High school graduates 590 392 331 84.4 61 15.6 198 33.6 Some college 434 320 281 87.8 39 12.2 114 26.3 A.S. occupational 213 196 193 98.5 3 1.5 17 8.0 A.S. academic 136 122 121 99.2 1 0.8 14 10.3 Bachelor degree 144 138 136 98.6 2 1.4 6 4.2 Higher degree 29 25 25 100.0 - - 4 13.8 MALE 2,232 1,457 1,344 92.2 113 7.8 775 34.7 No school completed 167 74 63 85.1 11 14.9 93 55.7 Elementary school 340 174 161 92.5 13 7.5 166 48.8 High school 693 344 305 88.7 39 11.3 349 50.4 High school graduates 335 259 238 91.9 21 8.1 76 22.7 Some college 301 240 216 90.0 24 10.0 61 20.3 A.S. occupational 151 139 136 97.8 3 2.2 12 7.9 A.S. academic 97 87 86 98.9 1 1.1 10 10.3 Bachelor degree 123 118 117 99.2 1 0.8 5 4.1 Higher degree 25 22 22 100.0 - - 3 12.0 FEMALE 2,019 622 422 67.8 200 32.2 1,397 69.2 No school completed 215 27 16 59.3 11 40.7 188 87.4 Elementary school 689 134 72 53.7 62 46.3 555 80.6 High school 601 133 62 46.6 71 53.4 468 77.9 High school graduates 255 133 93 69.9 40 30.1 122 47.8 Some college 133 80 65 81.3 15 18.8 53 39.8 A.S. occupational 62 57 57 100.0 - - 5 8.1 A.S. academic 39 35 35 100.0 - - 4 10.3 Bachelor degree 21 20 19 95.0 1 5.0 1 4.8 Higher degree 4 3 3 100.0 - - 1 25.0 2000 Census 4,628 2,232 1,864 83.5 368 16.5 2,396 51.8 No school completed 77 15 12 80.0 3 20.0 62 80.5 Elementary school 1,175 386 298 77.2 88 22.8 789 67.1 High school 1,434 472 348 73.7 124 26.3 962 67.1 High school graduates 621 359 293 81.6 66 18.4 262 42.2 Some college 667 414 358 86.5 56 13.5 253 37.9 A.S. occupational 232 206 191 92.7 15 7.3 26 11.2 A.S. academic 238 208 195 93.8 13 6.3 30 12.6 Bachelor degree 144 135 133 98.5 2 1.5 9 6.3 Higher degree 40 37 36 97.3 1 2.7 3 7.5 MALE 2,276 1,377 1,186 86.1 191 13.9 899 39.5 No school completed 33 8 6 75.0 2 25.0 25 75.8 Elementary school 381 169 136 80.5 33 19.5 212 55.6 High school 652 258 195 75.6 63 24.4 394 60.4 High school graduates 309 214 174 81.3 40 18.7 95 30.7 Some college 440 303 272 89.8 31 10.2 137 31.1 A.S. occupational 167 151 138 91.4 13 8.6 16 9.6 A.S. academic 147 130 122 93.8 8 6.2 17 11.6 Bachelor degree 116 114 113 99.1 1 0.9 2 1.7 Higher degree 31 30 30 100.0 - - 1 3.2 FEMALE 2,352 855 678 79.3 177 20.7 1,497 63.6 No school completed 44 7 6 85.7 1 14.3 37 84.1 Elementary school 794 217 162 74.7 55 25.3 577 72.7 High school 782 214 153 71.5 61 28.5 568 72.6 High school graduates 312 145 119 82.1 26 17.9 167 53.5 Some college 227 111 86 77.5 25 22.5 116 51.1 A.S. occupational 65 55 53 96.4 2 3.6 10 15.4 A.S. academic 91 78 73 93.6 5 6.4 13 14.3 Bachelor degree 28 21 20 95.2 1 4.8 7 25.0 Higher degree 9 7 6 85.7 1 14.3 2 22.2 Source: 1994 & 2000 FSM Censuses, Table P140 Note: The number of unemployed as a percent of the labor force is also the unemployed rate.
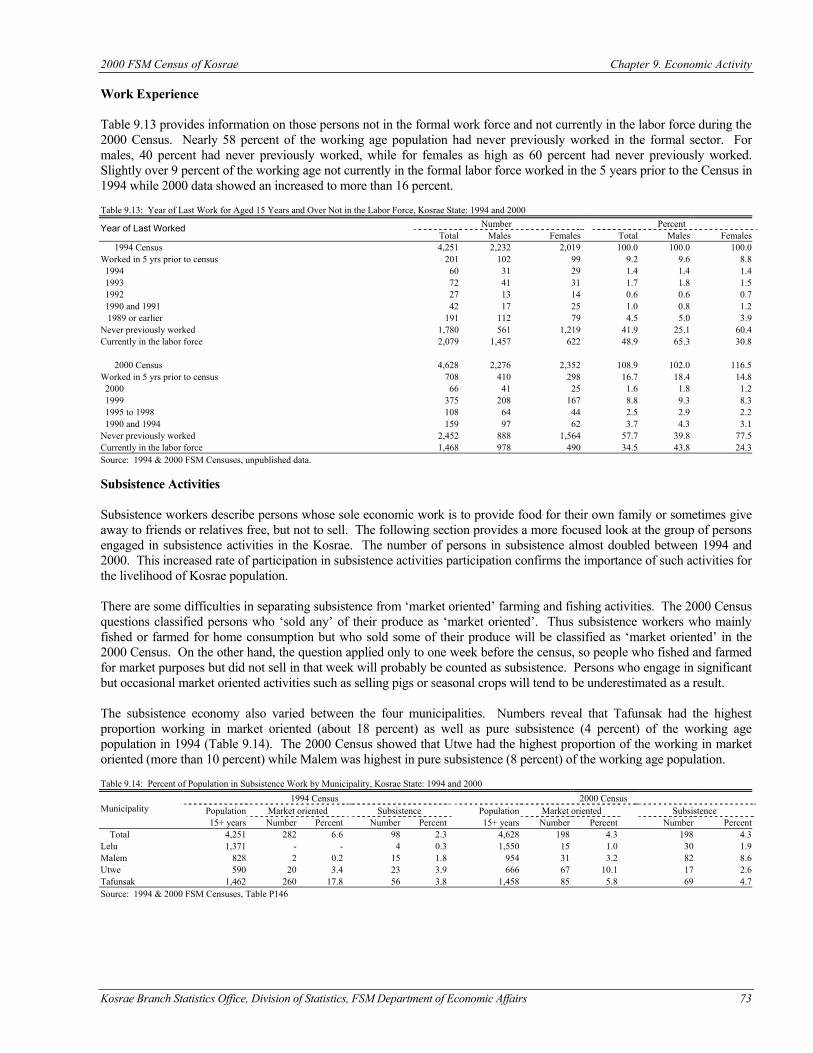
2000 FSM Census of Kosrae Chapter 9. Economic Activity
Kosrae Branch Statistics Office, Division of Statistics, FSM Department of Economic Affairs 73
Work Experience Table 9.13 provides information on those persons not in the formal work force and not currently in the labor force during the 2000 Census. Nearly 58 percent of the working age population had never previously worked in the formal sector. For males, 40 percent had never previously worked, while for females as high as 60 percent had never previously worked. Slightly over 9 percent of the working age not currently in the formal labor force worked in the 5 years prior to the Census in 1994 while 2000 data showed an increased to more than 16 percent. Table 9.13: Year of Last Work for Aged 15 Years and Over Not in the Labor Force, Kosrae State: 1994 and 2000
Number Percent Year of Last Worked Total Males Females Total Males Females
1994 Census 4,251 2,232 2,019 100.0 100.0 100.0 Worked in 5 yrs prior to census 201 102 99 9.2 9.6 8.8 1994 60 31 29 1.4 1.4 1.4 1993 72 41 31 1.7 1.8 1.5 1992 27 13 14 0.6 0.6 0.7 1990 and 1991 42 17 25 1.0 0.8 1.2 1989 or earlier 191 112 79 4.5 5.0 3.9 Never previously worked 1,780 561 1,219 41.9 25.1 60.4 Currently in the labor force 2,079 1,457 622 48.9 65.3 30.8 2000 Census 4,628 2,276 2,352 108.9 102.0 116.5 Worked in 5 yrs prior to census 708 410 298 16.7 18.4 14.8 2000 66 41 25 1.6 1.8 1.2 1999 375 208 167 8.8 9.3 8.3 1995 to 1998 108 64 44 2.5 2.9 2.2 1990 and 1994 159 97 62 3.7 4.3 3.1 Never previously worked 2,452 888 1,564 57.7 39.8 77.5 Currently in the labor force 1,468 978 490 34.5 43.8 24.3 Source: 1994 & 2000 FSM Censuses, unpublished data. Subsistence Activities Subsistence workers describe persons whose sole economic work is to provide food for their own family or sometimes give away to friends or relatives free, but not to sell. The following section provides a more focused look at the group of persons engaged in subsistence activities in the Kosrae. The number of persons in subsistence almost doubled between 1994 and 2000. This increased rate of participation in subsistence activities participation confirms the importance of such activities for the livelihood of Kosrae population. There are some difficulties in separating subsistence from ‘market oriented’ farming and fishing activities. The 2000 Census questions classified persons who ‘sold any’ of their produce as ‘market oriented’. Thus subsistence workers who mainly fished or farmed for home consumption but who sold some of their produce will be classified as ‘market oriented’ in the 2000 Census. On the other hand, the question applied only to one week before the census, so people who fished and farmed for market purposes but did not sell in that week will probably be counted as subsistence. Persons who engage in significant but occasional market oriented activities such as selling pigs or seasonal crops will tend to be underestimated as a result. The subsistence economy also varied between the four municipalities. Numbers reveal that Tafunsak had the highest proportion working in market oriented (about 18 percent) as well as pure subsistence (4 percent) of the working age population in 1994 (Table 9.14). The 2000 Census showed that Utwe had the highest proportion of the working in market oriented (more than 10 percent) while Malem was highest in pure subsistence (8 percent) of the working age population. Table 9.14: Percent of Population in Subsistence Work by Municipality, Kosrae State: 1994 and 2000
1994 Census 2000 Census Population Market oriented Subsistence Population Market oriented Subsistence Municipality 15+ years Number Percent Number Percent 15+ years Number Percent Number Percent
Total 4,251 282 6.6 98 2.3 4,628 198 4.3 198 4.3 Lelu 1,371 - - 4 0.3 1,550 15 1.0 30 1.9 Malem 828 2 0.2 15 1.8 954 31 3.2 82 8.6 Utwe 590 20 3.4 23 3.9 666 67 10.1 17 2.6 Tafunsak 1,462 260 17.8 56 3.8 1,458 85 5.8 69 4.7 Source: 1994 & 2000 FSM Censuses, Table P146
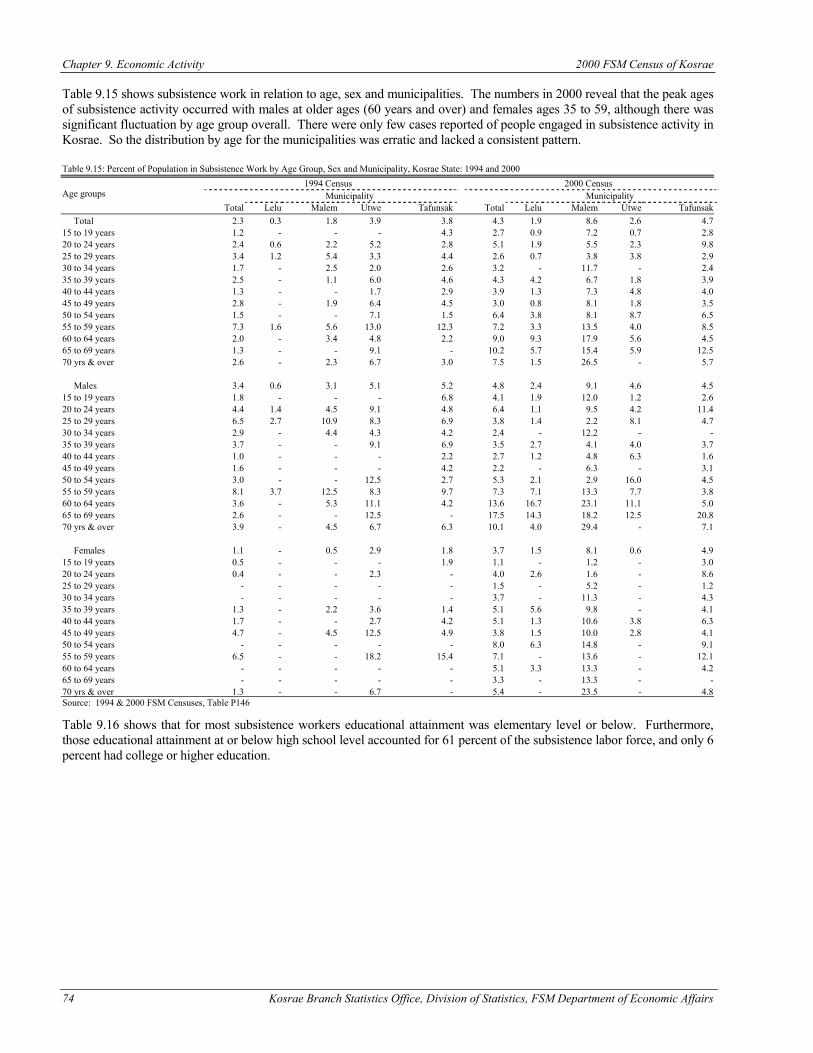
Chapter 9. Economic Activity 2000 FSM Census of Kosrae
74 Kosrae Branch Statistics Office, Division of Statistics, FSM Department of Economic Affairs
Table 9.15 shows subsistence work in relation to age, sex and municipalities. The numbers in 2000 reveal that the peak ages of subsistence activity occurred with males at older ages (60 years and over) and females ages 35 to 59, although there was significant fluctuation by age group overall. There were only few cases reported of people engaged in subsistence activity in Kosrae. So the distribution by age for the municipalities was erratic and lacked a consistent pattern. Table 9.15: Percent of Population in Subsistence Work by Age Group, Sex and Municipality, Kosrae State: 1994 and 2000
1994 Census 2000 Census Municipality Municipality Age groups
Total Lelu Malem Utwe Tafunsak Total Lelu Malem Utwe Tafunsak Total 2.3 0.3 1.8 3.9 3.8 4.3 1.9 8.6 2.6 4.7 15 to 19 years 1.2 - - - 4.3 2.7 0.9 7.2 0.7 2.8 20 to 24 years 2.4 0.6 2.2 5.2 2.8 5.1 1.9 5.5 2.3 9.8 25 to 29 years 3.4 1.2 5.4 3.3 4.4 2.6 0.7 3.8 3.8 2.9 30 to 34 years 1.7 - 2.5 2.0 2.6 3.2 - 11.7 - 2.4 35 to 39 years 2.5 - 1.1 6.0 4.6 4.3 4.2 6.7 1.8 3.9 40 to 44 years 1.3 - - 1.7 2.9 3.9 1.3 7.3 4.8 4.0 45 to 49 years 2.8 - 1.9 6.4 4.5 3.0 0.8 8.1 1.8 3.5 50 to 54 years 1.5 - - 7.1 1.5 6.4 3.8 8.1 8.7 6.5 55 to 59 years 7.3 1.6 5.6 13.0 12.3 7.2 3.3 13.5 4.0 8.5 60 to 64 years 2.0 - 3.4 4.8 2.2 9.0 9.3 17.9 5.6 4.5 65 to 69 years 1.3 - - 9.1 - 10.2 5.7 15.4 5.9 12.5 70 yrs & over 2.6 - 2.3 6.7 3.0 7.5 1.5 26.5 - 5.7 Males 3.4 0.6 3.1 5.1 5.2 4.8 2.4 9.1 4.6 4.5 15 to 19 years 1.8 - - - 6.8 4.1 1.9 12.0 1.2 2.6 20 to 24 years 4.4 1.4 4.5 9.1 4.8 6.4 1.1 9.5 4.2 11.4 25 to 29 years 6.5 2.7 10.9 8.3 6.9 3.8 1.4 2.2 8.1 4.7 30 to 34 years 2.9 - 4.4 4.3 4.2 2.4 - 12.2 - - 35 to 39 years 3.7 - - 9.1 6.9 3.5 2.7 4.1 4.0 3.7 40 to 44 years 1.0 - - - 2.2 2.7 1.2 4.8 6.3 1.6 45 to 49 years 1.6 - - - 4.2 2.2 - 6.3 - 3.1 50 to 54 years 3.0 - - 12.5 2.7 5.3 2.1 2.9 16.0 4.5 55 to 59 years 8.1 3.7 12.5 8.3 9.7 7.3 7.1 13.3 7.7 3.8 60 to 64 years 3.6 - 5.3 11.1 4.2 13.6 16.7 23.1 11.1 5.0 65 to 69 years 2.6 - - 12.5 - 17.5 14.3 18.2 12.5 20.8 70 yrs & over 3.9 - 4.5 6.7 6.3 10.1 4.0 29.4 - 7.1 Females 1.1 - 0.5 2.9 1.8 3.7 1.5 8.1 0.6 4.9 15 to 19 years 0.5 - - - 1.9 1.1 - 1.2 - 3.0 20 to 24 years 0.4 - - 2.3 - 4.0 2.6 1.6 - 8.6 25 to 29 years - - - - - 1.5 - 5.2 - 1.2 30 to 34 years - - - - - 3.7 - 11.3 - 4.3 35 to 39 years 1.3 - 2.2 3.6 1.4 5.1 5.6 9.8 - 4.1 40 to 44 years 1.7 - - 2.7 4.2 5.1 1.3 10.6 3.8 6.3 45 to 49 years 4.7 - 4.5 12.5 4.9 3.8 1.5 10.0 2.8 4.1 50 to 54 years - - - - - 8.0 6.3 14.8 - 9.1 55 to 59 years 6.5 - - 18.2 15.4 7.1 - 13.6 - 12.1 60 to 64 years - - - - - 5.1 3.3 13.3 - 4.2 65 to 69 years - - - - - 3.3 - 13.3 - - 70 yrs & over 1.3 - - 6.7 - 5.4 - 23.5 - 4.8 Source: 1994 & 2000 FSM Censuses, Table P146 Table 9.16 shows that for most subsistence workers educational attainment was elementary level or below. Furthermore, those educational attainment at or below high school level accounted for 61 percent of the subsistence labor force, and only 6 percent had college or higher education.
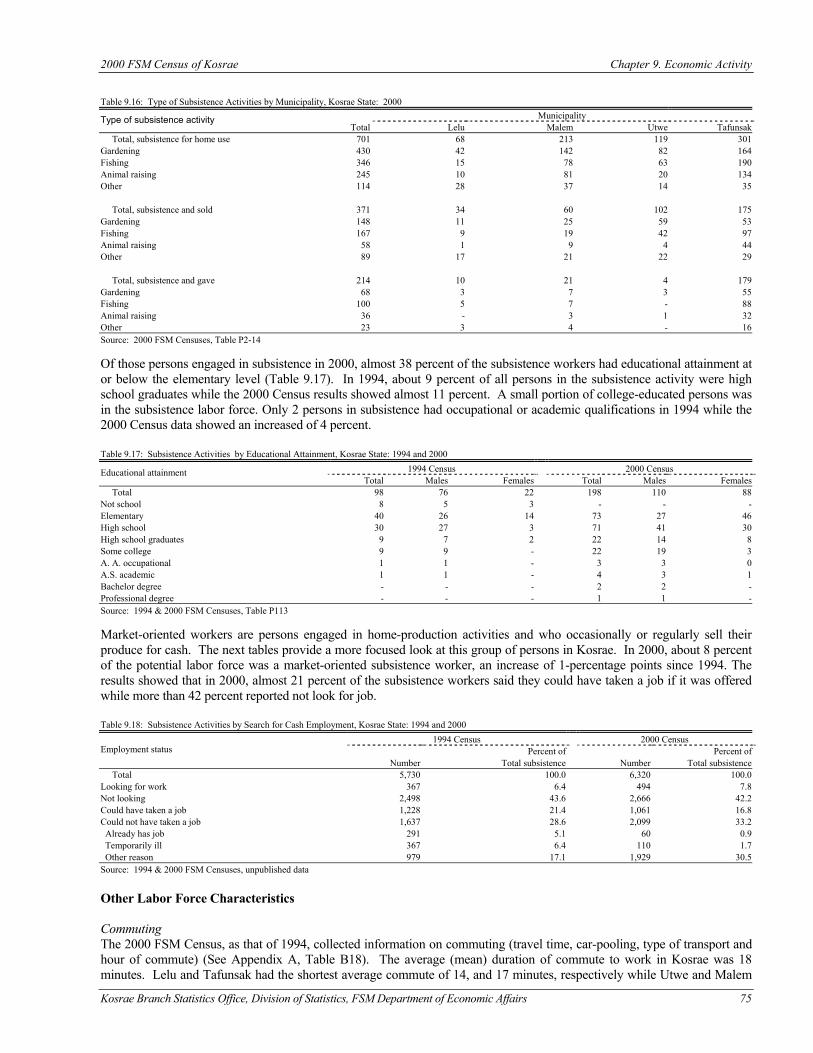
2000 FSM Census of Kosrae Chapter 9. Economic Activity
Kosrae Branch Statistics Office, Division of Statistics, FSM Department of Economic Affairs 75
Table 9.16: Type of Subsistence Activities by Municipality, Kosrae State: 2000
Municipality Type of subsistence activity Total Lelu Malem Utwe Tafunsak
Total, subsistence for home use 701 68 213 119 301 Gardening 430 42 142 82 164 Fishing 346 15 78 63 190 Animal raising 245 10 81 20 134 Other 114 28 37 14 35 Total, subsistence and sold 371 34 60 102 175 Gardening 148 11 25 59 53 Fishing 167 9 19 42 97 Animal raising 58 1 9 4 44 Other 89 17 21 22 29 Total, subsistence and gave 214 10 21 4 179 Gardening 68 3 7 3 55 Fishing 100 5 7 - 88 Animal raising 36 - 3 1 32 Other 23 3 4 - 16 Source: 2000 FSM Censuses, Table P2-14 Of those persons engaged in subsistence in 2000, almost 38 percent of the subsistence workers had educational attainment at or below the elementary level (Table 9.17). In 1994, about 9 percent of all persons in the subsistence activity were high school graduates while the 2000 Census results showed almost 11 percent. A small portion of college-educated persons was in the subsistence labor force. Only 2 persons in subsistence had occupational or academic qualifications in 1994 while the 2000 Census data showed an increased of 4 percent. Table 9.17: Subsistence Activities by Educational Attainment, Kosrae State: 1994 and 2000
1994 Census 2000 Census Educational attainment Total Males Females Total Males Females
Total 98 76 22 198 110 88 Not school 8 5 3 - - - Elementary 40 26 14 73 27 46 High school 30 27 3 71 41 30 High school graduates 9 7 2 22 14 8 Some college 9 9 - 22 19 3 A. A. occupational 1 1 - 3 3 0 A.S. academic 1 1 - 4 3 1 Bachelor degree - - - 2 2 - Professional degree - - - 1 1 - Source: 1994 & 2000 FSM Censuses, Table P113 Market-oriented workers are persons engaged in home-production activities and who occasionally or regularly sell their produce for cash. The next tables provide a more focused look at this group of persons in Kosrae. In 2000, about 8 percent of the potential labor force was a market-oriented subsistence worker, an increase of 1-percentage points since 1994. The results showed that in 2000, almost 21 percent of the subsistence workers said they could have taken a job if it was offered while more than 42 percent reported not look for job. Table 9.18: Subsistence Activities by Search for Cash Employment, Kosrae State: 1994 and 2000
1994 Census 2000 Census Percent of Percent of Employment status
Number Total subsistence Number Total subsistence Total 5,730 100.0 6,320 100.0 Looking for work 367 6.4 494 7.8 Not looking 2,498 43.6 2,666 42.2 Could have taken a job 1,228 21.4 1,061 16.8 Could not have taken a job 1,637 28.6 2,099 33.2 Already has job 291 5.1 60 0.9 Temporarily ill 367 6.4 110 1.7 Other reason 979 17.1 1,929 30.5 Source: 1994 & 2000 FSM Censuses, unpublished data Other Labor Force Characteristics Commuting The 2000 FSM Census, as that of 1994, collected information on commuting (travel time, car-pooling, type of transport and hour of commute) (See Appendix A, Table B18). The average (mean) duration of commute to work in Kosrae was 18 minutes. Lelu and Tafunsak had the shortest average commute of 14, and 17 minutes, respectively while Utwe and Malem
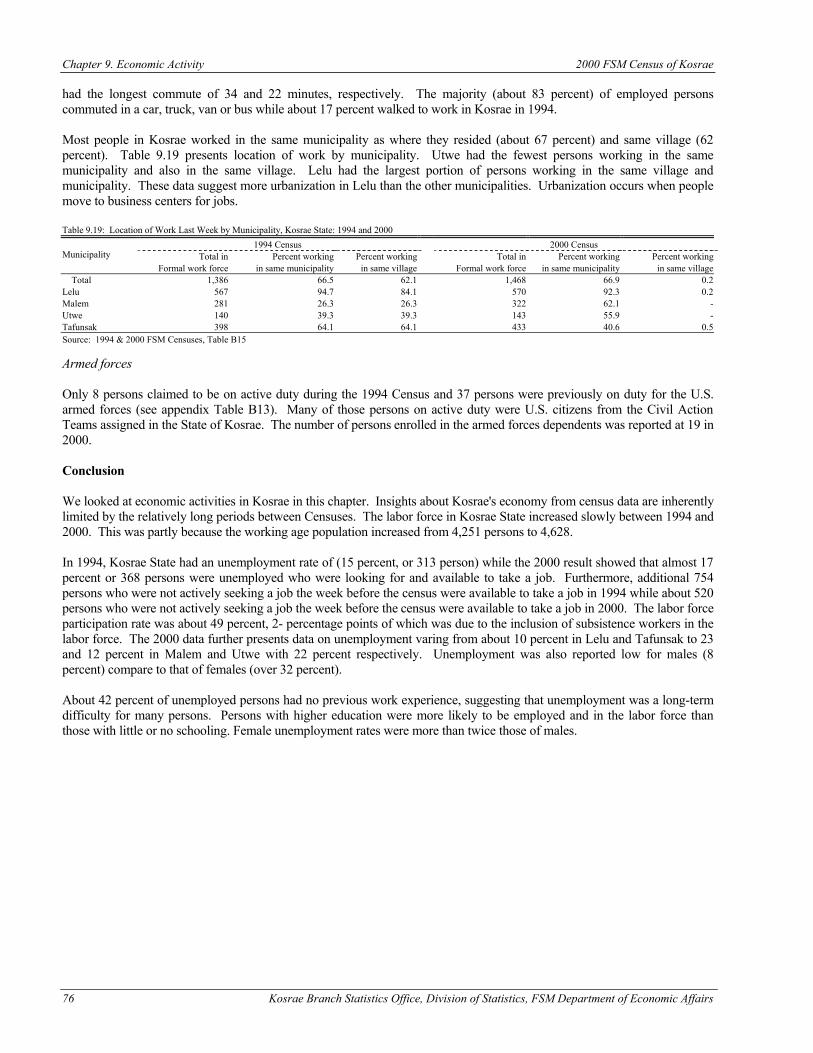
Chapter 9. Economic Activity 2000 FSM Census of Kosrae
76 Kosrae Branch Statistics Office, Division of Statistics, FSM Department of Economic Affairs
had the longest commute of 34 and 22 minutes, respectively. The majority (about 83 percent) of employed persons commuted in a car, truck, van or bus while about 17 percent walked to work in Kosrae in 1994. Most people in Kosrae worked in the same municipality as where they resided (about 67 percent) and same village (62 percent). Table 9.19 presents location of work by municipality. Utwe had the fewest persons working in the same municipality and also in the same village. Lelu had the largest portion of persons working in the same village and municipality. These data suggest more urbanization in Lelu than the other municipalities. Urbanization occurs when people move to business centers for jobs. Table 9.19: Location of Work Last Week by Municipality, Kosrae State: 1994 and 2000
1994 Census 2000 Census Total in Percent working Percent working Total in Percent working Percent working Municipality
Formal work force in same municipality in same village Formal work force in same municipality in same village Total 1,386 66.5 62.1 1,468 66.9 0.2 Lelu 567 94.7 84.1 570 92.3 0.2 Malem 281 26.3 26.3 322 62.1 - Utwe 140 39.3 39.3 143 55.9 - Tafunsak 398 64.1 64.1 433 40.6 0.5 Source: 1994 & 2000 FSM Censuses, Table B15 Armed forces Only 8 persons claimed to be on active duty during the 1994 Census and 37 persons were previously on duty for the U.S. armed forces (see appendix Table B13). Many of those persons on active duty were U.S. citizens from the Civil Action Teams assigned in the State of Kosrae. The number of persons enrolled in the armed forces dependents was reported at 19 in 2000. Conclusion We looked at economic activities in Kosrae in this chapter. Insights about Kosrae's economy from census data are inherently limited by the relatively long periods between Censuses. The labor force in Kosrae State increased slowly between 1994 and 2000. This was partly because the working age population increased from 4,251 persons to 4,628. In 1994, Kosrae State had an unemployment rate of (15 percent, or 313 person) while the 2000 result showed that almost 17 percent or 368 persons were unemployed who were looking for and available to take a job. Furthermore, additional 754 persons who were not actively seeking a job the week before the census were available to take a job in 1994 while about 520 persons who were not actively seeking a job the week before the census were available to take a job in 2000. The labor force participation rate was about 49 percent, 2- percentage points of which was due to the inclusion of subsistence workers in the labor force. The 2000 data further presents data on unemployment varing from about 10 percent in Lelu and Tafunsak to 23 and 12 percent in Malem and Utwe with 22 percent respectively. Unemployment was also reported low for males (8 percent) compare to that of females (over 32 percent). About 42 percent of unemployed persons had no previous work experience, suggesting that unemployment was a long-term difficulty for many persons. Persons with higher education were more likely to be employed and in the labor force than those with little or no schooling. Female unemployment rates were more than twice those of males.
Kosrae Branch Statistics Office, Division of Statistics, FSM Department of Economic Affairs 77
CHAPTER 10 INDUSTRY AND OCCUPATION
Introduction Industry and occupation chapter provides information on the changes occurring in the economy and how industries change employment patterns over the years. Different occupational groups classified against other characteristics show what persons hold which occupations in Kosrae State population. This chapter presents information collected from persons in the formal work force (not agricultural or fishing) who were currently working as well as persons who were currently not employed but worked in the five years previous to the census. Also reviewed in this chapter is the difference in employment between the private and public sectors. In both 1994 and 2000 FSM Censuses question number 28 was for industry and question 29 for occupation for all individuals aged 15 years and over. The type of business or industry was asked along with the name of the employer in order to check the information. Industry refers to the activity of the establishment in which an economically active person worked during the reference period established for data on economic characteristics (or last worked, if unemployed). The activity of the establishment refers to the kinds of goods or services produced. Occupation refers to the kind of work done during the reference period irrespective of the industry or the status (employer/employee). The occupation groups were derived from the level of skill and experience needed for the position. Examples include manager, sales person, typist, or factory worker. The data collected from previous censuses are not directly comparable for these classifications because of changes in definitions. The 1980 Census used definitions of industries and occupations from the U.S. standard industry and occupation classifications. The 1994 and 2000 Censuses used classifications defined by the International Labor Organization (ILO). Although the differences are minor, ILO classifications are used by a majority of Pacific Island nations and are an international standard. The 1980 Census tabulated information for individuals ages 16 and over which makes a difference when comparing to the 1994 and data which are tabulated for individuals ages 15 and over. Data Description Industry Industries within the state of Kosrae have been broken down into 14 categories by the Division of Statistics and are based on the International Labor Organization's International Standard Industrial Classification (ISIC). Some of the categories have been grouped together in order to accommodate the different economic activities of Kosrae State.
1. The first group contains agriculture, forestry, fishing, and mining (quarrying) enterprises. This group includes all agricultural production, subsistence activities, commercial fishing, mining, and quarrying.
2. Construction contains all enterprises relating to heavy construction and special building trade contractors.
Construction includes additions, alterations, reconstruction, installations, and repairs.
3. Transportation, communication, electric, gas, and sanitation services all fall in one category in the ILO breakdown; however, for Kosrae State this group has been broken into two groups, one group for transportation and communication and one group for electricity, gas, and sanitation services. The transportation and communication group includes all establishments, which provide the general public with passenger or freight transportation services and post and telecommunication services. The other group contains the major utilities of electricity, gas, and water supply.
4. Manufacturing of durable and non-durable goods is the third category. Manufacturing is the mechanical or
chemical transformation of materials or substances into new products. The category ranges in industries from fish packaging to publishing.
5. Wholesale and retail trade is combined in one group. Both groups encompass establishments involved with selling
of merchandise; wholesale implies trade to other businesses, while retail implies merchandise for personal or household consumption.
6. Financial intermediation and real estate include establishments such as depository institutions, credit institutions,
investment companies, commodity brokers, and insurance agents and brokers. Real estate includes owners, lessors, lessees, buyers, sellers, agents, and developers.
Chapter 10. Industry and Occupation 2000 FSM Census of Kosrae
78 Kosrae Branch Statistics Office, Division of Statistics, FSM Department of Economic Affairs
7. Hotels, restaurants and bars include enterprises that provide lodging, food, and beverages. This group contains establishments that provide short-term accommodations as well as bars, canteens, and restaurants.
8. Business and computer activities include the renting of machinery and equipment, research and development, legal
activities, architect and engineering services, computer activities, and other business related activities.
9. Health and social work industries include hospitals, medical and dental facilities, veterinary activities and social work facilities.
10. Education contains all establishments, which provide educational opportunities for the population.
11. Public administration consists of all government agencies and organizations, local, state, national, and international.
It also includes defense establishments and compulsory social security.
12. Other community and social services includes sewage and refuse disposal, membership organizations, recreational activities, libraries, and other service activities. Private household services are also included in this final category.
Occupation The International Standard Classification of Occupations (ISCO) breaks occupations into 10 basic categories. ISCO further aggregates occupations into 3 additional levels of detail. Responses on occupation in the 1994 FSM Census were classified down to three digits in the ISCO categories. The major groups are organized by the degree of skill and experience necessary for the occupation.
The ten major groups are broken down as follows:
1. Executives and managers: this group contains occupations whose main tasks include formulating government policy, laws, and regulations, planning directing and coordinating policies and activities of enterprises or organizations. Examples are judges, government department chiefs, traditional chiefs, legislators, and senior management of organizations.
2. Professionals: this group includes occupations whose tasks require a high level of professional knowledge and
experience. Tasks include increasing knowledge, applying scientific and artistic concepts and theories to the solution of problems, and teaching about the foregoing in a systematic manner. Examples include mathematicians, statisticians, geologists, computer programmers, architects, engineers, nurses, doctors, teachers for secondary level and above, accountants, lawyers, judges, and economists.
3. Technicians and associate professionals: this group requires technical knowledge and experience and conducts
tasks carrying out technical work connected with the application of concepts and operational methods. This group includes teachers at primary level, computer troubleshooters, ships' engineer, air traffic controller, building inspectors, medical health assistants, nutritionists, and business service agents.
4. Administrative support: also called clerks, this group includes occupations whose main tasks are to organize, store,
compute, and retrieve information. This group includes office clerks (such as secretaries and word processors, transport clerks, filing clerks) and customer service clerks (such as tellers, cashiers, client information, travel agents).
5. Service workers: this group includes occupations with tasks of provide services related to travel, housekeeping,
catering, personal care, protection, maintaining law and order, selling goods at shops or markets. This group includes travel stewards, waiters, cooks, child-care workers, barbers, police officers, fire fighters and stall or market sales persons.
6. Agriculture and fishing workers: these occupations include skilled workers who grow crops, breed or hunt animals,
catch or cultivate fish and conserve or exploit forests.
7. Craft and related trades: tasks include extracting raw materials, constructing buildings, and other structures and making various products and handicraft goods.
8. Machine operators: includes tasks, which require the knowledge and experience necessary to operate and monitor
large-scale industrial machinery and equipment.
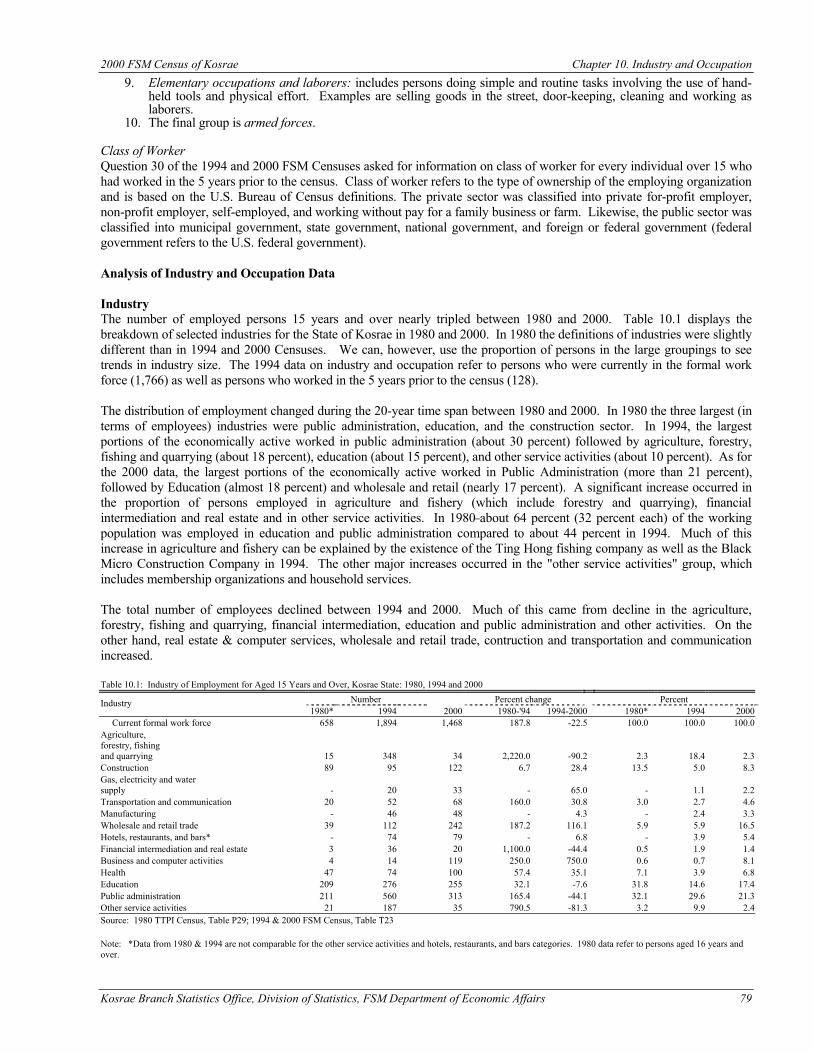
2000 FSM Census of Kosrae Chapter 10. Industry and Occupation
Kosrae Branch Statistics Office, Division of Statistics, FSM Department of Economic Affairs 79
9. Elementary occupations and laborers: includes persons doing simple and routine tasks involving the use of hand-held tools and physical effort. Examples are selling goods in the street, door-keeping, cleaning and working as laborers.
10. The final group is armed forces. Class of Worker Question 30 of the 1994 and 2000 FSM Censuses asked for information on class of worker for every individual over 15 who had worked in the 5 years prior to the census. Class of worker refers to the type of ownership of the employing organization and is based on the U.S. Bureau of Census definitions. The private sector was classified into private for-profit employer, non-profit employer, self-employed, and working without pay for a family business or farm. Likewise, the public sector was classified into municipal government, state government, national government, and foreign or federal government (federal government refers to the U.S. federal government). Analysis of Industry and Occupation Data Industry The number of employed persons 15 years and over nearly tripled between 1980 and 2000. Table 10.1 displays the breakdown of selected industries for the State of Kosrae in 1980 and 2000. In 1980 the definitions of industries were slightly different than in 1994 and 2000 Censuses. We can, however, use the proportion of persons in the large groupings to see trends in industry size. The 1994 data on industry and occupation refer to persons who were currently in the formal work force (1,766) as well as persons who worked in the 5 years prior to the census (128). The distribution of employment changed during the 20-year time span between 1980 and 2000. In 1980 the three largest (in terms of employees) industries were public administration, education, and the construction sector. In 1994, the largest portions of the economically active worked in public administration (about 30 percent) followed by agriculture, forestry, fishing and quarrying (about 18 percent), education (about 15 percent), and other service activities (about 10 percent). As for the 2000 data, the largest portions of the economically active worked in Public Administration (more than 21 percent), followed by Education (almost 18 percent) and wholesale and retail (nearly 17 percent). A significant increase occurred in the proportion of persons employed in agriculture and fishery (which include forestry and quarrying), financial intermediation and real estate and in other service activities. In 1980 about 64 percent (32 percent each) of the working population was employed in education and public administration compared to about 44 percent in 1994. Much of this increase in agriculture and fishery can be explained by the existence of the Ting Hong fishing company as well as the Black Micro Construction Company in 1994. The other major increases occurred in the "other service activities" group, which includes membership organizations and household services. The total number of employees declined between 1994 and 2000. Much of this came from decline in the agriculture, forestry, fishing and quarrying, financial intermediation, education and public administration and other activities. On the other hand, real estate & computer services, wholesale and retail trade, contruction and transportation and communication increased. Table 10.1: Industry of Employment for Aged 15 Years and Over, Kosrae State: 1980, 1994 and 2000
Number Percent change Percent Industry 1980* 1994 2000 1980-'94 1994-2000 1980* 1994 2000
Current formal work force 658 1,894 1,468 187.8 -22.5 100.0 100.0 100.0 Agriculture, forestry, fishing and quarrying 15 348 34 2,220.0 -90.2 2.3 18.4 2.3 Construction 89 95 122 6.7 28.4 13.5 5.0 8.3 Gas, electricity and water supply - 20 33 - 65.0 - 1.1 2.2 Transportation and communication 20 52 68 160.0 30.8 3.0 2.7 4.6 Manufacturing - 46 48 - 4.3 - 2.4 3.3 Wholesale and retail trade 39 112 242 187.2 116.1 5.9 5.9 16.5 Hotels, restaurants, and bars* - 74 79 - 6.8 - 3.9 5.4 Financial intermediation and real estate 3 36 20 1,100.0 -44.4 0.5 1.9 1.4 Business and computer activities 4 14 119 250.0 750.0 0.6 0.7 8.1 Health 47 74 100 57.4 35.1 7.1 3.9 6.8 Education 209 276 255 32.1 -7.6 31.8 14.6 17.4 Public administration 211 560 313 165.4 -44.1 32.1 29.6 21.3 Other service activities 21 187 35 790.5 -81.3 3.2 9.9 2.4 Source: 1980 TTPI Census, Table P29; 1994 & 2000 FSM Census, Table T23 Note: *Data from 1980 & 1994 are not comparable for the other service activities and hotels, restaurants, and bars categories. 1980 data refer to persons aged 16 years and over.
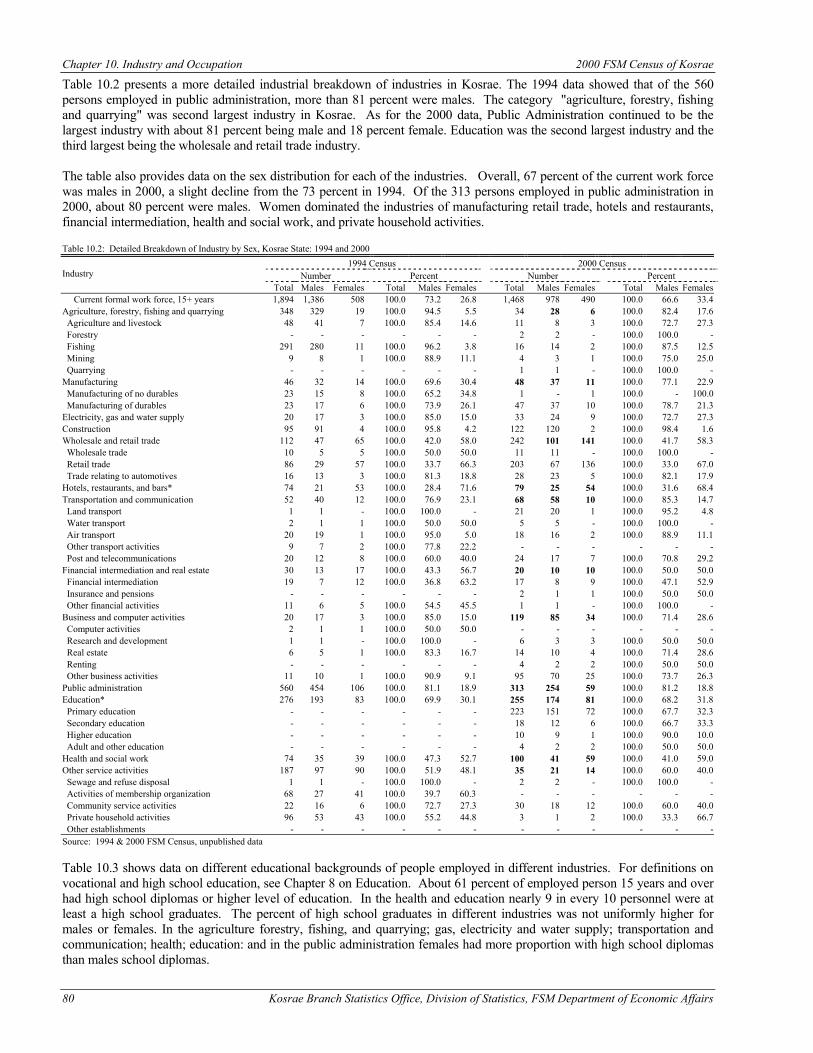
Chapter 10. Industry and Occupation 2000 FSM Census of Kosrae
80 Kosrae Branch Statistics Office, Division of Statistics, FSM Department of Economic Affairs
Table 10.2 presents a more detailed industrial breakdown of industries in Kosrae. The 1994 data showed that of the 560 persons employed in public administration, more than 81 percent were males. The category "agriculture, forestry, fishing and quarrying" was second largest industry in Kosrae. As for the 2000 data, Public Administration continued to be the largest industry with about 81 percent being male and 18 percent female. Education was the second largest industry and the third largest being the wholesale and retail trade industry. The table also provides data on the sex distribution for each of the industries. Overall, 67 percent of the current work force was males in 2000, a slight decline from the 73 percent in 1994. Of the 313 persons employed in public administration in 2000, about 80 percent were males. Women dominated the industries of manufacturing retail trade, hotels and restaurants, financial intermediation, health and social work, and private household activities. Table 10.2: Detailed Breakdown of Industry by Sex, Kosrae State: 1994 and 2000
1994 Census 2000 Census Number Percent Number Percent Industry
Total Males Females Total Males Females Total Males Females Total Males Females Current formal work force, 15+ years 1,894 1,386 508 100.0 73.2 26.8 1,468 978 490 100.0 66.6 33.4 Agriculture, forestry, fishing and quarrying 348 329 19 100.0 94.5 5.5 34 28 6 100.0 82.4 17.6 Agriculture and livestock 48 41 7 100.0 85.4 14.6 11 8 3 100.0 72.7 27.3 Forestry - - - - - - 2 2 - 100.0 100.0 - Fishing 291 280 11 100.0 96.2 3.8 16 14 2 100.0 87.5 12.5 Mining 9 8 1 100.0 88.9 11.1 4 3 1 100.0 75.0 25.0 Quarrying - - - - - - 1 1 - 100.0 100.0 - Manufacturing 46 32 14 100.0 69.6 30.4 48 37 11 100.0 77.1 22.9 Manufacturing of no durables 23 15 8 100.0 65.2 34.8 1 - 1 100.0 - 100.0 Manufacturing of durables 23 17 6 100.0 73.9 26.1 47 37 10 100.0 78.7 21.3 Electricity, gas and water supply 20 17 3 100.0 85.0 15.0 33 24 9 100.0 72.7 27.3 Construction 95 91 4 100.0 95.8 4.2 122 120 2 100.0 98.4 1.6 Wholesale and retail trade 112 47 65 100.0 42.0 58.0 242 101 141 100.0 41.7 58.3 Wholesale trade 10 5 5 100.0 50.0 50.0 11 11 - 100.0 100.0 - Retail trade 86 29 57 100.0 33.7 66.3 203 67 136 100.0 33.0 67.0 Trade relating to automotives 16 13 3 100.0 81.3 18.8 28 23 5 100.0 82.1 17.9 Hotels, restaurants, and bars* 74 21 53 100.0 28.4 71.6 79 25 54 100.0 31.6 68.4 Transportation and communication 52 40 12 100.0 76.9 23.1 68 58 10 100.0 85.3 14.7 Land transport 1 1 - 100.0 100.0 - 21 20 1 100.0 95.2 4.8 Water transport 2 1 1 100.0 50.0 50.0 5 5 - 100.0 100.0 - Air transport 20 19 1 100.0 95.0 5.0 18 16 2 100.0 88.9 11.1 Other transport activities 9 7 2 100.0 77.8 22.2 - - - - - - Post and telecommunications 20 12 8 100.0 60.0 40.0 24 17 7 100.0 70.8 29.2 Financial intermediation and real estate 30 13 17 100.0 43.3 56.7 20 10 10 100.0 50.0 50.0 Financial intermediation 19 7 12 100.0 36.8 63.2 17 8 9 100.0 47.1 52.9 Insurance and pensions - - - - - - 2 1 1 100.0 50.0 50.0 Other financial activities 11 6 5 100.0 54.5 45.5 1 1 - 100.0 100.0 - Business and computer activities 20 17 3 100.0 85.0 15.0 119 85 34 100.0 71.4 28.6 Computer activities 2 1 1 100.0 50.0 50.0 - - - - - - Research and development 1 1 - 100.0 100.0 - 6 3 3 100.0 50.0 50.0 Real estate 6 5 1 100.0 83.3 16.7 14 10 4 100.0 71.4 28.6 Renting - - - - - - 4 2 2 100.0 50.0 50.0 Other business activities 11 10 1 100.0 90.9 9.1 95 70 25 100.0 73.7 26.3 Public administration 560 454 106 100.0 81.1 18.9 313 254 59 100.0 81.2 18.8 Education* 276 193 83 100.0 69.9 30.1 255 174 81 100.0 68.2 31.8 Primary education - - - - - - 223 151 72 100.0 67.7 32.3 Secondary education - - - - - - 18 12 6 100.0 66.7 33.3 Higher education - - - - - - 10 9 1 100.0 90.0 10.0 Adult and other education - - - - - - 4 2 2 100.0 50.0 50.0 Health and social work 74 35 39 100.0 47.3 52.7 100 41 59 100.0 41.0 59.0 Other service activities 187 97 90 100.0 51.9 48.1 35 21 14 100.0 60.0 40.0 Sewage and refuse disposal 1 1 - 100.0 100.0 - 2 2 - 100.0 100.0 - Activities of membership organization 68 27 41 100.0 39.7 60.3 - - - - - - Community service activities 22 16 6 100.0 72.7 27.3 30 18 12 100.0 60.0 40.0 Private household activities 96 53 43 100.0 55.2 44.8 3 1 2 100.0 33.3 66.7 Other establishments - - - - - - - - - - - - Source: 1994 & 2000 FSM Census, unpublished data Table 10.3 shows data on different educational backgrounds of people employed in different industries. For definitions on vocational and high school education, see Chapter 8 on Education. About 61 percent of employed person 15 years and over had high school diplomas or higher level of education. In the health and education nearly 9 in every 10 personnel were at least a high school graduates. The percent of high school graduates in different industries was not uniformly higher for males or females. In the agriculture forestry, fishing, and quarrying; gas, electricity and water supply; transportation and communication; health; education: and in the public administration females had more proportion with high school diplomas than males school diplomas.
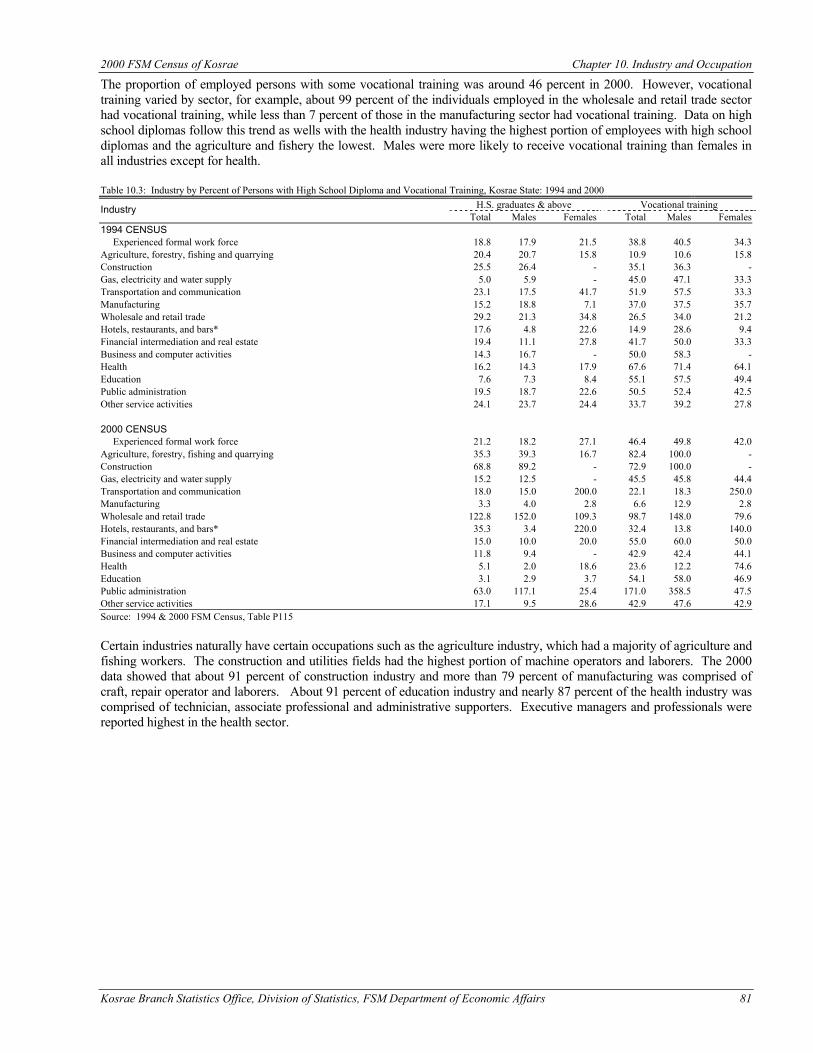
2000 FSM Census of Kosrae Chapter 10. Industry and Occupation
Kosrae Branch Statistics Office, Division of Statistics, FSM Department of Economic Affairs 81
The proportion of employed persons with some vocational training was around 46 percent in 2000. However, vocational training varied by sector, for example, about 99 percent of the individuals employed in the wholesale and retail trade sector had vocational training, while less than 7 percent of those in the manufacturing sector had vocational training. Data on high school diplomas follow this trend as wells with the health industry having the highest portion of employees with high school diplomas and the agriculture and fishery the lowest. Males were more likely to receive vocational training than females in all industries except for health. Table 10.3: Industry by Percent of Persons with High School Diploma and Vocational Training, Kosrae State: 1994 and 2000
H.S. graduates & above Vocational training Industry Total Males Females Total Males Females
1994 CENSUS Experienced formal work force 18.8 17.9 21.5 38.8 40.5 34.3 Agriculture, forestry, fishing and quarrying 20.4 20.7 15.8 10.9 10.6 15.8 Construction 25.5 26.4 - 35.1 36.3 - Gas, electricity and water supply 5.0 5.9 - 45.0 47.1 33.3 Transportation and communication 23.1 17.5 41.7 51.9 57.5 33.3 Manufacturing 15.2 18.8 7.1 37.0 37.5 35.7 Wholesale and retail trade 29.2 21.3 34.8 26.5 34.0 21.2 Hotels, restaurants, and bars* 17.6 4.8 22.6 14.9 28.6 9.4 Financial intermediation and real estate 19.4 11.1 27.8 41.7 50.0 33.3 Business and computer activities 14.3 16.7 - 50.0 58.3 - Health 16.2 14.3 17.9 67.6 71.4 64.1 Education 7.6 7.3 8.4 55.1 57.5 49.4 Public administration 19.5 18.7 22.6 50.5 52.4 42.5 Other service activities 24.1 23.7 24.4 33.7 39.2 27.8 2000 CENSUS Experienced formal work force 21.2 18.2 27.1 46.4 49.8 42.0 Agriculture, forestry, fishing and quarrying 35.3 39.3 16.7 82.4 100.0 - Construction 68.8 89.2 - 72.9 100.0 - Gas, electricity and water supply 15.2 12.5 - 45.5 45.8 44.4 Transportation and communication 18.0 15.0 200.0 22.1 18.3 250.0 Manufacturing 3.3 4.0 2.8 6.6 12.9 2.8 Wholesale and retail trade 122.8 152.0 109.3 98.7 148.0 79.6 Hotels, restaurants, and bars* 35.3 3.4 220.0 32.4 13.8 140.0 Financial intermediation and real estate 15.0 10.0 20.0 55.0 60.0 50.0 Business and computer activities 11.8 9.4 - 42.9 42.4 44.1 Health 5.1 2.0 18.6 23.6 12.2 74.6 Education 3.1 2.9 3.7 54.1 58.0 46.9 Public administration 63.0 117.1 25.4 171.0 358.5 47.5 Other service activities 17.1 9.5 28.6 42.9 47.6 42.9 Source: 1994 & 2000 FSM Census, Table P115 Certain industries naturally have certain occupations such as the agriculture industry, which had a majority of agriculture and fishing workers. The construction and utilities fields had the highest portion of machine operators and laborers. The 2000 data showed that about 91 percent of construction industry and more than 79 percent of manufacturing was comprised of craft, repair operator and laborers. About 91 percent of education industry and nearly 87 percent of the health industry was comprised of technician, associate professional and administrative supporters. Executive managers and professionals were reported highest in the health sector.
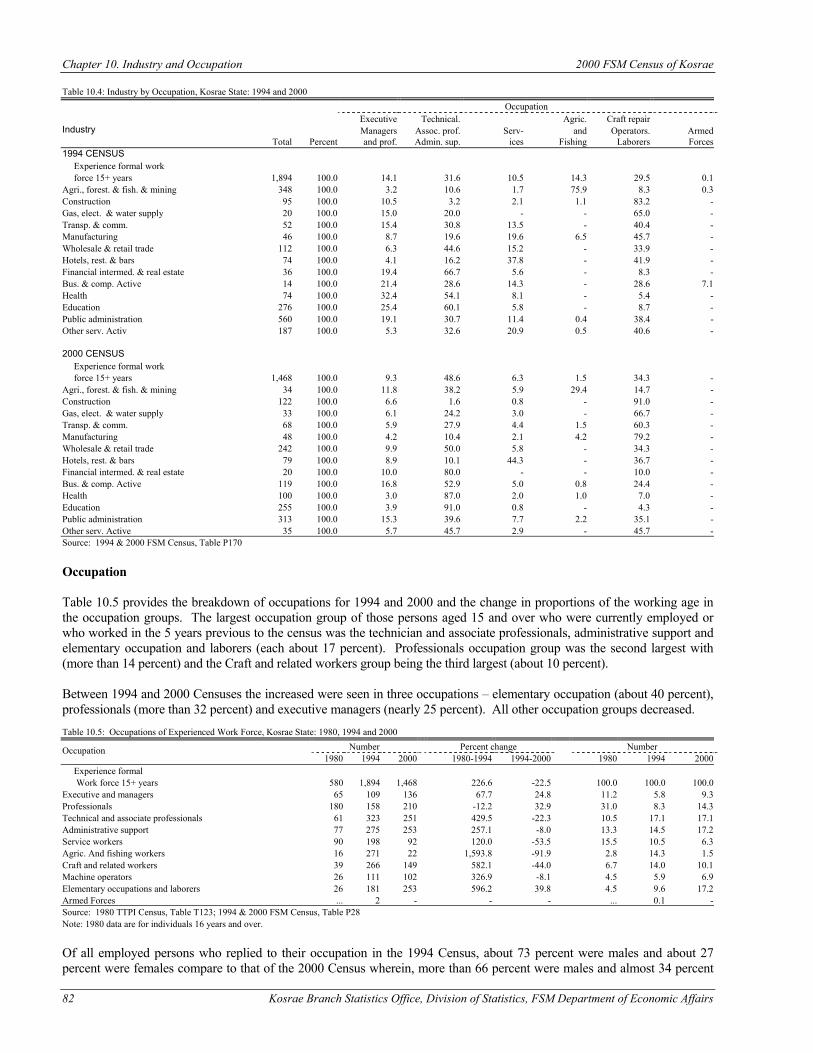
Chapter 10. Industry and Occupation 2000 FSM Census of Kosrae
82 Kosrae Branch Statistics Office, Division of Statistics, FSM Department of Economic Affairs
Table 10.4: Industry by Occupation, Kosrae State: 1994 and 2000 Occupation
Executive Technical. Agric. Craft repair Managers Assoc. prof. Serv- and Operators. Armed Industry
Total Percent and prof. Admin. sup. ices Fishing Laborers Forces 1994 CENSUS Experience formal work force 15+ years 1,894 100.0 14.1 31.6 10.5 14.3 29.5 0.1 Agri., forest. & fish. & mining 348 100.0 3.2 10.6 1.7 75.9 8.3 0.3 Construction 95 100.0 10.5 3.2 2.1 1.1 83.2 - Gas, elect. & water supply 20 100.0 15.0 20.0 - - 65.0 - Transp. & comm. 52 100.0 15.4 30.8 13.5 - 40.4 - Manufacturing 46 100.0 8.7 19.6 19.6 6.5 45.7 - Wholesale & retail trade 112 100.0 6.3 44.6 15.2 - 33.9 - Hotels, rest. & bars 74 100.0 4.1 16.2 37.8 - 41.9 - Financial intermed. & real estate 36 100.0 19.4 66.7 5.6 - 8.3 - Bus. & comp. Active 14 100.0 21.4 28.6 14.3 - 28.6 7.1 Health 74 100.0 32.4 54.1 8.1 - 5.4 - Education 276 100.0 25.4 60.1 5.8 - 8.7 - Public administration 560 100.0 19.1 30.7 11.4 0.4 38.4 - Other serv. Activ 187 100.0 5.3 32.6 20.9 0.5 40.6 - 2000 CENSUS Experience formal work force 15+ years 1,468 100.0 9.3 48.6 6.3 1.5 34.3 - Agri., forest. & fish. & mining 34 100.0 11.8 38.2 5.9 29.4 14.7 - Construction 122 100.0 6.6 1.6 0.8 - 91.0 - Gas, elect. & water supply 33 100.0 6.1 24.2 3.0 - 66.7 - Transp. & comm. 68 100.0 5.9 27.9 4.4 1.5 60.3 - Manufacturing 48 100.0 4.2 10.4 2.1 4.2 79.2 - Wholesale & retail trade 242 100.0 9.9 50.0 5.8 - 34.3 - Hotels, rest. & bars 79 100.0 8.9 10.1 44.3 - 36.7 - Financial intermed. & real estate 20 100.0 10.0 80.0 - - 10.0 - Bus. & comp. Active 119 100.0 16.8 52.9 5.0 0.8 24.4 - Health 100 100.0 3.0 87.0 2.0 1.0 7.0 - Education 255 100.0 3.9 91.0 0.8 - 4.3 - Public administration 313 100.0 15.3 39.6 7.7 2.2 35.1 - Other serv. Active 35 100.0 5.7 45.7 2.9 - 45.7 - Source: 1994 & 2000 FSM Census, Table P170 Occupation Table 10.5 provides the breakdown of occupations for 1994 and 2000 and the change in proportions of the working age in the occupation groups. The largest occupation group of those persons aged 15 and over who were currently employed or who worked in the 5 years previous to the census was the technician and associate professionals, administrative support and elementary occupation and laborers (each about 17 percent). Professionals occupation group was the second largest with (more than 14 percent) and the Craft and related workers group being the third largest (about 10 percent). Between 1994 and 2000 Censuses the increased were seen in three occupations – elementary occupation (about 40 percent), professionals (more than 32 percent) and executive managers (nearly 25 percent). All other occupation groups decreased. Table 10.5: Occupations of Experienced Work Force, Kosrae State: 1980, 1994 and 2000
Number Percent change Number Occupation 1980 1994 2000 1980-1994 1994-2000 1980 1994 2000
Experience formal Work force 15+ years 580 1,894 1,468 226.6 -22.5 100.0 100.0 100.0 Executive and managers 65 109 136 67.7 24.8 11.2 5.8 9.3 Professionals 180 158 210 -12.2 32.9 31.0 8.3 14.3 Technical and associate professionals 61 323 251 429.5 -22.3 10.5 17.1 17.1 Administrative support 77 275 253 257.1 -8.0 13.3 14.5 17.2 Service workers 90 198 92 120.0 -53.5 15.5 10.5 6.3 Agric. And fishing workers 16 271 22 1,593.8 -91.9 2.8 14.3 1.5 Craft and related workers 39 266 149 582.1 -44.0 6.7 14.0 10.1 Machine operators 26 111 102 326.9 -8.1 4.5 5.9 6.9 Elementary occupations and laborers 26 181 253 596.2 39.8 4.5 9.6 17.2 Armed Forces ... 2 - - - ... 0.1 - Source: 1980 TTPI Census, Table T123; 1994 & 2000 FSM Census, Table P28 Note: 1980 data are for individuals 16 years and over. Of all employed persons who replied to their occupation in the 1994 Census, about 73 percent were males and about 27 percent were females compare to that of the 2000 Census wherein, more than 66 percent were males and almost 34 percent
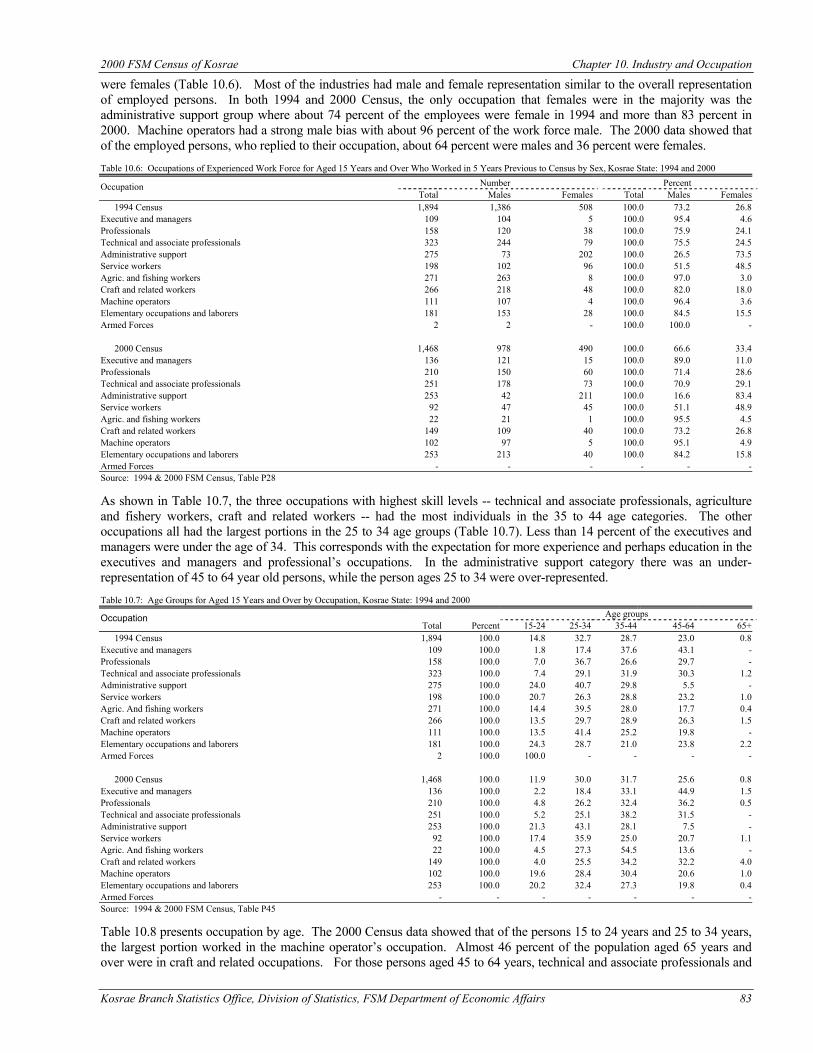
2000 FSM Census of Kosrae Chapter 10. Industry and Occupation
Kosrae Branch Statistics Office, Division of Statistics, FSM Department of Economic Affairs 83
were females (Table 10.6). Most of the industries had male and female representation similar to the overall representation of employed persons. In both 1994 and 2000 Census, the only occupation that females were in the majority was the administrative support group where about 74 percent of the employees were female in 1994 and more than 83 percent in 2000. Machine operators had a strong male bias with about 96 percent of the work force male. The 2000 data showed that of the employed persons, who replied to their occupation, about 64 percent were males and 36 percent were females. Table 10.6: Occupations of Experienced Work Force for Aged 15 Years and Over Who Worked in 5 Years Previous to Census by Sex, Kosrae State: 1994 and 2000
Number Percent Occupation Total Males Females Total Males Females
1994 Census 1,894 1,386 508 100.0 73.2 26.8 Executive and managers 109 104 5 100.0 95.4 4.6 Professionals 158 120 38 100.0 75.9 24.1 Technical and associate professionals 323 244 79 100.0 75.5 24.5 Administrative support 275 73 202 100.0 26.5 73.5 Service workers 198 102 96 100.0 51.5 48.5 Agric. and fishing workers 271 263 8 100.0 97.0 3.0 Craft and related workers 266 218 48 100.0 82.0 18.0 Machine operators 111 107 4 100.0 96.4 3.6 Elementary occupations and laborers 181 153 28 100.0 84.5 15.5 Armed Forces 2 2 - 100.0 100.0 - 2000 Census 1,468 978 490 100.0 66.6 33.4 Executive and managers 136 121 15 100.0 89.0 11.0 Professionals 210 150 60 100.0 71.4 28.6 Technical and associate professionals 251 178 73 100.0 70.9 29.1 Administrative support 253 42 211 100.0 16.6 83.4 Service workers 92 47 45 100.0 51.1 48.9 Agric. and fishing workers 22 21 1 100.0 95.5 4.5 Craft and related workers 149 109 40 100.0 73.2 26.8 Machine operators 102 97 5 100.0 95.1 4.9 Elementary occupations and laborers 253 213 40 100.0 84.2 15.8 Armed Forces - - - - - - Source: 1994 & 2000 FSM Census, Table P28 As shown in Table 10.7, the three occupations with highest skill levels -- technical and associate professionals, agriculture and fishery workers, craft and related workers -- had the most individuals in the 35 to 44 age categories. The other occupations all had the largest portions in the 25 to 34 age groups (Table 10.7). Less than 14 percent of the executives and managers were under the age of 34. This corresponds with the expectation for more experience and perhaps education in the executives and managers and professional’s occupations. In the administrative support category there was an under-representation of 45 to 64 year old persons, while the person ages 25 to 34 were over-represented. Table 10.7: Age Groups for Aged 15 Years and Over by Occupation, Kosrae State: 1994 and 2000
Age groups Occupation Total Percent 15-24 25-34 35-44 45-64 65+
1994 Census 1,894 100.0 14.8 32.7 28.7 23.0 0.8 Executive and managers 109 100.0 1.8 17.4 37.6 43.1 - Professionals 158 100.0 7.0 36.7 26.6 29.7 - Technical and associate professionals 323 100.0 7.4 29.1 31.9 30.3 1.2 Administrative support 275 100.0 24.0 40.7 29.8 5.5 - Service workers 198 100.0 20.7 26.3 28.8 23.2 1.0 Agric. And fishing workers 271 100.0 14.4 39.5 28.0 17.7 0.4 Craft and related workers 266 100.0 13.5 29.7 28.9 26.3 1.5 Machine operators 111 100.0 13.5 41.4 25.2 19.8 - Elementary occupations and laborers 181 100.0 24.3 28.7 21.0 23.8 2.2 Armed Forces 2 100.0 100.0 - - - - 2000 Census 1,468 100.0 11.9 30.0 31.7 25.6 0.8 Executive and managers 136 100.0 2.2 18.4 33.1 44.9 1.5 Professionals 210 100.0 4.8 26.2 32.4 36.2 0.5 Technical and associate professionals 251 100.0 5.2 25.1 38.2 31.5 - Administrative support 253 100.0 21.3 43.1 28.1 7.5 - Service workers 92 100.0 17.4 35.9 25.0 20.7 1.1 Agric. And fishing workers 22 100.0 4.5 27.3 54.5 13.6 - Craft and related workers 149 100.0 4.0 25.5 34.2 32.2 4.0 Machine operators 102 100.0 19.6 28.4 30.4 20.6 1.0 Elementary occupations and laborers 253 100.0 20.2 32.4 27.3 19.8 0.4 Armed Forces - - - - - - - Source: 1994 & 2000 FSM Census, Table P45 Table 10.8 presents occupation by age. The 2000 Census data showed that of the persons 15 to 24 years and 25 to 34 years, the largest portion worked in the machine operator’s occupation. Almost 46 percent of the population aged 65 years and over were in craft and related occupations. For those persons aged 45 to 64 years, technical and associate professionals and
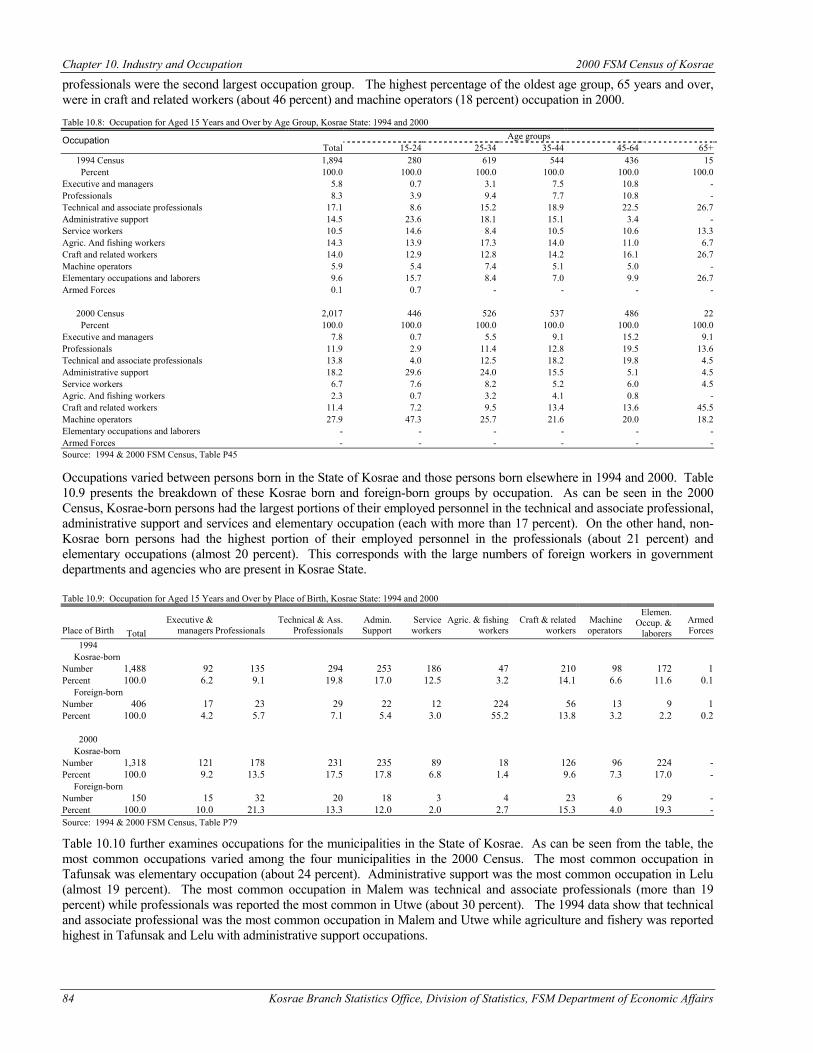
Chapter 10. Industry and Occupation 2000 FSM Census of Kosrae
84 Kosrae Branch Statistics Office, Division of Statistics, FSM Department of Economic Affairs
professionals were the second largest occupation group. The highest percentage of the oldest age group, 65 years and over, were in craft and related workers (about 46 percent) and machine operators (18 percent) occupation in 2000. Table 10.8: Occupation for Aged 15 Years and Over by Age Group, Kosrae State: 1994 and 2000
Age groups Occupation Total 15-24 25-34 35-44 45-64 65+
1994 Census 1,894 280 619 544 436 15 Percent 100.0 100.0 100.0 100.0 100.0 100.0 Executive and managers 5.8 0.7 3.1 7.5 10.8 - Professionals 8.3 3.9 9.4 7.7 10.8 - Technical and associate professionals 17.1 8.6 15.2 18.9 22.5 26.7 Administrative support 14.5 23.6 18.1 15.1 3.4 - Service workers 10.5 14.6 8.4 10.5 10.6 13.3 Agric. And fishing workers 14.3 13.9 17.3 14.0 11.0 6.7 Craft and related workers 14.0 12.9 12.8 14.2 16.1 26.7 Machine operators 5.9 5.4 7.4 5.1 5.0 - Elementary occupations and laborers 9.6 15.7 8.4 7.0 9.9 26.7 Armed Forces 0.1 0.7 - - - - 2000 Census 2,017 446 526 537 486 22 Percent 100.0 100.0 100.0 100.0 100.0 100.0 Executive and managers 7.8 0.7 5.5 9.1 15.2 9.1 Professionals 11.9 2.9 11.4 12.8 19.5 13.6 Technical and associate professionals 13.8 4.0 12.5 18.2 19.8 4.5 Administrative support 18.2 29.6 24.0 15.5 5.1 4.5 Service workers 6.7 7.6 8.2 5.2 6.0 4.5 Agric. And fishing workers 2.3 0.7 3.2 4.1 0.8 - Craft and related workers 11.4 7.2 9.5 13.4 13.6 45.5 Machine operators 27.9 47.3 25.7 21.6 20.0 18.2 Elementary occupations and laborers - - - - - - Armed Forces - - - - - - Source: 1994 & 2000 FSM Census, Table P45 Occupations varied between persons born in the State of Kosrae and those persons born elsewhere in 1994 and 2000. Table 10.9 presents the breakdown of these Kosrae born and foreign-born groups by occupation. As can be seen in the 2000 Census, Kosrae-born persons had the largest portions of their employed personnel in the technical and associate professional, administrative support and services and elementary occupation (each with more than 17 percent). On the other hand, non-Kosrae born persons had the highest portion of their employed personnel in the professionals (about 21 percent) and elementary occupations (almost 20 percent). This corresponds with the large numbers of foreign workers in government departments and agencies who are present in Kosrae State. Table 10.9: Occupation for Aged 15 Years and Over by Place of Birth, Kosrae State: 1994 and 2000
Place of Birth Total Executive &
managers Professionals Technical & Ass.
Professionals Admin. Support
Service workers
Agric. & fishing workers
Craft & related workers
Machine operators
Elemen. Occup. &
laborers Armed Forces
1994 Kosrae-born Number 1,488 92 135 294 253 186 47 210 98 172 1 Percent 100.0 6.2 9.1 19.8 17.0 12.5 3.2 14.1 6.6 11.6 0.1 Foreign-born Number 406 17 23 29 22 12 224 56 13 9 1 Percent 100.0 4.2 5.7 7.1 5.4 3.0 55.2 13.8 3.2 2.2 0.2
2000 Kosrae-born Number 1,318 121 178 231 235 89 18 126 96 224 - Percent 100.0 9.2 13.5 17.5 17.8 6.8 1.4 9.6 7.3 17.0 - Foreign-born Number 150 15 32 20 18 3 4 23 6 29 - Percent 100.0 10.0 21.3 13.3 12.0 2.0 2.7 15.3 4.0 19.3 - Source: 1994 & 2000 FSM Census, Table P79 Table 10.10 further examines occupations for the municipalities in the State of Kosrae. As can be seen from the table, the most common occupations varied among the four municipalities in the 2000 Census. The most common occupation in Tafunsak was elementary occupation (about 24 percent). Administrative support was the most common occupation in Lelu (almost 19 percent). The most common occupation in Malem was technical and associate professionals (more than 19 percent) while professionals was reported the most common in Utwe (about 30 percent). The 1994 data show that technical and associate professional was the most common occupation in Malem and Utwe while agriculture and fishery was reported highest in Tafunsak and Lelu with administrative support occupations.
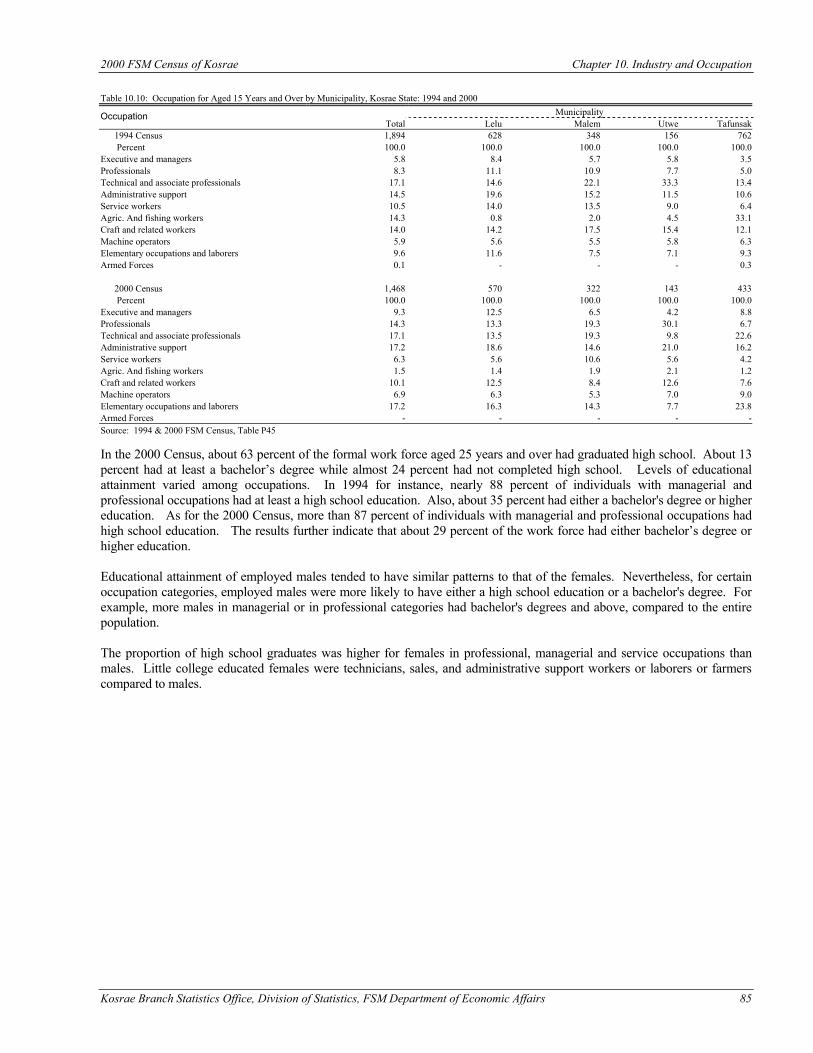
2000 FSM Census of Kosrae Chapter 10. Industry and Occupation
Kosrae Branch Statistics Office, Division of Statistics, FSM Department of Economic Affairs 85
Table 10.10: Occupation for Aged 15 Years and Over by Municipality, Kosrae State: 1994 and 2000
Municipality Occupation Total Lelu Malem Utwe Tafunsak
1994 Census 1,894 628 348 156 762 Percent 100.0 100.0 100.0 100.0 100.0 Executive and managers 5.8 8.4 5.7 5.8 3.5 Professionals 8.3 11.1 10.9 7.7 5.0 Technical and associate professionals 17.1 14.6 22.1 33.3 13.4 Administrative support 14.5 19.6 15.2 11.5 10.6 Service workers 10.5 14.0 13.5 9.0 6.4 Agric. And fishing workers 14.3 0.8 2.0 4.5 33.1 Craft and related workers 14.0 14.2 17.5 15.4 12.1 Machine operators 5.9 5.6 5.5 5.8 6.3 Elementary occupations and laborers 9.6 11.6 7.5 7.1 9.3 Armed Forces 0.1 - - - 0.3 2000 Census 1,468 570 322 143 433 Percent 100.0 100.0 100.0 100.0 100.0 Executive and managers 9.3 12.5 6.5 4.2 8.8 Professionals 14.3 13.3 19.3 30.1 6.7 Technical and associate professionals 17.1 13.5 19.3 9.8 22.6 Administrative support 17.2 18.6 14.6 21.0 16.2 Service workers 6.3 5.6 10.6 5.6 4.2 Agric. And fishing workers 1.5 1.4 1.9 2.1 1.2 Craft and related workers 10.1 12.5 8.4 12.6 7.6 Machine operators 6.9 6.3 5.3 7.0 9.0 Elementary occupations and laborers 17.2 16.3 14.3 7.7 23.8 Armed Forces - - - - - Source: 1994 & 2000 FSM Census, Table P45 In the 2000 Census, about 63 percent of the formal work force aged 25 years and over had graduated high school. About 13 percent had at least a bachelor’s degree while almost 24 percent had not completed high school. Levels of educational attainment varied among occupations. In 1994 for instance, nearly 88 percent of individuals with managerial and professional occupations had at least a high school education. Also, about 35 percent had either a bachelor's degree or higher education. As for the 2000 Census, more than 87 percent of individuals with managerial and professional occupations had high school education. The results further indicate that about 29 percent of the work force had either bachelor’s degree or higher education. Educational attainment of employed males tended to have similar patterns to that of the females. Nevertheless, for certain occupation categories, employed males were more likely to have either a high school education or a bachelor's degree. For example, more males in managerial or in professional categories had bachelor's degrees and above, compared to the entire population. The proportion of high school graduates was higher for females in professional, managerial and service occupations than males. Little college educated females were technicians, sales, and administrative support workers or laborers or farmers compared to males.
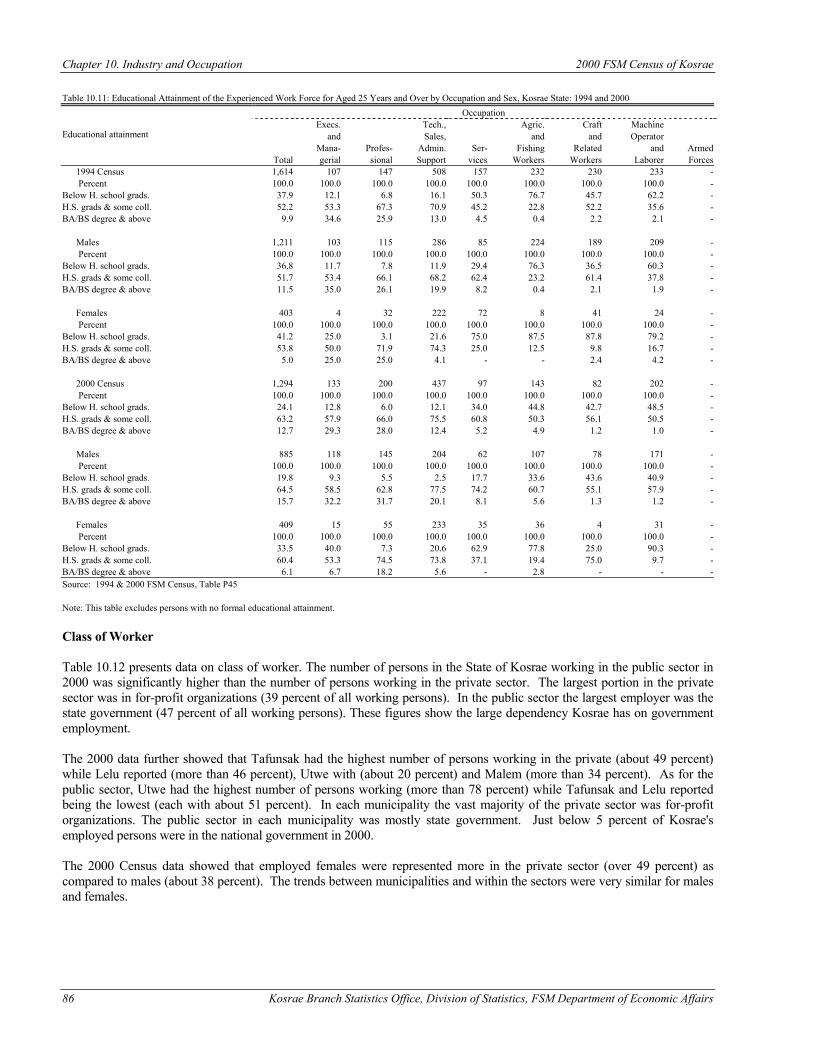
Chapter 10. Industry and Occupation 2000 FSM Census of Kosrae
86 Kosrae Branch Statistics Office, Division of Statistics, FSM Department of Economic Affairs
Table 10.11: Educational Attainment of the Experienced Work Force for Aged 25 Years and Over by Occupation and Sex, Kosrae State: 1994 and 2000
Occupation Execs. Tech., Agric. Craft Machine and Sales, and and Operator Mana- Profes- Admin. Ser- Fishing Related and Armed
Educational attainment
Total gerial sional Support vices Workers Workers Laborer Forces 1994 Census 1,614 107 147 508 157 232 230 233 - Percent 100.0 100.0 100.0 100.0 100.0 100.0 100.0 100.0 - Below H. school grads. 37.9 12.1 6.8 16.1 50.3 76.7 45.7 62.2 - H.S. grads & some coll. 52.2 53.3 67.3 70.9 45.2 22.8 52.2 35.6 - BA/BS degree & above 9.9 34.6 25.9 13.0 4.5 0.4 2.2 2.1 - Males 1,211 103 115 286 85 224 189 209 - Percent 100.0 100.0 100.0 100.0 100.0 100.0 100.0 100.0 - Below H. school grads. 36.8 11.7 7.8 11.9 29.4 76.3 36.5 60.3 - H.S. grads & some coll. 51.7 53.4 66.1 68.2 62.4 23.2 61.4 37.8 - BA/BS degree & above 11.5 35.0 26.1 19.9 8.2 0.4 2.1 1.9 - Females 403 4 32 222 72 8 41 24 - Percent 100.0 100.0 100.0 100.0 100.0 100.0 100.0 100.0 - Below H. school grads. 41.2 25.0 3.1 21.6 75.0 87.5 87.8 79.2 - H.S. grads & some coll. 53.8 50.0 71.9 74.3 25.0 12.5 9.8 16.7 - BA/BS degree & above 5.0 25.0 25.0 4.1 - - 2.4 4.2 - 2000 Census 1,294 133 200 437 97 143 82 202 - Percent 100.0 100.0 100.0 100.0 100.0 100.0 100.0 100.0 - Below H. school grads. 24.1 12.8 6.0 12.1 34.0 44.8 42.7 48.5 - H.S. grads & some coll. 63.2 57.9 66.0 75.5 60.8 50.3 56.1 50.5 - BA/BS degree & above 12.7 29.3 28.0 12.4 5.2 4.9 1.2 1.0 - Males 885 118 145 204 62 107 78 171 - Percent 100.0 100.0 100.0 100.0 100.0 100.0 100.0 100.0 - Below H. school grads. 19.8 9.3 5.5 2.5 17.7 33.6 43.6 40.9 - H.S. grads & some coll. 64.5 58.5 62.8 77.5 74.2 60.7 55.1 57.9 - BA/BS degree & above 15.7 32.2 31.7 20.1 8.1 5.6 1.3 1.2 - Females 409 15 55 233 35 36 4 31 - Percent 100.0 100.0 100.0 100.0 100.0 100.0 100.0 100.0 - Below H. school grads. 33.5 40.0 7.3 20.6 62.9 77.8 25.0 90.3 - H.S. grads & some coll. 60.4 53.3 74.5 73.8 37.1 19.4 75.0 9.7 - BA/BS degree & above 6.1 6.7 18.2 5.6 - 2.8 - - - Source: 1994 & 2000 FSM Census, Table P45 Note: This table excludes persons with no formal educational attainment. Class of Worker Table 10.12 presents data on class of worker. The number of persons in the State of Kosrae working in the public sector in 2000 was significantly higher than the number of persons working in the private sector. The largest portion in the private sector was in for-profit organizations (39 percent of all working persons). In the public sector the largest employer was the state government (47 percent of all working persons). These figures show the large dependency Kosrae has on government employment. The 2000 data further showed that Tafunsak had the highest number of persons working in the private (about 49 percent) while Lelu reported (more than 46 percent), Utwe with (about 20 percent) and Malem (more than 34 percent). As for the public sector, Utwe had the highest number of persons working (more than 78 percent) while Tafunsak and Lelu reported being the lowest (each with about 51 percent). In each municipality the vast majority of the private sector was for-profit organizations. The public sector in each municipality was mostly state government. Just below 5 percent of Kosrae's employed persons were in the national government in 2000. The 2000 Census data showed that employed females were represented more in the private sector (over 49 percent) as compared to males (about 38 percent). The trends between municipalities and within the sectors were very similar for males and females.
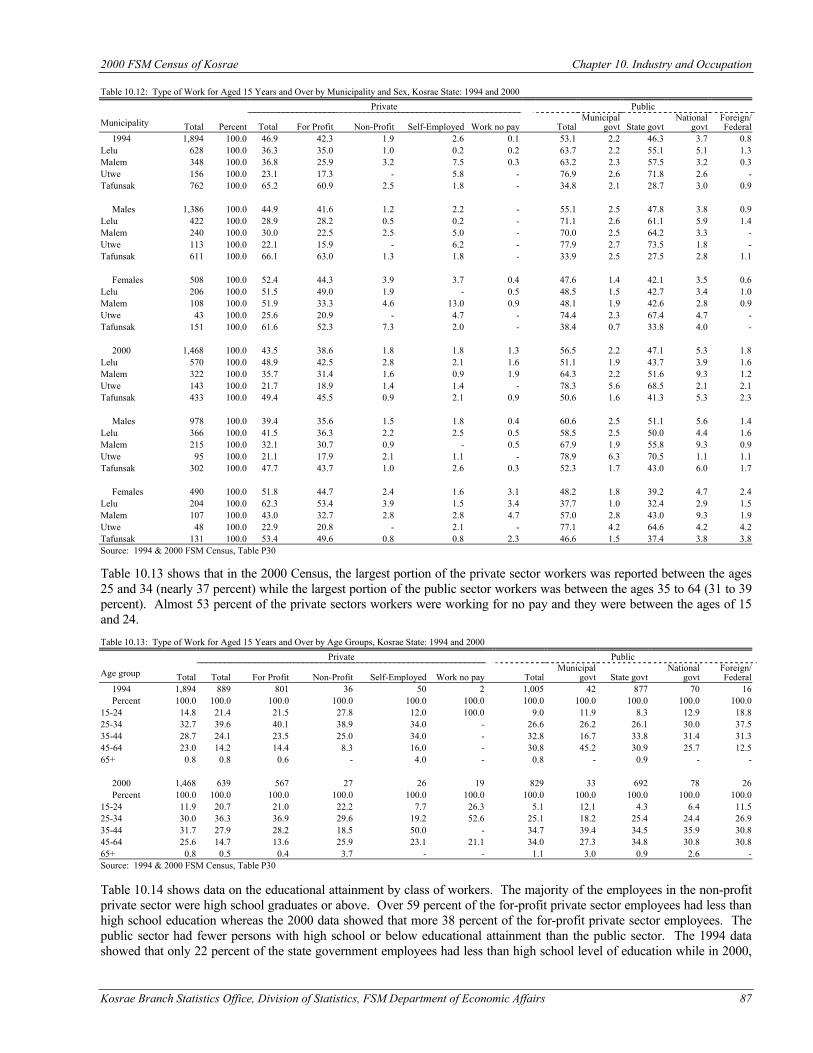
2000 FSM Census of Kosrae Chapter 10. Industry and Occupation
Kosrae Branch Statistics Office, Division of Statistics, FSM Department of Economic Affairs 87
Table 10.12: Type of Work for Aged 15 Years and Over by Municipality and Sex, Kosrae State: 1994 and 2000
Private Public
Municipality Total Percent Total For Profit Non-Profit Self-Employed Work no pay Total Municipal
govt State govt National
govt Foreign/ Federal
1994 1,894 100.0 46.9 42.3 1.9 2.6 0.1 53.1 2.2 46.3 3.7 0.8 Lelu 628 100.0 36.3 35.0 1.0 0.2 0.2 63.7 2.2 55.1 5.1 1.3 Malem 348 100.0 36.8 25.9 3.2 7.5 0.3 63.2 2.3 57.5 3.2 0.3 Utwe 156 100.0 23.1 17.3 - 5.8 - 76.9 2.6 71.8 2.6 - Tafunsak 762 100.0 65.2 60.9 2.5 1.8 - 34.8 2.1 28.7 3.0 0.9 Males 1,386 100.0 44.9 41.6 1.2 2.2 - 55.1 2.5 47.8 3.8 0.9 Lelu 422 100.0 28.9 28.2 0.5 0.2 - 71.1 2.6 61.1 5.9 1.4 Malem 240 100.0 30.0 22.5 2.5 5.0 - 70.0 2.5 64.2 3.3 - Utwe 113 100.0 22.1 15.9 - 6.2 - 77.9 2.7 73.5 1.8 - Tafunsak 611 100.0 66.1 63.0 1.3 1.8 - 33.9 2.5 27.5 2.8 1.1 Females 508 100.0 52.4 44.3 3.9 3.7 0.4 47.6 1.4 42.1 3.5 0.6 Lelu 206 100.0 51.5 49.0 1.9 - 0.5 48.5 1.5 42.7 3.4 1.0 Malem 108 100.0 51.9 33.3 4.6 13.0 0.9 48.1 1.9 42.6 2.8 0.9 Utwe 43 100.0 25.6 20.9 - 4.7 - 74.4 2.3 67.4 4.7 - Tafunsak 151 100.0 61.6 52.3 7.3 2.0 - 38.4 0.7 33.8 4.0 - 2000 1,468 100.0 43.5 38.6 1.8 1.8 1.3 56.5 2.2 47.1 5.3 1.8 Lelu 570 100.0 48.9 42.5 2.8 2.1 1.6 51.1 1.9 43.7 3.9 1.6 Malem 322 100.0 35.7 31.4 1.6 0.9 1.9 64.3 2.2 51.6 9.3 1.2 Utwe 143 100.0 21.7 18.9 1.4 1.4 - 78.3 5.6 68.5 2.1 2.1 Tafunsak 433 100.0 49.4 45.5 0.9 2.1 0.9 50.6 1.6 41.3 5.3 2.3 Males 978 100.0 39.4 35.6 1.5 1.8 0.4 60.6 2.5 51.1 5.6 1.4 Lelu 366 100.0 41.5 36.3 2.2 2.5 0.5 58.5 2.5 50.0 4.4 1.6 Malem 215 100.0 32.1 30.7 0.9 - 0.5 67.9 1.9 55.8 9.3 0.9 Utwe 95 100.0 21.1 17.9 2.1 1.1 - 78.9 6.3 70.5 1.1 1.1 Tafunsak 302 100.0 47.7 43.7 1.0 2.6 0.3 52.3 1.7 43.0 6.0 1.7 Females 490 100.0 51.8 44.7 2.4 1.6 3.1 48.2 1.8 39.2 4.7 2.4 Lelu 204 100.0 62.3 53.4 3.9 1.5 3.4 37.7 1.0 32.4 2.9 1.5 Malem 107 100.0 43.0 32.7 2.8 2.8 4.7 57.0 2.8 43.0 9.3 1.9 Utwe 48 100.0 22.9 20.8 - 2.1 - 77.1 4.2 64.6 4.2 4.2 Tafunsak 131 100.0 53.4 49.6 0.8 0.8 2.3 46.6 1.5 37.4 3.8 3.8 Source: 1994 & 2000 FSM Census, Table P30 Table 10.13 shows that in the 2000 Census, the largest portion of the private sector workers was reported between the ages 25 and 34 (nearly 37 percent) while the largest portion of the public sector workers was between the ages 35 to 64 (31 to 39 percent). Almost 53 percent of the private sectors workers were working for no pay and they were between the ages of 15 and 24. Table 10.13: Type of Work for Aged 15 Years and Over by Age Groups, Kosrae State: 1994 and 2000
Private Public
Age group Total Total For Profit Non-Profit Self-Employed Work no pay Total Municipal
govt State govt National
govt Foreign/ Federal
1994 1,894 889 801 36 50 2 1,005 42 877 70 16 Percent 100.0 100.0 100.0 100.0 100.0 100.0 100.0 100.0 100.0 100.0 100.0 15-24 14.8 21.4 21.5 27.8 12.0 100.0 9.0 11.9 8.3 12.9 18.8 25-34 32.7 39.6 40.1 38.9 34.0 - 26.6 26.2 26.1 30.0 37.5 35-44 28.7 24.1 23.5 25.0 34.0 - 32.8 16.7 33.8 31.4 31.3 45-64 23.0 14.2 14.4 8.3 16.0 - 30.8 45.2 30.9 25.7 12.5 65+ 0.8 0.8 0.6 - 4.0 - 0.8 - 0.9 - - 2000 1,468 639 567 27 26 19 829 33 692 78 26 Percent 100.0 100.0 100.0 100.0 100.0 100.0 100.0 100.0 100.0 100.0 100.0 15-24 11.9 20.7 21.0 22.2 7.7 26.3 5.1 12.1 4.3 6.4 11.5 25-34 30.0 36.3 36.9 29.6 19.2 52.6 25.1 18.2 25.4 24.4 26.9 35-44 31.7 27.9 28.2 18.5 50.0 - 34.7 39.4 34.5 35.9 30.8 45-64 25.6 14.7 13.6 25.9 23.1 21.1 34.0 27.3 34.8 30.8 30.8 65+ 0.8 0.5 0.4 3.7 - - 1.1 3.0 0.9 2.6 - Source: 1994 & 2000 FSM Census, Table P30 Table 10.14 shows data on the educational attainment by class of workers. The majority of the employees in the non-profit private sector were high school graduates or above. Over 59 percent of the for-profit private sector employees had less than high school education whereas the 2000 data showed that more 38 percent of the for-profit private sector employees. The public sector had fewer persons with high school or below educational attainment than the public sector. The 1994 data showed that only 22 percent of the state government employees had less than high school level of education while in 2000,
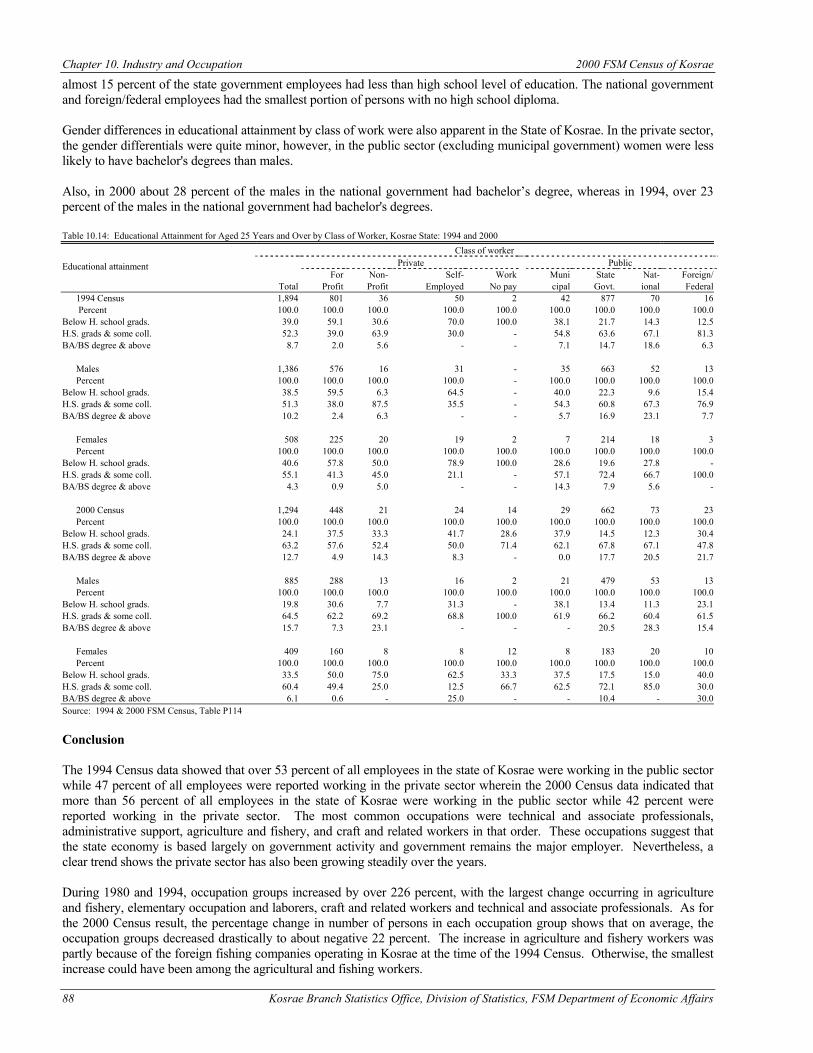
Chapter 10. Industry and Occupation 2000 FSM Census of Kosrae
88 Kosrae Branch Statistics Office, Division of Statistics, FSM Department of Economic Affairs
almost 15 percent of the state government employees had less than high school level of education. The national government and foreign/federal employees had the smallest portion of persons with no high school diploma. Gender differences in educational attainment by class of work were also apparent in the State of Kosrae. In the private sector, the gender differentials were quite minor, however, in the public sector (excluding municipal government) women were less likely to have bachelor's degrees than males. Also, in 2000 about 28 percent of the males in the national government had bachelor’s degree, whereas in 1994, over 23 percent of the males in the national government had bachelor's degrees. Table 10.14: Educational Attainment for Aged 25 Years and Over by Class of Worker, Kosrae State: 1994 and 2000
Class of worker Private Public For Non- Self- Work Muni State Nat- Foreign/
Educational attainment
Total Profit Profit Employed No pay cipal Govt. ional Federal 1994 Census 1,894 801 36 50 2 42 877 70 16 Percent 100.0 100.0 100.0 100.0 100.0 100.0 100.0 100.0 100.0 Below H. school grads. 39.0 59.1 30.6 70.0 100.0 38.1 21.7 14.3 12.5 H.S. grads & some coll. 52.3 39.0 63.9 30.0 - 54.8 63.6 67.1 81.3 BA/BS degree & above 8.7 2.0 5.6 - - 7.1 14.7 18.6 6.3 Males 1,386 576 16 31 - 35 663 52 13 Percent 100.0 100.0 100.0 100.0 - 100.0 100.0 100.0 100.0 Below H. school grads. 38.5 59.5 6.3 64.5 - 40.0 22.3 9.6 15.4 H.S. grads & some coll. 51.3 38.0 87.5 35.5 - 54.3 60.8 67.3 76.9 BA/BS degree & above 10.2 2.4 6.3 - - 5.7 16.9 23.1 7.7 Females 508 225 20 19 2 7 214 18 3 Percent 100.0 100.0 100.0 100.0 100.0 100.0 100.0 100.0 100.0 Below H. school grads. 40.6 57.8 50.0 78.9 100.0 28.6 19.6 27.8 - H.S. grads & some coll. 55.1 41.3 45.0 21.1 - 57.1 72.4 66.7 100.0 BA/BS degree & above 4.3 0.9 5.0 - - 14.3 7.9 5.6 - 2000 Census 1,294 448 21 24 14 29 662 73 23 Percent 100.0 100.0 100.0 100.0 100.0 100.0 100.0 100.0 100.0 Below H. school grads. 24.1 37.5 33.3 41.7 28.6 37.9 14.5 12.3 30.4 H.S. grads & some coll. 63.2 57.6 52.4 50.0 71.4 62.1 67.8 67.1 47.8 BA/BS degree & above 12.7 4.9 14.3 8.3 - 0.0 17.7 20.5 21.7 Males 885 288 13 16 2 21 479 53 13 Percent 100.0 100.0 100.0 100.0 100.0 100.0 100.0 100.0 100.0 Below H. school grads. 19.8 30.6 7.7 31.3 - 38.1 13.4 11.3 23.1 H.S. grads & some coll. 64.5 62.2 69.2 68.8 100.0 61.9 66.2 60.4 61.5 BA/BS degree & above 15.7 7.3 23.1 - - - 20.5 28.3 15.4 Females 409 160 8 8 12 8 183 20 10 Percent 100.0 100.0 100.0 100.0 100.0 100.0 100.0 100.0 100.0 Below H. school grads. 33.5 50.0 75.0 62.5 33.3 37.5 17.5 15.0 40.0 H.S. grads & some coll. 60.4 49.4 25.0 12.5 66.7 62.5 72.1 85.0 30.0 BA/BS degree & above 6.1 0.6 - 25.0 - - 10.4 - 30.0 Source: 1994 & 2000 FSM Census, Table P114 Conclusion The 1994 Census data showed that over 53 percent of all employees in the state of Kosrae were working in the public sector while 47 percent of all employees were reported working in the private sector wherein the 2000 Census data indicated that more than 56 percent of all employees in the state of Kosrae were working in the public sector while 42 percent were reported working in the private sector. The most common occupations were technical and associate professionals, administrative support, agriculture and fishery, and craft and related workers in that order. These occupations suggest that the state economy is based largely on government activity and government remains the major employer. Nevertheless, a clear trend shows the private sector has also been growing steadily over the years. During 1980 and 1994, occupation groups increased by over 226 percent, with the largest change occurring in agriculture and fishery, elementary occupation and laborers, craft and related workers and technical and associate professionals. As for the 2000 Census result, the percentage change in number of persons in each occupation group shows that on average, the occupation groups decreased drastically to about negative 22 percent. The increase in agriculture and fishery workers was partly because of the foreign fishing companies operating in Kosrae at the time of the 1994 Census. Otherwise, the smallest increase could have been among the agricultural and fishing workers.
Kosrae Branch Statistics Office, Division of Statistics, FSM Department of Economic Affairs 89
CHAPTER 11 INCOME
Introduction The 1994 FSM Census asked for cash income earned in 1993 from all persons 15 years and older while the 2000 FSM Census asked for cash income earned in 1999 from all persons 15 years and older. Income provides a measure of how well cash resources are distributed within the country as well as an insight into the sources of cash in Kosrae. Cash income is the amount of money received during a fixed period of time. For the 1994 FSM Census, the time period referred to be calendar year 1993 while the 2000 Census referred to calendar year 2000. Income includes wages or salaries, cash income from farm or non-farm business, interest on dividends or net rentals, estates or trusts, social security or retirement, and remittances. Income was tabulated by household, by family and by individual during both Census years. Household income included all cash income earned by each member living in a housing unit who was age 15 years and over. Family income included the cash income from those members of a household with two or more related members. Individual income was based on what an individual earned during 1993 and 1999 during the two current censuses. Household and family income did not include those person’s enumerated in-group quarters on census day. However, individual income did include those person’s in-group quarters. Fully 48 percent of the population aged 15 years and over reported receiving cash income in 1993. These 2,051 income recipients represented about half of the 4,251 persons in the working age population. The only persons used in the measures of income were those who reported an income for 1993. Thus measures of income were considered only for those persons who received money through salaries, wages, social security or other sources. About 52 (more than half) of the population reported no income. Definitions Wage or salary income is the total amount of money earned by a person working as an employee for a private enterprise (business or farm) or a branch of government. Wage or salary income includes take-home pay plus all deductions for withholding tax, social security, union dues, bonds, uniforms, etc. Also included are piece-rate payments, commissions, tips, bonuses, and sick leave pay. Own business income includes money receipts as well as business expenses. Interest and dividends are money earned from savings or shares. Social security and government benefits include payments from retirement, or disability payments. Remittances include money received from relatives within and outside of FSM who are not living with the individual. Two statistics were used to analyze income: median and mean. The median income is that income value that divides income recipients into two equal halves. The mean income is the sum of all income in a region or characteristic divided by the number of income recipients. (Similarly, the aggregate of all incomes in a region can be found by multiplying the mean by the number of persons earning income.) The median is a better estimate of average income because it places less emphasis on extreme values and is less susceptible to the effects of under reporting and processing errors. In this chapter both median and mean are used in most tables. Limitations and Comparability. Income is a self-reported number and is easily misreported due to self-inflation or deflation or to poor recollection. In the case of the FSM 1994 Census, the income was received at least 9 months prior to the time of reporting, making it easier to forget small or irregular income. Other errors occurred because of misunderstandings such as reporting net rather than gross earnings. The 1980 TTPI Census collected similar information on income and these data are used here with an inflation factor to compare against the 1994 Census data. Furthermore, the data collected during both 1980 and 1994 Censuses refer to cash income only. Income data may not fully explain the economy in Kosrae because of the significant share of subsistence activities in the economy. It does, however, give an indicator of the access of the Kosrae population to material possessions and changes in the cash economy.
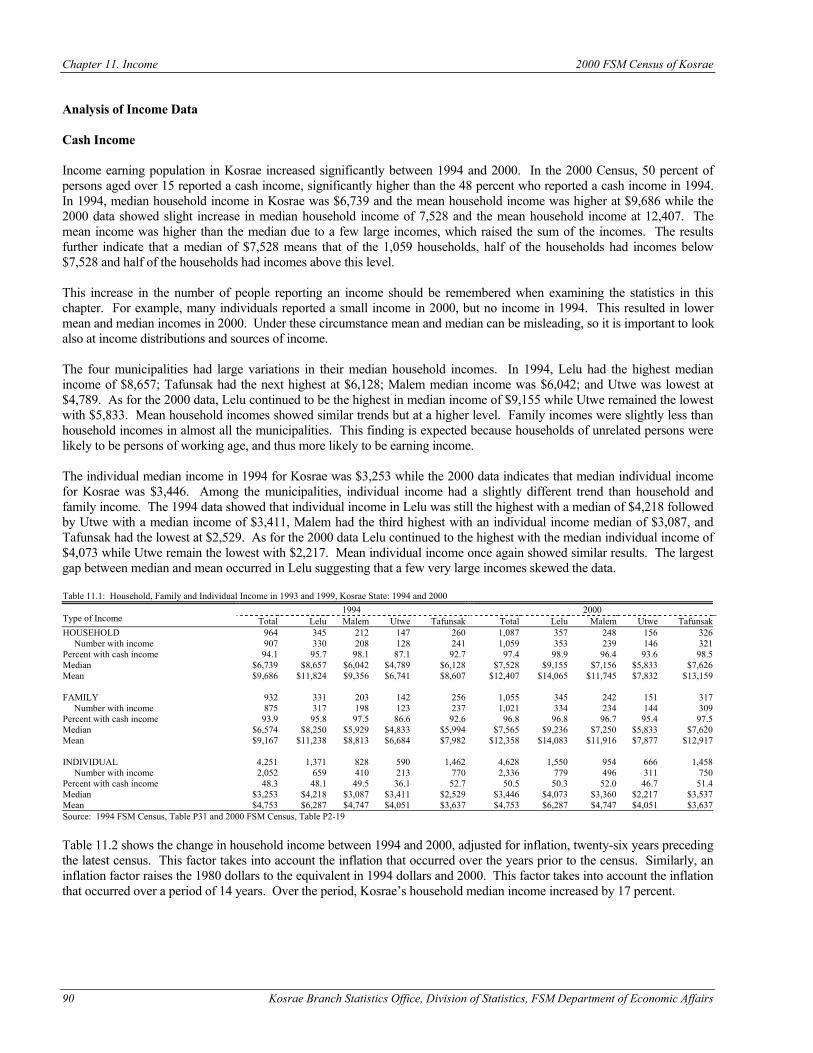
Chapter 11. Income 2000 FSM Census of Kosrae
90 Kosrae Branch Statistics Office, Division of Statistics, FSM Department of Economic Affairs
Analysis of Income Data Cash Income Income earning population in Kosrae increased significantly between 1994 and 2000. In the 2000 Census, 50 percent of persons aged over 15 reported a cash income, significantly higher than the 48 percent who reported a cash income in 1994. In 1994, median household income in Kosrae was $6,739 and the mean household income was higher at $9,686 while the 2000 data showed slight increase in median household income of 7,528 and the mean household income at 12,407. The mean income was higher than the median due to a few large incomes, which raised the sum of the incomes. The results further indicate that a median of $7,528 means that of the 1,059 households, half of the households had incomes below $7,528 and half of the households had incomes above this level. This increase in the number of people reporting an income should be remembered when examining the statistics in this chapter. For example, many individuals reported a small income in 2000, but no income in 1994. This resulted in lower mean and median incomes in 2000. Under these circumstance mean and median can be misleading, so it is important to look also at income distributions and sources of income. The four municipalities had large variations in their median household incomes. In 1994, Lelu had the highest median income of $8,657; Tafunsak had the next highest at $6,128; Malem median income was $6,042; and Utwe was lowest at $4,789. As for the 2000 data, Lelu continued to be the highest in median income of $9,155 while Utwe remained the lowest with $5,833. Mean household incomes showed similar trends but at a higher level. Family incomes were slightly less than household incomes in almost all the municipalities. This finding is expected because households of unrelated persons were likely to be persons of working age, and thus more likely to be earning income. The individual median income in 1994 for Kosrae was $3,253 while the 2000 data indicates that median individual income for Kosrae was $3,446. Among the municipalities, individual income had a slightly different trend than household and family income. The 1994 data showed that individual income in Lelu was still the highest with a median of $4,218 followed by Utwe with a median income of $3,411, Malem had the third highest with an individual income median of $3,087, and Tafunsak had the lowest at $2,529. As for the 2000 data Lelu continued to the highest with the median individual income of $4,073 while Utwe remain the lowest with $2,217. Mean individual income once again showed similar results. The largest gap between median and mean occurred in Lelu suggesting that a few very large incomes skewed the data. Table 11.1: Household, Family and Individual Income in 1993 and 1999, Kosrae State: 1994 and 2000
1994 2000 Type of Income Total Lelu Malem Utwe Tafunsak Total Lelu Malem Utwe Tafunsak HOUSEHOLD 964 345 212 147 260 1,087 357 248 156 326 Number with income 907 330 208 128 241 1,059 353 239 146 321 Percent with cash income 94.1 95.7 98.1 87.1 92.7 97.4 98.9 96.4 93.6 98.5 Median $6,739 $8,657 $6,042 $4,789 $6,128 $7,528 $9,155 $7,156 $5,833 $7,626 Mean $9,686 $11,824 $9,356 $6,741 $8,607 $12,407 $14,065 $11,745 $7,832 $13,159 FAMILY 932 331 203 142 256 1,055 345 242 151 317 Number with income 875 317 198 123 237 1,021 334 234 144 309 Percent with cash income 93.9 95.8 97.5 86.6 92.6 96.8 96.8 96.7 95.4 97.5 Median $6,574 $8,250 $5,929 $4,833 $5,994 $7,565 $9,236 $7,250 $5,833 $7,620 Mean $9,167 $11,238 $8,813 $6,684 $7,982 $12,358 $14,083 $11,916 $7,877 $12,917 INDIVIDUAL 4,251 1,371 828 590 1,462 4,628 1,550 954 666 1,458 Number with income 2,052 659 410 213 770 2,336 779 496 311 750 Percent with cash income 48.3 48.1 49.5 36.1 52.7 50.5 50.3 52.0 46.7 51.4 Median $3,253 $4,218 $3,087 $3,411 $2,529 $3,446 $4,073 $3,360 $2,217 $3,537 Mean $4,753 $6,287 $4,747 $4,051 $3,637 $4,753 $6,287 $4,747 $4,051 $3,637 Source: 1994 FSM Census, Table P31 and 2000 FSM Census, Table P2-19 Table 11.2 shows the change in household income between 1994 and 2000, adjusted for inflation, twenty-six years preceding the latest census. This factor takes into account the inflation that occurred over the years prior to the census. Similarly, an inflation factor raises the 1980 dollars to the equivalent in 1994 dollars and 2000. This factor takes into account the inflation that occurred over a period of 14 years. Over the period, Kosrae’s household median income increased by 17 percent.
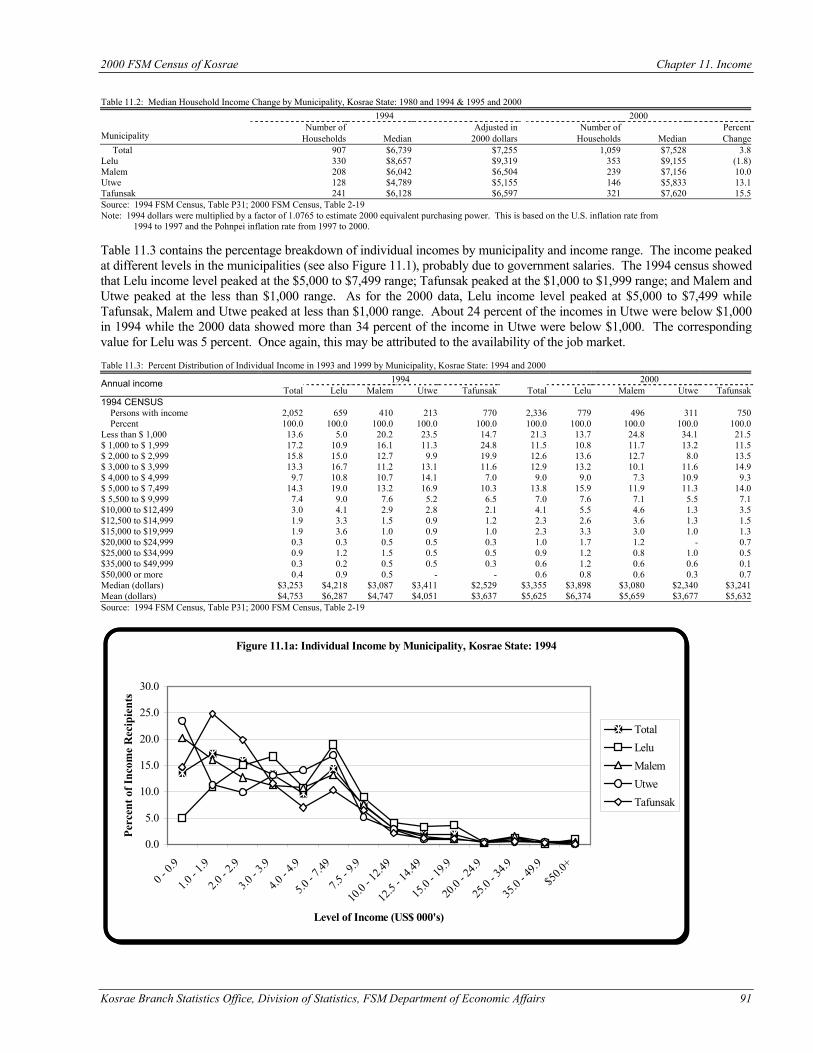
2000 FSM Census of Kosrae Chapter 11. Income
Kosrae Branch Statistics Office, Division of Statistics, FSM Department of Economic Affairs 91
Table 11.2: Median Household Income Change by Municipality, Kosrae State: 1980 and 1994 & 1995 and 2000
1994 2000 Number of Adjusted in Number of Percent
Municipality Households Median 2000 dollars Households Median Change Total 907 $6,739 $7,255 1,059 $7,528 3.8 Lelu 330 $8,657 $9,319 353 $9,155 (1.8) Malem 208 $6,042 $6,504 239 $7,156 10.0 Utwe 128 $4,789 $5,155 146 $5,833 13.1 Tafunsak 241 $6,128 $6,597 321 $7,620 15.5 Source: 1994 FSM Census, Table P31; 2000 FSM Census, Table 2-19 Note: 1994 dollars were multiplied by a factor of 1.0765 to estimate 2000 equivalent purchasing power. This is based on the U.S. inflation rate from 1994 to 1997 and the Pohnpei inflation rate from 1997 to 2000. Table 11.3 contains the percentage breakdown of individual incomes by municipality and income range. The income peaked at different levels in the municipalities (see also Figure 11.1), probably due to government salaries. The 1994 census showed that Lelu income level peaked at the $5,000 to $7,499 range; Tafunsak peaked at the $1,000 to $1,999 range; and Malem and Utwe peaked at the less than $1,000 range. As for the 2000 data, Lelu income level peaked at $5,000 to $7,499 while Tafunsak, Malem and Utwe peaked at less than $1,000 range. About 24 percent of the incomes in Utwe were below $1,000 in 1994 while the 2000 data showed more than 34 percent of the income in Utwe were below $1,000. The corresponding value for Lelu was 5 percent. Once again, this may be attributed to the availability of the job market. Table 11.3: Percent Distribution of Individual Income in 1993 and 1999 by Municipality, Kosrae State: 1994 and 2000
1994 2000 Annual income Total Lelu Malem Utwe Tafunsak Total Lelu Malem Utwe Tafunsak
1994 CENSUS Persons with income 2,052 659 410 213 770 2,336 779 496 311 750 Percent 100.0 100.0 100.0 100.0 100.0 100.0 100.0 100.0 100.0 100.0 Less than $ 1,000 13.6 5.0 20.2 23.5 14.7 21.3 13.7 24.8 34.1 21.5 $ 1,000 to $ 1,999 17.2 10.9 16.1 11.3 24.8 11.5 10.8 11.7 13.2 11.5 $ 2,000 to $ 2,999 15.8 15.0 12.7 9.9 19.9 12.6 13.6 12.7 8.0 13.5 $ 3,000 to $ 3,999 13.3 16.7 11.2 13.1 11.6 12.9 13.2 10.1 11.6 14.9 $ 4,000 to $ 4,999 9.7 10.8 10.7 14.1 7.0 9.0 9.0 7.3 10.9 9.3 $ 5,000 to $ 7,499 14.3 19.0 13.2 16.9 10.3 13.8 15.9 11.9 11.3 14.0 $ 5,500 to $ 9,999 7.4 9.0 7.6 5.2 6.5 7.0 7.6 7.1 5.5 7.1 $10,000 to $12,499 3.0 4.1 2.9 2.8 2.1 4.1 5.5 4.6 1.3 3.5 $12,500 to $14,999 1.9 3.3 1.5 0.9 1.2 2.3 2.6 3.6 1.3 1.5 $15,000 to $19,999 1.9 3.6 1.0 0.9 1.0 2.3 3.3 3.0 1.0 1.3 $20,000 to $24,999 0.3 0.3 0.5 0.5 0.3 1.0 1.7 1.2 - 0.7 $25,000 to $34,999 0.9 1.2 1.5 0.5 0.5 0.9 1.2 0.8 1.0 0.5 $35,000 to $49,999 0.3 0.2 0.5 0.5 0.3 0.6 1.2 0.6 0.6 0.1 $50,000 or more 0.4 0.9 0.5 - - 0.6 0.8 0.6 0.3 0.7 Median (dollars) $3,253 $4,218 $3,087 $3,411 $2,529 $3,355 $3,898 $3,080 $2,340 $3,241 Mean (dollars) $4,753 $6,287 $4,747 $4,051 $3,637 $5,625 $6,374 $5,659 $3,677 $5,632 Source: 1994 FSM Census, Table P31; 2000 FSM Census, Table 2-19
Figure 11.1a: Individual Income by Municipality, Kosrae State: 1994
0.0
5.0
10.0
15.0
20.0
25.0
30.0
0 - 0.
9
1.0 - 1
.9
2.0 - 2
.9
3.0 - 3
.9
4.0 - 4
.9
5.0 - 7
.49
7.5 - 9
.9
10.0
- 12.4
9
12.5
- 14.4
9
15.0
- 19.9
20.0
- 24.9
25.0
- 34.9
35.0
- 49.9
$50.0
+
Level of Income (US$ 000's)
Perc
ent o
f Inc
ome
Rec
ipie
nts
TotalLeluMalemUtweTafunsak
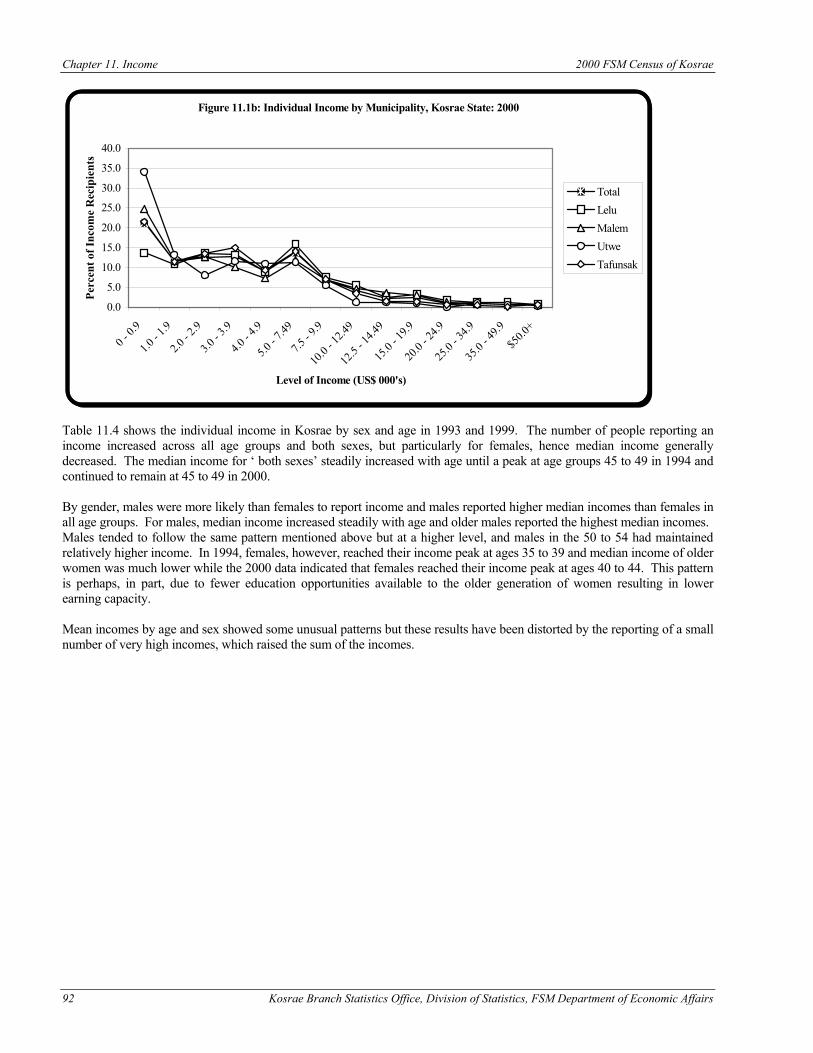
Chapter 11. Income 2000 FSM Census of Kosrae
92 Kosrae Branch Statistics Office, Division of Statistics, FSM Department of Economic Affairs
Table 11.4 shows the individual income in Kosrae by sex and age in 1993 and 1999. The number of people reporting an income increased across all age groups and both sexes, but particularly for females, hence median income generally decreased. The median income for ‘ both sexes’ steadily increased with age until a peak at age groups 45 to 49 in 1994 and continued to remain at 45 to 49 in 2000. By gender, males were more likely than females to report income and males reported higher median incomes than females in all age groups. For males, median income increased steadily with age and older males reported the highest median incomes. Males tended to follow the same pattern mentioned above but at a higher level, and males in the 50 to 54 had maintained relatively higher income. In 1994, females, however, reached their income peak at ages 35 to 39 and median income of older women was much lower while the 2000 data indicated that females reached their income peak at ages 40 to 44. This pattern is perhaps, in part, due to fewer education opportunities available to the older generation of women resulting in lower earning capacity. Mean incomes by age and sex showed some unusual patterns but these results have been distorted by the reporting of a small number of very high incomes, which raised the sum of the incomes.
Figure 11.1b: Individual Income by Municipality, Kosrae State: 2000
0.0
5.0
10.0
15.0
20.0
25.0
30.0
35.0
40.0
0 - 0.
9
1.0 - 1
.9
2.0 - 2
.9
3.0 - 3
.9
4.0 - 4
.9
5.0 - 7
.49
7.5 - 9
.9
10.0
- 12.4
9
12.5
- 14.4
9
15.0
- 19.9
20.0
- 24.9
25.0
- 34.9
35.0
- 49.9
$50.0
+
Level of Income (US$ 000's)
Perc
ent o
f Inc
ome
Rec
ipie
nts
TotalLeluMalemUtweTafunsak
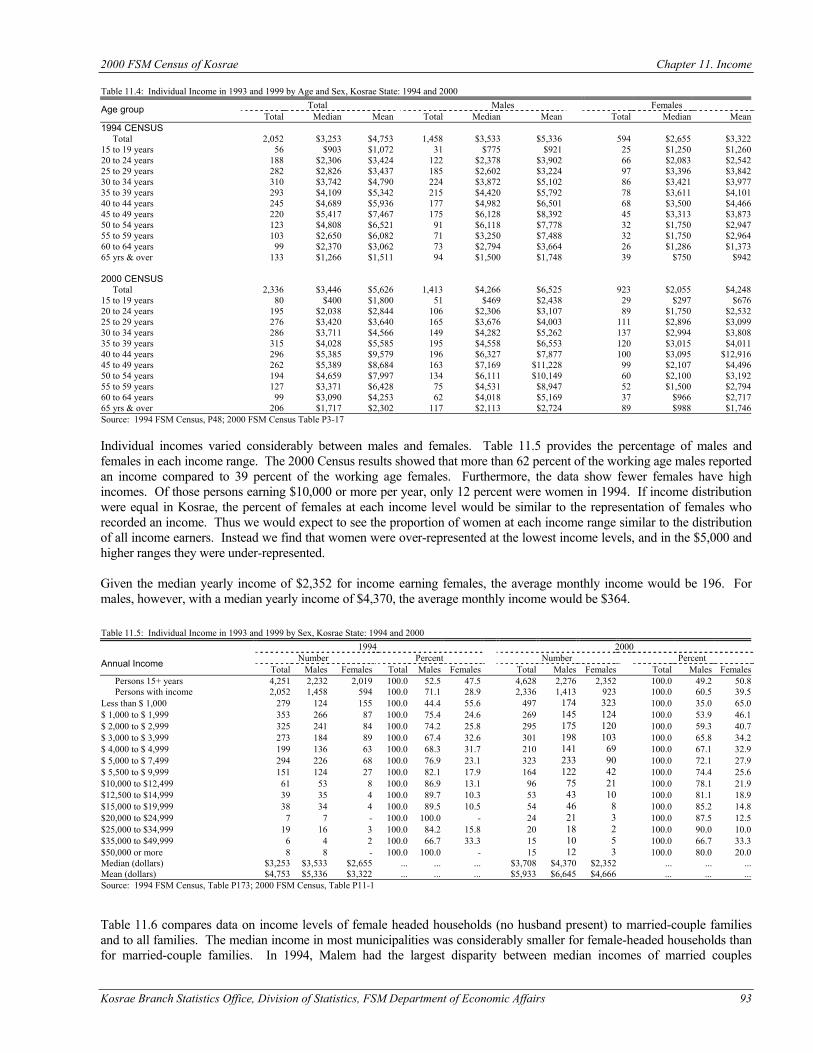
2000 FSM Census of Kosrae Chapter 11. Income
Kosrae Branch Statistics Office, Division of Statistics, FSM Department of Economic Affairs 93
Table 11.4: Individual Income in 1993 and 1999 by Age and Sex, Kosrae State: 1994 and 2000 Total Males Females Age group
Total Median Mean Total Median Mean Total Median Mean 1994 CENSUS Total 2,052 $3,253 $4,753 1,458 $3,533 $5,336 594 $2,655 $3,322 15 to 19 years 56 $903 $1,072 31 $775 $921 25 $1,250 $1,260 20 to 24 years 188 $2,306 $3,424 122 $2,378 $3,902 66 $2,083 $2,542 25 to 29 years 282 $2,826 $3,437 185 $2,602 $3,224 97 $3,396 $3,842 30 to 34 years 310 $3,742 $4,790 224 $3,872 $5,102 86 $3,421 $3,977 35 to 39 years 293 $4,109 $5,342 215 $4,420 $5,792 78 $3,611 $4,101 40 to 44 years 245 $4,689 $5,936 177 $4,982 $6,501 68 $3,500 $4,466 45 to 49 years 220 $5,417 $7,467 175 $6,128 $8,392 45 $3,313 $3,873 50 to 54 years 123 $4,808 $6,521 91 $6,118 $7,778 32 $1,750 $2,947 55 to 59 years 103 $2,650 $6,082 71 $3,250 $7,488 32 $1,750 $2,964 60 to 64 years 99 $2,370 $3,062 73 $2,794 $3,664 26 $1,286 $1,373 65 yrs & over 133 $1,266 $1,511 94 $1,500 $1,748 39 $750 $942 2000 CENSUS Total 2,336 $3,446 $5,626 1,413 $4,266 $6,525 923 $2,055 $4,248 15 to 19 years 80 $400 $1,800 51 $469 $2,438 29 $297 $676 20 to 24 years 195 $2,038 $2,844 106 $2,306 $3,107 89 $1,750 $2,532 25 to 29 years 276 $3,420 $3,640 165 $3,676 $4,003 111 $2,896 $3,099 30 to 34 years 286 $3,711 $4,566 149 $4,282 $5,262 137 $2,994 $3,808 35 to 39 years 315 $4,028 $5,585 195 $4,558 $6,553 120 $3,015 $4,011 40 to 44 years 296 $5,385 $9,579 196 $6,327 $7,877 100 $3,095 $12,916 45 to 49 years 262 $5,389 $8,684 163 $7,169 $11,228 99 $2,107 $4,496 50 to 54 years 194 $4,659 $7,997 134 $6,111 $10,149 60 $2,100 $3,192 55 to 59 years 127 $3,371 $6,428 75 $4,531 $8,947 52 $1,500 $2,794 60 to 64 years 99 $3,090 $4,253 62 $4,018 $5,169 37 $966 $2,717 65 yrs & over 206 $1,717 $2,302 117 $2,113 $2,724 89 $988 $1,746 Source: 1994 FSM Census, P48; 2000 FSM Census Table P3-17 Individual incomes varied considerably between males and females. Table 11.5 provides the percentage of males and females in each income range. The 2000 Census results showed that more than 62 percent of the working age males reported an income compared to 39 percent of the working age females. Furthermore, the data show fewer females have high incomes. Of those persons earning $10,000 or more per year, only 12 percent were women in 1994. If income distribution were equal in Kosrae, the percent of females at each income level would be similar to the representation of females who recorded an income. Thus we would expect to see the proportion of women at each income range similar to the distribution of all income earners. Instead we find that women were over-represented at the lowest income levels, and in the $5,000 and higher ranges they were under-represented. Given the median yearly income of $2,352 for income earning females, the average monthly income would be 196. For males, however, with a median yearly income of $4,370, the average monthly income would be $364. Table 11.5: Individual Income in 1993 and 1999 by Sex, Kosrae State: 1994 and 2000 1994 2000
Number Percent Number Percent Annual Income Total Males Females Total Males Females Total Males Females Total Males Females Persons 15+ years 4,251 2,232 2,019 100.0 52.5 47.5 4,628 2,276 2,352 100.0 49.2 50.8 Persons with income 2,052 1,458 594 100.0 71.1 28.9 2,336 1,413 923 100.0 60.5 39.5 Less than $ 1,000 279 124 155 100.0 44.4 55.6 497 174 323 100.0 35.0 65.0 $ 1,000 to $ 1,999 353 266 87 100.0 75.4 24.6 269 145 124 100.0 53.9 46.1 $ 2,000 to $ 2,999 325 241 84 100.0 74.2 25.8 295 175 120 100.0 59.3 40.7 $ 3,000 to $ 3,999 273 184 89 100.0 67.4 32.6 301 198 103 100.0 65.8 34.2 $ 4,000 to $ 4,999 199 136 63 100.0 68.3 31.7 210 141 69 100.0 67.1 32.9 $ 5,000 to $ 7,499 294 226 68 100.0 76.9 23.1 323 233 90 100.0 72.1 27.9 $ 5,500 to $ 9,999 151 124 27 100.0 82.1 17.9 164 122 42 100.0 74.4 25.6 $10,000 to $12,499 61 53 8 100.0 86.9 13.1 96 75 21 100.0 78.1 21.9 $12,500 to $14,999 39 35 4 100.0 89.7 10.3 53 43 10 100.0 81.1 18.9 $15,000 to $19,999 38 34 4 100.0 89.5 10.5 54 46 8 100.0 85.2 14.8 $20,000 to $24,999 7 7 - 100.0 100.0 - 24 21 3 100.0 87.5 12.5 $25,000 to $34,999 19 16 3 100.0 84.2 15.8 20 18 2 100.0 90.0 10.0 $35,000 to $49,999 6 4 2 100.0 66.7 33.3 15 10 5 100.0 66.7 33.3 $50,000 or more 8 8 - 100.0 100.0 - 15 12 3 100.0 80.0 20.0 Median (dollars) $3,253 $3,533 $2,655 ... ... ... $3,708 $4,370 $2,352 ... ... ... Mean (dollars) $4,753 $5,336 $3,322 ... ... ... $5,933 $6,645 $4,666 ... ... ... Source: 1994 FSM Census, Table P173; 2000 FSM Census, Table P11-1 Table 11.6 compares data on income levels of female headed households (no husband present) to married-couple families and to all families. The median income in most municipalities was considerably smaller for female-headed households than for married-couple families. In 1994, Malem had the largest disparity between median incomes of married couples
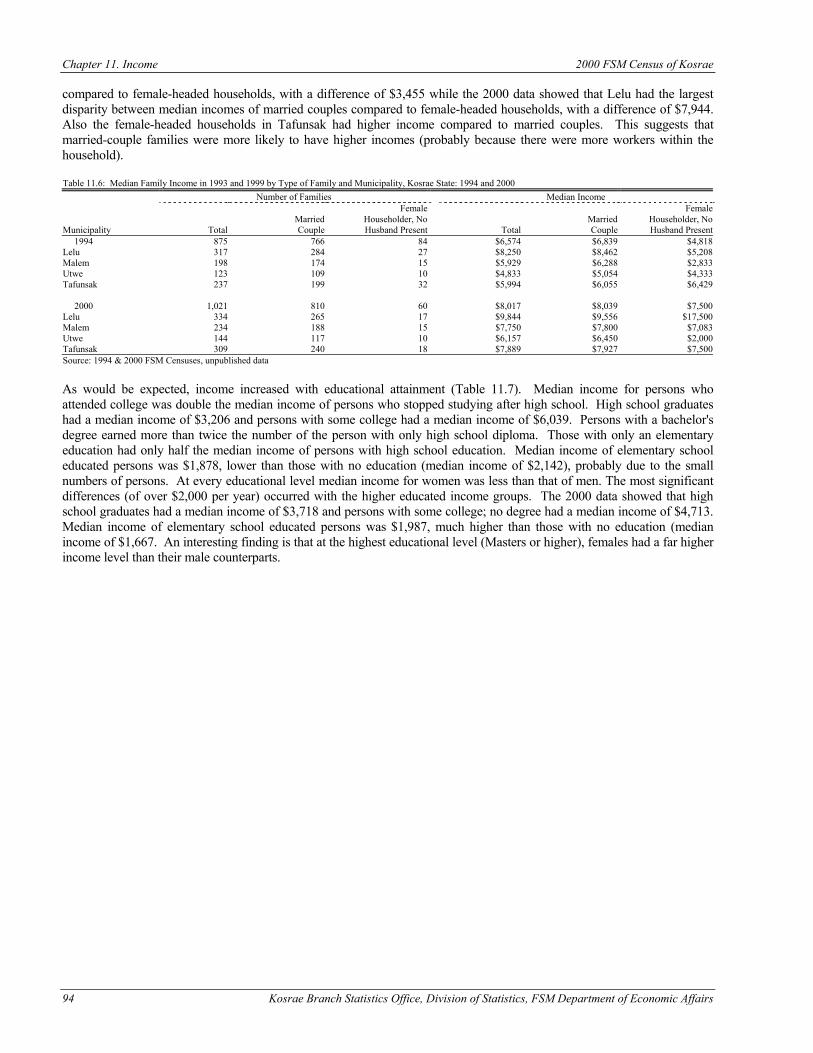
Chapter 11. Income 2000 FSM Census of Kosrae
94 Kosrae Branch Statistics Office, Division of Statistics, FSM Department of Economic Affairs
compared to female-headed households, with a difference of $3,455 while the 2000 data showed that Lelu had the largest disparity between median incomes of married couples compared to female-headed households, with a difference of $7,944. Also the female-headed households in Tafunsak had higher income compared to married couples. This suggests that married-couple families were more likely to have higher incomes (probably because there were more workers within the household). Table 11.6: Median Family Income in 1993 and 1999 by Type of Family and Municipality, Kosrae State: 1994 and 2000 Number of Families Median Income Female Female Married Householder, No Married Householder, No Municipality Total Couple Husband Present Total Couple Husband Present 1994 875 766 84 $6,574 $6,839 $4,818 Lelu 317 284 27 $8,250 $8,462 $5,208 Malem 198 174 15 $5,929 $6,288 $2,833 Utwe 123 109 10 $4,833 $5,054 $4,333 Tafunsak 237 199 32 $5,994 $6,055 $6,429 2000 1,021 810 60 $8,017 $8,039 $7,500 Lelu 334 265 17 $9,844 $9,556 $17,500 Malem 234 188 15 $7,750 $7,800 $7,083 Utwe 144 117 10 $6,157 $6,450 $2,000 Tafunsak 309 240 18 $7,889 $7,927 $7,500 Source: 1994 & 2000 FSM Censuses, unpublished data As would be expected, income increased with educational attainment (Table 11.7). Median income for persons who attended college was double the median income of persons who stopped studying after high school. High school graduates had a median income of $3,206 and persons with some college had a median income of $6,039. Persons with a bachelor's degree earned more than twice the number of the person with only high school diploma. Those with only an elementary education had only half the median income of persons with high school education. Median income of elementary school educated persons was $1,878, lower than those with no education (median income of $2,142), probably due to the small numbers of persons. At every educational level median income for women was less than that of men. The most significant differences (of over $2,000 per year) occurred with the higher educated income groups. The 2000 data showed that high school graduates had a median income of $3,718 and persons with some college; no degree had a median income of $4,713. Median income of elementary school educated persons was $1,987, much higher than those with no education (median income of $1,667. An interesting finding is that at the highest educational level (Masters or higher), females had a far higher income level than their male counterparts.
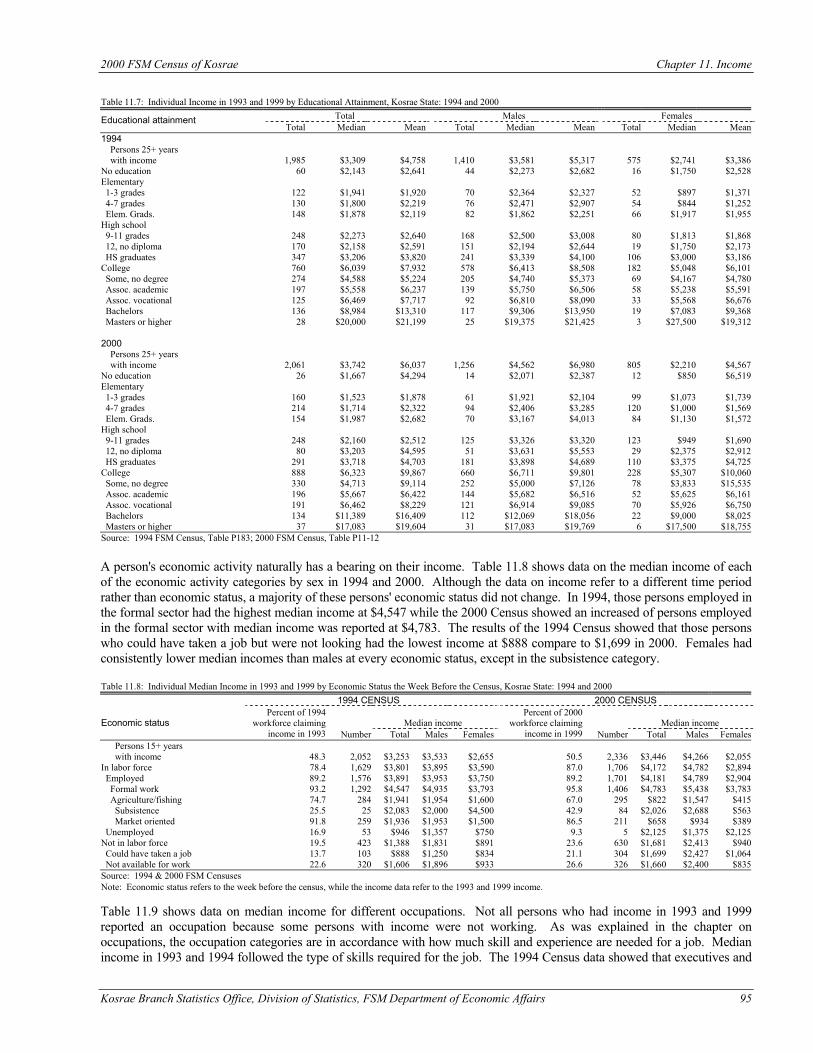
2000 FSM Census of Kosrae Chapter 11. Income
Kosrae Branch Statistics Office, Division of Statistics, FSM Department of Economic Affairs 95
Table 11.7: Individual Income in 1993 and 1999 by Educational Attainment, Kosrae State: 1994 and 2000
Total Males Females Educational attainment Total Median Mean Total Median Mean Total Median Mean
1994 Persons 25+ years with income 1,985 $3,309 $4,758 1,410 $3,581 $5,317 575 $2,741 $3,386 No education 60 $2,143 $2,641 44 $2,273 $2,682 16 $1,750 $2,528 Elementary 1-3 grades 122 $1,941 $1,920 70 $2,364 $2,327 52 $897 $1,371 4-7 grades 130 $1,800 $2,219 76 $2,471 $2,907 54 $844 $1,252 Elem. Grads. 148 $1,878 $2,119 82 $1,862 $2,251 66 $1,917 $1,955 High school 9-11 grades 248 $2,273 $2,640 168 $2,500 $3,008 80 $1,813 $1,868 12, no diploma 170 $2,158 $2,591 151 $2,194 $2,644 19 $1,750 $2,173 HS graduates 347 $3,206 $3,820 241 $3,339 $4,100 106 $3,000 $3,186 College 760 $6,039 $7,932 578 $6,413 $8,508 182 $5,048 $6,101 Some, no degree 274 $4,588 $5,224 205 $4,740 $5,373 69 $4,167 $4,780 Assoc. academic 197 $5,558 $6,237 139 $5,750 $6,506 58 $5,238 $5,591 Assoc. vocational 125 $6,469 $7,717 92 $6,810 $8,090 33 $5,568 $6,676 Bachelors 136 $8,984 $13,310 117 $9,306 $13,950 19 $7,083 $9,368 Masters or higher 28 $20,000 $21,199 25 $19,375 $21,425 3 $27,500 $19,312 2000 Persons 25+ years with income 2,061 $3,742 $6,037 1,256 $4,562 $6,980 805 $2,210 $4,567 No education 26 $1,667 $4,294 14 $2,071 $2,387 12 $850 $6,519 Elementary 1-3 grades 160 $1,523 $1,878 61 $1,921 $2,104 99 $1,073 $1,739 4-7 grades 214 $1,714 $2,322 94 $2,406 $3,285 120 $1,000 $1,569 Elem. Grads. 154 $1,987 $2,682 70 $3,167 $4,013 84 $1,130 $1,572 High school 9-11 grades 248 $2,160 $2,512 125 $3,326 $3,320 123 $949 $1,690 12, no diploma 80 $3,203 $4,595 51 $3,631 $5,553 29 $2,375 $2,912 HS graduates 291 $3,718 $4,703 181 $3,898 $4,689 110 $3,375 $4,725 College 888 $6,323 $9,867 660 $6,711 $9,801 228 $5,307 $10,060 Some, no degree 330 $4,713 $9,114 252 $5,000 $7,126 78 $3,833 $15,535 Assoc. academic 196 $5,667 $6,422 144 $5,682 $6,516 52 $5,625 $6,161 Assoc. vocational 191 $6,462 $8,229 121 $6,914 $9,085 70 $5,926 $6,750 Bachelors 134 $11,389 $16,409 112 $12,069 $18,056 22 $9,000 $8,025 Masters or higher 37 $17,083 $19,604 31 $17,083 $19,769 6 $17,500 $18,755 Source: 1994 FSM Census, Table P183; 2000 FSM Census, Table P11-12 A person's economic activity naturally has a bearing on their income. Table 11.8 shows data on the median income of each of the economic activity categories by sex in 1994 and 2000. Although the data on income refer to a different time period rather than economic status, a majority of these persons' economic status did not change. In 1994, those persons employed in the formal sector had the highest median income at $4,547 while the 2000 Census showed an increased of persons employed in the formal sector with median income was reported at $4,783. The results of the 1994 Census showed that those persons who could have taken a job but were not looking had the lowest income at $888 compare to $1,699 in 2000. Females had consistently lower median incomes than males at every economic status, except in the subsistence category. Table 11.8: Individual Median Income in 1993 and 1999 by Economic Status the Week Before the Census, Kosrae State: 1994 and 2000 1994 CENSUS 2000 CENSUS
Median income Median income Economic status
Percent of 1994 workforce claiming
income in 1993 Number Total Males Females
Percent of 2000 workforce claiming
income in 1999 Number Total Males Females Persons 15+ years with income 48.3 2,052 $3,253 $3,533 $2,655 50.5 2,336 $3,446 $4,266 $2,055 In labor force 78.4 1,629 $3,801 $3,895 $3,590 87.0 1,706 $4,172 $4,782 $2,894 Employed 89.2 1,576 $3,891 $3,953 $3,750 89.2 1,701 $4,181 $4,789 $2,904 Formal work 93.2 1,292 $4,547 $4,935 $3,793 95.8 1,406 $4,783 $5,438 $3,783 Agriculture/fishing 74.7 284 $1,941 $1,954 $1,600 67.0 295 $822 $1,547 $415 Subsistence 25.5 25 $2,083 $2,000 $4,500 42.9 84 $2,026 $2,688 $563 Market oriented 91.8 259 $1,936 $1,953 $1,500 86.5 211 $658 $934 $389 Unemployed 16.9 53 $946 $1,357 $750 9.3 5 $2,125 $1,375 $2,125 Not in labor force 19.5 423 $1,388 $1,831 $891 23.6 630 $1,681 $2,413 $940 Could have taken a job 13.7 103 $888 $1,250 $834 21.1 304 $1,699 $2,427 $1,064 Not available for work 22.6 320 $1,606 $1,896 $933 26.6 326 $1,660 $2,400 $835 Source: 1994 & 2000 FSM Censuses Note: Economic status refers to the week before the census, while the income data refer to the 1993 and 1999 income. Table 11.9 shows data on median income for different occupations. Not all persons who had income in 1993 and 1999 reported an occupation because some persons with income were not working. As was explained in the chapter on occupations, the occupation categories are in accordance with how much skill and experience are needed for a job. Median income in 1993 and 1994 followed the type of skills required for the job. The 1994 Census data showed that executives and
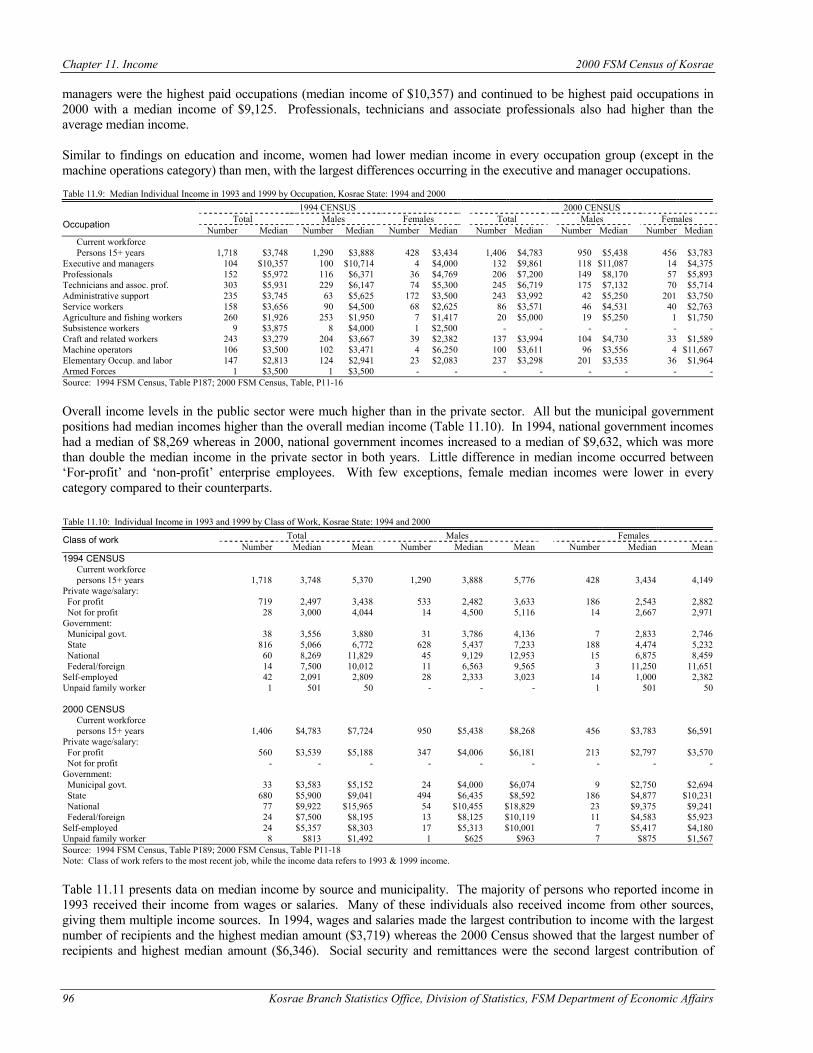
Chapter 11. Income 2000 FSM Census of Kosrae
96 Kosrae Branch Statistics Office, Division of Statistics, FSM Department of Economic Affairs
managers were the highest paid occupations (median income of $10,357) and continued to be highest paid occupations in 2000 with a median income of $9,125. Professionals, technicians and associate professionals also had higher than the average median income. Similar to findings on education and income, women had lower median income in every occupation group (except in the machine operations category) than men, with the largest differences occurring in the executive and manager occupations. Table 11.9: Median Individual Income in 1993 and 1999 by Occupation, Kosrae State: 1994 and 2000 1994 CENSUS 2000 CENSUS
Total Males Females Total Males Females Occupation Number Median Number Median Number Median Number Median Number Median Number Median Current workforce Persons 15+ years 1,718 $3,748 1,290 $3,888 428 $3,434 1,406 $4,783 950 $5,438 456 $3,783 Executive and managers 104 $10,357 100 $10,714 4 $4,000 132 $9,861 118 $11,087 14 $4,375 Professionals 152 $5,972 116 $6,371 36 $4,769 206 $7,200 149 $8,170 57 $5,893 Technicians and assoc. prof. 303 $5,931 229 $6,147 74 $5,300 245 $6,719 175 $7,132 70 $5,714 Administrative support 235 $3,745 63 $5,625 172 $3,500 243 $3,992 42 $5,250 201 $3,750 Service workers 158 $3,656 90 $4,500 68 $2,625 86 $3,571 46 $4,531 40 $2,763 Agriculture and fishing workers 260 $1,926 253 $1,950 7 $1,417 20 $5,000 19 $5,250 1 $1,750 Subsistence workers 9 $3,875 8 $4,000 1 $2,500 - - - - - - Craft and related workers 243 $3,279 204 $3,667 39 $2,382 137 $3,994 104 $4,730 33 $1,589 Machine operators 106 $3,500 102 $3,471 4 $6,250 100 $3,611 96 $3,556 4 $11,667 Elementary Occup. and labor 147 $2,813 124 $2,941 23 $2,083 237 $3,298 201 $3,535 36 $1,964 Armed Forces 1 $3,500 1 $3,500 - - - - - - - - Source: 1994 FSM Census, Table P187; 2000 FSM Census, Table, P11-16 Overall income levels in the public sector were much higher than in the private sector. All but the municipal government positions had median incomes higher than the overall median income (Table 11.10). In 1994, national government incomes had a median of $8,269 whereas in 2000, national government incomes increased to a median of $9,632, which was more than double the median income in the private sector in both years. Little difference in median income occurred between ‘For-profit’ and ‘non-profit’ enterprise employees. With few exceptions, female median incomes were lower in every category compared to their counterparts. Table 11.10: Individual Income in 1993 and 1999 by Class of Work, Kosrae State: 1994 and 2000
Total Males Females Class of work Number Median Mean Number Median Mean Number Median Mean
1994 CENSUS Current workforce persons 15+ years 1,718 3,748 5,370 1,290 3,888 5,776 428 3,434 4,149 Private wage/salary: For profit 719 2,497 3,438 533 2,482 3,633 186 2,543 2,882 Not for profit 28 3,000 4,044 14 4,500 5,116 14 2,667 2,971 Government: Municipal govt. 38 3,556 3,880 31 3,786 4,136 7 2,833 2,746 State 816 5,066 6,772 628 5,437 7,233 188 4,474 5,232 National 60 8,269 11,829 45 9,129 12,953 15 6,875 8,459 Federal/foreign 14 7,500 10,012 11 6,563 9,565 3 11,250 11,651 Self-employed 42 2,091 2,809 28 2,333 3,023 14 1,000 2,382 Unpaid family worker 1 501 50 - - - 1 501 50 2000 CENSUS Current workforce persons 15+ years 1,406 $4,783 $7,724 950 $5,438 $8,268 456 $3,783 $6,591 Private wage/salary: For profit 560 $3,539 $5,188 347 $4,006 $6,181 213 $2,797 $3,570 Not for profit - - - - - - - - - Government: Municipal govt. 33 $3,583 $5,152 24 $4,000 $6,074 9 $2,750 $2,694 State 680 $5,900 $9,041 494 $6,435 $8,592 186 $4,877 $10,231 National 77 $9,922 $15,965 54 $10,455 $18,829 23 $9,375 $9,241 Federal/foreign 24 $7,500 $8,195 13 $8,125 $10,119 11 $4,583 $5,923 Self-employed 24 $5,357 $8,303 17 $5,313 $10,001 7 $5,417 $4,180 Unpaid family worker 8 $813 $1,492 1 $625 $963 7 $875 $1,567 Source: 1994 FSM Census, Table P189; 2000 FSM Census, Table P11-18 Note: Class of work refers to the most recent job, while the income data refers to 1993 & 1999 income. Table 11.11 presents data on median income by source and municipality. The majority of persons who reported income in 1993 received their income from wages or salaries. Many of these individuals also received income from other sources, giving them multiple income sources. In 1994, wages and salaries made the largest contribution to income with the largest number of recipients and the highest median amount ($3,719) whereas the 2000 Census showed that the largest number of recipients and highest median amount ($6,346). Social security and remittances were the second largest contribution of
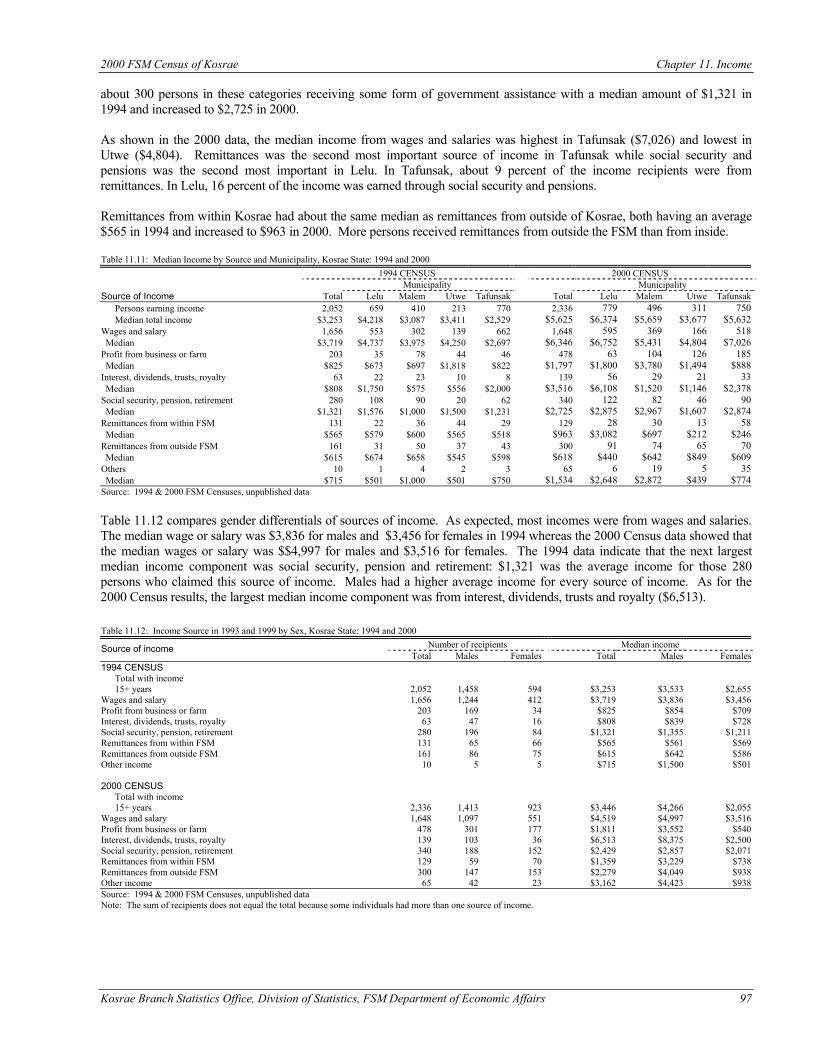
2000 FSM Census of Kosrae Chapter 11. Income
Kosrae Branch Statistics Office, Division of Statistics, FSM Department of Economic Affairs 97
about 300 persons in these categories receiving some form of government assistance with a median amount of $1,321 in 1994 and increased to $2,725 in 2000. As shown in the 2000 data, the median income from wages and salaries was highest in Tafunsak ($7,026) and lowest in Utwe ($4,804). Remittances was the second most important source of income in Tafunsak while social security and pensions was the second most important in Lelu. In Tafunsak, about 9 percent of the income recipients were from remittances. In Lelu, 16 percent of the income was earned through social security and pensions. Remittances from within Kosrae had about the same median as remittances from outside of Kosrae, both having an average $565 in 1994 and increased to $963 in 2000. More persons received remittances from outside the FSM than from inside. Table 11.11: Median Income by Source and Municipality, Kosrae State: 1994 and 2000 1994 CENSUS 2000 CENSUS Municipality Municipality Source of Income Total Lelu Malem Utwe Tafunsak Total Lelu Malem Utwe Tafunsak Persons earning income 2,052 659 410 213 770 2,336 779 496 311 750 Median total income $3,253 $4,218 $3,087 $3,411 $2,529 $5,625 $6,374 $5,659 $3,677 $5,632 Wages and salary 1,656 553 302 139 662 1,648 595 369 166 518 Median $3,719 $4,737 $3,975 $4,250 $2,697 $6,346 $6,752 $5,431 $4,804 $7,026 Profit from business or farm 203 35 78 44 46 478 63 104 126 185 Median $825 $673 $697 $1,818 $822 $1,797 $1,800 $3,780 $1,494 $888 Interest, dividends, trusts, royalty 63 22 23 10 8 139 56 29 21 33 Median $808 $1,750 $575 $556 $2,000 $3,516 $6,108 $1,520 $1,146 $2,378 Social security, pension, retirement 280 108 90 20 62 340 122 82 46 90 Median $1,321 $1,576 $1,000 $1,500 $1,231 $2,725 $2,875 $2,967 $1,607 $2,874 Remittances from within FSM 131 22 36 44 29 129 28 30 13 58 Median $565 $579 $600 $565 $518 $963 $3,082 $697 $212 $246 Remittances from outside FSM 161 31 50 37 43 300 91 74 65 70 Median $615 $674 $658 $545 $598 $618 $440 $642 $849 $609 Others 10 1 4 2 3 65 6 19 5 35 Median $715 $501 $1,000 $501 $750 $1,534 $2,648 $2,872 $439 $774 Source: 1994 & 2000 FSM Censuses, unpublished data Table 11.12 compares gender differentials of sources of income. As expected, most incomes were from wages and salaries. The median wage or salary was $3,836 for males and $3,456 for females in 1994 whereas the 2000 Census data showed that the median wages or salary was $$4,997 for males and $3,516 for females. The 1994 data indicate that the next largest median income component was social security, pension and retirement: $1,321 was the average income for those 280 persons who claimed this source of income. Males had a higher average income for every source of income. As for the 2000 Census results, the largest median income component was from interest, dividends, trusts and royalty ($6,513). Table 11.12: Income Source in 1993 and 1999 by Sex, Kosrae State: 1994 and 2000
Number of recipients Median income Source of income Total Males Females Total Males Females
1994 CENSUS Total with income 15+ years 2,052 1,458 594 $3,253 $3,533 $2,655 Wages and salary 1,656 1,244 412 $3,719 $3,836 $3,456 Profit from business or farm 203 169 34 $825 $854 $709 Interest, dividends, trusts, royalty 63 47 16 $808 $839 $728 Social security, pension, retirement 280 196 84 $1,321 $1,355 $1,211 Remittances from within FSM 131 65 66 $565 $561 $569 Remittances from outside FSM 161 86 75 $615 $642 $586 Other income 10 5 5 $715 $1,500 $501 2000 CENSUS Total with income 15+ years 2,336 1,413 923 $3,446 $4,266 $2,055 Wages and salary 1,648 1,097 551 $4,519 $4,997 $3,516 Profit from business or farm 478 301 177 $1,811 $3,552 $540 Interest, dividends, trusts, royalty 139 103 36 $6,513 $8,375 $2,500 Social security, pension, retirement 340 188 152 $2,429 $2,857 $2,071 Remittances from within FSM 129 59 70 $1,359 $3,229 $738 Remittances from outside FSM 300 147 153 $2,279 $4,049 $938 Other income 65 42 23 $3,162 $4,423 $938 Source: 1994 & 2000 FSM Censuses, unpublished data Note: The sum of recipients does not equal the total because some individuals had more than one source of income.
Chapter 11. Income 2000 FSM Census of Kosrae
98 Kosrae Branch Statistics Office, Division of Statistics, FSM Department of Economic Affairs
Conclusions The median income for individuals in Kosrae was $3,253 in 1993, and median household income was $6,739, an increase of approximately 20 percent since 1980 (after adjusting for inflation). The 2000 Census data showed that median income for individuals in Kosrae was $3,446, and median household income was $7, 528. Higher educated persons had higher incomes, government employees had higher incomes than private sector employees, and two-parent families did had higher incomes than female-headed families, and males had higher incomes than females. A majority of this income came from wages and salaries while remittances and profit from businesses and farms also contributed. As Kosrae becomes more reliant on the cash economy for well being instead of subsistence, income levels become a measuring stick for the quality of life and the distribution of resources.
Kosrae Branch Statistics Office, Division of Statistics, FSM Department of Economic Affairs 99
CHAPTER 12 HOUSING CHARACTERISTICS
Introduction The information about housing characteristics in the State of Kosrae, have been organized in this chapter into four major sections: (1) general housing characteristics, (2) structural characteristics, (3) utilities, and (4) equipment. Some tables in this chapter include data from the 1980 census to examine the change in housing in the Kosrae over time. The date presented in this chapter includes the total and different types of housing units found in the 2000 Census. The 2000 Census questionnaire contains the similar set of Census questionnaires used in the 1994 FSM Census, so the comparison of housing data for these two years was consistent. Data Description General Housing Characteristics A housing unit is a house, apartment, group of rooms, or single room occupied as separate living quarters or, if vacant, intended for occupancy as separate living quarters. Separate living quarters are those in which the occupants live and eat apart from other persons in the building and which have direct access from outside the building or through a common hall. Housing units built not for household occupancy but for group of unrelated persons were defined as group quarter. Group quarters include institutionalized and non-institutionalized quarters such as prisons/local jails, hospitals, school/college dormitories, etc. This chapter deals exclusively with housing units. The 2000 FSM Census included both occupied and vacant housing units as part of the housing inventory. Recreational boats, tents, etc were also included in the questionnaire to enumerate people using them, as they’re usual residences. The census classified a housing unit as occupied if it was the usual residence of the person or group of persons inhabiting it at the time of enumeration or if the occupants were only temporarily absent. A vacant housing unit was one, which contained no residents at the time of enumeration, unless its occupants were only temporarily absent. The census also considered vacant units that were temporarily occupied at the time of enumeration by persons who usually resided elsewhere. A new unit not yet occupied was classified as vacant if construction had reached the point where all exterior windows and doors, and final usable floors, were in place. The census did not consider unoccupied units open to the elements as vacant; these were excluded. Also excluded from vacant units were quarters used entirely for non-residential purposes, such as store, office, or storage facility. The 2000 Census distinguished between owner-occupied and renter-occupied housing units, a characteristic referred to as tenure. Questionnaire item H22, asked of all occupied housing units, dealt with tenure. The Census classified a housing unit as owner-occupied if the owner or co-owner resided in the unit on Census day, even if the unit was mortgaged or not fully paid for. The remaining occupied housing units were classified as renter-occupied, regardless of whether cash or some other means of payment was used. The Census recorded a housing unit as "rented for cash" if any money rent was paid or contracted for; this rent could come from individuals either living in the unit or elsewhere, or from an organization. Rental units classified under "occupied without payment of cash rent" generally were those provided free by friends or relatives, or in exchange for services such as those provided by a resident manager or tenant worker of on communal land. Questionnaire item H6 concerned the year a structure was built. Data on year of construction was collected for both occupied and vacant housing units. Data on the year the structure was built referred to when the building was first constructed, not when it was remodeled, added to, or converted. Recently built structures that met the housing unit definition requirements (all exterior windows, doors, and final usable floors installed) were assigned to the "1999-2000" category. The 2000 Census obtained information on the number of housing units in a structure from questionnaire item H1, which it recorded for all housing units. A structure comprised a separate building that either had open space on all four sides or was separated from other structures by dividing walls that extended from ground to roof. The statistics presented in this report refer to the number of housing units in separate structures of specified type and size. The following categories applied: .One-unit, detached -- a single-unit structure detached from any other structure (except a shed or garage). A one-family
house, which contained a business, was considered detached as long as the building had open space on all four sides.
Chapter 12. Housing Characteristics 2000 FSM Census of Kosrae
100 Kosrae Branch Statistics Office, Division of Statistics, FSM Department of Economic Affairs
.One-unit, attached -- a one-unit structure, which had one or more walls extending from, ground to roof separating it from
adjoining structures. In double houses and houses attached to non-residential structures, each housing unit was an individual attached structure if the dividing or common wall extended from ground or roof.
.Two or more units -- housing units in structures containing two or more housing units, further categorized as units in
structures with 2, 3 or 4, 5 to 9, 10 to 19, 20 or more units. .Other -- housing unit that did not fit the previous categories, such as abandoned cars, campers, vans, and shacks. The 1994 and 2000 Censuses obtained information on the number of rooms per housing unit from questionnaire item H7, with resulting information recorded both for occupied and vacant housing units. The intent of this question was to count the number of whole rooms used for living purposes. For each unit, whole rooms included living rooms, dining rooms, kitchens, bedrooms, finished recreation rooms, enclosed porches suitable for year-round use, and lodger's rooms. Excluded were kitchenettes, bathrooms, open porches, balconies, halls for foyers, utility rooms, unfinished attics or basements, and other unfinished space used for storage. Data on bedrooms were obtained from questionnaire item H8, with resulting information recorded for both occupied and vacant housing units. The number of bedrooms refers to the count of rooms that were used as bedrooms and the number of rooms that one would count as bedrooms when listing a housing unit for sale or for rent. The 1994 and 2000 FSM Censuses included as bedrooms all rooms intended for use as bedrooms even if residents were using them for some other purpose on Census Day. Housing units comprising a single room, such as an efficiency apartment, by definition were classified as having no bedroom. Data on material used for the outside walls of housing units were obtained from questionnaire item H3, for both occupied and vacant housing units. The census classified each unit according to the type of material used most in the construction of its outside walls and included as separate categories "Poured concrete", "Concrete blocks", "Metal/Tin", "Plywood", "Thatch", "Local wood or bamboo", "Other", and "No walls". The census collected data on the material used for the roofs of housing units with questionnaire item H4; the results recorded both for occupied and vacant housing units. The census classified each housing unit according to the type of material used most in the construction of its roof. The material categories employed were "Poured concrete", "Metal/Tin", "Wood", "Thatch", "Bamboo", and "Other". The 1994 and 2000 Censuses collected data on type of material used for the foundation of housing units with questionnaire item H5, both for occupied and vacant housing units. Census personnel classified each housing unit according to the type of material used most in its foundation. The categories employed were "Concrete", "Wood pier or piling", "Coral", "Stone", and "Other" for those other than the first four categories. Utilities The 1994 and 2000 Censuses collected data on electric power with questionnaire items H10, recorded for both occupied and vacant housing units. Even if the power had been shut off for some reasons, the census considered the unit to have electric power. The Census data on source of water were obtained from questionnaire item H15, also recorded for occupied and vacant housing units. Categories 1 to 9 on question H15 dealt with the sources of drinking water to the household. .A public (government) system only -- referred to when running water comes through water pipes from any common source
supplying 5 or more houses or apartments and it was the only source of water for the entire household or apartment.
.A community water system only -- referred to when running water came through water pipes supplied by a village or
community water system or obtained from a well that was maintained by the community. .A public and catchments -- referred to when running water came from a public system and there was also catchment in
which rainwater was collected.
2000 FSM Census of Kosrae Chapter 12. Housing Characteristics
Kosrae Branch Statistics Office, Division of Statistics, FSM Department of Economic Affairs 101
.An individual well -- referred to when the water came from a well on the property or on neighboring property serving fewer than 5 houses or apartments. Well water hand drawn, wind drawn, or engine drawn whether piped or not piped and stored in tanks or used directly from the well were included.
.A catchments, tanks, or drums only -- referred to when the source of water was a catchments, tanks, or drums in which
rainwater was collected. Such sources usually serve only one structure. .A public standpipe or street hydrant -- referred to when there was an elevated tank or vertical storage cylinder connected to a
public system from which nearby residents draw water. .Purchased bottled water -- referred to when the household depended only on water purchased from businesses. .Some other sources such as a spring, river, creek, etc. -- referred to other sources being used by the household as the main
source of drinking water. Data on "Piped water" were obtained from questionnaire items H9a to H9d, recorded for both occupied and vacant housing units. Piped water signified a housing unit where water was available at a sink, washbasin, bathtub, or shower. The piped water may have been located within a housing unit, in a hallway associated with the unit, or in a room used by several other households in the building containing the unit (even if occupants had to go outdoors to reach that part of the building). If both hot and cold water were available, the census recorded the type of energy used by the water heater: "electricity", "gas", "solar power", or "other fuels". Data on sewage disposal were obtained from questionnaire item H16, recorded both for occupied and vacant housing units. Housing units were classified as connected to a "public sewer", or a "septic tank or cesspool", or disposing of sewage by "other means". In the State of Kosrae, a public sewer system may be operated by a government or semi-government body or by a private organization where sewer pipes were connected to a processing plant. The septic tank or cesspool is an underground tank or pit for sewage disposal and limited to one or two toilets. The "other" category included housing units, which disposed of sewage in any manner not covered by the other specific categories. Equipment The 2000 Census obtained information on plumbing facilities from questionnaire items H9a, H9c, and H9d for occupied and vacant housing units. Following the 1980 U.S. Census in the territories, a unit was considered to have complete plumbing facilities when it had piped water, a flush toilet, and a bathtub or shower, regardless of whether these facilities were located in the unit being enumerated or inside the building which contained that unit. Data on sinks with piped water were obtained from questionnaire item H17e, recorded for both occupied and vacant housing units. For classification as a housing unit possessing a sink with piped water, such a sink had to be in the unit itself or inside the building containing the housing unit enumerated. Questionnaire item H9d addressed the type of toilet facilities both in occupied and vacant housing units. A flush toilet consisted of any toilet connected to piped water and emptying into a public sewer, septic tank or cesspool. If the unit did not have a flush toilet, the toilet could be an outhouse, privy, or banjo; otherwise, the last category, "Other", was used. The 1994 and 2000 FSM Censuses collected data on bathtub and shower with questionnaire item H9c both for occupied and vacant housing units. A bathtub or shower was counted only if connected permanently to piped running water, thus excluding equipment such as portable bathtubs. Questionnaire items H17a and H17b concerned cooking facilities and were asked at both occupied and vacant housing units. Main cooking facilities were those that were used most often for the preparation of meals, located either outside or inside the housing unit enumerated or in the building containing that housing unit. A housing unit with "No cooking facilities" comprised a unit with no cooking facilities available inside or outside the building. Questionnaire items H18 and H19 asked for the number of vehicles used for land transportation as well as boats used by the household for water transportation. Finally, the Census collected data on household appliances such as refrigerator, deep freezer, air-conditioning, television and VCR, telephone or CB radio, and any other battery operated radio.
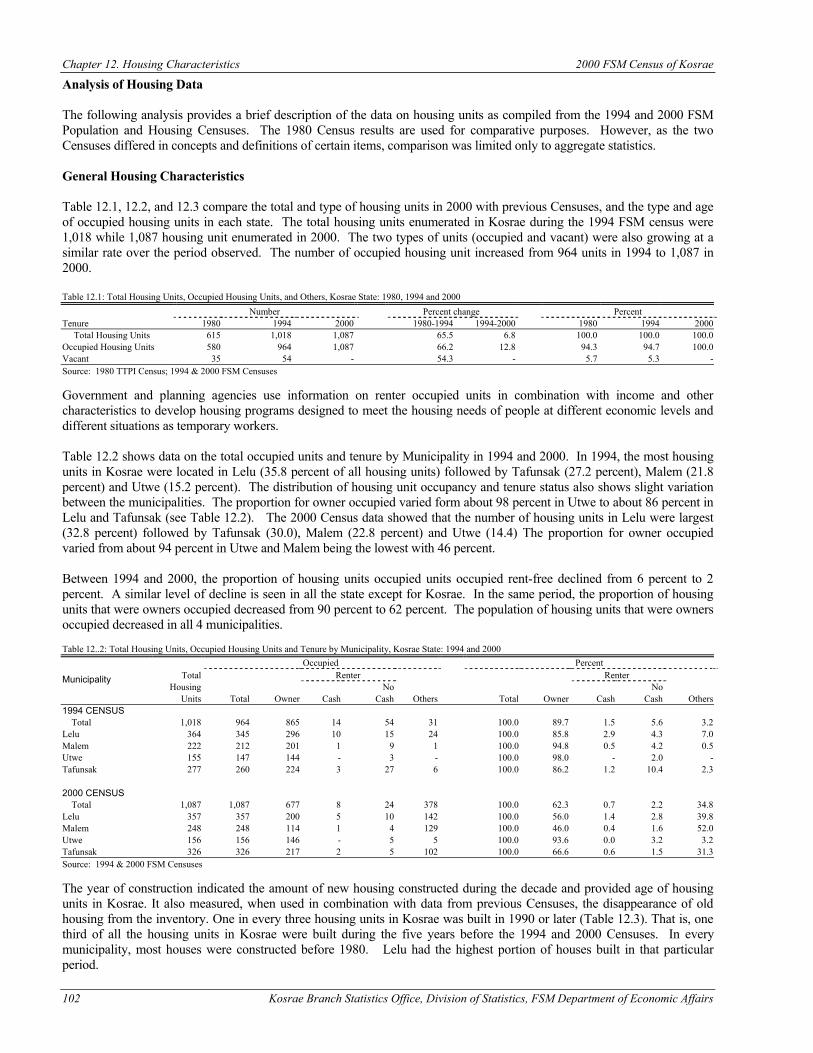
Chapter 12. Housing Characteristics 2000 FSM Census of Kosrae
102 Kosrae Branch Statistics Office, Division of Statistics, FSM Department of Economic Affairs
Analysis of Housing Data The following analysis provides a brief description of the data on housing units as compiled from the 1994 and 2000 FSM Population and Housing Censuses. The 1980 Census results are used for comparative purposes. However, as the two Censuses differed in concepts and definitions of certain items, comparison was limited only to aggregate statistics. General Housing Characteristics Table 12.1, 12.2, and 12.3 compare the total and type of housing units in 2000 with previous Censuses, and the type and age of occupied housing units in each state. The total housing units enumerated in Kosrae during the 1994 FSM census were 1,018 while 1,087 housing unit enumerated in 2000. The two types of units (occupied and vacant) were also growing at a similar rate over the period observed. The number of occupied housing unit increased from 964 units in 1994 to 1,087 in 2000. Table 12.1: Total Housing Units, Occupied Housing Units, and Others, Kosrae State: 1980, 1994 and 2000 Number Percent change Percent Tenure 1980 1994 2000 1980-1994 1994-2000 1980 1994 2000 Total Housing Units 615 1,018 1,087 65.5 6.8 100.0 100.0 100.0 Occupied Housing Units 580 964 1,087 66.2 12.8 94.3 94.7 100.0 Vacant 35 54 - 54.3 - 5.7 5.3 - Source: 1980 TTPI Census; 1994 & 2000 FSM Censuses Government and planning agencies use information on renter occupied units in combination with income and other characteristics to develop housing programs designed to meet the housing needs of people at different economic levels and different situations as temporary workers. Table 12.2 shows data on the total occupied units and tenure by Municipality in 1994 and 2000. In 1994, the most housing units in Kosrae were located in Lelu (35.8 percent of all housing units) followed by Tafunsak (27.2 percent), Malem (21.8 percent) and Utwe (15.2 percent). The distribution of housing unit occupancy and tenure status also shows slight variation between the municipalities. The proportion for owner occupied varied form about 98 percent in Utwe to about 86 percent in Lelu and Tafunsak (see Table 12.2). The 2000 Census data showed that the number of housing units in Lelu were largest (32.8 percent) followed by Tafunsak (30.0), Malem (22.8 percent) and Utwe (14.4) The proportion for owner occupied varied from about 94 percent in Utwe and Malem being the lowest with 46 percent. Between 1994 and 2000, the proportion of housing units occupied units occupied rent-free declined from 6 percent to 2 percent. A similar level of decline is seen in all the state except for Kosrae. In the same period, the proportion of housing units that were owners occupied decreased from 90 percent to 62 percent. The population of housing units that were owners occupied decreased in all 4 municipalities. Table 12..2: Total Housing Units, Occupied Housing Units and Tenure by Municipality, Kosrae State: 1994 and 2000
Occupied Percent Total Renter Renter
Housing No No Municipality
Units Total Owner Cash Cash Others Total Owner Cash Cash Others 1994 CENSUS Total 1,018 964 865 14 54 31 100.0 89.7 1.5 5.6 3.2 Lelu 364 345 296 10 15 24 100.0 85.8 2.9 4.3 7.0 Malem 222 212 201 1 9 1 100.0 94.8 0.5 4.2 0.5 Utwe 155 147 144 - 3 - 100.0 98.0 - 2.0 - Tafunsak 277 260 224 3 27 6 100.0 86.2 1.2 10.4 2.3 2000 CENSUS Total 1,087 1,087 677 8 24 378 100.0 62.3 0.7 2.2 34.8 Lelu 357 357 200 5 10 142 100.0 56.0 1.4 2.8 39.8 Malem 248 248 114 1 4 129 100.0 46.0 0.4 1.6 52.0 Utwe 156 156 146 - 5 5 100.0 93.6 0.0 3.2 3.2 Tafunsak 326 326 217 2 5 102 100.0 66.6 0.6 1.5 31.3 Source: 1994 & 2000 FSM Censuses The year of construction indicated the amount of new housing constructed during the decade and provided age of housing units in Kosrae. It also measured, when used in combination with data from previous Censuses, the disappearance of old housing from the inventory. One in every three housing units in Kosrae was built in 1990 or later (Table 12.3). That is, one third of all the housing units in Kosrae were built during the five years before the 1994 and 2000 Censuses. In every municipality, most houses were constructed before 1980. Lelu had the highest portion of houses built in that particular period.
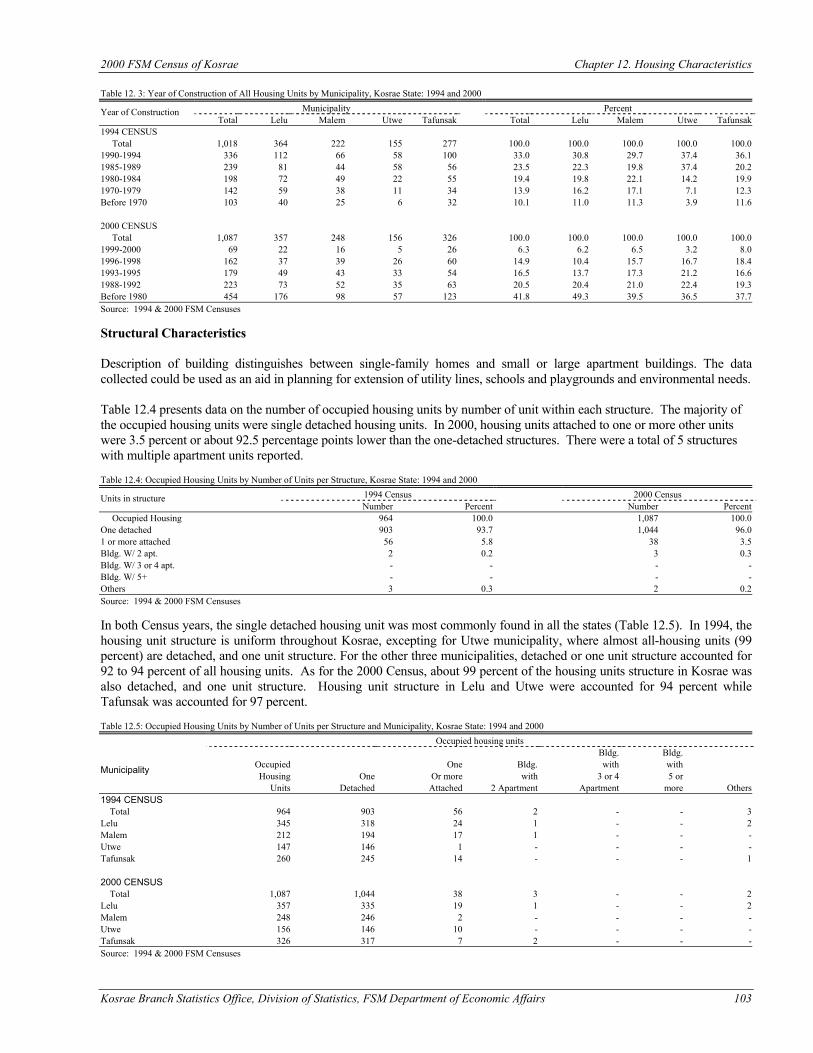
2000 FSM Census of Kosrae Chapter 12. Housing Characteristics
Kosrae Branch Statistics Office, Division of Statistics, FSM Department of Economic Affairs 103
Table 12. 3: Year of Construction of All Housing Units by Municipality, Kosrae State: 1994 and 2000
Municipality Percent Year of Construction Total Lelu Malem Utwe Tafunsak Total Lelu Malem Utwe Tafunsak
1994 CENSUS Total 1,018 364 222 155 277 100.0 100.0 100.0 100.0 100.0 1990-1994 336 112 66 58 100 33.0 30.8 29.7 37.4 36.1 1985-1989 239 81 44 58 56 23.5 22.3 19.8 37.4 20.2 1980-1984 198 72 49 22 55 19.4 19.8 22.1 14.2 19.9 1970-1979 142 59 38 11 34 13.9 16.2 17.1 7.1 12.3 Before 1970 103 40 25 6 32 10.1 11.0 11.3 3.9 11.6 2000 CENSUS Total 1,087 357 248 156 326 100.0 100.0 100.0 100.0 100.0 1999-2000 69 22 16 5 26 6.3 6.2 6.5 3.2 8.0 1996-1998 162 37 39 26 60 14.9 10.4 15.7 16.7 18.4 1993-1995 179 49 43 33 54 16.5 13.7 17.3 21.2 16.6 1988-1992 223 73 52 35 63 20.5 20.4 21.0 22.4 19.3 Before 1980 454 176 98 57 123 41.8 49.3 39.5 36.5 37.7 Source: 1994 & 2000 FSM Censuses Structural Characteristics Description of building distinguishes between single-family homes and small or large apartment buildings. The data collected could be used as an aid in planning for extension of utility lines, schools and playgrounds and environmental needs. Table 12.4 presents data on the number of occupied housing units by number of unit within each structure. The majority of the occupied housing units were single detached housing units. In 2000, housing units attached to one or more other units were 3.5 percent or about 92.5 percentage points lower than the one-detached structures. There were a total of 5 structures with multiple apartment units reported. Table 12.4: Occupied Housing Units by Number of Units per Structure, Kosrae State: 1994 and 2000
1994 Census 2000 Census Units in structure Number Percent Number Percent
Occupied Housing 964 100.0 1,087 100.0 One detached 903 93.7 1,044 96.0 1 or more attached 56 5.8 38 3.5 Bldg. W/ 2 apt. 2 0.2 3 0.3 Bldg. W/ 3 or 4 apt. - - - - Bldg. W/ 5+ - - - - Others 3 0.3 2 0.2 Source: 1994 & 2000 FSM Censuses In both Census years, the single detached housing unit was most commonly found in all the states (Table 12.5). In 1994, the housing unit structure is uniform throughout Kosrae, excepting for Utwe municipality, where almost all-housing units (99 percent) are detached, and one unit structure. For the other three municipalities, detached or one unit structure accounted for 92 to 94 percent of all housing units. As for the 2000 Census, about 99 percent of the housing units structure in Kosrae was also detached, and one unit structure. Housing unit structure in Lelu and Utwe were accounted for 94 percent while Tafunsak was accounted for 97 percent. Table 12.5: Occupied Housing Units by Number of Units per Structure and Municipality, Kosrae State: 1994 and 2000 Occupied housing units
Bldg. Bldg. Occupied One Bldg. with with Housing One Or more with 3 or 4 5 or
Municipality
Units Detached Attached 2 Apartment Apartment more Others 1994 CENSUS Total 964 903 56 2 - - 3 Lelu 345 318 24 1 - - 2 Malem 212 194 17 1 - - - Utwe 147 146 1 - - - - Tafunsak 260 245 14 - - - 1 2000 CENSUS Total 1,087 1,044 38 3 - - 2 Lelu 357 335 19 1 - - 2 Malem 248 246 2 - - - - Utwe 156 146 10 - - - - Tafunsak 326 317 7 2 - - - Source: 1994 & 2000 FSM Censuses
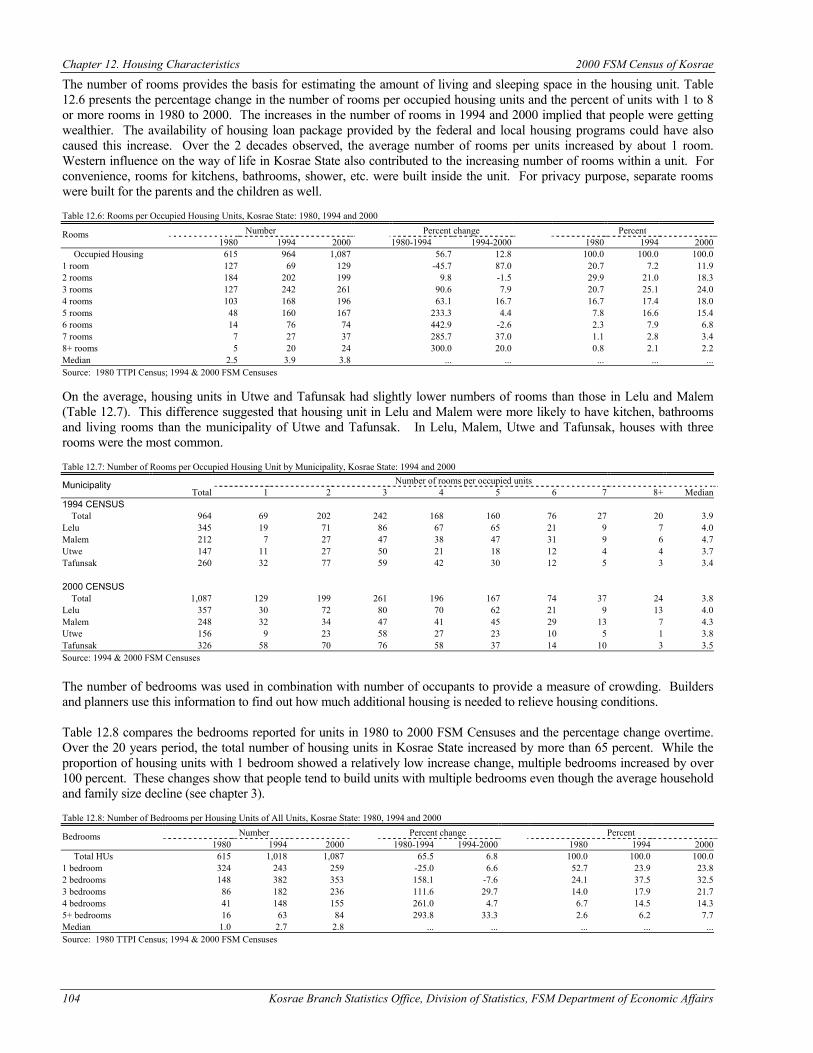
Chapter 12. Housing Characteristics 2000 FSM Census of Kosrae
104 Kosrae Branch Statistics Office, Division of Statistics, FSM Department of Economic Affairs
The number of rooms provides the basis for estimating the amount of living and sleeping space in the housing unit. Table 12.6 presents the percentage change in the number of rooms per occupied housing units and the percent of units with 1 to 8 or more rooms in 1980 to 2000. The increases in the number of rooms in 1994 and 2000 implied that people were getting wealthier. The availability of housing loan package provided by the federal and local housing programs could have also caused this increase. Over the 2 decades observed, the average number of rooms per units increased by about 1 room. Western influence on the way of life in Kosrae State also contributed to the increasing number of rooms within a unit. For convenience, rooms for kitchens, bathrooms, shower, etc. were built inside the unit. For privacy purpose, separate rooms were built for the parents and the children as well. Table 12.6: Rooms per Occupied Housing Units, Kosrae State: 1980, 1994 and 2000
Number Percent change Percent Rooms 1980 1994 2000 1980-1994 1994-2000 1980 1994 2000
Occupied Housing 615 964 1,087 56.7 12.8 100.0 100.0 100.0 1 room 127 69 129 -45.7 87.0 20.7 7.2 11.9 2 rooms 184 202 199 9.8 -1.5 29.9 21.0 18.3 3 rooms 127 242 261 90.6 7.9 20.7 25.1 24.0 4 rooms 103 168 196 63.1 16.7 16.7 17.4 18.0 5 rooms 48 160 167 233.3 4.4 7.8 16.6 15.4 6 rooms 14 76 74 442.9 -2.6 2.3 7.9 6.8 7 rooms 7 27 37 285.7 37.0 1.1 2.8 3.4 8+ rooms 5 20 24 300.0 20.0 0.8 2.1 2.2 Median 2.5 3.9 3.8 ... ... ... ... ... Source: 1980 TTPI Census; 1994 & 2000 FSM Censuses On the average, housing units in Utwe and Tafunsak had slightly lower numbers of rooms than those in Lelu and Malem (Table 12.7). This difference suggested that housing unit in Lelu and Malem were more likely to have kitchen, bathrooms and living rooms than the municipality of Utwe and Tafunsak. In Lelu, Malem, Utwe and Tafunsak, houses with three rooms were the most common. Table 12.7: Number of Rooms per Occupied Housing Unit by Municipality, Kosrae State: 1994 and 2000
Number of rooms per occupied units Municipality Total 1 2 3 4 5 6 7 8+ Median
1994 CENSUS Total 964 69 202 242 168 160 76 27 20 3.9 Lelu 345 19 71 86 67 65 21 9 7 4.0 Malem 212 7 27 47 38 47 31 9 6 4.7 Utwe 147 11 27 50 21 18 12 4 4 3.7 Tafunsak 260 32 77 59 42 30 12 5 3 3.4 2000 CENSUS Total 1,087 129 199 261 196 167 74 37 24 3.8 Lelu 357 30 72 80 70 62 21 9 13 4.0 Malem 248 32 34 47 41 45 29 13 7 4.3 Utwe 156 9 23 58 27 23 10 5 1 3.8 Tafunsak 326 58 70 76 58 37 14 10 3 3.5 Source: 1994 & 2000 FSM Censuses The number of bedrooms was used in combination with number of occupants to provide a measure of crowding. Builders and planners use this information to find out how much additional housing is needed to relieve housing conditions. Table 12.8 compares the bedrooms reported for units in 1980 to 2000 FSM Censuses and the percentage change overtime. Over the 20 years period, the total number of housing units in Kosrae State increased by more than 65 percent. While the proportion of housing units with 1 bedroom showed a relatively low increase change, multiple bedrooms increased by over 100 percent. These changes show that people tend to build units with multiple bedrooms even though the average household and family size decline (see chapter 3). Table 12.8: Number of Bedrooms per Housing Units of All Units, Kosrae State: 1980, 1994 and 2000
Number Percent change Percent Bedrooms 1980 1994 2000 1980-1994 1994-2000 1980 1994 2000
Total HUs 615 1,018 1,087 65.5 6.8 100.0 100.0 100.0 1 bedroom 324 243 259 -25.0 6.6 52.7 23.9 23.8 2 bedrooms 148 382 353 158.1 -7.6 24.1 37.5 32.5 3 bedrooms 86 182 236 111.6 29.7 14.0 17.9 21.7 4 bedrooms 41 148 155 261.0 4.7 6.7 14.5 14.3 5+ bedrooms 16 63 84 293.8 33.3 2.6 6.2 7.7 Median 1.0 2.7 2.8 ... ... ... ... ... Source: 1980 TTPI Census; 1994 & 2000 FSM Censuses
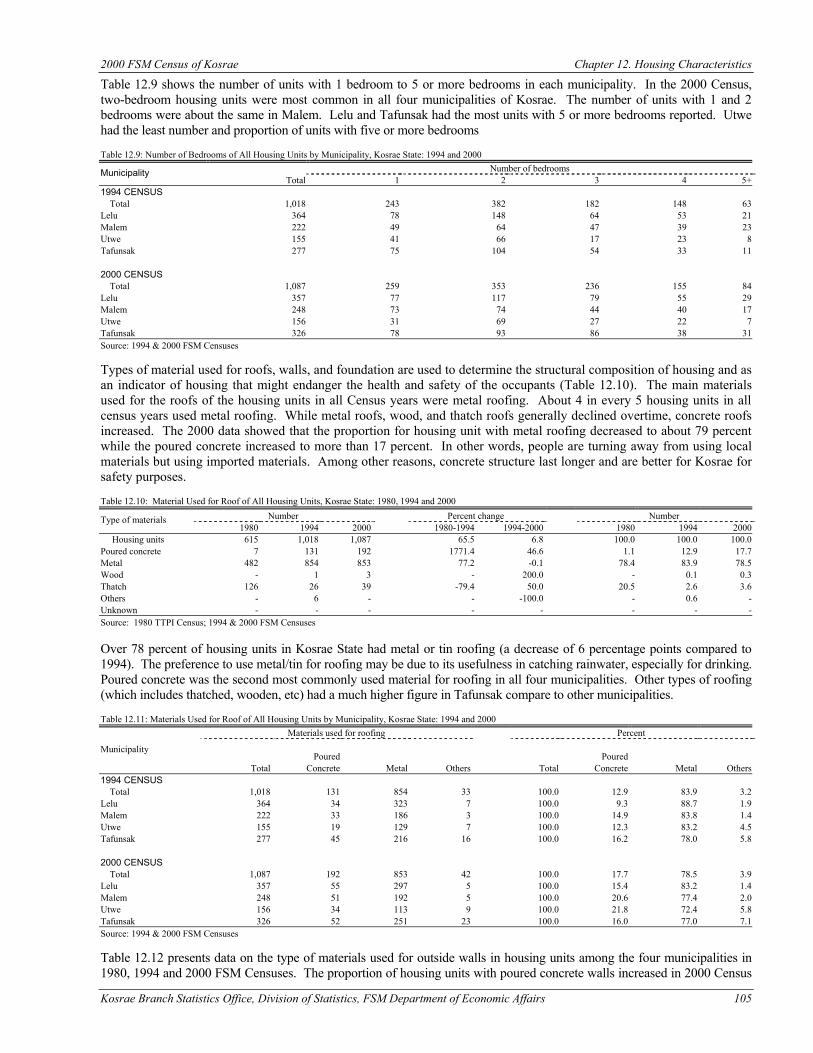
2000 FSM Census of Kosrae Chapter 12. Housing Characteristics
Kosrae Branch Statistics Office, Division of Statistics, FSM Department of Economic Affairs 105
Table 12.9 shows the number of units with 1 bedroom to 5 or more bedrooms in each municipality. In the 2000 Census, two-bedroom housing units were most common in all four municipalities of Kosrae. The number of units with 1 and 2 bedrooms were about the same in Malem. Lelu and Tafunsak had the most units with 5 or more bedrooms reported. Utwe had the least number and proportion of units with five or more bedrooms Table 12.9: Number of Bedrooms of All Housing Units by Municipality, Kosrae State: 1994 and 2000
Number of bedrooms Municipality Total 1 2 3 4 5+
1994 CENSUS Total 1,018 243 382 182 148 63 Lelu 364 78 148 64 53 21 Malem 222 49 64 47 39 23 Utwe 155 41 66 17 23 8 Tafunsak 277 75 104 54 33 11 2000 CENSUS Total 1,087 259 353 236 155 84 Lelu 357 77 117 79 55 29 Malem 248 73 74 44 40 17 Utwe 156 31 69 27 22 7 Tafunsak 326 78 93 86 38 31 Source: 1994 & 2000 FSM Censuses Types of material used for roofs, walls, and foundation are used to determine the structural composition of housing and as an indicator of housing that might endanger the health and safety of the occupants (Table 12.10). The main materials used for the roofs of the housing units in all Census years were metal roofing. About 4 in every 5 housing units in all census years used metal roofing. While metal roofs, wood, and thatch roofs generally declined overtime, concrete roofs increased. The 2000 data showed that the proportion for housing unit with metal roofing decreased to about 79 percent while the poured concrete increased to more than 17 percent. In other words, people are turning away from using local materials but using imported materials. Among other reasons, concrete structure last longer and are better for Kosrae for safety purposes. Table 12.10: Material Used for Roof of All Housing Units, Kosrae State: 1980, 1994 and 2000
Number Percent change Number Type of materials 1980 1994 2000 1980-1994 1994-2000 1980 1994 2000
Housing units 615 1,018 1,087 65.5 6.8 100.0 100.0 100.0 Poured concrete 7 131 192 1771.4 46.6 1.1 12.9 17.7 Metal 482 854 853 77.2 -0.1 78.4 83.9 78.5 Wood - 1 3 - 200.0 - 0.1 0.3 Thatch 126 26 39 -79.4 50.0 20.5 2.6 3.6 Others - 6 - - -100.0 - 0.6 - Unknown - - - - - - - - Source: 1980 TTPI Census; 1994 & 2000 FSM Censuses Over 78 percent of housing units in Kosrae State had metal or tin roofing (a decrease of 6 percentage points compared to 1994). The preference to use metal/tin for roofing may be due to its usefulness in catching rainwater, especially for drinking. Poured concrete was the second most commonly used material for roofing in all four municipalities. Other types of roofing (which includes thatched, wooden, etc) had a much higher figure in Tafunsak compare to other municipalities. Table 12.11: Materials Used for Roof of All Housing Units by Municipality, Kosrae State: 1994 and 2000
Materials used for roofing Percent Poured Poured
Municipality
Total Concrete Metal Others Total Concrete Metal Others 1994 CENSUS Total 1,018 131 854 33 100.0 12.9 83.9 3.2 Lelu 364 34 323 7 100.0 9.3 88.7 1.9 Malem 222 33 186 3 100.0 14.9 83.8 1.4 Utwe 155 19 129 7 100.0 12.3 83.2 4.5 Tafunsak 277 45 216 16 100.0 16.2 78.0 5.8 2000 CENSUS Total 1,087 192 853 42 100.0 17.7 78.5 3.9 Lelu 357 55 297 5 100.0 15.4 83.2 1.4 Malem 248 51 192 5 100.0 20.6 77.4 2.0 Utwe 156 34 113 9 100.0 21.8 72.4 5.8 Tafunsak 326 52 251 23 100.0 16.0 77.0 7.1 Source: 1994 & 2000 FSM Censuses Table 12.12 presents data on the type of materials used for outside walls in housing units among the four municipalities in 1980, 1994 and 2000 FSM Censuses. The proportion of housing units with poured concrete walls increased in 2000 Census
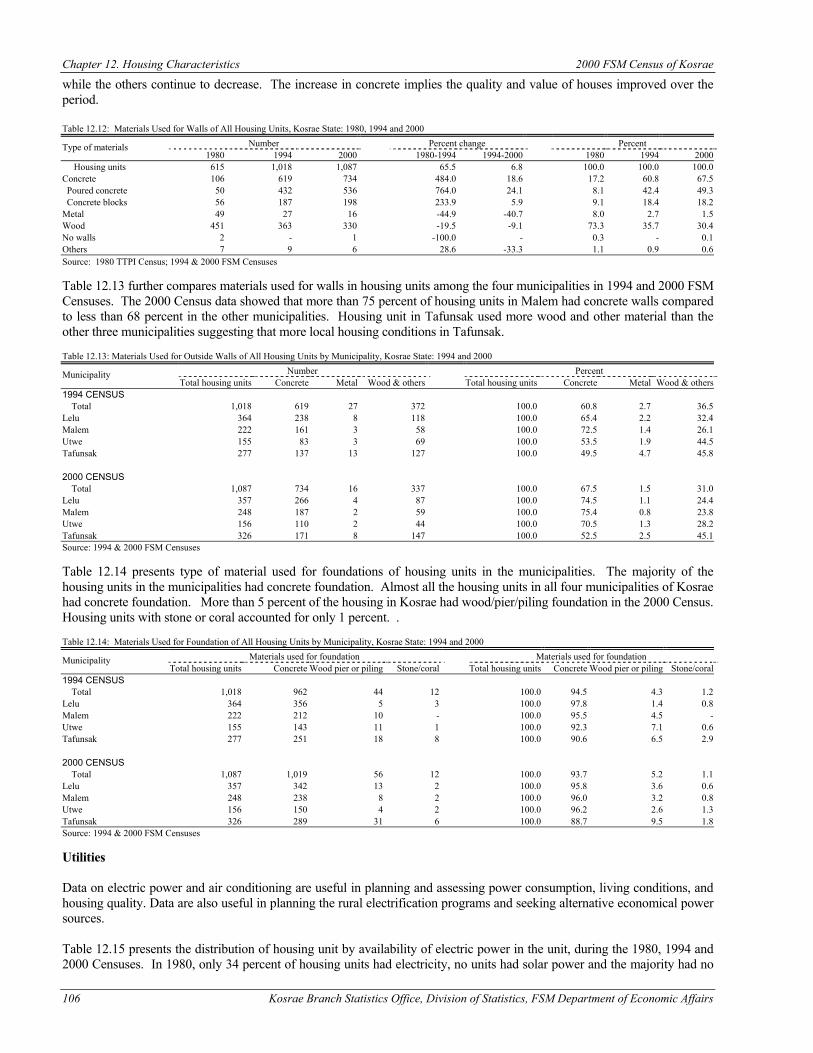
Chapter 12. Housing Characteristics 2000 FSM Census of Kosrae
106 Kosrae Branch Statistics Office, Division of Statistics, FSM Department of Economic Affairs
while the others continue to decrease. The increase in concrete implies the quality and value of houses improved over the period. Table 12.12: Materials Used for Walls of All Housing Units, Kosrae State: 1980, 1994 and 2000
Number Percent change Percent Type of materials 1980 1994 2000 1980-1994 1994-2000 1980 1994 2000
Housing units 615 1,018 1,087 65.5 6.8 100.0 100.0 100.0 Concrete 106 619 734 484.0 18.6 17.2 60.8 67.5 Poured concrete 50 432 536 764.0 24.1 8.1 42.4 49.3 Concrete blocks 56 187 198 233.9 5.9 9.1 18.4 18.2 Metal 49 27 16 -44.9 -40.7 8.0 2.7 1.5 Wood 451 363 330 -19.5 -9.1 73.3 35.7 30.4 No walls 2 - 1 -100.0 - 0.3 - 0.1 Others 7 9 6 28.6 -33.3 1.1 0.9 0.6 Source: 1980 TTPI Census; 1994 & 2000 FSM Censuses Table 12.13 further compares materials used for walls in housing units among the four municipalities in 1994 and 2000 FSM Censuses. The 2000 Census data showed that more than 75 percent of housing units in Malem had concrete walls compared to less than 68 percent in the other municipalities. Housing unit in Tafunsak used more wood and other material than the other three municipalities suggesting that more local housing conditions in Tafunsak. Table 12.13: Materials Used for Outside Walls of All Housing Units by Municipality, Kosrae State: 1994 and 2000
Number Percent Municipality Total housing units Concrete Metal Wood & others Total housing units Concrete Metal Wood & others
1994 CENSUS Total 1,018 619 27 372 100.0 60.8 2.7 36.5 Lelu 364 238 8 118 100.0 65.4 2.2 32.4 Malem 222 161 3 58 100.0 72.5 1.4 26.1 Utwe 155 83 3 69 100.0 53.5 1.9 44.5 Tafunsak 277 137 13 127 100.0 49.5 4.7 45.8 2000 CENSUS Total 1,087 734 16 337 100.0 67.5 1.5 31.0 Lelu 357 266 4 87 100.0 74.5 1.1 24.4 Malem 248 187 2 59 100.0 75.4 0.8 23.8 Utwe 156 110 2 44 100.0 70.5 1.3 28.2 Tafunsak 326 171 8 147 100.0 52.5 2.5 45.1 Source: 1994 & 2000 FSM Censuses Table 12.14 presents type of material used for foundations of housing units in the municipalities. The majority of the housing units in the municipalities had concrete foundation. Almost all the housing units in all four municipalities of Kosrae had concrete foundation. More than 5 percent of the housing in Kosrae had wood/pier/piling foundation in the 2000 Census. Housing units with stone or coral accounted for only 1 percent. . Table 12.14: Materials Used for Foundation of All Housing Units by Municipality, Kosrae State: 1994 and 2000
Materials used for foundation Materials used for foundation Municipality Total housing units Concrete Wood pier or piling Stone/coral Total housing units Concrete Wood pier or piling Stone/coral
1994 CENSUS Total 1,018 962 44 12 100.0 94.5 4.3 1.2 Lelu 364 356 5 3 100.0 97.8 1.4 0.8 Malem 222 212 10 - 100.0 95.5 4.5 - Utwe 155 143 11 1 100.0 92.3 7.1 0.6 Tafunsak 277 251 18 8 100.0 90.6 6.5 2.9 2000 CENSUS Total 1,087 1,019 56 12 100.0 93.7 5.2 1.1 Lelu 357 342 13 2 100.0 95.8 3.6 0.6 Malem 248 238 8 2 100.0 96.0 3.2 0.8 Utwe 156 150 4 2 100.0 96.2 2.6 1.3 Tafunsak 326 289 31 6 100.0 88.7 9.5 1.8 Source: 1994 & 2000 FSM Censuses Utilities Data on electric power and air conditioning are useful in planning and assessing power consumption, living conditions, and housing quality. Data are also useful in planning the rural electrification programs and seeking alternative economical power sources. Table 12.15 presents the distribution of housing unit by availability of electric power in the unit, during the 1980, 1994 and 2000 Censuses. In 1980, only 34 percent of housing units had electricity, no units had solar power and the majority had no
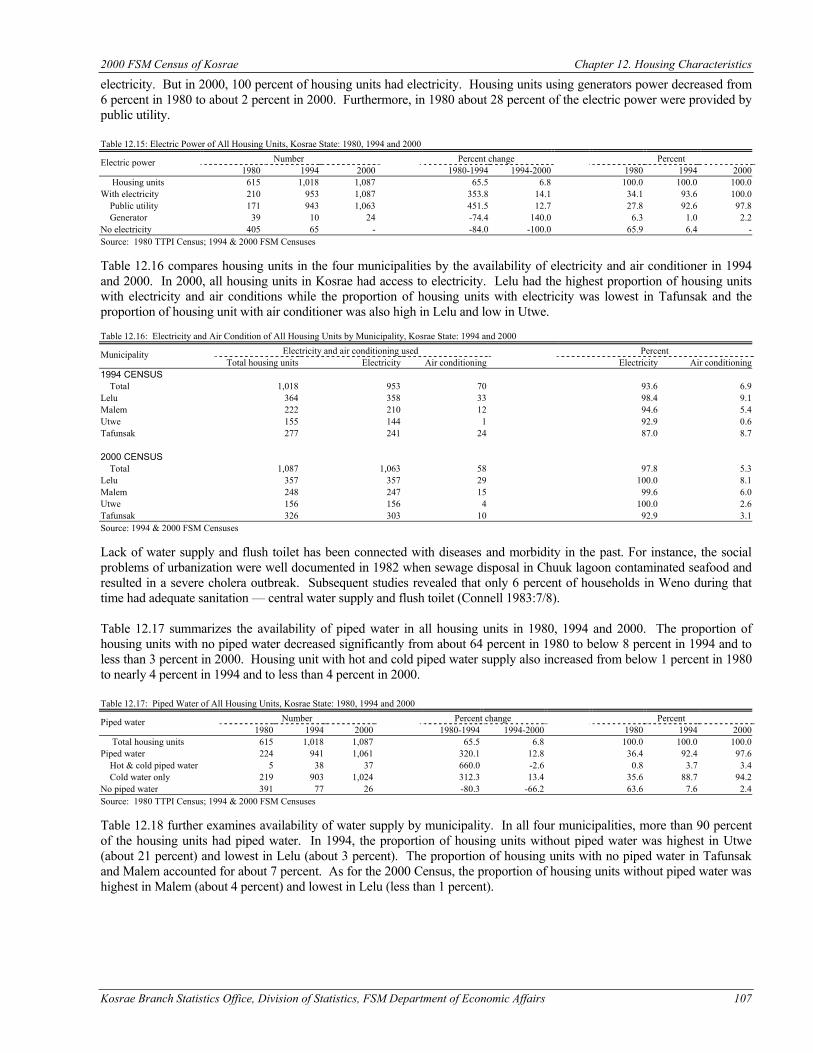
2000 FSM Census of Kosrae Chapter 12. Housing Characteristics
Kosrae Branch Statistics Office, Division of Statistics, FSM Department of Economic Affairs 107
electricity. But in 2000, 100 percent of housing units had electricity. Housing units using generators power decreased from 6 percent in 1980 to about 2 percent in 2000. Furthermore, in 1980 about 28 percent of the electric power were provided by public utility. Table 12.15: Electric Power of All Housing Units, Kosrae State: 1980, 1994 and 2000
Number Percent change Percent Electric power 1980 1994 2000 1980-1994 1994-2000 1980 1994 2000
Housing units 615 1,018 1,087 65.5 6.8 100.0 100.0 100.0 With electricity 210 953 1,087 353.8 14.1 34.1 93.6 100.0 Public utility 171 943 1,063 451.5 12.7 27.8 92.6 97.8 Generator 39 10 24 -74.4 140.0 6.3 1.0 2.2 No electricity 405 65 - -84.0 -100.0 65.9 6.4 - Source: 1980 TTPI Census; 1994 & 2000 FSM Censuses Table 12.16 compares housing units in the four municipalities by the availability of electricity and air conditioner in 1994 and 2000. In 2000, all housing units in Kosrae had access to electricity. Lelu had the highest proportion of housing units with electricity and air conditions while the proportion of housing units with electricity was lowest in Tafunsak and the proportion of housing unit with air conditioner was also high in Lelu and low in Utwe. Table 12.16: Electricity and Air Condition of All Housing Units by Municipality, Kosrae State: 1994 and 2000
Electricity and air conditioning used Percent Municipality Total housing units Electricity Air conditioning Electricity Air conditioning
1994 CENSUS Total 1,018 953 70 93.6 6.9 Lelu 364 358 33 98.4 9.1 Malem 222 210 12 94.6 5.4 Utwe 155 144 1 92.9 0.6 Tafunsak 277 241 24 87.0 8.7 2000 CENSUS Total 1,087 1,063 58 97.8 5.3 Lelu 357 357 29 100.0 8.1 Malem 248 247 15 99.6 6.0 Utwe 156 156 4 100.0 2.6 Tafunsak 326 303 10 92.9 3.1 Source: 1994 & 2000 FSM Censuses Lack of water supply and flush toilet has been connected with diseases and morbidity in the past. For instance, the social problems of urbanization were well documented in 1982 when sewage disposal in Chuuk lagoon contaminated seafood and resulted in a severe cholera outbreak. Subsequent studies revealed that only 6 percent of households in Weno during that time had adequate sanitation — central water supply and flush toilet (Connell 1983:7/8). Table 12.17 summarizes the availability of piped water in all housing units in 1980, 1994 and 2000. The proportion of housing units with no piped water decreased significantly from about 64 percent in 1980 to below 8 percent in 1994 and to less than 3 percent in 2000. Housing unit with hot and cold piped water supply also increased from below 1 percent in 1980 to nearly 4 percent in 1994 and to less than 4 percent in 2000. Table 12.17: Piped Water of All Housing Units, Kosrae State: 1980, 1994 and 2000
Number Percent change Percent Piped water 1980 1994 2000 1980-1994 1994-2000 1980 1994 2000
Total housing units 615 1,018 1,087 65.5 6.8 100.0 100.0 100.0 Piped water 224 941 1,061 320.1 12.8 36.4 92.4 97.6 Hot & cold piped water 5 38 37 660.0 -2.6 0.8 3.7 3.4 Cold water only 219 903 1,024 312.3 13.4 35.6 88.7 94.2 No piped water 391 77 26 -80.3 -66.2 63.6 7.6 2.4 Source: 1980 TTPI Census; 1994 & 2000 FSM Censuses Table 12.18 further examines availability of water supply by municipality. In all four municipalities, more than 90 percent of the housing units had piped water. In 1994, the proportion of housing units without piped water was highest in Utwe (about 21 percent) and lowest in Lelu (about 3 percent). The proportion of housing units with no piped water in Tafunsak and Malem accounted for about 7 percent. As for the 2000 Census, the proportion of housing units without piped water was highest in Malem (about 4 percent) and lowest in Lelu (less than 1 percent).
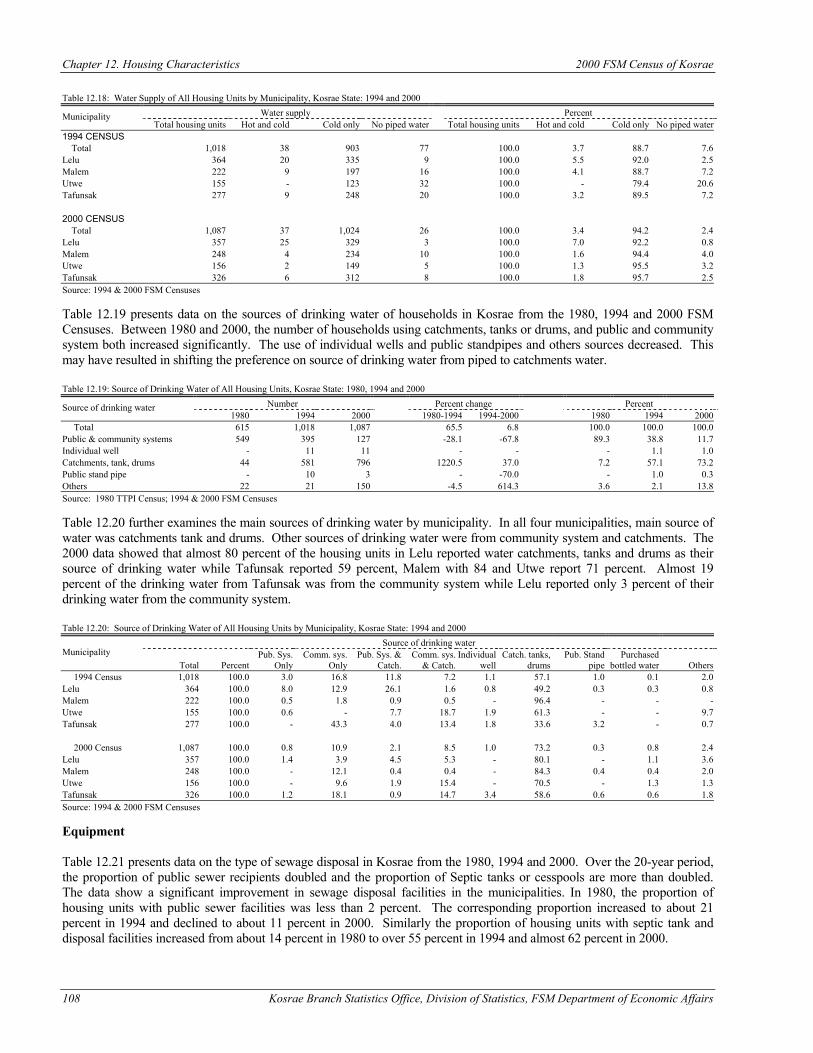
Chapter 12. Housing Characteristics 2000 FSM Census of Kosrae
108 Kosrae Branch Statistics Office, Division of Statistics, FSM Department of Economic Affairs
Table 12.18: Water Supply of All Housing Units by Municipality, Kosrae State: 1994 and 2000
Water supply Percent Municipality Total housing units Hot and cold Cold only No piped water Total housing units Hot and cold Cold only No piped water
1994 CENSUS Total 1,018 38 903 77 100.0 3.7 88.7 7.6 Lelu 364 20 335 9 100.0 5.5 92.0 2.5 Malem 222 9 197 16 100.0 4.1 88.7 7.2 Utwe 155 - 123 32 100.0 - 79.4 20.6 Tafunsak 277 9 248 20 100.0 3.2 89.5 7.2 2000 CENSUS Total 1,087 37 1,024 26 100.0 3.4 94.2 2.4 Lelu 357 25 329 3 100.0 7.0 92.2 0.8 Malem 248 4 234 10 100.0 1.6 94.4 4.0 Utwe 156 2 149 5 100.0 1.3 95.5 3.2 Tafunsak 326 6 312 8 100.0 1.8 95.7 2.5 Source: 1994 & 2000 FSM Censuses Table 12.19 presents data on the sources of drinking water of households in Kosrae from the 1980, 1994 and 2000 FSM Censuses. Between 1980 and 2000, the number of households using catchments, tanks or drums, and public and community system both increased significantly. The use of individual wells and public standpipes and others sources decreased. This may have resulted in shifting the preference on source of drinking water from piped to catchments water. Table 12.19: Source of Drinking Water of All Housing Units, Kosrae State: 1980, 1994 and 2000
Number Percent change Percent Source of drinking water 1980 1994 2000 1980-1994 1994-2000 1980 1994 2000
Total 615 1,018 1,087 65.5 6.8 100.0 100.0 100.0 Public & community systems 549 395 127 -28.1 -67.8 89.3 38.8 11.7 Individual well - 11 11 - - - 1.1 1.0 Catchments, tank, drums 44 581 796 1220.5 37.0 7.2 57.1 73.2 Public stand pipe - 10 3 - -70.0 - 1.0 0.3 Others 22 21 150 -4.5 614.3 3.6 2.1 13.8 Source: 1980 TTPI Census; 1994 & 2000 FSM Censuses Table 12.20 further examines the main sources of drinking water by municipality. In all four municipalities, main source of water was catchments tank and drums. Other sources of drinking water were from community system and catchments. The 2000 data showed that almost 80 percent of the housing units in Lelu reported water catchments, tanks and drums as their source of drinking water while Tafunsak reported 59 percent, Malem with 84 and Utwe report 71 percent. Almost 19 percent of the drinking water from Tafunsak was from the community system while Lelu reported only 3 percent of their drinking water from the community system. Table 12.20: Source of Drinking Water of All Housing Units by Municipality, Kosrae State: 1994 and 2000
Source of drinking water Municipality
Total Percent Pub. Sys.
Only Comm. sys.
Only Pub. Sys. &
Catch. Comm. sys.
& Catch. Individual
well Catch. tanks,
drums Pub. Stand
pipe Purchased
bottled water Others 1994 Census 1,018 100.0 3.0 16.8 11.8 7.2 1.1 57.1 1.0 0.1 2.0 Lelu 364 100.0 8.0 12.9 26.1 1.6 0.8 49.2 0.3 0.3 0.8 Malem 222 100.0 0.5 1.8 0.9 0.5 - 96.4 - - - Utwe 155 100.0 0.6 - 7.7 18.7 1.9 61.3 - - 9.7 Tafunsak 277 100.0 - 43.3 4.0 13.4 1.8 33.6 3.2 - 0.7 2000 Census 1,087 100.0 0.8 10.9 2.1 8.5 1.0 73.2 0.3 0.8 2.4 Lelu 357 100.0 1.4 3.9 4.5 5.3 - 80.1 - 1.1 3.6 Malem 248 100.0 - 12.1 0.4 0.4 - 84.3 0.4 0.4 2.0 Utwe 156 100.0 - 9.6 1.9 15.4 - 70.5 - 1.3 1.3 Tafunsak 326 100.0 1.2 18.1 0.9 14.7 3.4 58.6 0.6 0.6 1.8 Source: 1994 & 2000 FSM Censuses Equipment Table 12.21 presents data on the type of sewage disposal in Kosrae from the 1980, 1994 and 2000. Over the 20-year period, the proportion of public sewer recipients doubled and the proportion of Septic tanks or cesspools are more than doubled. The data show a significant improvement in sewage disposal facilities in the municipalities. In 1980, the proportion of housing units with public sewer facilities was less than 2 percent. The corresponding proportion increased to about 21 percent in 1994 and declined to about 11 percent in 2000. Similarly the proportion of housing units with septic tank and disposal facilities increased from about 14 percent in 1980 to over 55 percent in 1994 and almost 62 percent in 2000.
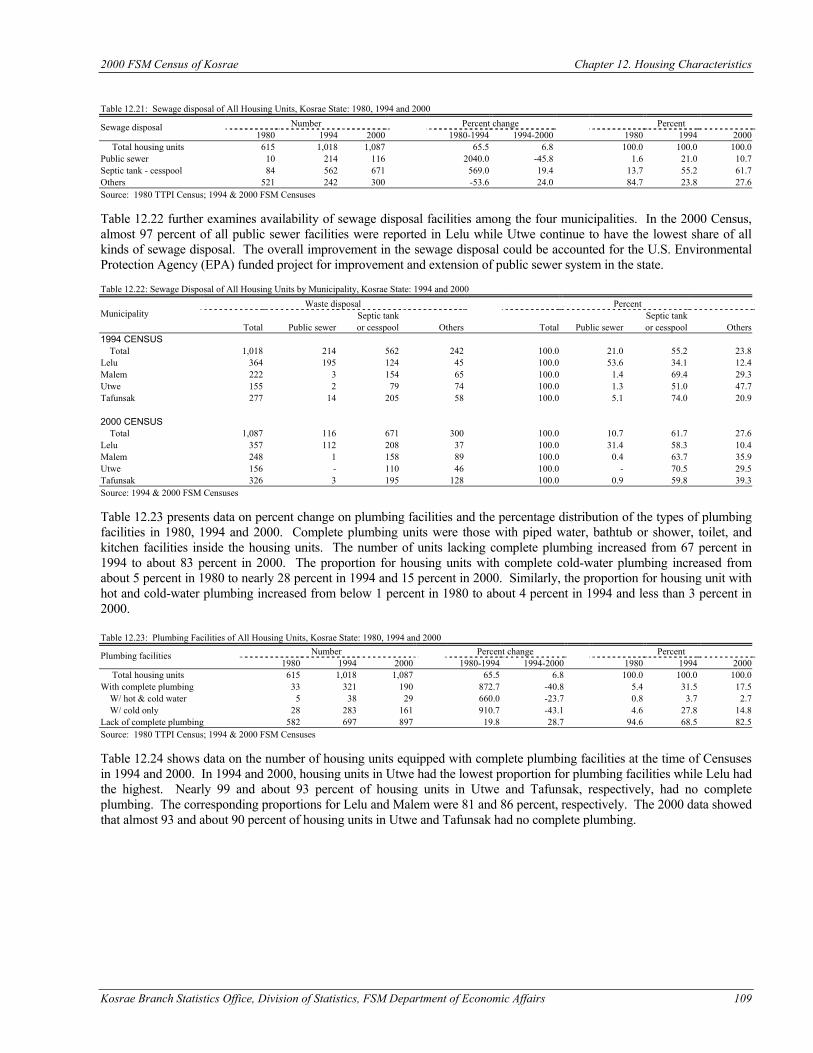
2000 FSM Census of Kosrae Chapter 12. Housing Characteristics
Kosrae Branch Statistics Office, Division of Statistics, FSM Department of Economic Affairs 109
Table 12.21: Sewage disposal of All Housing Units, Kosrae State: 1980, 1994 and 2000
Number Percent change Percent Sewage disposal 1980 1994 2000 1980-1994 1994-2000 1980 1994 2000
Total housing units 615 1,018 1,087 65.5 6.8 100.0 100.0 100.0 Public sewer 10 214 116 2040.0 -45.8 1.6 21.0 10.7 Septic tank - cesspool 84 562 671 569.0 19.4 13.7 55.2 61.7 Others 521 242 300 -53.6 24.0 84.7 23.8 27.6 Source: 1980 TTPI Census; 1994 & 2000 FSM Censuses Table 12.22 further examines availability of sewage disposal facilities among the four municipalities. In the 2000 Census, almost 97 percent of all public sewer facilities were reported in Lelu while Utwe continue to have the lowest share of all kinds of sewage disposal. The overall improvement in the sewage disposal could be accounted for the U.S. Environmental Protection Agency (EPA) funded project for improvement and extension of public sewer system in the state. Table 12.22: Sewage Disposal of All Housing Units by Municipality, Kosrae State: 1994 and 2000
Waste disposal Percent Septic tank Septic tank Municipality
Total Public sewer or cesspool Others Total Public sewer or cesspool Others 1994 CENSUS Total 1,018 214 562 242 100.0 21.0 55.2 23.8 Lelu 364 195 124 45 100.0 53.6 34.1 12.4 Malem 222 3 154 65 100.0 1.4 69.4 29.3 Utwe 155 2 79 74 100.0 1.3 51.0 47.7 Tafunsak 277 14 205 58 100.0 5.1 74.0 20.9 2000 CENSUS Total 1,087 116 671 300 100.0 10.7 61.7 27.6 Lelu 357 112 208 37 100.0 31.4 58.3 10.4 Malem 248 1 158 89 100.0 0.4 63.7 35.9 Utwe 156 - 110 46 100.0 - 70.5 29.5 Tafunsak 326 3 195 128 100.0 0.9 59.8 39.3 Source: 1994 & 2000 FSM Censuses Table 12.23 presents data on percent change on plumbing facilities and the percentage distribution of the types of plumbing facilities in 1980, 1994 and 2000. Complete plumbing units were those with piped water, bathtub or shower, toilet, and kitchen facilities inside the housing units. The number of units lacking complete plumbing increased from 67 percent in 1994 to about 83 percent in 2000. The proportion for housing units with complete cold-water plumbing increased from about 5 percent in 1980 to nearly 28 percent in 1994 and 15 percent in 2000. Similarly, the proportion for housing unit with hot and cold-water plumbing increased from below 1 percent in 1980 to about 4 percent in 1994 and less than 3 percent in 2000. Table 12.23: Plumbing Facilities of All Housing Units, Kosrae State: 1980, 1994 and 2000
Number Percent change Percent Plumbing facilities 1980 1994 2000 1980-1994 1994-2000 1980 1994 2000
Total housing units 615 1,018 1,087 65.5 6.8 100.0 100.0 100.0 With complete plumbing 33 321 190 872.7 -40.8 5.4 31.5 17.5 W/ hot & cold water 5 38 29 660.0 -23.7 0.8 3.7 2.7 W/ cold only 28 283 161 910.7 -43.1 4.6 27.8 14.8 Lack of complete plumbing 582 697 897 19.8 28.7 94.6 68.5 82.5 Source: 1980 TTPI Census; 1994 & 2000 FSM Censuses Table 12.24 shows data on the number of housing units equipped with complete plumbing facilities at the time of Censuses in 1994 and 2000. In 1994 and 2000, housing units in Utwe had the lowest proportion for plumbing facilities while Lelu had the highest. Nearly 99 and about 93 percent of housing units in Utwe and Tafunsak, respectively, had no complete plumbing. The corresponding proportions for Lelu and Malem were 81 and 86 percent, respectively. The 2000 data showed that almost 93 and about 90 percent of housing units in Utwe and Tafunsak had no complete plumbing.
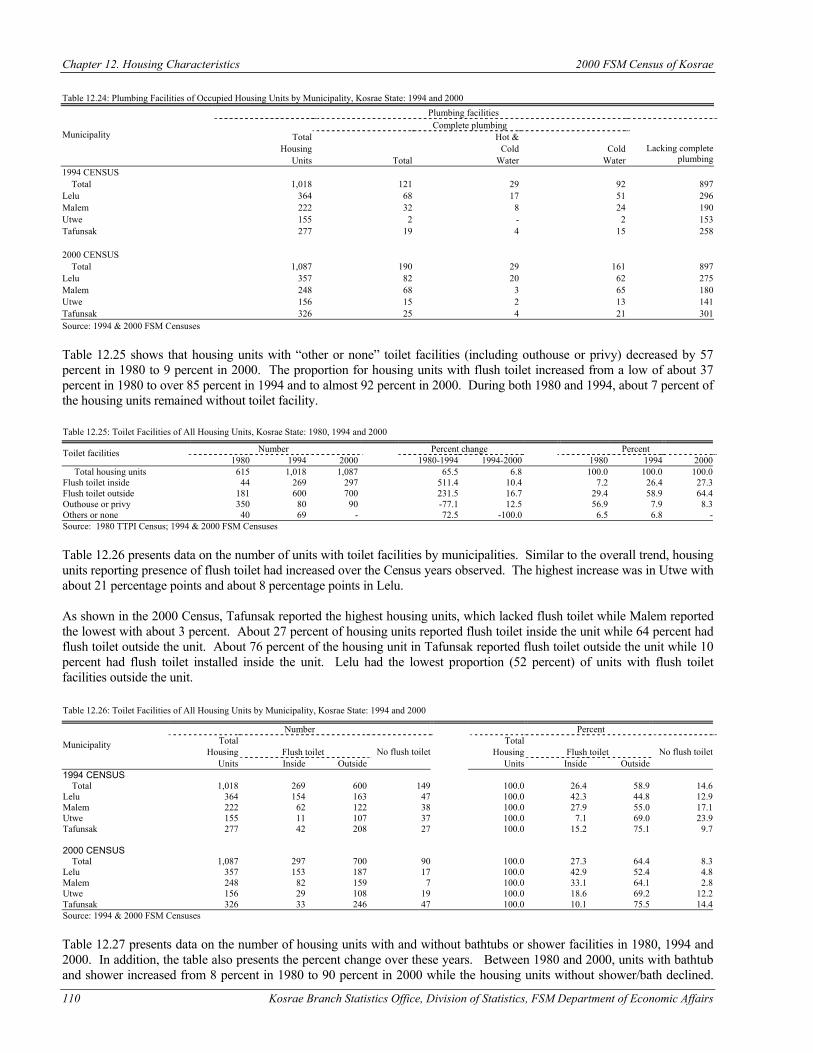
Chapter 12. Housing Characteristics 2000 FSM Census of Kosrae
110 Kosrae Branch Statistics Office, Division of Statistics, FSM Department of Economic Affairs
Table 12.24: Plumbing Facilities of Occupied Housing Units by Municipality, Kosrae State: 1994 and 2000
Plumbing facilities Complete plumbing
Total Hot & Housing Cold Cold
Municipality
Units Total Water Water Lacking complete
plumbing 1994 CENSUS Total 1,018 121 29 92 897 Lelu 364 68 17 51 296 Malem 222 32 8 24 190 Utwe 155 2 - 2 153 Tafunsak 277 19 4 15 258 2000 CENSUS Total 1,087 190 29 161 897 Lelu 357 82 20 62 275 Malem 248 68 3 65 180 Utwe 156 15 2 13 141 Tafunsak 326 25 4 21 301 Source: 1994 & 2000 FSM Censuses Table 12.25 shows that housing units with “other or none” toilet facilities (including outhouse or privy) decreased by 57 percent in 1980 to 9 percent in 2000. The proportion for housing units with flush toilet increased from a low of about 37 percent in 1980 to over 85 percent in 1994 and to almost 92 percent in 2000. During both 1980 and 1994, about 7 percent of the housing units remained without toilet facility. Table 12.25: Toilet Facilities of All Housing Units, Kosrae State: 1980, 1994 and 2000
Number Percent change Percent Toilet facilities 1980 1994 2000 1980-1994 1994-2000 1980 1994 2000
Total housing units 615 1,018 1,087 65.5 6.8 100.0 100.0 100.0 Flush toilet inside 44 269 297 511.4 10.4 7.2 26.4 27.3 Flush toilet outside 181 600 700 231.5 16.7 29.4 58.9 64.4 Outhouse or privy 350 80 90 -77.1 12.5 56.9 7.9 8.3 Others or none 40 69 - 72.5 -100.0 6.5 6.8 - Source: 1980 TTPI Census; 1994 & 2000 FSM Censuses Table 12.26 presents data on the number of units with toilet facilities by municipalities. Similar to the overall trend, housing units reporting presence of flush toilet had increased over the Census years observed. The highest increase was in Utwe with about 21 percentage points and about 8 percentage points in Lelu. As shown in the 2000 Census, Tafunsak reported the highest housing units, which lacked flush toilet while Malem reported the lowest with about 3 percent. About 27 percent of housing units reported flush toilet inside the unit while 64 percent had flush toilet outside the unit. About 76 percent of the housing unit in Tafunsak reported flush toilet outside the unit while 10 percent had flush toilet installed inside the unit. Lelu had the lowest proportion (52 percent) of units with flush toilet facilities outside the unit. Table 12.26: Toilet Facilities of All Housing Units by Municipality, Kosrae State: 1994 and 2000
Number Percent Total Total
Housing Flush toilet Housing Flush toilet Municipality
Units Inside Outside No flush toilet
Units Inside Outside No flush toilet
1994 CENSUS Total 1,018 269 600 149 100.0 26.4 58.9 14.6 Lelu 364 154 163 47 100.0 42.3 44.8 12.9 Malem 222 62 122 38 100.0 27.9 55.0 17.1 Utwe 155 11 107 37 100.0 7.1 69.0 23.9 Tafunsak 277 42 208 27 100.0 15.2 75.1 9.7 2000 CENSUS Total 1,087 297 700 90 100.0 27.3 64.4 8.3 Lelu 357 153 187 17 100.0 42.9 52.4 4.8 Malem 248 82 159 7 100.0 33.1 64.1 2.8 Utwe 156 29 108 19 100.0 18.6 69.2 12.2 Tafunsak 326 33 246 47 100.0 10.1 75.5 14.4 Source: 1994 & 2000 FSM Censuses Table 12.27 presents data on the number of housing units with and without bathtubs or shower facilities in 1980, 1994 and 2000. In addition, the table also presents the percent change over these years. Between 1980 and 2000, units with bathtub and shower increased from 8 percent in 1980 to 90 percent in 2000 while the housing units without shower/bath declined.
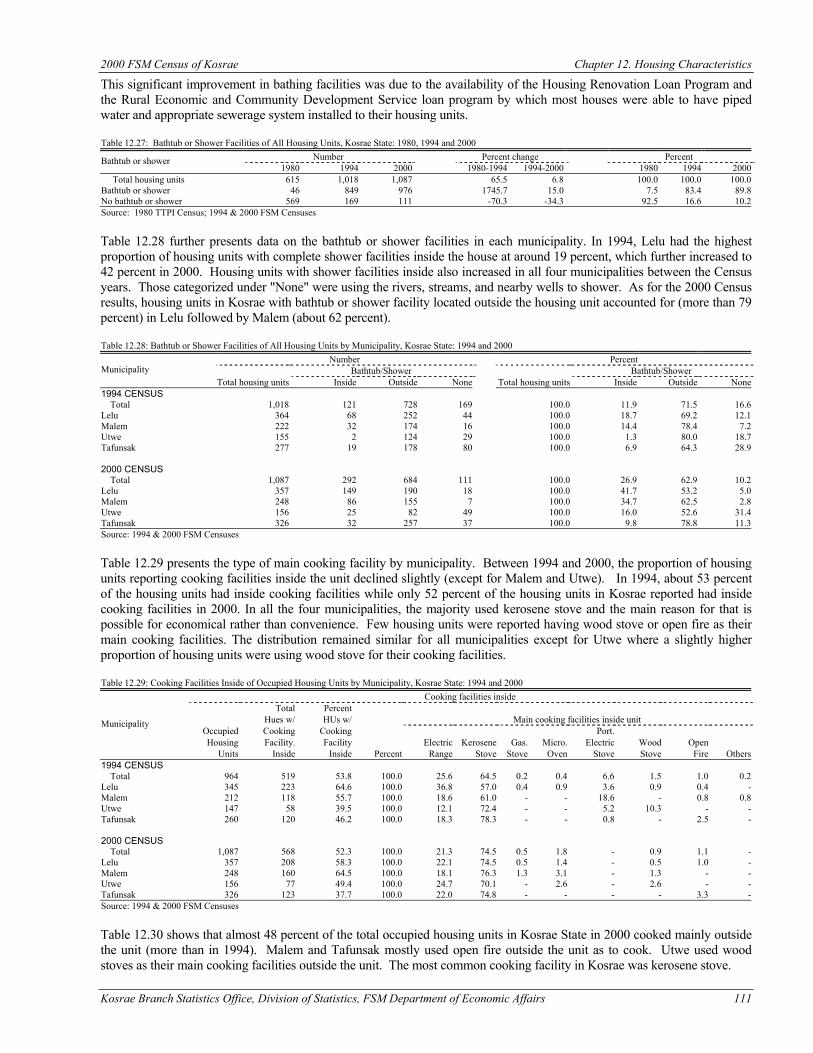
2000 FSM Census of Kosrae Chapter 12. Housing Characteristics
Kosrae Branch Statistics Office, Division of Statistics, FSM Department of Economic Affairs 111
This significant improvement in bathing facilities was due to the availability of the Housing Renovation Loan Program and the Rural Economic and Community Development Service loan program by which most houses were able to have piped water and appropriate sewerage system installed to their housing units. Table 12.27: Bathtub or Shower Facilities of All Housing Units, Kosrae State: 1980, 1994 and 2000
Number Percent change Percent Bathtub or shower 1980 1994 2000 1980-1994 1994-2000 1980 1994 2000
Total housing units 615 1,018 1,087 65.5 6.8 100.0 100.0 100.0 Bathtub or shower 46 849 976 1745.7 15.0 7.5 83.4 89.8 No bathtub or shower 569 169 111 -70.3 -34.3 92.5 16.6 10.2 Source: 1980 TTPI Census; 1994 & 2000 FSM Censuses Table 12.28 further presents data on the bathtub or shower facilities in each municipality. In 1994, Lelu had the highest proportion of housing units with complete shower facilities inside the house at around 19 percent, which further increased to 42 percent in 2000. Housing units with shower facilities inside also increased in all four municipalities between the Census years. Those categorized under "None" were using the rivers, streams, and nearby wells to shower. As for the 2000 Census results, housing units in Kosrae with bathtub or shower facility located outside the housing unit accounted for (more than 79 percent) in Lelu followed by Malem (about 62 percent). Table 12.28: Bathtub or Shower Facilities of All Housing Units by Municipality, Kosrae State: 1994 and 2000
Number Percent Bathtub/Shower Bathtub/Shower Municipality
Total housing units Inside Outside None Total housing units Inside Outside None 1994 CENSUS Total 1,018 121 728 169 100.0 11.9 71.5 16.6 Lelu 364 68 252 44 100.0 18.7 69.2 12.1 Malem 222 32 174 16 100.0 14.4 78.4 7.2 Utwe 155 2 124 29 100.0 1.3 80.0 18.7 Tafunsak 277 19 178 80 100.0 6.9 64.3 28.9 2000 CENSUS Total 1,087 292 684 111 100.0 26.9 62.9 10.2 Lelu 357 149 190 18 100.0 41.7 53.2 5.0 Malem 248 86 155 7 100.0 34.7 62.5 2.8 Utwe 156 25 82 49 100.0 16.0 52.6 31.4 Tafunsak 326 32 257 37 100.0 9.8 78.8 11.3 Source: 1994 & 2000 FSM Censuses Table 12.29 presents the type of main cooking facility by municipality. Between 1994 and 2000, the proportion of housing units reporting cooking facilities inside the unit declined slightly (except for Malem and Utwe). In 1994, about 53 percent of the housing units had inside cooking facilities while only 52 percent of the housing units in Kosrae reported had inside cooking facilities in 2000. In all the four municipalities, the majority used kerosene stove and the main reason for that is possible for economical rather than convenience. Few housing units were reported having wood stove or open fire as their main cooking facilities. The distribution remained similar for all municipalities except for Utwe where a slightly higher proportion of housing units were using wood stove for their cooking facilities. Table 12.29: Cooking Facilities Inside of Occupied Housing Units by Municipality, Kosrae State: 1994 and 2000
Cooking facilities inside Total Percent Hues w/ HUs w/ Main cooking facilities inside unit
Occupied Cooking Cooking Port. Housing Facility. Facility Electric Kerosene Gas. Micro. Electric Wood Open
Municipality
Units Inside Inside Percent Range Stove Stove Oven Stove Stove Fire Others 1994 CENSUS Total 964 519 53.8 100.0 25.6 64.5 0.2 0.4 6.6 1.5 1.0 0.2 Lelu 345 223 64.6 100.0 36.8 57.0 0.4 0.9 3.6 0.9 0.4 - Malem 212 118 55.7 100.0 18.6 61.0 - - 18.6 - 0.8 0.8 Utwe 147 58 39.5 100.0 12.1 72.4 - - 5.2 10.3 - - Tafunsak 260 120 46.2 100.0 18.3 78.3 - - 0.8 - 2.5 - 2000 CENSUS Total 1,087 568 52.3 100.0 21.3 74.5 0.5 1.8 - 0.9 1.1 - Lelu 357 208 58.3 100.0 22.1 74.5 0.5 1.4 - 0.5 1.0 - Malem 248 160 64.5 100.0 18.1 76.3 1.3 3.1 - 1.3 - - Utwe 156 77 49.4 100.0 24.7 70.1 - 2.6 - 2.6 - - Tafunsak 326 123 37.7 100.0 22.0 74.8 - - - - 3.3 - Source: 1994 & 2000 FSM Censuses Table 12.30 shows that almost 48 percent of the total occupied housing units in Kosrae State in 2000 cooked mainly outside the unit (more than in 1994). Malem and Tafunsak mostly used open fire outside the unit as to cook. Utwe used wood stoves as their main cooking facilities outside the unit. The most common cooking facility in Kosrae was kerosene stove.
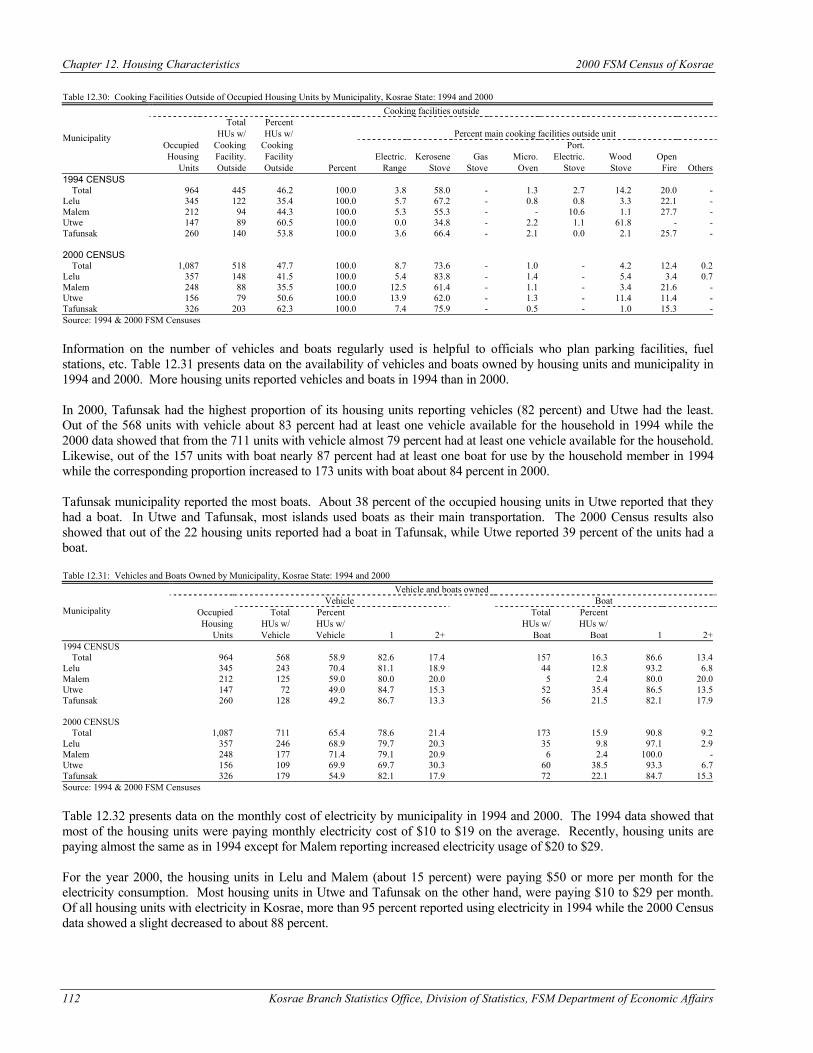
Chapter 12. Housing Characteristics 2000 FSM Census of Kosrae
112 Kosrae Branch Statistics Office, Division of Statistics, FSM Department of Economic Affairs
Table 12.30: Cooking Facilities Outside of Occupied Housing Units by Municipality, Kosrae State: 1994 and 2000
Cooking facilities outside Total Percent HUs w/ HUs w/ Percent main cooking facilities outside unit
Occupied Cooking Cooking Port. Housing Facility. Facility Electric. Kerosene Gas Micro. Electric. Wood Open
Municipality
Units Outside Outside Percent Range Stove Stove Oven Stove Stove Fire Others 1994 CENSUS Total 964 445 46.2 100.0 3.8 58.0 - 1.3 2.7 14.2 20.0 - Lelu 345 122 35.4 100.0 5.7 67.2 - 0.8 0.8 3.3 22.1 - Malem 212 94 44.3 100.0 5.3 55.3 - - 10.6 1.1 27.7 - Utwe 147 89 60.5 100.0 0.0 34.8 - 2.2 1.1 61.8 - - Tafunsak 260 140 53.8 100.0 3.6 66.4 - 2.1 0.0 2.1 25.7 - 2000 CENSUS Total 1,087 518 47.7 100.0 8.7 73.6 - 1.0 - 4.2 12.4 0.2 Lelu 357 148 41.5 100.0 5.4 83.8 - 1.4 - 5.4 3.4 0.7 Malem 248 88 35.5 100.0 12.5 61.4 - 1.1 - 3.4 21.6 - Utwe 156 79 50.6 100.0 13.9 62.0 - 1.3 - 11.4 11.4 - Tafunsak 326 203 62.3 100.0 7.4 75.9 - 0.5 - 1.0 15.3 - Source: 1994 & 2000 FSM Censuses Information on the number of vehicles and boats regularly used is helpful to officials who plan parking facilities, fuel stations, etc. Table 12.31 presents data on the availability of vehicles and boats owned by housing units and municipality in 1994 and 2000. More housing units reported vehicles and boats in 1994 than in 2000. In 2000, Tafunsak had the highest proportion of its housing units reporting vehicles (82 percent) and Utwe had the least. Out of the 568 units with vehicle about 83 percent had at least one vehicle available for the household in 1994 while the 2000 data showed that from the 711 units with vehicle almost 79 percent had at least one vehicle available for the household. Likewise, out of the 157 units with boat nearly 87 percent had at least one boat for use by the household member in 1994 while the corresponding proportion increased to 173 units with boat about 84 percent in 2000. Tafunsak municipality reported the most boats. About 38 percent of the occupied housing units in Utwe reported that they had a boat. In Utwe and Tafunsak, most islands used boats as their main transportation. The 2000 Census results also showed that out of the 22 housing units reported had a boat in Tafunsak, while Utwe reported 39 percent of the units had a boat. Table 12.31: Vehicles and Boats Owned by Municipality, Kosrae State: 1994 and 2000
Vehicle and boats owned Vehicle Boat
Occupied Total Percent Total Percent Housing HUs w/ HUs w/ HUs w/ HUs w/
Municipality
Units Vehicle Vehicle 1 2+ Boat Boat 1 2+ 1994 CENSUS Total 964 568 58.9 82.6 17.4 157 16.3 86.6 13.4 Lelu 345 243 70.4 81.1 18.9 44 12.8 93.2 6.8 Malem 212 125 59.0 80.0 20.0 5 2.4 80.0 20.0 Utwe 147 72 49.0 84.7 15.3 52 35.4 86.5 13.5 Tafunsak 260 128 49.2 86.7 13.3 56 21.5 82.1 17.9 2000 CENSUS Total 1,087 711 65.4 78.6 21.4 173 15.9 90.8 9.2 Lelu 357 246 68.9 79.7 20.3 35 9.8 97.1 2.9 Malem 248 177 71.4 79.1 20.9 6 2.4 100.0 - Utwe 156 109 69.9 69.7 30.3 60 38.5 93.3 6.7 Tafunsak 326 179 54.9 82.1 17.9 72 22.1 84.7 15.3 Source: 1994 & 2000 FSM Censuses Table 12.32 presents data on the monthly cost of electricity by municipality in 1994 and 2000. The 1994 data showed that most of the housing units were paying monthly electricity cost of $10 to $19 on the average. Recently, housing units are paying almost the same as in 1994 except for Malem reporting increased electricity usage of $20 to $29. For the year 2000, the housing units in Lelu and Malem (about 15 percent) were paying $50 or more per month for the electricity consumption. Most housing units in Utwe and Tafunsak on the other hand, were paying $10 to $29 per month. Of all housing units with electricity in Kosrae, more than 95 percent reported using electricity in 1994 while the 2000 Census data showed a slight decreased to about 88 percent.
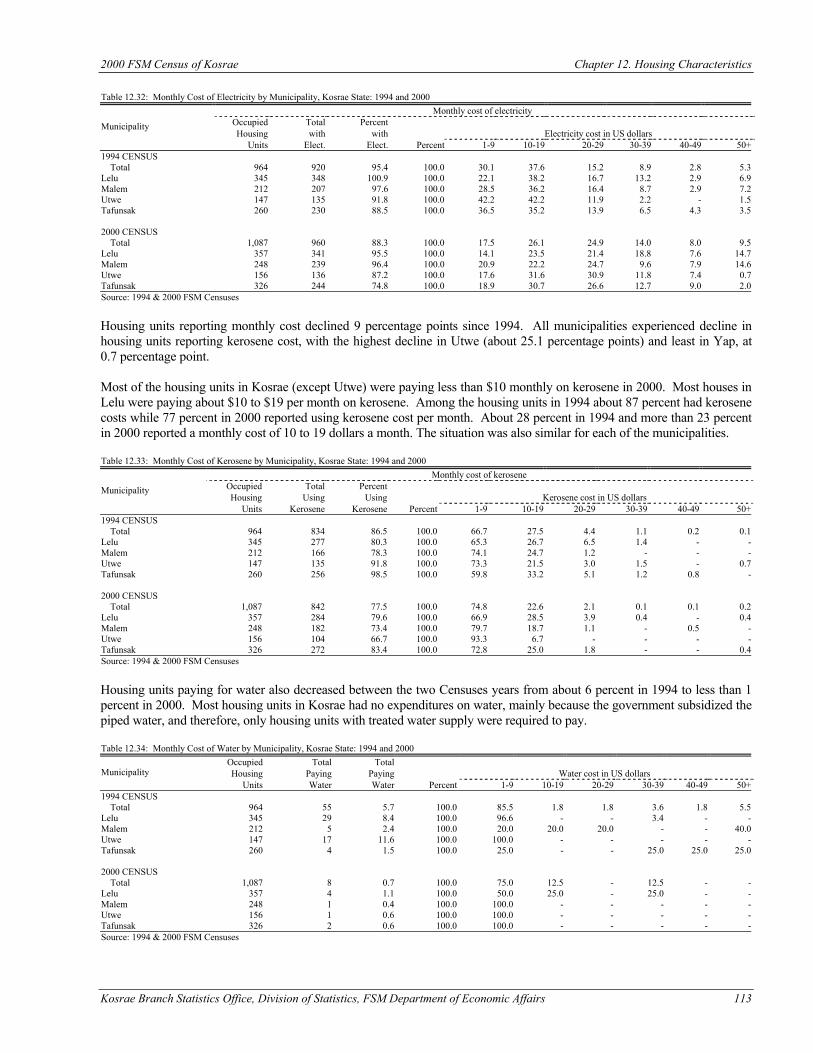
2000 FSM Census of Kosrae Chapter 12. Housing Characteristics
Kosrae Branch Statistics Office, Division of Statistics, FSM Department of Economic Affairs 113
Table 12.32: Monthly Cost of Electricity by Municipality, Kosrae State: 1994 and 2000
Monthly cost of electricity Occupied Total Percent Housing with with Electricity cost in US dollars
Municipality
Units Elect. Elect. Percent 1-9 10-19 20-29 30-39 40-49 50+ 1994 CENSUS Total 964 920 95.4 100.0 30.1 37.6 15.2 8.9 2.8 5.3 Lelu 345 348 100.9 100.0 22.1 38.2 16.7 13.2 2.9 6.9 Malem 212 207 97.6 100.0 28.5 36.2 16.4 8.7 2.9 7.2 Utwe 147 135 91.8 100.0 42.2 42.2 11.9 2.2 - 1.5 Tafunsak 260 230 88.5 100.0 36.5 35.2 13.9 6.5 4.3 3.5 2000 CENSUS Total 1,087 960 88.3 100.0 17.5 26.1 24.9 14.0 8.0 9.5 Lelu 357 341 95.5 100.0 14.1 23.5 21.4 18.8 7.6 14.7 Malem 248 239 96.4 100.0 20.9 22.2 24.7 9.6 7.9 14.6 Utwe 156 136 87.2 100.0 17.6 31.6 30.9 11.8 7.4 0.7 Tafunsak 326 244 74.8 100.0 18.9 30.7 26.6 12.7 9.0 2.0 Source: 1994 & 2000 FSM Censuses Housing units reporting monthly cost declined 9 percentage points since 1994. All municipalities experienced decline in housing units reporting kerosene cost, with the highest decline in Utwe (about 25.1 percentage points) and least in Yap, at 0.7 percentage point. Most of the housing units in Kosrae (except Utwe) were paying less than $10 monthly on kerosene in 2000. Most houses in Lelu were paying about $10 to $19 per month on kerosene. Among the housing units in 1994 about 87 percent had kerosene costs while 77 percent in 2000 reported using kerosene cost per month. About 28 percent in 1994 and more than 23 percent in 2000 reported a monthly cost of 10 to 19 dollars a month. The situation was also similar for each of the municipalities. Table 12.33: Monthly Cost of Kerosene by Municipality, Kosrae State: 1994 and 2000
Monthly cost of kerosene Occupied Total Percent Housing Using Using Kerosene cost in US dollars
Municipality
Units Kerosene Kerosene Percent 1-9 10-19 20-29 30-39 40-49 50+ 1994 CENSUS Total 964 834 86.5 100.0 66.7 27.5 4.4 1.1 0.2 0.1 Lelu 345 277 80.3 100.0 65.3 26.7 6.5 1.4 - - Malem 212 166 78.3 100.0 74.1 24.7 1.2 - - - Utwe 147 135 91.8 100.0 73.3 21.5 3.0 1.5 - 0.7 Tafunsak 260 256 98.5 100.0 59.8 33.2 5.1 1.2 0.8 - 2000 CENSUS Total 1,087 842 77.5 100.0 74.8 22.6 2.1 0.1 0.1 0.2 Lelu 357 284 79.6 100.0 66.9 28.5 3.9 0.4 - 0.4 Malem 248 182 73.4 100.0 79.7 18.7 1.1 - 0.5 - Utwe 156 104 66.7 100.0 93.3 6.7 - - - - Tafunsak 326 272 83.4 100.0 72.8 25.0 1.8 - - 0.4 Source: 1994 & 2000 FSM Censuses Housing units paying for water also decreased between the two Censuses years from about 6 percent in 1994 to less than 1 percent in 2000. Most housing units in Kosrae had no expenditures on water, mainly because the government subsidized the piped water, and therefore, only housing units with treated water supply were required to pay. Table 12.34: Monthly Cost of Water by Municipality, Kosrae State: 1994 and 2000
Occupied Total Total Housing Paying Paying Water cost in US dollars Municipality
Units Water Water Percent 1-9 10-19 20-29 30-39 40-49 50+ 1994 CENSUS Total 964 55 5.7 100.0 85.5 1.8 1.8 3.6 1.8 5.5 Lelu 345 29 8.4 100.0 96.6 - - 3.4 - - Malem 212 5 2.4 100.0 20.0 20.0 20.0 - - 40.0 Utwe 147 17 11.6 100.0 100.0 - - - - - Tafunsak 260 4 1.5 100.0 25.0 - - 25.0 25.0 25.0 2000 CENSUS Total 1,087 8 0.7 100.0 75.0 12.5 - 12.5 - - Lelu 357 4 1.1 100.0 50.0 25.0 - 25.0 - - Malem 248 1 0.4 100.0 100.0 - - - - - Utwe 156 1 0.6 100.0 100.0 - - - - - Tafunsak 326 2 0.6 100.0 100.0 - - - - - Source: 1994 & 2000 FSM Censuses
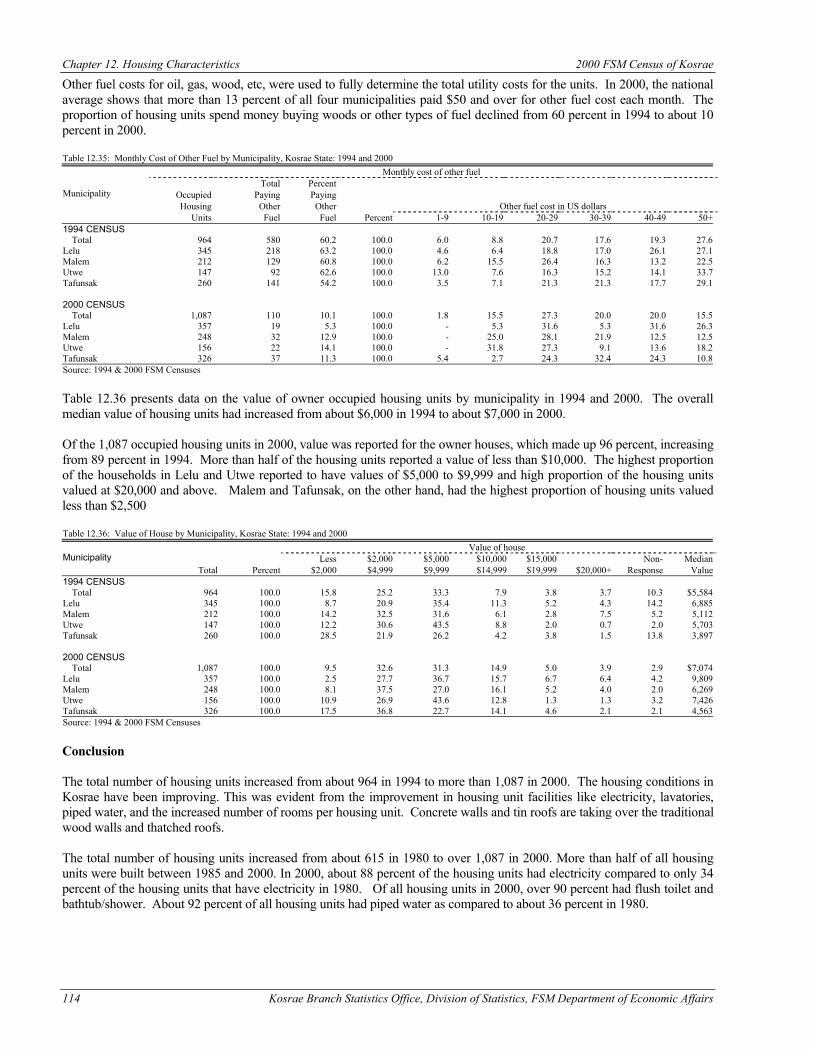
Chapter 12. Housing Characteristics 2000 FSM Census of Kosrae
114 Kosrae Branch Statistics Office, Division of Statistics, FSM Department of Economic Affairs
Other fuel costs for oil, gas, wood, etc, were used to fully determine the total utility costs for the units. In 2000, the national average shows that more than 13 percent of all four municipalities paid $50 and over for other fuel cost each month. The proportion of housing units spend money buying woods or other types of fuel declined from 60 percent in 1994 to about 10 percent in 2000. Table 12.35: Monthly Cost of Other Fuel by Municipality, Kosrae State: 1994 and 2000
Monthly cost of other fuel Total Percent
Occupied Paying Paying Housing Other Other Other fuel cost in US dollars
Municipality
Units Fuel Fuel Percent 1-9 10-19 20-29 30-39 40-49 50+ 1994 CENSUS Total 964 580 60.2 100.0 6.0 8.8 20.7 17.6 19.3 27.6 Lelu 345 218 63.2 100.0 4.6 6.4 18.8 17.0 26.1 27.1 Malem 212 129 60.8 100.0 6.2 15.5 26.4 16.3 13.2 22.5 Utwe 147 92 62.6 100.0 13.0 7.6 16.3 15.2 14.1 33.7 Tafunsak 260 141 54.2 100.0 3.5 7.1 21.3 21.3 17.7 29.1 2000 CENSUS Total 1,087 110 10.1 100.0 1.8 15.5 27.3 20.0 20.0 15.5 Lelu 357 19 5.3 100.0 - 5.3 31.6 5.3 31.6 26.3 Malem 248 32 12.9 100.0 - 25.0 28.1 21.9 12.5 12.5 Utwe 156 22 14.1 100.0 - 31.8 27.3 9.1 13.6 18.2 Tafunsak 326 37 11.3 100.0 5.4 2.7 24.3 32.4 24.3 10.8 Source: 1994 & 2000 FSM Censuses Table 12.36 presents data on the value of owner occupied housing units by municipality in 1994 and 2000. The overall median value of housing units had increased from about $6,000 in 1994 to about $7,000 in 2000. Of the 1,087 occupied housing units in 2000, value was reported for the owner houses, which made up 96 percent, increasing from 89 percent in 1994. More than half of the housing units reported a value of less than $10,000. The highest proportion of the households in Lelu and Utwe reported to have values of $5,000 to $9,999 and high proportion of the housing units valued at $20,000 and above. Malem and Tafunsak, on the other hand, had the highest proportion of housing units valued less than $2,500 Table 12.36: Value of House by Municipality, Kosrae State: 1994 and 2000
Value of house Less $2,000 $5,000 $10,000 $15,000 Non- Median Municipality
Total Percent $2,000 $4,999 $9,999 $14,999 $19,999 $20,000+ Response Value 1994 CENSUS Total 964 100.0 15.8 25.2 33.3 7.9 3.8 3.7 10.3 $5,584 Lelu 345 100.0 8.7 20.9 35.4 11.3 5.2 4.3 14.2 6,885 Malem 212 100.0 14.2 32.5 31.6 6.1 2.8 7.5 5.2 5,112 Utwe 147 100.0 12.2 30.6 43.5 8.8 2.0 0.7 2.0 5,703 Tafunsak 260 100.0 28.5 21.9 26.2 4.2 3.8 1.5 13.8 3,897 2000 CENSUS Total 1,087 100.0 9.5 32.6 31.3 14.9 5.0 3.9 2.9 $7,074 Lelu 357 100.0 2.5 27.7 36.7 15.7 6.7 6.4 4.2 9,809 Malem 248 100.0 8.1 37.5 27.0 16.1 5.2 4.0 2.0 6,269 Utwe 156 100.0 10.9 26.9 43.6 12.8 1.3 1.3 3.2 7,426 Tafunsak 326 100.0 17.5 36.8 22.7 14.1 4.6 2.1 2.1 4,563 Source: 1994 & 2000 FSM Censuses Conclusion The total number of housing units increased from about 964 in 1994 to more than 1,087 in 2000. The housing conditions in Kosrae have been improving. This was evident from the improvement in housing unit facilities like electricity, lavatories, piped water, and the increased number of rooms per housing unit. Concrete walls and tin roofs are taking over the traditional wood walls and thatched roofs. The total number of housing units increased from about 615 in 1980 to over 1,087 in 2000. More than half of all housing units were built between 1985 and 2000. In 2000, about 88 percent of the housing units had electricity compared to only 34 percent of the housing units that have electricity in 1980. Of all housing units in 2000, over 90 percent had flush toilet and bathtub/shower. About 92 percent of all housing units had piped water as compared to about 36 percent in 1980.
Kosrae Branch Statistics Office, Division of Statistics, FSM Department of Economic Affairs 115
Bibliography Arriaga, E.E., (1983). Estimating fertility from data on children ever born, by age of mother, US Bureau of the Census,
International Research Document no. 11, Washington D.C. Arriaga, E.E., et al. (1994). Population analysis with microcomputers, vol I & II, UNFPA, USAID and US Bureau of Census, Washington DC. Bank of Hawaii. (1989). An economic assessment of the Federated States of Micronesia. Bank of Hawaii, Honolulu, HI. Brass, W. (1975). Methods for Estimating Fertility and Mortality from Limited and Defective Data, Caroline Population Center, Laboratory for population studies, University of North Carolina, Chapel Hill. Brass, W., & Coale, A. J. (1968). Methods of Analysis and Estimation, The Demography of Tropical Africa, Princeton, Princeton University Press, Chapter III. Coale, A.J., & Demeney, P. (1966). Regional Model Life Tables and Stable Populations. Princeton, New Jersey, Princeton University Press. Coale, A.J., & J. Trussel. (1974). Model fertility schedule: variations on the age structure of child bearing in human population, Population Index, vol. 40, NY. _____ (1977). Estimating the time to which Brass estimates apply, Population Bulletin of the United Nations, no 10, NY. _____ (1988). Mortpak-Lite, the United Nations Software packages for mortality measurement, Population Division,
United Nations, New York, NY. Compact of the Free Association. (1982). Compact of Free Association and related agreements between the Federated States of Micronesia and the United States of America. Plebiscite Commission. Kolonia, Pohnpei. Connel, J., (1983). Migration, Employment and Development in the South Pacific, Country Report No. 3: Federated States of Micronesia, South Pacific Commission, New Caledonia. Connell, J. (1990). Modernity and its Discontents: Migration and Change in the South Pacific. Migration Development
in the South Pacific, Pacific Research Monograph No. 24. Australian National University. Canberra, Australia.
Fenney, G. (1976). Estimating infant mortality rate from child survivorship data by age of mother, Asian Pacific Census Newsletter, vol. 3, no. 2, pp 12-16. _____ (1980). Estimating infant mortality trends from child survivorship data, Population Studies, vol. 34, no. 1, NY. Firth, S. (1989). Sovereignty and Interdependence in the Contemporary Pacific. The Contemporary Pacific, 1, 75-96. Gorenflo, L.J., & Levin, M.J. (1992). Changing Migration Patterns in the Federated States of Micronesia. A journal of
Micronesian studies, 3:1. pp 29-71. Hezel, F.X., (1983). The First Taint of Civilization, University of Hawaii Press Hezel, F.X., & Berg, M. L. (1979). Micronesia: Winds of Change, TTPI Printing Office, 1979.
Bibliography 2000 FSM Census of Kosrae
116 Kosrae Branch Statistics Office, Division of Statistics, FSM Department of Economic Affairs
Hezel, F.X., & Levin, M.J. (1987). Micronesian emigration and the brain drain in Palau, Marshalls, and the Federated States. Journal of the Pacific Society, 10, 16-34. _____ (1990) Micronesian emigration: Beyond the brain drain. In J. Connell (Ed.), Migration and development in the South Pacific (Pacific research Monograph No. 24, pp. 42-60). Australian National University, National Centre for Development Studies. _____ (1996). New trend in Micronesian Migration, FSM Migrating to Guam and the Marianas, 1990-1993. Hezel, F.X., & McGrath, T.B. (1989). The great flight northward: FSM migration to Guam and the Northern Mariana Islands. Pacific Studies, 13(1), 47-64. Khalidi, N.A., (forthcoming). Population Profile, Federated States of Micronesia, 1994, with special reference to planning needs. Levin, M.J. (1995). Micronesian Migrants to Guam and the Commonwealth of Northern Mariana Islands: A Study of
the Impact of the Compact of the Free Association, Washington DC, US Government Printing Office. Levin, M.J. (Draft). Census and Demography in the U.S. Pacific Islands, East-West Center, Honolulu Hawaii. Levin, M. J. & Mailos, E. (1992). Homelessness on Guam, Levin, M.J., & Retherford, R.D. (1986). Recent fertility trends in the Pacific Islands, East-West Population Institute,
No. 101, East-West Center, Honolulu Hawaii. Myers, R. (1940). Errors and Bias in the Reporting of Age in the Census Data, Transaction of the Actuarial Society of America, vol 41. Nan'yo-cho [South Seas Bureau]. (1927). Nan'yo gunto tosei, chosa hokoku, Taicho juyonen [Census of the Japanese Mandate Territories, 1925]. Koror, Palau: Nan'yo-cho. _____ (1931). Nan'yo-gunto tosei, chosa-sho, Showa 5 nen [A summary of conditions in Mandate Territories, 1930]. (4 vols.). Koror, Palau: Nan'yo-cho. _____ (1937). Nan'yo-gunto tosei, chosa-sho, Showa 10 nen [A summary of conditions in Mandate Territories, 1935]. (2 vols.). Tokyo: Nan'yo-cho. OCC/Office of Census Coordinator. (1975). 1973 population of the Trust Territory of the Pacific Islands. Saipan: US Trust Territory of the Pacific Islands. ODA, UK & EPU, Malaysia/Overseas Development Administration, UK & Economic Planning Unit, Kuala Lumpur,
Malaysia. (1990). PEOPLE. Software package for making national and sub-national population projections, version 3.01, Malaysia.
OHC/Office of the High Commissioner. (1959). Census Report, 1958. US Trust Territory of the Pacific Islands. Agana, Guam. _____ TTPI Population Profiles, 1967. Special Report, Series No. 1. Trust Territory of the Pacific Islands. Agana, Guam. OPB/Office of Planning and Budget, Yap State. (1987). Report on the 1987 Yap State Census of Population, vol I, Colonia, Yap, FSM.
2000 FSM Census of Kosrae Bibliography
Kosrae Branch Statistics Office, Division of Statistics, FSM Department of Economic Affairs 117
_____ (1988). Report on the 1987 Yap State Census of Population, vol II, Colonia, Yap, FSM. OPS/Office of Planning and Statistics, FSM. (1988). 1985 Pohnpei State Census Report, Kolonia, Pohnpei, FSM. _____ (1989). 1986 Kosrae State Census Report, Kolonia, Pohnpei, FSM. _____ (1992). 1989 Chuuk State Census of Population and Housing, Palikir, Pohnpei, FSM. _____ (1992). Information Handbook, Federated States of Micronesia, (No 1., Vol 1). Palikir Pohnpei, FSM. Rubinstein, D. H. (1990). Micronesian Migrants to Guam and Saipan Post-Compact (1987), University of New South Wales. _____ (1991). The Future of Micronesian Migration to Guam, Micronesian Area Research Center, UOG. Rubinstein, D. H., & Levin, M. J. (1992). Micronesian migration to Guam: Social and economic characteristics. Asia and Pacific Migration Journal, 1, 350-385. Shinn, R. (1984). Trust Territory of the Pacific Islands. Oceania: A Regional Study, edited by F.M. Bunge and M. W. Cooke, pp. 295-348. Foreign Area Studies, American University. Washington DC: Government Printing Office. Shryock, H.S., et al. (1976). The method and materials of demography, condensed edition, NY. SPC/South Pacific Commission. (1995). Population Statistics, Statistical Bulletin No. 42, Noumea, New Caledonia. Sullivan, J. (1972). Models for the estimation of the probability of dying, birth, and exact ages of early childhood, Population Studies, vol. 26, no. 1, pp 77-79. UOG/University of Guam. (1993). 1992 Survey of Micronesians on Guam USBC/US Bureau of the Census. (1984). 1980 Census of Population (vol 1.1), characteristics of the population (part 57), Trust Territory of the Pacific Islands, excluding the Northern Mariana Islands. Washington DC: US Government Printing Office. _____ (1984). 1980 Census of Population (vol 1.1), characteristics of the population (part 57), Trust Territory of the Pacific Islands, excluding the Northern Mariana Islands. Washington DC: US Government Printing Office. _____ (1992a). 1990 census of population and housing: Summary population and housing characteristics,
Commnwealth of the Northern Mariana Islands, Washington, DC: US Government Printing Office. _____ (1992b). 1990 census of population and housing: Summary population and housing characteristics, Guam,
Washington, DC: US Government Printing Office. UN/United Nations. (1952). Accuracy tests for census age distributions tabulated in five-year and ten-year groups,
Population Bulletin, no. 2, New York. _____ (1967). Manual IV, Methods of Estimating Basic Demographic measures from incomplete data, Population Studies, No. 42, NY. _____ (1983). Manual X, Indirect Techniques for Demographic Estimation, Population Studies, No. 81. NY.

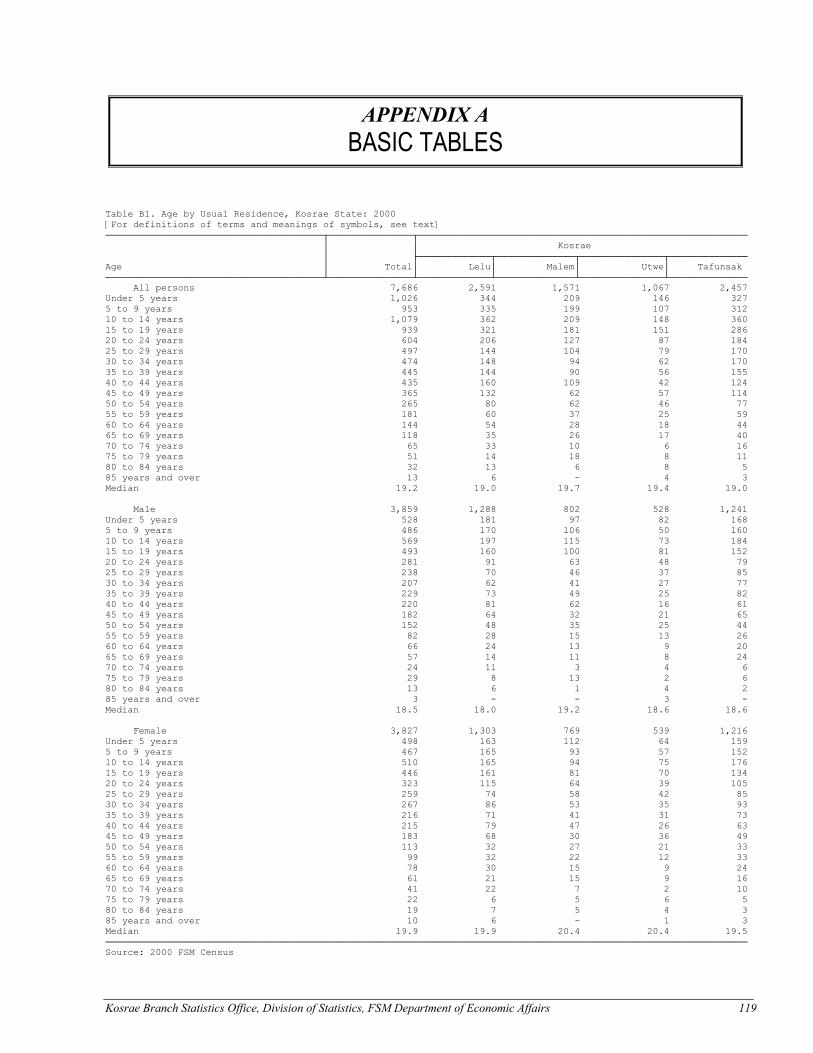
Kosrae Branch Statistics Office, Division of Statistics, FSM Department of Economic Affairs 119
Table B1. Age by Usual Residence, Kosrae State: 2000 [For definitions of terms and meanings of symbols, see text] ───────────────────────────────────────┬───────────────┬─────────────────────────────────────────────────────────── │ │ Kosrae │ ├─────────────┬──────────────┬───────────────┬────────────── Age │ Total│ Lelu│ Malem│ Utwe│ Tafunsak ───────────────────────────────────────┴───────────────┴─────────────┴──────────────┴───────────────┴────────────── All persons 7,686 2,591 1,571 1,067 2,457 Under 5 years 1,026 344 209 146 327 5 to 9 years 953 335 199 107 312 10 to 14 years 1,079 362 209 148 360 15 to 19 years 939 321 181 151 286 20 to 24 years 604 206 127 87 184 25 to 29 years 497 144 104 79 170 30 to 34 years 474 148 94 62 170 35 to 39 years 445 144 90 56 155 40 to 44 years 435 160 109 42 124 45 to 49 years 365 132 62 57 114 50 to 54 years 265 80 62 46 77 55 to 59 years 181 60 37 25 59 60 to 64 years 144 54 28 18 44 65 to 69 years 118 35 26 17 40 70 to 74 years 65 33 10 6 16 75 to 79 years 51 14 18 8 11 80 to 84 years 32 13 6 8 5 85 years and over 13 6 - 4 3 Median 19.2 19.0 19.7 19.4 19.0 Male 3,859 1,288 802 528 1,241 Under 5 years 528 181 97 82 168 5 to 9 years 486 170 106 50 160 10 to 14 years 569 197 115 73 184 15 to 19 years 493 160 100 81 152 20 to 24 years 281 91 63 48 79 25 to 29 years 238 70 46 37 85 30 to 34 years 207 62 41 27 77 35 to 39 years 229 73 49 25 82 40 to 44 years 220 81 62 16 61 45 to 49 years 182 64 32 21 65 50 to 54 years 152 48 35 25 44 55 to 59 years 82 28 15 13 26 60 to 64 years 66 24 13 9 20 65 to 69 years 57 14 11 8 24 70 to 74 years 24 11 3 4 6 75 to 79 years 29 8 13 2 6 80 to 84 years 13 6 1 4 2 85 years and over 3 - - 3 - Median 18.5 18.0 19.2 18.6 18.6 Female 3,827 1,303 769 539 1,216 Under 5 years 498 163 112 64 159 5 to 9 years 467 165 93 57 152 10 to 14 years 510 165 94 75 176 15 to 19 years 446 161 81 70 134 20 to 24 years 323 115 64 39 105 25 to 29 years 259 74 58 42 85 30 to 34 years 267 86 53 35 93 35 to 39 years 216 71 41 31 73 40 to 44 years 215 79 47 26 63 45 to 49 years 183 68 30 36 49 50 to 54 years 113 32 27 21 33 55 to 59 years 99 32 22 12 33 60 to 64 years 78 30 15 9 24 65 to 69 years 61 21 15 9 16 70 to 74 years 41 22 7 2 10 75 to 79 years 22 6 5 6 5 80 to 84 years 19 7 5 4 3 85 years and over 10 6 - 1 3 Median 19.9 19.9 20.4 20.4 19.5 ─────────────────────────────────────────────────────────────────────────────────────────────────────────────────── Source: 2000 FSM Census
APPENDIX A BASIC TABLES
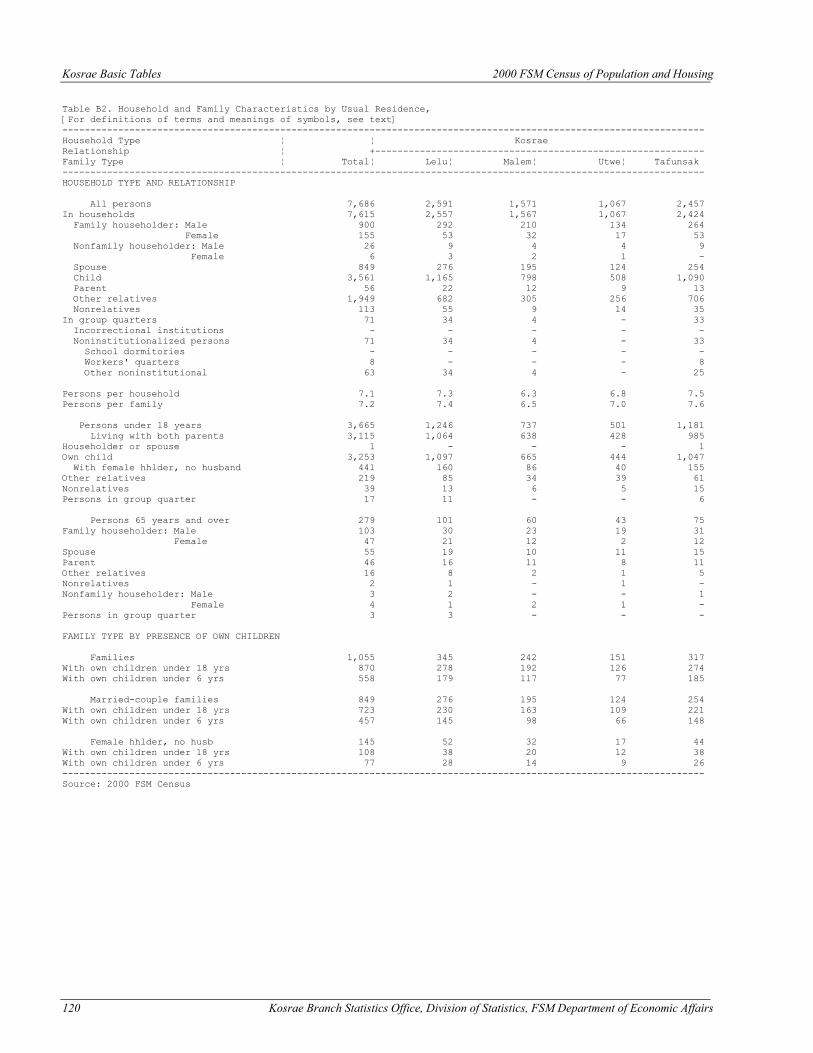
Kosrae Basic Tables 2000 FSM Census of Population and Housing
120 Kosrae Branch Statistics Office, Division of Statistics, FSM Department of Economic Affairs
Table B2. Household and Family Characteristics by Usual Residence, [For definitions of terms and meanings of symbols, see text] ------------------------------------------------------------------------------------------------------------------- Household Type ¦ ¦ Kosrae Relationship ¦ +----------------------------------------------------------- Family Type ¦ Total¦ Lelu¦ Malem¦ Utwe¦ Tafunsak ------------------------------------------------------------------------------------------------------------------- HOUSEHOLD TYPE AND RELATIONSHIP All persons 7,686 2,591 1,571 1,067 2,457 In households 7,615 2,557 1,567 1,067 2,424 Family householder: Male 900 292 210 134 264 Female 155 53 32 17 53 Nonfamily householder: Male 26 9 4 4 9 Female 6 3 2 1 - Spouse 849 276 195 124 254 Child 3,561 1,165 798 508 1,090 Parent 56 22 12 9 13 Other relatives 1,949 682 305 256 706 Nonrelatives 113 55 9 14 35 In group quarters 71 34 4 - 33 Incorrectional institutions - - - - - Noninstitutionalized persons 71 34 4 - 33 School dormitories - - - - - Workers' quarters 8 - - - 8 Other noninstitutional 63 34 4 - 25 Persons per household 7.1 7.3 6.3 6.8 7.5 Persons per family 7.2 7.4 6.5 7.0 7.6 Persons under 18 years 3,665 1,246 737 501 1,181 Living with both parents 3,115 1,064 638 428 985 Householder or spouse 1 - - - 1 Own child 3,253 1,097 665 444 1,047 With female hhlder, no husband 441 160 86 40 155 Other relatives 219 85 34 39 61 Nonrelatives 39 13 6 5 15 Persons in group quarter 17 11 - - 6 Persons 65 years and over 279 101 60 43 75 Family householder: Male 103 30 23 19 31 Female 47 21 12 2 12 Spouse 55 19 10 11 15 Parent 46 16 11 8 11 Other relatives 16 8 2 1 5 Nonrelatives 2 1 - 1 - Nonfamily householder: Male 3 2 - - 1 Female 4 1 2 1 - Persons in group quarter 3 3 - - - FAMILY TYPE BY PRESENCE OF OWN CHILDREN Families 1,055 345 242 151 317 With own children under 18 yrs 870 278 192 126 274 With own children under 6 yrs 558 179 117 77 185 Married-couple families 849 276 195 124 254 With own children under 18 yrs 723 230 163 109 221 With own children under 6 yrs 457 145 98 66 148 Female hhlder, no husb 145 52 32 17 44 With own children under 18 yrs 108 38 20 12 38 With own children under 6 yrs 77 28 14 9 26 ------------------------------------------------------------------------------------------------------------------- Source: 2000 FSM Census
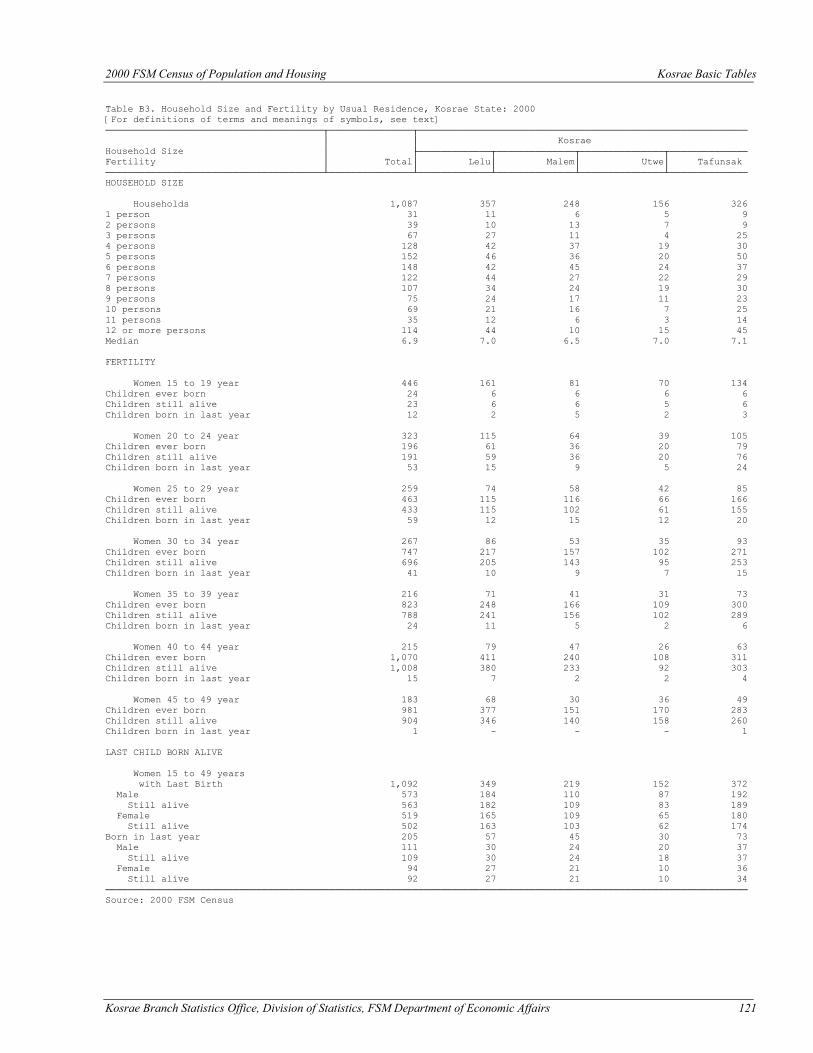
2000 FSM Census of Population and Housing Kosrae Basic Tables
Kosrae Branch Statistics Office, Division of Statistics, FSM Department of Economic Affairs 121
Table B3. Household Size and Fertility by Usual Residence, Kosrae State: 2000 [For definitions of terms and meanings of symbols, see text] ───────────────────────────────────────┬───────────────┬─────────────────────────────────────────────────────────── │ │ Kosrae Household Size │ ├─────────────┬──────────────┬───────────────┬────────────── Fertility │ Total│ Lelu│ Malem│ Utwe│ Tafunsak ───────────────────────────────────────┴───────────────┴─────────────┴──────────────┴───────────────┴────────────── HOUSEHOLD SIZE Households 1,087 357 248 156 326 1 person 31 11 6 5 9 2 persons 39 10 13 7 9 3 persons 67 27 11 4 25 4 persons 128 42 37 19 30 5 persons 152 46 36 20 50 6 persons 148 42 45 24 37 7 persons 122 44 27 22 29 8 persons 107 34 24 19 30 9 persons 75 24 17 11 23 10 persons 69 21 16 7 25 11 persons 35 12 6 3 14 12 or more persons 114 44 10 15 45 Median 6.9 7.0 6.5 7.0 7.1 FERTILITY Women 15 to 19 year 446 161 81 70 134 Children ever born 24 6 6 6 6 Children still alive 23 6 6 5 6 Children born in last year 12 2 5 2 3 Women 20 to 24 year 323 115 64 39 105 Children ever born 196 61 36 20 79 Children still alive 191 59 36 20 76 Children born in last year 53 15 9 5 24 Women 25 to 29 year 259 74 58 42 85 Children ever born 463 115 116 66 166 Children still alive 433 115 102 61 155 Children born in last year 59 12 15 12 20 Women 30 to 34 year 267 86 53 35 93 Children ever born 747 217 157 102 271 Children still alive 696 205 143 95 253 Children born in last year 41 10 9 7 15 Women 35 to 39 year 216 71 41 31 73 Children ever born 823 248 166 109 300 Children still alive 788 241 156 102 289 Children born in last year 24 11 5 2 6 Women 40 to 44 year 215 79 47 26 63 Children ever born 1,070 411 240 108 311 Children still alive 1,008 380 233 92 303 Children born in last year 15 7 2 2 4 Women 45 to 49 year 183 68 30 36 49 Children ever born 981 377 151 170 283 Children still alive 904 346 140 158 260 Children born in last year 1 - - - 1 LAST CHILD BORN ALIVE Women 15 to 49 years with Last Birth 1,092 349 219 152 372 Male 573 184 110 87 192 Still alive 563 182 109 83 189 Female 519 165 109 65 180 Still alive 502 163 103 62 174 Born in last year 205 57 45 30 73 Male 111 30 24 20 37 Still alive 109 30 24 18 37 Female 94 27 21 10 36 Still alive 92 27 21 10 34 ─────────────────────────────────────────────────────────────────────────────────────────────────────────────────── Source: 2000 FSM Census
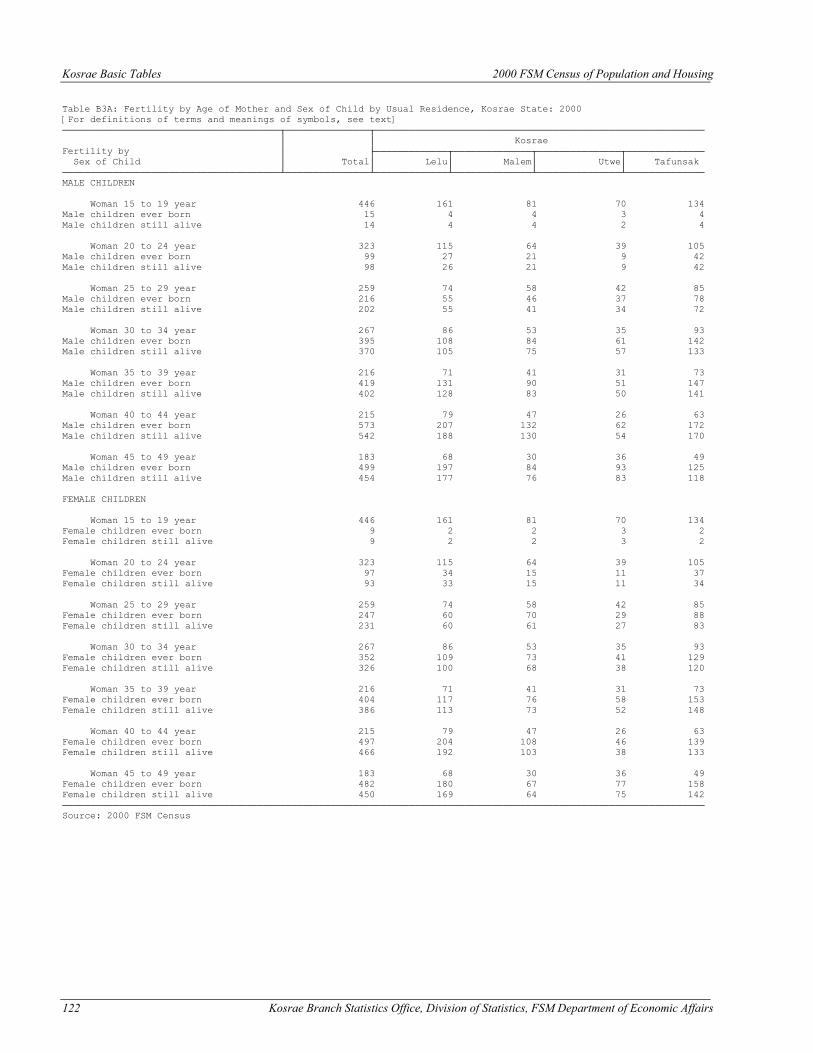
Kosrae Basic Tables 2000 FSM Census of Population and Housing
122 Kosrae Branch Statistics Office, Division of Statistics, FSM Department of Economic Affairs
Table B3A: Fertility by Age of Mother and Sex of Child by Usual Residence, Kosrae State: 2000 [For definitions of terms and meanings of symbols, see text] ───────────────────────────────────────┬───────────────┬─────────────────────────────────────────────────────────── │ │ Kosrae Fertility by │ ├─────────────┬──────────────┬───────────────┬────────────── Sex of Child │ Total│ Lelu│ Malem│ Utwe│ Tafunsak ───────────────────────────────────────┴───────────────┴─────────────┴──────────────┴───────────────┴────────────── MALE CHILDREN Woman 15 to 19 year 446 161 81 70 134 Male children ever born 15 4 4 3 4 Male children still alive 14 4 4 2 4 Woman 20 to 24 year 323 115 64 39 105 Male children ever born 99 27 21 9 42 Male children still alive 98 26 21 9 42 Woman 25 to 29 year 259 74 58 42 85 Male children ever born 216 55 46 37 78 Male children still alive 202 55 41 34 72 Woman 30 to 34 year 267 86 53 35 93 Male children ever born 395 108 84 61 142 Male children still alive 370 105 75 57 133 Woman 35 to 39 year 216 71 41 31 73 Male children ever born 419 131 90 51 147 Male children still alive 402 128 83 50 141 Woman 40 to 44 year 215 79 47 26 63 Male children ever born 573 207 132 62 172 Male children still alive 542 188 130 54 170 Woman 45 to 49 year 183 68 30 36 49 Male children ever born 499 197 84 93 125 Male children still alive 454 177 76 83 118 FEMALE CHILDREN Woman 15 to 19 year 446 161 81 70 134 Female children ever born 9 2 2 3 2 Female children still alive 9 2 2 3 2 Woman 20 to 24 year 323 115 64 39 105 Female children ever born 97 34 15 11 37 Female children still alive 93 33 15 11 34 Woman 25 to 29 year 259 74 58 42 85 Female children ever born 247 60 70 29 88 Female children still alive 231 60 61 27 83 Woman 30 to 34 year 267 86 53 35 93 Female children ever born 352 109 73 41 129 Female children still alive 326 100 68 38 120 Woman 35 to 39 year 216 71 41 31 73 Female children ever born 404 117 76 58 153 Female children still alive 386 113 73 52 148 Woman 40 to 44 year 215 79 47 26 63 Female children ever born 497 204 108 46 139 Female children still alive 466 192 103 38 133 Woman 45 to 49 year 183 68 30 36 49 Female children ever born 482 180 67 77 158 Female children still alive 450 169 64 75 142 ─────────────────────────────────────────────────────────────────────────────────────────────────────────────────── Source: 2000 FSM Census
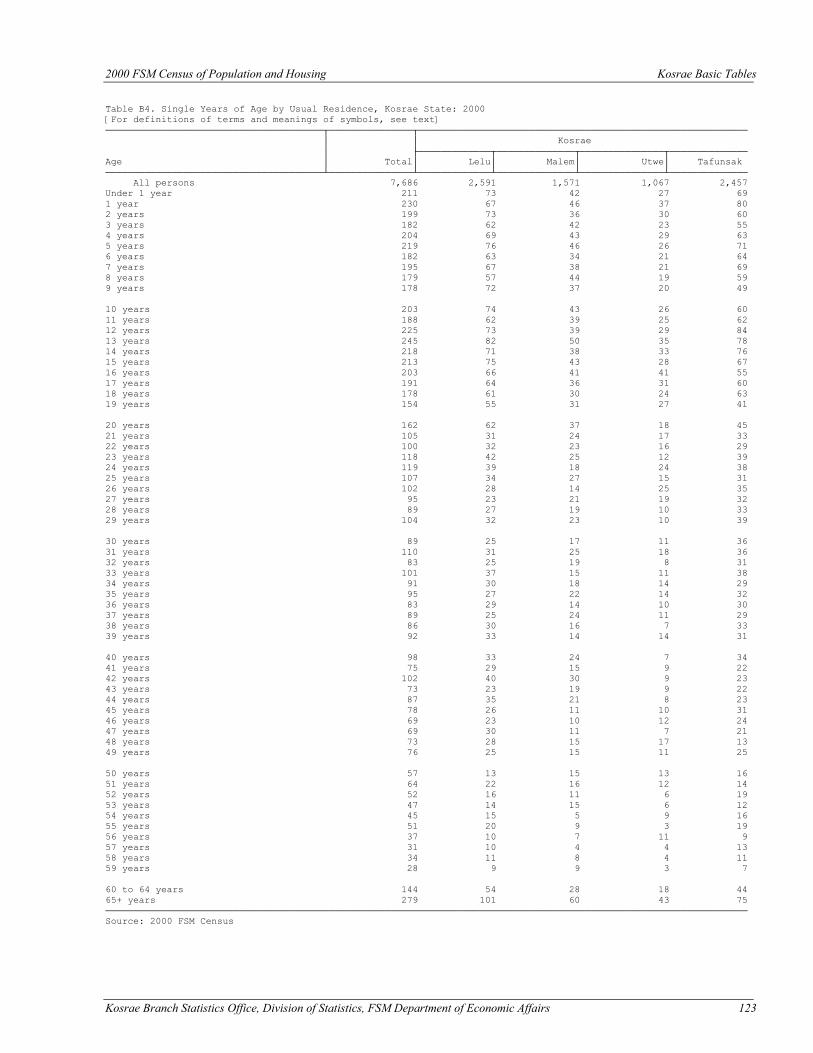
2000 FSM Census of Population and Housing Kosrae Basic Tables
Kosrae Branch Statistics Office, Division of Statistics, FSM Department of Economic Affairs 123
Table B4. Single Years of Age by Usual Residence, Kosrae State: 2000 [For definitions of terms and meanings of symbols, see text] ───────────────────────────────────────┬───────────────┬─────────────────────────────────────────────────────────── │ │ Kosrae │ ├─────────────┬──────────────┬───────────────┬────────────── Age │ Total│ Lelu│ Malem│ Utwe│ Tafunsak ───────────────────────────────────────┴───────────────┴─────────────┴──────────────┴───────────────┴────────────── All persons 7,686 2,591 1,571 1,067 2,457 Under 1 year 211 73 42 27 69 1 year 230 67 46 37 80 2 years 199 73 36 30 60 3 years 182 62 42 23 55 4 years 204 69 43 29 63 5 years 219 76 46 26 71 6 years 182 63 34 21 64 7 years 195 67 38 21 69 8 years 179 57 44 19 59 9 years 178 72 37 20 49 10 years 203 74 43 26 60 11 years 188 62 39 25 62 12 years 225 73 39 29 84 13 years 245 82 50 35 78 14 years 218 71 38 33 76 15 years 213 75 43 28 67 16 years 203 66 41 41 55 17 years 191 64 36 31 60 18 years 178 61 30 24 63 19 years 154 55 31 27 41 20 years 162 62 37 18 45 21 years 105 31 24 17 33 22 years 100 32 23 16 29 23 years 118 42 25 12 39 24 years 119 39 18 24 38 25 years 107 34 27 15 31 26 years 102 28 14 25 35 27 years 95 23 21 19 32 28 years 89 27 19 10 33 29 years 104 32 23 10 39 30 years 89 25 17 11 36 31 years 110 31 25 18 36 32 years 83 25 19 8 31 33 years 101 37 15 11 38 34 years 91 30 18 14 29 35 years 95 27 22 14 32 36 years 83 29 14 10 30 37 years 89 25 24 11 29 38 years 86 30 16 7 33 39 years 92 33 14 14 31 40 years 98 33 24 7 34 41 years 75 29 15 9 22 42 years 102 40 30 9 23 43 years 73 23 19 9 22 44 years 87 35 21 8 23 45 years 78 26 11 10 31 46 years 69 23 10 12 24 47 years 69 30 11 7 21 48 years 73 28 15 17 13 49 years 76 25 15 11 25 50 years 57 13 15 13 16 51 years 64 22 16 12 14 52 years 52 16 11 6 19 53 years 47 14 15 6 12 54 years 45 15 5 9 16 55 years 51 20 9 3 19 56 years 37 10 7 11 9 57 years 31 10 4 4 13 58 years 34 11 8 4 11 59 years 28 9 9 3 7 60 to 64 years 144 54 28 18 44 65+ years 279 101 60 43 75 ─────────────────────────────────────────────────────────────────────────────────────────────────────────────────── Source: 2000 FSM Census
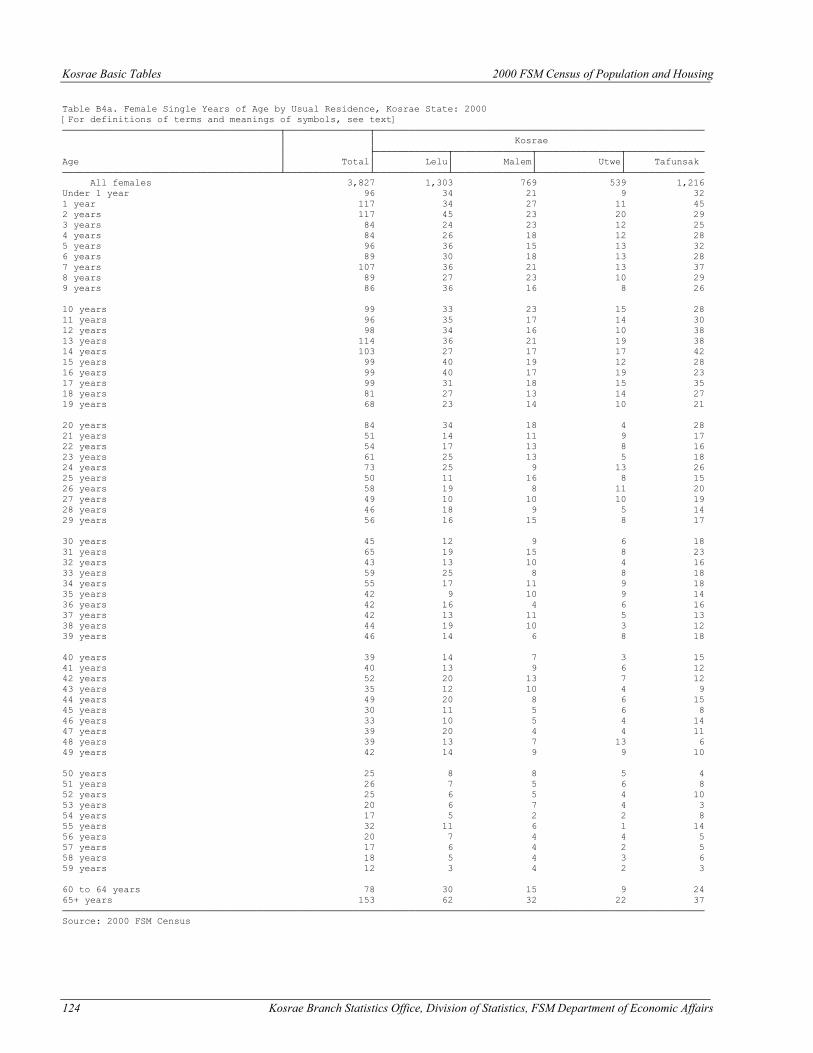
Kosrae Basic Tables 2000 FSM Census of Population and Housing
124 Kosrae Branch Statistics Office, Division of Statistics, FSM Department of Economic Affairs
Table B4a. Female Single Years of Age by Usual Residence, Kosrae State: 2000 [For definitions of terms and meanings of symbols, see text] ───────────────────────────────────────┬───────────────┬─────────────────────────────────────────────────────────── │ │ Kosrae │ ├─────────────┬──────────────┬───────────────┬────────────── Age │ Total│ Lelu│ Malem│ Utwe│ Tafunsak ───────────────────────────────────────┴───────────────┴─────────────┴──────────────┴───────────────┴────────────── All females 3,827 1,303 769 539 1,216 Under 1 year 96 34 21 9 32 1 year 117 34 27 11 45 2 years 117 45 23 20 29 3 years 84 24 23 12 25 4 years 84 26 18 12 28 5 years 96 36 15 13 32 6 years 89 30 18 13 28 7 years 107 36 21 13 37 8 years 89 27 23 10 29 9 years 86 36 16 8 26 10 years 99 33 23 15 28 11 years 96 35 17 14 30 12 years 98 34 16 10 38 13 years 114 36 21 19 38 14 years 103 27 17 17 42 15 years 99 40 19 12 28 16 years 99 40 17 19 23 17 years 99 31 18 15 35 18 years 81 27 13 14 27 19 years 68 23 14 10 21 20 years 84 34 18 4 28 21 years 51 14 11 9 17 22 years 54 17 13 8 16 23 years 61 25 13 5 18 24 years 73 25 9 13 26 25 years 50 11 16 8 15 26 years 58 19 8 11 20 27 years 49 10 10 10 19 28 years 46 18 9 5 14 29 years 56 16 15 8 17 30 years 45 12 9 6 18 31 years 65 19 15 8 23 32 years 43 13 10 4 16 33 years 59 25 8 8 18 34 years 55 17 11 9 18 35 years 42 9 10 9 14 36 years 42 16 4 6 16 37 years 42 13 11 5 13 38 years 44 19 10 3 12 39 years 46 14 6 8 18 40 years 39 14 7 3 15 41 years 40 13 9 6 12 42 years 52 20 13 7 12 43 years 35 12 10 4 9 44 years 49 20 8 6 15 45 years 30 11 5 6 8 46 years 33 10 5 4 14 47 years 39 20 4 4 11 48 years 39 13 7 13 6 49 years 42 14 9 9 10 50 years 25 8 8 5 4 51 years 26 7 5 6 8 52 years 25 6 5 4 10 53 years 20 6 7 4 3 54 years 17 5 2 2 8 55 years 32 11 6 1 14 56 years 20 7 4 4 5 57 years 17 6 4 2 5 58 years 18 5 4 3 6 59 years 12 3 4 2 3 60 to 64 years 78 30 15 9 24 65+ years 153 62 32 22 37 ─────────────────────────────────────────────────────────────────────────────────────────────────────────────────── Source: 2000 FSM Census
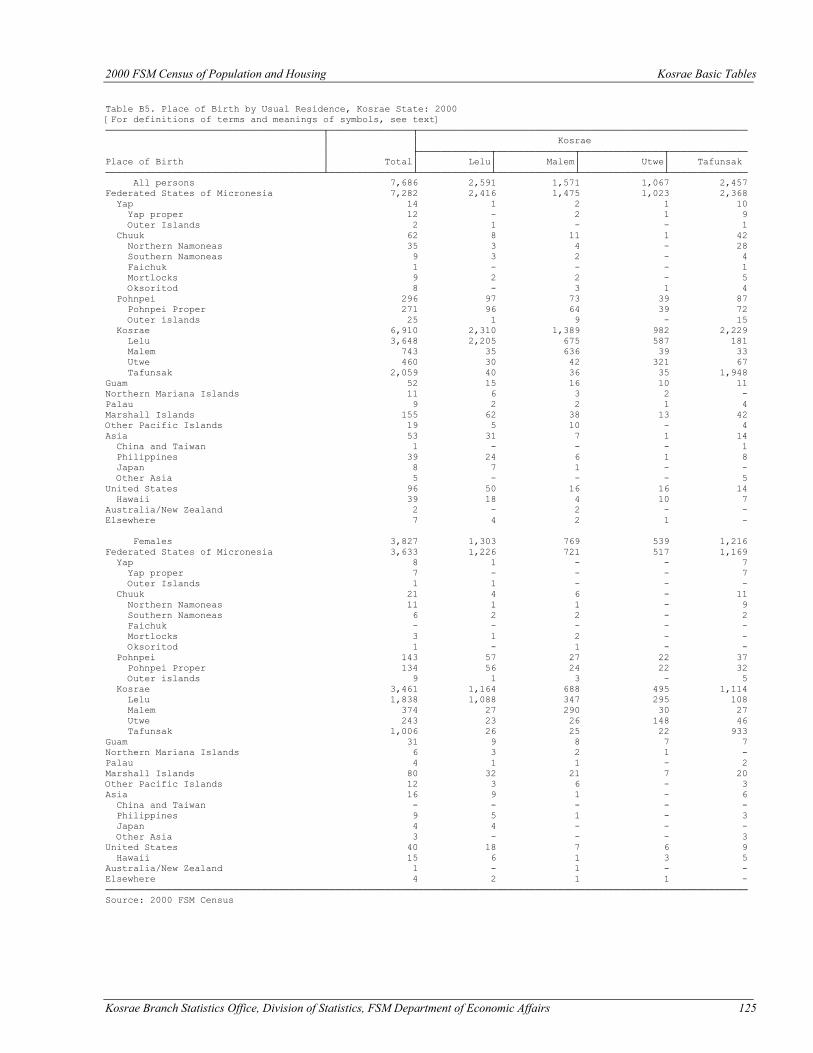
2000 FSM Census of Population and Housing Kosrae Basic Tables
Kosrae Branch Statistics Office, Division of Statistics, FSM Department of Economic Affairs 125
Table B5. Place of Birth by Usual Residence, Kosrae State: 2000 [For definitions of terms and meanings of symbols, see text] ───────────────────────────────────────┬───────────────┬─────────────────────────────────────────────────────────── │ │ Kosrae │ ├─────────────┬──────────────┬───────────────┬────────────── Place of Birth │ Total│ Lelu│ Malem│ Utwe│ Tafunsak ───────────────────────────────────────┴───────────────┴─────────────┴──────────────┴───────────────┴────────────── All persons 7,686 2,591 1,571 1,067 2,457 Federated States of Micronesia 7,282 2,416 1,475 1,023 2,368 Yap 14 1 2 1 10 Yap proper 12 - 2 1 9 Outer Islands 2 1 - - 1 Chuuk 62 8 11 1 42 Northern Namoneas 35 3 4 - 28 Southern Namoneas 9 3 2 - 4 Faichuk 1 - - - 1 Mortlocks 9 2 2 - 5 Oksoritod 8 - 3 1 4 Pohnpei 296 97 73 39 87 Pohnpei Proper 271 96 64 39 72 Outer islands 25 1 9 - 15 Kosrae 6,910 2,310 1,389 982 2,229 Lelu 3,648 2,205 675 587 181 Malem 743 35 636 39 33 Utwe 460 30 42 321 67 Tafunsak 2,059 40 36 35 1,948 Guam 52 15 16 10 11 Northern Mariana Islands 11 6 3 2 - Palau 9 2 2 1 4 Marshall Islands 155 62 38 13 42 Other Pacific Islands 19 5 10 - 4 Asia 53 31 7 1 14 China and Taiwan 1 - - - 1 Philippines 39 24 6 1 8 Japan 8 7 1 - - Other Asia 5 - - - 5 United States 96 50 16 16 14 Hawaii 39 18 4 10 7 Australia/New Zealand 2 - 2 - - Elsewhere 7 4 2 1 - Females 3,827 1,303 769 539 1,216 Federated States of Micronesia 3,633 1,226 721 517 1,169 Yap 8 1 - - 7 Yap proper 7 - - - 7 Outer Islands 1 1 - - - Chuuk 21 4 6 - 11 Northern Namoneas 11 1 1 - 9 Southern Namoneas 6 2 2 - 2 Faichuk - - - - - Mortlocks 3 1 2 - - Oksoritod 1 - 1 - - Pohnpei 143 57 27 22 37 Pohnpei Proper 134 56 24 22 32 Outer islands 9 1 3 - 5 Kosrae 3,461 1,164 688 495 1,114 Lelu 1,838 1,088 347 295 108 Malem 374 27 290 30 27 Utwe 243 23 26 148 46 Tafunsak 1,006 26 25 22 933 Guam 31 9 8 7 7 Northern Mariana Islands 6 3 2 1 - Palau 4 1 1 - 2 Marshall Islands 80 32 21 7 20 Other Pacific Islands 12 3 6 - 3 Asia 16 9 1 - 6 China and Taiwan - - - - - Philippines 9 5 1 - 3 Japan 4 4 - - - Other Asia 3 - - - 3 United States 40 18 7 6 9 Hawaii 15 6 1 3 5 Australia/New Zealand 1 - 1 - - Elsewhere 4 2 1 1 - ─────────────────────────────────────────────────────────────────────────────────────────────────────────────────── Source: 2000 FSM Census
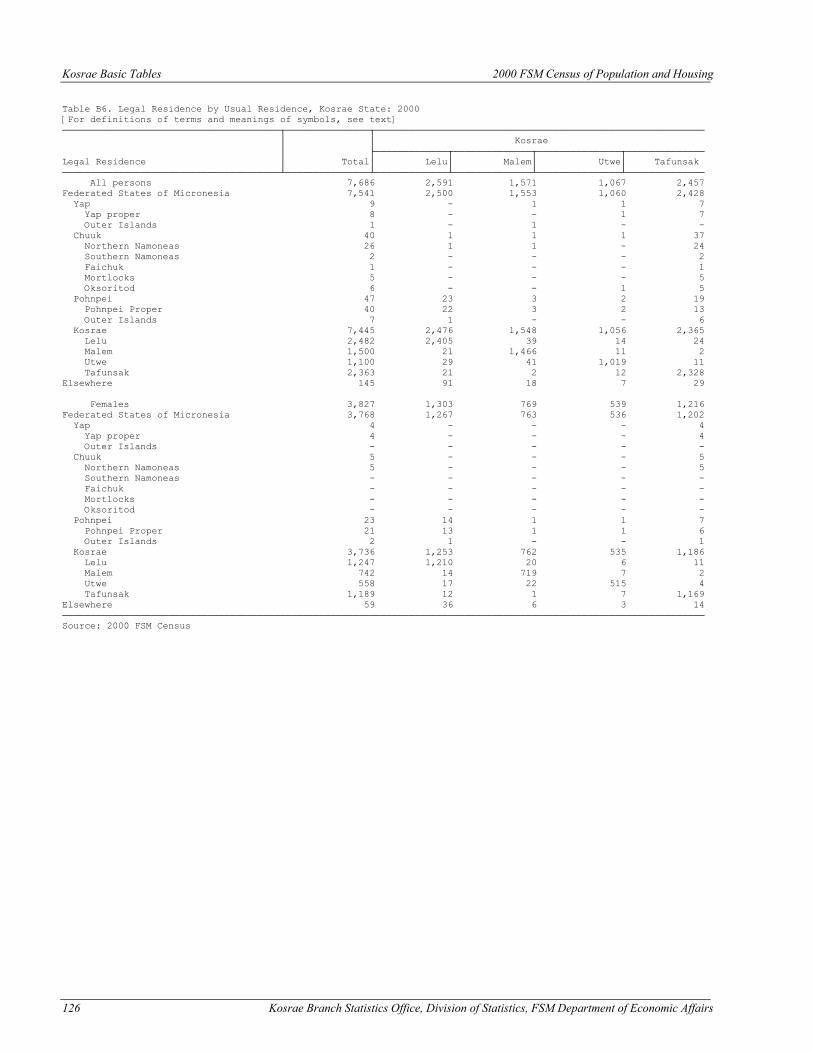
Kosrae Basic Tables 2000 FSM Census of Population and Housing
126 Kosrae Branch Statistics Office, Division of Statistics, FSM Department of Economic Affairs
Table B6. Legal Residence by Usual Residence, Kosrae State: 2000 [For definitions of terms and meanings of symbols, see text] ───────────────────────────────────────┬───────────────┬─────────────────────────────────────────────────────────── │ │ Kosrae │ ├─────────────┬──────────────┬───────────────┬────────────── Legal Residence │ Total│ Lelu│ Malem│ Utwe│ Tafunsak ───────────────────────────────────────┴───────────────┴─────────────┴──────────────┴───────────────┴────────────── All persons 7,686 2,591 1,571 1,067 2,457 Federated States of Micronesia 7,541 2,500 1,553 1,060 2,428 Yap 9 - 1 1 7 Yap proper 8 - - 1 7 Outer Islands 1 - 1 - - Chuuk 40 1 1 1 37 Northern Namoneas 26 1 1 - 24 Southern Namoneas 2 - - - 2 Faichuk 1 - - - 1 Mortlocks 5 - - - 5 Oksoritod 6 - - 1 5 Pohnpei 47 23 3 2 19 Pohnpei Proper 40 22 3 2 13 Outer Islands 7 1 - - 6 Kosrae 7,445 2,476 1,548 1,056 2,365 Lelu 2,482 2,405 39 14 24 Malem 1,500 21 1,466 11 2 Utwe 1,100 29 41 1,019 11 Tafunsak 2,363 21 2 12 2,328 Elsewhere 145 91 18 7 29 Females 3,827 1,303 769 539 1,216 Federated States of Micronesia 3,768 1,267 763 536 1,202 Yap 4 - - - 4 Yap proper 4 - - - 4 Outer Islands - - - - - Chuuk 5 - - - 5 Northern Namoneas 5 - - - 5 Southern Namoneas - - - - - Faichuk - - - - - Mortlocks - - - - - Oksoritod - - - - - Pohnpei 23 14 1 1 7 Pohnpei Proper 21 13 1 1 6 Outer Islands 2 1 - - 1 Kosrae 3,736 1,253 762 535 1,186 Lelu 1,247 1,210 20 6 11 Malem 742 14 719 7 2 Utwe 558 17 22 515 4 Tafunsak 1,189 12 1 7 1,169 Elsewhere 59 36 6 3 14 ─────────────────────────────────────────────────────────────────────────────────────────────────────────────────── Source: 2000 FSM Census
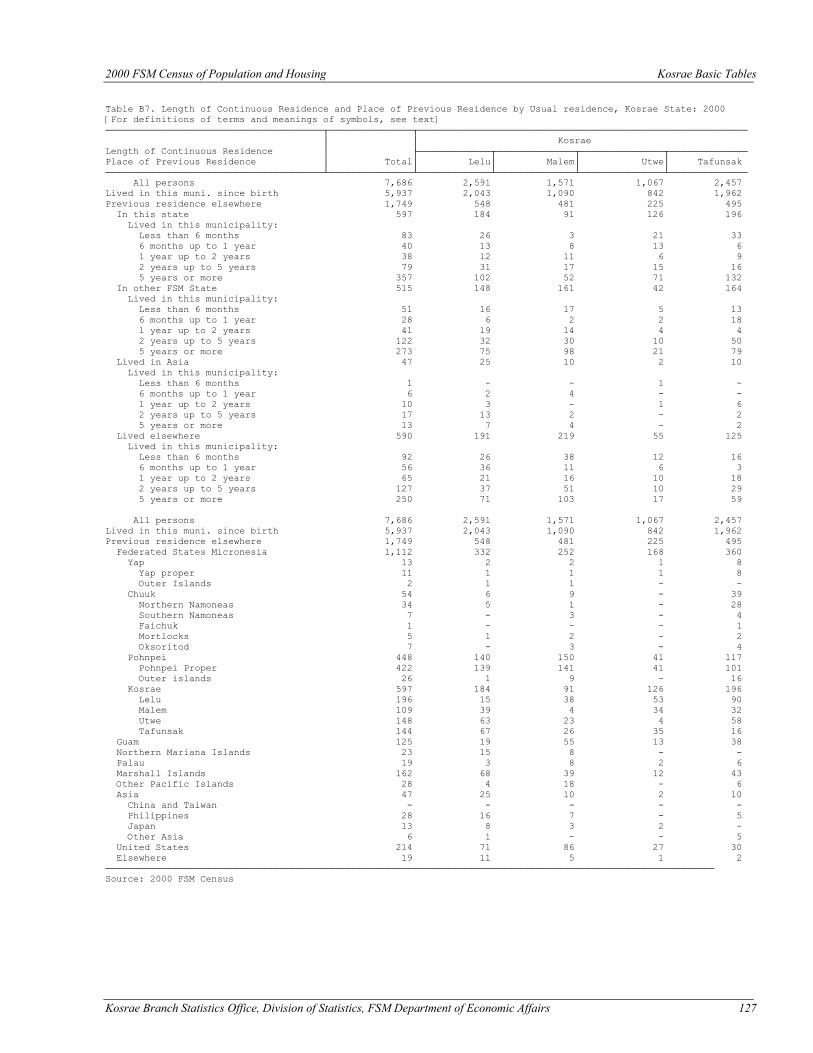
2000 FSM Census of Population and Housing Kosrae Basic Tables
Kosrae Branch Statistics Office, Division of Statistics, FSM Department of Economic Affairs 127
Table B7. Length of Continuous Residence and Place of Previous Residence by Usual residence, Kosrae State: 2000 [For definitions of terms and meanings of symbols, see text] ───────────────────────────────────────┬───────────────┬─────────────────────────────────────────────────────────── │ │ Kosrae Length of Continuous Residence │ ├─────────────┬──────────────┬───────────────┬────────────── Place of Previous Residence │ Total│ Lelu│ Malem│ Utwe│ Tafunsak ───────────────────────────────────────┴───────────────┴─────────────┴──────────────┴───────────────┴────────────── All persons 7,686 2,591 1,571 1,067 2,457 Lived in this muni. since birth 5,937 2,043 1,090 842 1,962 Previous residence elsewhere 1,749 548 481 225 495 In this state 597 184 91 126 196 Lived in this municipality: Less than 6 months 83 26 3 21 33 6 months up to 1 year 40 13 8 13 6 1 year up to 2 years 38 12 11 6 9 2 years up to 5 years 79 31 17 15 16 5 years or more 357 102 52 71 132 In other FSM State 515 148 161 42 164 Lived in this municipality: Less than 6 months 51 16 17 5 13 6 months up to 1 year 28 6 2 2 18 1 year up to 2 years 41 19 14 4 4 2 years up to 5 years 122 32 30 10 50 5 years or more 273 75 98 21 79 Lived in Asia 47 25 10 2 10 Lived in this municipality: Less than 6 months 1 - - 1 - 6 months up to 1 year 6 2 4 - - 1 year up to 2 years 10 3 - 1 6 2 years up to 5 years 17 13 2 - 2 5 years or more 13 7 4 - 2 Lived elsewhere 590 191 219 55 125 Lived in this municipality: Less than 6 months 92 26 38 12 16 6 months up to 1 year 56 36 11 6 3 1 year up to 2 years 65 21 16 10 18 2 years up to 5 years 127 37 51 10 29 5 years or more 250 71 103 17 59 All persons 7,686 2,591 1,571 1,067 2,457 Lived in this muni. since birth 5,937 2,043 1,090 842 1,962 Previous residence elsewhere 1,749 548 481 225 495 Federated States Micronesia 1,112 332 252 168 360 Yap 13 2 2 1 8 Yap proper 11 1 1 1 8 Outer Islands 2 1 1 - - Chuuk 54 6 9 - 39 Northern Namoneas 34 5 1 - 28 Southern Namoneas 7 - 3 - 4 Faichuk 1 - - - 1 Mortlocks 5 1 2 - 2 Oksoritod 7 - 3 - 4 Pohnpei 448 140 150 41 117 Pohnpei Proper 422 139 141 41 101 Outer islands 26 1 9 - 16 Kosrae 597 184 91 126 196 Lelu 196 15 38 53 90 Malem 109 39 4 34 32 Utwe 148 63 23 4 58 Tafunsak 144 67 26 35 16 Guam 125 19 55 13 38 Northern Mariana Islands 23 15 8 - - Palau 19 3 8 2 6 Marshall Islands 162 68 39 12 43 Other Pacific Islands 28 4 18 - 6 Asia 47 25 10 2 10 China and Taiwan - - - - - Philippines 28 16 7 - 5 Japan 13 8 3 2 - Other Asia 6 1 - - 5 United States 214 71 86 27 30 Elsewhere 19 11 5 1 2 ───────────────────────────────────────────────────────────────────────────────────────────────────────────── Source: 2000 FSM Census
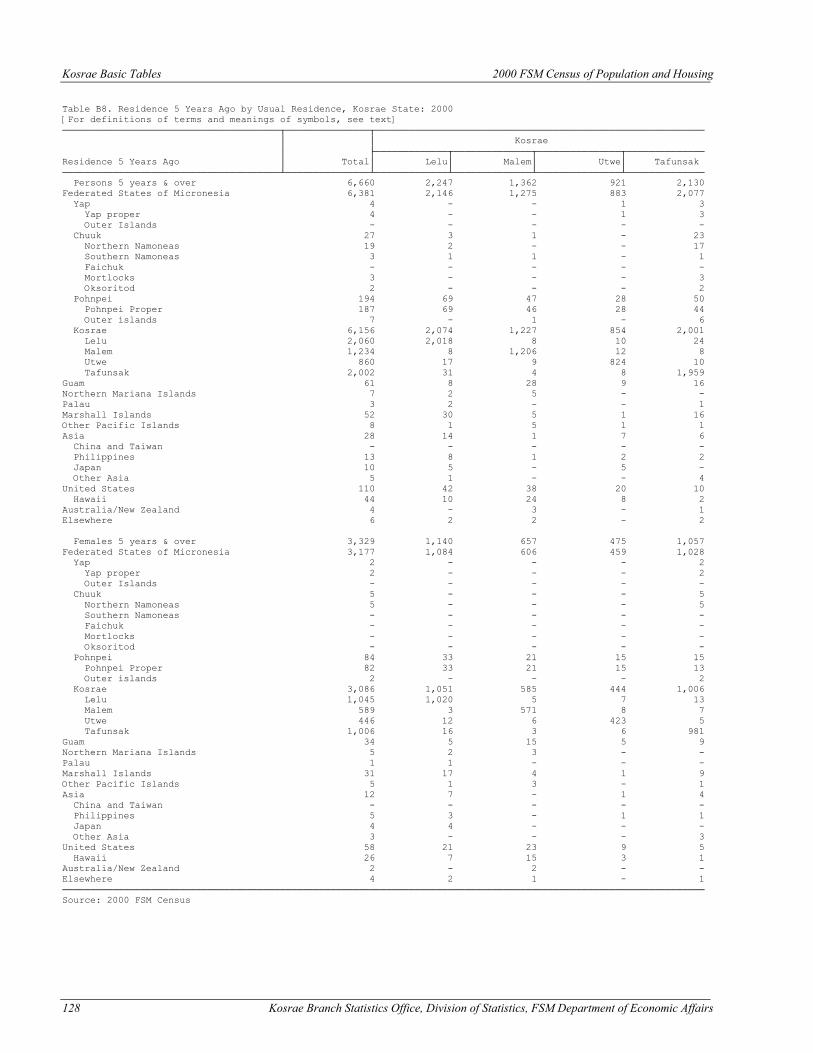
Kosrae Basic Tables 2000 FSM Census of Population and Housing
128 Kosrae Branch Statistics Office, Division of Statistics, FSM Department of Economic Affairs
Table B8. Residence 5 Years Ago by Usual Residence, Kosrae State: 2000 [For definitions of terms and meanings of symbols, see text] ───────────────────────────────────────┬───────────────┬─────────────────────────────────────────────────────────── │ │ Kosrae │ ├─────────────┬──────────────┬───────────────┬────────────── Residence 5 Years Ago │ Total│ Lelu│ Malem│ Utwe│ Tafunsak ───────────────────────────────────────┴───────────────┴─────────────┴──────────────┴───────────────┴────────────── Persons 5 years & over 6,660 2,247 1,362 921 2,130 Federated States of Micronesia 6,381 2,146 1,275 883 2,077 Yap 4 - - 1 3 Yap proper 4 - - 1 3 Outer Islands - - - - - Chuuk 27 3 1 - 23 Northern Namoneas 19 2 - - 17 Southern Namoneas 3 1 1 - 1 Faichuk - - - - - Mortlocks 3 - - - 3 Oksoritod 2 - - - 2 Pohnpei 194 69 47 28 50 Pohnpei Proper 187 69 46 28 44 Outer islands 7 - 1 - 6 Kosrae 6,156 2,074 1,227 854 2,001 Lelu 2,060 2,018 8 10 24 Malem 1,234 8 1,206 12 8 Utwe 860 17 9 824 10 Tafunsak 2,002 31 4 8 1,959 Guam 61 8 28 9 16 Northern Mariana Islands 7 2 5 - - Palau 3 2 - - 1 Marshall Islands 52 30 5 1 16 Other Pacific Islands 8 1 5 1 1 Asia 28 14 1 7 6 China and Taiwan - - - - - Philippines 13 8 1 2 2 Japan 10 5 - 5 - Other Asia 5 1 - - 4 United States 110 42 38 20 10 Hawaii 44 10 24 8 2 Australia/New Zealand 4 - 3 - 1 Elsewhere 6 2 2 - 2 Females 5 years & over 3,329 1,140 657 475 1,057 Federated States of Micronesia 3,177 1,084 606 459 1,028 Yap 2 - - - 2 Yap proper 2 - - - 2 Outer Islands - - - - - Chuuk 5 - - - 5 Northern Namoneas 5 - - - 5 Southern Namoneas - - - - - Faichuk - - - - - Mortlocks - - - - - Oksoritod - - - - - Pohnpei 84 33 21 15 15 Pohnpei Proper 82 33 21 15 13 Outer islands 2 - - - 2 Kosrae 3,086 1,051 585 444 1,006 Lelu 1,045 1,020 5 7 13 Malem 589 3 571 8 7 Utwe 446 12 6 423 5 Tafunsak 1,006 16 3 6 981 Guam 34 5 15 5 9 Northern Mariana Islands 5 2 3 - - Palau 1 1 - - - Marshall Islands 31 17 4 1 9 Other Pacific Islands 5 1 3 - 1 Asia 12 7 - 1 4 China and Taiwan - - - - - Philippines 5 3 - 1 1 Japan 4 4 - - - Other Asia 3 - - - 3 United States 58 21 23 9 5 Hawaii 26 7 15 3 1 Australia/New Zealand 2 - 2 - - Elsewhere 4 2 1 - 1 ─────────────────────────────────────────────────────────────────────────────────────────────────────────────────── Source: 2000 FSM Census
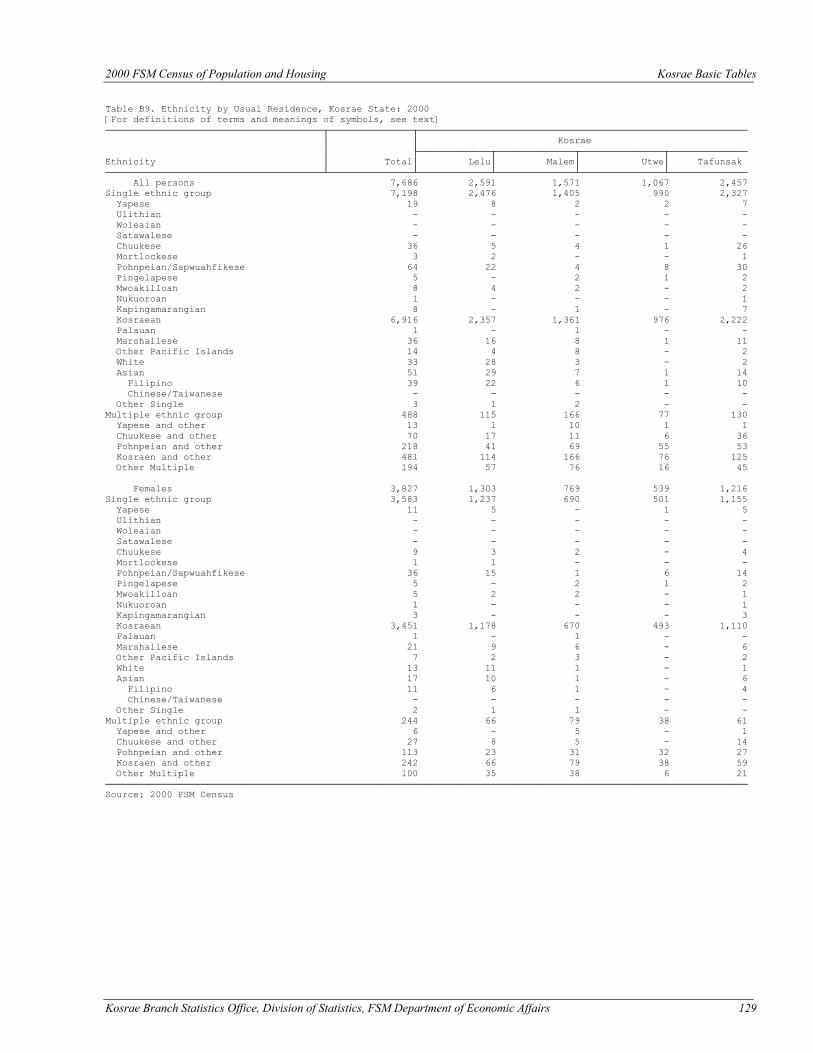
2000 FSM Census of Population and Housing Kosrae Basic Tables
Kosrae Branch Statistics Office, Division of Statistics, FSM Department of Economic Affairs 129
Table B9. Ethnicity by Usual Residence, Kosrae State: 2000 [For definitions of terms and meanings of symbols, see text] ───────────────────────────────────────┬───────────────┬─────────────────────────────────────────────────────────── │ │ Kosrae │ ├─────────────┬──────────────┬───────────────┬────────────── Ethnicity │ Total│ Lelu│ Malem│ Utwe│ Tafunsak ───────────────────────────────────────┴───────────────┴─────────────┴──────────────┴───────────────┴────────────── All persons 7,686 2,591 1,571 1,067 2,457 Single ethnic group 7,198 2,476 1,405 990 2,327 Yapese 19 8 2 2 7 Ulithian - - - - - Woleaian - - - - - Satawalese - - - - - Chuukese 36 5 4 1 26 Mortlockese 3 2 - - 1 Pohnpeian/Sapwuahfikese 64 22 4 8 30 Pingelapese 5 - 2 1 2 Mwoakilloan 8 4 2 - 2 Nukuoroan 1 - - - 1 Kapingamarangian 8 - 1 - 7 Kosraean 6,916 2,357 1,361 976 2,222 Palauan 1 - 1 - - Marshallese 36 16 8 1 11 Other Pacific Islands 14 4 8 - 2 White 33 28 3 - 2 Asian 51 29 7 1 14 Filipino 39 22 6 1 10 Chinese/Taiwanese - - - - - Other Single 3 1 2 - - Multiple ethnic group 488 115 166 77 130 Yapese and other 13 1 10 1 1 Chuukese and other 70 17 11 6 36 Pohnpeian and other 218 41 69 55 53 Kosraen and other 481 114 166 76 125 Other Multiple 194 57 76 16 45 Females 3,827 1,303 769 539 1,216 Single ethnic group 3,583 1,237 690 501 1,155 Yapese 11 5 - 1 5 Ulithian - - - - - Woleaian - - - - - Satawalese - - - - - Chuukese 9 3 2 - 4 Mortlockese 1 1 - - - Pohnpeian/Sapwuahfikese 36 15 1 6 14 Pingelapese 5 - 2 1 2 Mwoakilloan 5 2 2 - 1 Nukuoroan 1 - - - 1 Kapingamarangian 3 - - - 3 Kosraean 3,451 1,178 670 493 1,110 Palauan 1 - 1 - - Marshallese 21 9 6 - 6 Other Pacific Islands 7 2 3 - 2 White 13 11 1 - 1 Asian 17 10 1 - 6 Filipino 11 6 1 - 4 Chinese/Taiwanese - - - - - Other Single 2 1 1 - - Multiple ethnic group 244 66 79 38 61 Yapese and other 6 - 5 - 1 Chuukese and other 27 8 5 - 14 Pohnpeian and other 113 23 31 32 27 Kosraen and other 242 66 79 38 59 Other Multiple 100 35 38 6 21 ─────────────────────────────────────────────────────────────────────────────────────────────────────────────────── Source: 2000 FSM Census
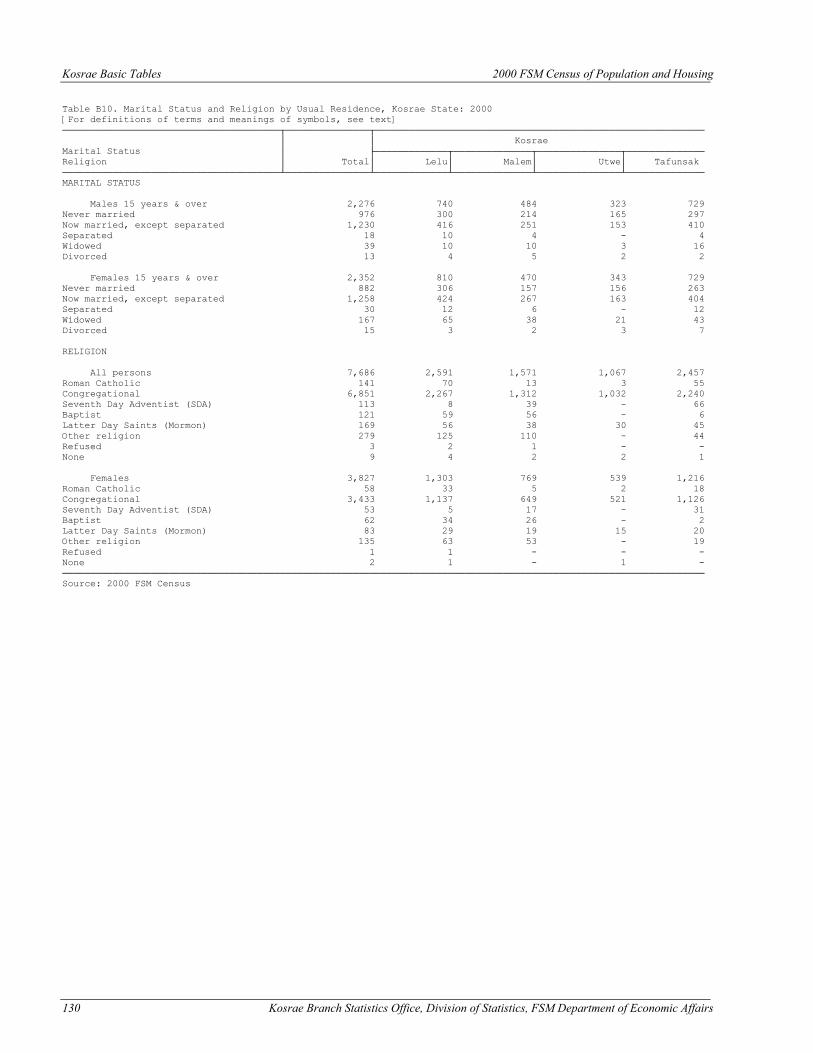
Kosrae Basic Tables 2000 FSM Census of Population and Housing
130 Kosrae Branch Statistics Office, Division of Statistics, FSM Department of Economic Affairs
Table B10. Marital Status and Religion by Usual Residence, Kosrae State: 2000 [For definitions of terms and meanings of symbols, see text] ───────────────────────────────────────┬───────────────┬─────────────────────────────────────────────────────────── │ │ Kosrae Marital Status │ ├─────────────┬──────────────┬───────────────┬────────────── Religion │ Total│ Lelu│ Malem│ Utwe│ Tafunsak ───────────────────────────────────────┴───────────────┴─────────────┴──────────────┴───────────────┴────────────── MARITAL STATUS Males 15 years & over 2,276 740 484 323 729 Never married 976 300 214 165 297 Now married, except separated 1,230 416 251 153 410 Separated 18 10 4 - 4 Widowed 39 10 10 3 16 Divorced 13 4 5 2 2 Females 15 years & over 2,352 810 470 343 729 Never married 882 306 157 156 263 Now married, except separated 1,258 424 267 163 404 Separated 30 12 6 - 12 Widowed 167 65 38 21 43 Divorced 15 3 2 3 7 RELIGION All persons 7,686 2,591 1,571 1,067 2,457 Roman Catholic 141 70 13 3 55 Congregational 6,851 2,267 1,312 1,032 2,240 Seventh Day Adventist (SDA) 113 8 39 - 66 Baptist 121 59 56 - 6 Latter Day Saints (Mormon) 169 56 38 30 45 Other religion 279 125 110 - 44 Refused 3 2 1 - - None 9 4 2 2 1 Females 3,827 1,303 769 539 1,216 Roman Catholic 58 33 5 2 18 Congregational 3,433 1,137 649 521 1,126 Seventh Day Adventist (SDA) 53 5 17 - 31 Baptist 62 34 26 - 2 Latter Day Saints (Mormon) 83 29 19 15 20 Other religion 135 63 53 - 19 Refused 1 1 - - - None 2 1 - 1 - ─────────────────────────────────────────────────────────────────────────────────────────────────────────────────── Source: 2000 FSM Census
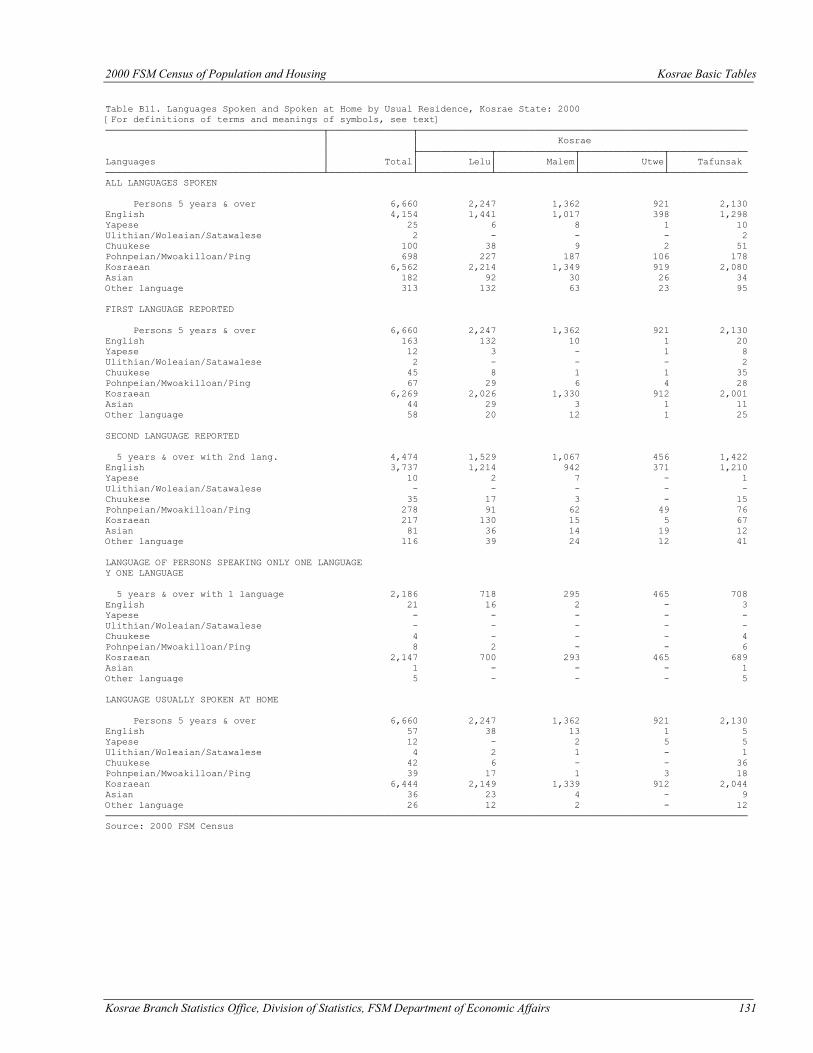
2000 FSM Census of Population and Housing Kosrae Basic Tables
Kosrae Branch Statistics Office, Division of Statistics, FSM Department of Economic Affairs 131
Table B11. Languages Spoken and Spoken at Home by Usual Residence, Kosrae State: 2000 [For definitions of terms and meanings of symbols, see text] ───────────────────────────────────────┬───────────────┬─────────────────────────────────────────────────────────── │ │ Kosrae │ ├─────────────┬──────────────┬───────────────┬────────────── Languages │ Total│ Lelu│ Malem│ Utwe│ Tafunsak ───────────────────────────────────────┴───────────────┴─────────────┴──────────────┴───────────────┴────────────── ALL LANGUAGES SPOKEN Persons 5 years & over 6,660 2,247 1,362 921 2,130 English 4,154 1,441 1,017 398 1,298 Yapese 25 6 8 1 10 Ulithian/Woleaian/Satawalese 2 - - - 2 Chuukese 100 38 9 2 51 Pohnpeian/Mwoakilloan/Ping 698 227 187 106 178 Kosraean 6,562 2,214 1,349 919 2,080 Asian 182 92 30 26 34 Other language 313 132 63 23 95 FIRST LANGUAGE REPORTED Persons 5 years & over 6,660 2,247 1,362 921 2,130 English 163 132 10 1 20 Yapese 12 3 - 1 8 Ulithian/Woleaian/Satawalese 2 - - - 2 Chuukese 45 8 1 1 35 Pohnpeian/Mwoakilloan/Ping 67 29 6 4 28 Kosraean 6,269 2,026 1,330 912 2,001 Asian 44 29 3 1 11 Other language 58 20 12 1 25 SECOND LANGUAGE REPORTED 5 years & over with 2nd lang. 4,474 1,529 1,067 456 1,422 English 3,737 1,214 942 371 1,210 Yapese 10 2 7 - 1 Ulithian/Woleaian/Satawalese - - - - - Chuukese 35 17 3 - 15 Pohnpeian/Mwoakilloan/Ping 278 91 62 49 76 Kosraean 217 130 15 5 67 Asian 81 36 14 19 12 Other language 116 39 24 12 41 LANGUAGE OF PERSONS SPEAKING ONLY ONE LANGUAGE Y ONE LANGUAGE 5 years & over with 1 language 2,186 718 295 465 708 English 21 16 2 - 3 Yapese - - - - - Ulithian/Woleaian/Satawalese - - - - - Chuukese 4 - - - 4 Pohnpeian/Mwoakilloan/Ping 8 2 - - 6 Kosraean 2,147 700 293 465 689 Asian 1 - - - 1 Other language 5 - - - 5 LANGUAGE USUALLY SPOKEN AT HOME Persons 5 years & over 6,660 2,247 1,362 921 2,130 English 57 38 13 1 5 Yapese 12 - 2 5 5 Ulithian/Woleaian/Satawalese 4 2 1 - 1 Chuukese 42 6 - - 36 Pohnpeian/Mwoakilloan/Ping 39 17 1 3 18 Kosraean 6,444 2,149 1,339 912 2,044 Asian 36 23 4 - 9 Other language 26 12 2 - 12 ─────────────────────────────────────────────────────────────────────────────────────────────────────────────────── Source: 2000 FSM Census
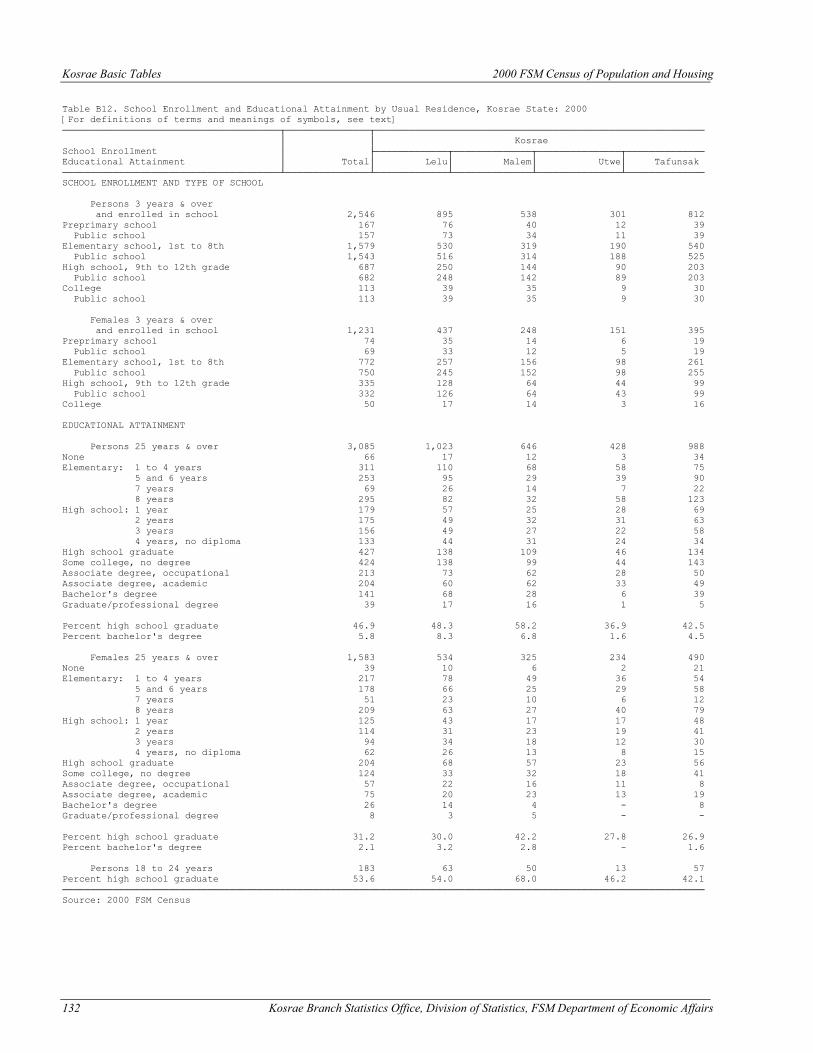
Kosrae Basic Tables 2000 FSM Census of Population and Housing
132 Kosrae Branch Statistics Office, Division of Statistics, FSM Department of Economic Affairs
Table B12. School Enrollment and Educational Attainment by Usual Residence, Kosrae State: 2000 [For definitions of terms and meanings of symbols, see text] ───────────────────────────────────────┬───────────────┬─────────────────────────────────────────────────────────── │ │ Kosrae School Enrollment │ ├─────────────┬──────────────┬───────────────┬────────────── Educational Attainment │ Total│ Lelu│ Malem│ Utwe│ Tafunsak ───────────────────────────────────────┴───────────────┴─────────────┴──────────────┴───────────────┴────────────── SCHOOL ENROLLMENT AND TYPE OF SCHOOL Persons 3 years & over and enrolled in school 2,546 895 538 301 812 Preprimary school 167 76 40 12 39 Public school 157 73 34 11 39 Elementary school, 1st to 8th 1,579 530 319 190 540 Public school 1,543 516 314 188 525 High school, 9th to 12th grade 687 250 144 90 203 Public school 682 248 142 89 203 College 113 39 35 9 30 Public school 113 39 35 9 30 Females 3 years & over and enrolled in school 1,231 437 248 151 395 Preprimary school 74 35 14 6 19 Public school 69 33 12 5 19 Elementary school, 1st to 8th 772 257 156 98 261 Public school 750 245 152 98 255 High school, 9th to 12th grade 335 128 64 44 99 Public school 332 126 64 43 99 College 50 17 14 3 16 EDUCATIONAL ATTAINMENT Persons 25 years & over 3,085 1,023 646 428 988 None 66 17 12 3 34 Elementary: 1 to 4 years 311 110 68 58 75 5 and 6 years 253 95 29 39 90 7 years 69 26 14 7 22 8 years 295 82 32 58 123 High school: 1 year 179 57 25 28 69 2 years 175 49 32 31 63 3 years 156 49 27 22 58 4 years, no diploma 133 44 31 24 34 High school graduate 427 138 109 46 134 Some college, no degree 424 138 99 44 143 Associate degree, occupational 213 73 62 28 50 Associate degree, academic 204 60 62 33 49 Bachelor's degree 141 68 28 6 39 Graduate/professional degree 39 17 16 1 5 Percent high school graduate 46.9 48.3 58.2 36.9 42.5 Percent bachelor's degree 5.8 8.3 6.8 1.6 4.5 Females 25 years & over 1,583 534 325 234 490 None 39 10 6 2 21 Elementary: 1 to 4 years 217 78 49 36 54 5 and 6 years 178 66 25 29 58 7 years 51 23 10 6 12 8 years 209 63 27 40 79 High school: 1 year 125 43 17 17 48 2 years 114 31 23 19 41 3 years 94 34 18 12 30 4 years, no diploma 62 26 13 8 15 High school graduate 204 68 57 23 56 Some college, no degree 124 33 32 18 41 Associate degree, occupational 57 22 16 11 8 Associate degree, academic 75 20 23 13 19 Bachelor's degree 26 14 4 - 8 Graduate/professional degree 8 3 5 - - Percent high school graduate 31.2 30.0 42.2 27.8 26.9 Percent bachelor's degree 2.1 3.2 2.8 - 1.6 Persons 18 to 24 years 183 63 50 13 57 Percent high school graduate 53.6 54.0 68.0 46.2 42.1 ─────────────────────────────────────────────────────────────────────────────────────────────────────────────────── Source: 2000 FSM Census
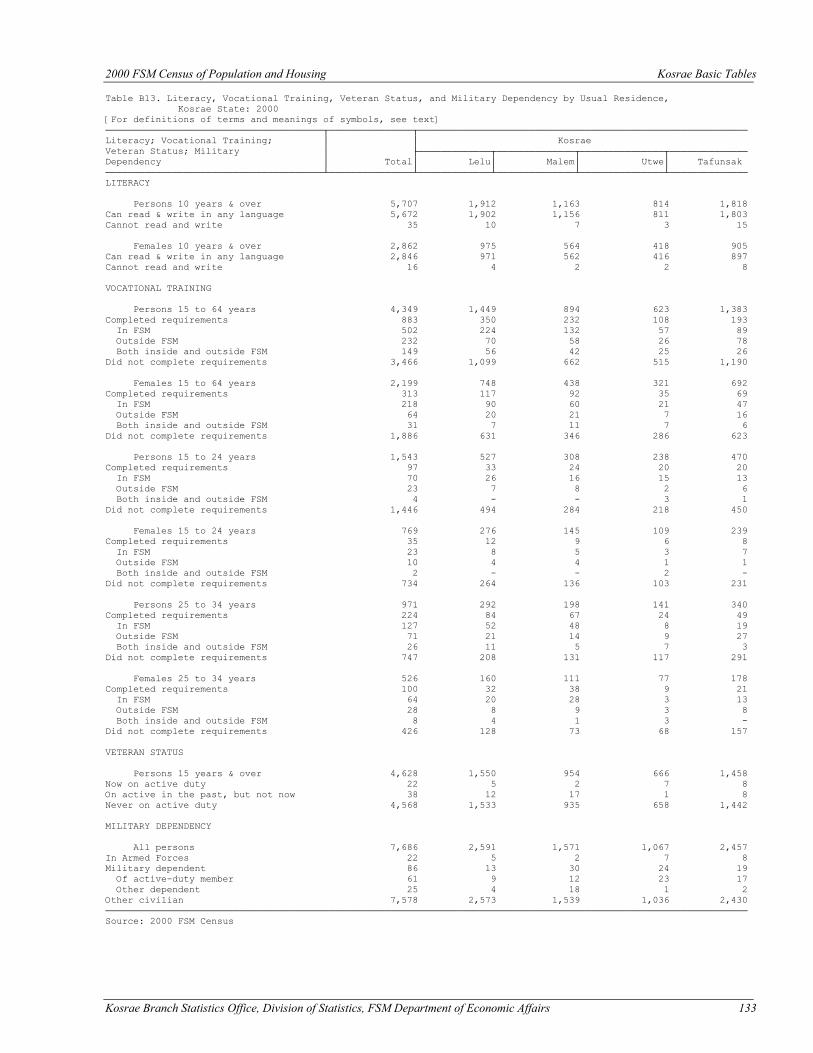
2000 FSM Census of Population and Housing Kosrae Basic Tables
Kosrae Branch Statistics Office, Division of Statistics, FSM Department of Economic Affairs 133
Table B13. Literacy, Vocational Training, Veteran Status, and Military Dependency by Usual Residence, Kosrae State: 2000 [For definitions of terms and meanings of symbols, see text] ───────────────────────────────────────┬───────────────┬─────────────────────────────────────────────────────────── Literacy; Vocational Training; │ │ Kosrae Veteran Status; Military │ ├─────────────┬──────────────┬───────────────┬────────────── Dependency │ Total│ Lelu│ Malem│ Utwe│ Tafunsak ───────────────────────────────────────┴───────────────┴─────────────┴──────────────┴───────────────┴────────────── LITERACY Persons 10 years & over 5,707 1,912 1,163 814 1,818 Can read & write in any language 5,672 1,902 1,156 811 1,803 Cannot read and write 35 10 7 3 15 Females 10 years & over 2,862 975 564 418 905 Can read & write in any language 2,846 971 562 416 897 Cannot read and write 16 4 2 2 8 VOCATIONAL TRAINING Persons 15 to 64 years 4,349 1,449 894 623 1,383 Completed requirements 883 350 232 108 193 In FSM 502 224 132 57 89 Outside FSM 232 70 58 26 78 Both inside and outside FSM 149 56 42 25 26 Did not complete requirements 3,466 1,099 662 515 1,190 Females 15 to 64 years 2,199 748 438 321 692 Completed requirements 313 117 92 35 69 In FSM 218 90 60 21 47 Outside FSM 64 20 21 7 16 Both inside and outside FSM 31 7 11 7 6 Did not complete requirements 1,886 631 346 286 623 Persons 15 to 24 years 1,543 527 308 238 470 Completed requirements 97 33 24 20 20 In FSM 70 26 16 15 13 Outside FSM 23 7 8 2 6 Both inside and outside FSM 4 - - 3 1 Did not complete requirements 1,446 494 284 218 450 Females 15 to 24 years 769 276 145 109 239 Completed requirements 35 12 9 6 8 In FSM 23 8 5 3 7 Outside FSM 10 4 4 1 1 Both inside and outside FSM 2 - - 2 - Did not complete requirements 734 264 136 103 231 Persons 25 to 34 years 971 292 198 141 340 Completed requirements 224 84 67 24 49 In FSM 127 52 48 8 19 Outside FSM 71 21 14 9 27 Both inside and outside FSM 26 11 5 7 3 Did not complete requirements 747 208 131 117 291 Females 25 to 34 years 526 160 111 77 178 Completed requirements 100 32 38 9 21 In FSM 64 20 28 3 13 Outside FSM 28 8 9 3 8 Both inside and outside FSM 8 4 1 3 - Did not complete requirements 426 128 73 68 157 VETERAN STATUS Persons 15 years & over 4,628 1,550 954 666 1,458 Now on active duty 22 5 2 7 8 On active in the past, but not now 38 12 17 1 8 Never on active duty 4,568 1,533 935 658 1,442 MILITARY DEPENDENCY All persons 7,686 2,591 1,571 1,067 2,457 In Armed Forces 22 5 2 7 8 Military dependent 86 13 30 24 19 Of active-duty member 61 9 12 23 17 Other dependent 25 4 18 1 2 Other civilian 7,578 2,573 1,539 1,036 2,430 ─────────────────────────────────────────────────────────────────────────────────────────────────────────────────── Source: 2000 FSM Census
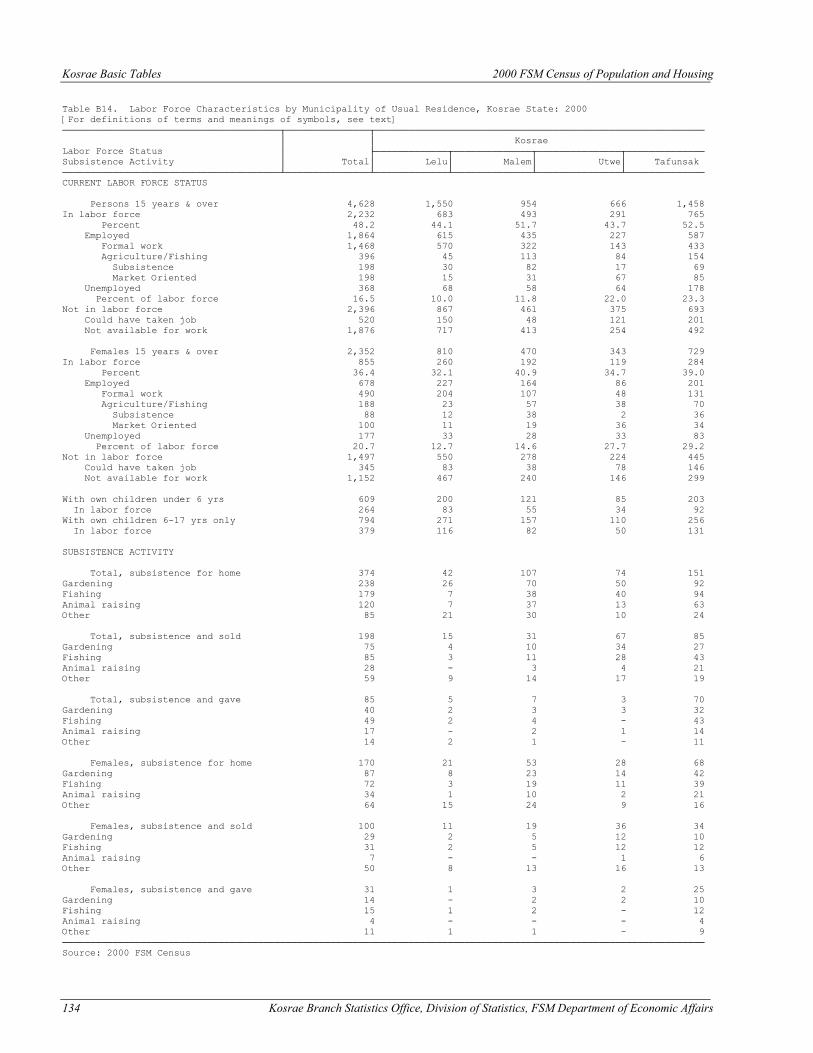
Kosrae Basic Tables 2000 FSM Census of Population and Housing
134 Kosrae Branch Statistics Office, Division of Statistics, FSM Department of Economic Affairs
Table B14. Labor Force Characteristics by Municipality of Usual Residence, Kosrae State: 2000 [For definitions of terms and meanings of symbols, see text] ───────────────────────────────────────┬───────────────┬─────────────────────────────────────────────────────────── │ │ Kosrae Labor Force Status │ ├─────────────┬──────────────┬───────────────┬────────────── Subsistence Activity │ Total│ Lelu│ Malem│ Utwe│ Tafunsak ───────────────────────────────────────┴───────────────┴─────────────┴──────────────┴───────────────┴────────────── CURRENT LABOR FORCE STATUS Persons 15 years & over 4,628 1,550 954 666 1,458 In labor force 2,232 683 493 291 765 Percent 48.2 44.1 51.7 43.7 52.5 Employed 1,864 615 435 227 587 Formal work 1,468 570 322 143 433 Agriculture/Fishing 396 45 113 84 154 Subsistence 198 30 82 17 69 Market Oriented 198 15 31 67 85 Unemployed 368 68 58 64 178 Percent of labor force 16.5 10.0 11.8 22.0 23.3 Not in labor force 2,396 867 461 375 693 Could have taken job 520 150 48 121 201 Not available for work 1,876 717 413 254 492 Females 15 years & over 2,352 810 470 343 729 In labor force 855 260 192 119 284 Percent 36.4 32.1 40.9 34.7 39.0 Employed 678 227 164 86 201 Formal work 490 204 107 48 131 Agriculture/Fishing 188 23 57 38 70 Subsistence 88 12 38 2 36 Market Oriented 100 11 19 36 34 Unemployed 177 33 28 33 83 Percent of labor force 20.7 12.7 14.6 27.7 29.2 Not in labor force 1,497 550 278 224 445 Could have taken job 345 83 38 78 146 Not available for work 1,152 467 240 146 299 With own children under 6 yrs 609 200 121 85 203 In labor force 264 83 55 34 92 With own children 6-17 yrs only 794 271 157 110 256 In labor force 379 116 82 50 131 SUBSISTENCE ACTIVITY Total, subsistence for home 374 42 107 74 151 Gardening 238 26 70 50 92 Fishing 179 7 38 40 94 Animal raising 120 7 37 13 63 Other 85 21 30 10 24 Total, subsistence and sold 198 15 31 67 85 Gardening 75 4 10 34 27 Fishing 85 3 11 28 43 Animal raising 28 - 3 4 21 Other 59 9 14 17 19 Total, subsistence and gave 85 5 7 3 70 Gardening 40 2 3 3 32 Fishing 49 2 4 - 43 Animal raising 17 - 2 1 14 Other 14 2 1 - 11 Females, subsistence for home 170 21 53 28 68 Gardening 87 8 23 14 42 Fishing 72 3 19 11 39 Animal raising 34 1 10 2 21 Other 64 15 24 9 16 Females, subsistence and sold 100 11 19 36 34 Gardening 29 2 5 12 10 Fishing 31 2 5 12 12 Animal raising 7 - - 1 6 Other 50 8 13 16 13 Females, subsistence and gave 31 1 3 2 25 Gardening 14 - 2 2 10 Fishing 15 1 2 - 12 Animal raising 4 - - - 4 Other 11 1 1 - 9 ─────────────────────────────────────────────────────────────────────────────────────────────────────────────────── Source: 2000 FSM Census
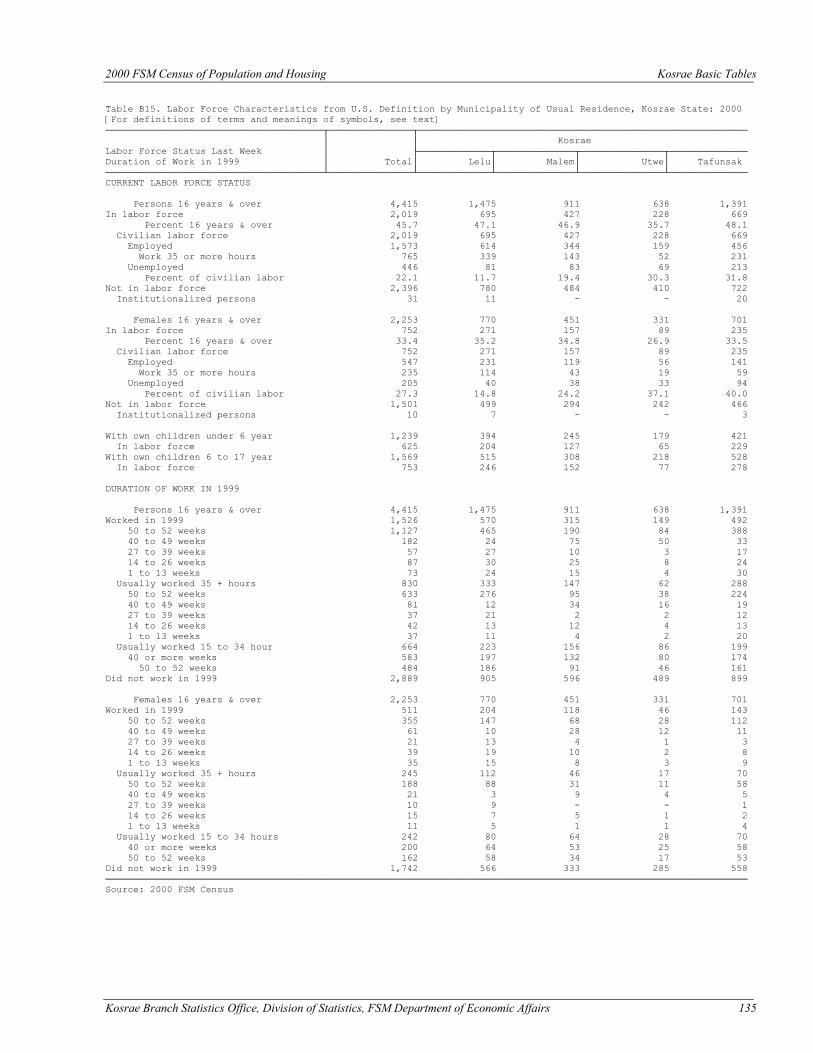
2000 FSM Census of Population and Housing Kosrae Basic Tables
Kosrae Branch Statistics Office, Division of Statistics, FSM Department of Economic Affairs 135
Table B15. Labor Force Characteristics from U.S. Definition by Municipality of Usual Residence, Kosrae State: 2000 [For definitions of terms and meanings of symbols, see text] ───────────────────────────────────────┬───────────────┬─────────────────────────────────────────────────────────── │ │ Kosrae Labor Force Status Last Week │ ├─────────────┬──────────────┬───────────────┬────────────── Duration of Work in 1999 │ Total│ Lelu│ Malem│ Utwe│ Tafunsak ───────────────────────────────────────┴───────────────┴─────────────┴──────────────┴───────────────┴────────────── CURRENT LABOR FORCE STATUS Persons 16 years & over 4,415 1,475 911 638 1,391 In labor force 2,019 695 427 228 669 Percent 16 years & over 45.7 47.1 46.9 35.7 48.1 Civilian labor force 2,019 695 427 228 669 Employed 1,573 614 344 159 456 Work 35 or more hours 765 339 143 52 231 Unemployed 446 81 83 69 213 Percent of civilian labor 22.1 11.7 19.4 30.3 31.8 Not in labor force 2,396 780 484 410 722 Institutionalized persons 31 11 - - 20 Females 16 years & over 2,253 770 451 331 701 In labor force 752 271 157 89 235 Percent 16 years & over 33.4 35.2 34.8 26.9 33.5 Civilian labor force 752 271 157 89 235 Employed 547 231 119 56 141 Work 35 or more hours 235 114 43 19 59 Unemployed 205 40 38 33 94 Percent of civilian labor 27.3 14.8 24.2 37.1 40.0 Not in labor force 1,501 499 294 242 466 Institutionalized persons 10 7 - - 3 With own children under 6 year 1,239 394 245 179 421 In labor force 625 204 127 65 229 With own children 6 to 17 year 1,569 515 308 218 528 In labor force 753 246 152 77 278 DURATION OF WORK IN 1999 Persons 16 years & over 4,415 1,475 911 638 1,391 Worked in 1999 1,526 570 315 149 492 50 to 52 weeks 1,127 465 190 84 388 40 to 49 weeks 182 24 75 50 33 27 to 39 weeks 57 27 10 3 17 14 to 26 weeks 87 30 25 8 24 1 to 13 weeks 73 24 15 4 30 Usually worked 35 + hours 830 333 147 62 288 50 to 52 weeks 633 276 95 38 224 40 to 49 weeks 81 12 34 16 19 27 to 39 weeks 37 21 2 2 12 14 to 26 weeks 42 13 12 4 13 1 to 13 weeks 37 11 4 2 20 Usually worked 15 to 34 hour 664 223 156 86 199 40 or more weeks 583 197 132 80 174 50 to 52 weeks 484 186 91 46 161 Did not work in 1999 2,889 905 596 489 899 Females 16 years & over 2,253 770 451 331 701 Worked in 1999 511 204 118 46 143 50 to 52 weeks 355 147 68 28 112 40 to 49 weeks 61 10 28 12 11 27 to 39 weeks 21 13 4 1 3 14 to 26 weeks 39 19 10 2 8 1 to 13 weeks 35 15 8 3 9 Usually worked 35 + hours 245 112 46 17 70 50 to 52 weeks 188 88 31 11 58 40 to 49 weeks 21 3 9 4 5 27 to 39 weeks 10 9 - - 1 14 to 26 weeks 15 7 5 1 2 1 to 13 weeks 11 5 1 1 4 Usually worked 15 to 34 hours 242 80 64 28 70 40 or more weeks 200 64 53 25 58 50 to 52 weeks 162 58 34 17 53 Did not work in 1999 1,742 566 333 285 558 ─────────────────────────────────────────────────────────────────────────────────────────────────────────────────── Source: 2000 FSM Census
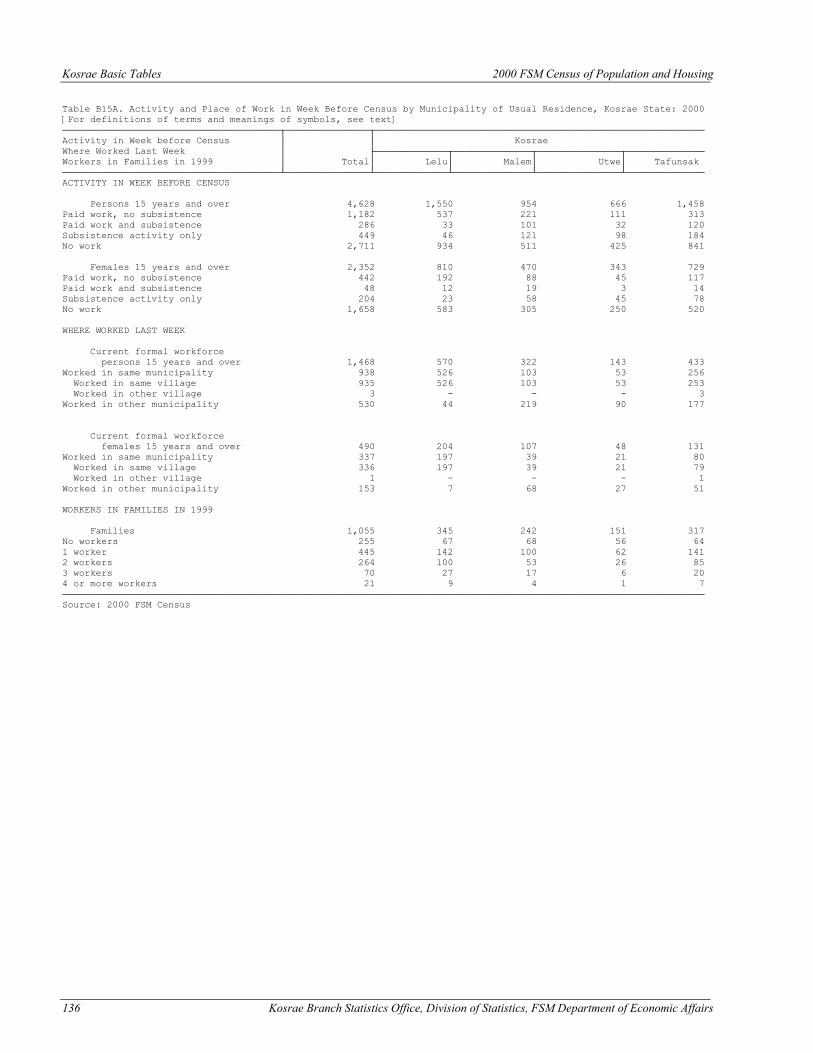
Kosrae Basic Tables 2000 FSM Census of Population and Housing
136 Kosrae Branch Statistics Office, Division of Statistics, FSM Department of Economic Affairs
Table B15A. Activity and Place of Work in Week Before Census by Municipality of Usual Residence, Kosrae State: 2000 [For definitions of terms and meanings of symbols, see text] ───────────────────────────────────────┬───────────────┬─────────────────────────────────────────────────────────── Activity in Week before Census │ │ Kosrae Where Worked Last Week │ ├─────────────┬──────────────┬───────────────┬────────────── Workers in Families in 1999 │ Total│ Lelu│ Malem│ Utwe│ Tafunsak ───────────────────────────────────────┴───────────────┴─────────────┴──────────────┴───────────────┴────────────── ACTIVITY IN WEEK BEFORE CENSUS Persons 15 years and over 4,628 1,550 954 666 1,458 Paid work, no subsistence 1,182 537 221 111 313 Paid work and subsistence 286 33 101 32 120 Subsistence activity only 449 46 121 98 184 No work 2,711 934 511 425 841 Females 15 years and over 2,352 810 470 343 729 Paid work, no subsistence 442 192 88 45 117 Paid work and subsistence 48 12 19 3 14 Subsistence activity only 204 23 58 45 78 No work 1,658 583 305 250 520 WHERE WORKED LAST WEEK Current formal workforce persons 15 years and over 1,468 570 322 143 433 Worked in same municipality 938 526 103 53 256 Worked in same village 935 526 103 53 253 Worked in other village 3 - - - 3 Worked in other municipality 530 44 219 90 177 Current formal workforce females 15 years and over 490 204 107 48 131 Worked in same municipality 337 197 39 21 80 Worked in same village 336 197 39 21 79 Worked in other village 1 - - - 1 Worked in other municipality 153 7 68 27 51 WORKERS IN FAMILIES IN 1999 Families 1,055 345 242 151 317 No workers 255 67 68 56 64 1 worker 445 142 100 62 141 2 workers 264 100 53 26 85 3 workers 70 27 17 6 20 4 or more workers 21 9 4 1 7 ─────────────────────────────────────────────────────────────────────────────────────────────────────────────────── Source: 2000 FSM Census

2000 FSM Census of Population and Housing Kosrae Basic Tables
Kosrae Branch Statistics Office, Division of Statistics, FSM Department of Economic Affairs 137
Table B16. Occupation by Usual Residence, Kosrae State: 2000 [For definitions of terms and meanings of symbols, see text] ───────────────────────────────────────┬───────────────┬─────────────────────────────────────────────────────────── │ │ Kosrae │ ├─────────────┬──────────────┬───────────────┬────────────── Occupation │ Total│ Lelu│ Malem│ Utwe│ Tafunsak ───────────────────────────────────────┴───────────────┴─────────────┴──────────────┴───────────────┴────────────── Current formal workforce 15 years & over 1,468 570 322 143 433 Legislators, Sr. Officials, Managers 136 71 21 6 38 Professionals 210 76 62 43 29 Technicians & Assoc. Professionals 251 77 62 14 98 Clerks 253 106 47 30 70 Service & Shop Market Sales Workers 92 32 34 8 18 Skilled Agric. & Fisheries workers 22 8 6 3 5 Craft and Related Workers 149 71 27 18 33 Plant/Machine Operators & Assembly 102 36 17 10 39 Elementary Occupations 253 93 46 11 103 Armed Forces - - - - - Current formal workforce males 15 years & over 978 366 215 95 302 Legislators, Sr. Officials, Managers 121 60 18 6 37 Professionals 150 58 39 32 21 Technicians & Assoc. Professionals 178 54 47 10 67 Clerks 42 17 8 5 12 Service & Shop Market Sales Workers 47 13 18 7 9 Skilled Agric. & Fisheries workers 21 7 6 3 5 Craft and Related Workers 109 52 20 11 26 Plant/Machine Operators & Assembly 97 35 14 10 38 Elementary Occupations 213 70 45 11 87 Armed Forces - - - - - Current formal workforce females 15 years & over 490 204 107 48 131 Legislators, Sr. Officials, Managers 15 11 3 - 1 Professionals 60 18 23 11 8 Technicians & Assoc. Professionals 73 23 15 4 31 Clerks 211 89 39 25 58 Service & Shop Market Sales Workers 45 19 16 1 9 Skilled Agric. & Fisheries workers 1 1 - - - Craft and Related Workers 40 19 7 7 7 Plant/Machine Operators & Assembly 5 1 3 - 1 Elementary Occupations 40 23 1 - 16 Armed Forces - - - - - ─────────────────────────────────────────────────────────────────────────────────────────────────────────────────── Source: 2000 FSM Census
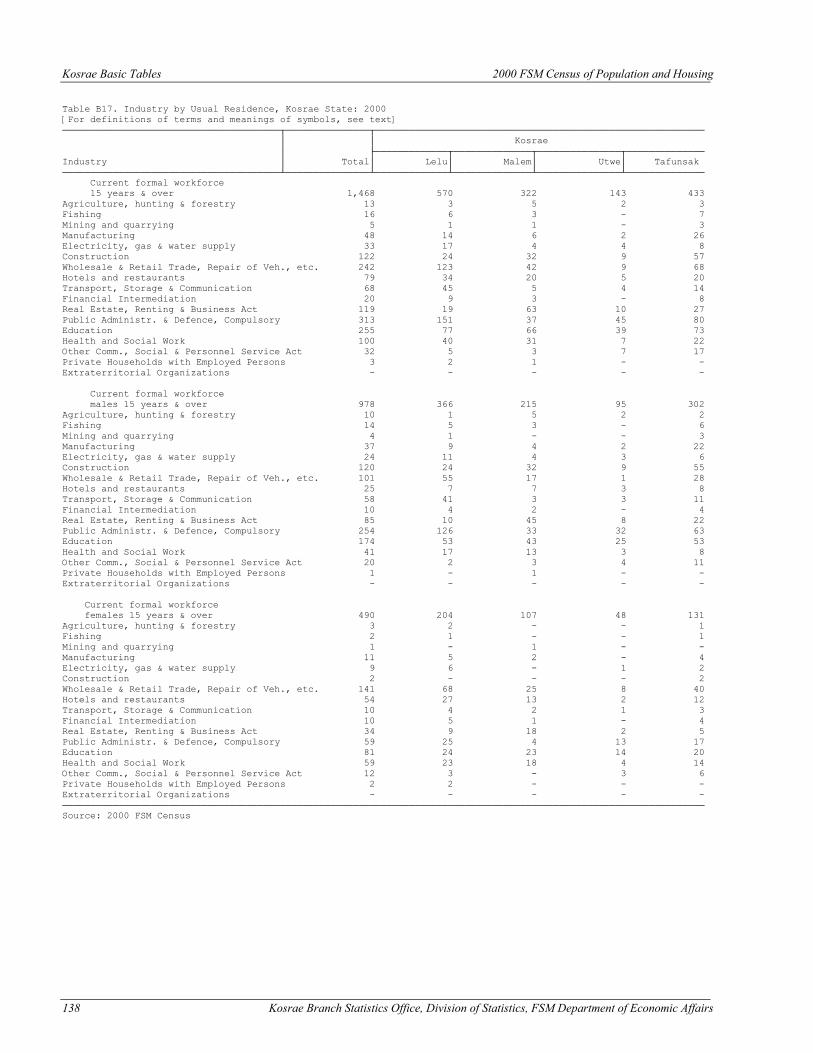
Kosrae Basic Tables 2000 FSM Census of Population and Housing
138 Kosrae Branch Statistics Office, Division of Statistics, FSM Department of Economic Affairs
Table B17. Industry by Usual Residence, Kosrae State: 2000 [For definitions of terms and meanings of symbols, see text] ───────────────────────────────────────┬───────────────┬─────────────────────────────────────────────────────────── │ │ Kosrae │ ├─────────────┬──────────────┬───────────────┬────────────── Industry │ Total│ Lelu│ Malem│ Utwe│ Tafunsak ───────────────────────────────────────┴───────────────┴─────────────┴──────────────┴───────────────┴────────────── Current formal workforce 15 years & over 1,468 570 322 143 433 Agriculture, hunting & forestry 13 3 5 2 3 Fishing 16 6 3 - 7 Mining and quarrying 5 1 1 - 3 Manufacturing 48 14 6 2 26 Electricity, gas & water supply 33 17 4 4 8 Construction 122 24 32 9 57 Wholesale & Retail Trade, Repair of Veh., etc. 242 123 42 9 68 Hotels and restaurants 79 34 20 5 20 Transport, Storage & Communication 68 45 5 4 14 Financial Intermediation 20 9 3 - 8 Real Estate, Renting & Business Act 119 19 63 10 27 Public Administr. & Defence, Compulsory 313 151 37 45 80 Education 255 77 66 39 73 Health and Social Work 100 40 31 7 22 Other Comm., Social & Personnel Service Act 32 5 3 7 17 Private Households with Employed Persons 3 2 1 - - Extraterritorial Organizations - - - - - Current formal workforce males 15 years & over 978 366 215 95 302 Agriculture, hunting & forestry 10 1 5 2 2 Fishing 14 5 3 - 6 Mining and quarrying 4 1 - - 3 Manufacturing 37 9 4 2 22 Electricity, gas & water supply 24 11 4 3 6 Construction 120 24 32 9 55 Wholesale & Retail Trade, Repair of Veh., etc. 101 55 17 1 28 Hotels and restaurants 25 7 7 3 8 Transport, Storage & Communication 58 41 3 3 11 Financial Intermediation 10 4 2 - 4 Real Estate, Renting & Business Act 85 10 45 8 22 Public Administr. & Defence, Compulsory 254 126 33 32 63 Education 174 53 43 25 53 Health and Social Work 41 17 13 3 8 Other Comm., Social & Personnel Service Act 20 2 3 4 11 Private Households with Employed Persons 1 - 1 - - Extraterritorial Organizations - - - - - Current formal workforce females 15 years & over 490 204 107 48 131 Agriculture, hunting & forestry 3 2 - - 1 Fishing 2 1 - - 1 Mining and quarrying 1 - 1 - - Manufacturing 11 5 2 - 4 Electricity, gas & water supply 9 6 - 1 2 Construction 2 - - - 2 Wholesale & Retail Trade, Repair of Veh., etc. 141 68 25 8 40 Hotels and restaurants 54 27 13 2 12 Transport, Storage & Communication 10 4 2 1 3 Financial Intermediation 10 5 1 - 4 Real Estate, Renting & Business Act 34 9 18 2 5 Public Administr. & Defence, Compulsory 59 25 4 13 17 Education 81 24 23 14 20 Health and Social Work 59 23 18 4 14 Other Comm., Social & Personnel Service Act 12 3 - 3 6 Private Households with Employed Persons 2 2 - - - Extraterritorial Organizations - - - - - ─────────────────────────────────────────────────────────────────────────────────────────────────────────────────── Source: 2000 FSM Census
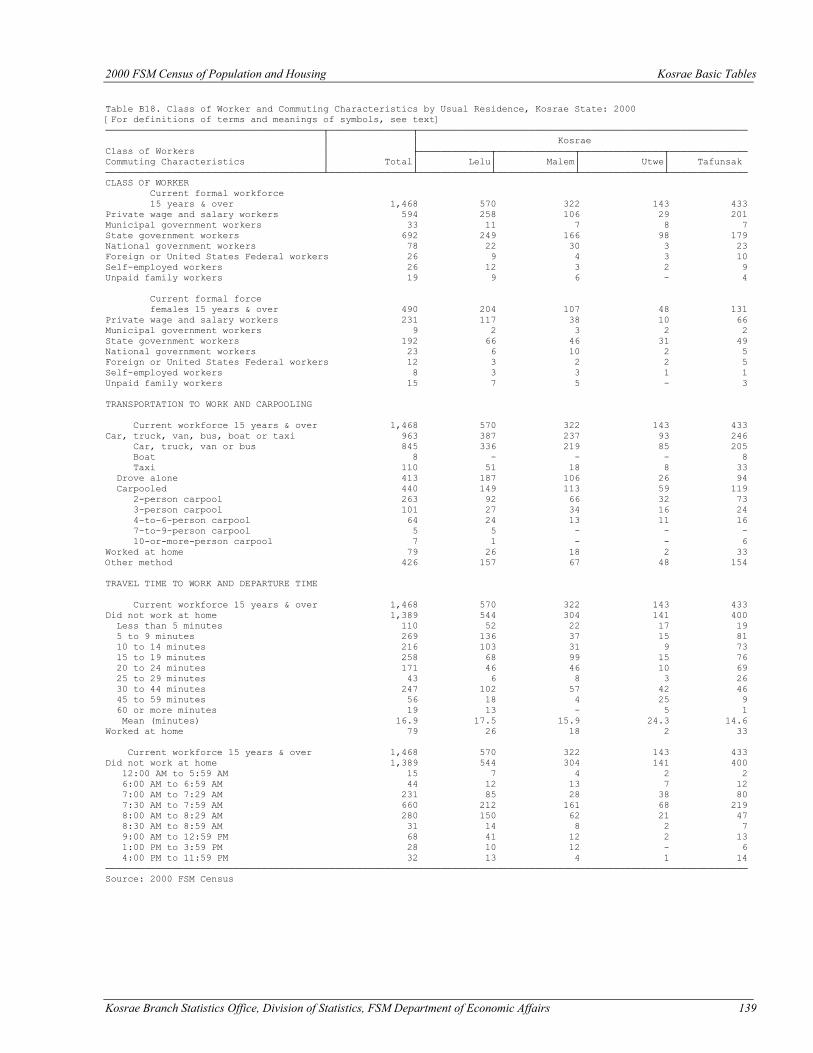
2000 FSM Census of Population and Housing Kosrae Basic Tables
Kosrae Branch Statistics Office, Division of Statistics, FSM Department of Economic Affairs 139
Table B18. Class of Worker and Commuting Characteristics by Usual Residence, Kosrae State: 2000 [For definitions of terms and meanings of symbols, see text] ───────────────────────────────────────┬───────────────┬─────────────────────────────────────────────────────────── │ │ Kosrae Class of Workers │ ├─────────────┬──────────────┬───────────────┬────────────── Commuting Characteristics │ Total│ Lelu│ Malem│ Utwe│ Tafunsak ───────────────────────────────────────┴───────────────┴─────────────┴──────────────┴───────────────┴────────────── CLASS OF WORKER Current formal workforce 15 years & over 1,468 570 322 143 433 Private wage and salary workers 594 258 106 29 201 Municipal government workers 33 11 7 8 7 State government workers 692 249 166 98 179 National government workers 78 22 30 3 23 Foreign or United States Federal workers 26 9 4 3 10 Self-employed workers 26 12 3 2 9 Unpaid family workers 19 9 6 - 4 Current formal force females 15 years & over 490 204 107 48 131 Private wage and salary workers 231 117 38 10 66 Municipal government workers 9 2 3 2 2 State government workers 192 66 46 31 49 National government workers 23 6 10 2 5 Foreign or United States Federal workers 12 3 2 2 5 Self-employed workers 8 3 3 1 1 Unpaid family workers 15 7 5 - 3 TRANSPORTATION TO WORK AND CARPOOLING Current workforce 15 years & over 1,468 570 322 143 433 Car, truck, van, bus, boat or taxi 963 387 237 93 246 Car, truck, van or bus 845 336 219 85 205 Boat 8 - - - 8 Taxi 110 51 18 8 33 Drove alone 413 187 106 26 94 Carpooled 440 149 113 59 119 2-person carpool 263 92 66 32 73 3-person carpool 101 27 34 16 24 4-to-6-person carpool 64 24 13 11 16 7-to-9-person carpool 5 5 - - - 10-or-more-person carpool 7 1 - - 6 Worked at home 79 26 18 2 33 Other method 426 157 67 48 154 TRAVEL TIME TO WORK AND DEPARTURE TIME Current workforce 15 years & over 1,468 570 322 143 433 Did not work at home 1,389 544 304 141 400 Less than 5 minutes 110 52 22 17 19 5 to 9 minutes 269 136 37 15 81 10 to 14 minutes 216 103 31 9 73 15 to 19 minutes 258 68 99 15 76 20 to 24 minutes 171 46 46 10 69 25 to 29 minutes 43 6 8 3 26 30 to 44 minutes 247 102 57 42 46 45 to 59 minutes 56 18 4 25 9 60 or more minutes 19 13 - 5 1 Mean (minutes) 16.9 17.5 15.9 24.3 14.6 Worked at home 79 26 18 2 33 Current workforce 15 years & over 1,468 570 322 143 433 Did not work at home 1,389 544 304 141 400 12:00 AM to 5:59 AM 15 7 4 2 2 6:00 AM to 6:59 AM 44 12 13 7 12 7:00 AM to 7:29 AM 231 85 28 38 80 7:30 AM to 7:59 AM 660 212 161 68 219 8:00 AM to 8:29 AM 280 150 62 21 47 8:30 AM to 8:59 AM 31 14 8 2 7 9:00 AM to 12:59 PM 68 41 12 2 13 1:00 PM to 3:59 PM 28 10 12 - 6 4:00 PM to 11:59 PM 32 13 4 1 14 ─────────────────────────────────────────────────────────────────────────────────────────────────────────────────── Source: 2000 FSM Census
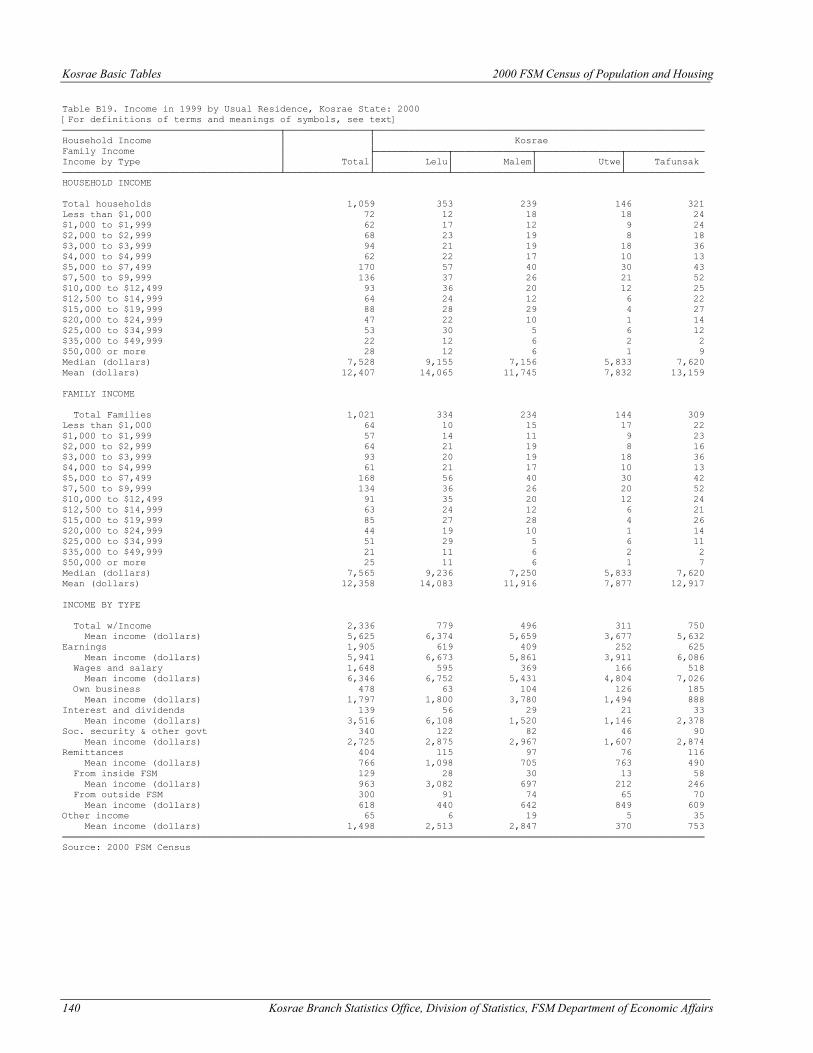
Kosrae Basic Tables 2000 FSM Census of Population and Housing
140 Kosrae Branch Statistics Office, Division of Statistics, FSM Department of Economic Affairs
Table B19. Income in 1999 by Usual Residence, Kosrae State: 2000 [For definitions of terms and meanings of symbols, see text] ───────────────────────────────────────┬───────────────┬─────────────────────────────────────────────────────────── Household Income │ │ Kosrae Family Income │ ├─────────────┬──────────────┬───────────────┬────────────── Income by Type │ Total│ Lelu│ Malem│ Utwe│ Tafunsak ───────────────────────────────────────┴───────────────┴─────────────┴──────────────┴───────────────┴────────────── HOUSEHOLD INCOME Total households 1,059 353 239 146 321 Less than $1,000 72 12 18 18 24 $1,000 to $1,999 62 17 12 9 24 $2,000 to $2,999 68 23 19 8 18 $3,000 to $3,999 94 21 19 18 36 $4,000 to $4,999 62 22 17 10 13 $5,000 to $7,499 170 57 40 30 43 $7,500 to $9,999 136 37 26 21 52 $10,000 to $12,499 93 36 20 12 25 $12,500 to $14,999 64 24 12 6 22 $15,000 to $19,999 88 28 29 4 27 $20,000 to $24,999 47 22 10 1 14 $25,000 to $34,999 53 30 5 6 12 $35,000 to $49,999 22 12 6 2 2 $50,000 or more 28 12 6 1 9 Median (dollars) 7,528 9,155 7,156 5,833 7,620 Mean (dollars) 12,407 14,065 11,745 7,832 13,159 FAMILY INCOME Total Families 1,021 334 234 144 309 Less than $1,000 64 10 15 17 22 $1,000 to $1,999 57 14 11 9 23 $2,000 to $2,999 64 21 19 8 16 $3,000 to $3,999 93 20 19 18 36 $4,000 to $4,999 61 21 17 10 13 $5,000 to $7,499 168 56 40 30 42 $7,500 to $9,999 134 36 26 20 52 $10,000 to $12,499 91 35 20 12 24 $12,500 to $14,999 63 24 12 6 21 $15,000 to $19,999 85 27 28 4 26 $20,000 to $24,999 44 19 10 1 14 $25,000 to $34,999 51 29 5 6 11 $35,000 to $49,999 21 11 6 2 2 $50,000 or more 25 11 6 1 7 Median (dollars) 7,565 9,236 7,250 5,833 7,620 Mean (dollars) 12,358 14,083 11,916 7,877 12,917 INCOME BY TYPE Total w/Income 2,336 779 496 311 750 Mean income (dollars) 5,625 6,374 5,659 3,677 5,632 Earnings 1,905 619 409 252 625 Mean income (dollars) 5,941 6,673 5,861 3,911 6,086 Wages and salary 1,648 595 369 166 518 Mean income (dollars) 6,346 6,752 5,431 4,804 7,026 Own business 478 63 104 126 185 Mean income (dollars) 1,797 1,800 3,780 1,494 888 Interest and dividends 139 56 29 21 33 Mean income (dollars) 3,516 6,108 1,520 1,146 2,378 Soc. security & other govt 340 122 82 46 90 Mean income (dollars) 2,725 2,875 2,967 1,607 2,874 Remittances 404 115 97 76 116 Mean income (dollars) 766 1,098 705 763 490 From inside FSM 129 28 30 13 58 Mean income (dollars) 963 3,082 697 212 246 From outside FSM 300 91 74 65 70 Mean income (dollars) 618 440 642 849 609 Other income 65 6 19 5 35 Mean income (dollars) 1,498 2,513 2,847 370 753 ─────────────────────────────────────────────────────────────────────────────────────────────────────────────────── Source: 2000 FSM Census
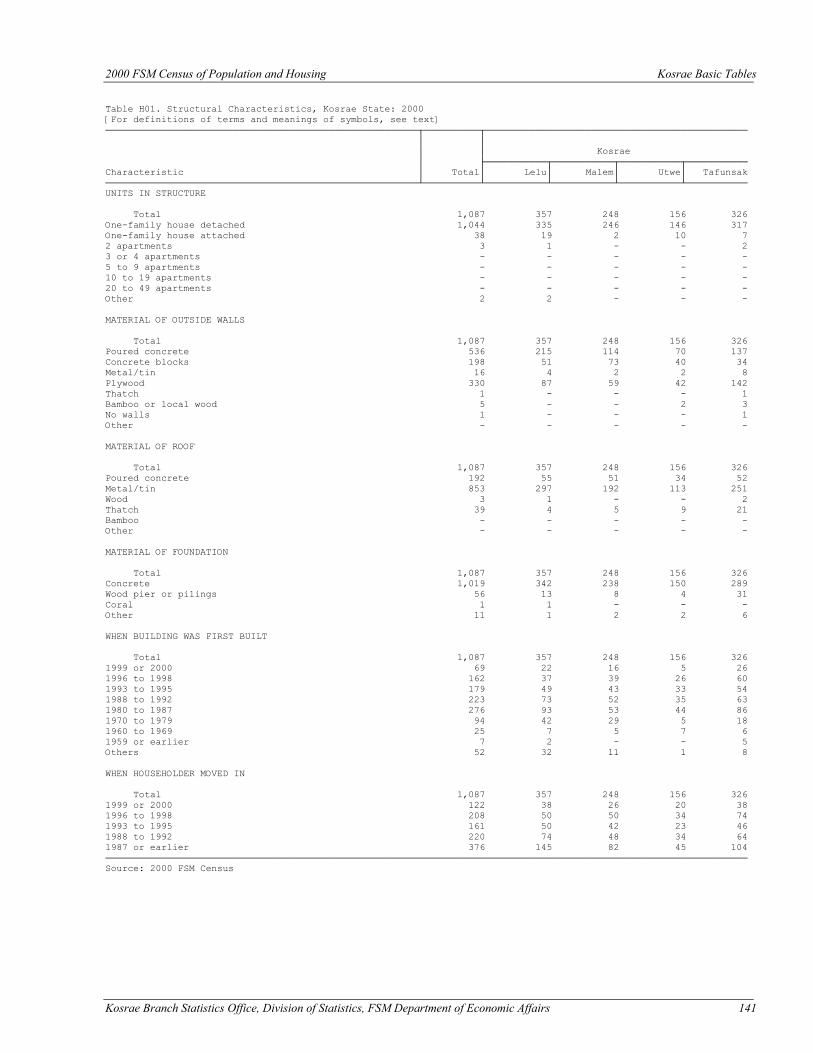
2000 FSM Census of Population and Housing Kosrae Basic Tables
Kosrae Branch Statistics Office, Division of Statistics, FSM Department of Economic Affairs 141
Table H01. Structural Characteristics, Kosrae State: 2000 [For definitions of terms and meanings of symbols, see text] ────────────────────────────────────────────────────────┬──────────┬─────────────────────────────────────────────── │ │ │ │ Kosrae │ ├───────────┬───────────┬───────────┬─────────── Characteristic │ Total│ Lelu│ Malem│ Utwe│ Tafunsak ────────────────────────────────────────────────────────┴──────────┴───────────┴───────────┴───────────┴─────────── UNITS IN STRUCTURE Total 1,087 357 248 156 326 One-family house detached 1,044 335 246 146 317 One-family house attached 38 19 2 10 7 2 apartments 3 1 - - 2 3 or 4 apartments - - - - - 5 to 9 apartments - - - - - 10 to 19 apartments - - - - - 20 to 49 apartments - - - - - Other 2 2 - - - MATERIAL OF OUTSIDE WALLS Total 1,087 357 248 156 326 Poured concrete 536 215 114 70 137 Concrete blocks 198 51 73 40 34 Metal/tin 16 4 2 2 8 Plywood 330 87 59 42 142 Thatch 1 - - - 1 Bamboo or local wood 5 - - 2 3 No walls 1 - - - 1 Other - - - - - MATERIAL OF ROOF Total 1,087 357 248 156 326 Poured concrete 192 55 51 34 52 Metal/tin 853 297 192 113 251 Wood 3 1 - - 2 Thatch 39 4 5 9 21 Bamboo - - - - - Other - - - - - MATERIAL OF FOUNDATION Total 1,087 357 248 156 326 Concrete 1,019 342 238 150 289 Wood pier or pilings 56 13 8 4 31 Coral 1 1 - - - Other 11 1 2 2 6 WHEN BUILDING WAS FIRST BUILT Total 1,087 357 248 156 326 1999 or 2000 69 22 16 5 26 1996 to 1998 162 37 39 26 60 1993 to 1995 179 49 43 33 54 1988 to 1992 223 73 52 35 63 1980 to 1987 276 93 53 44 86 1970 to 1979 94 42 29 5 18 1960 to 1969 25 7 5 7 6 1959 or earlier 7 2 - - 5 Others 52 32 11 1 8 WHEN HOUSEHOLDER MOVED IN Total 1,087 357 248 156 326 1999 or 2000 122 38 26 20 38 1996 to 1998 208 50 50 34 74 1993 to 1995 161 50 42 23 46 1988 to 1992 220 74 48 34 64 1987 or earlier 376 145 82 45 104 ─────────────────────────────────────────────────────────────────────────────────────────────────────────────────── Source: 2000 FSM Census
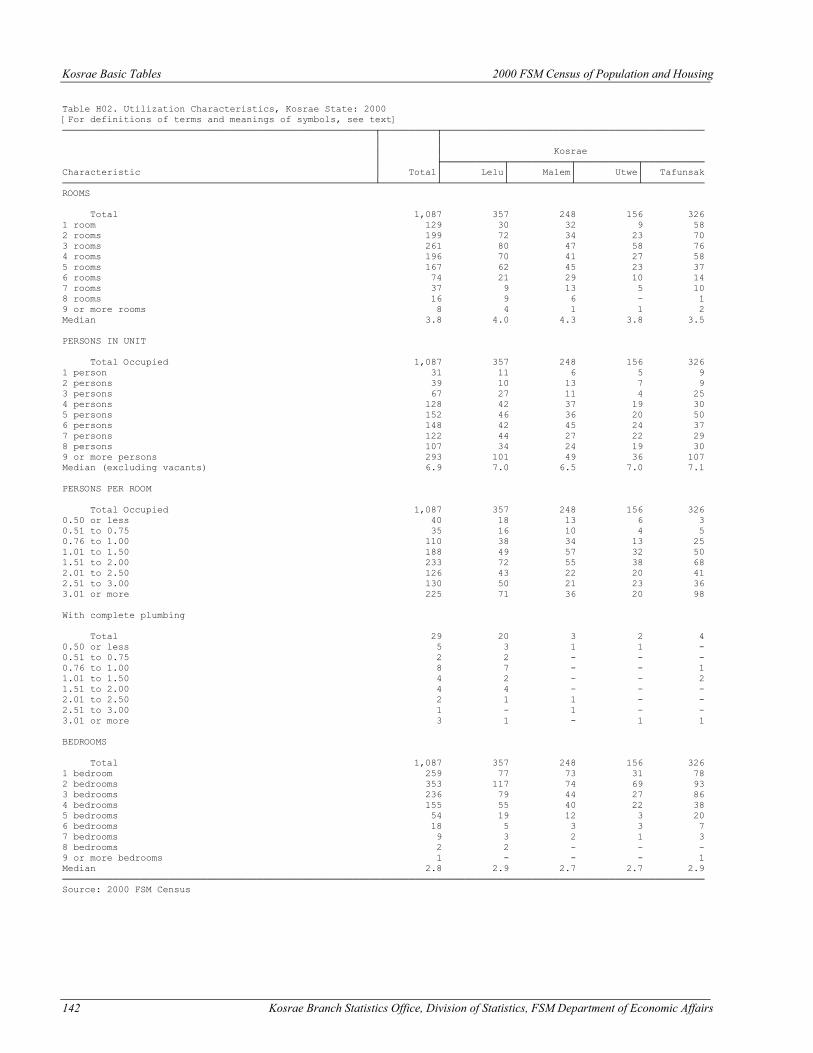
Kosrae Basic Tables 2000 FSM Census of Population and Housing
142 Kosrae Branch Statistics Office, Division of Statistics, FSM Department of Economic Affairs
Table H02. Utilization Characteristics, Kosrae State: 2000 [For definitions of terms and meanings of symbols, see text] ────────────────────────────────────────────────────────┬──────────┬─────────────────────────────────────────────── │ │ │ │ Kosrae │ ├───────────┬───────────┬───────────┬─────────── Characteristic │ Total│ Lelu│ Malem│ Utwe│ Tafunsak ────────────────────────────────────────────────────────┴──────────┴───────────┴───────────┴───────────┴─────────── ROOMS Total 1,087 357 248 156 326 1 room 129 30 32 9 58 2 rooms 199 72 34 23 70 3 rooms 261 80 47 58 76 4 rooms 196 70 41 27 58 5 rooms 167 62 45 23 37 6 rooms 74 21 29 10 14 7 rooms 37 9 13 5 10 8 rooms 16 9 6 - 1 9 or more rooms 8 4 1 1 2 Median 3.8 4.0 4.3 3.8 3.5 PERSONS IN UNIT Total Occupied 1,087 357 248 156 326 1 person 31 11 6 5 9 2 persons 39 10 13 7 9 3 persons 67 27 11 4 25 4 persons 128 42 37 19 30 5 persons 152 46 36 20 50 6 persons 148 42 45 24 37 7 persons 122 44 27 22 29 8 persons 107 34 24 19 30 9 or more persons 293 101 49 36 107 Median (excluding vacants) 6.9 7.0 6.5 7.0 7.1 PERSONS PER ROOM Total Occupied 1,087 357 248 156 326 0.50 or less 40 18 13 6 3 0.51 to 0.75 35 16 10 4 5 0.76 to 1.00 110 38 34 13 25 1.01 to 1.50 188 49 57 32 50 1.51 to 2.00 233 72 55 38 68 2.01 to 2.50 126 43 22 20 41 2.51 to 3.00 130 50 21 23 36 3.01 or more 225 71 36 20 98 With complete plumbing Total 29 20 3 2 4 0.50 or less 5 3 1 1 - 0.51 to 0.75 2 2 - - - 0.76 to 1.00 8 7 - - 1 1.01 to 1.50 4 2 - - 2 1.51 to 2.00 4 4 - - - 2.01 to 2.50 2 1 1 - - 2.51 to 3.00 1 - 1 - - 3.01 or more 3 1 - 1 1 BEDROOMS Total 1,087 357 248 156 326 1 bedroom 259 77 73 31 78 2 bedrooms 353 117 74 69 93 3 bedrooms 236 79 44 27 86 4 bedrooms 155 55 40 22 38 5 bedrooms 54 19 12 3 20 6 bedrooms 18 5 3 3 7 7 bedrooms 9 3 2 1 3 8 bedrooms 2 2 - - - 9 or more bedrooms 1 - - - 1 Median 2.8 2.9 2.7 2.7 2.9 ─────────────────────────────────────────────────────────────────────────────────────────────────────────────────── Source: 2000 FSM Census
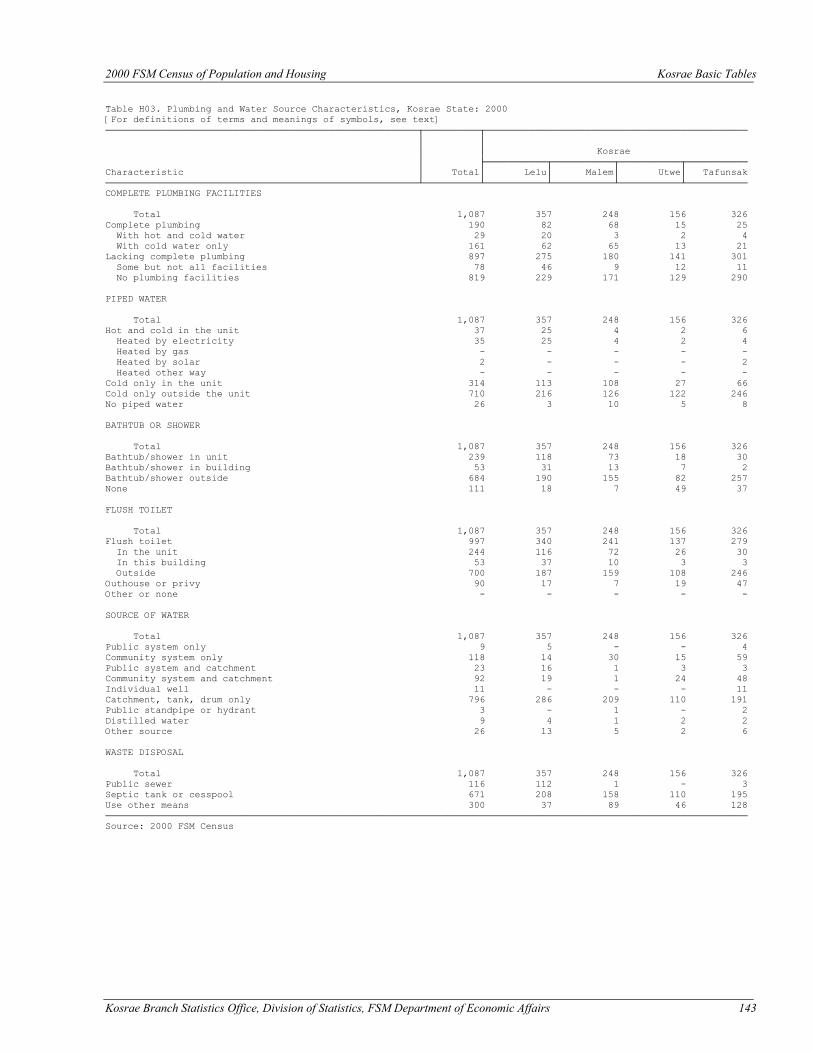
2000 FSM Census of Population and Housing Kosrae Basic Tables
Kosrae Branch Statistics Office, Division of Statistics, FSM Department of Economic Affairs 143
Table H03. Plumbing and Water Source Characteristics, Kosrae State: 2000 [For definitions of terms and meanings of symbols, see text] ────────────────────────────────────────────────────────┬──────────┬─────────────────────────────────────────────── │ │ │ │ Kosrae │ ├───────────┬───────────┬───────────┬─────────── Characteristic │ Total│ Lelu│ Malem│ Utwe│ Tafunsak ────────────────────────────────────────────────────────┴──────────┴───────────┴───────────┴───────────┴─────────── COMPLETE PLUMBING FACILITIES Total 1,087 357 248 156 326 Complete plumbing 190 82 68 15 25 With hot and cold water 29 20 3 2 4 With cold water only 161 62 65 13 21 Lacking complete plumbing 897 275 180 141 301 Some but not all facilities 78 46 9 12 11 No plumbing facilities 819 229 171 129 290 PIPED WATER Total 1,087 357 248 156 326 Hot and cold in the unit 37 25 4 2 6 Heated by electricity 35 25 4 2 4 Heated by gas - - - - - Heated by solar 2 - - - 2 Heated other way - - - - - Cold only in the unit 314 113 108 27 66 Cold only outside the unit 710 216 126 122 246 No piped water 26 3 10 5 8 BATHTUB OR SHOWER Total 1,087 357 248 156 326 Bathtub/shower in unit 239 118 73 18 30 Bathtub/shower in building 53 31 13 7 2 Bathtub/shower outside 684 190 155 82 257 None 111 18 7 49 37 FLUSH TOILET Total 1,087 357 248 156 326 Flush toilet 997 340 241 137 279 In the unit 244 116 72 26 30 In this building 53 37 10 3 3 Outside 700 187 159 108 246 Outhouse or privy 90 17 7 19 47 Other or none - - - - - SOURCE OF WATER Total 1,087 357 248 156 326 Public system only 9 5 - - 4 Community system only 118 14 30 15 59 Public system and catchment 23 16 1 3 3 Community system and catchment 92 19 1 24 48 Individual well 11 - - - 11 Catchment, tank, drum only 796 286 209 110 191 Public standpipe or hydrant 3 - 1 - 2 Distilled water 9 4 1 2 2 Other source 26 13 5 2 6 WASTE DISPOSAL Total 1,087 357 248 156 326 Public sewer 116 112 1 - 3 Septic tank or cesspool 671 208 158 110 195 Use other means 300 37 89 46 128 ─────────────────────────────────────────────────────────────────────────────────────────────────────────────────── Source: 2000 FSM Census
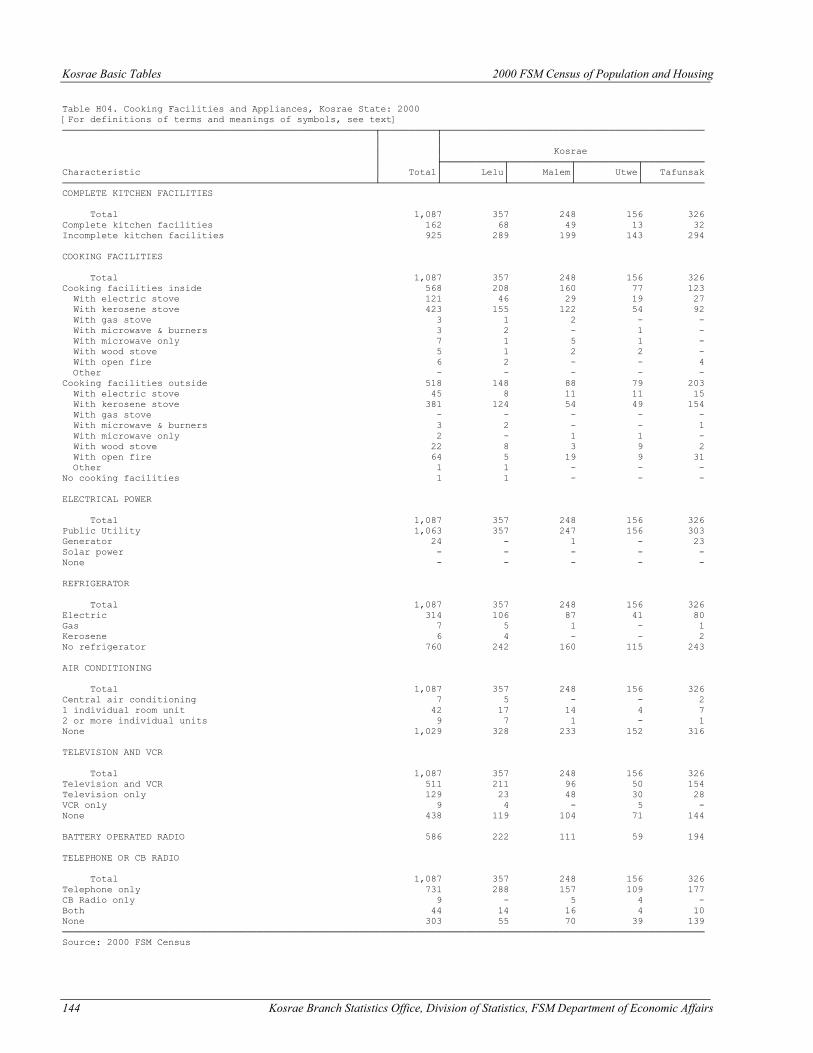
Kosrae Basic Tables 2000 FSM Census of Population and Housing
144 Kosrae Branch Statistics Office, Division of Statistics, FSM Department of Economic Affairs
Table H04. Cooking Facilities and Appliances, Kosrae State: 2000 [For definitions of terms and meanings of symbols, see text] ────────────────────────────────────────────────────────┬──────────┬─────────────────────────────────────────────── │ │ │ │ Kosrae │ ├───────────┬───────────┬───────────┬─────────── Characteristic │ Total│ Lelu│ Malem│ Utwe│ Tafunsak ────────────────────────────────────────────────────────┴──────────┴───────────┴───────────┴───────────┴─────────── COMPLETE KITCHEN FACILITIES Total 1,087 357 248 156 326 Complete kitchen facilities 162 68 49 13 32 Incomplete kitchen facilities 925 289 199 143 294 COOKING FACILITIES Total 1,087 357 248 156 326 Cooking facilities inside 568 208 160 77 123 With electric stove 121 46 29 19 27 With kerosene stove 423 155 122 54 92 With gas stove 3 1 2 - - With microwave & burners 3 2 - 1 - With microwave only 7 1 5 1 - With wood stove 5 1 2 2 - With open fire 6 2 - - 4 Other - - - - - Cooking facilities outside 518 148 88 79 203 With electric stove 45 8 11 11 15 With kerosene stove 381 124 54 49 154 With gas stove - - - - - With microwave & burners 3 2 - - 1 With microwave only 2 - 1 1 - With wood stove 22 8 3 9 2 With open fire 64 5 19 9 31 Other 1 1 - - - No cooking facilities 1 1 - - - ELECTRICAL POWER Total 1,087 357 248 156 326 Public Utility 1,063 357 247 156 303 Generator 24 - 1 - 23 Solar power - - - - - None - - - - - REFRIGERATOR Total 1,087 357 248 156 326 Electric 314 106 87 41 80 Gas 7 5 1 - 1 Kerosene 6 4 - - 2 No refrigerator 760 242 160 115 243 AIR CONDITIONING Total 1,087 357 248 156 326 Central air conditioning 7 5 - - 2 1 individual room unit 42 17 14 4 7 2 or more individual units 9 7 1 - 1 None 1,029 328 233 152 316 TELEVISION AND VCR Total 1,087 357 248 156 326 Television and VCR 511 211 96 50 154 Television only 129 23 48 30 28 VCR only 9 4 - 5 - None 438 119 104 71 144 BATTERY OPERATED RADIO 586 222 111 59 194 TELEPHONE OR CB RADIO Total 1,087 357 248 156 326 Telephone only 731 288 157 109 177 CB Radio only 9 - 5 4 - Both 44 14 16 4 10 None 303 55 70 39 139 ─────────────────────────────────────────────────────────────────────────────────────────────────────────────────── Source: 2000 FSM Census
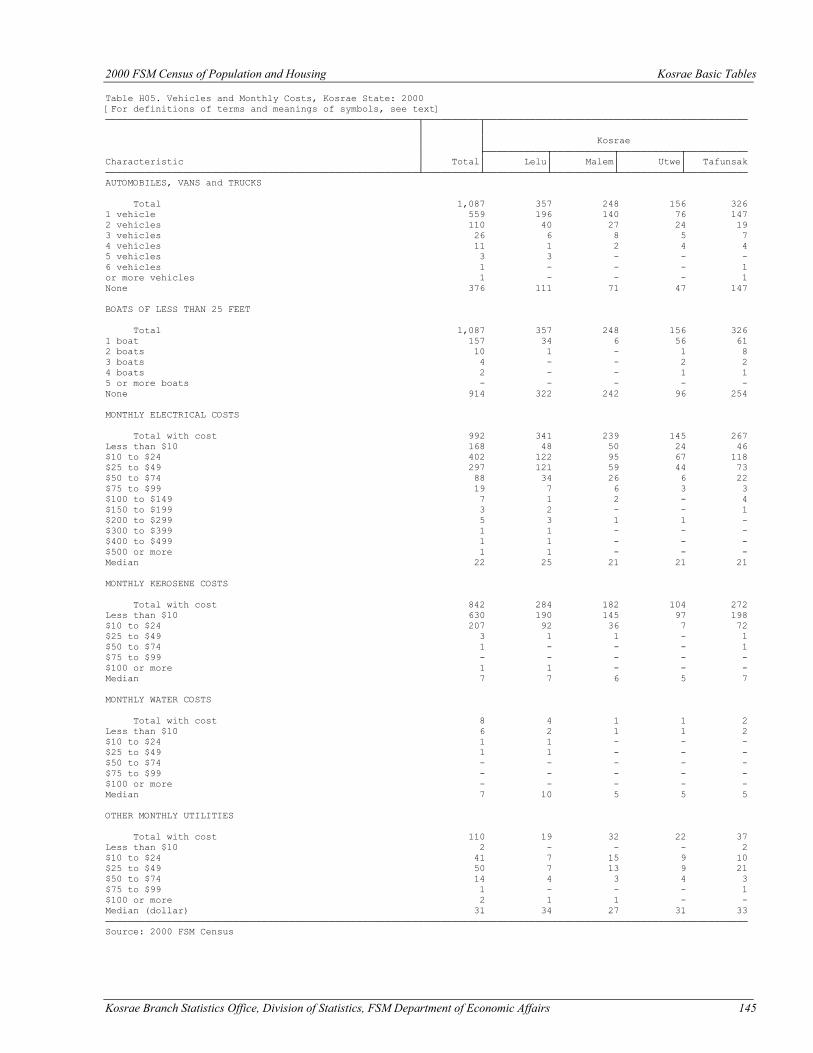
2000 FSM Census of Population and Housing Kosrae Basic Tables
Kosrae Branch Statistics Office, Division of Statistics, FSM Department of Economic Affairs 145
Table H05. Vehicles and Monthly Costs, Kosrae State: 2000 [For definitions of terms and meanings of symbols, see text] ────────────────────────────────────────────────────────┬──────────┬─────────────────────────────────────────────── │ │ │ │ Kosrae │ ├───────────┬───────────┬───────────┬─────────── Characteristic │ Total│ Lelu│ Malem│ Utwe│ Tafunsak ────────────────────────────────────────────────────────┴──────────┴───────────┴───────────┴───────────┴─────────── AUTOMOBILES, VANS and TRUCKS Total 1,087 357 248 156 326 1 vehicle 559 196 140 76 147 2 vehicles 110 40 27 24 19 3 vehicles 26 6 8 5 7 4 vehicles 11 1 2 4 4 5 vehicles 3 3 - - - 6 vehicles 1 - - - 1 or more vehicles 1 - - - 1 None 376 111 71 47 147 BOATS OF LESS THAN 25 FEET Total 1,087 357 248 156 326 1 boat 157 34 6 56 61 2 boats 10 1 - 1 8 3 boats 4 - - 2 2 4 boats 2 - - 1 1 5 or more boats - - - - - None 914 322 242 96 254 MONTHLY ELECTRICAL COSTS Total with cost 992 341 239 145 267 Less than $10 168 48 50 24 46 $10 to $24 402 122 95 67 118 $25 to $49 297 121 59 44 73 $50 to $74 88 34 26 6 22 $75 to $99 19 7 6 3 3 $100 to $149 7 1 2 - 4 $150 to $199 3 2 - - 1 $200 to $299 5 3 1 1 - $300 to $399 1 1 - - - $400 to $499 1 1 - - - $500 or more 1 1 - - - Median 22 25 21 21 21 MONTHLY KEROSENE COSTS Total with cost 842 284 182 104 272 Less than $10 630 190 145 97 198 $10 to $24 207 92 36 7 72 $25 to $49 3 1 1 - 1 $50 to $74 1 - - - 1 $75 to $99 - - - - - $100 or more 1 1 - - - Median 7 7 6 5 7 MONTHLY WATER COSTS Total with cost 8 4 1 1 2 Less than $10 6 2 1 1 2 $10 to $24 1 1 - - - $25 to $49 1 1 - - - $50 to $74 - - - - - $75 to $99 - - - - - $100 or more - - - - - Median 7 10 5 5 5 OTHER MONTHLY UTILITIES Total with cost 110 19 32 22 37 Less than $10 2 - - - 2 $10 to $24 41 7 15 9 10 $25 to $49 50 7 13 9 21 $50 to $74 14 4 3 4 3 $75 to $99 1 - - - 1 $100 or more 2 1 1 - - Median (dollar) 31 34 27 31 33 ─────────────────────────────────────────────────────────────────────────────────────────────────────────────────── Source: 2000 FSM Census
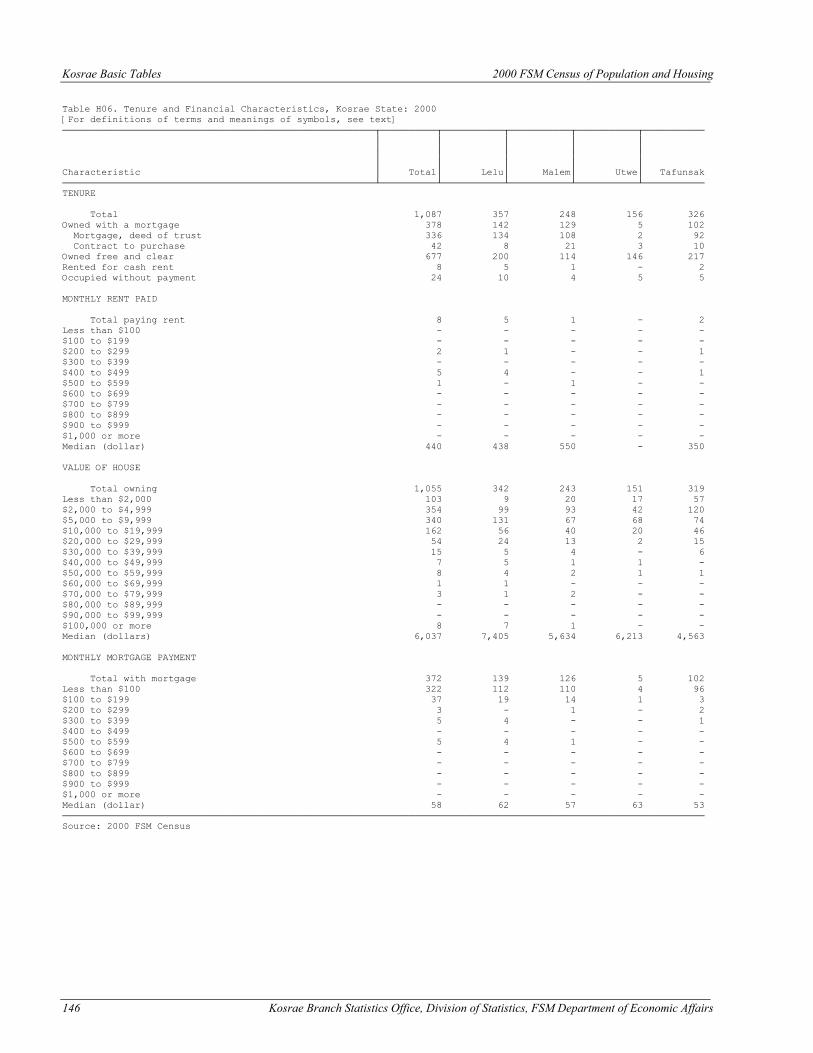
Kosrae Basic Tables 2000 FSM Census of Population and Housing
146 Kosrae Branch Statistics Office, Division of Statistics, FSM Department of Economic Affairs
Table H06. Tenure and Financial Characteristics, Kosrae State: 2000 [For definitions of terms and meanings of symbols, see text] ────────────────────────────────────────────────────────┬──────────┬───────────┬───────────┬───────────┬─────────── │ │ │ │ │ │ │ │ │ │ │ │ │ │ │ Characteristic │ Total│ Lelu│ Malem│ Utwe│ Tafunsak ────────────────────────────────────────────────────────┴──────────┴───────────┴───────────┴───────────┴─────────── TENURE Total 1,087 357 248 156 326 Owned with a mortgage 378 142 129 5 102 Mortgage, deed of trust 336 134 108 2 92 Contract to purchase 42 8 21 3 10 Owned free and clear 677 200 114 146 217 Rented for cash rent 8 5 1 - 2 Occupied without payment 24 10 4 5 5 MONTHLY RENT PAID Total paying rent 8 5 1 - 2 Less than $100 - - - - - $100 to $199 - - - - - $200 to $299 2 1 - - 1 $300 to $399 - - - - - $400 to $499 5 4 - - 1 $500 to $599 1 - 1 - - $600 to $699 - - - - - $700 to $799 - - - - - $800 to $899 - - - - - $900 to $999 - - - - - $1,000 or more - - - - - Median (dollar) 440 438 550 - 350 VALUE OF HOUSE Total owning 1,055 342 243 151 319 Less than $2,000 103 9 20 17 57 $2,000 to $4,999 354 99 93 42 120 $5,000 to $9,999 340 131 67 68 74 $10,000 to $19,999 162 56 40 20 46 $20,000 to $29,999 54 24 13 2 15 $30,000 to $39,999 15 5 4 - 6 $40,000 to $49,999 7 5 1 1 - $50,000 to $59,999 8 4 2 1 1 $60,000 to $69,999 1 1 - - - $70,000 to $79,999 3 1 2 - - $80,000 to $89,999 - - - - - $90,000 to $99,999 - - - - - $100,000 or more 8 7 1 - - Median (dollars) 6,037 7,405 5,634 6,213 4,563 MONTHLY MORTGAGE PAYMENT Total with mortgage 372 139 126 5 102 Less than $100 322 112 110 4 96 $100 to $199 37 19 14 1 3 $200 to $299 3 - 1 - 2 $300 to $399 5 4 - - 1 $400 to $499 - - - - - $500 to $599 5 4 1 - - $600 to $699 - - - - - $700 to $799 - - - - - $800 to $899 - - - - - $900 to $999 - - - - - $1,000 or more - - - - - Median (dollar) 58 62 57 63 53 ─────────────────────────────────────────────────────────────────────────────────────────────────────────────────── Source: 2000 FSM Census
Kosrae Branch Statistics Office, Division of Statistics, FSM Department of Economic Affairs 149
APPENDIX B
QUESTIONNAIRE
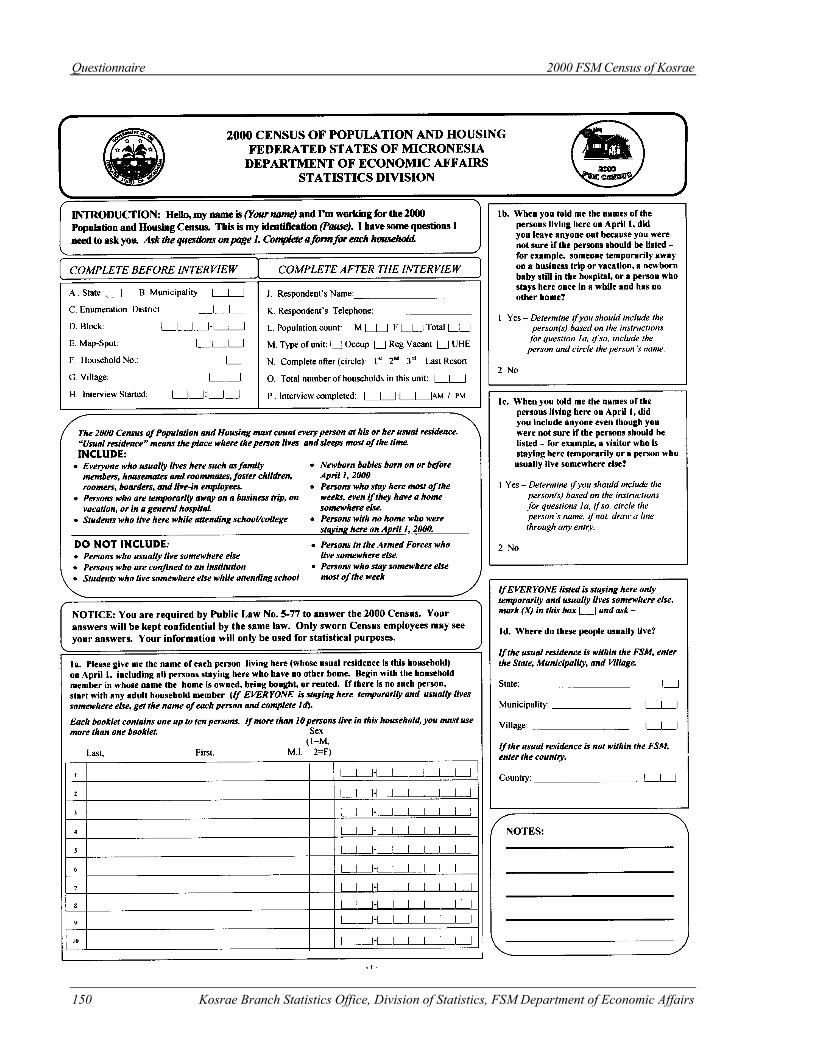
Questionnaire 2000 FSM Census of Kosrae
150 Kosrae Branch Statistics Office, Division of Statistics, FSM Department of Economic Affairs
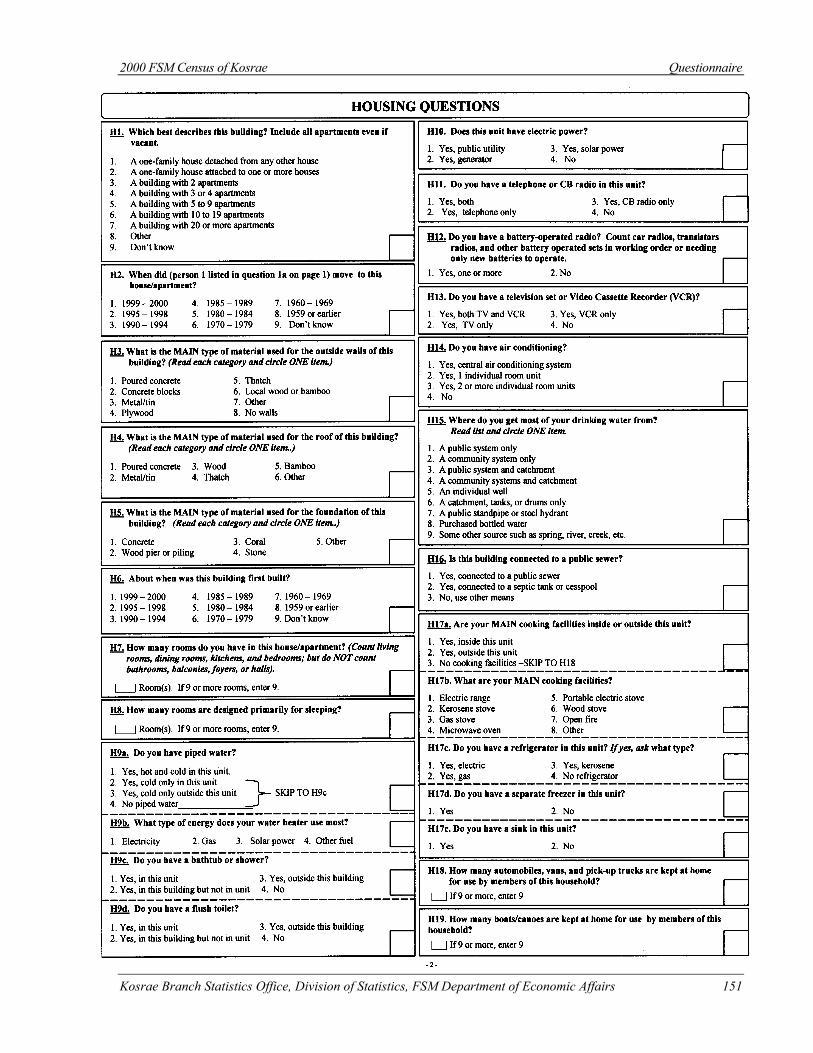
2000 FSM Census of Kosrae Questionnaire
Kosrae Branch Statistics Office, Division of Statistics, FSM Department of Economic Affairs 151
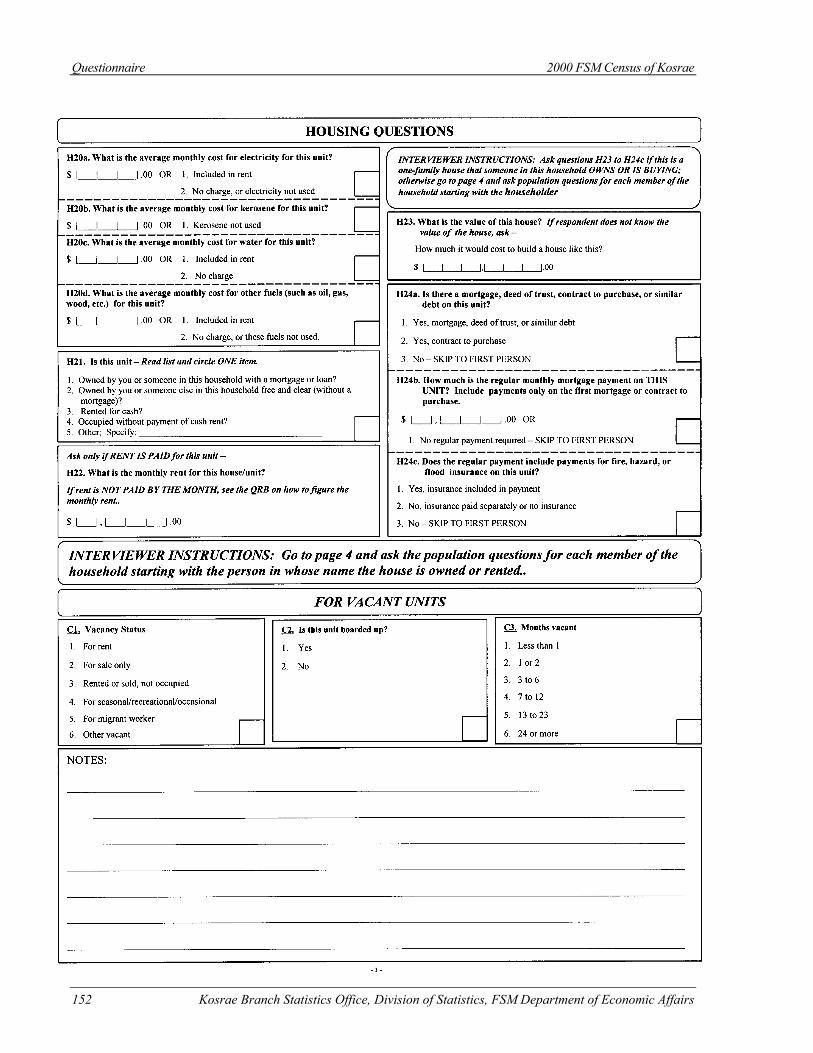
Questionnaire 2000 FSM Census of Kosrae
152 Kosrae Branch Statistics Office, Division of Statistics, FSM Department of Economic Affairs
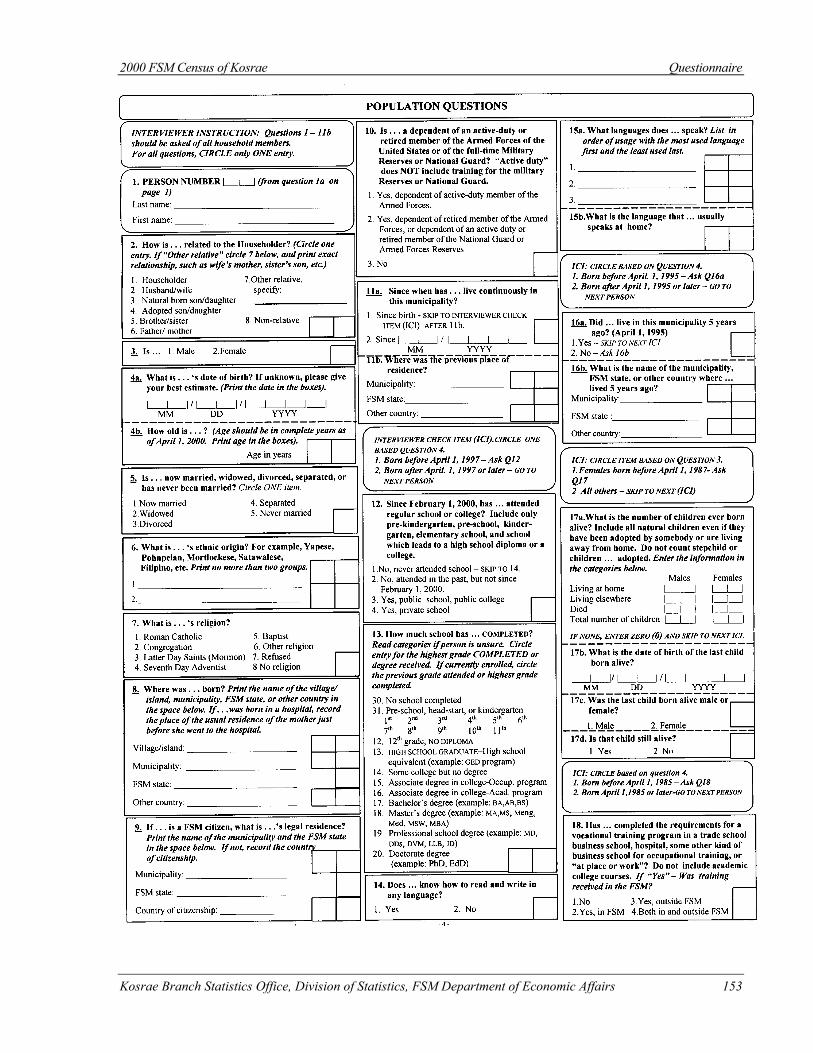
2000 FSM Census of Kosrae Questionnaire
Kosrae Branch Statistics Office, Division of Statistics, FSM Department of Economic Affairs 153

Questionnaire 2000 FSM Census of Kosrae
154 Kosrae Branch Statistics Office, Division of Statistics, FSM Department of Economic Affairs
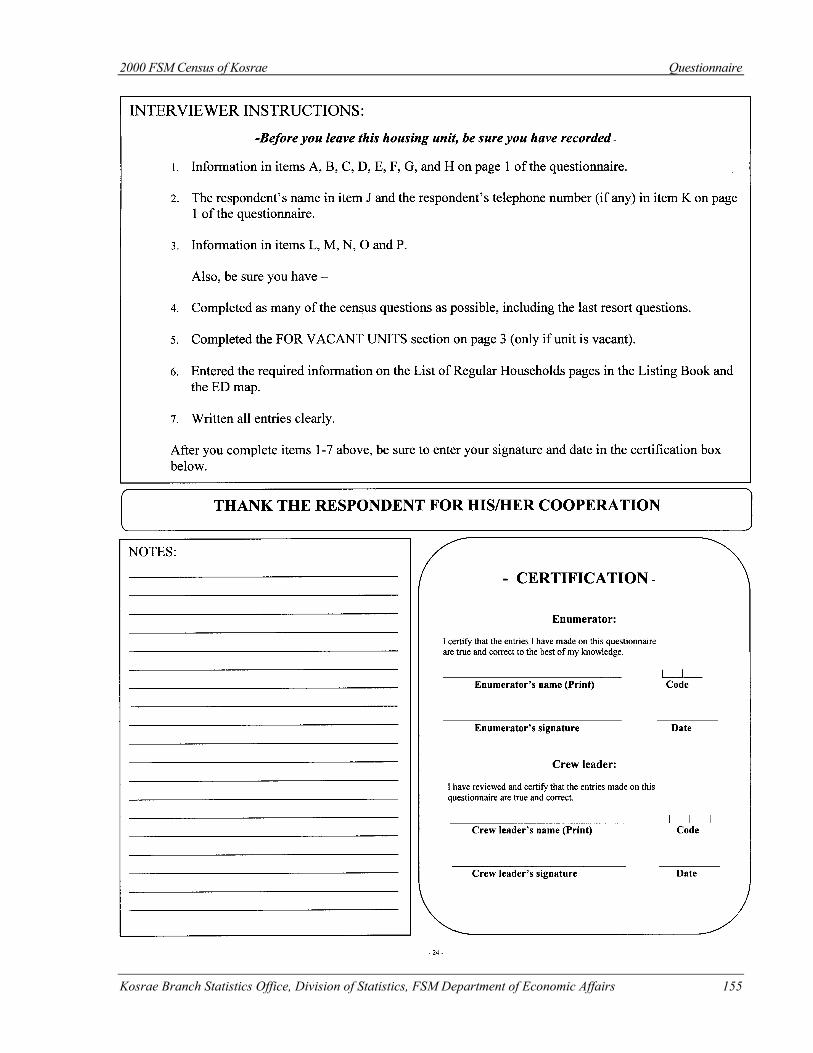
2000 FSM Census of Kosrae Questionnaire
Kosrae Branch Statistics Office, Division of Statistics, FSM Department of Economic Affairs 155