Embed Size (px)
Citation preview
School of Management and Economics
KPI’s – Measuring and evaluating in order to increase logistic efficiency
Bachelor Thesis G3 in Business Economics, 15
Logistics, FE3583, Spring semester 2008
Authors: Anna Rensfelt 840226
Carl-Johan Winblad 840819
Louise Lindman 830928
Tutor: Helena Forslund
Examinator: Petra Andersson
School of Management and Economics
I
PREFACE
This Bachelor Thesis was written during the spring 2008 at the Business Economics
Programme at Växjö University .The thesis comprises 15 credit points and was performed on
AA Power Logistics Sweden in Växjö.
We would like to thank everyone involved in helping us in the duration of this thesis for their
time, hospitality, efforts and helpfulness. We would especially like to thank our tutor Helena
Forslund and our primary contact at AA, logistics manager BB.
We hope that AA will find the results of this thesis valuable in their process towards increased
efficiency. We also hope that readers and others who may be interested in the subject will find
this useful and gain knowledge when reading this thesis.
Växjö, May 2008
Louise Lindman, Anna Rensfelt & Carl-Johan Winblad
__________________________________________
Louise Lindman
__________________________________________
Anna Rensfelt
__________________________________________
Carl-Johan Winblad
School of Management and Economics
II
Abstract
Bachelor Thesis G3 in Business Economics, 15 credit points, School of Management and
Economics at Växjö University, Logistics, FE3583, Spring semester 2008
Authors: Louise Lindman, Anna Rensfelt and Carl-Johan Winblad
Tutor: Helena Forslund
Title: KPI’s – Measuring and evaluating in order to increase logistic efficiency
Background: AA Power Logistics Sweden is having logistic efficiency problems, and at this
point they do not have performance measurement in terms of KPI´s. Due to constant
development and demand on their products, there have not been enough resources available to
perform these measurements.
Purpose: Our purpose is, on the basis of service level and turnover speed, to measure
efficiency in terms of KPI’s at AA. It is also to design record sheets that can assist AA to
increase the efficiency over time.
Methodology: Interviews with managers and employees, in order to have a solid foundation
for what to look for and analyse in the ERP system. The empirical material that was received
was analysed on the basis of different theories.
Result, conclusions: We have developed values for each KPI and also suggested SMART
goals that in the long run will contribute to increasing the logistic efficiency.
Proposal for continued research: In order to being able to evaluate and improve the
implementation process, we recommend participation in the implementation.
Keywords: Logistic Efficiency, KPI, SMART, Record Sheet, Turnover Speed and Service
Level.

School of Management and Economics
III
Sammanfattning
Kandidatuppsats G3 in Företagsekonomi, 15 hp, Ekonomihögskolan Växjö Universitet,
Logistik, FE3583, Vårterminen 2008
Författare: Louise Lindman, Anna Rensfelt och Carl-Johan Winblad
Handledare: Helena Forslund
Titel: KPI´s – Measuring and evaluating in order to increase logistic effiency
Bakgrund: AA Power Logistics Sweden har problem med logistiska effektivitetsproblem,
och i dagsläget utför de inte mätningar i termer av KPI. På grund av ständig utveckling och
efterfrågan på deras produkter, har det inte funnits tillräckligt med resurser tillgängliga för att
utföra dessa mätningar.
Syfte: Vårt syfte är att, baserat på servicenivå och omsättningshastighet, att mäta effektivitet i
termer av KPI på AA. Det är också att utforma så kallade record sheets som kan hjälpa AA att
på sikt öka effektiviteten.
Metod: Intervjuer har utförts med chefer och anställda, för att på så sätt få en solid grund vid
sökning och analys av informationen i affärssystemet. Det empiriska materialet som erhölls
analyserades med utgångspunkt i olika teorier.
Resultat, slutsatser: Vi har utvecklat värden för varje KPI och även föreslagit SMART mål
som i ett långsiktigt perspektiv kommer att bidra till att öka den logistiska effektiviteten.
Förslag till fortsatt forskning: För att kunna utvärdera och förbättra
implementeringsprocessen, rekommenderar vi deltagagande i implementeringen.
Nyckelord: Logistic Efficiency, KPI, SMART, Record Sheet, Turnover Speed och Service
Level.
School of Management and Economics
IV
1. Introduction ..........................................................................................................................1
1.1 Background.......................................................................................................................1 1.1.1 AA .............................................................................................................................1 1.1.2 Theoretical Background ............................................................................................2
1.2 Problem Discussion ..........................................................................................................4 1.3 Problem Definition ...........................................................................................................5 1.4 Purpose .............................................................................................................................6 1.5 Disposition........................................................................................................................7 1.6 Schedule............................................................................................................................8
2. Methodology..........................................................................................................................9
2.1 Scientific View .................................................................................................................9 2.1.1 Hermeneutics and Positivism ....................................................................................9 2.1.2 Our scientific view.....................................................................................................9
2.2 Research approach ..........................................................................................................10 2.2.1 Induction, Abduction and Deduction.......................................................................10 2.2.2 Our approach ...........................................................................................................10
2.3 Research Method ............................................................................................................11 2.3.1 Quantitative Method and Qualitative Method .........................................................11 2.3.2 Our method ..............................................................................................................11
2.4 Data Collection Method..................................................................................................11 2.4.1 Our data collection method......................................................................................12
2.5 Choice of respondents ....................................................................................................12 2.6 Trustworthiness ..............................................................................................................13 2.6.1 Transferability .........................................................................................................13 2.6.2 Dependability...........................................................................................................13 2.6.3 Confirmability .........................................................................................................13 2.6.4 Our trustworthiness..................................................................................................14
2.7 Summary.........................................................................................................................15 3. Theories ...............................................................................................................................16
3.1 Performance measurement .............................................................................................16 3.1.1 Why measuring performance?.................................................................................16 3.1.2 Defining KPI............................................................................................................16 3.1.3 Sorting of KPI..........................................................................................................18 3.1.4 Implementation of KPI ............................................................................................20 3.1.5 SMART ...................................................................................................................20
3.2 Inventory measurement ..................................................................................................22 3.2.1 Turnover speed ........................................................................................................22 3.2.2 Service level and delivery precision........................................................................23 3.2.3 Tied up capital .........................................................................................................24 3.2.4 Inventory Level........................................................................................................25 3.2.5 The Pareto principle.................................................................................................27 3.2.6 ABC analysis ...........................................................................................................27
3.3 Summary of theories.......................................................................................................29 3.3.1 Variables ..................................................................................................................29
4. Empirical .............................................................................................................................30
4.1 Performance Measurement .............................................................................................30 4.1.1 KPI...........................................................................................................................30
School of Management and Economics
V
4.1.2 SMART ...................................................................................................................30 4.2 Inventory.........................................................................................................................31 4.2.1 Inventory level and tied up capital ..........................................................................31 4.2.2 Turnover speed ........................................................................................................34 4.2.3 Service Level ...........................................................................................................35 4.2.4 The Pareto Principle and ABC analysis ..................................................................38
5. Analysis................................................................................................................................40
5.1 Performance Measurement .............................................................................................40 5.1.1 Why measuring performance...................................................................................40 5.1.2 KPI...........................................................................................................................40 5.1.3 SMART ...................................................................................................................41
5.2 Inventory.........................................................................................................................45 5.2.1 Inventory Level and Tied up Capital .......................................................................45 5.2.2 Turnover speed ........................................................................................................45 5.2.3 Service Level ...........................................................................................................46 5.2.4 Pareto Principle and ABC analysis..........................................................................47
6. Results..................................................................................................................................48
7. Discussion ............................................................................................................................49
7.1 Critical review and proposals for continued research.....................................................51 8. Conclusions..........................................................................................................................52
9. References............................................................................................................................53
Appendix 1...............................................................................................................................56
Appendix 2...............................................................................................................................59
Appendix 3...............................................................................................................................69

School of Management and Economics
VI
Figures
Figure 1. The efficiency variables
Figure 2. Disposition
Figure 3. Gantt Chart
Figure 4. Interview Table
Figure 5. A summary illustrating our chosen methods
Figure 6. Success Map
Figure 7. A figure illustrating SMART goal setting
Figure 8. The formula illustrating the turnover speed
Figure 9. Service level in order cycles
Figure 10. Tied up capital
Figure 11. ABC analysis chart
Figure 12. A table illustrating the article groups and the additional charges
Figure 13. Inventory value over time
Figure 14. Total level of tied up capital from May 2007 to April 2008
Figure 15. Formula illustrating the calculation of turnover speed.
Figure 16. Service level from the customer point of view
Figure 17. The table illustrates the number of delayed and on-time deliveries regarding NN.
Figure 18. Service level from AA’s point of view for product NN.
Figure 19. The chart illustrates late and on-time deliveries for ZZ 105.
Figure 20. The diagram illustrates how the articles are divided and the share of the percentage.
Figure 21. Table of results regarding KPI’s
School of Management and Economics
1
1. Introduction
The introduction chapter of this bachelor thesis is meant to provide the reader with relevant
information regarding the background of the efficiency problems at AA and also a
background about the company. In addition to this, the reader will be informed of the
disposition of the thesis.
1.1 Background
1.1.1 AA
AA in Sweden is involved in production, sales and delivery of a wide range of products, such
as gas and steam turbines, generators, hydroelectric power systems and also trains and other
products related to transport. (www.se.AA.com)
The head office is located in Norrköping, but there are also offices in Västerås, Växjö and
Stockholm. AA Sverige has 800 employees in total, divided on the three corporations AA
Power Sweden AB, AA Hydro Sweden AB and AA Transport AB. Some of the keywords
characterizing the company are quality and environmental consideration. All activities within
the company take the environment into consideration.
AA Power is located in Växjö and has development, construction and marketing of systems
for cleaning of smoke gases and other process gases. The logistics manager, BB Nilsson, at
AA explains that the task of the logistics department in Växjö is to provide the production
department with parts for manufacturing, and also function as an inventory for spare parts for
the international organisation. They are only involved in internal trading, which means that
they are only in contact with people from within the company and only deliver to local AA
offices. In its turn, the local offices supply the end customer.
Earlier, the different departments did not always turn to the logistics department in the first
place to order their parts; there were also other suppliers that provided spare parts. The
logistic manager tells us that the vision of the logistics department is to become the prime
supplier of original parts for production as well as spare parts.
In order to become the first choice for supplies, AA needs to improve the efficiency control
School of Management and Economics
2
by appointing a number of KPI´s1 that are of relevance to the specific problem.
1.1.2 Theoretical Background
Each company has a wide range of different costs. The costs for inventory represent a large
share of these. Despite this, an inventory is a condition to secure the ability to meet changes in
demand, unreliable lead times and variations in forecasts. To compensate the high costs for
keeping an inventory, it is of high importance to manage and control the different variables
that affect the efficiency.
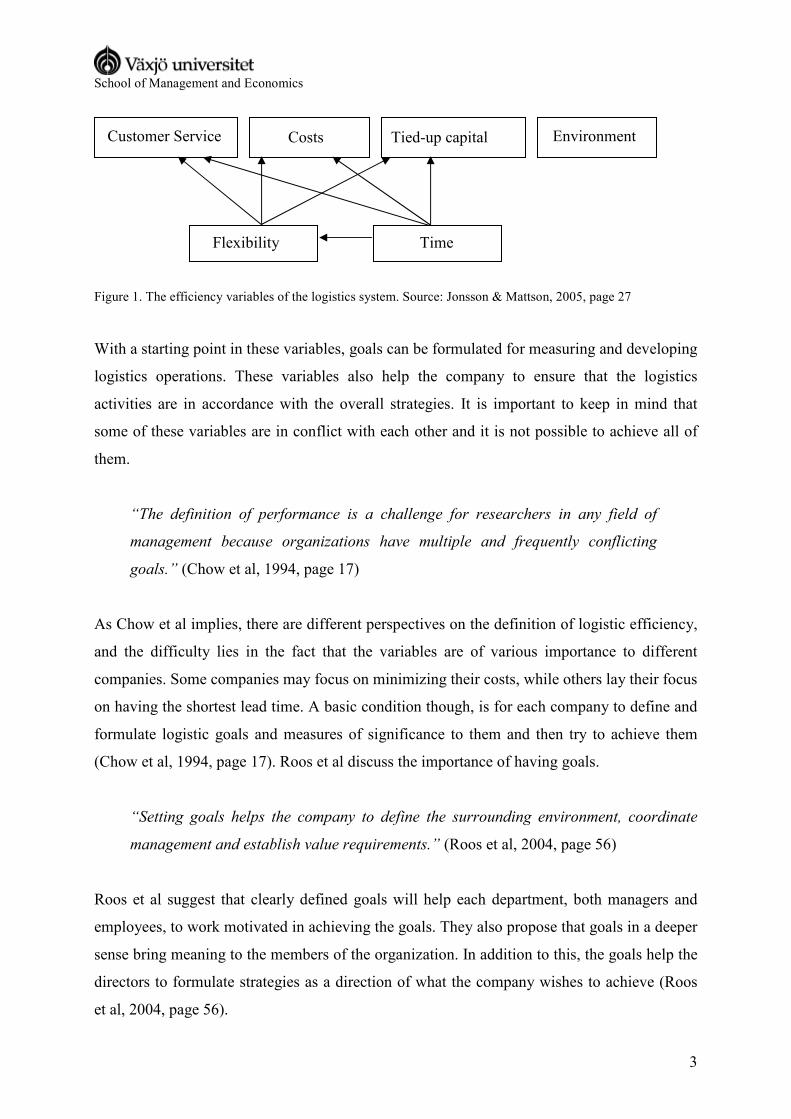
Jonsson and Mattson have defined logistic efficiency variables that can be used when
measuring logistics performance. It is illustrated in figure 1.
• Customer Service – The level of customer service affects the efficiency in terms of
service level, delivery time etc. The ability to provide with material flow information,
such as track and trace, also has an effect on the service level.
• Costs – In general, companies want to minimize costs, and maximize quality.
• Tied-up capital – There are two kinds of assets, turnover assets and building assets.
The turnover assets represent the tied-up capital.
• Flexibility – The ability to adapt changes in the surroundings.
• Time – If the logistics activities are not time efficient, it is difficult to design and
create an efficient logistics system.
• Environment – The logistics activities that negatively affect the environment should
be evaluated and improved. (Jonsson & Mattson, 2005, page 27)
1 Key Performance Indicator
School of Management and Economics
3
Figure 1. The efficiency variables of the logistics system. Source: Jonsson & Mattson, 2005, page 27
With a starting point in these variables, goals can be formulated for measuring and developing
logistics operations. These variables also help the company to ensure that the logistics
activities are in accordance with the overall strategies. It is important to keep in mind that
some of these variables are in conflict with each other and it is not possible to achieve all of
them.
“The definition of performance is a challenge for researchers in any field of
management because organizations have multiple and frequently conflicting
goals.” (Chow et al, 1994, page 17)
As Chow et al implies, there are different perspectives on the definition of logistic efficiency,
and the difficulty lies in the fact that the variables are of various importance to different
companies. Some companies may focus on minimizing their costs, while others lay their focus
on having the shortest lead time. A basic condition though, is for each company to define and
formulate logistic goals and measures of significance to them and then try to achieve them
(Chow et al, 1994, page 17). Roos et al discuss the importance of having goals.
“Setting goals helps the company to define the surrounding environment, coordinate
management and establish value requirements.” (Roos et al, 2004, page 56)
Roos et al suggest that clearly defined goals will help each department, both managers and
employees, to work motivated in achieving the goals. They also propose that goals in a deeper
sense bring meaning to the members of the organization. In addition to this, the goals help the
directors to formulate strategies as a direction of what the company wishes to achieve (Roos
et al, 2004, page 56).
Customer Service Costs Tied-up capital Environment
Flexibility Time
School of Management and Economics
4
1.2 Problem Discussion
There are several valid measurements for efficiency, but the difficulty lies in selecting the
adequate values for the specific company and problem. Terms such as lead time, tied-up
capital and service level have different meanings in different companies, which complicate
defining exactly what numbers and data to use when measuring the phenomena mentioned
above (Griffis et al, 2007, page 36).
As of 2008, the management has formulated a strategic vision named Blue Sky 2011. It refers
to the long term goals for the corporation as a whole. One of goals specified is to achieve
delivery precision of 95 percent.
Based on the suggestions by Jonsson & Mattson who described different efficiency variables,
and Chow et al who implied that each company has to define their own variables to measure
efficiency, it is of importance for AA to identify their specific variables. After consultation
with BB Nilsson, we were able to specify two variables of high importance to them; Customer
service and turnover speed, which can be founded in the variable tied up capital (figure 1).
Developing the term customer service and adjusting it to this specific company, it includes the
aspect of delivery performance and delivery precision. Delivery performance among with a
number of other variables together forms the concept of customer service. The level of tied up
capital is necessary in order to calculate our second variable, turnover speed. These variables
are important to AA, as they strongly affect the costs and the opportunity to become the prime
supplier. By controlling these variables, they also control the costs. An increased level of
control would result in an increased efficiency, which is in accordance with Blue Sky 2011.
The issue of contradictory objectives should be considered when setting goals. It is important
to decide what should be prioritized between for instance a high service level and a low level
of tied up capital, which in turn reflects the turnover speed. Several examples of conflicting
goals can be mentioned, but this is one of relevance to our study at AA.
The lack of measures in AA’s logistics department that can be used to analyse today’s levels
and potential goals, limits the management’s ability to evaluate, develop and improve the
inbound, production and outbound flows. In order to manage and control logistic
performance, it is relevant to enlighten a number of concrete measures to guarantee correct
KPI´s. An aspect related to this can be to achieve a satisfying service level, without increasing
School of Management and Economics
5
the level of tied up capital to a non-profitable level. Due to this, the company wishes to
establish KPI´s of relevance to the management and their financial goals.
The fact that AA are only involved in internal trade, hence they are not in contact with any
external customers, complicates the goal setting. Normally, companies and departments strive
to make the most profits out of the logistics and sales activities. In this case though, the aim is
to have zero profit, as any profit would indicate that the logistics department has overcharged
the local sales offices. This also implies that if the logistics department is charged too much
for purchased components, the price at the final stage will be set too high. This could result in
losing customers to other suppliers, charging a lower price.
Due to the fact that AA’s assortment contains a large number of articles and products, it
would not be possible to include all when designing and measuring the KPI’s. In order to
make the study as applicable as possible, the focus is on the three, in relation to turnover,
most significant products, NN, XX and ZZ.
The ERP2 system that AA uses contains all relevant information and data needed to analyse
the efficiency of logistics processes. The problem for AA is that no one has had the ability to
investigate today’s levels and objectives.
To sum up, the specific characteristics for AA are aspects such as internal trading, gathering
information from the ERP system and function both as a production unit and a storage unit for
the market worldwide.
1.3 Problem Definition
• What is today’s level of turnover speed and service level, in terms of delivery
precision?
• What would be appropriate goals in order to achieve the strategic vision Blue Sky
2011?
2 Enterprise Resource Planning System

School of Management and Economics
6
1.4 Purpose
Our purpose is, on the basis of service level and turnover speed, to measure efficiency in
terms of KPI’s at AA. It is also to design record sheets that can assist AA to increase the
efficiency over time.
School of Management and Economics
7
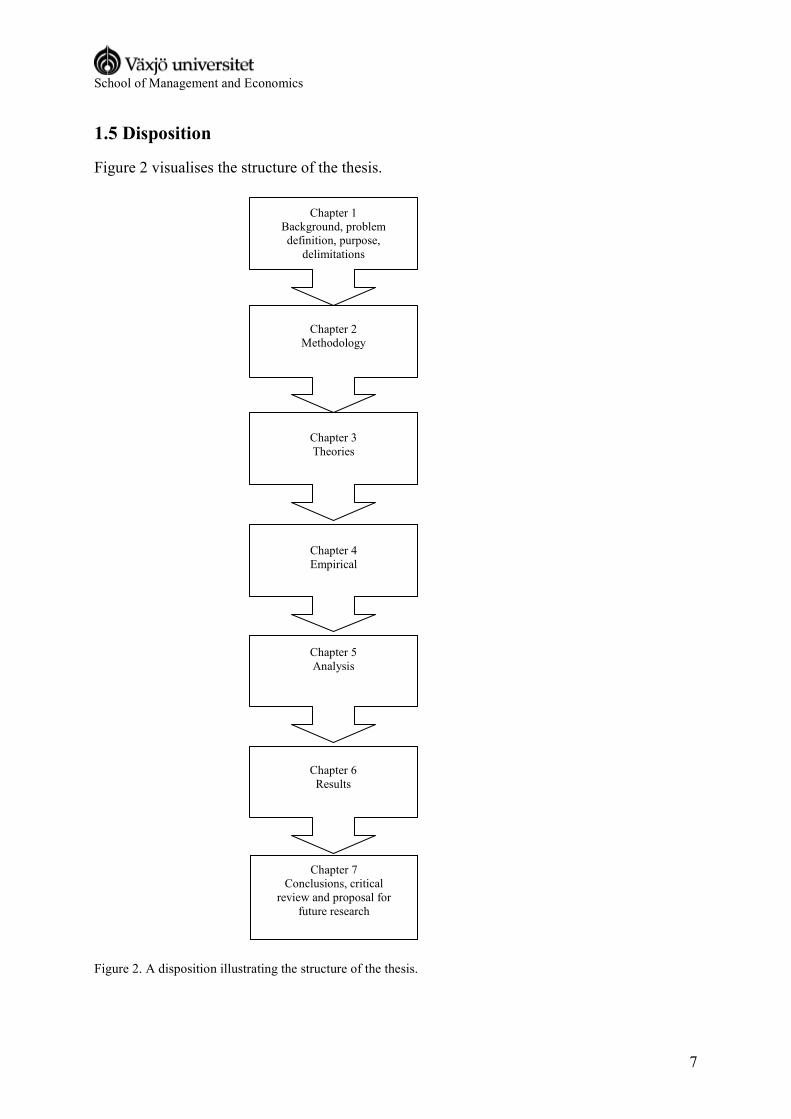
1.5 Disposition
Figure 2 visualises the structure of the thesis.
Figure 2. A disposition illustrating the structure of the thesis.
Chapter 1 Background, problem definition, purpose, delimitations
Chapter 2 Methodology
Chapter 3 Theories
Chapter 4
Chapter 5 Analysis
Chapter 4 Empirical
Chapter 6 Results
Chapter 7 Conclusions, critical review and proposal for
future research

School of Management and Economics
8
1.6 Schedule
April May June
14 15 16 17 18 19 20 21 22 23
Introduction
Method
Theories
Empirical
Analysis and conclusions
Design
Preparation for presentation
Figure 3. Gantt chart.
School of Management and Economics
9
2. Methodology
This chapter describes the methods used in collecting data, and the way it has been handled
and analyzed. It will also describe the scientific approach. The main task is to help the reader
understand the reason a particular method has been used and how it is relevant to our study
at AA.
2.1 Scientific View
In the scientific view there are two main alignments; positivism and hermeneutics. Within
positivism, the researcher applies scientific methods when reaching the results (Bryman &
Bell, 2003, page 593). The hermeneutic view is characterized by that the researcher aims to
create an understanding for the object being studied (Starrin & Svensson, 1994, page 73).
2.1.1 Hermeneutics and Positivism
Starrin & Svensson (1994) intends that the main aim of hermeneutics is to answer questions
and come to conclusions by creating understanding. Usually the researcher studies human
actions, interactions and other occurrences within their context. Due to this, the researcher can
capture the intentions and meanings behind the actions, which in turn gives the researcher a
wider sense of comprehension.
According to the positivistic view, the answer and the results to the problem are found by
following certain methods and common rules that are independent by the context and content
of the study. It is also of importance that any influence by the researcher during the study is
minimized. If the study is affected by feelings, emotions, prejudices etc, there is a risk that the
trustworthiness of the study decreases. (Kvale S, 1997, page 62-63)
2.1.2 Our scientific view
As we have been taught in a positivistic view, this has been reflected in the way our empirical
research has been performed. This means that, during the interviews we had no intention to
interpret what was said, but accepted the information as facts. In AA’s type of business, there
is no reason to make comments with hidden meanings, which is why we assumed that the
information presented to us was accurate.
School of Management and Economics
10
2.2 Research approach
There are two main ways of drawing scientific conclusions; inductive and deductive (DePoy
E, 1999, page 17). Induction is based on facts, the empirical, while deduction is based on
theories (Bryman & Bell, 2003, page 588, 590). Alvesson and Sköldberg (2000, page 17)
present a third way of approaching research, abduction, which means the ability to see
patterns.
2.2.1 Induction, Abduction and Deduction
An inductive approach means that the study is based on empirical facts, which will later be
the foundation of general conclusions. An inductive conclusion can not be considered
completely reliable, as it is built on empirical material that rarely includes all aspects.
(Thurén, 2000, page 19)
Abduction means the ability to see patterns and reveal deep structures (Alvesson &
Sköldberg, 2000, page 17). The intention of the abductive approach is to propose new
theories to already existing ones. Through authentication of empirical data, the existing
theories are developed (Spens & Kovàcs, 2006, page 374-390).
A deductive point of view is focused on theories, and from there the researcher investigates
whether reality agrees with the theory (Backman, J, 1998, page 48). Bryman and Bell (2003,
page 23) describe the deductive theory as the most common perception of the relationship
between theories and practice. Based on the present knowledge regarding a certain area, the
researcher deducts one or more hypothesises that have to pass an empirical review.
2.2.2 Our approach
We have used a deductive approach to our study, as we have performed our empirical studies
based on existing theories. Theories regarding efficiency and different efficiency variables
have been the core in our thesis. The theories have been adapted to match the situation at AA.
School of Management and Economics
11
2.3 Research Method
There are two methods when performing a research; quantitative and qualitative. A qualitative
method is focused on interviews or observations, and aims to capture an understanding. A
quantitative method comprises collection of data through surveys, where the information is
analysed through mathematical correlations. (Eliasson, 2006, page 22 & 28)
2.3.1 Quantitative Method and Qualitative Method
As mentioned above, quantitative research methods include different mathematical
calculations to analyse numbers and information. Quantitative researches are often conducted
through surveys. (Eliasson, 2006, page 28)
Hartman (2004, page 207) says that “quantitative research is characterized by investigating
the numerical relationship between two or more measurable attributes.”
Qualitative researches are focused on the constitution of objects, their nature and
characteristics (Alasuutari, 1995, page 7). Observations and interviews are the most
frequently used methods. Ethnography and participant observations are examples that are
categorized as observations. Interviews are divided into structured, semi-structured and
unstructured interviews. It is up to the observer or interviewer to decide what kind of
technique is most appropriate. (Eliasson, 2006, page 22)
2.3.2 Our method
Due to the fact that our purpose is, on the basis of service level and turnover speed, to
measure efficiency in terms of KPI’s at AA, we performed interviews with managers and
employees. The interviews were conducted at the logistics and IT department in order to
understand the environment affecting the logistic activities. Hence, the method that we mainly
used was qualitative.
The data we gathered from the ERP-system are to look upon as quantitative, thus we
summarize our research method as qualitative with segments of quantitative data.
2.4 Data Collection Method
Data can be separated into primary and secondary data. Primary data is collected by the
researcher, for the purpose of the research. Data that has been gathered by others, for another
purpose, is named secondary data.
School of Management and Economics
12
2.4.1 Our data collection method
Primary data in our thesis was collected through recorded interviews with key managers and
employees. The interviews with the managers were semi-structured and instead of a
questionnaire we used an interview guide with some of the questions decided previous to the
meeting. The interviews with employees were unstructured. A great part of the data was
gathered from the ERP-system. This is categorized as primary data, as we were able to decide
what information we considered useful to our purpose.
Secondary data was collected through the literature to construct a theoretical framework
suitable for the purpose of the thesis. After reading the literature the selection was made to
introduce the reader to the most relevant theories. The source for our literature study was the
University library in Växjö, including their access to articles and books in other libraries
transversely in Sweden. Most of the articles were found through EBSCOhost Business Source
Premier with keywords like “logistics”, “KPI”, “efficiency”, “turnover speed”, “service level”
and “logistic performance”.
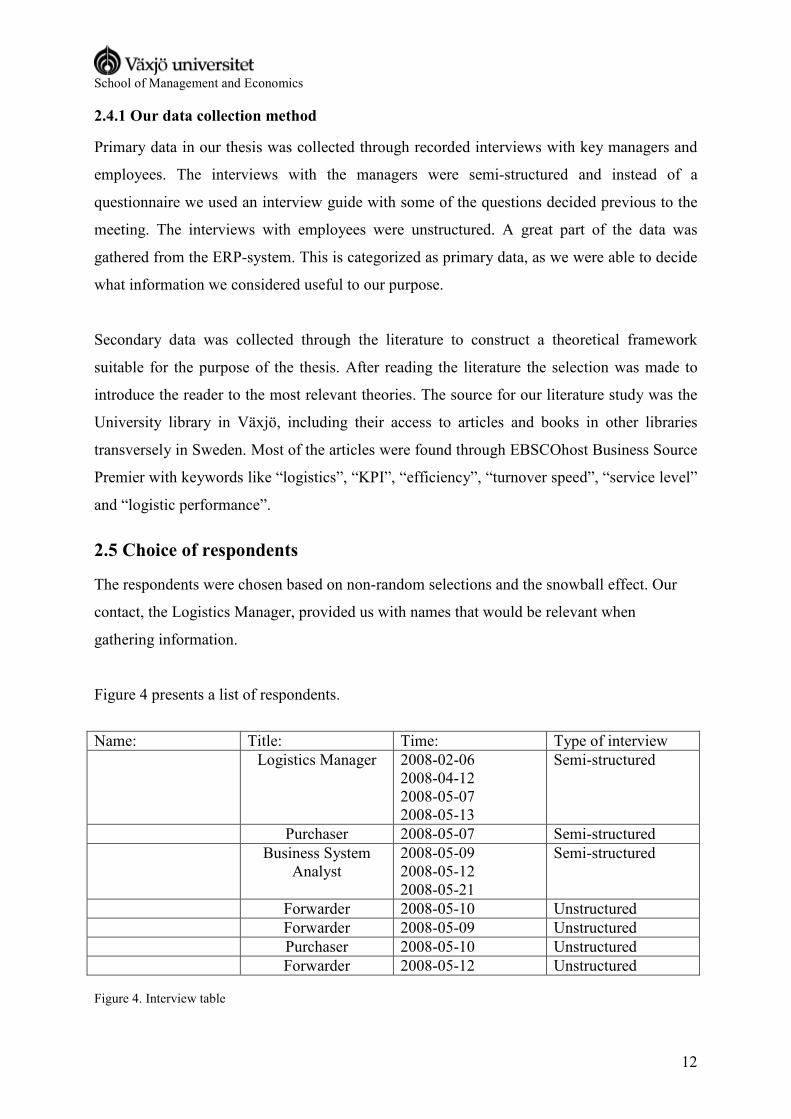
2.5 Choice of respondents
The respondents were chosen based on non-random selections and the snowball effect. Our
contact, the Logistics Manager, provided us with names that would be relevant when
gathering information.
Figure 4 presents a list of respondents.
Name: Title: Time: Type of interview Logistics Manager 2008-02-06
2008-04-12 2008-05-07 2008-05-13
Semi-structured
Purchaser 2008-05-07 Semi-structured Business System
Analyst 2008-05-09 2008-05-12 2008-05-21
Semi-structured
Forwarder 2008-05-10 Unstructured Forwarder 2008-05-09 Unstructured Purchaser 2008-05-10 Unstructured Forwarder 2008-05-12 Unstructured Figure 4. Interview table
School of Management and Economics
13
2.6 Trustworthiness
When it comes to quantitative methods, concepts such as validity and reliability are of great
importance. Validity aims to explain whether the researcher constructs valid conceptions,
relevant to the study. Reliability expresses the ability to replicate an investigation. Regarding
qualitative methods though, Guba and Lincoln (1985 and 1994, see Bryman and Bell, 2003,
page 306) suggest other criteria; credibility, transferability, dependability and confirmability.
Due to our deductive approach, our aim is not to construct new theories. Therefore,
credibility, which corresponds to internal validity, is of less interest.
2.6.1 Transferability
Qualitative studies usually have a strong focus on contextual unique occurrences, and on the
meaning or intention of the social reality being studied. Therefore, it is of importance to
visualize and give detailed descriptions of the surroundings. Visualisation and description
would help other reviewers to rebuild a corresponding database. The reason why this is
important is to be able to achieve acceptance for the results of the study. It is equivalent to
“external validity”. (Bryman & Bell, 2003, page 307)
2.6.2 Dependability
Dependability corresponds to reliability. The only way to attain dependability is to give a
complete and accessible account covering every phase of the process. One disadvantage of
auditing is the amount of work added to the process. Every step of the study has to be
documented alongside the original research. (Bryman & Bell, 2003, page 307)
Yin (2003, page 37) summarizes with a quote on reliability: “The goal of reliability is to
minimize the errors and biases in a study”. The quote can also be applied to dependability.
2.6.3 Confirmability
To be able to confirm and show objectiveness, the researcher must be aware of the fact that
there is no such thing as a complete objectiveness. Knowing this, the key action is to show the
reader that all results and conclusions are based on objective theories. It has to be obvious that
none of the researcher’s personal values or theoretical directions will affect the outcome of
the study. (Bryman & Bell, 2003, page 307-308)
School of Management and Economics
14
2.6.4 Our trustworthiness
Transferability aims to achieve acceptance for the results by detailed descriptions of the
surrounding environment. We consider the transferability for this thesis to be high as we have
presented the information and data we received in the Empirical chapter, and not excluded
any parts of it. When taking into account the distinguishing characteristics of this case, we
regard the study to contain all relevant information needed to achieve transferability.
Dependability refers to giving the reviewer an opportunity to replicate the study, usually by
keeping diaries and journals of the process. Given this perspective, we can conclude that our
degree of dependability is low. We have not kept journal of our report, due to the limited time
horizon and resources.
Confirmability derives the objectiveness of the thesis. When collecting and presenting data
and information, we have attempted to take all aspects into account. We have included both
advantageous and disadvantageous data, in order to perform the analyses in an accurate
manner. We based our analyses on existing theories, and not on assumptions. Hence, we
consider the confirmability of this thesis to be high.
School of Management and Economics
15
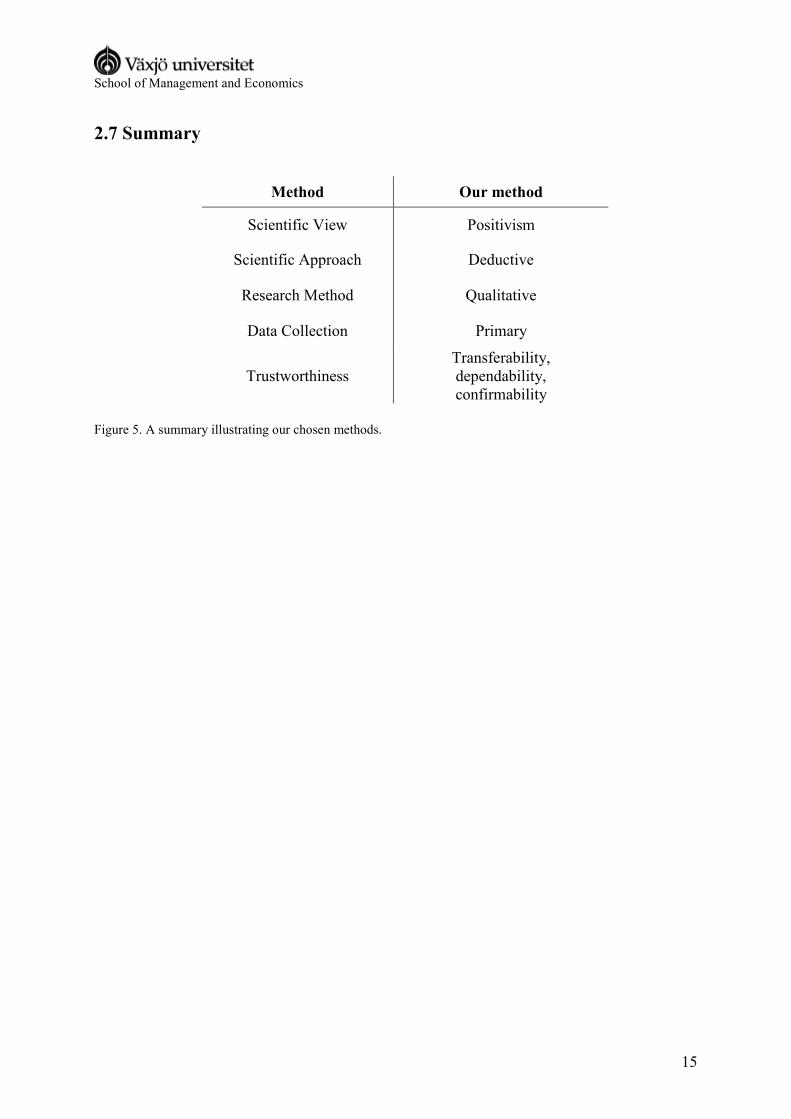
2.7 Summary
Method Our method
Scientific View Positivism
Scientific Approach Deductive
Research Method Qualitative
Data Collection Primary
Trustworthiness Transferability, dependability, confirmability
Figure 5. A summary illustrating our chosen methods.
School of Management and Economics
16
3. Theories
This chapter presents different scientific theories regarding how to measure KPI´s and how to
implement them. It also handles what to measure and different options for evaluating
inventories. In the end of the chapter we present a summary of theories relevant for the
proceeding study and this contributes to the conclusions.
3.1 Performance measurement
This chapter covers pertinent literature regarding performance measurement. A lot of the
theories are found in Parmenter (2007), and has his perspective on KPI and measurement.
Neely’s suggestions on how to define KPI´s to create the right behaviour and driving forces in
an organisation are also important aspects.
3.1.1 Why measuring performance?
In order to being able to establish and improve the performance in a process, it is according to
Anupindi et al (2006) important to measure it in terms that are possible to quantify. Alfred
Sloan, CEO of General Motors between 1923 and 1946, define a professional leader as one
that controls with facts rather than intuition and emotions. By collecting facts in an objective
and concrete way, it is possible to gain a clear view of the process. Measuring performance is
an important part when implementing methods to improve products and processes, and also
when establishing the outcome of an alteration. (Anupindi et al, 2006, page 6)
Furthermore, Neely et al (1997, page 1132) describe that a well-known effect of measuring
performance is that it creates driving forces and affects individual behaviour. The behaviour
changes as an ambition to improve the result of the measurement. The change that occurs
though, is not necessarily what the management wishes to achieve.
3.1.2 Defining KPI
KPI´s can be defined in several ways. The following definition is suggested by Parmenter
(2007, page 1) and separates three KPI´s; Key Result Indicator (KRI), Key Performance
Indicator (KPI) and Performance Indicator (PI).
Key Result Indicators, KRI´s, measure the performance from an external point of view. They
School of Management and Economics
17
can be financial measures, which can not be deducted to specific actions or causes. KRI´s are
meant to provide with information, such as solidity and profit, for external stakeholders. The
measures indicate whether the direction is accurate, but give no information about how to
improve the results. In general the KRI´s cover longer periods of time, usually months or
quarters of a year. The measures are suitable for the management to base decisions on, but are
of little use in the daily activities. (Parmenter, 2007, page 2)
Key Performance Indicators, KPI´s, are indicators showing what needs to be done in an
internal operative perspective. These KPI´s focus on the parts of an organisation’s
performance that are the most critical to success, both for present time and future. A good KPI
affects a number of critical success factors. It also affects other KPI´s in a positive manner.
Parmenter (2007, page 3) identifies seven characteristics for a KPI:
1. Non-financial measure
2. Regular measurements
3. A measure that is noticed by the management
4. Everyone in the organisation has an understanding for the KPI
5. Responsibility connections to individuals and teams
6. Significant effect
7. Positive effect
By measuring a KPI in dollars or another currency, it is directly defined as a Key Result
Indicator. A Key Performance Indicator lies deeper in the organisation, and is to be measured
on a daily or weekly basis. Hence, a KPI is of more current interest, describing the
performance in real time and not passed. A good KPI is of great significance and constantly
has the attention of the management. When deviating from the goal value, the management
takes action and contacts the responsible supervisor. Neely emphasizes the challenge to create
KPI´s of meaning in the daily activities, but that are also possible to aggregate to useful
information.
A Performance Indicator, PI, is an indicator showing what needs to be done in an internal
operative perspective to increase the performance. They are primarily considered as
complementary measures for the KPI. (Parmenter, 2007, page 3)
Anupindi et al (2006, page 6-9) also make a similar division of different measures; Financial,
School of Management and Economics
18
external and internal.
There is a rule called the 10/80/10 rule. It suggests that an appropriate number of measures in
an organisation are ten Key Result Indicators, 80 Performance Indicators and ten Key
Performance Indicators. The exact number of indicators though, is for every individual
organisation to decide. For clarification, this is a rule usually implemented on a strategic level.
(Parmenter, 2007, page 8)
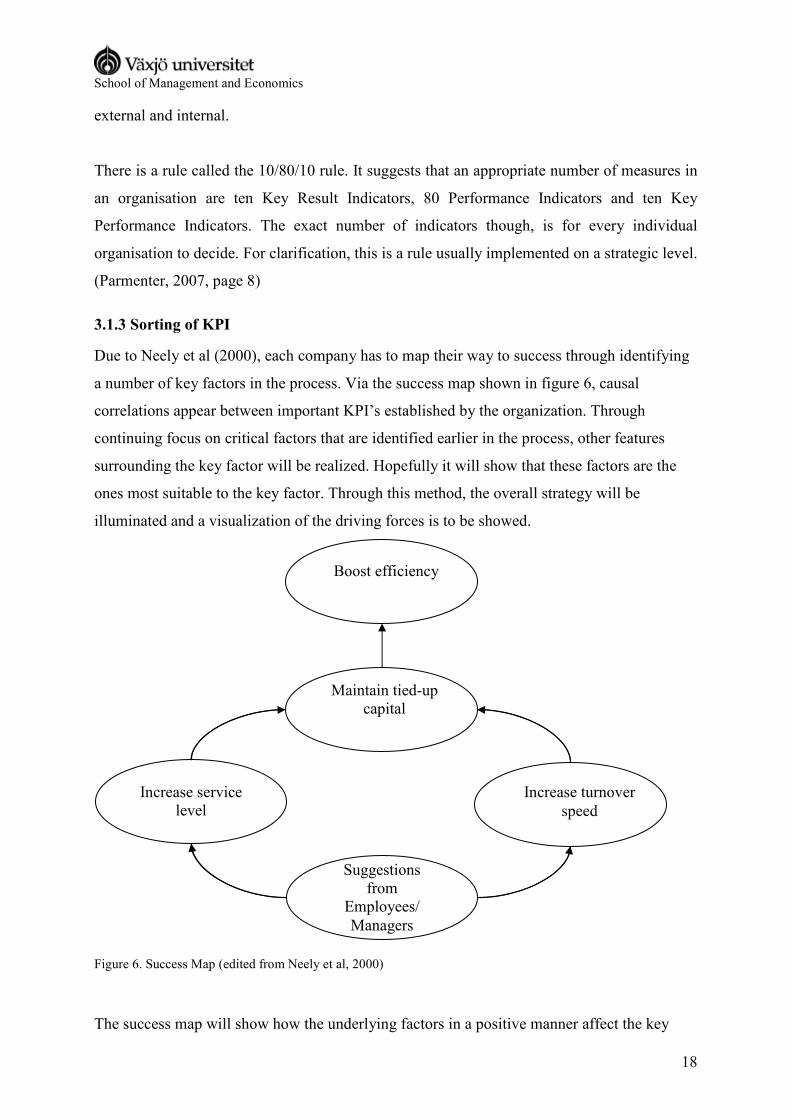
3.1.3 Sorting of KPI
Due to Neely et al (2000), each company has to map their way to success through identifying
a number of key factors in the process. Via the success map shown in figure 6, causal
correlations appear between important KPI’s established by the organization. Through
continuing focus on critical factors that are identified earlier in the process, other features
surrounding the key factor will be realized. Hopefully it will show that these factors are the
ones most suitable to the key factor. Through this method, the overall strategy will be
illuminated and a visualization of the driving forces is to be showed.
Figure 6. Success Map (edited from Neely et al, 2000)
The success map will show how the underlying factors in a positive manner affect the key
Suggestions from
Employees/ Managers
Increase service level
Increase turnover speed
Maintain tied-up capital
Boost efficiency

School of Management and Economics
19
factors. Due to Neely et al (2000) it will help the management to make significant decisions
and is also a tool to define KPI´s relevant for the strategy and goals for the department.
Different aspects need to taken into account before suggesting key factors. As Bourne et al
(2002) show, there can be incorrect behaviour due to some KPI´s. To be mentioned is that it is
not always what the management supposes to be the consequence, that turns out to be the
actual consequence. If there is a poor background control before implementing the KPI, it
could mean that unsolicited actions are being carried out. Bourne et al (2002) describes a case
at an airport where the managers wanted to speed up baggage handling after arrival. From the
beginning they measured the time for the first luggage to descend down the escalator from the
fuselage to the time when the first passenger picked up his or hers bag. The only problem was
that the ground crew picked their quickest man and let him run with the first and only bag to
throw it on the luggage belt. The consequence was that the first passenger received his
luggage quickly, but the other passengers where forced to wait.
To avoid misdemeanour, both Neely et al (1997) and Bourne et al (2000) advocate a Record
sheet for each KPI. To define and pattern every KPI, there is a greater possibility that the
indicator will correspond to the meaning. Bourne et al (2002) presents a design for a record
sheet as follows:
• Title
• Purpose
• Strategic goals in connection with the KPI
• Goals
• How to calculate
• Frequency of measuring
• Responsible for measuring
• Data source
• Responsible to react to diverges
• How to treat diverges
School of Management and Economics
20
3.1.4 Implementation of KPI
Parmenter (2007) means that there are four fundamental criteria that should be fulfilled before
an organization can say that they have implemented KPI´s into the operational activity. As
follows:
1. Collaboration between personnel, union, important suppliers and customers
2. Decentralization from management level to operational level
3. Integration between measurement, reporting and follow-up
4. Connection KPI´s �� Strategy
For the implementation, it stipulates full devotion, both from people within the organization,
such as personnel, managers and stock-holders and from stake-holders outside, like suppliers
and clients.
The involvement of personnel is one of the key factors to success. To achieve participation
from everyone involved requires full transferring of information. Treating employees as
equals engages them in the implementation and with education and follow-up they would feel
that there is no extra work for them reporting the KPI at a frequent basis. Parmenter especially
points out that the reporting should be time sensitive, efficient and focused on improving
decision-making. (Parmenter, 2007)
Both Parmenter (2007) and Neely et al (1997) emphasizes that the KPI should follow the
overall business strategy.
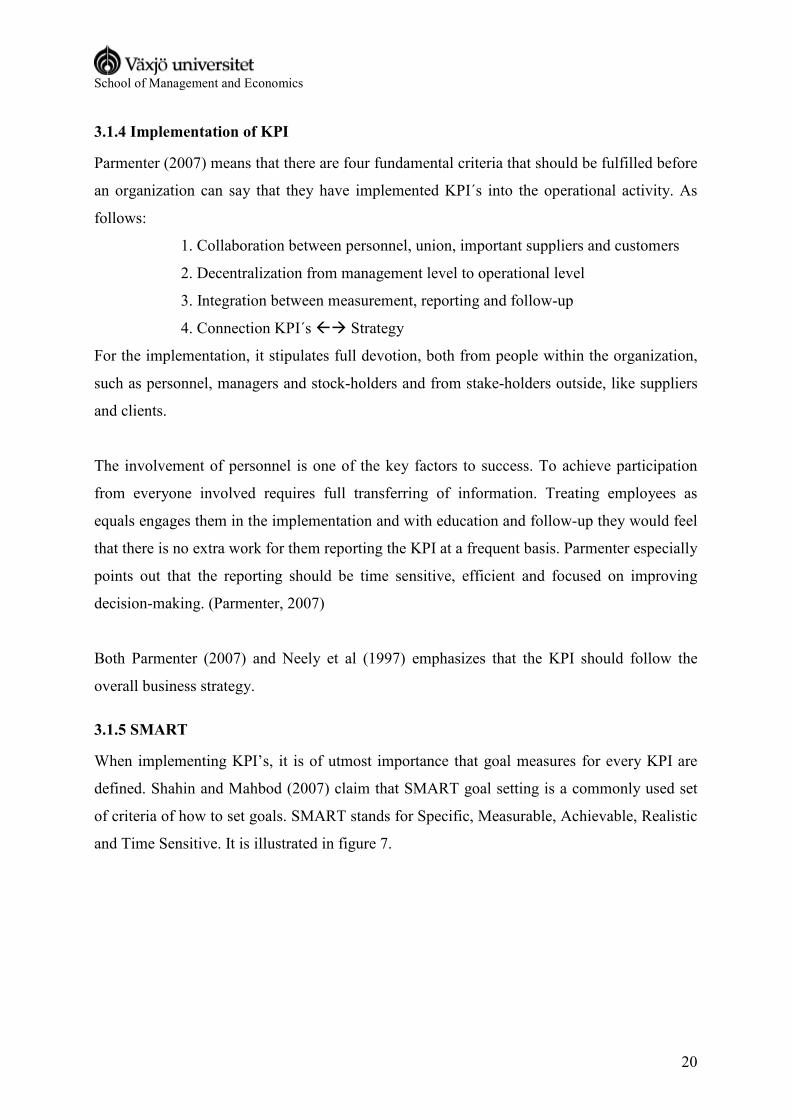
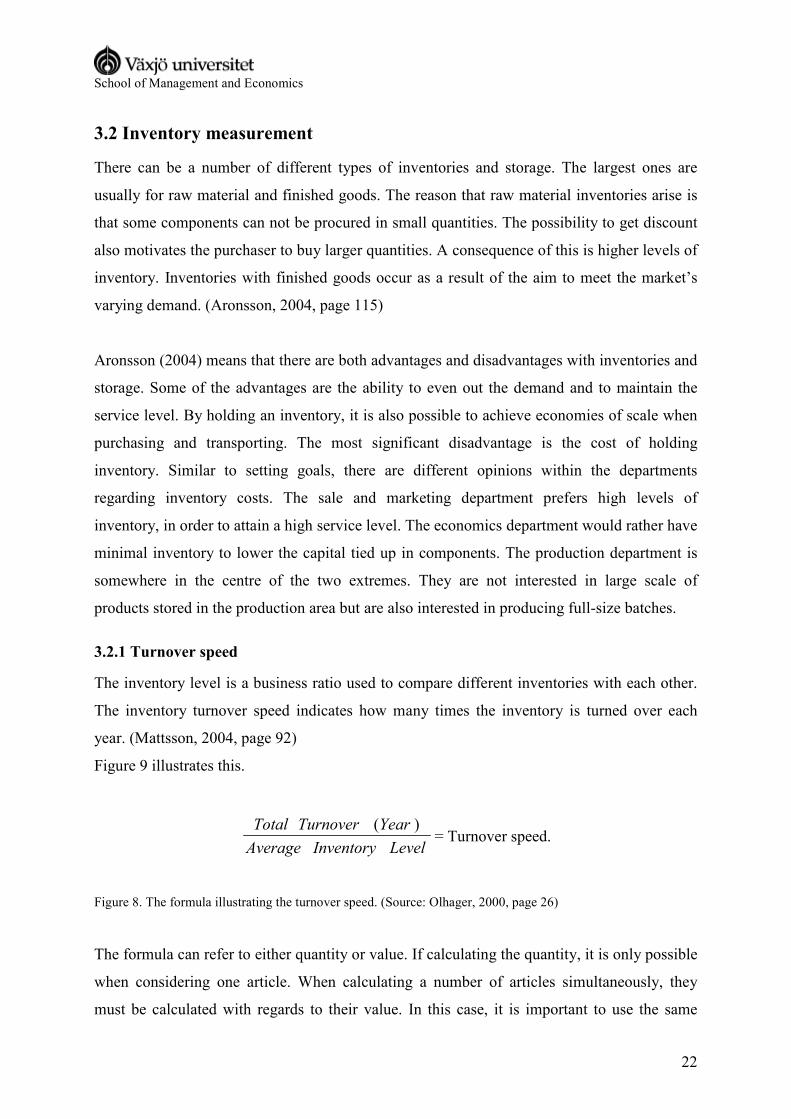
3.1.5 SMART
When implementing KPI’s, it is of utmost importance that goal measures for every KPI are
defined. Shahin and Mahbod (2007) claim that SMART goal setting is a commonly used set
of criteria of how to set goals. SMART stands for Specific, Measurable, Achievable, Realistic
and Time Sensitive. It is illustrated in figure 7.
School of Management and Economics
21
Figure 7. A figure illustrating SMART goal setting.
• Specific – Goals are to be as specific as possible. Wide or vague goals are not
desirable. When goals are specific, it is easier to tell when they are achieved, which
creates a possibility to accolade them.
• Measurable – The goal must be measurable, either qualitatively or quantitatively. It
should be placed in relation to the standard performance or expected performance.
• Achievable – It must be achievable, but should be formulated as a challenge and in
that way inspire members of the organisation to strive for goal achievement.
• Realistic – Developing the idea that a goal has to be achievable, it must also be
realistic and result oriented. I some cases, goals can be achievable but not realistic in
specific working environments.
• Time Sensitive – Every goal must have a specific time limit, when the goal has to be
achieved. The fact that the goal is time sensitive makes it easier to measure the
improvements on the way towards the goal. This also makes it possible to make a
schedule with strategies to reach the goal.
According to Max and Bacal (2004), the communication between the manager and the
employees is of high importance, when formulating the goal. The process for developing the
goal is often considered more important than the goal itself, as this process creates a sense that
the individual employee contributes to the success of the organisation.
SMART
Measureable
Achievable
Realistic
Time Sensitive Specific
School of Management and Economics
22
3.2 Inventory measurement
There can be a number of different types of inventories and storage. The largest ones are
usually for raw material and finished goods. The reason that raw material inventories arise is
that some components can not be procured in small quantities. The possibility to get discount
also motivates the purchaser to buy larger quantities. A consequence of this is higher levels of
inventory. Inventories with finished goods occur as a result of the aim to meet the market’s
varying demand. (Aronsson, 2004, page 115)
Aronsson (2004) means that there are both advantages and disadvantages with inventories and
storage. Some of the advantages are the ability to even out the demand and to maintain the
service level. By holding an inventory, it is also possible to achieve economies of scale when
purchasing and transporting. The most significant disadvantage is the cost of holding
inventory. Similar to setting goals, there are different opinions within the departments
regarding inventory costs. The sale and marketing department prefers high levels of
inventory, in order to attain a high service level. The economics department would rather have
minimal inventory to lower the capital tied up in components. The production department is
somewhere in the centre of the two extremes. They are not interested in large scale of
products stored in the production area but are also interested in producing full-size batches.
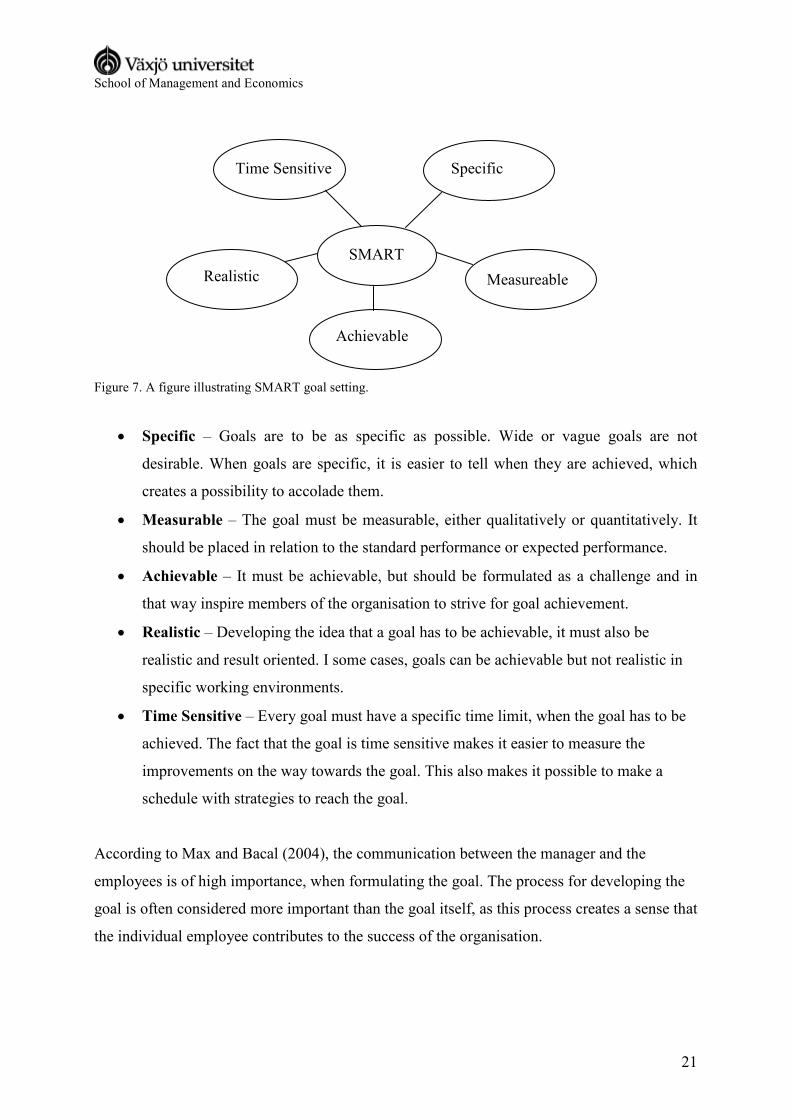
3.2.1 Turnover speed
The inventory level is a business ratio used to compare different inventories with each other.
The inventory turnover speed indicates how many times the inventory is turned over each
year. (Mattsson, 2004, page 92)
Figure 9 illustrates this.
LevelInventoryAverage
YearTurnoverTotal )(= Turnover speed.
Figure 8. The formula illustrating the turnover speed. (Source: Olhager, 2000, page 26)
The formula can refer to either quantity or value. If calculating the quantity, it is only possible
when considering one article. When calculating a number of articles simultaneously, they
must be calculated with regards to their value. In this case, it is important to use the same
School of Management and Economics
23
fundament in the numerator and denominator, for instance material value.
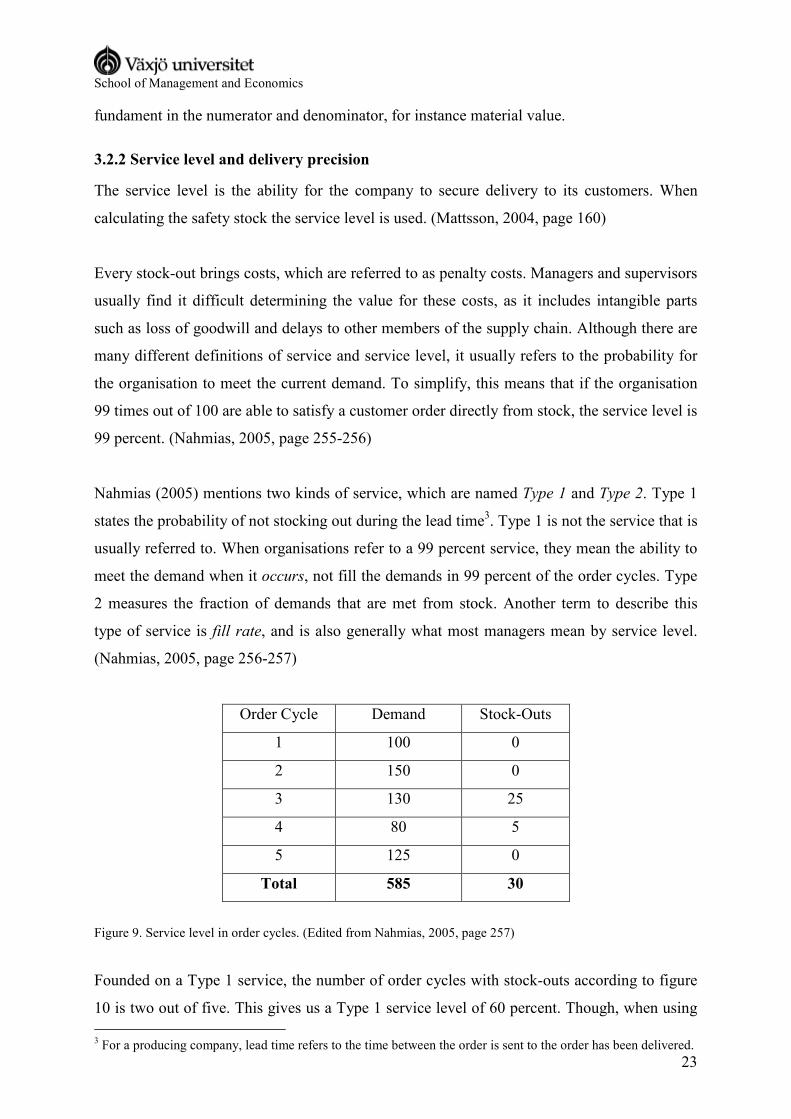
3.2.2 Service level and delivery precision
The service level is the ability for the company to secure delivery to its customers. When
calculating the safety stock the service level is used. (Mattsson, 2004, page 160)
Every stock-out brings costs, which are referred to as penalty costs. Managers and supervisors
usually find it difficult determining the value for these costs, as it includes intangible parts
such as loss of goodwill and delays to other members of the supply chain. Although there are
many different definitions of service and service level, it usually refers to the probability for
the organisation to meet the current demand. To simplify, this means that if the organisation
99 times out of 100 are able to satisfy a customer order directly from stock, the service level is
99 percent. (Nahmias, 2005, page 255-256)
Nahmias (2005) mentions two kinds of service, which are named Type 1 and Type 2. Type 1
states the probability of not stocking out during the lead time3. Type 1 is not the service that is
usually referred to. When organisations refer to a 99 percent service, they mean the ability to
meet the demand when it occurs, not fill the demands in 99 percent of the order cycles. Type
2 measures the fraction of demands that are met from stock. Another term to describe this
type of service is fill rate, and is also generally what most managers mean by service level.
(Nahmias, 2005, page 256-257)
Order Cycle Demand Stock-Outs
1 100 0
2 150 0
3 130 25
4 80 5
5 125 0
Total 585 30
Figure 9. Service level in order cycles. (Edited from Nahmias, 2005, page 257)
Founded on a Type 1 service, the number of order cycles with stock-outs according to figure
10 is two out of five. This gives us a Type 1 service level of 60 percent. Though, when using 3 For a producing company, lead time refers to the time between the order is sent to the order has been delivered.
School of Management and Economics
24
Type 2 service, the service level is approximately 95 percent. This is calculated by dividing
30 with 585, which gives a percentage of 5. Hence, the Type 2 service level is 95 percent.
As well as Nahmias, Anupindi distinguishes two types of service level. Anupindi (2006, page
170) mentions Cycle Service Level (CSL) and fill rate. In comparison CSL describes the same
as Type 1 service and Fill rate refers to Type 2 service.
Anupindi (2006) suggest that fill rate only can be used in business with knowledge about the
real demand. In retail sales for instance, the true demand is rarely observed because of stock
outs and therefore it is more appropriate to use CSL. In AA’s case, real demand can be
measured from the order stock, and in connection with Nahmias we identify Type 2 or Fill
rate as the most appropriate to AA.
Service level referring to fill rate as Nahmias and Anupindi describe it, can not be applied on
products that are made-to-order. Due to the fact that the products in this study are mainly
made-to-order, except for only a few components, Oskarsson et al (2003, page 41) suggest
another term more appropriate in this context; service level referring to on-time deliveries and
delivery precision.
Both terms concern the same aspects in customer service, the ability to deliver on time. One
of the terms from the perspective of products held in inventory, and the other from being
made-to-order. From now on, when mentioning service level, it refers to the ability to deliver
on time.
3.2.3 Tied up capital
Material store in repositories, WIP4 or inventories for finished goods ties capital. The cost for
the tied up capital is primarily related to the cost of capital, which refers to the purchase
financing. There are also costs for inventory space, handling equipment, insurance and waste.
Through the refining process, the tied up capital increases as a number of resources are used,
and the use of these are all costly. Hence, the product ties an increasing level of capital. The
product value and the capital the product ties up peaks when it reaches the stage of an end
product. (Olhager, 2000, page 24)
4 Work In Progress

School of Management and Economics
25
Generally, business try to minimize their level of tied up capital, as the cost is usually rather
high. The reason for the high cost is that the investor loses the ability to invest the capital
elsewhere, which is often referred to as trade off cost. (Yard, 2001, page 127) An
unnecessarily high level of tied up capital usually indicates that other forms of waste also
occur. A high inventory level means a waste of both inventory space and capital. Tying
capital can also be compared to speculation, as the revenue is not yet real. Olhager (2000)
describes the tied up capital as proportional to the amount of capital and also to the time the
capital has been tied up. Figure 8 illustrates how capital is tied up during the throughput cycle.
Figure 10. Tied up capital (Nyhuis P, 2007)
3.2.4 Inventory Level
As Mattsson (2003) implies, inventory is not a handling variable but rather a consequence of
how effective the supply chain flow and production planning is. He also indicates that the
operational materials control affects the efficiency.
In order to be able to decrease tied up capital, companies need to make their inventory
decisions based on figures calculated on true costs for holding inventory. Mattsson (2003)
calls this inventory factors. He states three different means for establishing these factors. The
first method is to benchmark with other actors in the same industry. The second way is to
collect the information through articles or relevant literature. Neither of these alternatives is to
suggest. The first way is not preferable due to the fact that there can be great differences for
inventory costs between two corporations even in the same local industry. The second
suggestion is also to neglect, when it comes to the inventory factor as a policy variable. A
policy variable means that the organisation inspect the problem with blinkers, refusing to

School of Management and Economics
26
calculate its own factors based on true values. If the company accepts the inventory factor as a
policy variable, this means that they will admit higher overall costs in order to lower capital
tied up. The third factor appears when companies analyse their true costs for keeping
inventory. Insurance, stock-taking, handling and register costs are examples of these. This
way is seldom used to calculate inventory factors. Despite this, this is the one that ought to be
the most frequently used method, as it is the one giving the fairest picture. There are no
specific standards for the inventory cost levels, but according to the author they vary between
five and 50 percent (Mattsson, 2003).
School of Management and Economics
27
3.2.5 The Pareto principle
The Pareto principle was formulated by the Swiss economist Vilfredo Pareto (Mattsson, 2004,
page 128). It is often referred to as the 80-20 rule or “the law of the vital few and the useful
many”. It attempts to explain the tendency that approximately 20 percent of the cause
represents about 80 percent of the result or the effect. (Jonsson et al, 2005, page 124-125).
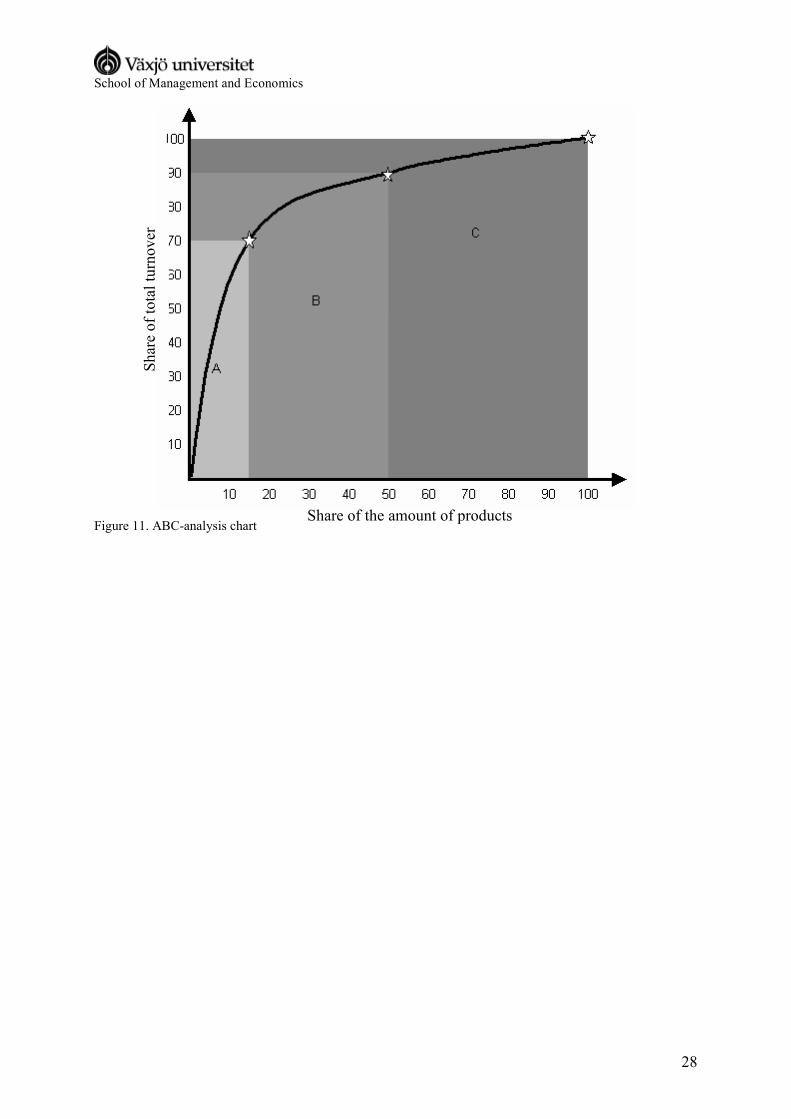
3.2.6 ABC analysis
According to Coughlan et al (2006, page 17-18), the ABC analysis is one of the most
fundamental aspects when it comes to being able to segmenting the market or products. This
is done by dividing the end customer or the products in different groups, usually according to
the Pareto Rule. The 20 percent representing 80 percent of the turnover or income is most
commonly referred to as group A. This group is important to the company, and has benefits in
terms of higher service level, or when it comes to the most important products, a higher
inventory level. The groups are usually divided so that the preferences are very similar within
the groups, but very different between them.
To differentiate the customer service and the priority rule of products and customers, a
possible way is to place them in different groups, with an ABC-analysis. The product, product
group or customer that stands for the highest share of the turnover or the revenue has a higher
priority. The groups are usually named A, B and C groups, and A is the group that stands for
the highest share of the total revenue or turnover. This group should be given the highest
priority regarding safety stock, production priority and similar. (Jonsson P & Mattsson S-A,
2005, page 125)
School of Management and Economics
28
Figure 11. ABC-analysis chart
Share of total turnover
Share of the amount of products
School of Management and Economics
29
3.3 Summary of theories
Based on the theories presented previously, the empirical contains data and information
relevant to the proceeding work. The variables of significant importance are service level, in
terms of Type 2, turnover speed, including tied up capital, KPI:s and goal setting through
SMART. Other variables that have been presented in the theories chapter, give a deeper
understanding of the collection of empirical data and further analysis.
3.3.1 Variables
Service Level: The type 2 service refers to the ability to meet demands as they occur. It is
often called fill rate and is the most commonly accepted definition.
Turnover Speed: The turnover speed is the ratio between turnover and inventory. The value
introduced is a so called snapshot value and can vary between different financial periods. It is
an indicator of how efficient the inventory is managed. The turnover speed is closely
connected to tied up capital, as the level of tied up capital is determined by the rate of the
turnover speed.
KPI: KPI´s are indicators showing what needs to be done in an internal operating perspective.
They focus on the parts of an organisation’s performance that are most critical to success,
both present and future.
SMART: It is a commonly used set of criteria of how to set goals. SMART stands for
Specific, Measurable, Achievable, Realistic and Time Sensitive.
School of Management and Economics
30
4. Empirical
Our empirical study contains information and data regarding inventory value, turnover
speed, definition of turnover speed and the service level. It also handles KPI’s, goal setting
and contradictory goals. All information and data presented in this chapter, has been given to
us by managers and employees at AA.
4.1 Performance Measurement
Today, AA does not measure their performance in terms of KPI’s or goals. They have made
analyses on their inventory, which in a sense is performance measurement. There have never
been specific goals formulated though, that could have resulted in KPI’s or similar. They have
expressed an ambition to create a foundation for implementing KPI´s. AA, according to
Logistics Manager, wish to attain balance for service level and tied up capital.
4.1.1 KPI
Basically all necessary data to calculate KPI’s are available in the ERP system. The reason
why the KPI’s have not been formulated is due to lack of time and resources. Numbers and
statistics that are not available is for instance the percentage of fulfilled orders. This is
because the ERP system automatically reschedules the delivery dates as the production, and
accordingly also the deliveries, is delayed. Consequently, SAP5 reports the service level as
100 percent.
When presenting the three options, KPI, KRI and PI and explained the differences, AA
instantly agreed on KPI as the most relevant indicator to them. As opposed to the financial
measures of KRI and the complementary measures for PI, the assignment presented to us
corresponded more adequately to the KPI criteria. AA is in need of explicit and clearly
defined goals to work for, not necessarily financial.
4.1.2 SMART
The logistics department has a goal of becoming the natural and prioritized supplier of
components and spare parts, which implies that a high service level is necessary. According to
logistics manager, it requires strategic decisions in order to achieve this objective, which now
have been presented by CEO6 Sweden in the recently released vision “Blue Sky 2011”. The
5 ERP system used by AA. 6 Chief Executive Officer
School of Management and Economics
31
name refers to a blue sky in terms of overcome problems, which is to be achieved by 2011.
The vision includes all three types of KPI’s; Business volume, on-time deliveries, hit rate7 and
cash. The strife is to fulfil the delivery undertakings, and in this way become superior in
serving the customers. The focus still lies on the internal
customers.mmmmmmmmmmmmmmmmm
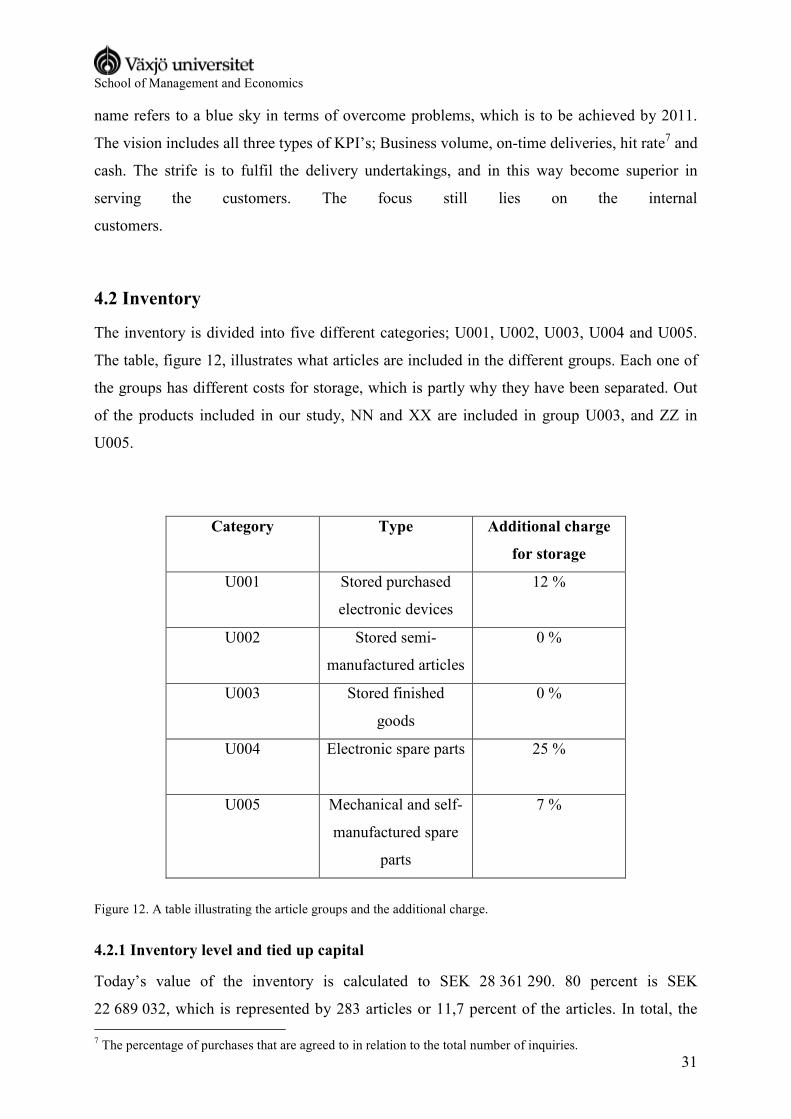
4.2 Inventory
The inventory is divided into five different categories; U001, U002, U003, U004 and U005.
The table, figure 12, illustrates what articles are included in the different groups. Each one of
the groups has different costs for storage, which is partly why they have been separated. Out
of the products included in our study, NN and XX are included in group U003, and ZZ in
U005.
Category Type Additional charge
for storage
U001 Stored purchased
electronic devices
12 %
U002
Stored semi-
manufactured articles
0 %
U003 Stored finished
goods
0 %
U004
Electronic spare parts 25 %
U005 Mechanical and self-
manufactured spare
parts
7 %
Figure 12. A table illustrating the article groups and the additional charge.
4.2.1 Inventory level and tied up capital
Today’s value of the inventory is calculated to SEK 28 361 290. 80 percent is SEK
22 689 032, which is represented by 283 articles or 11,7 percent of the articles. In total, the 7 The percentage of purchases that are agreed to in relation to the total number of inquiries.
School of Management and Economics
32
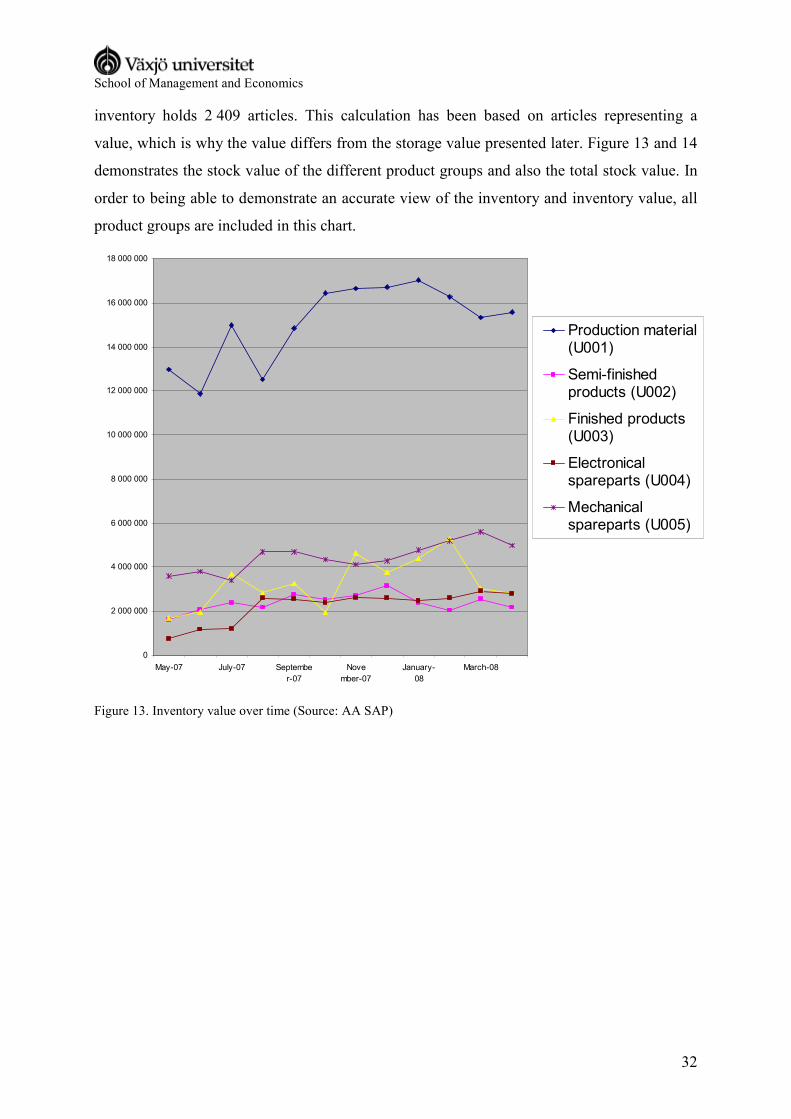
inventory holds 2 409 articles. This calculation has been based on articles representing a
value, which is why the value differs from the storage value presented later. Figure 13 and 14
demonstrates the stock value of the different product groups and also the total stock value. In
order to being able to demonstrate an accurate view of the inventory and inventory value, all
product groups are included in this chart.
0
2 000 000
4 000 000
6 000 000
8 000 000
10 000 000
12 000 000
14 000 000
16 000 000
18 000 000
May-07 July-07 Septembe
r-07
Nove
mber-07
January-
08
March-08
Production material(U001)
Semi-finishedproducts (U002)
Finished products(U003)
Electronicalspareparts (U004)
Mechanicalspareparts (U005)
Figure 13. Inventory value over time (Source: AA SAP)

School of Management and Economics
33
Total Stock value
20 646 299 20 885 577
25 717 99424 854 515
28 126 59327 662 172
30 779 576 30 558 78231 090 941 31 394 208
29 416 885
28 361 289
0
5 000 000
10 000 000
15 000 000
20 000 000
25 000 000
30 000 000
35 000 000
May-07 June-07 July-07 August-07 Sept
ember-07
October-
07
November-
07
December-
07
January-
08
February-
08
March-08 April-08
SEK
Total Stock Value
Figure 14. Total level of tied up capital from May 2007 to April 2008 (Source: AA SAP)
The trend of the inventory value has been increasing the last year. One reason for this is a
large purchase of significant electronic components.
Based on the BOM8 for the product XX the estimated stock value, or tied up capital, is SEK
4 312 235. This is the sum of the value of all 161 articles that are included in the final
product. The component of least value is worth SEK 13, and the most valuable one is SEK
281 235.
The BOM for NN amounts to SEK 3 673 638, which is a sum of the value for all of the
ingoing components. The BOM contains approximately 150 articles, which are a part of the
final product. The average inventory for NN is 121 835 pieces, including all components from
cables and bundle bands to control units and filters. NN and XX together represent one third
of the inventory value.
8 Bill of Materials
School of Management and Economics
34
ZZ 105 has an inventory value of SEK 144 603, and the average inventory holds
approximately 300 components. ZZ 135 is valuated to SEK 353 763 and average inventory is
calculated 585 pieces.
The calculation for the two ZZ differs from the ones performed on XX and NN as there is no
BOM available for ZZ 105 and 135. Instead we have used the average of all versions of ZZ.
4.2.2 Turnover speed
The definition for turnover speed used by AA is “the annual inventory turnover of the total
stock (sum of valuated stock and consignment stock) is calculated by dividing the total
consumption by the average total stock over one year.” (Source: AA SAP)
Figure 15 illustrates the formula used:
Beginning stock + n stock at month’s end _________________________________
n + 1
Figure 15. Formula illustrating the calculation of turnover speed.
Based on the list of the forecast for XX, the weighted average stock turnover is 0,859 per year.
The BOM for this specific product includes 161 different components, where some of the
components have a BOM of their own. The lowest turnover speed for a single component is 0
times a year, whereas the highest rate is 6,08 times. One thing that distinguishes XX, is the
fact that the product is at a stage called Limited Sales. Limited Sales refers to the phase before
it is released on the market, and the product is sold to customers to be assessed. The sales
level has to reach 50 before releasing the full sale.
The product NN exists in 24 different versions. The version that is most frequently sold had a
stock turn of 2,24 during the period 2007-05 through 2008-04. This version of NN consists of
144 components, where some of the components have separate ingoing parts. NN is a product
that has been available in Full Sales for a number of years.
9 Based on the last day of the month during the period 2007-05 to 2008-04.

School of Management and Economics
35
The product ZZ is divided into two sizes, 105 and 135. ZZ 135, the larger one, had a turnover
speed of 6,07 times last year10 and ZZ 105 had a stock turn at 10,32 times the same period. ZZ
has been produced and sold for approximately 20 years, and together the number that is sold
is approximately 15 000 pieces each year.
4.2.3 Service Level
The table illustrated below, figure 16, reviews the past year by a customer abroad regarding
the service received from AA. As can be understood from the table, to achieve the green level,
the customer requires a minimum of 90 percent of the purchase orders delivered on time. The
service level regarding quality is 100 percent, which is also accurate for the service level for
cost. The level for delivery for product NN (on time) is 66 percent, thus 42 orders out of total
65. The weighted average of the three variables is 89 percent, which, from the customer
perspective, is the experienced service level.
Figure 16. Service level from the customer point of view. (Source: Logistics Manager.)
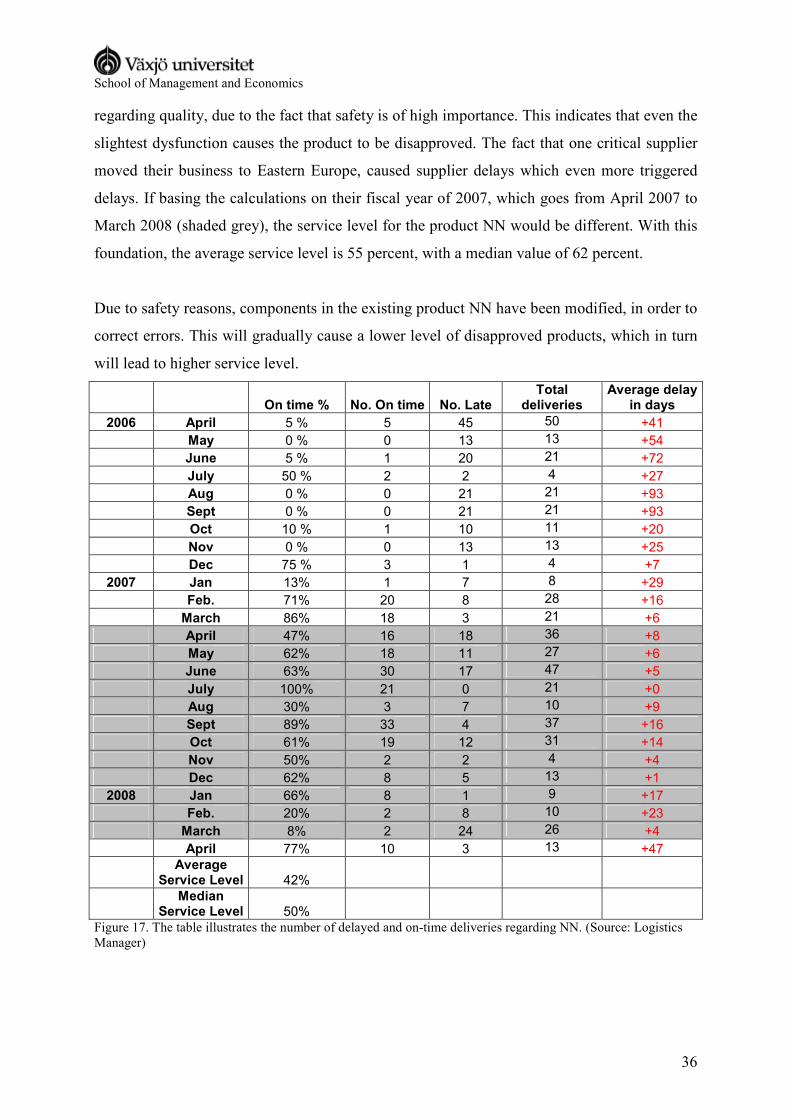
Figure 17 and 18 refer to actual on-time deliveries, as recorded by AA. This data regards NN,
one of the most important products. The calculated average, including all data from April
2006 to April 2008, amounts to 42 percent of the orders delivered on time, whereas the
median value is 50 percent. The service level calculated is Type 2. In accordance to “Blue
Sky 2011”, the vision for on-time deliveries is to reach a level of 98 percent.
For the duration of a couple of months 2006, no production was performed, due to quality
problems. This caused major delays to several customers. Even today, there are problems
10 Based on the period 2007-05 through 2008-04
School of Management and Economics
36
regarding quality, due to the fact that safety is of high importance. This indicates that even the
slightest dysfunction causes the product to be disapproved. The fact that one critical supplier
moved their business to Eastern Europe, caused supplier delays which even more triggered
delays. If basing the calculations on their fiscal year of 2007, which goes from April 2007 to
March 2008 (shaded grey), the service level for the product NN would be different. With this
foundation, the average service level is 55 percent, with a median value of 62 percent.
Due to safety reasons, components in the existing product NN have been modified, in order to
correct errors. This will gradually cause a lower level of disapproved products, which in turn
will lead to higher service level.
On time % No. On time No. Late Total
deliveries Average delay
in days
2006 April 5 % 5 45 50 +41
May 0 % 0 13 13 +54
June 5 % 1 20 21 +72
July 50 % 2 2 4 +27
Aug 0 % 0 21 21 +93
Sept 0 % 0 21 21 +93
Oct 10 % 1 10 11 +20
Nov 0 % 0 13 13 +25
Dec 75 % 3 1 4 +7
2007 Jan 13% 1 7 8 +29
Feb. 71% 20 8 28 +16
March 86% 18 3 21 +6
April 47% 16 18 36 +8
May 62% 18 11 27 +6
June 63% 30 17 47 +5
July 100% 21 0 21 +0
Aug 30% 3 7 10 +9
Sept 89% 33 4 37 +16
Oct 61% 19 12 31 +14
Nov 50% 2 2 4 +4
Dec 62% 8 5 13 +1
2008 Jan 66% 8 1 9 +17
Feb. 20% 2 8 10 +23
March 8% 2 24 26 +4
April 77% 10 3 13 +47
Average
Service Level 42%
Median
Service Level 50%
Figure 17. The table illustrates the number of delayed and on-time deliveries regarding NN. (Source: Logistics Manager)
School of Management and Economics
37
SIR delivery
+6+5
+0
+9
+16
+14
+4
+1
+17
+23
+4
+47
0
5
10
15
20
25
30
35
40
45
50
may June July Aug Sept Oct Nov Dec Jan Feb March April
No. of SIR
+0
+5
+10
+15
+20
+25
+30
+35
+40
+45
+50
Average delay (days)
SIR´s not delivered on time
SIR´s delivered on time
Average delay in days
62%Delivery
accuracy63 % 8 %20 %66 %62 %50 %61 %89 %30 %100 % 77 %
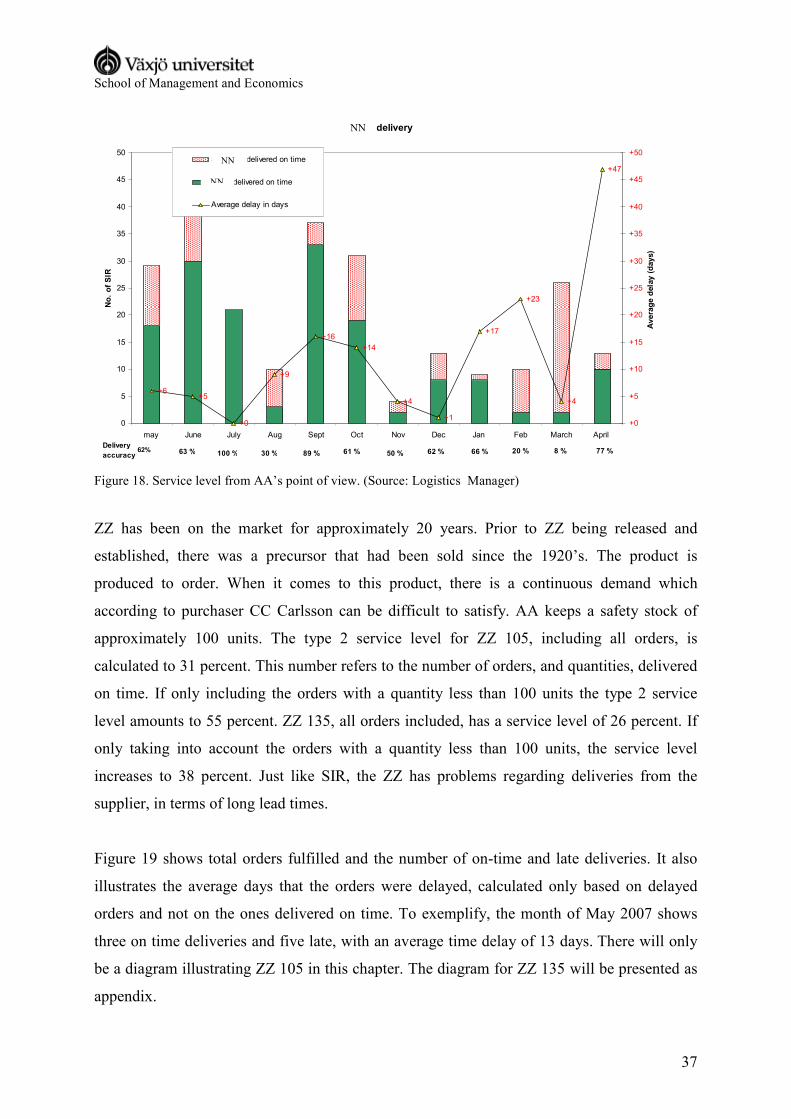
Figure 18. Service level from AA’s point of view. (Source: Logistics Manager)
ZZ has been on the market for approximately 20 years. Prior to ZZ being released and
established, there was a precursor that had been sold since the 1920’s. The product is
produced to order. When it comes to this product, there is a continuous demand which
according to purchaser CC Carlsson can be difficult to satisfy. AA keeps a safety stock of
approximately 100 units. The type 2 service level for ZZ 105, including all orders, is
calculated to 31 percent. This number refers to the number of orders, and quantities, delivered
on time. If only including the orders with a quantity less than 100 units the type 2 service
level amounts to 55 percent. ZZ 135, all orders included, has a service level of 26 percent. If
only taking into account the orders with a quantity less than 100 units, the service level
increases to 38 percent. Just like SIR, the ZZ has problems regarding deliveries from the
supplier, in terms of long lead times.
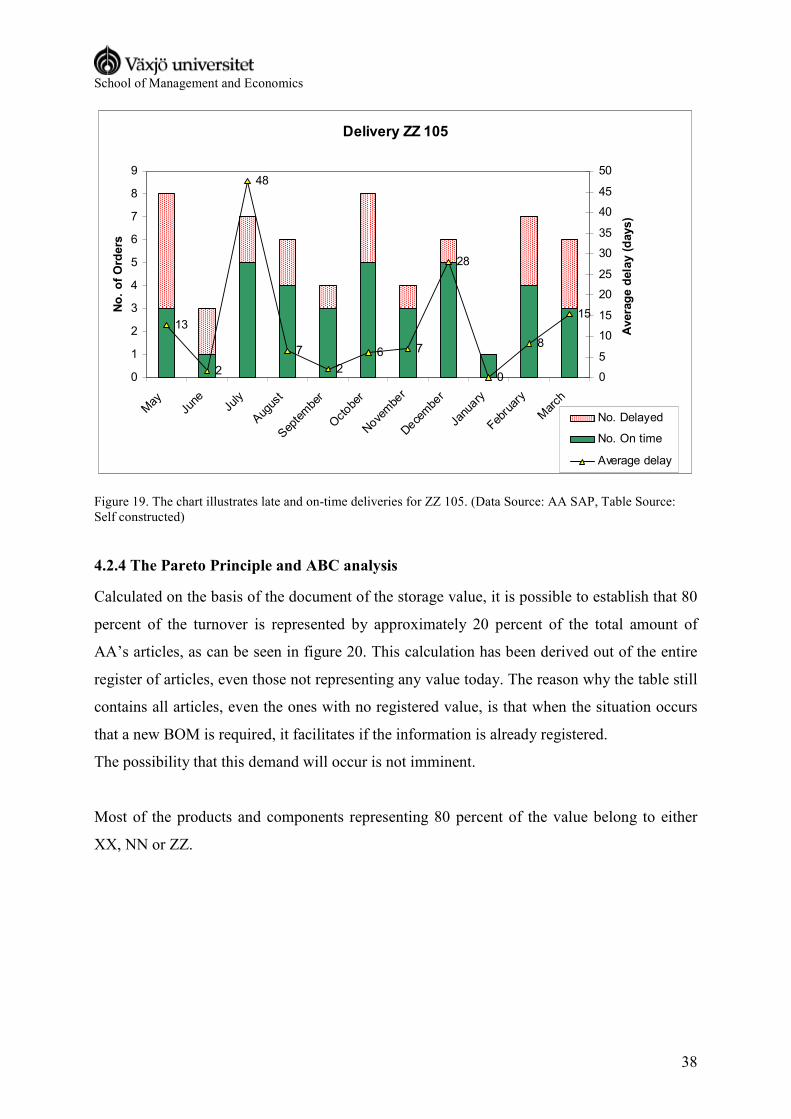
Figure 19 shows total orders fulfilled and the number of on-time and late deliveries. It also
illustrates the average days that the orders were delayed, calculated only based on delayed
orders and not on the ones delivered on time. To exemplify, the month of May 2007 shows
three on time deliveries and five late, with an average time delay of 13 days. There will only
be a diagram illustrating ZZ 105 in this chapter. The diagram for ZZ 135 will be presented as
appendix.
NN
NN
NN
School of Management and Economics
38
Delivery ZZ 105
13
2
48
7
2
6 7
28
0
8
15
0
1
2
3
4
5
6
7
8
9
May
June
July
Aug
ust
Sep
tembe
r
Octob
er
Nov
embe
r
Dec
embe
r
Janu
ary
Februa
ry
March
No. of Orders
0
5
10
15
20
25
30
35
40
45
50
Average delay (days)
No. Delayed
No. On time
Average delay
Figure 19. The chart illustrates late and on-time deliveries for ZZ 105. (Data Source: AA SAP, Table Source: Self constructed)
4.2.4 The Pareto Principle and ABC analysis
Calculated on the basis of the document of the storage value, it is possible to establish that 80
percent of the turnover is represented by approximately 20 percent of the total amount of
AA’s articles, as can be seen in figure 20. This calculation has been derived out of the entire
register of articles, even those not representing any value today. The reason why the table still
contains all articles, even the ones with no registered value, is that when the situation occurs
that a new BOM is required, it facilitates if the information is already registered.
The possibility that this demand will occur is not imminent.
Most of the products and components representing 80 percent of the value belong to either
XX, NN or ZZ.
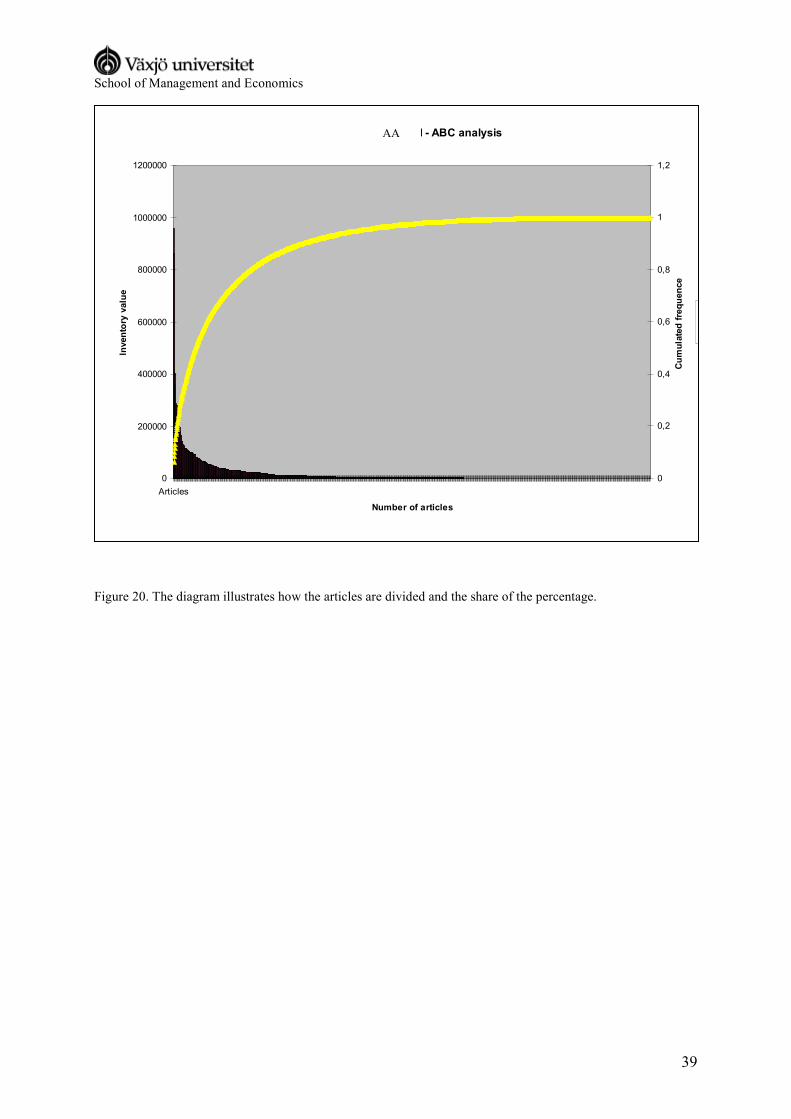
School of Management and Economics
39
Figure 20. The diagram illustrates how the articles are divided and the share of the percentage.
ALSTOM - ABC analysis
0
200000
400000
600000
800000
1000000
1200000
Articles
Number of articles
Inventory value
0
0,2
0,4
0,6
0,8
1
1,2
Cumulated frequence
AA
School of Management and Economics
40
5. Analysis
This chapter presents the analyses conducted from the theories and empirical. The chapter
deals with variables such as KPI in terms of measuring, sorting and implementing. It also
considers the aspects of goal setting in terms of SMART, service level and turnover speed.
5.1 Performance Measurement
5.1.1 Why measuring performance
In order to fulfil the engagement towards their customers and local sale offices, according to
Anupindi, AA needs specific goals and specific tools to follow up the KPI´s. A disadvantage
with a lack of measures is that it could cause AA a decreased level of turnover and a possible
loss of pace in the supply flow. Anupindi as well as Parmenter enlighten the importance of
measuring KPI´s. Both authors are in agreement that it will lead to increased control of the
overall performance of departments and companies. Like most companies, AA wishes to
reach balance between tied up capital and service level. This is indeed easier said than done.
According to what Logistics Manager believes, it is possible to increase the service level but
keeping the tied up capital on the same level. Presumably, the management will have to
prioritize between the two, and most likely the focus will be on increasing the service level.
5.1.2 KPI
In this case, the problem lies in the fact that basically all information needed to determine
KPI’s is available in SAP, but there has not been enough time or resources to analyse and
evaluate them. Because of this, it has not been possible to set or achieve goals that could be
significant to the department. The fact that delivery dates are rescheduled as production dates
change complicates the analysing and evaluation of these measures. It also provides with an
incorrect perception of the service level.
When presenting the theories of the three different indicators KPI, KRI and PI, AA
considered KPI as the option of highest relevance to them. Due to the fact that KPI is not a
financial indicator, such as increasing the solidity, it corresponds well to the nature of goals
that AA wish to formulate. The goals do not necessarily have to be financial, as the important
aspect to consider is increasing the efficiency in an internal point of view. This is consistent
with the theories regarding KPI´s according to Parmenter.
School of Management and Economics
41
5.1.3 SMART
The goal of becoming the prime supplier of components and spare parts is difficult to
measure. In order to discern whether the goal is achieved or not, the company initially has to
decide the desired percentage of the total orders of all customers, including both spare parts
and components. If this is not determined, it is impossible to tell when and if the goal is
accomplished.
The following is an evaluation of SMART pattern for the KPI Turnover speed:
• Specific
As the theories imply, it is important for a goal to be specific. Ingoing elements must be
mentioned in order to delimitate from unnecessary aspects. Features such as time period, unit
of measurement, desired level et cetera must be considered and formulated. This is important
in order to be able to determine whether the goal is reached or not. The goal of fulfilling the
delivery undertakings is somewhat specific; although, it can be narrowed down by expressing
certain levels that AA wishes to reach.
• Measurable
It is of extreme importance that the goals expressed are translated into specific numbers. The
goal should be able to be compared at different times. AA’s goal of being the superior
supplier of components and spare parts should be considered difficult to measure. It would
smooth the progress of measuring by formulating goals in terms of desired market share.
• Achievable
Generally, the direction for the organisation seems to be reasonable and it will always be a
target as an organisation always can become better. They will never be the sole supplier of
components and spare parts, even though it is possible to attain a continuously growing share.
The reason it is not possible to be the sole supplier is due to the continuously emerging new
customers and suppliers. The goal to fulfil deliveries though, should not be considered
impossible.
• Realistic
This aspect is very similar to achievable. The difference lies in the fact that it is theoretically
achievable to eliminate the inventory, but in reality an inventory is necessary in order to meet
changes in demand. Becoming the prime supplier is indeed realistic. It is essential though, for
strategic decisions to be made in order to point out a direction.
School of Management and Economics
42
• Time Sensitive
According to the theories, a goal must be delimited in terms of time. Due to the goal “Blue
Sky 2011” which is to be implemented by the end of 2011, it is necessary to formulate the
goals in stages. Each stage should bring the organization one step closer to the goal. In order
to reach the overall goal, it is suitable to divide the goal into part goals. Therefore, a goal for
turnover speed should be split into a yearly basis and reached one at a time.
Based on the ideas of Shahin & Mahbod (2007), claiming the importance of SMART goals,
and Parmenter (2007) and Neely (1997), emphasizing that goals should be in correspondence
to the business strategy, we have designed record sheets for KPI´s. Below is a record sheet for
the product XX regarding turnover speed. The record sheets for the remaining products and
KPI´s are attached in Appendix 2.
Record sheet for XX
Title Turnover speed
Purpose
To measure the logistic efficiency of the inventory in order to secure FIFO and a low level of
retired material.
Att mäta den logistiska effektiviteten på lagret, samt att säkerställa FIFU och en låg nivå av
inkurans.
Strategic goals in connection with the KPI
To achieve a higher level of turnover speed for XX, in order to lower the tied up capital and
create a quicker flow through the Logistics chain.
Att höja omsättningshastigheten för XX, för att sänka kapitalbindningen och skapa ett
snabbare flöde genom försörjningskedjan.
Goals
o After release: Key components should reach at least the same level as NN,
namely 2,24 times/year
o Efter full försäljning: Huvudkomponenterna skall minst nå upp till NN:s nivå,
2,24 gånger/år
School of Management and Economics
43
How to calculate
Log on to SAP� Stock�MC.9 LIS Stock Analysis� Plant: P700, Warehouse: L700 �
Material: P-XX-X-X-X � Choose key figures (F6)� annual ttl. stock turn � Read on the
“Total Line” under TtlStkTurn, Year
Logga in i SAP� Stock� Välj MC.9 LIS Stock Analysis � Skriv P700 under Plant och
L700 under Warehouse � Materialnummer: P-XX-X-X-X � Välj Key figures (F6) �
Klicka i Annual Ttl stockturn � Läs av på totallinjen för Ttl Stockturn, Year.
Frequency of measuring
Should be measured once a month
Bör kontrolleras en gång per månad
Responsible for measuring
Logistics Manager
Data source
AA SAP
Responsible to react to diverges
Logistics Manager
Logistikchef
How to treat diverges
Discuss with every involved team member, evaluate and compose concrete proposals to
regain control over the KPI. Evaluate with shorter periods the following three months.
Diskutera med avdelningsansvariga som berörs, utvärdera och författa konkreta förslag till
vad som bör göras för att återfå kontrollen over nyckeltalet. Utvärdera med kortare
tidsintervall följande tre månader.
School of Management and Economics
44
The following is an evaluation of a SMART pattern for the KPI Service level:
• Specific
The goal of increasing the service level to 98 percent is to be considered a specific aim.
Comparing with the level of today, which is approximately 50 percent for product NN, it
requires for every department to contribute. In accordance to the theories, goals ought to be
narrow and specific, due to the fact that it facilitates the evaluation and follow-up. This way, it
is possible to know when the service level of 98 percent is reached.
• Measurable
In connection with the SMART theory, this one is the most uncomplicated KPI in terms of
measuring concrete values. The management has a strategic goal pointing at a certain level
which is specifically expressed and easily understood. The probability of employees
misunderstanding the goals is low.
• Achievable
“Blue Sky 2011” strives towards reaching a service level of 98 percent. From the aspect of the
goal being achievable, this is a challenging part. When it comes to this, the road to success
goes through dividing the goal into stages. This refers to setting goals at for example one-year
intervals.
• Realistic
In terms of the goal being realistic, a service level of 98 percent certainly appears to be a
realistic and sound strife. If achieving this level, the organisation will be permeated by the
ambition of continually improving the logistic flow. A causal effect of reaching this goal is
that they automatically will fulfil their delivery undertakings.
• Time Sensitive
The theories describe the importance of having time delimitations when setting goals. Based
on the empirical statement “Blue Sky 2011”, this gives a clear time frame regarding working
for and achieving the goal for service level.

School of Management and Economics
45
5.2 Inventory
5.2.1 Inventory Level and Tied up Capital
By reason of the internal trading, and that the department covers their costs with additional
charges, the numbers presented in figure 12 illustrate the levels of the additional charges in
the different product groups. In connection with the theories presented in 3.2.1 Inventory
Level, claiming that the charges usually are between five and 45 percent, we can conclude
that these levels are fairly low. The reason for this is that the department do not strive for
profit, but only just to cover the costs caused by holding inventory. Product groups U002 and
U003 are not charged additionally, as they have already been included in previous steps of the
production flow.
As can be seen in figure 14, conducted by figure 13, the inventory level and accordingly also
the level of tied up capital, has had an increasing trend the last year. The most significant
reason for this is a large amount of electronic components purchased in order to secure future
production for the subsequent periods. Considering the fact that the component is critical for
production, it was crucial to make this purchase.
5.2.2 Turnover speed
XX is a new product, not yet fully released. Due to this, the turnover speed for this product is
at a significantly lower level comparing to other products. In spite of this, it is important to
analyse and present KPI’s when considering future storage of components for this product.
NN has been on the market for many years, and therefore also has a higher turnover speed.
A potential goal though might be the attempt to reach the same turnover speed for XX as NN
has today. As XX is still a new product, it has not yet reached a level where the two products
can be compared in a way that gives a fair picture. XX, at this point, does not have the same,
or even a comparable share of the total sales.
Regarding ZZ 105 and 135, their turnover speed is 10,32 and 6,07. The numbers have been
calculated based on the material value. These values are satisfactory considering the volume
at a total of 15 000 units sold each year. At this point, increasing these values should not be
prioritized, but rather to maintain the present turnover speed.
School of Management and Economics
46
5.2.3 Service Level
The fact that the ERP system continuously adjusts the delivery dates according to changes in
production pace, presents a misleading view of the service level and on-time deliveries to the
customers. This impedes determining and analysing that particular aspect. It decreases the
ability to develop and improve the system, as it is not possible to perform accurate
measurements. The only way of assessing the service level is by gathering three factors; data
from the ERP system, customers’ view and manually altered data. A collected analyse of
these ought to provide the best foundation for evaluating this KPI.
The products relevant in our study, XX, NN and ZZ, represent different service levels. XX, a
product not released on the market in full scale, has a different level comparing to NN and
ZZ. The reason that XX is important to include when performing the analyses on products
that are considered relevant, is that it is predicted to grow significantly larger in sales in future
periods; it is believed to eventually outgrow products such as NN.
NN, a product that has been available on the market for several years, has a relatively low
service level; only 42 percent of the orders are available in stock to be delivered on time. Due
to the production shutdown in 2006, this service level does not give a fair picture of the
number of orders delivered. When only including the latest fiscal year, the service level is
increased to 55 percent. Still, this is to be considered a low service level. Comparing to the
goal set in “Blue Sky 2011”, there is still a long way to go. Reasons causing delays, such as
quality concerns and late deliveries from the supplier, need to be addressed. A large share of
the problems regarding this lies in an overly optimistic attitude towards delivery and
throughput time. It can be solved by placing orders earlier, in order to secure on-time
deliveries. The issue with quality is a deeper problem that requires developing components
that are suited for the environment and will pass the quality tests, as well as the usage in real
situations.
Due to the fact that XX still is at the stage of Limited Sales, no records have been kept
regarding early, on-time and late deliveries. As it is released into Full Sales, there will be data
available to evaluate and follow up delivery times, in order to improve and increase the
service level.
School of Management and Economics
47
The relatively low overall service level of ZZ, only 31 percent, should be put in relation by
considering both small and large order quantities. It is obvious that the main part of the
problem regards orders with large quantities, as they are not held in stock. When excluding
the orders of more than 100 units, the service level increases up to 55 percent. In view of the
fact that a safety stock of approximately 100 units is held, with the purpose of meeting
demand, this level is rather low. It appears peculiar that, given that it is a make-to-order
product, and therefore not produced until there is a specific order, the service level is so low.
Even in this case, the problems occur as a result of time management and the point in time the
production order is placed. Given the fact that ZZ has been on the market for so long, it
should have resulted in a greater knowledge of the supply chain and lead times in different
parts of it.
When prioritizing in the goal conflict of a high service level and low level of tied up capital, it
is at this stage significantly more important to focus on increasing the service level than
keeping a low level of tied up capital. Still, in the long run, the balance is more beneficial than
focusing on only one aspect.
5.2.4 Pareto Principle and ABC analysis
The theory presents information about how to separate different categories of articles. Due to
this fact, and what to understand from figure 20, this gives a foundation and support to our
arguments that we have selected the three most significant products. 80 percent of the value of
all articles stored is about 200, and out of them there are only a few not included in one of the
three products.
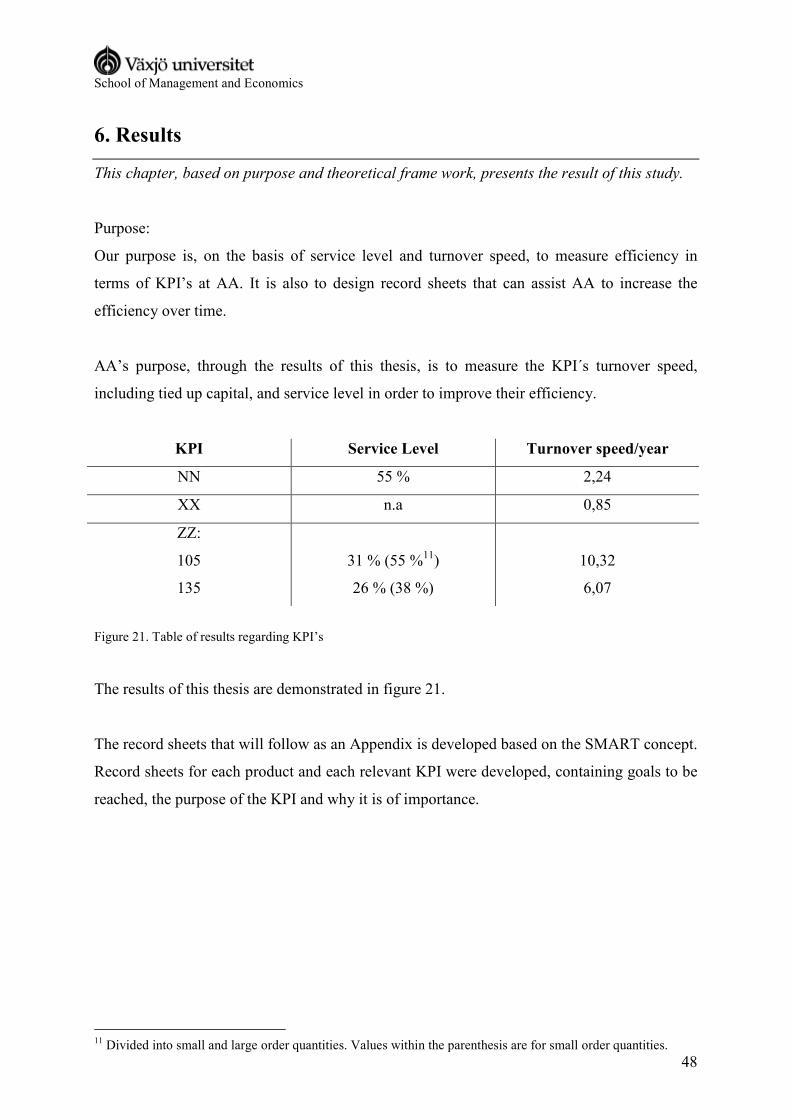
School of Management and Economics
48
6. Results
This chapter, based on purpose and theoretical frame work, presents the result of this study.
Purpose:
Our purpose is, on the basis of service level and turnover speed, to measure efficiency in
terms of KPI’s at AA. It is also to design record sheets that can assist AA to increase the
efficiency over time.
AA’s purpose, through the results of this thesis, is to measure the KPI´s turnover speed,
including tied up capital, and service level in order to improve their efficiency.
KPI Service Level Turnover speed/year
NN 55 % 2,24
XX n.a 0,85
ZZ:
105
135
31 % (55 %11)
26 % (38 %)
10,32
6,07
Figure 21. Table of results regarding KPI’s
The results of this thesis are demonstrated in figure 21.
The record sheets that will follow as an Appendix is developed based on the SMART concept.
Record sheets for each product and each relevant KPI were developed, containing goals to be
reached, the purpose of the KPI and why it is of importance.
11 Divided into small and large order quantities. Values within the parenthesis are for small order quantities.
School of Management and Economics
49
7. Discussion
Based on our problem definition to evaluate turnover speed and service level at AA, we have
concluded that the main focus ought to be on the KPI Service Level. What has emerged in this
study, is that the service level overall is too low. Regardless of which product has been
evaluated, they have all presented a low level of on-time deliveries. We have investigated
different kinds of products; both products with a high sales frequency, such as 15 000 units
each year, and products that are in the process of entering the market, like XX. None of these
products were able to demonstrate a delivery precision that would impress a manager. Due to
the fact that AA has not developed these numbers and KPI´s prior to this study, they have not
had knowledge regarding this situation. Therefore, presenting these KPI´s aims at providing a
foundation for future measurement of these numbers.
The fact that the service level does not differ considerably whether the order quantity is large
or small surprises us. Because a safety stock of approximately 100 units is held for ZZ, there
should not be a problem to deliver on time when the demand is below 100. A part of the
problem, and consequently also the solution, lies in the order handling, as the orders are not
managed in a satisfying way. One example of the order handling not being satisfactory is that
they sometimes are placed too late to be delivered on time. In some cases, the order is even
placed on the day of or the day after the requested delivery date, which of course eliminates
the possibility of delivering on time. Another part of the solution for delivering on the
requested date is to actually implement the KPI´s in the organisation, and use them on a
regular basis.
NN has reached a sales level of 1 500 units in total. This indicates that most of the faults
occurring at an early stage should have been attended to. Still, the fact that the service level is
low, only 55 percent, must have a reason. Quality control has experienced a number of
failures when it comes to quality and function. This is affected by that it is a high voltage
product, which requires high safety standards and no risk of defects, as it could cause personal
damage. The turnover speed of NN is 2,24 per year, which is connected to the need of
ensuring that the production always has the access to tested key components.
XX, still at the stage of Limited Sales, has not yet reached a level comparable to NN. The
ambition though, is that XX will attain an echelon equivalent to NN, both regarding service
School of Management and Economics
50
level, turnover speed and units sold. The foundation necessary to calculate KPI´s is yet too
shallow to draw further conclusions, and therefore it is uncertain to determine them at this
point. The values suggested by the authors are estimations based on present numbers. The
reason we include them is to give a base for future calculation, even though today’s numbers
do not give a correct picture.
ZZ, a product that has been sold and developed for many years, and is not as technically and
electronically advanced as NN and XX, would from our assumptions represent a higher
service level. The truth turned out to be the opposite; the service level for ZZ 105 is 31
percent, and for ZZ 135 it is 26 percent. When considering the fact that some orders have a
quantity of 800 to 1 500 units, this service level is understandable and in some cases even
acceptable. This would suggest that when the order quantities are smaller, the service level
would be significantly higher, a lot due to the safety stock. If the average delay were only a
couple of days, it would be more acceptable. The way it is though, with average delays on one
to two weeks, is not satisfactory. Taking the safety stock into account, there should be an
ability to fulfil the deliveries.
There may not be time to work enough with the KPI´s, which will mean that the department
never will achieve the goals. Our aim and expectations though is for the results of this study
to give the department a conviction of the importance of performance measurement,
preferably in terms of KPI´s.
The fact that the department is only involved in internal trading, may be an explanation to
why the KPI´s not have been prioritized. The logistic activities have not been considered
essential to overall performance. In terms of the result of the entire corporation, it may not
have a strong effect. When it comes to keeping relations with customers and attracting new
customers though, it is important to keep the delivery times and enlighten improvement of
today’s figures.
When having long term goals, in order to being able to reach them, it facilitates to divide them
into stages. Considering the circumstances regarding time and resources, the first year’s goal
is set to increase the service level to 65 percent. This is to give a smooth start, in order to
maintain the motivation. The second year’s goal requires more specific focus, in order to
achieve a level of 85 percent. When it comes to the goal of the third year, it is about fine

School of Management and Economics
51
tuning the details to increase the final 10 percent to 95 percent service level.
Another conclusion is that it is essential to primarily address the problem with information
transferring. The solution to a large share of AA’s problems is the transferring of information
between the different departments. Just like most of the logistics dilemmas, there is a lack of
understanding the importance of reporting and supplying the accurate information at the right
time.
7.1 Critical review and proposals for continued research
To look upon the results critically, we could have achieved a deeper foundation for our study
if we were allotted a longer time period. The depth of the thesis would have increased if we
had the ability to be a part of the implementation and afterwards evaluated it. At this point, we
do not have knowledge whether the record sheets in fact are SMART, and possible to put into
practice.
� Continued Research: We recommend future researchers to be a part of the
implementation of the mentioned KPI´s. This way, it is possible to make continuous
evaluations of the ongoing process, and if necessary make improvements to the
implementation.
School of Management and Economics
52
8. Conclusions
With this background, we have come to a number of conclusions regarding service level and
turnover speed.
• It is of importance that the service level is increased. The service level is to be
increased through different stages:
- Year 1 it is planned to reach an overall 65 percent service level.
- Year 2 it is to reach 85 percent.
- Year 3 the goal is to reach a 95 percent service level.
• Regarding turnover speed, we have concluded the following:
- The turnover for ZZ is satisfying with 6,07 for ZZ 135 and 10,32 for ZZ 105.
- The goal for XX should be to attain a turnover speed equivalent to NN, which at this
point is 2,24.
- The goal for NN, is a turnover speed of 3 times a year.
These levels are not based on calculations performed by us, but are estimations founded on
our experiences during this period. There may be room for a faster increase in service level
and turnover speed, if the problem is taken seriously enough.

School of Management and Economics
53
9. References
Books
Alasuutari P (1995). Researching Culture- Qualitative Method and Cultural Studies. London: SAGE Publications Ltd. Anupindi R, Chopra S, Deshmukh S, Van Mieghem JA & Zemel, E (2006). Managing business process flows – principles of operations management. New Jersey: Pearson Education. Aronsson H, Ekdahl B & Oskarsson B (2004). Modern Logistik: För Ökad Lönsamhet. Malmö: Liber Ekonomi. Backman, J (1998). Rapporter och Uppsatser. Lund: Studentlitteratur. Bjørnland D, Persson G & Virum H (2001). Logistik för konkurrenskraft – ett ledaransvar. Lund: Wallin & Dahlholm Boktryckeri AB. Bryman A & Bell E (2003). Företagsekonomiska forskningsmetoder. Oxford: Oxford University Press. DePoy, E (1999). Forskning – en introduktion. Lund: Studentlitteratur Guba E G & Lincoln Y S (1985). The Context of Emergent Paradigm Research. Beverly Hills: Sage. Guba E G & Lincoln Y S (1994). Competing Paradigms in Qualitative Research. Thousand Oaks: Sage Publications, Inc. Hartman J (2004). Vetenskapligt tänkande. Lund: Studentlitteratur. Jonsson P & Mattsson S-A (2005). Logistik – Läran om effektiva materialflöden. Lund: Studentlitteratur Kvale, S (1997). Den kvalitativa forskningsintervjun. Lund: Studentlitteratur.
Mattsson S-A (2004). Logistikens termer och begrepp. Stockholm: Brollins Offset AB.
Max D & Bacal R (2004). Perfect phrases for setting performance goals. United States:
McGraw-Hill Professional.
Nahmias S (2005). Production and Operations Analysis. New York: McGraw-Hill/Irwin.
Olhager J (2000). Produktionsekonomi. Lund: Studentlitteratur.

School of Management and Economics
54
Oskarsson B, Aronsson H & Ekdahl B (2003). Modern Logistik - för ökad lönsamhet. Malmö:
Liber AB.
Parmenter, D. (2007). Key Performance Indicators. Developing, Implementing
and Using Winning KPIs. Hoboken, New Jersey: John Wiley & Sons.
Roos G, von Krogh G & Roos J (2004). Strategi – en introduktion. Lund: Studentlitteratur. Starrin, B & Svensson, P-G (1994). Kvalitativ metod och vetenskapsteori. Lund: Studentlitteratur. Thuren, T (2000). Populärvetenskapens retorik: inte bara att förenkla. Stockholm: Liber. Yard S (2001). Kalkyler för investeringar och verksamheter. Lund: Studentlitteratur.
Yin R K (2003). Case Study Research: Design and Methods. Thousand Oaks: Sage Publications, Inc. Articles
Chow G, Heaver T and Nilsson L, “Logistics Performance: Definition and Management”, International Journal of Physical Distribution and Logistics Management, 1994, Vol 24 No. 1, page 17-28 Griffis S E, Goldsby T J, Cooper M, Closs D J, “Aligning logistics performance measures to the information needs of the firm”, Journal of Business Logistics, 2007, Vol 28 No. 2, page 36 Mattson S-A, “Optimerade totalkostnader eller manipulerad kapitalbindning”, Bättre Produktivitet, 2003, No. 2, page 12-14 Neely, A., Richards, H., Mills, J., Platts, K. & Bourne, M., “Designing performance measures: a structured approach”, International Journal of Operations & Production Management, 1997, Vol. 17, No. 11, page 1131-1152
Neely, A. and Bourne, M., “Why measurement initiatives fail”, Measuring business excellence, 2000, Vol. 4, No. 4, pp 3-6 Nyhuis P (2007). “Annals of the CIRP”, Practical Applications Of Logistic Operating, 2007, Vol 56, No1, page 483-486 Shahin A & Mahbod MA, “Prioritization of key performance indicators. An integration of analythical hierarchy process and goal setting”, International Journal of Productivity and Performance Management, 2007, Vol. 56, No. 3, pages 226-240 Spens K.M & Kovàcs G,”A Content Analysis of Research Approaches in Logistics”,

School of Management and Economics
55
International Journal of Physical Distribution and Logistics Management”, 2006, Vol 36, No 5, page 374-390

School of Management and Economics
56
Electronic
ABC Analysis http://images.google.se/imgres?imgurl=http://content.grin.com/binary/hade/19971/0.gif&imgr
efurl=http://www.hausarbeiten.de/faecher/hausarbeit/bwj/19971.html&h=428&w=505&sz=7
&hl=sv&start=72&tbnid=UZBf8XYyDKh1-
M:&tbnh=110&tbnw=130&prev=/images%3Fq%3DABC-
analys%26start%3D54%26gbv%3D2%26ndsp%3D18%26hl%3Dsv%26sa%3DN 2008-04-28
Appendix 1
Framework, Interview questions
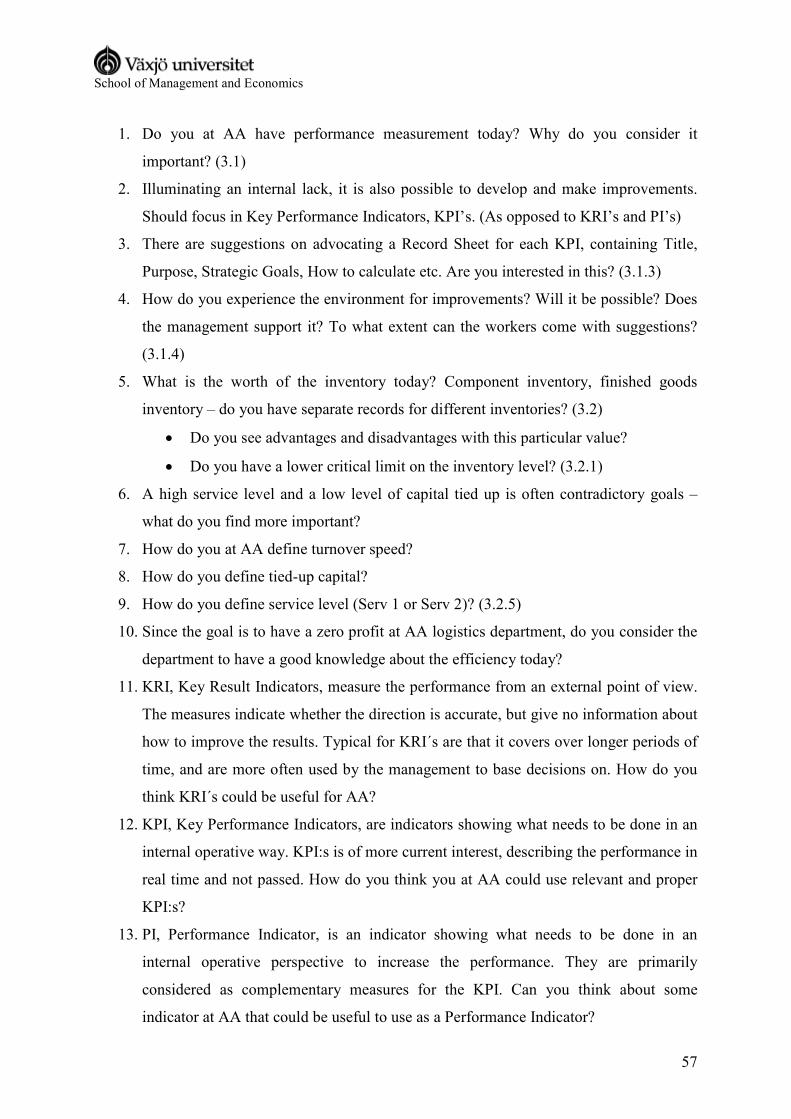
School of Management and Economics
57
1. Do you at AA have performance measurement today? Why do you consider it
important? (3.1)
2. Illuminating an internal lack, it is also possible to develop and make improvements.
Should focus in Key Performance Indicators, KPI’s. (As opposed to KRI’s and PI’s)
3. There are suggestions on advocating a Record Sheet for each KPI, containing Title,
Purpose, Strategic Goals, How to calculate etc. Are you interested in this? (3.1.3)
4. How do you experience the environment for improvements? Will it be possible? Does
the management support it? To what extent can the workers come with suggestions?
(3.1.4)
5. What is the worth of the inventory today? Component inventory, finished goods
inventory – do you have separate records for different inventories? (3.2)
• Do you see advantages and disadvantages with this particular value?
• Do you have a lower critical limit on the inventory level? (3.2.1)
6. A high service level and a low level of capital tied up is often contradictory goals –
what do you find more important?
7. How do you at AA define turnover speed?
8. How do you define tied-up capital?
9. How do you define service level (Serv 1 or Serv 2)? (3.2.5)
10. Since the goal is to have a zero profit at AA logistics department, do you consider the
department to have a good knowledge about the efficiency today?
11. KRI, Key Result Indicators, measure the performance from an external point of view.
The measures indicate whether the direction is accurate, but give no information about
how to improve the results. Typical for KRI´s are that it covers over longer periods of
time, and are more often used by the management to base decisions on. How do you
think KRI´s could be useful for AA?
12. KPI, Key Performance Indicators, are indicators showing what needs to be done in an
internal operative way. KPI:s is of more current interest, describing the performance in
real time and not passed. How do you think you at AA could use relevant and proper
KPI:s?
13. PI, Performance Indicator, is an indicator showing what needs to be done in an
internal operative perspective to increase the performance. They are primarily
considered as complementary measures for the KPI. Can you think about some
indicator at AA that could be useful to use as a Performance Indicator?
School of Management and Economics
58
14. When implementing KPI, SMART goal setting is a commonly used set of criteria of
how to set goals. Specific, Measurable, Attainable, Realistic and Time Sensitive are
what SMART stands for. How do you think the different parts in this model affect the
KPI implementation? Some part that you think is more important than some other?
15. When talking about Inventory and inventory level, there are usually different thoughts
about this at the company’s different department. The sale and marketing department
prefers high levels of inventory and the economics departments would rather have
minimal inventory level to lower the capital tied up. How is this working out at AA?
16. Usually business try to minimize their level of tied up capital, as the cost is usually
rather high. How is this at AA today? Do you consider AA to have good control over
your tied up capital today?
17. How is your turnover speed at AA today? In what way do you measure this in, either
in quantity or value?
18. Do you find it hard to measure the service level at AA today?
19. The Pareto principle is a very common principle, do use this today?
20. When segmenting inventory, ABC analysis is one of the most fundamental aspects, is
this used today?
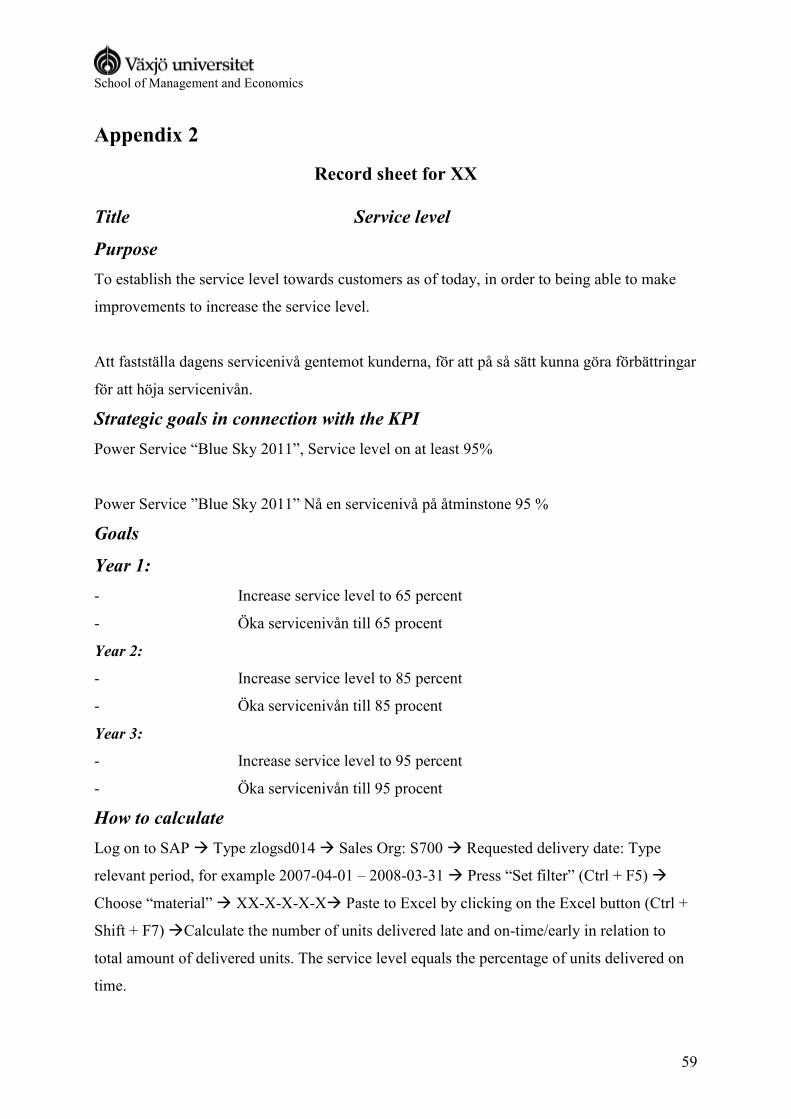
School of Management and Economics
59
Appendix 2
Record sheet for XX
Title Service level
Purpose
To establish the service level towards customers as of today, in order to being able to make
improvements to increase the service level.
Att fastställa dagens servicenivå gentemot kunderna, för att på så sätt kunna göra förbättringar
för att höja servicenivån.
Strategic goals in connection with the KPI
Power Service “Blue Sky 2011”, Service level on at least 95%
Power Service ”Blue Sky 2011” Nå en servicenivå på åtminstone 95 %
Goals
Year 1:
- Increase service level to 65 percent
- Öka servicenivån till 65 procent
Year 2:
- Increase service level to 85 percent
- Öka servicenivån till 85 procent
Year 3:
- Increase service level to 95 percent
- Öka servicenivån till 95 procent
How to calculate
Log on to SAP � Type zlogsd014 � Sales Org: S700 � Requested delivery date: Type
relevant period, for example 2007-04-01 – 2008-03-31 � Press “Set filter” (Ctrl + F5) �
Choose “material” � XX-X-X-X-X� Paste to Excel by clicking on the Excel button (Ctrl +
Shift + F7) �Calculate the number of units delivered late and on-time/early in relation to
total amount of delivered units. The service level equals the percentage of units delivered on
time.
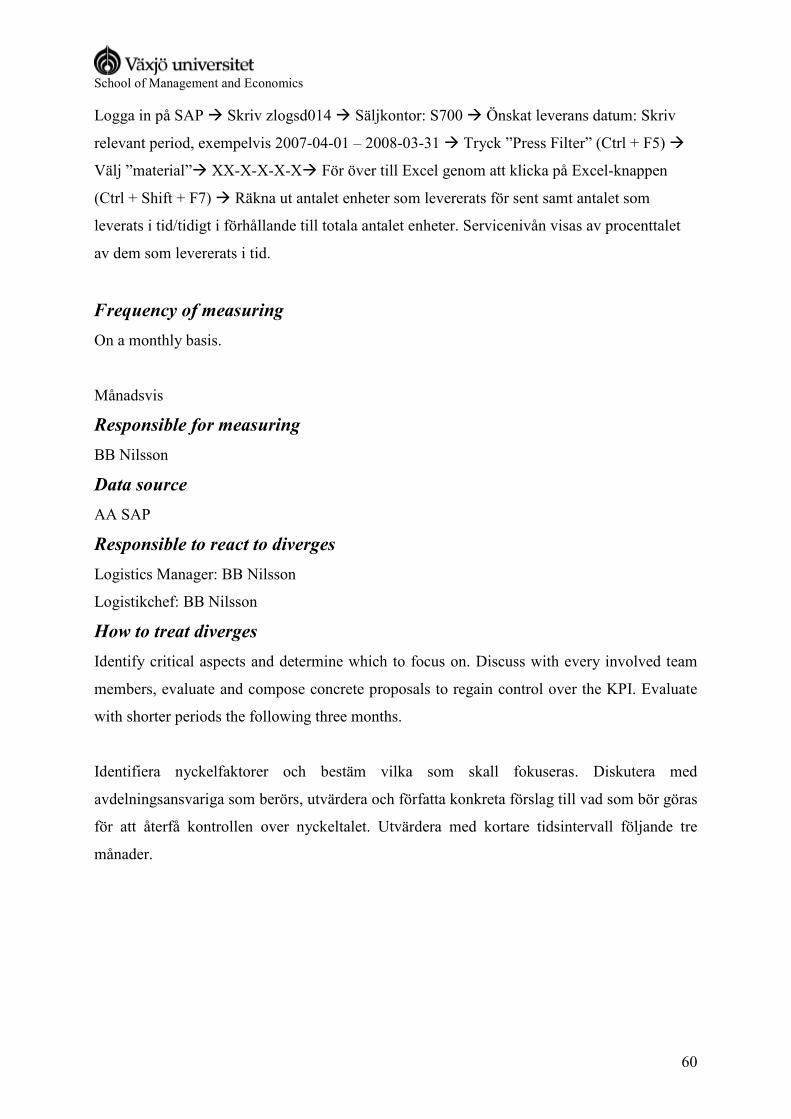
School of Management and Economics
60
Logga in på SAP � Skriv zlogsd014 � Säljkontor: S700 � Önskat leverans datum: Skriv
relevant period, exempelvis 2007-04-01 – 2008-03-31 � Tryck ”Press Filter” (Ctrl + F5) �
Välj ”material”� XX-X-X-X-X� För över till Excel genom att klicka på Excel-knappen
(Ctrl + Shift + F7) � Räkna ut antalet enheter som levererats för sent samt antalet som
leverats i tid/tidigt i förhållande till totala antalet enheter. Servicenivån visas av procenttalet
av dem som levererats i tid.
Frequency of measuring
On a monthly basis.
Månadsvis
Responsible for measuring
BB Nilsson
Data source
AA SAP
Responsible to react to diverges
Logistics Manager: BB Nilsson
Logistikchef: BB Nilsson
How to treat diverges
Identify critical aspects and determine which to focus on. Discuss with every involved team
members, evaluate and compose concrete proposals to regain control over the KPI. Evaluate
with shorter periods the following three months.
Identifiera nyckelfaktorer och bestäm vilka som skall fokuseras. Diskutera med
avdelningsansvariga som berörs, utvärdera och författa konkreta förslag till vad som bör göras
för att återfå kontrollen over nyckeltalet. Utvärdera med kortare tidsintervall följande tre
månader.
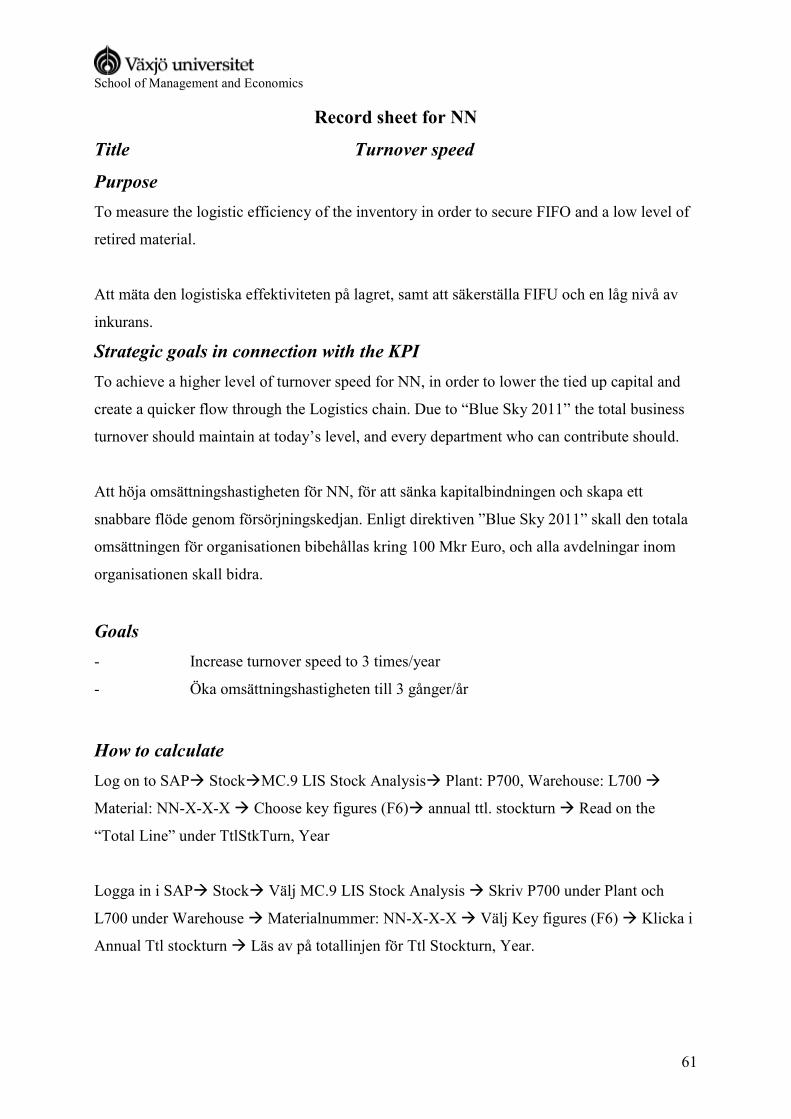
School of Management and Economics
61
Record sheet for NN
Title Turnover speed
Purpose
To measure the logistic efficiency of the inventory in order to secure FIFO and a low level of
retired material.
Att mäta den logistiska effektiviteten på lagret, samt att säkerställa FIFU och en låg nivå av
inkurans.
Strategic goals in connection with the KPI
To achieve a higher level of turnover speed for NN, in order to lower the tied up capital and
create a quicker flow through the Logistics chain. Due to “Blue Sky 2011” the total business
turnover should maintain at today’s level, and every department who can contribute should.
Att höja omsättningshastigheten för NN, för att sänka kapitalbindningen och skapa ett
snabbare flöde genom försörjningskedjan. Enligt direktiven ”Blue Sky 2011” skall den totala
omsättningen för organisationen bibehållas kring 100 Mkr Euro, och alla avdelningar inom
organisationen skall bidra.
Goals
- Increase turnover speed to 3 times/year
- Öka omsättningshastigheten till 3 gånger/år
How to calculate
Log on to SAP� Stock�MC.9 LIS Stock Analysis� Plant: P700, Warehouse: L700 �
Material: NN-X-X-X � Choose key figures (F6)� annual ttl. stockturn � Read on the
“Total Line” under TtlStkTurn, Year
Logga in i SAP� Stock� Välj MC.9 LIS Stock Analysis � Skriv P700 under Plant och
L700 under Warehouse � Materialnummer: NN-X-X-X � Välj Key figures (F6) � Klicka i
Annual Ttl stockturn � Läs av på totallinjen för Ttl Stockturn, Year.

School of Management and Economics
62
Frequency of measuring
On a monthly basis
På månadsbasis
Responsible for measuring
BB Nilsson
Data source
AA SAP
Responsible to react to diverges
Logistics Manager: BB Nilsson
Logistikchef: BB Nilsson
How to treat diverges
Discuss with every involved team members, evaluate and compose concrete proposals to
regain control over the KPI. Evaluate with shorter periods the following three months.
Diskutera med avdelningsansvariga som berörs, utvärdera och författa konkreta förslag till
vad som bör göras för att återfå kontrollen over nyckeltalet. Utvärdera med kortare
tidsintervall följande tre månader.

School of Management and Economics
63
Record sheet for NN
Title Service level
Purpose
To establish the service level towards customers as of today, in order to being able to make
improvements to increase the service level.
Att fastställa dagens servicenivå gentemot kunderna, för att på så sätt kunna göra förbättringar
för att höja servicenivån.
Strategic goals in connection with the KPI
AA Power Service “Blue Sky 2011”, Service level on at least 95%
AA Power Service ”Blue Sky 2011” Nå en servicenivå på åtminstone 95 %
Goals
Year 1:
- Increase service level to 65 percent
- Öka servicenivån till 65 procent
Year 2:
- Increase service level to 85 percent
- Öka servicenivån till 85 procent
Year 3:
- Increase service level to 95 percent
- Öka servicenivån till 95 procent
How to calculate
Log on to SAP � Type zlogsd014 � Sales Org: S700 � Requested delivery date: Type
relevant period, for example 2007-04-01 – 2008-03-31 � Press “Set filter” (Ctrl + F5) �
Choose “material” � NN-X-X-X-X� Paste to Excel by clicking on the Excel button (Ctrl +
Shift + F7) �Calculate the number of units delivered late and on-time/early in relation to
total amount of delivered units. The service level equals the percentage of units delivered on
time.

School of Management and Economics
64
Logga in på SAP � Skriv zlogsd014 � Säljkontor: S700 � Önskat leverans datum: Skriv
relevant period, exempelvis 2007-04-01 – 2008-03-31 � Tryck ”Press Filter” (Ctrl + F5) �
Välj ”material”� NN-X-X-X-X� För över till Excel genom att klicka på Excel-knappen
(Ctrl + Shift + F7) � Räkna ut antalet enheter som levererats för sent samt
Frequency of measuring
On a monthly basis
På månadsbasis
Responsible for measuring
BB Nilsson
Data source
AA SAP
Responsible to react to diverges
Logistics Manager: BB Nilsson
Logistikchef: BB Nilsson
How to treat diverges
Identify critical aspects and determine which to focus on. Discuss with every involved team
members, evaluate and compose concrete proposals to regain control over the KPI. Evaluate
with shorter periods the following three months.
Identifiera nyckelfaktorer och bestäm vilka som skall fokuseras. Diskutera med
avdelningsansvariga som berörs, utvärdera och författa konkreta förslag till vad som bör göras
för att återfå kontrollen over nyckeltalet. Utvärdera med kortare tidsintervall följande tre
månader.
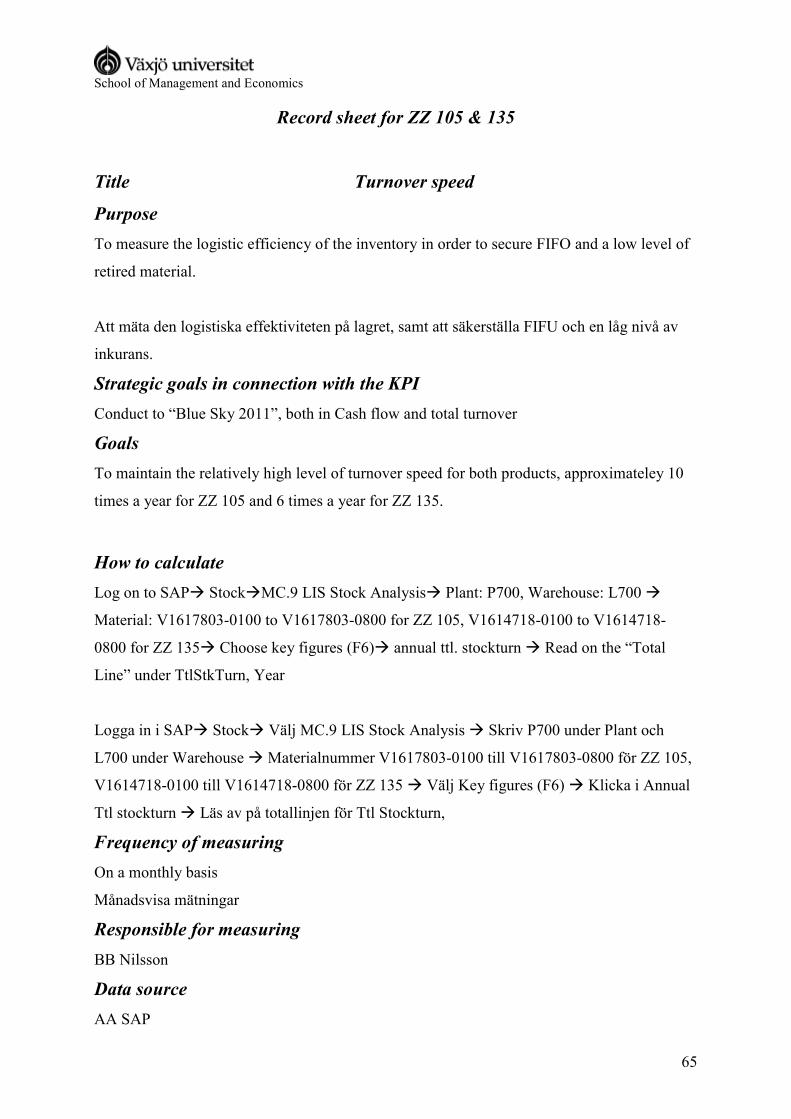
School of Management and Economics
65
Record sheet for ZZ 105 & 135
Title Turnover speed
Purpose
To measure the logistic efficiency of the inventory in order to secure FIFO and a low level of
retired material.
Att mäta den logistiska effektiviteten på lagret, samt att säkerställa FIFU och en låg nivå av
inkurans.
Strategic goals in connection with the KPI
Conduct to “Blue Sky 2011”, both in Cash flow and total turnover
Goals
To maintain the relatively high level of turnover speed for both products, approximateley 10
times a year for ZZ 105 and 6 times a year for ZZ 135.
How to calculate
Log on to SAP� Stock�MC.9 LIS Stock Analysis� Plant: P700, Warehouse: L700 �
Material: V1617803-0100 to V1617803-0800 for ZZ 105, V1614718-0100 to V1614718-
0800 for ZZ 135� Choose key figures (F6)� annual ttl. stockturn � Read on the “Total
Line” under TtlStkTurn, Year
Logga in i SAP� Stock� Välj MC.9 LIS Stock Analysis � Skriv P700 under Plant och
L700 under Warehouse � Materialnummer V1617803-0100 till V1617803-0800 för ZZ 105,
V1614718-0100 till V1614718-0800 för ZZ 135 � Välj Key figures (F6) � Klicka i Annual
Ttl stockturn � Läs av på totallinjen för Ttl Stockturn,
Frequency of measuring
On a monthly basis
Månadsvisa mätningar
Responsible for measuring
BB Nilsson
Data source
AA SAP

School of Management and Economics
66
Responsible to react to diverges
Logistics Manager: BB Nilsson
Logistikchef: BB Nilsson
How to treat diverges
Evaluate the present inventory and what to be changed in order to maintain the starting level.
Utvärdera den nuvarande lagerstrukturen och vad som behövs förändras för att bibehålla
dagens nivå.
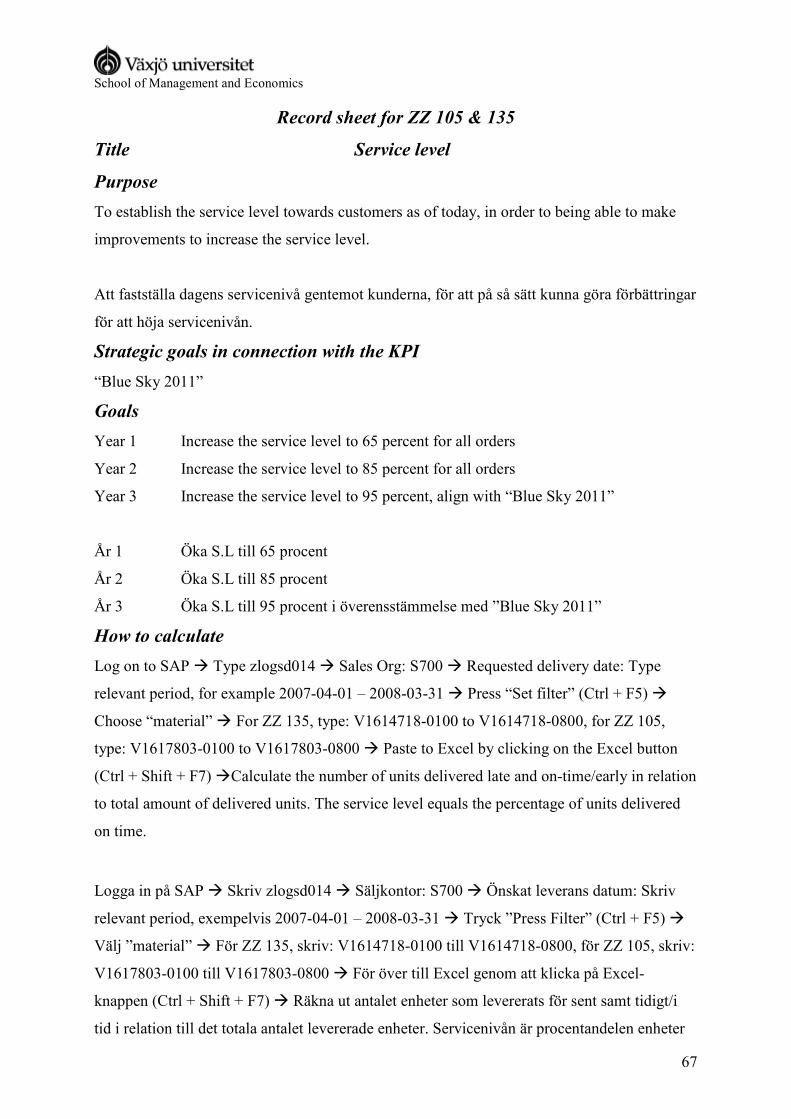
School of Management and Economics
67
Record sheet for ZZ 105 & 135
Title Service level
Purpose
To establish the service level towards customers as of today, in order to being able to make
improvements to increase the service level.
Att fastställa dagens servicenivå gentemot kunderna, för att på så sätt kunna göra förbättringar
för att höja servicenivån.
Strategic goals in connection with the KPI
“Blue Sky 2011”
Goals
Year 1 Increase the service level to 65 percent for all orders
Year 2 Increase the service level to 85 percent for all orders
Year 3 Increase the service level to 95 percent, align with “Blue Sky 2011”
År 1 Öka S.L till 65 procent
År 2 Öka S.L till 85 procent
År 3 Öka S.L till 95 procent i överensstämmelse med ”Blue Sky 2011”
How to calculate
Log on to SAP � Type zlogsd014 � Sales Org: S700 � Requested delivery date: Type
relevant period, for example 2007-04-01 – 2008-03-31 � Press “Set filter” (Ctrl + F5) �
Choose “material” � For ZZ 135, type: V1614718-0100 to V1614718-0800, for ZZ 105,
type: V1617803-0100 to V1617803-0800 � Paste to Excel by clicking on the Excel button
(Ctrl + Shift + F7) �Calculate the number of units delivered late and on-time/early in relation
to total amount of delivered units. The service level equals the percentage of units delivered
on time.
Logga in på SAP � Skriv zlogsd014 � Säljkontor: S700 � Önskat leverans datum: Skriv
relevant period, exempelvis 2007-04-01 – 2008-03-31 � Tryck ”Press Filter” (Ctrl + F5) �
Välj ”material” � För ZZ 135, skriv: V1614718-0100 till V1614718-0800, för ZZ 105, skriv:
V1617803-0100 till V1617803-0800 � För över till Excel genom att klicka på Excel-
knappen (Ctrl + Shift + F7) � Räkna ut antalet enheter som levererats för sent samt tidigt/i
tid i relation till det totala antalet levererade enheter. Servicenivån är procentandelen enheter

School of Management and Economics
68
som levererats i tid.
Frequency of measuring
On a monthly basis
På månadsbasis
Responsible for measuring
BB Nilsson
Data source
AA SAP
Responsible to react to diverges
Logistics manager: BB Nilsson
Logistikchef: BB Nilsson
How to treat diverges
Analyze the underlying factors to the diverges. Is it still the order handling? Call up a meeting
with involved personnel, and discuss in what way there can be improvements.
Analysera de bakomliggande faktorerna. Är det fortfarande orderhanteringen som är det
största problemet? Kalla till ett möte med inblandad personal och diskutera på vilket sätt
förbättringar kan göras.
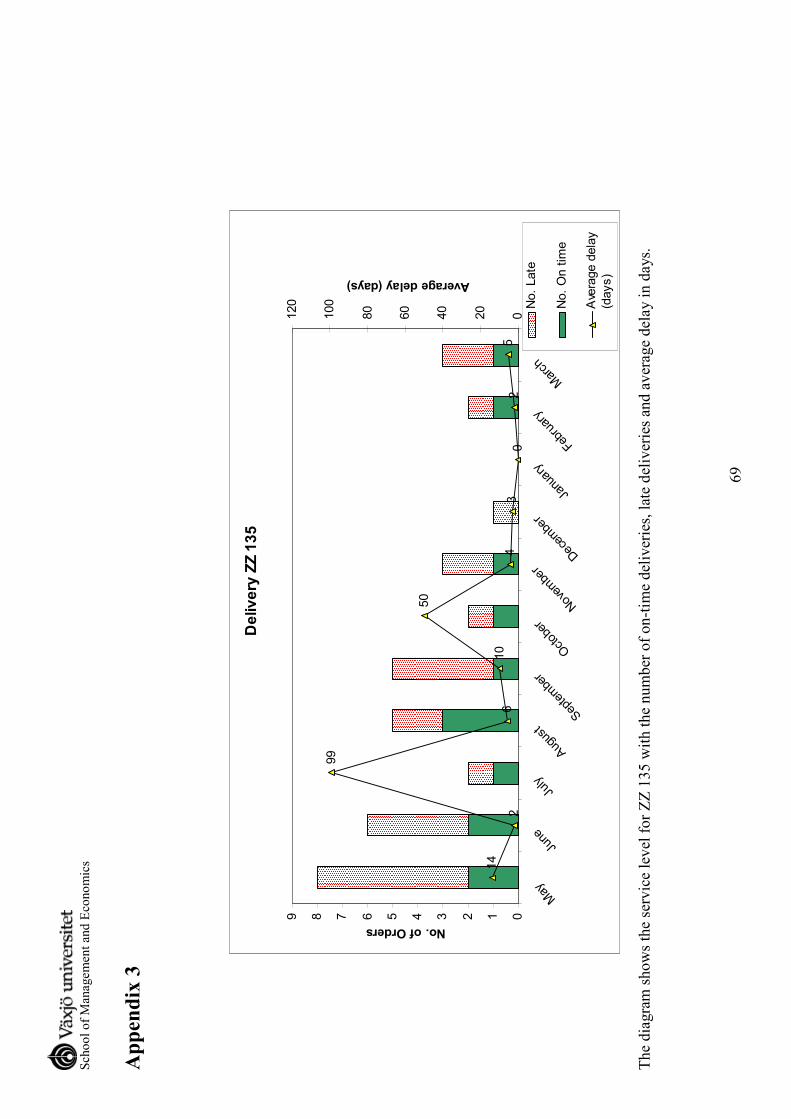
School of Management and Economics
69
Appendix 3
Delivery ZZ 135
14
2
99
610
50
43
02
50123456789
May
June
July
Aug
ust
Sep
tem
ber
Oct
ober
Nov
embe
rD
ecem
ber
Janu
ary
Febr
uary
Mar
ch
No. of Orders
020
40
60
80
100
120
Average delay (days)
No. Late
No. O
n tim
e
Ave
rage d
ela
y
(days)
The diagram shows the service level for ZZ 135 with the number of on-time deliveries, late deliveries and average delay in days.