Embed Size (px)
Citation preview

Q2 2018 Results
26 July 2018
2
Safe harbor
Q2 2018 Results | Safe harbor |
Alternative performance measures and management estimatesThis financial report contains a number of alternative performance measures (non-GAAP figures) to provide readers with additional financial information that is regularly reviewed by management, such as EBITDA and Free Cash Flow (‘FCF’). These non-GAAP figures should not be viewed as a substitute for KPN’s GAAP figures and are not uniformly defined by all companies including KPN’s peers. Numerical reconciliations are included in KPN’s quarterly factsheets and in the Integrated Annual Report 2017. KPN’s management considers these non-GAAP figures, combined with GAAP performance measures and in conjunction with each other, most appropriate to measure the performance of the Group and its segments. The non-GAAP figures are used by management for planning, reporting (internal and external) and incentive purposes. KPN’s main alternative performance measures are listed below. The figures shown in this report were rounded in accordance with standard business principles. As a result, totals indicated may not be equal to the precise sum of the individual figures.KPN defines EBITDA as operating result before depreciation (including impairments) of PP&E and amortization (including impairments) of intangible assets. Note that KPN’s definition of EBITDA deviates from the literal definition of earnings before interest, taxes, depreciation and amortization and should not be considered in isolation or as a substitute for analyses of the results as reported under IFRS as adopted by the European Union. In the Net Debt / EBITDA ratio, KPN defines Net Debt as the nominal value of interest bearing financial liabilities excluding derivatives and related collateral, representing the net repayment obligations in Euro, taking into account 50% of the nominal value of the hybrid capital instruments, less net cash and short-term investments, and defines EBITDA as a 12 month rolling total excluding restructuring costs, incidentals and major changes in the composition of the Group (acquisitions and disposals). Free Cash Flow is defined as cash flow from continuing operating activities plus proceeds from real estate, minus capital expenditures (Capex), being expenditures on PP&E and software. Operating free cash flow is defined as adjusted EBITDA minus Capex. Revenues are defined as the total of revenues and other income unless indicated otherwise. Adjusted revenues and adjusted EBITDA are derived from revenues (including other income) and EBITDA, respectively, and are adjusted for the impact of restructuring costs and incidentals. The term service revenues refers to wireless service revenues. All market share information in this financial report is based on management estimates based on externally available information, unless indicated otherwise. For a full overview on KPN’snon-financial information, reference is made to KPN’s quarterly factsheets available on ir.kpn.com
Forward-looking statementsCertain statements contained in this financial report constitute forward-looking statements. These statements may include, without limitation, statements concerning future results ofoperations, the impact of regulatory initiatives on KPN’s operations, KPN’s and its joint ventures' share of new and existing markets, general industry and macro-economic trends and KPN’sperformance relative thereto and statements preceded by, followed by or including the words “believes”, “expects”, “anticipates”, “will”, “may”, “could”, “should”, “intends”, “estimate”,“plan”, “goal”, “target”, “aim” or similar expressions.These forward-looking statements rely on a number of assumptions concerning future events and are subject to uncertainties and other factors, many of which are outside KPN’s controlthat could cause actual results to differ materially from such statements and speak only as of the date they are made. A number of these factors are described (not exhaustively) in theIntegrated Annual Report 2017.

3
Q2 ’18 adjusted revenues excl. regulation +0.5% y-on-y
Q2 ’18 adjusted EBITDA excl. regulation +2.3% y-on-y
€ 8.6ct per share paid to shareholders € 7.3ct final dividend over 2017 € 1.3ct pass through TEFD dividend
Ongoing success of convergence and value strategy in Consumer +46k fixed-mobile postpaid customers +19k fixed-mobile households
Competitive pressure on single play services KPN brand postpaid net adds flat,
no frills brands -10k -5k broadband net adds3
+10k IPTV net adds
Business transformation taking shape Continued growth of multi play seats4 in
SME, +33k net adds Growth in Professional Services, driven
by order intake in prior quarters
Highlights Q2
Improving customer satisfaction1
NPS Consumer: +14 (Q2 ’17: +13) NPS Business: -5 (Q2 ’17: -6)
Targeted household approach leading to increased convergence penetration and lower churn
Value focus reflected in more-for-more portfolio adjustments Consumer Residential
#1 Business service provider according to Dutch CIOs for 2nd consecutive year2
Highest ISS QualityScore for new Environmental and Social benchmark
Second wave Simplification program: ~€ 175m run-rate savings realized6
1 Source: Kantar TNS, Consumer (all brands), Business (KPN brand)2 Source: Dutch IT Partner Preference Survey3 Corrected for migrations to and new customers of small business proposition (6k)
launched in Q4 2017
4 Multi play seats consist of the total number of fixed voice lines plus the total number of mobile SIMs in multi play
5 All figures in this presentation are based on continuing operations, unless stated otherwise6 End Q2 ’18 vs. end Q4 ’16
Services & Innovation Operational Financial5
Q2 2018 Results | Highlights |
€ m Q2 ’18 H1 ’18
Adjusted revenues 1,402 2,803
y-on-y % -1.5% -2.5%
Adjusted EBITDA 577 1,146
y-on-y % 1.3% 1.8%
FCF (excl. TEFD dividend) 224 347
y-on-y % 2.4% 40%

4
Simplification and digitalization embedded in organizationDriving revenue opportunities and lower spend
ENABLING IMPROVEDCUSTOMER EXPERIENCE
Removing complexity for customers- Single ID, omnichannel experience, e-care
On-demand virtualized services- Instant provisioning, real-time scaling
DRIVINGPERFORMANCE
Lower spend- Marketing, call center, engineers- Personnel, IT/TI, maintenance, energy- Connection fees, traffic- Cheaper generic hardware
€Revenue opportunities- Fixed-mobile-IT convergence- Additional value added services
(incl. partnerships such as Netflix and WeChat)- Infrastructure as a Service- Data & Analytics as a Service
Simplify portfolio and operations - Fewer propositions- Creation of uniform digital layer- BSS / OSS IT integration
Decentralize
Virtualize
Digitalize
Rationalize
Use data & analytics- Targeted household marketing- Optimized customer service- Smarter network investments
Provide services closer to customers- Improved (metro) core network - First 5G technology use cases- Higher network efficiency
Increase network efficiency and effectiveness- Flexible on-demand capacity
and services- Self-healing and self-optimizing
networksQ2 2018 Results | Simplification & Digitalization |

5
Targeted household approach yielding tangible resultsSmart analytics driving increased convergence penetration and lower churn
Q2 2018 Results | Data & Analytics |
Step 1: Created uniform digital layer
Step 2: Started using Data & Analytics to optimize - Customer service- Up- and cross-sell- Network investmentswhile preserving privacy
Client situation
Data pool
Step 3: Reaping the benefits1
Reducing churn
Control group
Targeted advice
-6.5%
Increasing convergence penetration
Targeted advice
Control group
~95%
Targeted advice
Control group
~40%
Broadband
Broadband adding mobile
Mobile adding broadband
New (3) Offered (0)
Unique targeted client advice (shown to customer service)
We can enhance the customer’s WiFi connection (speed/stability) by switching channels
Customer has KPN fixed and mobile services, but has not activated converged benefits
Customer can upgrade connection to fiber
1 Measured in Q1 2018

6
Optimizing customer journeyUsing Data & Analytics to prevent online-to-offline leakage and deploy best call center agents
30% of interruption calls cause 80% of costs Routing calls to most suitable agents Facilitating online self-help
7
2
10
3
1
9
6
Total costs (related to interruptions)
4
8
5
Decile
~80%
Main drivers:
Use of mechanics
Hardware swaps
Expected annual savings from optimized customer journey: ~€ 10m
€ per journey vs. avg
~15%~60% ~85%
~40%
~15%~30% ~85%
~70%
xx%: 2018xx%: 2016
Q2 2018 Results | Data & Analytics |
Bottom-20% agents
+35%
Top-20% agents
-27%

7
Successful up- and cross-sell further strengthening convergence positionIncreasing SIMs per household leading to lower churn
More SIMs lead to lower churnCustomers in fixed-mobile bundles
Q2 2018 Results | Consumer |
Q2 ’18
Q2 ’17
47%
54%all brands
67%KPN brand
Q2 ’18:46k net adds
Q2 ’18:19k net adds
Q2 ’17
40%44%
Q2 ’18
Households1 Postpaid customers
1 As % of broadband customers2 Based on fixed-mobile households3 KPN brand
1.47
1.36
Q2 ’18
+12%
Q2 ’14
1.52
Q2 ’16
Increasing SIMs per household2
~50%
Broadband-only
~50%
F-M bundles (≥2 SIMs)
F-M bundles (1 SIM)
Lower churn3 (Q2 ’18)

8
Continued focus on value in competitive Consumer environment
Q2 2018 Results | Consumer |
+1.7%
Q2 ’18Q2 ’17
464472
€ m
Continued fixed revenue growthMobile service revenues impacted by regulation and price pressure in mobile-only
209208231
-9.2%
Q1 ’18 Q2 ’18Q2 ’17
-3.5%
Mobile service revenues
Growth of mobile service revenues(Excluding regulation)
€ m

9
Internet only
Internet & TV Basic
Internet & TV
Standard
Internet & 4K TV
Premium
New € 41.50 € 51.50 € 61.50 € 71.5050/5Mbps 50/5Mbps 100/10Mbps 150/15Mbps
Old € 39 € 49 € 59 € 6940/4Mbps 40/4Mbps 80/8Mbps 100/10Mbps
New Consumer fixed propositions reflecting value focus
More-for-more at KPN brand1 New Telfort propositions focus on convergence1
+ € 5 + € 7.50+ € 5
Internet Internet & TV All-in-1
Converged benefits
Internet only
Internet & TV Basic
Internet & TV
Standard
Internet & 4K TV
Premium
+ € 2.50
+10/1Mbps
to
+10/1Mbps
to
+20/2Mbps
to
+50/5Mbps
to
50/5 Mbps 50/5 Mbps 100/10 Mbps 150/15 Mbps
or or
Standard per SIM Additional benefit
€ 52 -€ 5
Q2 2018 Results | Consumer |1 KPN brand as per 1 July 2018, Telfort brand as per 16 April 20182 € 5/month discount on fixed subscription
2xdata

10
Business transformation taking shape
Business revenue growth drivers
Q2 ’18adjusted
y-on-y growth
H1 ’18 adjusted
y-on-y growth
Communication Services -7.3% -8.0%
Mobile service revenues -6.2% -7.0%
IoT 8.3% 22%
Broadband & Network services -1.4% -1.4%
Fixed voice -15% -15%
Other -13% -18%
IT Services (a.o. security, cloud, workspace) 28% 23%
Professional Services & Consultancy 9.1% 7.0%
Business total 0.3% -1.1%
Q2 2018 Results | Business |

11
KPN well positioned to cater to smaller businessesEncouraging take-up of new small business proposition
Q2 2018 Results | Business |
43
2
1
2
1
8
Q1 ’18
5
Q2 ’18
Migrations from Consumer
k
New small business customers
Migrations margin accretiveGood broadband inflow
Migrations from Business
Margin on small business
proposition
Margin on Consumer proposition
Margin uplift
~€ 5-10

12
Several landmark corporate deals in converged communication & IT services
Q2 2018 Results | Business |1 Source: Dutch IT Partner Preference Survey
IT Workspace Management
ConnectivityIT WorkspaceManagement
Network &Security services
KPN recognized as #1 Business service provider in The Netherlands for second consecutive year1
Amongst others
Telecom
Mobility
Datacenters
IT Services Management
IT Development
IT Infrastructure

13
Second wave Simplification program on trackRun-rate savings realized of ~€ 175m
~110
2017 End 2019
>350
~175
H1 ’18
~65
End 2016
SECOND WAVE
Simplification program run-rate opex and Capex savings
€ m
Customer centricNext generation Telco
Fully virtualized
Q2 2018 Results | Simplification |

14
BSS integration~€ 80m run-rate savings1 from KPN Consumer Fixed and Mobile IT rationalization
OSS integration~€ 30m run-rate savings1 from consolidation of network interaction layer
More flexible and simplified network and operating modelMobile BSS integration completed with migration of Telfort mobile base
Customer interaction layer (BSS)
Network interaction layer (OSS)
Consumer Fixed
Consumer & Business Mobile
UNIFORM DIGITAL LAYER (API)
TelfortB2B
Fixed
KPN B2B
Fixed
KPNB2B
Mobile
KPNB2B
Fixed
TelfortB2B
Fixed
TelfortB2B
MobileTelfortMobileKPN MobileKPN Fixed Telfort
Fixed
End 2013
H1 2018
Q2 2018 Results | Simplification |1 Run-rate savings per end 2019
TelfortB2B
Mobile

15
Adjusted revenue trend improving compared to Q1 ’18
Adjusted revenues declined by 1.5%1
€ m
19
15
Adj. revenues Q2 ’17
Consumer
2
Business Wholesale
10
1,424
Other (incl. eliminations)
Adj. revenues Q2 ’18
1,402
+0.5%
Growth of adjusted revenues, excluding € 29m regulation impact(roaming & MTA / FTA)
Q2 2018 Results | Financial performance |1 vs. Q1 2018: -3.4%

16
Adjusted EBITDA growth driven by Simplification and digitalization
Adjusted EBITDA increased by 1.3%
€ m40.0%
22
19
Adj. EBITDA Q2 ’17
569
Revenues IT/TI
10
Personnel expenses
3
3
Cost of goods & services
Adj. EBITDA Q2 ’18
577
Other operating expenses
41.1%
1 2
1 Lower traffic costs due to reduction MTA tariffs
Adjusted EBITDA margin
+2.3%
Growth of adjusted EBITDA, excluding € 5m regulation impact(roaming & MTA / FTA)
2 Ongoing Simplification and digitalization savings
Q2 2018 Results | Financial performance |
17
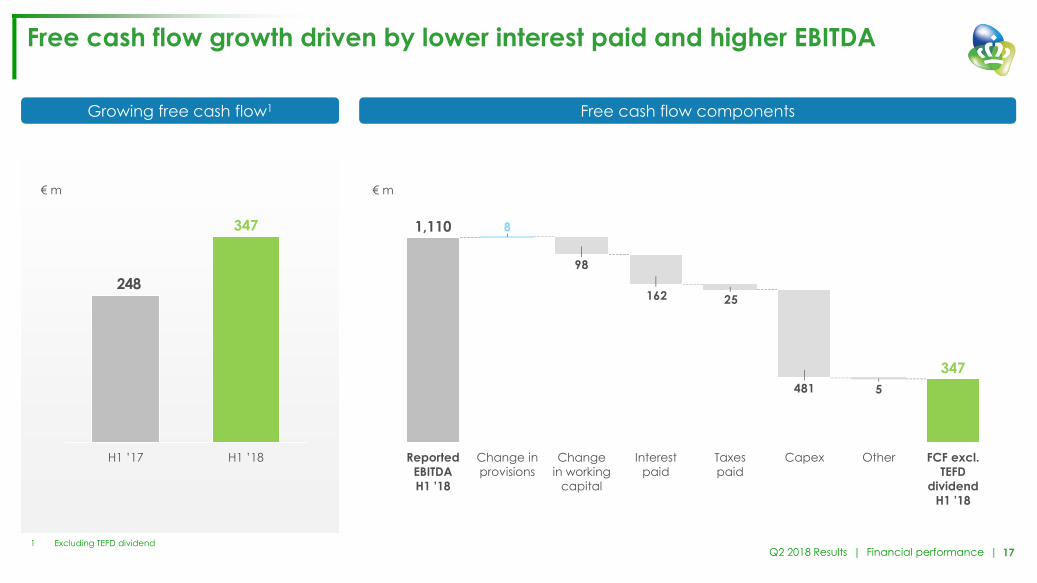
Free cash flow growth driven by lower interest paid and higher EBITDA
Q2 2018 Results | Financial performance |
Growing free cash flow1
248
347
H1 ’18H1 ’17
€ m
Free cash flow components
481
25162
98
Change in working
capital
8
Reported EBITDA H1 ’18
CapexTaxespaid
Interestpaid
Change in provisions
5
1,110
FCF excl. TEFD
dividend H1 ’18
347
Other
€ m
1 Excluding TEFD dividend

18
Solid financial positionIntention to redeem € 1.1bn hybrid bond from existing cash
Q1 ’18Q2 ’17 Q2 ’18
7.2 7.3 7.2
6.25.8 5.8
2.6x 2.5x2.5x
Lower debt level
Net debt / EBITDAx.xx.xGross debt1
Net debt
€ bn
Hybrid redemption at first call date2
Q2 2018 Results | Financial performance |1 Gross debt defined as the nominal value of interest bearing financial liabilities, excluding derivatives and related collateral,representing the net repayment obligations in Euro, taking into account 50% of the nominal value of the hybrid capital instruments
2 First call date: 14 September 2018
Successful execution of strategy since issuance in 2013
Realignment proportion hybrid capital to balance sheet
Saving € 67m annual coupon from 2019 onwards
Debt portfolio
Net debt in line with Q1 ’18 Free cash flow generated in Q2 ’18 Partial sale of TEFD stakeOffset by Final dividend over 2017 paid to shareholders
Average coupon senior bonds 3.8% (Q2 ’17: 4.1%)

19
Outlook 2018
Adjusted EBITDA in line with 2017
Capex ~€ 1.1bn
Free cash flow (excl. TEFD dividend) growing
Intended regular DPS of € 12ct in respect of 2018 Interim dividend of € 4ct to be paid on 2 August 2018
Intention to grow regular DPS in line with FCF growth profile
Excess cash could be utilized for Operational / financial flexibility (Small) in-country M&A Shareholder remuneration
Shareholder remunerationOutlook 20181
Q2 2018 Results | Outlook |1 Based on continuing operations

20
Q&AKey priorities on track
Simplify Grow Innovate
Grow in TV and IT services
Finalize Business transformation
Finalize build of flexible and simplified integrated network and operating model
Expand superior access position by deploying innovative technologies and increasing fiber penetration
Optimize financial framework and grow dividend
Accelerate up and cross-sell in bundles
Q2 2018 Results | Q&A |

Q2 2018 – Information Pack
For further information please contact
KPN Investor Relations+31 70 44 [email protected]

1 KPN ADR Program2 CSR strategy3 Group results overview4 Group KPI overview5 Debt overview6 IFRS 157 Spectrum8 Fixed infrastructure9 Telefónica Deutschland stake
Contents

23
KPN ADR programKPN has a sponsored Level 1 ADR program
Bloomberg ticker KKPNY
Trading platform Over-the-counter (OTC)
CUSIP 780641205
Ratio 1 ADR : 1 Ordinary Share
Depositary bank Deutsche Bank Trust Company Americas
Depositary bank contact Jonathan Montanaro
ADR broker helpline+1 212 250 9100 (New York) +44 207 547 6500 (London)
E-mail [email protected]
ADR website www.adr.db.com
Depositary bank’s local custodian Deutsche Bank, Amsterdam
Q2 2018 Results | Information Pack | ADR program |

1 KPN ADR Program2 CSR strategy3 Group results overview4 Group KPI overview5 Debt overview6 IFRS 157 Spectrum8 Fixed infrastructure9 Telefónica Deutschland stake
Contents

25
Successful CSR strategy1 Social and environmental achievements in Q2 ’18
KPN received highest ISS QualityScore for new Environmental and Social benchmarks
KPN KlasseContact had 248 new placements in Q2 2018, bringing the total number of users of KPN KlasseContact to 781
KPN’s charity fund supports the Dirk Kuyt Foundation, which started a pilot to transport disabled persons to sports accommodation and sport events
KPN’s charity fund and Foundation Papagenolaunched music therapy app for autistic children
Leading in Corporate Social Responsibility
Recognition
2017Privacy & SecurityEnvironmentEmployee Engagement
80%vs. 77% in 2016
24%Less energy consumption
vs. 2010
70%of Dutch people believe
their data is safe with KPN
1 As disclosed in KPN’s Integrated Annual Report 2017 Q2 2018 Results | Information Pack | CSR |

1 KPN ADR Program2 CSR strategy3 Group results overview4 Group KPI overview5 Debt overview6 IFRS 157 Spectrum8 Fixed infrastructure9 Telefónica Deutschland stake
Contents

27
Group results Q2 ’18 (continuing operations)
(€ m) Q2 ’18 Q1 ’18 Q2 ’17 y-on-y %Revenues 1,402 1,402 1,427 -1.7%Adjusted revenues 1,402 1,402 1,424 -1.5%
Operating expenses (excl. D&A) 847 847 877 -3.5%
EBITDA 555 555 550 1.0%
Adjusted EBITDA 577 569 569 1.3%
Depreciation 240 242 249 -3.5%Amortization 105 105 103 1.9%
Operating expenses 1,192 1,194 1,229 -3.0%
Operating profit 210 208 198 6.3%
Net finance costs -25 -81 5 n.m.Share of profit of associates and joint ventures - - - n.m.
Profit before taxes 185 127 203 -8.9%
Income tax -48 -28 -41 16%
Profit after taxes 137 98 162 -15%
Q2 2018 Results | Information Pack | Group results overview |

28
Group results YTD ’18 (continuing operations)
(€ m) YTD ’18 YTD ’17 y-on-y %Revenues 2,803 2,878 -2.6%Adjusted revenues 2,803 2,875 -2.5%
Operating expenses (excl. D&A) 1,693 1,799 -5.9%
EBITDA 1,110 1,079 2.9%
Adjusted EBITDA 1,146 1,126 1.8%
Depreciation 482 495 -2.6%Amortization 210 209 0.5%
Operating expenses 2,385 2,503 -4.7%
Operating profit 418 375 11%
Net finance costs -106 -77 39%Share of profit of associates and joint ventures - 1 -30%
Profit before taxes 312 299 4.3%
Income tax -76 -64 19%
Profit after taxes 236 235 0.4%
Q2 2018 Results | Information Pack | Group results overview |

29
Group cash flow Q2 ’18 (continuing operations)
(€ m) Q2 ’18 Q2 ’17 y-on-y %EBITDA 555 550 1.0%Interest paid/received -43 -42 2.6%Tax paid/received -20 -13 54%Change in provisions1 -1 19 n.m.Change in working capital1 -15 -61 -76%Other movements 47 71 -34%
Net cash flow from operating activities 523 525 -0.4%
Capex -245 -235 4.1%Proceeds from real estate - - n.m.
Free cash flow 278 289 -3.8%
Coupon on perpetual hybrid - - n.m.
1 Excluding changes in deferred taxes Q2 2018 Results | Information Pack | Group results overview |

30
Group cash flow YTD ’18 (continuing operations)
(€ m) YTD ’18 YTD ’17 y-on-y %EBITDA 1,110 1,079 2.9%Interest paid/received -162 -196 -17%Tax paid/received -25 -13 87%Change in provisions1 8 27 -71%Change in working capital1 -98 -154 -37%Other movements 43 75 -42%
Net cash flow from operating activities 877 818 7.3%
Capex -481 -499 -3.8%Proceeds from real estate 5 - n.m.
Free cash flow 401 318 26%
Coupon on perpetual hybrid - - n.m.
1 Excluding changes in deferred taxes Q2 2018 Results | Information Pack | Group results overview |

31
Dutch mobile service revenues
Service revenues (€ m) Q2 ’18 Q2 ’17 y-on-y %Consumer 209 231 -9.2%
Business1 141 148 -5.0%
Other2 41 36 15%
KPN The Netherlands 391 414 -5.6%
1 Includes M2M service revenues2 Includes amongst others Wholesale mobile service revenues and visitor roaming
Q2 2018 Results | Information Pack | Group results overview |

32
Tax YTD ’18
P&L Cash flowRegions (€ m) YTD ’18 YTD ’17 YTD ’18 YTD ’17The Netherlands -76 -64 -25 -13Other -3 -2 -3 1Total reported tax -79 -66 -28 -12Of which discontinued operations -3 -2 -3 1
Reported tax from continuing operations -76 -64 -25 -13
Effective tax rate continuing operations 24.4% 21.4%
The effective tax rate for H1 ’18 is mainly influenced by one-off effects Without one-off effects1 the effective tax rate would have been ~23% in H1 ’18
For the 2018-2019 period, the effective tax rate is expected to be ~23%. This effective tax rate does not take into account planned changes to the Dutch corporate tax rate as this change has not yet been formalized in law
Q2 2018 Results | Information Pack | Tax |1 Amongst others, tax law changes, settlements with tax authorities, impairments, revaluations

1 KPN ADR Program2 CSR strategy3 Group results overview4 Group KPI overview5 Debt overview6 IFRS 157 Spectrum8 Fixed infrastructure9 Telefónica Deutschland stake
Contents

34
ConsumerFixed-Mobile KPIs
1,156 1,280 1,299
2,417 2,200
43%40%
Q1 ’18 Q2 ’18
44%
Q2 ’17
2,256
1,733 1,980
1,944 1,664
53%47%
Q1 ’18
1,934
Q2 ’18
54%
Q2 ’17
1,721
Fixed-Mobile household development Fixed-Mobile postpaid development
F-M penetration broadband base F-M penetration postpaid base
F-M households (k) Fixed-only households(k) F-M postpaid base (k) Mobile-only postpaid base (k)
Q2 2018 Results | Information Pack | Group KPI overview |

35
Consumer (cont’d)Residential KPIs
391384670
3,572
2,518
551
Q1 ’18
2,556
3,499
Q2 ’18
395
3,536
Q2 ’17
577
2,564
BundledNot bundled(PSTN & Digitenne)
Not bundled (BB only)
42 43 43
Q2 ’18Q1 ’18Q2 ’17
-8
8
41%40%
Q1 ’18Q2 ’17 Q2 ’18
-52
10
25
32%32%
Q2 ’17
10
Q1 ’18 Q2 ’18
1 Source: Telecompaper2 Corrected for migrations to and new customers of small business proposition (6k) launched in Q4 2017
Household base (k) ARPU per household (€)
Broadband IPTV
Net adds (k) Broadband market share1 Net adds (k) TV market share1
Q2 2018 Results | Information Pack | Group KPI overview |

36
Consumer (cont’d)Mobile KPIs
-50
-20
391
Q2 ’17
-10
-34
Q2 ’18Q1 ’18 Q2 ’18
20
Q2 ’17
18
Q1 ’18
18
208231
Q1 ’18 Q2 ’18
209
Q2 ’17
-9.2%y-on-y
Mobile net adds (k) Mobile postpaid ARPU (€)
Wireless service revenues (€ m)
Postpaid net adds Prepaid net adds Committed ARPU Non-committed ARPU
Service revenues
Q2 2018 Results | Information Pack | Group KPI overview |1 Adjusted for 15k migration to Business

37
Business
Total Mobile Multi play (mainly SME)
Fixed voice Broadband
Total Business mobile customer base (k)
Business mobile ARPU (€)
Multi play seats (k)1
ARPU per multi play seat (€)
Broadband lines (k)
Broadband ARPU (€)
2325
1,8581,834
Q2 ’18
1,865
23
Q2 ’17 Q1 ’18
3234
512391545
Q1 ’18 Q2 ’18
32
Q2 ’17
48471213
356422
503451
Q2 ’18
1148
515333
Q2 ’17 Q1 ’18
7370
283293
Q2 ’17 Q1 ’18 Q2 ’18
73
285
Q2 2018 Results | Information Pack | Group KPI overview |
Traditional Fixed voice customer base (k)
Traditional Fixed voice ARPU (€)
VoIP customer base (k)
VoIP ARPU (€)
1 Multi play seats consist of the total number of fixed voice lines plus the total number of mobile SIMs in multi play

1 KPN ADR Program2 CSR strategy3 Group results overview4 Group KPI overview5 Debt overview6 IFRS 157 Spectrum8 Fixed infrastructure9 Telefónica Deutschland stake
Contents

39
Debt portfolio
Hybrid bonds24%
Global bonds9%
Other2%
Euro bonds65%
GBP2
24%
USD2
15%
EUR61%
’28 32
0.6
’26
0.1
’21
0.6 0.6
’30
0.4
’19 ’23’18
1.1
0.5
’25’20
1.0
’22
0.6 0.60.5
’29
0.8
’24
0.9
USD hybrid (1st call) GBPEUR USD
EUR hybrid (1st call)GBP hybrid (1st call)
1 Based on the nominal value of interest bearing liabilities after swap to EUR, including EUR 1.1bn hybrid bond, GBP 400m hybrid bond and USD 600m hybrid bond
2 Foreign currency amounts hedged into EUR3 Excludes bank overdrafts
Breakdown nominal debt1 (total € 8.3bn) Nominal debt by currency
Bond redemption profile (€ bn) Fixed vs. floating interest3
Floating15%
Q2 2018 Results | Information Pack | Debt overview |
Fixed85%

40
Treatment of hybrid bonds
Each tranche of the hybrid bonds is recognized as 50% equity and 50% debt by the rating agencies
Definition of KPN net debt includes: ‘[…], taking into account 50% of the nominal value of any hybrid capital instrument’ Hybrid bonds are part of KPN’s bond portfolio Independent of IFRS classification In line with treatment by credit rating agencies
EUR tranche is a perpetual, accounted for as equity Coupon payments treated as equity distribution, hence
not expensed through P&L, not included in FCF, but in financing cash flow1,2
GBP and USD tranche have 60 years specified maturity, accounted for as financial liability Coupon payments treated as regular bond coupon,
hence expensed through P&L, included in FCF
1 EUR tranche had short first coupon payment (0.5 years was payable in September 2013), annual coupon payments in September thereafter; USD tranche has semi-annual coupon payments (March / September); GBP tranche has annual coupon payments in March
2 Cash flow item ‘Paid coupon perpetual hybrid bonds’
Tranche Nominal KPN net debt Maturity Rates (swapped)1 IFRS principal IFRS coupon
EUR 1.1bn 6.125% € 1,100m € 550mPerpetual (first-call
Sept-2018)6.125% Equity Financing cash flow2
(not incl. in FCF)
GBP 0.4bn 6.875% € 460m € 230m60 years (first-call
Mar-2020)6.777% Liability Interest paid
(incl. in FCF)
USD 0.6bn 7.000% € 465m € 233m60 years (first-call
Mar-2023)6.344% Liability Interest paid
(incl. in FCF)
Total € 2,025m € 1,013m
KPN & Credit rating agencies IFRS
Q2 2018 Results | Information Pack | Debt overview |

1 KPN ADR Program2 CSR strategy3 Group results overview4 Group KPI overview5 Debt overview6 IFRS 157 Spectrum8 Fixed infrastructure9 Telefónica Deutschland stake
Contents
42
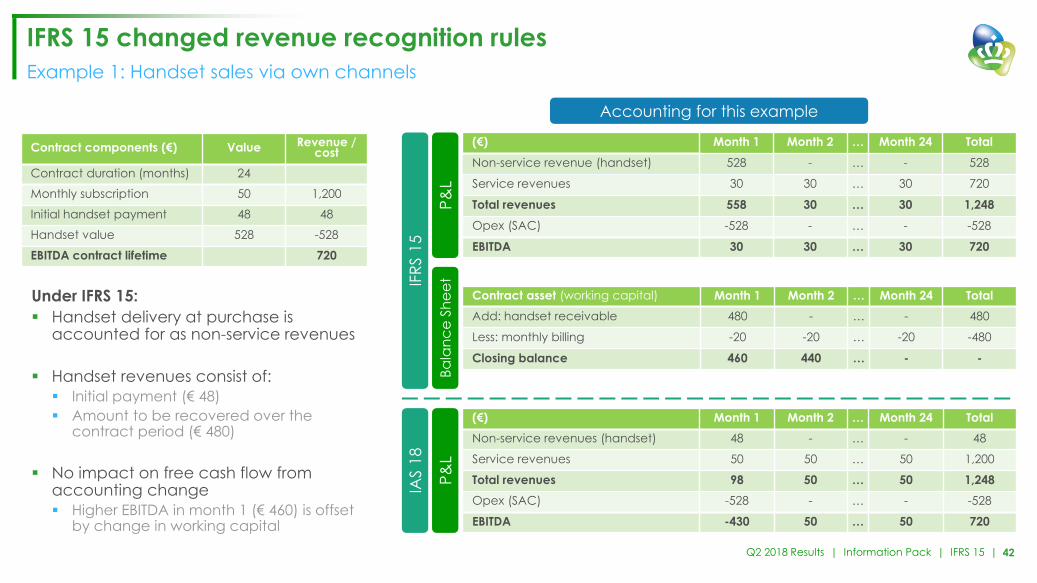
IFRS 15 changed revenue recognition rulesExample 1: Handset sales via own channels
IFRS
15
IAS
18
Accounting for this example
(€) Month 1 Month 2 … Month 24 TotalNon-service revenues (handset) 48 - … - 48
Service revenues 50 50 … 50 1,200
Total revenues 98 50 … 50 1,248Opex (SAC) -528 - … - -528
EBITDA -430 50 … 50 720
Contract components (€) Value Revenue / cost
Contract duration (months) 24
Monthly subscription 50 1,200
Initial handset payment 48 48
Handset value 528 -528
EBITDA contract lifetime 720
(€) Month 1 Month 2 … Month 24 TotalNon-service revenue (handset) 528 - … - 528
Service revenues 30 30 … 30 720
Total revenues 558 30 … 30 1,248Opex (SAC) -528 - … - -528
EBITDA 30 30 … 30 720
Contract asset (working capital) Month 1 Month 2 … Month 24 TotalAdd: handset receivable 480 - … - 480
Less: monthly billing -20 -20 … -20 -480
Closing balance 460 440 … - -
P&L
P&L
Under IFRS 15: Handset delivery at purchase is
accounted for as non-service revenues
Handset revenues consist of: Initial payment (€ 48) Amount to be recovered over the
contract period (€ 480)
No impact on free cash flow from accounting change Higher EBITDA in month 1 (€ 460) is offset
by change in working capital
Bala
nce
Shee
t
Q2 2018 Results | Information Pack | IFRS 15 |

43
IFRS 15 changed revenue recognition rules (cont’d)Example 2: Handset sales via third parties
IFRS
15
IAS
18
Accounting for this example
(€) Month 1 Month 2 … Month 24 TotalService revenues 50 50 … 50 1,200
Total revenues 50 50 … 50 1,200Opex (SAC) -600 - … - -600EBITDA -550 50 … 50 600
Contract components (€) Value Revenue / cost
Contract duration (months) 24
Monthly subscription 50 1,200
Dealer fee (handset) 480 -480
Dealer fee (subscription) 120 -120
EBITDA contract lifetime 600
(€) Month 1 Month 2 … Month 24 TotalService revenues 30 30 … 30 720
Total revenues 30 30 … 30 720Opex (SAC) -5 -5 … -5 -120
EBITDA 25 25 … 25 600
Contract asset (working capital) Month 1 Month 2 … Month 24 TotalAdd: handset receivable 480 - … - 480
Less: monthly billing -20 -20 … -20 -480
Closing balance 460 440 … - -
P&L
P&L
Bala
nce
Shee
t
Contract cost (non-current) Month 1 Month 2 … Month 24 TotalAdd: contract cost 120 - … - 120
Less: amortization -5 -5 … -5 -120
Closing balance 115 110 … - -
Under IFRS 15: At purchase, dealer fees are recognized
on the balance sheet Handset revenues and handset dealer fee
are no longer included in revenue and SAC
Dealer subscription fee is spread over the contract lifetime as SAC
No impact on free cash flow from accounting change Higher EBITDA in month 1 (€ 575) is offset by
change in working capital (contract asset) and change in provisions (non-current assets)
Q2 2018 Results | Information Pack | IFRS 15 |

1 KPN ADR Program2 CSR strategy3 Group results overview4 Group KPI overview5 Debt overview6 IFRS 157 Spectrum8 Fixed infrastructure9 Telefónica Deutschland stake
Contents

45
Spectrum in The Netherlands
800MHz(Paired)
Tele2 VodZig KPN2*30
2*10 2*10 2*10
900MHz(Paired)
VodZig KPN T-Mob2*35
2*10 2*10 2*15
1.8GHz(Paired)
KPN VodZig T-Mob2*70
2*20 2*20 2*30
2.1GHz(Paired)
VodZig KPN T-Mob KPN VodZig T-Mob2*59.4
2*14.6 2*14.8 2*10 2*5 2*5 2*10
2.6GHz(Unpaired)
T-Mob KPN Tele21*60
25 30 5
2.6GHz(Paired)
VodZig T-Mob KPN Tele22*65
2*30 2*5 2*10 2*20
TotalKPN VodZig T-Mob Tele2
578.8MHz169.6MHz 179.2MHz 165MHz 65MHz
Q2 2018 Results | Information Pack | Spectrum |

1 KPN ADR Program2 CSR strategy3 Group results overview4 Group KPI overview5 Debt overview6 IFRS 157 Spectrum8 Fixed infrastructure9 Telefónica Deutschland stake
Contents

47
Fixed infrastructure
Download speed Active inNetwork
~50Mbps
~100Mbps
~120Mbps
~240Mbps
~400Mbps
>1Gbps
~1Gbps
CO
CO
SC
ODF
SC
VDSL2
VDSL2 pair bonding
Vectoring
Bonded vectoring
Bonded VPLUS
NG.PON
FttH
SC
SC
Fiber Copper Q2 2018 Results | Information Pack | Fixed infrastructure |

1 KPN ADR Program2 CSR strategy3 Group results overview4 Group KPI overview5 Debt overview6 IFRS 157 Spectrum8 Fixed infrastructure9 Telefónica Deutschland stake
Contents
49
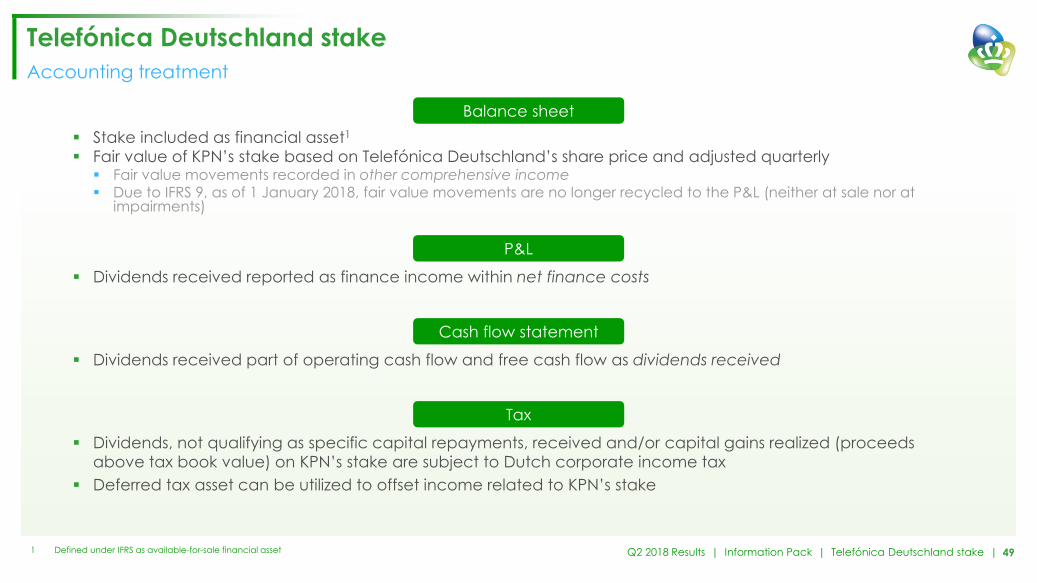
Telefónica Deutschland stakeAccounting treatment
Stake included as financial asset1
Fair value of KPN’s stake based on Telefónica Deutschland’s share price and adjusted quarterly Fair value movements recorded in other comprehensive income Due to IFRS 9, as of 1 January 2018, fair value movements are no longer recycled to the P&L (neither at sale nor at
impairments)
Dividends received reported as finance income within net finance costs
Dividends received part of operating cash flow and free cash flow as dividends received
Dividends, not qualifying as specific capital repayments, received and/or capital gains realized (proceeds above tax book value) on KPN’s stake are subject to Dutch corporate income tax
Deferred tax asset can be utilized to offset income related to KPN’s stake
1 Defined under IFRS as available-for-sale financial asset
Balance sheet
P&L
Cash flow statement
Tax
Q2 2018 Results | Information Pack | Telefónica Deutschland stake |