Embed Size (px)
Citation preview

1
Krause Fund Research Spring 2021
Stock Performance Highlights
Source: Krause Fund Model
FEDEX CORPORATION (NYSE: FDX) INDUSTRIALS RATING: BUY
Analysts: Carson Steffen Drake Evans Dee Le Target Price: $342-$389
March 26th, 2021
[email protected] [email protected] [email protected]
Investment Thesis
March 26th, 2021
We recommend a BUY rating for FedEx Corporation.
Drivers of Thesis:
❖ Currently monopolizing the Sundays and holiday
shipments.
❖ Strong e-commerce growth during and after the
COVID-19 pandemic elevates the demands for
shipping delivery services.
❖ Loosening of trade restrictions post-pandemic
increases revenue generated from international
transactions.
❖ Replacing old aircrafts and increasing uses of new
technology to optimize the Express and Ground
operations while reducing their costs.
Risks of Thesis:
❖ Low senior unsecured debt credit ratings potentially
decrease future access to capitals.
❖ Corporate tax hike adds more income tax expenses,
lowering profitability.
❖ Competition threats imposed by Amazon in the long
term.
Stock Performance Highlights
Current Price $281.34
52wk Range $103.40 - $305.66
Beta 1.032
Average Daily Volume 2.27 M
Share Highlights
Market Capitalization $75.16 B
Shares Outstanding 265.34 M
EPS (TTM) $11.36
P/E Ratio (TTM) 24.94
Dividend Yield 0.92%
Dividend Payout Ratio (most recent) 23.05%
Financial Ratios (2020)
Cash Ratio 0.47
Asset Turnover 0.27
Debt/Equity 2.06
ROE 7.03%
Operating Profit Margin 3.49%
ROA 1.75%
Dividend Payout Ratio 23.05%
Company Overview
FedEx Corp. is a global leader in providing integrated
freight & logistics services, based in Memphis,
Tennessee. They operate under four main segments:
FedEx Express, FedEx Ground, FedEx Freight, and
FedEx Services. Their FedEx Express unit is the world
largest transportation provider to 220 countries and
territories. FedEx maintains a fleet of over 680 aircrafts
and 183,000 vehicles. About 70% of their revenue is
generated in the United States.
EPS Forecasts
12 Months FDX Stock Performance VS. S&P500
2
Our group of analysts recommends a BUY rating for shares
of FedEx. Our predictions show an upside of 20% over the
next five years due to higher online consumption. Moving
forward, we believe that FedEx will become upgrade their
technology and become one of the most efficient package
service providers. The recent merger with TNT Express in
Europe will also make them a global leader in parcel delivery
services in the years to come. FedEx managed to keep their
delivery percentage higher than expected at the beginning of
the pandemic and we predict their revenue to get stronger.
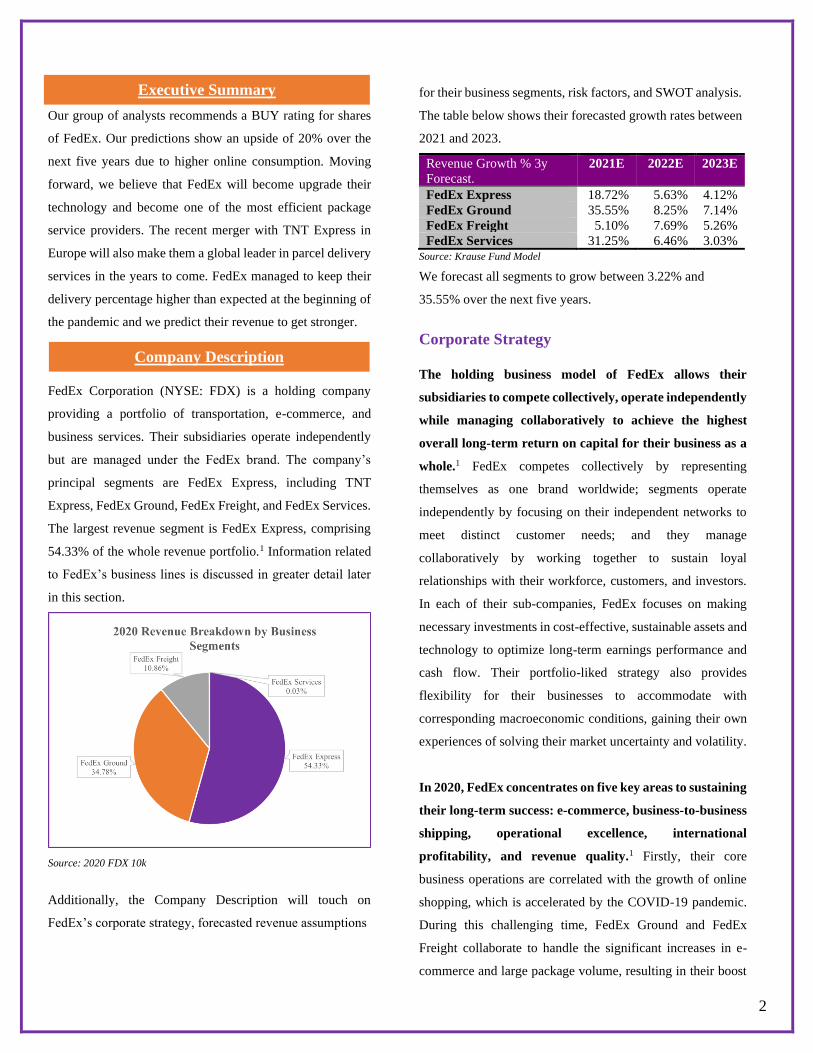
FedEx Corporation (NYSE: FDX) is a holding company
providing a portfolio of transportation, e-commerce, and
business services. Their subsidiaries operate independently
but are managed under the FedEx brand. The company’s
principal segments are FedEx Express, including TNT
Express, FedEx Ground, FedEx Freight, and FedEx Services.
The largest revenue segment is FedEx Express, comprising
54.33% of the whole revenue portfolio.1 Information related
to FedEx’s business lines is discussed in greater detail later
in this section.
Source: 2020 FDX 10k
Additionally, the Company Description will touch on
FedEx’s corporate strategy, forecasted revenue assumptions
for their business segments, risk factors, and SWOT analysis.
The table below shows their forecasted growth rates between
2021 and 2023.
Revenue Growth % 3y
Forecast.
2021E 2022E 2023E
FedEx Express 18.72% 5.63% 4.12%
FedEx Ground 35.55% 8.25% 7.14%
FedEx Freight 5.10% 7.69% 5.26%
FedEx Services 31.25% 6.46% 3.03% Source: Krause Fund Model
We forecast all segments to grow between 3.22% and
35.55% over the next five years.
Corporate Strategy
The holding business model of FedEx allows their
subsidiaries to compete collectively, operate independently
while managing collaboratively to achieve the highest
overall long-term return on capital for their business as a
whole.1 FedEx competes collectively by representing
themselves as one brand worldwide; segments operate
independently by focusing on their independent networks to
meet distinct customer needs; and they manage
collaboratively by working together to sustain loyal
relationships with their workforce, customers, and investors.
In each of their sub-companies, FedEx focuses on making
necessary investments in cost-effective, sustainable assets and
technology to optimize long-term earnings performance and
cash flow. Their portfolio-liked strategy also provides
flexibility for their businesses to accommodate with
corresponding macroeconomic conditions, gaining their own
experiences of solving their market uncertainty and volatility.
In 2020, FedEx concentrates on five key areas to sustaining
their long-term success: e-commerce, business-to-business
shipping, operational excellence, international
profitability, and revenue quality.1 Firstly, their core
business operations are correlated with the growth of online
shopping, which is accelerated by the COVID-19 pandemic.
During this challenging time, FedEx Ground and FedEx
Freight collaborate to handle the significant increases in e-
commerce and large package volume, resulting in their boost
Executive Summary
Company Description
3
in interim revenues between June 2020 and February 2021.2
Secondly, business-to-business shipping accounts for the
majority of FedEx revenue, which the corporation aims to
advances their service delivery quality and speed as demand
rises. Thirdly, FedEx is working on enhancing operations
while reducing costs by updating their businesses with better
technology. Also, they plan to reallocate their investments to
accommodate the pandemic protocols and shifting consumer
behaviors to improve revenue quality. FedEx reduced the
operation of some stores that belong to the FedEx Office
segment, while purchasing more assets for their major
segments, and health, safety equipment for the whole
business. 1 Lastly, with customers in more than 220 countries
and territories, FedEx earns more profit internationally
through their aircraft fleet modernization program, integration
of TNT Express, and streamlined services provided by FedEx
Express to the global market.
Here are some notable innovations that FedEx executed
during 2020 and early 2021:1.
❖ Expanding FedEx Ground residential delivery
operations to 7 days per week year-round for most
of the U.S. population, so there would be services
available even during holidays and weekends.
❖ Beginning testing of Roxo, the FedEx Same Day
Bot, in selected markets and collaborating with two
business partners to launch a pilot drone delivery
service as a potential solution for enhancing last-
mile residential delivery.
❖ Collaborating with Microsoft (Nasdaq “MSFT”
@microsoft) to create FedEx Surround, which
leverages data to provide near-real-time analytics
into shipment tracking using the logistics network of
FedEx and Azure, Dynamics 365 technology of
Microsoft.
❖ Progressing the FedEx Express/TNT Express
integration to improve their European ground
network.
❖ Continuing with the aircraft fleet modernization
strategy by replacing oldest and least efficient
aircraft with Boeing 777 Freighter (“B777F”)
aircraft and Boeing 767-300 Freighter (“B767F”)
aircraft to furtherly improve fuel efficiency and fleet
reliability.
❖ Launching FedEx Cares 50 by 50, their global
community engagement program to positively
impacting 50 million people by 2023
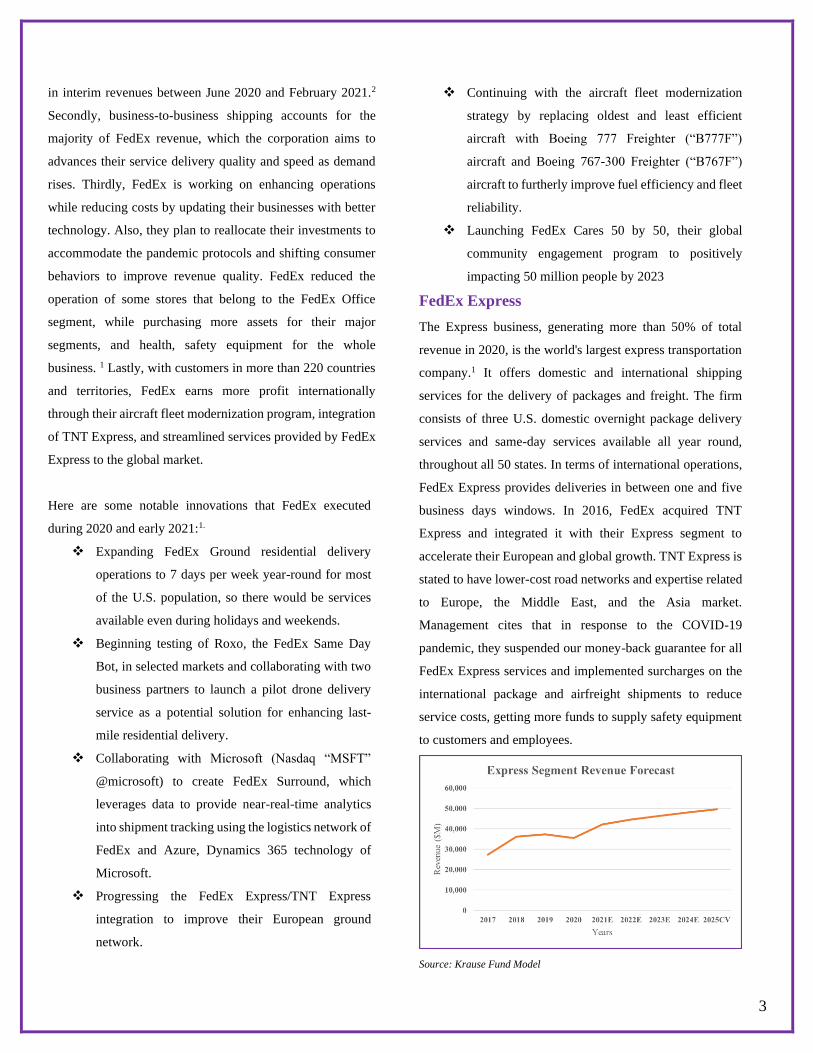
FedEx Express
The Express business, generating more than 50% of total
revenue in 2020, is the world's largest express transportation
company.1 It offers domestic and international shipping
services for the delivery of packages and freight. The firm
consists of three U.S. domestic overnight package delivery
services and same-day services available all year round,
throughout all 50 states. In terms of international operations,
FedEx Express provides deliveries in between one and five
business days windows. In 2016, FedEx acquired TNT
Express and integrated it with their Express segment to
accelerate their European and global growth. TNT Express is
stated to have lower-cost road networks and expertise related
to Europe, the Middle East, and the Asia market.
Management cites that in response to the COVID-19
pandemic, they suspended our money-back guarantee for all
FedEx Express services and implemented surcharges on the
international package and airfreight shipments to reduce
service costs, getting more funds to supply safety equipment
to customers and employees.
Source: Krause Fund Model

4
Our team projects a growth period for Express’s revenue
between 2021 and 2025, based on the booming of e-
commerce, TNT acquisitions, and FedEx’s aircraft fleet
modernization strategy. Our prediction of an 18.72% increase
in sales of this segment is deduced from the positive financial
results of the previous quarters of 2021.2 The pandemic
drives the demands for Express services as well as results in
favorable exchange rates for FedEx international business.
We believe the recovery from COVID-19 from the second
half of 2021 and loosening travel restrictions will lead to a
healthy rise of 5.63% in revenue. As FedEx continues with
their aircraft upgrade scheme and Indianapolis and Memphis
hub modernization, expansion programs that increase
productivity while lowering expenses,1 Express segment
would continue generating higher earnings.
FedEx Ground
The Ground segment generates more than 30% of total
revenue in 2020 from providing low-cost small-package
ground delivery services primarily in North America. 1 The
company recently integrated FedEx SmartPost, a business-to-
consumer package business that uses US Postal Service for
the final mile delivery, into this segment to keep pace with
higher demands for residential services. Management invests
more business resources into this segment during the
pandemic, increases hiring at FedEx Ground whilst making
temporary reductions in other workforces.
Source: Krause Fund Model
Historically, the Ground segment has higher annual growth
rates than the Express segment as it is less exposed to the
complex uncertainty and interconnectedness of the global
market. The 2021 interim reports show their strong earnings
performance due to large domestic package volumes and
safety supplies, vaccine distributions.2 From 2022, we
predict this segment’s revenue will grow between 7-8%.
Online shopping trends in North America will continue to
rise, sustaining the demands for Ground services.
FedEx Freight
FedEx Freight Segment offers less-than-truckload freight
services across all lengths of haul, including FedEx Freight
Priority and Economy services. 1 They contribute 10% of the
aggregate revenue. This business line is directly involved the
Express and Ground segments; hence, their revenue growth
rate is positively correlated with other major subsidiaries.
Management recently introduced FedEx Freight Direct,
which makes deliveries straight into homes to address the
needs for delivery of heavy, bulky products to residences and
businesses during the COVID-19 pandemic. The 2021
quarterly results of the Freight subsidiary emphasize the
increasing demands.2
We project the Freight segment revenue to rise steadily in the
next five years, resulting from comparable sales trend of
Express and Ground segments.
Source: Krause Fund Model
FedEx Services
Finally, the FedEx Services subsidiary offers sales,
marketing, technology supports, and other back-office

5
functions that support their transportation segments.1 This
unit includes FedEx Office and Print Services, providing
document and business services. The plummeting drop in
revenue between 2020 and 2021 is due to their accounting
approach alteration. Management allocates revenue and
operating expenses from the Services segment to other
respective operating segments to reflect their costs’ utility.
Source: Krause Fund Model
Again, the sales of this segment change accordingly with the
transportation businesses' revenue. Therefore, they are
predicted to rise slowly around 5% yearly, sharing the same
increasing trends with other subsidiaries.
Risk Factors
While FedEx expresses strong earnings performances
during the COVID-19 pandemic, they still face negative
impacts due to uncertainty and volatile conditions of the
domestic and global markets. One of the noted risks is the
disruption of global supply chains, interruption in economic
activity, and preventative measures that reduce international
sales and make it difficult for the company to predict
services’ demands.1 Additionally, the pandemic delays their
facility expansions, information technology initiatives, and
the TNT Express integration, postponing cost reduction and
revenue-boosting schemes that FedEx aims to implement.
Remote work arrangements also increase the enterprise
transporting hubs’ exposure to cyber risks and security
collapses, which lead to loss of critical confidential
information, adversely affecting their business reputation and
competitive advantages. When approaching the recovery
phase from the pandemic, FedEx’s financial results may
suffer due to challenges on tax positions from the Biden
administration, increasingly intensive competition, rising
fuel and vehicle prices, and volatility of costs and funding
requirements for employee benefits, especially pension and
healthcare benefit. These factors would incur more expenses,
reducing their net income in the future.
SWOT Analysis
Strengths
One of FedEx’s competitive advantages is their strong brand
recognition for their Express and Ground segments’
reliability, speed, and high-quality service. 1 Notably
speaking, FedEx Express is recognized as the largest express
provider in the world. Their Ground service is distinguishing
itself from its competitors due to their Sundays and holidays
residential deliveries to much of the domestic population.
FedEx’s holding strategy allows their sub-businesses to
utilize their market-specific expertise to cope with varying
economic conditions and meet distinct customers’ demands.
It also brings more flexibility in terms of reallocating capitals
among subsidiaries, based on their quick business
restructures in response to COVID-19. Additionally,
management emphasizes their technology-orientated goals,
including the utilization of drones, robots, as well as aircraft
fleets, and facilities modernizations. These improve FedEx’s
efficiency and decrease costs in the long run.
Weaknesses
Though the significant increase in the volumes of shipments
transported during the COVID-19 pandemic boosts the
demand for FedEx’s services, it can severely affect the
company’s profitability if capacity-demand is managed
poorly, as FedEx has high operating leverage due to heavy
investment in fixed assets. Other key weaknesses are their
liquidation problems as well as lower debt credit rating
compared to its strong rivals Amazon and UPS. Standard &
Poor’s has assigned them a senior unsecured debt credit
rating of BBB with an outlook of “negative,” while Moody’s

6
Investors Service has given a “negative” rating of Baa2. 1 The
company routinely grants credit to customers without
collateral, leading to high bad debt expense and hazardous
credit risk. Also, a lot of their debts have floating interest rate,
which is adversely impacted during volatile economic
conditions. If their credit ratings drop, they may have
difficulty utilizing the commercial paper market, resulting in
limitations to access to capital.
Opportunities
The continuing impacts of the COVID-19 pandemic drive e-
commerce sales, which increases the demand for FedEx
services, resulting in improved year-over-year revenue and
operating income for the remainder of 2021. The positive
e-commerce trend is projected to sustain even after post-
COVID-19, as the internet utilization rate increases during
shelters in places or work from home scenarios, leading to
people becoming more adjusted to the amenities provided by
technology. Additionally, the pandemic economic situation
makes the exchange rates more favorable for FedEx’s
international transactions. With the loosening of preventive
measures as well as global trading restrictions due to vaccine
recess, international sales are expected to boost. Moreover, if
FedEx successfully integrates the businesses and operations
of FedEx Express and TNT Express in the expected period
and cost, they will receive more demand from the European
markets; hence expanding their profitability.
Threats
To begin with, in the short run, rising variable accruals, labor
costs, and other costs related to the COVID-19 pandemic
would continue incurring in the remainder of 2021. Besides,
there will be headwinds related to the December 31, 2020,
expiration of the aviation excise tax holiday created by the
CARES Act and a higher effective income tax rate for the
second half of 2021. In March 2021, the Biden administration
was eyeing a major corporate tax hike to 28% from 21%,
which might lead to higher income tax expenses for FedEx.3
Secondly, the current government-related travel restrictions
make any expectations for the second half of 2021 to be
inherently less certain. Thirdly, as mentioned in our Risk
Factors section, cyber risk exposure during the pandemic
might harm their reputation, deteriorating their competitive
advantages. Overall, the company’s most prominent threat is
intense competition, posing by Amazon’s own shipping
delivery services. Amazon is aiming to expand its logistic
network and developing drone technology, which might
undermine FedEx in terms of pricing and speedy services.
World GDP
Source: International Monetary Fund (shown bigger in Appendix 1)
The global GDP has made significant rebounds since the
beginning of the COVID-19 pandemic. This heat map shows
first-quarter GDP changes by country around the world. The
dark green colors show higher growth change in GDP while
red stands for loss. This is an incredibly positive sign for all
business and economic sectors because it shows that the
world's economy is growing which will lead to business-to-
business growth all around the world.
U.S. GDP
Source: Bureau of Economic Analysis
Economic Outlook

7
This chart shows RGDP percentage change each quarter for
the last four years and into 2021. The US shows an increase
in Real GDP of 4.6% after the first quarter of 2021 while we
still work our way through the pandemic. With a vaccine now
being vastly distributed and implemented throughout the
country capital markets and economies are slowly moving
back to full functionality which we assume will lead to even
further GDP growth throughout the rest of the year.
COVID-19 Impacts
While economies and global GDP have rebounded from the
pandemic there is still concern as to variants in COVID and
the lasting effects of the vaccine. One of which has just been
recalled for a rare blood clotting. If there was a variant that
was not susceptible to the antibodies being administered right
now, we could be heading for another shut down or the
slowing of production for business and reversing the progress
the world has been making over the past 6 months.
Consumer Spending
Consumer spending has been down throughout the pandemic
as people have been prepared for the worst. However, these
numbers have increased as stimulus has been distributed
throughout the country and people have been spending the
stimulus money if they did not exactly need it to cover living
expenses.
Interest Rates
A big concern with the cost of borrowing and interest rates
has resurfaced as the stimulus brought into the economy is
going to have to be paid and stopped sometime in the future.
While we do not know exactly when this is coming, it will
certainly have an impact on most companies and the
economies of the world. The 10yr, 20yr, and 30yr Treasury
yields have already slightly from the beginning of the
pandemic and will continue to rise going forward. This will
increase the cost of borrowing for many companies, such as
FedEx who borrows a large amount of money for the
allocation of new airplanes and other vehicles for their air and
express cargo.
Industry Description
FedEx is a part of the Integrated Freight & Logistics industry
within the Industrials sector. Integrated Freight & Logistics can
be broken down into 5 subcategories: Logistics Services, Air and
Express Delivery Services, Freight Rail, Maritime, and Trucking.
FedEx is a part of all subcategories excluding maritime.
Source: Fred Economic Data (Shown larger in Appendix 2)
Producer Price Index: Air and Express Delivery
Services
This graph is the average production price for the air and
express delivery services industry from 1994 to 2020.11 There
has been 320% growth in the price of these services over the
past 25 years. This shows that industry has steadily grown
with the economy and inflation and the companies that
deliver these services are healthy. FedEx was the North
American Leader for both freight cargo deliveries and air
cargo deliveries in 2020.
Industry Lifecycle
The main subcategories that FedEx falls under in the Air &
Freight Logistics industry are very cyclical. This is because
this industry requires the demand for consumers and
businesses to be buying and shipping products. If the
economy is in a recession or is consumer spending is lower
than this lowers the potential revenue for companies like
FedEx in this industry.
Industry Analysis

8
Industry Trends
Technology
There are many ways that FedEx and its competitors must
look at to outpace the competition in delivering product faster
and more efficient. Drone technology has been the biggest
advancement for ground and expedited delivery services that
has been in the works for years now. The freight industry has
been looking to convert their coal emitting rails into hydrogen
fuel cell rails making the deliveries more efficient and better
for the environment. Another leading technology that is not
too far from being put into use is the use of biofuels instead
of rocket fuels for jet engines. This would significantly
reduce the cost of air delivery companies like FedEx and
leave a lot of capital to buy more planes with the same
capabilities. Another advancement being made is the use of
electric or hydrogen powered trucks that could one day be
self-driving which would also significantly reduce the cost of
companies that have primary expenses being the amount of
employees that they have.
Social Changes
Consumers and Investors have become increasingly
concerned with the use of sustainable component in all
aspects of the business model. Going forward, we will see a
lot of these logistics companies pushing for advancements in
the efficiency in the vehicles that they use along with the
environmental impact that the vehicles they use have. The
companies that can become the most sustainable will be the
ones that people lean toward using. Not only will this lead to
more business, but also to lower costs if there are
governmental changes that require these companies to have
lower emissions or are subsidized for being ahead of the
competition when it comes to the use of renewable energy.
Government
As mentioned above, Government could have a lasting
impact on how companies in this industry are allowed to
operate. Depending on trade policies with foreign countries
the demand for international package transportation services
could be highly volatile which could both positively and
negatively impact potential revenue for FedEx. More
regulation that will be coming into effect in the future will
drone policy. California recently became the first state to
allow the use of drones for delivery. If many other states,
follow, or federal policy was put in place to allow the use of
drones for delivery FedEx could potentially see exceedingly
high revenue numbers if they were able to implement drones
into their services. However, if big competitors like Amazon
implement these services before FedEx this could lead to an
exceptionally large decrease in market share for the FedEx
segment all around.
Demographics
The demand for truck driver for FedEx’s ground delivery
have increased in recent years as the amount of truck drivers
in the United States has begun to decrease. This will lead to
a higher pay for the retained driver and higher operating
expenses for the company. The idea of self-driving electric
vehicles has also become more relevant with the emergence
of companies like Tesla and Nikola who forecast there will
be fully self-automated trucking available to service
companies like FedEx by the year 2024. While this would
help in no longer needing as many drivers as possible or
employees and effectively lowering the cost of operating
expenses, FedEx would now have to invest in more Property,
Plant, and Equipment which may be more costly for the
company and create liquidity issues.
Porter’s Five Forces
Degree of Rivalry/Competition: High
There is a remarkably elevated level of competition in the Air
& Freight Logistics industry. UPS and Amazon have
extremely high market capitalizations and large market
shares as well. The Unites States Postal Service is also a key
competitor however, they rely on FedEx to transport most of
their air and freight deliveries. However, those two
subcategories are FedEx’s strongholds where they are the
North American leader for both Air and Freight delivery.

9
UPS and Amazon pose the most threat to FedEx’s ground
deliveries.
Bargaining Power of Customers: Low
The bargaining powers of customers in the industry is low
since there are only a few substitutes usually offering the
same prices for the same service. What also needs to be
considered is that when consumers are buying product from
businesses, they are only usually offered one or two
companies for their potential delivery service providers.
Bargaining Power of Suppliers: Medium
Boeing, Cessna, and Airbus are the three suppliers of air
couriers for FedEx. While Freightliner, Dodge, Mercedes-
Benz, and Volkswagen make up its suppliers of trucks for
ground services. This shows that FedEx has some options
when it comes to choosing a supplier for its ground services
and may be able to lower cost for capital expenditures in that
business segment. However, there a limited aerospace
manufacturing companies in the market which means FedEx
must spend large amount of capital or take on debt at the
amount the suppliers want for their vehicles.
Threats of Substitutes: High
There is a prominent level of threat for substitutes in this
industry mostly coming from FedEx’s largest competitors in
UPS and the rise of Amazon. These companies are constantly
competing for business are always looking to lower rates for
companies and speed up shipping times where they can.
These companies also offer the similar rates and delivery
times.
Threats of New Entrants: Low
While the emergence of Amazon is a prime example of a new
entrant to the delivery service market this is a rare occurrence
because of the other services that Amazon already offers. It
would be difficult for a new company to emerge in this
already highly competitive and saturated market. The amount
of PPE and infrastructure needed to compete with FedEx,
UPS, and Amazon would be hard for a new company to
acquire and be able to offer the same delivery speeds and
pricing.
Source: FactSet
*Note: Amazon market cap ($1.7T) too large to include.
Source: FactSet
In the freight and logistics sub-industry, Property, Plant, and
Equipment is incredibly significant. Machinery and
equipment take up an exceptionally sizable percentage of
capital expenditures (47% for FedEx in 2020).2 This sub-
industry also saw a 56% increase in Net PP&E from 2019 to
2020. We included the graphs above to show FedEx in
comparison to its competitors to help forecast the future.
PP&E as a percent of total assets help display which
companies can expand domestically and internationally due
to machinery and equipment making up a large amount of
these companies PP&E. Also, this is a great indication of
which companies would be able to satisfy drastic increases in
Comparative Analysis

10
deliveries/services. As far as market capitalization, FedEx is
second largest in the industry with UPS being the largest.
Although Amazon is in a different industry, we included it in
the second chart above because many segments of their
business overlap into the same sub-industry. FedEx differs
itself from its competitors with their air fleet. They have
nearly double the air fleet of UPS leading their pricing to be
cheaper in time-sensitive delivery. FedEx also operates under
multiple networks (Express, Ground, Services, etc.) while
UPS and many of the other competitors operate as one. FedEx
also uses independent contractors for a substantial part of its
ground transportation. FedEx’s large air freight footprint is
allowing them to grow a lot faster than many of its
competitors internationally.
United Parcel Service (UPS)
UPS engages in the transportation, distribution, ground
freight, air freight, ocean freight and other logistics services.
UPS is mostly known for its specialization in ground
delivery services. UPS is the world leader in logistics with
FedEx as a close second. As opposed to FedEx, UPS uses
its own employees for all deliveries and no independent
contractors.7 UPS is a direct competitor to FedEx, and we
forecast it to continue to be. UPS is currently focusing in on
small/medium sized businesses, international markets, and
health care.5 Like FedEx, UPS currently services over 220
countries and territories.
Expeditors International of Washington (EXPD)
EXPD engages in air and air freight services as well as
temperature-controlled transit, cargo insurance, and other
logistics services. EXPD had a 2020 quarter of 55% revenue
growth compared to that of the same quarter of the previous
year.8 With this growth it is possible for EXPD to become a
bigger competitor of FedEx in coming years.
J.B. Hunt Transport Services (JBHT)
JBHT offers logistical services such as intermodal freight
operations for rail carriers as well as private fleet conversion
and final-mile delivery services.
XPO Logistics (XPO)
XPO is a trucking company that operates in two segments.
Their transportation segment engages in freight brokerage,
full truckload, less-than-truckload, last mile, and global
forwarding services. The logistics segment engages in
warehousing and distribution, inventory solutions, and other
contract logistics services.
C.H. Robinson Worldwide (CHRW)
CHRW engages in freight transporting services through
their two segments: North American Surface Transportation
and Global Forwarding.
Amazon (AMZN)
Amazon is known worldwide for their online retail shopping
services. Increasingly, Amazon is taking market share in the
logistics industry. In this recent month, “Amazon added 15
cargo planes totaling 70 in the air by mid-2021.”
Comparingly, FedEx has 680 cargo planes ten times that of
Amazon. However, Amazon has an average “click-to-door"
time of 3.2 days while the average of the freight and logistics
industry is 4.3 days.6 In response to Amazon’s insane growth,
in mid-2019 FedEx ended its service contract with Amazon.
With FedEx working on autonomous delivery robots and
Amazon working on their autonomous delivery drones, it is
going to be increasingly competitive in this industry.
Revenue
As addressed in the Company Description, we anticipate that
all FedEx’s main segments’ revenues will increase
throughout five years, leading to an overall rise in total sales
from $65,370 million in 2020 to $100,385 million in 2025.
Valuation Analysis

11
The bar chart below depicts our forecasted numbers,
portraying a steady rise in the future. The most prominent
revenue growth will occur between 2020 and 2021, because
of the major boost in online shopping in the domestic
markets. FedEx will continue with its growth, if they keep
pursuing the TNT Express integration, upgrading their fixed
assets, and implementing innovations into their operations.
Their growth rates may face declining threats due to the
Biden administration’s tax hike scheme, 3 additional
competition, and capital-intensive investments in technology.
Source: Krause Fund Model
Operating Expense
Except for 2021, we project the 2022-2024 operating
expenses as 94% of their corresponding total revenues. We
computed this percentage from taking the historical average
of the prior ten years' operating expenses as proportions of
the total revenues. The sales and operating expenses are
positively correlated with each other, as FedEx’s strategy
demands them to immediately pay for their costs incurred by
the fixed assets and reinvest their earnings into modernizing
and purchasing new machinery. In 2021, the quarterly results
suggest that there was a substantial rise in the operating
expense due to the extra costs for compensating employees,
buying medical supplies, and losses caused by the COVID-
19 pandemic. We assume the average of 2021 first three
quarters operating expenses to be the figure for the last
interim, then sum them together to get the 2021 number.
Therefore the 2021 operating expense equals 98.44% of total
sales instead of 94%.
Cost of Equity
Risk-Free Rate 1.67%
Beta 1.032
Equity Risk Premium 4.26%
Cost of Equity 6.07%
Source: Krause Fund Model
We use the CAPM model to calculate the cost of equity. Our
risk-free rate is from the 10-year US Treasury Note rate. The
beta value is taken from the Bloomberg Terminal's 2-year
raw figure, plotted weekly. Finally, the equity risk premium
is referred from professor Damodaran’s spreadsheets, which
include the implied, COVID-19 adjusted rate as of April
2021. Together, we derive a cost of the equity value of 6.07%.
Cost of Debt
Risk-Free Rate 1.67%
Implied Default Premium 0.74%
Pre-Tax Cost of Debt 2.41%
Marginal Tax Rate 25.82%
After-Tax Cost of Debt 1.79%
Source: Krause Fund Model
The pre-tax cost of debt is pulled from the FINRA website,
which lists out most of FedEx bonds. We select a contract
that expires in 2030, the one that has the closest horizon to 10
years and use its yield as our pre-tax cost of debt. Our
marginal tax rate is computed as the sum of FedEx’s
Statutory tax, state and local tax, and foreign income tax, then
dividing it by the corresponding income before tax. We then
anticipate that the future tax rates will be the same as the 2020
rate. Finally, we get an after-tax cost of debt of 1.79%.
WACC
To derive the WACC, we first calculate the equity and debt
weights. The market value of FedEx’s equity is computed by
multiplying the total number of shares outstanding by the
current stock price, which gives us $73.430 B. By adding all
the interest-bearing debts with the PV of operating leases, we
have a market value of debt figure of $37.522 B. These lead

12
to the weights of equity and debt being 66.18% and 33.82%
respectively. Finally, we get a WACC of 4.62%.
Models
Models Price
DCF/EP $388.70
DDM $342.18
P/E (Rel_EPS) $286.91
PEG (Rel_EPS) $363.93
Source: Krause Fund Model
The P/E relative valuation model has the price that is closest
to the current price of $281.34. All the peers used in the
model have a lower price than FedEx; however, their average
P/E is higher, which makes the overall estimate more
consistent. Both DCF/EP and DMM show the higher price
than FedEx’s market price, showing that the company’s
fundamental values have been underestimated by the market.
This would suggest a buy signal for contrarian investors.
Beta vs Equity Risk Premium
We compared our two year weekly average beta against
Damodaran’s equity risk premium calculation to test for
sensitivity in FedEx’s stock price from factors compared to the
overall stock market. We chose a two-year average weekly
beta instead of a five-year because we felt the five year was
not a correct representation of the average beta due to
volatility after changing corporate strategy and the acquisition
TNT. As you can see in the table above, changes in both the
beta and the equity risk premium do not cause a substantial
change in stock price. We find this to be a sign of how stable
FedEx is as a company.
CV Growth % of NOPLAT vs. Marginal Tax Rate
We next compared the CV growth % of NOPLAT against the
marginal tax rate to see how the stock price would respond in
times of change in tax. This is especially important because
with there being a new party in office, there could be a
tremendous change in marginal taxes affecting FedEx. We
tested this against CV % of growth to also see how much the
price would be affected when growing NOPLAT with
different tax levels. We forecasted conservatively in our
NOPLAT CV growth, using GDP growth of 3.1%, so this
testing will example prices at higher NOPLAT growth.
Pre-tax cost of Debt vs. Risk-free Rate
We then compared the pre-tax cost of debt calculated by
taking the rate of a 10-year FedEx bond against the risk-free
rate calculated from the rate on a 10-year US Treasury bond.
We chose these two variables due to the enormous impact they
have in the WACC which the changes of lead onto our DCF
and EP models. As portrayed in the chart above, a change in
the risk-free rate minimally affects the forecasted price.
However, a change in the pre-tax cost of debt causes a drastic
change in stock price. This is because FedEx holds 34%
market value of debt.
CV Growth of EPS vs. CV ROE
We compared CV Growth of EPS to CV ROE to test
sensitivity in our DDM model. We felt that these two variables
would be the most significant to test against each other since
they are massive parts of the DDM calculation. As expected,
changes in growth of EPS cause large price changes in the
forecasted stock price while changes in ROE cause only slight
changes in stock price.
WACC vs. CV ROIC
Lastly, we compared the WACC against the CV ROIC due to
their significant impact in our valuations. The WACC as well
as the CV ROIC are used to calculate the DCF and the EP
valuation methods. As shown in the chart above, the WACC
effects the stock price about three times more than the CV
ROIC when increasing/decreasing it by .1%. The highest price
was yielded from the lowest WACC with the highest ROIC as
we expected. We specifically wanted to test these two
variables because we believe it is quite possible for the WACC
to change due interest rates rising and the CV ROIC to change
due to the many ways Invested Capital or NOPLAT can
fluctuate.
Sensitivity Analysis

University of Iowa Krause Fund 13
1. FedEx 10K 2020
2. FactSet - FedEx
3. Bloomberg – Biden Administration tax hike
4. Thomson Reuters - XPO Logistics Inc Profile
5. UPS – Investors Relations
6. GeekWire - the next AWS
7. Diffen - FedEx vs UPS
8. CSIMarket - EXPD Growth Comparisons
9. Bureau of Economic Analysis – GDP
10. IMF – Real GDP Growth % Change
11. Fred Economic Data - Producer Price Index by
Industry
12. Bureau of Economic analysis – Personal Income and
Outlays, Feb. 2021
13. Data Source
a) FactSet – Model
b) Damodaran – Model
c) Bloomberg Terminal – Model
d) FINRA Bond Data - Model
c) Yahoo! Finance – Tear Sheet Chart and data
References

University of Iowa Krause Fund 14
Appendix 1. Bureau of Economic Analysis – GDP
Appendix 2. Fred Economic Data - Producer Price Index by Industry
Appendix

University of Iowa Krause Fund 15
Important Disclaimer
This report was created by students enrolled in the Security
Analysis (6F:112) class at the University of Iowa. The report
was originally created to offer an internal investment
recommendation for the University of Iowa Krause Fund and
its advisory board. The report also provides potential
employers and other interested parties an example of the
students’ skills, knowledge, and abilities. Members of the
Krause Fund are not registered investment advisors, brokers
or officially licensed financial professionals. The investment
advice contained in this report does not represent an offer or
solicitation to buy or sell any of the securities mentioned.
Unless otherwise noted, facts and figures included in this
report are from publicly available sources. This report is not a
complete compilation of data, and its accuracy is not
guaranteed. From time to time, the University of Iowa, its
faculty, staff, students, or the Krause Fund may hold a
financial interest in the companies mentioned in this report.

FedEx CorporationSensitivity Tables
388.70 0.43 0.63 0.83 1.03 1.23 1.43 1.63 342.18 2.20% 2.40% 2.60% 2.80% 3.00% 3.20% 3.40%3.36% 379.74 381.79 383.83 385.89 387.90 389.94 391.97 13.45% 284.33 294.12 305.05 317.32 331.18 346.98 365.15 3.66% 380.13 382.36 384.58 386.83 389.02 391.24 393.45 15.45% 291.25 302.09 314.18 327.75 343.09 360.57 380.68 3.96% 380.53 382.93 385.34 387.76 390.14 392.53 394.93 17.45% 296.59 308.23 321.22 335.79 352.27 371.05 392.64 4.26% 380.92 383.51 386.09 388.70 391.26 393.83 396.40 19.45% 300.83 313.11 326.81 342.18 359.56 379.37 402.14 4.56% 381.31 384.08 386.85 389.64 392.37 395.12 397.87 21.45% 304.28 317.08 331.36 347.38 365.50 386.14 409.88 4.86% 381.70 384.66 387.60 390.58 393.49 396.42 399.35 23.45% 307.14 320.37 335.13 351.69 370.42 391.75 416.29 5.16% 382.10 385.23 388.36 391.51 394.60 397.71 400.82 25.45% 309.56 323.15 338.31 355.33 374.56 396.48 421.69
388.70 2.80% 2.90% 3.00% 3.10% 3.20% 3.30% 3.40% 388.70 4.32% 4.42% 4.52% 4.62% 4.72% 4.82% 4.92%22.82% 339.46 354.14 370.63 389.29 410.58 435.10 463.63 6.04% 502.60 448.49 402.01 361.67 326.32 295.09 267.30 23.82% 339.28 353.96 370.44 389.10 410.38 434.89 463.41 6.14% 514.33 459.29 412.01 370.97 335.01 303.25 274.99 24.82% 339.10 353.77 370.25 388.90 410.17 434.67 463.19 6.24% 525.68 469.74 421.69 379.98 343.43 311.15 282.42 25.82% 338.92 353.59 370.06 388.70 409.97 434.46 462.96 6.34% 536.67 479.86 431.06 388.70 351.59 318.80 289.62 26.82% 338.75 353.40 369.87 388.51 409.77 434.25 462.74 6.44% 547.32 489.67 440.14 397.15 359.49 326.21 296.60 27.82% 338.57 353.22 369.68 388.31 409.56 434.03 462.52 6.54% 557.65 499.17 448.95 405.35 367.14 333.40 303.37 28.82% 338.39 353.04 369.49 388.11 409.36 433.82 462.29 6.64% 567.67 508.39 457.49 413.29 374.57 340.36 309.93
388.70 1.81% 2.01% 2.21% 2.41% 2.61% 2.81% 3.01%0.77% 367.20 373.55 379.90 386.31 392.60 398.95 405.30 1.07% 367.95 374.32 380.68 387.11 393.41 399.78 406.14 1.37% 368.70 375.08 381.46 387.91 394.22 400.60 406.98 1.67% 369.45 375.85 382.24 388.70 395.03 401.43 407.82 1.97% 370.20 376.61 383.02 389.50 395.84 402.25 408.66 2.27% 370.95 377.38 383.80 390.29 396.65 403.08 409.50 2.57% 371.70 378.14 384.58 391.09 397.46 403.90 410.34
Ris
k-F
ree
Ra
te
Beta CV Growth of EPS
Eq
uity
Ris
k P
rem
ium
CV
Ye
ar
RO
E
WACC
Ma
rgin
al T
ax
Ra
te
CV
RO
IC
CV Growth % of NOPLAT
Pre-Tax Cost of Debt

FedEx CorporationRevenue Decompositionin $ million / millions of packagesFiscal Years Ending May.31 2017 2018 2019 2020 2021E 2022E 2023E 2024E 2025CV
Express Segment Average Daily Package Volume (Domestic) 2.726 2.729 2.901 2.808 3.910 4.164 4.260 4.459 4.553
Package Volume (Domestic) 994.990 996.085 1,058.865 1,027.728 1,427.150 1,519.915 1,554.873 1,631.944 1,661.663
Average Daily Package Volume (International) 2.424 2.454 2.471 2.337 2.429 2.475 2.492 2.545 2.563
Package Volume (International) 884.760 895.710 901.915 855.342 886.585 903.430 909.483 931.400 935.338
Total Net Sales 27,358 36,172 37,331 35,513 42,162 44,536 46,371 48,017 49,563
% Growth 3.43% 32.22% 3.20% -4.87% 18.72% 5.63% 4.12% 3.55% 3.22%
Ground Segment Average Daily Package Volume 7.896 8.336 8.952 9.997 11.810 12.572 13.381 14.594 15.222
Package Volume 2,882.040 3,042.640 3,267.480 3,648.905 4,310.816 4,588.864 4,883.928 5,326.900 5,555.957 Total Net Sales 18,075 18,395 20,522 22,733 30,814 33,356 35,738 38,700 41,541 % Growth 9.06% 1.77% 11.56% 10.77% 35.55% 8.25% 7.14% 8.29% 7.34%Freight Segment Total Net Sales 6,443 6,812 7,582 7,102 7,464 8,038 8,461 8,867 9,244
% Growth 3.92% 5.73% 11.30% -6.33% 5.10% 7.69% 5.26% 4.80% 4.25%
Services Segment Total Net Sales 1,621 1,650 1,691 22 32 34 35 36 37 % Growth 1.76% 1.79% 2.48% -98.70% 31.25% 6.46% 3.03% 3.54% 3.16%
Total Business Segment Sales 60,898 63,029 67,126 65,370 80,472 85,964 90,604 95,620 100,385
% Growth 19.84% 3.50% 6.50% -2.62% 18.77% 6.39% 5.12% 5.25% 4.75%

FedEx CorporationIncome Statementin $millionsFiscal Years Ending May.31 2017 2018 2019 2020 2021E 2022E 2023E 2024E 2025CV
Total revenue 60,319 65,450 69,693 69,217 80,472 85,964 90,604 95,620 100,385
Total operating expenses -55,753 -61,178 -65,227 -66,800 -79,213 -81,081 -85,463 -90,265 -94,844
Salaries and employee benefits -21,989 -23,795 -24,776 -25,031 -30,894 -31,549 -33,252 -35,093 -36,841
Purchased transportation -13,630 -15,101 -16,654 -17,466 -22,046 -20,545 -21,564 -22,758 -23,892
Rentals and landing fees -3,240 -3,361 -3,360 -3,712 -4,302 -4,212 -4,440 -4,685 -4,919
Depreciation and amortization -2,995 -3,095 -3,353 -3,615 -3,789 -4,401 -4,734 -5,068 -5,401
Fuel -2,773 -3,374 -3,889 -3,156 -2,798 -3,954 -4,168 -4,399 -4,618
Maintenance and repairs -2,374 -2,622 -2,834 -2,893 -3,273 -3,782 -3,987 -4,207 -4,417
Asset impairment charges 0 -380 0 -435 0 0 0 0 0
Business realignment costs 0 0 -320 0 -10 0 0 0 0Other -8,752 -9,450 -10,041 -10,492 -12,101 -12,637 -13,319 -14,056 -14,757
Total operating income / loss 4,566 4,272 4,466 2,417 1,259 4,883 5,142 5,355 5,541
Total other expense / income 13 -517 -3,811 -748 229 -521 -577 -639 -693
Interest, net -479 -510 -529 -617 -508 -521 -577 -639 -693
Interest expense -512 -558 -588 -672 -572 -603 -643 -689 -737
Interest income 33 48 59 55 64 82 65 50 44
Other retirement plans income 471 598 -3,251 -122 737 0 0 0 0
Other, net 21 -7 -31 -9 0 0 0 0 0
Income before income taxes 4,579 4,353 655 1,669 1,488 4,362 4,564 4,716 4,848Provision for income taxes -1,582 219 -115 -383 -342 -1,003 -1,050 -1,085 -1,115
Net income / loss 2,997 4,572 540 1,286 1,146 3,359 3,515 3,631 3,733
Per ShareEPS 11.07 16.79 2.03 4.90 4.35 13.15 14.09 14.95 15.36
Basic Shares Outstanding 266 267 262 261 267.67 263.17 255.45 249.49 242.96
Dividends per Share 1.60 2.00 2.60 2.60 2.62 2.87 3.16 3.28 3.58

FedEx CorporationCommon Size Income Statement% of sales Fiscal Years Ending May.31 2017 2018 2019 2020 2021E 2022E 2023E 2024E 2025CV
Total revenue 100.00% 100.00% 100.00% 100.00% 100.00% 100.00% 100.00% 100.00% 100.00%
Total operating expenses -92.43% -93.47% -93.59% -96.51% -98.44% -94.32% -94.33% -94.40% -94.48%
Salaries and employee benefits -36.45% -36.36% -35.55% -36.16% -38.39% -36.70% -36.70% -36.70% -36.70%
Purchased transportation -22.60% -23.07% -23.90% -25.23% -27.40% -23.90% -23.80% -23.80% -23.80%
Rentals and landing fees -5.37% -5.14% -4.82% -5.36% -5.35% -4.90% -4.90% -4.90% -4.90%
Depreciation and amortization -4.97% -4.73% -4.81% -5.22% -4.71% -5.12% -5.23% -5.30% -5.38%
Fuel -4.60% -5.16% -5.58% -4.56% -3.48% -4.60% -4.60% -4.60% -4.60%
Maintenance and repairs -3.94% -4.01% -4.07% -4.18% -4.07% -4.40% -4.40% -4.40% -4.40%
Asset impairment charges 0.00% -0.58% 0.00% -0.63% 0.00% 0.00% 0.00% 0.00% 0.00%
Business realignment costs 0.00% 0.00% -0.46% 0.00% -0.01% 0.00% 0.00% 0.00% 0.00%Other -14.51% -14.44% -14.41% -15.16% -15.04% -14.70% -14.70% -14.70% -14.70%
Total operating income / loss 7.57% 6.53% 6.41% 3.49% 1.56% 5.68% 5.67% 5.60% 5.52%
Total other expense / income 0.02% -0.79% -5.47% -1.08% 0.28% -0.61% -0.64% -0.67% -0.69%
Interest, net -0.79% -0.78% -0.76% -0.89% -0.63% -0.61% -0.64% -0.67% -0.69%
Interest expense -0.85% -0.85% -0.84% -0.97% -0.71% -0.70% -0.71% -0.72% -0.73%
Interest income 0.05% 0.07% 0.08% 0.08% 0.08% 0.10% 0.07% 0.05% 0.04%
Other retirement plans income 0.78% 0.91% -4.66% -0.18% 0.92% 0.00% 0.00% 0.00% 0.00%
Other, net 0.03% -0.01% -0.04% -0.01% 0.00% 0.00% 0.00% 0.00% 0.00%
Income before income taxes 7.59% 6.65% 0.94% 2.41% 1.85% 5.07% 5.04% 4.93% 4.83%Provision for income taxes -2.62% 0.33% -0.17% -0.55% -0.43% -1.17% -1.16% -1.13% -1.11%
Net income / loss 4.97% 6.99% 0.77% 1.86% 1.42% 3.91% 3.88% 3.80% 3.72%

FedEx CorporationBalance Sheetin $millionsFiscal Years Ending May.31 2017 2018 2019 2020 2021E 2022E 2023E 2024E 2025CV
AssetsCurrent AssetsCash & Short-Term Investments 3,969 3,265 2,319 4,881 6,233 4,955 3,786 3,300 2,418
Accounts Receivables, Net 7,599 8,481 9,116 10,558 11,968 11,605 12,232 12,909 13,552
Accounts Receivables, Gross 7,851 8,882 9,416 10,948 12,771 12,035 12,685 13,387 14,054
Bad Debt/Doubtful Accounts -252 -401 -300 -390 -803 -430 -453 -478 -502
Spare parts, supplies and fuel, Net 514 525 553 572 577 705 743 784 823
Spare parts, supplies and fuel, Gross 751 793 888 907 926 1,118 1,178 1,243 1,305
Inventory Valuation Allowance -237 -268 -335 -335 -349 -413 -435 -459 -482Prepaid expenses and other 546 1,070 1,098 372 853 860 906 956 1,004
Total Current Assets 12,628 13,341 13,086 16,383 19,631 18,125 17,667 17,949 17,797
Long-Term AssetsNet Property, Plant & Equipment 25,981 28,154 30,429 33,608 35,277 37,684 40,221 42,899 45,710
Property, Plant & Equipment - Gross 51,355 55,121 59,511 65,024 69,590 75,092 80,891 87,011 93,435
Aircraft and related equipment 18,833 20,749 22,793 24,518 26,691 29,012 31,458 34,040 36,750
Package handling and ground support equipment 8,989 9,727 10,409 11,382 12,227 13,130 14,081 15,085 16,139
Computer and Electronic Equipment 5,396 5,794 6,268 6,884 7,407 7,966 8,555 9,176 9,829
Vehicles and Trailers 6,961 7,708 8,339 9,101 9,906 10,765 11,671 12,628 13,631
Facilities and other 10,447 11,143 11,702 13,139 13,360 14,220 15,126 16,082 17,086
Accumulated Depreciation -24,645 -26,967 -29,082 -31,416 -34,313 -37,408 -40,669 -44,112 -47,726
Total Other Long-term Assets 10,198 10,835 10,888 23,546 26,898 29,500 30,706 32,010 33,249
Operating Lease Right-of-Use Assets 0 0 0 13,917 15,198 18,052 19,027 20,080 21,081
Goodwill 7,154 6,973 6,884 6,372 7,149 7,149 7,149 7,149 7,149Other Assets 3,044 3,862 4,004 3,257 4,551 4,298 4,530 4,781 5,019
Total Assets 48,807 52,330 54,403 73,537 81,806 85,309 88,595 92,858 96,756
Liabilities & Shareholders' EquityCurrent LiabilitiesST Debt & Curr. Portion LT Debt 22 1,342 964 51 656 538 574 615 658
Accounts Payable 2,752 2,977 3,030 3,269 4,316 3,868 4,077 4,303 4,517
Other Current Liabilities 5,144 5,308 5,019 7,024 9,512 9,026 9,513 10,040 10,540
Accrued salaries and employee benefits 1,914 2,177 1,741 1,569 2,604 2,321 2,446 2,582 2,710
Acrued expenses 3,230 3,131 3,278 3,532 4,720 4,298 4,530 4,781 5,019
Operating Lease Liabilities 0 0 0 1,923 2,188 2,407 2,537 2,677 2,811
Total Current Liabilities 7,918 9,627 9,013 10,344 14,484 13,433 14,164 14,958 15,715
Long-Term LiabilitiesLong-term debt, less current portion 14,909 15,243 16,617 21,952 23,074 24,470 26,073 27,959 29,895
Other Long-Term Liabilities 9,652 8,044 11,016 22,946 24,857 27,479 28,917 30,472 31,949
Deferred Lease Obligations 531 551 531 0 0 0 0 0 0
Operating Lease Liabilities 0 0 0 12,195 12,904 14,614 15,403 16,255 17,065
Deferred Income Taxes 2,485 2,867 2,821 3,162 3,759 3,439 3,624 3,825 4,015
Pension, postretirement healthcare, and other benefit obligations 4,487 2,187 5,095 5,019 4,966 6,017 6,342 6,693 7,027
Self-insurance accruals 1,494 1,784 1,899 2,104 2,398 2,579 2,718 2,869 3,012Other Liabilities 655 655 670 466 830 830 830 830 830
Total Liabilities 32,479 32,914 36,646 55,242 62,415 65,382 69,155 73,389 77,560
EquityCommon Stock 32 32 32 32 32 32 32 32 32
Additional paid-in capital 3,005 3,117 3,231 3,356 3,480 3,602 3,728 3,858 3,993
Retained Earnings 20,833 24,823 24,648 25,216 25,677 28,268 30,951 33,744 36,583
Accumulated Other Comprehensive Loss / Income -415 -578 -865 -1,147 -636 -712 -798 -894 -1,001
Treasury Stock -7,382 -7,978 -9,289 -9,162 -9,162 -11,262 -14,472 -17,272 -20,412Total common stockholders' investment 16,073 19,416 17,757 18,295 19,391 19,927 19,441 19,469 19,196
Total Liabilities & Shareholders' Equity 48,807 52,330 54,403 73,537 81,806 85,309 88,595 92,858 96,756

FedEx CorporationBalance Sheetin $millionsFiscal Years Ending May.31 2017 2018 2019 2020 2021E 2022E 2023E 2024E 2025CV
AssetsCurrent AssetsCash & Short-Term Investments 8.13% 6.24% 4.26% 6.64% 7.62% 5.81% 4.27% 3.55% 2.50%
Accounts Receivables, Net 15.57% 16.21% 16.76% 14.36% 14.63% 13.60% 13.81% 13.90% 14.01%
Accounts Receivables, Gross 16.09% 16.97% 17.31% 14.89% 15.61% 14.11% 14.32% 14.42% 14.53%
Bad Debt/Doubtful Accounts -0.52% -0.77% -0.55% -0.53% -0.98% -0.50% -0.51% -0.51% -0.52%
Spare parts, supplies and fuel, Net 1.05% 1.00% 1.02% 0.78% 0.71% 0.83% 0.84% 0.84% 0.85%
Spare parts, supplies and fuel, Gross 1.54% 1.52% 1.63% 1.23% 1.13% 1.31% 1.33% 1.34% 1.35%
Bad Debt/Doubtful Accounts -0.49% -0.51% -0.62% -0.46% -0.43% -0.48% -0.49% -0.49% -0.50%Prepaid expenses and other 1.12% 2.04% 2.02% 0.51% 1.04% 1.01% 1.02% 1.03% 1.04%
Total Current Assets 25.87% 25.49% 24.05% 22.28% 24.00% 21.25% 19.94% 19.33% 18.39%
Long-Term AssetsNet Property, Plant & Equipment 53.23% 53.80% 55.93% 45.70% 43.12% 44.17% 45.40% 46.20% 47.24%
Property, Plant & Equipment - Gross 105.22% 105.33% 109.39% 88.42% 85.07% 88.02% 91.30% 93.70% 96.57%
Aircraft and related equipment 38.59% 39.65% 41.90% 33.34% 32.63% 34.01% 35.51% 36.66% 37.98%
Package handling and ground support equipment 18.42% 18.59% 19.13% 15.48% 14.95% 15.39% 15.89% 16.25% 16.68%
Computer and Electronic Equipment 11.06% 11.07% 11.52% 9.36% 9.05% 9.34% 9.66% 9.88% 10.16%
Vehicles and Trailers 14.26% 14.73% 15.33% 12.38% 12.11% 12.62% 13.17% 13.60% 14.09%
Facilities and other 21.40% 21.29% 21.51% 17.87% 16.33% 16.67% 17.07% 17.32% 17.66%
Accumulated Depreciation -50.49% -51.53% -53.46% -42.72% -41.94% -43.85% -45.91% -47.50% -49.33%
Total Other Long-term Assets 20.89% 20.71% 20.01% 32.02% 32.88% 34.58% 34.66% 34.47% 34.36%
Operating Lease Right-of-Use Assets 0.00% 0.00% 0.00% 18.93% 18.58% 21.16% 21.48% 21.62% 21.79%
Goodwill 14.66% 13.33% 12.65% 8.67% 8.74% 8.38% 8.07% 7.70% 7.39%Other Assets 6.24% 7.38% 7.36% 4.43% 5.56% 5.04% 5.11% 5.15% 5.19%
Total Assets 100.00% 100.00% 100.00% 100.00% 100.00% 100.00% 100.00% 100.00% 100.00%
Liabilities & Shareholders' EquityCurrent LiabilitiesST Debt & Curr. Portion LT Debt 0.05% 2.56% 1.77% 0.07% 0.80% 0.63% 0.65% 0.66% 0.68%
Accounts Payable 5.64% 5.69% 5.57% 4.45% 5.28% 4.53% 4.60% 4.63% 4.67%
Other Current Liabilities 10.54% 10.14% 9.23% 9.55% 11.63% 10.58% 10.74% 10.81% 10.89%
Accrued salaries and employee benefits 3.92% 4.16% 3.20% 2.13% 3.18% 2.72% 2.76% 2.78% 2.80%
Acrued expenses 6.62% 5.98% 6.03% 4.80% 5.77% 5.04% 5.11% 5.15% 5.19%Operating Lease Liabilities 0.00% 0.00% 0.00% 2.62% 2.67% 2.82% 2.86% 2.88% 2.91%
Total Current Liabilities 16.22% 18.40% 16.57% 14.07% 17.71% 15.75% 15.99% 16.11% 16.24%
Long-Term LiabilitiesLong-term debt, less current portion 30.55% 29.13% 30.54% 29.85% 28.21% 28.68% 29.43% 30.11% 30.90%
Other Long-Term Liabilities 19.78% 15.37% 20.25% 31.20% 30.39% 32.21% 32.64% 32.82% 33.02%
Deferred Lease Obligations 1.09% 1.05% 0.98% 0.00% 0.00% 0.00% 0.00% 0.00% 0.00%
Operating Lease Obligations 0.00% 0.00% 0.00% 16.58% 15.77% 17.13% 17.39% 17.51% 17.64%
Deferred Income Taxes 5.09% 5.48% 5.19% 4.30% 4.60% 4.03% 4.09% 4.12% 4.15%
Pension, postretirement healthcare, and other benefit obligations 9.19% 4.18% 9.37% 6.83% 6.07% 7.05% 7.16% 7.21% 7.26%
Self-insurance accruals 3.06% 3.41% 3.49% 2.86% 2.93% 3.02% 3.07% 3.09% 3.11%Other Liabilities 1.34% 1.25% 1.23% 0.63% 1.01% 0.97% 0.94% 0.89% 0.86%
Total Liabilities 66.55% 62.90% 67.36% 75.12% 76.30% 76.64% 78.06% 79.03% 80.16%
EquityCommon Stock 0.07% 0.06% 0.06% 0.04% 0.04% 0.04% 0.04% 0.03% 0.03%
Additional paid-in capital 6.16% 5.96% 5.94% 4.56% 4.25% 4.22% 4.21% 4.16% 4.13%
Retained Earnings 42.68% 47.44% 45.31% 34.29% 31.39% 33.14% 34.94% 36.34% 37.81%
Accumulated Other Comprehensive Loss / Income -0.85% -1.10% -1.59% -1.56% -0.78% -0.83% -0.90% -0.96% -1.03%
Treasury Stock -15.12% -15.25% -17.07% -12.46% -11.20% -13.20% -16.34% -18.60% -21.10%Total Common Stockholders' Investment 32.93% 37.10% 32.64% 24.88% 23.70% 23.36% 21.94% 20.97% 19.84%
Total Liabilities & Shareholders' Equity 100.00% 100.00% 100.00% 100.00% 100.00% 100.00% 100.00% 100.00% 100.00%

FedEx CorporationHistorical Cash Flow Statementin $millionsFiscal Years Ending May.31 2017 2018 2019 2020Operating ActivitiesNet income 2,997 4,572 540 1,286
Adjustments to reconcile net income to cash provided by operating activities 1,933 102 5,073 3,811
Depreciation and amortization 2,995 3,095 3,353 3,615
Other, net 1,199 477 228 3,494
Provision for uncollectible accounts 136 246 295 442
Deferred income taxes and other noncash items 909 -231 -233 2,449
Stock-based compensation 154 167 174 168
Gain from sale of business 0 -85 -8 0
Impairment charges 0 380 0 435
Retirement plans mark-to-market adjustment -24 -10 3,882 794
Gain from sale of an investment -35 0 0 0
Business realignment costs 0 0 101 0
Changes in operating assets and liabilities, net -2,202 -3,460 -2,491 -4,092
Receivables -556 -1,049 -873 -1,331
Other assets 78 -135 -25 -59
Pension and postretirement healthcare assets and liabilities, net -1,688 -2,345 -909 -908
Accounts payable and other liabilities 103 141 -571 -1,787Other, net -139 -72 -113 -7
Net Operating Cash Flow 4,930 4,674 5,613 5,097
Investing ActivitiesCapital expenditures -5,116 -5,663 -5,490 -5,868
Proceeds from asset dispositions and other 135 -14 17 22
Business acquisitions, net of cash acquired 0 -179 -66 0
Proceeds from sale of business 0 123 0 0Proceeds from asset dispositions and other excluding business acquisitions, net of cash acquired and proceeds from sale of 135 42 83 22
Net Investing Cash Flow -4,981 -5,677 -5,473 -5,846
Financing ActivitiesProceeds from short-term borrowings, net 0 0 0 0
Principal payments on debt -82 -38 -1,436 -2,548
Proceeds from debt issuances 1,190 1,480 2,463 6,556
Proceeds from stock issuances 337 327 101 64
Dividend Paid -426 -535 -683 -679
Purchase of Treasury Stock -509 -1,017 -1,480 -3Other, net 18 10 -4 -9
Net Financing Cash Flow 528 227 -1,039 3,381
Effect of exchange rate changes on cash -42 72 -47 -70Net increase / decrease in cash and cash equivalents 435 -704 -946 2,562
Beginning Cash Balance 3,534 3,969 3,265 2,319Ending Cash Balance 3,969 3,265 2,319 4,881

FedEx CorporationForecasted Cash Flow Statement
Fiscal Years Ending May.31 2021E 2022E 2023E 2024E 2025CV
Operating ActivitiesNet income 1,146 3,359 3,515 3,631 3,733
Adjustments to reconcile net income to cash provided by operating activitiesDepreciation and amortization 3789 4401 4734 5068 5401
Allowance for doubtful accounts 803 430 453 478 502
Stock-based compensation 216 221 233 246 258
Changes in operating assets and liabilities, netReceivables -413 373 -23 -25 -24
Spare parts, supplies and fuel -14 -64 -22 -24 -23
Prepaid expenses and other -481 -7 -46 -50 -48
Operating Lease Right-of-Use Assets -1281 -2854 -974 -1053 -1001
Accounts payable 1047 -448 209 226 214
Accrued salaries and employee benefits 1035 -283 125 135 129
Acrued expenses 1188 -422 232 251 238
Operating Lease Liabilities 974 1929 919 993 943
Pension and postretirement healthcare assets and liabilities, net -53 1051 325 351 334
Deferred Income Taxes 597 -320 186 201 191
Self-insurance accruals 294 181 139 150 143
Other Long-term Liabilities 364 0 0 0 0
Net Operating Cash Flow 8553 7366 9864 10427 10847
Investing ActivitiesCapital expenditures -4566 -5502 -5799 -6120 -6425
Change in Short-term Investments -1663 -48 -594 -1615 -751
Business Acquisitions (Change in Goodwill) -777 0 0 0 0
Change in Other Long-term Assets -1294 253 -232 -251 -238
Net Investing Cash Flow -8300 -5297 -6625 -7986 -7414
Financing ActivitiesProceeds from issuance of long-term debt 1,727 1,278 1,638 1,927 1,979
Principal payments on debt 0 -1,853 -2,105 -1,324 -2,315
Payment of Finance Lease -67 -26 -25 -24 -81
Proceeds from issuance of Common Stock 124 122 126 130 135
Dividend Paid -685 -768 -832 -838 -893Repurchase of Treasury Stock 0 -2,100 -3,210 -2,800 -3,140
Net Financing Cash Flow 1,099 -3,347 -4,408 -2,928 -4,316
Beginning Cash Balance 4,881 6,233 4,955 3,786 3,300Ending Balance of Cash 6,233 4,955 3,786 3,300 2,418
Net increase / decrease in cash and cash equivalents 1,352 -1,277 -1,169 -486 -882

FedEx CorporationValue Driver Estimation
Fiscal Years Ending May.31 2017 2018 2019 2020 2021E 2022E 2023E 2024E 2025CV
NOPLAT:Net Sales 60,319 65,450 69,693 69,217 80,472 85,964 90,604 95,620 100,385
Less: Operating Expense -55,753 -61,178 -65,227 -66,800 -79,213 -81,081 -85,463 -90,265 -94,844
Salaries and employee benefits -21,989 -23,795 -24,776 -25,031 -30,894 -31,549 -33,252 -35,093 -36,841
Purchased transportation -13,630 -15,101 -16,654 -17,466 -22,046 -20,545 -21,564 -22,758 -23,892
Rentals and landing fees -3,240 -3,361 -3,360 -3,712 -4,302 -4,212 -4,440 -4,685 -4,919
Depreciation and amortization -2,995 -3,095 -3,353 -3,615 -3,789 -4,401 -4,734 -5,068 -5,401
Fuel -2,773 -3,374 -3,889 -3,156 -2,798 -3,954 -4,168 -4,399 -4,618
Maintenance and repairs -2,374 -2,622 -2,834 -2,893 -3,273 -3,782 -3,987 -4,207 -4,417
Asset impairment charges 0 -380 0 -435 0 0 0 0 0
Business realignment costs 0 0 -320 0 -10 0 0 0 0
Add: Implied Interest on Operating Leases 380.40 382.22 386.70 387.21 366.58 435.42 458.93 484.34 508.47EBITA 4,946 4,654 4,853 2,804 1,626 5,319 5,601 5,839 6,050
Adjusted TaxesMarginal Tax Rate 36.75% 27.89% 34.05% 25.82% 25.82% 25.82% 25.82% 25.82% 25.82%Income Tax Provision 1582.00 -219.00 115.00 383.00 342.25 1003.33 1049.80 1084.64 1114.98
Tax Shield on Interest Expense (+) 188.18 155.62 200.19 173.54 147.79 155.75 165.95 177.95 190.28
Tax on Interest on Operating Leases (-) -139.81 -106.60 -131.65 -99.99 -94.65 -112.43 -118.50 -125.06 -131.29
Tax on interest income (-) -12.13 -13.39 -20.09 -14.20 -16.64 -21.24 -16.89 -12.91 -11.25
Tax shield on Other retirement plans income (+) -173.11 -166.78 1106.83 31.51 -190.29 0.00 0.00 0.00 0.00
Tax shield on other non-operating income (+) -7.72 1.95 10.55 2.32 0.00 0.00 0.00 0.00 0.00
Total adjusted taxes (subtract from EBITDA) 1437.41 -348.19 1280.83 476.17 188.46 1025.40 1080.36 1124.64 1162.72
Change in Deferred Taxes (plus, cash basis vs GAAP) 918 382 -46 341 597 -320 186 201 191
NOPLAT 4,427 5,384 3,526 2,669 2,034 3,973 4,706 4,915 5,077
Invested Capital (IC):Operating Current Assets
Normal Cash (3.33% of sales) (+) 2,007 2,178 2,319 2,303 2,678 2,860 3,015 3,182 3,340
Account Receivables (+) 7,599 8,481 9,116 10,558 11,968 11,605 12,232 12,909 13,552
Spare parts, supplies and fuel (+) 514 525 553 572 577 705 743 784 823
Prepaid expenses and other (+) 546 1,070 1,098 372 853 860 906 956 1,004
Non Interest-Bearning Current Liabilities Accounts Payable 2,752 2,977 3,030 3,269 4,316 3,868 4,077 4,303 4,517
Other Current Liabilities 5,144 5,308 5,019 7,024 9,512 9,026 9,513 10,040 10,540
Net Operating Working Capital 2,770 3,969 5,037 3,512 2,248 3,135 3,305 3,488 3,661
Net Property, Plant, and Equipment (+) 51,355 55,121 59,511 65,024 69,590 75,092 80,891 87,011 93,435
Net Other Operating Assets (+) 15,847 16,032 16,053 15,519 15,198 18,052 19,027 20,080 21,081
Net Other Operating Liabilities (-) 9,652 8,044 11,016 22,946 24,857 27,479 28,917 30,472 31,949
Invested Capital 60,320 67,078 69,585 61,109 62,179 68,801 74,305 80,106 86,228
Free Cash Flow (FCF):NOPLAT 4,427 5,384 3,526 2,669 2,034 3,973 4,706 4,915 5,077Change in IC 6,022 6,758 2,507 -8,477 1,070 6,622 5,504 5,801 6,122
FCF -1,595 -1,374 1,018 11,146 964 -2,649 -798 -886 -1,045
Return on Invested Capital (ROIC):NOPLAT 4,427 5,384 3,526 2,669 2,034 3,973 4,706 4,915 5,077Beginning IC 54,297 60,320 67,078 69,585 61,109 62,179 68,801 74,305 80,106
ROIC 8.15% 8.93% 5.26% 3.84% 3.33% 6.39% 6.84% 6.62% 6.34%
Economic Profit (EP):Beginning IC * (ROIC-WACC)
Economic Profit (Total) 1,918 2,598 427 -546 -789 1,100 1,527 1,483 1,377

FedEx CorporationDiscounted Cash Flow (DCF) and Economic Profit (EP) Valuation Models
Key Inputs: CV Growth of NOPLAT 3.10% CV Year ROIC 6.34% WACC 4.62% Cost of Equity 6.07%
Fiscal Years Ending May.31 2021E 2022E 2023E 2024E 2025CV
DCF Model:Free Cash Flow (FCF) 963.8 -2649.3 -798.1 -885.6 -1044.5Continuing Value (CV) 170709.2PV of FCF 921.2 -2420.5 -696.9 -739.3 142494.5
Value of Operating Assets: 139559.0Non-Operating Adjustments(+)Excess Cash 2577.8- ESOP -2185.7(-) MV of Total Debt -37521.7(-) Underfunded Pension -5064.0
Value of Equity 97365.5Shares Outstanding 261.0
Intrinsic Value of Last FYE 373.05$ Implied Price as of Today 388.70$
EP Model:Economic Profit (EP) -789.1 1100.1 1527.2 1482.5 1376.5Continuing Value (CV) 90602.9PV of EP -754.3 1005.1 1333.7 1237.5 75628.1
Total PV of EP 78450.1Invested Capital (last FYE) 61108.8Value of Operating Assets: 139559.0
Non-Operating Adjustments(+)Excess Cash 2577.8- ESOP -2185.7(-) MV of Total Debt -37521.7(-) Underfunded Pension -5064.0
Value of Equity 97365.5Shares Outstanding 261.0
Intrinsic Value of Last FYE 373.05$ Implied Price as of Today 388.70$

FedEx CorporationDividend Discount Model (DDM) or Fundamental P/E Valuation Model
Fiscal Years Ending 2021E 2022E 2023E 2024E 2025CV
EPS 4.35$ 13.15$ 14.09$ 14.95$ 15.36$
Key Assumptions CV growth of EPS 2.80% CV Year ROE 19.45% Cost of Equity 6.07%
Future Cash Flows P/E Multiple (CV Year) 26.21 EPS (CV Year) 15.36$ Future Stock Price 402.65$ Dividends Per Share 2.62 2.87 3.16 3.28 Discounted Cash Flows 2.47 2.55 2.65 2.59 318.14$
Intrinsic Value as of Last FYE 328.40$ Implied Price as of Today 342.18$

FedEx CorporationRelative Valuation Models Prices as of 3/26/21
EPS EPS Est. 5yrTicker Company Price 2021E 2022E P/E 21 P/E 22 EPS gr. PEG 21 PEG 22UPS United Parcel Service (UPS) $167.98 $8.88 $9.63 19.60 18.30 10.06 1.95 1.82 EXPD Expeditors International of Washington, Inc. $107.80 $4.26 $4.39 25.60 25.10 4.20 6.10 5.98 JBHT J.B. Hunt Transport Services, Inc. $166.90 $6.19 $7.63 27.70 23.30 20.73 1.34 1.12 XPO XPO Logisitics, Inc. $123.21 $5.07 $5.92 24.90 21.50 10.14 2.46 2.12 CHRW C.H. Robinson Worldwide, Inc. $97.70 $4.43 $4.69 22.50 20.90 9.94 2.26 2.10
Average 24.06 21.82 2.82 2.63
FDX FedEx Corporation $281.34 $4.35 $13.15 16.1 14.5 10.5 1.5 1.4
Implied Relative Value: P/E (EPS20) $ 104.75
P/E (EPS21) 286.91$ PEG (EPS20) 129.28$ PEG (EPS21) 363.93$

FedEx CorporationWeighted Average Cost of Capital (WACC) Estimation
Cost of Equity: ASSUMPTIONS:Risk-Free Rate 1.67% 10-year Treasury Note used Beta 1.032 2 year weekly raw beta from BloombergEquity Risk Premium 4.26% Damodaran implied COVID-19-adjusted ERP as of 1-Apr-2021Cost of Equity 6.07%
Cost of Debt:Risk-Free Rate 1.67% 10-year Treasury Note used Implied Default Premium 0.74%Pre-Tax Cost of Debt 2.41% YTM on company's 9-year corporate bondMarginal Tax Rate 25.82%After-Tax Cost of Debt 1.79%
Market Value of Common Equity: MV Weights
Total Shares Outstanding 261Current Stock Price $281.34MV of Equity 73,429.74 66.18%
Market Value of Debt:Short-Term Debt 0Current Portion of LTD 51Long-Term Debt 21,952PV of Operating Leases 15,519 MV of Total Debt 37,521.67 33.82%
Market Value of the Firm 110,951.41 100.00%
Estimated WACC 4.62%
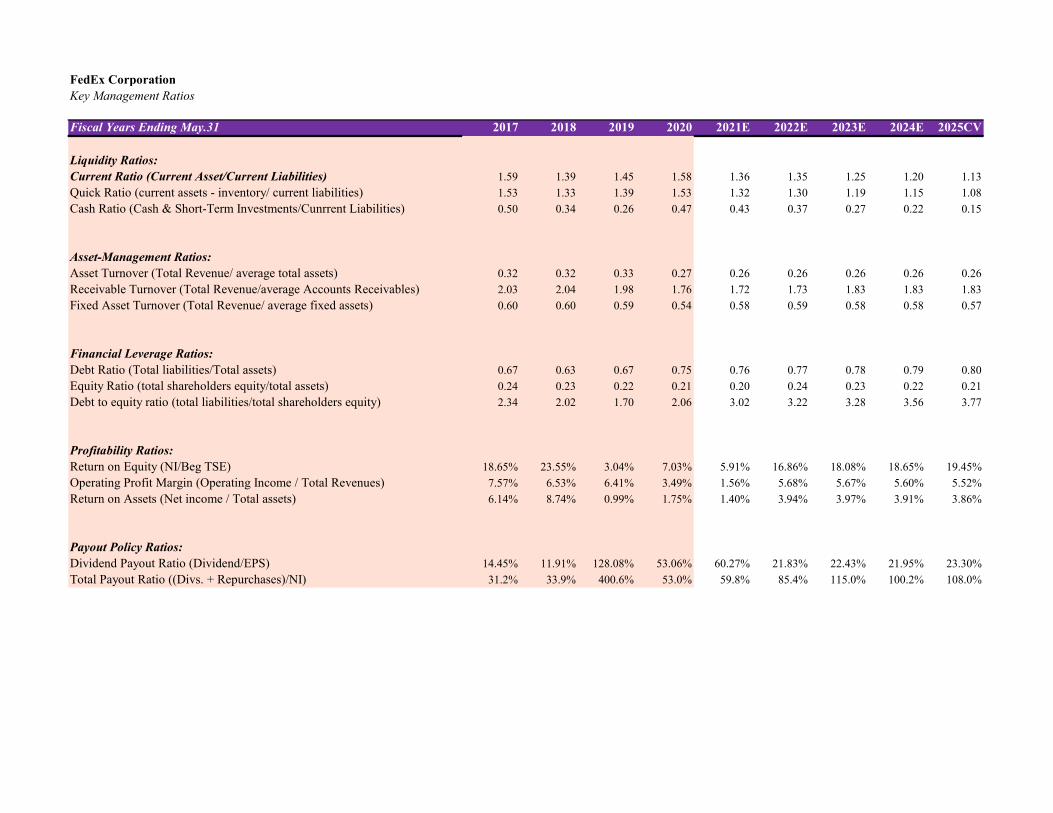
FedEx CorporationKey Management Ratios
Fiscal Years Ending May.31 2017 2018 2019 2020 2021E 2022E 2023E 2024E 2025CV
Liquidity Ratios:Current Ratio (Current Asset/Current Liabilities) 1.59 1.39 1.45 1.58 1.36 1.35 1.25 1.20 1.13
Quick Ratio (current assets - inventory/ current liabilities) 1.53 1.33 1.39 1.53 1.32 1.30 1.19 1.15 1.08
Cash Ratio (Cash & Short-Term Investments/Cunrrent Liabilities) 0.50 0.34 0.26 0.47 0.43 0.37 0.27 0.22 0.15
Asset-Management Ratios:Asset Turnover (Total Revenue/ average total assets) 0.32 0.32 0.33 0.27 0.26 0.26 0.26 0.26 0.26
Receivable Turnover (Total Revenue/average Accounts Receivables) 2.03 2.04 1.98 1.76 1.72 1.73 1.83 1.83 1.83
Fixed Asset Turnover (Total Revenue/ average fixed assets) 0.60 0.60 0.59 0.54 0.58 0.59 0.58 0.58 0.57
Financial Leverage Ratios:Debt Ratio (Total liabilities/Total assets) 0.67 0.63 0.67 0.75 0.76 0.77 0.78 0.79 0.80
Equity Ratio (total shareholders equity/total assets) 0.24 0.23 0.22 0.21 0.20 0.24 0.23 0.22 0.21
Debt to equity ratio (total liabilities/total shareholders equity) 2.34 2.02 1.70 2.06 3.02 3.22 3.28 3.56 3.77
Profitability Ratios:Return on Equity (NI/Beg TSE) 18.65% 23.55% 3.04% 7.03% 5.91% 16.86% 18.08% 18.65% 19.45%
Operating Profit Margin (Operating Income / Total Revenues) 7.57% 6.53% 6.41% 3.49% 1.56% 5.68% 5.67% 5.60% 5.52%
Return on Assets (Net income / Total assets) 6.14% 8.74% 0.99% 1.75% 1.40% 3.94% 3.97% 3.91% 3.86%
Payout Policy Ratios:Dividend Payout Ratio (Dividend/EPS) 14.45% 11.91% 128.08% 53.06% 60.27% 21.83% 22.43% 21.95% 23.30%
Total Payout Ratio ((Divs. + Repurchases)/NI) 31.2% 33.9% 400.6% 53.0% 59.8% 85.4% 115.0% 100.2% 108.0%

FedEx CorporationPresent Value of Operating Lease Obligations
Fiscal Years Ending May.31 2017 2018 2019 2020Year 1 2,445 2,471 2,497 2,416Year 2 2,230 2,177 2,263 2,266Year 3 1,931 1,951 2,028 2,012Year 4 1,709 1,762 1,779 1,689Year 5 1,540 1,548 1,486 1,515Thereafter 8,019 8,193 8,062 7,552Total Minimum Payments 17874.0 18102.0 18115.0 17450.0Less: Cumulative Interest 2027.4 2069.8 2061.5 1931.3PV of Minimum Payments 15846.6 16032.2 16053.5 15518.7
Implied Interest in Year 1 Payment 380.4 382.2 386.7 387.2
Pre-Tax Cost of Debt 2.41% 2.41% 2.41% 2.41%Years Implied by Year 6 Payment 5.2 5.3 5.4 5.0Expected Obligation in Year 6 & Beyond 1540 1548 1486 1515
Present Value of Lease PaymentsPV of Year 1 2387.4 2412.8 2438.2 2359.1PV of Year 2 2126.2 2075.7 2157.7 2160.5PV of Year 3 1797.8 1816.4 1888.1 1873.2PV of Year 4 1553.6 1601.8 1617.2 1535.4PV of Year 5 1367.0 1374.1 1319.1 1344.8PV of 6 & beyond 6614.7 6751.5 6633.3 6245.7Capitalized PV of Payments 15846.6 16032.2 16053.5 15518.7

FedEx CorporationEffects of ESOP Exercise and Share Repurchases on Common Stock Account and Number of Shares Outstanding
Number of Options Outstanding (shares): 16,124,745
Average Time to Maturity (years): 6.20
Expected Annual Number of Options Exercised: 2,600,765
Current Average Strike Price: 167.79$
Cost of Equity: 6.07%
Current Stock Price: $281.34
Fiscal Years Ending May.31 2021E 2022E 2023E 2024E 2025CV
Increase in Shares Outstanding: 2,600,765 2,600,765 2,600,765 2,600,765 2,600,765
Average Strike Price: 167.79$ 167.79$ 167.79$ 167.79$ 167.79$
Increase in Common Stock Account: 436,382,413 436,382,413 436,382,413 436,382,413 436,382,413
Share Repurchases ($) 0 2,100,000,000 3,210,000,000 2,800,000,000 3,140,000,000
Expected Price of Repurchased Shares: 281.34$ 295.82$ 311.04$ 327.05$ 343.88$
Number of Shares Repurchased: 0.00 7,098,943.74 10,320,135.38 8,561,390.68 9,131,073.84
Shares Outstanding (beginning of the year) 265,070,592 267,671,357 263,173,179 255,453,809 249,493,183
Plus: Shares Issued Through ESOP 2,600,765 2,600,765 2,600,765 2,600,765 2,600,765
Less: Shares Repurchased in Treasury - 7,098,944 10,320,135 8,561,391 9,131,074
Shares Outstanding (end of the year) 267,671,357 263,173,179 255,453,809 249,493,183 242,962,875

FedEx CorporationValuation of Options Granted under ESOP
Current Stock Price $281.34Risk Free Rate 1.67%Current Dividend Yield 0.92%Annualized St. Dev. of Stock Returns 31.67%
Average Average B-S ValueRange of Number Exercise Remaining Option of OptionsOutstanding Options of Shares Price Life (yrs) Price GrantedRange 1 16,124,745 167.79 6.20 135.55$ 2,185,689,830$ Total 16,124,745 167.79$ 6.20 149.06$ 2,185,689,830$