Embed Size (px)
Citation preview

TECHNICAL EVALUATION REPORT VOLUME 1
KriStar Perk Filter Stormwater Treatment
System Performance Monitoring
Prepared for
KriStar Enterprises, Inc
June 2010

Note: Some pages in this document have been purposefully skipped or blank pages inserted so that this document will copy correctly when duplexed.
TECHNICAL EVALUATION REPORT
KriStar Perk Filter Stormwater Treatment
System Performance Monitoring
Prepared for
KriStar Enterprises, Inc P.O. Box 6419
Santa Rosa, California 95406-0419
Prepared by
Herrera Environmental Consultants 2200 Sixth Avenue, Suite 1100
Seattle, Washington 98121 Telephone: 206.441.9080
June 4, 2010


Contents
Executive Summary ........................................................................................................................ v Sampling Procedures ............................................................................................................... v Hydrologic Performance ......................................................................................................... vi Water Quality Performance .................................................................................................... vi
Basic Treatment ............................................................................................................ vi Phosphorus Treatment .................................................................................................. vii
Introduction ..................................................................................................................................... 1
Technology Description .................................................................................................................. 5 Physical Description ................................................................................................................ 5
Structure ......................................................................................................................... 5 Inlet ................................................................................................................................ 5 Inlet Gallery ................................................................................................................... 5 Inlet Weir/Bypass Assembly .......................................................................................... 8 Cartridge Chamber ......................................................................................................... 8 Perk Filter Cartridges ..................................................................................................... 8 Outlet Chamber .............................................................................................................. 9 Outlet ............................................................................................................................ 10
Site Installation Requirements ............................................................................................... 10 Necessary Soil Characteristics ..................................................................................... 10 Hydraulic Grade Requirements .................................................................................... 10 Depth to Groundwater Limitations .............................................................................. 10 Utility Requirements .................................................................................................... 11
Treatment Processes .............................................................................................................. 11 Separation ..................................................................................................................... 11 Sedimentation ............................................................................................................... 11 Filtration ....................................................................................................................... 11 Adsorption .................................................................................................................... 11
Sizing Methods ...................................................................................................................... 12 Western Washington .................................................................................................... 12 Eastern Washington ..................................................................................................... 12
Expected Treatment Capabilities ........................................................................................... 13 Expected Design Life ............................................................................................................ 14 Maintenance Procedures ........................................................................................................ 14
Sampling Procedures .................................................................................................................... 17 Monitoring Design ................................................................................................................. 17 Site Location .......................................................................................................................... 17 Monitoring Schedule ............................................................................................................. 18 Test System Description ........................................................................................................ 18 Test System Sizing ................................................................................................................ 21
Bypass Conditions ........................................................................................................ 22 Maintenance Schedule ................................................................................................. 22
jr 08-03958-000 kristar ter.doc
i
Hydrologic Monitoring Procedures ....................................................................................... 22 Bypass Flow Monitoring (BIPF-BP) ........................................................................... 22 Influent/Effluent Flow Monitoring Station (BIPF-FM) ............................................... 23 Precipitation Monitoring Station (BIPF-RG) ............................................................... 23 Monitoring Equipment Maintenance ........................................................................... 23
Water Quality Monitoring Procedures ................................................................................... 23 Sediment Monitoring Procedures .......................................................................................... 26 Analytical Methods ................................................................................................................ 26 Quality Assurance and Control Measures ............................................................................. 26
Field Quality Assurance/Quality Control .................................................................... 26 Laboratory Quality Control .......................................................................................... 28
Data Management Procedures ............................................................................................... 29 Data Management Quality Control .............................................................................. 30
Data Analysis Procedures ...................................................................................................... 30 Hydrologic Data Analysis Procedures ......................................................................... 31 Water Quality Data Analysis Procedures ..................................................................... 31
Data Analysis ................................................................................................................................ 35 Hydrologic Data ..................................................................................................................... 35
Historical Rainfall Data Comparison ........................................................................... 35 Water Budget ............................................................................................................... 36
Water Quality Data ................................................................................................................ 43 Comparison of Data to TAPE Guidelines .................................................................... 43 Monitoring Results by Parameter................................................................................. 46
Sediment Retention ................................................................................................................ 57 Performance Evaluation ................................................................................................................ 59
Basic Treatment ..................................................................................................................... 59 Phosphorus Treatment ........................................................................................................... 61
Conclusions ................................................................................................................................... 65
References ..................................................................................................................................... 67 Appendix A Perk Filter Configuration Schematics Appendix B Specifications for Media Appendix C Perk Filter Pilot Use Level Designation Application Appendix D Perk Filter Research and Development Report Appendix E FloGard Perk Filter Systems Operations and Maintenance Manual Appendix F BIPF Design Drawings Appendix G Perk Filter Retrofit Report Appendix H Standardized Field Forms Appendix I Hydrologic Data Quality Assurance Memorandum Appendix J Water Quality Data Quality Assurance Memorandum Appendix K Individual Storm Reports Appendix L Water Quality Parameter Summary Sheets Appendix M Water Quality Database Appendix N Statistical Analysis Results Appendix O Laboratory Reports
jr 08-03958-000 kristar ter.doc
ii

Tables
Table 1. Head loss and minimum depth requirements for various Perk Filter cartridge configurations. ........................................................................................................... 10
Table 2. Perk Filter sizing table for western Washington. ....................................................... 12 Table 3. Perk Filter sizing table for eastern Washington. ........................................................ 13 Table 4. Equipment maintenance schedule for the Perk Filter monitoring program. .............. 24 Table 5. Automated sampler programming parameters for the Perk Filter test system
at Bainbridge Island. .................................................................................................. 25 Table 6. Methods and detection limits for water quality analyses. .......................................... 27 Table 7. Monthly and annual precipitation totals (in inches) for 2009-2010 at BIPF
compared to historical totals at Sea-Tac airport NOAA station. ............................... 36 Table 8. Summary statistics for storms that produced bypass flow at the BIPF test
system from May 1, 2009 through February 28, 2010. ............................................. 37 Table 9. Comparison of precipitation data from sampled storm events at the BIPF test
system to storm event guidelines in the TAPE. ......................................................... 45 Table 10. Comparison of flow-weighted composite data from sampled storm events at
the BIPF test system to criteria in the TAPE. ............................................................ 47 Table 11. Total suspended solids concentrations and removal efficiency estimates for
individual sampling events at the BIPF test system. ................................................. 48 Table 12. Total suspended solids concentrations from compiled national stormwater
monitoring data by land use. ...................................................................................... 49 Table 13. Total phosphorus concentrations and removal efficiency estimates for
individual sampling events at the BIPF test system. ................................................. 51 Table 14. Soluble reactive phosphorus concentrations and removal efficiency estimates
for individual sampling events at the BIPF test system. ............................................ 53 Table 15. pH concentrations and removal efficiency estimates for individual sampling
events at the BIPF test system. .................................................................................. 54 Table 16. The Wentworth scale for classification of particle size distribution. ........................ 56 Table 17. Summary of particle size distributions measured at the BIPF test system
during the monitoring period. .................................................................................... 57 Table 18. Total suspended solids concentrations and removal efficiency estimates for
valid sampling events at the BIPF test system. .......................................................... 60 Table 19. Total suspended solids summary statistics for 16 sampling events at the BIPF
test system with influent total suspended solids concentrations of 20 mg/L or greater. ....................................................................................................................... 61
Table 20. Total phosphorus concentrations and removal efficiency estimates for valid sampling events at the BIPF test system. ................................................................... 62
Table 21. Total phosphorus summary statistics for 11 sampling events at the BIPF test system with influent total phosphorus concentrations between 0.100 and 0.500 mg/L. ................................................................................................................ 63
jr 08-03958-000 kristar ter.doc
iii

jr 08-03958-000 kristar ter.doc
iv
Figures
Figure 1. Vicinity map of the Perk Filter monitoring site (BIPF) at the Bainbridge Island ferry terminal. ................................................................................................... 2
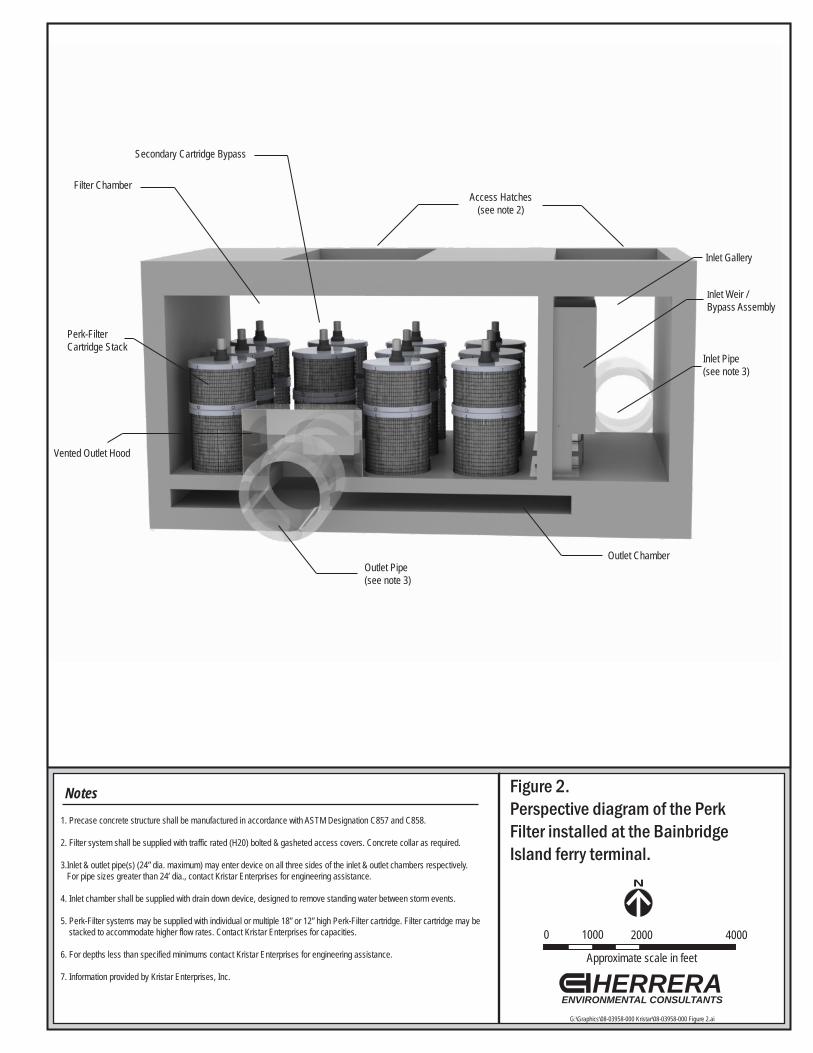
Figure 2. Perspective diagram of the Perk Filter installed at the Bainbridge Island ferry terminal. ....................................................................................................................... 6
Figure 3. Plan view and cross section of the Perk Filter installed at the Bainbridge Island ferry terminal. ................................................................................................... 7
Figure 4. Filter media in a typical cartridge and cross-section of cartridge stack. ..................... 9 Figure 5. Plan view diagram of the Perk Filter monitoring site (BIPF). ................................... 19 Figure 6. Cross-section of the Perk Filter monitoring site (BIPF). ........................................... 20 Figure 7. Comparison of storm precipitation depth and bypass storm volume at the
BIPF test system. ....................................................................................................... 40 Figure 8. Comparison of storm peak precipitation intensity and bypass storm volume at
the BIPF test system. ................................................................................................. 41 Figure 9. Comparison of total storm volume and bypass storm volume at the BIPF test
system. ....................................................................................................................... 41 Figure 10. Temporal plot of bypass storm volume and storm precipitation depth. .................... 42 Figure 11. Temporal plot of treated flow rate during bypass and storm precipitation
depth. ......................................................................................................................... 43 Figure 12. Total suspended solids data collected at the BIPF test system during the
2009-2010 monitoring year. ...................................................................................... 49 Figure 13. Total phosphorus data collected at the BIPF test system during the 2009-2010
monitoring year. ......................................................................................................... 52 Figure 14. Soluble reactive phosphorus data collected at the BIPF test system during the
monitoring period. ..................................................................................................... 52 Figure 15. Particle size distribution data collected from BIPF-IN during the monitoring
period. ........................................................................................................................ 56 Figure 16. Particle size distribution data collected from BIPF-OUT during the
monitoring period. ..................................................................................................... 57
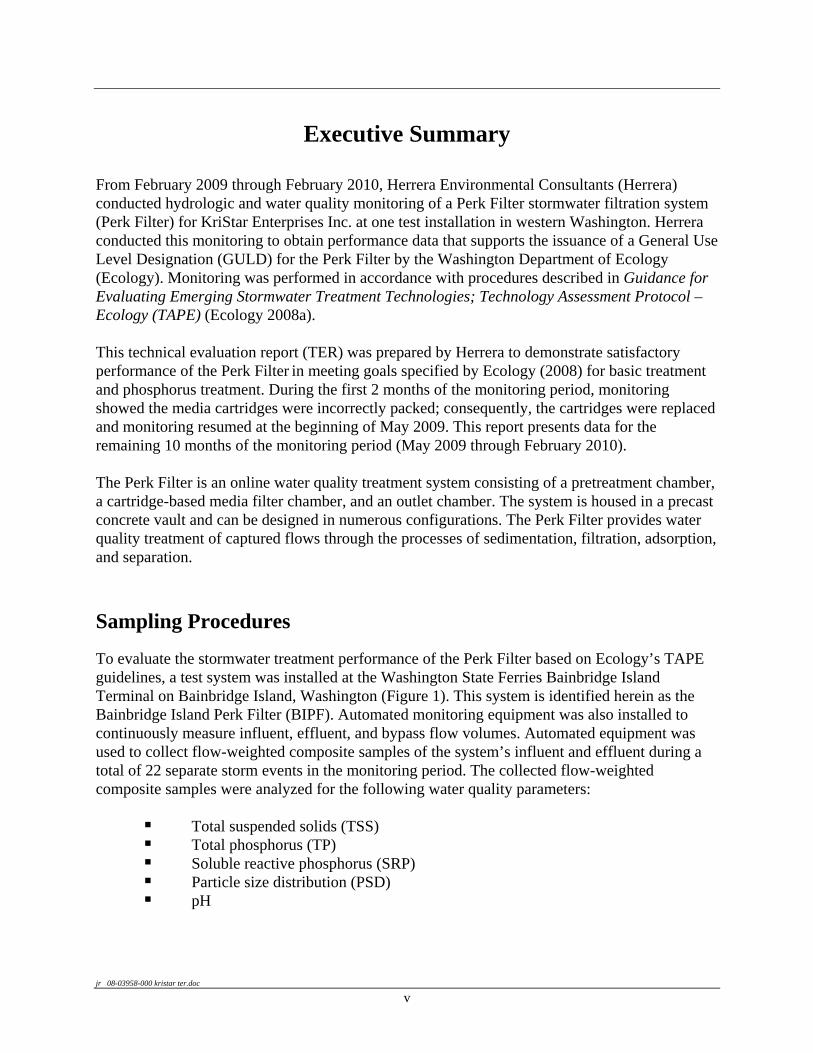
Executive Summary
From February 2009 through February 2010, Herrera Environmental Consultants (Herrera) conducted hydrologic and water quality monitoring of a Perk Filter stormwater filtration system (Perk Filter) for KriStar Enterprises Inc. at one test installation in western Washington. Herrera conducted this monitoring to obtain performance data that supports the issuance of a General Use Level Designation (GULD) for the Perk Filter by the Washington Department of Ecology (Ecology). Monitoring was performed in accordance with procedures described in Guidance for Evaluating Emerging Stormwater Treatment Technologies; Technology Assessment Protocol – Ecology (TAPE) (Ecology 2008a).
This technical evaluation report (TER) was prepared by Herrera to demonstrate satisfactory performance of the Perk Filter in meeting goals specified by Ecology (2008) for basic treatment and phosphorus treatment. During the first 2 months of the monitoring period, monitoring showed the media cartridges were incorrectly packed; consequently, the cartridges were replaced and monitoring resumed at the beginning of May 2009. This report presents data for the remaining 10 months of the monitoring period (May 2009 through February 2010).
The Perk Filter is an online water quality treatment system consisting of a pretreatment chamber, a cartridge-based media filter chamber, and an outlet chamber. The system is housed in a precast concrete vault and can be designed in numerous configurations. The Perk Filter provides water quality treatment of captured flows through the processes of sedimentation, filtration, adsorption, and separation.
Sampling Procedures
To evaluate the stormwater treatment performance of the Perk Filter based on Ecology’s TAPE guidelines, a test system was installed at the Washington State Ferries Bainbridge Island Terminal on Bainbridge Island, Washington (Figure 1). This system is identified herein as the Bainbridge Island Perk Filter (BIPF). Automated monitoring equipment was also installed to continuously measure influent, effluent, and bypass flow volumes. Automated equipment was used to collect flow-weighted composite samples of the system’s influent and effluent during a total of 22 separate storm events in the monitoring period. The collected flow-weighted composite samples were analyzed for the following water quality parameters:
Total suspended solids (TSS) Total phosphorus (TP) Soluble reactive phosphorus (SRP) Particle size distribution (PSD) pH
jr 08-03958-000 kristar ter.doc
v

These data were subsequently analyzed in the following ways:
Computation of pollutant removal efficiencies with bootstrap confidence intervals
Statistical comparisons of influent and effluent concentrations
Correlation analysis to examine the influence of storm characteristics on system performance
These results were then compared to TAPE goals for basic and phosphorus treatment.
Hydrologic Performance
The water quality treatment goal for the test system was to capture and treat 91 percent of the average annual runoff volume. Monitoring data showed that stormwater bypassed the BIPF test system during 53 out of the 85 monitored events in the monitoring period. However, relative to total event flow volumes, only a small volume of water bypassed during each event. As a result, 93.7 percent of the total volume was treated during the monitoring period.
During the monitoring period, there was no temporal trend in bypass volume, total suspended solids removal, or total phosphorus removal. There was, however, a negative trend in treated flow rate during bypass. After 10 months of monitoring, treated flow rate during bypass decreased to near the water quality design flow rate for the system. Because data were not collected past 10 months, it is not possible to determine if this was a temporary or permanent trend. Consequently, until additional data is provided, it appears as if a 10-month maintenance cycle is appropriate to ensure the system performs as designed.
Water Quality Performance Basic Treatment
The basic treatment goal in the TAPE guidelines is 80 percent removal of total suspended solids for influent concentrations ranging from 100 to 200 milligrams per liter (mg/L). For concentrations less than 100 mg/L, facilities should achieve an effluent goal of 20 mg/L. There is no specified criterion for influent total suspended solids concentrations less than 20 mg/L.
Total suspended solids removal rates ranged from 50 to 95 percent, with a median value of 83 percent. The lower 95 percent confidence interval about the median percent reduction was 80 percent. Consequently, it can be concluded that the median percent removal was significantly greater than the 80 percent goal specified in the TAPE guidelines, with the required 95 percent confidence. The median treated flow rate was 0.421 cfs (189 gpm); the design flow rate for the system is 0.394 cfs (177 gpm). These data indicate the system was able to meet the treatment basic treatment at a flow rate that slightly exceeded this design flow rate.
jr 08-03958-000 kristar ter.doc
vi
jr 08-03958-000 kristar ter.doc
vii
Phosphorus Treatment
The phosphorus treatment goal in the TAPE guidelines is 50 percent removal of total phosphorus for influent concentrations ranging from 0.1 to 0.5 mg/L.
A bootstrap estimate of the median percent reduction for these data was 71 percent, with a lower 95 percent confidence limit of 60 percent and an upper 95 percent confidence limit of 78 percent. Consequently, it can be concluded that the median percent removal was significantly greater than the 50 percent goal specified in the TAPE guidelines, with the required 95 percent confidence. The median flow rate for each sampled event was 0.401 cfs (180 gpm) while the system’s design flow rate is 0.394 cfs (177 gpm). These data indicate the system was able to meet the phosphorus treatment goal at a flow rate that slightly exceeded this design flow rate.


KriStar Perk Filter Stormwater Treatment System Performance Monitoring
Introduction
Herrera Environmental Consultants (Herrera) conducted hydrologic and water quality monitoring for KriStar Enterprises, Inc. at a test installation of the Perk Filter treatment system (Perk Filter) installed at the Washington State Ferries Bainbridge Island Terminal (Figure 1). This monitoring was performed over a 12-month period, from February 2009 through February 2010, to obtain performance data to support the issuance of a General Use Level Designation (GULD) for the Perk Filter by the Washington State Department of Ecology (Ecology). This monitoring was performed in accordance with procedures described in Guidance for Evaluating Emerging Stormwater Treatment Technologies; Technology Assessment Protocol – Ecology (TAPE) (Ecology 2008a).
TAPE guidelines indicate that a technical evaluation report (TER) must be completed for any stormwater treatment system under consideration for a GULD. Specifically, the TER should:
Document treatment performance of a technology to show that it will achieve Ecology’s performance goals for target pollutants, as demonstrated by field testing performed in accordance with the TAPE
Demonstrate the technology is satisfactory with respect to factors other than treatment performance (e.g., maintenance)
This document is the TER for the Perk Filter, and was prepared by Herrera to demonstrate satisfactory performance of the Perk Filter in meeting goals specified by Ecology (2008) for basic treatment and phosphorus treatment.
Initial laboratory testing using Sil-Co-Sil 106 indicated that, at the approved flow rate of 0.0013 cfs (0.567 gpm) per inch of cartridge height, the Perk Filter was able to attain a total suspended solids removal efficiency of 82 percent, with an average influent concentration of 102 milligrams per liter (mg/L) (Ecology 2008b). In a separate bench scale study, artificial stormwater was generated using a street dirt slurry (OWP 2009). In this study, influent total suspended solids averaged 99 mg/L, while influent total phosphorus averaged 0.15 mg/L. Three test runs at the approved flow rate of 0.0013 cfs (0.567 gpm) per inch of cartridge height resulted in a removal efficiency of 88 and 41 percent for total suspended solids and total phosphorus, respectively (OWP 2009).
The results from these studies support Kristar’s performance claim that at a flow rate of 0.0013 cfs (0.567 gpm) per inch of cartridge height, the Perk Filter can attain the Ecology goal of greater than 80 percent reduction in influent total suspended solids concentrations. Kristar also believes that the system under the same flow conditions may be able to attain Ecology’s phosphorus reduction goal of 50 percent (Ecology 2008a).
In accordance with these goals, monitoring data from the Perk Filter installation at the Bainbridge Island Terminal showed the system achieved 83 percent removal for total suspended
jr 08-03958-000 kristar ter.doc
June 4, 2010 1 Herrera Environmental Consultants

BIPF
OLYMPIC DRIVE
1226100
1226100
1226250
1226250
1226400
1226400
1226550
1226550
1226700
1226700
1226850
1226850
1227000
1227000
1227150
1227150
2314
50
2314
50
2316
00
2316
00
2317
50
2317
50
2319
00
2319
00
2320
50
2320
50
K:/P
roje
cts/
08-0
3958
-000
Pro
ject
s/S
torm
wat
er m
onito
ring
loca
tion
site
.mxd
(10/
09/0
8) J
AS
0 125 25062.5ft
Coordinates: WA State Plane NorthNAD 83 (feet)
Figure 1. Vicinity map of the Perk Filter monitoring site (BIPF) at the Bainbridge Island ferry terminal.
LegendMonitoring site location (BIPF)
P A C
I F I C
O C
E A N
O R E G O N
I D A
H OArea of
map detail
Drainage basin boundary

KriStar Perk Filter Stormwater Treatment System Performance Monitoring
jr 08-03958-000 kristar ter.doc
June 4, 2010 3 Herrera Environmental Consultants
solids and 71 percent for total phosphorus. These values represent the median removal efficiency for each parameter. The data and analyses used to determine these performance results are described within this TER. Pursuant to Ecology guidelines, this information is presented under the following major headings:
Technology Description Sampling Procedures Data Summaries Evaluation of Performance Goals Conclusions


KriStar Perk Filter Stormwater Treatment System Performance Monitoring
Technology Description
The Perk Filter provides water quality treatment of captured flows through a variety of physical and chemical unit processes. This section describes the system, treatment processes, sizing methods, expected treatment capabilities, expected design life, and maintenance procedures.
Physical Description
The configuration of a Perk Filter consists of three attached chambers (Figure 2): the inlet gallery, the cartridge chamber, and the outlet chamber. The inlet gallery acts as a settling basin, the cartridge chamber contains media cartridge filters, and the outlet chamber collects the flow from the cartridges and bypass and routes it to the outlet pipe. The media cartridges can be removed and replaced to maintain the treatment performance within an acceptable range; the settling chamber improves the filter performance and extends the cartridge life. The primary components of the Perk Filter are described below.
Structure
The Perk Filter is housed in a concrete catch basin or vault that is available in a variety of precast sizes, from a 2-foot by5-foot by 2-foot catch basin holding one 12-inch tall cartridge to an 8-foot by 18-foot by 10-foot vault holding 31 stacked 12-inch and 18-inch tall cartridges. Custom sizes and combinations of multiple unit structures are also possible.
Typically, each Perk Filter vault is designed and constructed to withstand traffic loads. The vault floor and walls are manufactured from 6-inch thick reinforced concrete. The top slab of the Perk Filter is manufactured with a minimum of 6-inch thick reinforced concrete. A perspective schematic of the Perk Filter is provided in Figure 2, while Figure 3 provides a plan view and cross section design drawing. The Perk Filter can also be configured with a steel catch basin for applications where a concrete vault would not be appropriate (e.g., installation on a bridge structure). See Appendix A for schematics of various Perk Filter configurations.
Inlet
Stormwater enters the Perk Filter via a grated surface inlet or a piped subsurface inlet. The inlet pipe can be installed to enter the inlet gallery on any of the three exposed sides. The maximum inlet pipe diameter is 24 inches, but larger pipes can be accommodated if required. If a grated inlet is required, the vault in configured with a steel grate rated for typical traffic loads.
Inlet Gallery
The inlet gallery consists of a settling chamber, an inlet pipe or grate, and an inlet weir/bypass assembly. Stormwater enters through the inlet and pools in the settling chamber before moving into the inlet weir/bypass assembly.
jr 08-03958-000 kristar ter.doc
June 4, 2010 5 Herrera Environmental Consultants
N
Notes
HERRERAENVIRONMENTAL CONSULTANTS
0 1000 2000
Approximate scale in feet
4000
G:\Graphics\08-03958-000 Kristar\08-03958-000 Figure 2.ai
Figure 2.Perspective diagram of the Perk Filter installed at the Bainbridge Island ferry terminal.
1. Precase concrete structure shall be manufactured in accordance with ASTM Designation C857 and C858.
2. Filter system shall be supplied with traffic rated (H20) bolted & gasheted access covers. Concrete collar as required.
3.Inlet & outlet pipe(s) (24” dia. maximum) may enter device on all three sides of the inlet & outlet chambers respectively. For pipe sizes greater than 24’ dia., contact Kristar Enterprises for engineering assistance.
4. Inlet chamber shall be supplied with drain down device, designed to remove standing water between storm events.
5. Perk-Filter systems may be supplied with individual or multiple 18” or 12” high Perk-Filter cartridge. Filter cartridge may be stacked to accommodate higher flow rates. Contact Kristar Enterprises for capacities.
6. For depths less than specified minimums contact Kristar Enterprises for engineering assistance.
7. Information provided by Kristar Enterprises, Inc.
Secondary Cartridge Bypass
Filter ChamberAccess Hatches
(see note 2)
Inlet Gallery
Inlet Weir / Bypass Assembly
Inlet Pipe(see note 3)
Outlet ChamberOutlet Pipe(see note 3)
Vented Outlet Hood
Perk-Filter Cartridge Stack

3.

KriStar Perk Filter Stormwater Treatment System Performance Monitoring
Inlet Weir/Bypass Assembly
The inlet weir/bypass assembly consists of two floatables weirs, two bypass weirs, four flow thru tubes, and a perforated drain down tube (the number of bypass weirs and flow thru tubes will vary depending upon the design). After stormwater moves through the inlet gallery it then must pass underneath the floatables weir before it can pass into the cartridge chamber through a set or four 3-inch by 4-inch flow thru tubes (Figures 2 and 3, Appendix A). If inflow exceeds the capacity of the cartridges in the cartridge chamber, then the water level in the inlet gallery will rise above the flow thru tubes until it reaches the rectangular bypass weir(s) (also behind the floatables weir). Bypassed flow enters directly into the outlet chamber without passing through the cartridge chamber. Once the storm event has ended, remnant water in the influent gallery is drained into the cartridge chamber via a 3/8-inch diameter perforated drain down tube. The floatables weirs, bypass weirs, flow thru tubes, and perforated drain down are all constructed of stainless steel and fastened to the concrete structure with expansion bolts and finally sealed with non-shrink polyurethane grout.
Cartridge Chamber
The cartridge chamber is the portion of the vault that contains the cartridge stacks. Numerous cartridge configurations are possible depending upon the site requirements. The height, width, and length of the cartridge chamber are dependent on the number of cartridges required for treatment. The floor of the cartridge chamber contains a circular depression for each cartridge and a cored 2-inch diameter hole in the center of each depression. These holes connect the cartridge chamber with the underlying outlet chamber (Figures 2 and 3, Appendix A). For water to pass through these holes, it must first pass through the Perk Filter cartridges.
Perk Filter Cartridges
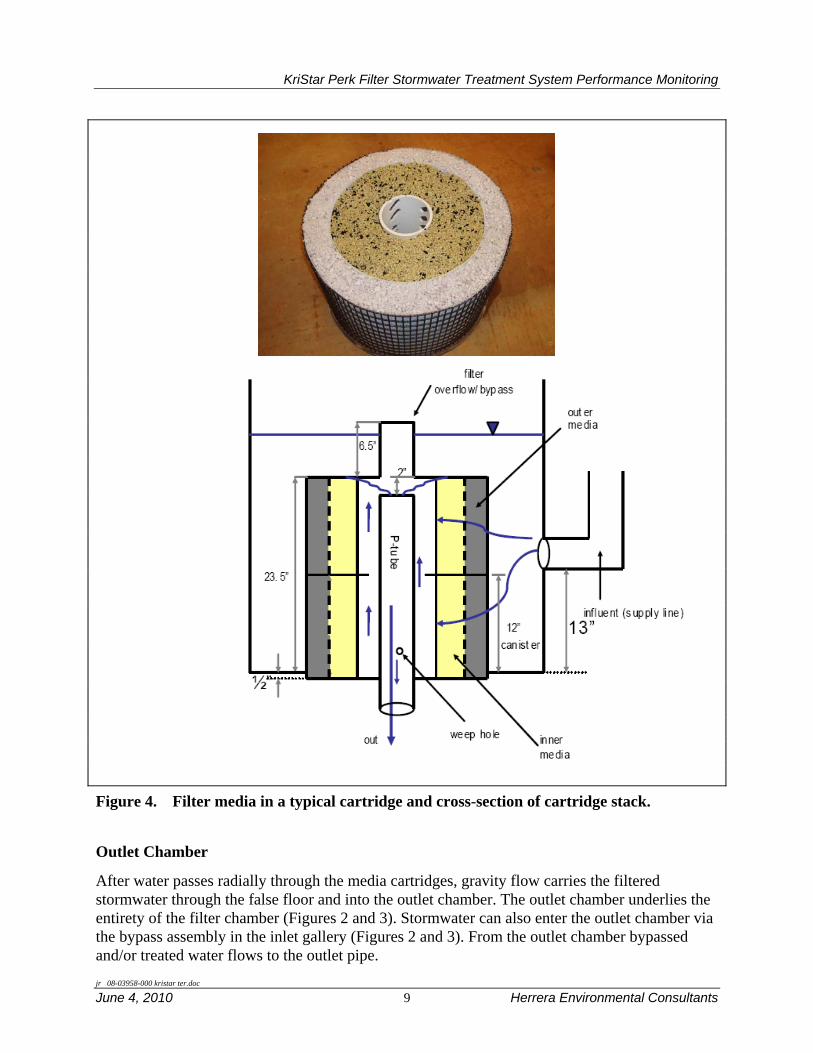
The Perk Filter cartridge consists of an 18-inch diameter polymer-coated cylindrical steel support screen that is manufactured in either a 12- or 18-inch height. Lining the interior of the support screen is a finer screen layer, a granular media layer, a second screen layer, followed by a second granular media layer (Figure 4). In total, the granular media within the cartridge is 17.25 inches in diameter. At the center of the cartridge is a perforated 4-inch polyvinyl chloride (PVC) central tube encasing a 2-inch PVC control tube that permits water to enter through the top and exit through the bottom (Figure 4). A cartridge bypass is located on top of the cartridge where a second 2-inch PVC tube controls the bypass water level in the filter chamber (Figure 4).
Various media are available for use in the Perk Filter. Appendix B provides the manufacturer specifications for the engineered filter media. The media include zeolite, perlite, and granulated activated carbon (GAC). The media configuration tested during this study consisted of a perlite outer layer and zeolite and GAC inner layer. However, previous to April 30, 2009 the perlite was not separated from the zeolite and GAC. Consequently, data from February 20, 2009 (the initiation of monitoring) to April 30, 2009 (when cartridges with properly configured media were installed) were not included in the final analysis.
jr 08-03958-000 kristar ter.doc
Herrera Environmental Consultants 8 June 4, 2010
KriStar Perk Filter Stormwater Treatment System Performance Monitoring
Figure 4. Filter media in a typical cartridge and cross-section of cartridge stack.
Outlet Chamber
After water passes radially through the media cartridges, gravity flow carries the filtered stormwater through the false floor and into the outlet chamber. The outlet chamber underlies the entirety of the filter chamber (Figures 2 and 3). Stormwater can also enter the outlet chamber via the bypass assembly in the inlet gallery (Figures 2 and 3). From the outlet chamber bypassed and/or treated water flows to the outlet pipe. jr 08-03958-000 kristar ter.doc
June 4, 2010 9 Herrera Environmental Consultants
KriStar Perk Filter Stormwater Treatment System Performance Monitoring
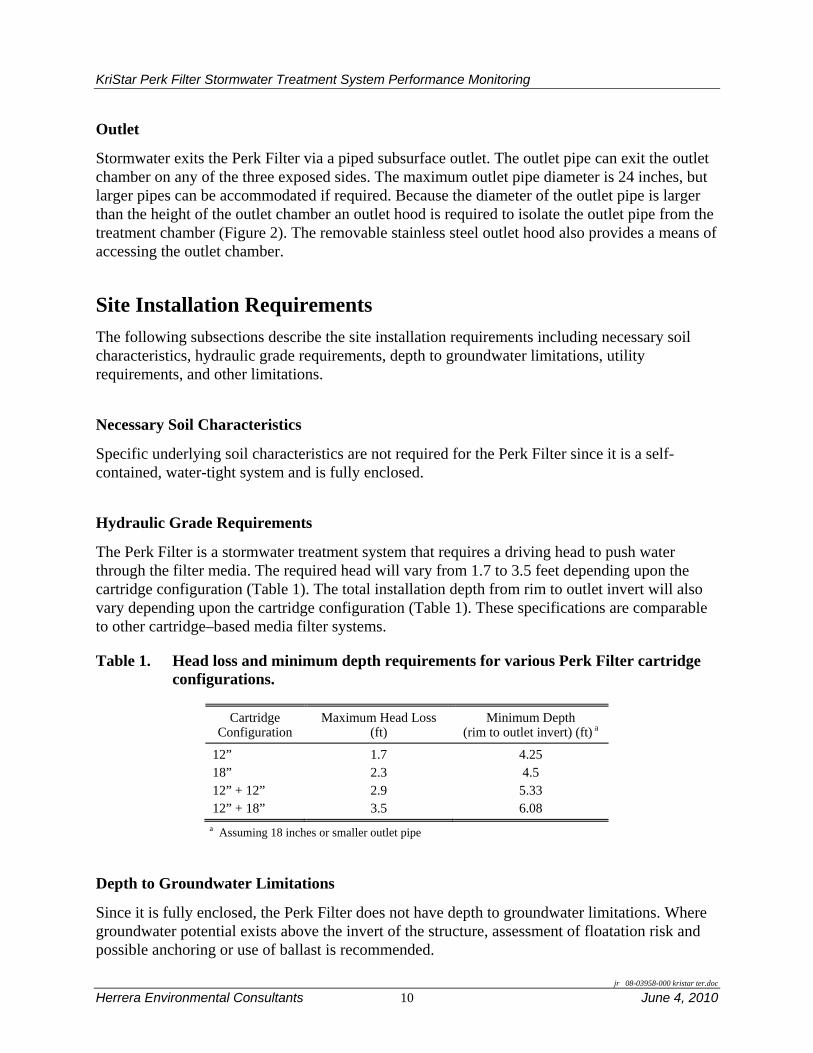
Outlet
Stormwater exits the Perk Filter via a piped subsurface outlet. The outlet pipe can exit the outlet chamber on any of the three exposed sides. The maximum outlet pipe diameter is 24 inches, but larger pipes can be accommodated if required. Because the diameter of the outlet pipe is larger than the height of the outlet chamber an outlet hood is required to isolate the outlet pipe from the treatment chamber (Figure 2). The removable stainless steel outlet hood also provides a means of accessing the outlet chamber.
Site Installation Requirements The following subsections describe the site installation requirements including necessary soil characteristics, hydraulic grade requirements, depth to groundwater limitations, utility requirements, and other limitations.
Necessary Soil Characteristics
Specific underlying soil characteristics are not required for the Perk Filter since it is a self-contained, water-tight system and is fully enclosed.
Hydraulic Grade Requirements
The Perk Filter is a stormwater treatment system that requires a driving head to push water through the filter media. The required head will vary from 1.7 to 3.5 feet depending upon the cartridge configuration (Table 1). The total installation depth from rim to outlet invert will also vary depending upon the cartridge configuration (Table 1). These specifications are comparable to other cartridge–based media filter systems.
Table 1. Head loss and minimum depth requirements for various Perk Filter cartridge configurations.
Cartridge Configuration
Maximum Head Loss (ft)
Minimum Depth (rim to outlet invert) (ft) a
12” 1.7 4.2518” 2.3 4.512” + 12” 2.9 5.3312” + 18” 3.5 6.08
a Assuming 18 inches or smaller outlet pipe
Depth to Groundwater Limitations
Since it is fully enclosed, the Perk Filter does not have depth to groundwater limitations. Where groundwater potential exists above the invert of the structure, assessment of floatation risk and possible anchoring or use of ballast is recommended.
jr 08-03958-000 kristar ter.doc
Herrera Environmental Consultants 10 June 4, 2010

KriStar Perk Filter Stormwater Treatment System Performance Monitoring
The Perk Filter is configured with a drain down mechanism, thus any groundwater entering the system will drain away and will not affect the media or performance of the Perk Filter.
Utility Requirements
The Perk Filter is designed to be a passive system requiring no power and has a free-draining outfall to an appropriate water conveyance or storage system (i.e., wet pond, storm sewer, underground infiltration).
Treatment Processes
The Perk Filter provides water quality treatment of captured flows through physical and chemical unit processes. Runoff treatment is achieved through separation, sedimentation, filtration, and adsorption.
Separation
A floatables weir located in the inlet gallery prevents the majority of floatable gross solids and oils from entering the filter chamber or bypass. Water must pass under the weir to move past the weir; this prevents floatable materials from exiting the inlet gallery. Floatables removed include: trash, litter, surfactants, oil, and grease.
Sedimentation
The Perk Filter is designed to reduce flow velocities in the inlet gallery, the filter chamber, and the filter cartridges. This promotes gravity settling of entrained particles. Settling of large particles in the inlet gallery acts as a pretreatment mechanism that improves system performance and extends the life of the filter cartridges. The amount of sedimentation is a function of particle density, size, water density, turbulence, and residence time.
Filtration
Particulates are physically removed from suspension as they come into contact with the filter media. The filter retains those particles that are unable to follow the tortuous channels of connected void space within the filter. Pollutant removal rates achieved through filtration are a function of the stormwater composition and media properties including permeability, grain size, and hydraulic conductivity.
Adsorption
Unlike filtration, where physical processes control removal of sediment from suspension, adsorption relies on opposing surface charges of media and dissolved species to remove pollutants from stormwater. The granular media contains material with a high surface area so that the binding sites are numerous and not easily exhausted. In addition, the filter media has a jr 08-03958-000 kristar ter.doc
June 4, 2010 11 Herrera Environmental Consultants

KriStar Perk Filter Stormwater Treatment System Performance Monitoring
high cation exchange capacity which promotes the removal of positively charged dissolved pollutants (including metal ions) from solution.
Sizing Methods
The following subsections describe the sizing methods for western and eastern Washington based on the provisional 0.567 gallons per minute per inch of cartridge height flow rate established in the pilot use-level designation PULD. This flow rate may be adjusted in the future depending on feedback from Ecology or acquisition of additional data.
Western Washington
Perk Filters designed for use in western Washington are sized using the Western Washington Hydrology Model, Version 3 (WWHM3), or another continuous hydrologic model approved by Ecology, to filter 91 percent of the annual stormwater volume.
For preliminary sizing purposes, a sizing table was developed that provides maximum contributing areas for each of the standard Perk Filter cartridge configurations (Table 2). The sizing table was generated based on a developed (“mitigated”) basin that consists of a flat parking area located in two western Washington regions, Seattle (36 inches annually) and Quilcene (62.3 inches annually). The sizing table is to be used for planning level use only. The design engineer must use a continuous model with the site-specific drainage area and precipitation to confirm that the unit will treat the required volume.
Table 2. Perk Filter sizing table for western Washington.
Cartridge Configuration
Cartridge Design Flow Rate (gpm/cartridge stack)
Basin Area for 91% Treatment with 36” Annual Rainfall (acres/cartridge stack) a
Basin Area for 91% Treatment with 62.3” Annual Rainfall
(acres/cartridge stack) a
12” 6.8 0.101 0.068 18” 10.2 0.151 0.102 12” + 12” 13.6 0.201 0.136 12” + 18” 17.0 0.251 0.170 a KriStar manufactures vault that can hold up to 31- to 30-inch cartridge stacks, but larger systems can be custom ordered. Notes: 1. Sizing table intended for planning level use. The design engineer must use WWHM3 and the site location mapping to calculate
the appropriate sized facility. 2. Sizing table based on WWHM3 parking/flat basin (100 percent impervious) and SeaTac rain gage with precipitation factor
of 1.0.
Eastern Washington
Perk Filters designed for use in eastern Washington are sized using HydroCAD, StormSHED, or another single event model to treat the 6-month water quality design storm. For preliminary sizing purposes, a sizing table was developed that provides maximum contributing areas for each
jr 08-03958-000 kristar ter.doc
Herrera Environmental Consultants 12 June 4, 2010
KriStar Perk Filter Stormwater Treatment System Performance Monitoring
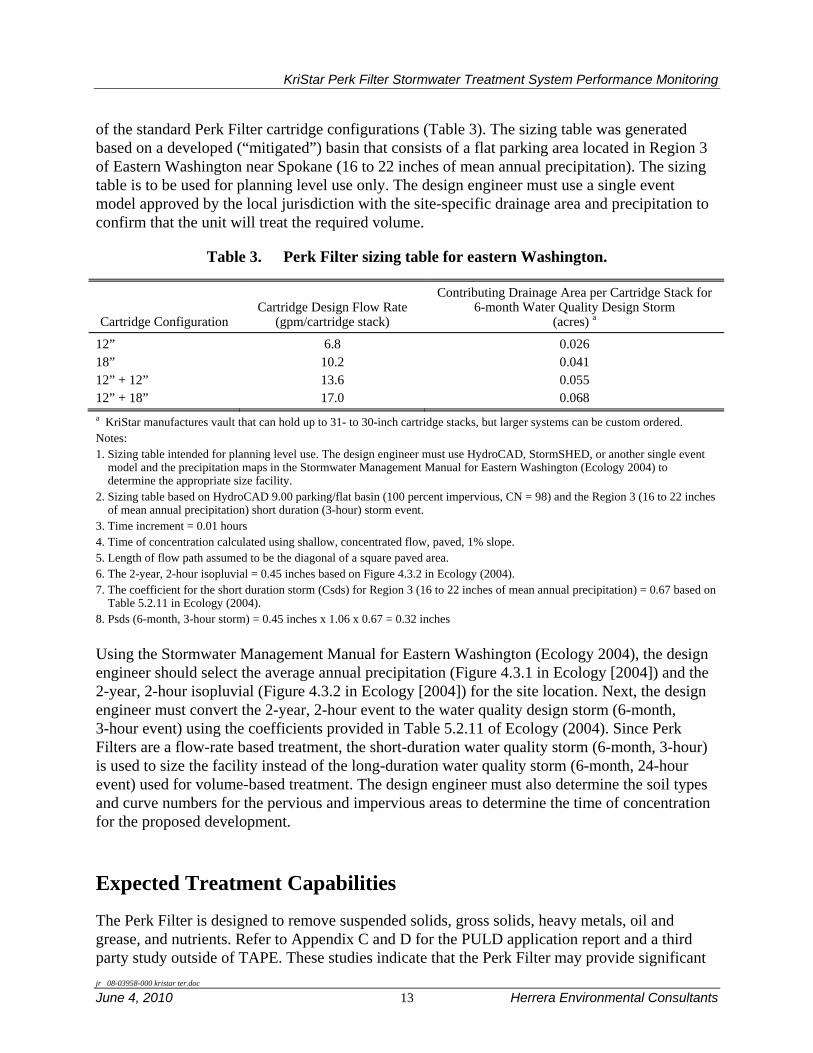
of the standard Perk Filter cartridge configurations (Table 3). The sizing table was generated based on a developed (“mitigated”) basin that consists of a flat parking area located in Region 3 of Eastern Washington near Spokane (16 to 22 inches of mean annual precipitation). The sizing table is to be used for planning level use only. The design engineer must use a single event model approved by the local jurisdiction with the site-specific drainage area and precipitation to confirm that the unit will treat the required volume.
Table 3. Perk Filter sizing table for eastern Washington.
Cartridge Configuration Cartridge Design Flow Rate
(gpm/cartridge stack)
Contributing Drainage Area per Cartridge Stack for 6-month Water Quality Design Storm
(acres) a
12” 6.8 0.026 18” 10.2 0.041 12” + 12” 13.6 0.055 12” + 18” 17.0 0.068 a KriStar manufactures vault that can hold up to 31- to 30-inch cartridge stacks, but larger systems can be custom ordered. Notes: 1. Sizing table intended for planning level use. The design engineer must use HydroCAD, StormSHED, or another single event
model and the precipitation maps in the Stormwater Management Manual for Eastern Washington (Ecology 2004) to determine the appropriate size facility.
2. Sizing table based on HydroCAD 9.00 parking/flat basin (100 percent impervious, CN = 98) and the Region 3 (16 to 22 inches of mean annual precipitation) short duration (3-hour) storm event.
3. Time increment = 0.01 hours 4. Time of concentration calculated using shallow, concentrated flow, paved, 1% slope. 5. Length of flow path assumed to be the diagonal of a square paved area. 6. The 2-year, 2-hour isopluvial = 0.45 inches based on Figure 4.3.2 in Ecology (2004). 7. The coefficient for the short duration storm (Csds) for Region 3 (16 to 22 inches of mean annual precipitation) = 0.67 based on
Table 5.2.11 in Ecology (2004). 8. Psds (6-month, 3-hour storm) = 0.45 inches x 1.06 x 0.67 = 0.32 inches Using the Stormwater Management Manual for Eastern Washington (Ecology 2004), the design engineer should select the average annual precipitation (Figure 4.3.1 in Ecology [2004]) and the 2-year, 2-hour isopluvial (Figure 4.3.2 in Ecology [2004]) for the site location. Next, the design engineer must convert the 2-year, 2-hour event to the water quality design storm (6-month, 3-hour event) using the coefficients provided in Table 5.2.11 of Ecology (2004). Since Perk Filters are a flow-rate based treatment, the short-duration water quality storm (6-month, 3-hour) is used to size the facility instead of the long-duration water quality storm (6-month, 24-hour event) used for volume-based treatment. The design engineer must also determine the soil types and curve numbers for the pervious and impervious areas to determine the time of concentration for the proposed development.
Expected Treatment Capabilities
The Perk Filter is designed to remove suspended solids, gross solids, heavy metals, oil and grease, and nutrients. Refer to Appendix C and D for the PULD application report and a third party study outside of TAPE. These studies indicate that the Perk Filter may provide significant jr 08-03958-000 kristar ter.doc
June 4, 2010 13 Herrera Environmental Consultants

KriStar Perk Filter Stormwater Treatment System Performance Monitoring
removal of several stormwater pollutants of concern, including total suspended solids, total phosphorus, and select heavy metals (OWP 2009).
Laboratory testing demonstrated that the Perk Filter was effective as a stormwater treatment best management practice (BMP), could meet Ecology’s performance goals for basic treatment, and has the potential to meet Ecology’s goal for phosphorus treatment. The following are the Findings of Fact as reported in the PULD designation letter (Ecology 2008b):
Based on laboratory testing at a flow rate of 12 gpm per filter, the Perk Filter™ containing ZPC media had an average total suspended solids removal efficiency of 82 percent using Sil-Co-Sil 106 with an average influent concentration of 102 mg/L and zero initial sediment loading
Based on laboratory testing at a flow rate of 4 gpm per filter, the Perk Filter™ containing ZC media had an average total suspended solids removal efficiency of 84 percent using Sil-Co-Sil 106 with an average influent concentration of 101.5 mg/L and zero initial sediment loading
Since the PULD designation (Ecology 2008b) was issued, additional laboratory testing using street dust in place of Sil-Co-Sil 106 has been conducted by the Sacramento State University Office of Water Programs. In this second study it was found that the ZPC filter media run at the Ecology recommended design flow rate of 0.0013 cfs (0.567 gpm) per inch of cartridge height was able to reduce total suspended solids, total phosphorus, soluble reactive phosphorus, total copper, total aluminum, and total zinc, by 88, 40, 63, 62, 76, and 57 percent , respectively. The results of this additional sampling can be found in Appendix D.
Expected Design Life
The Perk Filter vault, inlet weir/bypass assembly, and outlet hood are designed to last 25 years before needing maintenance or replacement. The manufacturer recommends that, on average, the filter media be replaced once per year. If pollutant loading is abnormally high, however (e.g., due to roadway sanding or construction runoff), cartridges may need more frequent replacement. Conversely, if pollutant loading is abnormally low (e.g., low use parking lot with routine street sweeping), then the filters need not be replaced each year.
Maintenance Procedures
Routine, semi-annual maintenance for the Perk Filter is recommended on the following schedule:
For areas with a definite rainy season: prior to and after the rainy season
For areas subject to year-round rainfall: on a recurring basis (at least two times per year)
jr 08-03958-000 kristar ter.doc
Herrera Environmental Consultants 14 June 4, 2010

KriStar Perk Filter Stormwater Treatment System Performance Monitoring
jr 08-03958-000 kristar ter.doc
June 4, 2010 15 Herrera Environmental Consultants
For areas with winter snow and summer rain: prior to and just after the snow season
For installed devices not subject to the elements (washracks, parking garages, etc.): On a recurring basis (no less than two times per year)
Maintenance should follow procedures given in the most recent version of the Perk Filter Operation, and Maintenance Manual (Appendix E). Perk Filter maintenance consists of the following steps:
The inlet manhole cover(s) and or grate(s) shall be removed and placed to one side.
Any floatable materials will be removed from the inlet bay(s) and disposed of in accordance with local regulations.
The standing water shall be checked for clarity, oils and hydrocarbons, and the depth of the collected silt and sediment will be measured.
The filter media within the Perk Filter cartridge(s) will be replaced once per year.
If sediment level exceeds manufacturer’s recommended level for effective operation, an industrial vacuum shall be used to carefully remove all sediment and debris.
The manhole cover(s) or grate(s) shall be replaced.


KriStar Perk Filter Stormwater Treatment System Performance Monitoring
Sampling Procedures
This section begins with a general overview of the monitoring design and describes the specific goals Ecology has established for the types of treatment that are being sought under the GULD. Separate sections then describe in more detail the site location, test system, monitoring schedule, and the specific procedures used to obtain the hydrologic and water quality data, respectively. Analytical methods, quality assurance and control measures, data management procedures, and data analysis procedures are also discussed.
Monitoring Design
To facilitate performance monitoring pursuant to the TAPE procedures, a 6- by 11-foot Perk Filter with eleven 30-inch cartridge stacks (12-inch cartridge + 18-inch cartridge) was installed for testing purposes in the holding lot for the Washington State Ferry’s Bainbridge Island Terminal (Figure 1). This system is identified herein as the Bainbridge Island Perk Filter (BIPF). Automated equipment was installed in conjunction with the BIPF test system to facilitate continuous monitoring of influent, effluent, and bypass flow volumes over a 12-month period extending from February 2009 through February 2010 (data reported for 10-month period from May 2009 through February 2010). In association with this hydrologic monitoring, automated samplers were also employed to collect flow-weighted composite samples of the influent and effluent during discrete storm events for subsequent water quality analyses.
Using the data obtained from this monitoring, removal efficiency estimates were computed for targeted monitoring parameters. These removal efficiency estimates were subsequently compared to goals identified in the TAPE to support the issuance of a GULD for the Perk Filter. These treatment goals are described below for the two types of treatment that are under consideration for inclusion in the GULD:
Basic Treatment – 80 percent removal of total suspended solids for influent concentrations that are greater than 100 mg/L, but less than 200 mg/L. For influent concentrations greater than 200 mg/L, a higher treatment goal may be appropriate. For influent concentrations less than 100 mg/L, the facilities are intended to achieve an effluent goal of 20 mg/L total suspended solids.
Phosphorus Treatment – 50 percent removal of total phosphorus for influent concentrations ranging from 0.1 to 0.5 mg/L.
Site Location
In general, most of the Bainbridge Island Terminal is on land with only the vehicle loading and unloading ramps extending over the water (Figure 1). The Bainbridge Island Terminal serves
jr 08-03958-000 kristar ter.doc
June 4, 2010 17 Herrera Environmental Consultants

KriStar Perk Filter Stormwater Treatment System Performance Monitoring
ferry traffic to and from Seattle and has an average annual daily traffic of 2,600 vehicles (Ziegler 2007 personal communication). Stormwater from parking areas and holding lanes at the Bainbridge Island terminal is collected in catch basins and conveyed via stormwater conveyance pipes to outfalls on Eagle Harbor. The BIPF test system received stormwater runoff from the terminal’s holding lanes for vehicles waiting to board the ferry. Treated effluent from the system is discharged to Eagle Harbor via a single outfall. The drainage area of the holding lanes is approximately 1.69 acres (see site map in Figure 1 for delineation), and generally slopes from the northwest to the southeast to the water’s edge with a grade of approximately 5.0 percent. The installation location for the BIPF test system within this drainage basin is designated “BIPF” in Figure 1. Design drawings of the installation are presented in Appendix F.
Pollutant generating surfaces within the basin include the parking lot surface and a portion of the roadway leading to the ferry dock. Tire, brake, and engine wear, coupled with leaking petroleum-based substances, and atmospheric deposition constitute the majority of the avenues of pollutant deposition on the parking lot and roadway surface.
Monitoring Schedule Hydrologic and water quality monitoring were conducted at the BIPF test system over a 1-year period from February 2009 through February 2010. However, because the data collected from February 2009 and April 2009 were representative of system performance with improperly installed media (see discussion above), only the data from May 2009 through February 2010 are presented herein. During this monitoring period, a total of 22 separate storm events were successfully sampled.
Test System Description The physical configuration of the BIPF test system is provided below, followed by a brief summary of bypass conditions and a maintenance schedule for the test system.
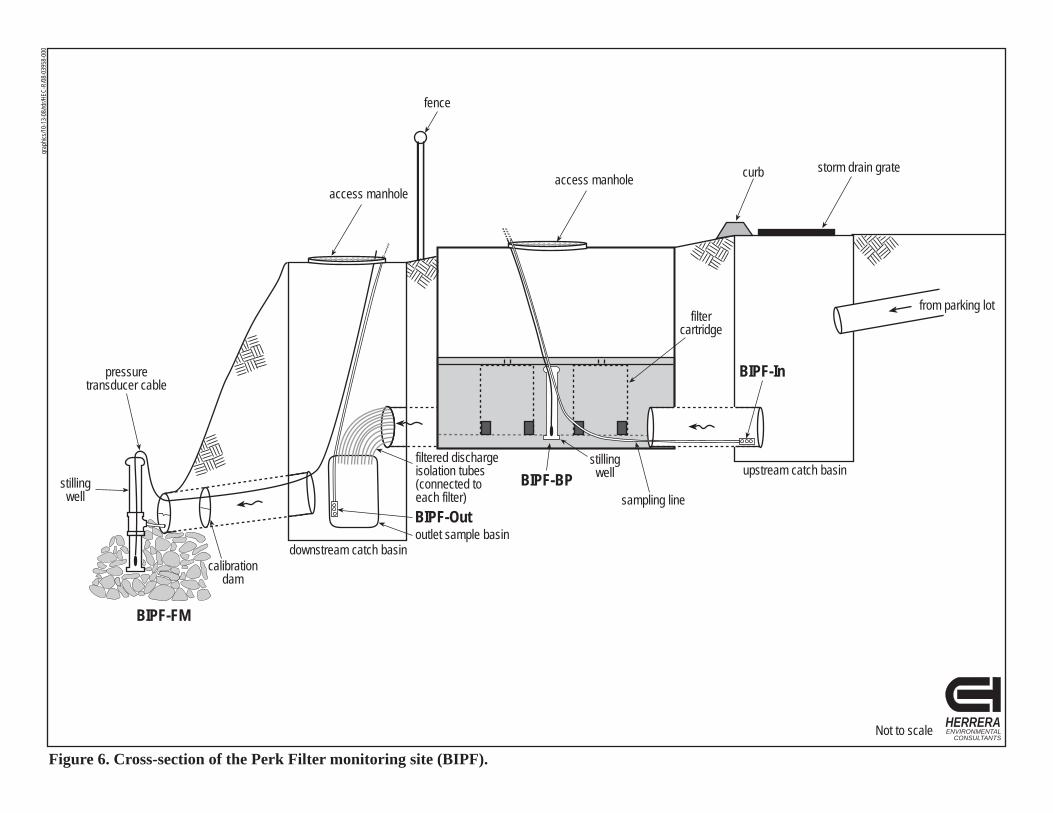
The BIPF test system consists of a 7- by 12-foot vault (external dimensions) with eleven 30-inch (12-inch cartridge stacked on top of an 18-inch cartridge) high cartridge stacks (Figures 2 and 3). The system was constructed with an 18-inch smooth-walled PVC inlet pipe that enters the northwest wall of the inlet gallery. Water exits the system through an 18-inch smooth-walled PVC outlet pipe located on the southeast wall of the filter/outlet chamber. The filtered and bypassed exits the system and then enters a second catch basin and finally flows from the catch basin to the outfall through an 18-inch smooth-walled PVC pipe (Figures 5 and 6).
Because bypassed flow and treated flow mix in the outlet chamber, it was not possible to sample only the treated stormwater without altering the system’s flow routing. To facilitate sampling of only the treated flow, 2-inch flexible vinyl tubes, or ‘treated-flow isolation tubing’, were connected to the bottom of each filter cartridge and routed through the outlet chamber, the outlet pipe, and into the downstream catch basin (Figures 5 and 6). Within the downstream catch basin,
jr 08-03958-000 kristar ter.doc
Herrera Environmental Consultants 18 June 4, 2010

HERRERAENVIRONMENTAL
CONSULTANTS
grap
hics/1
0-13
-08/r
dr/H
EC-R
/08-0
3958
-000
Figure 5. Plan view diagram of the Perk Filter monitoring site (BIPF).
outlet sample basin
curb
storm drain grate
to outfall
from parking lot
sampling instrumentenclosure
stilling well
stilling well
filter cartridgecalibration
dam
BIPF-FM
BIPF-BP BIPF-
In
Not to scale
sampling line
pressure transducer cable
BIPF-RG
filtered discharge
isolation tubes
fence
x
x
x
x
x
x
x
x
x
weir
BIPF-Out
HERRERAENVIRONMENTAL
CONSULTANTSNot to scale
Figure 6. Cross-section of the Perk Filter monitoring site (BIPF).
grap
hics/1
0-13
-08/r
dr/H
EC-R
/08-0
3958
-000
storm drain grateaccess manhole
access manhole
stilling well
filter cartridge
BIPF-Out
BIPF-BP
BIPF-In
stilling well
pressure transducer cable
calibrationdam
from parking lot
BIPF-FM
upstream catch basin
downstream catch basinoutlet sample basin
curb
sampling line
filtered dischargeisolation tubes(connected to each filter)
fence

KriStar Perk Filter Stormwater Treatment System Performance Monitoring
the separate treated-flow isolation tubing from each of the cartridges was routed to a single “outlet sampling” container. In this way, treated flow from all 11 cartridges was segregated from bypass (untreated flow) and collected at a single location.
The installation of the treated-flow isolation tubing was completed on April 30, 2009. Because the effluent water quality data collected before this date (February 2009 through April 2009) may have been contaminated by bypasses stormwater, the associated data were excluded from analysis in this report. See the Data Summaries section for further discussion.
During installation of treated-flow isolation tubing, routine maintenance activities were also performed on the BIPF test system (see detailed documentation of these activities in Appendix G). During these maintenance activities, field personnel noted that the media was not installed properly within the BIPF’s existing cartridges. Specifically, the zeolite, perlite, and GAC were not segregated as shown in Figure 4; in addition, the media had settled in the cartridges and to create a 2-inch gap at the top of the cartridges with no media. The improperly installed media, coupled with high sediment loading (potentially from residual construction runoff), caused the media to fail prematurely.
Due to these considerations, the existing cartridges from the original BIPF installation were removed on April 30, 2009 and replaced with new cartridges having properly installed media. Because the data collected from February 2009 to April 2009 were representative of system performance with improperly installed media, those data were excluded from this analysis.
Test System Sizing
In accordance with Ecology requirements (Ecology 2005), the BIPF test system must provide effective treatment for 91 percent of the annual runoff volume. To size the system to treat 91 percent of the annual runoff volume the Western Washington Hydrologic Model version 3 (WWHM3) was run with the following input parameters:
Basin area = 1.69 acres Simulated rainfall station = Quilcene gauge with 0.8 conversion factor Percent Impervious = 100 51-year simulation period (October 1948 – September 1999) Basin slope = moderate (5 to 15 percent)
For this evaluation, WWHM3 was run at a 15-minute time step for a 48-year simulation period (October 1948 to September 1996) to determine the design flow rate required to meet the treatment goal identified above. The resultant design flow rate from this modeling was 0.394 cfs (177 gpm). In the Perk Filter PULD, Ecology recommended a cartridge flow rate of 0.0013 cfs (0.567 gpm) per inch of cartridge height. Using this value and the modeled flow rate, it was determined that 307 inches of cartridge height were required to achieve the design flow rate. This was accomplished by installing eleven 30-inch tall cartridges, for a total of 330 inches of cartridge height.
jr 08-03958-000 kristar ter.doc
June 4, 2010 21 Herrera Environmental Consultants

KriStar Perk Filter Stormwater Treatment System Performance Monitoring
Bypass Conditions
The Perk Filter is designed to be an online system with an internal bypass. As described previously in the Technology Description section, there is a primary bypass located in the inlet gallery and then a secondary bypass located at the top of each cartridge stack. During the course of monitoring for this project only the primary bypass was engaged.
Maintenance Schedule
As described above, the BIPF test system at Bainbridge Island was maintained on April 30, 2009. Maintenance activities consisted of vacuuming the inlet gallery, replacing the cartridges, and vacuuming the filter chamber. A full report of these activities is included in Appendix G. The manufacturer recommends replacing the cartridges annually and maintaining the system twice per year. The results from this study will be used by Ecology to recommend a maintenance frequency for use in Washington State.
Hydrologic Monitoring Procedures
Generalized schematics of the equipment that was installed in association with the BIPF test system are provided in Figures 5 and 6. The equipment installations for each system were completed in February 2009. Continuous hydrologic monitoring was performed in conjunction with the BIPF test system at three separate monitoring stations: BIPF-BP, BIPF-FM, and BIPF-RG (Figures 5 and 6). BIPF-BP was a bypass flow monitoring station, BIPF-FM was an influent/effluent flow monitoring station that was located at the outlet but was used to represent both inlet and outlet flow, and BIPF-RG was a precipitation monitoring station. These hydrologic monitoring stations are discussed in separate subsections below, followed by a summary of the maintenance procedures performed on the monitoring equipment. These monitoring procedures are also described in greater detail within the quality assurance project plan (QAPP) that were prepared for this study (Herrera 2008).
Bypass Flow Monitoring (BIPF-BP)
To facilitate monitoring of bypass flow rates, a monitoring station, designated BIPF-BP, was established within the inlet gallery of the Perk Filter (Figures 5 and 6). In association with this station, an Instrumentation Northwest PS9805 (0 to 5 psi) pressure transducer was installed in a 3-inch diameter polyvinyl chloride (PVC) stilling well within the inlet gallery and behind the bypass weir. The bypass weir consisted of two 2-foot wide rectangular weirs with end constrictions. The pressure transducer was interfaced with a Campbell Scientific CR1000 datalogger. The datalogger was programmed to scan every 10 seconds and record average water levels behind the bypass weir on a 5-minute time step. When bypass occurred, the datalogger converted these water level readings to estimates of discharge based on standard hydraulic equations (Walkowiak 2006).
jr 08-03958-000 kristar ter.doc
Herrera Environmental Consultants 22 June 4, 2010

KriStar Perk Filter Stormwater Treatment System Performance Monitoring
The datalogger was powered with a Dyno 12 volt deep cycle marine battery that was charged with an 85 Watt Kyocera solar panel. Remote communications with the datalogger were established with a Raven XTV digital cellular modem.
Influent/Effluent Flow Monitoring Station (BIPF-FM)
To facilitate continuous monitoring of influent and effluent flow rates, a monitoring station, designated BIPF-FM, was established at the end of the 18-inch outlet pipe (Figures 5 and 6). A 15-inch Thel-Mar weir with an 18-inch adapter plate was installed at the end of the pipe and a hole was drilled through the face of the weir for connecting a section of reinforced 3/8-inch internal diameter (ID) polyethylene tubing. The other end of the tubing was connected to a stilling well that was constructed from 3-inch diameter PVC pipe. The stilling well was buried in the quarry spall near the outfall (Figures 5 and 6). An Instrumentation Northwest PS9805 submersible pressure transducer (0 to 1 psi) was installed in the stilling well to measure water levels behind the Thel-Mar weir. Initially, the BIPF-FM station was installed at the inlet to the downstream catch basin; however, when the treated-flow isolation tubing (see description above) was installed on April 30, 2010, there was no longer sufficient room in the pipe for the weir; therefore, the monitoring location was moved downstream to outlet pipe.
The BIPF-FM pressure transducer was interfaced with the same Campbell Scientific CR1000 datalogger described above for the BIPF station. The datalogger converted water level readings in the stilling well (which were equivalent water levels behind the Thel-Mar weir) to estimates of discharge based on standard hydraulic equations (Walkowiak 2006).
Precipitation Monitoring Station (BIPF-RG)
A third monitoring station, designated BIPF-RG, was established immediately east of the equipment enclosure (Figure 5) to facilitate continuous monitoring of precipitation depths. An Onset RG-2 rain gauge with a 6-inch catch was installed on an 8-foot steel pole and interfaced with the same Campbell Scientific CR1000 datalogger described above in connection with the BIPF-FM and BIPF-BP stations. The datalogger was programmed to scan every 10 seconds and totalize precipitation depth at the monitoring site on a 5-minute time step.
Monitoring Equipment Maintenance
Maintenance of the rain gauge and flow monitoring equipment was conducted on a routine basis during pre- and post-storm checks. Maintenance procedures and frequencies are summarized in Table 4. Instrument maintenance and calibration activities were documented on standardized field forms (Appendix H). Rain gauge and level calibration data can be found in the hydrologic data quality assurance memorandum in Appendix I.
Water Quality Monitoring Procedures To evaluate the water quality treatment performance of the Perk Filter test system, water quality sampling was conducted at the influent (BIPF-In) and effluent (BIPF-Out) stations (Figures 5
jr 08-03958-000 kristar ter.doc
June 4, 2010 23 Herrera Environmental Consultants

KriStar Perk Filter Stormwater Treatment System Performance Monitoring
and 6) during 22 discrete storm events over the period from May 2009 through February 2010. A general description of the procedures used for this monitoring is provided herein. A more detailed description of these procedures can also be obtained from the QAPP that was prepared for this study (Herrera 2008).
Table 4. Equipment maintenance schedule for the Perk Filter monitoring program.
Equipment Item Procedure Frequency
Rain gauge Level check Verify level with bubble indicator Monthly
Sampler Sample tubing Check integrity; verify no obstructions at opening
Every visit
Humidity indicator Check surface indicator Every visit
Pressure Sensors Desiccant Check color – when pink, exchange for new desiccant
Every visit
Level calibration Manually measure water level and recalibrate
Monthly (minimum) and before storm event (when time allows)
Weirs Level check Check bubble level on weir Monthly (minimum) and before storm event
To facilitate water quality sampling for this study, Sigma 900 full-size portable automated samplers were installed at the BIPF-In and BIPF-Out stations. The intake strainer for the automated sampler at the BIPF-In station was located in the pipe that connects the upstream catch basin to the inlet gallery; the intake strainer for the automated sampler at the BIPF-Out station was located 2 inches above the bottom of the outlet sampling container (Figures 5 and 6).
In each case, the sampler intakes were positioned to ensure the homogeneity and representativeness of the collected samples. Specifically, sampler intakes were installed to make sure adequate depth was available for sampling and to avoid capture of litter, debris, and other gross solids that might be present at the base of the channel. The sampler suction lines consisted of Teflon tubing with a 3/8-inch inner diameter.
The following conditions served as guidelines in defining the acceptability of specific storm events for sampling:
Target storm depth: A minimum of 0.15 inches of precipitation over a 24-hour period
Antecedent conditions: A period of at least 6 hours preceding the event with less than 0.04 inches of precipitation
End of storm: A continuous period of at least 6 hours after the event with less than 0.04 inches of precipitation
Antecedent conditions and storm predictions were monitored via the Internet, and a determination was made as to whether to target an approaching storm. Once a storm was targeted, field staff visited each station to verify that the equipment was operational and to start
jr 08-03958-000 kristar ter.doc
Herrera Environmental Consultants 24 June 4, 2010
KriStar Perk Filter Stormwater Treatment System Performance Monitoring
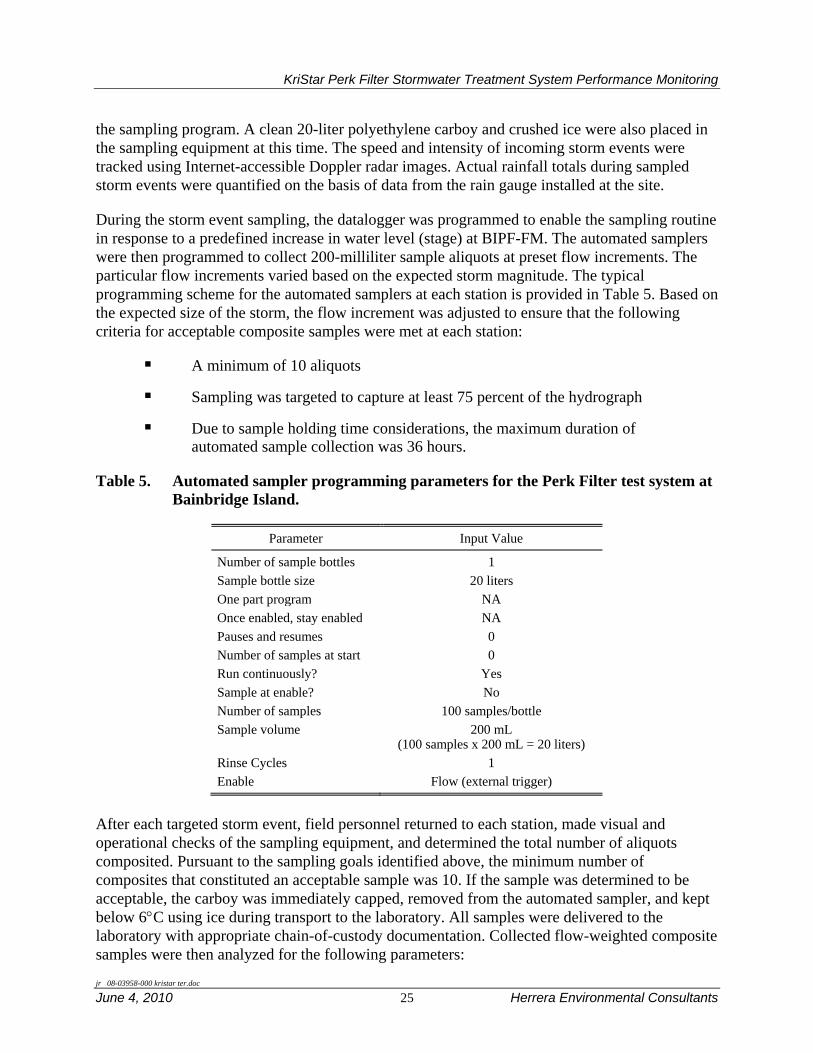
the sampling program. A clean 20-liter polyethylene carboy and crushed ice were also placed in the sampling equipment at this time. The speed and intensity of incoming storm events were tracked using Internet-accessible Doppler radar images. Actual rainfall totals during sampled storm events were quantified on the basis of data from the rain gauge installed at the site.
During the storm event sampling, the datalogger was programmed to enable the sampling routine in response to a predefined increase in water level (stage) at BIPF-FM. The automated samplers were then programmed to collect 200-milliliter sample aliquots at preset flow increments. The particular flow increments varied based on the expected storm magnitude. The typical programming scheme for the automated samplers at each station is provided in Table 5. Based on the expected size of the storm, the flow increment was adjusted to ensure that the following criteria for acceptable composite samples were met at each station:
A minimum of 10 aliquots
Sampling was targeted to capture at least 75 percent of the hydrograph
Due to sample holding time considerations, the maximum duration of automated sample collection was 36 hours.
Table 5. Automated sampler programming parameters for the Perk Filter test system at Bainbridge Island.
Parameter Input Value
Number of sample bottles 1Sample bottle size 20 litersOne part program NAOnce enabled, stay enabled NAPauses and resumes 0Number of samples at start 0Run continuously? YesSample at enable? NoNumber of samples 100 samples/bottleSample volume 200 mL
(100 samples x 200 mL = 20 liters) Rinse Cycles 1Enable Flow (external trigger)
After each targeted storm event, field personnel returned to each station, made visual and operational checks of the sampling equipment, and determined the total number of aliquots composited. Pursuant to the sampling goals identified above, the minimum number of composites that constituted an acceptable sample was 10. If the sample was determined to be acceptable, the carboy was immediately capped, removed from the automated sampler, and kept below 6°C using ice during transport to the laboratory. All samples were delivered to the laboratory with appropriate chain-of-custody documentation. Collected flow-weighted composite samples were then analyzed for the following parameters:
jr 08-03958-000 kristar ter.doc
June 4, 2010 25 Herrera Environmental Consultants

KriStar Perk Filter Stormwater Treatment System Performance Monitoring
jr 08-03958-000 kristar ter.doc
Herrera Environmental Consultants 26 June 4, 2010
Total suspended solids (TSS) Total phosphorus (TP) Soluble reactive phosphorus (SRP) Particle size distribution (PSD) pH
Additional parameters were measured, but this report only addresses those parameters that are pertinent to the basic and phosphorus treatment GULD.
Sediment Monitoring Procedures
On an approximately biannual basis, sediment depth within the inlet gallery was measured at 7 locations. The 7 depths were averaged to calculate the average sediment depth within the inlet gallery. An estimate on sediment volume was derived by multiplying the sediment depth by the area of the floor of the inlet gallery. These data were used to assess sediment accumulation within the inlet gallery relative to the recommended annual maintenance cycle.
Analytical Methods
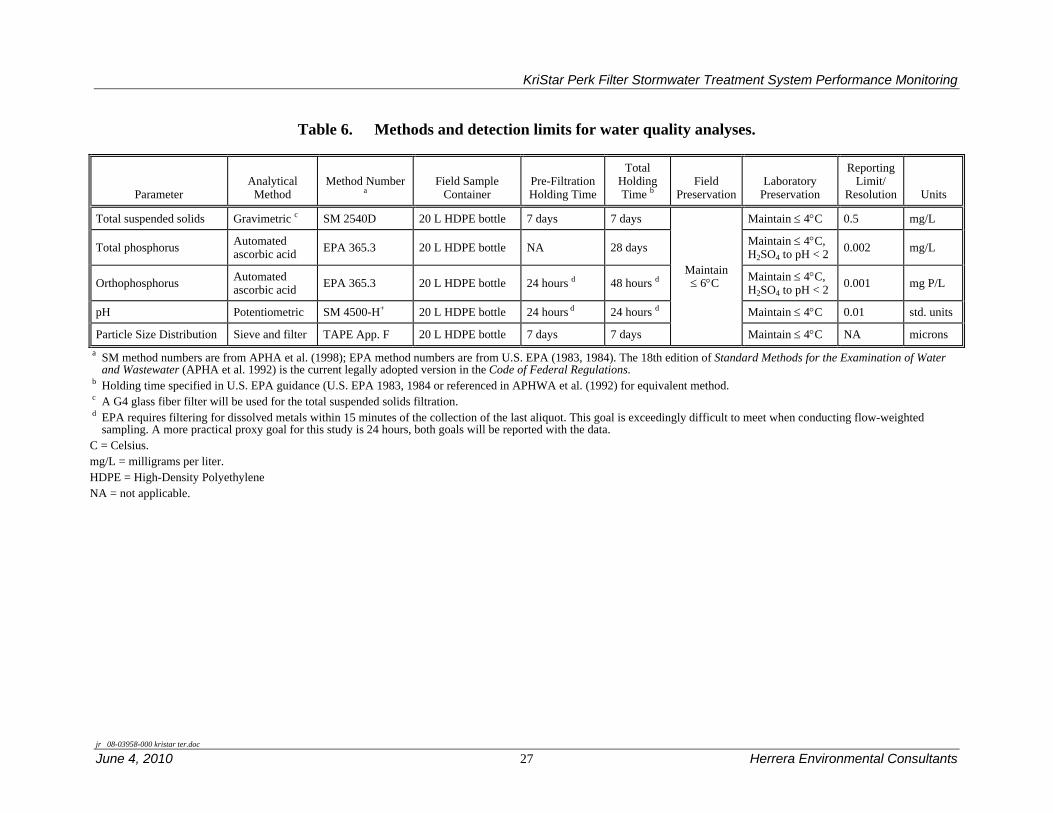
Analytical methods for this project are summarized in Table 6. Aquatic Research, Inc. in Seattle, Washington was the primary laboratory used for this project. This laboratory is certified by Ecology and participates in audits and inter-laboratory studies by Ecology and EPA. These performance and system audits have verified the adequacy of the laboratory’s standard operating procedures, which include preventive maintenance and data reduction procedures. Spectra Laboratories in Tacoma, Washington was used for PSD analysis until September 2009 at which point Analytical Resources, Inc. in Tukwila, Washington was used for PSD analysis. All laboratories provided sample and quality control data in standardized reports suitable for evaluating project data. The laboratory reports also included a case narrative summarizing any problems encountered in the analyses.
Quality Assurance and Control Measures
Field, laboratory, and data management quality control procedures used for the Perk Filter monitoring program are discussed in the following sections. Quality assurance memorandums discussing hydrologic and water quality data can be found in Appendices I and J, respectively.
Field Quality Assurance/Quality Control
This section summarizes the quality assurance/quality control (QA/QC) procedures that were implemented by field personnel to evaluate sample contamination and sampling precision.
KriStar Perk Filter Stormwater Treatment System Performance Monitoring
Table 6. Methods and detection limits for water quality analyses.
Parameter Analytical
Method Method Number
a Field Sample
Container Pre-Filtration Holding Time
Total Holding Time b
Field Preservation
Laboratory Preservation
Reporting Limit/
Resolution Units
Total suspended solids Gravimetric c SM 2540D 20 L HDPE bottle 7 days 7 days
Maintain ≤ 6°C
Maintain ≤ 4°C 0.5 mg/L
Total phosphorus Automated ascorbic acid EPA 365.3 20 L HDPE bottle NA 28 days Maintain ≤ 4°C,
H2SO4 to pH < 2 0.002 mg/L
Orthophosphorus Automated ascorbic acid EPA 365.3 20 L HDPE bottle 24 hours d 48 hours d Maintain ≤ 4°C,
H2SO4 to pH < 2 0.001 mg P/L
pH Potentiometric SM 4500-H+ 20 L HDPE bottle 24 hours d 24 hours d Maintain ≤ 4°C 0.01 std. units
Particle Size Distribution Sieve and filter TAPE App. F 20 L HDPE bottle 7 days 7 days Maintain ≤ 4°C NA microns a SM method numbers are from APHA et al. (1998); EPA method numbers are from U.S. EPA (1983, 1984). The 18th edition of Standard Methods for the Examination of Water
and Wastewater (APHA et al. 1992) is the current legally adopted version in the Code of Federal Regulations. b Holding time specified in U.S. EPA guidance (U.S. EPA 1983, 1984 or referenced in APHWA et al. (1992) for equivalent method. c A G4 glass fiber filter will be used for the total suspended solids filtration. d EPA requires filtering for dissolved metals within 15 minutes of the collection of the last aliquot. This goal is exceedingly difficult to meet when conducting flow-weighted
sampling. A more practical proxy goal for this study is 24 hours, both goals will be reported with the data. C = Celsius. mg/L = milligrams per liter. HDPE = High-Density Polyethylene NA = not applicable.
jr 08-03958-000 kristar ter.doc
June 4, 2010 27 Herrera Environmental Consultants

KriStar Perk Filter Stormwater Treatment System Performance Monitoring
Field Blanks
Automated samplers were cleaned using the rinse and purge-pump-purge cycle. Field blanks were collected after the first two storm events at both of the inlet and outlet monitoring stations. One additional field blank was collected midway through the monitoring season. Each field blank was collected by pumping reagent-grade water through the intake tubing into a precleaned sample container. The volume of reagent grade water pumped through the sampler for the equipment blank was similar to the volume of water collected during a typical storm event.
Field Duplicate Samples
Field duplicates were collected for 13.6 percent of the storm events. The station where the field duplicates were collected was chosen at random in advance of the storm event. To collect the field duplicates, an additional sampler was deployed to the site and programmed to collect samples simultaneous with the paired primary sampler. The duplicate samples were submitted to the laboratory and labeled as separate (blind) samples. The resultant data from these samples was used to assess variation in the analytical results that is attributable to environmental (natural), sub-sampling, and analytical variability.
Flow Measurements
The precision and bias of the automated flow measurement equipment were tested prior to the first monitoring round and periodically throughout the project. Level calibration data can be found in the hydrologic data quality assurance memorandum in Appendix I.
Laboratory Quality Control
This section summarizes the quality control procedures that the laboratories performed and reported with the analytical results. Accuracy of the laboratory analyses was verified through the use of blank analyses, duplicate analyses, laboratory control spikes, and matrix spikes in accordance with the EPA methods employed. Aquatic Research, Inc., Spectra Laboratories, and Analytical Resources, Inc. were responsible for conducting internal quality control and quality assurance measures in accordance with their own quality assurance plans.
Water quality results were first reviewed at the laboratory for errors or omissions and to verify compliance with acceptance criteria. The laboratories also validated the results by examining the completeness of the data package to determine whether method procedures and laboratory quality assurance procedures were followed. The review, verification, and validation by the laboratory were documented in a case narrative that accompanied the analytical results.
Data was reviewed and validated within 7 days of receiving the results from the laboratory. This review was performed to ensure that all data were consistent, correct, and complete, and that all required quality control information was provided. Specific quality control elements for the data were also examined to determine if the MQOs for the project were met. Results from these data validation reviews were summarized in quality assurance worksheets were prepared for each
jr 08-03958-000 kristar ter.doc
Herrera Environmental Consultants 28 June 4, 2010

KriStar Perk Filter Stormwater Treatment System Performance Monitoring
sample batch (Appendix J). Values associated with minor quality control problems were considered estimates and assigned J qualifiers. Values associated with major quality control problems were rejected and qualified with an R. Estimated values were used for evaluation purposes, while rejected values were not used.
Data Management Procedures Data from the datalogger was remotely transferred on a nightly basis and/or at the beginning and end of each storm event. The hydrologic data from each monitoring station was imported directly into an Aquarius (version 2.5) SQL-based database for subsequent analysis and archiving purposes. After the data were checked for errors and corrected, a storm identification visual basic algorithm was run of the flow, rain, and sample collection time data. The algorithm segregated storms based on the TAPE criteria identified above in the Water Quality Monitoring Procedures section. Once the events were delineated, the algorithm calculated the following storm statistics:
Precipitation: Start time Stop time Duration (hours) Antecedent dry period (hours) Depth (inches) Peak intensity (inches/5 minutes) Peak intensity (inches/hour) Average intensity (inches/hour)
Flow: Start time Stop time Duration (hours) Peak Flow (cubic feet per second) Average Flow (cubic feet per second) Storm Volume (cubic feet)
Sampling: Start time Stop time Duration (hours) Number of aliquots Volume represented by sampling (cf) Percent of storm sampled by volume
These storm statistics were stored in conjunction with associated water quality in a database. Each storm was numbered based on sequential qualifying events beginning in February 2009. These numbers are used to reference each storm event throughout this document. The laboratory reports, field notes, and event hydrograph were stored in the database with each event. One page
jr 08-03958-000 kristar ter.doc
June 4, 2010 29 Herrera Environmental Consultants
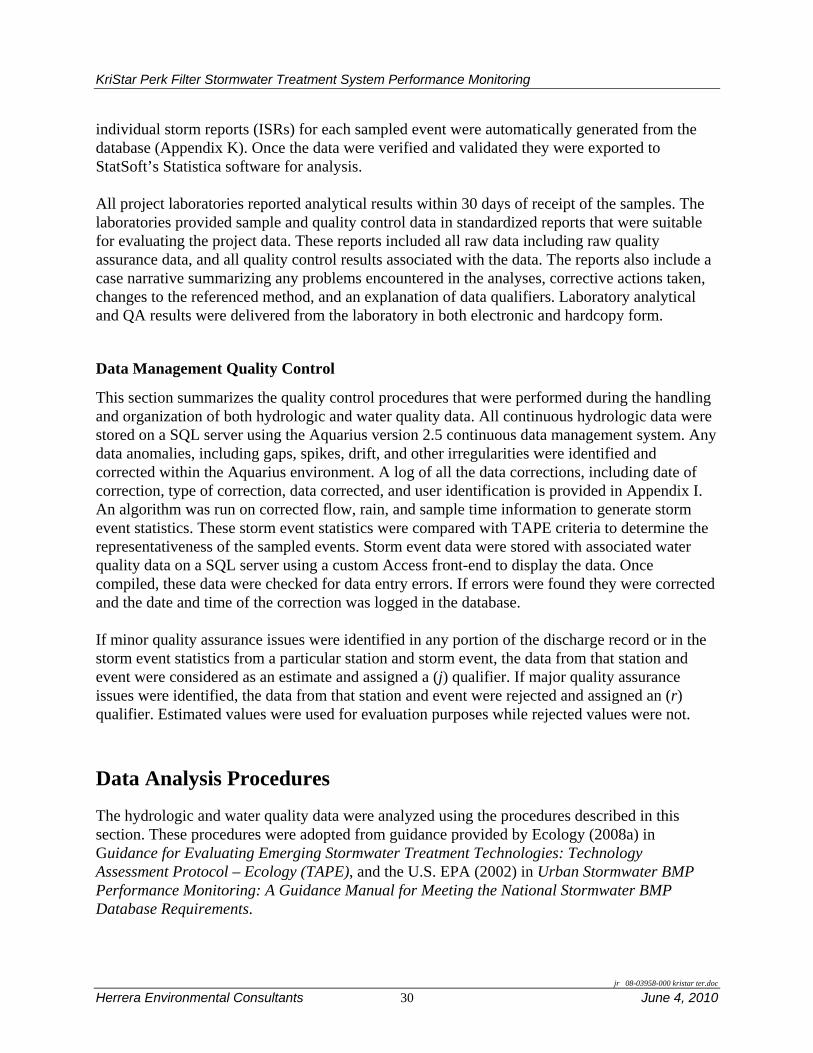
KriStar Perk Filter Stormwater Treatment System Performance Monitoring
individual storm reports (ISRs) for each sampled event were automatically generated from the database (Appendix K). Once the data were verified and validated they were exported to StatSoft’s Statistica software for analysis.
All project laboratories reported analytical results within 30 days of receipt of the samples. The laboratories provided sample and quality control data in standardized reports that were suitable for evaluating the project data. These reports included all raw data including raw quality assurance data, and all quality control results associated with the data. The reports also include a case narrative summarizing any problems encountered in the analyses, corrective actions taken, changes to the referenced method, and an explanation of data qualifiers. Laboratory analytical and QA results were delivered from the laboratory in both electronic and hardcopy form.
Data Management Quality Control
This section summarizes the quality control procedures that were performed during the handling and organization of both hydrologic and water quality data. All continuous hydrologic data were stored on a SQL server using the Aquarius version 2.5 continuous data management system. Any data anomalies, including gaps, spikes, drift, and other irregularities were identified and corrected within the Aquarius environment. A log of all the data corrections, including date of correction, type of correction, data corrected, and user identification is provided in Appendix I. An algorithm was run on corrected flow, rain, and sample time information to generate storm event statistics. These storm event statistics were compared with TAPE criteria to determine the representativeness of the sampled events. Storm event data were stored with associated water quality data on a SQL server using a custom Access front-end to display the data. Once compiled, these data were checked for data entry errors. If errors were found they were corrected and the date and time of the correction was logged in the database.
If minor quality assurance issues were identified in any portion of the discharge record or in the storm event statistics from a particular station and storm event, the data from that station and event were considered as an estimate and assigned a (j) qualifier. If major quality assurance issues were identified, the data from that station and event were rejected and assigned an (r) qualifier. Estimated values were used for evaluation purposes while rejected values were not.
Data Analysis Procedures
The hydrologic and water quality data were analyzed using the procedures described in this section. These procedures were adopted from guidance provided by Ecology (2008a) in Guidance for Evaluating Emerging Stormwater Treatment Technologies: Technology Assessment Protocol – Ecology (TAPE), and the U.S. EPA (2002) in Urban Stormwater BMP Performance Monitoring: A Guidance Manual for Meeting the National Stormwater BMP Database Requirements.
jr 08-03958-000 kristar ter.doc
Herrera Environmental Consultants 30 June 4, 2010

KriStar Perk Filter Stormwater Treatment System Performance Monitoring
Hydrologic Data Analysis Procedures
The hydrologic statistics for each event were assessed to develop a water budget for the test system to assess bypass frequency. During each bypass event, the flow at the outlet station was subtracted from the bypass flow to estimate the treated flow during bypass. These flows were then analyzed to look for temporal trends and to calculate the average peak treated flow rate for the study period. In addition, average treated flow rates were calculated for each sampled event by averaging the instantaneous flow rates at the point when each aliquot was collected. This average flow rate was used to determine the water quality design flow rate for which the Perk Filter will be approved.
Water Quality Data Analysis Procedures
Data analyses were performed to evaluate the water quality treatment performance of the test system. The specific procedures that were used in these analyses are as follows:
Statistical analyses to compare influent and effluent concentrations. Calculation of pollutant removal efficiency (four methods) Comparisons of the cumulative probability distribution for influent and
effluent pollutant concentrations
Each of these procedures is described in more detail in the following subsections.
Statistical Comparisons of Influent and Effluent Pollutant Concentrations
Statistical analyses were performed to assess significance of differences in pollutant concentrations between the influent and effluent stations across individual storm events. The specific null hypothesis (Ho) and alternative hypothesis (Ha) for these analyses are as follows:
Ho: Effluent pollutant concentrations are equal to or higher than influent concentrations.
Ha: Effluent concentrations are lower than influent concentrations.
To evaluate these hypotheses, a Wilcoxon signed rank test (Helsel and Hirsch 1992) was used to compare performance data from BIPF-In and BIPF-Out. The Wilcoxon test is a non-parametric analog to the paired t-test. Statistical significance was assessed based on an alpha (α) level of 0.05.
Calculation of the Pollutant Removal Efficiency
Pursuant to guidance from Ecology (Ecology 2008a), pollutant removal efficiencies were estimated using the methods described below.
jr 08-03958-000 kristar ter.doc
June 4, 2010 31 Herrera Environmental Consultants

KriStar Perk Filter Stormwater Treatment System Performance Monitoring
Method #1: Individual Storm Reduction in Pollutant Concentration The removal (in percent) in pollutant concentration during each individual storm (ΔC) was calculated as:
( )in
effin
CCC
C−
×=Δ 100
Where: Cin = Flow-weighted influent pollutant concentration Ceff = Flow-weighted effluent pollutant concentration.
Median percent removal values and 95 percent confidence interval about the median were estimated using a bootstrapping approach (Davison and Hinkley 1997) based on the percent removal values from individual storm events. Bootstrapping offers a distribution-free method for estimates of confidence intervals of a measure of central tendency. The generality of bootstrapped confidence intervals means they are well-suited to non-normally distributed data and/or datasets not numerous enough for a powerful test of normality.
To perform the bootstrapping approach, the percent removal values from Method #1 for each valid event were sampled randomly with replacement until a new synthetic percent removal dataset of equivalent size was generated. The median percent removal was then calculated on the synthetic dataset and the process was repeated. Repetition generates a distribution of possible values for the median. Quantiles of this distribution are confidence intervals of the statistic. For example, in this analysis the median was replicated 10,001 times; after sorting the replications, the 250th and 9,750th elements constitute the 95 percent confidence interval of the median, while the reported median was the 5,000th ranked value.
The results from this test were used to determine if the median percent removal was significantly different from percent removal thresholds presented in TAPE (e.g., 80 percent total suspended solids removal).
Method #2: Aggregate Pollutant Loading Reduction The aggregate reduction (in percent) in pollutant load for all storms (ΔLagg) was calculated as:
( ) ( )
( )∑
∑∑
=
==
⎟⎠
⎞⎜⎝
⎛−
×=Δ n
iiini
n
iieffi
n
iiini
agg
VC
VCVCL
1,
1,
1,
*
**100
Where: Ci,in = Influent pollutant concentration for storm i Vi = Volume of storm i Ci,eff = Flow-weighted effluent pollutant concentration n = Number of storms.
jr 08-03958-000 kristar ter.doc
Herrera Environmental Consultants 32 June 4, 2010

KriStar Perk Filter Stormwater Treatment System Performance Monitoring
jr 08-03958-000 kristar ter.doc
June 4, 2010 33 Herrera Environmental Consultants
Correlation Analysis to Examine Influence of Storm Characteristics
Kendall’s tau correlation coefficients were also used to evaluate whether the following storm event characteristics influenced system performance in any way: storm precipitation depth, storm average intensity, storm peak intensity, storm antecedent dry period, storm duration, and sample date. These tests specifically examined potential relationships between these storm event characteristics and the following variables that either directly measure or indirectly influence system performance: influent concentration, effluent concentration, and pollutant removal efficiency estimates. In all cases, the statistical significance of these tests was evaluated at an alpha level (α) of 0.05.


KriStar Perk Filter Stormwater Treatment System Performance Monitoring
Data Analysis
Water quality and quantity data were collected beginning February 2009; however, due to the reasons described in the Test System Description section, the quantity and quality data collected from February 2009 through April 2009 (Storms 1 through 33) are excluded from this analysis. Consequently, the analysis below includes only the data collected from May 2009 through February 2010 (Storms 34 through 115, of which 22 were sampled). Additional information related to project data can also be found in the following appendices:
Appendix H Standardized Field Forms Appendix I Hydrologic Data Quality Assurance Memorandum Appendix J Water Quality Data Quality Assurance Memorandum Appendix K Individual Storm Reports Appendix L Water Quality Parameter Summary Sheets Appendix M Water Quality Database Appendix N Statistical Analysis Results Appendix O Laboratory Reports
Hydrologic Data
To provide some context for interpreting the data, this section compares rainfall totals measured during the monitoring period relative to historical data. Separate sections evaluate the water budget for the test system and the average treated flow rates during each of the sampled events. Appendix I summarizes results from the quality assurance review that was performed on hydrologic data prior to their analysis.
Historical Rainfall Data Comparison
To provide some context for interpreting the hydrologic performance of the test system, an analysis was performed on rainfall data collected at the Western Regional Climate Center (WRCC) rain gauge at Sea-Tac airport to determine if rainfall totals from the monitoring period (i.e., February 2009 through February 2010) were anomalous. The WRCC gauge is located approximately 14 miles southeast of the BIPF site. The analysis specifically involved a comparison of rainfall totals measured at the WRCC rain gauge over the monitoring period to averaged totals for the same gauge from the 61 year historical record. These data are summarized in Table 7 along with data from the rain gauge associated with the BIPF test system.
Results from this analysis showed the average monitoring period rainfall total at the WRCC rain gauge from 1949 through 2010 was 38.09 inches (WRCC 2009). In comparison, the rainfall total at the WRCC rain gauge over the monitoring period was 37.51 inches, while the annual precipitation at the BIPF test system was 36.75 inches. These values are within the normal range of rainfall (i.e., 25th to 75th percentile) for the WRCC rain gauge based on the 61-year rainfall
jr 08-03958-000 kristar ter.doc
June 4, 2010 35 Herrera Environmental Consultants

KriStar Perk Filter Stormwater Treatment System Performance Monitoring
record, thus the rainfall total during the monitoring period can generally be considered representative of rainfall during an average water year.
Table 7. Monthly and annual precipitation totals (in inches) for 2009-2010 at BIPF compared to historical totals at Sea-Tac airport NOAA station.
Month BIPF Test System
(2009-2010)
Sea-Tac Station #457473 Rainfall Data
(2009-2010)
Sea-Tac Station #457473 Historical Rainfall Data
(1949-2010) a
February – a -- -- March 2.8 4.16 3.73 April 1.96 3.36 2.52 May 4.01 3.61 1.72 June 0.06 0.18 1.43 July 0.18 0.06 0.75 August 0.66 1.16 1.10 September 1.39 1.75 1.73 October 4.24 5.54 3.48 November 6.99 8.19 6.13 December 3.23 2.75 5.81 January 7.47 5.51 5.76 February 3.76 1.24 3.93 Total 36.75 37.51 38.09 a Monitoring began on February 15, 2009 so monthly rainfall totals were not reported for that month. b Source: Sea-Tac Station #457473 (WRCC 2009). Based on average monthly and annual precipitation totals measured over the
period from 1931 to 2005. Values in italics are below the 25th percentile value from the historical monthly or annual precipitation totals. Values in bold are above the 75th percentile value from the historical monthly or annual precipitation totals.
Water Budget
The water budget for the BIPF test system was analyzed to determine bypass frequency and volume (Table 8). WWHM modeling indicated that with the assumed basin area of 1.69 acres, the water quality design flow rate is 0.394 cfs. This equates with a 2-year peak storm discharge of 0.663 cfs. However, when peak discharges from each of the 85 measured events between May 2, 2009 and February 26, 2010 at BIPF-FM were averaged, the result (1.055 cfs) was higher than expected given the modeled design flows from WWHM. The hydrologic data quality assurance memorandum (Appendix I) indicates that the BIPF-FM discharge data is generally accurate; therefore, it is likely the contributing area to the BIPF test system was actually larger than originally thought and the WWHM modeling underestimated flows to the system.
In order to investigate this, field staff walked the basin during a heavy rain storm on May 20, 2010. The assessment, based on the field observations, was that the basin is at least 2 times larger than the initial delineated area (determined during a period of no rain). This was due to a large volume of water bypassing catch basin inlets near the top of the basin. Consequently, it appears as if the Perk Filter was undersized for this study.
jr 08-03958-000 kristar ter.doc
Herrera Environmental Consultants 36 June 4, 2010
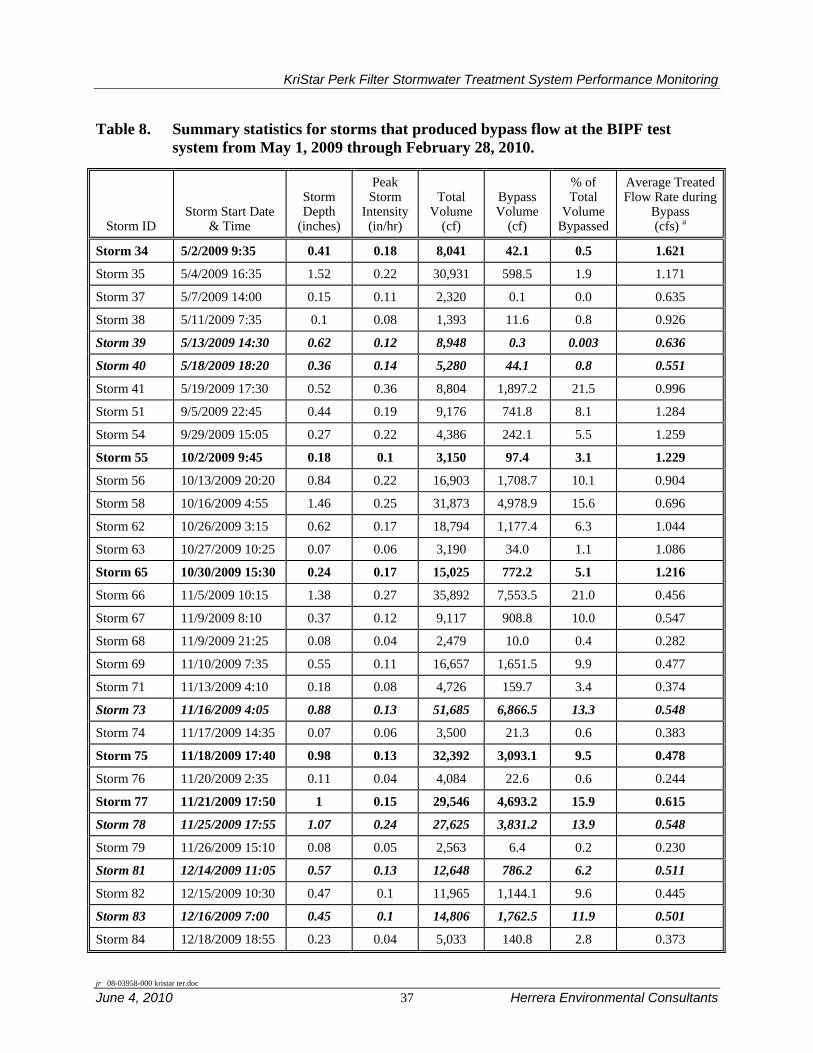
KriStar Perk Filter Stormwater Treatment System Performance Monitoring
Table 8. Summary statistics for storms that produced bypass flow at the BIPF test system from May 1, 2009 through February 28, 2010.
Storm ID Storm Start Date
& Time
Storm Depth
(inches)
Peak Storm
Intensity(in/hr)
Total Volume
(cf)
Bypass Volume
(cf)
% of Total
Volume Bypassed
Average Treated Flow Rate during
Bypass (cfs) a
Storm 34 5/2/2009 9:35 0.41 0.18 8,041 42.1 0.5 1.621
Storm 35 5/4/2009 16:35 1.52 0.22 30,931 598.5 1.9 1.171
Storm 37 5/7/2009 14:00 0.15 0.11 2,320 0.1 0.0 0.635
Storm 38 5/11/2009 7:35 0.1 0.08 1,393 11.6 0.8 0.926
Storm 39 5/13/2009 14:30 0.62 0.12 8,948 0.3 0.003 0.636
Storm 40 5/18/2009 18:20 0.36 0.14 5,280 44.1 0.8 0.551
Storm 41 5/19/2009 17:30 0.52 0.36 8,804 1,897.2 21.5 0.996
Storm 51 9/5/2009 22:45 0.44 0.19 9,176 741.8 8.1 1.284
Storm 54 9/29/2009 15:05 0.27 0.22 4,386 242.1 5.5 1.259
Storm 55 10/2/2009 9:45 0.18 0.1 3,150 97.4 3.1 1.229
Storm 56 10/13/2009 20:20 0.84 0.22 16,903 1,708.7 10.1 0.904
Storm 58 10/16/2009 4:55 1.46 0.25 31,873 4,978.9 15.6 0.696
Storm 62 10/26/2009 3:15 0.62 0.17 18,794 1,177.4 6.3 1.044
Storm 63 10/27/2009 10:25 0.07 0.06 3,190 34.0 1.1 1.086
Storm 65 10/30/2009 15:30 0.24 0.17 15,025 772.2 5.1 1.216
Storm 66 11/5/2009 10:15 1.38 0.27 35,892 7,553.5 21.0 0.456
Storm 67 11/9/2009 8:10 0.37 0.12 9,117 908.8 10.0 0.547
Storm 68 11/9/2009 21:25 0.08 0.04 2,479 10.0 0.4 0.282
Storm 69 11/10/2009 7:35 0.55 0.11 16,657 1,651.5 9.9 0.477
Storm 71 11/13/2009 4:10 0.18 0.08 4,726 159.7 3.4 0.374
Storm 73 11/16/2009 4:05 0.88 0.13 51,685 6,866.5 13.3 0.548
Storm 74 11/17/2009 14:35 0.07 0.06 3,500 21.3 0.6 0.383
Storm 75 11/18/2009 17:40 0.98 0.13 32,392 3,093.1 9.5 0.478
Storm 76 11/20/2009 2:35 0.11 0.04 4,084 22.6 0.6 0.244
Storm 77 11/21/2009 17:50 1 0.15 29,546 4,693.2 15.9 0.615
Storm 78 11/25/2009 17:55 1.07 0.24 27,625 3,831.2 13.9 0.548
Storm 79 11/26/2009 15:10 0.08 0.05 2,563 6.4 0.2 0.230
Storm 81 12/14/2009 11:05 0.57 0.13 12,648 786.2 6.2 0.511
Storm 82 12/15/2009 10:30 0.47 0.1 11,965 1,144.1 9.6 0.445
Storm 83 12/16/2009 7:00 0.45 0.1 14,806 1,762.5 11.9 0.501
Storm 84 12/18/2009 18:55 0.23 0.04 5,033 140.8 2.8 0.373
jr 08-03958-000 kristar ter.doc
June 4, 2010 37 Herrera Environmental Consultants

KriStar Perk Filter Stormwater Treatment System Performance Monitoring
Table 8 (continued). Summary statistics for storms that produced bypass flow at the BIPF test system from May 1, 2009 through February 28, 2010.
Storm ID Storm Start Date
& Time
Storm Depth
(inches)
Peak Storm
Intensity(in/hr)
Total Volume
(cf)
Bypass Volume
(cf)
% of Total
Volume Bypassed
Average Treated Flow Rate during
Bypass (cfs) a
Storm 85 12/19/2009 15:35 0.19 0.04 3,967 0.7 0.02 0.169
Storm 87 12/21/2009 0:55 0.48 0.18 3,780 95.1 2.5 0.314
Storm 90 12/31/2009 11:50 0.37 0.09 17,640 123.3 0.7 0.668
Storm 91 1/1/2010 2:50 0.83 0.13 36,962 2,968.3 8.0 0.812
Storm 92 1/4/2010 2:20 1.14 0.15 46,353 1,835.5 4.0 0.814
Storm 93 1/7/2010 23:30 0.13 0.06 7,371 29.2 0.4 0.259
Storm 94 1/8/2010 10:50 0.91 0.24 47,344 2,752.9 5.8 1.030
Storm 95 1/10/2010 20:40 1.26 0.19 54,780 2,751.5 5.0 0.980
Storm 96 1/11/2010 21:10 0.52 0.14 28,950 825.1 2.9 0.908
Storm 97 1/13/2010 14:00 0.46 0.02 26,302 750.3 2.9 0.761
Storm 98 1/14/2010 10:50 0.41 0.1 24,224 413.7 1.7 0.700
Storm 99 1/15/2010 4:50 0.65 0.18 29,910 1,759.4 5.9 0.930
Storm 100 1/16/2010 16:25 0.25 0.08 17,738 199.9 1.1 0.717
Storm 103 1/24/2010 12:25 0.42 0.12 19,129 252.9 1.3 0.769
Storm 105 1/31/2010 1:05 0.08 0.06 2,848 1.5 0.1 0.564
Storm 106 2/3/2010 10:30 0.38 0.12 12,564 465.9 3.7 0.730
Storm 107 2/4/2010 21:20 0.13 0.08 5,171 19.1 0.4 0.582
Storm 109 2/11/2010 4:00 0.35 0.11 13,742 405.7 3.0 0.693
Storm 110 2/12/2010 8:15 0.36 0.14 13,928 767.9 5.5 0.758
Storm 111 2/13/2010 11:00 0.68 0.13 24,981 661.2 2.6 0.641
Storm 113 2/15/2010 19:40 0.28 0.11 3,907 153.9 3.9 0.334
Storm 115 2/26/2010 1:10 0.89 0.11 17,500 50.0 0.3 0.427
Mean (all) 0.52 0.13 16,831 1,175 5.1 0.695
Median (all) 0.42 0.12 13,742 466 3.1 0.641
Min (all) 0.07 0.02 1,393 0.1 0.003 0.169
Max (all) 1.52 0.36 54,780 7,554 21.5 1.621 a Average treated flow rate during bypass was calculated by subtracting bypass flow from total flow to estimate treated flow.
The treated flow rate was then averaged over the duration of the bypass event to generate the values in the table. Storms in bold indicate storm events that were sampled for valid total suspended solids (see Table 18). Storms in italics indicate storm events that were sampled for valid total phosphorus (see Table 20). cfs: cubic feet per second cf: cubic feet
jr 08-03958-000 kristar ter.doc
Herrera Environmental Consultants 38 June 4, 2010

KriStar Perk Filter Stormwater Treatment System Performance Monitoring
Separate analyses of hydrologic data were performed to meet the following objectives:
Determine whether treatment goals for the test system were met based on the volume treated and bypassed
Determine whether bypass frequency and volume varied as a function of storm rainfall depth, storm rainfall intensity, influent flow volume, and sampling date
Determine maintenance frequency by examining bypass over the course of the study
The data used in these analyses are presented in their entirety in Appendix M.
Performance in Relation to Design Treatment Goal
The water quality treatment goal for the BIPF test system was to capture and treat 91 percent of the average annual runoff volume. Precipitation and flow data measured during storms that produced bypass flow are presented in Table 8. These data indicate that the BIPF test system bypassed during 53 out of 85 storm events that occurred from May 1, 2009 through February 28, 2010. This high frequency of bypass is likely due to the fact that the system was undersized for the basin (see discussion above). Despite being undersized, the system was still able to treat 93.7 percent of the total 10-month volume. Though monitoring ceased on February 28, 2010, it can be assumed that the 91 percent treatment goal would still be met after a full year of monitoring because the unmonitored months of March and April contained less than 5 percent of the annual number of storm events.
Bypass Frequency and Volume Analysis
Separate analyses were performed to determine how bypass frequency and volume varied in relation to storm rainfall depth, storm rainfall intensity, influent flow volume, and sampling date. Results from these analyses are presented in the following subsections.
Bypass Volume Compared to Rainfall Depth Bypass frequency and volume were evaluated in comparison to rainfall depth at the BIPF test system to determine how system performance varied in relation to this storm characteristic. In general, filtration systems are expected to have a higher likelihood of bypassing during larger rainfall events when inflow exceeds cartridge flow rate capacity and indeed this is the pattern that was observed at the BIPF test system (Table 8, Figure 7).
The largest bypass volume of 7,543.9 cubic feet occurred during Storm 66, a 1.38-inch storm event in November, 2009. Twenty-one percent of the runoff volume during that event was bypassed. However, the largest percent bypass (21.8 percent) occurred during Storm 41, a smaller event (0.52 inches) that occurred in May of 2009. This occurred because the precipitation intensity during Storm 41 was greater than during Storm 66.
jr 08-03958-000 kristar ter.doc
June 4, 2010 39 Herrera Environmental Consultants

KriStar Perk Filter Stormwater Treatment System Performance Monitoring
jr 08-03958-000 kristar ter.doc
Herrera Environmental Consultants 40 June 4, 2010
Red line is a Lowess smooth fit Storms with no bypass were excluded from the graph
0.0 0.2 0.4 0.6 0.8 1.0 1.2 1.4 1.6
Precipitation Depth (inches)
0
1,000
2,000
3,000
4,000
5,000
6,000
7,000
8,000B
ypas
s Sto
rm V
olum
e (c
ubic
feet
)
Figure 7. Comparison of storm precipitation depth and bypass storm volume at the BIPF test system.
Bypass Volume Compared to Storm Peak Intensity Bypass frequency and volume were evaluated in comparison to storm peak intensity at the BIPF test system to determine how system performance varied in relation to this storm characteristic. As shown in Figure 8, a trend was evident between the storm peak intensity and the bypass volume at the BIPF test system, with larger storm peak intensities associated with larger bypass volumes. Storm 41 had the highest peak precipitation intensity of any of the bypass events (Table 8), though it was not associated with the highest bypass volume, it did have the highest percent of total flow bypassed (21.8 percent).
Bypass Volume Compared to Total Storm Volume Bypass frequency and volume were evaluated in comparison to total storm volume at the BIPF test system to determine how system performance varied in relation to this storm characteristic. As shown in Figure 9, a trend was evident between the total storm volume and the bypass volume at the BIPF test system, with larger storm peak intensities associated with larger bypass volumes. In general, the largest storms were associated with the largest bypass volumes (Table 8).

KriStar Perk Filter Stormwater Treatment System Performance Monitoring
0.00 0.05 0.10 0.15 0.20 0.25 0.30 0.35 0.40
Peak Precipitation Intensity (inches/hour)
0
1,000
2,000
3,000
4,000
5,000
6,000
7,000
8,000
Bypa
ss S
torm
Vol
ume
(cub
ic fe
et)
Red line is a locally weighted scatterplot smooth (LOWESS) fit Storms with no bypass were excluded from the graph
Figure 8. Comparison of storm peak precipitation intensity and bypass storm volume at the BIPF test system.
Red line is a Lowess smooth fit Storms with no bypass were excluded from the graph
0 10,000 20,000 30,000 40,000 50,000 60,000
Total Storm Volume (cubic feet)
0
1,000
2,000
3,000
4,000
5,000
6,000
7,000
8,000
Byp
ass
Stor
m V
olum
e (c
ubic
feet
)
Figure 9. Comparison of total storm volume and bypass storm volume at the BIPF test system.
jr 08-03958-000 kristar ter.doc
June 4, 2010 41 Herrera Environmental Consultants

KriStar Perk Filter Stormwater Treatment System Performance Monitoring
Bypass Volume Compared to Sampling Date Bypass volume was also evaluated in comparison to sampling date at the BIPF test system to determine if bypass occurred more frequently as the cartridges aged. As shown in Figure 10, there is no apparent temporal trend over the 10-month monitoring period. Figure 10 also displays precipitation depth as bars from the upper x-axis. From the figure, it apparent that precipitation depth has a much stronger influence on bypass volume than time. This indicates that progressive filter clogging was not contributing to increased bypass volume or frequency.
Mar-2009
May-2009Jul-2009
Aug-2009Oct-2009
Dec-2009Jan-2010
Mar-2010May-2010
0
2,000
4,000
6,000
8,000
10,000
Byp
ass S
torm
Vol
ume
(cub
ic fe
et)
0
1
2
3
4
5
Prec
ipita
tion
Dep
th (i
nche
s)
Bypass Volume Storm Precipitation Depth
Red line is a Lowess smooth fit Storms with no bypass were excluded from the graph
Figure 10. Temporal plot of bypass storm volume and storm precipitation depth.
Treated Flow Rate During Bypass versus Time In order to further investigate system performance over the course of the study period, treated flow rate during bypass was assessed as a function of time. During bypass the full 30-inch height of the cartridges was activated, so the treated flow rate during bypass should be at or above the water quality design flow rate. If this flow rate falls below the design flow rate then that would indicate that the cartridges are clogging. Figure 11 presents a plot of treated bypass flow rate through the course of the 10-month study. As is apparent, the treated bypass flow rate decreases slightly through the study, and after 10 months the average treated flow rate during bypass is near the water quality design flow rate of 0.394 cfs. These data indicate that after 10 months system performance is approaching unacceptable levels. If additional data were collected, then it
jr 08-03958-000 kristar ter.doc
Herrera Environmental Consultants 42 June 4, 2010

KriStar Perk Filter Stormwater Treatment System Performance Monitoring
would be possible to determine if this trend continued or leveled off. Until further data are available, it would appear as if a 10-month maintenance cycle is appropriate to optimize system performance.
Mar-2009
May-2009Jul-2009
Aug-2009Oct-2009
Dec-2009Jan-2010
Mar-2010May-2010
0.00
0.20
0.40
0.60
0.80
1.00
1.20
1.40
1.60
1.80
Trea
ted
Flow
Rat
e du
ring
Byp
ass (
cubi
c fe
et/
seco
nd)
0
1
2
3
4
5
Prec
ipita
tion
Dep
th (i
nche
s)
Treated Flow Rate Storm Precipitation Depth
Design flow rate
Red line is a Lowess smooth fit Storms with no bypass were excluded from the graph
Figure 11. Temporal plot of treated flow rate during bypass and storm precipitation depth.
Water Quality Data
This section summarizes water quality data collected during the 2009-2010 monitoring period at the Perk Filter test system, including a comparison of data compiled over this period with guidelines identified by Ecology (2008) for assessing data acceptability. Monitoring results for each parameter are summarized and discussed in separate sections.
Comparison of Data to TAPE Guidelines
Ecology (2008) provides guidelines for determining data acceptability based on the characteristics of sampled storm events and the collected samples. The data collected through this monitoring effort are evaluated relative to these guidelines in the following subsections.
jr 08-03958-000 kristar ter.doc
June 4, 2010 43 Herrera Environmental Consultants

KriStar Perk Filter Stormwater Treatment System Performance Monitoring
jr 08-03958-000 kristar ter.doc
Herrera Environmental Consultants 44 June 4, 2010
Storm Event Guidelines During the May 2009 through February 2010 monitoring period, a total of 22 storm events were sampled to characterize the water quality treatment performance of the Perk Filter test system. Precipitation data from the sampled storm events was compared to the following TAPE storm event guidelines:
Minimum precipitation depth: 0.15 inches Minimum antecedent dry period: 6 hours with less than 0.04 inches of rain Minimum storm duration: 1 hour Minimum average storm intensity: 0.03 inches per hour for at least half
the sampled storms
Summary data related to these guidelines are presented in Table 9 for each of the 22 sampled storm events. Figures showing sample collection times in relation to influent and effluent hydrographs are also presented in Appendix K for all sampled storm events. These data show the guideline for minimum precipitation depth (0.15 inch) was met during all storm events except Storm 59. The minimum, median, and maximum precipitation depths across all 22 sampled storm events were 0.05, 0.34 and 1.07 inches, respectively. The guidelines for minimum antecedent dry period (6 hours) and storm duration (1 hour) were also met during all 22 storm events. Actual antecedent dry periods during the sampled storm events ranged from 6.3 to 277.9 hours, with a median value of 32.5 hours. Storm durations ranged from 2 to 34 hours, with a median value of 12.5 hours.
The minimum average storm intensity of 0.03 inches per hour was achieved for 86 percent of the sampled storm events. The TAPE storm event guidelines recommend this threshold for at least half of the sampled storms, consequently this criterion was met.
Storm 97 had a precipitation gap of 18 hours in the middle of the event. Because of poor sample coverage (see below) and this precipitation gap, the water quality data associated with this event were rejected. In addition, the data associated with Storm 59 were rejected based on the precipitation depth of 0.05 inches. Based on these comparisons to the TAPE storm event guidelines, the data from two of the 22 sampled storms were considered invalid for inclusion and analysis within this TER.
Sample Collection Guidelines As described in the methods section, automated samplers were programmed with the goal of meeting the following criteria for acceptable composite samples that are identified by Ecology (2008):
A minimum of 10 aliquots were collected for each event.
Sampling was targeted to capture at least 75 percent of the hydrograph.
Due to sample holding time considerations, the maximum duration of automated sample collection at all stations was 36 hours.
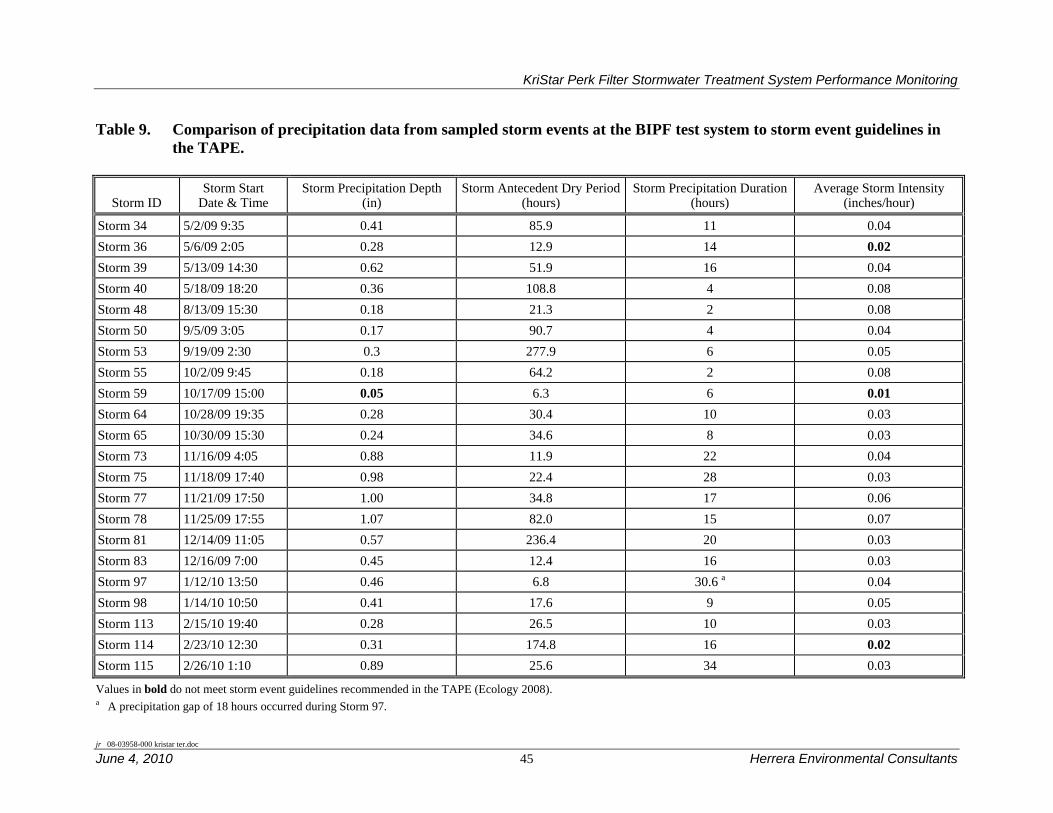
KriStar Perk Filter Stormwater Treatment System Performance Monitoring
Table 9. Comparison of precipitation data from sampled storm events at the BIPF test system to storm event guidelines in the TAPE.
Storm ID Storm Start
Date & Time Storm Precipitation Depth
(in) Storm Antecedent Dry Period
(hours) Storm Precipitation Duration
(hours) Average Storm Intensity
(inches/hour)
Storm 34 5/2/09 9:35 0.41 85.9 11 0.04 Storm 36 5/6/09 2:05 0.28 12.9 14 0.02 Storm 39 5/13/09 14:30 0.62 51.9 16 0.04 Storm 40 5/18/09 18:20 0.36 108.8 4 0.08 Storm 48 8/13/09 15:30 0.18 21.3 2 0.08 Storm 50 9/5/09 3:05 0.17 90.7 4 0.04 Storm 53 9/19/09 2:30 0.3 277.9 6 0.05 Storm 55 10/2/09 9:45 0.18 64.2 2 0.08 Storm 59 10/17/09 15:00 0.05 6.3 6 0.01 Storm 64 10/28/09 19:35 0.28 30.4 10 0.03 Storm 65 10/30/09 15:30 0.24 34.6 8 0.03 Storm 73 11/16/09 4:05 0.88 11.9 22 0.04 Storm 75 11/18/09 17:40 0.98 22.4 28 0.03 Storm 77 11/21/09 17:50 1.00 34.8 17 0.06 Storm 78 11/25/09 17:55 1.07 82.0 15 0.07 Storm 81 12/14/09 11:05 0.57 236.4 20 0.03 Storm 83 12/16/09 7:00 0.45 12.4 16 0.03 Storm 97 1/12/10 13:50 0.46 6.8 30.6 a 0.04 Storm 98 1/14/10 10:50 0.41 17.6 9 0.05 Storm 113 2/15/10 19:40 0.28 26.5 10 0.03 Storm 114 2/23/10 12:30 0.31 174.8 16 0.02 Storm 115 2/26/10 1:10 0.89 25.6 34 0.03
Values in bold do not meet storm event guidelines recommended in the TAPE (Ecology 2008). a A precipitation gap of 18 hours occurred during Storm 97.
jr 08-03958-000 kristar ter.doc
June 4, 2010 45 Herrera Environmental Consultants
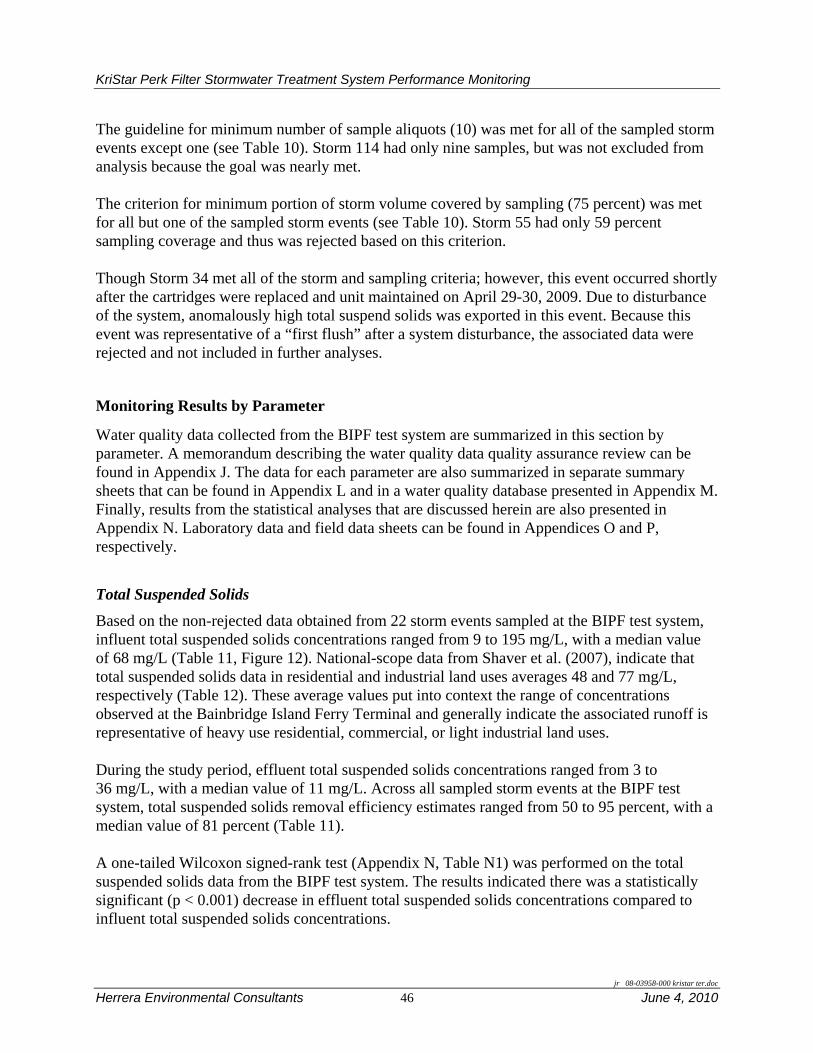
KriStar Perk Filter Stormwater Treatment System Performance Monitoring
The guideline for minimum number of sample aliquots (10) was met for all of the sampled storm events except one (see Table 10). Storm 114 had only nine samples, but was not excluded from analysis because the goal was nearly met.
The criterion for minimum portion of storm volume covered by sampling (75 percent) was met for all but one of the sampled storm events (see Table 10). Storm 55 had only 59 percent sampling coverage and thus was rejected based on this criterion.
Though Storm 34 met all of the storm and sampling criteria; however, this event occurred shortly after the cartridges were replaced and unit maintained on April 29-30, 2009. Due to disturbance of the system, anomalously high total suspend solids was exported in this event. Because this event was representative of a “first flush” after a system disturbance, the associated data were rejected and not included in further analyses.
Monitoring Results by Parameter
Water quality data collected from the BIPF test system are summarized in this section by parameter. A memorandum describing the water quality data quality assurance review can be found in Appendix J. The data for each parameter are also summarized in separate summary sheets that can be found in Appendix L and in a water quality database presented in Appendix M. Finally, results from the statistical analyses that are discussed herein are also presented in Appendix N. Laboratory data and field data sheets can be found in Appendices O and P, respectively.
Total Suspended Solids
Based on the non-rejected data obtained from 22 storm events sampled at the BIPF test system, influent total suspended solids concentrations ranged from 9 to 195 mg/L, with a median value of 68 mg/L (Table 11, Figure 12). National-scope data from Shaver et al. (2007), indicate that total suspended solids data in residential and industrial land uses averages 48 and 77 mg/L, respectively (Table 12). These average values put into context the range of concentrations observed at the Bainbridge Island Ferry Terminal and generally indicate the associated runoff is representative of heavy use residential, commercial, or light industrial land uses.
During the study period, effluent total suspended solids concentrations ranged from 3 to 36 mg/L, with a median value of 11 mg/L. Across all sampled storm events at the BIPF test system, total suspended solids removal efficiency estimates ranged from 50 to 95 percent, with a median value of 81 percent (Table 11).
A one-tailed Wilcoxon signed-rank test (Appendix N, Table N1) was performed on the total suspended solids data from the BIPF test system. The results indicated there was a statistically significant (p < 0.001) decrease in effluent total suspended solids concentrations compared to influent total suspended solids concentrations.
jr 08-03958-000 kristar ter.doc
Herrera Environmental Consultants 46 June 4, 2010
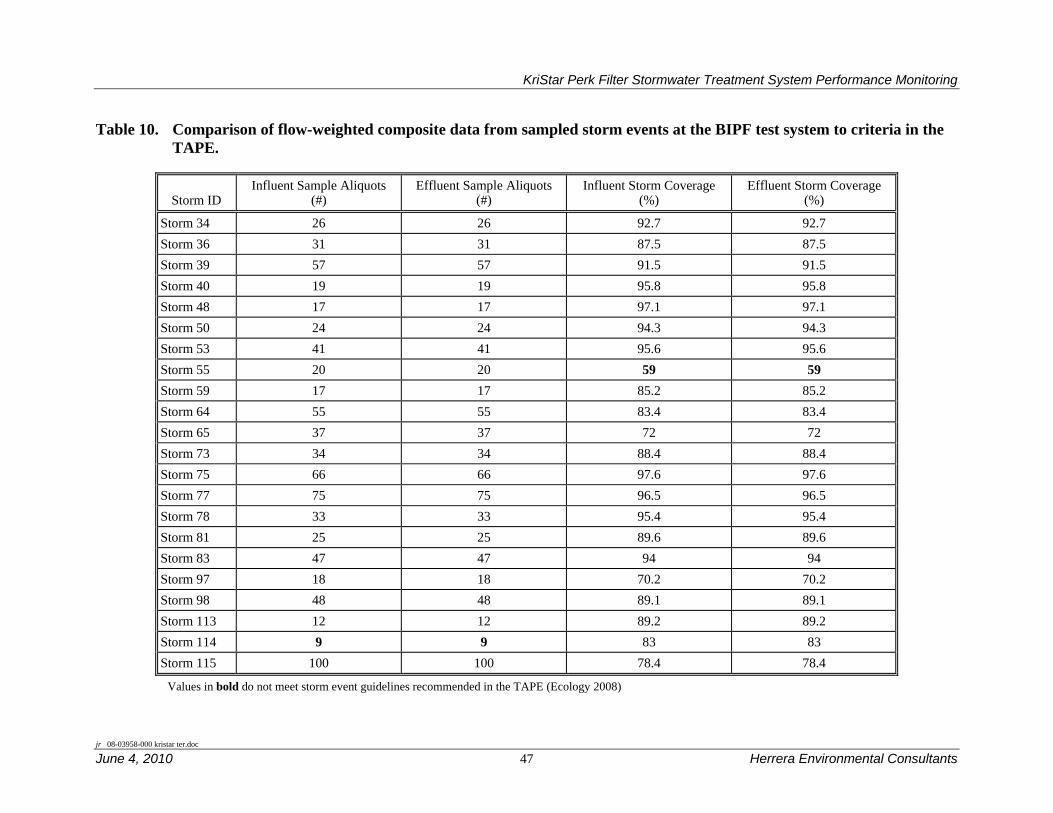
KriStar Perk Filter Stormwater Treatment System Performance Monitoring
Table 10. Comparison of flow-weighted composite data from sampled storm events at the BIPF test system to criteria in the TAPE.
Storm ID Influent Sample Aliquots
(#) Effluent Sample Aliquots
(#) Influent Storm Coverage
(%) Effluent Storm Coverage
(%)
Storm 34 26 26 92.7 92.7 Storm 36 31 31 87.5 87.5 Storm 39 57 57 91.5 91.5 Storm 40 19 19 95.8 95.8 Storm 48 17 17 97.1 97.1 Storm 50 24 24 94.3 94.3 Storm 53 41 41 95.6 95.6 Storm 55 20 20 59 59 Storm 59 17 17 85.2 85.2 Storm 64 55 55 83.4 83.4 Storm 65 37 37 72 72 Storm 73 34 34 88.4 88.4 Storm 75 66 66 97.6 97.6 Storm 77 75 75 96.5 96.5 Storm 78 33 33 95.4 95.4 Storm 81 25 25 89.6 89.6 Storm 83 47 47 94 94 Storm 97 18 18 70.2 70.2 Storm 98 48 48 89.1 89.1 Storm 113 12 12 89.2 89.2 Storm 114 9 9 83 83 Storm 115 100 100 78.4 78.4
Values in bold do not meet storm event guidelines recommended in the TAPE (Ecology 2008)
jr 08-03958-000 kristar ter.doc
June 4, 2010 47 Herrera Environmental Consultants
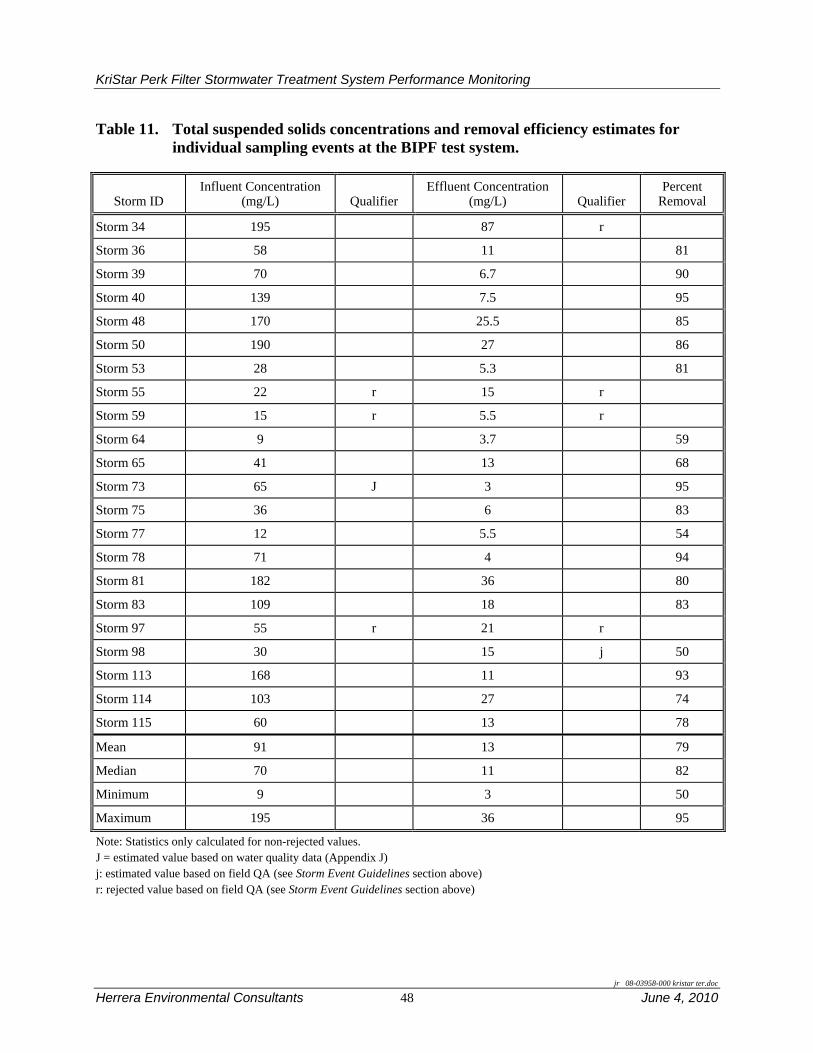
KriStar Perk Filter Stormwater Treatment System Performance Monitoring
Table 11. Total suspended solids concentrations and removal efficiency estimates for individual sampling events at the BIPF test system.
Storm ID Influent Concentration
(mg/L) Qualifier Effluent Concentration
(mg/L) Qualifier Percent
Removal
Storm 34 195 87 r
Storm 36 58 11 81
Storm 39 70 6.7 90
Storm 40 139 7.5 95
Storm 48 170 25.5 85
Storm 50 190 27 86
Storm 53 28 5.3 81
Storm 55 22 r 15 r
Storm 59 15 r 5.5 r
Storm 64 9 3.7 59
Storm 65 41 13 68
Storm 73 65 J 3 95
Storm 75 36 6 83
Storm 77 12 5.5 54
Storm 78 71 4 94
Storm 81 182 36 80
Storm 83 109 18 83
Storm 97 55 r 21 r
Storm 98 30 15 j 50
Storm 113 168 11 93
Storm 114 103 27 74
Storm 115 60 13 78
Mean 91 13 79
Median 70 11 82
Minimum 9 3 50
Maximum 195 36 95
Note: Statistics only calculated for non-rejected values. J = estimated value based on water quality data (Appendix J) j: estimated value based on field QA (see Storm Event Guidelines section above) r: rejected value based on field QA (see Storm Event Guidelines section above)
jr 08-03958-000 kristar ter.doc
Herrera Environmental Consultants 48 June 4, 2010
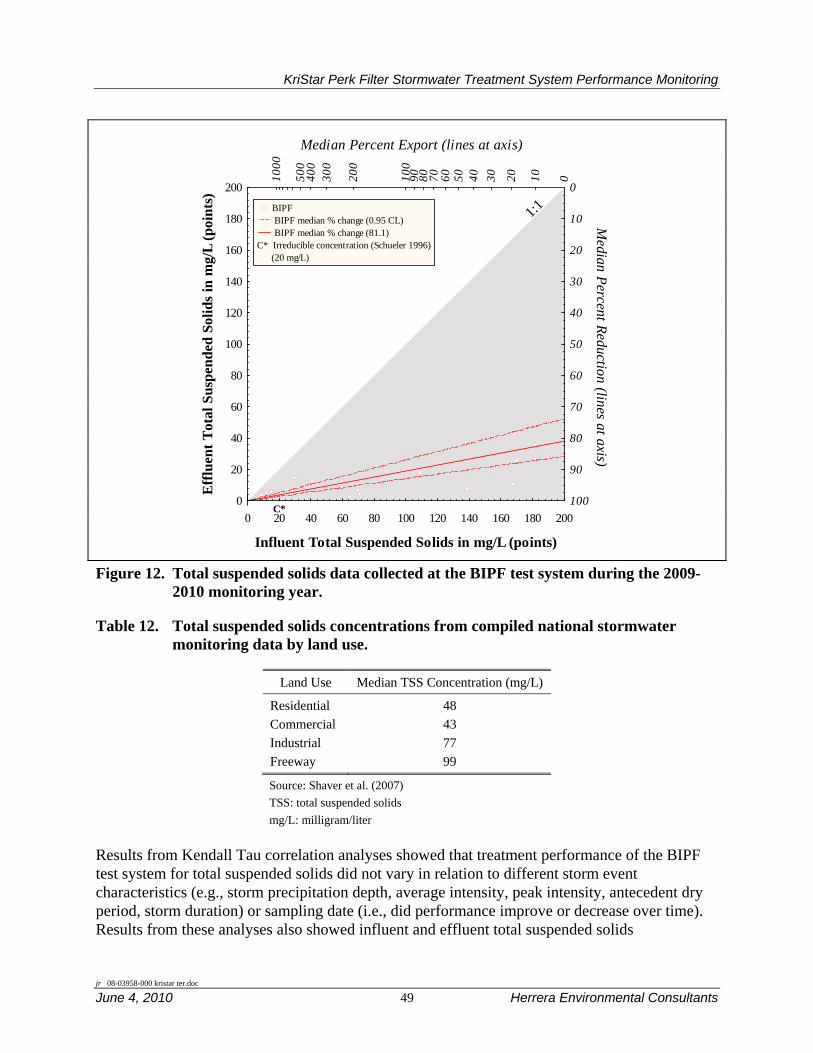
KriStar Perk Filter Stormwater Treatment System Performance Monitoring
0 20 40 60 80 100 120 140 160 180 200
Influent Total Suspended Solids in mg/L (points)010203040506070809010
0
200
300
400
500
1000
0
20
40
60
80
100
120
140
160
180
200
Eff
luen
t Tot
al S
uspe
nded
Sol
ids
in m
g/L
(poi
nts)
0
10
20
30
40
50
60
70
80
90
100
1:1M
edian Percent Reduction (lines at axis)
Median Percent Export (lines at axis)
BIPF BIPF median % change (0.95 CL) BIPF median % change (81.1)
C* Irreducible concentration (Schueler 1996) (20 mg/L)
C*
Figure 12. Total suspended solids data collected at the BIPF test system during the 2009-2010 monitoring year.
Table 12. Total suspended solids concentrations from compiled national stormwater monitoring data by land use.
Land Use Median TSS Concentration (mg/L)
Residential 48Commercial 43Industrial 77Freeway 99
Source: Shaver et al. (2007) TSS: total suspended solids mg/L: milligram/liter
Results from Kendall Tau correlation analyses showed that treatment performance of the BIPF test system for total suspended solids did not vary in relation to different storm event characteristics (e.g., storm precipitation depth, average intensity, peak intensity, antecedent dry period, storm duration) or sampling date (i.e., did performance improve or decrease over time). Results from these analyses also showed influent and effluent total suspended solids
jr 08-03958-000 kristar ter.doc
June 4, 2010 49 Herrera Environmental Consultants

KriStar Perk Filter Stormwater Treatment System Performance Monitoring
concentrations were not correlated with any of the storm event characteristics or sampling date (Appendix N, Table N2, Table N3, Figures N1 through N3).
Total Phosphorus Based on the non-rejected data obtained from the 22 storm events sampled at the BIPF test system, influent total phosphorus concentrations ranged from 0.034 to 1.080 mg/L, with a median value of 0.127 mg/L (Table 13, Figure 13). Across the same storm events, effluent total phosphorus concentrations ranged from 0.017 to 0.203 mg/L, with a median value of 0.051 mg/L. Total phosphorus removal efficiency for all non-rejected data estimates ranged from -1 to 96 percent, with a median value of 64 percent (Table 13).
A one-tailed Wilcoxon signed-rank test (Appendix N, Table N1) was performed on the total phosphorus data from the BIPF test system. The results confirmed that there was a statistically significant (p < 0.001) decrease in effluent total phosphorus concentrations compared to influent total phosphorus concentrations.
Results from Kendall Tau correlation analyses showed that treatment performance of the BIPF test system for total phosphorus did not vary in relation to different storm event characteristics or sampling date. Results from these analyses also showed influent and effluent total phosphorus concentrations were not correlated with any of the storm event characteristics or sampling date (Appendix N, Table N2, Table N3, Figures N4 through N6).
Soluble Reactive Phosphorus Based on the non-rejected data obtained from 22 storm events sampled at the BIPF test system, influent soluble reactive phosphorus concentrations ranged from 0.002 mg/L to 0.190 mg/L, with a median value of 0.014 mg/L (Table 14, Figure 14). Across the same storm events, effluent soluble reactive phosphorus concentrations ranged from 0.002 to 0.080 mg/L, with a median value of 0.007 mg/L. Soluble reactive phosphorus removal efficiency estimates ranged from -133 to 97 percent, with a median value of 21 percent (Table 14, Figure 14).
A one-tailed Wilcoxon signed-rank test (Appendix N, Table N1) was performed on the SRP data from the BIPF test system. The results indicated there was no statistically significant difference (p = 0.116) between influent and effluent SRP concentrations.
Results from Kendall Tau correlation analyses showed that treatment performance of the BIPF test system for soluble reactive phosphorus did not vary in relation to different storm event characteristics or sampling date (Appendix N, Tables N2 and N3). Similarly, results from these analyses also showed influent concentrations were not correlated with any of the storm event characteristics or sampling date. However, effluent concentrations were significantly negatively correlated with storm precipitation depth (τ = -0.372) and storm duration (τ = -0.502) (Appendix N, Tables N2 and N3). These results indicate that small short duration storms are associated with higher concentrations of soluble reactive phosphorus in effluent from the BIPF test system. This pattern could be explained by flushing of the cartridges that occurs during the beginning of each event. With small events, this flush may dominate the effluent EMC, resulting
jr 08-03958-000 kristar ter.doc
Herrera Environmental Consultants 50 June 4, 2010

KriStar Perk Filter Stormwater Treatment System Performance Monitoring
jr 08-03958-000 kristar ter.doc
June 4, 2010 51 Herrera Environmental Consultants
in higher concentrations; with larger events, the signal from the cartridge flush would be lost, resulting in lower concentrations.
Table 13. Total phosphorus concentrations and removal efficiency estimates for individual sampling events at the BIPF test system.
Storm ID Influent Concentration
(mg/L) Qualifier Effluent Concentration
(mg/L) Qualifier Percent
Removal
Storm 34 0.585 0.225 r Storm 36 0.174 0.051 71 Storm 39 0.127 0.048 62 Storm 40 0.444 0.053 88 Storm 48 0.314 0.203 35 Storm 50 0.381 0.154 60 Storm 53 0.111 0.112 -1 Storm 55 0.098 r 0.099 r Storm 59 0.081 r 0.044 r Storm 64 0.034 0.027 21 Storm 65 0.082 0.057 30 Storm 73 0.107 J 0.017 84 Storm 75 0.072 0.022 69 Storm 77 0.054 0.02 63 Storm 78 0.113 0.025 78 Storm 81 0.464 0.126 73 Storm 83 0.218 0.063 71 Storm 97 0.118 r 0.066 r Storm 98 0.067 0.044 j 34 Storm 113 1.08 0.043 96 Storm 114 0.624 0.111 82 Storm 115 0.162 0.059 64
Mean 0.274 0.069 60 Median 0.162 0.052 67 Minimum 0.034 0.017 -1 Maximum 1.080 0.203 96
Note: Statistics only calculated for non-rejected values. J = estimated value based on water quality data (Appendix J) j: estimated value based on field QA (see Storm Event Guidelines section above) r: rejected value based on field QA (see Storm Event Guidelines section above)
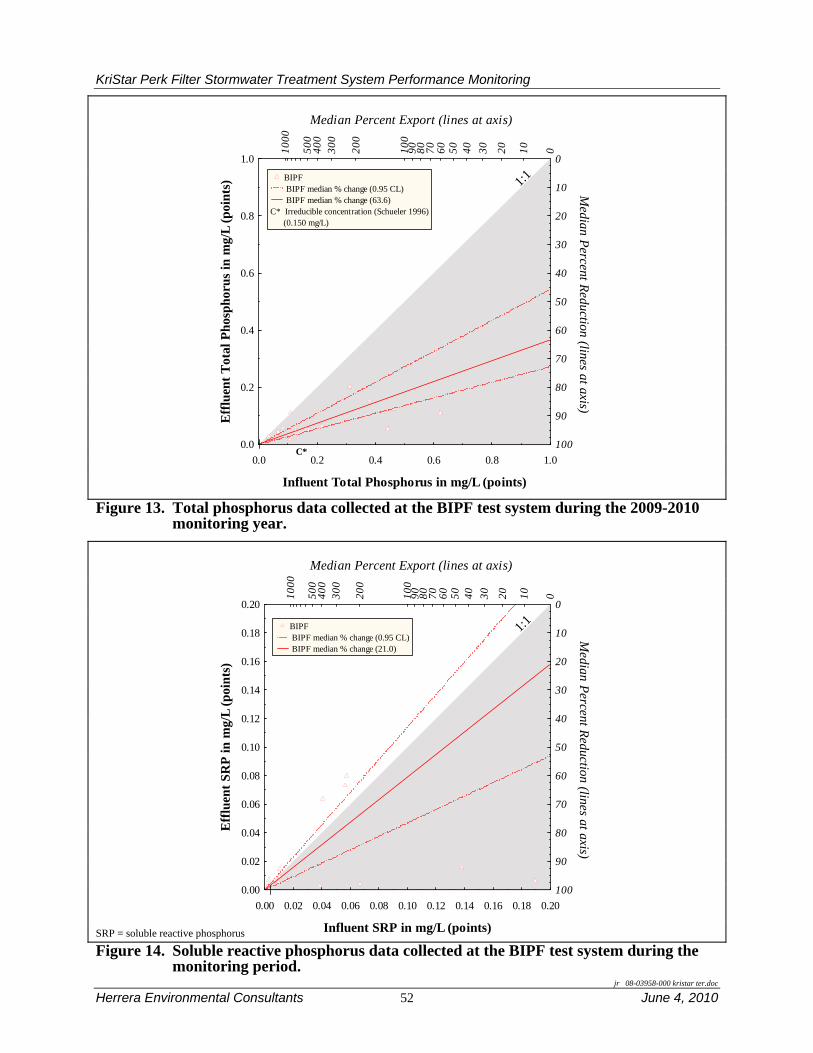
KriStar Perk Filter Stormwater Treatment System Performance Monitoring
0.0 0.2 0.4 0.6 0.8 1.0
Influent Total Phosphorus in mg/L (points)
0102030405060708090100
200
300
400
500
1000
0.0
0.2
0.4
0.6
0.8
1.0
Eff
luen
t Tot
al P
hosp
horu
s in
mg/
L (p
oint
s)
0
10
20
30
40
50
60
70
80
90
100
1:1
Median Percent Reduction (lines at axis)
Median Percent Export (lines at axis)
BIPF BIPF median % change (0.95 CL) BIPF median % change (63.6)
C* Irreducible concentration (Schueler 1996) (0.150 mg/L)
C*
Figure 13. Total phosphorus data collected at the BIPF test system during the 2009-2010 monitoring year.
SRP = soluble reactive phosphorus
0.00 0.02 0.04 0.06 0.08 0.10 0.12 0.14 0.16 0.18 0.20
Influent SRP in mg/L (points)
0102030405060708090100
200
300
400
500
1000
0.00
0.02
0.04
0.06
0.08
0.10
0.12
0.14
0.16
0.18
0.20
Eff
luen
t SR
P in
mg/
L (p
oint
s)
0
10
20
30
40
50
60
70
80
90
100
1:1
Median Percent Reduction (lines at axis)
Median Percent Export (lines at axis)
BIPF BIPF median % change (0.95 CL) BIPF median % change (21.0)
Figure 14. Soluble reactive phosphorus data collected at the BIPF test system during the monitoring period.
jr 08-03958-000 kristar ter.doc
Herrera Environmental Consultants 52 June 4, 2010
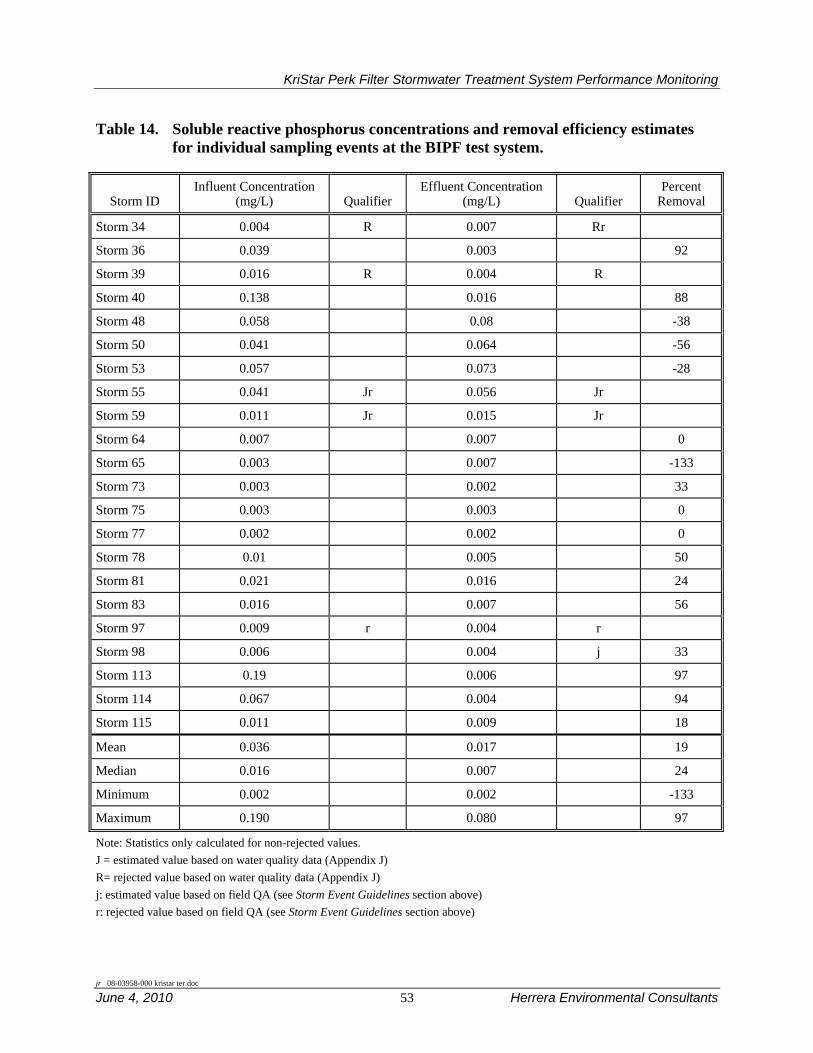
KriStar Perk Filter Stormwater Treatment System Performance Monitoring
Table 14. Soluble reactive phosphorus concentrations and removal efficiency estimates for individual sampling events at the BIPF test system.
Storm ID Influent Concentration
(mg/L) Qualifier Effluent Concentration
(mg/L) Qualifier Percent
Removal
Storm 34 0.004 R 0.007 Rr
Storm 36 0.039 0.003 92
Storm 39 0.016 R 0.004 R
Storm 40 0.138 0.016 88
Storm 48 0.058 0.08 -38
Storm 50 0.041 0.064 -56
Storm 53 0.057 0.073 -28
Storm 55 0.041 Jr 0.056 Jr
Storm 59 0.011 Jr 0.015 Jr
Storm 64 0.007 0.007 0
Storm 65 0.003 0.007 -133
Storm 73 0.003 0.002 33
Storm 75 0.003 0.003 0
Storm 77 0.002 0.002 0
Storm 78 0.01 0.005 50
Storm 81 0.021 0.016 24
Storm 83 0.016 0.007 56
Storm 97 0.009 r 0.004 r
Storm 98 0.006 0.004 j 33
Storm 113 0.19 0.006 97
Storm 114 0.067 0.004 94
Storm 115 0.011 0.009 18
Mean 0.036 0.017 19
Median 0.016 0.007 24
Minimum 0.002 0.002 -133
Maximum 0.190 0.080 97
Note: Statistics only calculated for non-rejected values. J = estimated value based on water quality data (Appendix J) R= rejected value based on water quality data (Appendix J) j: estimated value based on field QA (see Storm Event Guidelines section above) r: rejected value based on field QA (see Storm Event Guidelines section above)
jr 08-03958-000 kristar ter.doc
June 4, 2010 53 Herrera Environmental Consultants
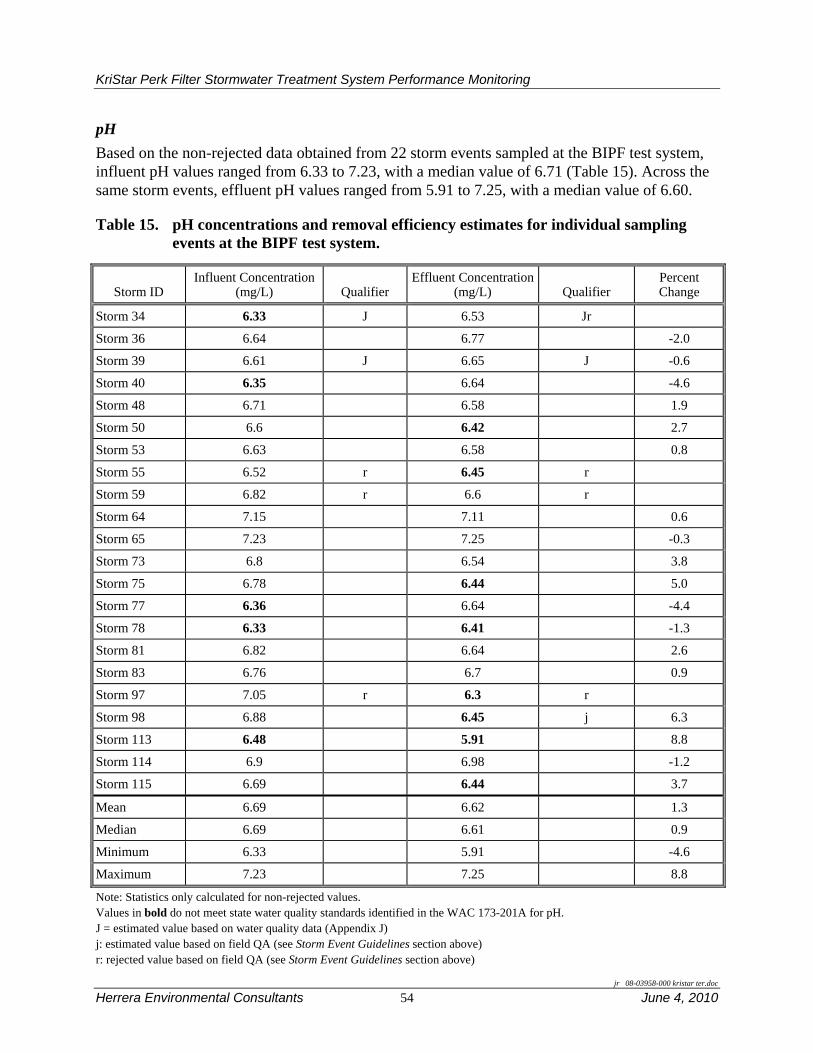
KriStar Perk Filter Stormwater Treatment System Performance Monitoring
pH Based on the non-rejected data obtained from 22 storm events sampled at the BIPF test system, influent pH values ranged from 6.33 to 7.23, with a median value of 6.71 (Table 15). Across the same storm events, effluent pH values ranged from 5.91 to 7.25, with a median value of 6.60.
Table 15. pH concentrations and removal efficiency estimates for individual sampling events at the BIPF test system.
Storm ID Influent Concentration
(mg/L) Qualifier Effluent Concentration
(mg/L) Qualifier Percent Change
Storm 34 6.33 J 6.53 Jr
Storm 36 6.64 6.77 -2.0
Storm 39 6.61 J 6.65 J -0.6
Storm 40 6.35 6.64 -4.6
Storm 48 6.71 6.58 1.9
Storm 50 6.6 6.42 2.7
Storm 53 6.63 6.58 0.8
Storm 55 6.52 r 6.45 r
Storm 59 6.82 r 6.6 r
Storm 64 7.15 7.11 0.6
Storm 65 7.23 7.25 -0.3
Storm 73 6.8 6.54 3.8
Storm 75 6.78 6.44 5.0
Storm 77 6.36 6.64 -4.4
Storm 78 6.33 6.41 -1.3
Storm 81 6.82 6.64 2.6
Storm 83 6.76 6.7 0.9
Storm 97 7.05 r 6.3 r
Storm 98 6.88 6.45 j 6.3
Storm 113 6.48 5.91 8.8
Storm 114 6.9 6.98 -1.2
Storm 115 6.69 6.44 3.7
Mean 6.69 6.62 1.3
Median 6.69 6.61 0.9
Minimum 6.33 5.91 -4.6
Maximum 7.23 7.25 8.8
Note: Statistics only calculated for non-rejected values. Values in bold do not meet state water quality standards identified in the WAC 173-201A for pH. J = estimated value based on water quality data (Appendix J) j: estimated value based on field QA (see Storm Event Guidelines section above) r: rejected value based on field QA (see Storm Event Guidelines section above)
jr 08-03958-000 kristar ter.doc
Herrera Environmental Consultants 54 June 4, 2010

KriStar Perk Filter Stormwater Treatment System Performance Monitoring
Comparisons of the pH data to Washington State surface water quality standards (WAC 173-201A) showed that 25 percent of the influent samples and 31 percent of the effluent samples at the BIPF test system (Table 15) were below the acceptable range (i.e., 6.5 to 8.5) identified by the standard.
A Wilcoxon signed-rank test of the pH data indicated that there was no significant difference (p = 0.117) between the influent and effluent concentrations.
Analyses performed to evaluate potential relationships between pH and storm event characteristics showed that influent pH levels exhibited a significant negative correlation with average storm intensity (τ = -0.374) (Appendix N, Tables N2 and N3). Effluent pH levels did not exhibit any correlation with any of the storm event characteristics or the sampling date (Appendix N, Tables N2 and N3).
Particle Size Distribution
The TAPE guidelines state that Pacific Northwest stormwater typically contains mostly silt-sized particles; thus, PSD results should be provided to indicate whether the stormwater runoff analyzed is consistent with particle sizes typically found in urban runoff in this region.
Spectra Laboratories were used for PSD analysis for storms 34, 36, 39, 40, and 48. After Storm 48, all laboratory analyses for PSD were performed by Analytical Resources, Inc. to obtain results that more closely followed the recommendation provided in Appendix F of the TAPE guidelines (Ecology 2008a). As a result, the PSD data for storms 34, 36, 39, 40, and 48 applied a slightly different binning method (i.e., not Wentworth scale), did not have bins larger than 128 microns, and did not have a bin for >128 microns. Therefore, the >128 micron bin was estimated by summing the mass in each bin below 128 microns and then subtracting this mass from the influent total suspended solids concentration obtained from each event.
A comparison of the bin breaks between the two labs is presented in Table 16. As is apparent in Figure 15, the PSD results from Spectra were not consistent with the PSD results from Analytical Resources. Specifically, the Spectra results appear to underestimate the amount of silt in the influent samples (Spectra PSD analysis was not done for effluent samples). Despite this apparent bias, average influent PSD among all the events, including the Spectra events, was characterized by majority silt (48 percent), followed by sand (27 percent), coarser than sand (13 percent), and clay and finer (12 percent) (Table 17, Figure 15). Consequently, this dataset generally meets the TAPE guidelines of mostly silt-sized particles in influent runoff.
Effluent PSD data from the BIPF test system (only analyzed after Storm 48) showed that an average of 25 percent of the sample could be classified as silt, 29 percent as clay, 39 percent as colloids, and 6 percent as medium sand (Table 17, Figure 16). The largest median mass removal rates at the BIPF test system occurred in the fine and very fine sand fractions (100 percent), followed by the silt size fraction (92.5 percent), the coarser than medium sand fraction (92.0 percent), the medium sand fraction (82.6 percent), and finally the clay fraction (53.0 percent) (Table 17). The mass of colloids in the effluent was actually 18.0 percent greater
jr 08-03958-000 kristar ter.doc
June 4, 2010 55 Herrera Environmental Consultants

KriStar Perk Filter Stormwater Treatment System Performance Monitoring
than in the influent. This increase in colloids was likely due to measurement error or the weathering of fine clays within the filter.
Table 16. The Wentworth scale for classification of particle size distribution.
Soil Description Spectra Labs Scale Size
Breaks ARI, Inc. Scale Size Break
(Wentworth Scale)
Medium sand NA < 500 µm Fine sand NA < 250 µm Very fine sand <128 µm < 125 µm Silt NA < 62.5 µm Coarse Silt <63 µm NA Medium Silt <31 µm NA Fine Silt <16 µm NA Very Fine Silt <8 µm NAClay <3.9 µm < 3.9 µm Colloid <2 µm < 1 µm
µm = microns Wentworth scale size breaks based on Wentworth (1922)
PSD results from Spectra Labs
Red line = average particle size distribution
Figure 15. Particle size distribution data collected from BIPF-IN during the monitoring period.
jr 08-03958-000 kristar ter.doc
Herrera Environmental Consultants 56 June 4, 2010

KriStar Perk Filter Stormwater Treatment System Performance Monitoring
Table 17. Summary of particle size distributions measured at the BIPF test system during the monitoring period.
Particle Size (micron) Wentworth Class Name Influent a Effluent b Percent Mass Reduction c
>500 Coarser than medium sand 13% 0% 92.0% 500-250 Medium sand 7% 6% 82.6% 250-125 Fine sand 5% 0% 100% 125-62.5 Very fine sand 15% 0% 100% 62.5-3.9 Silt 48% 25% 92.5% 3.9-1 Clay 8% 29% 53.0% <1 Colloids 4% 39% -18.0% a Influent PSD for Storms 34, 36, 39, 40, and 48 were analyzed without the >128 uM fraction. This fraction was estimated
using total suspended solids data. b Effluent PSD was not analyzed for Storms 34, 36, 39, 40, and 48. c Mass removal calculated for Storms 49 and greater based on average mass in each size class. Bold value indicates that Wentworth scale break for silt. Wentworth scale size breaks based on Wentworth (1922)
Red line = average particle size distribution
Figure 16. Particle size distribution data collected from BIPF-OUT during the monitoring period.
Sediment Retention
Sediment depth within the inlet gallery was measured on two occasions, once on October 6, 2009 and once after the completion of monitoring on March 12, 2010. The system was vacuumed on
jr 08-03958-000 kristar ter.doc
June 4, 2010 57 Herrera Environmental Consultants

KriStar Perk Filter Stormwater Treatment System Performance Monitoring
jr 08-03958-000 kristar ter.doc
Herrera Environmental Consultants 58 June 4, 2010
April 29, 2009 so the first measurement represented 160 days of sediment accumulation and the second measurement represented an additional 157 more days or a total of 317 days. Sediment depths measured October 6, 2010 averaged 0.06 feet. Deposited sediment volume in the inlet gallery on this date was 0.9 cubic feet. At the end of the study, the average sediment depth was 0.27 feet. Deposited sediment volume in the inlet gallery on this date was 4.05 cubic feet. Consequently, the system accumulated approximately 4 cubic feet of sediment over 317 days (10.5 months). The system has the potential to accumulate 0.62 feet of sediment before requiring vacuuming, so the recommended 6-month schedule for vacuuming appears adequate to keep the sediment at acceptable levels at this site.

KriStar Perk Filter Stormwater Treatment System Performance Monitoring
Performance Evaluation
This section evaluates water quality data based on treatment goals addressed in this TER.
Basic Treatment
The basic treatment goal listed in the TAPE guidelines is 80 percent removal of total suspended solids for influent concentrations ranging from 100 to 200 mg/L. For influent total suspended solids concentrations less than 100 mg/L, the facilities should achieve an effluent goal of 20 mg/L. There is no specified criterion for influent total suspended solids concentrations less than 20 mg/L. Based on preliminary discussions with Ecology regarding data requirements for this TER (Ecology 2009), only samples with influent total suspended solids concentrations of 20 mg/L or greater were acceptable for evaluating the performance of the Perk Filter based on basic treatment goals specified in the TAPE guidelines.
In this analysis, the effluent threshold and percent removal goals described above were both evaluated using data with influent concentrations ranging from 20 to 200 mg/L to increase the sample size and thus improve the power of statistical analyses. In theory, this would make it more difficult to show the system meets the 80 percent reduction goal because a reduction of this magnitude is more difficult to achieve when influent concentrations between 20 and 100 mg/L are included in the analysis. Similarly, the maximum effluent concentration goal of 20 mg/L is more difficult to achieve when influent concentrations between 100 and 200 mg/L are included in the analysis.
The TAPE guidelines require a maximum of 35 sampling events and a minimum of 12. During the monitoring period, this threshold was met (22 sampled events). After rejected values were excluded the coefficient of variation (COV) computed from data obtained from these 22 sampling events was 0.74 (Appendix L). Based on information presented in Appendix D, Table 2, of the TAPE guidelines, only eight sample pairs are required to demonstrate basic treatment (i.e., 80 percent removal of total suspended solids) given a COV of 0.74 for influent total suspended solids concentrations. Consequently, a sufficient number of samples were collected to meet this guideline.
A one-tailed Wilcoxon signed-rank test (Appendix N, Table N1) performed on the total suspended solids data indicated there was a statistically significant (p < 0.001) decrease in effluent total suspended solids concentrations compared to influent total suspended solids concentrations. Total suspended solids removal rates ranged from 50 to 95 percent, with a median value of 83 percent based on the data obtained from the 16 sample pairs that were not rejected for QA purposes and had influent concentrations that ranged from 20 to 200 mg/L (Table 18). As shown in Table 19, the lower 95 percent confidence interval about the median percent reduction was 80 percent. Consequently, it can be concluded that the Perk Filter met the basic treatment goal for percent removal with the required 95 percent confidence specified in the TAPE guidelines.
jr 08-03958-000 kristar ter.doc
June 4, 2010 59 Herrera Environmental Consultants

KriStar Perk Filter Stormwater Treatment System Performance Monitoring
Table 18. Total suspended solids concentrations and removal efficiency estimates for valid sampling events at the BIPF test system.
Storm ID
Influent Concentration
(mg/L) Qualifier
Effluent Concentration
(mg/L) Qualifier Percent
Removal
Average Sampled Flow Rate
(cfs)
Storm 36 58 11 81 0.127 Storm 39 70 6.7 90 0.251 Storm 40 139 7.5 95 0.258 Storm 48 170 25.5 85 0.541 Storm 50 190 27 86 0.497 Storm 53 28 5.3 81 0.303 Storm 65 41 13 68 0.972 Storm 73 65 J 3 95 0.699 Storm 75 36 6 83 0.453 Storm 78 71 4 94 0.561 Storm 81 182 36 80 0.401 Storm 83 109 18 83 0.441 Storm 98 30 15 j 50 0.559 Storm 113 168 11 93 0.250 Storm 114 103 27 74 0.137 Storm 115 60 13 78 0.246
Mean 95 14 82 0.419 Median 71 12 83 0.421 Minimum 28 3 50 0.127 Maximum 190 36 95 0.972
Note: Statistics only calculated for non-rejected values. J = estimated value based on water quality data (Appendix J) j: estimated value based on field QA (see Storm Event Guidelines section above) The aggregate pollutant load reduction was also calculated for the valid total suspended solids data and all the non-rejected total suspended solids data. The results of these analyses indicated that total suspended solids load was, on average, reduced by 84 and 85 percent based on all non-rejected data and all valid data, respectively (Appendix L).
Finally, the median effluent total suspended solids concentration from this same subset of data (Table 18) was 12 mg/L, and the upper 95 percent confidence limit for the median was 19.0 mg/L (Table 19). Because the upper confidence limit is lower than the effluent goal of 20 mg/L, it can also be concluded that the BIPF test system met the basic treatment goal for effluent concentration with the required 95 percent confidence specified in the TAPE guidelines.
To determine what flow rates this total suspended solids removal was associated with, the flow rate at the point when each aliquot was collected was calculated. These flow rates were then
jr 08-03958-000 kristar ter.doc
Herrera Environmental Consultants 60 June 4, 2010
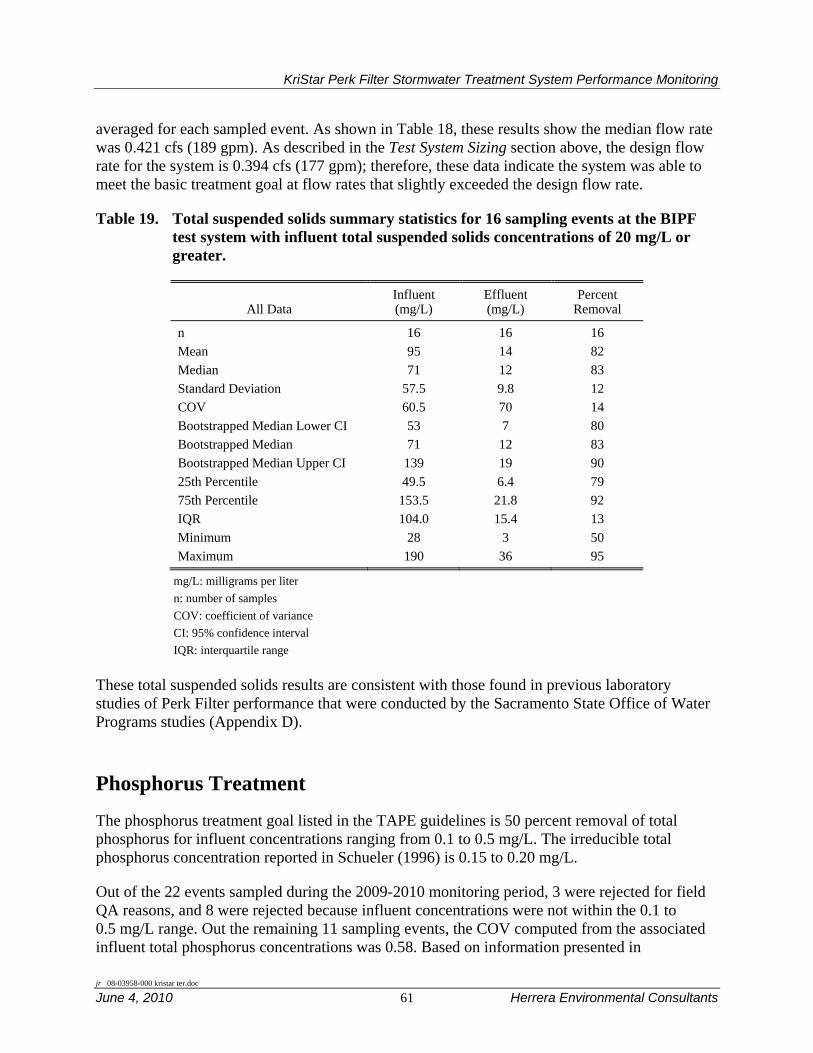
KriStar Perk Filter Stormwater Treatment System Performance Monitoring
averaged for each sampled event. As shown in Table 18, these results show the median flow rate was 0.421 cfs (189 gpm). As described in the Test System Sizing section above, the design flow rate for the system is 0.394 cfs (177 gpm); therefore, these data indicate the system was able to meet the basic treatment goal at flow rates that slightly exceeded the design flow rate.
Table 19. Total suspended solids summary statistics for 16 sampling events at the BIPF test system with influent total suspended solids concentrations of 20 mg/L or greater.
All Data Influent (mg/L)
Effluent (mg/L)
Percent Removal
n 16 16 16 Mean 95 14 82 Median 71 12 83 Standard Deviation 57.5 9.8 12 COV 60.5 70 14 Bootstrapped Median Lower CI 53 7 80 Bootstrapped Median 71 12 83 Bootstrapped Median Upper CI 139 19 90 25th Percentile 49.5 6.4 79 75th Percentile 153.5 21.8 92 IQR 104.0 15.4 13 Minimum 28 3 50 Maximum 190 36 95
mg/L: milligrams per liter n: number of samples COV: coefficient of variance CI: 95% confidence interval IQR: interquartile range
These total suspended solids results are consistent with those found in previous laboratory studies of Perk Filter performance that were conducted by the Sacramento State Office of Water Programs studies (Appendix D).
Phosphorus Treatment
The phosphorus treatment goal listed in the TAPE guidelines is 50 percent removal of total phosphorus for influent concentrations ranging from 0.1 to 0.5 mg/L. The irreducible total phosphorus concentration reported in Schueler (1996) is 0.15 to 0.20 mg/L.
Out of the 22 events sampled during the 2009-2010 monitoring period, 3 were rejected for field QA reasons, and 8 were rejected because influent concentrations were not within the 0.1 to 0.5 mg/L range. Out the remaining 11 sampling events, the COV computed from the associated influent total phosphorus concentrations was 0.58. Based on information presented in
jr 08-03958-000 kristar ter.doc
June 4, 2010 61 Herrera Environmental Consultants

KriStar Perk Filter Stormwater Treatment System Performance Monitoring
Appendix D, Figure 2, of the TAPE guidelines, approximately 15 sample pairs are required to demonstrate phosphorus treatment (i.e., 50 percent removal of total phosphorus) given a COV of 0.58 for influent total phosphorus concentrations.
However, despite the low sample size and resultant low statistical power, a one-tailed Wilcoxon signed-rank test (Appendix N, Table N1) performed on the data from these 11 sampling events indicated there was a statistically significant (p = 0.002) decrease in effluent total phosphorus concentrations compared to influent concentrations. As shown in Table 20, influent concentrations from these sampling events ranged from 0.107 to 0.464 mg/L with a median value of 0.174 mg/L. Effluent concentrations for the same events ranged from 0.017 to 0.203 mg/L with a median value of 0.059 mg/L.
Table 20. Total phosphorus concentrations and removal efficiency estimates for valid sampling events at the BIPF test system.
Storm ID
Influent Concentration
(mg/L) Qualifier
Effluent Concentration
(mg/L) QualifierPercent
Removal
Average Sampled Flow Rate (cfs)
Storm 36 0.174 0.051 71 0.127 Storm 39 0.127 0.048 62 0.251 Storm 40 0.444 0.053 88 0.258 Storm 48 0.314 0.203 35 0.541 Storm 50 0.381 0.154 60 0.497 Storm 53 0.111 0.112 -1 0.303 Storm 73 0.107 J 0.017 84 0.699 Storm 78 0.113 0.025 78 0.561 Storm 81 0.464 0.126 73 0.401 Storm 83 0.218 0.063 71 0.441 Storm 115 0.162 0.059 64 0.246
Mean 0.237 0.083 62 0.393 Median 0.174 0.059 71 0.401 Minimum 0.107 0.017 -1 0.127 Maximum 0.464 0.203 88 0.699
Note: Statistics only calculated for non-rejected values. J = estimated value based on water quality data (Appendix J) A bootstrap estimate of the median percent reduction for these data was 71 percent with a lower 95 percent confidence limit of 60 percent and an upper 95 percent confidence limit of 78 percent (Table 21). In addition, the aggregate pollutant load reduction was calculated for the valid total phosphorus data and all the non-rejected total phosphorus data. The results of these analysis indicated that total phosphorus load was, on average, reduced by 72 percent for both data sets (Appendix L). Based on these results, it can be concluded that the median percent removal was significantly greater than 50 percent goal specified in the TAPE guideline with the required 95 percent confidence.
jr 08-03958-000 kristar ter.doc
Herrera Environmental Consultants 62 June 4, 2010
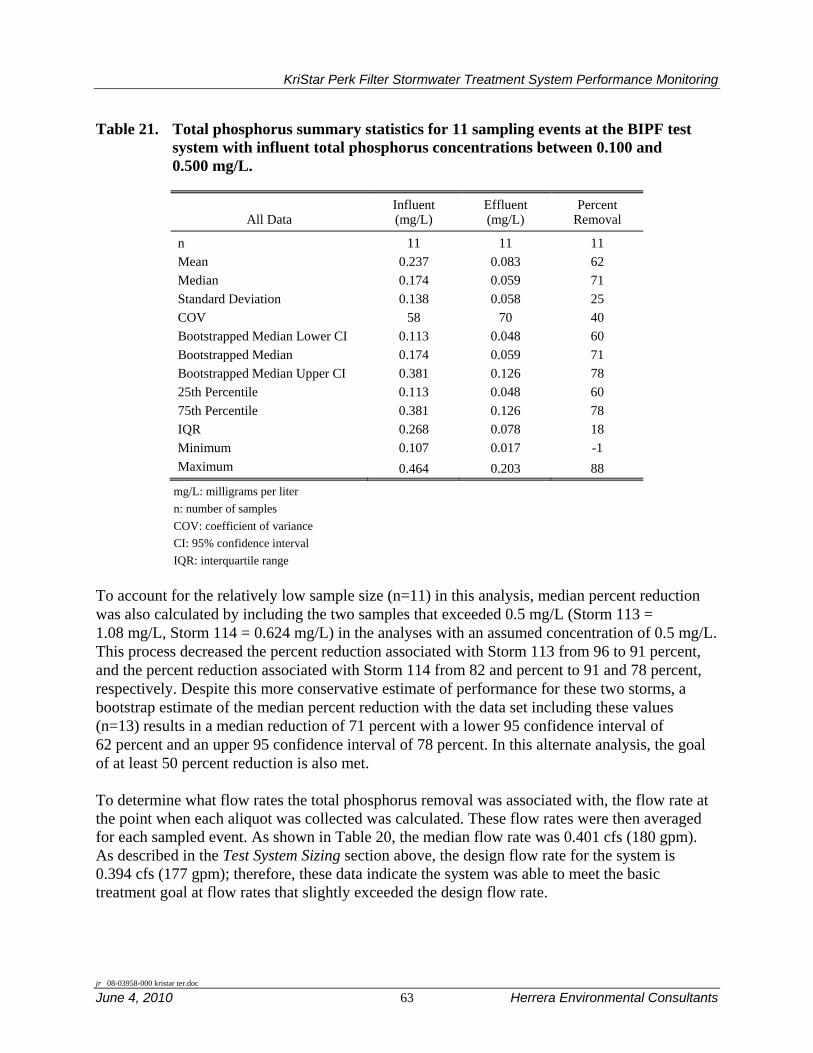
KriStar Perk Filter Stormwater Treatment System Performance Monitoring
jr 08-03958-000 kristar ter.doc
June 4, 2010 63 Herrera Environmental Consultants
Table 21. Total phosphorus summary statistics for 11 sampling events at the BIPF test system with influent total phosphorus concentrations between 0.100 and 0.500 mg/L.
All Data Influent (mg/L)
Effluent (mg/L)
Percent Removal
n 11 11 11 Mean 0.237 0.083 62 Median 0.174 0.059 71 Standard Deviation 0.138 0.058 25 COV 58 70 40 Bootstrapped Median Lower CI 0.113 0.048 60 Bootstrapped Median 0.174 0.059 71 Bootstrapped Median Upper CI 0.381 0.126 78 25th Percentile 0.113 0.048 60 75th Percentile 0.381 0.126 78 IQR 0.268 0.078 18 Minimum 0.107 0.017 -1 Maximum 0.464 0.203 88
mg/L: milligrams per liter n: number of samples COV: coefficient of variance CI: 95% confidence interval IQR: interquartile range
To account for the relatively low sample size (n=11) in this analysis, median percent reduction was also calculated by including the two samples that exceeded 0.5 mg/L (Storm 113 = 1.08 mg/L, Storm 114 = 0.624 mg/L) in the analyses with an assumed concentration of 0.5 mg/L. This process decreased the percent reduction associated with Storm 113 from 96 to 91 percent, and the percent reduction associated with Storm 114 from 82 and percent to 91 and 78 percent, respectively. Despite this more conservative estimate of performance for these two storms, a bootstrap estimate of the median percent reduction with the data set including these values (n=13) results in a median reduction of 71 percent with a lower 95 confidence interval of 62 percent and an upper 95 confidence interval of 78 percent. In this alternate analysis, the goal of at least 50 percent reduction is also met.
To determine what flow rates the total phosphorus removal was associated with, the flow rate at the point when each aliquot was collected was calculated. These flow rates were then averaged for each sampled event. As shown in Table 20, the median flow rate was 0.401 cfs (180 gpm). As described in the Test System Sizing section above, the design flow rate for the system is 0.394 cfs (177 gpm); therefore, these data indicate the system was able to meet the basic treatment goal at flow rates that slightly exceeded the design flow rate.


KriStar Perk Filter Stormwater Treatment System Performance Monitoring
jr 08-03958-000 kristar ter.doc
June 4, 2010 65 Herrera Environmental Consultants
Conclusions
To obtain performance data to support the issuance of a GULD for the Perk Filter stormwater filtration system, Herrera conducted hydrologic and water quality monitoring at a Perk Filter test system on Bainbridge Island, Washington from May 2009 through February 2010. During this monitoring period, a total of 22 separate storm events were sampled.
Of the 22 sampled events 16 qualified for total suspended solids analysis. Influent and effluent pairs were compared and the results indicated that the median percent reduction was 83 percent with a lower 95 percent confidence limit of 80 percent. Consequently, the 80 percent reduction goal identified in the TAPE for basic treatment was met.
Eleven of the 22 sampled events qualified for total phosphorus analysis. The median percent total phosphorus reduction was 71 percent with a 95 percent lower confidence limit of 60 percent. The treatment goal for phosphorus in the TAPE is a significant decrease of at least 50 percent. Consequently, the Perk Filter met the TAPE phosphorus treatment goal.
The average treated flow rate during sample collection for both total suspended solids and total phosphorus slightly exceeded the design flow rate for the system. Consequently, sufficient treatment was achieved at the design flow rate of 0.394 cfs (177 gpm).


KriStar Perk Filter Stormwater Treatment System Performance Monitoring
References
Davison, A.C. and D.V. Hinkley. 1997. Bootstrap Methods and Their Application. Cambridge University Press, Cambridge, New York.
Ecology. 2004. Stormwater Management Manual for Eastern Washington. Washington State Department of Ecology, Olympia, Washington.
Ecology. 2005. 2005 Stormwater Management Manual for Western Washington: Volume III – Hydrologic Analysis and Flow Control Design/BMPs. Washington State Department of Ecology, Olympia, Washington.
Ecology. 2008a. Guidance for Evaluating Emerging Stormwater Treatment Technologies: Technology Assessment Protocol – Ecology (TAPE). Publication No. 02-10-037, Washington State Department of Ecology, Olympia, Washington.
Ecology. 2008b. Pilot Use Level Designation for Basic Treatment for KriStar Enterprises, Inc. Flogard Perk Filter. Washington State Department of Ecology, Olympia, Washington.
Herrera. 2008. Quality Assurance Project Plan: KriStar Perk Filter Stormwater Treatment System Performance Monitoring Project. Prepared for KriStar Enterprises, Inc., by Herrera Environmental Consultants, Inc., Seattle, Washington.
Howie, Douglas. 2009. Personal communication (discussion with Dylan Ahearn of Herrera Environmental Consultants, Inc., Seattle, Washington, regarding Perk Filter data at Ecology head quarters). Washington State Department of Ecology, Olympia, Washington. December 23, 2009.
OWP. 2009. Perk Filter Research and Development 2008-2009. Prepared for Kristar Enterprises, Inc., by Sacramento State University, Office of Water Programs, Sacramento, California.
Shaver, H., R. Horner, J. Skupien, C. May, and G. Ridley. 2007. Fundamentals of Urban Runoff Management: Technical and Institutional Issues. North American Lake Management Society, Madison, Wisconsin.
U.S. EPA. 2002. Urban Stormwater BMP Performance Monitoring: A Guidance Manual for Meeting the National Stormwater BMP Database Requirements. EPA-821-B-02-001, U.S. Environmental Protection Agency, Washington, D.C.
Walkowiak, D.K. (Editor), 2006. Isco Open Channel Flow Measurement Handbook. Teledyne Isco, Inc., Lincoln, Nebraska. 520 pp.
Wentworth, C.K. 1922. A Scale of Grade and Class Terms for Clastic Sediments. Journal of Geology 30(5):377-392.
jr 08-03958-000 kristar ter.doc
June 4, 2010 67 Herrera Environmental Consultants

KriStar Perk Filter Stormwater Treatment System Performance Monitoring
jr 08-03958-000 kristar ter.doc
Herrera Environmental Consultants 68 June 4, 2010
Zeigler, Ellie. 2007. Personal communication (average daily trip [ADT] data provided to Herrera Environmental Consultants, Inc., Seattle, Washington). Washington State Department of Transportation, Washington State Ferries Environmental Compliance Office, Seattle, Washington.