Embed Size (px)
DESCRIPTION
Impact of Reduced Nitrogen on Air Quality: Fine Scale Simulation, Evaluation, and Sensitivity Study. Kristen Olsen and Yang Zhang Department of Marine, Earth, and Atmospheric Sciences, NC State University, Raleigh, NC John Walker - PowerPoint PPT Presentation
Citation preview
Impact of Reduced Nitrogen on Air Quality: Fine Scale
Simulation, Evaluation, and Sensitivity StudyKristen Olsen and Yang Zhang
Department of Marine, Earth, and Atmospheric Sciences, NC State University, Raleigh, NC
John WalkerDivision of Air Pollution Prevention and Control, US EPA, RTP, NC
Wayne RobargeDepartment of Soil Science, NC State University, Raleigh, NC
The 7th Annual CMAS Conference
Chapel Hill, NC, October 6-8, 2008
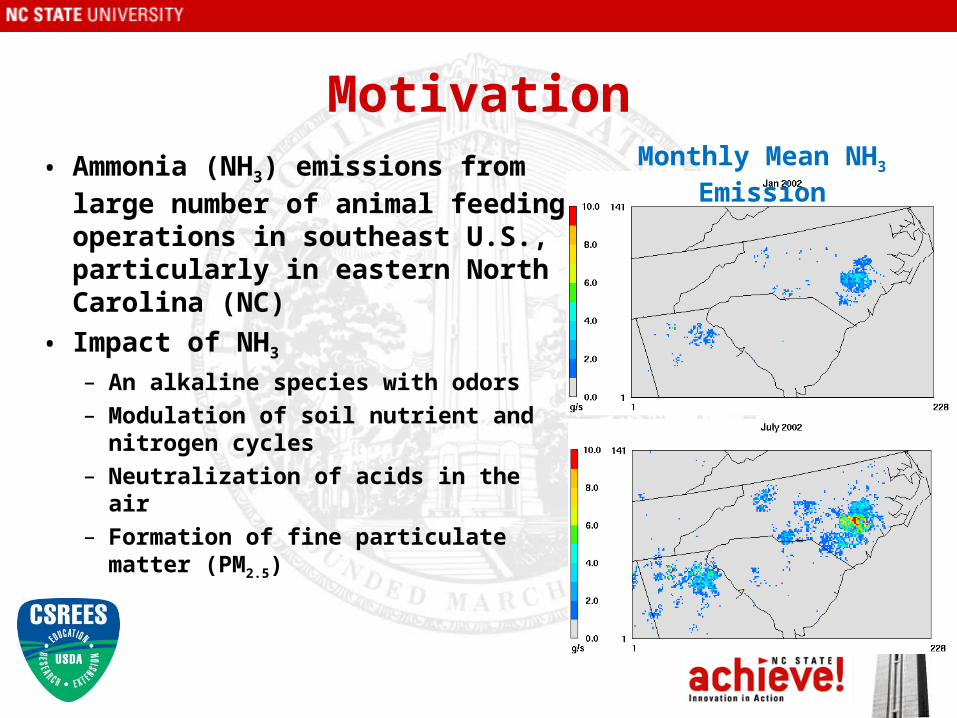
Motivation• Ammonia (NH3) emissions from
large number of animal feeding operations in southeast U.S., particularly in eastern North Carolina (NC)
• Impact of NH3
– An alkaline species with odors– Modulation of soil nutrient and
nitrogen cycles– Neutralization of acids in the air– Formation of fine particulate matter
(PM2.5)
Monthly Mean NH3 Emission

Objectives• Intercompare the performance of two air
quality models in simulating the fate and transport of reduced nitrogen (NHx = NH3 + NH4
+) at fine grid scales• Evaluate the sensitivity of air quality
predictions to a 50% reduction of emissions of agricultural livestock NH3 (AL-NH3)
• Examine model sensitivity to horizontal grid resolution (12-, 4-, and 1.33-km)
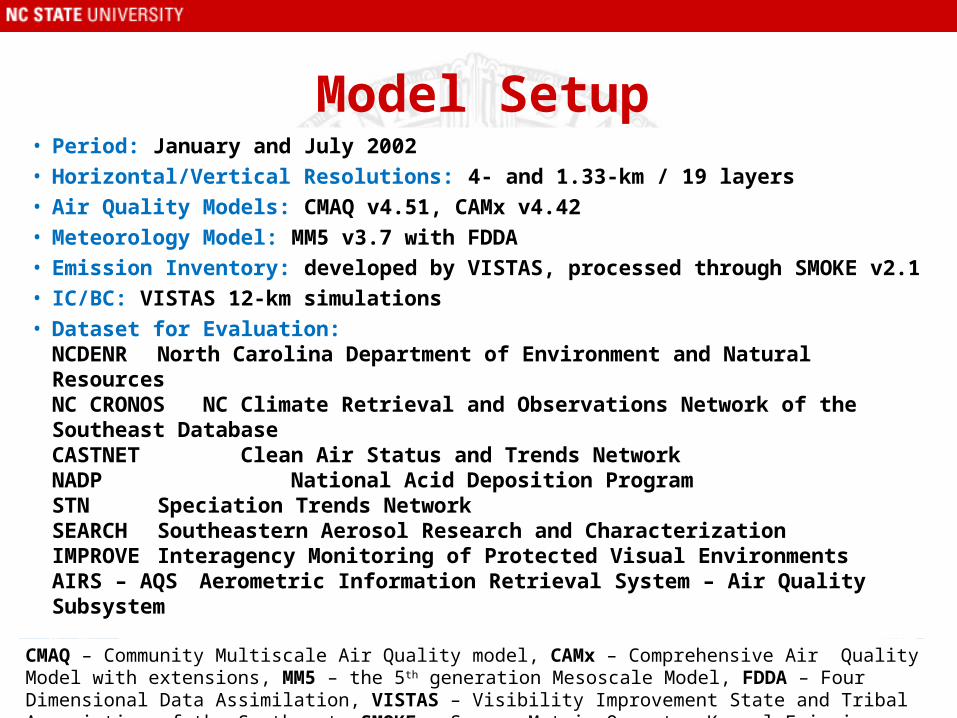
CMAQ – Community Multiscale Air Quality model, CAMx – Comprehensive Air Quality Model with extensions, MM5 – the 5th generation Mesoscale Model, FDDA – Four Dimensional Data Assimilation, VISTAS – Visibility Improvement State and Tribal Association of the Southeast, SMOKE – Sparse Matrix Operator Kernel Emission
Model Setup• Period: January and July 2002
• Horizontal/Vertical Resolutions: 4- and 1.33-km / 19 layers
• Air Quality Models: CMAQ v4.51, CAMx v4.42
• Meteorology Model: MM5 v3.7 with FDDA
• Emission Inventory: developed by VISTAS, processed through SMOKE v2.1
• IC/BC: VISTAS 12-km simulations
• Dataset for Evaluation: NCDENR North Carolina Department of Environment and Natural ResourcesNC CRONOS NC Climate Retrieval and Observations Network of the Southeast DatabaseCASTNET Clean Air Status and Trends Network NADP National Acid Deposition Program STN Speciation Trends NetworkSEARCH Southeastern Aerosol Research and Characterization IMPROVE Interagency Monitoring of Protected Visual Environments AIRS – AQS Aerometric Information Retrieval System – Air Quality Subsystem
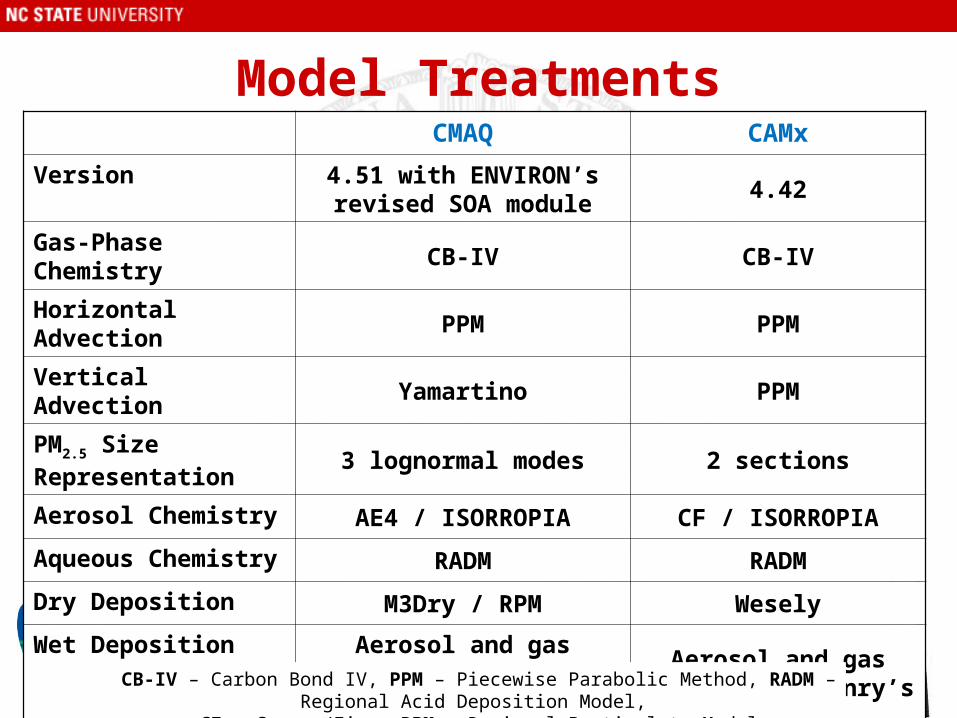
Model TreatmentsCMAQ CAMx
Version 4.51 with ENVIRON’s revised SOA module
4.42
Gas-Phase Chemistry CB-IV CB-IV
Horizontal Advection PPM PPM
Vertical Advection Yamartino PPM
PM2.5 Size Representation 3 lognormal modes 2 sections
Aerosol Chemistry AE4 / ISORROPIA CF / ISORROPIA
Aqueous Chemistry RADM RADM
Dry Deposition M3Dry / RPM Wesely
Wet Deposition Aerosol and gas scavenging; Henry’s Law;
accumulation/coarse PM in cloud water, Aitken slowly absorbed
Aerosol and gas scavenging; Henry’s Law;
all PM in cloud water
CB-IV – Carbon Bond IV, PPM – Piecewise Parabolic Method, RADM – Regional Acid Deposition Model, CF – Coarse/Fine, RPM – Regional Particulate Model
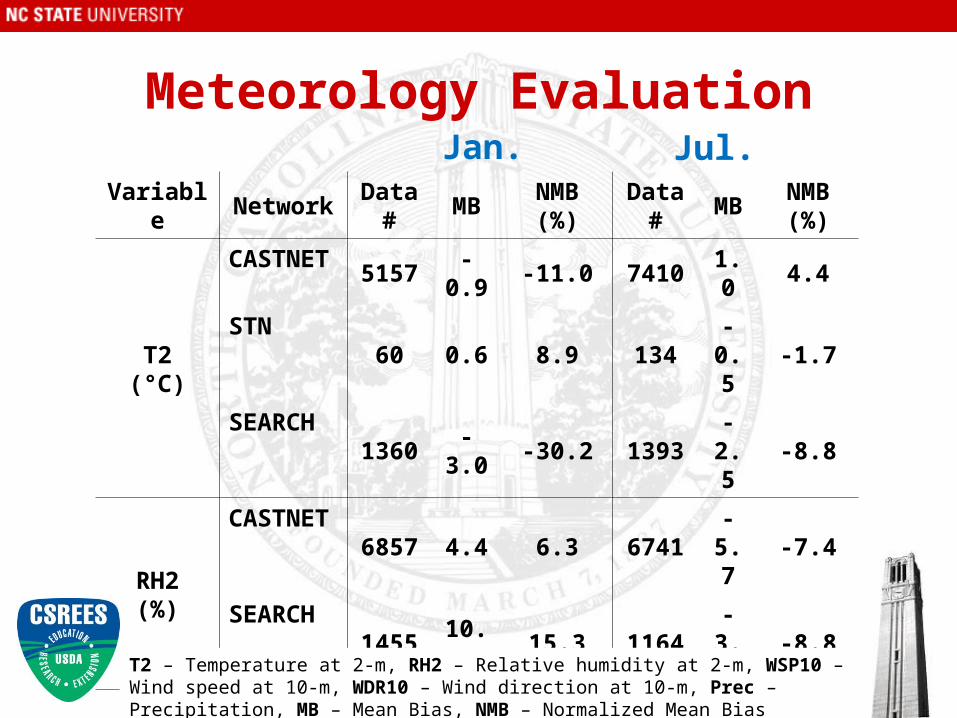
Meteorology EvaluationJan.
Variable Network Data # MB NMB (%) Data # MB NMB (%)
T2(°C)
CASTNET 5157 -0.9 -11.0 7410 1.0 4.4
STN 60 0.6 8.9 134 -0.5 -1.7
SEARCH 1360 -3.0 -30.2 1393 -2.5 -8.8
RH2(%)
CASTNET 6857 4.4 6.3 6741 -5.7 -7.4
SEARCH 1455 10.7 15.3 1164 -3.4 -8.8
WSP10(m s-1)
CASTNET 4877 1.1 18.7 3251 1.1 31.0
SEARCH 1067 0.4 3.5 571 0.8 22.8
WDR10(°)
CASTNET 7098 12.1 6.0 7140 0.9 0.5
SEARCH 1455 0.3 6.0 1182 -6.5 -2.9
Prec (mm) NADP 72 -3.2 -11.0 84 45.6 151.3
Jul.
T2 – Temperature at 2-m, RH2 – Relative humidity at 2-m, WSP10 – Wind speed at 10-m, WDR10 – Wind direction at 10-m, Prec – Precipitation, MB – Mean Bias, NMB – Normalized Mean Bias
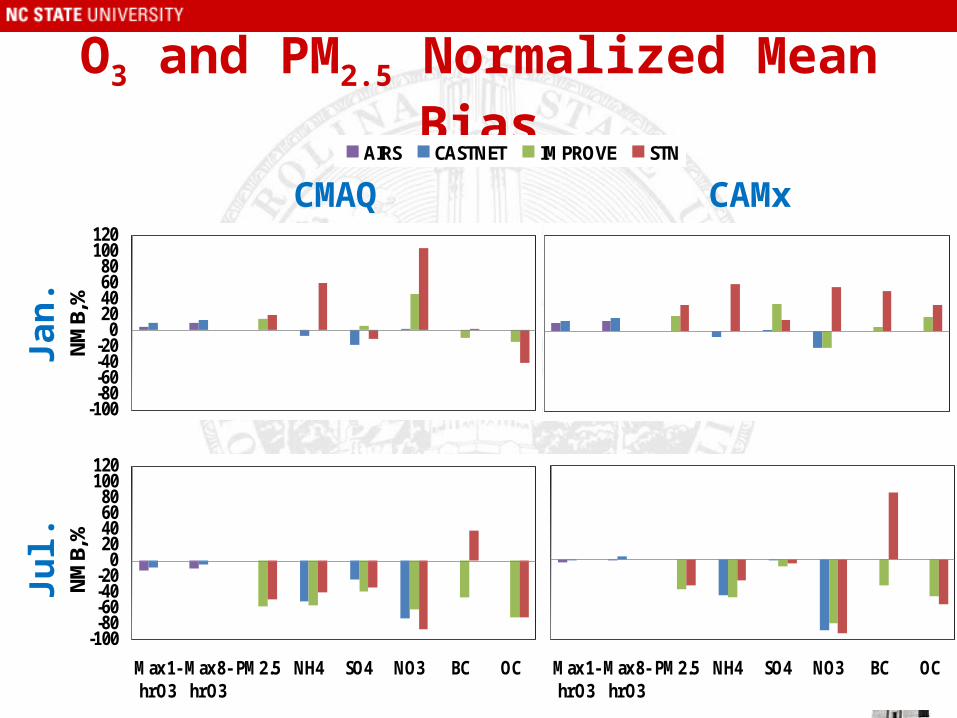
O3 and PM2.5 Normalized Mean Bias
CAMxCMAQ
Ja
n.
Ju
l.
-100-80-60-40-20
020406080
100
Max1-hrO3
Max8-hrO3 PM2.5 NH4 SO4 NO3 BC OC
AIRS CASTNET IMPROVE STN
-100-80-60-40-20
020406080
100120
Max 1-hr O3
Max 8-hr O3
PM2.5 NH4 SO4 NO3 BC OC
NMB,
%
-100-80-60-40-20
020406080
100120
Max 1-hr O3
Max 8-hr O3
PM2.5 NH4 SO4 NO3 BC OC
NMB,
%
-100-80-60-40-20
020406080
100120
Max 1-hr O3
Max 8-hr O3
PM2.5 NH4 SO4 NO3 BC OC
NMB,
%
-100-80-60-40-20
020406080
100120
Max 1-hr O3
Max 8-hr O3
PM2.5 NH4 SO4 NO3 BC OC
NMB,
%
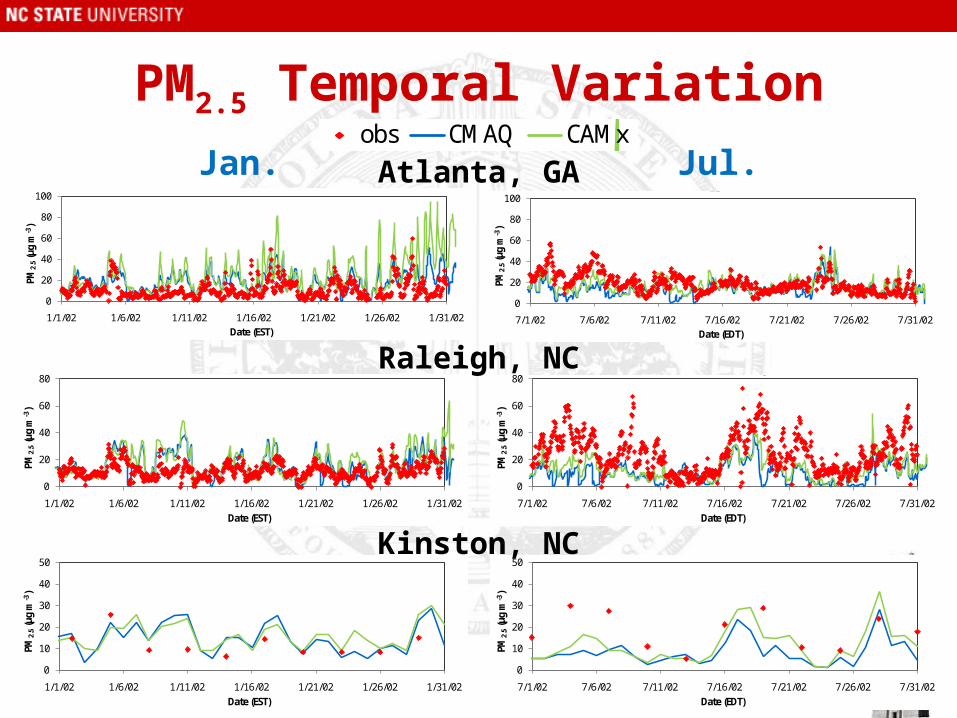
PM2.5 Temporal Variation
Jul.Jan.
0
10
20
30
40
50
1/1/02 1/6/02 1/11/02 1/16/02 1/21/02 1/26/02 1/31/02
PM2.
5(μ
g m
-3)
Date (EST)
Jan. PM2.5, Raleigh obs CMAQ CAMx
0
20
40
60
80
1/1/02 1/6/02 1/11/02 1/16/02 1/21/02 1/26/02 1/31/02
PM2.
5(μ
g m
-3)
Date (EST)
Jan. PM2.5, Raleigh
0
20
40
60
80
7/1/02 7/6/02 7/11/02 7/16/02 7/21/02 7/26/02 7/31/02PM
2.5
(μg
m-3
)
Date (EDT)
Jul. PM2.5, Raleigh
0
10
20
30
40
50
7/1/02 7/6/02 7/11/02 7/16/02 7/21/02 7/26/02 7/31/02
PM2.
5(μ
g m
-3)
Date (EDT)
Jul. PM2.5, Kinston obs CMAQ CAMx
0
10
20
30
40
50
1/1/02 1/6/02 1/11/02 1/16/02 1/21/02 1/26/02 1/31/02
PM2.
5(μ
g m
-3)
Date (EST)
Jan. PM2.5, Kinston obs CMAQ CAMx
0
20
40
60
80
100
1/1/02 1/6/02 1/11/02 1/16/02 1/21/02 1/26/02 1/31/02
PM2.
5(μ
g m
-3)
Date (EST)
Jan. PM2.5, Atlanta
0
20
40
60
80
100
7/1/02 7/6/02 7/11/02 7/16/02 7/21/02 7/26/02 7/31/02
PM2.
5(μ
g m
-3)
Date (EDT)
Jul. PM2.5, Atlanta
Raleigh, NC
Atlanta, GA
Kinston, NC

% Conversion of NH3 to NH4+
(NH4+/NHx)
Jan
.Ju
l.
CAMxCMAQ
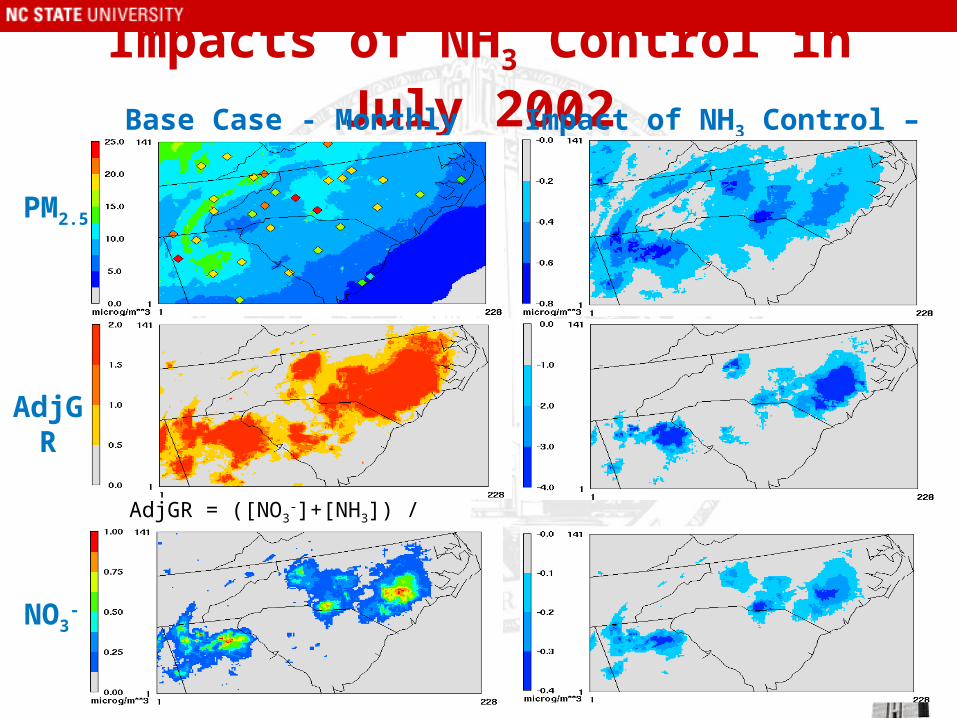
Impacts of NH3 Control in July 2002Base Case - Monthly Mean Impact of NH3 Control – Abs. Difference
AdjGR = ([NO3-]+[NH3]) / ([NO3
-]+[HNO3])
PM2.5
AdjGR
NO3-
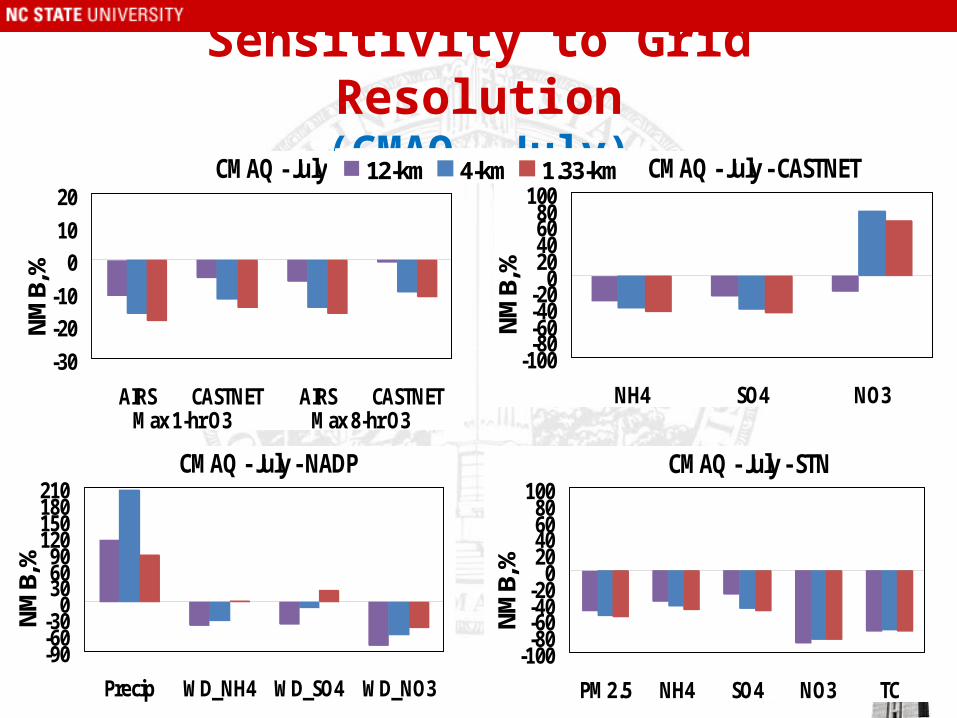
Sensitivity to Grid Resolution(CMAQ, July)
CMAQ - July - STN
-100-80-60-40-20
020406080
100
PM2.5 NH4 SO4 NO3 TC
NMB,
%
CMAQ - July
-30-20-10
01020
AIRS CASTNET AIRS CASTNETMax 1-hr O3 Max 8-hr O3
NMB,
%
CMAQ - July - NADP
-90-60-30
0306090
120150180210
Precip WD_NH4 WD_SO4 WD_NO3
NMB,
%
CMAQ - July - CASTNET
-100-80-60-40-20
020406080
100
NH4 SO4 NO3
NMB,
%
-30-20-10
01020
AIRS CASTNET AIRS CASTNET
12-km 4-km 1.33-km
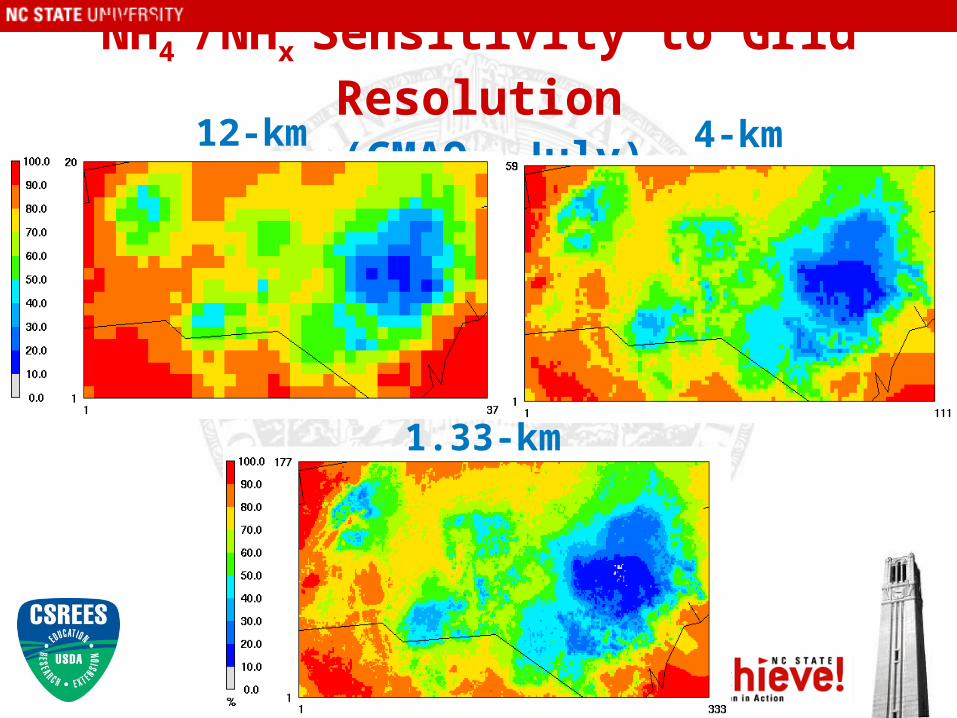
NH4+/NHx Sensitivity to Grid
Resolution (CMAQ, July)
12-km 4-km
1.33-km
Summary• MM5 performance is reasonably good, except for precipitation in July.
CMAQ and CAMx perform similarly for O3 but differently for PM2.5 and composition, with worse performance for NO3
- and OC by CMAQ in both months, others better by CMAQ in Jan. but by CAMx in Jul.
• Compared to CMAQ, CAMx gives similar conversion rates of NH3 to NH4
+ in Jan., but higher rates in Jul., possibly due to differences in vertical mixing, deposition, and aerosol treatments.
• 50% AL-NH3 emission reduction in Jul. leads to lower PM2.5 by up to 8% via decreasing NH4NO3 and an increased role of transport via increasing ratios of NH4
+/NHx near the source.• The use of 4- and 1.33-km resolutions without adequate NH3 source
treatments does not improve model performance in Jul.
Acknowledgments• This project is supported by National Research Initiative
Competitive Grant no. 2008-35112-18758 from the USDA Cooperative State Research, Education, and Extension Service Air Quality Program
• Pat Brewer, Mike Abraczinskas, George Bridgers, Bebhinn Do, Chris Misenis, Hoke Kimball, and Wayne Cornelius, NCDENR
• Don Olerud, Baron Advanced Meteorological Systems • Dennis McNally and Cyndi Loomis, Alpinephysics, Inc. • Ryan Boyles, NC State Climate Office • Alice Gilliland, Steve Howard, and Shao-Cai Yu, U.S. EPA • Shiang-Yuh Wu, Clark County Department of Air Quality and
Environmental Management

Extras
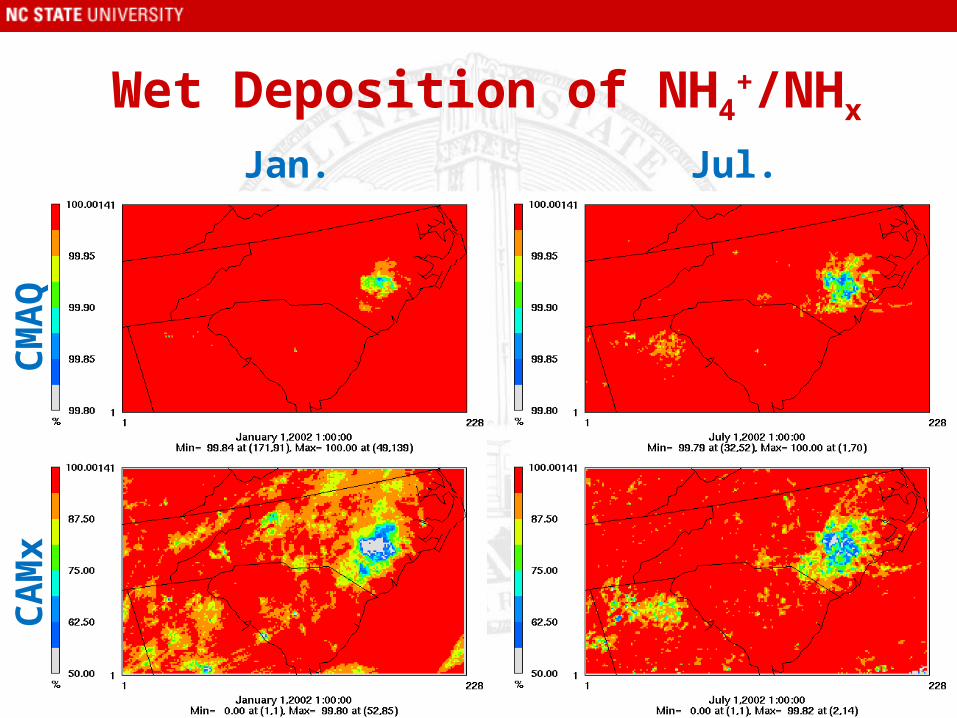
CM
AQ
CA
Mx
Wet Deposition of NH4+/NHx
Jul.Jan.
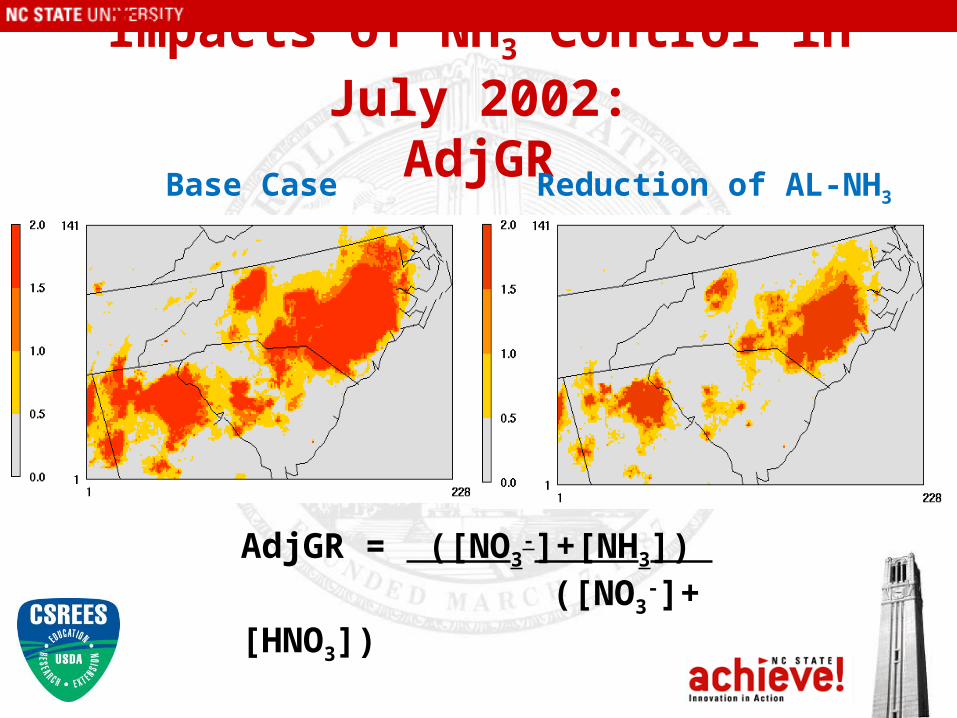
Impacts of NH3 Control in July 2002:AdjGR
Base Case Reduction of AL-NH3
AdjGR = ([NO3-]+[NH3])
([NO3-]+[HNO3])
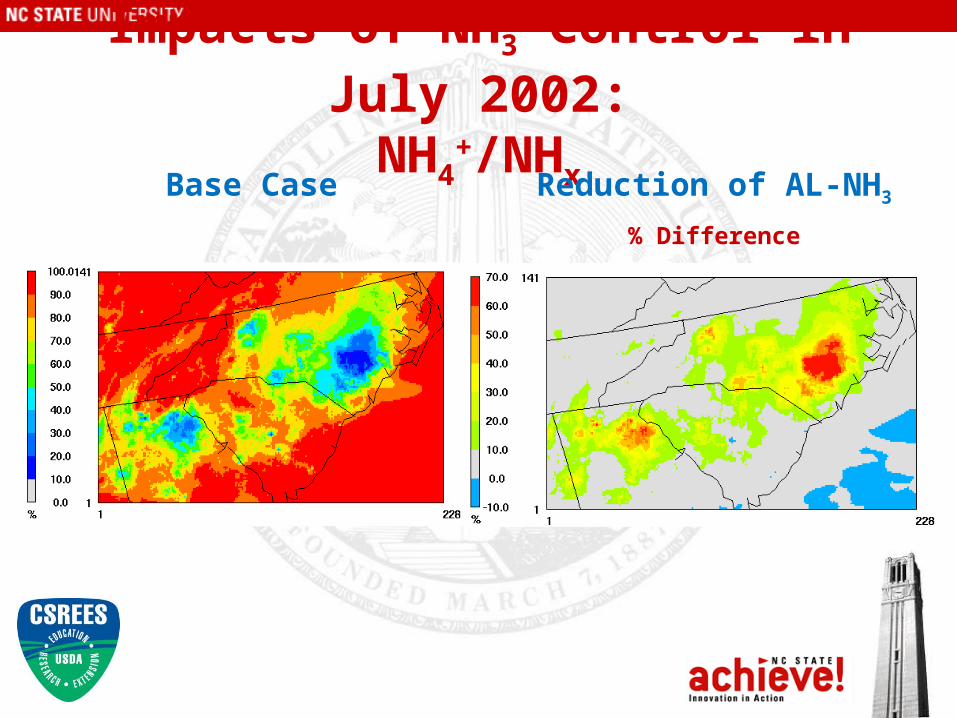
Impacts of NH3 Control in July 2002:
NH4+/NHxBase Case Reduction of AL-NH3
% Difference
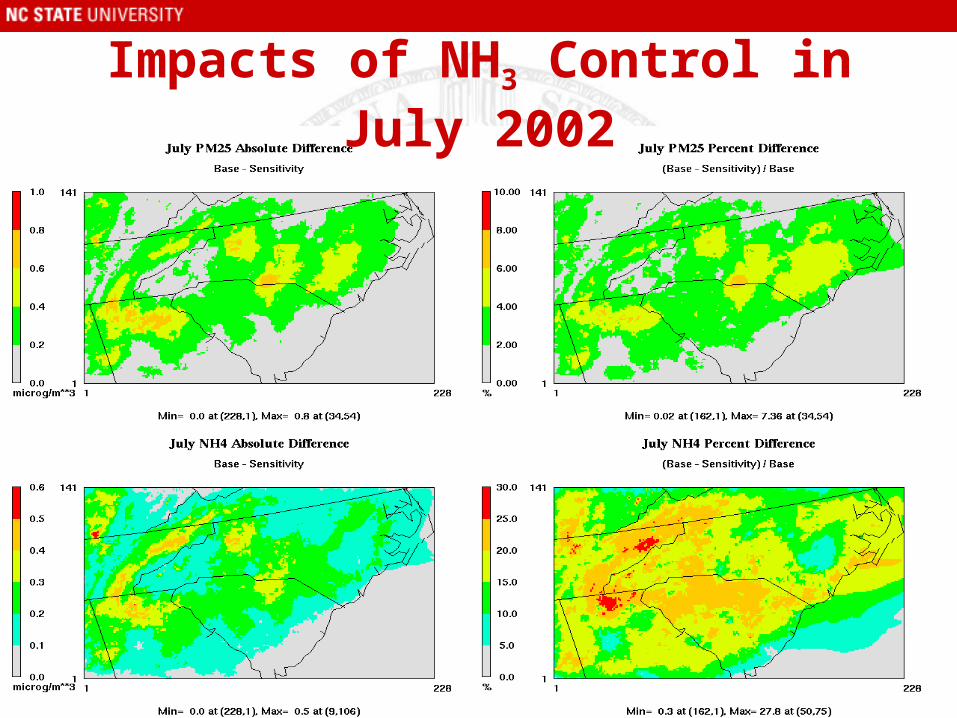
Impacts of NH3 Control in July 2002
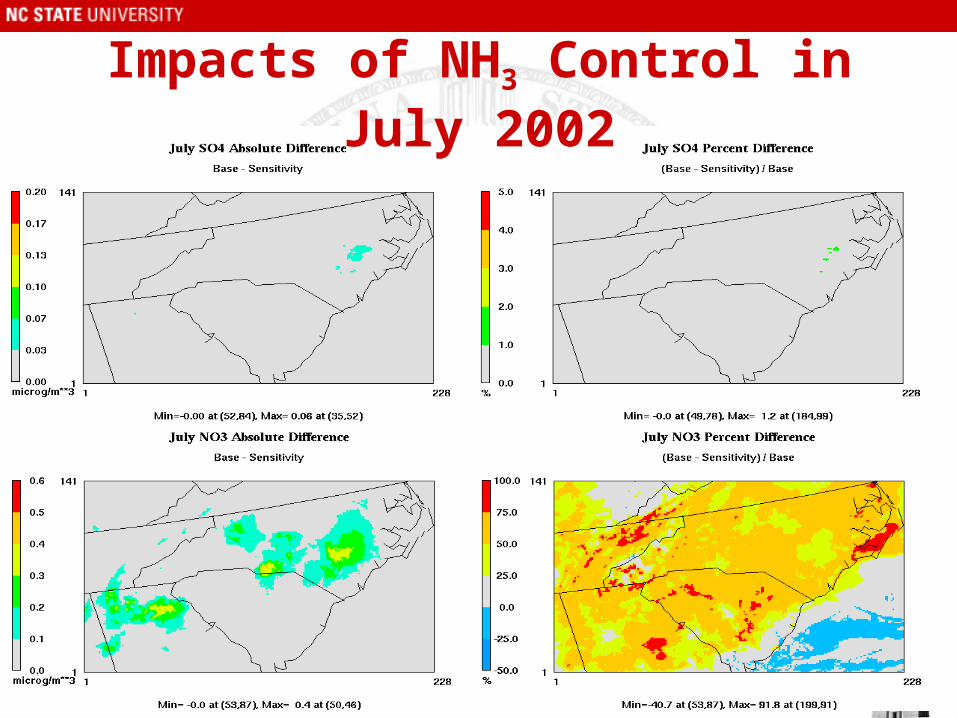
Impacts of NH3 Control in July 2002

[NH3]emis, 50% AL-NH3 / [NH3]emis, base
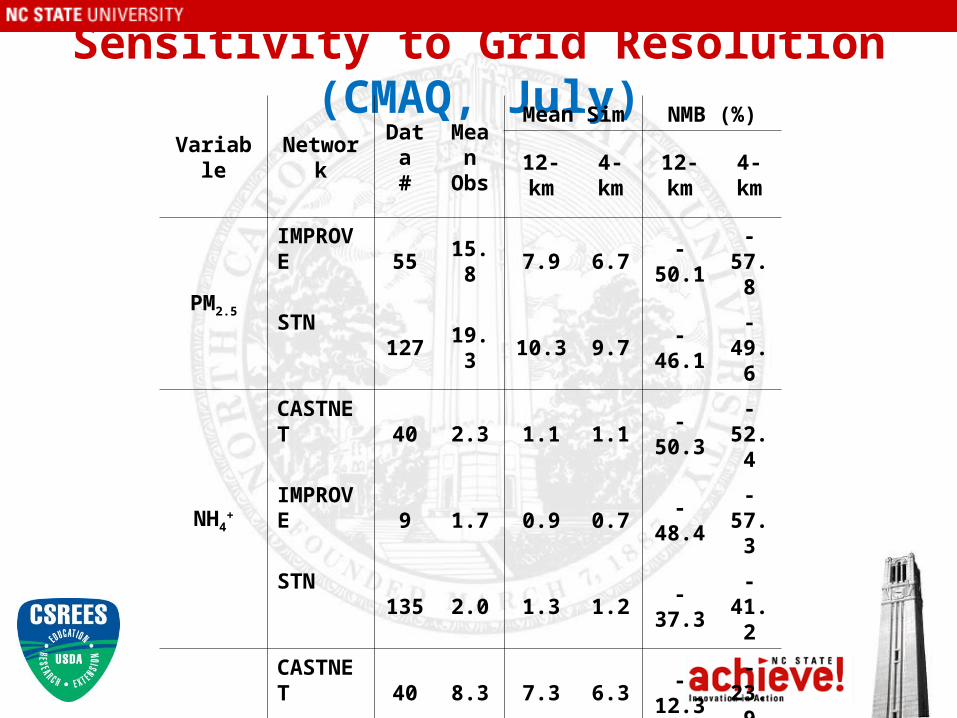
Sensitivity to Grid Resolution (CMAQ, July)
Variable NetworkData
#MeanObs
Mean Sim NMB (%)
12-km 4-km 12-km 4-km
PM2.5
IMPROVE 55 15.8 7.9 6.7 -50.1 -57.8
STN 127 19.3 10.3 9.7 -46.1 -49.6
NH4+
CASTNET 40 2.3 1.1 1.1 -50.3 -52.4
IMPROVE 9 1.7 0.9 0.7 -48.4 -57.3
STN 135 2.0 1.3 1.2 -37.3 -41.2
SO42-
CASTNET 40 8.3 7.3 6.3 -12.3 -23.9
IMPROVE 56 7.1 5.4 4.3 -23.6 -39.1
STN 135 7.2 5.9 4.7 -18.0 -34.3
NO3-
CASTNET 40 0.2 0.0 0.1 -81.4 -73.4
IMPROVE 56 0.2 0.1 0.1 -80.2 -61.8
STN 135 0.7 0.1 0.1 -89.9 -86.9
BCIMPROVE 43 0.3 0.2 0.2 -42.5 -46.6
STN 134 0.4 0.5 0.5 20.8 37.6
OCIMPROVE 43 2.3 0.7 0.6 -70.3 -72.5
STN 134 4.8 1.3 1.4 -74.1 -71.6
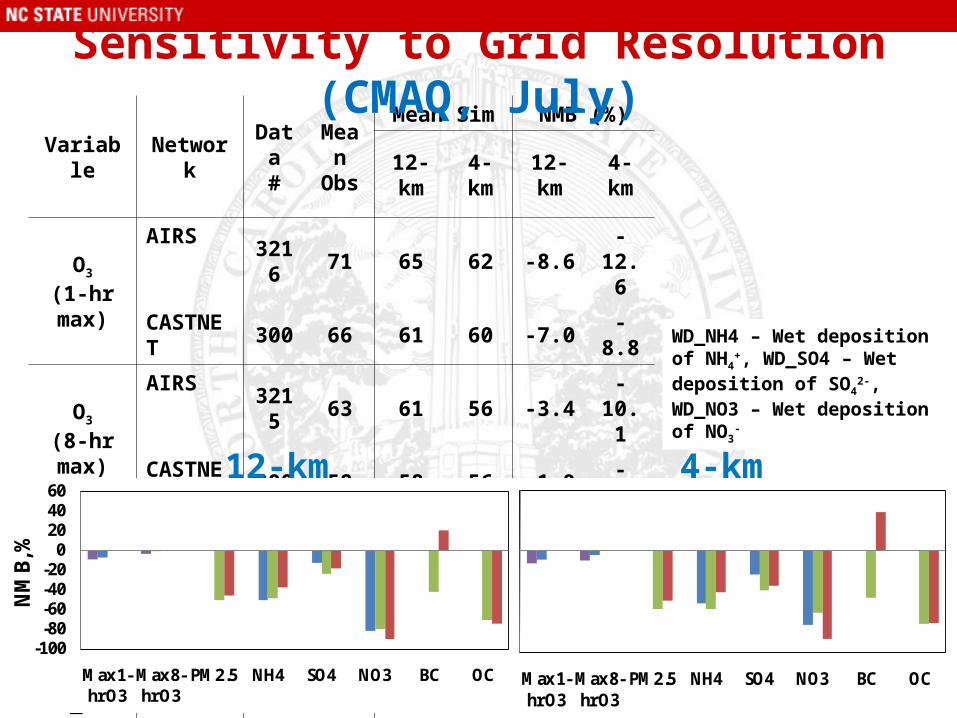
Variable NetworkData
#MeanObs
Mean Sim NMB (%)
12-km 4-km 12-km 4-km
O3
(1-hr max)
AIRS 3216 71 65 62 -8.6 -12.6
CASTNET 300 66 61 60 -7.0 -8.8
O3
(8-hr max)
AIRS 3215 63 61 56 -3.4 -10.1
CASTNET 300 58 58 56 -1.0 -5.0
WD_NH4 NADP 69 0.3 0.2 0.2 -45.0 -23.2
WD_SO4 NADP 69 2.2 1.7 3.0 -18.9 38.3
WD_NO3 NADP 69 1.6 0.5 0.9 -69.6 -43.5
Prec NADP 84 30.1 63.8 75.7 111.9 151.3
Sensitivity to Grid Resolution (CMAQ, July)
12-km 4-km
-100-80-60-40-20
0204060
Max 1-hr O3
Max 8-hr O3
PM2.5 NH4 SO4 NO3 BC OC
NM
B, %
-100-80-60-40-20
0204060
Max 1-hr O3
Max 8-hr O3
PM2.5 NH4 SO4 NO3 BC OC
NM
B, %
WD_NH4 – Wet deposition of NH4+,
WD_SO4 – Wet deposition of SO42-,
WD_NO3 – Wet deposition of NO3-
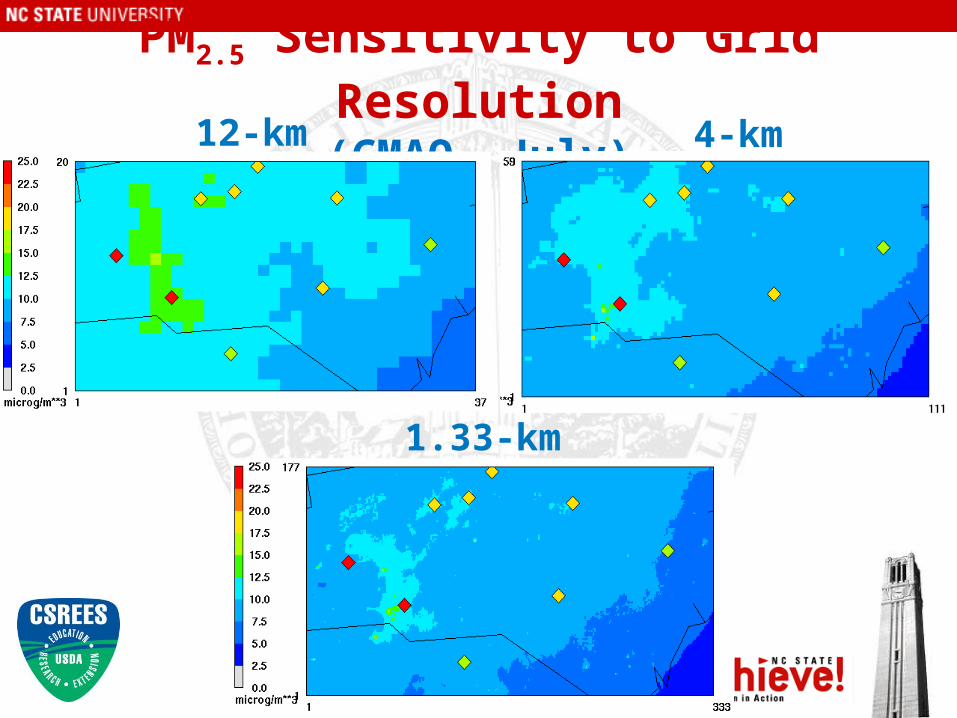
PM2.5 Sensitivity to Grid Resolution(CMAQ, July)12-km 4-km
1.33-km