Embed Size (px)
Citation preview
KRUK Group Presentation
Q1 2017
2
Introduction
Operating activities
Market position
Financial performance
Strategy and summary
Appendices
Agenda
3
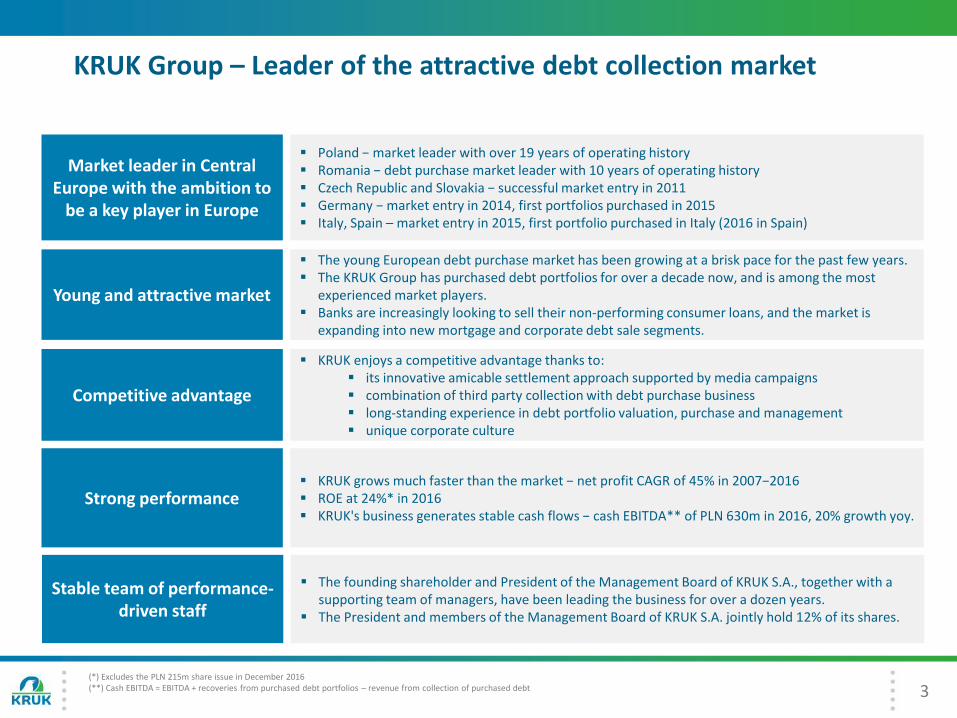
KRUK Group – Leader of the attractive debt collection market
Market leader in Central Europe with the ambition to
be a key player in Europe
Poland − market leader with over 19 years of operating history Romania − debt purchase market leader with 10 years of operating history Czech Republic and Slovakia − successful market entry in 2011 Germany − market entry in 2014, first portfolios purchased in 2015 Italy, Spain – market entry in 2015, first portfolio purchased in Italy (2016 in Spain)
Young and attractive market
The young European debt purchase market has been growing at a brisk pace for the past few years. The KRUK Group has purchased debt portfolios for over a decade now, and is among the most
experienced market players. Banks are increasingly looking to sell their non-performing consumer loans, and the market is
expanding into new mortgage and corporate debt sale segments.
Competitive advantage
KRUK enjoys a competitive advantage thanks to: its innovative amicable settlement approach supported by media campaigns combination of third party collection with debt purchase business long-standing experience in debt portfolio valuation, purchase and management unique corporate culture
Strong performance KRUK grows much faster than the market − net profit CAGR of 45% in 2007−2016 ROE at 24%* in 2016 KRUK's business generates stable cash flows − cash EBITDA** of PLN 630m in 2016, 20% growth yoy.
Stable team of performance-driven staff
The founding shareholder and President of the Management Board of KRUK S.A., together with a supporting team of managers, have been leading the business for over a dozen years.
The President and members of the Management Board of KRUK S.A. jointly hold 12% of its shares.
(*) Excludes the PLN 215m share issue in December 2016(**) Cash EBITDA = EBITDA + recoveries from purchased debt portfolios – revenue from collection of purchased debt
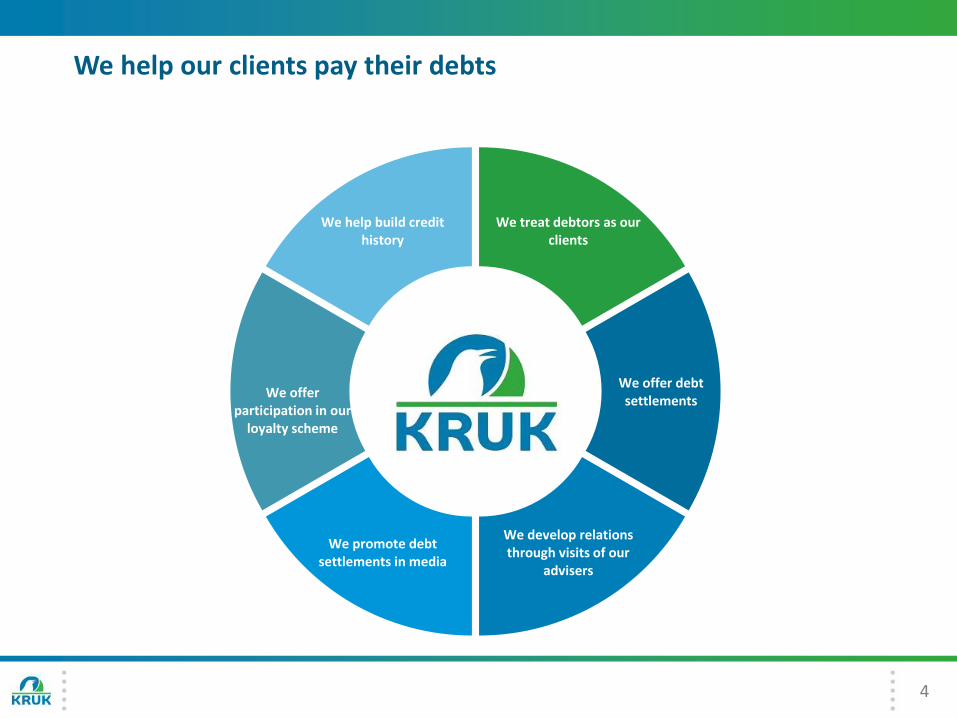
We treat debtors as our clients
We offer debt settlements
We develop relations through visits of our
advisers
We promote debt settlements in media
We offer participation in our
loyalty scheme
We help build credit history
4
We help our clients pay their debts
5
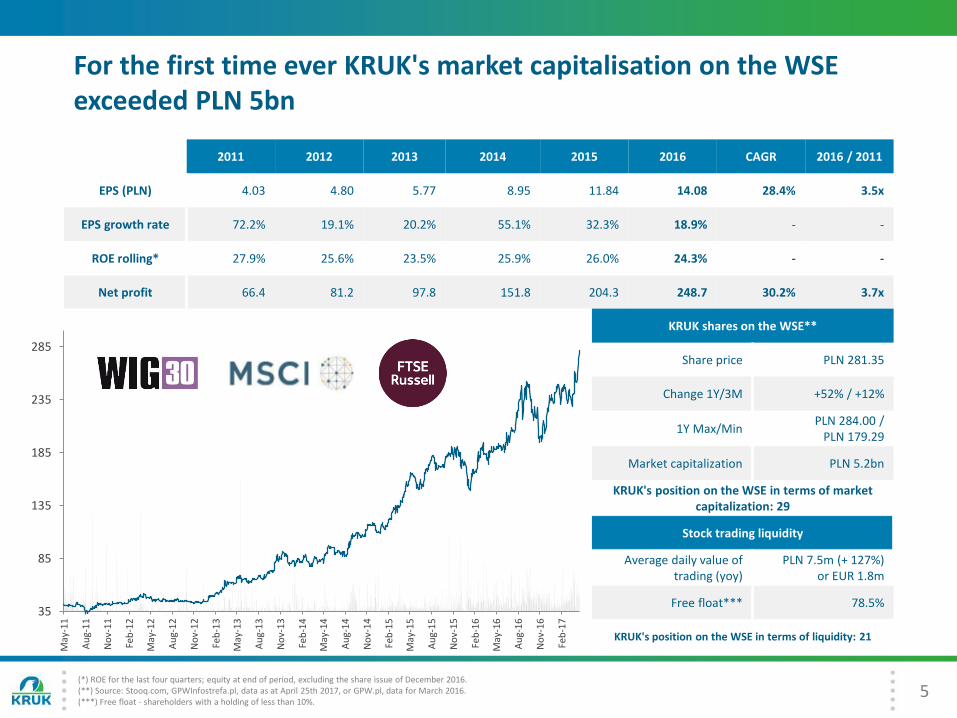
2011 2012 2013 2014 2015 2016 CAGR 2016 / 2011
EPS (PLN) 4.03 4.80 5.77 8.95 11.84 14.08 28.4% 3.5x
EPS growth rate 72.2% 19.1% 20.2% 55.1% 32.3% 18.9% - -
ROE rolling* 27.9% 25.6% 23.5% 25.9% 26.0% 24.3% - -
Net profit 66.4 81.2 97.8 151.8 204.3 248.7 30.2% 3.7x
For the first time ever KRUK's market capitalisation on the WSE exceeded PLN 5bn
KRUK shares on the WSE**
Share price PLN 281.35
Change 1Y/3M +52% / +12%
1Y Max/MinPLN 284.00 /
PLN 179.29
Market capitalization PLN 5.2bn
KRUK's position on the WSE in terms of market capitalization: 29
Stock trading liquidity
Average daily value of trading (yoy)
PLN 7.5m (+ 127%)or EUR 1.8m
Free float*** 78.5%
KRUK's position on the WSE in terms of liquidity: 21
(*) ROE for the last four quarters; equity at end of period, excluding the share issue of December 2016.(**) Source: Stooq.com, GPWInfostrefa.pl, data as at April 25th 2017, or GPW.pl, data for March 2016.(***) Free float - shareholders with a holding of less than 10%.
0
100000
200000
300000
400000
500000
600000
700000
800000
900000
35
85
135
185
235
285
May
-11
Au
g-1
1
No
v-1
1
Feb
-12
May
-12
Au
g-1
2
No
v-1
2
Feb
-13
May
-13
Au
g-1
3
No
v-1
3
Feb
-14
May
-14
Au
g-1
4
No
v-1
4
Feb
-15
May
-15
Au
g-1
5
No
v-1
5
Feb
-16
May
-16
Au
g-1
6
No
v-1
6
Feb
-17
6
2007Q1
2017’16/’07
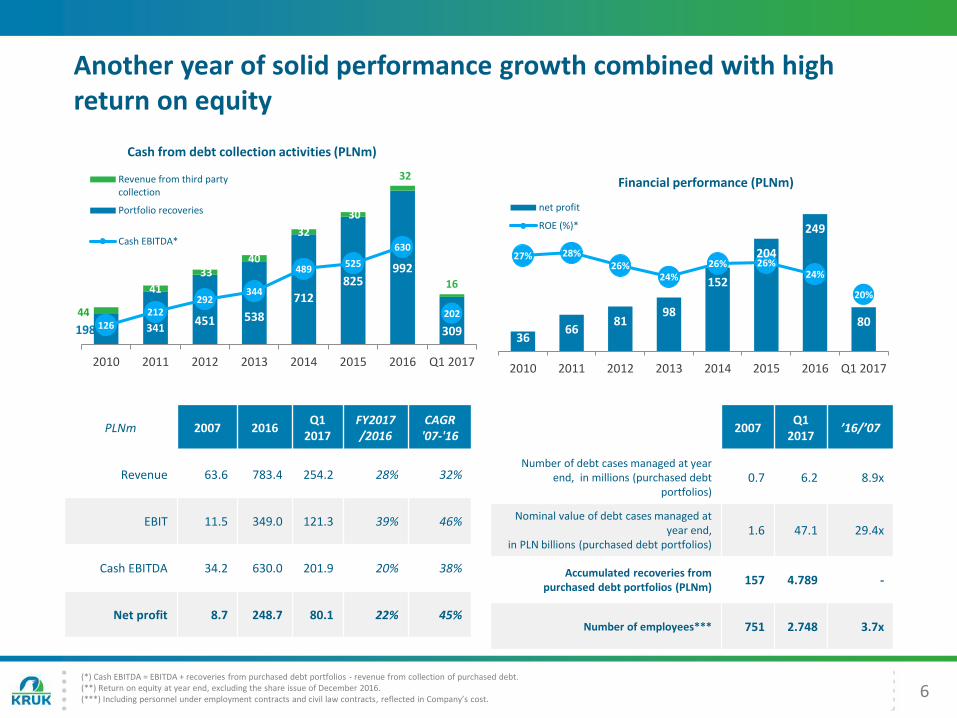
Number of debt cases managed at year end, in millions (purchased debt
portfolios)0.7 6.2 8.9x
Nominal value of debt cases managed at year end,
in PLN billions (purchased debt portfolios)1.6 47.1 29.4x
Accumulated recoveries from purchased debt portfolios (PLNm)
157 4.789 -
Number of employees*** 751 2.748 3.7x
PLNm 2007 2016Q1
2017FY2017/2016
CAGR '07-'16
Revenue 63.6 783.4 254.2 28% 32%
EBIT 11.5 349.0 121.3 39% 46%
Cash EBITDA 34.2 630.0 201.9 20% 38%
Net profit 8.7 248.7 80.1 22% 45%
198 341451 538
712
825992
309
44
41
3340
32
30
32
16
126212
292344
489525
630
202
0
200
400
600
800
100 0
120 0
0
200
400
600
800
1000
1200
2010 2011 2012 2013 2014 2015 2016 Q1 2017
Cash from debt collection activities (PLNm)
Revenue from third partycollection
Portfolio recoveries
Cash EBITDA*
(*) Cash EBITDA = EBITDA + recoveries from purchased debt portfolios - revenue from collection of purchased debt.(**) Return on equity at year end, excluding the share issue of December 2016.(***) Including personnel under employment contracts and civil law contracts, reflected in Company’s cost.
Another year of solid performance growth combined with high return on equity
3666
8198
152
204
249
80
27% 28%26%
24%
26% 26%24%
20%
10%
15%
20%
25%
30%
35%
40%
0
50
100
150
200
250
300
2010 2011 2012 2013 2014 2015 2016 Q1 2017
Financial performance (PLNm)
net profit
ROE (%)*
7
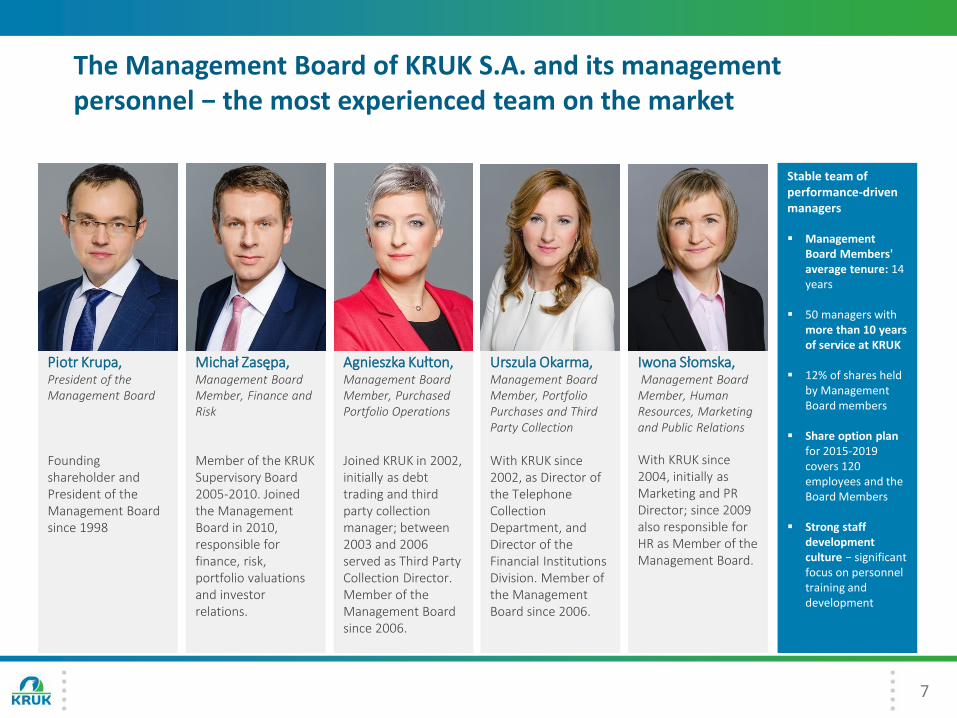
The Management Board of KRUK S.A. and its management personnel − the most experienced team on the market
Piotr Krupa, President of the Management Board
Founding shareholder and President of the Management Board since 1998
Michał Zasępa, Management Board Member, Finance and Risk
Member of the KRUK Supervisory Board 2005-2010. Joined the Management Board in 2010, responsible for finance, risk,portfolio valuationsand investor relations.
Agnieszka Kułton, Management Board Member, Purchased Portfolio Operations
Joined KRUK in 2002, initially as debt trading and third party collectionmanager; between2003 and 2006 served as Third Party Collection Director. Member of the Management Board since 2006.
Urszula Okarma, Management Board Member, Portfolio Purchases and Third Party Collection
With KRUK since 2002, as Director of the Telephone Collection Department, and Director of the Financial Institutions Division. Member of the Management Board since 2006.
Iwona Słomska,Management Board
Member, Human Resources, Marketing and Public Relations
With KRUK since 2004, initially as Marketing and PR Director; since 2009 also responsible for HR as Member of the Management Board.
Stable team of performance-driven managers
Management Board Members' average tenure: 14years
50 managers with more than 10 years of service at KRUK
12% of shares held by Management Board members
Share option planfor 2015-2019 covers 120employees and the Board Members
Strong staff development culture − significant focus on personnel training and development
8
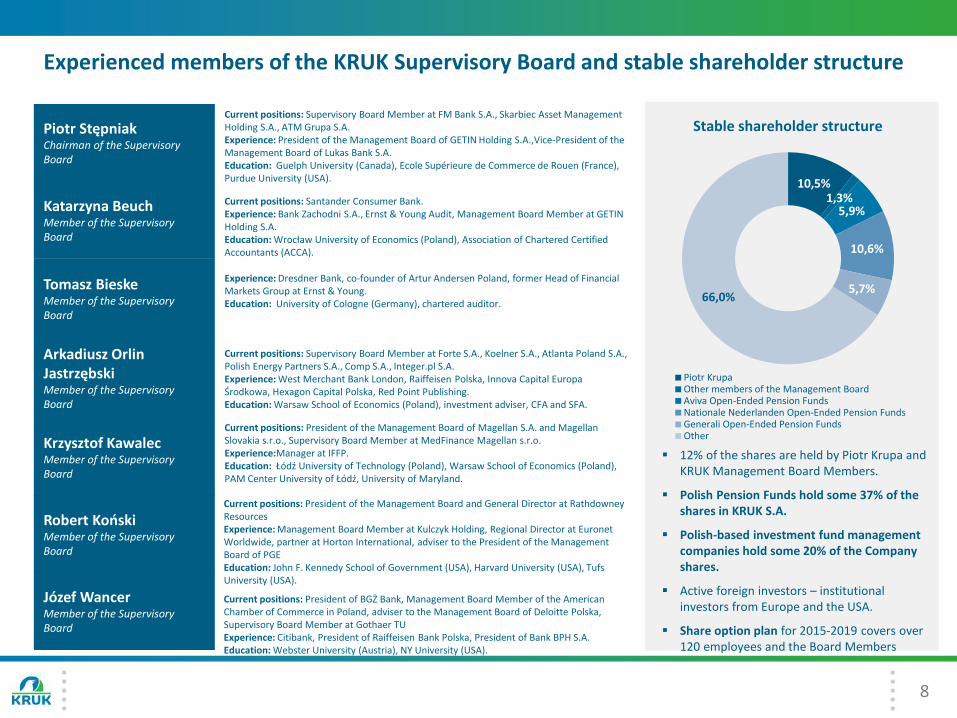
Experienced members of the KRUK Supervisory Board and stable shareholder structure
10,5%1,3%
5,9%
10,6%
5,7%66,0%
Piotr KrupaOther members of the Management BoardAviva Open-Ended Pension FundsNationale Nederlanden Open-Ended Pension FundsGenerali Open-Ended Pension FundsOther
Stable shareholder structurePiotr StępniakChairman of the Supervisory Board
Katarzyna BeuchMember of the Supervisory Board
Tomasz BieskeMember of the Supervisory Board
Robert KońskiMember of the Supervisory Board
Krzysztof KawalecMember of the Supervisory Board
Józef WancerMember of the Supervisory Board
Arkadiusz Orlin JastrzębskiMember of the Supervisory Board
Current positions: Supervisory Board Member at FM Bank S.A., Skarbiec Asset Management Holding S.A., ATM Grupa S.A.Experience: President of the Management Board of GETIN Holding S.A.,Vice-President of the Management Board of Lukas Bank S.A.Education: Guelph University (Canada), Ecole Supérieure de Commerce de Rouen (France), Purdue University (USA).
Current positions: Santander Consumer Bank.Experience: Bank Zachodni S.A., Ernst & Young Audit, Management Board Member at GETIN Holding S.A.Education: Wrocław University of Economics (Poland), Association of Chartered Certified Accountants (ACCA).
Experience: Dresdner Bank, co-founder of Artur Andersen Poland, former Head of Financial Markets Group at Ernst & Young.Education: University of Cologne (Germany), chartered auditor.
Current positions: President of the Management Board and General Director at RathdowneyResourcesExperience: Management Board Member at Kulczyk Holding, Regional Director at EuronetWorldwide, partner at Horton International, adviser to the President of the Management Board of PGEEducation: John F. Kennedy School of Government (USA), Harvard University (USA), Tufs University (USA).
Current positions: President of the Management Board of Magellan S.A. and Magellan Slovakia s.r.o., Supervisory Board Member at MedFinance Magellan s.r.o. Experience:Manager at IFFP.Education: Łódź University of Technology (Poland), Warsaw School of Economics (Poland), PAM Center University of Łódź, University of Maryland.
Current positions: President of BGŻ Bank, Management Board Member of the American Chamber of Commerce in Poland, adviser to the Management Board of Deloitte Polska, Supervisory Board Member at Gothaer TU Experience: Citibank, President of Raiffeisen Bank Polska, President of Bank BPH S.A. Education: Webster University (Austria), NY University (USA).
Current positions: Supervisory Board Member at Forte S.A., Koelner S.A., Atlanta Poland S.A., Polish Energy Partners S.A., Comp S.A., Integer.pl S.A. Experience: West Merchant Bank London, Raiffeisen Polska, Innova Capital Europa Środkowa, Hexagon Capital Polska, Red Point Publishing.Education: Warsaw School of Economics (Poland), investment adviser, CFA and SFA.
12% of the shares are held by Piotr Krupa and KRUK Management Board Members.
Polish Pension Funds hold some 37% of the shares in KRUK S.A.
Polish-based investment fund management companies hold some 20% of the Company shares.
Active foreign investors – institutional investors from Europe and the USA.
Share option plan for 2015-2019 covers over120 employees and the Board Members
9
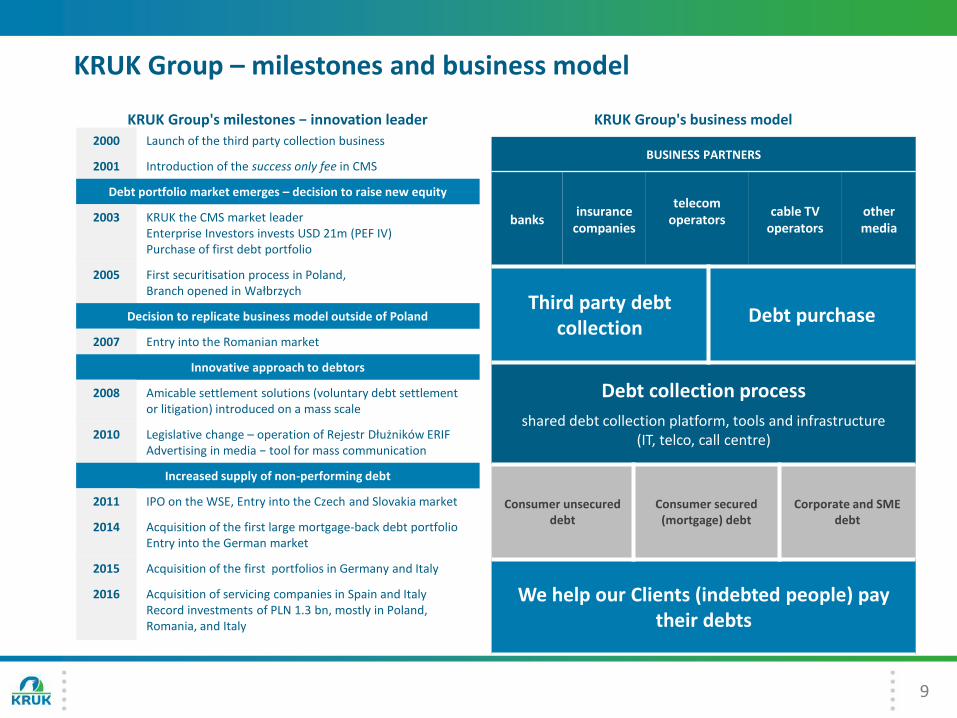
KRUK Group – milestones and business model
2000 Launch of the third party collection business
2001 Introduction of the success only fee in CMS
Debt portfolio market emerges – decision to raise new equity
2003 KRUK the CMS market leaderEnterprise Investors invests USD 21m (PEF IV)Purchase of first debt portfolio
2005 First securitisation process in Poland, Branch opened in Wałbrzych
Decision to replicate business model outside of Poland
2007 Entry into the Romanian market
Innovative approach to debtors
2008 Amicable settlement solutions (voluntary debt settlement or litigation) introduced on a mass scale
2010 Legislative change – operation of Rejestr Dłużników ERIFAdvertising in media − tool for mass communication
Increased supply of non-performing debt
2011 IPO on the WSE, Entry into the Czech and Slovakia market
2014 Acquisition of the first large mortgage-back debt portfolioEntry into the German market
2015 Acquisition of the first portfolios in Germany and Italy
2016 Acquisition of servicing companies in Spain and ItalyRecord investments of PLN 1.3 bn, mostly in Poland, Romania, and Italy
KRUK Group's milestones − innovation leader
BUSINESS PARTNERS
banksinsurance
companies
telecomoperators
cable TV operators
other media
Third party debtcollection
Debt purchase
Debt collection process
shared debt collection platform, tools and infrastructure (IT, telco, call centre)
Consumer unsecureddebt
Consumer secured(mortgage) debt
Corporate and SME debt
We help our Clients (indebted people) pay their debts
KRUK Group's business model
10
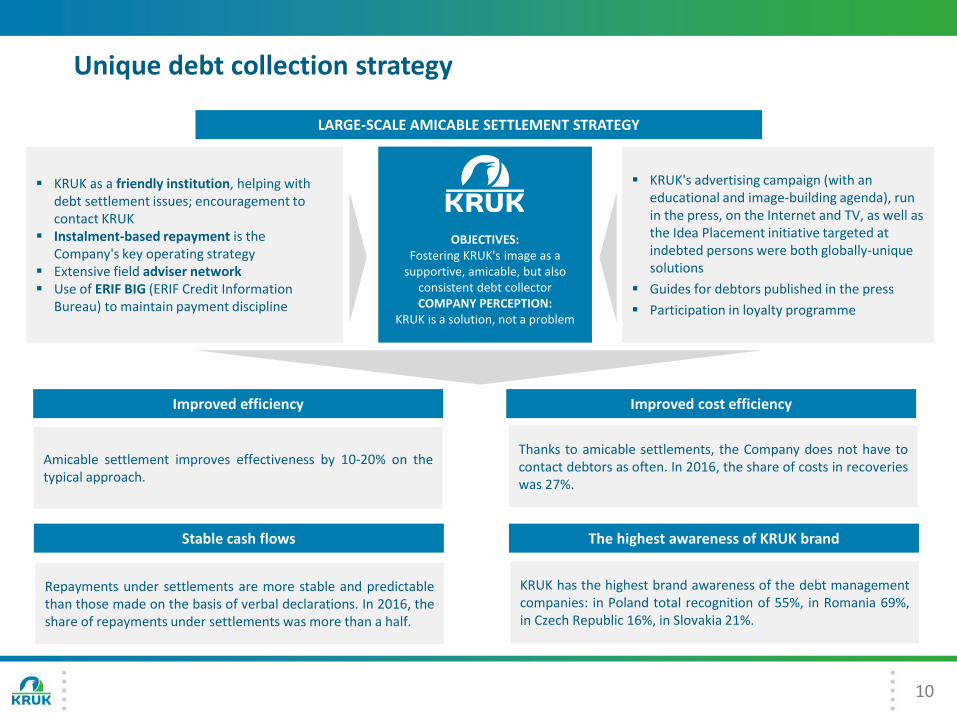
Unique debt collection strategy
KRUK as a friendly institution, helping with debt settlement issues; encouragement to contact KRUK
Instalment-based repayment is the Company's key operating strategy
Extensive field adviser network Use of ERIF BIG (ERIF Credit Information
Bureau) to maintain payment discipline
LARGE-SCALE AMICABLE SETTLEMENT STRATEGY
KRUK's advertising campaign (with an educational and image-building agenda), run in the press, on the Internet and TV, as well as the Idea Placement initiative targeted at indebted persons were both globally-unique solutions
Guides for debtors published in the press
Participation in loyalty programme
Thanks to amicable settlements, the Company does not have tocontact debtors as often. In 2016, the share of costs in recoverieswas 27%.
Improved efficiency
OBJECTIVES:Fostering KRUK's image as a
supportive, amicable, but also consistent debt collectorCOMPANY PERCEPTION:
KRUK is a solution, not a problem
KRUK has the highest brand awareness of the debt managementcompanies: in Poland total recognition of 55%, in Romania 69%,in Czech Republic 16%, in Slovakia 21%.
Amicable settlement improves effectiveness by 10-20% on thetypical approach.
Repayments under settlements are more stable and predictablethan those made on the basis of verbal declarations. In 2016, theshare of repayments under settlements was more than a half.
Improved cost efficiency
Stable cash flows The highest awareness of KRUK brand
0
50
100
150
200
250
300
350
0
50
100
150
200
250
300
350
2007 2008 2009 2010 2011 2012 2013 2014 2015 2016
Number of cases − debt purchase
Number of cases − credit management
Recoveries (debt purchase and credit management)
11
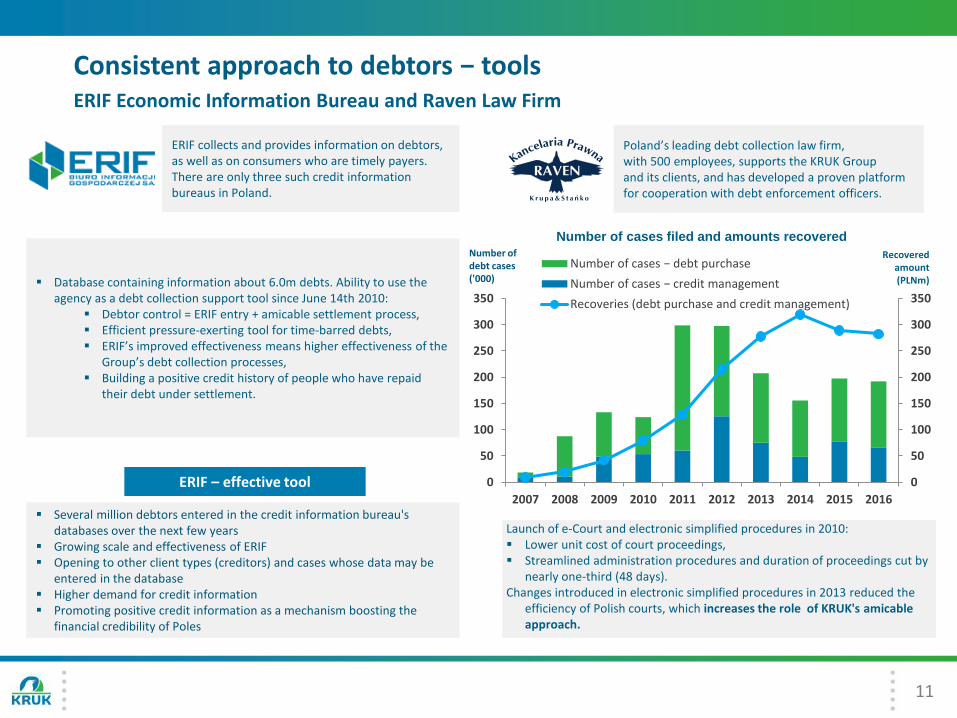
Consistent approach to debtors − toolsERIF Economic Information Bureau and Raven Law Firm
Launch of e-Court and electronic simplified procedures in 2010: Lower unit cost of court proceedings, Streamlined administration procedures and duration of proceedings cut by
nearly one-third (48 days).Changes introduced in electronic simplified procedures in 2013 reduced the
efficiency of Polish courts, which increases the role of KRUK's amicable approach.
Number of debt cases ('000)
Recovered amount(PLNm)
Number of cases filed and amounts recovered
Several million debtors entered in the credit information bureau's databases over the next few years
Growing scale and effectiveness of ERIF Opening to other client types (creditors) and cases whose data may be
entered in the database Higher demand for credit information Promoting positive credit information as a mechanism boosting the
financial credibility of Poles
Database containing information about 6.0m debts. Ability to use the agency as a debt collection support tool since June 14th 2010:
Debtor control = ERIF entry + amicable settlement process, Efficient pressure-exerting tool for time-barred debts, ERIF’s improved effectiveness means higher effectiveness of the
Group’s debt collection processes, Building a positive credit history of people who have repaid
their debt under settlement.
ERIF collects and provides information on debtors, as well as on consumers who are timely payers. There are only three such credit informationbureaus in Poland.
Poland’s leading debt collection law firm, with 500 employees, supports the KRUK Group and its clients, and has developed a proven platform for cooperation with debt enforcement officers.
ERIF – effective tool
12
Introduction
Operating activities
Market position
Financial performance
Strategy and summary
Appendices
Agenda
13
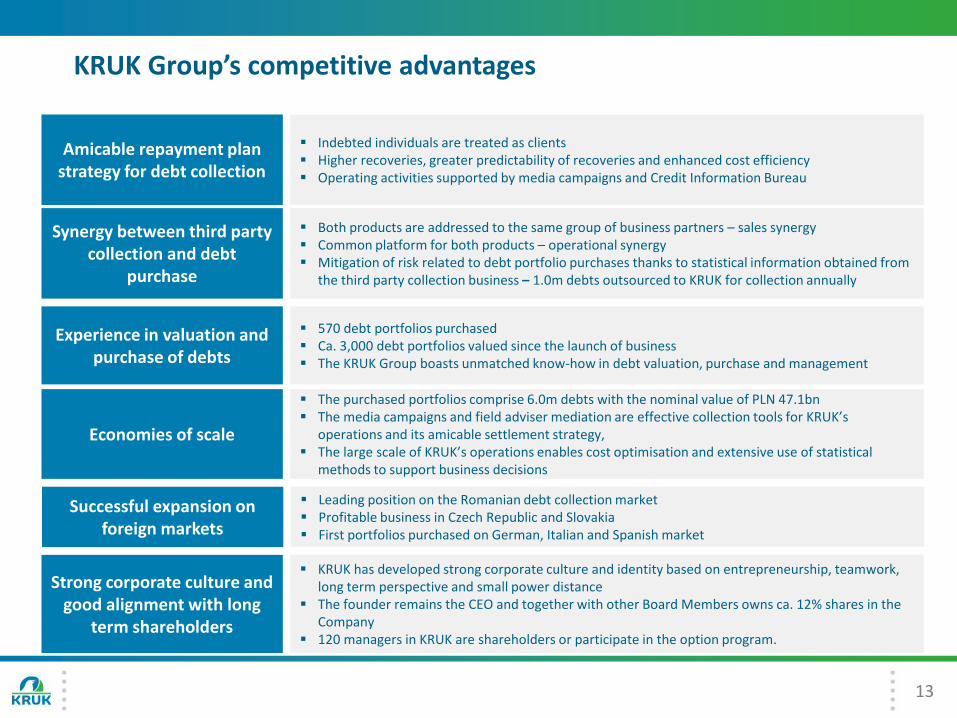
KRUK Group’s competitive advantages
Amicable repayment planstrategy for debt collection
Indebted individuals are treated as clients Higher recoveries, greater predictability of recoveries and enhanced cost efficiency Operating activities supported by media campaigns and Credit Information Bureau
Synergy between third party collection and debt
purchase
Both products are addressed to the same group of business partners – sales synergy Common platform for both products – operational synergy Mitigation of risk related to debt portfolio purchases thanks to statistical information obtained from
the third party collection business – 1.0m debts outsourced to KRUK for collection annually
Experience in valuation and purchase of debts
570 debt portfolios purchased Ca. 3,000 debt portfolios valued since the launch of business The KRUK Group boasts unmatched know-how in debt valuation, purchase and management
Economies of scale
The purchased portfolios comprise 6.0m debts with the nominal value of PLN 47.1bn The media campaigns and field adviser mediation are effective collection tools for KRUK’s
operations and its amicable settlement strategy, The large scale of KRUK’s operations enables cost optimisation and extensive use of statistical
methods to support business decisions
Successful expansion on foreign markets
Leading position on the Romanian debt collection market Profitable business in Czech Republic and Slovakia First portfolios purchased on German, Italian and Spanish market
Strong corporate culture and good alignment with long
term shareholders
KRUK has developed strong corporate culture and identity based on entrepreneurship, teamwork, long term perspective and small power distance
The founder remains the CEO and together with other Board Members owns ca. 12% shares in the Company
120 managers in KRUK are shareholders or participate in the option program.
14
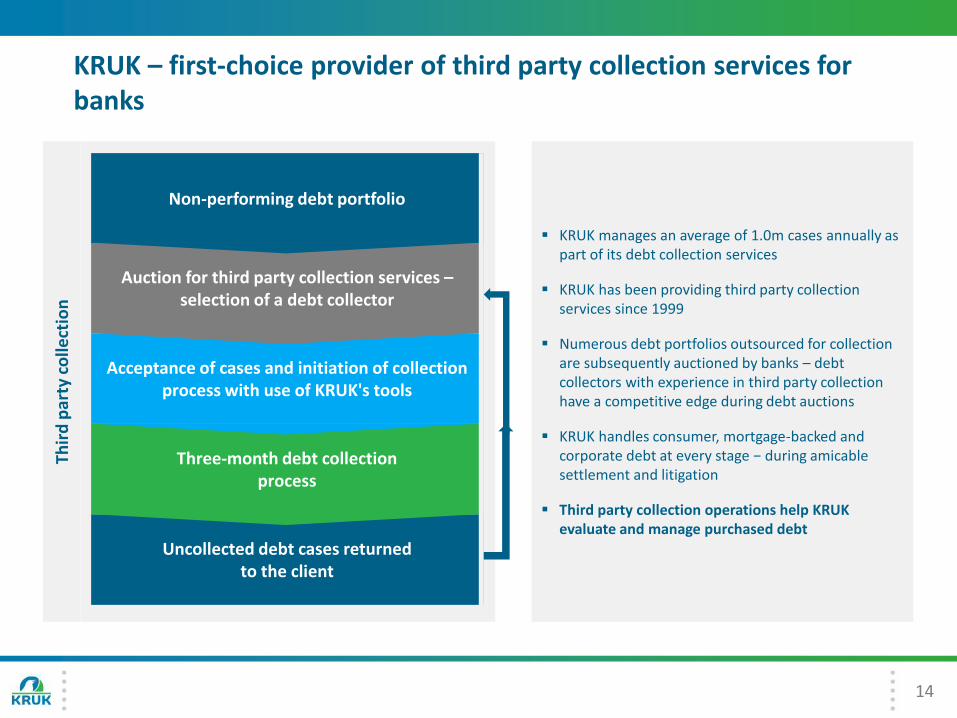
KRUK – first-choice provider of third party collection services for banks
Non-performing debt portfolio
Auction for third party collection services –selection of a debt collector
Acceptance of cases and initiation of collection process with use of KRUK's tools
Three-month debt collection process
Uncollected debt cases returned to the client
KRUK manages an average of 1.0m cases annually as part of its debt collection services
KRUK has been providing third party collectionservices since 1999
Numerous debt portfolios outsourced for collection are subsequently auctioned by banks – debt collectors with experience in third party collectionhave a competitive edge during debt auctions
KRUK handles consumer, mortgage-backed and corporate debt at every stage − during amicable settlement and litigation
Third party collection operations help KRUK evaluate and manage purchased debt
Thir
d p
arty
co
llect
ion
15
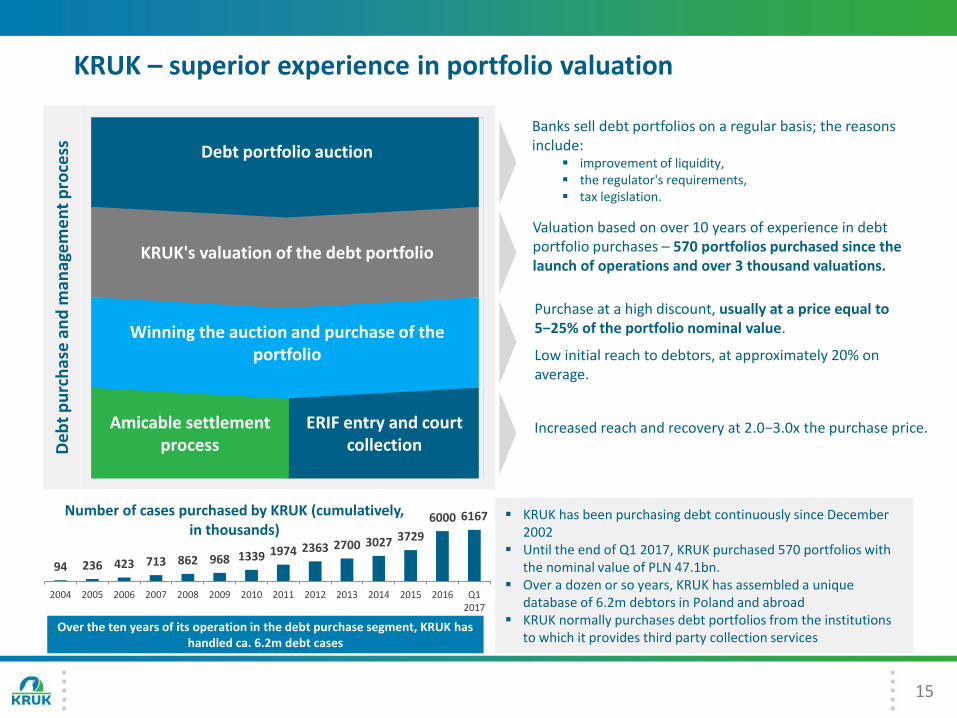
KRUK – superior experience in portfolio valuation
Debt portfolio auction
KRUK's valuation of the debt portfolio
Winning the auction and purchase of the portfolio
ERIF entry and court collection
Amicable settlement processD
eb
t p
urc
has
e a
nd
man
age
me
nt
pro
cess
94 236 423 713 862 968 1339 1974 2363 2700 3027 3729
6000 6167
2004 2005 2006 2007 2008 2009 2010 2011 2012 2013 2014 2015 2016 Q12017
Number of cases purchased by KRUK (cumulatively, in thousands)
Over the ten years of its operation in the debt purchase segment, KRUK has handled ca. 6.2m debt cases
KRUK has been purchasing debt continuously since December 2002
Until the end of Q1 2017, KRUK purchased 570 portfolios with the nominal value of PLN 47.1bn.
Over a dozen or so years, KRUK has assembled a unique database of 6.2m debtors in Poland and abroad
KRUK normally purchases debt portfolios from the institutions to which it provides third party collection services
Increased reach and recovery at 2.0−3.0x the purchase price.
Purchase at a high discount, usually at a price equal to 5−25% of the portfolio nominal value.
Low initial reach to debtors, at approximately 20% on average.
Banks sell debt portfolios on a regular basis; the reasons include:
improvement of liquidity, the regulator's requirements, tax legislation.
Valuation based on over 10 years of experience in debt portfolio purchases – 570 portfolios purchased since the launch of operations and over 3 thousand valuations.
16
Introduction
Operating activities
Market position
Financial performance
Strategy and summary
Appendices
Agenda
17
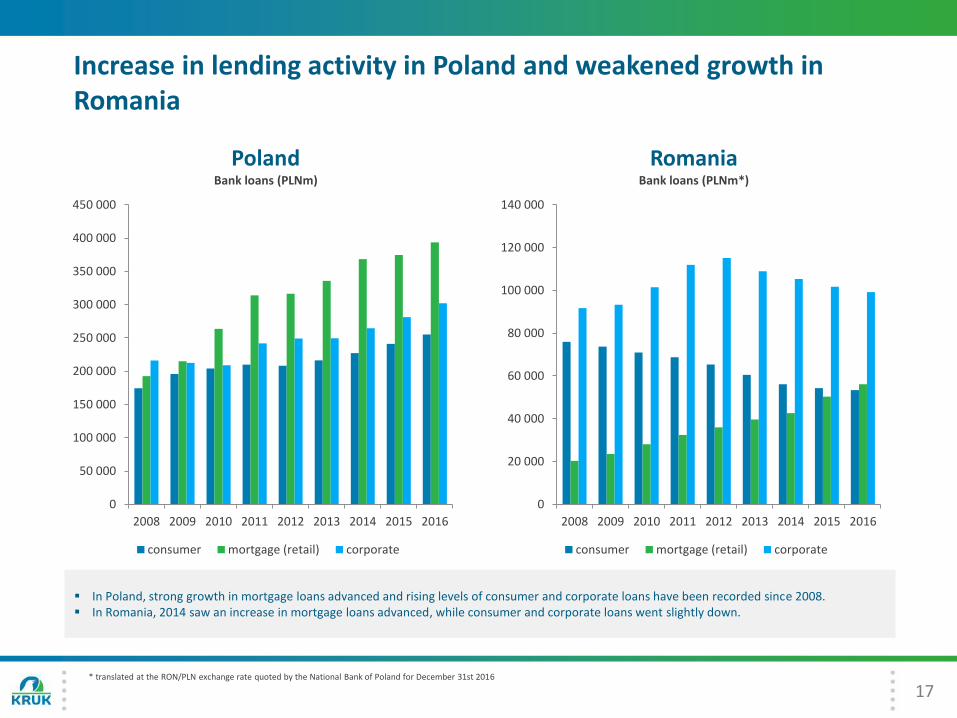
Increase in lending activity in Poland and weakened growth in Romania
In Poland, strong growth in mortgage loans advanced and rising levels of consumer and corporate loans have been recorded since 2008. In Romania, 2014 saw an increase in mortgage loans advanced, while consumer and corporate loans went slightly down.
* translated at the RON/PLN exchange rate quoted by the National Bank of Poland for December 31st 2016
0
50 000
100 000
150 000
200 000
250 000
300 000
350 000
400 000
450 000
2008 2009 2010 2011 2012 2013 2014 2015 2016
PolandBank loans (PLNm)
consumer mortgage (retail) corporate
0
20 000
40 000
60 000
80 000
100 000
120 000
140 000
2008 2009 2010 2011 2012 2013 2014 2015 2016
RomaniaBank loans (PLNm*)
consumer mortgage (retail) corporate
18
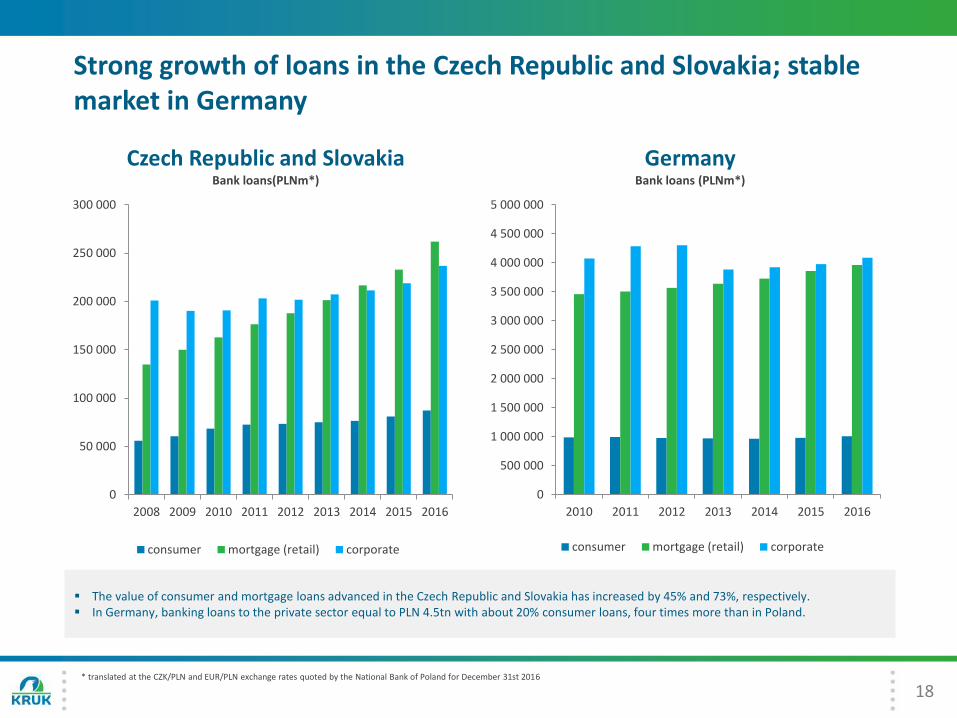
Strong growth of loans in the Czech Republic and Slovakia; stablemarket in Germany
The value of consumer and mortgage loans advanced in the Czech Republic and Slovakia has increased by 45% and 73%, respectively. In Germany, banking loans to the private sector equal to PLN 4.5tn with about 20% consumer loans, four times more than in Poland.
* translated at the CZK/PLN and EUR/PLN exchange rates quoted by the National Bank of Poland for December 31st 2016
0
50 000
100 000
150 000
200 000
250 000
300 000
2008 2009 2010 2011 2012 2013 2014 2015 2016
Czech Republic and SlovakiaBank loans(PLNm*)
consumer mortgage (retail) corporate
0
500 000
1 000 000
1 500 000
2 000 000
2 500 000
3 000 000
3 500 000
4 000 000
4 500 000
5 000 000
2010 2011 2012 2013 2014 2015 2016
GermanyBank loans (PLNm*)
consumer mortgage (retail) corporate
19
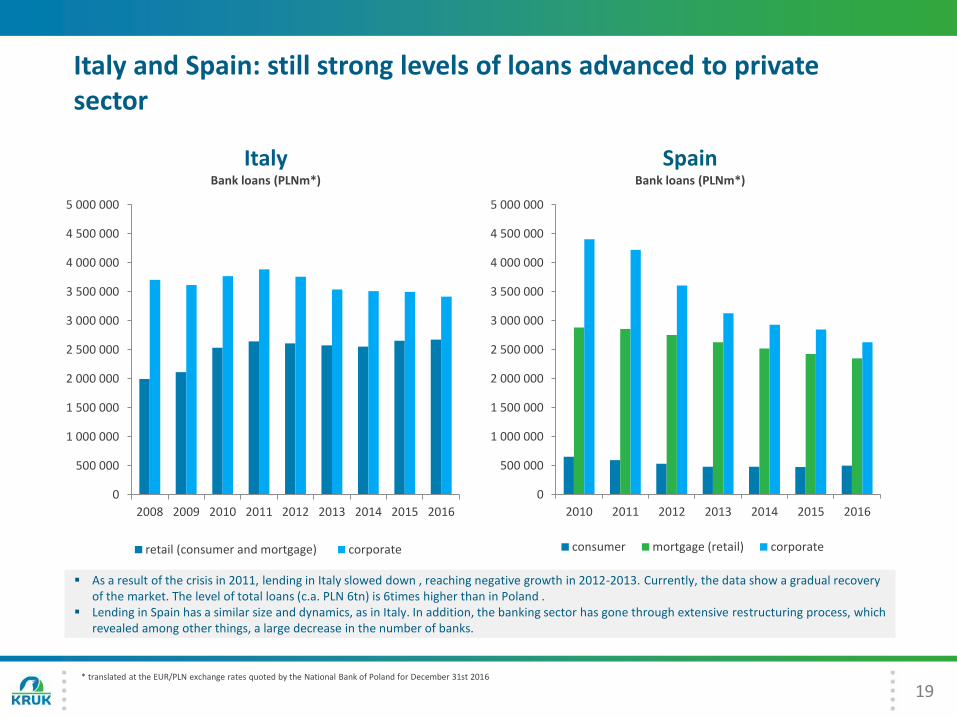
Italy and Spain: still strong levels of loans advanced to privatesector
As a result of the crisis in 2011, lending in Italy slowed down , reaching negative growth in 2012-2013. Currently, the data show a gradual recovery of the market. The level of total loans (c.a. PLN 6tn) is 6times higher than in Poland .
Lending in Spain has a similar size and dynamics, as in Italy. In addition, the banking sector has gone through extensive restructuring process, which revealed among other things, a large decrease in the number of banks.
* translated at the EUR/PLN exchange rates quoted by the National Bank of Poland for December 31st 2016
0
500 000
1 000 000
1 500 000
2 000 000
2 500 000
3 000 000
3 500 000
4 000 000
4 500 000
5 000 000
2008 2009 2010 2011 2012 2013 2014 2015 2016
ItalyBank loans (PLNm*)
retail (consumer and mortgage) corporate
0
500 000
1 000 000
1 500 000
2 000 000
2 500 000
3 000 000
3 500 000
4 000 000
4 500 000
5 000 000
2010 2011 2012 2013 2014 2015 2016
SpainBank loans (PLNm*)
consumer mortgage (retail) corporate
20
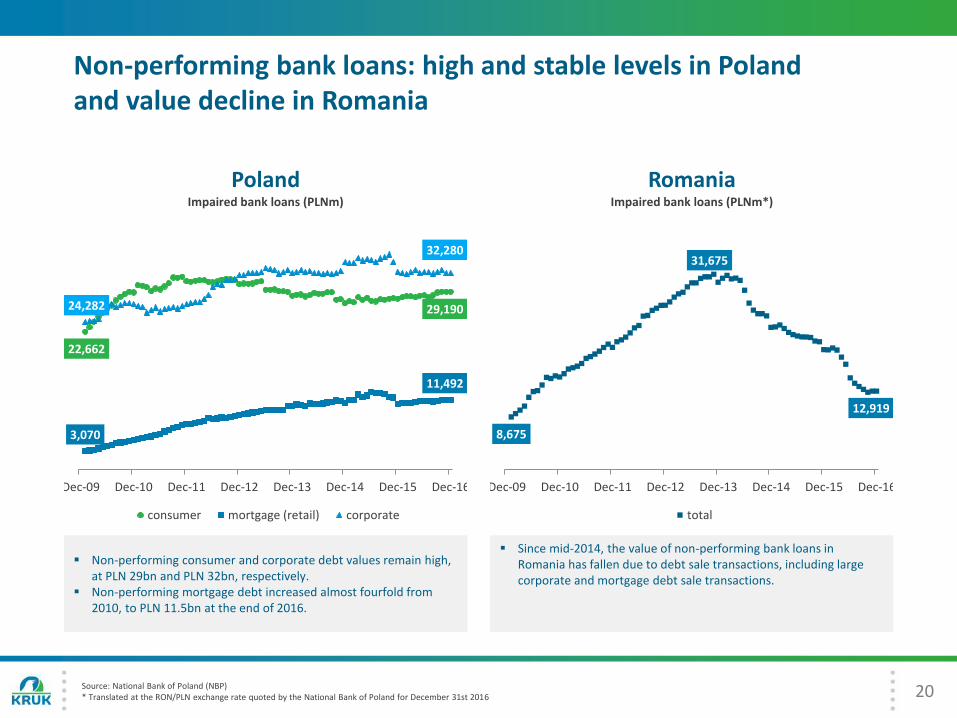
Non-performing bank loans: high and stable levels in Poland and value decline in Romania
22,662
29,190
3,070
11,492
24,282
32,280
Dec-09 Dec-10 Dec-11 Dec-12 Dec-13 Dec-14 Dec-15 Dec-16
PolandImpaired bank loans (PLNm)
consumer mortgage (retail) corporate
Non-performing consumer and corporate debt values remain high, at PLN 29bn and PLN 32bn, respectively.
Non-performing mortgage debt increased almost fourfold from 2010, to PLN 11.5bn at the end of 2016.
8,675
31,675
12,919
Dec-09 Dec-10 Dec-11 Dec-12 Dec-13 Dec-14 Dec-15 Dec-16
RomaniaImpaired bank loans (PLNm*)
total
Since mid-2014, the value of non-performing bank loans in Romania has fallen due to debt sale transactions, including large corporate and mortgage debt sale transactions.
Source: National Bank of Poland (NBP)* Translated at the RON/PLN exchange rate quoted by the National Bank of Poland for December 31st 2016
21
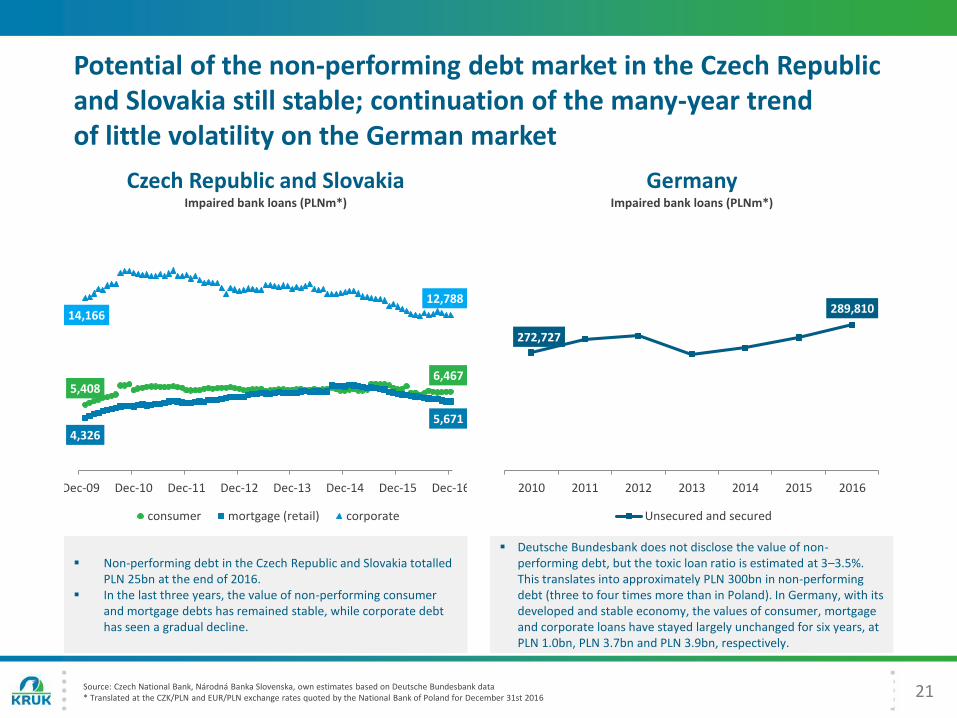
Potential of the non-performing debt market in the Czech Republic and Slovakia still stable; continuation of the many-year trend of little volatility on the German market
5,4086,467
4,3265,671
14,166
12,788
Dec-09 Dec-10 Dec-11 Dec-12 Dec-13 Dec-14 Dec-15 Dec-16
Czech Republic and SlovakiaImpaired bank loans (PLNm*)
consumer mortgage (retail) corporate
272,727
289,810
2010 2011 2012 2013 2014 2015 2016
GermanyImpaired bank loans (PLNm*)
Unsecured and secured
Non-performing debt in the Czech Republic and Slovakia totalled PLN 25bn at the end of 2016.
In the last three years, the value of non-performing consumer and mortgage debts has remained stable, while corporate debt has seen a gradual decline.
Deutsche Bundesbank does not disclose the value of non-performing debt, but the toxic loan ratio is estimated at 3–3.5%. This translates into approximately PLN 300bn in non-performing debt (three to four times more than in Poland). In Germany, with its developed and stable economy, the values of consumer, mortgage and corporate loans have stayed largely unchanged for six years, at PLN 1.0bn, PLN 3.7bn and PLN 3.9bn, respectively.
Source: Czech National Bank, Národná Banka Slovenska, own estimates based on Deutsche Bundesbank data* Translated at the CZK/PLN and EUR/PLN exchange rates quoted by the National Bank of Poland for December 31st 2016
22
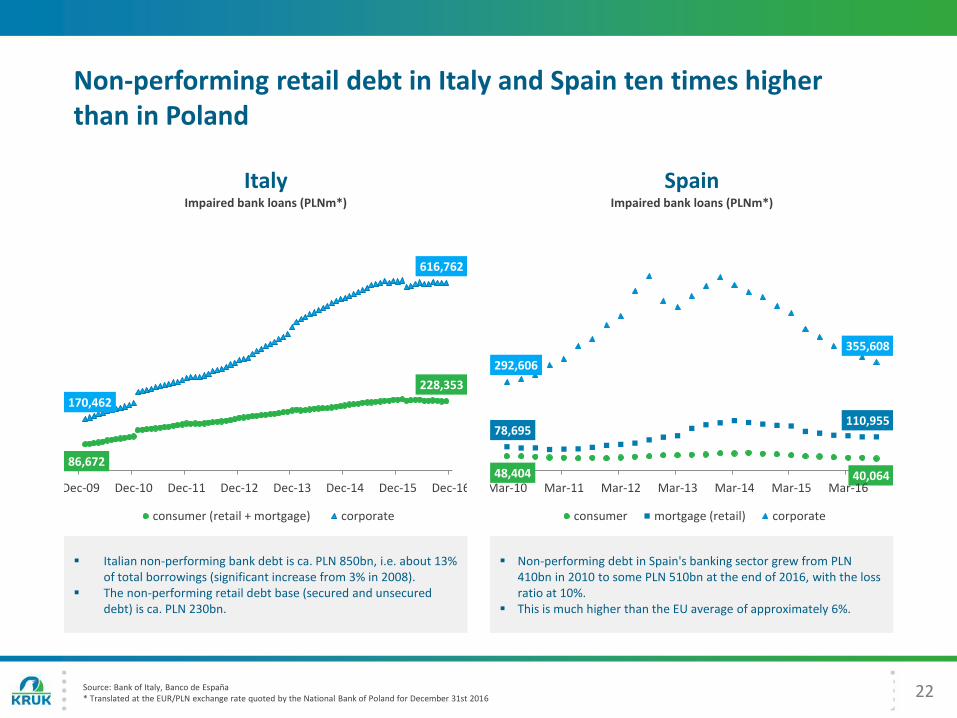
Non-performing retail debt in Italy and Spain ten times higher than in Poland
86,672
228,353
170,462
616,762
Dec-09 Dec-10 Dec-11 Dec-12 Dec-13 Dec-14 Dec-15 Dec-16
ItalyImpaired bank loans (PLNm*)
consumer (retail + mortgage) corporate
48,404 40,064
78,695110,955
292,606
355,608
Mar-10 Mar-11 Mar-12 Mar-13 Mar-14 Mar-15 Mar-16
SpainImpaired bank loans (PLNm*)
consumer mortgage (retail) corporate
Italian non-performing bank debt is ca. PLN 850bn, i.e. about 13% of total borrowings (significant increase from 3% in 2008).
The non-performing retail debt base (secured and unsecured debt) is ca. PLN 230bn.
Non-performing debt in Spain's banking sector grew from PLN 410bn in 2010 to some PLN 510bn at the end of 2016, with the loss ratio at 10%.
This is much higher than the EU average of approximately 6%.
Source: Bank of Italy, Banco de España* Translated at the EUR/PLN exchange rate quoted by the National Bank of Poland for December 31st 2016
23
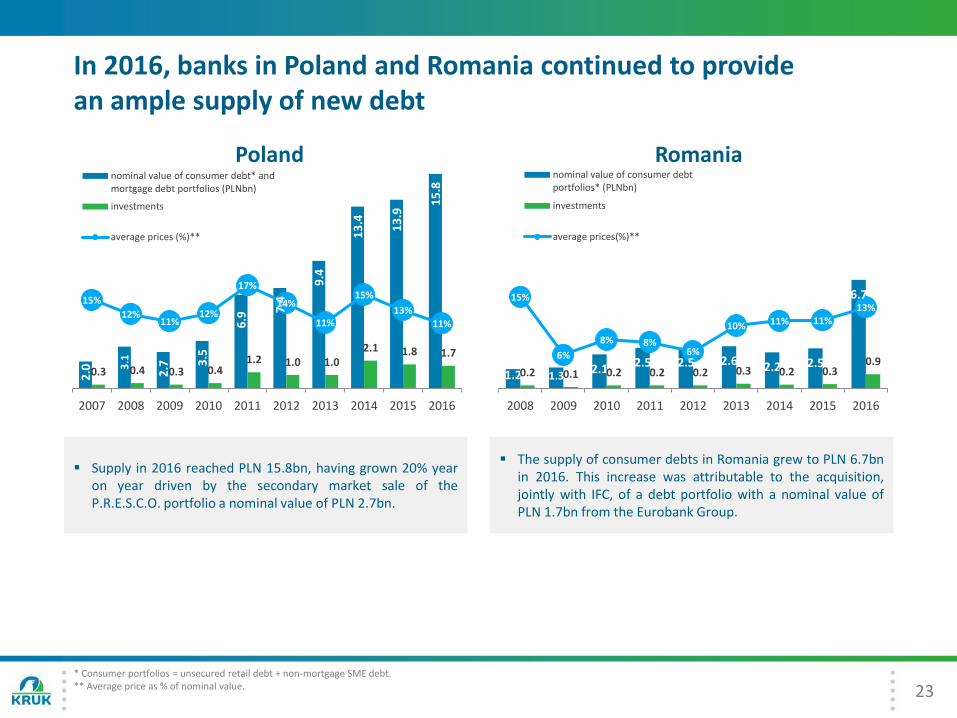
In 2016, banks in Poland and Romania continued to provide an ample supply of new debt
2.0 3
.1
2.7 3
.5
6.9
7.4
9.4
13
.4 13
.9
15
.8
0.3 0.4 0.3 0.41.2 1.0 1.0
2.1 1.8 1.7
15%
12%11%
12%
17%
14%
11%
15%
13%
11%
0%
5%
10%
15%
20%
25%
30%
35%
40%
0
2
4
6
8
10
12
14
16
18
2007 2008 2009 2010 2011 2012 2013 2014 2015 2016
Polandnominal value of consumer debt* andmortgage debt portfolios (PLNbn)
investments
average prices (%)**
1.2 1.32.1 2.5 2.5 2.6 2.2 2.5
6.7
0.2 0.1 0.2 0.2 0.2 0.3 0.2 0.30.9
15%
6%
8% 8%6%
10% 11% 11%13%
0%
5%
10%
15%
20%
25%
30%
35%
40%
0
2
4
6
8
10
12
14
2008 2009 2010 2011 2012 2013 2014 2015 2016
Romanianominal value of consumer debtportfolios* (PLNbn)
investments
average prices(%)**
Supply in 2016 reached PLN 15.8bn, having grown 20% yearon year driven by the secondary market sale of theP.R.E.S.C.O. portfolio a nominal value of PLN 2.7bn.
The supply of consumer debts in Romania grew to PLN 6.7bnin 2016. This increase was attributable to the acquisition,jointly with IFC, of a debt portfolio with a nominal value ofPLN 1.7bn from the Eurobank Group.
* Consumer portfolios = unsecured retail debt + non-mortgage SME debt.** Average price as % of nominal value.
24
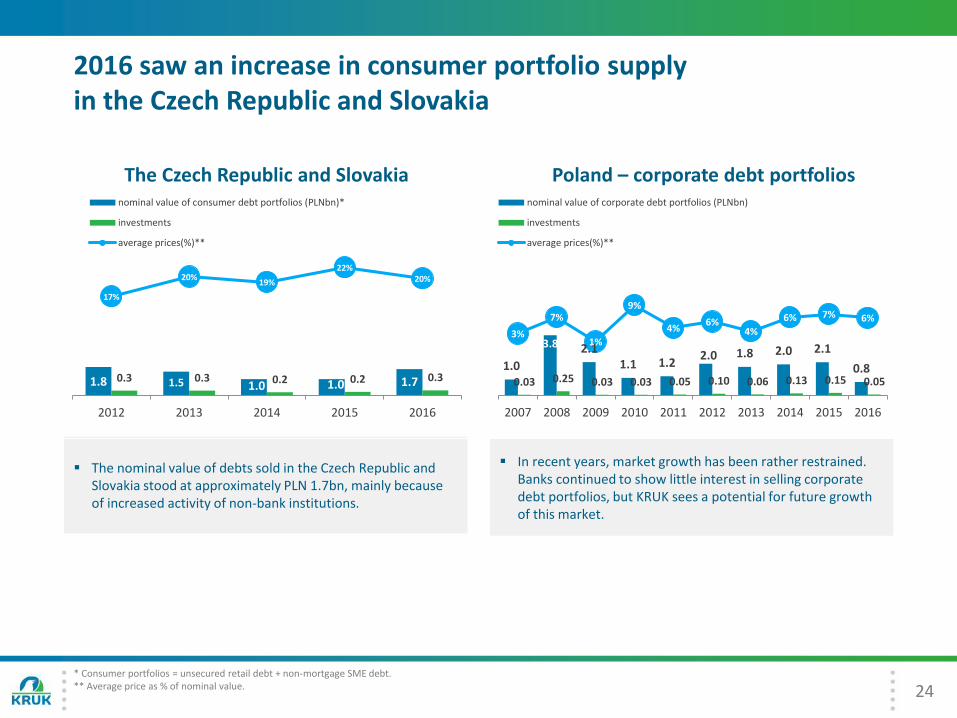
2016 saw an increase in consumer portfolio supply in the Czech Republic and Slovakia
1.0
3.8 2.11.1 1.2
2.0 1.8 2.0 2.1
0.80.03 0.25 0.03 0.03 0.05 0.10 0.06 0.13 0.15 0.05
3%
7%
1%
9%
4%6%
4%
6% 7% 6%
-10%
-5%
0%
5%
10%
15%
20%
25%
30%
35%
40%
0
2
4
6
8
10
12
14
2007 2008 2009 2010 2011 2012 2013 2014 2015 2016
Poland – corporate debt portfoliosnominal value of corporate debt portfolios (PLNbn)
investments
average prices(%)**
The nominal value of debts sold in the Czech Republic and Slovakia stood at approximately PLN 1.7bn, mainly because of increased activity of non-bank institutions.
In recent years, market growth has been rather restrained. Banks continued to show little interest in selling corporate debt portfolios, but KRUK sees a potential for future growth of this market.
* Consumer portfolios = unsecured retail debt + non-mortgage SME debt.** Average price as % of nominal value.
1.8 1.5 1.0 1.0 1.70.3 0.3 0.2 0.2 0.3
17%
20%19%
22%20%
0%
5%
10%
15%
20%
25%
30%
35%
40%
0
2
4
6
8
10
12
14
2012 2013 2014 2015 2016
The Czech Republic and Slovakianominal value of consumer debt portfolios (PLNbn)*
investments
average prices(%)**
25
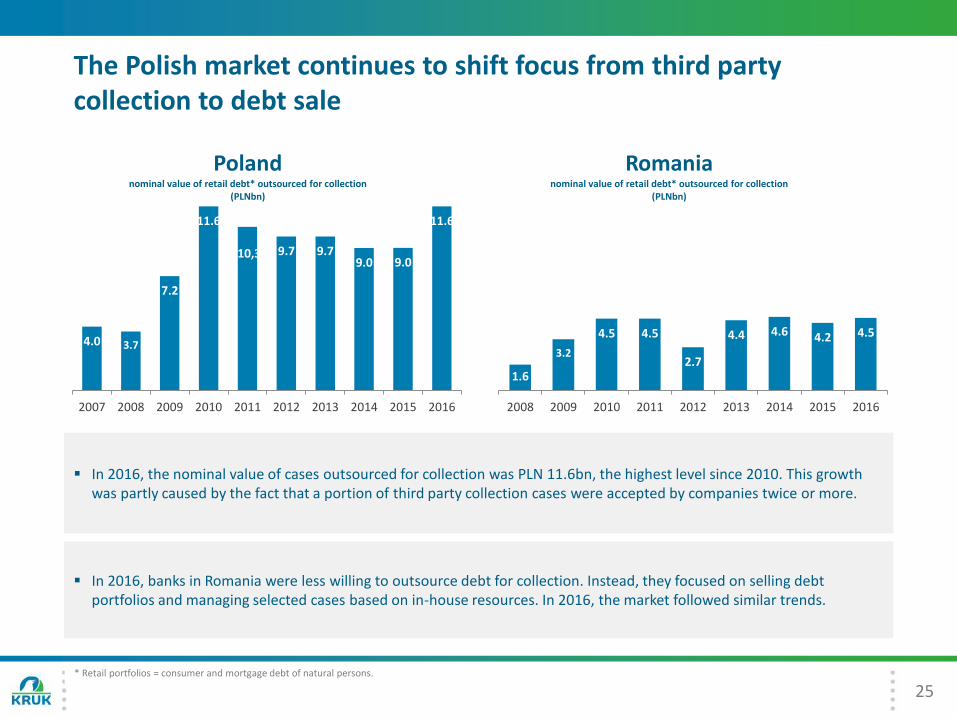
The Polish market continues to shift focus from third party collection to debt sale
4.0 3.7
7.2
11.6
.10,3 9.7 9.79.0 9.0
11.6
0
2
4
6
8
10
12
14
2007 2008 2009 2010 2011 2012 2013 2014 2015 2016
Polandnominal value of retail debt* outsourced for collection
(PLNbn)
1.6
3.2
4.5 4.5
2.7
4.4 4.6 4.2 4.5
0
2
4
6
8
10
12
14
2008 2009 2010 2011 2012 2013 2014 2015 2016
Romanianominal value of retail debt* outsourced for collection
(PLNbn)
In 2016, the nominal value of cases outsourced for collection was PLN 11.6bn, the highest level since 2010. This growth was partly caused by the fact that a portion of third party collection cases were accepted by companies twice or more.
In 2016, banks in Romania were less willing to outsource debt for collection. Instead, they focused on selling debt portfolios and managing selected cases based on in-house resources. In 2016, the market followed similar trends.
* Retail portfolios = consumer and mortgage debt of natural persons.
26
Introduction
Operating activities
Market position
Financial performance
Strategy and summary
Appendices
Agenda
27
3,776 4,926
16,440
3,830
2014 2015 2016 Q1 20176,009
1,969
8,049
3,830
Q2 2016
Q3 2016
Q4 2016
Q1 2017
Nominal value of purchased debts (PLNm)
Investments in new debt portfolios (PLNm)
663
209
350
214
Q2 2016
Q3 2016
Q4 2016
Q1 2017
571 489 1,286
214
2014 2015 2016 Q1 2017
28,972
19,857
1,435
2,560
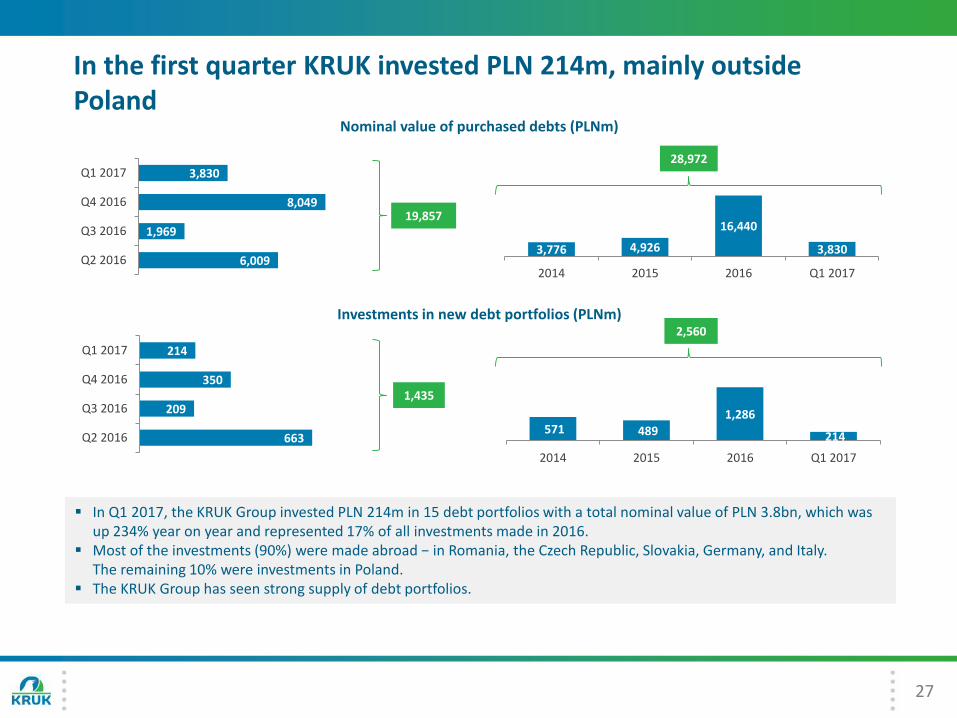
In Q1 2017, the KRUK Group invested PLN 214m in 15 debt portfolios with a total nominal value of PLN 3.8bn, which was up 234% year on year and represented 17% of all investments made in 2016.
Most of the investments (90%) were made abroad − in Romania, the Czech Republic, Slovakia, Germany, and Italy. The remaining 10% were investments in Poland.
The KRUK Group has seen strong supply of debt portfolios.
In the first quarter KRUK invested PLN 214m, mainly outside Poland
28
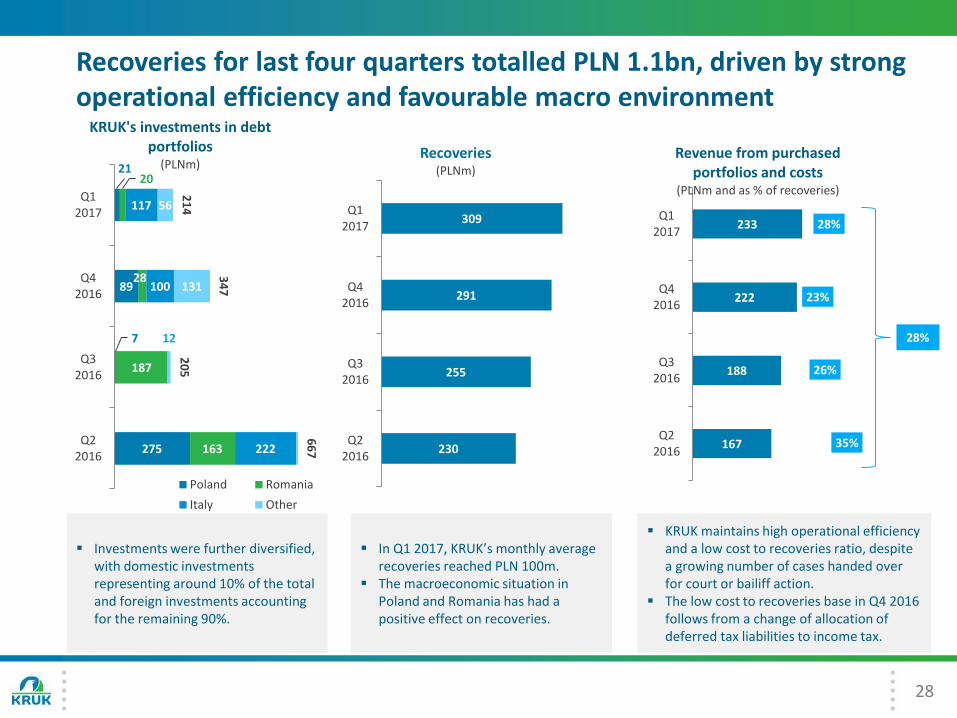
Recoveries for last four quarters totalled PLN 1.1bn, driven by strong operational efficiency and favourable macro environment
275
7
89
21
163
187
28
20
222
100
117
7
12
131
56
66
7
20
5
34
7
21
4
Q22016
Q32016
Q42016
Q12017
KRUK's investments in debt portfolios
(PLNm)
Poland Romania
Italy Other
230
255
291
309
Q22016
Q32016
Q42016
Q12017
Recoveries(PLNm)
167
188
222
233
Q22016
Q32016
Q42016
Q12017
Revenue from purchasedportfolios and costs
(PLNm and as % of recoveries)
Investments were further diversified, with domestic investments representing around 10% of the total and foreign investments accounting for the remaining 90%.
In Q1 2017, KRUK’s monthly average recoveries reached PLN 100m.
The macroeconomic situation in Poland and Romania has had a positive effect on recoveries.
KRUK maintains high operational efficiency and a low cost to recoveries ratio, despite a growing number of cases handed over for court or bailiff action.
The low cost to recoveries base in Q4 2016 follows from a change of allocation of deferred tax liabilities to income tax.
35%
26%
23%
28%
28%
1,102
1,117
1,047
5,151
Q22016
Q32016
Q42016
Q12017
Nominal value of debt under third party collection (PLNm)
and commission fees(% of nominal value)
0,7%
0,7%
0,9%
0,3%
29
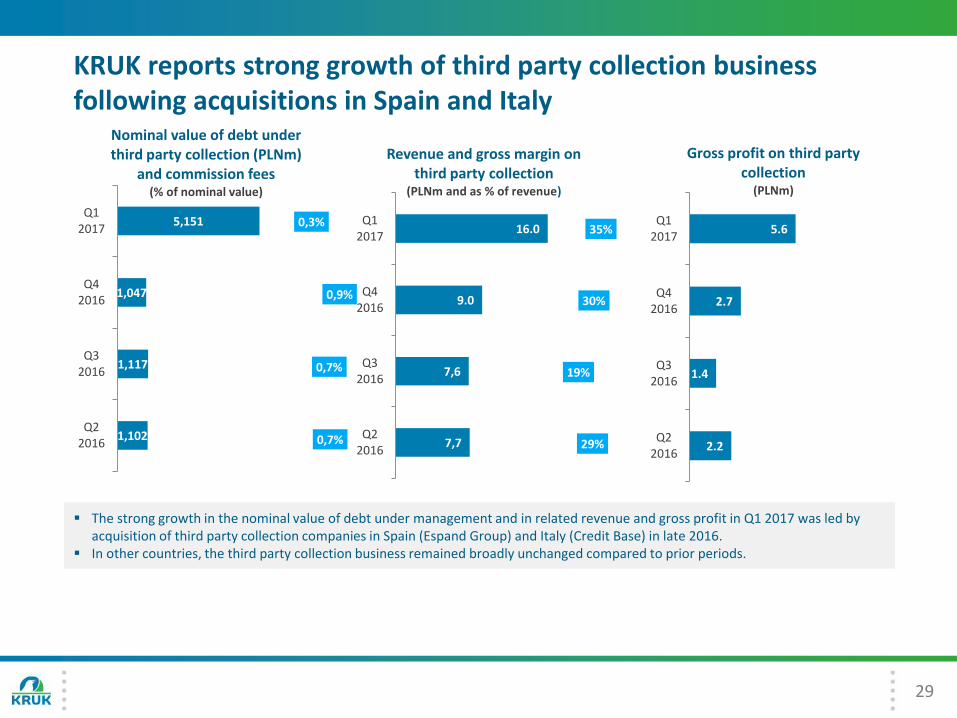
KRUK reports strong growth of third party collection business following acquisitions in Spain and Italy
7,7
7,6
9.0
16.0
Q22016
Q32016
Q42016
Q12017
Revenue and gross margin on third party collection
(PLNm and as % of revenue)
29%
19%
30%
35%
2.2
1.4
2.7
5.6
Q22016
Q32016
Q42016
Q12017
Gross profit on third party collection
(PLNm)
The strong growth in the nominal value of debt under management and in related revenue and gross profit in Q1 2017 was led byacquisition of third party collection companies in Spain (Espand Group) and Italy (Credit Base) in late 2016.
In other countries, the third party collection business remained broadly unchanged compared to prior periods.
29.025.3
6.37.0
-
5,0
10,0
15,0
20,0
25,0
30,0
35,0
40,0
45,0
-
5,0
10,0
15,0
20,0
25,0
2016Q1 2017
value of cases number of entries
10.1 41.3
7.5
1.7
-
10,0
20,0
30,0
40,0
50,0
60,0
-
1,0
2,0
3,0
4,0
5,0
6,0
7,0
8,0
9,0
10,0
2016Q1 2017
gross value number of loans
30
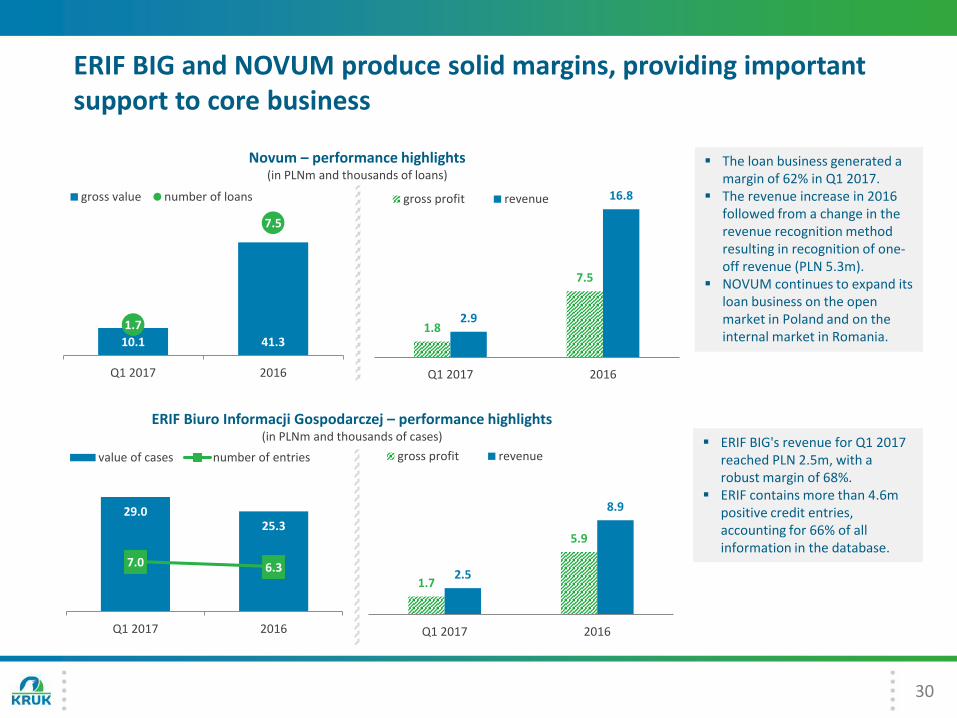
ERIF Biuro Informacji Gospodarczej – performance highlights (in PLNm and thousands of cases)
ERIF BIG and NOVUM produce solid margins, providing important support to core business
Novum – performance highlights (in PLNm and thousands of loans)
The loan business generated a margin of 62% in Q1 2017.
The revenue increase in 2016 followed from a change in the revenue recognition method resulting in recognition of one-off revenue (PLN 5.3m).
NOVUM continues to expand its loan business on the open market in Poland and on the internal market in Romania.
ERIF BIG's revenue for Q1 2017 reached PLN 2.5m, with a robust margin of 68%.
ERIF contains more than 4.6m positive credit entries, accounting for 66% of all information in the database.
1.8
7.5
2.9
16.8
Q1 2017 2016
gross profit revenue
1.7
5.9
2.5
8.9
Q1 2017 2016
gross profit revenue
31
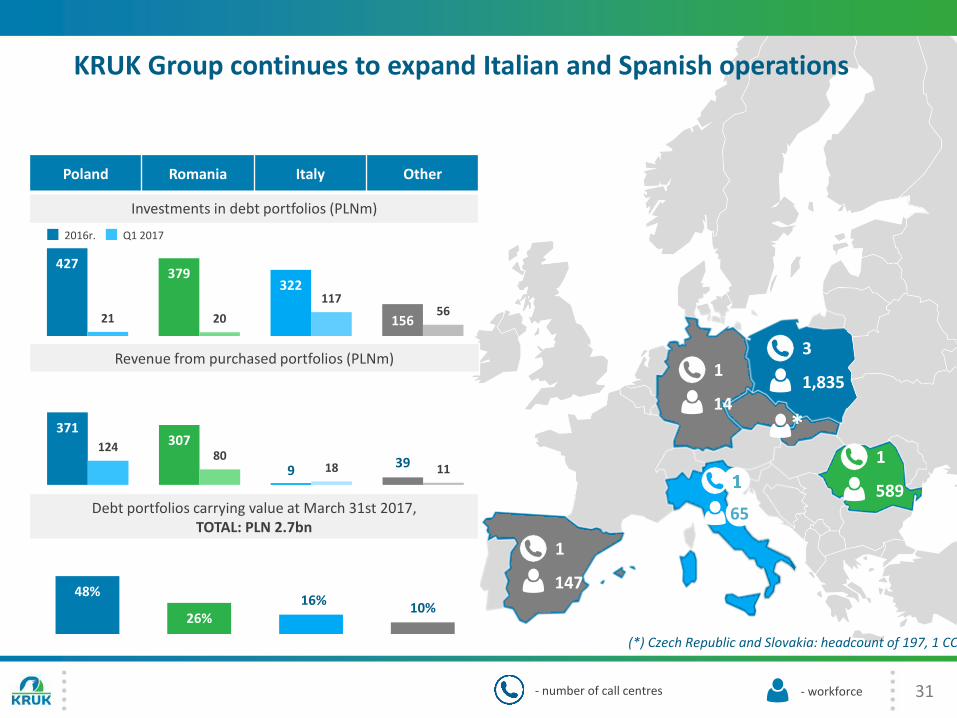
KRUK Group continues to expand Italian and Spanish operations
3
1,835
1
147
1
14
1
589
*
(*) Czech Republic and Slovakia: headcount of 197, 1 CC
427379
322
15621 20
11756
Poland Romania Italy Other
Investments in debt portfolios (PLNm)
Revenue from purchased portfolios (PLNm)
371307
939
12480
18 11
48%
26%16%
10%
- number of call centres - workforce
2016r. Q1 2017
Debt portfolios carrying value at March 31st 2017, TOTAL: PLN 2.7bn
65
32
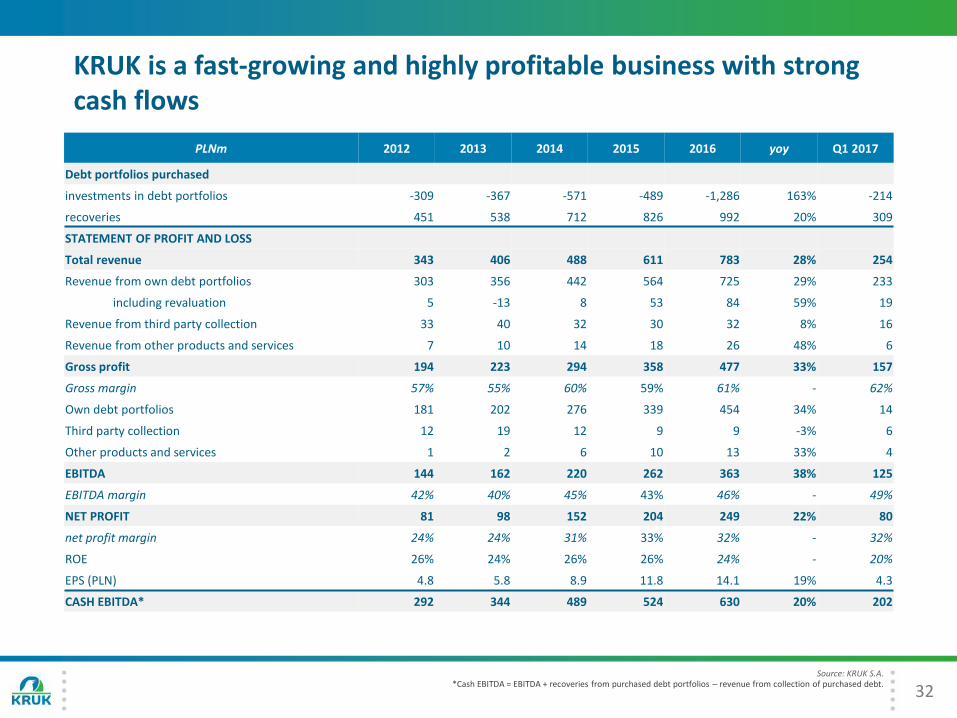
KRUK is a fast-growing and highly profitable business with strong cash flows
PLNm 2012 2013 2014 2015 2016 yoy Q1 2017
Debt portfolios purchased
investments in debt portfolios -309 -367 -571 -489 -1,286 163% -214
recoveries 451 538 712 826 992 20% 309
STATEMENT OF PROFIT AND LOSS
Total revenue 343 406 488 611 783 28% 254
Revenue from own debt portfolios 303 356 442 564 725 29% 233
including revaluation 5 -13 8 53 84 59% 19
Revenue from third party collection 33 40 32 30 32 8% 16
Revenue from other products and services 7 10 14 18 26 48% 6
Gross profit 194 223 294 358 477 33% 157
Gross margin 57% 55% 60% 59% 61% - 62%
Own debt portfolios 181 202 276 339 454 34% 14
Third party collection 12 19 12 9 9 -3% 6
Other products and services 1 2 6 10 13 33% 4
EBITDA 144 162 220 262 363 38% 125
EBITDA margin 42% 40% 45% 43% 46% - 49%
NET PROFIT 81 98 152 204 249 22% 80
net profit margin 24% 24% 31% 33% 32% - 32%
ROE 26% 24% 26% 26% 24% - 20%
EPS (PLN) 4.8 5.8 8.9 11.8 14.1 19% 4.3
CASH EBITDA* 292 344 489 524 630 20% 202
Source: KRUK S.A.*Cash EBITDA = EBITDA + recoveries from purchased debt portfolios – revenue from collection of purchased debt.
33
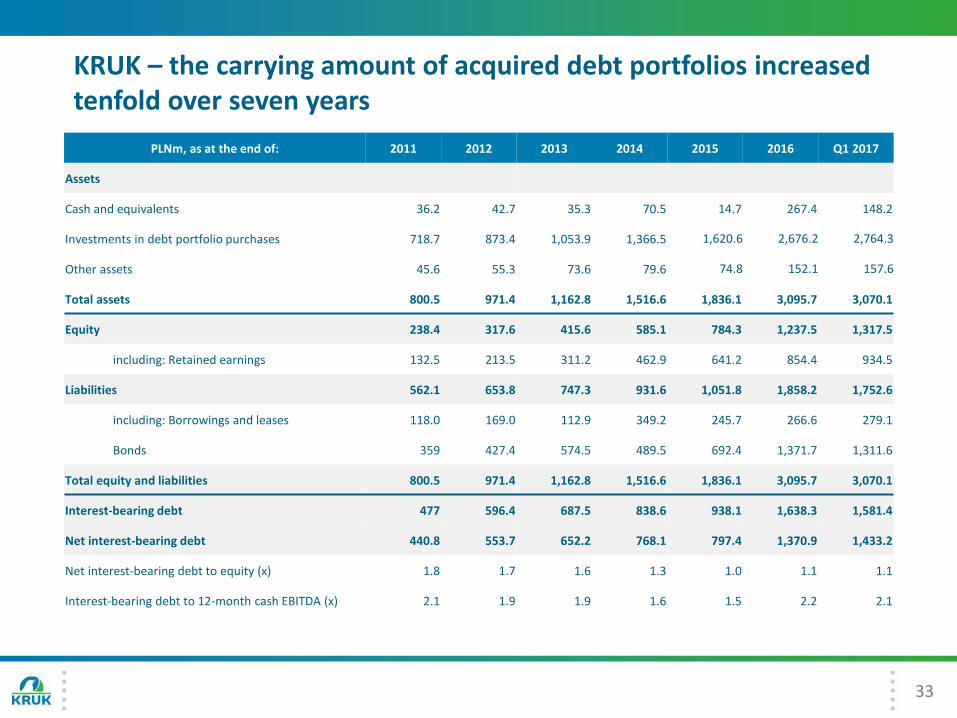
KRUK – the carrying amount of acquired debt portfolios increased tenfold over seven years
PLNm, as at the end of: 2011 2012 2013 2014 2015 2016 Q1 2017
Assets
Cash and equivalents 36.2 42.7 35.3 70.5 14.7 267.4 148.2
Investments in debt portfolio purchases 718.7 873.4 1,053.9 1,366.5 1,620.6 2,676.2 2,764.3
Other assets 45.6 55.3 73.6 79.6 74.8 152.1 157.6
Total assets 800.5 971.4 1,162.8 1,516.6 1,836.1 3,095.7 3,070.1
Equity 238.4 317.6 415.6 585.1 784.3 1,237.5 1,317.5
including: Retained earnings 132.5 213.5 311.2 462.9 641.2 854.4 934.5
Liabilities 562.1 653.8 747.3 931.6 1,051.8 1,858.2 1,752.6
including: Borrowings and leases 118.0 169.0 112.9 349.2 245.7 266.6 279.1
Bonds 359 427.4 574.5 489.5 692.4 1,371.7 1,311.6
Total equity and liabilities 800.5 971.4 1,162.8 1,516.6 1,836.1 3,095.7 3,070.1
Interest-bearing debt 477 596.4 687.5 838.6 938.1 1,638.3 1,581.4
Net interest-bearing debt 440.8 553.7 652.2 768.1 797.4 1,370.9 1,433.2
Net interest-bearing debt to equity (x) 1.8 1.7 1.6 1.3 1.0 1.1 1.1
Interest-bearing debt to 12-month cash EBITDA (x) 2.1 1.9 1.9 1.6 1.5 2.2 2.1
34
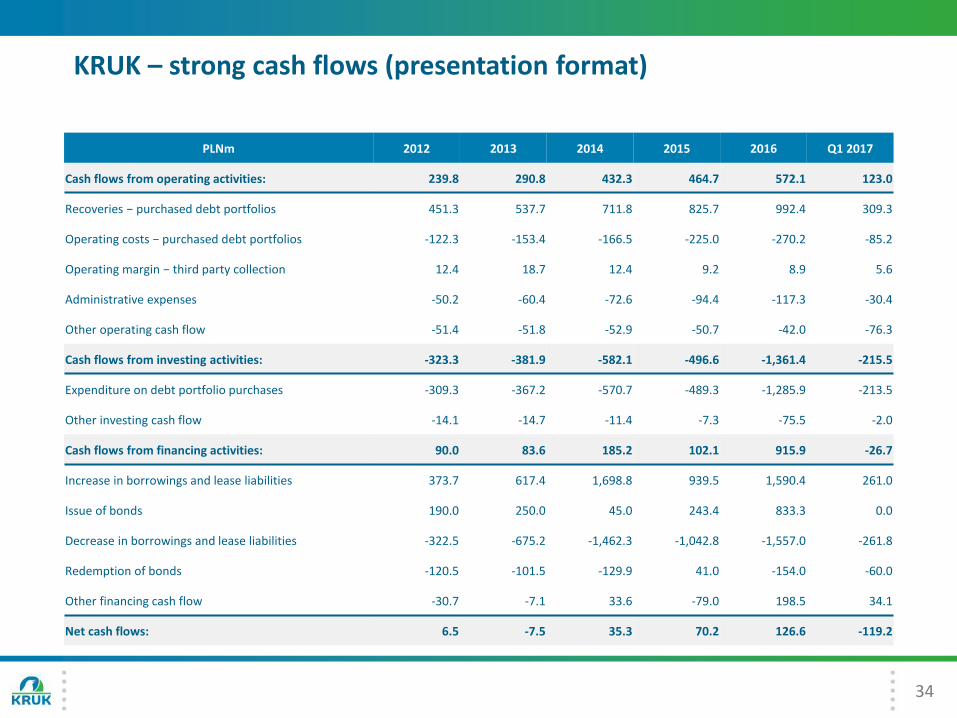
KRUK – strong cash flows (presentation format)
PLNm 2012 2013 2014 2015 2016 Q1 2017
Cash flows from operating activities: 239.8 290.8 432.3 464.7 572.1 123.0
Recoveries − purchased debt portfolios 451.3 537.7 711.8 825.7 992.4 309.3
Operating costs − purchased debt portfolios -122.3 -153.4 -166.5 -225.0 -270.2 -85.2
Operating margin − third party collection 12.4 18.7 12.4 9.2 8.9 5.6
Administrative expenses -50.2 -60.4 -72.6 -94.4 -117.3 -30.4
Other operating cash flow -51.4 -51.8 -52.9 -50.7 -42.0 -76.3
Cash flows from investing activities: -323.3 -381.9 -582.1 -496.6 -1,361.4 -215.5
Expenditure on debt portfolio purchases -309.3 -367.2 -570.7 -489.3 -1,285.9 -213.5
Other investing cash flow -14.1 -14.7 -11.4 -7.3 -75.5 -2.0
Cash flows from financing activities: 90.0 83.6 185.2 102.1 915.9 -26.7
Increase in borrowings and lease liabilities 373.7 617.4 1,698.8 939.5 1,590.4 261.0
Issue of bonds 190.0 250.0 45.0 243.4 833.3 0.0
Decrease in borrowings and lease liabilities -322.5 -675.2 -1,462.3 -1,042.8 -1,557.0 -261.8
Redemption of bonds -120.5 -101.5 -129.9 41.0 -154.0 -60.0
Other financing cash flow -30.7 -7.1 33.6 -79.0 198.5 34.1
Net cash flows: 6.5 -7.5 35.3 70.2 126.6 -119.2
35
Introduction
Operating activities
Market position
Financial performance
Strategy and summary
Appendices
Agenda
36
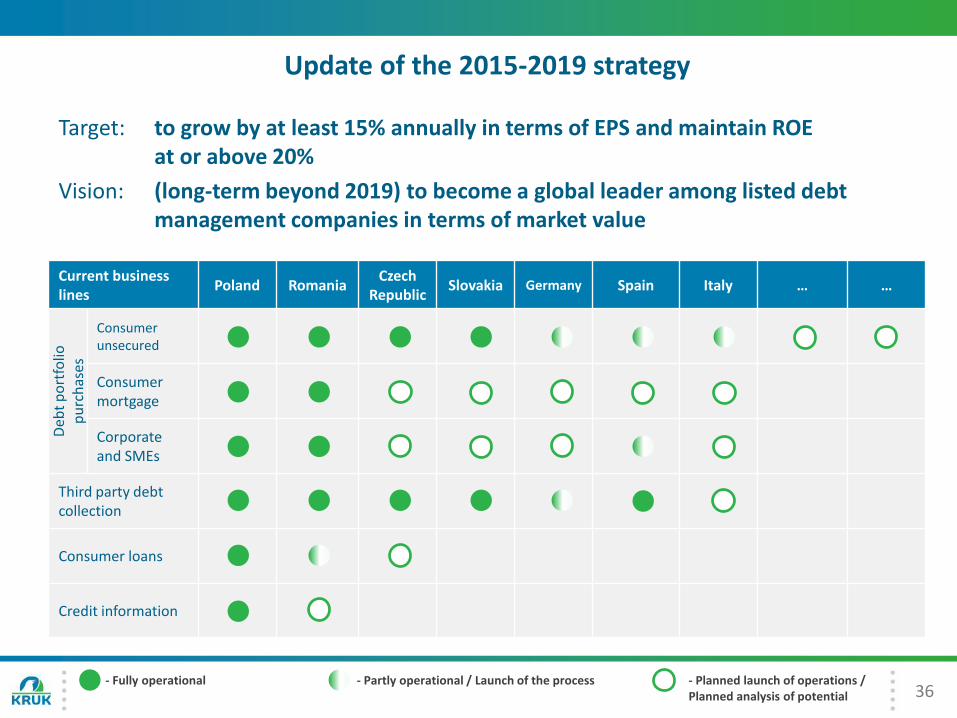
Update of the 2015-2019 strategy
Current business lines
Poland RomaniaCzech
RepublicSlovakia Germany Spain Italy … …
Deb
t p
ort
folio
p
urc
has
es
Consumerunsecured
Consumer mortgage
Corporateand SMEs
Third party debtcollection
Consumer loans
Credit information
- Fully operational - Partly operational / Launch of the process - Planned launch of operations / Planned analysis of potential
Target: to grow by at least 15% annually in terms of EPS and maintain ROE at or above 20%
Vision: (long-term beyond 2019) to become a global leader among listed debt management companies in terms of market value
37
Introduction
Operating activities
Market position
Financial performance
Strategy and summary
Appendices
Agenda
38
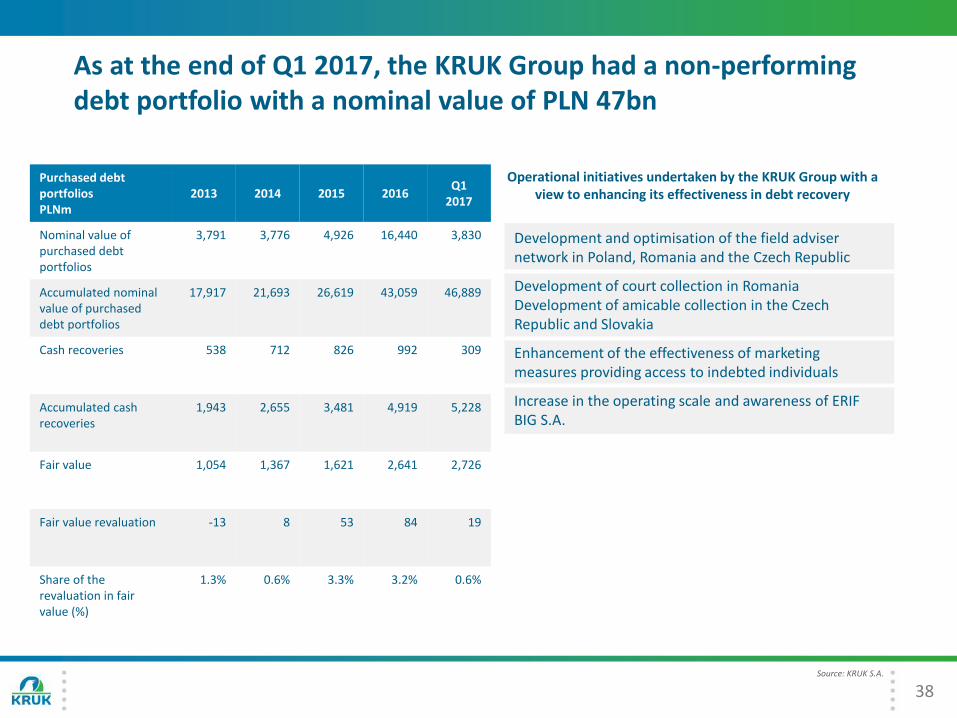
As at the end of Q1 2017, the KRUK Group had a non-performing debt portfolio with a nominal value of PLN 47bn
Purchased debt portfolios PLNm
2013 2014 2015 2016Q1
2017
Nominal value of purchased debt portfolios
3,791 3,776 4,926 16,440 3,830
Accumulated nominal value of purchased debt portfolios
17,917 21,693 26,619 43,059 46,889
Cash recoveries 538 712 826 992 309
Accumulated cash recoveries
1,943 2,655 3,481 4,919 5,228
Fair value 1,054 1,367 1,621 2,641 2,726
Fair value revaluation -13 8 53 84 19
Share of the revaluation in fair value (%)
1.3% 0.6% 3.3% 3.2% 0.6%
Development and optimisation of the field adviser network in Poland, Romania and the Czech Republic
Development of court collection in RomaniaDevelopment of amicable collection in the Czech Republic and Slovakia
Enhancement of the effectiveness of marketing measures providing access to indebted individuals
Increase in the operating scale and awareness of ERIF BIG S.A.
Operational initiatives undertaken by the KRUK Group with a view to enhancing its effectiveness in debt recovery
Source: KRUK S.A.
39
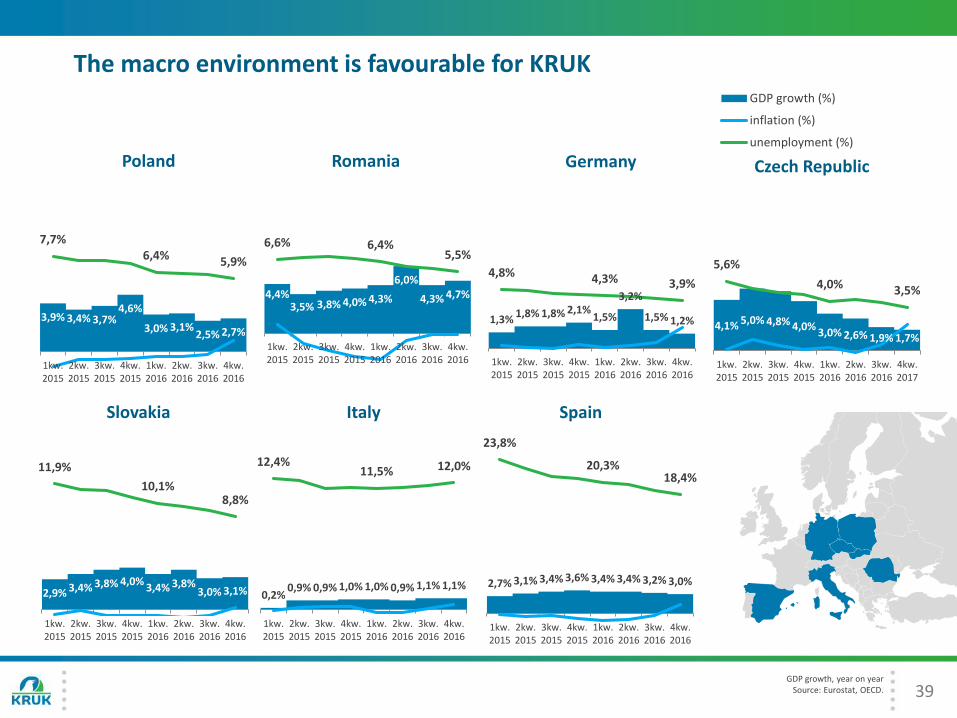
The macro environment is favourable for KRUK
GDP growth, year on yearSource: Eurostat, OECD.
3,9% 3,4% 3,7%4,6%
3,0% 3,1%2,5% 2,7%
7,7%6,4% 5,9%
1kw.2015
2kw.2015
3kw.2015
4kw.2015
1kw.2016
2kw.2016
3kw.2016
4kw.2016
Poland
4,4%3,5% 3,8% 4,0% 4,3%
6,0%
4,3% 4,7%
6,6% 6,4%5,5%
1kw.2015
2kw.2015
3kw.2015
4kw.2015
1kw.2016
2kw.2016
3kw.2016
4kw.2016
Romania
4,1% 5,0% 4,8% 4,0%3,0% 2,6% 1,9% 1,7%
5,6%
4,0% 3,5%
1kw.2015
2kw.2015
3kw.2015
4kw.2015
1kw.2016
2kw.2016
3kw.2016
4kw.2017
Czech Republic
GDP growth (%)
inflation (%)
unemployment (%)
2,9% 3,4% 3,8% 4,0%3,4% 3,8%
3,0% 3,1%
11,9%
10,1%8,8%
1kw.2015
2kw.2015
3kw.2015
4kw.2015
1kw.2016
2kw.2016
3kw.2016
4kw.2016
Slovakia
1,3%1,8% 1,8% 2,1%
1,5%
3,2%
1,5% 1,2%
4,8% 4,3% 3,9%
1kw.2015
2kw.2015
3kw.2015
4kw.2015
1kw.2016
2kw.2016
3kw.2016
4kw.2016
Germany
0,2%0,9% 0,9% 1,0% 1,0% 0,9% 1,1% 1,1%
12,4%11,5% 12,0%
1kw.2015
2kw.2015
3kw.2015
4kw.2015
1kw.2016
2kw.2016
3kw.2016
4kw.2016
Italy
2,7% 3,1% 3,4% 3,6% 3,4% 3,4% 3,2% 3,0%
23,8%
20,3%18,4%
1kw.2015
2kw.2015
3kw.2015
4kw.2015
1kw.2016
2kw.2016
3kw.2016
4kw.2016
Spain
RON/PLN
40
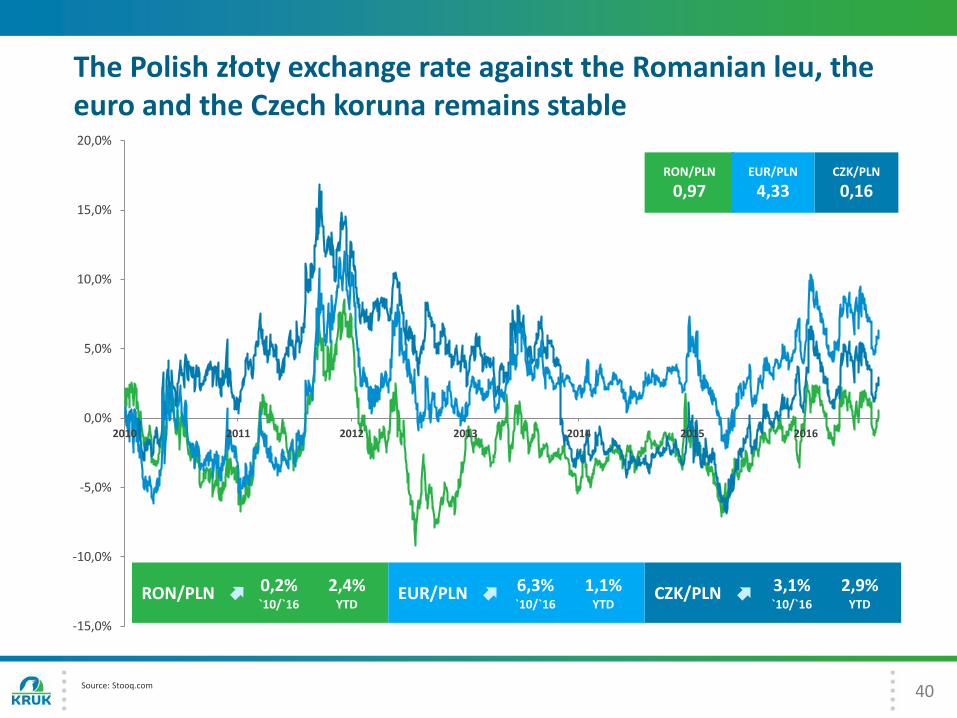
The Polish złoty exchange rate against the Romanian leu, the euro and the Czech koruna remains stable
-15,0%
-10,0%
-5,0%
0,0%
5,0%
10,0%
15,0%
20,0%
2010 2011 2012 2013 2014 2015 2016
0,2%`10/`16
2,4%YTD
CZK/PLNEUR/PLN 6,3%`10/`16
1,1%YTD
3,1%`10/`16
2,9%YTD
RON/PLN
0,97CZK/PLN
0,16EUR/PLN
4,33
Source: Stooq.com
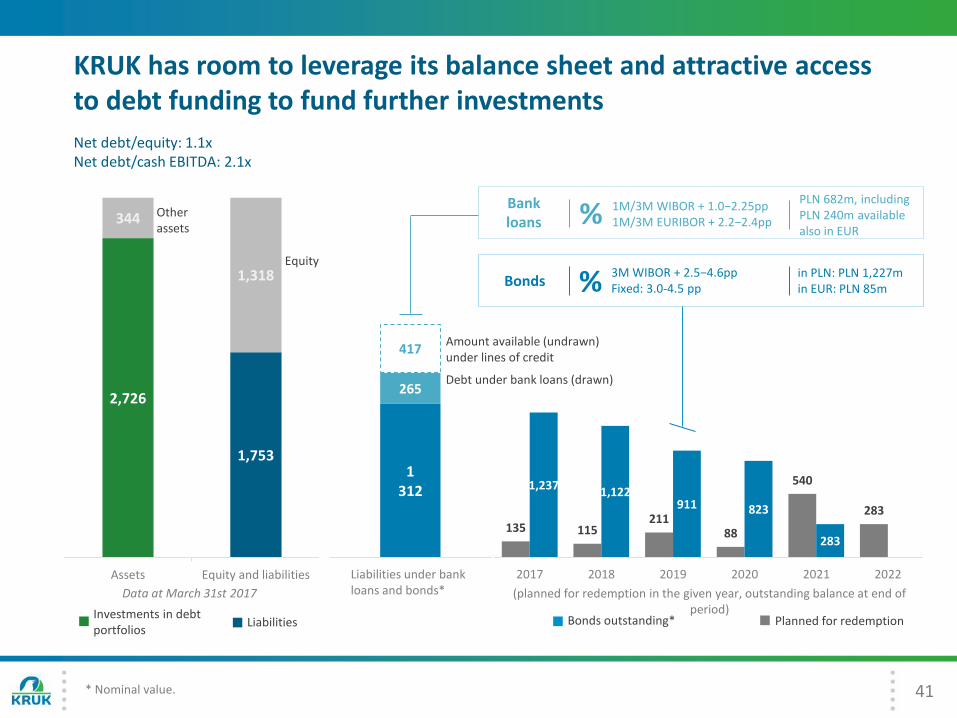
2,726
344
1,753
1,318
Assets Equity and liabilities
Equity
41
KRUK has room to leverage its balance sheet and attractive access to debt funding to fund further investments
1 312
265
417
Liabilities under bank loans and bonds*
135 115211
88
540
283
1,2371,122
911 823
283 0
2017 2018 2019 2020 2021 2022
Data at March 31st 2017
Investments in debt portfolios
Other assets
Liabilities Bonds outstanding*
Debt under bank loans (drawn)
Amount available (undrawn) under lines of credit
Planned for redemption
(planned for redemption in the given year, outstanding balance at end of period)
Bank loans
Bonds3M WIBOR + 2.5−4.6pp Fixed: 3.0-4.5 pp
% 1M/3M WIBOR + 1.0−2.25pp1M/3M EURIBOR + 2.2−2.4pp
%
Liabilities under bank loans and bonds*
* Nominal value.
PLN 682m, including PLN 240m available also in EUR
in PLN: PLN 1,227min EUR: PLN 85m
Net debt/equity: 1.1xNet debt/cash EBITDA: 2.1x
42
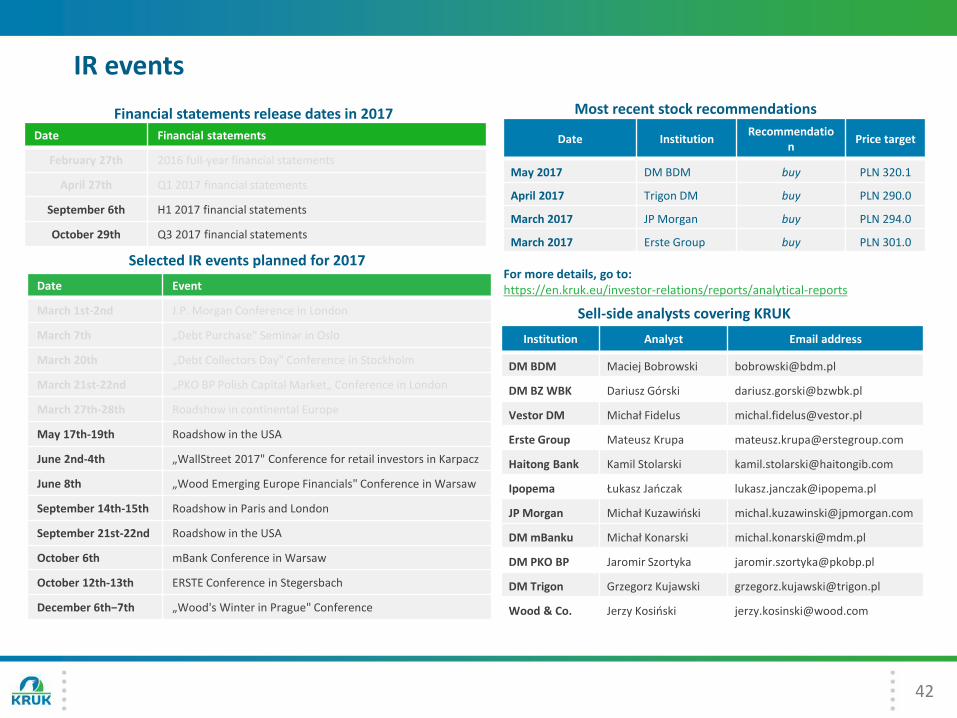
IR events
Institution Analyst Email address
DM BDM Maciej Bobrowski [email protected]
DM BZ WBK Dariusz Górski [email protected]
Vestor DM Michał Fidelus [email protected]
Erste Group Mateusz Krupa [email protected]
Haitong Bank Kamil Stolarski [email protected]
Ipopema Łukasz Jańczak [email protected]
JP Morgan Michał Kuzawiński [email protected]
DM mBanku Michał Konarski [email protected]
DM PKO BP Jaromir Szortyka [email protected]
DM Trigon Grzegorz Kujawski [email protected]
Wood & Co. Jerzy Kosiński [email protected]
Sell-side analysts covering KRUK
Date InstitutionRecommendatio
nPrice target
May 2017 DM BDM buy PLN 320.1
April 2017 Trigon DM buy PLN 290.0
March 2017 JP Morgan buy PLN 294.0
March 2017 Erste Group buy PLN 301.0
Most recent stock recommendations
Selected IR events planned for 2017For more details, go to:https://en.kruk.eu/investor-relations/reports/analytical-reportsDate Event
March 1st-2nd J.P. Morgan Conference in London
March 7th „Debt Purchase" Seminar in Oslo
March 20th „Debt Collectors Day" Conference in Stockholm
March 21st-22nd „PKO BP Polish Capital Market„ Conference in London
March 27th-28th Roadshow in continental Europe
May 17th-19th Roadshow in the USA
June 2nd-4th „WallStreet 2017" Conference for retail investors in Karpacz
June 8th „Wood Emerging Europe Financials" Conference in Warsaw
September 14th-15th Roadshow in Paris and London
September 21st-22nd Roadshow in the USA
October 6th mBank Conference in Warsaw
October 12th-13th ERSTE Conference in Stegersbach
December 6th−7th „Wood's Winter in Prague" Conference
Financial statements release dates in 2017
Date Financial statements
February 27th 2016 full-year financial statements
April 27th Q1 2017 financial statements
September 6th H1 2017 financial statements
October 29th Q3 2017 financial statements
KRUK S.A.ul. Wołowska 8
51-116 Wrocław, Polandwww.kruksa.pl
Investor Relations: [email protected] investors: www.kruksa.pl/dla-inwestora