Embed Size (px)
DESCRIPTION
Present studies were undertaken during kharif seasonof 2009 at the Students’ Research Farm, Department ofAgronomy, Punjab Agricultural University, Ludhiana. Thistract of India falls under Trans-Gangetic Agro-climatic Zonewith sub-tropical climate. The soil of the experimental fieldwas loamy sand in texture and alkaline in reaction (pH 8.1).The soil tested low in organic carbon (0.30%), availablenitrogen (145.63 kg ha-1), medium in available phosphorus(12.70 kg ha-1) and available potassium (189.66 kg ha-1).The experiment was conducted in split plot design withthree replications comprising of three residue levels {full(RF), half (RH) and no residue (RO)} in main plots and fournitrogen levels {125% N (N125), 100% N (N100), 75% N (N75)and 50% N through inorganic source+ 50% N through FYM(N50 + N50 FYM)} in sub plots. The residues of precedingwheat crop were kept as per treatments (full, half and noresidue) in main plots and these were turn down intoexperimental field with rotavator on April 21, 2009. The cropvariety ‘SL 525’ was sown on June 15, 2009 and harvestedon October 28, 2009. Recommended dose of nitrogen dosefor soybean is about 32 kg N ha-1. The total amount of rainfallreceived during crop season was 901.7 mm. The crop wasraised as per the package of practices of Punjab AgriculturalUniversity, Ludhiana. Chemical analysis of seed, straw andsoil were conducted after the harvest of the crop usingstandard analytical methods.Different residue management practices did notinfluenced the percentage of N, P and K content in seedand straw and total uptake. Similarly nitrogen levels of N100and N125 did not showed any superiority in terms of totaluptake of P and K and soybean seed and straw yield, butthe integrated use of chemical fertilizer and Farm YardManure (N50 + N50 FYM) resulted significantly higher thannitrogen level of N75.
Citation preview

Volume 39 Number 1 June 2012

INDIAN ECOLOGICAL SOCIETY(www.indianecologicalsociety.com)
Founder President: A.S. Atwal(Founded 1974, Registration No.: 30588-74)
Registered OfficeCollege of Agriculture, Punjab Agricultural University, Ludhiana – 141004, Punjab, India
(e-mail : [email protected])
Advisory Board
B.V. Patil P.S. Mihas T.P. RajendranC. Devakumar Asha Dhawan A.S. Sidhu
Executive CouncilPresident
G.S. Dhaliwal
Vice-Presidents
S. Geetha S.K. Singh S.G. Bhave G.T. Gujar
General Secretary-cum-Managing Editor
A.K. Dhawan
Joint Secretary-cum-Treasurer
Vijay Kumar
Councillors
R. Peshin P.T. Patel D. Jena V. Durga RaniA.K. Sharma A. Shukla S. Chakraborti Haseena Bhaskar
Members
T.R. Sharma M.P. Rajanna A.P. Singh S.B. DasS.K. Raina K.S. Shylaraj B. Mandal Veena Khanna
Editorial Board
Associate Editors
Sanjeev Chauhan S.S. Walia Vikas Jindal G..K. Taggar
Editors
R.K. Pannu S.K. Bal G. Hemalatha V. KaulKiran Bains J. Mukerjee T.V.K. Singh T.R. SharmaV.K. Patil A.P. Singh M.P. Rajanna S.B. DasB. Mandal K.S. Shylaraj
The Indian Journal of Ecology is an official organ of the Indian Ecological Society and is published six-monthly in June and December. Research papers in all fields of ecology are accepted for publication fromthe members. The annual and life membership fee is Rs (INR) 500 and Rs 7500, respectively within Indiaand US $ 60 and 300 for overseas. The annual subscription for institutions is Rs 2000 and US $ 300 withinIndia and overseas, respectively. All payments should be by demand draft drawn in favour of the IndianEcological Society payable at Ludhiana.

Indian J. Ecol. (2012) 39(1)Indian Journal
of Ecology
CONTENTS
Tree-ring Width of Teak (Tectona grandis L. F.) and Its Relationship with Rainfall and Temperature 1Satish Kumar Sinha
Land Transformation and Urban Sprawl Mapping Using Remote Sensing and GIS Technologies -A Case Study of Amritsar City, India 6Minakshi*, N.S. Tur, Amardeep Singh, Deepak Mehra, Harpinder Singh, Virrat Devaser and Rajneesh Kumar
Agro-Climatic Resource Inventory Characterization of Punjab State in Spatial Domain 11S.K. Bal, J. Mukherjee, Gurjot Singh, Anil Sood, B.V. Choudhury Harpreet Singh and Prabhjyot Kaur
Economic Impact of Insecticide Resistance Management (IRM) strategies in cotton in Muktsar district (Punjab) 18A.K. Dhawan, Vijay Kumar, Amardip Singh, Jasbir Singh and Amrik Singh
Effect of Foliar Feeding of GA3, Triacontanol and Calcium Salts on Shelf-Life in Kinnow Mandarin 23Tanjeet Singh Chahal, J. S. Bal and Kiran Kour
Effect of Sodium Sulphite-Microwave Pretreatment on Paddy Straw Digestibility 27Urmila Gupta Phutela, Karamjeet Kaur and N.K. Khullar
Evaluation of Quality Parameters of Low Alcoholic, Self Carbonated Fermented Beverage 32P. Sahota, G. Pandove and T.S. Dhillion
Impact of a Paper Mill on Surrounding Epiphytic Lichen Communities Using Multivariate Analysis 38Pulak Das, Santosh Joshi, Jayashree Rout and D.K. Upreti
Effect of pH upon Copepoda and Cladocera under Laboratory Conditions 44C.B. Tiwary and Kamlakant Thakur
Diversity of Molluscan Fauna Inhabited by River Chenab-fed Stream (Gho-Manhasan) 48K.K. Sharma and Samita Chowdhary
Diurnal Variation of Phytoplankton in the Kali Estuary, Karwar, West Coast of India 52U.G. Naik, V.V. Nayak and N. Kusuma
Heavy Metal Content in Soils and Crops Irrigated with Untreated Sewage Water in Sangrur District of Punjab 58M.P.S. Khurana, Kuldip Singh and Dhanwinder Singh
Interactive Effect of Cobalt, Boron and Molybdenum on Yield Attributes of Pea (Pisum sativum L.). 63D. K. Singh, P. Kumar and S.K. Singh
Micro-nutrient status of pear orchards in Kashmir 67M. A. Dar, J. A. Wani, S.K. Raina, M.Y. Bhat and M.A. Malik
Evaluation of a Customized Fertilizer on Wheat 71B.S. Sekhon, Satwinderjit Kaur, and Pritpal Singh
Effect of Organic Nitrogen Management on Yield and Quality of Produce in Rice–Vegetable based Cropping System 76R. N. Meena and Kalan Singh
Effect of Biofertilizers on Yield and Quality Traits of Cabbage (Brassica oleracea var. capitata L.) 82N.S. Gill, J. S. Bal and D. S. Khurana
Effect of Nitrogen Levels, Cultivars and Weed Control Treatments on Smothering Potential of CanolaGobhi Sarson (Brassica napus L.) 86Lovreet Singh Shergill, B. S. Gill and P. S. Chahal
Vertical Distribution of Readily and Slowly Available Potassium in a Typic Haplustept under DifferentCropping Sequences 92H.S. Jassal, Raj Kumar, Kuldip Singh and N.S. Dhillon

CONTENTS
Forms and Quantity-Intensity Parameters of Potassium Applied to Wheat under Temperate Conditions of Kashmir 98J.A Wani, M.A.Malik, M.A. Dar, Farida Akhter and M.A. Bhat
Evaluating Impact of Watershed Development Programme on Land Resources in Shiwalik Hills of J&K 102Narinder Deep Singh
Nitrogen and Spacing Requirements of Promising Hybrids of Indian Mustard (Brassica juncea L. Czern & Coss) 108Parminder Singh Sandhu, S.S. Mahal and Virender Sardana
Studies on Growth, Yield and Yield Attributes of Wheat-Mentha Intercropping System in Relation toPlanting Methods and Nitrogen Levels 112Sumedh Chopra, Jaspal Singh and Satpal Singh
Evaluation of Bt Cotton as an Integral Component of Integrated Pest Management 118Vikas Jindal, Naveen Aggarwal and Vikram Singh
Farmers perceived constraints in the uptake of cotton IPM practices 123Rajinder Peshin, A.K. Dhawan, Kamaldeep Singh and Rakesh Sharma
A Case-Study of Two Sunscreens that May Prevent Apoptotic Sunburn 131Chanda Siddoo Atwal
Melia dubia: A Potential Species for Agroforestry Under Different Agro-Climatic Conditions of Haryana State of India 135Jagdish Chander
Response of Potting Media and Sunshine on Bougainvillea Cultivars 138Ravipal Singh and R.K. Dubey
Efficient In vitro Sterilization Technique for Micropropagation of Banana (Musa acuminata) cv. ‘Grand Naine’ 141Pooja Manchanda, Ajinder Kaur and S.S. Gosal
Effect of Some Bio-pesticides and Chemical Pesticides on Survival of Larval Parasitoid Bracon hebetorSay (Hymenoptera: Braconidae) 143Lakshman Chandra Patel and Anirudhya Pramanik
Adsorption and Leaching Behaviour of Sulfosulfuron 145S. K. Randhawa and Amandeep Singh Brar
Screening of Seed Sources and Development of Powdery Mildew of Dalbergia sissoo Roxb. 148K.S. Ahlawat, J.C. Kaushik, O.P. Lathwal and Avtar Singh
Management of root-knot Nematode Meloidogyne javanica in Pigeonpea through Seed Treatment 151Tarique Hassan Askary
Standardization of Method for Soil Arthropods Extraction by Tullgren Funnel 153Romila Akoijam and Badal Bhattacharyya
Strategies to Enhance Fish Production from Ox-bow Lakes of Muzaffarpur, Bihar 156Sujeet Rajak, Arpita Sharma, S.K. Chakraborty, S.C. Rai, Dilip Kumar and A.K. Jaiswar
Effect of Residue Management Practices and Nitrogen Levels on Soil Properties, Yield and Uptakeof Nitrogen, Phosphorus and Potassium in Soybean Sown after Preceding Wheat Crop 158K. S. Saini and S. K. Chongtham
Sowing Time, Seed Rate and Planting Method effect on Nitrogen Uptake and Quality of Bread Wheat 160Balkaran Singh, R.S. Uppal and R.P. Singh
Performance of Direct Seeded Rice as Influenced by Variety and Date of Sowing 164U. S. Walia, S. S. Walia and Shelly Nayyar
Effect of Fruit Maturity and Temperature on Seed Germination in Summer Squash (Cucurbita pepo L.) 167Namarta Gupta, S.S. Bal and H.S. Randhawa
Evaluation of N, P, Zn Complex Fertilizer for its Efficiency using Wheat as Test Crop in Indo–Gangetic AlluvialSoils of Northwestern India 169B.S. Brar, D.S. Benipal and Jagdeep Singh
Effect of Bio-fertilizers in Combination with Chemical Fertilizers on Growth and Yield of Broccoli 172(Brassica oleracea Var. italica Plank)Pradeep Kumar, Sanjay Kumar, Yogesh Chandra Yadav and Adesh Kumar
Attempts are going on to retrieve climatic information
using growth rings of trees from several sites in India. Beingdominated by the tropical monsoon and influenced byoceanic climate, the Western Ghats of Karnataka is an
important site for dendroclimatic analysis. It is estimatedthat about twenty five percent of the total number of treespecies produce growth rings (Chowdhury, 1939, 1940).
Two taxa, teak (Tectona grandis) and toon (Toona ciliata)exhibit datability of growth rings to the exact years of theirformation, which is a prerequisite for dendrochronology.
Amongst these two taxa, teak is widely distributed in thepeninsular region of the country. It has been studied from adendrochronological point of view at several sites viz., from
moist deciduous forest in Thane, Maharashtra (Pant andBorgaonkar, 1983; Ramesh et al., 1989; Bhattacharyya etal.,1992), dry deciduous forest in Korzi, Andhra Pradesh
(Yadav and Bhattacharyya, 1996), Western ghats of Kerala(Bhat and Priya, 1997; Bhattacharyya et al., 2007), upperNarmada river basin in Central India (Wood, 1996) to dry
deciduous forests of Madhya Pradesh (Shah et al., 2007;Somaru et al., 2008) and dry deciduous forests of Karnatakaand Maharashtra (Sinha et al., 2009, 2011). These
exploratory studies revealed that tree rings of teak could bevaluable proxy data for dendroclimatic analysis, especiallymonsoon precipitation. Western Ghats of Karnataka are
well known for the best teak growing sites in India. Shimogaand Mundagod falling in this region and with a distance of200 km between them were selected for the present study.
Shimoga is a tropical moist deciduous forest and Mundagodis a dry deciduous forest. No detailed tree-ring analysis
Tree-ring Width of Teak (Tectona grandis L. F.) and Its Relationshipwith Rainfall and Temperature
Satish Kumar SinhaDendrochronology Laboratory, Wood Properties and Uses Division,Institute of Wood Science & Technology, Bangalore-560 003, India
E-mail: [email protected]
Abstract: Tree-ring chronologies of teak (Tectona grandis L.) at two sites, Mundagod and Shimoga, in Western Ghats of Karnataka wereestablished. Both sites are influenced by climate varying with altitude and proximity to the Arabian sea and the equator. Mundagod is a drydeciduous forest area in North Karnataka where the south-west monsoon is crucial for the main rainy season. Shimoga is a moistdeciduous forest area in Central Karnataka dominated by both south-west and north-east monsoon. According to our comparison of thetree-ring chronologies with the respective climate data, teak growth at Mundagod is negatively correlated with October rainfall of previousyear and positively correlated with June to August rainfall of current year. At Shimoga, however, teak growth is positively associated withDecember rainfall of previous year and May to August rainfall of current year. Temperature during the pre-monsoon season, plays animportant role for the onset of cambium activity at both sites.
Key Words: South-West monsoon, Tree ring, North-East monsoon, Teak
has been reported so far on this tree species in this area. In
this paper, an attempt has been made to analyze the growthrings of teak (Tectona grandis) in relation to rainfall andtemperature at these two sites of Western Ghats.
MATERIAL AND METHODS
Study Area and Sample Collection
Ten increment core samples were collected, using anincrement borer, at diameter at breast height (DBH) of teaktrees in Shimoga (13o56’ N lat. and 75o38' E long.) in October
2007 and ten discs were collected in Mundagod in April1999 from the base of felled trees at Yellapur Karnataka(140 58' N lat. and 750 1’E long.).
Tree-ring Data
The surfaces of the twenty samples were sanded withdifferent grades of sand papers to expose the growth ringsand prepare the wood for microscopic analysis. In the case
of discs, two radial strips of 1.5 cm width were cut fromopposite sides of each disc, which included all the ringsfrom pith to bark. After counting the rings, ring-widths were
measured along two radii of each disc and a single radiusof each core sample to the nearest 0.01 mm under a Leicastereo-zoom microscope with a linear stage (Velmex)
interfaced with a computer system to record themeasurements. Each ring of these radii was dated to thecalendar year of its formation using cross-dating technique
(Stokes and Smiley, 1968). These measurements anddates were re-checked using the computer programme
Indian J. Ecol. (2012) 39(1) : 1-5Indian Journal
of Ecology

2
COFECHA (Holmes, 1983) for any error in themeasurement or dating of the samples. Finally, corrected
measurements of tree-ring sequences along 30 radii wereselected for further analysis.
The ring-width data series of two sites were
standardized using a negative exponential method ofARSTAN programme (Cook, 1985). After standardization, aring-width index chronology was prepared from each ring-
width series from both the sites. Indices were derived bydividing the measured ring-width data with thecorresponding predicted value of ring-width for each year to
extract useful climatic signals. The chronologies of bothsites contain significant autocorrelation at lags of 1-2 years,which were removed from each ring-width series by
autoregressive modeling. All individual index series wereaveraged from both the sites to form a site- tree-ring-width-index chronology. The prepared mean tree-ring-width-index
chronology of Mundagod and Shimoga extend from AD1941-1999 and AD 1947-2007, respectively (Fig. 1).
The chronology considered suitable for climatic study
should have good correlation both between trees and withintrees, high mean sensitivity, high standard deviation, highvalues of common variance and a high signal to noise ratio.
All these statistics considered for the evaluation of tree ringchronology are shown in Table 1.
Mean sensitivity is a measure of the relative difference
in width between consecutive rings (Fritts, 1976). Its valueranges from 0 (indicating no change in ring-width from oneyear to the next) to 2 (where a zero value occurs next to a
non-zero one in a time series, i.e., occurrence of missing
Fig. 1. Mean ring-width index chronology of Tectona grandis at Mundagod and Shimoga in Western Ghats of Karnataka
ring). High value of mean sensitivity is desirable for ring-
width series as it indicates the presence of considerablehigh-frequency variance (Fritts, 1976). Autocorrelation is theassociation between ring width for the year (t-1) and the
subsequently formed ring t, t+1, to t+k, which can perturbthe casual relationship between climate and tree growth.The Expressed Population Signal (EPS) is a measure ofthe correlation between the mean chronology of samples
from each site and the population from which they are drawn.Wigely et al. (1984) suggest that chronologies with EPS e”0.85 can be accepted as reliable chronology for
dendroclimatic analysis. Strength of signal between trees(common variance) has been estimated by calculating thesignal to noise ratio (Wigley et al., 1984). The value of signal
Table 1. Selected statistics of tree-ring index chronologies ofTectona grandis L. at Mundagod and Shimoga.
Mundagod Shimoga
Chronology time span AD 1941-1999 AD 1947-2007
Number of trees (radii) 10 (20) 10 (10)
Mean tree-ring width (mm) 2.14 3.16
Standard deviation 0.320 0.210
Mean sensitivity 0.219 0.258
Autocorrelation order 1 0.024 0.020
Common interval time span 1944 - 1999 1960 - 2007
Number of trees (radii) 9 (18) 8 (8)
Mean correlation between trees 0.25 0.48
Signal-to-noise ratio 5.90 2.69
Expressed population signal 0.86 0.73
Variance explained % in first 30.95 64.84
eigenvector
Satish Kumar Sinha

3
to noise ratio greater than one indicates the more commonuseful climatic signal. The common variance is a mean of
the correlation coefficients of all possible pairwisecombinations of ring-width index series over the commoninterval period. This value indicates the variance owing to
the common forcing factor of a site, which might be a climaticeffect experienced by the all trees over a wide area.
Climatic Data
The mean monthly temperature and rainfall data of two
meteorological stations namely Belgaum and Shimoga,close to the tree-ring sampling sites have been used in theresponse function analysis for Mundagod and Shimoga
tree-ring samples. The records extend from AD 1941-1999and AD 1947- 2007 for Mundagod and Shimoga respectively.
Response Function Analysis
Climate and tree-growth relationship is assessed by
means of response function analysis using a computerprogramme RESPO (Fritts, 1976). This procedure is amultiple regression analysis in which monthly climatic
parameters (temperature and rainfall) are predictors andtree-ring parameters are predictants. The resultingregression equation quantifies the response of the tree to
variations in the most important climatic variables. Monthlymean temperature and rainfall at Mundagod and Shimogawere entered as predictor variables and the tree-ring indices
as the predictant variables. The analyses were based onthe time period 1941-1999 and 1947 to 2007 for Mundagodand Shimoga that were common to both the meteorological
and tree-ring data, respectively.
RESULTS AND DISCUSSION
The chronology statistics (Table 1) suggested that teak
at both the sites exhibit moderately high values of standard
deviation, mean sensitivity, EPS, common variance and
signal to noise ratio, there by proving suitability of these
chronologies for dendroclimatic analysis. In case of
Mundagod, climatic data shows that April (28.02oC) and
December-January (21.9 oC) are the hottest and coldest
months, respectively. July receives the highest rainfall
(389.2mm) and January-February are the driest months
having only 0.75 mm of precipitation (Fig. 2). Similarly in the
case of Shimoga, April (27.83 oC) and December-January
(21.7 oC) are the hottest and the coldest months, respectively.
July receives the highest rainfall (1983.59 mm), October to
December months experience scanty rain from north-east
monsoon and January-February are the driest months
having only 21.45 mm of precipitation (Fig. 3).
Tree Growth and Climate Relationship
The initiation of growth period in teak starts around
March and reaches a peak in June- July and by the firstweek of October there is no wood formation. Shedding ofleaves starts by December and by first week of February, all
trees are leafless (Chowdhury, 1939, 1940; Rao and Dave,1981; Priya and Bhat, 1999). In constructing the responsefunctions, a total of 26 variables were used as predictor
variables, which means 13 for temperature and 13 forrainfall from previous October (end of previous growingseason) to the current October (end of current growing
season). Since many of climatic variables are highlyintercorrelated, principle components for 26 data serieswere obtained. Ring width index chronologies of Mundagod
and Shimoga were regressed on the climate principalcomponents to obtain response function coefficients. Figure4 shows the standardized regression coefficients for the
response functions on a monthly scale for the tree ringchronologies from Mundagod and Shimoga.
Analysis of tree-growth and climate relationship at
Mundagod revealed that June-August rainfall and March
Fig. 2. Mean monthly precipitation and temperature atMundagod based on the data from AD 1941-1999.
Fig. 3. Mean monthly precipitation and temperature at Shimogabased on the data from AD 1947-2007.
Relationship of Tree-ring Width with Weather Parameters

4
temperature were positively associated with tree-ring widthwhereas, October rainfall of previous year, April rainfall and
temperature of current year were negatively associated (Fig.4 a, b). Positive tree growth and climate relationship duringJune-August suggests that southwest monsoon rainfall
plays an important role in the growth of teak. October rainfallof the preceding year showed negative influence on treegrowth. This might be due to non-availability of moisture
and nutrients as meager rainfall may have eluviated thenutrients to the non-availability zone. A high temperatureduring March is required for the initiation of cambial activity
(Rao and Rajput, 1999). Increased temperature during thispre-monsoon month was also recorded to have animportant role in the initiation of cambial activity by
Bhattacharyya et al. (2007). The inverse relationship withApril rainfall and temperature might be due to a lower netphotosynthetic rate, presumably due to higher
evapotranspiration. During this month, precipitation is lessbut temperature is at its maximum level in this region (Fig.2). Thus, increased precipitation during a hot summer
accelerates the rate of evapotranspiration, which might havecaused a water stress for teak trees.
At Shimoga, December rainfall of the previous year,May-August rainfall and March-April temperature of currentyear were positively associated with ring width whereasJanuary rainfall was negatively associated (Fig. 4 c, d).Shimoga receives rainfall due to early south-west monsoon(May-August) and north-east monsoon (October-December). The positive relationship between tree growthand May-August rainfall of current year is due to the effect of
the early SW monsoon and December rainfall of previousyear might be due to the effect of late NE monsoon. The
inverse relationship with January rainfall may be due to thefact that during January, low rainfall may favour respirationover photosynthesis, as trees remain leafless and
photosynthesis is almost nil at that time, this might be thecause for lower tree growth. The positive correlation ofMarch-April temperature with tree growth indicates that warm
and dry conditions from March to April favours the initiationof cambial activity.
Tree-growth and climate relationship in Western Ghats
of Karnataka has great significance since it adds novel
information to the understanding of the temporal variability
in growth of teak with changes in climate. Mundagod and
Shimoga are two sites of Karnataka influenced by different
types of monsoon climate. Shimoga which is influenced by
two monsoons showed wider ring width in teak than
Mundagod which is influenced by only one monsoon. This
study substantiated that the pattern of ring width in teak
varies with the local climatic conditions of different sites.
ACKNOWLEDGEMENT
The present paper represents part of a research projectsponsored by the Ministry of Environment and Forests
(MoEF), Government of India. The author thanks Dr. H.P.Borgaonkar from Indian Institute of Tropical Meteorology,Pune, for assisting in tree ring sample analysis. Facilities
provided by Institute of Wood Science and Technology,Bangalore are gratefully acknowledged.
Fig. 4. Response function analysis of tree-ring chronologies of teak (Tectona grandis) at Mundagod and Shimoga using monthlytemperature and rainfall at Belgaum and Shimoga, respectively. Vertical bars indicate 95% confidence interval.
Satish Kumar Sinha

5
REFERENCESBhat, K.M. and Priya, P.B. (1997) Tree ring responses to physical
changes in climate in ring porous tropical hardwood-teak. In:Proc. IUFRO World Congress, Division 5, Pullman, USA.
Bhattacharyya, A., Yadav, R.R., Borgaonkar, H.P. and Pant, G.B.(1992) Growth-ring analysis of Indian tropical trees:dendroclimatic potential. Curr. Sci. 62 (11):736-740.
Bhattacharyya, A., Eckstein, D., Shah, S.K. and Chaudhary, V.(2007) Analyses of climatic changes around Parambikulum,South India, based on early wood mean vessel area of teak.Curr. Sci. 93 (8):1159-1164.
Chowdhury, K.A. (1939) The formation of growth rings in Indiantrees-I. Indian Forest Records 1-39.
Chowdhury, K.A. (1940) The formation of growth rings in Indiantrees-II. Indian Forest Records 41-57.
Cook, E.R. (1985) A time series analysis approach to tree ringstandardization. Dissertation, University of Arizona, Tucson,USA.
Fritts, H. C. (1976) Tree Rings and Climate. Academic Press, London,pp.567.
Holmes, R.L. (1983) A computer assisted quality control in tree-ringdating and measurement; Tree-Ring Bull. 43: 69-78.
Pant, G.B. and Borgaonkar, H.P. (1983) Growth rings of teak treesand regional climatology (An ecological study of Thane region).In: L.R. Singh, S. Singh, R.C. Tiwari and R.P. Srivastava (Eds),Environmental Management. Geog. Soc. Allahabad, India,pp.153-158.
Priya, P.B. and Bhat, K.M. (1999) Influence of rainfall, irrigation andage on the growth, periodicity and wood structure in teak(Tectona grandis). IAWA 20: 181-192.
Ramesh, R., Bhattacharya, S.K. and Pant, G.B. (1989) Climaticsignificance of D variations in a tropical tree species fromIndia. Nature 337: 149–150.
Rao, K.S. and Dave, Y.S. (1981) Seasonal variations in the cambial
anatomy of Tectona grandis (Verbenaceae). Nordic J. Bot. 1:535-542.
Rao, K.S. and Rajput, K.S. (1999) Seasonal behavior of vascularcambium in teak (Tectona grandis L.) growing in moistdeciduous and dry deciduous forests. IAWA Journal 20 (1):85-93.
Shah, S.K, Bhattacharyya, A. and Chaudhary, V. (2007)Reconstruction of June-September precipitation based on tree-ring data of teak (Tectona grandis L.) from Hoshangabad,Madhya Pradesh, India. Dendrochronologia 25: 57-64.
Sinha, S.K., Deepak, M.S. and Rao, R.V. (2009) Climatic responseof early wood mean vessel area of teak (Tectona grandisL.f.) from Shimoga of Central Karnataka. J. Ind. Acad. WoodSci. 6 (1 &2): 90-97.
Sinha, S.K., Deepak, M.S. Rao, R.V. and Borgaonkar, H.P. (2011)Dendroclimatic analysis of teak (Tectona grandis L.f.) annualrings from two locations of peninsular India. Curr. Sci. 100(1): 84-88.
Somaru, R., Borgaonkar, H.P. and Sikder, A.B. (2008) Tree-ringanalysis of teak (Tectona grandis L.F.) in Central India and itsprobable linkage with moisture fluctuation: A case study. J.Earth System Sciences 117 (5): 637-645.
Stokes, M.A. and Smiley, T.L. (1968) An introduction to tree-ringdating; The University of Chicago Press, Chicago.
Wigley, T.M.L., Briffa, K.R. and Jones, P.D. (1984) On the averagevalue of correlated time series, with applications indendroclimatology and hydrometeorology. J. Climate Appl.Meteorol. 23: 201-213.
Wood, M.L. (1996) Synoptic dendroclimatology in the upper Narmadariver basin- an exploratory study in Central India. MS thesis,University of Arizona.
Yadav, R.R. and Bhattacharya, A. (1996) Biological inferences fromthe growth climate relationship in teak from India. Proceedingsof Indian Academy of Science B 62(3): 233-238.
Relationship of Tree-ring Width with Weather Parameters
Received 10 August, 2011; Accepted 11 December, 2011
The shift of rural population to cities and towns for
livelihood is leading to unplanned growth of towns and cities.The pressure of an ever growing population becomes aburden on the limited civic amenities which are virtually
collapsing. Asymmetrical growth of urban centersconsumes agricultural land at their periphery. The outwardspread of cities is accompanied by many environmental
problems: changes in the land use patterns, fragmentationand destruction of wild life habitat, discharge of pollutedrunoff water into stream and surface water bodies, and
pollution of ground water resources. Besides taxing thegroundwater resources available for an urban centre, anincrease in the paved area severely reduces the ground
water recharge potential, leading to situations which maytruly be potential catastrophes. The current trend of spatialurban growth in most of the Indian cities is haphazard and
in an unplanned manner, particularly along the urban-ruralfringe. There is an obvious need for continuously monitoringthe phenomena of growth of cities/towns, and mapping
and analyzing the growth patterns (Farooq et al., 2008).Barnes et al. (2001) categorized the sprawls depending ontheir forms and patterns. This information is needed by the
urban administrators and planners so as to provide basicamenities and infrastructure for the complex urbanenvironment (Pathan et al., 1991; Mundia and Aniya, 2005;
Mahesh et al., 2008).
Mapping urban growth by conventional methods is too
Land Transformation and Urban Sprawl Mapping Using RemoteSensing and GIS Technologies - A Case Study of Amritsar City, India
Minakshi*, N.S. Tur, Amardeep Singh, Deepak Mehra, Harpinder Singh, Virrat Devaserand Rajneesh Kumar
Punjab Remote Sensing Centre, Ludhiana-141 004, India*E-mail: [email protected]
Abstract: Understanding of the growth dynamics of urban agglomerations is essential for ecologically feasible developmental planning.The inefficient and consumptive use of land and its associated resources is termed sprawl. By monitoring changes in the urban sprawlover a period of time, the impact of changing land use on land, ecology and environment system can be assessed. Mapping urban growthby conventional methods is too tedious and a slow process, and by the time information becomes available to planners, it is alreadyoutdated and redundant since the damage has already been done. Satellite remote sensing data and application of GIS technology providean alternative means of rapidly assessing the dynamics and development of sprawl so that timely action may be taken. The urban growthanalysis of Amritsar city was undertaken with an objective of studying the expansion of Amritsar city at the expense of fertile agricultureland. The study was carried out using panchromatic cartosat-1 data of 2.5 m spatial resolution and IRS P6-LISS 1V MX data of 5.8 m spatialresolution to delineate the extent, pace pattern and direction of growth of the city area of Amritsar with time. The urban area in Amritsarcity has increased almost three times since 1972. The rate of land consumption was substantially moderate till 2002 but after 2002witnessed a sharp increase in land consumption. It is also evident from the land use map for years 1972, 2002 and 2006 that the landconsumed for built up after 1972 was mainly agriculture land.
Key Words: Urban Sprawl, Remote Sensing, GIS, Amritsar, Land use
tedious and a slow process. Satellite remote sensing dataand application of GIS technologies provide an alternative
means of rapidly assessing the dynamics and developmentof sprawl so that timely action may be taken. Besides beingflexible and extensible, the datasets are easily rectified,
updated and may be used for other applications.Infrastructral development brings along negative impactson natural resources and ecology of the area and particularly
it matters most in agrarian state like Punjab (Narinder etal., 2011).
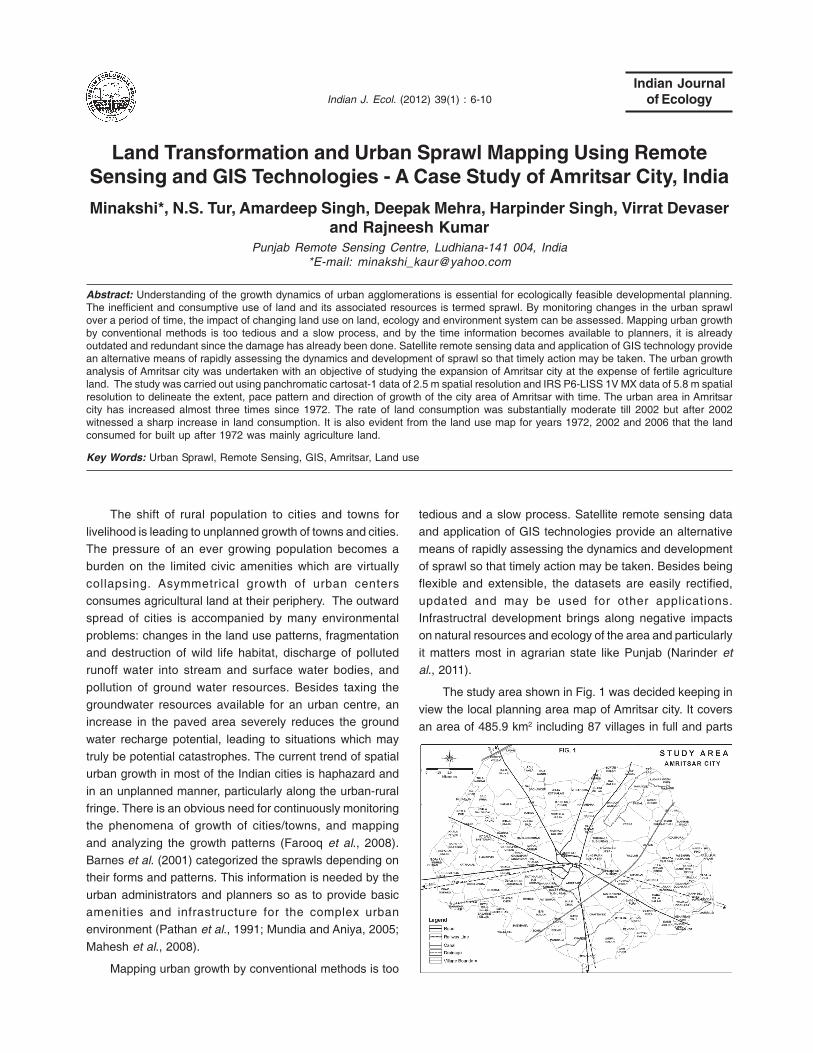
The study area shown in Fig. 1 was decided keeping in
view the local planning area map of Amritsar city. It coversan area of 485.9 km2 including 87 villages in full and parts
Indian J. Ecol. (2012) 39(1) : 6-10Indian Journal
of Ecology

7
of another 26 villages. These villages surround the Amritsarcity. Amritsar is located in Punjab state of India at
31°37’59.16" latitude 74°51’56.16" longitude. The objectiveof the project is to study the expansion of Amritsar city at theexpense of fertile agriculture land.
MATERIAL AND METHODS
Satellite Data Used
a) IRS 1C/1D LISS III multispectral data of 2002 withspatial resolution of 23.5 metres.
b) High resolution Cartosat I data (spatial resolution 2.5
metres) for the year 2005 and IRS P6 LISS IV digitaldata of 5.8 metres resolution for the year 2006.
c) Survey of India Toposheet for 1972.
d) Collateral population data from the governmentagencies, village boundaries from Director LandRecord.
The objective of the study was to map the land
transformation of agriculture land to built up land from 1972
to 2006. For mapping the extent of the urban area as it
stood at the 1972 level, survey of India Topographic map 44
I/14 was used. Apart from the extent of the urban area, this
has details of drainage, water bodies, rail and road network,
built up area and administrative boundaries. IRS IC/ID, LISS-
III multi spectral data of 2002 was used to map the extent of
sprawl for 2002. Similarly most recent built up was marked
from Cartosat data and IRS P6, LISS IV digital data of 2006.
The study area was marked using the local planning area
map of Amritsar city. Base map of the study area showing
permanent features like road, railway and canal was
prepared. All the built up areas were marked with in the
study area using the available information for the year 1972
from topographic maps and digitized in Arc-Info 9.1 GIS
software. With in the same study area built up was
interpreted on line from March, 2002 data of IRS IC/ID-LISS-
Land Transformation and Urban Sprawl Mapping of Amritsar City

8
III. Similarly IRS P6 LISS IV data of 2006 was also interpretedto update the built up for 2006. The fine resolution Cartosat
I data for the year 2005 facilitated clear demarcation of builtup areas and agriculture areas which was other wise notpossible from LISS III data of spatial resolution 23.5 metres.
The maps generated for years 1972, 2002 and 2006 wereoverlaid in Arc GIS to map the urban sprawl and landtransformation from agriculture to build up. The area
statistics of built up land with in the study area for thesethree years was calculated. The methodology followed hasbeen depicted in Fig. 2.
RESULTS AND DISCUSSION
Urban sprawl refers to the expansion of town or city asa result of natural population and influx of migrants due toindustrial or commercial purpose. Physical growth of
Amritsar city from the year 1972 to 2006 has been studiedwith the help of survey of India topographic maps (1972)and multi date remote sensing data viz. IRS IC/ID LISS III.
March 2002 and Cartosat data of 2006 (Fig. 3) employingboth visual and digital technology and supported by groundcheck. Land transformation map of Amritsar (Fig. 4) was
prepared by overlaying the land use maps of 1972, 2002and 2006 using the ARC-INFO GIS software. In 1972, theurban area of Amritsar consists of old, thickly populated
core constituting the ancient city confined mostly with in thedouble wall prepared at the time of Maharaja Ranjit Singh.
Table 1. Built up and cultivated area around Amritsar City (1972-2006)
Year Built up Cultivated Per cent increase
area (km2) area (km2) in built up
1972 49.43 436.48 -
2002 127.29 358.62 157.5
2006 142.01 343.90 187.3
* Total study area of 485.91 km2.
This core area is almost completely covered and thereappears to be no patch available for any kind ofdevelopment. The city has a peculiar example of planning
system with unique areas called katras. The katras are selfstyled residential units that-provided unique defencesystem. To the south east of Amritsar railway station is the
dusty and congested old city crowded with narrow zig zagstreets with mixed commercial and residential structures.Golden temple is in the heart of the old city and the walls of
Maharaja Ranjit Singh time had been demolished to a ringroad around the city. The other rural built ups are scatteredaround the city with in the study area. The area statistics of
built up land with in the study area for the year 1972 was
commuted and amounts to be 49.43 km2 (Table 1). TheIRS-IC/ID LISS-III, March 2002 data was used to map the
built up area with in the area of interest for the year 2002.
Table 2. Urban population in Amritsar city during 1971-2001
Year Population Decadal per cent
increase in population
1971 434951 -
1981 594844 36.8
1991 708835 19.2
2001 1003917 41.6
Source: Economic Advisor, Statistical Abstract of Punjab, 2007.
The general trend of growth from 1972 to 2002 was
observed mainly along the transportation corridorsconnecting Amritsar to Delhi and Pathankot. The increasein city area through incorporation of surrounding rural areas
in the city limits has been a continuing process. However itcould not develop much towards western side due to theproximity of the Indo-Pak border. But after wars in 1965 and
1971, military camps were established in the western sideof the city. The new urban areas are being developed to theNorth – East part of the city like Rambagh, Mall and other
posh areas of Amritsar. Part of many surrounding villageswere covered by built up land in 2002 e.g., Verka, Saidpura,Naushehra, Nangli, Kaler, Kambo, Kala Ghanupur, Gumtala,
Mahal, Hair, Bal, Kathanian, Hamidpur, Vadala Guru,Khurmanian, Baser Ke, Guru Wali, Fatehpur, Sultan Wind,Rakh Sukar Garh, Tung Bala, Tung Paian, Miran Kot,
Nizarpura and Kot Khalsa. In the year 2002, the total builtup land with in the study area was calculated to be 127.29km2, almost an increase of 157.5 per cent with in a time
span of thirty years. The cartosat data of 2006 depicts therecent picture of urban development (Fig. 3) and accordingto this data the total built up land with in the study area
comes out to be 142.01 km2 (an increase of 187.3 per centin thirty four years). The land transformation (Fig. 4) showsthat after 2002 the pattern of growth is mainly high density
ribbon sprawl towards north western part along Ajnala andVerka roads. According to census 2001, the total populationof Amritsar city has been upto 1,003917, is much more than
the total population of the city in 1971 (Table 2). There is apopulation increase of 130.8 per cent in three decades.This has been accompanied by an unprecedented wave of
development. During the last thirty four years, on an average2.72 km2 of area per year is paved over or otherwiseconverted to urban human uses. Not with standing the poor
pollution control facilities, every person added to thepopulation, consumes additional resources and createsadditional waste. All this has resulted in decline in the quality
Minakshi, N.S. Tur, Amardeep Singh, Deepak Mehra, Harpinder Singh, Virrat Devaser and Rajneesh Kumar

9Land Transformation and Urban Sprawl Mapping of Amritsar City

10
of life, especially for the growing development. One of theprimary issues is the loss of prime agricultural land due to
urbanization.
The study reveals that the urban area has increasedalmost three times since 1972. The rate of land consumption
was substantially moderate till 2002 but after 2002witnessed a sharp increase in land consumption. It is alsoevident from the land use map for year 1972, 2002 and
2006 that the land consumed for built up after 1972 wasmainly agriculture land. Hence the fertile crop land is beingused extensively for commercial, industrial, residential,
educational and recreational establishments.
The satellite data and GIS technology are very well usedfor broad land use/land cover mapping with respect to
agricultural and urban areas. Urban fringe development ofconstruction sites are easily delineated on satellite databecause of their tone, texture and pattern. The urban sprawl
maps generated using GIS technologies are very useful forother applications. As observed the agricultural land is beingconsumed at alarming rate for unplanned development of
urban regions. There is a need to balance the presentrequirements of land against future needs. Preservingagricultural land in the fringe areas of expanding cities is
vital for preserving and maintaining open spaces and
thereby, environmental quality.
REFERENCESBarnes, K.B., Morgan, III J., Roberge, M.C. and Lowe, S. (2001)
Sprawl development; its pattern, consequences andmeasurement, Towson University Retrieved June 27, 2006from http:// Chesapeake.towson.edu/landscape/urban sprawl/download/sprawl–while–paperPDF
Farooq, S. and Ahmad, S. (2008) Urban sprawl development aroundAligarh city: A study aided by satellite remote sensing and GIS.J. Ind. Soc. Rem. Sens. 36:77-88.
Pathan, S.K., Shukla, V.K., Patel, R.G., Patel, B.R. and Mehta, K.S.(1991) Urban land use mapping. A case study of Ahmedabadcity. J. Ind. Soc. Rem. Sens. 19: 95-112.
Economic Advisor, Punjab. (2007) Statistical Abstract of Punjab,Economic and Statistical Organisation, Govt. of Punjab.Publication No. 915.
Mundia, C.N. and Aniya, M. (2005) Analysis of land use/coverchanges and urban expansion of Nairobi city using remotesensing and GIS. Int. J. Rem. Sens. 26:2831-2849
Jat, M.K., Garg, P.K. and Khare, Deepak (2008) Monitoring andmodelling of urban sprawl using remote sensing and GIStechniques. Int. J. App. Earth Observation and Geoinformation10:26-43.
Tur, N.S., Singh, A., Mehra, D., Singh, H., Minakshi, Kumar, R. andDevasar V. (2011) Mapping of urban sprawl around SahibzadaAjit Singh Nagar. Indian J. Ecol. 38(2): 155-162.
Minakshi, N.S. Tur, Amardeep Singh, Deepak Mehra, Harpinder Singh, Virrat Devaser and Rajneesh Kumar
Received 8 August, 2011; Accepted 4 January, 2012

Agro-Climatic Resource Inventory Characterization of Punjab Statein Spatial Domain
S.K. Bal*, J. Mukherjee, Gurjot Singh, Anil Sood1, B.V. Choudhury1,Harpreet Singh and Prabhjyot Kaur
Department of Agricultural Meteorology, Punjab Agricultural University, Ludhiana 141 004, India1Punjab Remote Sensing Centre, Ludhiana, India
*E-mail: [email protected]
Abstract: Agro-climatic resource inventory characterization in spatial domain can play a great role in site specific suitability of sustainableagricultural crop production. An attempt has been made for creation of spatial database and zoning of agro-climatic resources of Punjabin spatial environment using GIS approach. This zoning approach divided Punjab into five zones for temperature and seven zones forLength of Growing Period (LGP). These newly drawn zones reflect that the average annual temperature of the state varies from 21-26OC,with LGP ranging from < 60 to 180 days. Temperature and LGP variation in the entire state depicted a reverse trend, being maximumtemperature in south-western part with lowest LGP while lowest temperature being recorded in the northern most parts with highest LGP.Amongst all thermal zones, area under annual average temperature 23-24 °C was highest (58% of total geographical area) followed byannual average temperature 24-25 °C and the least area was under annual average temperature 21-22 °C. Similarly, the state has highestarea (29.5%) where LGP varies from 120-140 days (L3 zone) followed by L4 and L5. Less than 1 per cent of the total area of the state hasLGP of >160 days. Overlaying of thermal and LGP layers further resulted into 7 thermal-LGP zones. Maximum area of the state (36% oftotal geographical area) was under annual average temperature 23-24OC & LGP 120-140 days zone followed by zone with annualaverage temperature 23-24OC & LGP 100-120 days.
Key Words: Agro-climatic resources, ArcGIS, LGP, Punjab, Thermal zone
The survival and failure of particular land use or farming
system in a given region heavily relies on careful
assessment and adoption to location specific agro-climatic
resources. Temperature (thermal) and moisture regimes
are the two most important components represent agro-
climatic resources of an area. Plants can grow and thrive
only between certain limits of temperature (upper, lower
and optimal) and that limits also differ from species to
species and even within a given species from one stage of
life cycle to next (Schulze et al., 1997). Availability of soil
moisture also plays a great role in deciding the length of
crop growth periods. A general characterization of moisture
conditions is achieved through the concept of length of
growing period (LGP), i.e., the period during the year when
both moisture availability and temperature are conducive to
crop growth. Farmers’ cropping strategies are undoubtedly
influenced by the variability they have experienced in the
onset of the rainy season.
A practical zoning approach of agro-climatic regionsthus arises, based on thermal and moisture regimes
because climate represented by similar thermal andmoisture regimes forms uniform geographic areas capableof supporting agricultural developmental planning and other
interventions (FAO, 1976). Each zone has a similarcombination of constraints and potentials for land use andserves as a focus for formulation and implementation of
location specific recommendations in order to improve theexisting land use situation, either through increasingsustainable production system or by arresting further
degradation of productive landmasses.
In the post green revolution era, it is impossible forIndian Punjab, to increase financial returns by expanding
cropped area as there is little scope left for further increasein horizontal expansion of cultivable area. As a byproduct ofgreen revolution, multiple problems have surfaced and are
now confronting agricultural productivity and sustainabilityof natural resources particularly due to large scale adoptionof high input intensive mono-cropping without due
consideration to site suitability based on agro-climatic andagro-physical resource inventory. This has led to substantialchanges in the growth of agriculture and land use/land cover
and ultimately the change in global climate contributingfactors have led to change in climate at various places ofPunjab in the recent past (Hundal and Kaur, 2002;
Mukherjee and Bal, 2003).
In the past, agro-climatic resource inventorycharacterization for the state of Punjab involved manual
integration of data (Mavi, 1984). Manual integration is timeconsuming, labour intensive and generally, lack in providinginformation in time space dimension for a large region like
the whole state of Punjab. As a result, large amount ofclimatic data and other agro-physical inputs could not be
Indian J. Ecol. (2012) 39(1) : 11-17Indian Journal
of Ecology

12
handled easily. This led to the loss of information on spatialvariability.
However, with the advent of space technologies suchas remote sensing (RS), geographic information systems(GIS) and global positioning systems (GPS) and their
integration with traditional tools, the homogenous zoningand agro-climatic resource inventory characterization ofparticular region considering space and time dimension
has become much easier for achieving sustainabledevelopment of natural resources (Steven, 1993). Moderntool as GIS has been providing newer dimensions to
effectively monitor and manage the natural resources inspatial domain. Thus, to sustain the food security of theIndian Punjab, it is of great importance to delineate the
state into different zones according to the climaticrequirements and various agro-physical parameterssuitability to specific landuse. Therefore, agro-climatic
resource inventory characterization in spatial format for thePunjab state is the urgent need. Thus, in the changingclimatic and land use scenario, the revision of
characterization of climatic resources inventory has becomeimminent.
MATERIAL AND METHODS
Location and Description of the Study Area
The study was conducted in Punjab State, having a
geographical area of 50,362 sq. km, forms a part of theIndus plain. It falls between 29O33´ and 32O31´ N latitudeand between 73O55´ and 76O45´ E longitude (Table 1). The
annual rainfall of the state varies from 400 to 1200 mm,more than 80 per cent of which is received during the threemonsoon months (July to September). The study area
belongs to the western plain, arid, with length of growingperiod of 60-150 days agro ecological sub-regions (Sehgalet al., 1996).
Table1. Locations of meteorological observatories used for thestudy area.
Sr No Station name Latitude Longitude
1 Abohar 30.15o N 74.20o E
2 Amritsar 31.63o N 74.87o E
3 Ballowal Saunkhri 31.12o N 76.12o E
4 Bathinda 30.17o N 74.98o E
5 Ferozepur 30.92o N 74.61o E
6 Jalandhar 31.33o N 75.58o E
7 Ludhiana 30.93o N 75.87o E
8 Patiala 30.33o N 76.47o E
9 Kapurthala 31.38o N 75.38o E
10 Gurdaspur 32.03o N 75.51o E
11 Pathankot 32.28o N 75.65o E
12 Chandigarh 30.67o N 76.75o E
13 Hoshiarpur 31.33o N 76.05o E
14 Sirsa 29.53o N 75.44o E
15 Ambala 30.38o N 76.78o E
16 Hissar 29.17o N 75.76o E
17 Ganganagar 29.90o N 73.88o E
Table 2. Equipments/Inputs and sources of data collection
Equipment / Inputs Source Purpose
Data and maps
Climatic data State Agricultural Universities, India • To generate thermal maps
• Temperature Meteorological Department, Air port, • To generate LGP maps
• Rainfall Air Force Stations
Softwares and hardwares
GPS (Global Positioning PAU, Ludhiana Used for collection of ground truth data in
System) identification of crops and met station locations
ARC GIS 9.1 P.R.S.C., Ludhiana Multi-layer analysis
Climatic Data Collection
Daily weather data of rainfall, minimum and maximumtemperature representing different existing agro-climaticregions of Punjab and its neighbouring states were
collected.
Method of Patching Climatic Data
The meteorological data collected from differentsources were not uniform with respect to number of
parameters, continuity and frequency of recording interval.Thus to maintain uniformity while generating surface mapsfor thermal and LGP layers, caution was taken to select and
collect those meteorological parameters which wereuniformly available for all stations to reduce the redundancy.Once the parameters were selected, they were checked to
S.K. Bal, J. Mukherjee, Gurjot Singh, Anil Sood, B.V. Choudhury, Harpreet Singh and Prabhjyot Kaur

13
find out the missing data if any. It was found that for most ofthe stations, data was missing for some or other reasons.
To fill that missing data, following methods were used fortemperature and rainfall.
Temperature. Richardson type weather generator
ClimGen (Stockle et al., 1999) was used to generate monthlymean maximum and minimum air temperature. In thismodel, precipitation occurrence is modeled using a first
order two state Markov procedure, which describes twoprecipitation classes (wet or dry) and takes into accountprecipitation occurrence on the previous day only. If
precipitation occur, then the amount of precipitation fallingon the wet days is determined usually by using a pre-definedfrequency distribution i.e., Weibull distribution. Temperature
was then calculated based on their correlation with otherparameters like solar radiation, wind speed, rainfall and onthe wet or dry status of each day. The Climgen software is
based on the assumption that temperature is a weeklystationary process (Matalas, 1967). It considers maximumand minimum temperature to be continuous, multivariate
and stochastic process with daily means and standarddeviations conditioned by the precipitation status i.e. wetand dry period of the day (Richardson, 1981). The time
series of each variable (maximum and minimumtemperature) is reduced to a time series of residualelements through the removal of the periodic means and
scaling by standard deviations.
Rainfall. The method used for patching daily rainfallvalues was the inverse distance interpolation (ID). This
method was chosen for its simplicity and reasonable scorefrom the past research. The inverse distance interpolationmethod of estimating daily precipitation gave less deviation
from the actual data followed by other methods like thearithmetic averaging and normal ratio methods (Xia et al.,1999)
The inverse distance method is used to estimatemissing data because of its simplicity.
yt = {m Σ
i=1 (x
ti / D
ib} / { m Σ
i=1 1/D
ib}
where yt is the estimated value of the missing data, xti
is the value of the ith nearest weather station, and Di is thedistance between the station of missing dataset and the ithnearest weather station (Tang et al., 1996).
Statistical Evaluation of the Generated Data
The generated data from 1991 to 1995 were analyzed.In the first step, the five years generated as well as theobserved data for the same period (1991-1995) was
averaged to compute monthly mean and standard deviation.
The agreement between the observed and generated datawas evaluated using the statistical indices like Residual
Mean Square Error (RMSE), General Standard Deviation(GSD) and Willmott’s (1982) index of agreement (d).
RMSE = SQRT [{(1/n) * nΣi=1 (Pi – Oi)
2}]
d = 1.0 - Σ (Oi - Pi)2 / Σ [ |Pi - Obar| + |Oi - Obar| ]
2
GSD = RMSE / Obar
where, Oi = observed data; Pi = generated data and Obar
= mean of the observed data.
The performance of the model was evaluated from GSDand d indicators. If GSD is ≤ 0.10 and d is 0.95 then the
model performance was good; and if 0.10 < GSD ≤ 0.20and 0.95 > d ≥ 0.90, performance was consideredacceptable. Values other than the above conditions indicated
poor performance. Willmott’s index (d) is considered animproved model evaluation tool over R2 because it takesinto account differences in observed and model means
(biases) and variances, as well as correlation.
Climatic Data Analysis
The daily maximum temperature, minimumtemperature and rainfall measurements from 20
meteorological stations were used in the analysis of data.The data from these stations is variable in that differentstations have climatic data readings from 1971 to date while
a few stations only have records dating from 1984.
Potential Evapotranspiration (PET) Calculation
PET calculation was done by Papadakis method as itrequires only daily maximum and minimum temperature
data which was actually available at all the meteorologicalstations chosen for this study. Moreover, Kingra and Hundal(2002) also reported that Papadaki’s method fits best for
Punjab representing different agro-climatic regions.
PET = 0.5625 (emax – emin-2) x 10
No of days in month
Where,
PET = Potential Evapotranspiration
emax = Saturation vapour pressure corresponding to
maximum temperature
emin-2 = Saturation vapour pressure corresponding todew point temperature
0.5625 = Papadakis constant
Length of Growing Period (LGP) Calculation
Rainfall and potential evapotranspiration (PET) werethe critical climatic factors for interpretation. Long-term
Agro-climatic Resource Inventory Characterization
14
weekly data on these two parameters were analyzed forcalculation of length of growing period (LGP). The LGP is
the period in days during a year when precipitation exceedshalf the potential evapo-transpiration plus a period requiredto evapotranspire assured estimated stored moisture
(Higgins and Kassam, 1981). Lengths of Growing Periods(LGPs) year wise were calculated using Excel spreadsheetfor the period of time that precipitation (P) + stored soil
moisture (S) exceeds 0.5 ETp (Potential evapo-transpiration). The yields of many common crops declinemarkedly if the soil moisture falls below this level
(Doorenbos and Kassam, 1979). The soil moisture storagecapacity was assumed to be uniform throughout the state,because a particular soil type was scattered irrespective of
rainfall and PET zones. The LGP excludes any period inwhich the temperature is unfavourable for crop growth.
Extraction of Area of Interest
The approach adopted is to overlay state boundary
(taken from Survey of India (SOI) maps at 1:50,000 scale)by transforming it into image coordinates and analyze pixelinside the boundary. The area of interest (Punjab state)
was extracted using state boundary mask along with districtboundaries.
Map Preparation in Arc GIS
Thermal and LGP maps were prepared in the GIS
environment using Arc GIS-9.1.
Following steps were followed to prepare the maps:
1) Punjab state polygon coverage was selected.
2) Data were collected from different sites of Punjab,Haryana, Rajasthan and Jammu regardingtemperature and rainfall using Global Positioning
System (GPS) x, y coordinates (latitude and longitude).
3) The latitude- longitude data was converted to degree-decimal format.
4) The coverage file (point) was then generated from thelocation data in Arc GIS.
5) The thermal and LGP data was transformed as attribute
table and attached to the point file coverage alreadygenerated.
6) Then the point file coverage was converted to rasterformat through Krigging method giving equal distance
points.
7) Clipping was done to get the thermal and LGP zonesof Punjab state.
Procedure for Zoning and Overlaying of Thermaland LGP Layers
Zoning divides the area into smaller units based ondistribution of climate. The level of detail to which a zone isdefined depends on the scale of the study, and sometimes
on the power of the data processing facilities.
Both layers of thermal zone and LGP zones wererasterized using vector to raster module of Arc/Info. Both
these raster based spatial data bases were created at 1km grid size. Different intersections and unions were theresultant of the overlaying of the two layers. To finalize the
layers, redigitization of the intersection zones were doneand final zones were demarcated. This raster based spatialdatabase of Thermal and LGP zone was then imported into
a separate image channel using image processingsoftware (PCI Geometica 9.17).
RESULTS AND DISCUSSION
Patching of Climatic Data
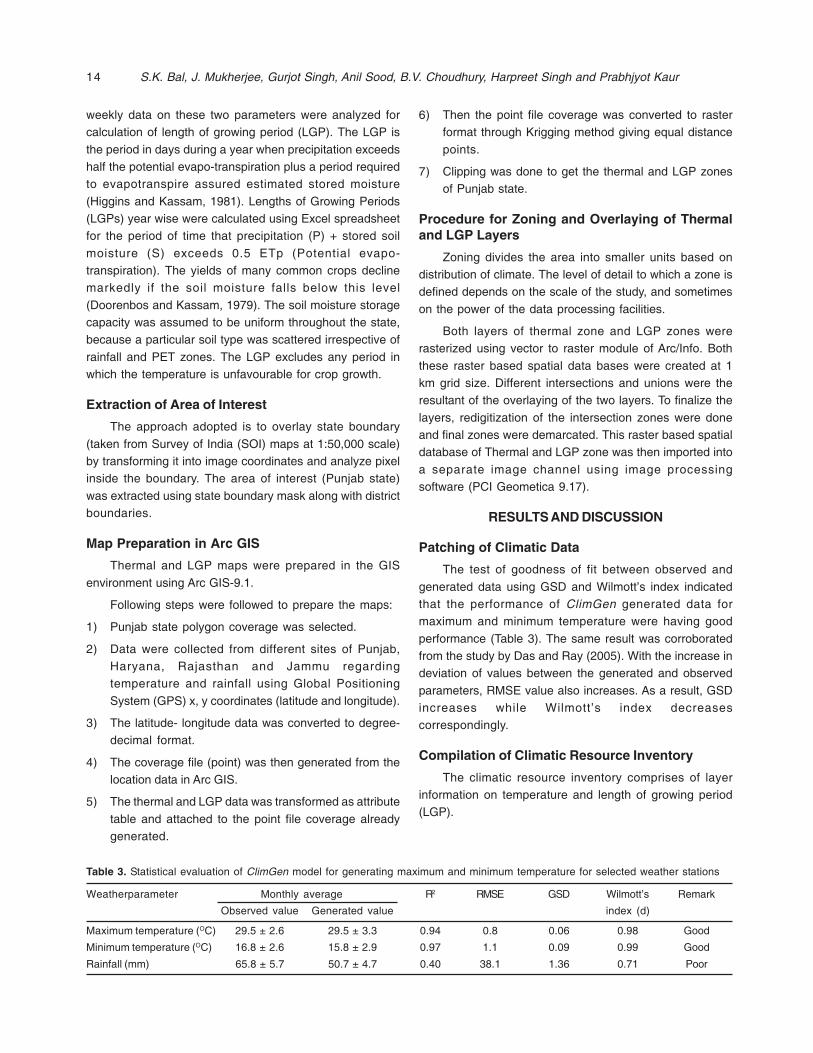
The test of goodness of fit between observed and
generated data using GSD and Wilmott’s index indicatedthat the performance of ClimGen generated data formaximum and minimum temperature were having good
performance (Table 3). The same result was corroboratedfrom the study by Das and Ray (2005). With the increase indeviation of values between the generated and observed
parameters, RMSE value also increases. As a result, GSDincreases while Wilmott’s index decreasescorrespondingly.
Compilation of Climatic Resource Inventory
The climatic resource inventory comprises of layerinformation on temperature and length of growing period(LGP).
Table 3. Statistical evaluation of ClimGen model for generating maximum and minimum temperature for selected weather stations
Weatherparameter Monthly average R2 RMSE GSD Wilmott’s Remark
Observed value Generated value index (d)
Maximum temperature (OC) 29.5 ± 2.6 29.5 ± 3.3 0.94 0.8 0.06 0.98 Good
Minimum temperature (OC) 16.8 ± 2.6 15.8 ± 2.9 0.97 1.1 0.09 0.99 Good
Rainfall (mm) 65.8 ± 5.7 50.7 ± 4.7 0.40 38.1 1.36 0.71 Poor
S.K. Bal, J. Mukherjee, Gurjot Singh, Anil Sood, B.V. Choudhury, Harpreet Singh and Prabhjyot Kaur

15
Thermal Layer
The inventory of thermal layer was prepared by usingtemperature data of individual stations. A spatial coverage
layer was generated using point data on temperature in ArcGIS. The boundaries of thermal zone were constructed byspatial interpolation (krigging) in GIS environment. Later
on, the thermal map was subsequently digitized (Map 1).The thermal regime refers to the amount of heat availablefor plant growth and development during the growing
period. It is usually defined by the mean daily temperatureduring the growing period. In the present study, five thermalzones have been defined based on temperature intervals
of 1OC across the zones. Average annual mean temperatureranges from 21OC to 26OC. The high-lying areas over theextreme north and north-eastern parts of the state (Map 1)
record relatively low temperatures representing zones T1
and T2 (22 to 23OC) while in the low-lying south-westernarid zones (T4 & T5), temperature is 24-26OC. The high
temperature in the south-western parts of the state may bedue to the proximity to Thar Desert, scanty rainfall and lackof sufficient vegetative covers. The lower temperature in the
northern part may be ascribed to its higher latitudinallocation and its proximity to the foot hills of Himalayas(Siwalik Hills). Most of the areas of the state however lies
within the moderate thermal zones of 22-23OC to 24-25OC.Area under T3 zone was highest followed by T4 zone and theleast area was under T1 zone (Table 4).
Table 4. Per cent total geographical area (TGA) under differentthermal zones of Punjab
Thermal Description % TGA
Zones
T1 Annual average temperature 21-22oC 0.7
T2 Annual average temperature 22-23oC 10.0
T3 Annual average temperature 23-24oC 57.9
T4 Annual average temperature 24-25oC 29.5
T5 Annual average temperature 25-26oC 1.9
Length of Growing Period (LGP) Layer
In Punjab and its adjoining areas, when rainfall data
was superimposed on PET in Excel spreadsheet , it wasfound that LGP pattern was normal type i.e. two peaks(ridges) were obtained throughout the year. The larger peak
was obtained during Kharif season (July-September), sincePunjab receives more than 80 per cent of the total rainfallduring the months of July-September through south-western
monsoons. The lower / marginal peak was observed duringthe winter season, since during that period only 20 per centof the total annual rainfall is received through western
disturbance. More over, erratic nature of the rainfalldistribution further compounded the low peak.
These LGP data of different meteorological stationswere fed into GIS environment and through spatial
interpolation method (krigging), LGP surface layer map wasgenerated. Altogether, seven LGP zones were categorizedranging from < 60 days to 180 days with an interval of 20-
days (Map 2). Maximum number of days (L1=160-180 days)with sufficient moisture for crop growth was found in theextreme northern part of Gurdaspur district of Punjab. This
was mainly due to the occurrence of higher rainfall andlower ET demand. The lowest number of days (L7 < 60days) lies in the extreme south-western parts of the state
comprising southern parts of Ferozepur and Muktsardistricts. This may be attributed to occurrence of less rainfall,higher temperature and subsequent high ET demand. Most
of the areas of the state however lie with in the moderate
Table 5. Per cent total geographical area (TGA) under differentLGP zones of Punjab
LGP Zones Description % TGA
L1 LGP 160-180 days 0.7
L2
LGP 140-160 days 9.8
L3 LGP 120-140 days 34.1
L4 LGP 100-120 days 27.6
L5 LGP 80-100 days 16.8
L6 LGP 60-80 days 3.8
L7 LGP < 60 days 7.2
Fig. 1. Thermal zones of Punjab
Agro-climatic Resource Inventory Characterization

16
LGP zones of L5 (80-100 days) to L2 (140-160 days). Themaximum area was under L3 followed by L4 and L5. Theleast area was under L1 zone (Table 5).
Delineation of Thermal-LGP zones
Thermal layer comprises of five zones and LGP layercomprises of seven zones. Through logical combinationsof these two layers in raster module of Image processing
software (PCI Geomatica), seven Thermal-LGP zones forthe state of Punjab has been generated (Map 3).
For convenience in carrying out further analysis, these
seven zones have been represented as Z1 to Z7. Zone 1 (Z1)comprises only extreme northern parts of Gurdaspur district.Zone 2 (Z2) comprises northern parts of Gurdaspur,
Hoshiarpur, Rupnagar and SAS Nagar districts of Punjabwhich has temperature range of 22-23OC and LGP variesfrom 160-180 days. Z3 and Z4 have similar thermal climate
(23-24OC) but different LGP values (120-140 and 100-120days). These include districts of Amritsar, Tarntaran,Ludhiana, Jalandhar, Kapurthala, Patiala and Sangrur. Z5
and Z6 (Muktsar, Faridkot, Bathinda, Mansa) were havingsimilar thermal (24-25OC) but different LGP zones (80-100and 60-80 days). The last zone was the driest and hottest
zone (Z7) having annual average temperature of 25-26OCand LGP less than 60 days. It is confined to the
southernmost part of Firozpur district. Maximum area wasunder Z3 zone followed by Z4 and Z5 (Table 6).
Table 6. Per cent total geographical area (TGA) under differentThermal-LGP zones of Punjab
LGP Zones Description % TGA
Temperature (ºC ) LGP (days)
Z1 21-22 160-180 0.7
Z 2 22-23 140-160 9.7
Z 3 23-24 120-140 36.0
Z 4 23-24 100-120 25.8
Z 5 24-25 80-100 17.0
Z 6 24-25 60-80 8.0
Z 7 25-26 < 60 2.8
The test of goodness of fit between observed and
generated data using GSD and Wilmott’s index indicatedthat performance of ClimGen generated data for maximumand minimum temperature was good for selected stations
situated at different agro-climatic conditions of the state. Intotal, five thermal zones were defined based on temperatureintervals of 1OC, the gradient being from northeast to
southwest. The northeast and southwestern part of the stateexperiences the lowest and highest temperatures of thestate, simultaneously. The LGP pattern in the state is normal
type and a total of 7 zones were identified with an interval of20-days, the highest being in the north-eastern part and
Fig. 2. Length of growing period (LGP) zones of Punjab Fig. 3. Thermal - LGP zones of Punjab
S.K. Bal, J. Mukherjee, Gurjot Singh, Anil Sood, B.V. Choudhury, Harpreet Singh and Prabhjyot Kaur

17
lowest being in the south-western part of the state. Thelogical combination of the thermal as well as LGP zones
resulted in seven thermal-LGP zones.
REFERENCESDas, G. and Ray, S.S. (2005) Comparative evaluation of two weather
generators for Punjab. J. Agrometeorol. 7: 231-240.
Doorenbos, J. and Kassam, A.H. (1979) Yield response to water.FAO Irrigation and Drainage paper No. 33, FAO, Rome.
FAO. (1976) A Framework for Land Evaluation. Soils Bulletin, 32.Food and Agricultural Organisation, Rome, Italy.
Higgins, G.M. and Kassam, A.H. (1981) The FAO agro-ecologicalzone approach to determination of land potential. Pedologie31: 147–168.
Hundal, S.S. and Kaur, P. (2002) Annual and seasonal climaticvariability at different locations in Punjab. J. Agrometeorol. 4:113-126.
Kingra, P.K. and Hundal, S.S. (2002) Estimation of PET by variousmethods and its relationships with mesh covered panevaporation at Ludhiana. J. Agrometeorol. 4: 143-149.
Matalas, N.C. (1967) Mathematical assessment of synthetichydrology. Water Resour. Res. 3: 937-945.
Mavi, H.S. (1984) Introduction to Agrometeorology. (2nd ed). Oxford& IBH Publishers Co. Pvt. Ltd, New Delhi, pp. 209-227.
Mukherjee, J. and Bal, S.K. (2003) Climatic variability at BallowalSaunkhri, Punjab. Proc. National Symposium on Emerging
trends in Agricultural Physics and Four Decades of Researchin Division of Agricultural Physics. 22-24 April, Division ofAgricultural Physics, I.A.R.I., New Delhi, pp 105.
Richardson, C.W. (1981) Stochastic simulation of daily precipitation,temperature and solar radiation. Water Resour. Res. 17: 182-190.
Schulze, R.E., Maharaj, M., Lynch, S.D., Howe, B.J. and Melvil-Thomson, B. (1997) South African Atlas of Agrohydrologyand Climatology. Report TT82/96. Water Research Commission,Pretoria, pp 277.
Sehgal, J.L., Mandal, D.K., Mandal, C. and Vadivelu, S. (1996) Agro-ecological regions of India. Publication 24. NBSS & LUP (ICAR),Nagpur, India.
Steven, M.D. (1993) Satellite remote sensing for agriculturalmanagement: Opportunities and logistic constraints. ISPRS J.Photogramm. 48: 29-34.
Stöckle, C.O., Campbell, G.S. and Nelson, R. (1999) ClimGen manual.Biological Systems Engineering Department, Washington StateUniversity, Pullman, WA, pp. 28.
Tang, W.Y., Kassim, A.H.M. and Abubakar, S.H. (1996) Comparativestudies of various missing data treatment methods - Malaysianexperience. Atmos. Res. 42: 247-262.
Willmott, C.J. (1982) Some comments on the evaluation of modelperformance. Bull. Amer. Meteorol. Soc., 63: 1309-1313.
Xia, Y., Fabian, P., Winterhalter, M. and Stohl, A. (1999) Forestclimatology: estimation of missing values for Bavaria, Germany.Agr. Forest Meteorol. 96: 131-144.
Agro-climatic Resource Inventory Characterization
Received 7 June, 2011; Accepted 3 March, 2012

Cotton (Gossypium sp.) being the most importantcommercial crop, plays a vital role in social and monetaryaffairs of the India. Besides other causes, major bottleneck
in cotton cultivation is biotic stresses due to attack of insectpests and diseases which play a significant role inachieving optimum yield potential. In India, cotton ecosystem
harbours about 162 insect species, of which 9 are of utmostimportance inflicting significant losses in yield (Dhaliwal etal., 2004). Before the introduction of Bt cotton, farmers solely
relied on insecticides for effective management ofBollworms. Besides increasing cost of production andenvironmental problems, the excessive and indiscriminate
use of insecticides for the control of these pests has resultedin development of insecticidal resistance particularly inHelicoverpa armigera (Hubner) decline in natural enemies’
population and resurgence of the pests like whitefly, Bemisiatabaci (Gennadiaus) and jassid, Amrasca biguttula biguttula(Ishida) (Gill and Dhawan, 2006). Besides, A. biguttula and
B. tabaci, other sucking pests like thrips, Thrips tabaci(Lindemann) hitherto occurring during May-June and aphids,Aphis gossypii (Glover) at fag end of the crop season are
also gaining importance. During 2006, a new sucking pest,mealy bug, Phenacoccus solenopsis (Tinsley) appeared infew pockets of Bathinda, Ferozepur and Muktsar districts
and caused economic loss (Dhawan et al., 2007). Keepingin view the above facts, IRM window based strategies wereimplemented in the last two years with the aim to slow or
reverse the development of resistance in sucking pests.The various strategies includes the use of refugia,mechanical control of immature stages of tobacco caterpillar
Economic Impact of Insecticide Resistance Management (IRM)Strategies in Cotton in Muktsar District (Punjab)
A.K. Dhawan, Vijay Kumar*, Amardip Singh, Jasbir Singh and Amrik SinghDepartment of Entomology, Punjab Agricultural University, Ludhiana – 141 004, India
*E-mail: [email protected]
Abstract: To disseminate Insecticide Resistance Management (IRM) strategies, 10 villages were adopted in Muktsar district of Punjabduring 2008 and 2009. Two villages were kept as check (Non-IRM) for comparing the impact of IRM strategies on the major insect pestsand natural enemies in Bt cotton arthropod fauna. The impact of adoption of IRM strategies leads to reduction in the population of jassid andwhitefly in IRM villages as compared to non-IRM villages. The mean population of nymphs jassid, Amrasca biguttula biguttula (Ishida), andwhitefly, Bemisia tabaci (Gennadius), adults per three leaves was 0.41, 0.45 and 0.61, 0.69 in IRM villages, while in non-IRM villages, itwas 0.50, 2.00 and 0.80, 2.40 during 2008 and 2009 crop season, respectively. No incidence of bollworms was observed in IRM as wellas Non-IRM villages. Cotton IRM villages were sprayed 3.73 and 3.40 as compared to 6.30 and 6.05 in non-IRM villages for both the years.The per cent reduction in number of sprays, cost of sprays and increase in seed-cotton yield was 40.79 and 43.80, 64.96 and 51.16,22.70 and 30.45 over non-IRM villages in 2008 and 2009, respectively. The additional net profit per hectare in IRM villages was Rs 11422and Rs 18441 during both the years.
Key Words: Arthropod fauna, Bt Cotton, Insecticide resistance management, Economics, Non-IRM, Natural enemies
and other damaging insects, use of insecticides on thebasis of economic threshold, and alternations as well asrotation of insecticide group in window based adoption of
chemical and non-chemical methods for the managementof cotton insect-pests.
MATERIAL AND METHODS
Ten villages were adopted for dissemination of IRMstrategies in Muktsar district of Punjab during 2008-09 and2009-10. Two villages adjoining to IRM villages were keptunder observation and these constituted the non-IRMvillages or villages not adopting the IRM strategies. At least50 farmers from each village were selected as a targetgroup for dissemination of following IRM strategies. The Btcotton was grown as per the recommended agronomicpractices (Anon., 2009).
For the effectiveness of these strategies, training wasgiven to the scouts as well as to the farmers about theidentification of insect-pests of cotton crop and naturalenemies of these insect-pests. The literature havingknowledge about insect-pests, their economic threshold(ETL) and their control was distributed among the farmers.The insecticides of different groups were sprayed ateconomic threshold level and an attempt has been madenot to repeat same insecticide as far as possible. Thebaseline data regarding time of sowing, number ofirrigations, number of insecticidal sprays and type of productused in application of broad spectrum insecticides,herbicides, IGRs and seed cotton yield obtained to studythe impact of the implementation of project in the form of
Indian J. Ecol. (2012) 39(1) : 18-22Indian Journal
of Ecology

19
questionnaire were collected from IRM and non IRM villages.The data on the number of sucking pests (jassid, whitefly,
thrips and mealy bug), bollworm complex (Americanbollworm and spotted bollworm) and foliage feeder(Tobacco caterpillar) and natural enemies (spiders,
coccinellids, predatory bugs etc.) were recorded at weeklyinterval from 26th to 39th meteorological weeks.
Window 1 (Till 60 days after sowing)
• Cultivation of recommended tolerant genotypes (Bt or
non-Bt) against sucking pests.
• Complete the sowing up to 15 May.
• Eradication of weeds in or around the cotton fields.
• Avoidance of neonicotinoids and organophosphategroup of insecticide for sucking pest
• Do not spray against sucking pest in order to conservethe natural enemies.
Window II (60-90 days after sowing)
• Do not spray against minor lepidopterons.
• Use of endosulfan, if necessary.
• Use of organophosphate only on non-Bt cotton at ETL
basis.
• Use of neonicotinoids on ETL basis against suckingpest.
Window III (90-120 days after sowing)
• Use of pheromone traps for monitoring of bollwormmoths.
• Peak bollworm infestation period on non-Bt.
• Use of organophosphate or carbamates only once onETL basis.
• Use of spinosad or indoxacarb only on non-Bt cotton atETL.
Window IV (>120 days after sowing):
• Use of pheromone traps for monitoring of bollworms
and tobacco caterpillar moths.
• Need based use of Novaluron as first spray for thecontrol of tobacco caterpillar.
• Use of non- chemical methods for control of mealy bug
• Need based spray of Buprofezin for the control of mealybug as spot treatment.
RESULTS AND DISCUSSION
Agronomic Practices
The numbers of farmers involved were 571 and 683
covering an area of 2627 and 2068 ha area under Bt cottonduring 2008 and 2009, respectively. In 2008, due to heavyrains at irregular times, the total number of irrigations varied
from 1.90 to 2.60; while in 2009 number of irrigations variedfrom 2.10 to 3.15 and about 63.00 per cent sowing wascompleted after 15th May due to heavy rains at regular
intervals in 2008 while in 2009, 70.90 per cent sowing wascompleted within time before May 15. In non IRM villages,numbers of farmers involved were 75 and 104 covering an
area of 163.2 and 244.8 ha area cotton during 2008 and2009, respectively. In non-IRM village during 2008, theaverage number of irrigations was 2.23; while during 2009
number of irrigations was 4.07 and about 69.40 and 26.50per cent sowing was completed after 15 may in 2008 and2009, respectively. In IRM villages, urea (kg ha-1), DAP (kg
ha-1) and number of potassium sprays were 300, 75 and2.10 during 2008 and 325, 77 and 2.95 during 2009. In non-IRM villages, urea (kg ha-1), DAP (kg ha-1) and number of
potassium sprays were 310, 72 and 1.59 during 2008 and289, 70 and 1.75 during 2009 (Table 1).
Impact on Pest Situation
Sucking pests. The data pertaining to the pest status
(Table 2) indicated that during 2008 and 2009 crop season,the population of jassid remained below economicthreshold level (ETL) with the mean numbers of 0.41 and
0.45 nymphs per 3 leaves in IRM villages, while in non-IRM
Table 1. Agronomic practices adopted in IRM villages of Muktsar during 2008 and 2009
Year Land holding Area under different dates of Fertilizer (Kg ha-1)
(ha) sowing (%) Irrigations
Total Under Before May 1-15 After N P KNO sprays
area cotton April 30 May 15 (Urea) (DAP) (13:0:45)
IRM villages
2008 4263 2627 5.50 31.50 63.00 2.20(1.90-2.60) 300 75 2.10
2009 4466 2068 21.10 70.90 8.00 3.86(2.10-3.15) 325 77 2.95
Non- IRM villages
2008 347 163 6.30 24.30 69.40 2.23 310 72 1.59
2009 454 245 18.50 55.00 26.50 4.07 289 70 1.75
Impact of IRM Strategies in Cotton

20
villages, its population was 0.50 and 2.00 during therespective years. Similarly, the data on the population of
whitefly per 3 leaves showed that it remains below ETLlevel with 0.61 and 0.69 in IRM villages during 2008 and2009 crop season, respectively, while in non-IRM villages,
it was 0.80 and 2.40 per 3 leaves for the correspondingyears. The population of mealy bug per 2.5 cm of centralshoot was 0.34 and 0.00 in IRM villages during 2008 and
2009 crop season, respectively, whereas in non-IRMvillages, it was 0.70 and 0.80 for the corresponding years.The population of thrips per plant was 0.07 and 0.05 in IRM
villages during 2008 and 2009 crop season, respectively,whereas in non-IRM villages, it was 0.58 and 0.50 for thecorresponding years (Table 2).
Maximum number of sprays was given for sucking pest
in both the years. The number of sprays for sucking pests
was 2.22 and 3.28 in IRM villages and 5.52 and 5.75 in non-
IRM villages during 2008 and 2009 crop season,
respectively.
Bollworm complex and foliage feeders. No incidence
of pink bollworm, spotted bollworm and American bollworm
in 2008 and 2009 due to adoption of recommended
varieties/Bt cotton.
The mean population of tobacco caterpillar was 0.27
and 0.01 in IRM villages; however it was 0.35 and 0.10 in
non-IRM villages during 2008 and 2009, respectively (Table
2).
Natural enemies. The most common natural enemies
observed were spiders, lady bird beetle, Coccinellids and
green lace wing, Chrysoperla spp. The population of natural
enemies in IRM villages was high as compared to non-IRM
villages. The average number of natural enemies in IRM
villages was 0.94 and 0.86 per plant during 2008 and 2009,respectively, while in non-IRM villages it was 0.47 and 0.20per plant. The peak population of natural enemies was
recorded during 32nd-35th meteorological weeks during both
the years. Subsequently their population declined whichmight be due to the insecticidal sprays (Table 2).
Insecticide use pattern. In IRM villages, maximumnumbers of sprays were given for the control of suckingpest (2.22 and 3.28) followed by sprays for control of tobacco
caterpillar (1.51 and 0.12) in both the year 2008 and 2009.Insecticides sprayed maximum times belongs to grouporganophosphates (2.09) followed by neonicotinoids (0.95)
and organochlorine (0.25) in 2008, while in 2009 cropseason, insecticides sprayed maximum times belongs togroup neonicotinoids (1.35) followed by organophosphate
(1.20) and organochlorines (0.70). In non-IRM villages,number of insecticide sprays was maximum for control ofsucking pest (5.52 and 5.75) followed by sprays against
tobacco caterpillar (0.78 and 0.30) during 2008 and 2009,respectively. Insecticides sprayed the maximum timesbelongs to group organophosphates (3.10) followed by
neonicotinoids (1.60) and carbamates and IGRs (0.60) in2008, while in 2009, insecticides sprayed maximum timesbelongs to group neonicotinoids (3.20) followed by
organophosphate (1.80) and miscellaneous (0.40).
Impact of IRM Strategies on Economics
The numbers of sprays were 3.73 and 3.40 in IRMvillages as compared to 6.30 and 6.05 in non-IRM villages
(Table 3). The total cost of sprays (Rs ha-1 ) and seed-cottonyield oBtained (kg ha-1) was 1638 and 1778; and 2189 and2630 in IRM villages (Table 3) as compared to 4675 and
3641; and 1784 and 2016 in non-IRM villages during 2008and 2009, respectively. It represented 64.96 and 51.16 percent reduction in cost of sprays over non-IRM villages with
22.70 and 30.45 per cent increase in seed-cotton yield overnon-IRM villages during 2008 and 2009, respectively. Thetotal cost of cultivation (Rs. ha-1) was 22222 and 25518 in
IRM villages as compared to 22301 and 25898 in non-IRMvillages during both the years (Table 3). The net profit perhectare in IRM villages was Rs 39067 and 56028 during
Table 2. Status of insect pest in IRM and non-IRM villages of Muktsar district during 2008 and 2009.
Year Jassid Whitefly Mealy bug Thrips Tobacco Bollworm Spider Chrysopa Coccinellid Predatory
nymphs (per 3 (2.5 cm (per 3 caterpillar complex* bug
(per 3 leaves) of central leaves) (no. per
leaves) shoot) plant) Numbers per plant
IRM villages
2008 0.41 0.61 0.34 0.07 0.27 0.00 0.70 0.04 0.20 0.00
2009 0.45 0.69 0.00 0.05 0.01 0.00 0.67 0.02 0.17 0.00
Non-IRM villages
2008 0.50 0.80 0.70 0.58 0.35 0.00 0.28 0.03 0.16 0.00
2009 2.00 2.40 0.80 0.50 0.10 0.00 0.15 0.02 0.03 0.00
Bollworm complex includes American bollworm, spotted bollworm and pink bollworm
A.K. Dhawan, Vijay Kumar, Amardip Singh, Jasbir Singh and Amrik Singh

21
Fig. 1. Insecticide used pattern in Muktsar cotton belt (Punjab) during 2008
Fig. 2. Insecticide used pattern in Muktsar cotton belt (Punjab) during 2009
Table 3. Impact of IRM strategies on economics in Muktsar district during 2008 and 2009
Year Number of Cost of sprays Seed cotton yield Cost of cultivation Net profit Cost :Benefit
sprays (Rs ha-1) (kg ha-1) (Rs ha-1) (Rs ha-1) ratio
IRM villages
2008 3.73 (40.79)* 1638 (64.96)* 2189 (22.70)** 22222 (0.35)* 39067 (41.31)** 1:1.75 (42.27)**
2009 3.40 (43.80)* 1778 (51.16)* 2630 (30.45)** 25518 (1.46)* 56028 (49.06)** 1: 2.19 (51.03)**
Non-IRM villages
2008 6.30 4675 1784 22301 27645 1 : 1.23
2009 6.05 3641 2016 25898 37587 1 : 1.45
* Figures in parentheses are per cent decrease over non-IPRM villages** Figures in parentheses are per cent increase over non-IPRM villages
Impact of IRM Strategies in Cotton

22
the two years. Thus, adoption of IRM strategies resulted inadditional profit of Rs 11422 and Rs 18441 of IRM villages
over non-IRM villages during 2008 and 2009, representing41.31 and 49.06 per cent increase over IRM villages.
The present findings collaborate with the result of
Kranthi et al. (2000) who estimated 90 per cent reduction insprays and seed cotton yield increased up to 59 per centand plant protection cost reduced by 25-60 per cent due to
adoption of IRM strategies. He also reported that number ofsprays for the control of sucking and bollworm complexvaried from 8-17 in North India. Dhawan et al. (2006) also
reported reduction in number of sprays, cost of sprays (Rsha-1) and increase in seed cotton yield was 24.4 and 25.6;19.2 and 42.0; and 25.8 and 15.5 per cent in IRM villages
over non-IRM villages during 2002 and 2003, respectively.Suruli Velu et al. (2004) also reported 63 per cent reductionin number of sprays at Coimbatore and Theni districts, with
the mean of 2.7 in project village as compared to 7.3 incontrol villages.
Likewise, in our study, reduction in spray cost, number
of sprays and increased seed cotton yield was recordedduring 2008 and 2009. The per cent increase in net profit ofIRM villages over non-IRM villages was 41.3 and 49.1 during
both the years. The cost benefit ratio increased up to 29.7and 33.7 per cent during both the years. Similarly, Rajak etal. (1997) reported 30 to 50 per cent reduction in pesticide
consumption in IRM-adopted fields with 21-27 per centincrease in seed-cotton yield. With the adoption of IRMstrategies, there was no damage of bollworms and also
less incidence of sucking pests and foliage feeders, highernumber of natural enemies in IRM villages with increase in
seed cotton yield as compared to non-IRM villages.
ACKNOWLEDGEMENT
The authors are graeful to The Director CICR, Nagpur
for the financial help provided under IRM Project.
REFERENCESAnonymous (2009) Package of Practices for Crops of Punjab-
Kharif. Punjab Agricultural University, Ludhiana, India.
Dhawan, A. K., Singh, K., Arora, P. K. and Kumar, T. (2006) Insecticideresistance management (IRM) strategies: their impact onarthropod fauna and economics in cotton agro ecosystem.Indian J. Ecol. 33(2): 158-162.
Dhawan A. K., Singh, K., Saini, S., Mohindru, B., Kaur, A., Singh, G.and Singh, S. (2007) Incidence and damage potential of mealybug, Phenacoccus solenopsis Tinsley, on cotton in Punjab.Indian J. Ecol. 34 (2): 166–172.
Dhaliwal, G. S., Arora, R. and Dhawan, A. K. (2004) Crop lossesdue to insect pests in Indian agriculture. Indian J. Ecol. 31(1):1-7.
Gill, H. K. and Dhawan, A. K. (2006) Global status of insecticideresistance in Helicoverpa armigera on cotton. J. Cotton Res.Dev. 20 (2): 226-231.
Kranthi, K. R., Banerjee, S. K. and Russell, D. (2000) IRM strategiesfor sustainable cotton pest management in India. Pestology,24: 58-67.
Rajak, R. L., Diwaker, M. C. and Mishra, M. P. (1997) National IPMprogramme in India. Pestic. Inf. 23: 23-26.
Suruli Velu, T., Sumathi, E., Matharajan, V. G. and Rajendran, T. P.(2004) Evaluation of success of insecticides resistancemanagement in Tamil Nadu. In: B. M. Khadi, M. H.Vaamadevaiah, I. S. Katageri, Chattannawar, S. S. Udikeri andS. B. Patil (Eds.) International Symposium on Strategies forSustainable Cotton Production – A Global Version 3. CropProtection, Dharwad, pp. 204-207.
A.K. Dhawan, Vijay Kumar, Amardip Singh, Jasbir Singh and Amrik Singh
Received 2 February 2011; Accepted 11 December, 2011

Kinnow, a mandarin hybrid (Citrus nobilis Loureiro X
Citrus deliciosa Tenore) is dominant citrus fruit of Punjab
and is expanding fastly to Haryana and Rajasthan. It grows
successfully is all frost free, tropical and sub-tropical regions
of India. Kinnow appears to be very exacting in its climatic
requirements.
Large plantations have been brought under kinnow
during the last two decades and consequently it has become
the major fruit crop dominating the state. This resulted into
increased production of kinnow, which is posing a serious
handling problem and thus invites research on increasing
its shelf life. In this fruit crop, harvesting is confined to a
limited period so market glut is the serious problem faced
by the growers, which engage the attention of horticulturists
to enhance its storage period after harvest. This process
can help to overcome the hurdles in its further expansion
and regulation of marketing.
Essential plant nutrients and growth regulators like
calcium and GA3 are known to be involved in number of
physiological processes concerning membrane structure,
functioning and enzyme activity. There use for extending the
shelf life has good scope in kinnow mandarin. Keeping
this in view, the investigations were conducted with the aim
to study the effect of different chemicals on shelf life of
kinnow fruits with the help of GA3, triacontanol and calcium
salts along with their thresh hold levels.
Effect of Foliar Feeding of GA3, Triacontanol and Calcium Salts onShelf-Life in Kinnow Mandarin
Tanjeet Singh Chahal*, J. S. Bal1 and Kiran Kour2
Fruit Research Station, Gangian (PAU), Hoshiarpur, India1Department of Agriculture, Khalsa College, Amritsar, Punjab, India
2Division of Fruit Science, SKUAST-J, Jammu - 180 019, India*E-mail: [email protected]
Abstract: The studies on the effect of pre-harvest chemical treatments in kinnow were conducted investigate their effect on shelf life ofthe fruits. The plant material used was fifteen year old plantation raised on citrus jambhiri rootstock. Pre-harvest foliar application of GA3
(10, 20, 30 ppm), triacontanol (400, 600 ppm), CaCl2 (4, 6 %) and Ca(NO3)2 (0.1, 0.2, 0.3 %) were applied to the kinnow plants on 25th
October. The harvesting of the fruits was done on January 15th and the fruits were kept under ambient conditions for 30 days. The fruitsamples were analysed for physico-chemical evaluation at 10 days interval. It was observed that CaCl2 6% proved to be the mosteffective treatment for minimizing the weight loss during ambient storage. Like physiological loss in weight, the minimum spoilage loss wasalso recorded in the fruits from CaCl2 6% treatment. Significantly lower spoilage loss was also observed with GA3, triacontanol and othercalcium treatments. Highest level of TSS content was shown by fruits treated with GA3 30 ppm, while the highest acidity level wasobserved in the fruits treated with CaCl2 6% and Ca(NO3)2 0.3%.
Key Words: Kinnow mandarin, GA3, CaCl2, Ca(NO3)2, Triacontanol
MATERIAL AND METHODS
The plant material for investigations was selected from
‘Punjab Government Progeny Orchard’ Attari, Amritsar. The
uniform and disease free trees of kinnow with 15 years of
age were selected for the investigations. The plants were
applied with standard doses of fertilizers and plant protection
measures as recommended by Punjab Agricultural
University, Ludhiana. The pre-harvest treatments of
Gibberellic Acid (GA3) at 10, 20 and 30ppm, Vipul
(Triacontanol) at 400 and 600ppm, Calcium Chloride (CaCl2)
at 4 and 6 per cent, Calcium Nitrate {Ca(NO3)2} at 0.1, 0.2
and 0.3 per cent and control (spray of water) were applied
on 25th October.
The experiment consisted of eleven treatments. Two
trees were kept as unit treatment and replicated three times.
The fruits taken for the study were harvested on January
15th. The observations were recorded for physiological loss
in weight, spoilage loss, TSS, acidity, TSS acid ratio, total
sugars and reducing sugars.
RESULTS AND DISCUSSION
During the study, the plants applied with different CaCl2and Ca(NO3)2 concentrations showed significantly lower
physiological loss in weight in comparison to control (Table1). The minimum weight loss was registered in the fruitsapplied with CaCl2 at 6 per cent. The decreased weight
loss of calcium treated fruits was due to lower storage
Indian J. Ecol. (2012) 39(1) : 23-26Indian Journal
of Ecology

24
breakdown associated with lower respiratory rate comparedto control fruits (Faust and Shear, 1972). Pathmanaban etal. (1995) in acid lime revealed similar retardation in
physiological loss in weight with CaCl2 and Ca(NO3)2
treatments. GA3 treatments were also found to lower thephysiological weight loss significantly over control. The mostefficacious dose of GA3 in lowering the weight loss was 20
ppm. The reduced weight loss in GA3 treated fruits might bedue to antisenescent property of GA3 and also by bindingthe ethylene biosynthesis as reported by Khader (1992).
Triacontanol at 600 ppm was also found to reduce theweight loss in comparison to control. However, effect of thischemical in reducing weight loss during storage was
significantly lesser than calcium and GA3 treatments.Physiological loss in weight increased with the increase instorage period irrespective of treatments. This may be due
to continuous water loss from fruits during storage.
The data presented in Table 1 revealed that theapplication of all the calcium treatments recorded
significantly lower spoilage in the fruits during storage ofkinnow mandarin. The minimum spoilage loss wasobserved in the fruits applied with CaCl2 at 6 per cent. This
might be due to the fact that the exogenously applied calciumbecame localized in the cell wall, thus increasing thenumber of salt bridges, which could have accounted for the
resistance of this tissue to maceration by fungalpolygalacturonase and for resistance to pathogens, thusavoiding spoilage. Significantly lower spoilage loss was
also observed with the GA3 and triacontanol treatments. Allthe GA3 concentrations were found to be superior overtriacontanol. The most effective GA3 application was at 20
ppm. The lower spoilage loss with these growth regulators
might be due to firmer fruits produced by them, which may
have checked fungal attack and rotting for longer period.
The spoilage losses fastly increased with the progressive
increase in storage period in kinnow mandarin under all
the treatments. This could be owed to continuous bio-
chemical changes in the fruits after picking, causing the
aging which could have attracted fungal infection that leads
to fruit softening and hence spoilage. The results are in
close confirmation with those of Kumar et al.(2002) who
observed increased fruit rot with increased storage period
in Red Blush grapefruit.
The TSS level of the fruits significantly decreased with
the application of triacontanol at 400 ppm (Table 2). The
decrease might be due to higher firmness in the triacontanol
treated fruits in comparison to control, which might have
decreased the biochemical changes in fruits. All the CaCl2and Ca(NO3)2 treatments showed significant decrease in
the TSS level of the kinnow fruits in comparison to control.
The maximum decrease was recorded in the fruits treated
with CaCl2 at 6 per cent. In the present studies, calcium had
probably reduced the TSS level of the fruits due to reduced
respiration rate (Faust and Klein, 1973). Similar decrease
in the TSS level of the mango cv. Totapuri fruits with calcium
application was also observed by Dhaka et al. (2001). The
soluble solids recorded a general increase in kinnow fruits
during storage under all the treatments. The exceeded TSS
with prolongation of storage period can be attributed to
increased hydrolysis of polysachharides and concentration
of juice due to dehydration (Bhullar et al., 1985). Similar
increase in TSS level of the fruits with prolongation in storage
period was advocated by Mahajan et al. (2002) in kinnow.
Table 1. Effect of GA3, triacontanol and calcium salts on physiological loss in weight (%) during storage of kinnow fruits
Treatments Physiological loss in weight (%) Spoilage (%)
10 20 30 Mean 10 20 30 Mean
GA3 10ppm 3.27 8.02 11.68 7.66 0 10.33 21.00 10.44
GA3
20ppm 3.03 6.93 10.49 6.82 0 9.67 17.00 8.89
GA3 30ppm 3.47 7.13 9.94 6.85 0 10.67 21.00 10.56
Tria 400ppm 4.01 8.81 14.85 9.22 0 13.67 29.00 14.22
Tria 600ppm 3.98 6.24 14.60 8.27 0 12.67 27.00 13.22
CaCl2 4% 2.25 4.45 9.11 5.27 0 8.67 15.00 7.89
CaCl2 6% 2.10 4.03 7.27 4.47 0 7.33 13.00 6.78
Ca(NO3)2 0.1% 3.60 6.34 11.22 7.05 0 10.67 21.00 10.56
Ca(NO3)2 0.2% 3.52 6.27 11.13 6.97 0 10.00 19.00 9.67
Ca(NO3)2 0.3% 2.26 4.45 8.14 4.95 0 7.67 15.00 7.56
Control 4.37 8.52 15.43 9.44 0 15.33 36.67 17.33
Mean 3.26 6.47 11.26 0.00 10.61 21.33
CD(0.05) Physiological loss in weight: Treatments (A) – 0.36; Storage Interval (B) – 0.19 and AxB – 0.62
Spoilage : Treatments (A) – 0.78; Storage Interval (B) – 0.41 and AxB – 1.35
Tanjeet Singh Chahal, J. S. Bal and Kiran Kour
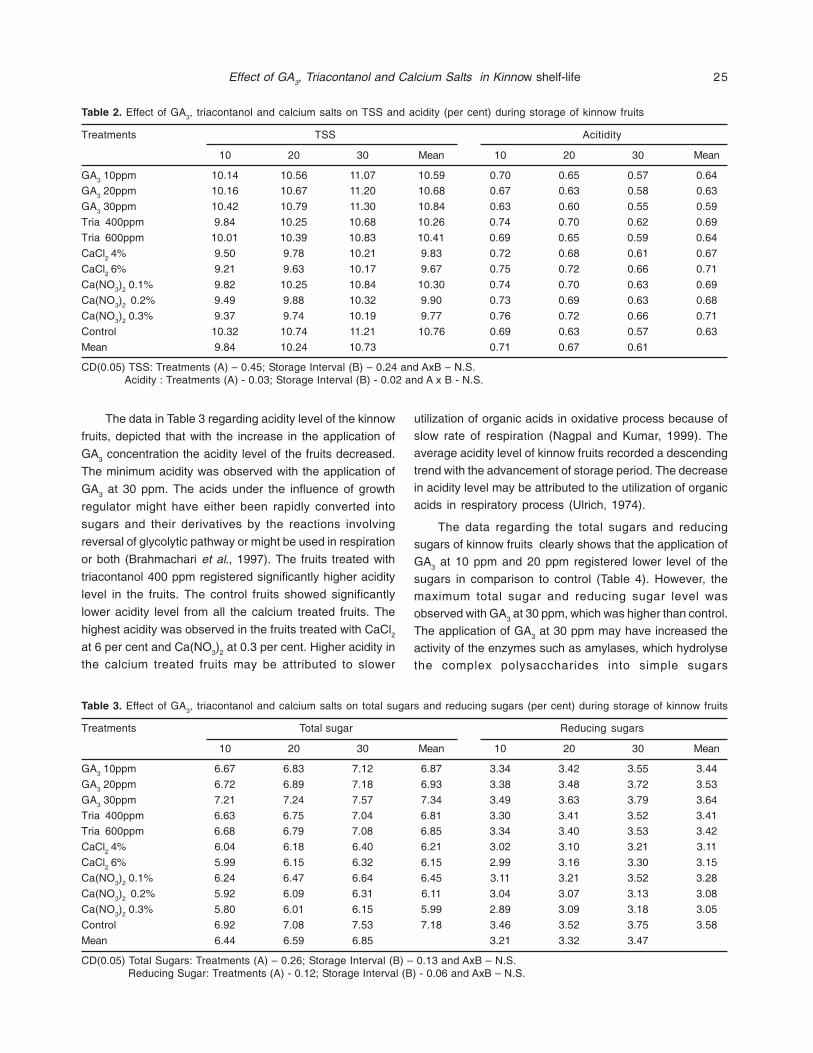
25
The data in Table 3 regarding acidity level of the kinnow
fruits, depicted that with the increase in the application of
GA3 concentration the acidity level of the fruits decreased.
The minimum acidity was observed with the application of
GA3 at 30 ppm. The acids under the influence of growth
regulator might have either been rapidly converted into
sugars and their derivatives by the reactions involving
reversal of glycolytic pathway or might be used in respiration
or both (Brahmachari et al., 1997). The fruits treated with
triacontanol 400 ppm registered significantly higher acidity
level in the fruits. The control fruits showed significantly
lower acidity level from all the calcium treated fruits. The
highest acidity was observed in the fruits treated with CaCl2at 6 per cent and Ca(NO3)2 at 0.3 per cent. Higher acidity in
the calcium treated fruits may be attributed to slower
utilization of organic acids in oxidative process because ofslow rate of respiration (Nagpal and Kumar, 1999). Theaverage acidity level of kinnow fruits recorded a descending
trend with the advancement of storage period. The decreasein acidity level may be attributed to the utilization of organicacids in respiratory process (Ulrich, 1974).
The data regarding the total sugars and reducingsugars of kinnow fruits clearly shows that the application ofGA3 at 10 ppm and 20 ppm registered lower level of the
sugars in comparison to control (Table 4). However, themaximum total sugar and reducing sugar level wasobserved with GA3 at 30 ppm, which was higher than control.
The application of GA3 at 30 ppm may have increased theactivity of the enzymes such as amylases, which hydrolysethe complex polysaccharides into simple sugars
Table 2. Effect of GA3, triacontanol and calcium salts on TSS and acidity (per cent) during storage of kinnow fruits
Treatments TSS Acitidity
10 20 30 Mean 10 20 30 Mean
GA3 10ppm 10.14 10.56 11.07 10.59 0.70 0.65 0.57 0.64
GA3
20ppm 10.16 10.67 11.20 10.68 0.67 0.63 0.58 0.63
GA3 30ppm 10.42 10.79 11.30 10.84 0.63 0.60 0.55 0.59
Tria 400ppm 9.84 10.25 10.68 10.26 0.74 0.70 0.62 0.69
Tria 600ppm 10.01 10.39 10.83 10.41 0.69 0.65 0.59 0.64
CaCl2 4% 9.50 9.78 10.21 9.83 0.72 0.68 0.61 0.67
CaCl2 6% 9.21 9.63 10.17 9.67 0.75 0.72 0.66 0.71
Ca(NO3)2 0.1% 9.82 10.25 10.84 10.30 0.74 0.70 0.63 0.69
Ca(NO3)2 0.2% 9.49 9.88 10.32 9.90 0.73 0.69 0.63 0.68
Ca(NO3)2 0.3% 9.37 9.74 10.19 9.77 0.76 0.72 0.66 0.71
Control 10.32 10.74 11.21 10.76 0.69 0.63 0.57 0.63
Mean 9.84 10.24 10.73 0.71 0.67 0.61
CD(0.05) TSS: Treatments (A) – 0.45; Storage Interval (B) – 0.24 and AxB – N.S. Acidity : Treatments (A) - 0.03; Storage Interval (B) - 0.02 and A x B - N.S.
Table 3. Effect of GA3, triacontanol and calcium salts on total sugars and reducing sugars (per cent) during storage of kinnow fruits
Treatments Total sugar Reducing sugars
10 20 30 Mean 10 20 30 Mean
GA3 10ppm 6.67 6.83 7.12 6.87 3.34 3.42 3.55 3.44
GA3 20ppm 6.72 6.89 7.18 6.93 3.38 3.48 3.72 3.53
GA3 30ppm 7.21 7.24 7.57 7.34 3.49 3.63 3.79 3.64
Tria 400ppm 6.63 6.75 7.04 6.81 3.30 3.41 3.52 3.41
Tria 600ppm 6.68 6.79 7.08 6.85 3.34 3.40 3.53 3.42
CaCl2 4% 6.04 6.18 6.40 6.21 3.02 3.10 3.21 3.11
CaCl2 6% 5.99 6.15 6.32 6.15 2.99 3.16 3.30 3.15
Ca(NO3)2 0.1% 6.24 6.47 6.64 6.45 3.11 3.21 3.52 3.28
Ca(NO3)2 0.2% 5.92 6.09 6.31 6.11 3.04 3.07 3.13 3.08
Ca(NO3)2 0.3% 5.80 6.01 6.15 5.99 2.89 3.09 3.18 3.05
Control 6.92 7.08 7.53 7.18 3.46 3.52 3.75 3.58
Mean 6.44 6.59 6.85 3.21 3.32 3.47
CD(0.05) Total Sugars: Treatments (A) – 0.26; Storage Interval (B) – 0.13 and AxB – N.S. Reducing Sugar: Treatments (A) - 0.12; Storage Interval (B) - 0.06 and AxB – N.S.
Effect of GA3, Triacontanol and Calcium Salts in Kinnow shelf-life
26
(Brahmachari et al., 1997). Shinde et al. (2000) in Mosambirevealed similar results to that observed in the present study.
All the triacontanol and calcium treatments produced lowertotal sugars and reducing sugars in comparison to control.The decrease in the sugars with calcium application owes
to the fact that exogenous calcium incorporates intoprotopectin molecules in the middle membrane retardshydrolysis during post-harvest ripening (Sharma et al., 1996).
The results are in proximity with the findings of Ramakrishnaet al. (2001) in papaya. A continuous increase in the totalsugars and reducing sugars on an average was recorded
with increase in storage period. Increase in the level ofsugars during storage might be either due to hydrolyticconversion of polysaccharides (starch) into
monosaccharides (sugars) or due to concentration of juiceowing to dehydration (Jain et al., 2001).
From the foregoing discussion, inference can be drawn
that pre-harvest application of all calcium salt treatmentsand GA3 treatments help in reducing the physiological lossin weight and spoilage losses during ambient storage of
the kinnow fruits. However, the pre-harvest application ofCaCl2 6 per cent was observed to be the most efficacioustreatment in reducing the spoilage losses. Thus, foliar
application of CaCl2 6 per cent can be used for enhancingthe shelf-life of kinnow fruits during ambient storage.
REFERENCESBhullar, J. S., Dhillon, B. S. and Randhawa, J. S. (1985) Effect of
wrappers on the storage of kinnow mandarin. J. Res. PunjabAgric. Univ. 22 : 663-666.
Brahmchari, V. S., Kumar, Naresh and Kumar, Rajesh (1997) Effectof foliar feeding of calcium, potassium and growth substanceson yield and quality of guava (Psidium guajava L.). HaryanaJ. Hort. Sci. 26(3-4): 169-173.
Dhaka, R. S., Verma, M. K. and Agrawal, M. K. (2001) Effect of postharvest treatments on physico-chemical characters during
storage of mango cv. Totapuri. Haryana J. Hort. Sci. 30(1-2):36-38.
Faust, M. and Shear, C. B. (1972) The effect of calcium on respirationof apples. J. Amer. Soc. Hort. Sci. 97 : 437-439.
Faust, M. and Klein, J. D. (1973) Levels and sites of metabolicallyactive calcium in apple fruits. J. Amer. Soc. Hort. Sci. 99 : 93-94.
Jain, S. K., Mukherjee, S. and Gupta, N. K. (2001) Effect of post-harvest treatments and storage condition on the quality ofmango during storage. Haryana J. Hort. Sci. 30(3-4) : 183-187.
Khader, S. E. S. A. (1992) Effect of gibberellic acid and vapourguard on ripening, amylase and peroxidase activity in storageof mango. J. Hort. Sci. 67(6): 25-29.
Kumar, A., Rattanpal, H. S. and Randhawa, J. S. (2002) Storagebehaviour of polyethylene wrapped Red Blush grapefruitunder ambient conditions. Indian J. Citriculture 1(2): 179-184.
Mahajan, B. V. C., Dhatt, A. S. and Rattan, G. S. (2002) Evaluation ofvarious wax formulations on the post-harvest characteristicsof kinnow. Indian J. Citriculture 1(2): 185-188.
Nagpal, Rajesh and Kumar, Ranjit (1999) Effect of post-harvesttreatments on the quality of Dashehari mango during storage.Haryana J. Hort. Sci. 28(1-2) : 76-77.
Pathmanaban, G., Nagarajan, M., Manian, K. and Annamalainathan,K. (1995) Effect of fused calcium salts on post-harvestpreservation in fruits. Madras Agric. J. 82(1): 47-50.
Ramakrishna, M., Haribabu, K., Reddy, Y. N. and Purushotam, K.(2001) Effect of pre-harvest application of calcium on physico-chemical changes during ripening and storage of papaya.Indian J. Hort. 58(1): 228-231.
Sharma, R. M., Yamdagni, R., Gaur, H. and Sukla, R. K. (1996) Roleof calcium in horticulture – A review. Haryana J. Hort. Sci.25(4): 205-212.
Shinde, S. B., Kadam, B. A., Naik, D. M., Shinde, B. N., Shinde, N. N.and Purandare, N. D. (2000) Effect of growth regulators andchemicals on physico-chemical composition of Mosambi fruits(Citrus sinensis Osbeck). Hi-Tech Citrus Management : Proc.of International Symposium on Citriculture, pp. 637-639.
Ulrich, R. (1974) Biochemistry of fruits and their products. AcademicPress, New York, USA, pp. 89-118.
Tanjeet Singh Chahal, J. S. Bal and Kiran Kour
Received 8 September, 2011; Accepted 12 December, 2011

In India, annual production of rice is about 136.5 million
tonnes (http://www.indiastat.com) and about 136.5-150
million tonnes of paddy straw is estimated to be produced.
Paddy straw burning can be commonly seen during the
harvesting season which causes soil erosion and emission
of pollutants. Paddy straw has high content of cellulose
(35-40%), hemi-cellulose (20%), lignin (12%) and silica
(8%) (Pathak et al., 1986). But, the lignin complex and silica
incrustation shields the microbial action and hence restricts
paddy straw digestibility. So, the first step towards
economical utilization of paddy straw is to remove/degrade
lignin and silica.
Different types of pretreatments i.e., physical
(mechanical and thermal), chemical (acid, alkali, oxidizing
agents), physico-chemical (AFEX, CO2 and steam explosion)
and biological (using ligno-cellulosic microbes/enzymes)
are being tried to increase the digestibility of rice straw.
These pretreatments technologies either change or remove
structural and compositional constraints to improve
hydrolysis rate. Amongst all these pretreatment methods, a
few can be used on an industrial scale based on economics
and environmental consideration (Sun and Cheng, 2002).
Keeping in view all these aspects and the importance of
paddy straw for energy and power generation along with
combating the environmental pollution, the present study
of microwave supplementation to the sodium sulphite
pretreatment was carried out so as to reduce the
concentration of chemical for enhancing paddy straw
digestibility.
Effect of Sodium Sulphite-Microwave Pretreatment on Paddy StrawDigestibility
Urmila Gupta Phutela*, Karamjeet Kaur1 and N.K. Khullar2
School of Energy Studies for Agriculture, College of Agricultural Engineering and Technology,1Department of Microbiology, College of Basic Sciences and Humanities,
2Department of Civil Engineering, College of Agricultural Engineering and Technology,Punjab Agricultural University, Ludhiana-141 004, India
*E-mail: [email protected]
Abstract: To remove lignin and silica complex of paddy straw, which are the main hindering factors in paddy straw digestibility, sodiumsulphite (different concentrations i.e. 2, 4, 6, 8, and 10%) pretreatments in combination with microwave (30 and 60 min) were applied.Microwave irradiations were found to enhance the paddy straw biodegradability in combination with sodium sulphite. Lignin and silicacontent of pretreated paddy straw decreased by 30.0 and 16.9 per cent, respectively as compared to untreated paddy straw whenpaddy straw was soaked in 10 per cent sodium sulphite for 48 h. Whereas, 48.3 and 15.4 per cent reduction in lignin and silica contentwas found in case of only 4 per cent sodium sulphite pretreatment in combination with microwave (60 minutes).
Key Words: Paddy straw, Ligno-cellulose, Microwave, Sodium-sulphite
MATERIAL AND METHODS
Procurement of the materials. Paddy straw was
procured from the research field of Punjab AgriculturalUniversity, Ludhiana. The paddy straw was chopped to 3-5cm and was stored in polythene bags at room temperature.
The chemicals used for chemical pretreatment andproximate analysis were of analytical grade.
Chemical-soaking pretreatment of paddy straw.Solutions of different concentrations (2, 4, 6, 8 and 10%) ofNa2SO3 were poured onto the chopped, washed and driedpaddy straw @ 10 per cent and paddy straw was soaked in
chemical solution for 24 and 48h. After the desired period ofsoaking, the solution was decanted off and paddy strawwas washed with tap water until the washings were clean,
colorless and neutral to the pH paper. The paddy straw wasthen dried overnight in the oven at 100oC, ground and thenused for proximate and chemical analysis i.e., TS, VS, total
sugars, cellulose, hemi-cellulose, lignin and silicadetermination.
Chemical-Microwave pretreatment of paddy straw.Beaker containing paddy straw soaked in solution ofdifferent concentrations of Na2SO3 (as mentioned in theprevious section) was irradiated with microwave (180oC)
for 30 min. The same pretreatment was repeated for 60min also. Pretreated paddy straw was washed with tapwater until the washings were clean, colorless and neutral
to the pH paper. Paddy straw was dried overnight in oven at100oC. Pretreated paddy straw was ground and stored inpolythene bags.
Indian J. Ecol. (2012) 39(1) : 27-31Indian Journal
of Ecology

28
A control (untreated paddy straw) was also analyzedsimultaneously along with these pretreatments in order to
determine the extent of degradation of various componentsof paddy straw. All the experiments for proximate andchemical analysis were conducted in triplicates.
Analytical procedures and statistical analysis. Theproximate and chemical analysis of paddy straw i.e. totalsolids (TS), volatile solids (VS), cellulose, hemi-cellulose,
lignin and silica content was done as per standard methods(AOAC, 2000). Total sugars were estimated by Phenol-Sulphuric acid method using glucose as standard (Dubois
et al., 1956). Critical difference (at 5% level) was calculated.
RESULTS AND DISCUSSION
Effect of sodium sulphite-soaking pretreatment onpaddy straw degradation. There was significant decrease
in TS of the paddy straw with the increase in Na2SO3
concentration and soaking period whereas VS content getincreased. A minimum value of TS was obtained at 10%
Na2SO3-48h soaking. Maximum amount of VS was obtainedat 10% Na2SO3-48h soaking. A 27.5 per cent and 31%increase in total sugars was observed at 10% Na2SO3
concentration when paddy straw was soaked for 24h and48h, respectively (Table 1).
Cellulose increased significantly w.r.t. increasing
Na2SO3 concentration but non-significantly w.r.t. soakingperiod. An increase of 3.9 and 4.9 per cent cellulose wasobtained at 10% Na2SO3 for 24 and 48h, respectively as
compared to control (43.1%). Hemi-cellulose increasedsignificantly w.r.t. both the parameters and was maximumat 10% Na2SO3 showing an increase of 7.4 -10.2% than
that of the control (24.4%). There was a significant decreasein lignin concentration reaching a minimum of 4.5% (24hsoaking) and 4.2% (48h soaking) accounting to a decrease
of 25 and 30 per cent, respectively than that of the control(6%). Silica concentration reached a minimum value of 5.7%and 5.4% at 10% Na2SO3-24h soaking and 10% Na2SO3-
48h soaking corresponding to a decrease of 12.3 and 16.9per cent, respectively.
Effect of sodium sulphite-microwave pretreatmenton paddy straw degradation. A decreasing trend in TS andincreasing trend in VS was observed while moving towardshigher Na2SO3 concentration and increasing microwave
duration (Table 2). TS decreased to 95.2 and 94.7 per centin case of 10% Na2SO3-30 and 10% Na2SO3-60 minmicrowave, respectively from 96.4 per cent in control
indicating a decrease of 1.2 and 1.8 per cent. Maximumincrease in VS was observed at 10% Na2SO3. Increase inmicrowave duration from 30 to 60 min did not increase the
VS content of paddy straw significantly. Total sugars werefound to increase significantly from 46.5 mg total sugars/g
PS in the control to 98.7 mg total sugars/g PS at 10%Na2SO3-60 min microwave indicating an increase of 112.3per cent than the control. The increase in sugars could be
due to the degradation of cellulose/hemi-cellulose tofermentable sugars and decrease might be the result ofconversion of these fermentable sugars into furfural or HMF
(Gregg and Saddler, 1996). Reducing sugars increase withthe increasing radiation dose in rice straw, rice hull andcorn husk hydrolyzed with acid (Rosa et al., 1983). In case
of chemical-microwave pretreatment, the increase in totalsugars might be result of supplementation of the microwaveirradiation to the alkali resulting in the cleavage of ß-1, 4
glycosidic bond in the cellulose thereby, releasingfermentable sugars (Ma et al., 2009).
A maximum increase of 10.7 and 12.3 per cent cellulose
was obtained when paddy straw was pretreated with 10%Na2SO3 in combination with microwave for 30 and 60 min,respectively, as compared to the control. Hemi-cellulose
increased significantly to 26.1 and 26.7 per cent at 10%Na2SO3 for the two microwave durations (30 and 60 min)from a control with 24.4 per cent hemi-cellulose. An increase
of 30.6 per cent cellulose and 43.3 per cent hemi-cellulosecontent of paddy straw by microwave pretreatment (680W;24 minutes) has been reported (Ma et al, 2009). Profound
and significant decrease in lignin was found reaching aminimum of 2.3% for 10% Na2SO3-60 min microwave.Oxygen-sodium sulphite pulping method was reported to
be better than conventional alkaline pulping and oxygen-sodium hydroxide pulping with 95 per cent delignificationand high retention of both cellulose and hemi-cellulose
(Park et al., 2000). A reduction of 26.2 and 30.8 per cent insilica content was observed for 10% Na2SO3-30 and 60min microwave, respectively as compared to the untreated
straw.
Microwave irradiations cause acceleration of ions,collision with other molecules, rapid rotation (2450 million
times/sec) of dipoles such as H2O with an alternating electricfield (Banik et al., 2003), which generates sufficient heat forthe solubilization of hindering components such as lignin
(soluble only at high temperatures) and disruption ofsilicified waxy surface and breakdown of lignin-hemicellulose complex (Ma et al., 2009), which make these
irradiations highly suitable for enhancing paddy strawdigestibility.
It is concluded that microwave irradiations reduce the
need of higher concentrations of chemical for pretreatmentpurpose as observed from the current study where 48.3
Urmila Gupta Phutela, Karamjeet Kaur and N.K. Khullar

29
Tab
le 1
. E
ffect
of
sodi
um s
ulph
ite-s
oaki
ng p
retr
eatm
ent
on p
addy
str
aw d
iges
tibili
ty
Pro
xim
ate
and
Unt
reat
edS
oaki
ngN
a 2SO
3 co
ncen
trat
ion
(%)
CD
5%
CD
5%
CD
5%
chem
ical
padd
yp
eri
od
(Na 2S
O3
(Soa
king
(Na 2S
O3 co
nc.
com
posi
tion
ofs
tra
w(h
)co
nc.
)p
eri
od
)X
so
akin
gp
ad
dy
stra
w(c
on
tro
l)p
eri
od
)0
24
68
10
Tota
l sol
ids
96.4
2496
.396
.396
.295
.795
.695
.20.
370.
21N
S
(%)
(↓0.
1)(↓
0.1)
(↓0.
2)(↓
0.7)
(↓0.
8)(↓
1.2)
4896
.296
.195
.895
.495
.395
.1
(↓0.
2)(↓
0.3)
(↓0.
6)(↓
1.0)
(↓1.
1)(↓
1.3)
Vol
atile
sol
ids
89.0
2489
.289
.289
.589
.589
.789
.90.
400.
230.
57
(%)
(↑0.
2)(↑
0.2)
(↑0.
6)(↑
0.6)
(↑0.
8)(↑
1.0)
4889
.389
.489
.689
.789
.990
.1
(↑0.
3)(↑
0.4)
(↑0.
7)(↑
0.8)
(↑1.
0)(↑
1.2)
Tota
l su
gars
46.5
2447
.450
.554
.956
.857
.859
.30.
390.
220.
55
(mg-1
PS
)(↑
1.9)
(↑8.
6)(↑
18.1
)(↑
22.2
)(↑
24.3
)(↑
27.5
)
4847
.252
.655
.458
.559
.260
.9
(↑1.
5)(↑
13.1
)(↑
19.1
)(↑
25.8
)(↑
27.3
)(↑
31.0
)
Cel
lulo
se (
%)
43.1
2443
.243
.643
.944
.144
.444
.80.
32N
SN
S
(↑0.
2)(↑
1.2)
(↑1.
9)(↑
2.3)
(↑3.
0)(↑
3.9)
4843
.343
.744
.044
.244
.745
.2
(↑0.
5)(↑
1.4)
(↑2.
1)(↑
2.6)
(↑3.
7)(↑
4.9)
Hem
i-cel
lulo
se24
.424
24.5
24.5
24.7
25.2
25.5
26.2
0.41
0.24
NS
(%)
(↑0.
4)(↑
0.4)
(↑1.
2)(↑
3.3)
(↑4.
5)(↑
7.4)
4824
.724
.925
.125
.625
.926
.9
(↑1.
2)(↑
2.0)
(↑2.
9)(↑
4.9)
(↑6.
1)(↑
10.2
)
Lign
in (
%)
6.0
246.
46.
15.
35.
24.
94.
50.
380.
22N
S
(↑6.
7)(↑
1.7)
(↓11
.7)
(↓13
.3)
(↓18
.3)
(↓25
.0)
486.
26.
05.
04.
94.
64.
2
(↑3.
3)(0
)(↓
16.7
)(↓
18.3
)(↓
23.3
)(↓
30.0
)
Sili
ca (
%)
6.5
246.
86.
66.
26.
15.
95.
70.
380.
22N
S
(↑4.
6)(↑
1.5)
(↓4.
6)(↓
6.2)
(↓9.
2)(1
2.3
)
486.
76.
45.
85.
75.
65.
4
(↑3.
1)(↓
1.5)
(↓10
.8)
(↓12
.3)
(↓13
.8)
(↓16
.9)
Val
ues
in p
aren
thes
es i
ndic
ate
incr
ease
(↑)
or
decr
ease
(↓)
w.r
.t. u
ntre
ated
pad
dy s
traw
Paddy Straw Digestibility with Sodium Sulphite

30 Urmila Gupta Phutela, Karamjeet Kaur and N.K. Khullar
Tab
le 2
. E
ffect
of
sodi
um s
ulph
ite-m
icro
wav
e pr
etre
atm
ent
on p
addy
str
aw d
iges
tibili
ty
Pro
xim
ate
and
Unt
reat
edM
icro
Na 2S
O3 co
ncen
trat
ion
(%)
CD
CD
CD
chem
ical
padd
yw
av
e(N
a 2SO
3(M
icro
(Na 2S
O3 co
nc.
com
posi
tion
ofs
tra
wdu
ratio
nco
nc.
)w
av
eX
M
icro
pa
dd
y st
raw
(co
ntr
ol)
(min
)d
ura
tion
)w
av
e0
24
68
10d
ura
tion
)
Tota
l so
lids
(%)
96.4
3096
.496
.195
.895
.695
.495
.20.
380.
22N
S
(0)
(↓0.
3)(↓
0.6)
(↓0.
8)(↓
1.0)
(↓1.
2)
6096
.395
.995
.595
.395
.194
.7
(↓0.
1)(↓
0.5)
(↓0.
9)(↓
1.1)
(↓1.
3)(↓
1.8)
Vol
atile
sol
ids
(%)
89.0
3089
.289
.389
.489
.689
.990
.10.
37N
SN
S
(↑0.
2)(↑
0.3)
(↑0.
4)(↑
0.7)
(↑1.
0)(↑
1.2)
6089
.389
.489
.689
.890
.090
.2
(↑0.
3)(↑
0.4)
(↑0.
7)(↑
0.9)
(↑1.
1)(↑
1.3)
Tota
l su
gars
46.5
3047
.455
.358
.573
.885
.592
.90.
480.
280.
68
(mg-1
PS
)(↑
1.9)
(↑18
.9)
(↑25
.8)
(↑58
.7)
(↑83
.9)
(↑99
.8)
6047
.257
.965
.482
.689
.798
.7
(↑1.
5)(↑
24.5
)(↑
40.6
)(↑
77.6
)(↑
92.9
)(↑
112.
3)
Cel
lulo
se (
%)
43.1
3043
.243
.745
.145
.746
.547
.70.
360.
210.
52
(↑0.
2)(↑
1.4)
(↑4.
6)(↑
6.0)
(↑7.
9)(1
0.7
)
6044
.643
.946
.446
.947
.848
.4
(↑3.
5)(↑
1.9)
(↑7.
7)(↑
8.8)
(↑10
.9)
(↑12
.3)
Hem
i-cel
lulo
se24
.430
24.5
24.5
24.9
25.2
25.6
26.1
0.40
NS
0.57
(%)
(↑0.
4)(↑
0.4)
(↑2.
0)(↑
3.3)
(↑4.
9)(↑
7.0)
6024
.524
.725
.325
.725
.926
.7
(↑0.
4)(↑
1.2)
(↑3.
7)(↑
5.3)
(↑6.
1)(↑
9.4)
Lign
in (
%)
6.0
306.
46.
03.
53.
42.
72.
60.
440.
25N
S
(↑6.
7)(0
)(↓
41.7
)(↓
43.3
)(↓
65.0
)(↓
56.7
)
606.
05.
73.
12.
92.
42.
3
(0)
(↓5.
0)(↓
48.3
)(↓
51.7
)(↓
60.0
)(↓
61.7
)
Sili
ca (
%)
6.5
306.
86.
55.
85.
75.
34.
80.
48N
SN
S
(↑4.
6)(0
)(↓
10.8
)(↓
12.3
)(↓
18.5
)(↓
26.2
)
607.
56.
35.
55.
44.
94.
5
(↑15
.4)
(↓3.
1)(↓
15.4
)(↓
16.9
)(↓
24.6
)(3
0.8
)
Val
ues
in p
aren
thes
es i
ndic
ate
incr
ease
(↑)
or
decr
ease
(↓)
w.r.
t. un
trea
ted
padd
y st
raw

31
and 15.4 per cent decrease in lignin and silica content wasobserved when microwaves are supplemented with only
4% Na2SO3. Whereas, without microwave, 10% Na2SO3 wasneeded to achieve 30.0 and 16.9 per cent reduction in ligninand silica content, respectively.
REFERENCESAOAC (2000) Association of Official Analytical Chemists, Official
Methods of Analysis, 17th Edition, Maryland, USA.
Banik, S., Bandyopadhyay, S. and Ganguly, S. (2003) Bio-effectsof microwave-a brief review. Bioresour. Technol. 87: 155-159.
Dubois, M., Gilles, K.A., Hamilton, J.K., Rebers, P.A. and Smith, F.(1956) Calorimetric method for determination of sugars andrelated substances. Anal. Chem. 28: 350-356.
Gregg, D. and Saddler, J.N. (1996) A techno-economic assessmentof the pretreatment and fractionation steps of a biomass toethanol process. Appl. Biochem. Biotechnol. 57-58: 711-727.
http://www.indiastat.com
Ma, H., Liu, W.W., Chen, X., Wu, Y.J. and Yu, Z.L. (2009) Enhancedenzymatic saccharification of rice straw by microwavepretreatment. Bioresour. Technol. 100: 1279-1284.
Pathak, B.S., Jain, A.K. and Singh, A. (1986) Characteristics ofcrop residues. Agri. Wastes 16: 27-35.
Park, S.Y., Koda, K., Matsumoto, Y., Meshitsuka, G. and Iiyama, K.(2000) Oxygen weak base pulping of rice straw with minimumsilica removal. Japan TAPPI J. 54(9): 1245- 1251.
Rosa, A.M.D., Mines, A.S.D., Banson, R.B. and Nuguid, Z.F.S. (1983)Radiation pretreatment of cellulose for energy production.Radiat. Phys. Chem. 22(3-5): 861-867.
Sun, Y. and Cheng, J. (2002) Hydrolysis of lignocellulosic materialsfor ethanol production: a review. Bioresour. Technol. 83: 1-11.
Paddy Straw Digestibility with Sodium Sulphite
Received 8 July, 2011; Accepted 4 May, 2012
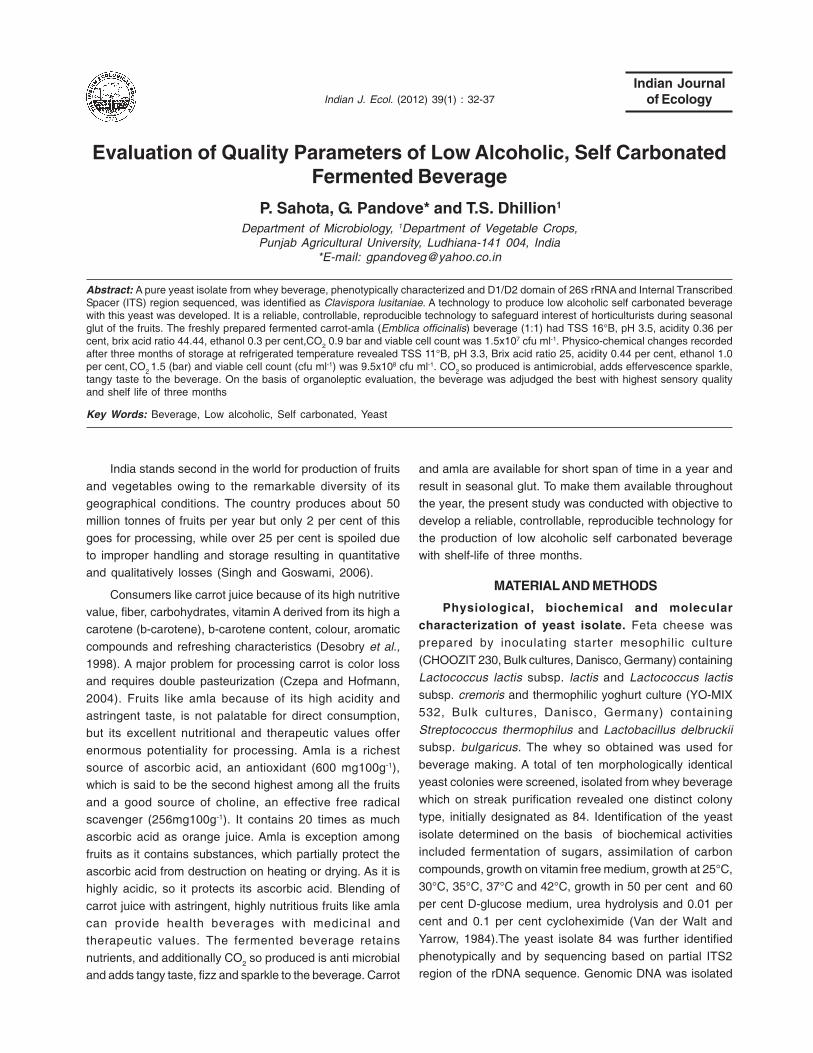
India stands second in the world for production of fruits
and vegetables owing to the remarkable diversity of itsgeographical conditions. The country produces about 50million tonnes of fruits per year but only 2 per cent of this
goes for processing, while over 25 per cent is spoiled dueto improper handling and storage resulting in quantitativeand qualitatively losses (Singh and Goswami, 2006).
Consumers like carrot juice because of its high nutritivevalue, fiber, carbohydrates, vitamin A derived from its high acarotene (b-carotene), b-carotene content, colour, aromatic
compounds and refreshing characteristics (Desobry et al.,1998). A major problem for processing carrot is color lossand requires double pasteurization (Czepa and Hofmann,
2004). Fruits like amla because of its high acidity andastringent taste, is not palatable for direct consumption,but its excellent nutritional and therapeutic values offer
enormous potentiality for processing. Amla is a richestsource of ascorbic acid, an antioxidant (600 mg100g-1),which is said to be the second highest among all the fruits
and a good source of choline, an effective free radicalscavenger (256mg100g-1). It contains 20 times as muchascorbic acid as orange juice. Amla is exception among
fruits as it contains substances, which partially protect theascorbic acid from destruction on heating or drying. As it ishighly acidic, so it protects its ascorbic acid. Blending of
carrot juice with astringent, highly nutritious fruits like amlacan provide health beverages with medicinal andtherapeutic values. The fermented beverage retains
nutrients, and additionally CO2 so produced is anti microbialand adds tangy taste, fizz and sparkle to the beverage. Carrot
Evaluation of Quality Parameters of Low Alcoholic, Self CarbonatedFermented Beverage
P. Sahota, G. Pandove* and T.S. Dhillion1
Department of Microbiology, 1Department of Vegetable Crops,Punjab Agricultural University, Ludhiana-141 004, India
*E-mail: [email protected]
Abstract: A pure yeast isolate from whey beverage, phenotypically characterized and D1/D2 domain of 26S rRNA and Internal TranscribedSpacer (ITS) region sequenced, was identified as Clavispora lusitaniae. A technology to produce low alcoholic self carbonated beveragewith this yeast was developed. It is a reliable, controllable, reproducible technology to safeguard interest of horticulturists during seasonalglut of the fruits. The freshly prepared fermented carrot-amla (Emblica officinalis) beverage (1:1) had TSS 16°B, pH 3.5, acidity 0.36 percent, brix acid ratio 44.44, ethanol 0.3 per cent,CO2 0.9 bar and viable cell count was 1.5x10⁷ cfu ml-1. Physico-chemical changes recordedafter three months of storage at refrigerated temperature revealed TSS 11°B, pH 3.3, Brix acid ratio 25, acidity 0.44 per cent, ethanol 1.0per cent, CO2 1.5 (bar) and viable cell count (cfu ml-1) was 9.5x10⁸ cfu ml-1. CO2 so produced is antimicrobial, adds effervescence sparkle,tangy taste to the beverage. On the basis of organoleptic evaluation, the beverage was adjudged the best with highest sensory qualityand shelf life of three months
Key Words: Beverage, Low alcoholic, Self carbonated, Yeast
and amla are available for short span of time in a year and
result in seasonal glut. To make them available throughoutthe year, the present study was conducted with objective todevelop a reliable, controllable, reproducible technology for
the production of low alcoholic self carbonated beveragewith shelf-life of three months.
MATERIAL AND METHODS
Physiological, biochemical and molecularcharacterization of yeast isolate. Feta cheese was
prepared by inoculating starter mesophilic culture
(CHOOZIT 230, Bulk cultures, Danisco, Germany) containing
Lactococcus lactis subsp. lactis and Lactococcus lactissubsp. cremoris and thermophilic yoghurt culture (YO-MIX
532, Bulk cultures, Danisco, Germany) containing
Streptococcus thermophilus and Lactobacillus delbruckiisubsp. bulgaricus. The whey so obtained was used for
beverage making. A total of ten morphologically identical
yeast colonies were screened, isolated from whey beverage
which on streak purification revealed one distinct colony
type, initially designated as 84. Identification of the yeast
isolate determined on the basis of biochemical activities
included fermentation of sugars, assimilation of carbon
compounds, growth on vitamin free medium, growth at 25°C,
30°C, 35°C, 37°C and 42°C, growth in 50 per cent and 60
per cent D-glucose medium, urea hydrolysis and 0.01 per
cent and 0.1 per cent cycloheximide (Van der Walt and
Yarrow, 1984).The yeast isolate 84 was further identified
phenotypically and by sequencing based on partial ITS2region of the rDNA sequence. Genomic DNA was isolated
Indian J. Ecol. (2012) 39(1) : 32-37Indian Journal
of Ecology

33
from pure culture (Sambrook et al. 2001). Using consensusprimers, D1/D2 domain of 26S rRNA, ITS-1 and 2 region
fragment (0.4 Kb) was amplified using high fidelity Taqpolymerase (Hi-Media). The PCR product was cloned in topTZ57R/T vector as per manufacturer’s instruction
(Fermentas, USA) and plasmid DNA was bi-directionallysequenced using the forward, reverse and an internalprimer. Sequence data was aligned and analyzed for finding
the closest homology for the microbe. The MEGA 4.0 package(Tamura et al., 2007) was used for all analyses.
Screening of yeast isolates for potential offermentation of fruit juices. Screening of yeast isolates forpotential of fermentation of fruit juices was carried out byinoculating the yeast isolate 84 in amla juice (procured from
the Deptt. of Horticulture, Punjab Agricultural University,Ludhiana). The inoculum for low-alcoholic self carbonatedbeverage was prepared in boiled fruit juice. Brix adjusted to
16°B with boiled and cooled sucrose solution. A loopful of24 h old yeast culture was transferred to 100 ml fruit juice in250 ml Erlenmeyer flask and incubated at 20±5°C for 24
hrs to achieve concentration 107-108 cells ml-1. Studies onfermentation potential of yeast isolates in fruit juice wasdone in one litre glass bottles each containing 750 ml juice
(16°B), inoculated @ 0.5 per cent and incubated at 20±5°C.The bottles were analyzed for ethanol and carbon dioxide(bar) production after 36 h at 20±5°C temperature.
Fruits and extraction of juices. Carrot var. PC-34 wasprocured from the Department of Vegetable crops, PAU,Ludhiana. Amla var. Chaikya was obtained from Department
of Horticulture, PAU, Ludhiana. Healthy fruits and vegetableswere washed with chlorinated water and peeled. Carrotjuice was extracted aseptically and in hygienic conditions
using Electronic juicer (INALSA), where as amla waspassed through screw type extractor to extract juice.Extracted juice was filtered through muslin cloth
Preparation of sugar solution. The granulated sucroseprocured from local market of Ludhiana city, was boiled inequal water (500g 100 litre-1) for 5 min and then cooled to
room temperature to prepare sugar solution.
Physico-chemical analysis of carrot and amla.Physico-chemical analysis of Carrot and amla juice was
done, TSS (°B), pH, acidity (%), Brix-acid ratio, total sugar(%), reducing sugar (%), ascorbic acid (mg 100 ml-1), totalcarotenoids (mg 100ml-1), juice recovery kg-1. Carrot and
amla juices were mixed in the ratio of 3:1, 1:1 and 1:3.Blended juice was diluted in the ratio of 1:2 with water.Diluted juice was pasteurized at 82°C for 15 secs, cooledand brix adjusted to 16°B by adding sugar solution followedby culture @ 0.5 per cent. It was incubated for 36 hrs at
20±5°C. The beverage was refrigerated for 24 h, siphoned,bottled and stored in refrigerated conditions.
Chemical Analysis. The pH of the juice wasdetermined using a digital pH meter (Electronic Corporarionof India Ltd., Hyderabad, type 101). Total acidity expressed
as per cent anhydrous citric acid by titration againststandardized 0.1N NaOH (AOAC, 1980). Per cent totalsoluble solids (%TSS) determined by using Erma hand
refractometer of 0-32°B (UNICO make). Total sugarsestimated by phenol-sulphuric acid method of Dubois et al.(1956) using glucose as standard. Reducing sugars
estimated by the method of Miller (1959). Ascorbic acidwas determined by titrametric method using 2, 6-dichlorophenol indophenol dye (AOVC, 1996). Per cent
ethanol in beverage was estimated by theSpectrophotometric method. Higher alcohols, aldehyde andethyl acetate in beverage were estimated by GC Headspace
Injection, TR wax Column, Detection by FID [PunjabBiotechnology Incubator, Phase-V, SAS Nagar (Mohali),Punjab, India]. Carbon dioxide volumes in beverage bottles
were determined by Zahm and Nagel piercing device.Sensory evaluation of beverage was carried out using nine-point hedonic scale (Amerine et al., 1965).
Statistical analysis was done by using GSTATO4 andCPCS1 software developed by Maths, Statistics and PhysicsDepartment, PAU, Ludhiana.
RESULTS AND DISCUSSION
Physiological and biochemical characterization.Preliminary identification was attempted using classicaltechniques involving physiological and biochemical tests.
After three days of growth in glucose yeast extract (GYE)broth at 25°C, cells of yeast isolates 84 were mostly elliptical(5.1 x 6.5μm and 5.3 x 6.7μm).The colony morphology of the
isolate on solid media exhibited viscous texture with off-white colouration and matt appearances, the shape of thecolonies were considerably distinct. After four weeks on
GYE agar, 84 colonies were off-white, butyrous, dull, waxy,and had convex to umbonate elevations. The results of thecarbon assimilation and the fermentation tests showed that
the yeast isolate 84 was able to ferment D-glucose, D-xyloseand raffinose while assimilate D-galactose, L-sorbose, D-glucosamine, D-ribose, D-xylose, L-arabinose, sucrose,
maltose, Alpha, alpha-trehalose, Me alpha-D-glucoside,melezitose, glycerol, ribotol, D-glucitol, D-mannitol, D-glucono-1,5-lactone, 2-keto-D-gluconate, D-gluconate, DL-
lactate, succinate, citrate and ethanol. Isolate 84 had anidentical physiological and biochemical profile toDebaromyces hansenii except that 84 were unable to
Quality Parameters of Low Alcoholic, Self Carbonated Fermented Beverage

34
metabolize soluble starch, ethylamine, L-lysine, andcadaverine. Similarly, isolate 84 was able to grow at
temperatures up to 42°C; in high osmotic pressureconditions (50 % glucose); exhibited a negative starch test;was resistant to 1000 ppm cycloheximide; and was not
able to grow in vitamin-free media. On the basis ofphysiological, biochemical, nucleotide homology (Table 1)and phylogenetic analysis (Fig.1), the isolate 84 was
detected to be Clavispora lusitaniae and was deposited inGenBank of NCBI under accession number: EF221824.Nearest homologous genus and species of isolate 84 was
found to be Candida flosculorum (Accession No. EF137918).
Screening of yeast isolates for fermentation ondifferent juices for preparation of low-alcoholic naturallycarbonated beverage. C. lusitaniae EF221824 was usedfor carrying out fermentation on amla juice. Yeast isolate C.lusitaniae EF568047 showed the potential to produce low
alcohol and carbonation in amla juice with carbonation of0.9 bars and ethanol concentration of 0.4 per cent. Sobeverage was prepared using C. lusitaniae EF568047
under standardized condition. Markides (1986) reported thatyeasts ferment the sugar to alcohol and producing CO2 asthe by-product having the bottle pressure of about 500-600
KPa (5-6 atmospheres) at 10°C; after the completion of
Table 1. Percentage homologies of yeast isolate 84 based on nucleotide sequence
Isolates Percentage homology
1 2 3 4 5 6 7 8 9 10 11
84 (1) * 100 100 100 98 99 95 96 82 99 77
EF221824 (2) * 100 100 98 99 95 96 82 99 77
EF568047 (3) * 100 98 99 95 96 82 99 77
EF568024 (4) * 98 99 95 96 82 99 77
AYI74102 (5) * 98 95 96 82 98 77
A Y 493434 (6) * 94 95 81 98 77
EU568925 (7) * 93 80 98 76
A Y321464 (8) * 80 96 77
EF137918 (9) * 81 78
A Y321465 (10) * 77
EF060724 (11) *
Fig. 1. Phylogenetic tree of yeast isolate 84 (using neighbor joining method)
P. Sahota, G. Pandove and T.S. Dhillion
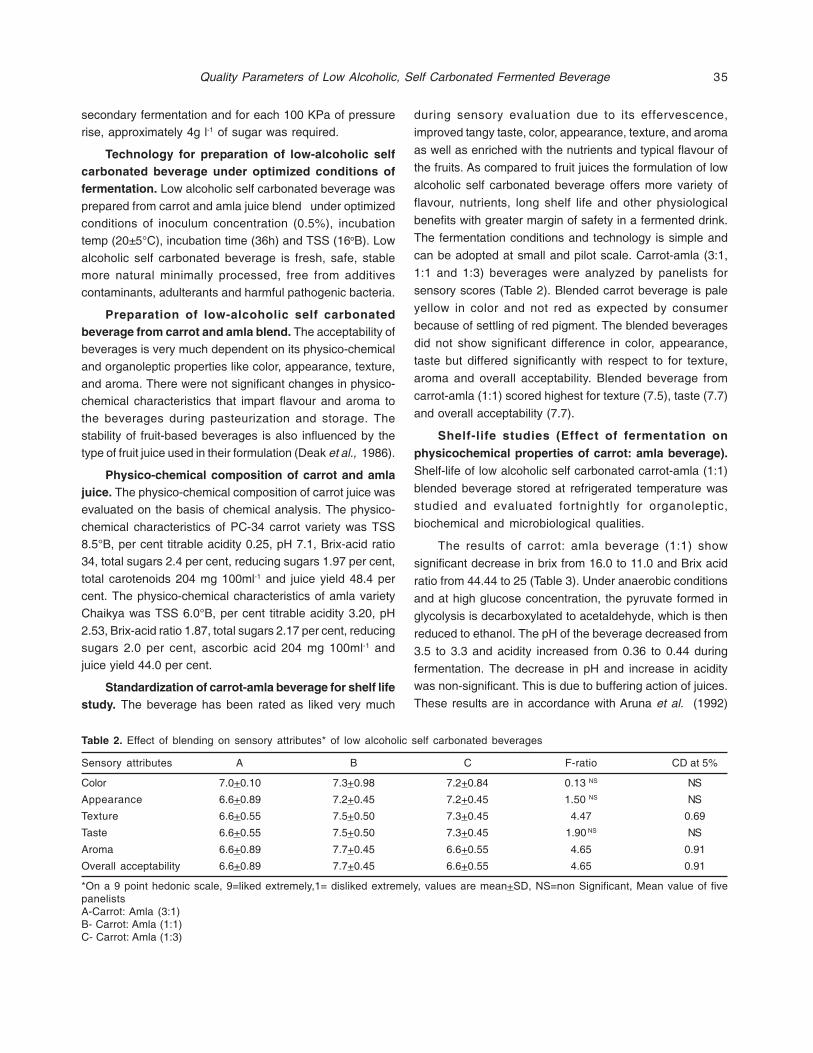
35
secondary fermentation and for each 100 KPa of pressurerise, approximately 4g l-1 of sugar was required.
Technology for preparation of low-alcoholic selfcarbonated beverage under optimized conditions offermentation. Low alcoholic self carbonated beverage was
prepared from carrot and amla juice blend under optimizedconditions of inoculum concentration (0.5%), incubationtemp (20±5°C), incubation time (36h) and TSS (16oB). Low
alcoholic self carbonated beverage is fresh, safe, stablemore natural minimally processed, free from additivescontaminants, adulterants and harmful pathogenic bacteria.
Preparation of low-alcoholic self carbonatedbeverage from carrot and amla blend. The acceptability ofbeverages is very much dependent on its physico-chemical
and organoleptic properties like color, appearance, texture,and aroma. There were not significant changes in physico-chemical characteristics that impart flavour and aroma to
the beverages during pasteurization and storage. Thestability of fruit-based beverages is also influenced by thetype of fruit juice used in their formulation (Deak et al., 1986).
Physico-chemical composition of carrot and amlajuice. The physico-chemical composition of carrot juice wasevaluated on the basis of chemical analysis. The physico-
chemical characteristics of PC-34 carrot variety was TSS8.5°B, per cent titrable acidity 0.25, pH 7.1, Brix-acid ratio34, total sugars 2.4 per cent, reducing sugars 1.97 per cent,
total carotenoids 204 mg 100ml-1 and juice yield 48.4 percent. The physico-chemical characteristics of amla varietyChaikya was TSS 6.0°B, per cent titrable acidity 3.20, pH
2.53, Brix-acid ratio 1.87, total sugars 2.17 per cent, reducingsugars 2.0 per cent, ascorbic acid 204 mg 100ml-1 andjuice yield 44.0 per cent.
Standardization of carrot-amla beverage for shelf lifestudy. The beverage has been rated as liked very much
during sensory evaluation due to its effervescence,
improved tangy taste, color, appearance, texture, and aroma
as well as enriched with the nutrients and typical flavour of
the fruits. As compared to fruit juices the formulation of low
alcoholic self carbonated beverage offers more variety of
flavour, nutrients, long shelf life and other physiological
benefits with greater margin of safety in a fermented drink.
The fermentation conditions and technology is simple and
can be adopted at small and pilot scale. Carrot-amla (3:1,
1:1 and 1:3) beverages were analyzed by panelists for
sensory scores (Table 2). Blended carrot beverage is pale
yellow in color and not red as expected by consumer
because of settling of red pigment. The blended beverages
did not show significant difference in color, appearance,
taste but differed significantly with respect to for texture,
aroma and overall acceptability. Blended beverage from
carrot-amla (1:1) scored highest for texture (7.5), taste (7.7)
and overall acceptability (7.7).
Shelf-life studies (Effect of fermentation onphysicochemical properties of carrot: amla beverage).Shelf-life of low alcoholic self carbonated carrot-amla (1:1)
blended beverage stored at refrigerated temperature was
studied and evaluated fortnightly for organoleptic,
biochemical and microbiological qualities.
The results of carrot: amla beverage (1:1) show
significant decrease in brix from 16.0 to 11.0 and Brix acid
ratio from 44.44 to 25 (Table 3). Under anaerobic conditions
and at high glucose concentration, the pyruvate formed in
glycolysis is decarboxylated to acetaldehyde, which is then
reduced to ethanol. The pH of the beverage decreased from
3.5 to 3.3 and acidity increased from 0.36 to 0.44 during
fermentation. The decrease in pH and increase in aciditywas non-significant. This is due to buffering action of juices.
These results are in accordance with Aruna et al. (1992)
Table 2. Effect of blending on sensory attributes* of low alcoholic self carbonated beverages
Sensory attributes A B C F-ratio CD at 5%
Color 7.0+0.10 7.3+0.98 7.2+0.84 0.13 NS NS
Appearance 6.6+0.89 7.2+0.45 7.2+0.45 1.50 NS NS
Texture 6.6+0.55 7.5+0.50 7.3+0.45 4.47 0.69
Taste 6.6+0.55 7.5+0.50 7.3+0.45 1.90 NS NS
Aroma 6.6+0.89 7.7+0.45 6.6+0.55 4.65 0.91
Overall acceptability 6.6+0.89 7.7+0.45 6.6+0.55 4.65 0.91
*On a 9 point hedonic scale, 9=liked extremely,1= disliked extremely, values are mean+SD, NS=non Significant, Mean value of fivepanelistsA-Carrot: Amla (3:1)B- Carrot: Amla (1:1)C- Carrot: Amla (1:3)
Quality Parameters of Low Alcoholic, Self Carbonated Fermented Beverage

36
Table 3. Effect of storage on low alcoholic self carbonated carrot:amla (1:1) blended beverage
Carrot: amla (1:1) Fresh 15days 30days 45days 60days 75days 90days CD at 5%
(p= 0.05)
Physico-chemical properties
TSS (oB) 16.00 16.00 15.85 15.10 14.25 13.20 11.00 0.35
pH 3.50 3.50 3.40 3.40 3.40 3.30 3.30 NS
Acidity (%) 0.36 0.36 0.37 0.41 0.42 0.43 0.44 NS
Brix acid ratio 44.44 44.44 42.89 36.82 33.92 30.70 25.00 0.85
Alcohol (w/v) 0.30 0.40 0.60 0.70 0.70 0.80 1.00 NS
CO2 (bar) 0.90 0.90 0.90 1.20 1.20 1.20 1.50 NS
Total plate count 1.5x10⁷ 3.5x10⁷ 4.0x10⁷ 4.5x10⁷ 6.5x10⁷ 8.0x10⁸ 9.5x10⁸ 0.35
(cfu ml-1)
Organoleptic properties
Color 8.0+0.50 8.2+0.45 8.1+022 8.1+022 7.9+0.22 7.8+0.45 7.8+0.45 NS
Appearance 8.1+0.22 8.0+0.50 8.0+0.50 8.1+0.22 7.9+0.22 8.0+0.50 7.9+0.22 NS
Texture 7.8+0.84 7.7+0.45 7.9+0.22 7.8+0.45 7.8+045 7.7+045 7.7+0.45 NS
Taste 8.2+0.84 8.1+0.22 8.1+0.22 7.9+0.22 7.7+0.45 7.8+0.45 7.9+0.22 NS
Aroma 7.8+0.84 7.7+0.45 7.6+0.55 7.8+0.45 7.8+0.45 7.9+0.22 7.9+0.22 NS
Overall acceptability 7.8+0.84 7.7+0.45 7.9+0.22 7.8+0.45 7.8+0.45 7.9+0.22 7.6+0.55 NS
NS: Non-significant
who observed that during storage, total soluble solid, andpH decreased while acidity increased. Babajide et al. (2002)also reported decrease in pH and increase in acidity during
storage of low-alcoholic beverage made from millet grain.Ezeronye (2005) observed decrease in Brix from 20°B to6°B during fermentation. Ilamaran and Amutha (2007)
reported gradual decrease in BAR content of carbonatedbanana beverage during storage. The ethanol after 15 dayswas 0.40 per cent and gradually increased to 0.70% v/v
after 60 days and reached up to 1.0 per cent after 90 days.Higher alcohol like propanol, butanol, isopropanol andacetaldehyde and ethyl acetate was absent in beverage
after 90 days of storage. The CO2 pressure of freshbeverage was 0.90 bar that increased to 1.5 bar at the endof 90 days. Viable cell count increased from 1.5x10⁷-9.5x10⁸
cfu ml-1. During fermentation CO2, alcohol and glycerolproduced is proportional to the amount of sugar fermented.The yeast strain produce large amount of glycerol at the
expense of ethanol represent an advantageous alternativefor development of beverages with low ethanol contentsversus physical processes which alter the organoleptic
properties of the final product. Kumar (1997) found thatcarbonated pure mandarin juice beverage at 100 psipressure of carbonation, the best, similarly low alcoholic
self carbonated beverage from carrot: amla (1:1) has beenadjudged the best with sensory scores ranges from likedvery much to moderately liked with shelf life of three months
as carbonation enhances the sensory quality of beveragepartly due to increased acidity, sparkle and unique fizz.
The alarming wastage associated with carrot and amla(Emblica officinalis) coupled with its low level of industrialutilization in the developing countries calls for a great
concern. The nutritional and therapeutic value of amla(Emblica officinalis) and carrot can be tapped by processingthem into value added fermented product (low alcoholic
self carbonated beverage) with retention of nutritionalproperties, highest sensory qualities and shelf life of threemonths
ACKNOWLEDGEMENT
The authors acknowledged the financial assistanceprovided by University Grants Commission (UGC), NewDelhi, India for support of the project entitled “Preparation
of non-alcoholic naturally carbonated beverage from fruitjuices”.
REFERENCESAmerine M. A., Pangborn R. M., Roessler E. B. (1965) Principles of
Sensory Evaluation of Food. Academic press , London.
AOAC (1980) Official Methods of Analysis. Association of OfficialAnalytical Chemists, 13th ed., Washington, DC, USA.
AOVC (1996) Methods of Vitamin Assay. Association of VitaminChemists Inc. (Ed.) Interscience Publishers, pp.306-312.
Aruna-seralthan, M., Malathi, D. and Susheela-Thirumaran, A.(1992) Preparation of carrot based ready to serve beverage.S. Indian Hort. 40: 41-52.
Babajide, J. M., Atanda, O. O. and Idown, M. A.(2002) Microbial andsensory quality of freshly processed and reconstituted“Kununzaki” – A Nigerian Mille based beverage. J. FoodTechnol. 7: 65-67.
P. Sahota, G. Pandove and T.S. Dhillion

37
Czepa, A. and Hofmann, T. (2004) Structural and sensorycharacterization of compound contributing to bitter taste ofcarrots and carrot puree. J. Agri. Food Chem. 51: 3865–3875.
Deak, T., Tabajdi-Pinter and Fabri, I. (1986) Baseline counts of yeastsin soft drinks. In: A.D King, Jr., J .I Pitt, L. R. Beuchat, J. E. L.Corry Methods for the Mycological Examination of Food (eds)Plenum Press, New York, pp.188-189.
Desobry, S. A., Netro, F. M. and Labaza, T. P. (1998) Preservation ofâ-carotene from carrots. Crit. Rev. Food Sci. Nutrition. 38:381-396.
Dubois, M., Gills, K. A., Hamilton, J. K., Roberts, P. A. and Smith, F.(1956) Colorimetric method for determination of sugars andrelated substances. Anal. Chem. 28: 350-356.
Ezeronye, O. V. (2005) Nutrient utilization profile of Saccharomycescerevisiae from palm wine in tropical fruit fermentation. Antonievan Leeuwenhoek 86: 235-239.
Ilamaran, M. and Amutha, S. (2007) Effect of total soluble solidsand CO
2 pressure on physico-chemical and sensory qualities
of carbonated banana and sapota beverages. J. Food Sci.Technol. 44:178-182.
Kumar, S. (1997) Standardization of technology and evaluation of
carbonated citrus fruit juices and their blends with syntheticbeverage. M. Sc. Thesis, Dr. Y. S. Parmar University ofHorticulture & Forestry, Nauni-Solan, (HP), India.
Markides, A. J. (1986) The microbiology of methode Champenoise.In: Proceedings of 6th Australian Wine Industry TechnicalConference, Adelaide, 14-17, 1986. Australian IndustrialPublishers, Adelaide, pp 232-236.
Miller, G. L. (1959) Use of Dinitrosalicylic acid reagent fordetermination of reducing sugar. Anal. Chem. 31: 426-428.
Sambrook, J., Maccallum, P. and Russell, D. (2001) MolecularCloning: A Laboratory Manual. 3rd ed. Cold Spring HarborPress, NY, 2344 p.
Singh, A. K. and Goswami, T. K. (2006) Controlled atmospherestorage of fruits and vegetables: A review. J. Food Sci.Technol. 43: 1-7.
Tamura, K. D., Nei, J. M. and Kumar, S. (2007) MEGA4, molecularevolutionary genetics analysis (MEGA) software version 4.0.Mol. Biol. Evol. 24: 1596–1599.
Van der Walt, J. P. and Yarrow, D. (1984) Methods for the isolation,maintenance, classification and identification of yeasts. In: N.J. W. Kreger-van Rij (Ed.). The Yeasts: A Taxonomie Study.Elsevier Science Publishers.
Received 4 March, 2011; Accepted 4 November, 2011
Quality Parameters of Low Alcoholic, Self Carbonated Fermented Beverage

Lichens are among the most frequently used indicatorsof atmospheric pollution in the last couple of decades dueto their sensitivity towards atmospheric pollutants in theform of oxides and other hazardous pollutants. Important
factors behind the high sensitivity of lichens are the absenceof a protective cuticle that lead to the direct exposure ofthallus surface to atmosphere and rather unspecific uptake
of mineral nutrients from the surrounding environment. Pulpand paper mills are considered as one of most pollutedindustries in India. SO2 and NOx are two major air pollutants
emitted from pulp and paper mills along with some otherpollutants. Impacts of the polluted environment upon lichenshave been observed from morphological changes to
community structure changes (Gries, 1996). It has beenobserved that air pollution leads to a reduction of thallussize and frequency of lichens, and sometimes even to the
complete loss of sensitive species (Zambrano et al., 2000;Brodo, 1966). Ultra structural changes in lichens due toSO2 and NOx consequently develop physiological changes,
which may affect the dispersal mechanism throughreduction in abundance and species richness (Nash andGries, 2002), changes in frequency and coverage (LeBlanc
et al., 1974), directing the overall lichen community structure.The changes in frequency, coverage, abundance, numberof lichen individuals, and richness in terms of species,
genera, and family can therefore be considered importantparameters to study the impact of pollution on surroundinglichens. In other words, the spatial pattern of lichens in
such community can be deciphered by studying these
Impact of a Paper Mill on Surrounding Epiphytic Lichen CommunitiesUsing Multivariate Analysis
Pulak Das*, Santosh Joshi1, Jayashree Rout and D.K. Upreti1
Department of Ecology and Environmental Science, Assam University, Silchar, Assam–788 011, India1Lichenology Laboratory, Plant Biodiversity and Conservation Biology Division,
CSIR-National Botanical Research Institute, Lucknow (UP)–226 001, India*E-mail: [email protected]
Abstract: The present study analyses the effect of a paper mill on epiphytic lichen communities in Barak Valley, Assam, India. Lichenthallus size, thallus number and frequency of occurrence, along with diversity of lichens at three levels (species, generic, and family) areconsidered as variables to see the community composition across the distance from a paper mill. Number of lichen thallus per tree in studyarea ranged from 3 to 16, while thallus area per tree varied from 20 cm2 to 256.48 cm2. Number of species showed high positive correlationwith number of genera, families, thalli and thallus area. Number of thalli showed high positive correlation with area covered, number ofthallus, and thallus area per tree. Distance from the paper mill exhibited no significant correlation with either variable. Multivariate analysisshowed two major groups and two subgroups of communities. Sites which are more polluted showed a decrease in the communityvariables. Fifteen out of seventeen sites were most affected ones. Epiphytic lichen community study thus can be used to study levels ofpollution impact around a source of pollution.
Key Words: Epiphytic lichen community, Paper mill, Pollution, Cluster analysis
parameters. Considering these, the present study aims toassess the role of industrial point source pollution in thereformation of epiphytic lichen communities around a papermill in Barak Valley by studying above mentioned variables
and delineating the areas which are most affected.
MATERIAL AND METHODS
The study was conducted around Cachar Paper Mill(Fig.1) in Panchgram in Barak Valley of Assam state in north
east India, which is a unit of Hindustan Paper CorporationLimited (HPCL). It uses almost 2,00,000 Bone dry metrictons (BDMT) of bamboo annually for the production of
1,00,000 metric tons (MT) of paper. The data on epiphyticlichens were collected at seventeen sites randomly selectedfrom the geographical map of the area (Fig. 1) within 25 km
radius around the paper mill covering an area of around1800 km2 and spanning between the dimensions 92°22 –92°53 E longitude and 24°42 – 24°59 N latitude. Kalinagar
is the nearest site at 2.4 km and Jalalpur is the farthest siteat 24 km towards east and north-west of the mill,respectively (Fig. 2). Lichens are collected following Insarov
(2010) from the model tree Artocarpus heterophyllus,growing abundantly around the study area. A group of modeltrees (five trees in the present case) belonging to A.heterophyllus, located close to each other, forms thesampling plot (or site). Seventeen sampling plots (Fig. 2)are randomly selected in the present study. At each
sampling plot, trees exposed to more or less similarconditions of light, temperature, and humidity and trees with
Indian J. Ecol. (2012) 39(1) : 38-43Indian Journal
of Ecology

39
Fig. 1. Location of Cachar paper mill in Barak Valley, Assam
Fig. 2. Locations of the seventeen study sites (plots) around the paper mill
Site Nos.: 1-Gumra, 2-Dumkur, 3-Baroital, 4-Mohanpur, 5-Elongjuri, 6-Umarpur, 7-Bhanga, 8-Devendranagar, 9-Bornogod, 10-Lokhirbond, 11-Uttarkanchanpur, 12-Kalinagar, 13-Ghagrapar, 14-Sangjurai, 15-Udharbond, 16-Jalalpur, 17-Kaliganj
Paper Mill and Lichen Communities
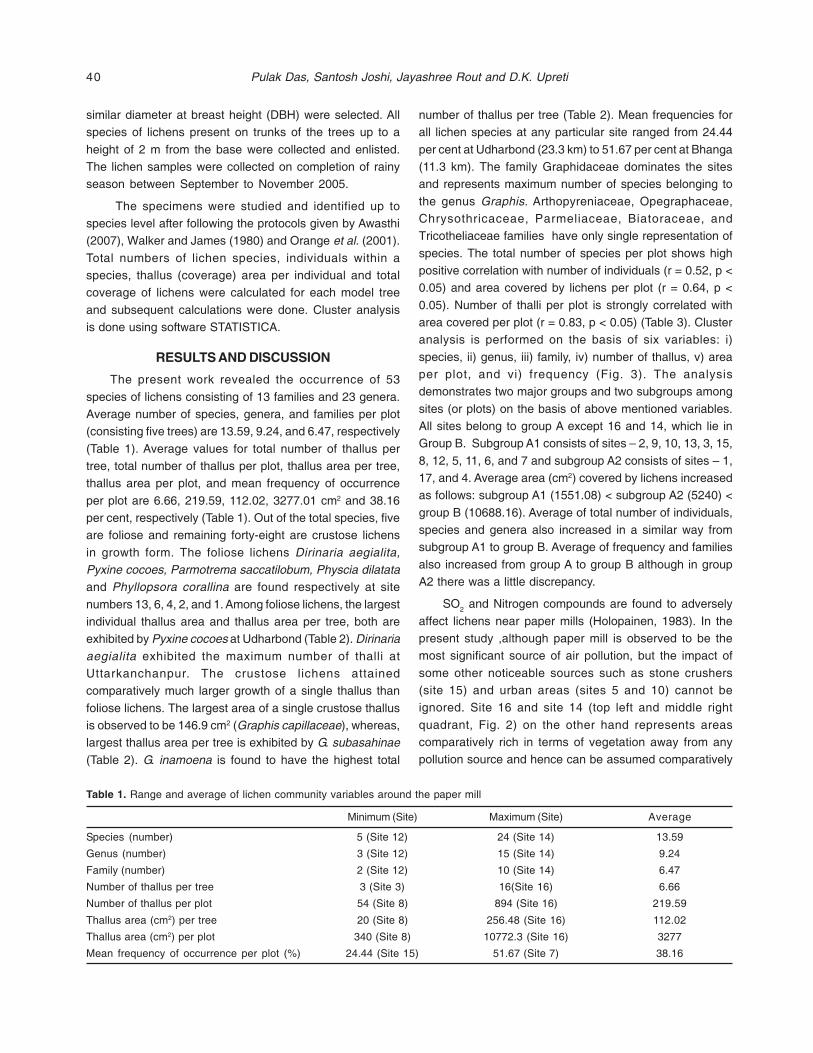
40
similar diameter at breast height (DBH) were selected. Allspecies of lichens present on trunks of the trees up to a
height of 2 m from the base were collected and enlisted.The lichen samples were collected on completion of rainyseason between September to November 2005.
The specimens were studied and identified up tospecies level after following the protocols given by Awasthi(2007), Walker and James (1980) and Orange et al. (2001).
Total numbers of lichen species, individuals within aspecies, thallus (coverage) area per individual and totalcoverage of lichens were calculated for each model tree
and subsequent calculations were done. Cluster analysisis done using software STATISTICA.
RESULTS AND DISCUSSION
The present work revealed the occurrence of 53
species of lichens consisting of 13 families and 23 genera.Average number of species, genera, and families per plot(consisting five trees) are 13.59, 9.24, and 6.47, respectively
(Table 1). Average values for total number of thallus pertree, total number of thallus per plot, thallus area per tree,thallus area per plot, and mean frequency of occurrence
per plot are 6.66, 219.59, 112.02, 3277.01 cm2 and 38.16per cent, respectively (Table 1). Out of the total species, fiveare foliose and remaining forty-eight are crustose lichens
in growth form. The foliose lichens Dirinaria aegialita,Pyxine cocoes, Parmotrema saccatilobum, Physcia dilatataand Phyllopsora corallina are found respectively at site
numbers 13, 6, 4, 2, and 1. Among foliose lichens, the largestindividual thallus area and thallus area per tree, both areexhibited by Pyxine cocoes at Udharbond (Table 2). Dirinariaaegialita exhibited the maximum number of thalli atUttarkanchanpur. The crustose lichens attainedcomparatively much larger growth of a single thallus than
foliose lichens. The largest area of a single crustose thallusis observed to be 146.9 cm2 (Graphis capillaceae), whereas,largest thallus area per tree is exhibited by G. subasahinae(Table 2). G. inamoena is found to have the highest total
number of thallus per tree (Table 2). Mean frequencies forall lichen species at any particular site ranged from 24.44
per cent at Udharbond (23.3 km) to 51.67 per cent at Bhanga(11.3 km). The family Graphidaceae dominates the sitesand represents maximum number of species belonging to
the genus Graphis. Arthopyreniaceae, Opegraphaceae,Chrysothricaceae, Parmeliaceae, Biatoraceae, andTricotheliaceae families have only single representation of
species. The total number of species per plot shows highpositive correlation with number of individuals (r = 0.52, p <0.05) and area covered by lichens per plot (r = 0.64, p <
0.05). Number of thalli per plot is strongly correlated witharea covered per plot (r = 0.83, p < 0.05) (Table 3). Clusteranalysis is performed on the basis of six variables: i)
species, ii) genus, iii) family, iv) number of thallus, v) areaper plot, and vi) frequency (Fig. 3). The analysisdemonstrates two major groups and two subgroups among
sites (or plots) on the basis of above mentioned variables.All sites belong to group A except 16 and 14, which lie inGroup B. Subgroup A1 consists of sites – 2, 9, 10, 13, 3, 15,
8, 12, 5, 11, 6, and 7 and subgroup A2 consists of sites – 1,17, and 4. Average area (cm2) covered by lichens increasedas follows: subgroup A1 (1551.08) < subgroup A2 (5240) <
group B (10688.16). Average of total number of individuals,species and genera also increased in a similar way fromsubgroup A1 to group B. Average of frequency and families
also increased from group A to group B although in groupA2 there was a little discrepancy.
SO2 and Nitrogen compounds are found to adversely
affect lichens near paper mills (Holopainen, 1983). In thepresent study ,although paper mill is observed to be themost significant source of air pollution, but the impact of
some other noticeable sources such as stone crushers(site 15) and urban areas (sites 5 and 10) cannot beignored. Site 16 and site 14 (top left and middle right
quadrant, Fig. 2) on the other hand represents areascomparatively rich in terms of vegetation away from anypollution source and hence can be assumed comparatively
Table 1. Range and average of lichen community variables around the paper mill
Minimum (Site) Maximum (Site) Average
Species (number) 5 (Site 12) 24 (Site 14) 13.59
Genus (number) 3 (Site 12) 15 (Site 14) 9.24
Family (number) 2 (Site 12) 10 (Site 14) 6.47
Number of thallus per tree 3 (Site 3) 16(Site 16) 6.66
Number of thallus per plot 54 (Site 8) 894 (Site 16) 219.59
Thallus area (cm2) per tree 20 (Site 8) 256.48 (Site 16) 112.02
Thallus area (cm2) per plot 340 (Site 8) 10772.3 (Site 16) 3277
Mean frequency of occurrence per plot (%) 24.44 (Site 15) 51.67 (Site 7) 38.16
Pulak Das, Santosh Joshi, Jayashree Rout and D.K. Upreti

41
Table 3. Correlation between different community variables. Bold values are significantly correlated (p<0.05)
Distance Number of Number of Number of Number of Area Mean
from the species genera families individual covered frequency
pollution per plot per plot per plot per plot per plot per plot
source
Distance from the pollution source 1.00
Number of species per plot 0.22 1.00
Number of genera per plot 0.19 0.92 1.00
Number of families per plot 0.17 0.76 0.89 1.00
Number of individual per plot 0.33 0.52 0.35 0.03 1.00
Area covered per plot 0.31 0.64 0.56 0.34 0.83 1.00
Mean frequency per plot 0.21 0.15 0.11 0.11 0.38 0.31 1.00
Table 2. Highest values of thallus area and numbers of foliose and crustose species found in the study area
Species Site (no.) Distance (km)
FOLIOSE GROWTH FORM
Highest area (cm2) per thallus
Dirinaria aegialita 6.2 Gumra (1) 16.9
Pyxine cocoes 12.54 Udharbond (15) 23.3
Parmotrema saccatilobum 3.25 Bornogod (9) 12.1
Physcia dilatata 1.46 Sangjurai (14) 8.8
Phyllopsora corallina 4.52 Devendranagar (8) 5.6
Highest thallus area (cm2) per tree
Dirinaria aegialita 105.88 Uttarkanchanpur (1) 4.8
Pyxine cocoes 439 Udharbond (15) 23.3
Parmotrema saccatilobum 8.67 Bornogod (9) 12.1
Physcia dilatata 14.63 Sangjurai (14) 8.4
Phyllopsora corallina 117.5 Devendranagar (8) 5.6
Highest total number of thallus per tree
Dirinaria aegialita 51 Uttarkanchanpur (11) 4.8
Pyxine cocoes 35 Udharbond (15) 23.3
Parmotrema saccatilobum 4 Dumkur (2) 16.1
Physcia dilatata 10 Sangjurai (14) 8.8
Phyllopsora corallina 26 Devendranagar (8) 5.6
CRUSTOSE GROWTH FORM
Highest area (cm2) per thallus
Graphis capillaceae 146.9 Gumra (1) 16.9
Highest thallus area (cm2) per tree
Graphis subasahinae 1624.6 Sangjurai (14) 8.4
Highest total number of thallus per tree
Graphis inamoena 54.7 Jalalpur (16) 24.1
cleaner. Both the areas are amidst hillock; former being apart of tea garden near Jalalpur and the latter belongs toSrikona region. The distance from the mill is not showing
statistically significant relationship with either of the variable,which declines its significance in role as factor in the overallvariation; the topography of the region and other sources of
pollution besides the paper mill could be held responsiblefor the same. High positive correlation between species
richness and thallus area per plot is consistent with theresults found by Cáceres et al. (2007). Although in the presentstudy species richness is not significantly correlated with
the thallus area per tree, some authors like Löbel and Rydin(2009) believes that a general decrease in epiphyte covercould lead to a decrease in species richness. In the present
study, the area coverage is increasing on increasing thenumber of thallus in other trees within a plot. The community
Paper Mill and Lichen Communities
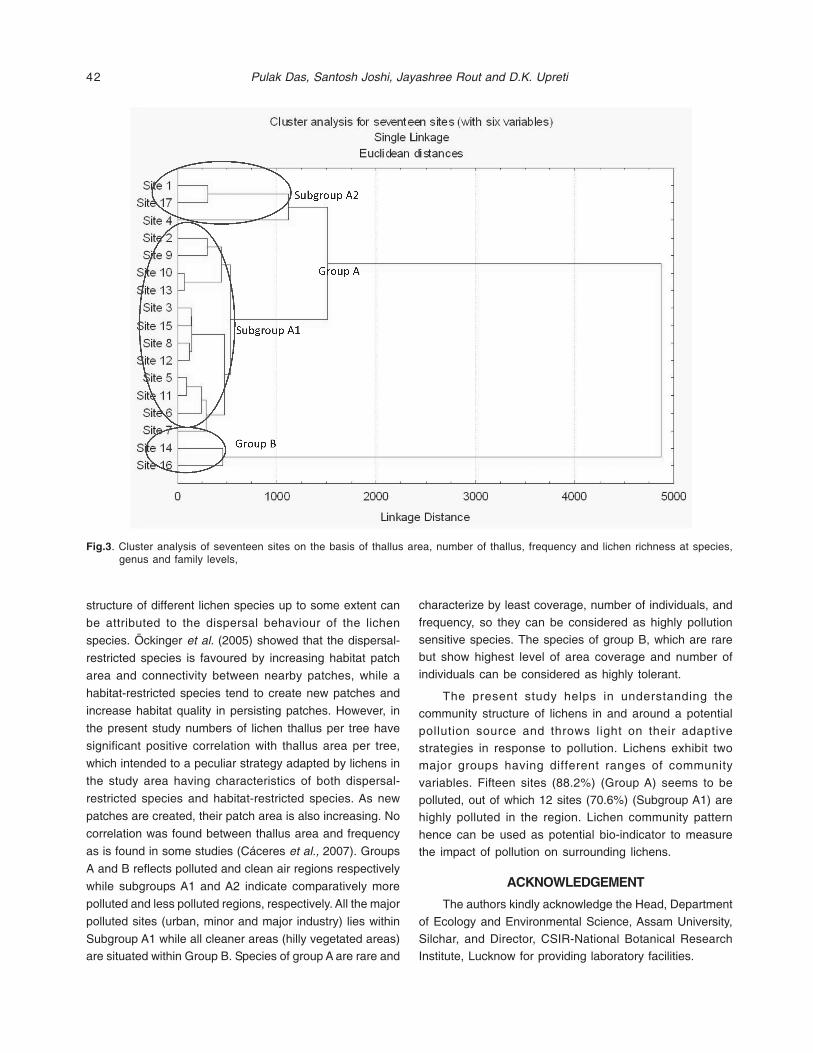
42
structure of different lichen species up to some extent can
be attributed to the dispersal behaviour of the lichen
species. Öckinger et al. (2005) showed that the dispersal-
restricted species is favoured by increasing habitat patch
area and connectivity between nearby patches, while a
habitat-restricted species tend to create new patches and
increase habitat quality in persisting patches. However, in
the present study numbers of lichen thallus per tree have
significant positive correlation with thallus area per tree,
which intended to a peculiar strategy adapted by lichens in
the study area having characteristics of both dispersal-
restricted species and habitat-restricted species. As new
patches are created, their patch area is also increasing. No
correlation was found between thallus area and frequency
as is found in some studies (Cáceres et al., 2007). Groups
A and B reflects polluted and clean air regions respectively
while subgroups A1 and A2 indicate comparatively more
polluted and less polluted regions, respectively. All the major
polluted sites (urban, minor and major industry) lies within
Subgroup A1 while all cleaner areas (hilly vegetated areas)are situated within Group B. Species of group A are rare and
characterize by least coverage, number of individuals, and
frequency, so they can be considered as highly pollutionsensitive species. The species of group B, which are rarebut show highest level of area coverage and number of
individuals can be considered as highly tolerant.
The present study helps in understanding thecommunity structure of lichens in and around a potential
pollution source and throws light on their adaptivestrategies in response to pollution. Lichens exhibit twomajor groups having different ranges of community
variables. Fifteen sites (88.2%) (Group A) seems to bepolluted, out of which 12 sites (70.6%) (Subgroup A1) arehighly polluted in the region. Lichen community pattern
hence can be used as potential bio-indicator to measurethe impact of pollution on surrounding lichens.
ACKNOWLEDGEMENT
The authors kindly acknowledge the Head, Department
of Ecology and Environmental Science, Assam University,Silchar, and Director, CSIR-National Botanical ResearchInstitute, Lucknow for providing laboratory facilities.
Fig.3. Cluster analysis of seventeen sites on the basis of thallus area, number of thallus, frequency and lichen richness at species,genus and family levels,
Pulak Das, Santosh Joshi, Jayashree Rout and D.K. Upreti

43
REFERENCEAwasthi, D.D. (2007) A Compendium of the Macrolichens from
India, Nepal and Sri Lanka. Bishen Singh Mahendra Pal Singh,Dehra Dun, India.
Brodo, I. M. (1996) Lichen growth and cities: A study on LongIsland, New York. The Bryologist 69: 427-449.
Cáceres, M. E. S., Lücking, R. and Rambold, G. (2007) Phorophytespecificity and environmental parameters versus stochasticityas determinants for species composition of corticolouscrustose lichen communities in the Atlantic rain forest ofnortheastern Brazil. Mycological Progress 6: 117–136.
Gries, C. (1996) Lichens as indicators of air pollution. In: T. H. NashIII (Ed.), Lichen Biology, Cambridge University Press,Cambridge.
Holopainen, T. H. (1983) Ultrastructural changes in epiphytic lichens,Bryoria capillaries and Hypogymnia physodes, growing neara fertilizer plant and pulp mill in central Finland. Annales BotaniciFennici 20:169-185.
Insarov, G.E. (2010) Epiphytic montane lichens exposed tobackground air pollution and climate change: monitoring andconservation aspects. International J. Ecol. and Environ. Sci.36 (1): 29-35.
LeBlanc, F., Robitaille, G. and Rao, D.N. (1974) Biological responseof lichens and bryophytes to environmental pollution in theMurdochville Copper mine area, Quebec. Hattori Bot. Lab.38:405-433.
Löbel, S. and Rydin, H. (2009) Dispersal and life history strategiesin epiphyte metacommunities: alternative solutions to survivalin patchy, dynamic landscapes. Oecologia 161:569–579.
Nash, T.H III. and Gries, C. (2002) Lichens as bio-indicators ofsulfur dioxide. Symbiosis 33:1-21.
Öckinger, E., Niklasson, M. and Nilsson, S.G. (2005) Is localdistribution of the epiphytic lichen Lobaria pulmonaria limitedby dispersal capacity or habitat quality? Biodiversity andConservation 14:759-773.
Orange, A., James, P.W. and White, F.J. (2001) Micro-chemicalmethods for the identification of lichens. British Lichen Society.
Walker, F.J. and James, P.W. (1980) A revised guide to the micro-chemical technique for the identification of lichen products.Bulletin of British Lichen Society 46: 13-29.
Zambrano, G.A., Nash III, T.H. and Herrera-Campos, M.A. (2000)Lichen decline in Desierto de los Leones (Mexico City). TheBryologist 103(3): 428-441.
Paper Mill and Lichen Communities
Received 13 October, 2011; Accepted 4 February, 2011

Temperate lakes has shown that the number of speciespresent are strongly correlated with pH, with speciesdiversity highest in lakes varying in pH from 6.8 to 7.2
(Ivanova, 1987), but there is scarcity of literature infreshwater tropical conditions. Thus, it seems that theabundance and presence of may zooplankton species are
negatively affected by both low and high pH in tropicalconditions. Considerable experimental research has beendone on the effects of pH on the population dynamics and
community composition of micro-crustacean zooplankton(Havens,1992). However, these studies were concernedwith the effects of acidification, while the ecological
importance of high pH has been less investigated.Information based on field and laboratory experimentssuggests that most Cladoceran species have an upper pH
limit in the range of 10.5-11.5 (O’Brien and DeNoyelles,1972; Hansen et al., 1991). It is unclear, however, how thesehigh pH values affect the population growth rate of
Cladocerans. Most previous studies have been concentratedon direct toxic effects of pH on the free-living stages.However, an elevated pH may affect the population growth
rate through chronic effect on somatic growth and fecundity.In our study, the response of a Zooplankton population toelevated pH was examined. Special interest is focused on
the impact of elevated pH on egg viability. The pH valuestested in the experiments were chosen because springand summer pH values of many eutrophic and hypertrophic
lakes and ponds fall within this range (Jeppesen et al.,1990).
Effect of pH upon Copepoda and Cladocera under LaboratoryConditions
C.B. Tiwary* and Kamlakant Thakur1
Dept. of Zoology, S.M.D. College, M.N.Jalalpur, Gopalganj - 841 428, Bihar, India**J.P. University, Chapra - 841 452, Bihar, India
*E-mail : [email protected]
Abstract: The increased CO2 diffused from the atmosphere into water body surface, result in increased partial pressure of CO2 andreduced pH. Laboratory experiments revealed that water acidification has negative impacts on the fertilization, cleavage, larva settlementand reproductive stages to environmental change within zooplanktons. There appear to be significant ontogenetic impacts and species-species differences in tolerance to the low pH. The effect of high pH on the reproduction revealed that the mortality of Juveniles and adultsdid not increase with increasing pH in the range 9.0-10.5 and suggest that the threshold value for mortality is between pH 10.5 and 11.5.However, both mortality and the proportion of stillborn neonates increased at pH 10.0 and above and both Copepoda (Daphnia carinata)and Cladocera (Mesocyclopus hyalinus) differed in their sensitivities to pH. Consequently, pH affects population growth rate markedlyfrom pH 10.0 onward. Because pH value ≥ 10.0 are common during spring and summer in local water bodies due to intense photosynthesisactivity, indicating that high pH has larger effect on population structure and the community composition of zooplankton in such waterbodies.
Key Words: pH, Zooplankton, Nauplius, Stillborn, Buffer, Daphnia carinata, Mesocyclopus hyalinus
MATERIAL AND METHODS
Both Copepoda (Mesocyclops hyalinus) and Cladocera(Daphnia carinata) were acclimatized to their experimentalconditions for two generations. They were kept under
constant illumination at 17.5±0.2 Candella, and pH waskept constant at 9.0 ±0.1. As soon as the animals producednewborn, the mothers were removed. These newborn were
reared to maturity and their offspring used in theexperiments.
A buffer of NaOH- NaHCO3 was used to make the
different PH series. Four constant pH treatments wereapplied (9.0±0.1, 9.5±0.1, 10.0±0.1 and 10.5±0.1). Neonatesfrom different mother were equally treated with pH solutions.
About 16 individuals were cultured per pH series. After every2-3 days, the individuals were examined then transferred toclean tubes with fresh medium. During each observation,
dead individuals were noted and removed. Live animalswere observed, every molt noted, and the number of egg-embryos and of newborn recorded. Furthermore, egg
mortality was noted and newborn were discarded afterbeing examined; observations were stopped when theCladoceran reared the fourth adult instar and Copepod till
adult stage.
RESULTS AND DISCUSSION
pH effect upon copepods. The various life cycle stagesof copepods, such as fertilization, cleavage, planktonic larva,
metamorphosis, juvenile and adult reproductive stages
Indian J. Ecol. (2012) 39(1) : 44-47Indian Journal
of Ecology

45
were effected differently due to pH. Both hatching andnauplius survival decrease with decreasing pH in the
M.hyalinus below 7.1 and Cyclopus scutifer below 6.9, eventhough negative effects were significant only at high level ofCO2 than normal in water body. Additionally, the hatching
rate was unaffected during ensuring generations (0 to 2generations). The delayed larval development is observedat low pH than 7.1 and also at high pH than 8.3 during
experiment period. The mortality rate is higher for smallerindividuals than for larger individuals. pH also effectedsettlement of juveniles, which was significantly low than
the control. The studied copepod cultured under 7.9 pH(saline water) for 15 week showed reduced reproductionas compared to the control. On the other hand, egg
production of studied copepod was not affected when rearedunder low PH than 7.1, but significantly decreased abovepH level of 8.9.
Ion transport is an energy consuming process,
whereas, molecular CO2 directly diffuses across the
biological cell membranes more faster than protons and
hence lowering of intracellular pH into eggs or sperms
through entering of CO2 was observed. Low pH of eggs,
thus trigger the initiation of inorganic development in aquatic
macro-invertebrates. In addition to the impact on sperm
motility, the low egg pH may present fertilization and
subsequent development of copepods. The time to
complete the first cleavage was shortest at pH 8.2 and
increased with decreasing pH. Both hatching and naupliar
survival decreased with decreasing pH in copepods than
8.1, even though negative impacts were significant only at
low pH caused by higher CO2 level those projected to occur
in the future (Kurihara and Shirayam, 2004). The hatching
rate in copepods was significantly reduced at low pH as
indicated in calcifiers (Hart and Strathmann, 1995). The egg
production of all copepods studied (e.g., Acropora steveriand A. erythraea) was not affected when reared under the
7.5 pH at high CO2 (Kurihara and Ishimatsu, 2008). The
data indicated positive effect of moderate pH upon
ontogenetic development in copepods under freshwater
culture in companies of its negative effect upon oceanic
species and significantly positive role in tropical water body
of this investigation.
pH effect upon cladocera. The apparent food quality ofthe algae was not influenced by the pH treatment as
indicated with measurement of P,N and content of algalparticles just before and 48 hour after their suspension inDaphnia carinata medium (Table 1). Within the pH range
9.0-10.5, no clear relationship between mortality and pHwas observed pH effects were non-significant (P=0.068),
but instar effect (P=0.001) and interactions between instarnumber and pH (P=0.037) and between adult and pH
(P=0.045) were significant.
The mean number of eggs per adult female decreasedsignificantly with pH, but the differences were small. Also, a
substantial and significant increase in egg mortalityoccurred with increasing pH (Fig. 1). Eggs degeneratedand were reabsorbed before the next molt accord. At pH
10.5, egg mortality also resulted in reduced fecundity. Deadand inactive neonates were frequently observed. In somecases, the neonates were still alive, although in a very poor
condition. However, these individuals were always lying onthe bottom of petridish, were never observed swimmingand invariably died within 24 hour after they had seen. All
these newborns are categorized as stillborn neonates. Weobserved a distinct and significant increase in stillbornneonates with increasing pH (x2=193.2; df=3,P<0.001). At
pH 10.5, almost half the neonates were stillborn, whichcaused a marked reduction in fecundity; newborn at pH10.0 were also seriously affected, while the effects were
smaller at the series below pH 10.0. Assuming all eggs are
Table 1. Mean number of eggs per female (+95% C.L.) ofD.carinata cultured at different pH values
Daphnia carinata
pH Mean N
9.0 11.1 (1.90) 30
9.5 9.7 (1.57) 28
10.0 9.0 (1.28) 31
10.5 7.6 (1.72) 27
Fig. 1. Effect of pH on D. carinata and M. hyalinus in terms ofper cent degenerated eggs
Deg
ener
ated
egg
s (%
)
D. Carinata
M. hyalinus
viable and result in living newborn, t-tests with the sequentialBonferonni corrections showed no significant differencesin the rate of population increase between treatments.
However, the combined effects of egg mortality and stillbornneonates resulted in strong and significant reductions in r.The r-value shows a more general decrease over the pH
range of 9.0-10.5 (Fig. 2).
pH Effect on Copepoda and Cladocera

46
A strong effect of high pH on reproduction, but thequestion arises whether this pH effect acts directly (as a
stress factor) or indirectly via variations in the food quality.Direct effects that may have played a role at high pH aretoxic effect of un-ionized ammonia (NH3) on Daphnia carinataand disruption of ion-exchange in Daphnia. An indirect effectmay have been the change of algal food conditions forDaphnia as result of pH shock undergone by the algae.
The changes in food quality as a result of the variation in pHare less likely because nutrient status of the algae showedno pH effect. The high P content of the algae is an indication
that the food was enriched (Sterner, 1993). Additionally, anindirect effect would have resulted in reduced somaticgrowth and a reduced number of larger eggs; larger eggs
contain more yolk and will have a higher viability (Tessierand Consolatti,1989). Because no reduced growth rate inrelation to elevated pH was observed, egg viability
decreased, and reduction in number of eggs produced wassmall and did not contribute to the observed overall reductionin r (Fig. 2). The high degeneration and stillborn rates at
elevated pH are likely due to direct effects.
The two direct effects on Daphnia carinata that mayhave played a role are the toxic effect of un-ionized ammonia
and the disruption of ion exchange. The equilibrium betweenunionized and ionized ammonia is strongly effected by pH.The un-ionized ammonia is toxic for cladocerans. Results
of culture experiments by Elendt and Bias (1990) suggestthat selenium deficiency in culture media may cause eggabortion and neonate mortality in Daphnia carinata. Exactly
the same phenomena at high pH was observed, whichtempting to regard Se limitation as the possible causalfactor. However, it is not likely that this was the case. First,
because we used 12 per cent filtered water from a localwaterbody for Daphnia medium, the Se concentration inthis medium was ~0.1 g liter-1, which is high enough for
successful reproduction and low neonate mortality (Elendt
and Bias, 1990). Second, within the pH range studied, Sespeciation did not change (i.e., availability of Se was not
inhibited at high pH). Deleterious effects of important abioticinfluences such as pH or toxic substances are often strongerat low food levels because they usually act via the inability
of the organism to keep food intake and assimilation highenough to pay for increased respiration (Reinikainen et al.,1994). The number of neonates produced were reduced by
50-80 per cent due to egg degeneration and stillbirth in thepH range of 10.0-10.5. Because were cultured the daphnidsat high food levels-well above the incipient limiting level-
and because even in eutrophic lakes daphnids may befood limited as a consequence of prevailing low food quality(Boersma and Vijverberg, 1994), pH effect on egg and
neonate viability in the natural habitat may be even largerthan observed in the present study.
In some Copepod and Cladoceran species, thephysiological effect of high pH was due to a pH effect on thesodium balance (Potts and Fryer, 1979). Copepods usuallyshowed a good sodium balance up to ~ pH 9.5, but abovethis pH, they showed a net sodium loss (Nilssen et al.,1984). Several studies have reported the presence ofdegenerated eggs in populations of Copepods andCladocerans under natural conditions (Boersma andVijverberg, 1995), but in none of these studies was high pHconsidered a possible factor for this mortality. Present studydemonstrated that high pH can substantially reduce theegg viability and fitness of micro-crustacean zooplankton. ApH value >10.0 is commonly found in many eutrophic andhypertrophic lakes. Therefore, the effect of high pH on thepopulation dynamics and community composition of micro-crustacean zooplankton is probably much more importantthan has been assumed.
The culture of selected zooplankton in culture mediumconclude that optimal pH (7.6-8.5) is best for survival andreproduction. The physiological effect of high pH has been
Fig 2. Mean per cent of stillborn neonates affected by pH in D. carinata and M. hyalinus.
D. Carinata
M. hyalinus
C.B. Tiwary and Kamlakant Thakur

47
caused by a pH effect on the sodium balance. Copepodsusually showed a good sodium balance up to pH 9.5, but
above this pH they showed a net sodium loss. TheCladocerans are more sensitive than Copepods.
REFERENCESBoersma, M. and Vijverberg, J. (1994) Seasonal variations in the
condition of two Daphnia species and their hybrid in a eutrophiclake: Evidence for food limitation under field conditions. J.Plankton Res. 16: 1793-1809.
Boersma, M. and Vijverberg, J. (1995) The significance of non-viable eggs for Daphnia population dynamics. Limnol.Oceanogr. 40:1215-1224.
Elendt, B.P. and Bias, W.R.(1990) Trace nutrient deficiency inDaphnia magna cultured in standard medium for toxicity testing:Effects of the optimization of culture condition of life historyparameters of D. Magna. Water Res. 24: 1157-1167.
Hansen, M., Christensen, J.V. and Sortkajaer,O.(1991) Effect ofhigh pH on zooplankton and nutrients in fish free enclosures.Arch. Hydrobiol. 123:143-164.
Hart, M.W. and Strathmann, B.R. (1995) Mechanisms and rates ofsuspension feeding. In: Mc Edward, L. (Ed.) Ecology of MarineImertebrate Larvae. CRC press, Boca Raton, pp 183-222.
Havens, K.E.(1992). Acidification effects on the plankton sizespectrum – an in situ experiment. J. Plankton. Res. 14: 1687-1697.
Ivanova, M. B. (1987) Relationship between zooplanktondevelopment and environmental conditions in different type oflakes in the zone of temperate climate. Int. Rev. GesamtenHydrobiol. 72:669-684.
Jeppesen, E., Sondergaard M., Sortkjaer,O., Mortenson,E. andKristensen, O.P. (1990) Interactions between phytoplankton,zooplankton and fish in a shallow, hypertrophic lake : A studyon phytoplankton collapses in lake seleygard, Denmark.Hydrobiologia 191: 149-164.
Kurihara, H. and Shirayama,Y. (2004). Effect of increasedatmospheric CO2 on copepod development. Mar. Ecol. Prog.Series 274:161-168.
Kurihara, H. and Ishimatsu, A. (2008). Effects of elevated CO2 onthe life cycle of Copepoda. Mar. pollution Bulletin. 56: 1086-1090.
Nilssen, J.P., Potts, W.T.W. and Ostdahl, T. (1984). Physiology ofzooplankton subjected to acidification and liming. A pilot studyusing radioisotopes. Kalkningsprosj. Rapp. 11:37pp.
O’Brien, W.J. and Denoyelles, F. (1972). Photosynthetically elevatedPH as a factor in zooplankton mortality in nutrient enrichedponds. Ecology 53: 606-614.
Potts, W.T.W. and Fryer, G. (1979) The effect of pH and salt contenton sodium balance in Daphnia magna (cladocera). J. Comp.Physiol. 129:289-294.
Reinikainen, M., Ketola M. and Walls, M. (1994) Effects of theconcentration of toxic Microcystis Geruginosa and analternative food on the survival of Daphnia pulex. Limnol.Oceanogr. 39: 424-432.
Sterner, R.W. (1993) Daphnia growth on varying quality ofscendesmus : Mineral limitation of zooplankton. Ecology74:2351-2360.
Tessier, A.J. and Consolatti, N.L. (1989) Variation in offspring sizein Daphnia and consequence for individual fitness. Oikos 56:269-276.
Received 20 September, 2011; Accepted 23 December, 2011
pH Effect on Copepoda and Cladocera

Macrobenthic organisms occupy the bottom of water
body and display a wide range of life histories, and
sensitivities to water quality impairment. The abundance
and variance of macrobenthic invertebrates flourishing in
the bottom depends upon the physico-chemical conditions
of water, soil and biological complexes. The functional role
of macrobenthic communities in the trophic dynamics of
reservoir ecosystems is well acknowledged. The
composition, abundance and distribution of benthic
organisms over a period of time provide an index of the
ecosystems. In recent years, there used to be a greater
emphasis world over for better understanding of benthic
environment, its communities and productivity, which has
led to increased exploitation of many inland water bodies.
Though a lot of work has been done on the hydrological
and macrobenthic faunal aspects on lotic freshwater bodies
by earlier workers (Dutta and Malhotra, 1986; Dutta et al.,2000; Sawhney, 2008; Mushtaq, 2007) but no work has been
done on the molluscan diversity.
The phylum Mollusca is a large assemblage of animals
having diverse shapes, sizes, habits and occupies different
habitats (Subba Rao, 1993). Although molluscs are
common components of the benthic communities, their role
in the dynamics of the aquatic ecosystem and their
contribution to biomass production is not well known. Our
freshwater molluscs are not only a fascinating part of our
natural heritage but have global significance. As a group,
they serve vital functions in freshwater ecosystems and
many species are commercially important. Freshwater
molluscs have been known to play significant roles in thepublic and veterinary health and thus need to be scientifically
Diversity of Molluscan Fauna Inhabited by River Chenab-fed Stream(Gho-Manhasan)
K.K. Sharma and Samita Chowdhary*Department of Zoology, University of Jammu, Jammu-180 001, India
*E-mail: [email protected]
Abstract : Among nine species of Molluscan fauna, seven species belongs to families Viviparidae, Thiaridae, Lymnoidae, Physidae andPlanorbidae of class Gastropoda and two species are of Family Pisididae of the class Bivalvia. Melanoides tuberculata of family Thiaridaewas most dominant species ranged from 234 org m-2 (spring) to 802 org m-2 (summer). Class Bivalvia is represented by only 2 speciesPisidium mitchelli and Sphaerium indicum in which P. mitchelli was dominant and had its minimum density 72org m-2 in monsoon andmaximum 360org m-2 in winters. Different biological indices are used to determine the diversity, dominance, species richness andevenness of the observed malacofauna. This biosurvey of the molluscan diversity gives an important insight into the health of the steamand appends the knowledge and understanding of the management strategies involving bio-monitoring as a significant tool in therestoration studies.
Key Words: Malacofauna, Biological indexes, Species richness, Dominance, Diversity, Evenness
explored more extensively. In the present paper, some ofthe basic observations on the molluscan diversity of a
subtropical stream, a tributary of River Chenab, have beenpresented.
MATERIAL AND METHODS
This study carried out in October 2008 to August 2009
covered the River Chenab-fed stream Gho-Manhasan. RiverChenab is one of the largest rivers of the Indus basis andfeeds to maximum parts of the Jammu region of J&K. River
Chenab gives rise to many streams and Gho-Manhasan isone of them, which is located at 32.56°N 74.95°E. Thisstream is sole source for the population of adjoining areas,
which depends on this stream for irrigation and domesticpurposes. Since, no work has been done on this streamso, it was a necessity to explore the diversity exhibiting in it.
The molluscs of the littoral zone were collected by handpicking and for the smallest species a sieve was used.They were brought to the laboratory, washed and then
preserved in polythene bags. Identifications were done thebasis of standard procedure of Zoological Survey of India.
To understand a particular biotic community Shanon-
Weiner (H) (Shannon and Weiner, 1949), Marglef’s index(d) (Marglef, 1958), Simpson’s index (dsimp) (Simpson,1949) and Pielou’s evenness index (Pi) (Pielou, 1966) were
calculated.
RESULTS AND DISCUSSION
The distribution and abundances of freshwatermolluscs in Gho-manhasan stream may be attributed to
the availability of food, shelter and oviposition sites. Water
Indian J. Ecol. (2012) 39(1) : 48-51Indian Journal
of Ecology

49
bodies rich in organic and silt matter are known to supportthriving populations of macro-invertebrates because of
reduction in water current and as such the substratum tendsto make molluscs indistinguishable from their typical lentichabitat (Whitton, 1975). Molluscs are represented in
freshwater bodies by classes Gastropoda and Pelecypodaand are a group of most diverse and dominant benthic waterbodies. Molluscs were found abundant in Gho-manhasan
stream particular the marginal areas. Their abundancemight be attributed to the presence of vegetation in theshallow depth, which emerged when the stream was dry
during the post-monsoon period and formed a good feedleading to their multiplication as has also been observedby earlier workers (Gupta, 1976; Manoharan et al., 2006).
During the present study, a total of eight species ofMollusca belonging to 6 families were recorded (Table 1).The population of Gastropoda was recorded throughout
the year and is represented by 7 species. The density oforder Gastropoda ranged between 9 to 802 org m-2 withmaximum in summer and minimum in autumn. A higher
count of Gastropods recorded during summer may be eitherdue to the effect of reproduction of these macrobenthicinvertebrates, as small sized molluscs were observed in
collection during this period or the maximum abundance ofdecomposer settled organic matter and macrophytes onthe bottom of the water body and increased water
temperature activating the process of decomposition oforganic sediments (Dutta and Malhotra, 1986; Malhotra etal., 1996). Minimum density of Gastropods recorded during
autumn may be due to aestivation (Singh and Munshi, 1992).
Amongst the Gastropoda group, Mellanoidestuberculata was dominant (47.18%) followed by Gyraulusladacensis (18.50%), Bellamya bengalensis (15.40%),Lymnaea luteola (4.37%), L.accuminata (f.brevissima)(2.16%), while 2 species (Pisidium mitchelli and Sphaeriumindicum) of order Trigoindae (Bivalvia) were recorded anddensity of this group represented by 18-360 org m-2 showingtheir peak in winter (Fig. 1). Some other Gastropods, which
are used as pollution indicators include Physa acuta,Lymnaea accuminata, and L. luteola. In addition, bothbivalvia species Pisidium mitcheli and Sphaerium indicumcan also tolerate greater nutrient concentrations are alsoused like some other Gastropods, as a bioindicator of water.Such a high diversity of molluscan fauna may be attributed
to availaibility of suitable habitats (Wadaan, 2007),organically enriched soft bottom (Singh, 1984) and slowwater currents (Sawhney, 2008).
Mellanoides tuberculata is the commonest and mostwide ranging member of the family Thiaridae, founddominant in the stream. M. tuberculata contributed 47.18 Tab
le 1
. S
easo
nal
fluct
uatio
n of
mol
lusc
an f
auna
(or
g m
-2)
reco
rded
in
Gho
-man
hasa
n, d
urin
g O
ct.2
008
to S
ept.2
009
Cla
ssO
rder
Fam
ilyG
enus
Sp
eci
es
Spr
ing
Sum
mer
Au
tum
nW
inte
r
Gas
trop
oda
Mes
ogas
trop
oda
Viv
ipar
idae
Bel
lam
yabe
ngal
ensi
s f.
typ
ica
(la
ma
rck)
-72
9063
Thi
arid
aeM
ela
no
ide
stu
berc
ulat
a (M
ulle
r)23
480
243
254
9
Bas
omm
atop
hora
Lym
noid
aeLy
mna
eaac
cum
inat
a (f
.bre
viss
ima
)-
5436
-
lute
ola
(f.t
ypic
a)
-11
736
54
accu
min
ata
(f.p
atu
la)
5481
-36
Phy
sida
eP
hysa
acut
a (D
rapa
rnau
d)36
5427
-
Pla
norb
idae
Gyr
au
lus
lada
cens
is (
Nev
ill)
198
252
931
5
Biv
alvi
aT
rigoi
nida
eP
isid
idae
Pis
idiu
mm
itche
lli (
Pra
sha
d)
7213
672
360
Sph
aeri
umin
dicu
m (
De
sha
yes)
7254
1812
6
Diversity of Molluscan Fauna
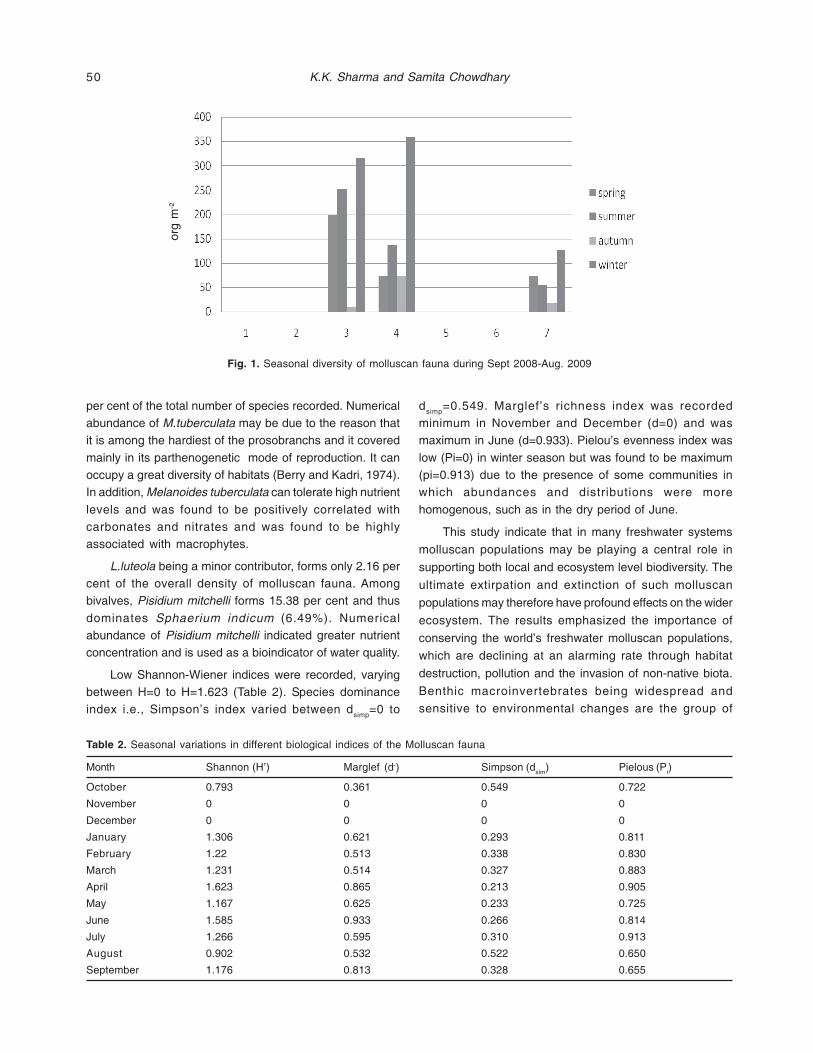
50
per cent of the total number of species recorded. Numericalabundance of M.tuberculata may be due to the reason thatit is among the hardiest of the prosobranchs and it covered
mainly in its parthenogenetic mode of reproduction. It canoccupy a great diversity of habitats (Berry and Kadri, 1974).In addition, Melanoides tuberculata can tolerate high nutrient
levels and was found to be positively correlated withcarbonates and nitrates and was found to be highlyassociated with macrophytes.
L.luteola being a minor contributor, forms only 2.16 percent of the overall density of molluscan fauna. Amongbivalves, Pisidium mitchelli forms 15.38 per cent and thus
dominates Sphaerium indicum (6.49%). Numericalabundance of Pisidium mitchelli indicated greater nutrientconcentration and is used as a bioindicator of water quality.
Low Shannon-Wiener indices were recorded, varyingbetween H=0 to H=1.623 (Table 2). Species dominanceindex i.e., Simpson’s index varied between dsimp=0 to
dsimp=0.549. Marglef’s richness index was recordedminimum in November and December (d=0) and wasmaximum in June (d=0.933). Pielou’s evenness index was
low (Pi=0) in winter season but was found to be maximum(pi=0.913) due to the presence of some communities inwhich abundances and distributions were more
homogenous, such as in the dry period of June.
This study indicate that in many freshwater systems
molluscan populations may be playing a central role in
supporting both local and ecosystem level biodiversity. The
ultimate extirpation and extinction of such molluscan
populations may therefore have profound effects on the wider
ecosystem. The results emphasized the importance of
conserving the world’s freshwater molluscan populations,
which are declining at an alarming rate through habitat
destruction, pollution and the invasion of non-native biota.
Benthic macroinvertebrates being widespread and
sensitive to environmental changes are the group of
Table 2. Seasonal variations in different biological indices of the Molluscan fauna
Month Shannon (H’) Marglef (d-) Simpson (dsim) Pielous (Pi)
October 0.793 0.361 0.549 0.722
November 0 0 0 0
December 0 0 0 0
January 1.306 0.621 0.293 0.811
February 1.22 0.513 0.338 0.830
March 1.231 0.514 0.327 0.883
April 1.623 0.865 0.213 0.905
May 1.167 0.625 0.233 0.725
June 1.585 0.933 0.266 0.814
July 1.266 0.595 0.310 0.913
August 0.902 0.532 0.522 0.650
September 1.176 0.813 0.328 0.655
Fig. 1. Seasonal diversity of molluscan fauna during Sept 2008-Aug. 2009
org
m-2
K.K. Sharma and Samita Chowdhary

51
organisms most often used for assessment of freshwaterquality. Application of such bioindicators can be used to
improve the environment and to augment awareness of theliving creatures to obtain better appreciation of their crucialrole in sustaining life of the planet.
ACKNOWLEGEMENT
Authors are grateful to ZSI Kolkata especially Dr. Raoand Dr. Amit Mudhopadhay for their selfless help in theidentification of molluscs.
REFERENCESBerry,A.J. and Kadri,A.B.H. (1974) Reproduction in the Malayan
freshwater cerithiacean Gastropoda, Mellanoidestuberculata. J. Zool. Lond. 172: 369-381.
Dutta, S.P.S. and Malhotra, Y.R. (1986). Seasonal variations in themacrobenthic fauna of Gadigarh stream (Miran Sahib) Jammu.Indian J. Ecol. 113(1): 138-145.
Dutta, S.P.S., Malhotra, Y.R., Sharma, K.K. and Sinha, K. (2000).Diel variations in physico-chemical parameters of water inrelation to macrobenthic invertebrate in some pool adjacent tothe River Tawi, Nagrota Bye Pass, Jammu. Him.J. Env. Zool.14:13-24.
Gupta,S.D. (1976). Macrobenthic fauna of Loni reservoir. J. InlandFish. Soc. India 8:49-59.
Manoharan, S., Murugesan, V.K. and Palaniswamy, R. (2006)Numerical abundance of benthic macroinvertebrates inselected reservoirs of Tamil Nadu. J. Inland Fish. Soc. India38(1): 54-59.
Marglef, R. (1958) Perspective in ecological theory. Univ. ChicagoPress, 122, Chicago, USA.
Metcalf, J.L. (1989) Biological water quality assessment of runningwaters based on macroinvertebrate communities. History andpresent status in Europe. Environ. Poll. 60:101-139
Mushtaq, R. (2007) Impact of urban influences on the diversity ofmacrobenthic invertebrate fauna of River Tawi. M.PhilDissertation, University of Jammu, Jammu.
Pielou, E.C. (1966) The measurement of diversity in different typesof biological collections. J. Theor. Biol. 13: 131-144.
Sawhney, N. (2008) Biomonitoring of river Tawi in the vicinity ofJammu City. Ph.D. Thesis. University of Jammu, Jammu.
Shanon, C.E. and Wiener, W. (1949) The Mathematical Theory ofCommunication. University of Illinois press, 117, Urbana, USA.
Simpson, E.H. (1949) Measurement of diversity. Nature, Lond. 164:163-688.
Singh,R. and Munshi, J.S.D.(1992) Molluscan diversity and role ofcertain abiotic factors on the density of Gastropods Pilaglobosa and Bellamya bengalensis in a tank at Jamalpur. J.Freshwater Biol. 4(2):135-140.
Singh, R. (1984) Hydrobiological investigations of Neeru Nullah(Bhaderwah) with reference to the Benthicmacroinvertebrates. M. Phil. Dissertation, University of Jammu,Jammu.
Subba Rao,N.V. (1993) Freshwater Mollusca of India. In: Rao K.S.(Ed.). Recent Advances in Freshwater Biology. New Delhi.Anmol Publication. Vol. 2, pp.187-202.
Wadaan, A.M. (2007) The fresh water growing snail Physa acuta: A suitable bioindicator for testing cadmium toxicity. Saudi J.Biological Sciences 14(2): 185-190.
Whitton,B.A. (1975) Zooplanktons and Macroinvertebrates. In:Whitton.B.A. (Ed.). Studies in River Ecology. Vol.2. BakerPublisher Limited London, pp. 87-118.
Received 3 February, 2011; Accepted 9 December, 2011
Diversity of Molluscan Fauna

In an estuary, the physico-chemical properties and
biological entities variations is mainly governed by the
differential tidal amplitude and the Kali estuary is no
exception for it. Hence it is very essential to acquire
information on circadian (diel) variations in hydrographic
(environmental) parameters of such water body. Information
available on such diurnal variations on estuarine
phytoplankton in India is limited to few regions (Chandran,
1985; Gouda and Panigrahy, 1989). Kali River estuary
located between 14o 50’ 15" - 14o 51’ 12" N latitude and 74o
07’ 30" E - 74o 10’ 09" E longitude is one of the major
estuaries of Uttara Kannada maritime district of Karnataka
state (west coast of India), it is opening into the Arabian Sea
near Karwar. It is a shallow estuary with maximum depth of
3.5 m at its deepest region but influenced by semi-diurnal
tide. This region is free from pollution and is surrounded by
the rich mangrove flora and is high productive zone from
the point of fishery resource. Many more estuaries on west
coast of India still remain either little known or totally
unexplored. Therefore, in the present investigation an effort
is made to study the diurnal variations in phytoplankton
population along with some physico-chemical factors of
Kali estuary, Karwar, west coast of India.
MATERIAL AND METHODS
The present investigation was carried out during Aprilat a fixed site (14o51´ N and 74o10´ E) located in the lower
reaches of the estuary. Sampling was made at every twohour interval starting from 19.15 hrs on 25th April to the sametime next day on 26th April. The water level change was
Diurnal Variation of Phytoplankton in the Kali Estuary, Karwar, WestCoast of India
U.G. Naik*, V.V. Nayak1 and N. KusumaDepartment of Marine Biology, Karnatak University PG Centre,
Kodibag, Karwar-581 303, Karnataka, India1Shri Mahasatee Arts, Commerce and Science College, Ulga, Karwar-581 324, Karnataka, India
*E-mail: [email protected]
Abstract: Along with different hydrographic parameters variations in phytoplankton density and photosynthetic pigments were studiedat every two hour for 24 hours, at a fixed station in the lower reaches of the Kali estuary. During flood tides, the species diversity andphytoplankton density increased and decreased during ebb tides. Considerable discrepancy (about 12%) was noticed between cellcounts of day and night high waters. Oscillation in Chl. a, followed by the cell number. Among the nutrients, silicate and nitrate concentrationwas increased markedly during ebb tide periods. An inverse relationship was noticed between salinity and nutrients like nitrite, nitrate,phosphate and silicate. Linear relationship was observed between salinity and nitrate and salinity with silicate compared to salinity versusnitrite and phosphate.
Key Words: Phytoplankton, Kali estuary, Chlorophyll
measured by fixing a tide staff near the collection site. Bothtemperature and pH were recorded at study site only.
Analyses for nutrients, dissolved oxygen, chlorophyll-a andcarotenoids were made following the standard procedures(Strickland and Parsons, 1975). For enumerating density
of phytoplankton population, the sedimentation techniquewas followed (Utermohl, 1931). Using the numerical densityof phytoplankton, the species diversity index was also
calculated (Shannon and Weiner, 1963).
RESULTS AND DISCUSSION
Hydrographic parameters: The water level graduallyincreased from 19.15 hours and highest water level (1.40m)
was reached at 23.15 hours and later it gradually decreasedand minimum level of 0.18 m at 05.15 hours (Fig. 1). Againsecond highest water level was recorded at 13.15 hours
(1.88 m) and later it gradually decreased in following hours.A variation of 48 cm was noticed between the water heightsof two flood tides during the study period.
Temperature (air and water):Air temperature wasgradually lowered from 19.15 to 11.15 hours and later itslowly increased and more or less stable profile was
maintained (Fig. 2). More or less similar pattern oftemperature profile of surface water was recorded but thevalues were far lesser than the air temperature and gradually
increased from 07.15 hours and attained the peak at 15.15hours. Temperature of bottom water was comparativelyhigher than the surface water temperature but was lower
than air temperature during 19.15 and 07.15 hours, later itsvalues were found slightly higher than the air temperature
Indian J. Ecol. (2012) 39(1) : 52-57Indian Journal
of Ecology

53
(13.15 - 15.15 hours) and once again found lower than airtemperature in 17.15 -19.15 hours. Considerable variationwas noticed between air temperature and surface water
temperature and fluctuated from 21.4o to 27.5oC and 16.5o
to 27.4oC, respectively. During night hours, well-markeddifference between surface and bottom water temperature
was noticed when the bottom water remained relativelywarmer than that of surface water.
Salinity did not show any marked variation in its salt
content in both surface and bottom water but the content inthe bottom water was lesser than surface layer in day andnight hours (Fig. 3). High salinity was recorded during 21.15
and 13.15 hours low during 05.15 hours in both layers. Thesalinity conditions revealed conspicuous tidal variationsranging from 18.4 to 26.8 for surface and 16.1 to 26.3 parts
per thousand for bottom waters. Higher salinities wererecorded during flood periods compared to ebb periods.The vertical salinity gradients during extreme high water
and low water were 0.3 and 1.7 parts per thousand,respectively. Hydrogen ion concentration (pH) in surfaceand bottom water varied between 7.8 - 8.4 and 8.1 – 8.6, the
bottom water showed slightly more alkaline condition (Fig.4). The concentration varied in accordance with the changein tidal amplitude. Variations in hydrogen ion concentration
(pH) were between 7.81 and 8.6 and followed the pattern ofsalinity variations with higher values during flood periods.Compared to surface waters, the pH values of bottom waters
were invariably higher. There is no marked variation in thedissolved oxygen content in surface and bottom water layerbut the content. Both have shown more or less uniform
trend in the distribution of the dissolved oxygen. Slightlyhigher values were noticed during 11.15-19.15 hourssampling (Fig. 5). With respect to the tidal cycle, the
dissolved oxygen varied from 3.42-4.93 ml/l at the surfaceand 3.05-4.59 ml/l near the bottom. Comparatively higher
oxygen concentrations were recorded during daytime thanat night hours.
Diurnal variation in nutrients: The concentration of all
nutrient salts (Phosphate-P, Nitrate-N, Nitrite-N and Silicate-Si) varied considerably with respect to the tidal amplitude(Fig. 6-9). On a whole, higher values were obtained during
high tides than at low tides.Phosphate showed markedvariation on time scale with higher concentration in bottomwaters and both strata showed more or less uniform pattern
in their concentration (Fig. 6). In bottom water, maximumconcentration was recorded at 23.15, 05.15 and 15.15 hours(1.32, 1.45 and 1.48 μg at/l, respectively). Similarly in surface
water also but the quantum was comparatively lesser thanthe previous stratum (0.94, 1.26 and 1.15 μg at/l,respectively). Nitrate exhibited marked variation in surface
and bottom water layers but comparatively higherconcentration was recorded in surface waters (Fig. 7).Relatively higher concentration was noticed during 05.15
and 09.15 hours in both layers. Minimum concentrationwas noticed during 23.15 and 01.15 hours in both surfaceand bottom water. Nitrite was found in high concentration
during 05-15-07.15 hours and in 15.15-17.15 hours butquantum of nitrite in bottom water found in the late hours(15.15-17.15hours) was higher than samples collected in
the early hours. But, the reverse case was noticed in thesurface water samples (Fig. 8). Silicate content in bothlayers of surface and bottom showed uniform pattern of
distribution of this nutrient salt but the quantity was foundmore in surface than bottom layer (Fig. 9). Minimum contentof this nutrient was noticed during 21.15 - 01.15 hours in
both layers, whereas, maximum content was noticed during05.15 and 19.15 hours in both strata of aquatic biotopeThis shows inverse relationship between the tide and
silicate nutrient salt during the period of investigation. Whencompared to phosphate and nitrite, the concentrations of
Fig.1.Diurnal variation in the tidal amplitude range at study station –River Kali
Fig.2.Diurnal variation in temperature profile at study station – River Kali
Diurnal Variation of Phytoplankton

54
Fig.7. Diurnal variation in the Nitrate-N content at study stationduring the study period
Fig.8. Diurnal variation in the nitrate-N content at study stationduring the study period
Fig.3.Diurnal variation in salinity profile at study station during thestudy period
Fig.4.Diurnal variation in the pH range at study station during thestudy period
Fig.5.Diurnal variation in the Dissolved Oxygen content at studystation during the study period
Fig.6.Diurnal variation in the phosphate content at study stationduring the study period
U.G. Naik, V.V. Nayak and N. Kusuma

55
silicate and nitrate were highly fluctuating during the study
period. During 03.15 - 09.15 hours period, it was quiteevident that there was well-marked difference betweensurface and bottom strata. In bottom waters, the phosphate
(PO4-P) concentration was higher than the correspondingsurface concentration values throughout the tidal cycle.Contrary to this, a reverse trend was seen in silicate (SiO4-
Si) while a different pattern in nitrate (N03-N) distributionwas experienced (Fig. 7 & 9).
Diurnal variation in phytoplankton. Totally 56 species
of phytoplankton comprising 1-blue-green algae, 4- greenalgae, 41- diatoms and 10- dinoflagellates were recordedduring the tidal cycle period (Table 1). Assemblages of the
phytoplankton cells were comparatively richer in high tidesthan the low tides period. Among the diatoms,Coscinodiscus sp., Skeletonema costatum, Chaetocerossocialis, C. affinis, Guinardia, Gyrosigma, Nitzschialongissima, Navivula sp., Rhizosolenia stolterfothii, R.styliformis, Talassionema sp., Eucampia sp., Bellorocheasp., and Hemidiscus hardmanensis were encountered inmajority of collections between 13.15 and 15.15 hours and
thus were considered as common species for the estuary.
Similarly, the blue-green algae Trichodesmiumerythraeum and dinoflagellates Ceratium massiliensis, C.tripos, Peridinium depressum and Prorocentrum sp.
occurred more frequently and abundantly than other speciesof the respective groups (Table 1). The green algaecomponents namely, Zygnema and Spirogyra species were
less frequent and occurred only during the ebb conditions.Maximum, 36 species and minimum, 14 species wererecorded during 09.15 and 15.15 hours, respectively.
Species diversity varied between 1.45 (15.15 hours) and3.96 (11.15 hours) and exhibited well-marked tidal variations.Numerical abundance (cells x103/l-1) of phytoplankton
showed significant diurnal variations. Maximum(25.47x10³/l-1) and minimum (9.45x10³/l-1) cell counts wereobtained at 19.15 and 21.15 hours, respectively.
Phytoplankton cells in general dwindled in number duringebb periods and with the rise of water level the cell countsalso increased. About 14 per cent increase in total cell
number was observed between the two high waters, highestbeing at 09.15 hours.
Table 1. Phytoplankton species recorded at Kali estuary
Class Species
Cyanophyceae Trichodesmium erythraeum
Chlorophyceae Cosmarium sp., Miocroasterias sp., Spirogyra sp., and Zygnema sp.
Bacillariophyceae Coscinodiscus sp., Skeletonema costatum, Hemidiscus sp., Stephanophyxis sp, Triceratium sp., Biddulphiasp., B. mobiliensis, B. obtusa, B. sinensis, Guinardia sp, Bellorochea sp., Melosira sp, Nitzschia sp,N.seriata, Ditylum sp., Chaetoceros socialis, C.decipens, C. lorenzianus, C. affinis, Grammatophora sp,Campylodiscus sp., Planktoniella sp, Bacteriastrum sp, Eucampia sp., Clamacodium sp., Streptotheca sp,Thallassiosira sp, T. gravida, Thallassionema sp, Rhizosolenia alata, R. stolterfothii, R. stlyiformis, R.hebata,R. robusta, R. castracanei, Thalassiothrix sp, Asterionella japonica, Pleurosigma sp, Gyrosigma sp, Naviculasp, Lithodesmium sp.
Dinophyceae Peridinium depressum, Noctiluca miliaris, Pyrocystis fusiformis, Prorocentrum sp., Dinophysis sp.,Ornithocercus sp, Ceratium tripos, C. massiliensis, C. furca, C. fusus,
Fig.9. Diurnal variation in the silicate-Si content at study stationduring the study period
Fig.10. Diurnal variation in the chlorophyll ‘a’ and carotene contentwith ratio factor.
Diurnal Variation of Phytoplankton

56
Floristic phytoplankton crop in the present study seemsto be more or less similar to that of other estuaries of West
coast of India (Rammirtham and Jayaraman, 1963; Qasimand Gopinathan, 1969; Qasim et al., 1969; Dehadri andBhargava, 1972; Bhargava and Dwivedi, 1976; Bhattathiri
et al., 1976; Qasim and Sengupta, 1981; Devassy, 1983;Devassy and Goes, 1989; Naik and Neelakantan, 1990;Redekar and Wagh, 2000; Tripathy et al., 2005) but diatoms
were greatly dominated over other groups. Representationof lower density of blue-green and green algae can be aspecial feature to this habitat. Considerable differences
(about 12%) were noticed between cell populations of dayand night samples during high tide waters. This could bedue to difference in heights of tidal amplitude and high rate
of grazing pressures exerted by zooplankton communitynear the surface area during night hours. Such type ofaggregation of zooplankton in the surface during night hours
is a common incident in the Indian waters (Goswami et al.,1979; Madhupratap and Rao, 1979; Naik and Neelakantan,1989 and Naik et al., 2005).
In the present study, more or less a close and direct
relationship was established between chlorophyll-a and
phytoplankton population density. At 21.15 hours (25th April),
the lowest chlorophyll-a value (0.51 mg/m3) was obtained.
Whereas, during 07.15 - 09.15 hours, the chlorophyll-aincreased and then gradually decreased till 15.15 hours
and later once again increased during 17.15 hours. At 19.15
hours of 25th April, the carotene attained peak value of 1.83
m-SPU/m-3. The ratio between chlorophyll-a and carotene
fluctuated between 0.46 and 4.56 (Fig. 10).
As it is envisaged from the data that the distribution of
chlorophyll-a closely followed the phytoplankton cell counts
and the maximum values were obtained during peak
density phase. Since the chlorophyll-a is the common
pigment present in all groups of algae and its increase or
decrease normally follows with increase or decrease of
phytoplankton density. However, exceptions were found
towards mid-day when bleaching of pigments could occur
due to intense surface radiation (Yentsch and Scagel, 1958).
In the present study, the pattern of distribution ofchlorophyll- a was very much similar to previous works thathave been carried out in different estuaries of India
(Krishnamurthy, 1971; Bhargava, 1973; Vijaylakshmi andVenugopalan, 1973; Verlencar and D’Silva, 1978). Ascarotenoid values did not follow phytoplankton density but
variable ratios between chlorophyll-a and carotenoids wereobserved. Lower values (<1) of chlorophyll-a : carotenoidratios were obtained at sampling hours of 13.15, 15.15,
19.15 and 21.15 indicating the occurrence of unhealthy and
chlorotic phytoplankton population during these hours asobserved elsewhere. Phytoplankton are extremely sensitive
to the spectra of turbulent motions in the mixed layers oflakes, estuaries and oceans.
Among physico-chemical parameters, the salinity,
silicate and nitrate were found to be more fluctuating duringthe study period. Every nutrient salt showed a significantnegative correlation with salinity. Greater linearity was
observed between salinity and nitrate (r = -0.657) and salinityand silicate (r = -0.788) compared to that of salinity againstnitrite (r = 0.451) and salinity versus phosphate (r = 423). It
is surmised from the present data that the main source oftheir supply to the environment is from freshwater biotopes.
The phytoplankton density showed clear diurnal
variation and was much dependent on the tidal amplitude.Further, it was also observed that phytoplankton cell densityand species diversity index were remained moderately high
during the high tides when compared to low tide periods.Likewise increased density of phytoplankton population andhigher diversity index of this micro floral community during
flood periods and comparatively lower values found duringebb tide periods have been reported in many Indianestuaries (Bhargava and Dwivedi, 1974; Devassy and
Bhargava, 1978; Chandran, 1985).
REFERENCESBhargava, R.M.S. (1973) Diurnal variation in phytoplankton of
Mandovi estuary, Goa. Indian J. Marine Sciences 2: 27-31.
Bhargava,R.M.S. and Dwivedi, S.N. (1974) Diurnal variations ofphytoplankton pigments of Zuari estuary. Indian J. MarineSciences 5: 142-145.
Bhargava, R.M.S. and Dwivedi, S.N. (1976) Seasonal distributionof phytoplankton pigments in the estuarine system of Goa.Indian J. Marine Sciences 5: 87-90.
Bhattathiri, P.M.A., Devassy, V.P. and Bhargava, R.M.S. (1976)Production at different trophic levels in the estuarine systemof Goa. Indian J. Marine Sciences 5: 83-86.
Chandran, R. (1985) Mahasagar-Bulletin of National Institute ofOceanography 18: 37.
Dehadri, P.V. and Bhargava, R.M.S. (1972) Distribution of chlorophyll,carotenoids and phytoplankton in relation to certainenvironmental factors along the central west coast of India.Marine Biology 17: 30-37.
Devassy, V.P. (1983) Plankton ecology of some estuarine and marineregions of the west coast of India. Ph.D. Thesis, Universityof Kerala, Trivandrum.
Devassy, V.P. and Goes, J.I. (1989) Seasonal patterns ofphytoplankton biomass and productivity in a tropical estuarinecomplex (west coast of India). Indian Academy Sciences 99(5): 485-501.
Devassy, V.P. and Bhargava, R.M.S. (1978) Diel changes inphytoplankton in the Mandovi and Zuari estuaries of Goa.Mahasagar- Bulletin of National Institute of Oceanography,Goa 11: 195-199.
U.G. Naik, V.V. Nayak and N. Kusuma

57
Gleason, H.A. (1922) On the relation between species and area.Ecology 3: 156-162.
Goswami, S.C., Selvakumar and Goswami, U. (1979) Mahasagar-Bulletin of National Institute of Oceanography 12: 247.
Gouda Rajashree and Panigrahy, R.C. (1989) Diurnal variation ofphytoplankton in Rushikulya estuary, east coast of India. IndianJ. Marine Sciences 18: 246-250.
Krishanmurthy, K. (1971) Phytoplankton pigments in Porto Novowaters (India). Ind. Revu. Ges. Hydrobiol. 56: 273-282.
Madhupratap,M. and Rao, T.S.S. (1979) Tidal and diurnal influenceon estuarine plankton. Indian J. Marine Sciences 8(1): 9-11.
Naik, U.G. and Neelakantan, B. (1989) Seasonal abundance ofphytoplankton in the inshore waters of Karwar. ComparativePhysiology and Ecology 14(4): 219-226.
Naik, U.G. and Neelakantan, B. (1990) Phytoplankton distribution inthe Kali estuary-A seasonal study. Pollution Research 15:23-27.
Naik, Ulhas G., Naik R.K. and Nayak, V.N. (2006) Primary productivityin the Karwar bay, Karnataka, west coast of India.Environment and Ecology 24(4): 827-831.
Qasim, S.Z. and Gopinathan, C.K. (1969) Tidal cycle and theenvironmental features of Cochin backwater (a tropicalestuary). Proceeding of Indian Academy Sciences, B 69: 336-348.
Qasim, S.Z. and Sengupta, R. (1981) Environmental characteristicsof the Mandovi-Zuari estuarine system in Goa. EstuarineCoastal Shelf Sci. 13: 557-578.
Qasim, S.Z., Wallershaws, S.P., Bhattathiri M.A. and Abidi, S.A.H.(1969) Organic production in a tropical estuary. Proceedingof Indian Academy Sciences, B 69: 51-74.
Ramamirtham, C.P. and Jayaraman, R. (1963) Some aspects of thehydrographical conditions of the backwaters around WillingdonIsland, Cochin. J. Marine Biological Association of India 5:170.
Rangarajan, K. (1959) Light penetration in the inshore waters ofPorto Novo. Proceeding of Indian Sciences, Sect. B. 49: 271-279.
Redekar, P.D. and Wagh, A.B. (2000) Planktonic diatoms of theZuari estuary, Goa (west coast of India). Seaweed ResearchUtilization 22(1 & 2): 107-112.
Shannon, C.E. and Weiner, W. (1963) The Mathematical Theory ofCommunications. Urbana Univ. Illinois Press. 117: p.111.
Singbal, S.Y.S. (1976) Diurnal variation of some physico-chemicalfactors in the Mandovi estuary of Goa. Mahasagar Bulletin ofNational Institute of Oceanography 9: 27-34.
Strickland, J.D.H. and Parsons, T.R. (1975) A Manual of SeawaterAnalysis. Fisheries Research Board, Canada, Ottawa, 167:pp.310.
Tripathy, S.C., Ray, A.K., Patra, S. and Sarma, V.V. (2005) Waterquality assessment of Gautami-Godavari mangrove estuarineecosystem of Andhra Pradesh, India during September 2001.J. Earth Systems Sciences 114 (2): 185-190.
Utermohl, H. (1931) Verhint ver theor angew. Limnology. 5: 567
Verlencar, X.N. and D’Silva, C. (1978) Mahasagar Bulletin ofNational Institute of Oceanography 11: 83.
Yentsch, C. S. and Ryther, J.H. (1957) Short term variations inphytoplankton chlorophyll and their significance. Limnologyand Oceanogr. 2: 140.
Yentsch, C.S. and Scagel, R.F. (1958) Diurnal study of phytoplanktonpigments. An in situ study in East Sound, Washington. J.Marine Research 17: 567-583.
Received 12 October, 2011; Accepted 5 April, 2011
Diurnal Variation of Phytoplankton

Disposal of waste water as a source of irrigation to
agricultural lands is an old practice and still followed inmost of the developing countries. In the recent past, due torapid industrialization and urbanization, a large volume of
industrial waste water is produced every day. Theseindustrial effluents are disposed-off as such in to sewersystem, which is used for irrigation purposes either directly
or through some water body. It is estimated that 15000million liters of sewage water is produced every day in thecountry, which approximately contributes 3.2, 1.4 and 1.9
million tons of nitrogen, phosphorus and potash,respectively per annum with an economic value of aboutRs. 2600 million (Jurwarkar et al., 1991). However, one
constraint with this approach is the contamination of soilsand crops grown on these soils have bearing on the qualityof the produce. It has been observed that the use of
municipal waste water for irrigation purposes leads tosubstantial increase in the accumulation of heavy metals(Kansal, 1994), consequently crops grown in polluted soils
may accumulate heavy metals to such an extent so as tocause health hazards in animals and human beings.Therefore, the present investigation was undertaken to
evaluate the effects of irrigation with contaminated sewagewater on the concentration of heavy metals in the soils andcrops.
MATERIAL AND METHODS
Sangrur is one of the important cities of Punjab wheredifferent types of industries (paper mill, pipe fittings, ghee
Heavy Metal Content in Soils and Crops Irrigated with UntreatedSewage Water in Sangrur District of Punjab
M.P.S. Khurana, Kuldip Singh* and Dhanwinder SinghDepartment of Soil Science, Punjab Agricultural University, Ludhiana -141 004, India
*E-mail: [email protected]
Abstract: Soil and plant samples collected from different sites receiving sewage and tube-well irrigation in Sangrur District of Punjabwere analyzed for heavy metals to ascertain pollution potential. The sewage irrigated soils accumulated relatively higher amounts ofDiethydene triamine penta acitic acid (DTPA) extractable and total heavy metals in surface as well as at all the depths as compared to tube-well irrigated soils and their content generally decreased with depth. The mean total contents of Pb, Ni, Cd, Zn, Cu, Fe and Mn in sewageirrigated soils were 56.7, 26.7, 2.15, 88.6, 48.4, 10990 and 272.8 mg kg-1 soil, respectively in the surface samples which were 3.02, 4.24,1.12, 1.26, 1.70, 1.30 and 2.10 times their respective content in tube well irrigated soil. All the soil samples, in terms of pollutant elementsof sewage irrigated were found within permissible limits. All the crops had higher amount of micro-nutrients and heavy metals in theirabove ground parts when grown in sewage irrigated soils than in the same plant species grown in tube well irrigated soils. Spinachaccumulated highest amount of micronutrients and heavy metal among all the crops. The extent of accumulation of different pollutantmetals were maximum for Pb followed by Ni and Cd in all crops. In the sewage irrigated soils, the content of Pb, Ni and Cd were below thecritical limit in all the crops except for Cd in spinach.
Key Words: Heavy metals, Sewage irrigated soils, Vegetables, DTPA Extractable
mill, biscuit and glucose factory) are situated along theSunam road. The untreated polluted water released fromthese industries, together with domestic waste water findits way into open drain called “Ganda Nallah” situated inthe out skirts of the city. The farmers of the villages namelyShibian, Uppali, Kanoi and Chotey Nacktey located alongthis open drain use this waste water for irrigation to theircrops. In order to determine the depth wise distribution ofmetals in soils, the samples were collected from 0-15, 15-30, 30-45 and 45-90 cm depth from the locations usingsewage waters largely contaminated by industrial effluentsfor irrigation. Soil samples at the same depths were alsocollected from different far off sites receiving tube-wellirrigation in the same villages. The available contents ofthese metals in the soils were determined by DTPA method(Lindsay and Norvell, 1978). Total contents of pollutantelements (Pb, Ni and Cd) and micro- nutrients (Zn, Cu Feand Mn) were estimated only in the surface layer of bothpolluted and sewage irrigated soils after digesting the soilsamples with hydrofloric and perchloric acids usingplatinum crucibles. Above ground parts of the crops namelycauliflower (Brassica oleracea L.var botrytis), cabbage(Brassica oleracea L.var capitata), spinach (Spinaciaoleracea) and radish (Raphanus sativus) were sampledfrom three locations. The total content of the metals in dryplant material were determined after pooling the groundsamples and digested in a di-acid mixture of nitric andperchloric acid in the ratio of 4:1. The contents of the metalsin the digests were analysed by atomic absorption spectro-photometer.
Indian J. Ecol. (2012) 39(1) : 58-62Indian Journal
of Ecology
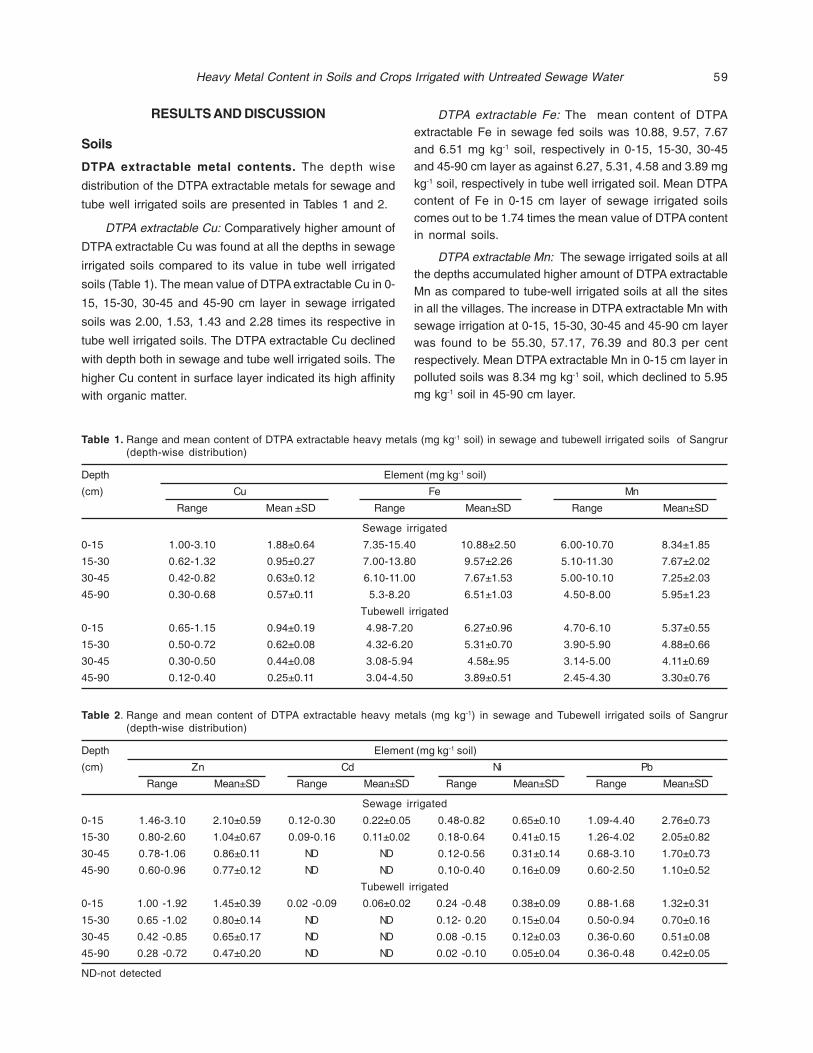
59
RESULTS AND DISCUSSION
Soils
DTPA extractable metal contents. The depth wise
distribution of the DTPA extractable metals for sewage and
tube well irrigated soils are presented in Tables 1 and 2.
DTPA extractable Cu: Comparatively higher amount of
DTPA extractable Cu was found at all the depths in sewage
irrigated soils compared to its value in tube well irrigated
soils (Table 1). The mean value of DTPA extractable Cu in 0-
15, 15-30, 30-45 and 45-90 cm layer in sewage irrigated
soils was 2.00, 1.53, 1.43 and 2.28 times its respective in
tube well irrigated soils. The DTPA extractable Cu declined
with depth both in sewage and tube well irrigated soils. The
higher Cu content in surface layer indicated its high affinity
with organic matter.
DTPA extractable Fe: The mean content of DTPAextractable Fe in sewage fed soils was 10.88, 9.57, 7.67and 6.51 mg kg-1 soil, respectively in 0-15, 15-30, 30-45and 45-90 cm layer as against 6.27, 5.31, 4.58 and 3.89 mgkg-1 soil, respectively in tube well irrigated soil. Mean DTPAcontent of Fe in 0-15 cm layer of sewage irrigated soilscomes out to be 1.74 times the mean value of DTPA contentin normal soils.
DTPA extractable Mn: The sewage irrigated soils at allthe depths accumulated higher amount of DTPA extractableMn as compared to tube-well irrigated soils at all the sitesin all the villages. The increase in DTPA extractable Mn withsewage irrigation at 0-15, 15-30, 30-45 and 45-90 cm layerwas found to be 55.30, 57.17, 76.39 and 80.3 per centrespectively. Mean DTPA extractable Mn in 0-15 cm layer inpolluted soils was 8.34 mg kg-1 soil, which declined to 5.95mg kg-1 soil in 45-90 cm layer.
Table 1. Range and mean content of DTPA extractable heavy metals (mg kg-1 soil) in sewage and tubewell irrigated soils of Sangrur(depth-wise distribution)
Depth Element (mg kg-1 soil)
(cm) Cu Fe Mn
Range Mean ±SD Range Mean±SD Range Mean±SD
Sewage irrigated
0-15 1.00-3.10 1.88±0.64 7.35-15.40 10.88±2.50 6.00-10.70 8.34±1.85
15-30 0.62-1.32 0.95±0.27 7.00-13.80 9.57±2.26 5.10-11.30 7.67±2.02
30-45 0.42-0.82 0.63±0.12 6.10-11.00 7.67±1.53 5.00-10.10 7.25±2.03
45-90 0.30-0.68 0.57±0.11 5.3-8.20 6.51±1.03 4.50-8.00 5.95±1.23
Tubewell irrigated
0-15 0.65-1.15 0.94±0.19 4.98-7.20 6.27±0.96 4.70-6.10 5.37±0.55
15-30 0.50-0.72 0.62±0.08 4.32-6.20 5.31±0.70 3.90-5.90 4.88±0.66
30-45 0.30-0.50 0.44±0.08 3.08-5.94 4.58±.95 3.14-5.00 4.11±0.69
45-90 0.12-0.40 0.25±0.11 3.04-4.50 3.89±0.51 2.45-4.30 3.30±0.76
Table 2. Range and mean content of DTPA extractable heavy metals (mg kg-1) in sewage and Tubewell irrigated soils of Sangrur(depth-wise distribution)
Depth Element (mg kg-1 soil)
(cm) Zn Cd Ni Pb
Range Mean±SD Range Mean±SD Range Mean±SD Range Mean±SD
Sewage irrigated
0-15 1.46-3.10 2.10±0.59 0.12-0.30 0.22±0.05 0.48-0.82 0.65±0.10 1.09-4.40 2.76±0.73
15-30 0.80-2.60 1.04±0.67 0.09-0.16 0.11±0.02 0.18-0.64 0.41±0.15 1.26-4.02 2.05±0.82
30-45 0.78-1.06 0.86±0.11 ND ND 0.12-0.56 0.31±0.14 0.68-3.10 1.70±0.73
45-90 0.60-0.96 0.77±0.12 ND ND 0.10-0.40 0.16±0.09 0.60-2.50 1.10±0.52
Tubewell irrigated
0-15 1.00 -1.92 1.45±0.39 0.02 -0.09 0.06±0.02 0.24 -0.48 0.38±0.09 0.88-1.68 1.32±0.31
15-30 0.65 -1.02 0.80±0.14 ND ND 0.12- 0.20 0.15±0.04 0.50-0.94 0.70±0.16
30-45 0.42 -0.85 0.65±0.17 ND ND 0.08 -0.15 0.12±0.03 0.36-0.60 0.51±0.08
45-90 0.28 -0.72 0.47±0.20 ND ND 0.02 -0.10 0.05±0.04 0.36-0.48 0.42±0.05
ND-not detected
Heavy Metal Content in Soils and Crops Irrigated with Untreated Sewage Water

60
DTPA extractable Zn: DTPA extractable Zn also exhibiteddecreasing trend with depth. The mean values of DTPA
extractable Zn in tube-well irrigated soils in 0-15 and 45-90cm layer was 1.45 and 0.47 mg kg-1 soil respectively, whichwere 69 and 61 per cent of the corresponding values of
polluted soils (Table 2).
The increase in micro nutrient content in soil withsewage irrigation has been reported by many workers
(Adhikari et al., 1998; Kuhad et al., 1989). Kuhad et al. (1989)also observed higher concentration of metals such as Zn,Cu, Mn and Fe in the surface layer of the sewage irrigated
soils in comparison to tubewell irrigated soils of Sonepatdistrict of Haryana. Bosewell (1975) reported that the contentof Cu and Zn in soil was remarkably higher after one year of
sludge application.
DTPA extractable Cd, Pb and Ni: Higher amounts ofDTPA extractable Cd, Pb and Ni were found at all the depths
in sewage irrigated soils compared to tube well irrigatedsoils. Higher amounts of DTPA extractable Cd, Pb and Ni atsurface layer indicated their low mobility and diminution
with depth. Mean DTPA extractable content of Cd, Pb and Niin sewage irrigated soils irrespective of sites were 4.4, 1.71and 1.85 times their content in tube well irrigated soils (Table
2). The results also find support from the work of Dowdy etal. (1991) who found that massive sludge additions (765Mg ha-1 on dry weight basis) over a period of 14 years
resulted in an increased concentration of Cd, Zn and Cu inAp1 genetic horizon. The movement of these metals wasrestricted and usually stay at tillage depth. The others
workers like Sharma and Kansal (1986) also observed thataround Ludhiana City, Punjab, the soils that received waterof Budda Nallah (a rivulet contaminated with industrial and
municipal wastes) were enriched with heavy metals.Accumulation was greater in surface soils but decreasedwith depth. The increase in heavy metals content of soils
with continuous application of sewage water has beenreported by Brar et al. (2002). Azad et al. (1986) found that
accumulation of Cd, Ni and Co was higher in soils irrigatedwith sewage water as compared with tubewell water
irrigation and their content decreased with depth. Kansaland Khurana (2000) observed that waste water irrigationelevated the level of both available and total Cd content in
soils of all the three industrial towns of Punjab namelyLudhiana, Amritsar and Jalandhar. In an other studyKhurana and Kansal (2001) found elevated concentration
of DTPA extractable Pb in sewage irrigated soils in all theindustrial towns of Punjab both in surface (0-15 cm) andsub surface (15-30 cm) as compared to normal soils.
Total metal content. Elevated concentration of total Pb, Ni,Cd, Zn, Cu, Fe and Mn was found in sewage fed soils ofSangrur district as compared to normal soils. Mean contents
of Pb, Ni, Cd, Zn, Cu, Fe and Mn in sewage irrigated soilswere 56.7, 26.7, 2.15, 88.6, 48.4, 10990 and 272.8 mg kg-1
soil, respectively, which were 3.02, 4.24, 1.12, 1.26, 1.70,
1.30 and 2.10 times their respective content in tube wellirrigated soil (Table 3). The increase in the mean content ofvarious metals with sewage irrigation may have resulted
from higher rate of metal loading from industrial effluents.
Critical values based on total metal content are availablein literature for categorizing soils into polluted category. If
guidelines of Kabata and Pendias (1984) were to beconsidered, where maximum concentrations of Pb, Ni, Cd,Zn, Cu and Mn were taken as 100, 100, 3, 200, 60 and 1500
mg kg-1 soil, respectively, no soil samples of sewageirrigated soils of Sangrur fall in polluted category. However,use of untreated waste water on long term basis would
result in development of contaminated soils.
Vegetable Crops
Micronutrient content in various crops. Invariably, all thecrops contained higher amount of micro-nutrient cations
like Zn, Cu, Fe and Mn in their above ground parts whengrown in sewage irrigated soils than in the same plantspecies grown in tube well irrigated soils. The higher
Table 3. Total content of heavy metals (mg kg-1 soil) of sewage and tube well irrigated soils of Sangrur (0-15 cm)
Element (mg kg-1 soil)
Cu Fe Mn Zn Pb Ni Cd
Sewage irrigated soils
Mean± SD 48.4±17.4 10990±1134.6 272.8±52.3 88.6±24.1 56.7±10.8 26.7±4.5 2.15±0.52
(16.5-68.4) (9580-13100) (200-352) (58.2-121.0) (39.9-72.4) (20.4-32) (1.50-2.72)
Tubewell irrigated soils
Mean± SD 11.4±2.45 9747±316.7 215.6±45.6 28.38±8.4 33.06±3.2 20.50±3.78 1.02±0.10
(8.0-14.3) (9358-10210) (176-286) (19.2-43.2) (29.8-37.2) (15.4-25.4) (0.80-1.25)
Permissible Limits - - - - 100-500 100 3-8
Figures in parentheses indicate range
M.P.S. Khurana, Kuldip Singh and Dhanwinder Singh

61
content of DTPA extractable metals in sewage irrigated soilshas caused the growing plants in these soils to take upthese elements in higher amounts. Different crops showeddifferent pattern of accumulation of micronutrient content.The content of Zn in their above ground parts of cauliflower,cabbage, spinach and radish in sewage irrigated soils were1.62, 1.92, 1.20 and 1.56 times their content in tube wellirrigated soils. The increase in the content of Cu withsewage irrigation was found to be 23.5, 15.3, 31.5 and 78.1per cent, respectively. The content of Fe in cauliflower,cabbage, spinach and radish were 180, 74, 560 and 452μg g-1 dry matter, respectively in sewage irrigated soils.Similarly, increase in the content of Mn in cauliflower,cabbage, spinach and radish in sewage irrigated soilsemulated the same pattern. Singh and Sakal (2001)reported higher concentration of micronutrients in differentcrops than normal in sewage sludge treated soils. Adhikariet al. (1998) reported that the comparatively higherconcentration of the micronutrients in vegetables incomparison to normal soils has resulted from the additionof these elements through the continuous application ofsewage water in the outskirts of city of Calcutta. Themicronutrient concentration for various crops in sewageirrigated sangrur soils can be arranged in the following order
Zn : Spinach > cauliflower > cabbage > radishFe : Spinach > radish > cauliflower > cabbage
Cu : Spinach > radish> cauliflower > cabbageMn : Radish > spinach > cauliflower > cabbage
It may be concluded that spinach accumulated highestamount of Zn, Cu and Fe except Mn in its above groundparts indicating it to be the efficient accumulator amongthese crops. Although, micronutrient accumulation wasmore in sewage irrigated soils than normal soils, but noneof the micronutrient approached the level of toxicity, in any ofthe plant species.
Table 4. Amount of micronutrient and pollutant elements (μg g-1) in shoot (above ground parts) of various crops in sewage irrigated andtubewell irrigated soils
Crop Micronutrient element (μg g-1) Pollutant elements (μg g-1)
Cu Fe Mn Zn Pb Ni Cd
Sewage irrigation
Cauliflower 8.4 180.0 48.0 53.6 2.10 1.02 0.24
Cabbage 6.8 74.0 30.0 38.4 2.75 0.87 0.48
Spinach 14.2 560.0 57.4 50.2 5.02 3.00 1.98
Radish 11.4 452.0 60.27 45.0 1.45 1.12 0.56
Tubewell irrigation
Cauliflower 6.8 84.3 30.0 32.8 1.03 0.50 0.04
Cabbage 5.9 45.0 21.8 20.0 1.46 0.40 0.08
Spinach 10.8 402.0 32.8 41.8 2.40 0.83 0.10
Radish 6.4 270.0 23.5 29.5 0.98 0.90 0.04
Pollutant elements. Pollutant elements unlike those of
micronutrients, become toxic to the plants and animal
species at a very low concentration. Their presence above
the critical limit in the plants may cause health hazards in
animals and human beings. The three pollutant elements
(Pb, Ni and Cd) were present in higher concentration in the
above ground parts of all the plant species growing on
sewage fed soils in comparison to their concentration in
tube well irrigated soils. The amount of Pb, Ni and Cd in
cauliflower irrigated with sewage water was 2.03, 1.82 and
4.8 times their respective content in tube well water irrigation.
Other pollutant elements also followed the same pattern
regardless of the crop species. The extent of accumulation
of different metals was maximum for Pb followed by Ni and
Cd in all the plant species. The content of Pb, Ni and Cd
were found below the critical limit of 10, 5 and 0.8 μg g-1
(Allaway, 1968) respectively for Pb, Ni and Cd in all the crops
except for spinach in the sewage irrigated soils where
concentration of Cd was 1.98 μg g-1 (Table 4). More recently,
Aulakh et al. (2009) found that the mean concentrations of
Pb, Cr, Cd, and Ni in crops grown on sewage-irrigated soils
were 4.88, 4.20, 0.29, and 3.99 mg kg”1, respectively, which
were significantly higher than their concentrations in
tubewell-irrigated soil.
From this study, it is revealed that in most of the
situations where soils of Sangrur district have been
receiving sewage irrigation for the last many years, the
plants growing on them has not yet crossed the threshold
values of toxicity. It is advisable to monitor the build up of
these elements on long term basis. It is desirable that the
waste water particularly industrial effluent would be made
to undergo suitable treatment in wastewater treatment
plants before being discharged in to water bodies.
Heavy Metal Content in Soils and Crops Irrigated with Untreated Sewage Water

62
REFERENCESAdhikari, S., Mitra, A., Gupta, S.K. and Banerjee, S.K. (1998) Pollutant
metal contents of vegetables irrigated with sewage water. J.Indian Soc. Soil Sci. 46: 153-155.
Allaway, W.H. (1968) Agronomic controls over the environmentalcycling of trace elements. Adv. Agro. 20: 235-274.
Aulakh, M.S., Khurana, M.P.S. and Dhanwinder Singh (2009)Water pollution related to agricultural, industrial, and urbanactivities, and its effects on the food chain: Case studies fromPunjab. J. New Seeds 10:112-137.
Azad, A.S., Sekhon, G.S. and Arora, B.R. (1986) Distribution ofcadmium, nickel and cobalt in sewage water irrigated soils. J.Indian Soc. Soil Sci. 34: 619-622.
Bosewell, F.C. (1975) Municipal sewage sludge and selectedelements application to soils. J. Envion. Qual. 4: 267-273.
Brar, M.S., Khurana, M.P.S. and Kansal, B.D. (2002) Effect of irrigationby untreated sewage effluents on the micro and potentiallytoxic elements in soils and plants. In: Proc 17 the WorldCongress of Soil Science held at Bangkok, Thailand fromAugust 14-21, 2002, Volume IV, Symposium no 24, pp 198(1)–198(10).
Dowdy, R.H., Lattreell, J.J., Hinesly,T.D., Grassman, R.B. andSullivan, D.L. (1991) Trace metal movement in an aericochraqualf following 14 years of annual sludge application J.Environ. Qual. 20: 119-123.
Jurwarkar, A.S., Jurwarkar Asha, Deshbharatan, P.B. and Bal, A.S.(1991) Exploitation of nutrient potential of sewage and sludgethrough land application. In: Asian Experience in IntegratedPlant Nutrition. RAPA-FAO, Bankok, pp. 178-201.
Kabata, P.A. and Pendias, H. (1984) Trace Elements in Soil andPlants. p 365. CRC Press Inc Boca Raton, Florida, U.S.A.
Kansal, B.D. (1994). Efeect of domestic and industrial effulents onagricultural productivity. In: G.S. Dhaliwal and B.D. Kansal(Eds) Management of Agricultural Pollution in India.Commonwealth Publishers, New Delhi, pp. 157-176.
Kansal, B.D. and Khurana, M.P.S. (2000) Cadmium accumulation inalluvial soils from agricultural use of urban and industrial wastewater. 8th International Congress on Soil Science, Islamabad,Pakisthan, Nov 13-16, 2000.
Khurana, M.P.S. and Kansal, B.D. (2001) Lead contamination ofalluvial soils as influenced by sewage irrigation. Paperpresented at the 66th Annual Convention of the Indian Societyof Soil Science held at Udipur from 29th Oct to 3 Nov 2001.
Kuhad, M.S., Malik, R.S., Singh, R. and Singh, A. (1989) Studied onmobility and accumulation of heavy metals in agricultural soilsreceiving sewer water irrigation. J. Indian Soc. Soil Sci. 37:290-294.
Lindsay, W.L. and Norvell, W.A. (1978) Development of DTPA soiltest for zinc, iron manganese and copper. Soil Sci. Soc. Amer.J. 42: 421-428.
Sharma, V.K. and Kansal, B.D. (1986) Heavy metal contaminationof soils and plants with sewage irrigation. Pollut. Res. 4: 86-91.
Singh, A.P and Sakal, R. (2001) Sewage sludge treated soils:Distribution and translocation of micronutrient cations indifferent plant species. Sust. Chemi. Agri. 2: 22-32.
Received 4 May, 2011; Accepted 12 December, 2011
M.P.S. Khurana, Kuldip Singh and Dhanwinder Singh

Majority of the Indian population is vegetarian and theydepend for their protein requirement on pulses. Pulses arethe cheapest source of protein and sustain the productivity
of cropping system by their ability to use atmosphericnitrogen through biological nitrogen fixation, which isecologically most acceptable and economically viable.
Availability of all the essential plant nutrients in adequatequantity and balanced proportion is essential to realize fullpotentiality of yield from newly developed high yielding
improved varieties. Phosphorus is desirable for promotingnitrogen fixation by soil microorganisms. Thus, phosphorusrequirement of leguminous crop, which is totally dependent
for meeting out their nitrogen requirement on atmosphericnitrogen fixation by symbiotic Rhizobium are higher thancereals. Sulphur deficiency in soil affects the assimilation
of nitrogen and synthesis of protein. Cobalt, Boron andMolybdenum are essential for the growth of Rhizobiumand nitrogen fixation. These micronutrients are essential
for synthesis of vitamin B12, translocation of materials,photosynthesis, absorption of nitrogen required forsynthesis of amino acids and proteins, carbohydrate
metabolism and proper nodulation. The studies onintegrated effect of various micronutrients at varying soilfertility on yield attributes of leguminous plants are very
scare. The present study was designed to study theinteractive effect of nutrients on pea (Pisum sativum L.) bykeeping the record of cropping history of the field from which
soil was taken for pot experiment. Mostly the paddy-wheatand paddy-pea have been the main crop rotation. Paddybeing transplanted and water logged crop witness high
rate of protection of applied water resulting into leachinglosses of many essential plant nutrients. Cobalt is one of
Interactive Effect of Cobalt, Boron and Molybdenum on YieldAttributes of Pea (Pisum sativum L.)
D. K. Singh*, P. Kumar1 and S.K. SinghKrishi Vigyan Kendra, 1Department of Environmental Science, P.G. College, Ghazipur, U.P., India
*E-mail: [email protected]
Abstract: An experiment was conducted during the winter season of 2008-09 and 2009-2010 to study the interactive effect of cobalt,boron and molybdenum on yield attributes of pea (Pisum sativum L.) at fertility level of 30 mg P2O5+20 mg S+2.5 mg Zn, per kg soil and60mg P2O5+40 mg S+5.0 mg Zn, per kg soil on number of pod per plant, no. of seeds per pod, grain yield and straw yield. The number ofpod per plant and number of seeds per pod were significantly influenced with increasing levels of fertility in both the years. Themacronutrients viz. Co, B and Mo have also shown significant impact on number of pod per plant and number of seeds per pod. The grainyield was affected significantly at higher fertility level. A significant increase in grain yield and straw yield was recorded by the use ofCo, B and Mo but the combined effect of fertility did not show significant impact.
Key Words: Interactive effect, Micronutrient, Yield, Pea
such element which becomes critically deficient after paddycropping.
MATERIAL AND METHODS
A pot experiment was conducted during winter at
Agricultural Research Farm of Krishi Vigyan Kendra,Ghazipur in the year 2008-09 and 2009-2010. Certifiedseeds of pea Malviya 15 were used for the experiment. The
pot experiment was conducted in a glass house. Eachearthen pot was cleaned by fresh water and its outer andinner surfaces were coloured by red and black paint,
respectively. The pots were filled with 10 kg processed soil.The recommended dose of N, P2O5, K2O, S and Zn for peais 20, 60, 30, 40 and 5 kgha-1, respectively. Our idea was to
accommodate two levels of P, S and Zn, one at par with therecommended dose, while the other at an elevated level sothat the optimum dose could be assertained. The treatments
consisted of two fertility levels viz. F1: P1S1Zn1 (30:20:2.5mgkg-1 of P2O5, sulphur and zinc) and F2: P2S2Zn2 (60:40:5 mgkg-1 of P2O5, sulphur and zinc) Uniform application of N (20
mg kg-1 soil ) and K (30 mg K2O kg-1 soil) was applied ineach pot. Eight concentration of micronutrients viz. control,Co 2 mg kg-1, B 0.3%, Mo 1 mg kg-1, Co 2 mg kg-1 + B 0.3%,
Co 2 mg kg-1 + 1 mg kg-1, B 0.3% + Mo 1 mg kg-1, Co 2 mgkg-1 + B 0.3% + Mo 1 mg kg-1 were tested in completelyRandomized Block Design (factorial arrangement) with four
replications. All the nutrients were applied as basal exceptboron, for which foliar application was done at 45 and 60days after sowing. Nitrogen, potassium, phosphorus,
sulphur, zinc, molybdenum and cobalt were applied throughurea, KCl, KH2PO4, CaSO4.2H2O, ZnSO4 7H2O, ammoniummolybdate and cobalt nitrate, respectively. Boron was
Indian J. Ecol. (2012) 39(1) : 63-66Indian Journal
of Ecology

64
applied as sodium borate in solution form.
The average number of pods per plant and grains of
pods were counted and the mean values were expressedas number of pod per plant and number of grain per pod,respectively. Harvesting was done manually at complete
maturity. The grain yield and straw yield was measured ingram per pot. Soil samples were taken from each earthenpot for analysis before cropping from a depth of 0-15 cm.
Collected soil samples were analysed for various physico-chemical properties (Piper, 1966).
RESULTS AND DISCUSSION
The number of pods per plant as influenced by
micronutrient under fertility levels F1 and F2 are shown inthe Table 2. It is evident from data that treatment effect hassignificant impact over control. F1 fertility level showed 19.17
and 17.23 per cent more number of pods per plant thancontrol during 2008-09 and 2009-10, respectively. Themaximum number of pods per plant were observed under
F2 fertility level. Significant impact of micronutrients wasobserved at both fertility level during both the years. Thenumber of pod increased by 6.13, 3.15, 3.92, 6.04, 7.21,
0.94 and 3.24 per cent during 2008-09 and 6.64, 4.97,4.68, 7.85, 8.06, 3.34 and 6.43 per cent during 2009-10 bythe application of Co, B, Mo Co+B, Co+Mo, B+Mo, Co+B+Mo
over control, respectively. The number of pods increasedsignificantly due to application of Cobalt, othermicronutrients did not cause significant impact on number
of pods per plant. The interaction of B x Co and B x Mo wasalso significant. These findings are in close conformity withthe findings of Srivastava and Verma (1984), Kanaujia et al.(1998, 1999) and ABO-Shetara and Soheir (2001).
The number of seeds per pod increased significantlysuperior over control. The number of seeds per pod were
19.4 and 27.92 per cent more than absolute control during
2008-09 and 2009-10, respectively. F2 fertility level produced13.98 and 18-07 per cent more number of seeds per pod
than F1 during 1st and 2nd year, respectively. Micronutrientsalso showed significant impact on number of seeds perpod. Increase in number of seeds per pod over control by
the application of Co, B, Mo, Co+B, Co+Mo, B+Mo, Co+B+Mowas 12.84, 12.47, 11.74, 16.14, 13.76, 16.51 and 21.10 percent, respectively, during 2009-10. Significant increase in
number of seeds per pod were noted by to application ofCo, B and Mo during both the years. These resultscorroborate with the finding of Srivastava and Ahlawat
(1995).
F1 fertility level recorded 40.61 and 48.15 per cent moregrain yield per pot than control during 2008-09 and 2009-
10, respectively. Fertility level showed significant impact ongrain yield per pot during both the years. The F2 fertility levelshowed 48 and 11.37 per cent more yield than F1 fertility
level during 2008-09 and 2009-10, respectively.Micronutrients also showed significant impact at both fertilitydoses during both the years. Grain yield increased by 47.60
42.81, 44.64, 49.40, 51.18, 45.89 and 53.57 pre cent during2008-09 and 48.23, 45.10. 45.67, 51.55, 41.44, 47.53 and54.00 per cent during 2009-10 by the application of Co, B,
Mo, Co+B, Co+Mo, B+Mo, Co+B+Mo, respectively overcontrol.
The straw yield was infuenced significantly with fertilizer
application (40.62 and 48.28 per cent more than controlduring 2008-09 and 2009-10, respectively). Fertility levelalso affected significantly. The application of F2 fertility level
produced 5.09 and 15.81 per cent more straw yield per potthan F1 fertility level during first and second year, respectively.The micronutrient also showed significant impact on straw
yield of pea per pot. Increase in straw yield per pot overcontrol by the application of Co, B, Mo, Co+B, Co+Mo, B+Mo,Co+B+Mo was 47.0, 42.34, 44.12, 48.64, 50.40, 45.17 and
Table 1. Chemical analysis of the soil
Soil parameter Procedure followed 2008-09 2009-10
pH Chopra and Kanwar (1991) 7.5 7.6
EC(milli mhos per cm) Chopra and Kanwar (1991) 0.26 0.38
CEC mole (P+) kg-1 Jackson (1973) 12.65 12.70
Organic carbon(%) Walkley and Black (1934) 0.36 0.38
Available N (kg ha-1 ) Subbiah and Asija (1956) 230.0 236.0
Available P (kg ha-1) Olsen’s (1954) 18.00 20.00
Available K (kg ha-1 ) Jackson (1973) 22.00 230.00
Available S (kg ha-1) Chesnin and Yien (1951) 18.00 20.00
Available Co ppm Lindsay and Norvell (1978) 0.1 0.1
Available B ppm Jackson (1973) 0.2 0.2
Available Mo ppm Jackson (1973) 0.08 0.08
D. K. Singh, P. Kumar and S.K. Singh

65
Tab
le 2
. E
ffect
of
Co,
B a
nd M
o at
diff
eren
t fe
rtili
ty s
tatu
s on
yie
ld a
nd y
ield
con
trib
utin
g pa
ram
eter
s
Tre
atm
en
tsN
umbe
r of
pod
s pe
r pl
ant
Num
ber
of s
eeds
per
pod
Gra
in y
ield
(g
per
pot)
Str
aw y
ield
(g
per
pot)
20
08-0
9
2009
-10
20
08
-09
20
09
-10
20
08-0
9
2009
-10
20
08
-09
20
09
-10
F 1F 2
F 1F 2
F 1F 2
F 1F 2
F 1F 2
F 1F 2
F 1F 2
F 1F 2
Co
ntr
ol
21
24
23
25
55
.95
68
99
39
211
311
71
21
12
01
46
Co
2pp
m2
32
42
52
65
.96
.56
6.8
13
21
38
14
21
63
17
11
79
18
52
12
B 0
.3%
22
24
25
26
5.7
6.6
5.8
6.7
12
81
33
13
81
59
16
51
73
18
02
07
Mo
1p
pm
22
24
24
26
5.8
6.4
5.9
6.7
12
91
35
13
91
59
16
71
76
18
12
07
Co
2ppm
+ B
0.3
%2
32
42
62
66
6.7
6.1
6.9
13
41
39
14
51
66
17
31
81
18
82
16
Co
2p
pm
+ M
o 1
pp
m2
42
42
62
66
.16
.46
.26
.91
35
14
11
46
16
51
75
18
31
89
21
4
B 0
.3%
+ M
o 1p
pm2
12
42
42
56
6.8
66
.81
31
13
61
41
16
11
69
17
71
84
20
9
Co
2ppm
+ B
0.3
%
+2
22
42
52
66
.36
.96
.37
13
81
43
14
91
67
17
71
86
19
32
17
Mo
1p
pm
Me
an
22
24
24
26
5.6
6.4
5.7
6.6
12
31
29
13
21
53
15
91
67
17
21
99
Ab
solu
te c
on
tro
l1
9-
21
-5
-4
.8-
73
-7
9-
95
-1
02
-
Co
mp
ari
son
be
twe
en
SE
m±
CD
(5%
)
S
Em
± C
D(5
%)
SE
m±
CD
(5%
)S
Em
±C
D (
5%)
SE
m±
CD
(5%
)S
Em
±C
D (
5%)
SE
m±
CD
(5%
)S
Em
±C
D (
5%)
Mea
ns o
f F
ertil
ity0
.10
.40
.20
.64
0.1
0.1
0.1
0.2
1.2
3.4
1.8
5.1
1.6
4.5
2.3
6.6
Mea
ns o
f M
icro
nutr
ient
s0
.10
.40
.20
.64
0.1
0.1
0.1
0.2
1.2
3.4
1.8
5.1
1.6
4.5
2.3
6.6
Inte
ract
ion
F
xM0
.20
.50
.30
.91
0.1
0.2
0.1
0.3
1.7
4.8
2.5
7.2
2.2
6.3
3.3
9.3
Tre
atm
ent
vs C
ontr
ol0
.41
.10
.61
.82
0.1
0.4
0.2
0.5
3.4
9.5
5.1
14
4.5
13
6.6
19
Effect of Cobalt, Boron and Molybdenum on Pea Yield
66
52.43 per cent during 2008-09 and 49.05, 45.01, 45.55,51.30, 47.40. 44.02 and 53.86 per cent during 2009-10,
respectively.
Grain yield and straw yield significantly increased bythe use of Co, B and Mo but the combined effect of fertility
and micronutrient did not show significant impact on grainand straw yield of pea.
REFERENCESABO- Shetia A.M. and Soheir, A.M. (2001) Yield and yield component
response of chickpea (Cicer arietinum) to phosphorusfertilization and micronutrients. Arab University. J. AgriculturalSci. 9(1): 235-248.
Chesnis, L. and Yien, C.H. (1951) Turbidimetric determination ofavailable sulphates, proceedings of the soil. Science Societyof America 14:149-151.
Chopra, S.L. and Kanwar, J.S. (1991) Analytical AgriculturalChemistry, Kalyani publisher’s New Delhi.
Jackson, M.L. (1973) Soil Chemical Analysis, Prentice Hall of IndiaPrivate Limited, New Delhi.
Kanaujia, S.P., Sharma, S.K. and Rastogi, K.B. (1998) Effect of P.K.and Rhizobium inoculation on growth and yield of pea(Pisum sativum ). Annals of Agricultural Research 19(2):219-221.
Kanaujia, S.P., Tripathi, D., Narayan, R. and Shukla, Y.R. (1999)Influence of P, K and Rhizobium on green pod yield of pea(Pisum sativum L.) cv Linoln. Advance in Horticulture andForestry 7 :107-112.
Lindsay, W.L. and Norvell, W.A. (1978) Development of DTPA soiltest for zine, iron, manganese and copper. Soil Science Societyof America Journal 42: 421-428.
Olsen, S.R., Cole, C.V., Watanbe, F.S. and Dean, L.A. (1954)Estimation of available phosphorus in soil by extraction withsodium bicarbonate. U.S. Department of Agricluture Circular939, U.S. Govt,. Printing Office, Wahington DC.
Piper, C.S. (1966) Soil and plant analysis. Academic Press, NewYork.
Srivastava, S.N.L. and Verma, S.C. (1984) Effect of nitrogen,Rhizobium and techniques of phosphorus application on yieldand quality of field pea (Pisum sativum L.). Legume Research7(1): 37-42.
Srivastava, T. K. and Ahlawat, I.P.S. (1995) Response of pea (PisumSativum) to phosphorus, molybdenum and biofertilizers. IndianJ. Agron. 40(4): 630-635.
Subbiah, B.V. and Asija, G. L. (1956) A rapid procedure fordetermination of available nitrogen in soils. Curr. Sci. 25: 259-260.
Walkley, A. J. and Black, I .A. (1934) An estimation of soil organiccarbon by the chromic acid titration method. Soil Science 37:29-38.
Received 12 March, 2011; Accepted 12 December, 2011
D. K. Singh, P. Kumar and S.K. Singh

Jammu & Kashmir state is famous throughout the worldnot only for its scenic beauty of mountains, pastures, lakes,rivers, meadows, heritages, gardens, etc but also for the
production of diverse type of fruits because of theiradaptability owing to topography, parent material, vegetation,soils, besides climate. The state is by and large a
mountainous area comprising of sub-tropical, intermediate,temperate and cold arid zone on the basis of altitude andclimate. The temperate zone comprises of whole of Kashmir
valley and higher reaches of Doda and Poonch districts.The altitude of the valley varied from 1500 to 2500 metersabove mean sea level. The altitude has a considerable
effect on the nutrient status of soil and plant growth as thevariation in climate has resulted in significant differencesin leaf composition of the plants. In India pear occupies
third place in temperate fruits both in area and productionand is cultivated largely in Jammu & Kashmir state andalso in upper hills of Himachal Pradesh and Uttrakhan.
However, sand pear or oriental pear requires less chillingand is cultivated in semi-temperate regions of the states ofPunjab, Haryana and Nilgiri regions. In Jammu and
Kashmir, the pear ranks second among the pome fruitsafter apple in acreage and production. The area under pearwas 12.10 thousand hectares with a production of 45.86
thousand metric tonnes. Among various factors ofproduction, nutrition of pear fruits has received aconsiderable attention in recent years, because of
importance of nutrients in quality production of fruits andalso due to their relationship to physiological disorders andother effects particularly reducing respiration, delaying
ripening and increasing fruit firmness thereby extendingtheir storage and shelf life. Imbalance of nutrients causesseveral disorders which consequently affects the quality
Micro-nutrient Status of Pear Orchards in Kashmir
M. A. Dar, J. A. Wani, S.K. Raina*, M.Y. Bhat1 and M.A. MalikDivision of Soil Science, 1Division of Fruit Science
Sher-e-Kashmir University of Agricultural Sciences and Technology of Kashmir,Shalimar Srinagar (J&K) -191 121, India
*E-mail: [email protected]
Abstract: The present study was undertaken to find out the concentration of micro-nutrients in the leaves of pear cultivar “Bartlett”grown in Kashmir, which revealed that concentration of zinc and manganese were adequate to high, whereas copper content was lowto adequate . The concentration of Iron was found adequate in all the samples of pear orchards. The relationship among the micro-nutrientcations in the foliage of pear was significantly positive. The micro-nutrients varied significantly among the pear orchards of three altitudesduring the course of study.
Key Words: Micro-nutrients, Pear, Kashmir, Altitude, Soils
and yield of pear. Besides major elements, micro-nutrientelements are also required in small quantities because oftheir role as activators, structural components, energy
transfer and as regulator of cell constituents. Different micro-nutrient elements are required for carrying out variousphysiological processes in plants, and thereby maintaining
their essentiality in growth and nourishment of plantsleading to maximum production of quality fruits. Since thenutritional aspect of pear fruits have not received much
attention so far and no attempt has been made to assessthe status of micro-nutrients in pear orchards of Kashmirvalley. Therefore keeping in view the importance of micro-
nutrients in the production of pear, a study was undertakento evaluate the status of micro-nutrients in pear orchards ofKashmir valley.
MATERIAL AND METHODS
For this study twenty one orchards of uniform age groupwith seven orchards each located in three altitudes viz. high,mid and low altitude were selected. The leaf samples of
pear cultivar “Bartlett” were collected from each sampleorchard following the procedure outlined by Chapman(1964). The leaf samples were washed with tap water and
then dipped in 0.1 N hydrochloric acid solution. Furtherwashings were repeated with single and double distill water.The samples were air dried on filter papers followed by
oven drying at a temperature of 60+5 oC for 72 hours. Thesamples were then ground in a stainless steel blender topass through 2 mm mesh and stored in polythene bags for
analysis. For the determination of micro-nutrient cations,the leaf samples were digested in di-acid mixture of nitricacid and per-chloric acid in the ratio of 10:3. The digested
material was diluted in double distilled water and filtered in
Indian J. Ecol. (2012) 39(1) : 67-70Indian Journal
of Ecology

68
100 ml volumetric flask. In order to ensure complete transferof digested material, about six washings were given with
double distilled water and final volume was made to 100ml. The micro-nutrient cations like zinc, copper, manganeseand iron were determined on atomic absorption
spectrophotometer. The leaf micro-nutrient status wasevaluated on the basis of critical concentrations reportedby Vanden-Ende and Leece (1975) give in Table 1.
Properties of the surface soils in orchards. The soilswere clay loam to silly clay loam in texture with normalelectrical conductivity and calcium carbonate content. The
pH was slightly acidic to slightly alkaline and ranged from6.10 to 7.76 (Table 2). The organic carbon was medium tohigh in soils analyzed and varied from 0.66 to 2.36 per cent.
The DTPA extractable zinc was low to high and ranged from0.54 to 1.82 mg kg-1 soil, while as, DTPA extractable copperwas medium to high ranging from 1.14 to 2.80 mg kg-1 soil.
The DTPA extractable iron and manganese were high inpear orchard soils and varied from 29.6 to 76.0 and 25.4 to54.4 mg kg-1 soil. All available micro-nutrient cations were
observed high in high altitude soils.
Table 2. Properties of surface layers in pear orchard soils ofKashmir
Soil property Range
pH 6.10 - 7.76
EC (dSm-1) 0.10 - 0.44
Calcium carbonate (%) 6.40 - 9.80
Organic carbon (%) 0.66 - 2.36
Available Zinc (ppm) 0.54 - 1.82
Available Copper (ppm) 1.14 - 2.80
Available Iron (ppm) 29.6 - 76.0
Available Manganese (ppm) 25.4 - 54.4
RESULTS AND DISCUSSION
Concentration of micro-nutrients in leaves. Theconcentration of zinc in the leaves of “Bartlett” cultivar ofpear ranged from 44.7 to 58.3, 39.0 to 48.0 and 24.0 to 44.0
ppm with mean value of 52.19, 44.30 and 32.10 ppm inhigh, mid and low altitude orchards, respectively (Table 3).Chaplin and Westwood (1980) and Shen (1990) also
reported similar range of zinc concentration in pear leaves.
The higher concentration of zinc in high altitude may be
attributed to acidic pH which favours the uptake of zinc. The
leaf zinc content was observed adequate in 76 per cent and
high in 24 per cent orchards, which could be attributed to
high content of organic matter and favourable pH for its
uptake. The zinc content in the foliage also revealed
significant variation among the orchards of three altitudes
with highest amount in high altitude orchards and lowest
amount in low altitude orchards. This is supported by the
findings of Mamgain et al. (1988) and Najar (2002). The
leaf copper content in high, mid and low altitude orchards
varied from 14.3 to 19.7, 10.0 to 17.7 and 8.3 to 16.3 ppm
with mean value of 17.04, 13.47 and 11.76 ppm, respectively.
These values are nearly in same magnitude as reported by
Chaplin and Westwood (1980) and Arora et al. (1992). The
leaf copper exhibited significant variation among the
orchards of three altitudes with higher amount in high
altitude orchards. The leaf copper was adequate in 95 per
cent samples and low in per cent samples and low content
was observed in 5 per cent orchards located at low altitude.
This could be due to higher amount of organic matter and
available copper in soils and favourable soil pH for its
uptake in high altitude orchards. Sharma and Bhandari
(1992) and Mamgain et al. (1998) also reported similar
range of copper in apple foliage. The concentration of iron
in leaves ranged from 128.7 to 199.3, 86.0 to 138.0 and
84.0 to 122.7 ppm with mean value of 157.76, 118.06 and
104.71 ppm, respectively in high, mid and low altitude pear
orchards. Similar range of iron concentration was reported
in foliage of pear by Woodbridge (1973) and Arora et al.(1992). The leaf iron was observed adequate in 100 percent
samples and it varied significantly among the orchards of
three altitudes with high content observed in high altitude
orchards, which may be due to high amount of organic
matter as well as available iron and soil condition for its
uptake. Mamgain et al. (1998) and Najar (2002) observed
that high amount of iron in the foliage of apple at higher
altitude was attributed to high amount of organic matter
and available iron in the soil, besides suitable pH for its
uptake. The leaf manganese content of pear ranged from
96.7 to 128.3, 81.3 to 122.0 and 72.0 to 118.3 ppm with
Table 1. Critical concentration of micro-nutrients in pear
Nutrient Micro-nutrients (ppm)
Deficient Marginal Adequate High Excess
Zinc <10 10-19 20-50 >50 -
Copper <5 5-8 9-20 21-50 >50
Iron - <60 60-200 >200 -
Manganese <20 20-59 60-120 120-220 >220
(Vanden-Ende and Leece, 1975)
M. A. Dar, J. A. Wani, S.K. Raina, M.Y. Bhat and M.A. Malik
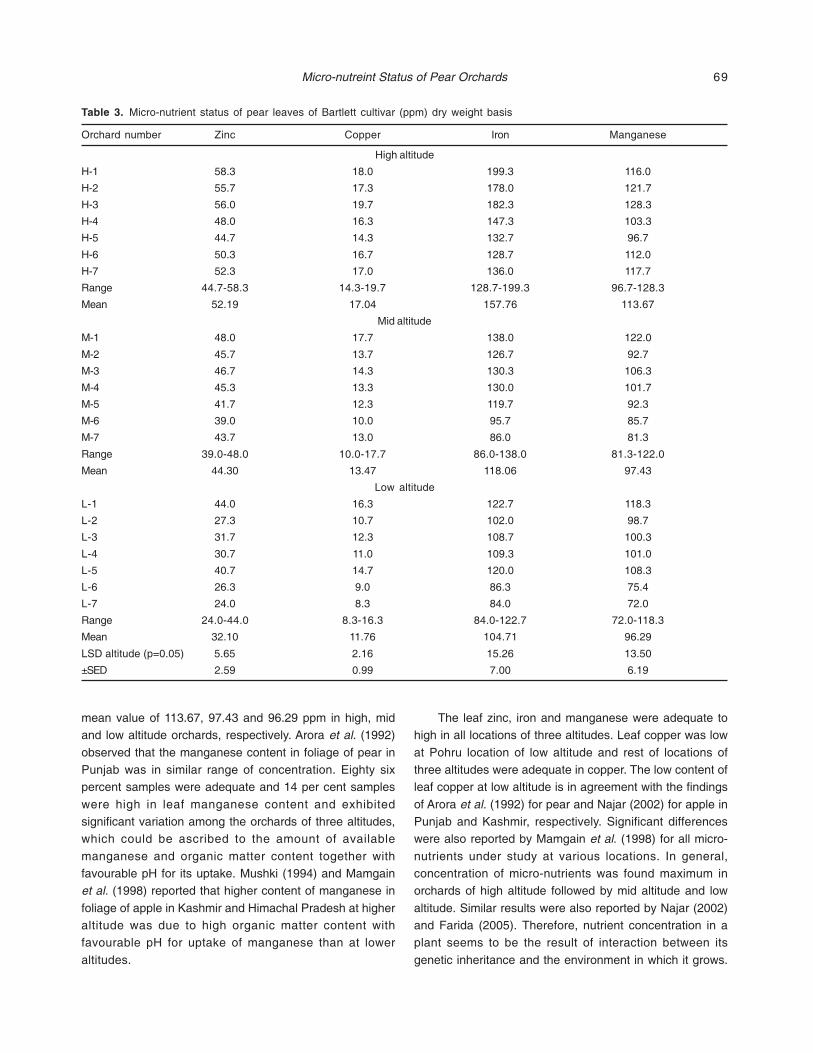
69
Table 3. Micro-nutrient status of pear leaves of Bartlett cultivar (ppm) dry weight basis
Orchard number Zinc Copper Iron Manganese
High altitude
H-1 58.3 18.0 199.3 116.0
H-2 55.7 17.3 178.0 121.7
H-3 56.0 19.7 182.3 128.3
H-4 48.0 16.3 147.3 103.3
H-5 44.7 14.3 132.7 96.7
H-6 50.3 16.7 128.7 112.0
H-7 52.3 17.0 136.0 117.7
Range 44.7-58.3 14.3-19.7 128.7-199.3 96.7-128.3
Mean 52.19 17.04 157.76 113.67
Mid altitude
M-1 48.0 17.7 138.0 122.0
M-2 45.7 13.7 126.7 92.7
M-3 46.7 14.3 130.3 106.3
M-4 45.3 13.3 130.0 101.7
M-5 41.7 12.3 119.7 92.3
M-6 39.0 10.0 95.7 85.7
M-7 43.7 13.0 86.0 81.3
Range 39.0-48.0 10.0-17.7 86.0-138.0 81.3-122.0
Mean 44.30 13.47 118.06 97.43
Low altitude
L-1 44.0 16.3 122.7 118.3
L-2 27.3 10.7 102.0 98.7
L-3 31.7 12.3 108.7 100.3
L-4 30.7 11.0 109.3 101.0
L-5 40.7 14.7 120.0 108.3
L-6 26.3 9.0 86.3 75.4
L-7 24.0 8.3 84.0 72.0
Range 24.0-44.0 8.3-16.3 84.0-122.7 72.0-118.3
Mean 32.10 11.76 104.71 96.29
LSD altitude (p=0.05) 5.65 2.16 15.26 13.50
±SED 2.59 0.99 7.00 6.19
mean value of 113.67, 97.43 and 96.29 ppm in high, midand low altitude orchards, respectively. Arora et al. (1992)
observed that the manganese content in foliage of pear inPunjab was in similar range of concentration. Eighty sixpercent samples were adequate and 14 per cent samples
were high in leaf manganese content and exhibitedsignificant variation among the orchards of three altitudes,which could be ascribed to the amount of available
manganese and organic matter content together withfavourable pH for its uptake. Mushki (1994) and Mamgainet al. (1998) reported that higher content of manganese in
foliage of apple in Kashmir and Himachal Pradesh at higheraltitude was due to high organic matter content withfavourable pH for uptake of manganese than at lower
altitudes.
The leaf zinc, iron and manganese were adequate tohigh in all locations of three altitudes. Leaf copper was low
at Pohru location of low altitude and rest of locations ofthree altitudes were adequate in copper. The low content ofleaf copper at low altitude is in agreement with the findings
of Arora et al. (1992) for pear and Najar (2002) for apple inPunjab and Kashmir, respectively. Significant differenceswere also reported by Mamgain et al. (1998) for all micro-
nutrients under study at various locations. In general,concentration of micro-nutrients was found maximum inorchards of high altitude followed by mid altitude and low
altitude. Similar results were also reported by Najar (2002)and Farida (2005). Therefore, nutrient concentration in aplant seems to be the result of interaction between its
genetic inheritance and the environment in which it grows.
Micro-nutreint Status of Pear Orchards
70
Interrelationship among the leaf micro-nutrients. Theconcentration of micro-nutrients in pear leaves indicated
positive and significant relationship with each other. Zincshowed significant and positive correlation co-efficient withcopper (r = 0.908), iron (r = 0.844) and manganese (r =
0.734), whereas, copper revealed r value of 0.852 and 0.898with iron and manganese, respectively. The leaf ironindicated similar relationship with manganese (r = 0.795).
Similar relationship between zinc and copper was alsoreported by Arora et al. (1992).
Thus it can be concluded that micro-nutrients are by
and large in adequate concentrations except copper.Therefore package of practices should include applicationof copper to pear orchards in order to encourage proper
growth of plants leading to maximum production of qualitypear.
REFERENCESAnonymous. (2008) Area & production of horticultural crops in
Jammu and Kashmir state. Department of Horticulture, J & KGovernment.
Arora, C. L, Brar, M. S. and Dhatt, A. S. (1992) Secondary andmicro-nutrient status of pear orchards in Punjab. Indian J.Hort. 49(2): 150-154.
Bhandari, A. R. and Randhawa, N. S. (1978) Micro-nutrient statusof apple orchards of Shimla hills. Indian J. Hort. 35(4): 321-327.
Chaplin, M. H. and Westwood, M. N. (1980) Nutritional status ofBartlett pear on Cydonia and Pyrus species rootstocks. J.American Soc. Hort. Sci. 105(1): 60-63.
Chapman, H. D. (1964) Suggested foliar sampling and handlingtechniques for determining the nutrient status of some field,
horticultural and plantation crops. Indian J. Hort. 21(2): 97-119.
Farida, A. (2005) Studies on relationship between fruit yield andquality with soil and leaf nutrient content in apple orchards ofZangier block of district Baramulla Kashmir. Ph. D. Thesissubmitted to Sher-e-Kashmir University of AgriculturalSciences & Technology of Kashmir, Shalimar, Srinagar, pp.117.
Mamgain, S., Verma, H. S. and Kumar, J. (1998) Relationshipbetween fruit yield and foliar nutrient status of apple. Indian J.Hort. 55(3): 226-231.
Mushki, G. M. (1994) Studies on apple orchard soils of Kashmir. M.Sc. Thesis submitted to Sher-e-Kashmir University ofAgricultural Sciences & Technology of Kashmir, Shalimar,Srinagar, pp.144.
Najar, G. R. (2002) Studies on pedogenesis and nutrient indexing ofapple (Red Delicious) growing soils of Kashmir. Ph.D. Thesissubmitted to Sher-e-Kashmir University of AgriculturalSciences & Techn0logy of Kashmir, Shalimar, Srinagar, pp204.
Proebsting, E. L. Jr. and Kenworthy, A. L. (1954) Growth and leafanalysis of Montmorency cherry trees as influenced by solarradiation and intensity of nutrition. Proceed. American Soc.Hort. Sci. 63: 41-48
Sharma, U. and Bhandari, A. R. (1992) Survey of the nutrient statusof apple orchards in Himachal Pradesh. Indian J. Hort. 49(3):234-241.
Shen, T. (1990) Nutritional ranges in deciduous tree fruits and nuts.Acta Hort. 274: 429-436.
Vanden-Ende, B. and Leece, D. R. (1975) Leaf analysis for peardevelopment of standards and the nutritional status of orchardsin the Goulburn valley and Murrumbidgee Irrigation Areas. Aust.J. Expet. Agric. Animal Hus. 15: 129-135.
Woodbridge, C. G. (1973) Effect of rootstock and interstocks onnutrient levels in Bartlett pear leaves, on tree growth and onfruit. J. American Soc. Hort. Sci. 98(2): 200-202.
Received 5 June, 2011; Accepted 25 September, 2011
M. A. Dar, J. A. Wani, S.K. Raina, M.Y. Bhat and M.A. Malik

Evaluation of a Customized Fertilizer on Wheat
B.S. Sekhon*, Satwinderjit Kaur1, and Pritpal Singh2
Department of Soil Science, Punjab Agricultural University, Ludhiana – 141 004, Punjab, India1Krishi Vigyan Kendra, Gurdaspur, Punjab, India2Krishi Vigyan Kendra, Rupnagar, Punjab, India
*E-mail: [email protected]
Abstract: An experiment was conducted at two sites in Punjab state to evaluate the effect of a customized fertilizer (CF) with grade16:24:9:5:0.7(N: P: K: S: Zn) on yield and yield attributes of wheat crop (var PBW 550). The treatments involved considered a manufacturer-recommended dose of CF (MRDCF) providing basal 60kg N ha-1, 90kg ha-1 P2O5, and 35kg K2O ha-1 as standard dose (100% MRDCF). Theother treatments involved graded doses of CF from 0 to 150% MRDCF through 50, 75, 100, and 125%. An additional comparison treatmentinvolved use of CF as per state recommendations for N and P. The CF effect evaluated through observations on plant height, effectivetillers, spike length, spike weight, 1000-grain test weight, grain and straw yield, agronomic efficiency of N (AEN), benefit-cost ratio, netreturns, etc. indicated that using CF as per state recommendations gave the best results.
Key Words: Punjab, Customized fertilizer, Yield attributes, Wheat
A typical rice-wheat sequence that yields 7t ha-1 of rice
(unmilled) and 5t ha-1 of wheat consumes 300kg of N, 30kgP, and 300kg ha-1 of potassium (Bijay-Singh et al., 2004).Besides, it leads to concomitant depletion of various
secondary and micronutrients. The rice-wheat system hasstarted showing fatigue signs and lack of response toincreasing levels of fertilizers has been attributed amongmany factors to macro- and micro-nutrient imbalances
resulting from exhaustive feeding and imbalancedreplenishment of nutrients through inappropriate fertilizerapplications. Application of many fertilizer sources resulting
from soil-test based recommendations during oneagronomic operation (at the time of sowing), is constrainedby high labour costs and uneven application (if mixed) owing
to segregation. These hurdles to site-specific soil test-based fertilizer applications can be overcome by producingcrop-specific and site-specific mixed fertilizer grades, called
customized fertilizers.
Wheat is the predominant rabi season crop ofnorthwestern and central India. Due to its prolonged
association with rice, the rice-wheat cropping sequencehas started exhibiting deficiency of various secondary andmicronutrients, namely, sulphur, manganese, and zinc. As
a result, the northwest region has been witnessingincreased sale of various nutrient cocktails. These cocktailsdo not provide site-specific, need-based, and economical
solutions to various plant nutrition related problems. Thereis a need for fertilizers that can provide for application ofmicronutrients like Zn (Ramkala et al., 2008).
Keeping this in view, this experiment was laid duringrabi 2010-11 to evaluate the performance of a customized
fertilizer grade (CF-18) prepared specifically for Amritsar,Gurdaspur, Hoshiarpur, Jalandhar, Kapurthala, Rupnagar,and Shaheed Bhagat Singh Nagar districts of Punjab for
wheat crop by a fertilizer manufacturer.
MATERIAL AND METHODS
The experiment was laid out in completely randomizeddesign to evaluate the performance of a customized fertilizer
(CF) product provided by M/S Nagarjuna Fertilzers andChemicals Limited, Hyderabad. The grade of CF (CF-18)was 16:24:9.5:0.7 (N-P-K-S-Zn). The experiment was
conducted at two sites: Punjab Agricultural UniversityRegional Research Station, Gurdaspur (75O, 25’, 36.77"Eand 32O, 02’, 54.27" N), and at a farmer’s field (30O 57’ 31.4"N
and 76O 22’ 20.4"E) in Chamkaur Sahib sub-division ofRupnagar district of Punjab. Basic soil properties of bothsites are given in Table 1. Soil organic carbon was
determined as per the method proposed by Walkley andBlack (1934), available P by the method given by Olsen etal. (1954), and available K was determined by extracting
the soil with 1N neutral ammonium acetate (Pratt, 1982).
Table 1. Some basic properties of soil at Gurdaspur and Rupnagarsites
Property Gurdaspur Rupnagar
Texture Clay loam Sandy loam
pH(1:2 soil:water ratio) 6.6 8.1
EC (dS m-1) 0.07 0.24
Organic Carbon(g kg-1 soil) 6.0 4.5
Available P (kg ha-1) 32.7 38.7
Available K (kg ha-1) 326.1 145.6
Indian J. Ecol. (2012) 39(1) : 71-75Indian Journal
of Ecology

72
Keeping in view the protocol given by the manufacturer,
the treatment with a CF dose providing a basal dose of60kg N ha-1, 90kg ha-1 P2O5, and 35kg K2O ha-1 wasconsidered as the basic treatment (T4, Table 2). Hence,
this CF dose level was considered as 100% of themanufacturer-recommended dose of CF (100% MRDCF).The other treatments were designed around it by varying
this basal CF dose by a level of 25%, starting from 50% (T2)through 75% (T3), 100%(T4), 125% (T5) to 150% (T6).
Two other treatments were control (T1) and application
of basal CF dose as per the state university basal N (60kg
N ha-1) and P (60kg P2O5 ha-1) fertilizer recommendations
(67% of standard CF dose). T7 incidentally provided 23kg
K2O ha-1. Each treatment had three replicates. Besides
basal application, treatments involving graded doses of CF
(T2 through T6) involved top-dressing N through two equated
instalments of urea with first and second irrigations. Amount
of top-dressed N was calculated by maintaining a basal N
to top-dressed N ratio of 0.54. However, in the treatment
involving agreement with state recommended dose of N
and P through CF N was top-dressed once @ 60kg N ha-1
(basal N: top-dressed N ratio 1:1) through urea a day before
first irrigation in keeping with the State university
recommendation.
Wheat crop (variety PBW 550), was sown on 14
November 2010 at Rupnagar site and on 30 November2010 at Gurdaspur. All recommended agronomic practiceswere followed to raise the crop. Below normal temperatures
prevalent during April 2011 delayed the maturityconsiderably at Gurdaspur site. Straw and grain yieldparameters were recorded at maturity. Other observations
included number of tillers and effective tillers per plant orper meter row, plant height at maturity, spike length, numberof grains per spike, spike weight, grain test weight, etc. For
plant height, plants selected at random were tagged and
height was measured in centimeters from ground level tothe base of the ear head. Effective tillers in one meter rowlength were counted from randomly selected rows in each
plot. Grains per spike were assessed by randomly selectingten ear heads from each plot. The experimental data wasexamined statistically using analysis of variance by
employing CS-11 programme (Cheema, 1990).
RESULTS AND DISCUSSION
Plant height. Customized fertilizer application resultedin increased plant height (Table 3), but increasing CF rates
did not increase plant height significantly at Gurdaspur site.At this site, increasing CF rates from 50% to 150% of thebenchmark, CF level (100%) maintained plant height around
a mean of 87.7cm. In contrast, however, at Rupnagar site,increase in plant height with increasing CF level stagnatedat 75% CF level. Mean plant height at CF levels beyond
75% at Rupnagar site was 88.0cm. Average plant height atCF application as per state university recommendationsdid not differ significantly from other CF levels in its vicinity.
Data showed that splitting top-dressed N dose in twoinstalments, first at crown root initiation stage and secondat first node stage, resulted in greater, though statistically
insignificant, plant height than that gained in topdressing Nin one dose at CRI stage. The higher plant height with splittop dressed N has been reported extensively (Bhardwaj etal., 2010, Oscarson et al. 1995). It might have resulted fromincreased production of photosynthates by prolongedavailability of fertilizer N (Bhardwaj et al., 2010).
Effective tillers. On an average, effective tillers formedabout 93-96 per cent of total tillers at Gurdaspur site and93-99% at Rupnagar site (Table 3). It is likely that relatively
earlier planting at Rupnagar site led to slightly better tillering.
Table 2. Various treatments of customized fertilizer used in wheat crop
Treatment CF Level Basal CF Urea First Second Total N Total P Total K Total S Total
CF(kg ha-1) contribution contribution top top added added added added Zn
to basal to basal dressed dressed (kg ha-1) (kg ha-1) (kg ha-1) (kg ha-1) added
N(kg ha-1) N(kg ha-1) N(kg ha-1) N(kg ha-1) (kg ha-1)
T1 Control 0 0 0 0 0 0 0 0 0.0 0.0
T2 50%MRDCF* 188 30 0 30 26 86 45 17 9.4 1.3
T3 75%MRDCF 281 45 0 45 38 128 68 25 14.1 2.0
T4 100%MRDCF 375 60 0 60 51 171 90 34 18.8 2.6
T5 125%MRDCF 469 75 0 75 64 214 113 42 23.4 3.3
T6 150%MRDCF 563 90 0 90 77 257 135 51 28.1 3.9
67% MRDCF
T7 (Standard) 250 40 20 60 0 120 60 23 12.5 1.8
*MRDCF: Manufacturer-recommended dose of customized fertilizer
B.S. Sekhon, Satwinderjit Kaur and Pritpal Singh

73
CF application resulted in increased number of tillers but
increasing CF levels beyond 75% level did not add to thenumber of effective tillers considerably. Further, using CFas per state recommendations (T7) for N and P produced
same number of effective tillers as did the 75% MRDCFapplication.
Spike length. Customized fertilizer application led to
increase in spike length (Table 4). However, increasing ratesof CF beyond 50% of MRDCF in Gurdaspur and beyond75% in Rupnagar did not increase the head length
significantly. Furthermore, Rupnagar site, in general,showed higher response of spike length than did Gurdaspursite. Gurdaspur site produced longer spikes than Rupnagarsite. This varied response can be ascribed to the difference
in fertility status of the two sites and consequent responseto CF.
Spike weight. Customized fertilizer application
increased spike weight over unfertilized soil (Table 4 ).However, in line with other yield attributes, increasing ratesof CF application beyond state-recommended levels (67%
MRDCF) did not add to the spike weight significantly. At bothsites, under normally fertilized conditions, spike weighthovered around a mean of 2.46g.
No. of grains/spike. Customized fertilizer applicationadded to the grain count (Table 4) but increasing CF levelsdid not increase grain count accordingly. On an average, at
both sites under fertilizer levels beyond 67%, CF maintaineda 50-grain/spike level.
1000-grain test weight. Thousand-grain test weight
yield attribute behaved the way other yield attributes did(Table 4). CF applications beyond state-recommended dosedid not help to increase 1000-grain weight. Rupnagar site,
in comparison to Gurdaspur site, showed more responseto CF application in terms of this parameter.
Grain yield. Grain yield is a composite and interactive
effect of above-discussed yield attributes. Accordingly,
increasing CF level beyond state recommended dose (T7,
67% MRDCF) did not lead to a significant increase in grainyield at Gurdaspur site (Table 5 ). In contrast, however, atRupnagar site increasing CF levels went on adding
significantly to grain yield.
Straw yield. Effect of CF application on straw yieldresembles its effect on grain yield (Table 5). However,increasing CF dose went on adding to straw yieldsignificantly till 125% MRDCF level in Rupnagar site and till100% MRDCF in Gurdaspur site. Past 100% MRDCF,Gurdaspur site showed sudden decline in straw yield. Thisdecline, though inexplicable, was in line with decline innumber of effective tillers witnessed at this level (Table 3).However, the extended response of straw yield to increasingCF dose at Rupnagar site can be attributed to comparativelylower organic carbon and available K levels.
Harvest index. Ratio of grain yield to total biomassyield decreased with increasing CF level from 0 to 100%through 50 and 75% at Gurdaspur site (Table 5). However,in accordance with the straw yield pattern, harvest index atthis site increased with increasing CF levels beyond 100%.CF application as per state recommendations for N and Pgave harvest index similar to that in 75% CF level. AtRupnagar site, in general, values of harvest index werehigher than obtained at Gurdaspur site. Also, increasingCF levels did not significantly affect the average harvestindex of 0.474 achieved in all the treatments.
Agronomic Efficiency of Nitrogen (AEN)
At Gurdaspur site, highest AEN was obtained at 50%
MRDCF level (Table 5) and the 150% MRDCF gave thelowest AEN (11.5kg grain kg-1N). The second highest AENat Gurdaspur site was obtained in treatment involving use
of CF as per N and P state recommendations. At Rupnagar,the highest AEN (31.0kg grain kg-1 N) was obtained whenCF dose was equivalent to state recommendations for N
and P. This was followed by 75% CF treatment; and like in
Table 3. Plant height, number of tillers and effective tillers as affected by various customized fertilizer (CF) levels.
Treatment CF level Plant height (cm) No. of tillers m-1 row No. of effective tillers m-1 row
(% of MRDCF) Gurdaspur Rupnagar Gurdaspur Rupnagar Gurdaspur Rupnagar
T1 (control) 0 71.8 62.1 30 29 28 27
T2 50 87.3 74.7 51 58 49 56
T3 75 88.2 87.9 54 75 51 73
T4 100 87.7 88.7 61 81 57 79
T5 125 87.7 89.0 57 84 53 83
T6 150 88.2 89.9 61 86 57 84
T7 67 87.4 84.7 54 74 51 72
LSD (0.05) 2.6 4.2 8 10 7 10
Customized Fertilizer Response on Wheat

74
Gurdaspur site 150% CF treatment gave the lowest AEN(15.3 kg grain kg-1N). In general, use of CF resulted in better
AEN at Rupnagar site. This can be ascribed to comparativelylower organic carbon level (Table 1). The grain yieldresponse to fertilizer can also vary with the environment at
the time of fertilizer application (Otteson et al., 2008).
Net Returns
A perusal of net returns yielded by various CF levels(Table 6) indicated that at both Gurdaspur and Rupnagar
sites, MRDCF 100% treatment gave the highest net returns.
Beyond 75 per cent MRDCF level, Rupnagar site gave highernet returns. This trend can be associated with higher straw
yields at Gurdaspur site. CF levels beyond 67 per cent (staterecommended dose) did not add significantly to the netreturns.
Benefit-cost (B:C) Ratio
A comparison among the two sites shows thatGurdaspur site gave better B:C ratio than Rupnagar sitebelow 67 per cent MRDCF level (Table 6). This difference
did not result from grain yield difference but from higher
Table 4. Spike length, spike weight, number of grains/spike, and grain weight as affected by various CF levels
Treatment CF Level Spike length (cm) Spike wt. (g) No. of grains/spike 1000-grain test wt. (g)
(% of MRDCF) Gurdaspur Rupnagar Gurdaspur Rupnagar Gurdaspur Rupnagar Gurdaspur Rupnagar
T1 (control) 0 9.3 4.6 0.79 0.81 12 13 36.29 13.21
T2 50 11.1 7.1 1.27 1.28 35 36 37.93 23.57
T3 75 10.9 8.8 2.42 2.44 48 49 37.62 36.22
T4 100 11.3 9.0 2.46 2.47 49 51 36.61 36.72
T5 125 11.1 9.3 2.43 2.49 51 51 37.83 36.96
T6 150 11.5 9.3 2.53 2.53 51 53 36.19 36.97
T7 67 11.2 8.7 2.42 2.43 48 49 36.39 35.44
LSD (0.05) 0.6 0.7 0.17 0.16 3 3 0.81 1.55
Table 5. Wheat grain yield, straw yield, nitrogen efficiency, and economic parameters as affected by various CF levels
Treatment CF Level Grain yield (q ha-1) Straw yield (q ha-1) Harvest index AEN(kg grain kg-1 N)
(% of MRDCF) Gurdaspur Rupnagar Gurdaspur Rupnagar Gurdaspur Rupnagar Gurdaspur Rupnagar
T1 (control) 0 16.4 12.3 23.8 13.6 0.417 0.475 - -
T2 50 41.4 29.3 61.3 32.5 0.402 0.473 29.2 19.9
T3 75 45.7 49.9 72.2 55.4 0.389 0.474 22.9 29.3
T4 100 50.3 50.6 84.2 56.7 0.375 0.472 19.8 22.4
T5 125 47.9 51.1 69.7 57 0.409 0.473 14.7 18.2
T6 150 45.9 51.4 72.9 56.9 0.382 0.474 11.5 15.3
T7 67 46.7 49.5 75.1 55 0.389 0.474 25.3 31.0
LSD(0.05) 2.4 0.30 4.9 0.28 0.018 NS 3.1 0.21
AEN= Agronomic Efficiency of Nitrogen
Table 6. Income parameters of various CF treatments
Treatment CF Level Net returns(Rs. ha-1) B:C Ratio
(% of MRDCF) Gurdaspur Rupnagar Gurdaspur Rupnagar
T1 (control) 0 3261 -4100 1.15 0.55
T2 50 40273 18919 2.72 2.25
T3 75 47263 47961 2.95 4.20
T4 100 54793 48367 3.19 4.00
T5 125 47560 48220 2.84 3.78
T6 150 45289 47688 2.70 3.56
T7 67 49370 47691 3.06 4.27
LSD(0.05) 3533 368 0.15 0.02
B.S. Sekhon, Satwinderjit-Kaur, and Pritpal-Singh
75
straw yield across all the treatments at Gurdaspur site aswell. Thus, this superiority in B:C ratio is of significance
only under efficient economic utilization of straw. Accountingfor statistical significance, the highest B:C ratio wasrecorded by the use of CF as per the Punjab state
recommendations for N and P.
Data on yield and yield attributes and economicparameters primarily suggest that using the CF at state
recommended dose for N (120 kg ha-1, half basal, half topdressed once at Crown Root Initiation stage) and P (60kgP2O5 ha-1), equivalent to 67 per cent of the dose considered
standard by the manufacturer, leads to the best results.This is closely followed by the use of CF at 75 per cent of themanufacturer-recommended level. Higher overall response
of various yield and yield attributes to increasing CF levelsat Rupnagar site can be clearly ascribed to the differencesin soil fertility status at the two sites.
REFERENCESBhardwaj, V., Yadav, V. and Chauhan, B.S. (2010) Effect of nitrogen
application timings and varieties on growth and yield of wheatgrown on raised beds. Arch. Agron. Soil Sci. 56: 211-222.
Bijay-Singh, Yadvinder-Singh, Patricia-Imas and Xie Jian-Chang
(2004) Potassium nutrition of the rice-wheat cropping system.Adv. Agron. 81: 203-259.
Cheema, H.S. (1990). A Computer Programming Package forStatistical Analysis Manual. Punjab Agricultural University,Ludhiana.
Olsen, S.R., Cole, C.V., Watanabe, F.S. and Dean L.A. (1954)Estimation of available phosphorus in soils by extraction withsodium bicarbonate. United States Department of Agriculturecircular 939.
Oscarson, P., Lundborg, T., Larsson, M. and Larson, C. M. (1995)Fate and effects on yield components of extra applications ofnitrogen on spring wheat (Triticum aestivum L.) grown insolution culture. Plant Soil 175:179–188.
Otteson, B. N., Mergoum, M., Ransom, J. K. and Schatz, B. (2008)Tiller contribution to spring wheat yield under varying seedingand nitrogen management. Agron J. 100:406–413.
Pratt, P F. (1982) Potassium In: Methods of Soil Analysis. Part II.Chemical and Microbiological Properties. In: A.L. Page, R.H.Miller and D.R. Keeney (eds) American Society of Agronomy,Soil Sci. Soc. Am. Madison, Wisconsin, USA, pp. 225-246.
Ramkala, Dahiya, R.R., Dahiya, S.S. and Dalel-Singh (2008)Evaluation of N:P:Zn (10:50:1.5) complex fertilizer in rice-wheatcropping sequence. Indian J. Agric. Res. 42: 288-292.
Walkley, A. and Black, J.A. (1934) An examination of the Degtjareffmethod of determining soil organic matter and a proposedmodification of the chromic acid titration method. Soil Sci. 37:29-38.
Received 1 July, 2011; Accepted 4 March, 2012
Customized Fertilizer Response on Wheat

Green revolution of India has undoubtedly changed thescenario of food grain production which has been more
than doubled during post green revolution period withoutany change in the cultivated area. This has resulted notonly self-sufficiency in food grains production but also made
the country food surplus. This increased level of productioncould be achieved only due to increased use of externalagro-inputs mainly fertilizers. Use of these high analysis
chemical fertilizers in imbalanced and indiscriminatemanner had developed many problems like decline of soilorganic matter, increase in salinity, sodicity, soil pollutant
and hazards of pests and diseases (Chakraborti and Singh,2004). Continuous use of inorganic fertilizers has not onlybrought loss of vital soil fauna and flora but also resulted in
loss of secondary and micronutrients. In organic productionsystems, the soil health is maintained and improved throughstimulating the activity of soil organisms and organic
manures are also helpful in alleviating the increasingincidence or deficiency of secondary and micronutrientsand is capable of sustaining crop productivity. Organic
manures modifies the soil physical behaviour andincreases the efficiency of applied nutrients (Pandey et al.,2007). Regular application of organics in amounts sufficient
to meet the requirements of crops not only results inincreasing crop yield but also improve soil fertility and organicmatter content (Ramesh et al., 2008). Use of organic
manures to meet the nutrient requirement of crops wouldbe an inevitable practice in the years to come for sustainableagriculture hence, organic matter should be replenished
Effect of Organic Nitrogen Management on Yield and Quality ofProduce in Rice–Vegetable Based Cropping System
R. N. Meena* and Kalan SinghDepartment of Agronomy, Institute of Agricultural Sciences,Banaras Hindu University, Varanasi - 221 005 (U.P.), India
*E-mail: [email protected]
Abstract: A field experiment was conducted during 2003-04 and 2004-05 at Research Farm, BHU, Varanasi, U.P. to study the effect ofvarious sources (farm yard manure, vermicompost and poultry manure) and rates of organic manures (100%, 125% and 150% RND) onyield, quality of produce, soil quality and economics of rice-table pea-onion cropping sequence. Poultry manure @ 150% RND gave highergrain (57.96q ha-1) and straw yield (91.27q ha-1) in rice, green pod yield (70.72q ha-1) and straw yield (70.03q ha-1) of table pea and bulb(270.84q/ha) and haulm yield (35.13q ha-1) of onion. On an average, application of poultry manure resulted improved values regarding soilorganic carbon, uptake of available NPK and soil biological properties compared to varying doses of vermicompost, FYM and over thecontrol treatment. Physical properties of soil viz. bulk density and water stable aggregates were not affected due to nitrogen managementthrough organic sources. Economic analysis revealed that the highest rice-grain equivalent yield and maximum net profit (Rs.1,30,799ha-1) from rice-table pea-onion sequence were recorded with the application of 150% RND through poultry manure.
Key Words: Rice, Table pea, Onion, Cropping sequence, Organic farming, System productivity, Economics
by adding organic manures. Therefore, the present studywas conducted to find out the effect of various organic
manures on yield, quality and nutrient uptake by rice-vegetable based cropping system and to explore thepossibility of improving the productivity, profitability and
sustainability of the above sequence by supply of nutrientsthrough organic source.
MATERIAL AND METHODS
A field experiment was conducted during 2003-04 and
2004-05 at Varanasi, Uttar Pradesh with rice-tablepea-onioncropping sequence during rainy, winter and summerseasons. The soil was sandy clay loam in texture with 7.12
pH, 0.45% organic carbon and 180.5, 18.2 and 202.4 kgha-1 available nitrogen, phosphorus and potassium,respectively. The experiment was carried out in randomized
block design in fixed plots lay out replicated thrice consistinga set of ten treatment combinations involving three sourcesof organic manures viz. farm yard manure (FYM),
vermicompost (VM) and poultry manure (PM) adopting 3different rates i.e., 100%, 125% and 150% of recommendednitrogen dose (RND) and 100% RND through urea (control).
The organic manures were applied as per their nutrientcontent on oven dry weight basis. The FYM, vermicompostand poultry manure contained 0.50, 2.30 and 2.80% N, 0.20,
0.75 and 2.20% P2O5 and 0.50, 1.23 and 1.30% K2O,respectively. Organic manures were applied as pertreatment at sowing and mixed thoroughly in 15cm top soil
layer. In control treatment, recommended dose of nitrogen
Indian J. Ecol. (2012) 39(1) : 76-81Indian Journal
of Ecology

77
through urea was drilled 10cm deep and 5cm away fromthe seed or seedling. The cultivars of rice (Pusa Sugandha-
3), table pea (Early Apoorva) and onion (Pusa Red) weretransplanted/sown at 20×10cm, 30×10cm and 20×10cm,respectively. Protein content in rice and tablepea grain was
estimated through NIR by taking whole grain under nearinfra-red waves (AOAC, 1995). Pungency (%) in onion wascomputed by Allyl-propyl-disulphide content in onion bulb
determined as pyruvic acid and using formula suggestedby Hort and Fisher (1970). The yield data were recordedand converted into rice-grain equivalent and system
productivity was calculated on the basis of prevailing marketprices of rice, table pea and onion. Economics of treatmentswere calculated on prevailing market price of yield and
inputs during investigation period.
RESULTS AND DISCUSSION
Yield of Rice, Table pea and Onion
An increase in grain and straw yields of rice wererecorded during both the years with increase in level of
nitrogen from 100% recommended dose to 150% under allthe three sources of organic manures (Table 1). Among thedifferent sources of manures used, PM proved significantly
superior followed by VC and FYM. Pooled analysis revealedthat the maximum grain and straw yields i.e. 40.4 per centand 44.4 per cent higher than control were recorded with
PM applied @ 150% RND, which produced significantlygreater yield response than other sources at all the levelsof nitrogen application. However, during first year differences
in straw yield were found non-significant. Grain and strawyield of rice behaved in similar manner and these might beattributed to better physical conditions of soil which provided
congenial growing environment. Maximum reduction in riceyield was found when the crop was fertilized with 100%RND through urea.
The green pod yield level of tablepea improvedconsiderably with successive increment in rate of organicnitrogen nutrition though FYM levels were remained
statistically at par. Incorporation of 150% RND as PMproduced significantly higher green pod yield compared toother sources and their application rates and the increase
was found to the extent of 70.1 per cent and 114.8 per centhigher over control treatment during first and second year,respectively. However, pooled data reflects that application
of PM and VM @ 150% RND produced significantly highergreen pod yield over their 100% RND only and were at partwith 125% RND. Similarly superior values of table pea straw
yields were recorded at higher levels of different sourcesfor nitrogen nutrition. Poultry manure @ 150% RND was
best in enhancing straw yield and had 33.1 per cent higherstraw yield compared with control in pooled analysis.
Bulb and haulm yield of onion were affected significantly(Table 1). Use of FYM, VM and PM gave better bulb yieldthan the control. Increased application of organic manure
alone, from 100 to 150% of the recommended dose of N,also increased bulb and haulm yield. Application of PM andVM brought significant improvement in bulb and haulm yield
of onion over 100% RND through urea (control) irrespectiveof levels of manures. Application of 150% RND as PMrecorded the maximum bulb and haulm yield of onion.
However, superior values of bulb and haulm yield wererecorded in order of PM>VM>FYM>control.
It may thus be inferred that sustainability of rice- table
pea-onion sequence production was not influenced byorganic nitrogen nutrition and poultry manure among allorganic sources used was proved most effective. It might
be due to the fact that mineralized nutrient from thesesources could sufficiently meet the nutritional requirementof the crops. Thus, higher rates over recommended nitrogen
dose favourably influenced plant growth and developmentcharacters which ultimately resulted in higher yields.
Quality of Produce
There were no significant differences in parameters
judged for quality of rice grain due to different treatments
during both the years (Table 2). Protein content, protein yield
and carbohydrate content in tablepea grain differed
significantly due to various treatments and the highest
values of these were noticed with PM treatments followed
by VC, FYM and 100% RND through urea, respectively.
Poultry manure applied @ 150% RND produced maximum
protein content which was significantly superior over control,
100% and 125% RND as FYM during first year and to the
control and 100% RND as FYM during second year of study.
Rest all the treatments were found at par. Protein yield
(452.10 and 458.01 kg ha-1) and carbohydrate content (59.93
and 60.18%) during both years were observed significantly
higher than other treatments when PM applied @ 150%
RND which was at par with PM @ 125% RND. Pungency
percentage in onion was significantly higher with PM
application and followed the order of PM>VM>FYM>control.
Each successive increase in the level of organic nitrogen
nutrition through different sources showed significant
improvement in pungency per cent. The superior
performance exhibited by PM in comparison to other sources
and also better results obtained at higher RND may be
explained with the fact it might have helped in improving thenutrients availability for a prolonged period and improved
Management of Organic Nitrogen Nutrition in Rice–Vegetable Cropping

78
Tab
le 1
. E
ffect
of
orga
nic
nitr
ogen
nut
ritio
n on
the
pro
duct
ivity
of
rice-
high
val
ue c
rop
base
d cr
oppi
ng s
eque
nce
(q h
a-1)
Tre
atm
ent
Ric
eTa
ble
pea
Oni
on
Gra
inS
tra
wG
reen
pod
Str
aw
Bul
bH
aulm
2003
2004
Poo
led
2003
2004
-P
oole
d20
03-
2004
-P
oole
d20
03-
2004
-P
oole
d20
03-
2004
-P
oole
d20
03-
2004
-P
oole
d
-04
-05
-04
0504
0504
0504
0504
05
100
% R
ND
as
FY
M46
.79
40.8
643
.83
64.2
371
.79
68.2
740
.51
51.9
246
.21
59.9
553
.256
.57
23
8.9
42
39
.68
23
9.3
113
.78
13.7
413
.76
125%
RN
D a
s F
YM
47.4
441
.51
44.4
764
.59
77.8
971
.06
40.9
854
.847
.89
60.2
160
.89
60.5
52
45
.94
24
4.7
62
45
.35
21.8
714
.68
18.2
7
150%
RN
D a
s F
YM
48.7
244
.89
46.8
64.7
478
.84
71.7
243
.58
58.3
350
.95
61.8
961
.21
61.5
52
49
.81
25
1.4
72
50
.64
22.9
516
.24
19.6
100%
RN
D a
s V
M49
.56
45.4
347
.49
68.2
81.0
974
.64
49.9
959
.354
.65
62.6
761
.53
62.1
25
0.4
625
8.8
25
4.6
323
.29
17.4
720
.36
125%
RN
D a
s V
M50
.32
50.9
650
.869
.23
81.7
275
.48
59.3
160
.359
.81
63.1
162
.07
62.5
92
57
.46
26
1.0
32
59
.24
24.8
724
.44
24.6
5
150%
RN
D a
s V
M50
.64
51.1
252
72.4
385
.979
.16
62.9
964
.42
63.7
164
.82
62.8
263
.83
26
2.4
22
62
.02
26
2.2
227
.54
26.1
226
.83
100%
RN
D a
s P
M52
.88
54.0
752
.19
74.5
190
.782
.61
63.6
965
.69
64.6
966
.44
63.1
464
.77
26
4.5
42
65
.55
26
5.0
531
.23
26.4
428
.83
125%
RN
D a
s P
M53
.52
54.5
554
.04
74.6
899
.42
87.0
564
.54
68.5
966
.56
66.7
565
.06
65.9
266.
32
66
.12
26
6.2
132
.31
29.3
530
.83
150%
RN
D a
s P
M57
.37
58.5
557
.96
76.1
21
06
.41
91.2
767
.09
74.3
670
.72
68.9
171
.15
70.0
32
70
.54
27
1.1
42
70
.84
35.8
234
.43
35.1
3
100%
RN
D t
hrou
gh u
rea
43.9
138
.62
41.2
761
.48
64.9
463
.21
39.4
434
.62
37.0
357
.44
47.7
652
.62
34
.54
23
8.0
523
6.3
10.2
712
.26
11.2
7
C.D
. (0.
05)
5.80
4.79
3.63
25.4
16.9
214
.74
4.79
11.1
95.
88N
S14
.07
8.78
1419
.72
11.7
8.87
8.18
5.81
RN
D,
reco
mm
ende
d ni
trog
en d
ose;
FY
M,
farm
yard
man
ure;
VM
, ve
rmic
ompo
st;
PM
, po
ultr
y m
anur
eC
harg
es o
f in
put
used
(R
s kg
-1):
Ure
a 5.
00,
FY
M 0
.50,
VM
3.0
0, P
M 3
.00
Sel
ling
pric
e (R
s kg
-1)
of o
rgan
ic p
rodu
ce:
Ric
e gr
ain
6.50
, ta
ble
pea
pod
8.0
0, o
nion
bul
b 4.
00,
rice
and
tabl
e pe
a st
raw
1.0
0S
ellin
g pr
ice
(Rs
kg-1 )
of
inor
gani
c pr
oduc
e: R
ice
grai
n 5.
00,
tabl
e pe
a po
d 5
.00,
oni
on b
ulb
3.00
, ric
e an
d ta
ble
pea
stra
w 0
.50
R. N Meena and Kalan Singh

79Ta
ble
2.
Effe
ct o
f or
gani
c ni
trog
en n
utrit
ion
on q
ualit
y of
ric
e-hi
gh v
alue
cro
p ba
sed
crop
ping
seq
uenc
e
Tre
atm
ent
Ric
eTa
ble
pea
Oni
on
Hul
ling
Mill
ing
Hea
d ric
eP
rote
inP
rote
inP
rote
inC
arbo
hydr
ate
Pun
genc
yC
arbo
hydr
ate
(%)
(%)
reco
very
cont
ent
inco
nte
nt
yiel
dco
nte
nt
(%)
cont
ent
(%)
(%)
grai
n (%
)(%
)(k
g ha
-1)
(%)
2003
-20
04-
2003
-20
04-
2003
-20
04-
2003
-20
04-
2003
-20
04-
2003
-20
04-
2003
-20
04-
2003
-20
04-
2003
-20
04-
0405
0405
0405
0405
0405
0405
0405
0405
0405
100%
RN
D a
s F
YM
71.5
171
.61
59.8
159
.89
57.4
457
.48
5.90
5.87
16.2
016
.27
27
0.8
63
15
.96
56.5
056
.75
0.0
03
90
.00
21
10.3
710
.30
125%
RN
D a
s F
YM
71.6
971
.79
59.8
659
.94
57.5
457
.60
5.96
5.89
16.3
317
.94
30
2.1
13
51
.27
56.6
056
.90
0.0
04
40
.00
35
10.5
710
.33
150%
RN
D a
s F
YM
71.7
671
.84
60.2
660
.34
57.9
257
.99
5.99
5.99
17.2
018
.00
32
9.5
53
65
.94
57.3
057
.55
0.0
04
80
.00
39
10.8
310
.50
100%
RN
D a
s V
M71
.94
72.0
160
.28
60.3
657
.94
58.0
16.
066.
1617
.29
18.0
83
35
.77
37
2.0
957
.60
57.8
50
.00
49
0.0
04
510
.90
10.8
0
125%
RN
D a
s V
M72
.10
72.1
660
.36
60.4
458
.03
58.0
86.
156.
2417
.75
18.1
13
60
.86
38
4.8
457
.90
58.1
50
.00
59
0.0
05
810
.97
10.8
7
150%
RN
D a
s V
M72
.19
72.2
560
.45
60.5
358
.10
58.1
46.
216.
3117
.81
18.5
23
68
.13
41
5.2
258
.25
58.5
00
.00
61
0.0
06
611
.03
10.9
3
100%
RN
D a
s P
M72
.22
72.3
160
.60
60.6
858
.25
58.3
36.
446.
5418
.11
19.0
14
06
.03
42
9.0
658
.69
58.9
40
.00
62
0.0
07
211
.07
11.0
3
125%
RN
D a
s P
M72
.58
72.6
860
.69
60.7
758
.59
58.6
76.
486.
5718
.66
19.0
24
32
.35
45
1.6
759
.25
59.5
00
.00
71
0.0
07
611
.60
11.2
0
150%
RN
D a
s P
M72
.61
72.7
361
.20
61.2
858
.82
58.9
16.
546.
7419
.10
19.2
24
52
.10
45
8.0
159
.93
60.1
80
.00
76
0.0
07
811
.80
11.9
7
100%
RN
D t
hrou
gh u
rea
70.9
471
.06
59.6
959
.77
57.3
757
.45
5.89
5.84
15.3
016
.05
24
7.4
02
96
.93
56.2
656
.51
0.0
01
70
.00
14
10.2
010
.10
C.D
. (0.
05)
NS
NS
NS
NS
NS
NS
NS
NS
2.44
2.92
20.8
88.
451.
151.
12N
SN
SN
SN
S
Tab
le 3
. P
aram
eter
s as
inf
luen
ced
by o
rgan
ic n
itrog
en n
utrit
ion
at t
he e
nd o
f 2
year
s cy
cle
of r
ice-
high
val
ue c
rop
base
d se
quen
ce
Tre
atm
ent
Soi
l ph
ysic
al p
aram
eter
sS
oil c
hem
ical
par
amet
ers
Soi
l bio
logi
cal p
aram
eter
s
Bul
kP
oros
ityW
ater
sta
ble
Org
an
icA
vaila
ble
nutr
ient
(kg
ha-1
)B
act
eri
aF
ungi
Act
ino
myc
ete
s
de
nsi
ty (
%)
ag
gre
ga
tes
carb
on
(x1
03)
(x1
03)
(x1
03)
(g c
c-1)
(%)
(%)
NP
K
100%
RN
D a
s F
YM
1.36
40.3
218
.01
0.44
18
4.3
424
.43
15
4.4
162
.82
22.5
33.7
3
125%
RN
D a
s F
YM
1.37
40.3
818
.18
0.45
18
5.4
624
.61
15
4.8
763
.63
23.0
334
.74
150%
RN
D a
s F
YM
1.39
41.3
418
.20.
461
86
.72
25.4
41
55
.44
66.9
224
.00
35.4
3
100%
RN
D a
s V
M1.
3840
.318
.01
0.47
18
7.7
326
.52
15
7.4
272
.34
25.3
136
.25
125%
RN
D a
s V
M1.
440
.36
18.2
0.48
18
9.4
427
.82
15
8.8
477
.94
27.9
437
.44
150%
RN
D a
s V
M1.
4141
.18
18.5
0.49
18
9.9
528
16
0.4
278
.65
28.6
343
.18
100%
RN
D a
s P
M1.
3940
.218
.04
0.5
19
0.4
428
.42
16
1.7
279
.54
29.4
546
.94
125%
RN
D a
s P
M1.
4140
.22
18.3
20.
521
91
.43
28.8
41
62
.43
80.4
432
.11
54.4
6
150%
RN
D a
s P
M1.
4240
.95
18.6
50.
541
92
.98
29.4
31
64
.12
82.4
537
.82
58.2
3
100%
RN
D t
hrou
gh u
rea
1.35
40.0
218
.00
0.4
17
8.9
522
.44
15
2.4
441
.85
11.4
933
.44
C.D
. (0.
05)
NS
0.86
NS
0.12
9.78
0.56
8.94
--
-
Management of Organic Nitrogen Nutrition in Rice–Vegetable Cropping
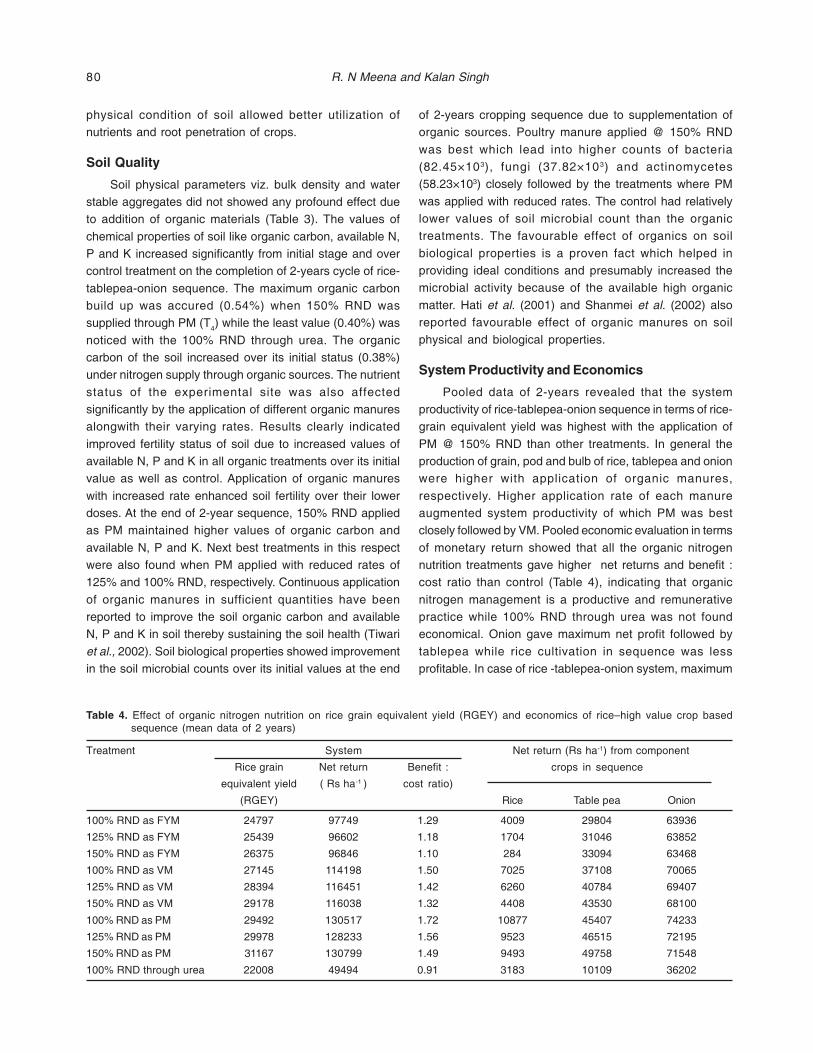
80
physical condition of soil allowed better utilization ofnutrients and root penetration of crops.
Soil Quality
Soil physical parameters viz. bulk density and waterstable aggregates did not showed any profound effect dueto addition of organic materials (Table 3). The values of
chemical properties of soil like organic carbon, available N,P and K increased significantly from initial stage and overcontrol treatment on the completion of 2-years cycle of rice-
tablepea-onion sequence. The maximum organic carbonbuild up was accured (0.54%) when 150% RND wassupplied through PM (T4) while the least value (0.40%) was
noticed with the 100% RND through urea. The organiccarbon of the soil increased over its initial status (0.38%)under nitrogen supply through organic sources. The nutrient
status of the experimental site was also affectedsignificantly by the application of different organic manuresalongwith their varying rates. Results clearly indicated
improved fertility status of soil due to increased values ofavailable N, P and K in all organic treatments over its initialvalue as well as control. Application of organic manures
with increased rate enhanced soil fertility over their lowerdoses. At the end of 2-year sequence, 150% RND appliedas PM maintained higher values of organic carbon and
available N, P and K. Next best treatments in this respectwere also found when PM applied with reduced rates of125% and 100% RND, respectively. Continuous application
of organic manures in sufficient quantities have beenreported to improve the soil organic carbon and availableN, P and K in soil thereby sustaining the soil health (Tiwari
et al., 2002). Soil biological properties showed improvementin the soil microbial counts over its initial values at the end
of 2-years cropping sequence due to supplementation oforganic sources. Poultry manure applied @ 150% RND
was best which lead into higher counts of bacteria(82.45×10³), fungi (37.82×10³) and actinomycetes(58.23×10³) closely followed by the treatments where PM
was applied with reduced rates. The control had relativelylower values of soil microbial count than the organictreatments. The favourable effect of organics on soil
biological properties is a proven fact which helped inproviding ideal conditions and presumably increased themicrobial activity because of the available high organic
matter. Hati et al. (2001) and Shanmei et al. (2002) alsoreported favourable effect of organic manures on soilphysical and biological properties.
System Productivity and Economics
Pooled data of 2-years revealed that the systemproductivity of rice-tablepea-onion sequence in terms of rice-grain equivalent yield was highest with the application of
PM @ 150% RND than other treatments. In general theproduction of grain, pod and bulb of rice, tablepea and onionwere higher with application of organic manures,
respectively. Higher application rate of each manureaugmented system productivity of which PM was bestclosely followed by VM. Pooled economic evaluation in terms
of monetary return showed that all the organic nitrogennutrition treatments gave higher net returns and benefit :cost ratio than control (Table 4), indicating that organic
nitrogen management is a productive and remunerativepractice while 100% RND through urea was not foundeconomical. Onion gave maximum net profit followed by
tablepea while rice cultivation in sequence was lessprofitable. In case of rice -tablepea-onion system, maximum
Table 4. Effect of organic nitrogen nutrition on rice grain equivalent yield (RGEY) and economics of rice–high value crop basedsequence (mean data of 2 years)
Treatment System Net return (Rs ha-1) from component
Rice grain Net return Benefit : crops in sequence
equivalent yield ( Rs ha-1 ) cost ratio)
(RGEY) Rice Table pea Onion
100% RND as FYM 24797 97749 1.29 4009 29804 63936
125% RND as FYM 25439 96602 1.18 1704 31046 63852
150% RND as FYM 26375 96846 1.10 284 33094 63468
100% RND as VM 27145 114198 1.50 7025 37108 70065
125% RND as VM 28394 116451 1.42 6260 40784 69407
150% RND as VM 29178 116038 1.32 4408 43530 68100
100% RND as PM 29492 130517 1.72 10877 45407 74233
125% RND as PM 29978 128233 1.56 9523 46515 72195
150% RND as PM 31167 130799 1.49 9493 49758 71548
100% RND through urea 22008 49494 0.91 3183 10109 36202
R. N Meena and Kalan Singh
81
net return of Rs. 1, 30,799 ha-1 with 1.49 benefit: cost ratiowas obtained when crops were fertilized with 150% RNDthrough PM. It was followed by (Rs. 1, 30,517 ha-1 and 1.72benefit: cost ratio) 100% RND applied as PM. The benefit:cost ratio reduced with increase in the rate of manureapplication is an indicative of the fact that additionalproductivity obtained due to increased manurial dose overRND and the value of additional product/ha were notproportionately increased.
It was concluded that growing of rice-tablepea-onionsequence with organic nitrogen nutrition applied as 150%RND through PM could be beneficial for enhancing soilfertility and sustaining the system productivity.
REFERENCESChakarborti, Mandira and Singh, N.P. (2004). Bio-compost: a novel
input to organic farming. Agrobios News Letter 2(8):14-15.
Hati, K.M., Mandal, K.G., Mishra, A.K., Ghosh, P.K. and Acharya,C.L. (2001). Effect of irrigation regimes and nutrientmanagement on soil water dynamics, evapo-transpiration andyield of wheat in vertisols. Indian J. Agricultural Sciences71(9): 581-587.
Hort, F.L. and Fisher, H.J. (1970). Determination of Pyruvic acid indehydrated onion. In: Modern Food Analysis Springer Verlog,Berlin, Neidelberg, New York, pp. 433-434.
Pandey, N., Verma, A.K., Anurag, and Tripathi, R.S. (2007). Integratednutrient management in transplanted hybrid rice (Oryza sativaL.). Indian J. Agron. 52(1): 40-42.
Ramesh, P., Panwar, N.R., Singh, A.B. and Ramana, S. (2008).Effect of organic manures on productivity, nutrient uptake andsoil fertility of maize – Linseed cropping system. Indian J.Agricultural Sciences 78(4): 351-354.
Tiwari, A., Dwivedi, A.K. and Diskhit, P.R. 2002. Long term influenceof organic and inorganic fertilization on soil fertility andproductivity os soybean – wheat system in a vertisols. J.Indian Society of Soil Science 50(4): 472-475.
Received 8 October, 2011; Accepted 13 March, 2012
Management of Organic Nitrogen Nutrition in Rice–Vegetable Cropping

The consumption of chemical fertilizers was recorded
more than 14.31 million tonnes during 2003-04. The greenrevolution with high use inorganic fertilizers has reached aplateau with falling dividends. The intensive use of inorganic
fertilizers alone had polluted the soil, water and environment.The problem is further aggravated in most of the vegetablecrops when the crop residues are seldom left in the fields
for biological decomposition as a result organic matter islost rapidly. The probable solution for the vegetable growerswould be to follow the practices of integrated use of nutrients
without compromising for production. It may not be possibleto completely replace the chemical fertilizers. However, itseems to be possible to reduce the dose of inorganic
fertilizers by substituting some part of nutrients frombiofertilizers. For this, the dose of fertilizers need to begradually reduced and be balanced by increasing the use
of optimum quantity of organic manures and biofertilizers.Azotobacter and Azospirillium the strains of free livingnitrogen bacteria can help to reduce the consumption of
nitrogen. Likewise strains of Phosphorus Solublizingbacteria (PSB) can make available the phosphorus alreadypresent in the soil. The scientists have also advocated the
inoculation of plants with Vesicular Arbuscular Mycorrizae(VAM) which can help to proliferase tips of roots which canhelp to absorb phosphorus assimilates from the soil.
Keeping in view these facts a study has been planned tocompare the production potential of cabbage under theinfluence of various biofertilizers and farm yard manure
(FYM) and to study the possibility of limiting the use ofinorganic fertilizers by using biofertilizers and FYM.
Effect of Biofertilizers on Yield and Quality Traits of Cabbage(Brassica oleracea var. capitata L.)
N.S. Gill, J. S. Bal and D. S. Khurana*Department of Vegetable Crop, Punjab Agricultural Unviersity, Ludhiana-141 004, India
*E-mail:[email protected]
Abstract: The present investigation was carried out at Krishi Vigyan Kendra, Moga during 2007-2009. The experimental materialcomprised of cabbage (Brassica oleracea var. capitala L.) cv. Golden Acre, grown in randomized block design and replicated thrice.Maximum head weight during 2008 was found in plots were Phosphorus Solublizing Bacteria (PSB) with recommended dose of Nitrogen(N), Phosphorus (P) and Potassium was applied, while in 2009, maximum head weight was observed where PSB + 75%P + recommendeddose of N and K was applied. It was found that in cabbage maximum ratio of polar and equitorial diameter was obtained whereAzotobactor with 75% recommended P and full dose of N and K was applied during 2008. But in 2009, maximum ratio was found intreatment where only recommended dose of N, P and K was applied. Maximum Ascorbic acid was obtained where PSB with 75% P andrecommended dose of N and K was applied. Maximum chlorophyll content was obtained when Vesicular Arbuscular Mycorrizae (VAM)+75% P + full dose of N and K was applied during 2008. But maximum chlorophyll content during 2009 was found where VAM with fulldoses of N, P and K was applied. Thus, it is concluded that all the treatments, which included biofertilizers gave better results than thetreatments with only recommended dose of chemical fertilizers.
Key Words: Biofertilizers, Quality traits, Cabbage, Yield
MATERIAL AND METHOD
The present investigation was carried out at Krishi
Vigyan Kendra, Moga and Biochemistry Laboratory of theDepartment of Vegetable crops, Punjab AgriculturalUniversity, Ludhiana. The nursery of cabbage cv. Golden
Acre was sown in second week of October, 2007 and 2008.Before sowing the seed was treated with Captan @ 3gm/kg of seed. The thirty days old seedlings were transplanted
in the second week of November. Before transplanting theseedlings were treated with Azotobacter, Azospirillium andPSB at the rate given below for one hour. Vesicular
Arbuscular Mycorrizae was applied as soil applicationbefore transplanting. FYM was incorporated into the soil onair dry weight basis. It contains 1.6% N, 1.5% P and 1.4% K.
Table 1. Different treatments of biofertilizers for experiment
Biofertilizer Dose Method of Application
Azotobactor 200 g acre-1 Seedling dip treatment
Azosprillium 200 g acre-1 -do-
PSB 200 g acre-1 -do-
VAM 200 g acre-1 Soil application
FYM 16 tonne acre-1 Soil application
The present investigation was carried out inrandomized block design (RBD) replicated thrice. There
were eleven treatments including control (Table 1).Recommended dosages of chemical fertilizers as perpackage of practices for vegetable crops by Punjab
Agricultural University, Ludhiana i.e., 125:60:60 kg ha-1 N, Pand K, respectively were applied. The chemical fertilizersurea, single super phosphate and muriate of potash were
Indian J. Ecol. (2011) 38(2) : 82-85Indian Journal
of Ecology

83
used as source of nitrogen, phosphorus and potassiumrespectively. Half dose of urea and full dose of single super
phosphate and muirate of potash was applied beforetransplanting. The remaining half dose of urea was appliedfour weeks after transplanting. The seedlings were
transplanted on ridges by keeping the inter-row spacing of60 cm and intra-row spacing of 45 cm. Irrigation was appliedimmediately after transplanting. Later on timely irrigations,
cultural practices and sprays were done as per packageand practices for vegetable crops to raise the healthy crop.The observations were recorded on plant height (cm),
number of leaves, head weight (g), head shape, total yield(q/ha), ascorbic acid(mg/100g) and chlorophyll content (μg/g) The data was subjected to randomized block design
analysis.
RESULTS AND DISCUSSION
Maximum plant height of 24.87 cm in 2008 and 20.88cm in 2009 was observed in plots (Table 1) where PSB with
recommended dose of N, P & K was applied, which was atpar with (Azospirillium + 75% N + recommended dose P &K, Azospirillium + recommended N, P & K, Azotobactor +
75% N + recommended P & K, Azotobactor + recommendedN, P & K, VAM + 75% P + recommended N & K but significantlyhigher than recommended N, P & K, and Control. The
beneficial effects of biofertilizers are well known as theincrease in growth attributes could be because of certaingrowth promoting substances secreted by microbial
inoculants and increased availability of nitrogen andphosphorus. Present study finds the support of Rather etal. (2003) who has reported that application of biofertilizers
help to increase the growth attributes.
In cabbage, maximum number of non-wrapper leaves13.17 during 2008 and 13.13 2009 (Table 1) were found in
plots where Azotobactor + recommended dose of N, P andK was applied. This was at par with other treatments andthere was no significant difference among different
treatments. Similar results were also reported by Verma etal. (1997). It was observed that in plots where biofertilizerswas applied, produced more number of leaves. However,
maximum head weight during 2008 was observed with PSB+ recommended dose of N, P and K was applied whichwas significantly higher than recommended N, P and K,
Azosprillium + 75% N + recommended P and K and butwas as par with VAM + 75% P + recommended N and K,PSB + 75% P + recommended N and K. During 2009,
maximum head weight was found in plot where PSB + 75%P + recommended N and K was applied which wassignificantly higher than treatments Azospirillium + 75% N
+ recommended P & K, Azotobactor + 75% N +recommended P & K but was at par with VAM + 75% P+
recommended N & K, PSB + recommended N, P & K. Thelowest head weight per plant 215.09 g and 251.53 g during2008-2009 respectively was obtained from control where
neither chemical fertilizer nor biofertilizer was supplied.Improvement in yield with PSB might be due to bettersolublization of insoluble fixed P and better uptake of soluble
P by the plant. Present study finds the support of Bahadur etal. (2004 and 2006).
During 2008, maximum ascorbic acid 40.57 mg/g
(Table 2) was obtained in treatment where PSB + 75% P +recommended dose of N and K was applied which wassignificantly higher than Azosprillium + 75% N +
recommended P and K. But during 2009, maximum ascorbicacid 45.13 mg g-1 was found where Azotobactor + 75% N +recommended P and K was applied, which was significantly
higher than all treatments except recommended N, P andK, PSB + recommended N, P and K and FYM. In both theyears, minimum ascorbic acid 29.43 mg g-1 and 30.87 mg
g-1 was found in 2008 and 2009 respectively in control. Itwas observed from the data that biofertilizers likeAzotobactor, Azosprillium and PSB tend to increase the
ascorbic acid. The maximum and significantly higherascorbic acid content over other treatments were obtainedfrom Azotobactor, Azosprillium and PSB. Ascorbic acid was
found higher in treatments with biofertilizers. This might bedue to physiological influence of Azospirillium on a numberof enzymes (Sendur et al., 1998).
The data in Table 2, revealed that maximum chlorophyll
content 92 ug/g was found where VAM + 75% P +
recommended dose of N and K was applies which was at
par with treatment VAM + recommended N, P and K and
was significantly higher than all treatments in 2008. During
2009, maximum chlorophyll content was found in plots
where VAM + recommended N, P and K was applied which
was at par with treatments Azospirillium + 75% N +
recommended P & K and VAM + 75% P+ recommended N
& K but was significantly higher than recommended N, P
and K, Azospirillium + recommended N, P& K, PSB + 75% P
+ recommended N & K and control.
Effect of biofertilizers on head shape is also presented
in Table 1. Maximum ratio (1.00) was found where
Azotobactor + 75% N + recommended dose of P and K was
applied in 2008. During both years, there was no significant
difference in head shape. During in 2009, lowest ratio 1.01
was found in control where neither chemical fertilizer nor
biofertilizers were applied.
Biofertilizers and Cabbage

84
Tab
le 1
. E
ffect
of
biof
ertil
izer
s on
eco
nom
ic t
raits
of
cabb
age
Tre
atm
ents
Pla
nt h
eigh
t (cm
)N
on
-wra
pp
er
lea
ves
Hea
d w
eigh
t (g
)H
ead
shap
e
2008
2009
Mea
n20
0820
09M
ean
2008
2009
Mea
n20
0820
09M
ean
Rec
omm
ende
d N
, P, K
19.3
317
.24
18.2
910
.51
11.5
011
.01
51
5.3
36
24
.27
56
9.8
00.
991.
051.
02
Azo
spiri
llium
+75
% N
+R
ecom
men
ded
P a
nd K
24.3
820
.18
22.2
810
.73
10.5
110
.62
51
4.8
56
19
.87
56
7.3
61.
001.
041.
02
Azo
spiri
llium
+R
ecom
men
ded
N, P
, K22
.29
20.2
721
.28
11.7
112
.21
11.9
65
16
.17
63
3.4
35
74
.80
0.98
1.04
1.01
Azo
toba
ctor
+75
%N
+R
ecom
men
ded
P a
nd K
24.5
219
.84
22.1
813
.17
13.1
313
.15
51
5.4
96
21
.09
56
8.2
91.
001.
121.
06
Azo
toba
ctor
+R
ecom
men
ded
N,
P a
nd K
23.8
019
.37
21.5
912
.34
12.4
012
.37
52
2.9
24
37
.15
48
0.0
30.
981.
041.
01
VA
M+
75%
P+
Rec
omm
eded
N a
nd K
24.3
320
.69
22.5
110
.78
10.7
810
.78
59
3.4
76
68
.74
63
1.1
00.
991.
021.
01
VA
M+
Rec
omm
ende
d N
, P a
nd K
21.4
018
.35
19.8
710
.79
11.3
511
.07
59
1.1
56
65
.75
62
8.4
50.
991.
041.
02
PS
B+
75%
P+
Rec
omm
ende
d N
and
K23
.28
20.3
621
.82
11.4
711
.62
11.5
46
10
.74
68
7.9
36
49
.34
1.00
1.04
1.02
PS
B+
Rec
omm
ende
d N
, P a
nd K
24.8
720
.88
22.8
711
.75
11.3
711
.56
61
4.5
86
50
.44
63
2.5
10.
961.
020.
99
FY
M17
.32
16.1
916
.75
10.4
110
.48
10.4
53
59
.93
55
6.0
54
57
.99
0.96
1.09
1.03
Con
trol
16.1
814
.81
15.4
99.
727.
128.
422
15
.09
25
1.5
32
33
.31
0.97
1.02
1.00
LSD
(0.0
5)2.
312.
372.
34N
.S.
N.S
.N
.S.
30.1
145
.21
36.6
3N
.S.
N.S
.N
.S.
*rat
io o
f tw
o ax
is
Tab
le 2
. E
ffect
of
biof
ertil
izer
s on
qua
lity
trai
ts o
f ca
bbag
e
Tre
atm
ents
Asc
orbi
c ac
id (
mg
100g
-1)
Chl
orop
hyll
cont
ent
(u g
-1)
Yie
ld (
q ha
-1)
2008
2009
Mea
n20
0820
09M
ean
2008
2009
Mea
n
Rec
omm
ende
d N
, P, K
35.4
340
.18
37.8
155
.67
57.0
056
.34
18
9.7
21
98
.79
19
4.2
6
Azo
spiri
llium
+75
% N
+R
ecom
men
ded
P a
nd K
38.8
645
.13
42.0
071
.33
71.0
071
.17
18
3.4
51
95
.23
18
9.3
4
Azo
spiri
llium
+R
ecom
men
ded
N, P
, K37
.66
44.2
240
.94
73.3
374
.33
73.8
31
90
.03
20
4.1
51
97
.09
Azo
toba
ctor
+75
%N
+R
ecom
men
ded
P a
nd K
38.5
645
.35
41.9
571
.00
71.6
771
.34
18
5.2
82
00
.07
19
2.6
7
Azo
toba
ctor
+R
ecom
men
ded
N,
P a
nd K
38.4
644
.36
41.4
170
.67
70.6
770
.67
19
5.6
92
03
.95
19
9.8
2
VA
M+
75%
P+
Rec
omm
eded
N a
nd K
37.7
744
.47
41.1
277
.67
78.6
778
.17
20
2.1
22
08
.43
20
5.2
7
VA
M+
Rec
omm
ende
d N
, P a
nd K
38.2
243
.50
40.8
678
.67
79.0
078
.84
20
9.2
42
17
.88
21
3.5
6
PS
B+
75%
P+
Rec
omm
ende
d N
and
K40
.57
41.2
240
.89
74.3
375
.00
74.6
72
14
.85
22
0.7
12
17
.78
PS
B+
Rec
omm
ende
d N
, P a
nd K
36.1
836
.34
36.2
672
.67
75.0
073
.84
21
0.1
22
08
.88
20
9.5
0
FY
M33
.58
34.0
833
.83
41.3
342
.67
42.0
01
76
.43
18
4.1
51
80
.29
Con
trol
29.4
330
.78
30.1
137
.33
37.6
737
.50
93.8
798
.19
96
.00
3
LSD
(0.0
5)1.
784.
111.
923.
983.
873.
9216
.07
13.2
414
.49
N.S. Gill, J. S. Bal and D. S. Khurana
85
As shown in Table 2, maximum yield 214.85 q ha-1
during 2008 and 220.71 q ha-1 during 2009 was found where
PSB + 75% P + recommended dose of N and K was applied,
which was significantly higher than recommended N, P and
K, Azosprillium + 75% N + recommended P and K,
Azotobactor + 75% N + recommended P and K and FYM but
was at par with treatments VAM + 75% P + recommended N
and K and PSB + recommended N, P and K.
Thus, it was concluded that the treatments, which
included biofertilizers gave better cabbage production as
well as quality over recommended dose of chemical
fertilizers. The biofertilizers application helped to save 25
per cent N as well as P.
REFERENCESBahadur, A., Singh, J. and Singh, K.P. (2004) Response of cabbage
to organic manures and biofertilizers. Indian J. Hort. 61(3) :278-279.
Bahadur, A., Singh, J., Singh, K.P., Upadhaya, A.K. and Rai, M.(2006) Effect of organic amendments and biofertilizers ongrowth, yield and quality attributes of Chinese cabbage(Brassica pekinensis). Indian J. Agric.Sci. 76(10): 596-598.
Rather, S.A, Ahmed, M. and Chatto, M.A. (2003) Response of onionto microbial inoculation and chemical nitrogen. Haryana J. Hort.Sci. 32(3-4) : 270-271.
Sendur, K.S., Natarjan, S. and Thamburj, S. (1998) Effect of organicand inorganic fertilizers on growth, yield and quality of tomato.S. Indian Hort. 46(3,4) : 203-205.
Verma, T.S., Thakur, P.C. and Singh, A. (1997) Effect of biofertilizerson vegetable and seed yield of cabbage. Veg. Sci. 24(1) : 1-3.
Biofertilizers and Cabbage
Received 15 June, 2011; Accepted 20 September, 2011

Canola (Brassica napus L.) is a genetically improved
version of rapeseed and is low in both erucic acid and
glucosinolates, which distinguish it from ordinary rapeseed.
It is also called double zero (‘00’) crop and swede rape. In
irrigated agro-ecosystem, liberal use of irrigation and
nitrogen application offer congenial environment for growth
and development of weeds. Application of nitrogen may
shift the competition in favor of crops against weeds.
Increased crop vigour as a result of increased nutrient
uptake may suppress the weeds due to shading (Mishra
and Kurchania, 1999). Canola seed yield respond to
nitrogen fertilizer applied at either sowing or bud stage,
generally increasing with increased nitrogen upto 200 Kg
ha-1 (Ramsey and Callinan, 1994). Per cent yield loss due
to weeds decreases as we go for higher and higher doses
of nitrogen. It was reported that per cent yield loss due to
weeds was 14.3 per cent at 100 kg ha-1 nitrogen application,
which was significantly lower as compared to no nitrogen
application (Anon., 2001).
Increasing costs of herbicide inputs in intensive crop
production systems and incidence of herbicide resistance
in weeds have renewed interest in exploiting crop
competitiveness to reduce herbicide use. Variation in
competitive ability against weeds exist not only among crop
species, but among cultivars within species. So in this
investigation, it is to be studied that how nitrogen levels
would help in shifting the advantage of competition toward
crop for different varieties of canola gobhi sarson. Hence,
the current research is planned to explore the competitive
potential of canola gobhi sarson against weeds and also
whether it could be increased with nitrogen application.
Effect of Nitrogen Levels, Cultivars and Weed Control Treatmentson Smothering Potential of Canola Gobhi Sarson (Brassica napus L.)
Lovreet Singh Shergill*, B. S. Gill and P. S. ChahalDepartment of Agronomy, Punjab Agricultural University, Ludhiana- 141 004, India
*E-mail: [email protected]
Abstract: The field experiment was conducted during the rabi season of 2008-09 to study the effect of various nitrogen levels, cultivarsand weed control treatments on smothering potential of canola gobhi sarson (Brassica napus L.). The crop registered significantly highervalue of seed yield (19.29 q ha-1) with the application of 125 kg N ha-1, with further increase in nitrogen up to 150 and 175 kg N ha-1, theincrease was non-significant. The weed population and dry matter accumulation data revealed decreasing trend with increasing level ofnitrogen. Among the cultivars, the differences in weed population and dry matter accumulation were non-significant. There was nodifference in competitive ability of both cultivars. Hyola PAC 401 yielded higher (20.21 q ha-1) because of its higher yield potential than GSC6 (18.87 q ha-1). Hand weeding registered higher values of yield attributes viz. plant height, dry matter, LAI, primary and secondarybranches plant-1, number of siliquae plant-1 which resulted in higher seed yield (20.67 q ha-1) as compared to unweeded control.
Key Words: Smothering potential, Brassica napus, Canola, Gobhi sarson, Weed, Nitrogen
MATERIAL AND METHODS
Field investigation was carried out at the StudentsResearch Farm, Department of Agronomy, Punjab
Agricultural University, Ludhiana, during rabi 2008-09 onloamy sand soils with low organic carbon (0.28 %), lowavailable nitrogen (243 kg ha-1), medium in availablePhosphorus (20.8 kg ha-1) and potash (188 kg ha-1). The
experiment comprised 16 treatments with three replicationsand was laid out in a split plot design with four levels ofnitrogen (100, 125, 150 and 175 kg ha-1) in main plots and
two cultivars (GSC 6 and Hyola PAC 401) and two weedcontrol methods (weeded and unweeded) in subplots. Thecrop was sown on 24th October 2008 with hand drill, in rows
45 cm apart and seeds were covered with light soil. Theplant to plant spacing of 10 cm was kept by thinning thecrop. Nitrogen was applied through urea (46% N), whereas,
phosphorus was applied through single super phosphate(16% P2O5), which is also source of sulphur (12% S). Handweeding was done at 30 days after sowing (DAS) to the
crop by using small hand tool. The first post sowing irrigationto the crop was given at 30 days after sowing. Secondirrigation was applied at 50 DAS of crop, whereas, third and
last irrigation was given at 75 days after sowing of crop. Allrecommended plant protection measures were adopted.To protect the crop from aphids and cabbage caterpillar
alternate sprays of insecticides, Thiodon 35 EC(Endosulfan) @ 500 ml/acre was made at appropriate cropgrowth stages.
Weed population and dry matter was recorded specieswise. Weeds were counted by randomly throwing a quadrantof size 0.3 × 0.3 m in each plot and results expressed as
Indian J. Ecol. (2012) 39(1) : 86-91Indian Journal
of Ecology

87
number m-2, whereas, weeds collected from the plots forweed count were sun dried, followed by oven drying at 60°
± 2°C till constant weight was obtained. The samples wereweighed and results expressed as g m-2. Species-wise drymatter accumulated by weeds was summed up to get the
value for total of weed dry matter accumulation by allspecies.
The plant height of five plants was measured from
ground to tip of main shoot. Above ground parts of plantsfrom each plot were removed from 30 cm row length, airdried and further dried in a hot air oven at 60° ± 2°C till
constant weight was obtained. Dry weight was recorded atharvest and expressed as g m-2. The periodic leaf areaindex (LAI) and photosynthetic active radiation interception
(PARI) of plants was recorded with sun scan canopyanalyzer. The observations were taken at random from fourplaces in each plot at 12:00 noon to 12:30 PM in a day. The
number of primary, secondary branches and siliquae plant-1
of five plants was counted and average was worked out.One thousand seeds were taken from each plot for obtaining
test weight. The crop was harvested manually when colourof stems, branches and siliquae changed from green tolight yellow or brown. The harvested crop was tied in
bundles, labeled and kept for sun drying for few days.Threshing was done manually separately for each plot andcleaned by proper winnowing. The entire produce from net
plot was weighed and expressed in q ha-1.
RESULTS AND DISCUSSION
Effect on Weed Population
Weed flora of the experimental field consisted ofChenopodium album, Lepidium sativa, Rumex dentatus,Phalaris minor, Avena ludoviciana, Gnaphalium purpureum,Melilotus alba, Spergulla arvensis, Anagallis arvensis andMedicago denticulata. The data on major weed population
i.e., C. album, L. sativa, R. dentatus, P. minor are discussedin Table 1. The weed species which showed very lessnumber per unit area in periodic weed counts were grouped
under one heading i.e. other weed species. These weedspecies consist of A. ludoviciana, G. purpureum, M. alba, S.arvensis, A. arvensis and M. denticulata.
The population data revealed that there were non-significant differences in weed count in all the weed speciesviz. C. album, L. sativa, R. dentatus, P. minor and other,
among various levels of nitrogen at harvest, but a decreasingtrend was observed with higher level of nitrogen except inC. album. This may be due to the increase in crop plant
height and the crop covered inter-row spaces more rapidlywhich suppressed the weeds, and ultimately the weed
population was reduced. Among cultivars, the difference inweed population was non-significant for all the species.
However, weed population in GSC 6 was higher than HyolaPAC 401, this maybe due to spreading and comparativelyquick growth habit of Hyola cultivar. At 120 days after sowing
(DAS), the weeded treatments recorded significantly lowervalues of weed count (3.3, 4.2, 2.0, 3.7 and 2.7 m-2) for allthe weeds viz., C. album, L. sativa, R. dentatus, P. minorand other respectively, as compared to that of unweededcontrol. All other interaction effects were found to be non-significant. Similar results were also reported by Singh
(2006) in P. minor in varieties and weed control methods.
Effect on Weed Dry Matter
The data collected for dry matter accumulation by C.album at 120 DAS (Table 1) revealed that there were non-
significant differences in dry matter accumulation among
various nitrogen levels at all stages of observation. It was
observed that the dry matter of weeds declined with
subsequent increase in nitrogen levels. This may be due to
the fact that with each increment in nitrogen level, the crop
dry matter increased, which may have suppressed the weed
growth. Hosseni et al. (2006) also reported that the addition
of nitrogen fertilizer resulted in increasing plant leaf area
index (LAI) and decreasing weed dry matter. Cultivar Hyola
PAC 401 registered lower values of weed dry matter as
compared to GSC 6, although the differences were non-
significant. This may be due to greater suppression by the
crop due to greater plant height, LAI and dry matter
accumulation by the crop. Among weed control treatments,
hand weeding treatment gave significantly lower values of
weed dry matter accumulation over that of unweeded control
at 120 DAS. Chauhan et al. (2005) reported that two hand
weedings drastically reduced weed density and weed
biomass. All other interaction effects were found non-
significant.
Effect on Crop
Increase in nitrogen application from 100 to 175 Kgha-1 resulted in increase in plant height Maximum plant
height (152.1 cm) was recorded with 175 Kg N ha-1, whichwas significantly higher as compared to 100 and 125 Kg Nha-1 but it was statistically at par with of 150 Kg N ha-1 (149.6
cm). The results are in conformity with Kumar et al. (2002).Application of 175 Kg N ha-1 gave significantly higher drymatter accumulation (819.4 g m-2) over 100 Kg N ha-1
application but was statistically at par with 150 Kg N ha-1
and 125 Kg N ha-1 at harvest. Similar results have beenreported by Gill and Narang (1993) and Chauhan et al.(1992). Significantly higher LAI was recorded with 175 kg N
Weed Control Treatments on Smothering Potential of Canola Gobhi Sarson

88
Tab
le 1
.E
ffect
of
diffe
rent
nitr
ogen
lev
els,
cul
tivar
s an
d w
eed
cont
rol
trea
tmen
ts o
n w
eed
popu
latio
n an
d dr
y m
atte
r ac
cum
ulat
ion*
Tre
atm
ent
Wee
d po
pula
tion
m-1
at 1
20 D
AS
Wee
d dr
y m
atte
r ac
cum
ulat
ion
(g m
-2)
at
120
DA
S
Che
nopo
dium
Lepi
dium
Rum
exP
ha
lari
sO
ther
Che
nopo
dium
Lepi
dium
Rum
exP
ha
lari
sO
ther
Tota
l dry
mat
ter
alb
um
sativ
ade
ntat
usm
inor
spe
cie
sa
lbu
msa
tiva
dent
atus
min
orsp
eci
es
accu
mul
atio
n
Nitr
ogen
(K
g ha
-1)
100
6.76
6.21
3.53
6.02
4.27
5.63
4.35
1.96
2.47
2.81
111.
64
(62
.09
)(5
5.2
9)
(18
.07
)(4
2.1
3)
(23
.63
) (
59.6
2)(3
3.3
5)
(4.1
9)
(8.2
5)
(7.1
1)
125
5.86
6.06
3.15
5.91
3.73
5.57
3.45
1.81
2.42
2.24
110.
11
(65
.33
)(4
9.7
7)
(12
.05
)(4
0.8
0)
(17
.61
)(4
7.7
7)
(15
.81
)(3
.34
)(6
.14
)(4
.87
)
150
6.29
5.69
2.99
5.03
3.12
5.26
3.08
1.76
2.35
1.91
92.0
3
(54
.2)
(48
.20
)(1
2.5
1)
(30
.28
)(1
4.2
5)
(42
.37
)(1
1.6
4)
(2.8
2)
(5.3
6)
(3.0
9)
175
5.66
5.17
2.42
4.57
3.11
4.66
2.81
1.37
2.30
1.82
64.7
1
(34
.75
)(4
5.8
8)
(8.3
9)
(26
.33
)(1
1.5
8)
(40
.28)
(9.
44)
(1.4
0)
(5.5
0)
(2.7
2)
CD
(0.
05)
NS
NS
NS
NS
NS
NS
NS
NS
NS
NS
NS
Cul
tivar
GS
C 6
6.61
6.53
3.06
5.82
3.81
5.55
3.64
1.74
2.55
2.23
110.
84
(63
.48
)(6
4.7
4)
(12
.97
)(4
0.8
0)
(19
.87
)(5
3.8
1)
(22
.71
)(3
.13
)(7
.04
)(5
.01
)
Hyo
la P
AC
401
5.68
5.04
2.98
4.95
3.31
5.01
3.20
1.71
2.22
2.16
78.4
1
(44
.71
)(3
4.8
4)
(12
.51
)(2
8.9
6)
(13
.67
) (
41.2
1)(1
2.4
1)
(2.7
5)
(5.5
9)
(4.4
0)
CD
(0.
05)
NS
NS
NS
NS
NS
NS
NS
NS
NS
NS
NS
Wee
d co
ntro
l
We
ed
ed
3.29
4.16
2.05
3.66
2.66
2.11
2.37
1.31
1.59
1.85
25.8
8
(15
.75
)(2
5.6
2)
(4.8
7)
(16
.8)
(8.3
4)
(7.
03)
(7.0
0)
(0.9
0)
(1.9
3)
(3.4
4)
Un
we
ed
ed
9.99
7.39
3.99
7.11
4.46
8.46
4.47
2.14
3.18
2.55
16
3.3
7
(92
.44
)(7
3.9
7)
(20
.62
)(5
2.9
8)
(25
.19
)(8
7.9
9)
(28
.12
)(4
.98
)(1
0.7
0)
(6.0
7)
CD
(0.
05)
1.93
2.64
1.07
1.22
1.40
1.92
1.47
0.54
0.57
0.59
46.0
7
*Fig
ures
in
the
pare
nthe
ses
are
mea
ns o
f or
igin
al v
alue
s.
Lovreet Singh Shergill, B. S. Gill and P. S. Chahal

89
ha-1 at 120 DAS, which was statistically at par with 150 kg N
ha-1 application. The results are in conformity with results
of Singh et al. (1997) who reported that addition of nitrogen
fertilizer resulted in increasing plant LAI. The increase in
nitrogen level increased the photosynthetic active radiation
interception (PARI) but significantly higher PARI was
recorded at 150 kg N ha-1 over 100 kg N ha-1 at 90 DAS.
Further increase in nitrogen level upto 175 kg N ha-1 did not
increase PARI significantly. This may be due to the fact that
with increase in nitrogen level, there was increase in plant
height and LAI. The primary branches plant-1 increased
significantly upto 150 kg N ha-1 over 100 and kg N ha-1 but
was statistically at par with that of 175 kg N ha-1. Application
of 175 kg N ha-1 gave significantly higher secondary
branches plant-1 over 100 kg N ha-1 but was statistically at
par with 125 kg and 150 kg N ha-1. Data (Table 2) showed
that nitrogen at 125 kg ha-1 recorded significantly higher
number of siliquae plant-1 over 100 kg N ha-1 but at par with
that of 150 kg and 175 kg N ha-1 application. Minhas et al.(2007) also reported increase in siliquae per plant with
successive increments of nitrogen from 0 to 150 kg ha-1.
Highest value (3.80 g) of test weight was recorded for
nitrogen application of 175 kg ha-1, though this was
statistically at par with all other levels of nitrogen application.
The seed yield increased with increase in nitrogen levels
upto 175 kg ha-1 (Table 2). Maximum seed yield was obtained
with the application of 175 kg N ha-1, which was significantly
superior over 100 kg N ha-1 application, however it was
statistically at par with 125 kg and 150 kg N ha-1. The seed
yield increased by 8.9, 15.0 and 17.3 per cent with 125, 150
and 175 kg N ha-1 application over 100 kg N ha-1, respectively.
Increase in N level from 125 to 150 Kg N ha-1 resulted in 5.6
per cent increase in seed yield, whereas, increase in N
levels from 150 to 175 kg N ha-1 resulted only 2 per cent
increase in seed yield. The increase in seed yield may be
due to more number of branches, siliqua plant-1 and test
weight with increase in levels of nitrogen. Nitrogen
application increased seed yield and significant response
was observed up to 125 kg ha-1 (Deol and Mahey, 2005).
Similar results were also reported by Thakur et al. (2003).
Among the two cultivars, Hyola PAC 401 recorded
significantly higher plant height (153.3 cm) as compared to
GSC 6 (142.6 cm) at harvest (Table 2). Similar results were
also reported by Depar et al. (2005). Dry matter
accumulation differed significantly in both cultivars. On the
whole Hyola PAC 401 accumulated 10.6 per cent more dry
matter over GSC 6 at harvest. At harvest, Hyola PAC 401
accumulated significantly higher dry matter (779.9 g m-2)
as compared to GSC 6 (704.8 g m-2). Siddiqui and
Mohammad (2004) also reported similar results for Hyola Tab
le 2
.S
eed
yiel
d an
d yi
eld
cont
ribut
ing
char
acte
rs o
f ca
nola
gob
hi s
arso
n as
inf
luen
ced
by d
iffer
ent
nitr
ogen
lev
els,
cul
tivar
s an
d w
eed
cont
rol
trea
tmen
ts
Tre
atm
ent
Pla
ntD
ry m
atte
rLe
af a
rea
Pho
tosy
nthe
ticP
rimar
yS
eco
nd
ary
Sili
qua/
Test
wei
ght
See
d yi
eld
heig
htac
cum
ulat
ion
ind
exac
tive
radi
atio
nb
ran
che
s/br
anch
es/p
lant
plan
t(g
)(q
ha-1
)(c
m)
by c
rop
(g m
-1)
(120
DA
S)
(90
DA
S)
plan
t
Nitr
ogen
(K
g ha
-1)
100
143.
366
2.1
2.21
85.4
4.4
7.0
198.
93.
6817
.71
125
147.
072
0.1
2.74
90.9
4.9
7.9
215.
93.
7019
.29
150
149.
676
7.9
3.02
94.1
5.3
8.7
222.
33.
7720
.37
175
152.
181
9.4
3.19
96.0
5.4
8.9
224.
53.
8020
.78
CD
(0.
05)
2.57
99.3
60.
225.
770.
240.
9612
.08
NS
1.53
4C
ultiv
arG
SC
614
2.6
704.
82.
2788
.54.
87.
421
1.3
3.71
18.8
7H
yola
PA
C 4
0115
3.3
779.
93.
3194
.75.
28.
821
9.4
3.75
20.2
1C
D (
0.05
)3.
3338
.20
0.14
3.70
0.15
0.39
7.57
NS
0.70
3W
eed
cont
rol
We
ed
ed
150.
576
9.7
2.98
88.7
5.6
8.5
223.
93.
7620
.67
Un
we
ed
ed
145.
571
5.0
2.60
94.5
4.5
7.8
206.
83.
7118
.41
CD
(0.
05)
3.33
38.2
00.
143.
700.
150.
397.
57N
S0.
703
Weed Control Treatments on Smothering Potential of Canola Gobhi Sarson

90
PAC 401. Both cultivars differed significantly in leaf area.Hyola PAC 401 recorded significantly higher LAI as
compared to GSC 6 at 120 DAS. Siddiqui and Mohammad(2004) also reported that Hyola PAC 401 produced thehighest LAI. The PARI of Hyola PAC 401 was significantly
higher over GSC 6 at 90 DAS. Hyola PAC 401 registeredhigher PARI because of greater plant height and LAI. Thisprovided advantage to Hyola PAC 401 as compared to GSC
6 in suppressing weeds. Hyola PAC 401 recordedsignificantly higher number of primary branches plant-1 (5.20)as compared to GSC 6 cultivar (4.80). Thakur et al. (2005)
also reported similar trend with increase in nitrogen levelsand among varieties. Hyola PAC 401 recorded significantlyhigher number of secondary branches plant-1(8.81) and
siliquae plant-1 as compared to GSC 6 (7.44). Kumar et al.(2002) also reported similar trend. The differences in testweight were found to be non-significant among both the
varieties. Hyola PAC 401 proved more competent cultivarwhich produced seed yield of 20.21 q ha-1 and it wassignificantly superior over GSC 6, yielding 18.87 q ha-1. Hyola
cultivar recorded 7.1 per cent higher seed yield over GSC 6.Higher seed yield recorded in Hyola PAC 401 was due tohigher LAI, more number of branches, siliqua plant-1 and
there was no difference in competitive ability of bothcultivars.
Effect of Weed Control Methods
Among weed control treatments hand weeding showed
significantly higher plant height. Maximum plant height of150.5 cm was observed in weeded plot treatment andminimum of 145.5 cm in unweeded control treatment at
harvest. Dry matter accumulation, LAI, was significantlyhigher in one hand weeding as compared to unweededcontrol. Weeded plots recorded 7.65 per cent higher dry
matter over unweeded control. Mishra and Kurchania (1999)reported that with increase in nitrogen levels there wassubstantial increase in crop biomass under hand weeded
plots as compared to weedy plots. Unweeded controltreatment intercepted significantly more solar radiation ascompared to hand weeded treatment at 90 DAS. The
unweeded treatment intercepted more light because ofpresence of weeds in the inter row spaces. Similar resultswere reported by Singh (2006) for varieties and weed control
methods. All other interaction effects were found to be non-significant. Among weed control treatments, weeded plotsrecorded significantly higher value of primary (5.6),
secondary branches plant-1 (8.5), siliqua plant-1 (223.9) ascompared to unweeded control (4.5, 7.8 and 206.8,respectively). This may be due to the weeds interference in
the unweeded control treatments. The differences in test
weight in weed control treatments were found to be non-significant. Under weed control treatments viz. hand
weeding and weedy check. Hand weeding producedsignificantly higher seed yield (20.67 q ha-1) as comparedto unweeded control. It was 12.28 per cent higher for weeded
plots as compared to unweeded control. It was due to thefact that in weeded plots there was more space and hencemore branching and siliqua plant-1, which ultimately reflected
in seed yield. The results are in conformity with resultsreported by Fathi et al. (2005) and Singh et al. (2001).
There was no difference in competitive ability of both
cultivars. Hyola PAC 401 yielded higher because of its higheryield potential than GSC 6. Application of 125 Kg N ha-1
produced significantly higher seed yield, with further
increase in nitrogen, the increase was non-significant. Handweeding treatment registered higher values of yieldattributes which resulted in higher seed yield as compared
to unweeded control.
REFERENCESAnonymous (2001) Proceedings of the Australian Agronomy
Conference. Australian Society of Agron.
Chauhan, A. K., Singh, M. and Dadhwal, K. S. (1992) Effect ofnitrogen level and row spacing on performance of rape(Brassica napus). Indian J. Agron. 37(4): 851-853.
Chauhan, Y. S., Bhargava, M. K. and Jain, V. K. (2005) Weedmanagement in Indian mustard (Brassica juncea L.). Indian J.Agron. 50(2): 149-151.
Deol, K. S. and Mahey, R. K. (2005) Response of gobhi sarson(Brassica napus subsp. oleifera var annua) to transplantingmethods and nitrogen. Environ. Ecol. 23(4): 723-725.
Depar, M. S., Soomro, N. A., Usmanikhail, M. U., Memon, G. R. andBaloch, F. M. (2005) Comparative study of Brassica speciesunder different fertility levels. Indus J. Plant Sci. 4(4): 467-473.
Fathi, G. (2005) Integrated weed management in canola (Brassicanapus L). Turkish J. Field Crops 10(2): 57-63.
Gill, M. S. and Narang, R. S. (1993) Yield analysis in gobhi sarson(Brassica napus subsp. oleifera var. annua) to irrigation andnitrogen. Indian J. Agron. 38(2): 257-265.
Hosseini, N. M., Alizadeh, H. M. and Ahmadi, H. M. (2006) Effects ofplant density and nitrogen rates on the competitive ability ofcanola (Brassica napus L.) against weeds. J. Agric. Sci.Tech. 8: 281-291.
Kumar, R., Singh, D. and Singh, H. (2002) Effect of nitrogen andsowing dates on productivity of Brassica species. Indian J.Agron. 47(3): 411-417.
Minhas, K. S., Rajinderpal and Brar, R. S. (2007) Effect of nitrogenapplication on transplanted hybrid gobhi sarson (Brassicanapus L.) in relation to age of seedlings. Envrion. Ecol. 25:291-294.
Mishra, J. S. and Kurchania, S. P. (1999) Effect of nitrogen levels,planting geometry and herbicides on weed growth and yieldof Indian mustard (Brassica juncea (L) Czern. and Coss.).Indian J. Weed Sci. 31: 187-190.
Lovreet Singh Shergill, B. S. Gill and P. S. Chahal

91
Ramsey, B. R. and Callinan, A. P. L. (1994) Effects of nitrogenfertilizer on canola production in north central Victoria.Australian J. Expt. Agric. 34(6): 789-796.
Siddiqui, M. H. and Mohammad, F. (2004) Physio-morphologicalanalysis of rapeseed-mustard cultivars. Indian J. Pl. Physiol.9: 283-287.
Singh, H., Singh, B. P. and Prasad, H. (2001) Weed management inBrassica species. Indian J. Agron. 46(3): 533-537.
Singh, S. (2006) Competitive ability of Brassica genotypes againstPhalaris minor and other weeds as influenced by date of
sowing. M.Sc. Thesis, Punjab Agricultural University, Ludhiana,India.
Thakur, K. S., Kumar, A. and Manuja, S. (2003) Effect of nitrogenfertilization on productivity and nitrogen balance in soil in gobhisarson (Brassica napus) based crop sequences. Indian J.Agron. 48(3): 162-163.
Thakur, K. S., Kumar, A. and Manuja, S. (2005) Performance ofpromising varieties of gobhi sarson (Brassica napus) atdifferent nitrogen levels. Indian J. Agron. 50(1): 67-69.
Weed Control Treatments on Smothering Potential of Canola Gobhi Sarson
Received 24 May, 2011; Accepted 15 October, 2011

The intensive cropping and adoption of high yielding
varieites in the past several decades has caused imbalanceof several primary nutrients in the alluvial soils of Punjab(Singh and Singh, 2001). Although, the soils of Punjab arerich in potassium because of dominance of K bearing
minerals, but show overall negative input-output balancewith respect to K.
Potassium uptake and removal by crops is usually of
the order of or greater than N removal, and depends oncrops and cropping sequence, K reserves and claymineralogy of soils (Kaur and Benipal, 2006). It has been
reported that continuous cropping without potassiumapplicaiton appreciably decreases the available K contentwhereas regular incorporation of potassium influences its
availability to varying extent (Brar et al., 2008). Thereplenishment of K nutrient removed by crops, thus, mustbe to the extent that it makes the system sustainable for
intensive cropping. The present investigation is aimed tostudy the readily and slowly available forms of K and theirdistribution pattern in the soils under the different cropping
sequences.
MATERIAL AND METHODS
A loamy sand/ sandy loam soils from the experimentalfield of Department of Soils, Punjab Agricultural Unviersity,
Ludhiana was studied for vertical distribution of differentforms of potassium. The soils were under long-term fieldexperimentation, which started in seventies following
cropping sequences of paddy-wheat, maize-wheat and
Vertical Distribution of Readily and Slowly Available Potassium in aTypic Haplustept under Different Cropping Sequences
H.S. Jassal*, Raj Kumar, Kuldip Singh and N.S. DhillonDepartment of Soils Science, Punjab Agricultural University, Ludhiana-141 004, India
*E-mail: [email protected]
Abstract: Vertical distribution of different forms of potassium in a soil under long-term (34 years) field experiment of paddy-wheat, maize-wheat and arhar-wheat cropping sequences were studied. The soils of experimental site were found to be low to medium in available Kand and high in non-exchangeable K. The exchangeable K and non-exchangeable K followed almost similar pattern as followed byavailable K and HNO3 extractable K respectively with depth suggesting their close association. The fertilizer treated plots were found tobe relatively higher in different K fractions compared to the control plots in all the cropping sequences. The control and fertilized plotsunder paddy-wheat, maize-wheat and arhar-wheat sequences showed increase in non-exchangeable K within a half-meter depth. Thewater soluble K significantly and positively correlated with organic matter (r = 0.48**) whereas the exchangeable K had positive but non-significant relationship with clay due to its low content. The exchangeable and non-exchaneable K has shown their affinity with twodifferent sources, the former more with clay fraction whereas later more with silt fraction. As compared to paddy-wheat and maize-wheat sequences, relatively higher depletion of potential K reserve from the surface horizon (0-24 cm) in arhar-wheat may be due tolower root biomass addition in the latter.
Key Words: Soil properties, Potassium fractions, Correlation, Cropping sequences
arhar-wheat. The field under each cropping sequence was
differentiated into two plots one representng absolutecontrol and other fertilized one. No fertilizers were appliedto the control plots whereas fertilized plots received nitrogenand phosphorus at the rate of 125 per cent and potassium
at the rate of 100 per cent of recommended doses ofrespective crops. A total of six representative profiles (P1 toP6), two profiles from a cropping sequence (one from
absolute control and one from fertilized plot), were exposedfor the present sudy. The soil samples were collected fromdifferent horizons of the representative profiles from the
control and fertilized plots of three cropping sequences, i.e.paddy-wheat, maize-wheat and arhar-wheat. The soilsamples were dried and ground for subsequent analyzed
for physical and chemical properties such as particle sizedistribution, organic carbon content, pH, electricalconductance and CaCO3 content following standard
procedures (Soil Conservation Service, 1972)
Water-soluble and 1N ammonium acetate extractableK (1:5 soil extracted ratio) were estimated as per the method
given by Jackson (1967). Exchangebale K content wascalculated by subtracting water soluble K from 1Nammonium acetate extractable K (avalable K). Potassium
extractable in 1N boiling HNO3 was estimated according tothe method of Pratt (1965). Non-exchangeable K wasobtained by subtracting available K from 1N boiling HNO3
extractable K. Total K in soil samples was determined inHF-HCIO4 digest. The amount of K in mineral lattice wasestimated by subtracting 1N boiling HNO3 extractable K from
Indian J. Ecol. (2012) 39(1) : 92-97Indian Journal
of Ecology

93
the total soil K content. Potassium content in all the extractswas determined by a flame photometer. Simple correclation
coefficient between physico-chemical properties and Kforms were worked out as per the statistical methodsoutlined by Gomez and Gomez (1984).
RESULTS AND DISCUSSION
Physical and Chemical Characteristics
The physical and chemical characteristics of soilsamples collected from various profiles under differentcropping sequences are summarized in Table 1. The
particle size distribution data revealed highest content ofsand (61.2 to 77.5%) followed by silt (18.5 to 39.5%) andclay (1.8 to 5.8%). The texture of the soil is sandy loam but
also crosses to marginally loamy sand in PI and P6 soilsand in surface horizons of P3 and P4 soils. The pH of thesoils is nearly neutral ranging from 6.9 to 7.9 (wt. mean)
corroborating the absence of carbonates in the profiles.The surface horizon had relatively lower pH comparedsubsurface horizons suggesting acids produced due to root
respiration and decomposition organic matter. The soilsunder different cropping sequences showed conspicuousdecrease in pH in fertilized plots as compared to control
plots in all the cropping sequences. Singh et at. (2006)have also reported decrease of pH in soils with applicationof fertilizers in a long-term experiment. Electrical conductivity
value remained well below the critical limit of 0.80 dS m-1
indicating non-saline nature of the soils. The surface horizonhad more EC than immediate subsurface horizon
suggesting salts accumulation at surface soil. Differentcropping sequences have not shown any significantinfluence on organic carbon content of the soils. Organic
carbon content ranges from 0.31 to 0.41 per cent in surface
horizons and 0.05 to 0.16 per cent in subsurface horizons.The soils are almost free of -calcium carbonate except for
minor presence at surface horizons of P3 soil. Theuninterrupted irrigation of the field for long period resultedin leaching calcium carbonate to lower depths. The soils of
the experimental farm were classified as coarse loamy,mixed hyperthermic family of Typic Haplustepts followingthe criteria of Soil Taxonomy (Soil Survey Staff, 1999).
Distribution of Readily Available Potassium
The water soluble potassium ranged from 5.0 to 24.5
mg kg-1 with an average weighted mean of 12.2 mg kg-1 in
different profiles (Table 2). The depth-wise distribution of
water soluble K in different cropping sequences was
generally decreasing with depth in both control and fertilized
plots. Relatively more concentration of water soluble K at or
near the surface suggests its dynamic nature which appears
to be associated with phytocyc1ing, capillary rise of water
and effect of irrigation which return substantial K in surface
horizon. Dhaliwal et at. (2004) observed Gurdaspur and
Dhar soils low in water soluble K on account of exhaustive
rice-wheat system and better leaching condition of the area.
The exchangeable K ranged from 5.5 to 61.0 mg kg-1
with an average weighted mean of 25.4 mg kg-1 in differentprofiles (Table 2). The exchangeable K content was highest
in soils of arhar-wheat and lowest in maize-wheatsequence. The surface horizon of soils (control plots) underpaddy-wheat and arhar-wheat showed relatively lower
amounts of exchangeable K than immediate subsurfacehorizon suggesting some depletion. However soilsreceiving K fertilization showed relatively higher in
exchangeable K in surface horizon than underlying horizonin all the cropping sequences. No specific trend of
Table 1. Important physico-chemical properties* of the soils of different cropping sequence
Sand(%) SIlt (%) Clay (%) pH (1:2) EC (dS/m) O C (%)
Profile 1, Paddy-Wheat (control)
74.5 (71.7-76.6) 22.5 (20.0-244.9) 3.0 (2.8-3.4) 7.6 (7.2-8.5) 0.06 (0.05-0.07) 0.14 (0.05-0.41)
Profile 2, Paddy-Wheat (fertilized)
70.7 (61.2-75.5) 24.9 (19.3-34.0) 4.4 (3.0-5.6) 7.2 (6.7-7.4) 0.05 (0.04-.06) 0.12 (0.05-0.32)
Profile 3, Maize-Wheat (control)
70.7 (67.1-77.5) 26.2 (20.3-39.5) 3.1 (1.8-4.6) 7.9 (7.8-8.3) 0.07 (0.05-0.10) 0.15 (0.09-0.32)
Profile 4, Maize-Wheat (fertilized)
67.8 (62.6-73.2) 28.6 (24.4-32.8) 3.6 (2.4-4.8) 6.9 (6.5-7.0) 0.06 (0.05-0.08) 0.15 (0.10-0.31)
Profile 5, Arhar-Wheat (control)
73.1 (70.4-74.5) 22.2 (20.0-25.2) 4.7 (4.0 (4.0-5.8) 7.8 (7.4-8.3) 0.06 (0.05-0.08) 0.14 (0.08-0.34)
Profile 6, Arhar-Wheat (fertilized)
75.3 (74.6-77.3) 21.2 (18.5-22.6) 3.5 (2.8-4.4) 7.5 (7.0-7.9) 0.05 (0.04-0.07) 0.14 (0.08-0.33)
* Weighted mean (figures in parentheses indicate range)
Distribution of Available K in different Cropping Sequences
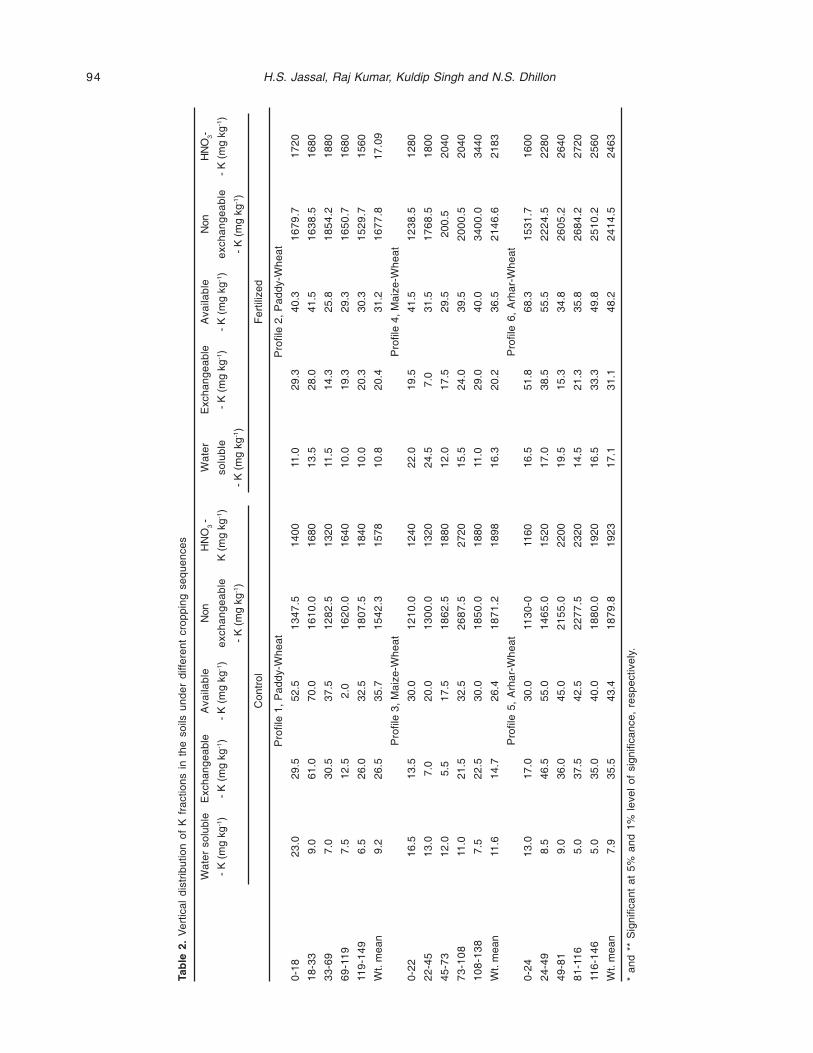
94 H.S. Jassal, Raj Kumar, Kuldip Singh and N.S. Dhillon
Tab
le 2
. V
ertic
al d
istr
ibut
ion
of K
fra
ctio
ns i
n th
e so
ils u
nder
diff
eren
t cr
oppi
ng s
eque
nces
Wat
er s
olub
leE
xcha
ngea
ble
Ava
ilabl
eN
onH
NO
3 -W
ater
Exc
hang
eabl
eA
vaila
ble
Non
HN
O3-
- K
(m
g kg
-1)
- K
(m
g kg
-1)
- K
(m
g kg
-1)
exch
ange
able
K (
mg
kg-1)
solu
ble
- K
(m
g kg
-1)
- K
(m
g kg
-1)
exch
ange
able
- K
(m
g kg
-1)
- K
(m
g kg
-1)
- K
(m
g kg
-1)
- K
(m
g kg
-1)
Con
trol
Fer
tiliz
ed
Pro
file
1, P
addy
-Whe
atP
rofil
e 2,
Pad
dy-W
heat
0-18
23.0
29.5
52.5
13
47
.514
0011
.029
.340
.31
67
9.7
1720
18-3
39.
061
.070
.01
61
0.0
1680
13.5
28.0
41.5
16
38
.516
80
33-6
97.
030
.537
.51
28
2.5
1320
11.5
14.3
25.8
18
54
.218
80
69
-11
97.
512
.52.
01
62
0.0
1640
10.0
19.3
29.3
16
50
.716
80
119
-14
96.
526
.032
.51
80
7.5
1840
10.0
20.3
30.3
15
29
.715
60
Wt.
mea
n9.
226
.535
.71
54
2.3
1578
10.8
20.4
31.2
16
77
.817
.09
Pro
file
3, M
aize
-Whe
atP
rofil
e 4,
Mai
ze-W
heat
0-22
16.5
13.5
30.0
12
10
.012
4022
.019
.541
.51
23
8.5
1280
22-4
513
.07.
020
.01
30
0.0
1320
24.5
7.0
31.5
17
68
.518
00
45-7
312
.05.
517
.51
86
2.5
1880
12.0
17.5
29.5
200.
520
40
73
-10
811
.021
.532
.52
68
7.5
2720
15.5
24.0
39.5
20
00
.520
40
10
8-1
38
7.5
22.5
30.0
18
50
.018
8011
.029
.040
.03
40
0.0
3440
Wt.
mea
n11
.614
.726
.41
87
1.2
1898
16.3
20.2
36.5
21
46
.621
83
Pro
file
5, A
rhar
-Whe
atP
rofil
e 6,
Arh
ar-W
heat
0-24
13.0
17.0
30.0
113
0-0
1160
16.5
51.8
68.3
15
31
.716
00
24-4
98.
546
.555
.01
46
5.0
1520
17.0
38.5
55.5
22
24
.522
80
49-8
19.
036
.045
.02
15
5.0
2200
19.5
15.3
34.8
26
05
.226
40
81
-11
65.
037
.542
.52
27
7.5
2320
14.5
21.3
35.8
26
84
.227
20
116
-14
65.
035
.040
.01
88
0.0
1920
16.5
33.3
49.8
25
10
.225
60
Wt.
mea
n7.
935
.543
.41
87
9.8
1923
17.1
31.1
48.2
24
14
.524
63
* an
d **
Sig
nific
ant
at 5
% a
nd 1
% l
evel
of
sign
ifica
nce,
res
pect
ivel
y.

95
exchangeable K with depth, however, was observed in thesoils.
The available K ranged from 17.5 to 70.0 mg kg-1 withan average weighted mean of 37.7 mg kg-1 in differentprofiles (Table 2). The water soluble K contributed to the
extent of 12 to 67 per cent (average 32 %) and theexchangeable K to the extent of 33 to 88 per cent (average68%) towards the available K. The depth-wise distribution
pattern of available K was almost similar to exchangeablepotassium showing no specific trend with depth.Considering the fertility index of available K less than 51
mg kg-1 as low, 51 to 124 mg kg-1 as medium and more than124 mg kg-1 as high, the soils (surface horizon) under allcropping sequences are low to medium in available K. The
surface horizon of fertilized plots showed relatively moreavailable K compared to control plots, except in paddy-wheat sequence. Amongst the different cropping
sequences, unfertilized surface horizon showed higherdepletion of available K as compared to immediate sub-surface horizon in arhar-wheat, and this trend was not
followed by paddy-wheat cropping sequence, which isconsidered to be more exhaustive for K. This may be due toaddition of K from irrigation water in paddy-wheat sequence.
The maize-wheat sequence, on the other hand, showedsome available K built-up in the surface horizon probablydue to its lower uptake and more recycling/addition from
organic residue. Normally, the quantity of nutrients removedby paddy-wheat from soils exceeded the other two croppingsequences. Being water soluble, exchangeable and
available K are very dynamic forms and undergo rapidchange with irrigation, salts and organic matteraccumulation, therefore these forms may not serve a
reliable indicator of K depletion in soils.
Distribution of Slowly Available Potassium
The non-exchangeable K ranged from 1130.0 to 3400.0mg kg-1 with an average weighted mean of 1816.9 mg kg-1
(Table 2). Unlike the water soluble, exchangeable andavailable K forms, the non-exchangeable K invariablyshowed relatively lower content at the surface horizon
compared to subsurface horizon in the soils of all croppingsequence except in fertilized plot of paddy-wheat. The soil
of all the cropping sequences (control and fertilized) showedincrease in non-exchangeable K to a depth of 50 cmindicating the depletion of soil reserves. Relative to the
immediate sub-surface horizon, the surface horizon of thecontrol plot of arhar-wheat showed maximum depletion (335K mg kg-1), followed by paddy-wheat (262.5 K mg kg-1) and
maize-wheat (90 K mg kg-1).
The boiling 1N HNO3 extractale K ranged from 1160 to3440 mg kg-1 (Table 2) with an average weighted mean of
1855 mg kg-1. Almost similar depth distribution pattern ofnon-exchangeable K and HNO3 extractable K indicatedmajor contribution of former in the make up of later.
According to critical limit of K availability as 655 mg kg-1 ofHNO3 K (Brar and Sekhon, 1976), the soils under studyhave been rated as high for in HNO3 extractable K. The
surface horizon of the soils (except profile P2) showedrelatively lower content of HNO3 K than the subsurfacehorizons. The lower content of HNO3 K in surface horizon
might be due to the continuous leachign of K and uptake bycrops released from non-exchangeable part to compensatethe loss of water soluble and exchangeable K (Brar et al.,2008)
Correlation Between Soil Properties and KFractions
The correlation coefficient between soil properties andK fractions (Table 3) indicated water soluble K significantly
and positively correlated with organic carbon (r=0.48**)suggesting contribution from root biomass, but significantlyand negatively correlated with pH (r=-0.49**) possibly due
to increasing stability of K minerals with higher pH (Kumaret al., 2006). The exchangeable K had positive but non-significant relationship with clay probably due to vey low
content and low exchange capacity of the later in these soils(Table 3). The effect of organic carbon on available K was,therefore, more (r=0.28) as compared to clay content
(r=0.05). The non-exchangeable K and HNO3 extractable Kshowed significant positive correlation with silt fraction
Table 3. Correlation coefficient among soil properties and K fractions
Sand SIlt Clay pH EC OC WS-K Exch-K Avail-K Non-Exch-
K
Water soluble 0.0114 0.0269 -0.2235 -0.4880** 0.0967 0.4799**
Exch.-K 0.1044 -0.1795 0.1306 0.1271 0.0635 0.0900 -0.2318
Avail.-K 0.1105 -0.1719 0.0455 -0.0611 0.0268 0.2785 0.1544 0.9253**
Non-exch.-K -0.2678 0.2995* 0.2105 0.0743 -0.3610* -0.3287* -0.0801 0.0401 0.0095
HNO3-K -0.2651 0.2954* 0.2115 0.0729 -0.3602* -0.3223* -0.0765 0.0611 0.0323 0.9997**
* Significant at 5% level of significance, ** Significant at 1% level of significance
Distribution of Available K in different Cropping Sequences

96
(r=0.30*) and non-significant (r=0.21) with clay fractionsuggesting appreciable amounts of potash rich minerals
such as muscovite, biotite and feldspars in silt and illite inclay fractions.
The correlation coefficient determined amongst
different forms of K recorded significant positive correlation(r=0.92**) between exchangeable K and available K and(r=0.99**) between non-exchangeable K and HN03
extractable K. Non-significant positive correlation betweenexchangeable and non-exchangeable K (r=0.04) suggestedtheir association with different sources i.e., exchangeable
K associated more with illite in clay fraction whereas non-exchangeable K more with muscovite, biotite and feldsparsin silt fraction.
Effect of Cropping Sequence and Fertilization
In all the cropping sequences, relatively higher contentof water soluble K was observed in the fertilized plot than incontrol plot of respective sequence (Table 2). The control
plot under arhar-wheat sequence showed lowest watersoluble K, whereas, highest content (wt. mean = 11.6 mgkg-1) was recorded in maize-wheat sequence. Among
different cropping sequences (control), the surface horizonof arhar-wheat had the lowest content of water soluble Kwhereas paddy-wheat had the highest. Relatively higher
content of water soluble K at surface suggest that this formis little affected by crop use. Exchangeable K content wasrelatively higher in the surface horizons of fertilized plots
compared to control plots suggesting some build-up in thesurface horizon on addition of K. The paddy-wheat and arhar-wheat sequences (control) showed some depletion of
exchangeable K in the surface horizon compared tounderlying horizon whereas there was accumulation of K inmaize-wheat (control) sequence. The soils without K
application may not exhibit large-scale depletion ofexchangeable K as it replenishes from non-exchangeablepool or organic matter recycling (Talukdar et al., 1992).
Except under paddy-wheat sequence, all other soils inrespective cropping sequences were relatively higher inavailable K content in fertilized plot than in control. Under
the control condition, the surface horizon showed relativelyhigher depletion of available K in arhar-wheat and lower inpaddy-wheat sequence whereas maize-wheat had some
accumulation (Table 2). The exchangeable and available Kfractions might not be the good indicators of K depletionunless supplemented with other K fractions as the soils
having similar amount of available K release differentamounts of K depending on their non-exchangeable Kcontent (Prakash and Siddaramappa, 2001). Furthermore,
there are contradictory reports on changes in available K
status of soils under continuous cropping and receiving noK applications (Talukdar et al., 1992).
A perusal of non-exchangeable K and HNO3 extractableK data revealed relatively lower content of K in control plotsthan in the fertilized plots suggesting mining of potential K
reserve from the soils. The results indicate that the surfacehorizon of soil under arhar-wheat (control) had the lowestcontents of non-exchangeable K and HN03 K, whereas, the
soils under paddy-wheat sequence (control) have highestcontents. In the control plots, the non-exchangeable Kcontent in surface horizon compared to immediate
subsurface horizon decreased to 335 mg kg-1 in arhar-wheat, 262.5 mg kg-1 in paddy wheat and 90 mg kg-1 inmaize-wheat sequences. The similar trend was observed
for HN03 extractable K in these cropping sequences.Relatively lower content of non-exchangeable K in thesurface horizon of arhar-wheat sequence compared to other
sequences may be due higher removal and poor recyclingof K (Blaise et al., 2005). Although paddy removes more Kthan arhar, however, excessive irrigation returns more K in
paddy.
REFERENCESBlaise, D., Bonde, A.N. and Chaudhary, R.S. (2005) Nutrient uptake
and balance of cotton+pigeonpea strip intercropping on rainfedVertisols of central India. Nutr. Cycl. Agroecosyst. 73: 135-145.
Brar, M.S. and Sekhon, G.S. (1976) Potassium fixation and responseof wheat to applied potassium in Punjab soils. J. Res., PunjabAgric. Univ. 13: 136-139.
Brar, N.K., Benipal, D.S. and Brar, B.S. (2008) Potassium releasekinetics in soils of a long-term fertilizer experiment. Indian J.Ecol. 35: 9-15.
Dhaliwal, A.K., Gupta, R.K., Yadvinder-Singh, Sharma, B.D. andBijay-Singh (2004) Distribution of different forms of potassiumin benchmark soil series under rice-wheat cropping system inPunjab. J. Potassium Res. 20: 12-21.
Gomez, K.A. and Gomez, A.A. (1984) Statistical Procedures forAgricultural Research, 2nd Edition. John Wile and Sons, NewYork.
Jackson, M.L. (1967) Soil Chemical Analysis. Prentice — Hall ofIndia Private Limited, Bombay.
Kaur, N. and Benipal, D.S. (2006) Effect of crop residue andfarmyard manure on forms on soils of long term fertilityexperiment. Indian J. Crop Sci. 1: 161-164.
Kumar, R. Hundal, H.S. and Benbi, D.K. (2006) Mineral sources ofPunjab and its estimation in soils of Punjab, India. In: S.S.Mukhopadhyay, M.S. Brar and P. Sharma (Eds.) BalancedFertilization for Sustaining Crop Productivity. Proceeding ofInternational Symposium held at PAU, Ludhiana, India, 22-25November, 2006.
Prakash, N.B. and Siddaramappa, R. (2001) Distribution andavailability of potassium in red soils of India. In: N.S. Pasrichaand S.K. Bansal (Eds.) Potassium in Indian Agriculture. PotashResearch Institute of India, Gurgaon (Haryana), pp. 89-107.
H.S. Jassal, Raj Kumar, Kuldip Singh and N.S. Dhillon

97
Pratt, P.F. (1965) Potassium. In: C.A. Black (eds.) Methods of SoilAnalysis, Volume 2: Chemical and Biological Properties.American Society of Agronomy, Madison, USA: 1023-1030.
Singh, V., Dhillon, N.S., Kumar, R. and Brar, B.S. (2006) Long-termeffects of inorganic fertilizers and manure on phosphorusreaction products in a Typic Ustochrept. Nutr. Cycl.Agroecosyst. 76: 29-37.
Singh, Y. and Singh, B. (2001) Efficient management of primarynutrients in the rice-wheat system J. Crop Prod. 4: 23-85.
Soil Conservation Service (1972) Soil Survey Laboratory Methods
and Procedurs for Colelcting Soil Samples. U.S. GovernmentPrinting Office, Washington, DC.
Soil Survey Staff (1999) Soil Taxonomy- A Basic System of SoilClassification for Making and Interpreting Soil Survey.Agricultrue Handbook No 436, USDA Natural ResourcesConservation Service. US Government Printing Office,Washington, DC.
Talukdar, M.C., Khera, M.S. and Barua, T.C. (1992) Kinetics of non-exchangeable potassium release from K depleted Ustochrepts.J. Potassium Res. 8: 38-43.
Distribution of Available K in different Cropping Sequences
Received 6 September, 2011; Accepted 7 March, 2012

Potassium in soils is known to occur in various formsviz ,water soluble, exchangeable ,non- exchangeable andlattice potassium. However, in the order of their availability
to plants the K forms are solution, exchangeable, non-exchangeable and mineral potassium (Martin andSparks,1983).The different forms of potassium are known
to exist in dynamic equilibrium with each other(Maclean,1978).The study of different forms of potassiumwill serve to work out rational fertilizer dose of this nutrient
to crops especially for high yielding varieties of cereals.Potassium when added to soils, gets fixed, and underintensive cropping it is released. Thus any decrease in soil
potassium would be made up by the release of nonexchangeable to exchangeable form. Since thecharacterization of dynamics as well as quantification of
potassium are necessary for planning long term potassiumneed of crops (Goswami and Bandopadhyay,1978), thethermodynamic concept is generally advocated for
characterizing and assessing the availability of K to thegrowing plants. In this approach, the quantity (Q) parameterssuch as labile K(KL), K on specific sites (KO) and K on non-
specific sites (Kx) and intensity (I) parameter such as activityratio of K(ARo
k) are worked out for a greater understandingof the fertility status of any soil. The activity ratio, energy
replacement and other thermodynamic functions of the soilhave been used to describe the K-availability to plants inmodern approach. The Q/I measures the ability of soil to
maintain the intensity of soil solution K and is proportionalto cation exchange capacity (CEC) of soils. A high valuesignifies good K supplying power, whereas low suggests
need for K fertilization. When Q/I values are low small
Forms and Quantity-Intensity Parameters of Potassium Applied toWheat under Temperate Conditions of Kashmir
J.A Wani, M.A. Malik, M.A. Dar, Farida Akhter and M.A. BhatDivision of Science Science, S.K.University of Agricultural Sciences and Technology of Kashmir, Shalimar-191 121,India
*E-mail: [email protected].
Abstract A field trial was conducted to study the influence of potassium on forms and quantity-intensity parameters of potassium of soilunder wheat. The treatments consisted of 5 levels of potassium (0,20,40,60,80 Kg K2O ha-1) and two methods of application viz singlebasal and split (1/2 basal+1/2 at tiller initiation stage). All forms of potassium viz water-soluble, exchangeable and boiling HNO3 extractableand lattice potassium increased with increasing levels of potassium and were found to be maximum when potassium was applied @80 kg ha-1 in two equal splits except lattice K, which was maximum in treatment where potassium was applied @ 60 kg ha-1. The quantityas well as intensity factors recorded higher values with increasing potassium levels indicating a greater K-release into soil solutionresulting in large pool of labile potassium. Higher potential buffering capacity of potassium (PBCk) was found at lower levels of potassium.A significant and positive correlation was found among Q/I parameters whereas a negative and significant relation existed between Q/Iand PBCk.
Key Words: Potassium, Quantity–intensity relations, Wheat, Temperate region
changes in exchangeable K produce large differences insoil solution K. By virtue of its higher potentiality, wheatcrop is emerging as a potential field crop under valley
conditions. Therefore, different forms of K and variousthermodynamic parameters of soil K with respect to Knutrition of wheat is required to be worked out so as to
rationale K fertilizer management. in general and potassiumfertilizer management in general. A research programmewas thus undertaken to elucidate the magnitude of changes
in different K forms and quantity – intensity parameters of Kin wheat under temperate conditions of Kashmir valley.
MATERIAL AND METHODS
The experiment was undertaken on the research farm
of Division of Soil Science, SKUAST-K, Shalimar with wheat(var. HS-240) as test crop. Before sowing a representativecomposite sample was taken and analysed for different
physico- chemical characteristics following standardmethods (Table 1). The experiment was laid out inrandomized block design with three replications and nine
treatments. The treatments included,control (0 kg K2O ha-1),20 kg K2O ha-1 basal, 40 kg K2O ha-1 basal, 60 kg K2O ha-1
basal, 80 kg K2O ha-1 basal; 20 kg K2O ha-1 (half basal +half
at tillering stage), 40 kg K2O ha-1 (half basal +half at tilleringstage), 60 kg K2O ha-1(half basal+ half at tillering stage) and80 Kg K2O ha-1 (half basal +half at tillering stage). Potassium
was applied in the form of muriate of potash at the time ofsowing and tiller initiation stage as per the treatments.Nitrogen and phosphorus was applied in the form of Urea
and diammonium phosphate respectively as per packageof practices. The seeds were sown in lines with a spacing
Indian J. Ecol. (2012) 39(1) : 98-101Indian Journal
of Ecology
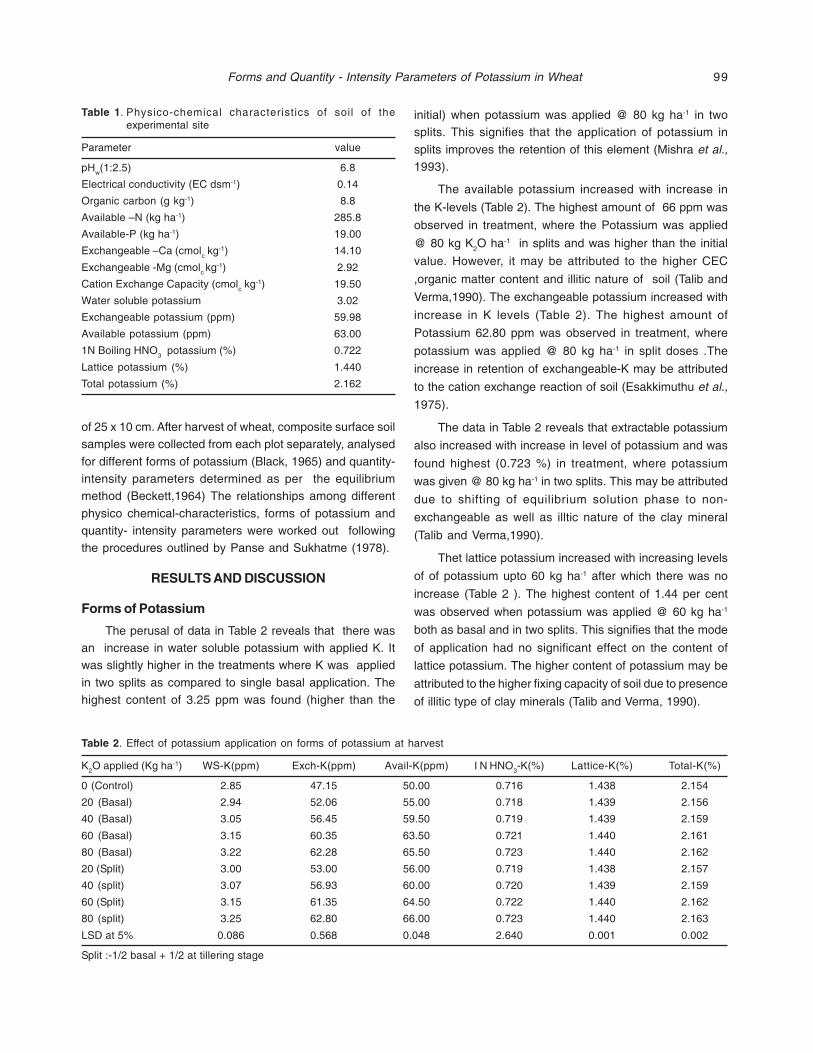
99
of 25 x 10 cm. After harvest of wheat, composite surface soilsamples were collected from each plot separately, analysed
for different forms of potassium (Black, 1965) and quantity-intensity parameters determined as per the equilibriummethod (Beckett,1964) The relationships among different
physico chemical-characteristics, forms of potassium andquantity- intensity parameters were worked out followingthe procedures outlined by Panse and Sukhatme (1978).
RESULTS AND DISCUSSION
Forms of Potassium
The perusal of data in Table 2 reveals that there wasan increase in water soluble potassium with applied K. Itwas slightly higher in the treatments where K was applied
in two splits as compared to single basal application. Thehighest content of 3.25 ppm was found (higher than the
initial) when potassium was applied @ 80 kg ha-1 in twosplits. This signifies that the application of potassium in
splits improves the retention of this element (Mishra et al.,1993).
The available potassium increased with increase in
the K-levels (Table 2). The highest amount of 66 ppm was
observed in treatment, where the Potassium was applied
@ 80 kg K2O ha-1 in splits and was higher than the initial
value. However, it may be attributed to the higher CEC
,organic matter content and illitic nature of soil (Talib and
Verma,1990). The exchangeable potassium increased with
increase in K levels (Table 2). The highest amount of
Potassium 62.80 ppm was observed in treatment, where
potassium was applied @ 80 kg ha-1 in split doses .The
increase in retention of exchangeable-K may be attributed
to the cation exchange reaction of soil (Esakkimuthu et al.,
1975).
The data in Table 2 reveals that extractable potassium
also increased with increase in level of potassium and was
found highest (0.723 %) in treatment, where potassium
was given @ 80 kg ha-1 in two splits. This may be attributed
due to shifting of equilibrium solution phase to non-
exchangeable as well as illtic nature of the clay mineral
(Talib and Verma,1990).
Thet lattice potassium increased with increasing levels
of of potassium upto 60 kg ha-1 after which there was no
increase (Table 2 ). The highest content of 1.44 per cent
was observed when potassium was applied @ 60 kg ha-1
both as basal and in two splits. This signifies that the mode
of application had no significant effect on the content of
lattice potassium. The higher content of potassium may be
attributed to the higher fixing capacity of soil due to presence
of illitic type of clay minerals (Talib and Verma, 1990).
Table 1. Physico-chemical characteristics of soil of theexperimental site
Parameter value
pHw(1:2.5) 6.8
Electrical conductivity (EC dsm-1) 0.14
Organic carbon (g kg-1) 8.8
Available –N (kg ha-1) 285.8
Available-P (kg ha-1) 19.00
Exchangeable –Ca (cmolc kg-1) 14.10
Exchangeable -Mg (cmolc kg-1) 2.92
Cation Exchange Capacity (cmolc kg-1) 19.50
Water soluble potassium 3.02
Exchangeable potassium (ppm) 59.98
Available potassium (ppm) 63.00
1N Boiling HNO3 potassium (%) 0.722
Lattice potassium (%) 1.440
Total potassium (%) 2.162
Table 2. Effect of potassium application on forms of potassium at harvest
K2O applied (Kg ha-1) WS-K(ppm) Exch-K(ppm) Avail-K(ppm) I N HNO3-K(%) Lattice-K(%) Total-K(%)
0 (Control) 2.85 47.15 50.00 0.716 1.438 2.154
20 (Basal) 2.94 52.06 55.00 0.718 1.439 2.156
40 (Basal) 3.05 56.45 59.50 0.719 1.439 2.159
60 (Basal) 3.15 60.35 63.50 0.721 1.440 2.161
80 (Basal) 3.22 62.28 65.50 0.723 1.440 2.162
20 (Split) 3.00 53.00 56.00 0.719 1.438 2.157
40 (split) 3.07 56.93 60.00 0.720 1.439 2.159
60 (Split) 3.15 61.35 64.50 0.722 1.440 2.162
80 (split) 3.25 62.80 66.00 0.723 1.440 2.163
LSD at 5% 0.086 0.568 0.048 2.640 0.001 0.002
Split :-1/2 basal + 1/2 at tillering stage
Forms and Quantity - Intensity Parameters of Potassium in Wheat

100
Quantity- Intensity Parameters
The activity ratio of potassium (ARok) labile K (KL) non -
specific or coarsely bound K(Ko) and specifically bound K(Kx)
increased with increasing levels of potassium (Table 3).The higher value of ARo
k, KL, Ko and Kx were observed whenpotassium was applied @ 80 kg ha-1. This indicates that the
soil has higher K ion strength in comparison to Ca and Mgin soil solution. The immediate availability of K will be morein this treatment as compared to other treatments. Higher
value of ARok showed that these were having enough K so
as to maintain the intensity value. Higher Kx indicates higherexchange surface offering a specific binding for K and not
for Ca and Mg. This might be due to the higher amount ofillitic clay. Lower ARo
k and KL, KO, Kx values might be due totheir higher cation retention power which implies that only a
small amount of K would remain in soil. Similar results
Table 4. Correlation coefficient between physico-chemical characteristics and forms of potassium
pH Ec OC Ca2+ Mg2+
Ws-K -0.200 -0.268 0.671** 0.901 0.944**
Exch-K -0.127 -0.215 0.661** 0.934 0.942**
Avail-k -0.128 -0.216 0.662** 0.933 0.943**
An HNO3-K -0.230 0.017 0.210 0.007 0.016
Lattice –K -0.141 -0.253 0.636** 0.860** 0.906**
Total-K -0.096 -0.223 0.633 0.949** 0.946**
* Significant at 5 % ; ** Significant at 1 %
Table 3.Q/I parameters of potassium in soil as influenced by potassium application
K2O applied ARoK(mol L-1) KL KO KX PBCK[meq 100g 1
before sowing 1/2 x 103 (mol L-1) x 103]
(Kg ha-1) Meq 100 g-1
0 (Control) 5.68 0.22 0.09 0.13 23.80
20 (Basal) 5.20 0.24 0.11 0.13 19.36
40 (Basal) 6.71 0.26 0.12 0.14 17.88
60 (Basal) 8.85 0.28 0.13 0.15 15.56
80 (Basal) 8.95 0.30 0.14 0.16 15.64
20 (Split) 5.10 0.21 0.10 0.11 19.60
40 (Split) 6.77 0.25 0.12 0.13 17.72
60 (Split) 7.95 0.26 0.12 0.14 15.09
80 (Split) 8.97 0.29 0.13 0.16 14.49
Table 5. Correlation coefficient between physico-chemical characteristics and Q/I parameters of potassium
pH Ec OC Ca2+ Mg2+
ARek -0.196 -0.292 0.626** 0.907** 0.956**
KL -0.407 -0.442 0.465 0.784** 0.915**
Ko -0.377 -0.320 0.565* 0.799** 0.893**
KX -0.401 -0.522* 0.328 0.703** 0.858**
PBCk -0.009 -0.097 0.657** -0.926** -0.906**
* Significant at 5 %; **Significant at 1 %
were reported by Amrutsagar and Sonar (2000). It was furtherobserved that higher PBCk value were noticed when
potassium was applied at lower rates, while lower PBCk athigher rates or PBCk decreased with increasing level of K(Table 3). This might be attributed to more depletion of
potassium (Niranjana et al., 2000).
All forms of potassium were significantly and positivelycorrelated with OC, Ca , Mg respectively, except I N boiling
HNO3- K. A non-significant and negative correlation of pHand EC was observed with all forms of potassium. Therelationship between different Q/I parameters and soil
properties reveled that OC, Ca and Mg were significantly,and positively correlated with all Q/I parameters except PBCk
which showed negative and significant correlation (Table
5). The similar trend was observed by Patiram (1991) andRoy et al. (1991), while studying the correlations between
J.A Wani, M.A.Malik, M.A. Dar, Farida-Akhter and M.A. Bhat
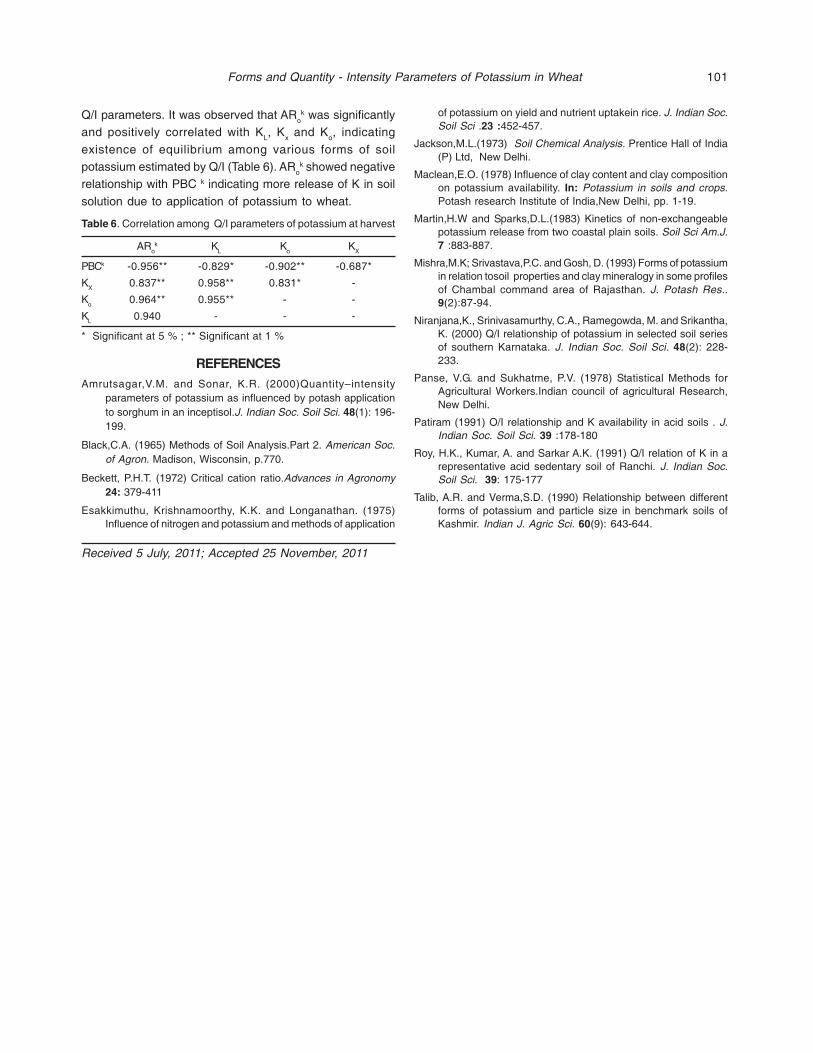
101
Q/I parameters. It was observed that ARok was significantly
and positively correlated with KL, Kx and Ko, indicating
existence of equilibrium among various forms of soilpotassium estimated by Q/I (Table 6). ARo
k showed negativerelationship with PBC k indicating more release of K in soil
solution due to application of potassium to wheat.
Table 6. Correlation among Q/I parameters of potassium at harvest
ARok KL Ko KX
PBCk -0.956** -0.829* -0.902** -0.687*
KX 0.837** 0.958** 0.831* -
Ko 0.964** 0.955** - -
KL 0.940 - - -
* Significant at 5 % ; ** Significant at 1 %
REFERENCESAmrutsagar,V.M. and Sonar, K.R. (2000)Quantity–intensity
parameters of potassium as influenced by potash applicationto sorghum in an inceptisol.J. Indian Soc. Soil Sci. 48(1): 196-199.
Black,C.A. (1965) Methods of Soil Analysis.Part 2. American Soc.of Agron. Madison, Wisconsin, p.770.
Beckett, P.H.T. (1972) Critical cation ratio.Advances in Agronomy24: 379-411
Esakkimuthu, Krishnamoorthy, K.K. and Longanathan. (1975)Influence of nitrogen and potassium and methods of application
of potassium on yield and nutrient uptakein rice. J. Indian Soc.Soil Sci .23 :452-457.
Jackson,M.L.(1973) Soil Chemical Analysis. Prentice Hall of India(P) Ltd, New Delhi.
Maclean,E.O. (1978) Influence of clay content and clay compositionon potassium availability. In: Potassium in soils and crops.Potash research Institute of India,New Delhi, pp. 1-19.
Martin,H.W and Sparks,D.L.(1983) Kinetics of non-exchangeablepotassium release from two coastal plain soils. Soil Sci Am.J.7 :883-887.
Mishra,M.K; Srivastava,P.C. and Gosh, D. (1993) Forms of potassiumin relation tosoil properties and clay mineralogy in some profilesof Chambal command area of Rajasthan. J. Potash Res..9(2):87-94.
Niranjana,K., Srinivasamurthy, C.A., Ramegowda, M. and Srikantha,K. (2000) Q/I relationship of potassium in selected soil seriesof southern Karnataka. J. Indian Soc. Soil Sci. 48(2): 228-233.
Panse, V.G. and Sukhatme, P.V. (1978) Statistical Methods forAgricultural Workers.Indian council of agricultural Research,New Delhi.
Patiram (1991) O/I relationship and K availability in acid soils . J.Indian Soc. Soil Sci. 39 :178-180
Roy, H.K., Kumar, A. and Sarkar A.K. (1991) Q/I relation of K in arepresentative acid sedentary soil of Ranchi. J. Indian Soc.Soil Sci. 39: 175-177
Talib, A.R. and Verma,S.D. (1990) Relationship between differentforms of potassium and particle size in benchmark soils ofKashmir. Indian J. Agric Sci. 60(9): 643-644.
Received 5 July, 2011; Accepted 25 November, 2011
Forms and Quantity - Intensity Parameters of Potassium in Wheat

Since early 1950’s India has invested more than Rs.
170 billions (US $ 3.5 billions) on watershed developmentprogrammes (WSP) covering more than 45 million ha area,and in the recent years the annual expenditure on these
programmes have exceeded Rs. 10 billion which reflectsthe priority and faith of Indian Government on WDP’s forimprovement of natural resources (Reddy et al., 2007).
Although these WDP’s have resulted in increasing croppingintensity, changing cropping patterns, increasing productivityof crops, augmenting underground recharge of water and
increasing family incomes and employment opportunitiesin some areas but these improvements were short livedand WDP’s failed to generate sustainability of these
improvements. Further more, despite the long history ofWDP’s, there are no systematic and large scale impactassessment studies on their performance as there is lack
of proper indicators and evaluation methods to assess theoverall impact of these programmes (Anon., 2001).
However, the National Wasteland Development Board
(NWDB) in collaboration with National Remote SensingAgency, Hyderabad (NRSA) identified 147 different districtsspread over different agro-climatic zones of the country,
having more than 17 per cent area under wastelands. Suchwastelands possess great potential of mitigating thebiomass requirement of the people living in these areas, if
put to optimal and judicious use. The Udhampur District ofJ&K was one of such district and therefore a WDP forChenani watershed (Udhampur District) was formulated
by Forest Department, Government of Jammu and Kashmirduring the year 1990 and was started as a centrallysponsored scheme with the help of NWDB, in 1992. The
Chenani WDP was executed in 3300 ha, with financial
Evaluating Impact of Watershed Development Programme on LandResources in Shiwalik Hills of J&K
Narinder Deep SinghFaculty of Agriculture, Khalsa College, Amritsar - 143 001, India
E-mail: [email protected]
Abstract: The present study was undertaken for estimating the impact of Chenani watershed development programme in Udhampurdistrict of Jammu and Kashmir state, in terms of resource availability during 2005-08. A combination of both the conventional and advancedtechniques like field visits and satellite images were used for data collection to estimate parameters like change in land use/cover pattern,production capacity of land resources and soil erosion level, for impact assessment of watershed developed programme (WDP). Thestudy showed no significant improvement in the quality of land resources production capacity and soil erosion level in the project area thannon project area. Hence, the analysis showed poor ecological viability of WDP due to poor implementation of the programme.
Key Words: Watershed, Carrying capacity, Quantitative/Qualitative approach, Discount rate
implication of Rs. 22.95 millions from the year 1992 to 1997,
with the objectives to arrest the problem of soil erosion ofthe catchment area, rehabilitate the natural forests, afforest/reforest the agricultural, forestry and other cultivable areas
with the green cover to provide fuelwood, fodder, grassesand fiber and update the local ecology and environment ofthe catchments area of Chenani by adopting various
corrective and development measures.
The WDP was claimed to be quite successful by theproject implementing agency, as it has helped in improving
the condition and availability of natural resourcesconsiderably in the study area (Anon., 1997). The presentstudy was undertaken for assessing the impact of this
particular WDP in terms of resource conditions andavailability. As some other WDP’s are ongoing in Udhampurdistrict, therefore lessons learnt from this study could be
very helpful in making ongoing WDP’s more effective,efficient and sustainable. The present study was undertakenduring the year 2005-08 with following specific objectives
to develop indicators for estimation of impact of WDP onresource condition and availability in the study area andevaluate the impact of watershed development programme
on natural resources.
MATERIAL AND METHODS
In the present study to assess the impact of WDP interms of land use pattern and soil erosion level, so as to
compare the extent of difference WDP has made in thearea regarding natural resources condition and availabilityin Project Area (PA) where WDP was implemented as
compared to area where no WDP was implemented i.e.,Non Project Areas (NPA).
Indian J. Ecol. (2012) 39(1) : 102-107Indian Journal
of Ecology

103
Preliminary related information was collected from theoffices of Revenue Department, Forest Department, District
Statistical Department, Department of Water Resources,Department of Animal Husbandry and Directorate of SoilConservation, Government of Jammu and Kashmir. The
secondary data included information regarding area,number of villages, land use pattern, land holdings, numberof households, human and animal population, availability
of fuel wood, fodder and other by products of naturalresources in the study area (PA and NPA separately), pastureand wastelands development in the area. Information
regarding WDP’s activities undertaken like details ofplantations, formation of enclosures, fencing erected,grasses and legumes sown, soil and water conservation
methods adopted, assets created and costs incurred onthese activities were also collected from forest department.Primary data was collected by using conventional method
i.e., personal questionnaire method, where information wascollected from 300 households i.e., 150 each from PA andNPA each, regarding production of foodgrains and fodder
from agricultural lands, resource condition and availability,benefits of WDP and status of soil erosion. Along with theseconventional data, advanced data using the satellite images
of 1:50,000 scale of the study area for the year 1991 (beforeimplementation of WDP) and year 2001 (after theimplementation of WDP) were procured from National
Remote Sensing Agency (NRSA) Hyderabad. GeographicalInformation System (GIS) was used for extracting informationfrom images like land use/cover pattern, types and
conditions of natural resources, categorization of landresources on the basis of their condition and level of soilerosion were also estimated. These images were also used
for verification of the data, which was collected from variousother sources.
The impact of WDP on indicators like land use pattern,
production capacity of land resources and soil erosion levelin the study area were estimated using simple averages,frequencies and percentages.
Land Use Pattern
In the land use pattern, the land resources werecategorized into forest lands agricultural lands, scrublandsand drainage areas. Each category was further subdivided
into various groups i.e.,
i) Forest lands : These lands were categorized on thebasis of Crown Density (CD) of trees into dense forests
(with CD>40 per cent), moderate forests (CD between10 to 40 per cent) and open/degraded forests (CD<10per cent).
ii) Agricultural lands: These lands were categorized intocultivable and uncultivable lands.
iii) Scrub lands: Areas under wasteland, pasture lands,open lands etc. come under scrub lands. It wascategorized into three sub classes on the basis of
Green Biomass Density (GBD) i.e. dense scrub (withGBD>40 per cent), thin scrub (with GBD between 10 to40 per cent) and degraded scrub (GBD<10 per cent).
Production Capacities
Production capacities in terms of fuelwood, fodder and
food grain production from forest lands, agricultural lands
and scrub lands were estimated, so as to assess the
qualitative change in these resources (if any) due to WDP.
In the first phase productivity level of various categories of
forests and scrub lands were estimated by using sampling
techniques. Five sample plots measuring 20 m x 20 m
were laid in each category of forests (dense, moderate and
open forests) and scrub lands (dense, thin and degraded
scrub) in PA and NPA so as to estimate the annual
production of fuelwood and fodder from these land
resources. The productivity of crops from the agricultural
lands were evaluated from the primary data collected from
PA and NPA.
Level of Soil Erosion
In the present study, extent and magnitude of soilerosion was estimated according to the methodology
adopted by the Directorate of Soil Conservation, Govt. ofJ&K, based on parameters like a) loss of top soil, b) slopeof the area, c) gully erosion, d) land slides and landslips, e)
stream bank erosion, f) land use etc. On these parameters,soil erosion was measured in terms of six erosion intensityclasses (E.I), from E.I class I to E.I – VI indicating intensity of
erosion problem in ascending order.
RESULTS AND DISCUSSION
The following activities were performed during WDPas per official records of implementing agency i.e., forest
department, Government of J&K.
Closure Formation
For natural and artificial regeneration, closures wereformed in forest areas so as to stop all kinds of biotic
interferences. During the project period nearly 3270 ha ofarea were converted into enclosures, with fencing of69,9731 running foot, to check infiltration of humans and
animals so as to save forestlands from encroachment andmisuse (Table 1). Every enclosure in PA had been fenced
Impact of Watershed Development Programme

104
with pre-stressed cement concrete (PCC) poles with fourstrands of barbed wire. In all 61,635 PCC poles and 591
quintals of barbed wire were used for this work.
Soil and Moisture Conservation
For the protection and conservation of soil and water inthe study area various mechanical and vegetative measures
were adopted. Some of the important ones are discussedbelow:
Mechanical measures. The mechanical measures
adopted in the WDP in the PA were:-
i) Formation of DRSM: In order to absorb and slow downthe flow of run off water to reduce soil erosion, 14248
cubic meters of works under dry rubble stone masonry(DRSM) were undertaken.
ii) Construction of stone crates: In order to check the rapid
flow of water, about 106 crates measuring sevenhundred and seventy three (773) cubic metre had beenconstructed (Table 1).
Vegetative measures. Due to high initial cost,continuous maintenance and high level of skill required forthe construction of mechanical structures, vegetative
measures are considered to be best option for conservationof natural resources. Vegetative measures like plantingtrees, grasses, strip cropping, mixed cropping etc, not only
provide protection to land from soil erosion but also help inincreased and continuous production of fodder, fuelwoodand foodgrains throughout the year. Various vegetative
measures adopted under WDP in the PA during the projectperiods are discussed below:
Table 1. Physical works undertaken during project period
Items of work 1992-93 1993-94 1994-95 1995-96 1996-97 Total
Area closed (ha) 510 525 630 1,173 432 3270
Fencing in rft. (four strands) 92450 92097 1,49,704 2,67,108 98,372 699731
DRSM (cu.m) 3098 3501 3320 4252 2150 16521
Plantation of trees (No’s) 2,59,600 1,65,288 4,78,113 1,70,302 1,70,302 12,42,188
Patches Grown
a) Red clover 15000 20,000 75,000 1,00,000 26,000 236000
b) Grasses 8,000 8000
c) Deodar 19,000 19000
Total 15,000 20,000 1,02,000 1,00,000 26,000 2,63,000
Tending of Trees 72,000 72,000
Crates laid
a) Number 106
b) Area (cum) 773
Fuel saving devices (no.) 200 200 - 400 - 800
Source: Forest Department, Government of Jammu and Kashmir, 1997
i) Plantation of trees: To rehabilitate and regenerate thedegraded forests in the PA, various species of fast
growing trees were planted. A total of 12, 42,188 treeswere planted which were raised in nurseries spreadover 2.5 ha of area (Anon., 1997).
ii) Patches grown: To improve the percolation andpermeability of rain water so as to protect the soil fromsplashing and dashing effects of rain, and conserve
moisture in soil, various patches of red clovers, grassesand deodar tree were planted. Seeds of red clover weresown, fodder grasses have been propagated by slips
whereas saplings (tree) were raised in the nurseriesin polythene bags which were used for growing patches(Table 1).
iii) Tending of trees: Nearly 72,000 trees were tended toimprove their growth and development.
Promoting Fuel Saving Devices
For reducing pressure on forests, 800 fuel saving
devices were given to the locals, which include 700smokeless chullah’s, pressure cookers, 2 gobar gasplants, 1 solar light etc. for popularizing the non-
conventional energy sources in the area.
But the authenticity of official records of implementingagency was doubtful, as they were not in accordance with
the situation on ground. Some serious discrepancies wereobserved while critically analyzing the official records of theproject implementing agency, which are discussed below:
The comparison of physical and financial targets andtheir subsequent achievements were made (Table 2) and it
Narinder Deep Singh
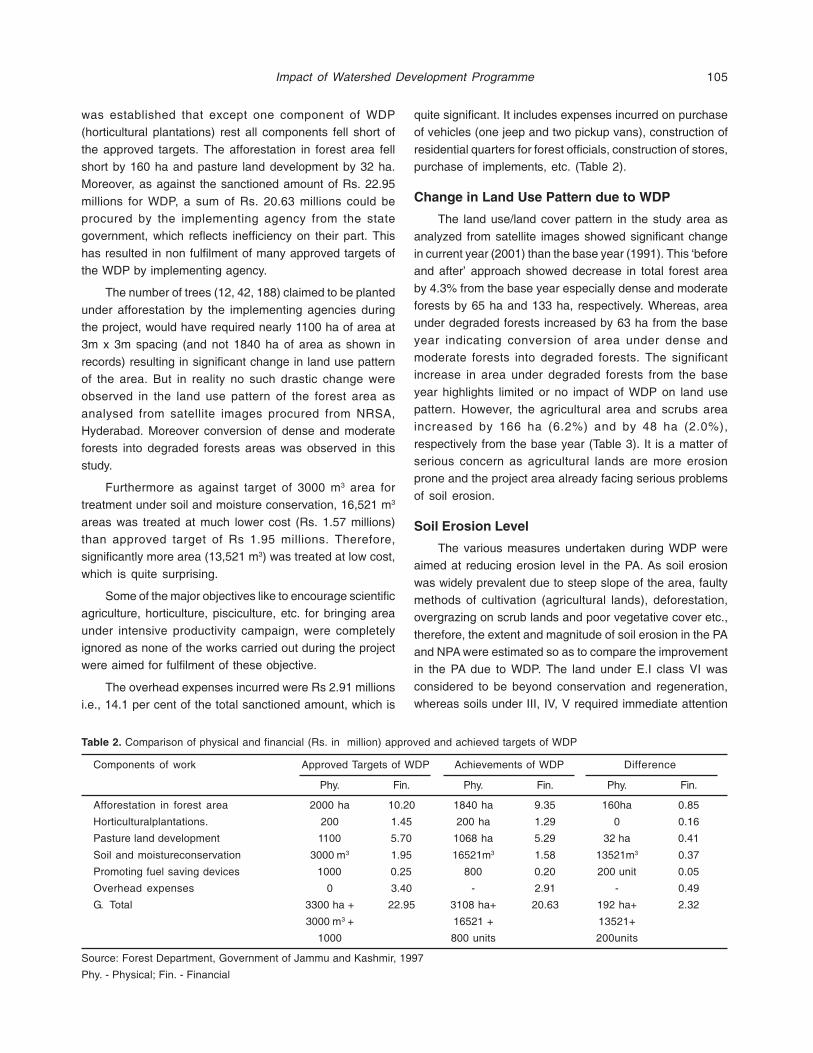
105
was established that except one component of WDP(horticultural plantations) rest all components fell short of
the approved targets. The afforestation in forest area fellshort by 160 ha and pasture land development by 32 ha.Moreover, as against the sanctioned amount of Rs. 22.95
millions for WDP, a sum of Rs. 20.63 millions could beprocured by the implementing agency from the stategovernment, which reflects inefficiency on their part. This
has resulted in non fulfilment of many approved targets ofthe WDP by implementing agency.
The number of trees (12, 42, 188) claimed to be planted
under afforestation by the implementing agencies duringthe project, would have required nearly 1100 ha of area at3m x 3m spacing (and not 1840 ha of area as shown in
records) resulting in significant change in land use patternof the area. But in reality no such drastic change wereobserved in the land use pattern of the forest area as
analysed from satellite images procured from NRSA,Hyderabad. Moreover conversion of dense and moderateforests into degraded forests areas was observed in this
study.
Furthermore as against target of 3000 m3 area fortreatment under soil and moisture conservation, 16,521 m3
areas was treated at much lower cost (Rs. 1.57 millions)than approved target of Rs 1.95 millions. Therefore,significantly more area (13,521 m3) was treated at low cost,
which is quite surprising.
Some of the major objectives like to encourage scientificagriculture, horticulture, pisciculture, etc. for bringing area
under intensive productivity campaign, were completelyignored as none of the works carried out during the projectwere aimed for fulfilment of these objective.
The overhead expenses incurred were Rs 2.91 millionsi.e., 14.1 per cent of the total sanctioned amount, which is
Table 2. Comparison of physical and financial (Rs. in million) approved and achieved targets of WDP
Components of work Approved Targets of WDP Achievements of WDP Difference
Phy. Fin. Phy. Fin. Phy. Fin.
Afforestation in forest area 2000 ha 10.20 1840 ha 9.35 160ha 0.85
Horticulturalplantations. 200 1.45 200 ha 1.29 0 0.16
Pasture land development 1100 5.70 1068 ha 5.29 32 ha 0.41
Soil and moistureconservation 3000 m3 1.95 16521m3 1.58 13521m3 0.37
Promoting fuel saving devices 1000 0.25 800 0.20 200 unit 0.05
Overhead expenses 0 3.40 - 2.91 - 0.49
G. Total 3300 ha + 22.95 3108 ha+ 20.63 192 ha+ 2.32
3000 m3 + 16521 + 13521+
1000 800 units 200units
Source: Forest Department, Government of Jammu and Kashmir, 1997
Phy. - Physical; Fin. - Financial
quite significant. It includes expenses incurred on purchaseof vehicles (one jeep and two pickup vans), construction of
residential quarters for forest officials, construction of stores,purchase of implements, etc. (Table 2).
Change in Land Use Pattern due to WDP
The land use/land cover pattern in the study area as
analyzed from satellite images showed significant changein current year (2001) than the base year (1991). This ‘beforeand after’ approach showed decrease in total forest area
by 4.3% from the base year especially dense and moderateforests by 65 ha and 133 ha, respectively. Whereas, areaunder degraded forests increased by 63 ha from the base
year indicating conversion of area under dense andmoderate forests into degraded forests. The significantincrease in area under degraded forests from the base
year highlights limited or no impact of WDP on land usepattern. However, the agricultural area and scrubs areaincreased by 166 ha (6.2%) and by 48 ha (2.0%),
respectively from the base year (Table 3). It is a matter ofserious concern as agricultural lands are more erosionprone and the project area already facing serious problems
of soil erosion.
Soil Erosion Level
The various measures undertaken during WDP wereaimed at reducing erosion level in the PA. As soil erosion
was widely prevalent due to steep slope of the area, faultymethods of cultivation (agricultural lands), deforestation,overgrazing on scrub lands and poor vegetative cover etc.,
therefore, the extent and magnitude of soil erosion in the PAand NPA were estimated so as to compare the improvementin the PA due to WDP. The land under E.I class VI was
considered to be beyond conservation and regeneration,whereas soils under III, IV, V required immediate attention
Impact of Watershed Development Programme

106
Table 3. Change in land use/ land cover in the project area
Particulars 1991 2001 Change
Forest area 3155 3020 -135 (4.3)
a) Dense forests 1027 962 -65 (6.3)
b) Moderate/open forests 1412 1279 -133 (9.4)
c) Degraded forests 716 779 63 (8.8)
Agricultural area 2658 2824 166 (6.2)
a) Cultivated area 2189 2454 265 (12.1)
b) Uncultivated area 69 370 - 99 (21.1)
Scrub area 2460 2508 - 48 (2.0)
a) Dense scrub 1385 1223 - 162 (11.7)
b) Moderate scrub 948 853 - 95 (10.0)
c) Thin scrub 357 432 75 (21.0)
Drainage system 489 390 - 99 (20.2)
Residential/commercial areas 136 155 19 (13.9)
Total (1+2+3+4+5) 8898 8898 -
Source: Satellite Images NRSA; Figures in parentheses show %age change from the base year
for redemption of soil, so that it could be saved from futuredeterioration and ultimate loss. The soil under E.I classesI and II were having erosion at minimum levels. Nearly 3.8
per cent of the total area in PA and 2.5 per cent in NPA wereunder E.I category VI. The maximum area in both PA as wellas NPA were under E.I category III, IV and V, with 36.2, 25.3and 14 per cent area in PA and 39, 28.2 and 11.4 per cent
in NPA, respectively (Table 4). From comparison of areas ofPA and NPA facing various levels of soil erosion problemsmall difference was observed within the same E.I level of
the respective areas. This signifies limited or no significantimprovement in soil erosion status of PA due to WDP, asdue to high level of siltation in river tawi (because of soil
erosion), the Chenani hydel project still faces manyproblems resulting in reduction in its production capacity.Moreover regular landslides and landslips were reported
during monsoon seasons especially in Samroli area of PA,resulting in closure of NH-1A, which highlights theineffectiveness of measures undertaken during WDP for
controlling erosion problem in the area.
Table 4. Soil erosion level
E.I class PA NPA
I 658 (7.4) 761 (9.3)*
II 975 (11) 630 (7.7)
III 3222 (36.2) 3192 (39)
IV 2252 (25.3) 2309 (28.2)
V 1246 (14) 933 (11.4)
VI 338 (3.8) 204 (2.5)
Nallahs 207 (2.3) 158 (1.9)
Total 8898 (100) 8187 (100)
* Figures in parentheses are in per cent
Production Capacity of Land Resources
The overall comparison of PA and NPA productioncapacities in terms of fuelwood, fodder and food grainssustainably from forest lands, agricultural lands and scrub
lands were estimated, so as to assess the qualitative changein land resources (if any) due to WDP. The study revealedoverall better situation of production capacity of landresources in the NPA than PA. The dense forests were
producing 0.16 quintals ha-1 less fuelwood and 0.42quintals ha-1 less fodder annually in PA than NPA. Similarly,other categories of forest lands (i.e. moderate and degraded
forests) were also producing less fuelwood and fodder inPA than NPA. However, agricultural and scrub lands wereshowing non-significant/no difference in fuelwood
production in PA than NPA. But fodder production from theagricultural and scrub lands showed significant differencei.e., 11.10 quintals ha-1 and 0.48 quintals ha-1, respectively
of PA than NPA. The foodgrain production capacity in NPAwas also found to be better than PA (Table. 5). Hence theanalysis showed no impact of WDP on quality of land
resources production capacity, as it was still less than NPA.
The WDP implemented in Chenani area of Udhampurdistrict, had limited significant impact on natural resource
condition and their availability in view of the exorbitant costof Rs. 20.63 millions incurred. The satellite images andfield visits showed no improvement in vegetative cover and
production capacity of land resources in PA as comparedwith NPA. The study revealed overall better situation ofproduction capacity of land resources in terms of fuelwood,
fodder and food grain production in the NPA than PA. Thesoil erosion problem was quite serious in the PA assignificant PA still comes under danger zone i.e. E.I. IV to VI
Narinder Deep Singh

107
(nearly 42 %). Moreover, problems such as regular closure
of NH-IA due to landslides after rainfalls specially in Samroliarea and siltation problems in Chenani hydel power stationclearly highlights the ineffectiveness of WDP activities in
controlling erosion problem of PA. The study highlighteddecrease in area and tree density in forests, conversion ofdense forests into degraded forests, increase in agricultural
area and aggravated soil erosion problem in the area whichmeans WDP has been ineffective in fulfilling its objectives.
Table 5. Production capacity (quintals ha-1) of land resources in terms of fuelwood, fodder and food grains in the study area
Production capacity PA NPA Difference
(PA-NPA)
A) Fuelwood production
1. Forest area
a) Dense forests 2.50 2.66 - 0.16
b) Moderate forests 1.36 1.67 - 0.31
c) Degraded forests 0.35 0.43 - 0.08
2. Agricultural area 0.57 0.55 0.02
3. Scrub area 0.25 0.25 —
B) Fodder production
1. Forest area
a) Dense forests 1.75 2.17 - 0.42
b) Moderate forests 1.15 1.41 - 0.26
c) Degraded forests 0.70 0.76 - 0.06
2. Agricultural area
a) Dry fodder 4.5 4.6 - 0.01
b) Green fodder 53 62.10 - 11.10
3. Scrub area
a) Dense scrub 2.4 3.2 - 0.08
b) Moderate scrub 1.8 2.28 - 0.48
c) Thin scrub 0.5 0.5 —
C) Food grain production
a) Maize 1.5 1.7 - 0.20
b) Rice 1.6 1.9 - 0.30
c) Wheat 1.3 1.2 0.10
d) Other cereals 0.8 0.7 0.10
e) Pulses 1.1 1.2 - 0.10
REFERENCESAnonymous (1997) Integrated wasteland development project
Chenani watershed Udhampur, Annual report, Forestdepartment, Government of Jammu and Kashmir.
Anonymous (2001) Mid-term Appraisal of Ninth Five Year Plan,Planning Commission, Govt. of India, New Delhi.
Reddy, V.R., Shiferaw, B., Bantilan, M.C.S., Wani, S.P. and Sreedevi,T.K. (2007) Collective action for integrated watershedmanagement in semi arid India: Strategic policy and institutionaloptions, policy brief No. 11, ICRISAT, Hyderabad.
Received 2 February, 2012; Accepted 5 April, 2012
Impact of Watershed Development Programme

In India, rapeseed-mustard is cultivated in about 28
states with a production of 7314.5 thousand tons and
productivity of 1190 kg ha-1 (Anonymous, 2010). India is the
second largest producer of rapeseed-mustard after China
in the world (Kumar, 2008). Among these Brassica species,
Indian mustard (Brassica juncea L. Czern & Coss) occupies
a prominent position and is cultivated under diverse climatic
and agro-ecological conditions in the country. Better ability
of Indian mustard to withstand drought and perform well
under low moisture conditions has led to increase in area
in UK, Canada, USA and Australia by bringing additional
area or replacing area under oilseed rape (Brassica napusL.). There is limited scope for further expansion of area
under oilseeds in the India because of lack of market
infrastructure, mechanization and low yield potential of
oilseed crops but a big leap in productivity of oilseeds is
required to fulfill the minimum daily dietary requirements of
edible oils. The increased production will come from high
yielding hybrids/varieties and improved agronomic
practices. Nitrogen is the most important nutrient required
by plants to perform multiple roles in several metabolic
processes that influence growth, yield and quality of crop.
There is, thus, need to find out optimum nitrogen and row
spacing requirements of promising hybrids of Indian
mustard.
MATERIAL AND METHODS
The field experiment was conducted during winter rabi2009-10 at the Research Farm of Oilseeds Section,
Department of Plant Breeding and Genetics, PunjabAgricultural University, Ludhiana. The soil of the experimentalfield was loamy sand in texture, slightly alkaline, low in
Nitrogen and Spacing Requirements of Promising Hybrids of IndianMustard (Brassica juncea L. Czern & Coss)
Parminder Singh Sandhu*, S.S. Mahal and Virender SardanaDepartment of Agronomy, Punjab Agricultural University, Ludhiana - 141 004, India
*E-mail: [email protected]
Abstract: A field experiment was conducted to evalute nitrogen and spacing requirements of promising hybrids of Indian mustard(Brassica juncea L. Czern & Coss). Two hybrids (PMH 128 and PMH 145) and variety RLC1 (check) were laid in main plots and in sub-plotcombination of nitrogen and row spacing were tested in a split plot design. Among the three nitrogen doses (100 kg ha-1, 125 kg ha-1 and150 kg ha-1),150 kg ha-1 produced highest seed yield (17.09 q ha-1) and among row spacing, 30 cm produced significantly higher yield of17.01 q as compared to 40 cm row spacing. There was increase in plant height, dry matter, PAR interception and chlorophyll content whileharvest index showed non-significant results, with various nitrogen doses.
Key Words: Chlorophyll, Indian mustard, Nitrogen, PAR, Row spacing
organic carbon, low in available nitrogen, medium inphosphorus and potassium. The study was conducted in
three replications in split plot design with 2 hybrids (PMH128 and PMH 145) and 1 variety (RLC 1) as check in mainplot and doses of nitrogen (N100, N125 and N150 kg ha-1) and
row spacing (30 and 45 cm) as sub plot treatments. Nitrogenwas applied in two equal splits first at the time of sowingand second after first irrigation.The sowing was done on
October 28 with plot size of 5 x 4.5 m. Optimum plantpopulation was maintained by thinning and gap filling atabout 3 weeks after sowing by keeping plant to plant spacing
of about 15 cm within rows. Two hoeing were given firstalongwith thinning and second was done at about 40 DAS.Two irrigations, 30 and 50 DAS, whereas, the last irrigation
was applied at 75 DAS. For plant protection measures,package of practices for rabi crops was followed from timeto time
Periodical observations were recorded for plant height,dry matter accumulation, interception of photosyntheticallyactive radiation (PAR) at 35, 70, 105 DAS and at maturity.
Leaf chlorophyll content was recorded before flower initiation,peak flowering and at peak siliquae formation. For plantheight ten plants were selected at random and height of
each plant was measured from the base to the tip of theplant. For dry matter accumulation, three plants wereharvested from 0.5 metre length of the outer row in each
treatment. Chlorophyll content in leaves was determinedusing the procedure of Anderson and Boardmen (1964). Aline quantum sensor (Model LI-191-SA) was used to
measure the amount transmitted PAR in the wavelength of400-700 nm. The incoming and reflected radiationmeasurements were made 1 m above the canopy while
Indian J. Ecol. (2012) 39(1) : 108-111Indian Journal
of Ecology

109
transmitted radiation were recorded as the base canopywith the sensor base just touching the ground. Per cent
interception of PAR by the crop was calculated as:
PAR above the crop–PAR at soil surfacePAR interception (%) = ————————————————— x 100
PAR above the crop
The data regarding days taken to flowering initiation,
50 per cent flowering and completion of flowering wereobserved when at least one fully opened flower appearedin each row, 50 per cent of the total plants in each row had
at least one fully opened flower and at least one fully openedflower appeared on all the plants, respectively. Harvest indexwas calculated as the ratio of seed yield to biomass yield.
RESULTS AND DISCUSSION
Hybrids/Variety. The plant height continued to increase upto maturity and such an increase was almost linear up to105 DAS (Table1). The plant height did not differ significantly
in different cultivars at different DAS. Dry matter accumulationalso showed the same trend except at 105 DAS stage whereRLC 1 (check) accumulated significantly higher dry matter
in pods than PMH 128 and PMH 145, which were statisticallyat par with each other (Table 2). Though leaf chlorophyllcontent in RLC 1 (check) was higher than PMH 128 and
PMH 145 at different growth stages, but it was statisticallysimilar. Hybrids and RLC 1 (check) did not differ significantlyin their ability to intercept PAR at all the growth stages except
at 35 DAS, where fast and vigorous growth of RLC 1 (check)intercepted significantly higher PAR than PMH 145 and PMH128 (Table 3). Significant differences were observed among
hybrids and RLC 1 (check) in attaining differentphenophases viz. flowering initiation, 50 per cent and 100
per cent flowering but days to initiation of senescence andmaturity showed non-significant results. Kumar and Kumar
(2004) reported that different cultivars of Brassica junceatook different number of days for 50 per cent flowering whichdepend upon their genetic constitution. The highest harvest
index was registered in RLC 1 (check) followed by PMH128, and both these registered significantly higher harvestindex than PMH 145 (Table 4).
Doses of nitrogen. Nitrogen doses did not significantly affect
the plant height except at 70 DAS where application of 150
kg ha-1 of N produced highest plant height and it was
statistically at par with 125 kg ha-1 of N but significantly better
than 100 kg ha-1 of N. the similar trend was observed for dry
matter accumulation. Dry matter accumulation by plant at
35 DAS was highest with the application of 150 kg ha-1 of N
and it was statistically at par with 125 kg ha-1 of N application
significantly higher than 100 kg ha-1 of N application.
Similarly, Kumar et al. (1997) reported increase in dry matter
with 150 kg ha-1 of N at all the growth stages compared to
100 and 125 kg ha-1 of N doses
Chlorophyll content before flowering stage showednon-significant differences, whereas, at peak flowering andpeak siliquae formation stage significantly higher
chlorophyll content was obtained with 150 kg ha-1 of Napplication (Table 3). Nitrogen doses showed non-significant results for PAR interception at 35 and 105 DAS
and at maturity stages except at 70 DAS, where highestinterception was obtained in 150 kg ha-1 of N and it wassignificantly better than 100 kg ha-1 of N but it was statistically
at par with 125 kg ha-1 of N application. Application of differentN doses failed to influence 50 per cent and 100 per cent
Table 1. Plant height of Indian mustard as influenced by hybrids, doses of nitrogen and row spacing
Treatment Plant height (cm)
35 DAS 70 DAS 105 DAS At maturity
Hybrids
PMH 128 16.8 90.1 196.7 200.9
PMH 145 16.9 87.2 196.2 201.2
RLC 1 (check) 17.2 88.1 197.7 204.4
CD (0.05) NS NS NS NS
Doses of nitrogen kg ha-1
100 16.5 85.6 192.2 200.9
125 17.3 88.7 197.5 203.3
150 17.2 91.1 200.9 202.3
CD (0.05) NS 4.0 NS NS
Row spacing (cm)
30 17.0 89.4 197.4 202.2
45 16.9 87.6 196.4 202.1
CD (0.05) NS NS NS NS
DAS = Days after sowing
Nitrogen and Spacing Requirements of Mustard Hybrids
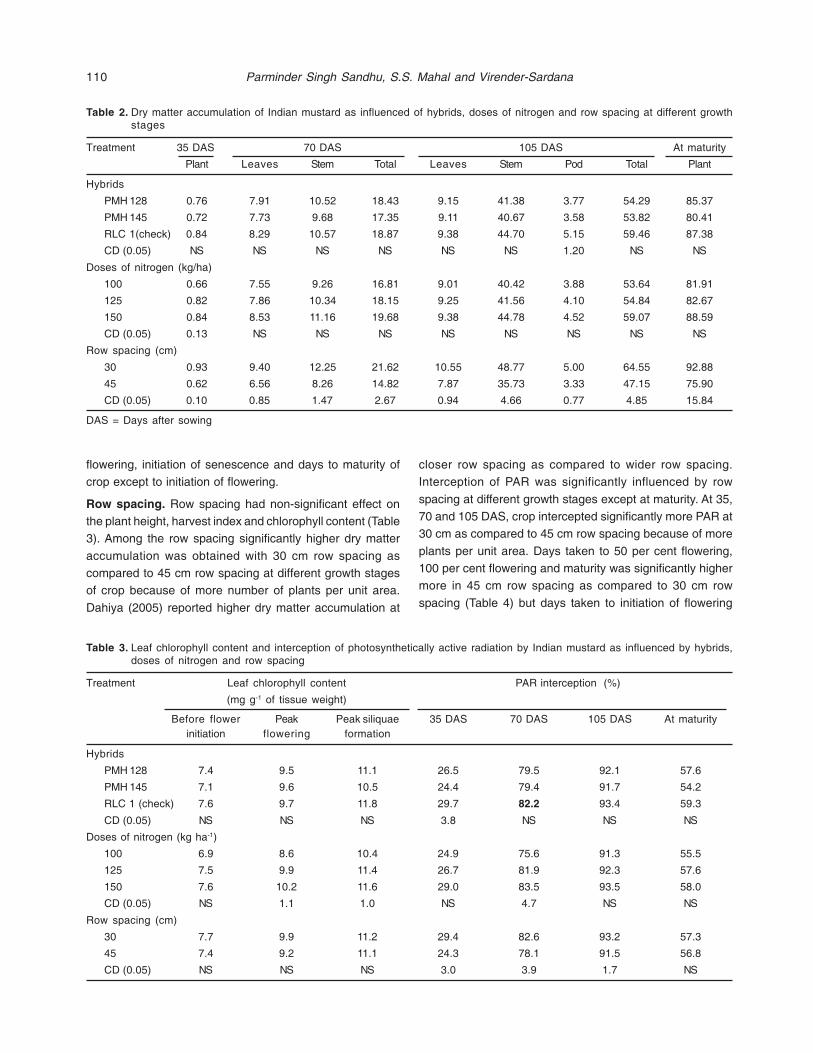
110
flowering, initiation of senescence and days to maturity ofcrop except to initiation of flowering.
Row spacing. Row spacing had non-significant effect onthe plant height, harvest index and chlorophyll content (Table3). Among the row spacing significantly higher dry matter
accumulation was obtained with 30 cm row spacing ascompared to 45 cm row spacing at different growth stagesof crop because of more number of plants per unit area.
Dahiya (2005) reported higher dry matter accumulation at
Table 2. Dry matter accumulation of Indian mustard as influenced of hybrids, doses of nitrogen and row spacing at different growthstages
Treatment 35 DAS 70 DAS 105 DAS At maturity
Plant Leaves Stem Total Leaves Stem Pod Total Plant
Hybrids
PMH 128 0.76 7.91 10.52 18.43 9.15 41.38 3.77 54.29 85.37
PMH 145 0.72 7.73 9.68 17.35 9.11 40.67 3.58 53.82 80.41
RLC 1(check) 0.84 8.29 10.57 18.87 9.38 44.70 5.15 59.46 87.38
CD (0.05) NS NS NS NS NS NS 1.20 NS NS
Doses of nitrogen (kg/ha)
100 0.66 7.55 9.26 16.81 9.01 40.42 3.88 53.64 81.91
125 0.82 7.86 10.34 18.15 9.25 41.56 4.10 54.84 82.67
150 0.84 8.53 11.16 19.68 9.38 44.78 4.52 59.07 88.59
CD (0.05) 0.13 NS NS NS NS NS NS NS NS
Row spacing (cm)
30 0.93 9.40 12.25 21.62 10.55 48.77 5.00 64.55 92.88
45 0.62 6.56 8.26 14.82 7.87 35.73 3.33 47.15 75.90
CD (0.05) 0.10 0.85 1.47 2.67 0.94 4.66 0.77 4.85 15.84
DAS = Days after sowing
Table 3. Leaf chlorophyll content and interception of photosynthetically active radiation by Indian mustard as influenced by hybrids,doses of nitrogen and row spacing
Treatment Leaf chlorophyll content PAR interception (%)
(mg g-1 of tissue weight)
Before flower Peak Peak siliquae 35 DAS 70 DAS 105 DAS At maturityinitiation flowering formation
Hybrids
PMH 128 7.4 9.5 11.1 26.5 79.5 92.1 57.6
PMH 145 7.1 9.6 10.5 24.4 79.4 91.7 54.2
RLC 1 (check) 7.6 9.7 11.8 29.7 82.2 93.4 59.3
CD (0.05) NS NS NS 3.8 NS NS NS
Doses of nitrogen (kg ha-1)
100 6.9 8.6 10.4 24.9 75.6 91.3 55.5
125 7.5 9.9 11.4 26.7 81.9 92.3 57.6
150 7.6 10.2 11.6 29.0 83.5 93.5 58.0
CD (0.05) NS 1.1 1.0 NS 4.7 NS NS
Row spacing (cm)
30 7.7 9.9 11.2 29.4 82.6 93.2 57.3
45 7.4 9.2 11.1 24.3 78.1 91.5 56.8
CD (0.05) NS NS NS 3.0 3.9 1.7 NS
closer row spacing as compared to wider row spacing.Interception of PAR was significantly influenced by row
spacing at different growth stages except at maturity. At 35,70 and 105 DAS, crop intercepted significantly more PAR at30 cm as compared to 45 cm row spacing because of more
plants per unit area. Days taken to 50 per cent flowering,100 per cent flowering and maturity was significantly highermore in 45 cm row spacing as compared to 30 cm row
spacing (Table 4) but days taken to initiation of flowering
Parminder Singh Sandhu, S.S. Mahal and Virender-Sardana

111
Table 4. Days taken for different phenological observations and harvest index of Indian mustard as influenced by hybrids, doses ofnitrogen and row spacing
Treatment Days taken to Harvest
Flowering 50% 100% Initiation of Maturity index (%)
initiation flowering flowering senescence
Hybrids
PMH 128 56.2 69.4 83.4 118.9 146.0 21.0
PMH 145 58.6 74.7 88.5 121.6 146.7 18.9
RLC 1(check) 57.3 72.6 87.1 121.6 146.2 22.3
CD(0.05) 1.4 2.5 3.3 NS NS 2.1
Doses of nitrogen (kg ha-1)
100 56.8 72.0 85.3 119.9 146.2 20.7
125 57.6 72.2 86.3 120.9 146.3 20.8
150 57.8 72.6 87.3 121.2 146.4 20.8
CD(0.05) 0.8 NS NS NS NS NS
Row spacing (cm)
30 57.1 71.0 85.1 120.4 146.1 20.8
45 57.6 73.5 87.6 121.0 146.5 20.7
CD(0.05) NS 1.5 1.3 NS 0.3 NS
and initiation of senescence at different row spacing showed
non-significant results.
The study revealed that hybrids PMH 128 and PMH 145and variety RLC 1(check) did not differ significantly regardingplant height, dry matter, leaf chlorophyll content and harvest
index while RLC 1 (check) intercepted more PAR ascompared to hybrids. Nitrogen dose of 125 kg ha-1 wasfound optimum for hybrids and RLC 1 (check) variety.
REFERENCESAnonymous (2010) http: www.indiastat.com
Anderson, J.M. and Boardman, N.K. (1964) Studies on greening ofdark brown bean plants VI. Development of photochemicalactivity. Aust. J. Bot. 17: 93-144
Dahiya R (2005) Effect of time of transplanting and inter-rowspacing on nitrogen and phosphorous in Canola (Brassicanapus L.). M.Sc Thesis, Punjab Agricultural University,Ludhiana, India.
Kumar, A. (2008) Rapeseed-mustard in India: Current status andfuture prospects. In: Kumar, A., Chauhan, J.S. andChattopadhayay, C. (Eds.) Sustainable production of oilseeds:Rapeseed-Mustard technology. Agrotech Publishing Academy,Udaipur, pp: 39-52.
Kumar, A. and Kumar, S. (2008) Crop growth rate and developmentalcharacteristics of Indian mustard var Vardan to varying levelsof nitrogen and sulphur. Indian J. Agric. Sci. 42: 112-115.
Kumar, S., Singh, J. and Dhingra, K.K. (1997) Leaf area in relationshipwith solar radiation interception and yield of Indian mustard(Brassica juncea) as influenced by plant population andnitrogen. Indian J. Agron 42: 348-351
Received 4 April, 2011; Accepted 12 January, 2012
Nitrogen and Spacing Requirements of Mustard Hybrids

Intercropping is an important way of increasing
production without much increase in the use of inputs. It
gives greater stability in yield during aberrant weather
conditions and epidemics of disease and pest, which is of
considerable importance to subsistent farmers (Tomar etal., 1997). Many reports have clearly advocated the possibility
of growing potato, gram, mustard, sunflower, peas, linseed,
etc. as intercrop in wheat (Triticum aestivum L.). Mentha
(Mentha arvensis Linn.) is also one such crop, which needs
to be tested as intercrop with wheat for higher returns and
crop diversification.
Method of planting plays an important role in the
emergence and establishment of crop seedlings besides
affecting soil aeration, temperature, root development, water
use and solar radiation. Flat planting is the common practice
of raising wheat but bed planting is also gaining popularity
due to water saving and higher water use efficiency (Pal,
2003). In an intercropping situation where two or more crops
are associated, their fertilizer requirement may vary widely
and hence, fertilization becomes more complex (Singh etal., 1996). In wheat-mentha intercropping system, whole of
nitrogen to wheat is applied within one month of sowing
and to mentha, half nitrogen is applied at the time of planting
in the mid season of wheat, and remaining half nitrogen is
top dressed after harvesting of wheat crop. So, there is a
possibility that mentha crop may use the residual nitrogenapplied to wheat and suitable dose for intercropping systemare to be evaluated through this study. Considering these
Studies on Growth, Yield and Yield Attributes of Wheat-MenthaIntercropping System in Relation to Planting Methods and Nitrogen
Levels
Sumedh Chopra*, Jaspal Singh1 and Satpal SinghFASS, PAU, Gurdaspur, 1Khalsa College of Veterinary & Animal Sciences, Amritsar
*E-mail: [email protected]
Abstract: A field experiment was conducted during winter to summer seasons of 2006-07 and 2007-08 at Gurdaspur (Punjab) on siltyclay loam soil to assess the response of intercropping of wheat and mentha to planting methods and nitrogen levels. The experiment waslaid out in randomized block design having two planting methods viz. two rows of wheat (November sown) with 20 cm row spacing andtwo rows of mentha (February sown) on outer side of wheat rows under flat and bed (37.5 cm top + 30 cm furrow) method covering atotal width of 67.5 cm and five levels of nitrogen i.e., 0+0, 90+75, 120+75, 150+75 and 180+75 kg N ha-1 to wheat and mentha, respectively.Bed was significantly higher over flat in yield attributes and grain yield of wheat. Interaction on grain yield of wheat showed the responseof flat and bed to 150 and 120 Kg N ha-1, respectively. Both the planting methods were on par in growth, herbage and essential oil yield ofmentha during 2006-07 but bed was significantly higher over flat during 2007-08 due to higher rainfall. Bed planting gave significantlyhigher wheat grain equivalent yield of intercropping system over flat and it increased significantly upto 120 + 75 Kg N ha-1 for wheat andmentha.
Key Words: Wheat-mentha intercropping, Planting method, Flat bed, Nitrogen
facts, a two year study was conducted to assess theresponse of intercropping of wheat and mentha in the flatand bed planting methods with various rates of nitrogen
application.
MATERIAL AND METHODS
A field experiment was conducted during winter (rabi)to summer seasons of 2006-07 and 2007-08 at Village
Dalla of district Gurdaspur in Punjab. The soil having pH of7.9 was high in organic carbon, low in available nitrogenand high in available phosphorus and potassium with silty
clay loam texture.
The treatments comprising of two planting methodsand five levels of nitrogen were tested in randomized block
design with three replications. Two rows of wheat (W) with20 cm spacing and two rows of mentha (M) on outer sidesof wheat rows (2:2) were sown under flat planting (FP) and
bed planting (BP) covering a total width of 67.5 cm anddesignated as FP-W+M (2:2) 67.5 cm and BP-W+M (2:2)67.5 cm, respectively. Five levels of nitrogen i.e. 0+0 (control),
90+75, 120+75, 150+75 and 180+75 kg N ha-1 to wheat andmentha, respectively, were abbreviated as WN0+MN0,WN90+MN75, WN120+MN75, WN150+MN75, WN180+MN75 in
similar order.
The wheat variety ‘PBW 502’ was sown on November3 and 5 during 2006-07 and 2007-08, respectively, using
75 kg seed ha-1. In a single operation, with the help of bedmaker-cum-planter, the raised beds of 67.5 cm were
Indian J. Ecol. (2012) 39(1) : 112-117Indian Journal
of Ecology

113
prepared by keeping 37.5 cm as the top of the bed withfurrows of 30 cm and two rows of wheat were drilled at 20
cm spacing on the top of the 37.5 cm raised beds. Irrigationwater was applied in the furrows between the beds andwater was not allowed to reach at the top of the bed by
applying 5 cm irrigation on the plot area basis. Bed sownrow arrangements were exactly followed in the flat situationand crop was sown in solid rows with the help of seed drill
and irrigated with 7.5 cm of depth.
Planting of mentha variety ‘kosi’ was done on February,7 and 10 during 2006-07 and 2007-08, respectively. In bed
planting, two rows of mentha were planted on the bed-topon both sides of wheat rows. In flat situation, similar rowpattern was followed. The wheat and mentha were
harvested manually on April 13 and June 26 during 2006-07 and on April 19 and July 10 during 2007-08, respectively.
Nitrogen fertilizer was applied through urea to wheat
and mentha as per treatment. In wheat, half dose of N wasbroadcast just before sowing of wheat and the remaining Nwas top dressed after first irrigation. In mentha crop, half of
the N was applied along the mentha rows at the time ofplanting and remaining half N applied as top dressing afterharvesting of wheat crop. In flat, fertilizer was broadcast
uniformly but in bed treatment it was applied carefully onthe top 37.5 cm width. Recommended dose of phosphoruswas applied to wheat at sowing but its application was
skipped at the time of planting mentha. All the recommendedcultural operations were followed as per packages ofpractices for rabi (Anon., 2006) and kharif crops of Punjab
(Anon., 2007).
The essential oil was distilled at harvest stage from500 g fresh herbage from each treatment with Clevenger’s
apparatus. The per cent essential oil content from fresh
herbage was calculated on v/w basis. Essential oil yieldwas computed by multiplying herbage yield (q ha-1) at harvest
with essential oil content (%) and expressed in litres perhectare (l ha-1). Leaves and stems of 200 g fresh herbagesample from each plot were separated and weighed after
drying first in sun and then in oven. The leaf to stem ratiowas calculated by dividing leaf weight with stem weight.Wheat grain equivalent yield (q ha-1) of the system was
calculated by summing actual grain yield of wheat andessential oil yield of mentha after converting into wheat-equivalent on the basis of prevailing prices. The price of
wheat grain and mentha oil was Rs. 850 q-1 and Rs.490 l-1 during 2006-07 and Rs. 1000 q-1 and Rs. 650 l-1
during 2007-08, respectively.
RESULTS AND DISCUSSION
Effect on Wheat
Growth. The plant height of wheat recorded at harveststage did not differ significantly due to planting methods
(Table 1). The pooled average of two years indicated thatincreasing levels of nitrogen enhanced the plant height ofwheat significantly up to WN120+MN75 and further increase
in N at WN150+MN75, though, increased the plant height butthe differences were non-significant. However, at highestrate of N application (WN180+MN75), plant height wassignificantly higher over WN120+MN75.
The bed planted wheat + mentha was significantlyhigher in dry matter of wheat over flat planting. Increasinglevels of nitrogen increased the dry matter significantly upto
WN150+MN75. A reduction in dry matter was observed as thelevel of nitrogen was increased from N150 to N180. Thedecrease in dry matter at higher rate of nitrogen at
WN180+MN75 was due to lodging of the crop which might
Table 1. Effect of planting methods and nitrogen levels on growth, yield attributes and straw yield of wheat at harvest (pooled averageof two years)
Treatments Plant Dry Effective Ear No. of Test Strawheight matter tillers length grains weight yield(cm) (q ha-1) (m-2) (cm) ear -1 (g) (q ha-1)
Planting method
FP-W+M (2:2) 67.5cm 81.5 102.1 272.7 9.38 45.7 38.37 56.1
BP-W+M (2:2) 67.5cm 81.0 117.7 294.2 9.76 48.2 39.30 63.5
CD (5%) NS 3.19 5.03 0.071 0.89 0.384 1.59
Nitrogen (kg ha-1)
WN0+MN0 65.2 58.4 184.3 8.43 39.8 38.22 31.5
WN90+MN75 81.0 110.7 294.7 9.45 46.8 38.99 59.1
WN120+MN75 85.0 123.4 309.0 9.87 49.1 39.39 66.5
WN150+MN75 86.9 129.9 314.3 10.05 49.5 39.12 71.0
WN180+MN75 88.0 127.0 314.9 10.06 49.5 38.45 70.8
CD (5%) 2.11 5.04 7.96 0.112 1.41 0.607 2.51
Wheat-Mentha Intercropping Yield
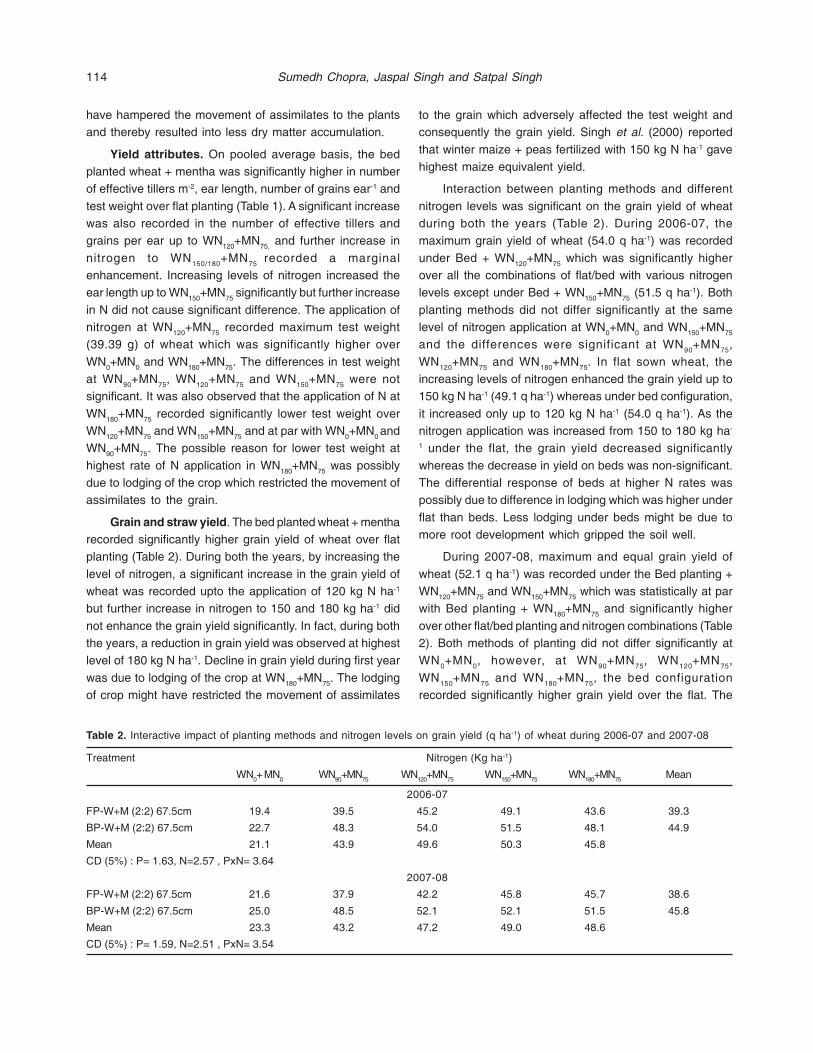
114
have hampered the movement of assimilates to the plantsand thereby resulted into less dry matter accumulation.
Yield attributes. On pooled average basis, the bedplanted wheat + mentha was significantly higher in numberof effective tillers m-2, ear length, number of grains ear-1 and
test weight over flat planting (Table 1). A significant increasewas also recorded in the number of effective tillers andgrains per ear up to WN120+MN75, and further increase in
nitrogen to WN150/180+MN75 recorded a marginalenhancement. Increasing levels of nitrogen increased theear length up to WN150+MN75 significantly but further increase
in N did not cause significant difference. The application ofnitrogen at WN120+MN75 recorded maximum test weight(39.39 g) of wheat which was significantly higher over
WN0+MN0 and WN180+MN75. The differences in test weightat WN90+MN75, WN120+MN75 and WN150+MN75 were notsignificant. It was also observed that the application of N at
WN180+MN75 recorded significantly lower test weight overWN120+MN75 and WN150+MN75 and at par with WN0+MN0 andWN90+MN75. The possible reason for lower test weight at
highest rate of N application in WN180+MN75 was possiblydue to lodging of the crop which restricted the movement ofassimilates to the grain.
Grain and straw yield. The bed planted wheat + mentharecorded significantly higher grain yield of wheat over flatplanting (Table 2). During both the years, by increasing the
level of nitrogen, a significant increase in the grain yield ofwheat was recorded upto the application of 120 kg N ha-1
but further increase in nitrogen to 150 and 180 kg ha-1 did
not enhance the grain yield significantly. In fact, during boththe years, a reduction in grain yield was observed at highestlevel of 180 kg N ha-1. Decline in grain yield during first year
was due to lodging of the crop at WN180+MN75. The lodgingof crop might have restricted the movement of assimilates
to the grain which adversely affected the test weight andconsequently the grain yield. Singh et al. (2000) reported
that winter maize + peas fertilized with 150 kg N ha-1 gavehighest maize equivalent yield.
Interaction between planting methods and different
nitrogen levels was significant on the grain yield of wheatduring both the years (Table 2). During 2006-07, themaximum grain yield of wheat (54.0 q ha-1) was recorded
under Bed + WN120+MN75 which was significantly higherover all the combinations of flat/bed with various nitrogenlevels except under Bed + WN150+MN75 (51.5 q ha-1). Both
planting methods did not differ significantly at the samelevel of nitrogen application at WN0+MN0 and WN150+MN75
and the differences were significant at WN90+MN75,
WN120+MN75 and WN180+MN75. In flat sown wheat, theincreasing levels of nitrogen enhanced the grain yield up to150 kg N ha-1 (49.1 q ha-1) whereas under bed configuration,
it increased only up to 120 kg N ha-1 (54.0 q ha-1). As thenitrogen application was increased from 150 to 180 kg ha-
1 under the flat, the grain yield decreased significantly
whereas the decrease in yield on beds was non-significant.The differential response of beds at higher N rates waspossibly due to difference in lodging which was higher under
flat than beds. Less lodging under beds might be due tomore root development which gripped the soil well.
During 2007-08, maximum and equal grain yield of
wheat (52.1 q ha-1) was recorded under the Bed planting +WN120+MN75 and WN150+MN75 which was statistically at parwith Bed planting + WN180+MN75 and significantly higher
over other flat/bed planting and nitrogen combinations (Table2). Both methods of planting did not differ significantly atWN0+MN0, however, at WN90+MN75, WN120+MN75,
WN150+MN75 and WN180+MN75, the bed configurationrecorded significantly higher grain yield over the flat. The
Table 2. Interactive impact of planting methods and nitrogen levels on grain yield (q ha-1) of wheat during 2006-07 and 2007-08
Treatment Nitrogen (Kg ha-1)
WN0+ MN0 WN90+MN75 WN120+MN75 WN150+MN75 WN180+MN75 Mean
2006-07
FP-W+M (2:2) 67.5cm 19.4 39.5 45.2 49.1 43.6 39.3
BP-W+M (2:2) 67.5cm 22.7 48.3 54.0 51.5 48.1 44.9
Mean 21.1 43.9 49.6 50.3 45.8
CD (5%) : P= 1.63, N=2.57 , PxN= 3.64
2007-08
FP-W+M (2:2) 67.5cm 21.6 37.9 42.2 45.8 45.7 38.6
BP-W+M (2:2) 67.5cm 25.0 48.5 52.1 52.1 51.5 45.8
Mean 23.3 43.2 47.2 49.0 48.6
CD (5%) : P= 1.59, N=2.51 , PxN= 3.54
Sumedh Chopra, Jaspal Singh and Satpal Singh

115
flat recorded significantly higher grain yield of wheat up to150 kg N ha-1 (45.8 q ha-1) whereas the bed responded
significantly only up to 120 kg N ha-1 (52.1 q ha-1).
During both the years, significantly higher grain yieldunder bed planting with less nitrogen was due to better
nitrogen utilization on beds. As the application of nitrogenon beds was restricted to top bed area (37.5 cm) only andthe remaining area under furrow (30 cm) was not applied
with nitrogen. Effect of better utilization of N under bedsituation was very clear on the growth and yield componentsand the cumulative impact might have resulted into the
interaction between planting methods and nitrogen levels.Bed planting in wheat reduced the soil applied nitrogenlosses by reducing leaching and gas emission (Sayre and
Moreno 1997) and recorded higher grain yield due toincreased N fertilizer efficiency (Khan et al., 1987).
The bed planted wheat + mentha recorded significantly
higher straw yield of wheat over flat planting (Table 1). Thetwo year pooled data showed that increasing rates ofnitrogen application increased the straw yield of wheat up
to WN150+MN75 and decreased marginally at WN180+MN75.
Effect on Mentha
Growth. During 2006-07, higher plant height, dry matteraccumulation, number of stools m-2 and leaf: stem ratio of
mentha were recorded under flat planted wheat + menthaover bed planted wheat + mentha, but the differences werenot significant (Table 3). The higher values of growth
parameters were possibly due to availability of proper soilmoisture under the flat and moisture stress on the beds.During 2007-08 at harvest stage, the plant height, dry matter
accumulation, number of stools m-2 and leaf: stem ratiounder the bed planted wheat + mentha were significantlyhigher over flat planted wheat + mentha. The significantly
higher values of growth parameters under bed sownsituation during 2007-08 were due to high rainfall of 353.7
mm between 120 days after planting to harvest stage inthis year. Higher rainfall between 120 DAS to harvest stagehad a negative effect on growth of mentha due to
submergence of the crop under the flat bed while it benefitedthe bed sown treatments possibly due to availability ofoptimum soil moisture content.
During both the years, all the levels of N application atN90/N120/N150/N180 to wheat + N75 to mentha were on par inthe plant height, dry matter accumulation and number of
stools m-2 of mentha but these levels were significantlyhigher over the control (WN0+MN0). But, leaf: stem ratio washigher under the control possibly due to less shedding of
leaves whereas N fertilized treatments recorded vigorousgrowth which caused mutual shading of lower leavescausing early senescence and shedding. Kothari et al.(1996) also reported higher leaf: stem ratio of Japanesemint with no application of N. So, it is very clear that nitrogenapplication to wheat crop did not show any carry over
response to all the growth parameters of mentha.
Herbage and essential oil yield and essential oilcontent. During 2006-07, the flat planted wheat + mentha
recorded higher herbage and essential oil yield of menthathan the bed planted wheat + mentha, but the differenceswere not significant (Table 4). Reversely, during 2007-08,
bed planted wheat + mentha gave significantly higherherbage and essential oil yield over flat planted wheat +mentha. Better response on herbage yield under bed was
due to more plant height, dry matter accumulation andnumber of stools m-2 (Table 3), which consequentlyenhanced the essential oil yield. Moreover, the higher
herbage yield of mentha during 2007-08 was due to morerainfall of 353.7 mm between 120 days after planting to
Table 3. Effect of planting methods and nitrogen levels on growth parameters of mentha at harvest
Treatment Plant height (cm) DMA (q ha-1) No. of stools m-2 Leaf: Stem ratio
2006-07 2007-08 2006-07 2007-08 2006-07 2007-08 2006-07 2007-08
Planting Method (P)
FP-W+M (2:2) 67.5cm 75.1 83.8 50.3 54.2 93.1 94.4 0.82 0.98
BP-W+M (2:2) 67.5cm 73.6 88.9 48.1 57.5 90.7 102.1 0.80 1.01
CD (5%) NS 4.39 NS 2.57 NS 3.69 NS 0.017
Nitrogen (Kg ha-1)
WN0+MN0 65.1 75.9 36.1 40.9 73.9 81.6 0.88 1.11
WN90+MN75 77.3 89.4 53.1 59.8 96.7 103.7 0.79 0.98
WN120+MN75 76.4 88.4 52.0 59.1 96.8 103.7 0.79 0.97
WN150+MN75 76.1 88.7 52.2 60.0 94.8 101.4 0.79 0.97
WN180+MN75 76.9 89.3 52.5 59.5 97.4 100.9 0.79 0.97
CD (5%) 5.16 6.94 4.81 4.06 4.81 5.83 0.030 0.027
Wheat-Mentha Intercropping Yield
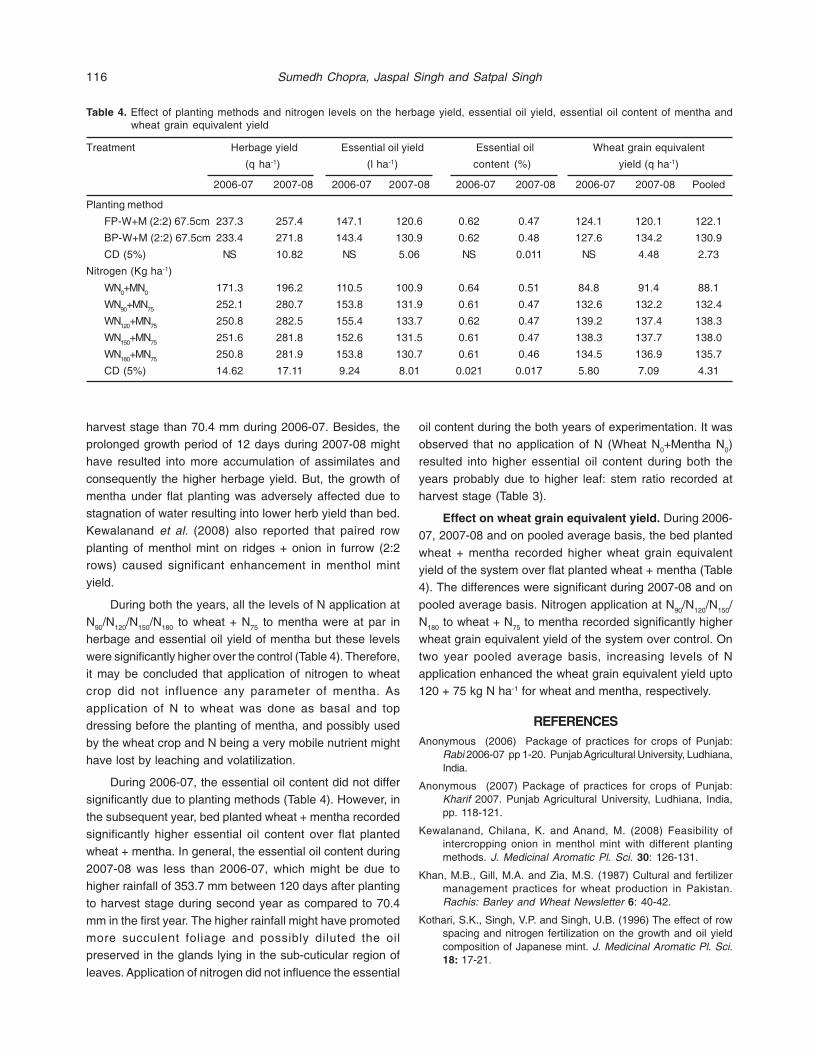
116
Table 4. Effect of planting methods and nitrogen levels on the herbage yield, essential oil yield, essential oil content of mentha andwheat grain equivalent yield
Treatment Herbage yield Essential oil yield Essential oil Wheat grain equivalent
(q ha-1) (l ha-1) content (%) yield (q ha-1)
2006-07 2007-08 2006-07 2007-08 2006-07 2007-08 2006-07 2007-08 Pooled
Planting method
FP-W+M (2:2) 67.5cm 237.3 257.4 147.1 120.6 0.62 0.47 124.1 120.1 122.1
BP-W+M (2:2) 67.5cm 233.4 271.8 143.4 130.9 0.62 0.48 127.6 134.2 130.9
CD (5%) NS 10.82 NS 5.06 NS 0.011 NS 4.48 2.73
Nitrogen (Kg ha-1)
WN0+MN0 171.3 196.2 110.5 100.9 0.64 0.51 84.8 91.4 88.1
WN90+MN75 252.1 280.7 153.8 131.9 0.61 0.47 132.6 132.2 132.4
WN120+MN75 250.8 282.5 155.4 133.7 0.62 0.47 139.2 137.4 138.3
WN150+MN75 251.6 281.8 152.6 131.5 0.61 0.47 138.3 137.7 138.0
WN180+MN75 250.8 281.9 153.8 130.7 0.61 0.46 134.5 136.9 135.7
CD (5%) 14.62 17.11 9.24 8.01 0.021 0.017 5.80 7.09 4.31
harvest stage than 70.4 mm during 2006-07. Besides, theprolonged growth period of 12 days during 2007-08 mighthave resulted into more accumulation of assimilates and
consequently the higher herbage yield. But, the growth ofmentha under flat planting was adversely affected due tostagnation of water resulting into lower herb yield than bed.Kewalanand et al. (2008) also reported that paired row
planting of menthol mint on ridges + onion in furrow (2:2rows) caused significant enhancement in menthol mintyield.
During both the years, all the levels of N application atN90/N120/N150/N180 to wheat + N75 to mentha were at par inherbage and essential oil yield of mentha but these levels
were significantly higher over the control (Table 4). Therefore,it may be concluded that application of nitrogen to wheatcrop did not influence any parameter of mentha. As
application of N to wheat was done as basal and topdressing before the planting of mentha, and possibly usedby the wheat crop and N being a very mobile nutrient might
have lost by leaching and volatilization.
During 2006-07, the essential oil content did not differsignificantly due to planting methods (Table 4). However, in
the subsequent year, bed planted wheat + mentha recordedsignificantly higher essential oil content over flat plantedwheat + mentha. In general, the essential oil content during
2007-08 was less than 2006-07, which might be due tohigher rainfall of 353.7 mm between 120 days after plantingto harvest stage during second year as compared to 70.4
mm in the first year. The higher rainfall might have promotedmore succulent foliage and possibly diluted the oilpreserved in the glands lying in the sub-cuticular region of
leaves. Application of nitrogen did not influence the essential
oil content during the both years of experimentation. It wasobserved that no application of N (Wheat N0+Mentha N0)resulted into higher essential oil content during both the
years probably due to higher leaf: stem ratio recorded atharvest stage (Table 3).
Effect on wheat grain equivalent yield. During 2006-07, 2007-08 and on pooled average basis, the bed planted
wheat + mentha recorded higher wheat grain equivalentyield of the system over flat planted wheat + mentha (Table4). The differences were significant during 2007-08 and on
pooled average basis. Nitrogen application at N90/N120/N150/N180 to wheat + N75 to mentha recorded significantly higherwheat grain equivalent yield of the system over control. On
two year pooled average basis, increasing levels of Napplication enhanced the wheat grain equivalent yield upto120 + 75 kg N ha-1 for wheat and mentha, respectively.
REFERENCESAnonymous (2006) Package of practices for crops of Punjab:
Rabi 2006-07 pp 1-20. Punjab Agricultural University, Ludhiana,India.
Anonymous (2007) Package of practices for crops of Punjab:Kharif 2007. Punjab Agricultural University, Ludhiana, India,pp. 118-121.
Kewalanand, Chilana, K. and Anand, M. (2008) Feasibility ofintercropping onion in menthol mint with different plantingmethods. J. Medicinal Aromatic Pl. Sci. 30: 126-131.
Khan, M.B., Gill, M.A. and Zia, M.S. (1987) Cultural and fertilizermanagement practices for wheat production in Pakistan.Rachis: Barley and Wheat Newsletter 6: 40-42.
Kothari, S.K., Singh, V.P. and Singh, U.B. (1996) The effect of rowspacing and nitrogen fertilization on the growth and oil yieldcomposition of Japanese mint. J. Medicinal Aromatic Pl. Sci.18: 17-21.
Sumedh Chopra, Jaspal Singh and Satpal Singh

117
Pal, M.S. (2003) Future prospects of zero tillage and FIRB plantingsystem in Indian agriculture. Ind. Farmers’ Digest. April-May,26-28.
Sayre, K.D. and Moreno, R.O.H. (1997) Applications of raised bedplanting systems of wheat. Wheat Programme Special ReportNo. 31: Mexico, CIMMYT: 1-31.
Singh, D.P., Rana, N.S. and Singh, R.P. (2000) Production potentialand economics of winter maize based cropping systems. Ann.Agric. Res. 21: 472-476.
Singh, R., Gangasaran, K. and Bandyyopadhay, S.K. (1996) Studieson spatial arrangement and N levels in wheat-gramintercropping system under dry land situation. Ann. Agric.Res. 17: 74-79.
Tomar, S.K., Singh, H.P. and Ahlawat, I.P.S. (1997) Dry matteraccumulation and nitrogen uptake in wheat based intercroppingsystems as affected by N fertilizer. Indian J. Agron. 42: 33-37.
Received 25 October, 2011; Accepted 20 April, 2012
Wheat-Mentha Intercropping Yield

Evaluation of Bt Cotton as an Integral Component of Integrated PestManagement
Vikas Jindal*, Naveen Aggarwal and Vikram SinghDepartment of Entomology, Punjab Agricultural University, Ludhiana-141 004, India
*E-mail: [email protected]
Abstract: Bt cotton hybrid were evaluated as an component of Integrated Pest Management and compared with farmers practice. During2005-06, the Bt hybrid viz., RCH134 with IPM module was compared with BT hybrid with farmers practice (FP), conventional variety (CV)F1861 with IPM module and F1861 with farmers practice (FP). Later in 2006-2007 and 2007-2008, IPM module with Bt (RCH134Bt) wascompared with non Bt version of same hybrid, RCH134 non Bt, with farmers practice. The sucking pests remained almost same in all thetreatments in all years of study. The bollworm incidence is quite low in IPM and FP plots with Bt cotton than in conventional variety (F1861).The results indicated that performance of Bt cotton is better in IPM module than non-Bt hybrid in terms of lower incidence of bollworms,higher yield, gross income and cost benefit ratio. Bt cotton hybrids must be used as an component of IPM module to get the highest returns.
Key Words: Bt Cotton, Cost benefit ratio, Farmers practice, Integrated pest management
Indian J. Ecol. (2012) 39(1) : 118-122Indian Journal
of Ecology
Cotton is an attractive host for several pests and 162
insect pests have been found to be associated with Indian
cotton ecosystem from sowing to harvesting (Dhawan,
2004). Of these, nine are considered as key pests in
different zones. The bollworm complex {american bollworm
Helicoverpa armigera (Hübner), spotted bollworms Eariasinsulana (Boisduval) and E. vitella (Fabricius), pink bollworm
Pectinophora gossypiella (Saunders)} may lead to complete
failure of non Bt cotton crop. For the management of these
pests, research over the last 25 years has generated various
modules of IPM in different regions of the country. IPM
technology has been successfully implemented in rainfed
cotton at “Astha” village in Maharashtra (Singh et al., 2002).
In the present era, Bt cotton has proved quite beneficial for
managing these bollworms and reducing the use of
insecticides. Since the introduction of Bt cotton, its
performance was studied for insect pest incidence and
economics in comparison to non-Bt cotton cultivars. It has
been quite clear from the early studies that Bt cotton is
quite effective against bollworms. However, Fitt (2000)
stated that Bt cotton technology must not be considered as
silver bullets, but should be viewed as a foundation of IPM
systems, including biological and cultural control tactics,
for sustainable crop production. Therefore, taking these
factors in view, the studies were undertaken to evaluate the
performance Bt cotton as an integral component of
integrated pest management module against farmers
practice.
MATERIAL AND METHODS
Field experiments were conducted at Regional Station,Punjab Agricultural University, Faridkot for three years i.e.
Kharif 2005-06 to 2007-08. During 2005-06, the Bt hybridviz., RCH134 with IPM module was compared with Bt hybrid
with farmers practice (FP), conventional variety (CV) F1861with IPM module and F1861 with farmers practice (FP). Laterin 2006-2007 and 2007-2008, IPM module with Bt (RCH134)
was compared with non Bt version of same hybrid, RCH134non Bt, with farmers practice. The crop was grown in plotsmeasuring 30 x 60 m2 following PAU recommendedpractices. The IPM module followed includes first spray of
neem based insecticides against sucking pests, use ofpheromone traps for bollworms, erecting bird perches andeconomic threshold level based spray of insecticides,
however, in farmers practice only regular sprays at 7-10days intervals were given. The observations on incidenceof sucking pests, bollworms and fruiting bodies damage
due to bollworms were recorded from 45 randomly selectedplants from each plot at 15 days interval. The sucking pestsviz., thrips (nymph and adult), whitefly (adult), jassid (nymph)
and aphid (young one and adult) were recorded from 3 topfully opened leaves. The intact fruiting bodies damage andpredators population was recorded on per plant basis. The
boll and locule damage was observed in bolls collectedfrom 15 randomly selected plants from the field. The yieldfrom each plot was noted and the economics of IPM and
farmers practice was worked out. The data were subjectedto ANOVA test and the means were compared using LeastSignificant Differences (P=0.05).
RESULTS AND DISCUSSION
Comparison of Bt and non-Bt Hybrid with IPM andFarmer Practice (FP)
The population of sucking pests viz. jassid, whitefly and

119
Table1. Population of sucking pests in Bt and conventional variety (F1861) under IPM and non-IPM practice during 2005-06
Insect pests IPM-Bt (RCH134) FP-Bt(RCH134) IPM-F 1861 FP-F1861
Thrips / 3 leaves 1.66a 0.60 a 1.09 a 1.58 a
Aphid / 3 leaves 1.97 a 0.86 a 1.58 a 7.11 b
Jassid / 3 leaves 0.96 a 0.98 a 1.33 a 1.21 a
Whitefly / 3 leaves 4.79 a 5.35 a 4.82 a 4.17 a
Means followed by same letter are not significant at P=0.05 level by LSD; FP - Farmer’s Practice
Table 2. Bollworm incidence in Bt and conventional variety (F1861) under IPM and non-IPM practice during 2005-06
Parameters IPM-Bt (RCH134) FP-Bt(RCH134) IPM-F 1861 FP-F1861
Heliothis eggs / plant 0.00a 0.00 a 0.00 a 0.00 a
Heliothis larvae / plant 0.00 0.00 a 0.00 a 0.00 a
Fruiting bodies damage (%) 7.78 a 5.60 a 25.36 c 19.57 b
Boll damage (%) 0.3 a 0.87 a 24.38 c 12.88 b
Locule damage (%) 0.11 a 0.36 a 11.13 c 6.25 b
Means followed by same letter are not significant at P=0.05 level by LSD; FP - Farmer’s Practice
thrips differ non significantly among the three modulestested. The maximum population of thrips, jassid and
whitefly were recorded in IPM-Bt, IPM-CV and FP-Bt,respectively (Table 1). The population of aphid wassignificantly higher on FP-CV than other three modules, but
aphid is considered as minor pest in Punjab and occursporadically, therefore we did not rank modules with respectto aphids. Patil et al. (2004) also recorded the population of
sucking pests more or less same in Bt and non Bt cottonhybrids. However, Bambawale et al. (2004) recorded theincidence of all sucking pests, whiteflies, jassids, thrips
and aphids were statistically higher in non IPM withconventional cotton as compared to IPM with Bt Mech162,non Bt Mech162 and conventional variety. These variations
in results may be due to differences in susceptibility ofdifferent hybrids to sucking pests and different locationspecific modules being followed.
The infestation due to bollworms was significantlydifferent in all the modules. The maximum intact fruitingbodies damage was in IPM-CC followed by FP-CC and it
was minimum in FP-Bt (Table 2). Similar trend wasobserved in open boll and locule damage in all the fourmodules. The results indicated that Bt hybrids with IPM and
FP effectively manage the bollworm complex. The findingscorroborates with those of Patil et al. (2004) who foundsignificant effect of Bt toxin in Bt cotton (Mech 184 Bt) on
bollworms. Bambawale et al. (2004) recorded the minimumdamage in IPM plots with Mech 162Bt followed by IPM withconventional cotton, IPM with non Bt and non IPM with
conventional cotton. The economic threshold level forsucking pests crossed once in all the four modules andthat for bollworms once in BT plot four times in IPM-
conventional variety and 2 times in FP-conventional variety(Table3). Similarly, the quantity of insecticides used was
higher in FP-conventional variety.
The FP-CV required highest plant protection cost ascompared to other modules with minimum in IPM-Bt and
consequently the yield was significantly higher (34.07 and33.84 q ha-1) in IPM-Bt and FP-Bt plot compared to IPM andFP with conventional variety (Table 4). Taking into
consideration the maximum gross income, cost of cultivationand net profit, the cost benefit ratio was highest (2.63) inIPM-Bt plot, followed by FP-Bt, IPM-CV abd FP-CV. The
results clearly indicated that Bt as a component of IPM andwith FP recorded highest yield and net returns thanconventional variety. The present studies have been
supported by Bhosle et al. (2004), Patil et al. (2004) andPrasad et al. (2008). Bambawale et al. (2004) also recordedsignificantly higher yield in IPM with Mech162 Bt followed by
IPM with non Bt Mech162, IPM-CC and on IPM-CC.
Comparison of IPM- Bt with FP-non Bt
During 2005-06, higher seed cotton yield in Bt cotton(RCH134) in IPM plots may be due to higher potential of Bt
cotton hybrid than conventional variety (F1861). Therefore,to confirm the potential of Bt cotton as a component of IPM,the experiments were conducted with RCH134 Bt with IPM
and non Bt version of RCH with farmers practice during2006-07 and 2007-08. The results revealed that theincidence of all the sucking pests was almost similar in
IPM-Bt and FP-non Bt plots (Table 5). The population ofwhitefly remained below economic threshold level duringboth years of study and it did not vary among IPM-Bt and FP-
non Bt plots, although it was higher in FP-non Bt plot. Bhosle
Evaluation of Bt Cotton

120
Table 4. Economics of Bt and conventional variety (F1861) under IPM and non-IPM practice during 2005-06
Parameter IPM-Bt (RCH134) FP-Bt(RCH134) IPM-F 1861 FP-F1861
*Plant protection cost (Rs ha-1) 1616.00 2266.00 2892.00 4641.00
Yield (q ha-1) 34.07 33.87 26.61 27.88
**Gross income (Rs ha-1) 62518.45 62151.45 48829.35 51159.80
***Cost of cultivation (Rs ha-1) 15598.00 15598.00 11925.50 11925.50
Net profit (Rs ha-1) 45304.45 44287.45 34011.85 34593.30
Cost benefit ratio 2.63 2.48 1:2.30 1:2.09
**Rates of different pesticides based on the rate contract by the Store Purchase Organisation, PAU Ludhiana with Pesticides Dealers
*Based on MSP fixed for the medium staple cotton by the Agricultural Costs and Prices Commission, Government of India for 2005-06;
*** Source: Department of Economics, PAU, Ludhiana
Table 3. Economic threshold levels and number of sprays in RCH Bt and F1861 under IPM and non-IPM practice during 2005-06
Parameter IPM-Bt (RCH134) FP-Bt(RCH134) IPM-F 1861 FP-F1861
No. of times ETL crossed 1 1 1 1
for sucking pests
No. of times ETL (larva or % damage) 1 1 4 2
crossed for bollworms
No of sprays 3 4 5 8
Quantity of insecticides used (g a.i. ha-1) 1382.50 2395.00 3257.50 5090.00
Table 5. Population of sucking pests in Bt-IPM and non-Bt farmers plots
Insect pests 2006-07 2007-08 Mean
IPM-Bt(RCH134) FP-Non Bt IPM-Bt(RCH134) FP-Non Bt IPM-Bt(RCH134) FP-Non Bt
Thrips / 3 leaves 0.71a 1.19 a 4.83 a 4.66 a 2.77 a 2.93 a
Aphid / 3 leaves 0.00 a 0.00 a 0.32 a 0.26 a 0.16 a 0.13 a
Jassid / 3 leaves 1.76 a 1.64 a 1.46 a 1.45 a 1.61 a 1.55 a
Whitefly / 3 leaves 3.00 a 3.42 a 5.12 a 5.66 a 4.06 a 4.54 a
Means followed by same letter are not significant at P=0.05 level by LSD; FP - Farmer’s Practice
et al. (2004) in their studies indicated that IPM module withthree different Bt cotton hybrids (Mech 12Bt, Mech 162 Btand Mech 182Bt) have variable population of jassid as
compared to that on FP-non Bt. It was significantly lower inFP-CV than in all the hybrids with IPM after 45DAS and thenonly Mech12 Bt after 60DAS. Similarly, variable results were
reported with different hybrids for thrips. Prasad et al. (2008)reported that sucking insect pest was slightly higher exceptthrips in Bt hybrids (RCH134) as compared to non Bt version
with IPM.
Significantly lower intact fruiting bodies, boll and loculedamage was recorded in IPM-Bt as compared to FP-non Bt
Table 6. The mean fruiting bodies, boll and locule damagewas in IPM-BT cotton than in FP-non Bt. The study clearlyindicated the positive effect of Bt as an component of IPM
module on bollworm infestation. Bhosle et al. (2004)reported comparatively higher damage of bollworms in FP-CV (NHH44) and lower yield than three Bt hybrids with IPM
module. Bambawale et al. (2004) reported the per cent
damage to bolls was statistically lowest in Bt Mech-IPM ascompared to Non IPM-CC. The square and locule damagewas higher in non Bt and Bt (RCH134) under IPM (Prasad
et al., 2008)
The mean number of times when sucking pestscrossed economic threshold level is same (0.50) in both
the years of study in both IPM-BT and FP-non Bt module(Table 7). Bollworm infestation did not crossed ETL in IPM-Bt plots during both the years, while it crossed 2 and 4
times in FP-non Bt plot during 2006-07 and 2007-08,respectively. The mean number of sprays and total quantityof insecticides used was 1.00 and 737.50 g a.i. ha-1 in IPM-
Bt as compared to 7.50 and 3538.25 g a.i. ha-1 in FP-non Bt,respectively (Table 7). Accordingly, the mean plant protectioncost in IPM-Bt plot is quite low (575.48 Rs ha-1) as compared
to FP-non Bt (5105.45 Rs ha-1). Using Bt hybrid and adoptingIPM practices resulted in higher yield (6.61 q ha-1) than usingnon Bt hybrids with farmers practice. The cost of cultivation
was higher in IPM-Bt mainly due to the cost of seed. The net
Vikas Jindal, Naveen Aggarwal and Vikram Singh

121
Table 7. Economic threshold levels and number of sprays in Bt-IPM and non-Bt farmers plots
Parameter 2006-07 2007-08 Mean
IPM-Bt(RCH134) FP-Non Bt IPM-Bt(RCH134) FP-Non Bt IPM-Bt(RCH134) FP-Non Bt
No. of times ETL 0 0 1 1 0.50 0.50crossed for sucking pests
No. of times ETL (larva or 0 2 0 4 0.00 3.00% damage) crossed for bollworms
No of sprays 1 8 1 7 1.00 7.50
Quantity of insecticides 875.00 3040.75 600 4035.75 737.50 3538.25used (g a.i. ha-1)
Table 6. Bollworm incidence in Bt-IPM and non-Bt farmers plots
Parameter 2006-07 2007-08 Mean
IPM-Bt(RCH134) FP-Non Bt IPM-Bt(RCH134) FP-Non Bt IPM-Bt(RCH134) FP-Non Bt
Heliothis eggs / plant 0.00a 0.00 a 0.00 a 0.00 a 0.00 a 0.00 a
Heliothis larvae / plant 0.00 a 0.00 a 0.00 a 0.00 a 0.00 a 0.00 a
Fruiting bodies damage (%) 0.00 a 9.08 b 1.39 a 5.44 b 0.70 a 7.26 b
Boll damage (%) 2.39 a 15.73 b 0.00 a 4.83 b 1.20 a 10.28 b
Locule damage (%) 0.84 a 6.38 b 0.00 a 2.57 b 0.42 a 4.48 b
Means followed by same letter are not significant at P=0.05 level by LSD; FP - Farmer’s Practice
Table 8. Economics of Bt-IPM and non-BT farmers
Parameter 2006-07 2007-08 Mean
IPM-Bt(RCH134) FP-Non Bt IPM-Bt(RCH134) FP-Non Bt IPM-Bt(RCH134) FP-Non Bt
*Plant protection cost (Rs ha-1) 625.95 5008.40 525 5202.50 575.48 5105.45
Yield (q/ha) 21.03 12.19 21.19 16.80 21.11 14.50
**Gross income (Rs ha-1) 38585.27 22371.92 41320.50 32760.00 39952.89 27565.96
***Cost of cultivation (Rs ha-1) 19238.50 13728.50 18588.50 13078.50 18913.50 13403.50
Net profit (Rs ha-1) 18720.82 3635.02 22207.00 14479.00 20463.91 9057.01
Cost benefit ratio 1.94 1.19 2.16 1.79 2.05 1.49
**Rates of different pesticides based on the rate contract by the Store Purchase Organisation, PAU Ludhiana with Pesticides Dealers
*Based on MSP fixed for the medium staple cotton by the Agricultural Costs and Prices Commission, Government of India for 2006-07and 2007-08; *** Source: Department of Economics, PAU, Ludhiana
profit was higher (Rs 20463.91 ha-1) in IPM-Bt plot as
compared to FP-non Bt (Rs 9057.01 ha-1). The cost benefitratio also follow similar trend, higher 2.05 in IPM-Bt ascompared to 1.49 in FP-non Bt. Bambawale et al. (2004)
also recorded higher seed cotton yield, net returns and B: Cratio in IPM-Bt block as compared to non IPM-non Bt. Bhosleet al. (2004) also recorded higher returns in IPM block.
Various studies also showed that Bt cotton hybrids assuperior to non Bt hybrid with respect to yield, net return(Patel et al., 2004).
The experiment during 2005-06 showed that the IPMpractices and Bt cotton hybrids gave better returns thanconventional variety and farmers practice. The further studies
indicated that Bt must be used as component of IPM forharvesting maximum returns. Rao et al. (2007) found nosignificant reduction in plant protection expenditure on
adoption of Bt hybrids without IPM practices, however,
adoption of IPM practices has lead to reduced use ofinsecticides and increased profitability. Therefore it can beconcluded that rather than using Bt hybrids as silver bullets
only these must be used as an component of IPM to harvestmaximum economic benefit to growers and society.
REFERENCESBambawale, O. M., Singh, A., Sharma, O. P., Bhosle, B. B., Lavekar,
R. C., Dhandapani, A., Kanwar, V., Tamhankar, R. K., Rathod,K. S. and Patange, N. R. (2004) Performance of Bt cottonMECH-162 Bt under Integrated Pest Management in farmersparticipatory field trial in Nanded District, Central India. Curr.Sci. 86 : 900-909.
Bhosle, B.B., Rathod, K.S., Patange, N.R. and Adkine, S.J. (2004)Effectiveness of Bt cotton in pest management as an integralcomponent of IPM. In: B.M. Kahdi, H.M. Vamadevaiah, I.S.Katageri, S.N. Chattannavar, S.S. Udikeri and S.B. Patil (Eds)
Evaluation of Bt Cotton

122
International Symposium on “Strategies for SustainableCotton Production – a Global Vision” 3 Crop protection, 23-25 November 2004, UAS, Dharwad, Karnataka, India, pp-155-157.
Dhawan A K. (2004) Insect resistance in cotton : Achievementsand challenges. In : Dhaliwal G S and Singh R (ed) Host PlantResistance to Insects ; Concepts and Applications. PanimaPublishing Corporation, New Delhi, pp 263-314.
Fitt, G.P. (2000) An Australian approach to IPM in cotton: integratingnew technologies to minimise insecticide dependence. CropProt. 19 : 793-800.
Patil, B. V., Bheemanna, M., Hanchinal, S. G., and Kengegowda, N.(2004) Performance and economics of Bt cotton cultivation inirrigated ecosystem. In: B.M. Kahdi, H.M. Vamadevaiah, I.S.Katageri, S.N. Chattannavar, S.S. Udikeri and S.B. Patil (Eds)
International Symposium on “Strategies for SustainableCotton Production – a Global Vision” 3 Crop protection, 23-25 November 2004, UAS, Dharwad, Karnataka, India, pp-139-142.
Prasad N.V.V.S.D. and Rao, N. H. (2008) Field evaluation of Bt cottonhybrids against insect pest complex under rain fed conditions.Indain J. Entomol. 70 (4): 330-336.
Rao, C.A.R., Rao, M.S., Naraiah, P., Malathi, B. and Reddy, Y.V.R.(2007) Profitability of cotton on a pest management continuumin Guntur District of Andhra Pradesh. Agric. Econ. Res. Rev.20: 273-282.
Singh, A., Sharma, A.P., Lavekar, R.C., Bambawale, O.M., Murthy,K.S. and Dhandapani, A. (2002) IPM technology for rainfedcotton. Tech. Bull. 11: 1-36.
Received 12 December, 2011; Accepted 4 May, 2011
Vikas Jindal, Naveen Aggarwal and Vikram Singh
Indian J. Ecol. (2012) 39(1) : 123-130Indian Journal
of Ecology
Rogers (1983,1995 and 2003) recognized five attributesof a technology affecting the adoption, these are relativeadvantage, compatibility, observability, complexity andtrialability, which in turn affect the rate of adoption by 49 to
87 per cent and. Many adoption studies have shown theimportance of these aspects (Fliegel et al., 1967). Theadoption of technology for natural resource management
and conservation, such as soil conservation, integrated pestmanagement (IPM), irrigation management, are consideredapart, from the use of conventional green revolution inputs,
such as high yielding varieties, fertilizers and pesticides(Caswell et al., 2000). In comparison with use of singlemeasure such as pesticides, IPM appears, and often is,
complex, its effect is rarely immediately observable (Dent,1995). The constraints in the adoption have been in termsof appropriateness of technology, economic implications,
availability of appropriate information, acquiring ofknowledge and skills by farmers for applying the IPM intheir fields, dissemination of IPM, vast network of chemical
industry to lure farmers for using pesticides andappropriateness of technology in terms of it being lesscomplex and compatible with the farming system. Due to
complexities of carrying out IPM, it has been difficult forfarmers in carrying out IPM practices like ETL (Godell, 1984,van de Fliert, 1993, Eslanda and Heong, 1994, Matterson etal., 1994, Malone et al., 2004). The compatibility of an IPMpractice also plays role in its adoption. If IPM practice is notcompatible like ‘trash trap’ in maize (Bentley and Andrews,
Farmers Perceived Constraints in the Uptake of Cotton IPM Practices
Rajinder Peshin*, A.K. Dhawan1, Kamaldeep Singh1 and Rakesh SharmaDivision of Agricultural Extension Education, Sher-e-Kashmir University of Agricultural Sciences and Technology of Jammu
1Department of Entomology, Punjab Agricultural University, Ludhiana - 141 001, India*E-mail : [email protected]
Abstract: Adoption and diffusion research in rural sociology, extension education, and agricultural economics is replete with the studiesthat socio-economic variables affect the adoption or rejection of the agricultural technologies. On the basis of these studies, the farmersare categorised in innovators/laggards. But the limited number of studies undertaken to find out the other reasons for adoption/rejectionhave comprehensively concluded that the technological attributes affect the rate of adoption, varying between 49 to 87 per cent. Thestudy evaluation of the insecticide resistance management (IRM) based IPM programme in Punjab was undertaken to find out the outcomesof this programme by employing quasi-experimental non equivalent control group design, and the perceived reasons for non-adoptionexpressed by the 150 IRM trained farmers selected from 15 IRM villages. The constraints in the uptake of IPM practices were: IPMtechnologies not being compatible with the farming system, benefits of the technology not being visible, risk factors and complexityassociated with knowledge intensive practices (software technologies) like ETL. The researchers should re-visit the IPM strategies todevelop farmers compatible less complex IPM practices, and to expand the definition of ecosystem further to include farmers by elicitingtheir knowledge and skills. Extension professionals from the subject matter areas should move from training to education of farmers.Policy makers should take a clear cut stand, whether ecologically viable “integrated pest management” or “integrated pesticide management”is the main plant protection strategy?
Key Words: IRM, IPM, Cotton IPM, Attributes of IPM, Adoption of IPM, Constraints in Uptake of IPM
1991), it is a limitation in its adoption. Economic returns/implications of IPM need to be demonstrated to the farmerso that the farmer learns that even buying information andadvice can be more profitable than buying chemicals
(Lacewell, 1980). Growers perceived that IPM practices aremore risky than conventional pest management (Norris etal., 2003), so the risk associated must be decreased to
make farmers sure of its economic viability.
Dissemination of IPM technology related information
in top-down approach is also a constraint in many
developing countries (Kenmore et al., 1995) and lack of
proper knowledge about different aspects of IPM like agro-
ecosystem analysis and not acquiring required skills for its
use act as barriers (van de Fliert, 1993, Merchant and Teetas,
1994). Vast network of pesticide companies in the
developed and developing world also lured back the IPM
practioners. The pesticide company agents scouting the
farmers’ field and assisting them in making pesticide use
decisions act as a barrier for IPM adoption. Counteracting
forces even in public extension services confuse the farmers
and the lack of commitment of extension agencies to IPM
limit the spread and adoption of IPM (van de Fliert, 1993)
and lack of master trainers act as obstacle in the adoption
of IPM (Matteson et al., 1994).
The constraints for different agricultural systems canvary as in most of the Latin American countries there is nopublic service extension so the farmers are more dependent

124
on agents of chemical industry for information. In the USA,the constraints are in terms of IPM adoption is often more
expensive than conventional pesticide based management,due to increased need for population assessment andrecord keeping, and where it meets economic interest of
growers adoption is high. In developing countriescounteracting approaches, lack of proper dissemination oftechnology in a participatory mode are the barriers in the
adoption of IPM. For different crops also the constraintsdiffer. The lack of knowledge in terms of comprehensionand its applications and lack of skills to use complex
practices are the universal constrains reported in numerousstudies. In this paper, the constraints in the adoption ofselected IPM practices disseminated under the Insecticide
Resistance Management (IRM) programme implementedin the state of Punjab are reported. The study intended toanalyse how the attributes of innovation effect the adoption
of selected IPM practices like timely sowing of cotton crop,adoption of the Punjab Agricultural University (PAU)recommended resistant varieties, seed treatment, use of
ETL for insecticides application and IRM strategy forinsecticide use, and what are the cotton growers perceivedconstraints in the adoption of IPM practices.
MATERIAL AND METHODS
A quasi-experimental design of research was employed
for conducting the evaluation study of the IRM-IPM
programme. A with/without, and before/after design was
applied in villages covered under the IRM-IPM programme
(experimental group-with IRM intervention) and villages not
covered under the IRM-IPM programme (control group-
without IRM intervention) for assessing the benefits of the
IRM-IPM programme. The constraints in the adoption of the
IRM-IPM practices were studied only in the IRM project area.
The constraints were measured as the impediments faced
by the farmers in the adoption of selected IPM practices,
and were measured in terms of percentage of farmers
reporting the constraint in the adoption of a particular
practice.
The study was conducted in three cotton-growing
districts of the State of Punjab: Bathinda, Ferozepur and
Mansa. These districts were selected purposively as they
were being covered under the IRM-IPM programme, and
account for 70 per cent (356,000 out of 509,000 ha) of the
total area under cotton cultivation in Punjab. A sample of
150 farmers from 15 randomly selected villages, where
the IRM-IPM programme was implemented, was selected
for the study (experimental group). From hereon, these
villages will be referred to as ‘IRM villages’, and their farmerswill be referred to as ‘IRM farmers’. The descriptive statistics
of the IRM farmers is given in Table 1. Five cotton IPMpractices namely: timely (April) sowing of cotton crop to
reduce insect pest losses, cultivation of resistant andtransgenic cotton varieties, seed dressing to reduce theimpact of sucking pest upto 60-70days after sowing, use of
economic threshold levels for making pesticide usedecisions and rationalizing the insecticide use based onIRM strategy were selected as indicative of IPM adoption.
The data were collected with the help of semi-structuredinterview schedule.
RESULTS AND DISCUSSION
Constraints in timely sowing of the cotton crop. Along
with cultivation of early maturing resistant varieties, the timeof sowing plays an important role in reducing the pestdamage and pesticide use. The manipulation of sowing
time helps to minimize the buildup of Helicoverpa armigera(ABW) and Bemisia tabaci (whitefly) and timely sowing cropescapes damage from these pests (Dhawan, 1999).
Though the IRM farmers having knowledge about thetimely sowing was 93 per cent (Peshin et al., 2007) butonly 74 per cent farmers adopt this practice (Peshin et al.,2009) as there are a number of impediments faced by thefarmers in completing timely sowing of the crop.
The IRM farmers who had either sown cotton crop in
April as well as May, or had sown only in May or later, reportedthat shortage of canal irrigation is the most importantconstraint in timely sowing of the cotton crop. The IRM
farmers who had partially sown in April, 79 per cent of themreported shortage and non-availability of canal water as thelimiting factor in completing the sowing in April, and 38 per
cent, reported that poor quality of ground water is anotherimportant constraint (Table 2). The incomplete/lateharvesting of wheat also limits the complete sowing of the
cotton crop in April. The IRM farmers who had sown thewhole area under cotton crop late also reported the irrigationwater being the limiting factor. The different constraints as
reported by IRM farmers are listed in Table 2. Theresearchers should take the limitations faced by the farmersinto consideration before recommending such practices
which are partially compatible with the farming system inPunjab. Here the technology recommended does not fitwith the farming system. Timely sowing does not fit in the
wheat-cotton crop rotation but fits rapeseed mustard-cottoncrop rotation.
A farmer in village Malwala, district Bathinda has solved
the problem of shortage of canal water for irrigation, byapplying the pre-sowing irrigation in the standing wheatcrop few days before harvesting of the wheat crop, and on
harvesting of the wheat crop the farmer immediately goes
Rajinder Peshin, A.K. Dhawan, Kamaldeep Singh and Rakesh Sharma

125
for land preparation and completes sowing in the month of
April, even though his total land holding is 25 hectares andhad cultivated cotton on 10.4 hectares.
The constraints in the timely sowing are mainly the
incompatibility of the technology and physical problem ofthe irrigation water. Thus, the farmer blame bias of theresearchers and extension functionaries is proved to be
incorrect.
Constraints in the adoption of PAU recommended varietiesother than Bt cotton. The introduction of Bt cotton in the
state of Punjab has totally changed the cotton growingscenario. Before the introduction of Bt cotton in 2005, 79per cent farmers had already cultivated the Bt cotton in 2004.
The adoption of the other recommended but non-Bt varietieswas not encouraging. The number of IRM farmers cultivatingrecommended resistant non- Bt varieties was very less.
The respondent IRM farmers were asked in open endedquestion to rank in order, the three important characteristicsof a variety, which influences their decision to adopt a variety.
The results are given in Table 3. Rank one was given tohigher yielding by 58 per cent, resistant varieties by 27 percent and authentic seed/early maturity by five per cent of the
IRM farmers. Rank two was given to higher yielding by 29per cent, resistant varieties by 32 per cent, and good loculi
size/lint quality by 13 per cent of the IRM farmers. Rank
three was given to higher yielding by eight per cent, resistantvarieties seven per cent, and authentic seed and earlymaturity by five per cent of the IRM farmers. The constraints
encountered by the farmers in timely sowing of the cottoncrop were mainly the incompatibility attribute of thetechnology and problems of irrigation water. Thus, the farmer
blame bias of the researcher and extension professionalsis contradicted.
But in case of Bt cotton, a hardware technology, the
relative advantages were visible without any complexity
involved as perceived by the farmers, the rate of adoption
was fast. Farmers started getting aware about the existence
of Bt-cotton in 2000 and by 2004 awareness-knowledge
were 100 per cent and it formed S-shaped curve (Figure 1).
The majority of the IRM farmers, 71 per cent had come to
know about Bt-cotton in 2002 and 2003 . The sources of
information was other farmers (76%), representatives of
companies (19%), newspapers (11%), Arthias (5%).
Interpersonal communication channels were the main
source of diffusion of this innovation. This implies that farmer
to farmer diffusion was effective , in case the technology is
predominantly hardware and the economic benefits are
visible.
Table 1. Descriptive statistics of the IRM farmers
District District District Overall for
Bathinda Ferozepur Mansa three districts
Education (% farmers)
I. Illiterate 6 8 16 10
II. Upto primary 10 18 12 13
III. Middle 18 26 26 23
IV. Matric 36 36 32 35
V. 10+2 14 8 14 12
VI. Graduate and above 16 4 0 7
Telephone connection (% farmers) 84 66 64 71
Total operational land (ha) holding (i + ii - iii) 461.2 675.0 377.0 1513.2
I. Owned 415.8 611.8 352.4 1380.0
II. Leased-in 53.0 74.8 29.6 157.4
III. Leased-out 7.6 11.6 5.0 24.2
Average operational landholding(ha) 9.22 13.50 7.54 10.09
I. 1-2ha (small) 6 4 2 4
II. 2 – 4ha (Semi-medium) 20 12 24 19
III. 4 – 10ha (Medium)
IV. >10ha (Large) 46 40 56 47
28 44 18 30
Area under cotton crop(ha) 313.0 428.2 217.65 958.85
Percentage area under cotton crop 67.87 63.44 57.73 63.37
Constraints in the Uptake of Cotton IPM

126
Table 3. Important attributes for adoption of a particular cotton variety as ranked by the IRM farmers
Attribute of variety Ranking (% farmers)
Rank I Rank II Rank III
Higher yield 58 29 8
Resistant to pest 27 32 3
Early maturing 5 9 11
Good quality seed 5 3 5
Good loculi size/lint quality 1 13 0
Less water requiring 3 3 3
Decimals rounded up to nearest whole numbers
The rate of adoption of Bt-cotton also formed ‘S’ shaped
curve (Fig. 1), which is in agreement with Rogers (1983)
diffusion theory. The Bt cotton technology is similar to the
green revolution technologies (high yielding varieties,
fertilization, pesticides), so the rate of adoption was fast as
cotton growers were rewarded with less bollworm problem
and higher yields. Against four per cent adoption in 2002,
rate of adoption multiplied four times in 2003 and during
2004 rate of adoption was 72 per cent before the official
release and recommendation. The rate of adoption of Bt
cotton increased to 95 in the subsequent years. The
attributes of Bt-cotton as reported by IRM farmers were
resistance to boll-worms, higher yielding, saving on
pesticide expenditure, timely wheat sowing (relative
advantages and observability); easy to adopt and compatible
(compatibility); high cost of seed, more water requiring,
higher fertilizer dosages, susceptible to CLCuV and tobacco
caterpillar (non-compatibility), but no complexity was
reported by the farmers.
The majority of the IRM farmers (52%) had not procuredBt-cotton seed from authentic sources in 2004. Some
farmers had even procured from Gujarat state, and weresure of the authencity of seed (43%). Role of public serviceextension does not count if the technologies are developed
by the private sector and are economically viable. Extensionor no extension, the farmers adopt the technologies which
have visible relative advantages.
Constraints in the adoption of seed treatment. The majorconstraints reported by 93 IRM farmers, for not treating the
seed were in terms of lack of knowledge (51%), no previousexperience (29%), seed treating chemicals not availablelocally (5%), chemicals being poisonous and laborious
practice (2%). The other reasons given by the IRM farmers(18%) were that there is no benefit of seed treatment (noobservability), IRM programme started late and farmers
gained knowledge about seed treatment when sowing wascomplete (10%). Table 4 gives an overview of the reasonsand constraints for not treating seed.
Constraints in the adoption of ETL. Waibel (1986) and Smithet al. (1988) showed that economic threshold level (ETL)based pesticide use had economic benefits but its uptake
by the farmers was negligible. The Punjab AgriculturalUniversity, Ludhiana, India recommended an ETL for cottonjassid (Amrasca biguttula) in 1979 (PAU, 1979), and for
whitefly (Bemisiatabaci) and bollworm complex(Helicoverpa armigera, Earias vitella and Pectinophoragossypiella) in 1991 (PAU, 1991). The cotton farmers in
Punjab had no knowledge about ETL, prior to the start of
Table 2. Constraints in the adoption of timely sowing
Constraint District wise % age of farmers Overall %age
Bathinda Ferozepur Mansa of 3 districts
Shortage/non-availability of canal water 88 80 71 79
Poor quality (No. 2/No. 3) of tube well water 25 33 56 38
Late/incomplete harvesting of wheat crop 25 4 10 13
Delayed land preparation 18 0 2 6
More land holding/not possible to complete sowing in April 8 0 7 5
Timely sowing Mustard + cotton crop rotation 0 7 0 2
n= 40 45 41 126
Multiple responseDecimals rounded up to nearest whole numbersSome farmers apply pre-sowing irrigation in standing wheat crop
Rajinder Peshin, A.K. Dhawan, Kamaldeep Singh and Rakesh Sharma

127
Fig. 1. Rate of adoption of economic thresholds and Bt cotton
Table 4. Adoption of seed treatment/treated seed and reasons for its adoption
Practice/Reason District wise percentage of farmers Overall percentage
Bathinda Ferozepur Mansa of 3 districts
Seed treatment/treated seed 90 45 92 75
i. Seed treatment# 13 10 2 8
ii. Treated seed# 90 35 92 72
No seed treatment/treated seed 10 55 8 25
n 48 49 49 146
Reasons#
i. As seed already treated 95 77 100 94
ii. Delayed attack of jassid 40 23 11 25
iii. Good germination 2 0 4 3
iv. Less disease infestation/CLCuV 14 0 2 6
v. No termite damage 5 9 6 6
vi. Given by dept. of Agric. for trial 0 4 0 1
n 43 22 45 110
# Multiple responses, Decimals rounded up to nearest whole numbers
the insecticide resistance management based IPM
programme in 2002. Though, it has relative advantage overprophylactic pesticide spray, its adoption was zero in cottonin Punjab (Peshin et al., 2009). During the implementation
of the IRM programme 35,25 and 33 per cent farmersadopted the ETLs for Jassid, whitefly and Americanbollworm, respectively but once the IRM intervention was
withdrawn adoption rate showed a down ward slide. The
constraints limiting the adoption of ETL were similar interms of complexities. The constraints expressed by 88IRM farmers, were that determining ETL is time consuming
(26%), lack of proper knowledge, comprehension and skill(20%), laborious (22%), pest population never being belowETL in case of ABW and whitefly (8%) (Table 5).
Constraints in the Uptake of Cotton IPM

128
One of the attributes of ETL expressed by farmers was
‘risk’ which was not forming the part of semi-structuredquestions related to attributes of ETL, but in case of openended questions related to constraints, ‘risk’ was reported
as a constraint by 19 per cent of IRM farmers (Table 5). Theother reasons for not adopting ETL were: insecticides areapplied as preventive measure (7%), their past experience
and general observations were enough to take pesticiderelated decisions (33%). No benefit of ETL was reported bytwo per cent of the 88 IRM farmers. The ETL not being
adopted puts a question mark on the applicability of thispractice at farmers’ level in Punjab and taking it as indicatorfor determining the level of IPM adoption.
Use of pesticides according to good agricultural practice.Pesticide based pest management in itself is a complextechnology for farmers to efficiently adopt (Litsinger et al.,2009). It is a mix of software (consisting of knowledge base)and hardware (consisting of inputs) technology. Hardwarein terms of the pesticides, and software in terms of selection
of a right pesticide against a particular pest, right dosage,right dilution and right time of application. Hardware side oftechnology is dominant and its adoption is faster as
compared to software side of a technology (Rogers, 2003).The pesticide based pest management requires higherlevels of knowledge and greater skills on the part of farmers
in terms of selecting a right pesticide, pesticide dosageand dilution (spray volume). Most pesticides are only toxicto a specific pests, can be washed away by rain, can drift
with wind, require being placed on a specific part of theplant and must be diluted correctly. The State of Punjabbeing the “Leader of the Green Revolution” in India, the
pesticide use is also the highest. But the use of pesticides
according to correct dosages, right timing and applicationtechnology is not upto the accepted norms. The farmerseither under dose or overdosed the insecticides in cotton
(Table 6). Under the IRM oprogramme endosufan insecticidewas recommended as the recommended insecticideagainst Jassid. Farmers were reluctant to use it, as they feltintoxicated after its spraying. The Excel pesticide company
was selling endosufan as IPM pesticide. The farmers wereahead of the scientists, because they have real lifeexperiences and now there is a hue and cry for banning
endosulfan in India.
Table 6. The adoption of correct and incorrect dosages ofinsecticides by the IRM farmers
Insecticide Incorrect dosage Correct dosage
(% farmers) (% farmers)
Alphamethrin 71 29
Cypermethrin 92 08
Fenvalerate 90 10
Acephate 24 66
Chlorpyriphos 49 51
Ethion 33 63
Monocrotohos 22 88
Profenophos 25 75
Quinalphos 25 75
Triazophos 36 64
Acetamirid 89 11
Indoxacarb 5 95
Spinosad 67 33
The reasons given by 117 IRM farmers, who had partiallyor completely adopted IRM strategy of insecticides use, arereported in Table 7. The cotton growers in Punjab have
suffered heavily due to losses caused by insect-pests
Table 5. Constraints/reasons in the adoption of economic threshold level (reasons other than constraints also included)
Constraint/Reason District-wise percentage of farmers Overall
Bathinda Ferozepur Mansa percentage of
(n=19) (n=36) (n=33) 3 districts (n=88)
i. Time consuming 16 31 27 26
ii. General observation enough to take decision 42 25 36 33
iii. Lack of knowledge/comprehension and skill 21 17 24 20
iv. Risk involved 16 19 21 19
v. Laborious and difficult to calculate frequently 21 17 27 22
vi. Application of insecticides as a preventive major
based on our past experience 5 11 3 7
vii. Use pheromone traps 5 0 0 1
viii. Pest population never below ETL in case of 0 14 6 8
ABW and whitefly
ix. Application of insecticides at egg stage of the pest 11 3 0 3
x. No benefit of ETL 0 5 0 2
Multiple response, Decimals rounded up to nearest whole numbers
Rajinder Peshin, A.K. Dhawan, Kamaldeep Singh and Rakesh Sharma

129
mainly bollworms between 1995 to 2003, so the farmerswere keen to know about the recommendations of the PAU
for insecticide use. The reasons for partially or completelyfollowing IRM strategy was to reduce insecticideexpenditure (34%), reduce insecticide use (15%), to rotate
the insecticide during cropping season (10%), to avoid tankmixing (11%) and for trial purpose (14%). One of theimportant reasons reported by the IRM farmers was that
the IRM staff created credibility (12%) and availability of IRMstaff for advice (6%). Some of the farmers (5%) reportedthat they used IRM strategy only for using correct dosage.
The other reasons listed by the IRM farmers were to avoidresistance in pests, avoid resurgence of whitefly by avoidingsynthetic pyrethroids, increase time interval between two
applications and avoid first spray of monocrotophos 36SLto conserve natural enemies.
As was in the case of ETL, 30 per cent of the 80 IRM
farmers reported that following the IRM strategy forinsecticides use the most important limiting factor was ‘risk’.Ten percent of the farmers reported tank mixing of
insecticides gives better results than IRM recommendationand especially in case American boll worm and spottedboll worm are present at the same time (14%). Ten per cent
of farmers also reported that when infestation of bollwormsand tobacco caterpillar in severe tank mixing is the only
option and an equal number of farmers reported that theadvice given by dealers/other farmers was followed for taking
the pesticide decisions. Two per cent of the 86 IRM farmersreported that pesticide companies even lay the trials ofusing tank mixtures so experimentation and trial should be
laid to make them observe the results of IRM-IPM strategyof insecticide use. The detail list of reasons and constraintsare given in Table 7.
In the green revolution era the emphasis was onenhancing the mutual linkages between research,extension and farmers (Roling, 1996) for dissemination
and adoption of hardware technologies (high yieldingvarieties, fertilizers and pesticides) through top-downtechnology dissemination. The experiences with efforts to
introduce IPM practices through transfer of technology (ToT)paradigm did not work. The research and extension beliefsand modes changed with the time (Chambers, 1991). In
1950s and 1960s, the farmers were categorized intoadopters/laggards and explanation for non-adoption wasignorance. In 1970s and 1980s explanation for non-
adoption of technologies was farm level constraints(incompatibility of technology with the farming system). Thekey prescriptions were extension/remove constraints and
activities were training and input supply. In 1990s, thequestions were being asked about the technology, whether
Table 7. Constraints in the adoption/partial adoption of insecticides as per IRM strategy*
Constraint/Reason District wise percentage of farmers Overall percentage
Bathinda Ferozepur Mansa of 3 districts
(n=8) (n=40) (n=38) (n=86)
i. Risk involved in following IRM strategy 37 30 24 30
ii. Decision of elders for tank mixing of insecticides 13 0 5 3
iii. Followed other farmers/dealers advice 0 5 18 10
iv. Tank mixing of insecticides gives better results 25 28 21 24
v. In case of two pests present at the same time,
tank mixing needed (eg. ABW+SBW) 25 13 13 14
vi. In case of severe infestation of ABW/TCP tank
mixing of insecticides effective 13 13 8 10
vii. Tank mixed initially before developing confidence
in IRM staff 0 10 0 5
viii. Endosulfan 35EC intoxicating 0 3 5 3
ix. Time interval between two pesticide application 0 15 5 9
decreased and spraying cost increases without
tank mixing
x. Pesticide companies lay trails of tank mixing/using
mixed insecticides 0 3 3 2
xi. Difficult to give up old habits 0 5 3 3
xii. Trial should be laid by IRM staff for seeing is believing 0 3 3 2
xiii. During full-moon night spraying pesticides essential 0 0 5 2
*Multiple response, Decimals rounded up to the nearest whole numbers
Constraints in the Uptake of Cotton IPM
130
it fits the farmer and emphasis was on farmer participationactivities. Thus management of different factors namely
farmers’ participation, farmers’ experimentation, choices,etc. are required for developing farmers’ compatibletechnologies. The results provide empirical evidence that
the attributes of the IPM practices are the dominant variablesaffecting the adoption or rejection. Thus researchers musttake into consideration the area specific farming system
and also involve the active farmers in the refinement andvalidation of the technologies before their release. Therecommendations in the “Package of Practices,” published
by the PAU should be tested for its adoptability at the farmers’level; otherwise such technologies should not berecommended where chances of adoption are bleak. Many
agricultural researchers and policy makers have suggestedto expand the definition of ecosystem further to includehumans. Farmers are seen as part of their farming systems,
interacting with their crops through their knowledge, skillsand mutual cooperation.
REFERENCESBenthley, J. and Andrews, K. (1996) Trough the road blocks: IPM
and Central American small-holders. Sustainable AgriculturalProgramme Gatekeeper Series 56. International Institute forEnvironment and Development, London.
Caswell, M., Fuuglie K., Ingram, C., Jam, S. and Kascak, C. (2000)Adoption of Agricultural Production Practices-Lesson Learnedfrom the US Department of Agriculture Area Studies Project.Economic Research Services, USDA. http://www.usda.org.
Chambers, R. (1991). Scientists or resource poor farmer-whoseknowledge counts? In: Proceedings of a Seminar on CropProtection for Resource –Poor farmers. CTA/NRI, Isle of Thorn,UK, Nov.4-8, pp1-15.
Dent, D. (1995) Integrated Pest Management. Chapman and Hall,London.
Dhawan, A.K. (1999) Major insect pests of cotton and theirintegrated anagement. In: R.K. Upadhay, K.G. Mukerji and O.P.Dubey (Eds.) IPM Systems in Agriculture Vol 6 Cash Crops.Aditya Books Pvt Ltd, New Delhi, pp 165-225.
Escalanda, M.M. and Heong, K.L. (1994) New developments andneed for training IPM. Proc 16th session of FAO/UNEP Panelof Experts on Integrated Pest Control 25-29 April, FAO, Rome.
Fliegel, F.C. (1967) Innovation in India: The Success or Failure ofAgricultural Development Programmes in 108 Indian Villages.National Institute of Community Development, Research Report9, Hyderabad.
Godell, G.E. (1984) Challenges to integrated pest management
research and extension in the Third World: Do we really wantIPM to work? Bulletin of Entomological Society of America,30: 18-26.
Kenmore, P.E., Gallangher, K.D. and Ooi, P.A.C. (1995) Empoweringfarmers: experiences with integrated pest management.Entwicklung and Landlicher Raum 1/95: 27-28.
Lacewell, R.D. and Taylor, C.R. (1980). Benefit-cost analysis ofIntegrated Pest Management Programs. Proc of Seminar andWorkshop. Pp 283-302. CICP- USAID.
Malone, S., Herbert, D.A. Jr., and Pheasant, S. (2004) Determiningadoption of integrated pest management practices by grainsfarmers in Virginia. J. Extension 42: 1-7.
Matteson, P.C., Gallagher, K.D. and Kenmore, P.E. (1994) Extensionof integrated pest management for pant hoppers in Asianirrigated rice: Empowering the user. In: R.F. Denno and T.J.Perfect (Eds) Ecology and Management of Plant hoppers.Chapman and Hall, London.
Merchant, M.E. and Teetas, G.L. (1994) Perception of Texas farmersand pest management advisors on integrated pest managementof sorghum insect pests. South Western Entomology, 19: 237-248.
Norris, R.F., Caswell-Chen, E.P. and Kogan, M. (2002) Concept inIntegrated Pest Management. Prentice-Hall of India PrivateLtd, New Delhi.
PAU (1979) Package of Practices for Crops of Punjab – Kharif.Directorate of Extension Education, Punjab AgriculturalUniversity, Ludhiana.
PAU (1991) Package of Practices for Crops of Punjab-Kharif. PunjabAgricultural University, Ludhiana.
Peshin, R., Dhawan, A.K., Vatta, K. and Singh, K. (2007). Attributesand socio-economic dynamics of adopting Bt-cotton. Economicand Political Weekly 42:72–80.
Peshin, R., Dhawan, A.K. , Kranthi, K.R. and Singh, K. (2009).Evaluation of the benefits of an insecticide resistancemanagement programme in Punjab in India, International J.Pest Management 55(3):207-220.
Rogers E M (1983, 1995, 2003) Diffusion of Innovation. Free Press,New York.
Roling, N. (1994). Facilitating sustainable agriculture; turning policymodels upside down. In: B.J.I. Scoones and J. Thompson(eds) Beyond Farmer First, IT Publications, London, pp 248-248.
van de Fliert, E. (1993) Integrated Pest Management : FarmerField School Generate Sustainable Practices. WageningenAgricultural University Papers 93.3
van den Berg, H; Ooi, P.A.C., Hakim, A.L., Ariawan, H. and Cahyana,W. (2004) Farmer Field Research: An Analysis of Experiencein Indonesia. FAO-EU IPM Programme for Cotton in Asia FAORegional Office for Asia and the Pacific, Bangkok, Thailand.
Received 5 February, 2011; Accepted 6 December, 2011
Rajinder Peshin, A.K. Dhawan, Kamaldeep Singh and Rakesh Sharma

Ultraviolet (UV) radiation from the sun is a major cause
of skin cancer and accounts for 1.3 million new cases inthe USA alone each year. It is classed as a completecarcinogen in that it has the capacity to inducecarcinogenesis without the presence of any other stimuli
(Shannon et al., 2004). Solar UV radiation is largelycomprised of UVB (280-320 nm) and UVA (320-400 nm)wavelengths. UVB radiation has been associated with
sunburn, immunosuppression, photoaging, skin cancersand DNA lesions. The latter include cyclobutane pyrimidinedimers and 6,4 pyrimidine pyrimidone. UVA radiation, which
represents 95 per cent of the total UV received at groundlevel, is less energetic than UVB. It has also beenassociated with immunosuppression, photoaging, and
mutagenesis (Bernerd et al., 2003). According to the albinohairless mouse model, both UVB and UVA can be involvedin the development of cutaneous cancers including
squamous cell carcinomas (SCC) and basal cellcarcinomas (BCC). However, the relative efficiency of UVAin inducing these carcinomas is approximately 10,000 times
lower than UVB and much higher doses of UVA are required(Routaboul et al., 2002). Both UVA and UVB act by causingprogrammed cell death [apoptosis] which has been linked
to carcinogenesis (Siddoo-Atwal, 2009)). Thus, ideally,sunscreen products should provide efficient protectionagainst both UVB and UVA radiation.
The natural human sunburn cycle (without the use ofany sun lotions or sunscreens) is approximately one weekin length (7 days) from start to finish. Macroscopically, it
consists of three phases including inflammation, new tissue
A Case-Study of Two Sunscreens that May Prevent ApoptoticSunburn
Chanda Siddoo AtwalMedical College of Wisconsin, Milwaukee, Wisconsin, USA
E-mail: [email protected]
Abstract: Two new sunscreen formulations were tested for their respective ability to block peeling, or, apoptosis following exposure tosolar radiation. The active ingredients utilized were zinc oxide and melanin. A slight pinkish sunglass line appeared on the nose followingthe trial with the zinc oxide sunscreen. Although probably representing some degree of immediate pigment darkening and persistentpigment darkening in response to UVA radiation, the line was none of the expected melanin colours in the eumelanin or pheomelanin range{brown, black, yellow, or red}. In the case of the melanin sunscreen, a sunglass line was visible after one hour of sun exposure on bothnose and cheeks while no acute redness or inflammation was observed. Once again, the sunglass line was pinkish and there was someslight stinging during sun exposure possibly indicating a little sunburn. Since there was no peeling even 96 hours after sun exposure witheither sunscreen, this indicates that both these formulations may be somewhat effective in preventing the apoptotic phase, but notnecessarily the inflammatory phase, of UVB-induced sunburn by uncoupling the two events.
Key Words: Sunscreens, Zinc oxide, Melanin, Peeling, Sunburn, Apoptosis
formation, and apoptosis (visible peeling). The inflammatory
phase consists of redness and inflammation commencing20-30 minutes from the time of initial sun exposure. It spansgrossly 2-3 days, but can last up to 5 or 6 days dependingupon UV intensity. New tissue formation is stimulated some
time after initial exposure and it is complete within one week.In the last apoptotic phase, the top layer of dead skin cellssloughs off to reveal a new tissue layer beneath. This
process follows on from the inflammatory phase and iscomplete approximately 7 days following exposure.
Previously, it has been shown that sunburn can also
occur despite the use of sunscreen (15 SPF) during wintermonths in a temperate climate (Siddoo-Atwal, 2011a). Inaddition, sunburn may still occur while wearing stronger
sunscreens (30 SPF). Although they may attenuate or eveneliminate the first phase of redness and inflammation, thesecond and third phases may not be prevented. Since it is
the last apoptotic phase that has been linked tocarcinogenesis, this would appear to reflect an inherentweakness in the general composition of many sunscreens
available to the consumer. It also brings into question theefficacy and safety of sunscreens which effectively blockinflammation, but are unable to prevent peeling following
sun exposure in providing protection against skin cancer(Siddoo-Atwal, 2011b).
MATERIAL AND METHODS
In the current case-study, two new sunscreen
formulations were tested for their respective ability to blockpeeling, or, apoptosis following exposure to solar radiation.
Indian J. Ecol. (2012) 39(1) : 131-134Indian Journal
of Ecology

132
The first was a preparation of pure zinc oxide (7.5%) in acreme base rather than the microfine or nano form which is
currently a popular ingredient of sunscreens (Pinnell et al.,2000). The second was a preparation of melanin (50 mg/ml) extracted from black sesame in a creme base containing
zinc oxide (7.5%).
Zinc oxide has been used for centuries as a specializedskin ointment and it was known as pushpanjan in Ayurvedic
medicine. It was chosen for its property as the broadestspectrum UVA and UVB reflector that is approved for use asa sunscreen by the FDA. It acts as a physical sunblock by
scattering ultraviolet light more effectively than othersubstances. Moreover, it is photostable (Mitchnick et al.,1999). Zinc oxide has the added advantage of sitting on the
surface of the skin without being absorbed into it whichmay not be the case with the microfine or nano form. Melaninwas chosen because it is the natural sunscreen of the
human body, which usually protects itself from solarradiation by increasing melanin production. It ranges incolour from red and yellow {pheomelanin} to brown and
black {eumelanin} with the latter being the most effective(Chintala et al., 2005). It likely acts as a chromophore byabsorbing light energy and undergoing a subsequent
conformational change involving the excitation of electrons.The resulting energy may be converted into lower energyradiation and heat which can be dissipated. However,
certain individuals are not able to produce enough melaninto fulfill this function and the result is sunburn. Thus, thereis reason to suppose that it may be one of the most suitable
ingredients for a commercial sunscreen. Previously, it hasbeen shown that bacterial-derived melanin can providephotoprotection against UVA-induced cell death (Geng etal., 2008). Therefore, in this study, melanin derived fromblack sesame (Sesamum indicum) was selected for itspotential application as an active sunscreen (courtesy of
Lingonberry Organic Foodstuffs, China).
Various tests were carried out on the melanin todetermine its chemical purity as it is not a common
commercially available compound. There were no aerobicor anaerobic bacteria detected in the sample. It was alsonegative for mycobacterium and fungus. In addition, there
was no contamination with any type of dead bacteria{courtesy of Professor Paul J. Hergenrother, Department ofChemistry, University of Illinois}.
Absorbance studies carried out on the zinc oxide andmelanin confirmed their physical properties (courtesy ofMatthew Brichacek and Professor PJ Hergenrother’s Lab).
The zinc oxide at 7.5% was found to be a good reflector inthe UVB and UVA ranges (Fig. 1) . The melanin at 0.4 mg/ml
was found to absorb light nicely in the UVB and UVA2 (320-340 nm) ranges, while it was only moderate in the UVAI
range (340-400 nm) (Fig. 2). In fact, the comparative graphof mass extinction coefficients showed that zinc oxideabsorbed light slightly better than the melanin over a range
of various UV wavelengths (Fig. 3). Thus, since zinc oxidealone appeared to be an adequate sunblock at thisconcentration, it was reasoned that these two ingredients
should provide even greater sun protection together as theywould cover more surface area of the skin.
The experimental model was similar to the one
previously described (Siddoo-Atwal, 2011). The subject satoutdoors or walked at noon facing the direct sunlight on aclear, sunny day. Each experiment lasted between 30 and
Fig. 1. ZnO absorbance
Fig. 2. Melanin (Sesamum indicum) absorbance
Chanda Siddoo Atwal
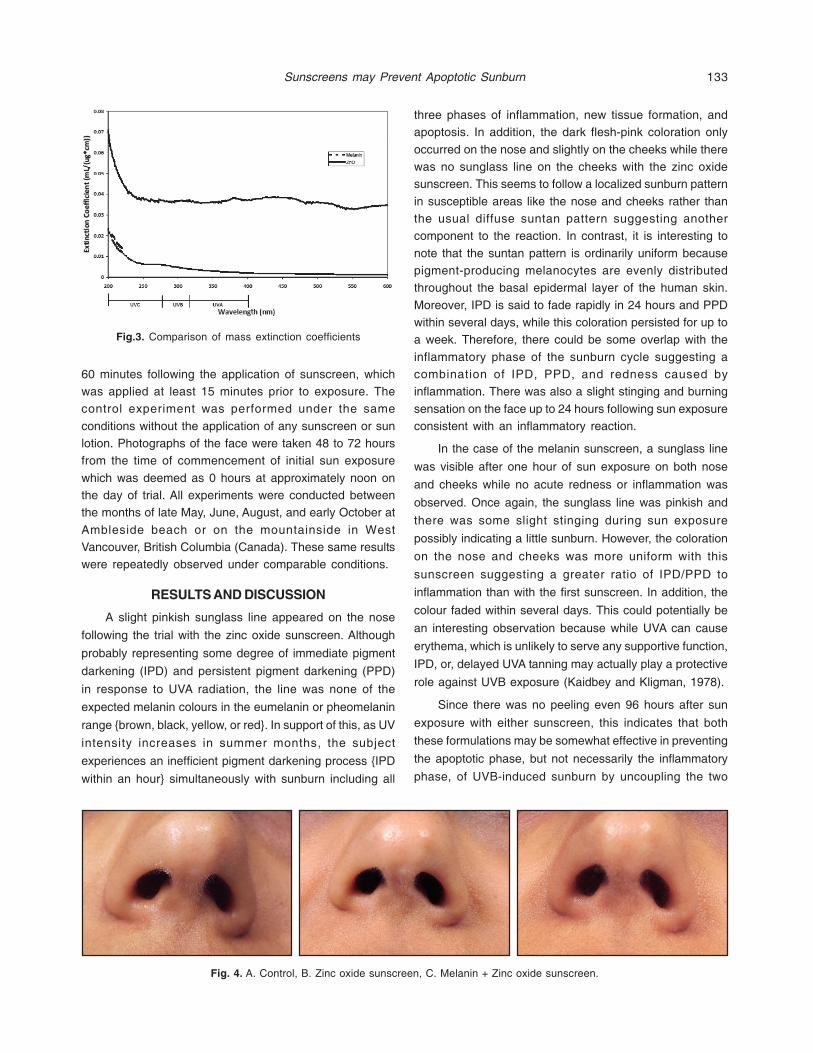
133
60 minutes following the application of sunscreen, whichwas applied at least 15 minutes prior to exposure. Thecontrol experiment was performed under the same
conditions without the application of any sunscreen or sunlotion. Photographs of the face were taken 48 to 72 hoursfrom the time of commencement of initial sun exposure
which was deemed as 0 hours at approximately noon onthe day of trial. All experiments were conducted betweenthe months of late May, June, August, and early October at
Ambleside beach or on the mountainside in WestVancouver, British Columbia (Canada). These same resultswere repeatedly observed under comparable conditions.
RESULTS AND DISCUSSION
A slight pinkish sunglass line appeared on the nose
following the trial with the zinc oxide sunscreen. Although
probably representing some degree of immediate pigment
darkening (IPD) and persistent pigment darkening (PPD)
in response to UVA radiation, the line was none of the
expected melanin colours in the eumelanin or pheomelanin
range {brown, black, yellow, or red}. In support of this, as UV
intensity increases in summer months, the subject
experiences an inefficient pigment darkening process {IPD
within an hour} simultaneously with sunburn including all
three phases of inflammation, new tissue formation, andapoptosis. In addition, the dark flesh-pink coloration only
occurred on the nose and slightly on the cheeks while therewas no sunglass line on the cheeks with the zinc oxidesunscreen. This seems to follow a localized sunburn pattern
in susceptible areas like the nose and cheeks rather thanthe usual diffuse suntan pattern suggesting anothercomponent to the reaction. In contrast, it is interesting to
note that the suntan pattern is ordinarily uniform becausepigment-producing melanocytes are evenly distributedthroughout the basal epidermal layer of the human skin.
Moreover, IPD is said to fade rapidly in 24 hours and PPDwithin several days, while this coloration persisted for up toa week. Therefore, there could be some overlap with the
inflammatory phase of the sunburn cycle suggesting acombination of IPD, PPD, and redness caused byinflammation. There was also a slight stinging and burning
sensation on the face up to 24 hours following sun exposureconsistent with an inflammatory reaction.
In the case of the melanin sunscreen, a sunglass line
was visible after one hour of sun exposure on both nose
and cheeks while no acute redness or inflammation was
observed. Once again, the sunglass line was pinkish and
there was some slight stinging during sun exposure
possibly indicating a little sunburn. However, the coloration
on the nose and cheeks was more uniform with this
sunscreen suggesting a greater ratio of IPD/PPD to
inflammation than with the first sunscreen. In addition, the
colour faded within several days. This could potentially be
an interesting observation because while UVA can cause
erythema, which is unlikely to serve any supportive function,
IPD, or, delayed UVA tanning may actually play a protective
role against UVB exposure (Kaidbey and Kligman, 1978).
Since there was no peeling even 96 hours after sun
exposure with either sunscreen, this indicates that both
these formulations may be somewhat effective in preventing
the apoptotic phase, but not necessarily the inflammatory
phase, of UVB-induced sunburn by uncoupling the two
Fig.3. Comparison of mass extinction coefficients
Sunscreens may Prevent Apoptotic Sunburn
Fig. 4. A. Control, B. Zinc oxide sunscreen, C. Melanin + Zinc oxide sunscreen.

134
events (Fig.4A,B,&C). The inflammation may also represent
some degree of UVA-induced erythema. As zinc oxide is a
known UVAI blocker at 7.5% and since it is UVAI that causes
IPD, it is unlikely to be the sole cause of the change in
coloration observed in these trials. Although not an ideal
result, these two sunscreen formulations are preferable to
those which prevent the inflammatory but not the apoptotic
phase of sunburn which has been linked to carcinogenesis.
Currently, the sun protection factor (SPF) of a sunscreen is
based on its ability to block erythema and immediate
pigment darkening (IPD). However, neither of these biological
parameters has been linked to skin cancer. Therefore,
certain scientists have recommended using another
criterion that is more representative of long term UV
cutaneous damage such as apoptotic sunburn cells. The
term tumour protection factor (TPF) has been proposed to
describe it. Thus, it seems possible that a solution as
simple as melanin could finally provide the protection
required against this deadly disease.
REFERENCESBernerd, F., Vioux, C., Lejeune, F. and Asselineau, D. (2003) The
sun protection factor (SPF) inadequately defines broadspectrum photoprotection: demonstration using skinreconstructed in vitro exposed to UVA, UVB, or UV-solarsimulated radiatio Eur. J. Dermatol. 13(3): 242-249.
Chintala, S., Li, W., Lamoreux, M.L., Ito, S., Wakamatsu, K.,Sviderskaya, E.V., Bennett, D.C., Park, Y.M., Gahl, W.A., Huizing,
M., Spritz, R.A., Ben, S., Novak, E.K., Tan, J. and Swank, R.T.(2005) Slc7a11 gene controls production of pheomelaninpigment and proliferation of cultured cells. Proc. Natl. Acad.Sci. USA 102(31): 10964-10969.
Geng, J., Tang, W., Wan, X., Zhou, Q., Wang, X.J., Shen, P., Lei, T.C.and Chen, X.D. (2008) Photoprotection of bacterial-derivedmelanin against ultraviolet A-induced cell death and its potentialapplication as an active sunscreen. J. Eur. Acad. Dermatol.Venereol 22(7): 852-858.
Kaidbey, K.H. and Kligman, A.M. (1978) Sunburn protection bylongwave ultraviolet radiation-induced pigmentation. Arch.Dermatol. 114: 46-48, 1978
Mitchnick MA, Fairhurst D, Pinnell SR. (1999) Microfine zinc oxide(Z-cote) as a photostable UVA/UVB sunblock agent. J. Am.Acad. Dermatol. 40(1): 85-90.
Pinnell, S.R., Fairhurst, D., Gillies, R., Mitchnick, M.A. and Kollias, N.(2000) Microfine zinc oxide is a superior sunscreen ingredientto microfine titanium dioxide. Dermatol. Surg. 26(4): 309-314
Routaboul, C., Denis, A. and Bohbot, M. (2002) Proposal for a newUVA protection factor: use of an in vitro model of immediatepigment darkening. Eur. J. Dermatol 12(5): 439-444.
Shannon, R. S., Farrukh, A., Moammir, H. A. and Nihal, A. (2004)Modulations of critical cell cycle regulatory events duringchemoprevention of ultraviolet B-mediated responses byresveratrol in SKH-1 hairless mouse skin. Oncogene 23: 5151-5160.
Siddoo-Atwal, C. (2011a) Sunburn with sunscreen-a case study.Science 2.0, published online on April 20, 2011.
Siddoo-Atwal, C. (2011b) A case study of apoptotic sunburn withsunscreen. Indian J. Ecol. 38(2): 300-301.
Siddoo-Atwal, C. (2009) AT, apoptosis, and cancer: A viewpoint.Indian J. Ecol. 36(2): 103-110.
Received 10 November, 2011; Accepted 4 March, 2012
Chanda Siddoo Atwal

Forests have been serving mankind since thebeginning of this universe. It is not possible to sum up theimportance of forests in just a few words. The world over
the forests are considered as the repositories of biologicaldiversity, they harbour the rare and endangered species ofplants and animals. Leave the tangible benefits in terms of
timber, fuel wood, fodder, fibre and medicinal herbs, theintangible benefits of the forests are incalculable. The airwe breathe, the water we drink, the food we eat are the
products of forests and its biological biodiversity. But in spiteof the fact that the forests are vital for mankind, the forestsare disappearing all over the world. Loss of forest is the
major cause for global warming and need to be protectedall over the world irrespective of whether it isunderdeveloped or developing or the developed country.
Though many alternatives of wood are available but nothingcan replace wood. Therefore, it is important to meet thetimber requirement of the people and industries though
conserving the forests, biological diversity in-situ andextending the tree cover outside forests including on farm.Besides meeting the requirement of wood for timber and
pulp, the agroforestry on farmland will ease pressure onforests and will help in conserving the flora and fauna ofthat area.
Trees on the farm have been adopted due to their higheconomics in the north-western states of India. Farmers’need quick returns, and poplar and eucalyptus have fitted
well into the system of agroforestry of Haryana and adjoiningstates because they grow faster than any other indigenoustree species. They have brought prosperity to the people by
giving quick returns. However, they too have limitations.Poplar grows only in a limited zone with well drained neutralsoil and does not perform well in high temperature conditions
(beyond 45OC) prevailing in the region during summermonths. Eucalyptus Gall Wasp (Leptocybe invasa) isthreatening Eucalyptus farming and this species too does
not grow in semi-arid tracts. Further, there is a need todiversify species under agroforestry system andmonoculture is always dangerous. Therefore, Melia dubia(syn. M. composita) is an another species that fits into the
system well with much market demand.
Melia dubia belongs to Meliaceae and is a tall tree
with smooth bark, which is reddish-brown when young,
turning grey brown on maturity. It grows straight attaining a
height of about 20 m in its natural habitat. The length of the
straight bole is about 9m, which is a very good length for
any broad leaved species. The beautiful serrated leaves
and purple flowers make it an ornamental tree. It is
deciduous in nature and sheds its leaves by end of
December allowing much needed sunshine to reach the
ground, which makes it a suitable species for agroforestry.
The species is likely to be a viable option for adoption by
the farmers with economic gains at short rotation. Research
emphasis has been given on M. azedarach and M. volkensiibut very little has been attempted on Melia dubia (Stewart
and Blomley, 1994; Luna et al., 2006; Chauhan et al., 2008).Therefore, to facilitate the farmers, information has been
generated on the important aspects of plantation
management of this important species.
The study was conducted in Pinjore, Panchkula,
Bithmarha, Sohna and Jhumpa areas of Haryana and
Mohali of Punjab. To introduce M. dubia in Haryana, seeds
of M. dubia were procured from plus trees selected by the
Punjab State Forest Department located at Mohali in
February 2005 and three thousand plants were raised in
polybags in Rawalwas nursery in Hisar district. Plantation
was done in July 2006 at a place called Khedar (semiarid
zone) in Hisar district alongwith other species namely
Albizia procera, Azadirachta indica, Ailanthus excelsa and
Cordia dichotoma. The annual rainfall here is around
300mm. It is stabilized sand dune and the texture of the
soil is sandy loam (pH of the soil is 8.2). Four hectare area
was allotted to each species.
M. dubia was introduced in Panchkula district ofHaryana in 2007. The soil is clay loam and pH is around
7.5. The annual precipitation here is around 1000 mm. Inthe same year, its plantation was also raised in JhumpaForest Research Station of Haryana Forest Department.
The soil and climatic conditions here are almost similar to
Melia dubia : A Potential Species for Agroforestry Under DifferentAgro-Climatic Conditions of Haryana State of India
Jagdish ChanderResearch Circle, Haryana State Forest Department, Pinjore-134 102, Haryana, India
E-mail: [email protected]
Indian J. Ecol. (2012) 39(1) : 135-137Indian Journal
of Ecology

136
Khedar. The plantation in Panchkula and Jhumpa was doneat a spacing of 4mx3m to facilitate the movement of tractor
for ploughing. The plants were irrigated once in a month.The study trial for the selection of superior genotype waslayed out at two places viz., Bithmarha and Sohna located
in western and southern Haryana. Both of these sites arelocated in semi-arid tract and receive an annual rainfall ofabout 400mm. The tree-crop interface studies [M. dubia(dek)-Triticum aestivum (wheat)] were conducted at Jhumpain semi-arid tract and Panchkula in Shiwalik foothills. Theplantation at both the sites was done in July 2007. In
Panchkula, wheat was grown upto three years starting fromwinters of 2007 and at Jhumpa, the crop was raised duringthird year of the plantation only.
The study on the tolerance of M. dubia to hightemperature and frost, plantations were established atKhedar, Bithmarha, Panchkula, Jhumpa and Sohna. The
observations were recorded during peak winters and peaksummer period. To study the end uses of wood of M. dubia,logs were arranged and converted to veneer, chairs and
table at the Saw Mill of Forest Department, Haryana. Thesawing properties, nail holding capacity, polish taking qualityand wood turning capacity were studied. The views of the
carpenters using M. dubia wood at timber market Mohaliwere also recorded as expert input. Paper making qualitywas got analyzed in the laboratory of Star Paper Mill at
Saharanpur (Uttar Pradesh, India). Marketing of produce isan important aspect of interest for the adopters. The averagecurrent rates per cubic meter of popular agroforestry tree
species namely poplar and Eucalyptus were collected fromHaryana and Punjab timber market to compare the currentprevailing rates of timber with M. dubia. The data were
suitably analyzed to draw proper inferences.
The adoption of the technologies/species dependsupon the attitude and the perception of the stakeholders.
The attitudes of foresters and farmers of Haryana for makingM. dubia an integral component in regular plantingprogramme were also recorded. The views of large number
of farmers were taken in this regard including the views offrontline staff and officers.
Haryana is an agrarian state, where the tree cover is
much below (6.8%) than the minimum required percentage(20%) as envisaged in the National Forest Policy. The onlyoption is to extend trees on the farmland but all tree species
can not fit into the agro-ecosystem. The tree species shouldbe fast growing and intercultivated cause minimumcompetition of resources with the crops. Eucalyptus since
sixties and poplar since late seventies are being grown bythe farmers of Haryana and adjoining states but it is also a
fact that they have narrow genetic base and are prone toattack by pests. Additionally, Eucalyptus and poplar have
their limitations for adoption on semi-arid and aridconditions. Therefore, a species with wider adaptability wasneeded and M. dubia is a recent introduction in Haryana.
The final results are not available but the initial resultsindicate that M. dubia can adapt in Haryana in clayey, loamand sandy loam soils in all bio-geographical regions of the
state. As regards biomass production in semi-arid region,it is better than Ailanthus excelsa (local fast growing tree),whereas, the results are comparable with eucalyptus and
poplar in Shiwalik foothills and the central plains. M. dubiahas performed much better than the local M. azedarach interms of growth, bole length and form. Out of all species
i.e., Albizia procera, Azadirachta indica, Ailanthus excelsaand Cordia dichotoma planted in Khedar in 2006, M. dubiagrew fastest and made the barren land green within a year.
The plantation of M. dubia done in Panchkula in 2007, hadhigh survival rate and has put on excellent growth. Theresults obtained from planting M. dubia in Panchkula and
Khedar have proved that it can grow and adapt well in allparts of the state except the pure sand. The frost is ofcommon occurrence throughout the state but it is more
severe in Jhumpa and Khedar area but M. dubia was notaffected either by frost or by high temperature. Species hasalso been tested positive on extreme temperature
conditions. It thrived well under extreme temperatureconditions of 48oC in summers and zero degree in wintersin Haryana. In the western parts of Haryana, extremely harsh
conditions are experienced during summer months. On-farm raising of M. dubia may moderate the high temperaturefor better crop yield.
Wheat (Triticum aestivum) was also grown with M.dubia at Panchkula and yield of wheat during three years ofcultivation have been presented in table 1. It was noticed
that yield of wheat during first year was 1.98 tons per hectare.The maximum yield without trees was 2 tons. So duringfirst year, there was no significant effect in the yield of wheat,
however, during second and third year, the yield of wheatwas significantly less though the reduction in yield was notonly due to competition but also due to reduced effective
area for crop. Infact, M. dubia is a deciduous species and it
Table 1. Wheat yield under M. dubia canopy
Year of plantation Wheat yield (tha-1)
2007-08 1.98
2008-09 1.55
2009-10 1.20
Control 2.00
Jagdish Chander

137
allows sunshine to reach on the ground during winterswithout any significant hindrance. The decrease in yield
was because of the reason that significantly more spacewas left unploughed and uncultivated to avoid injury to theroots. It can be concluded that the crops can be grown with
M. dubia atleast upto three years.
M. dubia wood was found to take the polish well and itsnail holding capacity it self was good. The wood turns well,
the carpenters love to work on it for furniture making. Pinhole borer (Dinoderus) and powder post beetle (Lyctus)cause heavy damage to furniture and plywood, etc. M. dubiafurniture is being used in Forest Department office since2008. Neither veneers nor the furniture has been attackedby powder post beetles. No termite attack has been noticed,
hence, it can be concluded that M. dubia wood is notattacked by powder post beetles.
M. dubia wood was got analyzed for paper making
qualities and the results are presented in table 2. It is evidentthat pulp yield of M. dubia is comparable with eucalyptusand poplar. The bulk density is little lower and the kappa
number little higher than eucalyptus and poplar, indicatethat it is not bad to use for paper making. Though M. dubiais little on the lower side for paper quality but is comparable
with eucalyptus and poplar, thus, selling of wood of M. dubiadue to its diverse uses will not be a problem.
The average market rates of M. dubia are less than
eucalyptus and poplar, yet the timber rates are comparable(Table 2). Grewal (2000) also suggested the on-farmprofitability of M. azedarach. It is so because eucalyptus
and poplar have limited zone of establishment and M. dubia
has wide adaptability. Therefore, growing M. dubia inHaryana on a large scale would boost economy equally in
all parts of state.
Out of 100 persons interviewed for its adoption,everyone was in favour of growing M. dubia in Haryana on a
large scale. M. dubia grows much faster than the indigenousM. azedarach (Chauhan et al., 2008). Besides the bole ofM. dubia is straighter and less branchy, thus facilitates inter-
cultivation of crops underneath. The survival of M. dubia isalso higher than other tree species because the leaves arenot a good fodder and the animals eat it only in scarcity. The
instant greening is the most important reason for the loveof foresters towards M. dubia. People of Haryana havegone crazy after M. dubia and want to plant more and more
of it on their farms. The wider adoption of this species inHaryana and adjoining states requires attention on low costvegetative propagation technology and tree-crop interface
research for economic and environmental benefits.
REFERENCESChauhan, R., Chauhan, S.K. and Saralch, H.S. (2008) Melia
azedarach. Bulletin pubished by Department of Forestry andNatural Resources, PAU Ludhiana, 48p.
Grewal, S.S. (2000) Evaluation of drake (Melia azedarach) raisedin agroforestry systems by farmers of Punjab Shiwaliks. Ind.J. Soil Consv. 28: 253-255.
Luna, R.K., Singh, B. and Sharma, S.K. (2006) Assessment of 51progenies of Melia azedarach Linn.-A promising agroforestrytree. Ind. For. 132: 941-951.
Stewart, M. and Blomley, T. (1994) Use of Melia volkensii in a semi-arid agroforestry system in Kenya. Commonwealth ForestryReview 73: 128–131.
Table 2. Comparison among three important agroforestry species for paper making qualities and timber sale prices
S. No. Paper quality test Eucalyptus tereticornis Populus deltoides Melia dubia
1 Pulp yield (%) 50 50.20 49.8
2. Bulk density (kg m-2) 225 207 194
3. Kappa number (at 17 % active alkali) 12.1 13.1 14.9
4. Timber sale prices (Rs. m-3) 5000 4500 4000
Received 16 January, 2011; Accepted 18 May, 2011
Melia dubia is a Potential Species for Agroforestry

Bougainvillea is one of the most useful plants forlandscaping in almost all the parts of the World. Schoelhorn
and Alavrez (2002) recorded that the bloom cycles ofbougainvillea are typically from four to six weeks. The plantrequires little water to flower. In India, Bougainvillea grows
best in all the parts of the country but its cultivation is limitedin temperate climate with heavy snowfall and severe frost. Itgenerally fails to flower in shade and the color of the bract is
never bright (Randhawa and Mukhopadhyay,1986). In northIndian plains, especially in Punjab, most varieties bearbracts from September to December and again from
February to June. Plant growth in compost-based mediacontaining peat or bark was equal to or better than that intwo commercial media composed primarily of bark or peat.
(Ticknoor et al.,1985). Increased land costs in urban areasresulted in less space for the plants and people preferraising indoor plants in pots, thus, the environmental
conditions like sunshine and temperature is not adequate.Therefore, the investigation was carried out to categorizethe different cultivars of Bougainvillea according to their
response to the different sunshine hours and potting media.
Response of Potting Media and Sunshine on Bougainvillea Cultivars
Ravipal Singh and R.K. Dubey*Department of Floriculture and Landscaping,
Punjab Agricultural University, Ludhiana - 141 004, India*E-mail:[email protected]
The present experiment was carried out at LandscapeNursery unit, Department of Floriculture and Landscaping,
Punjab Agricultural University, Ludhiana during the year(2008-10). Five different potting media i.e., soil, soil + leafmould (1:1), soil + vermicompost (1:1), soil + FYM (1:1) and
coco peat + vermicompost (1:1) were used forstandardization of optimum potting media for quality potproduction of Bougainvillea. Ten varieties (Torch glory,
Zakeriana, Shubhra, Thimma, Mahara, Meera, Mohan, LadyMary Baring, Mrs. H. C. Buck and Scarlet Queen) wereexposed to variable sunlight treatments like 4 hours, 8 hours
and full sunlight by constructing a temporary structures(Fig. 1) in the East- West direction being covered their topand sides with the black polythene sheet for providing the
shade to the plants after exposing them to 4 hours and 8hours sunlight. Dimensions of the temporary structure(shed) was 25’ (L) x 22’ (B) x 6’ (H1) x 3’ (H2).Each structure
accommodates 450 pots of bougainvillea plants. The verticalhanging was also given to provide the shade to pot plantsunder different sunshine hours. The length of the vertical
hanging was adjusted according to the varying angle of the
Fig.1. Side view of specially designed structure showing both the hangings (horizontal and vertical) in different
Indian J. Ecol. (2012) 39(1) : 138-140Indian Journal
of Ecology

139
sun in different months during the experiment. The tenexperimental varieties selected were. The experiment was
laid out in FCRD (Factorial Completely Randomized BlockDesign). The Bougainvillea plants about 1-1.5 years oldwas transplanted in 8 inches size earthen pots in three
replications. Observation like number of bracts/plant indifferent potting media and colour of bracts during openingand senescence was recorded and was interpreted indifferent months.
The data showed significant influence of potting mediaon number of bracts/plant in bougainvillea (Table1). Amongvarious potting media, soil + leaf mould (1:1) recorded
maximum number of bracts/plant from September (3.72)to July (15.22) followed by soil + vermicompost (1:1) exceptin the month of Feb, while minimum number of bracts/plant
were recorded in cocopeat + vermicompost (1:1) duringSeptember (1.65) to July (5.66). More number of bracts/plant in soil + leaf (1:1) mould may be attributed due to high
(36.59) C:N ratio of the media as compared to 14.3 C:N
ratio of soil + vermicompost (1:1). Less number of bracts/plant were found during the months of December- January
in all the media. This might be due to the periodic floweringcharacter of the different cultivars of Bougainvillea.
Sunlight duration of 8 hours (8.39) resulted in maximum
number of bracts/plant. Number of bracts (8.26) in fullsunlight was found to be at par with 8 hours sunlight (Table2). Hackett and Sachs (1965) recommended that floweringcan be increased in bougainvillea by increasing light
intensity through improved plant spacing. Further, it wasconfirmed by (Dol et al., 1992) that quality of potted floweringplants (generally placed in shaded area) is often greatly
affected by poor environmental conditions, such as low lightintensity, high or low temperature, variation and water stress.Wurr et al. (2000) found that light is an essential prerequisite
factor for the plant growth and development. Criley (1977)reported that 8 hours day length was significantly moreeffective than 14.0 - 14.5 hours day length. Rate of progress
to flowering increased linearly with temperature and with
Table 1. Influence of potting media on bracts/plants in Bougainvillea
Media Sept. Oct. Nov. Dec. Jan. Feb. Mar. Apr. May June July
Soil 3.30 4.96 6.93 4.38 2.63 0.87 4.26 5.16 5.85 6.12 6.88
Soil + Leaf mould (1:1) 3.72 6.19 10.08 4.64 2.88 1.11 5.54 12.11 13.22 13.87 15.22
Soil + Vermicompost (1:1) 3.51 5.64 7.29 4.30 2.71 0.89 5.00 6.64 7.12 7.88 8.16
Soil + FYM (1:1) 2.35 3.19 4.04 1.56 1.19 0.49 4.16 4.70 5.12 5.22 6.00
Cocopeat + Vermicompost (1:1) 1.65 2.47 2.93 1.14 0.99 0.42 4.01 4.26 4.67 5.09 5.66
C.D ( 0.05) 0.22 0.42 0.34 0.10 0.17 0.10 0.10 0.31 0.24 0.28 0.28
Table 3. Number of bracts/plant in different varieties of Bougainvillea
Varieties Sept. Oct. Nov. Dec. Jan. Feb. Mar. Apr. May June July
T. Glory 5.44 8.89 9.54 3.29 - - 6.19 7.78 8.12 9.36 10.58
Zakeriana 4.69 6.04 6.47 2.05 - 0.99 9.26 11.00 11.88 12.97 13.78
Shubhra - 1.10 2.27 3.95 5.05 1.39 5.12 6.84 7.62 8.00 8.69
Thimma 5.44 6.93 6.88 1.87 0.16 1.19 4.13 7.00 7.84 8.63 9.11
LadyMaryBaring 3.88 5.55 12.80 3.86 - - 1.93 13.26 14.56 17.22 19.12
Mrs.H.C. Buck - 4.49 9.18 2.53 - - 6.71 6.88 7.22 8.54 9.87
Mohan 0.24 0.11 1.30 2.94 3.99 0.73 5.01 5.96 6.99 8.12 9.54
Mahara 2.44 3.62 4.57 5.57 6.15 1.36 6.00 7.85 8.46 9.35 10.11
Scarlet Queen 3.72 5.54 5.63 1.06 - 0.92 8.11 10.09 11.26 12.59 14.12
Meera 1.93 2.65 3.90 4.93 5.47 1.00 6.33 7.54 8.12 9.46 10.19
C.D (0.05) 0.31 0.34 0.34 0.31 0.14 0.14 0.16 0.44 0.34 0.34 0.38
Table 2. Influence of sunshine on bracts/plants in Bougainvillea
Sunlight Sept. Oct. Nov. Dec. Jan. Feb. Mar. Apr. May June July
4 hours 2.55 4.10 5.56 2.71 1.23 0.48 4.47 5.12 5.32 5.61 5.85
8 Hours 3.15 4.87 6.59 3.61 3.36 1.04 5.82 6.36 7.01 7.59 8.39
Full sunlight 3.02 4.51 6.61 3.23 1.65 0.75 5.15 6.03 6.89 7.48 8.26
C.D (0.05) 0.17 0.32 0.26 0.78 0.13 0.78 0.78 0.44 0.17 0.22 0.21
Response of Potting Media and Sunshine on Bougainvillea

140
increase in photoperiods (Adams et al., 1997).
The maximum number of bracts (19.12) per plant was
observed in variety Lady Mary Baring in the month of July.Numbers of bracts in different varieties were found to beminimum in months from December- February except
Shubhra, Mohan, Mahara and Meera. This may be due tothe frequent rains and fog, which reduced the solar radiationintensity and sunshine hours. No flowering was observed
in varieties Torch Glory, Zakeriana, Lady Mary Baring, ScarletQueen and Mrs. H. C Buck in the month of January andFebruary. This may be due to resting period of these
varieties. It was found that all varieties flowered profusely insoil + leaf mould (1:1) media under different sunshineconditions. Varieties like Shubhra (12.99), Mohan (10.98)
and Mahara (13.09) showed maximum number of bracts/plant in 4 hours sunshine duration. Golstev et al. (2003)recommended that extremely high irradiation destroys
photosynthetic pigments. Chen et al. (1979) also reportedthat short day promotes flowering in Bougainvillea. Varietieslike Zakeriana (12.26), Thimma (9.11), and Scarlet Queen
(14.12) were found to have maximum number of bracts/plant in 8 hours sunshine duration. Other varieties like TorchGlory (11.21) and Lady Mary Baring (19.1) showed maximum
number of bracts/plant in full sunlight conditions. Munir etal. (2004) found that photoperiod and temperature are majorinfluencing factors on time of flowering.
REFERENCESAdams, S. R., Pearson, S. and Headly, P. (1997) Effect of
temperature, photoperiod and light integral on the time to
flowering of Pansy cv. Universal violet (Viola x wittrockianaGams). Annals of Bot. 80: 107-112.
Chen, Z., Sachs, R. and Heckett, W. P. (1979) Control of floweringin Bougainvillea ‘San Diego Red’ metabolism of benzyl adenineand action of gibberellic acid in relation to short day induction.Plant Physiol. 64(4): 646-651.
Criley, R. A. (1977) Year around flowering of double bougainvillea.J. Amer. Soc. Hort. Sci. 102(6): 775-778.
Dol M., Mizuo, T. and Imanishi, H. (1992) Post harvest quality ofImpatiens Walleriana hook. as influenced by silverthiosulphate application and light condition. J. Japan Soc. Hort.Sci. 61: 643-649.
Golstev, V., Zaharieva, I., Lambrev, P., Yordanov, I. and Strassar, R.(2003) Simultaneous analysis of prompt and delayedchlorophyll ‘a’ fluroscence in leaves during the induction periodof light to dark adaptation. J. Theor. Biol. 225:171-83
Hackett, W. P. and Sachs, R. M. (1965) Factors affecting floweringin Bougainvillea. Calif. Agri. 19:47-56.
Munir, M., Jamil, M., Baloch, J. and Khattak, R. K. (2004) Impact oflight intensity on flowering time and plant quality of Antirhinumcv. Chimesnhite. J.Zhejiang Uni.Sci. 3: 1634-1636.
Randhawa, G. S. and Mukhopadhyay, C. S. (1986) Floriculture inIndia. Allied Publishers Private Limited, pp.171-78
Schoelhorn, R. and Alavrez, R. (2002) E. Warm climate productionguidelines for Bougainvillea Univ. Florida/IFASExtn. 874.
Ticknoor, R. L., Hemphill, D. D. and Flower, D. J. (1985) Growthresponse of Photima, Thuja and nutritional concentration intissue and potting medium as influences by composted sewagesludge, peat, bark and saw dust on potting media J. Envi.Hort. 3(4): 176-180.
Wurr, D. C. E., Jane, R. F. and Lynn, A. (2000) The effect oftemperature and day length on flower initiation anddevelopment in Dianthus allwoodii and Dianthus alpines.Scientia Hort. 86: 57-70.
Received 4 August, 2011; Accepted 5 February, 2012
Ravipal Singh and R.K. Dubey

Banana (Musa spp.) is the fourth most important foodcommodity that grows throughout in humid tropics andsubtropics with an annual production of 97.5 million tonnes
(Ganapathi et al., 2008). Application of micropropagationtechnique for large scale production of elite clones ofbanana is an effective and superior alternative to
propagation through conventional cuttings of Musa spp. Invitro propagation technique for banana (Musa acuminataL.) cv. ‘Grand Naine’ involves various steps, i.e.,
establishment of aseptic cultures, shoot multiplication,induction of rooting, hardening and transfer of plantlets tosoil. The maintenance of aseptic (free from all
microorganisms) or sterile conditions is essential forsuccessful tissue culture procedures. To maintain anaseptic environment, all culture vessels, media and
instruments used in handling tissues, as well as explantitself must be sterilized. Various sterilization agents are usedto decontaminate the tissues. These sterilants are also
toxic to the plant tissues, hence proper concentration ofsterilants, duration of exposing the explant to the varioussterilants, the sequences of using these sterilants has to
be standardized to minimize explant injury and achieve bettersurvival. Two different chemicals, 0.1% carbendazim(BavistinTM from BASF India Ltd, Mumbai) and mercuric
chloride (HgCl2) were used for the present study to reducethe incidence of both fungal and bacterial contaminationand to standardize the best sterilization protocol for in vitroculture of banana cv. ‘Grand Naine’.
The suitable explants were prepared from youngsuckers (3-13 cm diameter), carefully removed from the
field by digging a trench around the sucker to completelydetach it from the banana mother plants and brought to thelaboratory. All the soil was removed by washing them
thoroughly under running tap water for 10-15 min. The rootsand leaf sheaths of the suckers were removed with thehelp of a sharp knife. The shoot-tip explants were prepared
by removing extraneous corm tissue from suckers. Shoot-tips, containing several sheathing bases enclosing axillarybuds measuring about 4.5-5.5 cm in length were isolated.
These shoot-tips were first washed with TeepolTM for 4-5
Efficient In vitro Sterilization Technique for Micropropagation ofBanana (Musa acuminata) cv. ‘Grand Naine’
Pooja Manchanda*, Ajinder Kaur and S. S. GosalSchool of Agricultural Biotechnology, Punjab Agricultural University, Ludhiana-141 004, India
*E-mail: [email protected]
minutes and then in running tap water for 5-10 minutes toremove the detergent. The pale-white tissue-block ofbanana containing shoot-tips and rhizomatous bases were
surface sterilized with 0.1% carbendazim on a rotary shakerfor which appropriate duration (25, 35, 45 and 55 min.) wasstandardized to make the explants free from any fungal
contamination. This treatment was followed by washingthem in running tap water for 4-5 min contained in culturejars were taken in a laminar air flow cabinet (Klenzaides,
Bombay) where these were further sterilized with mercuricchloride (HgCl2) for which optimum concentration out of 0.1and 0.2 per cent, and duration of 5, 8, 10 and 12 minues
were tested, to prevent bacterial contamination. Thistreatment was followed by rinsing the explants thrice insterile distilled water.
The surface sterilizing solution was prepared freshevery time. The exposed tissue from cut ends of eachsterilized block was removed to obtain a 2-3 cm portion
containing intact apex and one or more pairs of leaf primordiatogether with 3.5-4.0 cm of rhizomatous base. The explantin this form was used for inoculation. All glassware and
instruments were thoroughly washed and dried at 80°C.Distilled water and glassware used for explants wereautoclaved at 15 psi for 45 min. Implantations of sterilized
explants were done using Murashige and Skoog basalmedium. The cultures were placed in culture growth room.The observations were recorded regularly till 30 days for
the growing cultures. The experiment was repeated threetimes in completely randomized block design with twentyexplants per replication. Statistical analysis was done using
CPCS-1 software package developed at Punjab AgriculturalUniversity.
The data on the effect of pre-treatment with fungicide
and the duration of exposure on explant survival percentageare presented in Table 1. Cultured explants showed 100per cent contamination and did not survive when no
treatment of bavistin was given. There was significantreduction in per cent contamination with pre-treatment ofexplants with bavistin on a rotary shaker. Among the various
Indian J. Ecol. (2012) 39(1) : 141-142Indian Journal
of Ecology

142
durations of treatments, bavistin for 45 min was found bestand significantly effective than the other treatments, in which
57.71 per cent uncontaminated explants were obtained andthe per cent explant survival was 55.63. The survival percent was significantly reduced at lower durations, which
was 17.74 and 51.07 per cent at 25 and 35 minutes,respectively. Although percentage of contaminated explantscould be reduced when treatment was given for 55 minutes
but at the same time, explant survival rate was reduced to47.11 per cent. The use of antifungal agents to minimizethe contamination of in vitro cultures in Musa spp. has been
demonstrated by Nandwani et al. (2000).
Table 1. Effect of pre-treatment of explants with bavistin 0.1%on per cent explant contamination and survival in bananacv. ‘Grand Naine’
Duration of Contamination* Explant survival*
exposure (min.) (%) (%)
0 (Control) 100*(89.96)** 0.00(0.00)
25 82.55(65.28) 17.74(24.89)
35 66.77(54.77) 51.07(45.59)
45 57.71(49.42) 55.63(48.21)
55 35.18(36.36) 47.11(43.32)
CD (p = 0.05) 1.02 0.887
* Figures in parentheses are arc-sine transformed values.
Among the various combinations and concentrationsof HgCl2 tested, the HgCl2 @ 0.1 per cent for a duration of 10
minutes was found best and significantly effective than othertreatments, where 55.7 per cent survival of uncontaminatedexplants was obtained (Table 2). The treatment with shorter
durations (5 and 8 minutes) showed significantly lessexplant survival percentages of 21.86 and 47.03,respectively. An increase in the concentration of HgCl2(0.2%) and increase in duration of sterilization resulted indrying out and death of explants. The reduction in explantsurvival percentage with increase in the duration of exposure
might be due to phytotoxicity caused by mercuric ions (Hg2+)present in mercuric chloride. Thereafter, the explants wereestablished in the medium after the removal of dead
tissues.
Effectiveness of mercuric chloride for sterilization ofexplants collected from field-grown suckers of banana has
been reported by many workers (Shiragi et al., 2008; Kacaret al., 2010). However, the kind, concentration and durationof sterilization treatment required vary with the degree of
contamination, type and hardiness of explants.
Thus, in the present study, an effective sterilizationtechnique for suckers of banana cv. Grand Naine wasworked out. It was established that treatment of field
collected suckers first with 0.1% bavistin solution for 45min and then with 0.1% HgCl2 for 10 min helps in achievingmore than 50 per cent reduction in contamination due to
fungus and bacteria, respectively and more than 55 percent explant survival. This sterilization may be followed forother banana cultivars also.
REFERENCESGanapathi, T.R., Sidha, M., Suprasanna, P., Ujjappa, K.M., Bapat,
V.A. and D’Souza, S.F. (2008) Field performance and RAPDanalysis of gamma-irradiated variants of banana cultivar ‘GiantCavendish’ (AAA). Intl. J. Fruit Sci. 8: 147-159.
Kacar, Y.A., Bicen, B., Varol, I., Mendi, Y.Y., Serce, S. and Cetiner,S. (2010) Gelling agents and culture vessels affect in vitromultiplication of banana plantlets. Genet. Mol. Res. 9: 416-424.
Nandwani, D., Zehr, U., Zehr, B.E. and Barwale, R.B. (2000) Masspropagation and ex vitro survival of banana cv. Basrai throughtissue culture. Garten Bauwissen Chaft 65: 237-240.
Shiragi, M.H.K., Baque, M.A. and Nasiruddin, K.M. (2008) Eradicationof banana bunchy top virus (BBTV) and banana mosaic virus(BMV) from infected plant of banana cv. Amritasagar throughmeristem culture. South Pacific Studies 29: 17-41.
Table 2. Effect of mercuric chloride (HgCl2) treatment (followingantifungal treatment) on per cent explant contaminationand survival in banana cv. ‘Grand Naine’
Concentration Duration of Contamination* Explant
(%) exposure (%) survival*
(min.) (%)
Control - 100 0
(89.96) (0)
0.1 5 77.61 21.86
(61.73) (27.86)
8 61.66 47.03
(51.73) (43.28)
10 50.8 55.7
(45.44) (47.89)
12 44.33 53.3
(41.72) (46.87)
0.2 5 62.18 26.34
(52.04) (30.86)
8 50.38 17.75
(45.19) (24.90)
10 42.13 14.06
(39.21) (22.01)
CD(0.05) 1.49 0.995
*Figures in parentheses are arc-sine transformed values.
Received 12 July, 2011; Accepted 14 January, 2012
Pooja-Manchanda, Ajinder-Kaur and S. S. Gosal

Bracon hebetor Say is an effective bio-control agent aslarval parasitoid of some lepidopteran insect-pests. It canbe easily mass multiplied in the laboratory and releasedinto the crop field for bio-control (Khan et al., 2009). In recentyears, the adoption of bio-intensive pest managementapproach has been stressed but this strategy requiresattention on the impact and selectivity of the bio-pesticidesand insecticides either singly or in combination on naturalenemies. The conservation of natural enemies like B.hebetor through effective integration of these pesticideswould be a valuable bio-intensive pest management (BIPM)options for many crops. The selective insecticides, lesstoxic to natural enemies than to target pests, are helpful inintegration of biological control and chemical applications(Hull and Beers, 1985). Croft (1990) concluded that most ofthe conventional insecticides have harmful effects on non-target organisms including natural enemies. Apart from this,neem based botanicals have also shown toxicity to B.hebetor (Raguraman and Singh, 1998). Among the newchemistry insecticides spinosad was highly toxic to Braconmellitor (Kovalankov, 2002). Danfa and Valk (1999)documented 100 per cent mortality of Bracon hebetoragainst Metarhizium sp. and Beauveria bassiana. Theeffect of Bacillus thuringiensis on Bracon instabilis wasstudied by Salama et al. (1996), who reported prolongedimmature stages of Bracon followed by reduced emergenceof adults with less fertile females. Acknowledging theavailable literature, it is not enough to get a clear picture ofthe selectivity of bio-pesticides and insecticides to be usedalong with the Bracon hebetor in a sustainable bio-intensivepest management. So, the present study was conductedwith an objective of finding selective bio-pesticides andmodern chemical insecticide either single or their differentcombinations against B. hebetor when the later can beused in integration with them for management of importantlepidopteran larvae.
Studies on the toxic effect of bio-pesticides, syntheticinsecticides and their combination to natural larvalparasitoid Bracon hebetor was conducted in the Laboratorycondition in completely randomized block design and eachtreatment was replicated thrice. The larval parasitoid B.
hebetor used in this study was obtained from the bio-controllaboratory, Bidhan Chandra Krishi Viswavidyalaya, Kalyani,Nadia, West Bengal. For such study, glass tube of 15 x 2.5cm size was smeared with 0.5ml of pesticide solution.Freshly emerged 10 adults of B. hebetor were transferredinto each treated tube. The tubes were then covered with acotton cloth and honey (5%) was provided as food with thehelp of cotton swab at the top of the cloth. Mortality of theadult larval parasitoids was recorded at every one day intervalupto 4 days after treatment. The Data collected on adultmortality were subjected to statistical analyses after angulartransformations and the means were separated by DMRT(Gomez and Gomez, 1984).
The detailed results of the present research on thetoxic effect of bio-pesticides, chemical pesticides and someof their different mixtures on larval parasitoid B. hebetor ispresented in Table 1. M. anisopliae was at par with untreatedcontrol with no mortality. All other treatments as comparedto untreated check differ significantly in terms of mortality ofadult Bracons. Among chemical insecticides, the cartaphydrochloride @ 0.1% proved highly toxic with 100 per centmortality. At par mortality was recorded at different timeintervals in separate mixture of cartap hydrochloride withbio-pesticides Bacillus thuringiensis var kurstaki andMetarhizium anisopliae at half of their recommendeddoses. The complete mortality was observed for both of themixtures at four days after treatment. In comparison to this,the new chemistry insecticide flufenoxuron was relativelymore safe causing only 16.92 per cent mortality to adultBracon hebetor exposed to four days after treatment. It wasstatistically at par with Bacillus thuringiensis var kurstaki,neem oil and Beauveria bassiana at different time hours.After four days of exposure, among microbial pesticides, B.thuringiensis caused relatively more mortality (13.43%)followed by B. bassiana (9.70%) and M. anisopliae (nil).The separate mixture of neem oil with B. thuringiensis andM. anisopliae were relatively safer than cartap hydrochloride50 SP mixtures.
The very negligible per cent of contact toxicity wasrecorded for adult Bracon hebetor to Bacillus thuringiensis
Effect of Some Bio-pesticides and Chemical Pesticides on Survivalof Larval Parasitoid Bracon hebetor Say (Hymenoptera: Braconidae)
Lakshman Chandra Patel* and Anirudhya Pramanik1
Ramkrishna Ashram KVK, Nimpith Ashram, South 24 Parganas, W.B. – 743 338, India1AICRP on Plant Parasitic Nematodes, BCKV, Kalyani, Nadia, W.B., India, India
*E-mail: [email protected]
Indian J. Ecol. (2012) 39(1) : 143-144Indian Journal
of Ecology

144
var kurstaki. This particular information is indirectlyaccordance with the result obtained by Salama et al. (1996).Although, 100 per cent mortality of the parasitoid wasreported by Danfa and Valk (1999) when exposed to M.anisopliae and B. bassiana but in this study both the fungalpathogens were safe to Bracon hebetor. Such contradictoryfinding might be due to differences in strains of both theentomopathogens. Aqueous suspension and ethanolicextract of neem seed kernel (NSK) were safe to Braconhebetor in respect of ovipositional deterency, toxicity(Raghuraman and Singh, 1998), which more or lesscorroborates the present findings. In this present study, thenew generation insecticide flufenoxuron was less toxic toBracon hebetor, although Khan et al. (2009) proved slightlyharmful to harmful effect after 48 hours of application of theother new generation insecticides like emamectin benzoate,abamectin, spinosad, indoxacarb and methoxyfenozide atdifferent doses. The complete mortality was observed inthe adults treated with recommended dose rate ofconventional insecticide cartap hydrochloride just after 24hours of application. Moreover, the separate mixture of thesame with Bacillus thuringiensis var kurstaki andMetarhizium anisopliae at half of their recommended dosewere not also safe at all to Bracon after 96 hours ofapplication. These results are indirectly supported withthose obtained by Reddy et al. (1997) and Mandal andSomchoudhury (1995), who reported the toxicity of theconventional insecticides to Bracon hebetor.
It can be concluded that the bio-pesticides such asBacillus thuringiensis var kurstaki, Metarhizium anisopliae,Beauveria bassiana and neem oil either solo or their mixapplication may be used with Bracon hebetor in bio-intensive pest management. Safe insecticide like
flufenoxuron may be integrated with bio-pesticides andBracon hebetor for successful implementation oflepidopteran pest eradication as well as insecticideresistance management.
REFERENCESCroft, B. A. (1990) Arthropod Biological Control Agents and
Pesticides. John Wiley and Sons, New York.Danfa, A. and Valk, H.C.H.G. (1999) Laboratory testing of
Metarrhizium spp. and Beauveria bassiana on Sahelian non-target arthropods. Biocontrol Science and Technology 9(2):187-198.
Gomez, K. A. and Gomez, A. A. (1984) Statistical Procedures forAgricultural Research. John Wiley and Sons, New York. pp. 680.
Hull, L.A. and Beers, E.H. (1985) Ecological sensitivity modifyingchemical control practices to preserve natural enemies. In:Biological pest Control in Agricultural Ecosystem. Acad.Press, Orlando, Fla., pp. 103-121.
Khan, R. R., Ashfaq, M., Ahmed, S. and Sahi, S.T. (2009) Mortalityresponses in Bracon hebetor (Say) (Braconidae:Hymenoptera) against some new chemistry and conventionalinsecticides under laboratory conditions. Pak. J. Agri. Sci.46(1): 30-33.
Kovalankov, V.G. (2002) A biomethod for condition of arthropodsresistances to insecticides. Zahista-i-Karantin-Res-Tenni. 5:18-19.
Mandal, S.K. and Somchoudhury, A.K. (1995) Bioefficacy ofcommercial formulation of insecticides against Bracon hebetor(Say). Ind. J. Entomo. 57: 50-54.
Raguraman, S. and Singh, R.P. (1998) Behavioural and physiologicaleffects of neem (Azadirachta indica) seed kernel extracts onlarval parasitoid. Bracon hebetor. J. Chem. Eco. 24(7): 1241-1250.
Reddy, G.R., Sreelatha, S. and Divakar, B.J. (1997) Toxicity of sixinsecticides to two species of Bracon. Ind. J. Plant Prot. 25:135-136.
Salama, H.S., Zaki, F.N. and Sabbour, M.M. (1996) Effect of Bacillusthuringiensis endotoxin on Apanteles litae Nixon and Braconinstabilis Marsh. (Hym.: Braconidae), two parasitoids of thepotato tuber moth Phthorimia operculella Zeller (Lep.,Gelishiidae). J. Appl. Entomo. 120 (1-5): 565-568.
Table 1. Toxicity of microbial, botanical, chemical pesticides and their mixtures on adult of larval parasitoid Bracon hebetor
Dose Adult mortality (%) of Bracon hebetor
(Days after treatment)
1 2 4
Bacillus thuringiensis var kurstaki 5% WP @ 0.1% 3.03e 6.73ef 13.43d
Metarhizium anisopliae 1% W/W @ 0.5% 0.00e 0.00e 0.00e
Beauveria bassiana 1% W/W @ 0.5% 3.92e 7.25ef 9.70d
Neem oil 5000 ppm @ 0.2% 7.50de 10.83de 10.83d
Flufenoxuron 10% DC @ 0.1% 6.73de 11.62de 16.92cd
Cartap hydrochloride 50 SP @ 0.1% 100.00a 100.00a 100.0a
Bacillus thuringiensis var kurstaki 5% WP @ 0.05% + Neem oil @ 0.1% 20.06c 23.33e 30.00b
Bacillus thuringiensis var kurstaki 5% WP @ 0.05% + Cartap hydrochloride 53.33b 63.33b 100.00a
50 SP @ 0.05%Metarhizium anisopliae 1% W/W @ 0.25% + Neem oil 0.1% 12.22d 17.78cd 25.00bc
M. anisopliae 1% W/W @ 0.25%+ Cartap hydrochloride 50 SP @ 0.05% 55.00b 60.00b 96.67a
*No mortality was recorded in untreated control
*In a column, means followed by same alphabet are not significantly different (P=0.05) by DMRT
Received 12 December, 2011; Accepted 4 March, 2012
Lakshman Chandra Patel and Anirudhya-Pramanik
145
Sulfosulfuron is a main member of the sulfonylurea
family of herbicides used widely throughout the world forthe control of broadleaf and grassy weeds in a range ofcrops. The fundamental mode of action for sulfosulfuron
and indeed all sulfonylurea herbicides entails inhibition ofacetolactate synthase (ALS) an essential enzyme in aliphaticamino acid synthesis (Maheshwari and Ramesh, 2007).
The sulfonylurea herbicides are mainly degraded by non-biological chemical hydrolysis and soil micro organisms.Some parts of the herbicides are also lost from the upper
soil layers as they leach down from the surface to the lowerlayers. Excessive mobility and persistence of sulfonylureaherbicides in soils may cause groundwater contamination
and phytotoxicity to rotational crops. This movement ofherbicides in the soil profile is also dependent upon soilfactors such as pH, clay and organic matter (Yaron, 1989;
Ramesh and Maheswari, 2003). Sulfonylurea herbicidesare weak acids and they exist primarily in the anion form inagronomic soils. Consequently, sulfonylurea herbicides are
generally weakly adsorbed by soil (Eleftherohorinos et al.,2004). The adsorption and leaching behaviour determinethe persistence of a herbicide. Thus, adsorption and
leaching behavior of sulfosulfuron need to be studied fordetermining the persistence of sulfosulfuron. Hence, thepresent study was conducted.
An experiment was conducted during 2005 in theherbicide residue laboratory of the department of Agronomy,Punjab Agricultural University, Ludhiana to study the
adsorption and leaching behavior of sulfosulfuron. The soilwas loamy sand in texture (sand 71.2 %, silt 12.3 % andclay 15.8 %) having pH 8.2, organic carbon 0.32 and EC 0.2
dS m-1. The type of soil selected was loamy sand becauseit is the predominant type of soil in Punjab. Sulfosulfuron atfield rate for wheat crop i.e., 25 g ha-1, double (50 g ha-1) and
four times (100 g ha-1) the field rate was used to study theadsorption and leaching behaviour.
For this study, PVC columns having 10 cm internal
diameter and 65 cm length were used. Each column wasdivided into two longitudinal segments by cutting thecolumns lengthwise in the middle. The two column
Adsorption and Leaching Behaviour of Sulfosulfuron
S. K. Randhawa and Amandeep Singh Brar*Department of Agronomy
Punjab Agricultural University, Ludhiana-141 004, India*E-mail: [email protected]
segments were then rejoined by using the plastic tape. Soil
representing different soil depths (0-10, 10-20, 20-30, 30-
40, 40-50 and 50-60 cm) was taken from the field, dried in
shade, ground, sieved and filled in soil columns depth wise
with constant gentle shaking. The base of each column
was closed by tying a muslin cloth to it. The top of the soil
columns was covered with 2 cm of sand so as to prevent
crust formation resulting from the addition of water which
may hamper the downward movement of water. Columns
were then placed on the plastic funnels adjusted on the
tripod stands and connected to the beakers meant to collect
the leachate. Water was added on the surface of columns
and the columns were covered from the top by using
aluminium foil to prevent any evaporation from the surface.
Columns were brought to the field capacity by adding water
from the top and waiting till dripping stops from the base.
Herbicide doses corresponding to 25, 50 and 100 g ha-1
were calculated on the basis of surface area of the top of
the columns, dissolved in 5 ml of water and added over the
soil surface in the columns. Herbicide was then leached
with 20 ml water and the leachates collected after 24 hours
were analyzed by HPLC for the detection of residues.
Thereafter, 25 ml of water was added on the surface of the
columns after every 24 hours and leachates collected
everyday were analyzed. The leachates were collected for
10 consecutive days. The leachates thus collected were
acidified using 2 per cent phosphoric acid and partitioned
with dichloromethane. The dried sample was taken in
acetonitrile for injection into HPLC. The percentage recovery
of sulfosulfuron from the fortified sample of water was foundto be 91 per cent.
On the eleventh day, the soil columns were longitudinallycut open using a sharp knife into two parts by tearing theplastic tape holding the two column segments together.
Two parts of column were taken as two replicates. Depth-wise sampling of soil profile in the column was done bytaking samples from both the segments. Soil depth from 0-
10 cm formed the first sample with subsequent 10 cmdepths forming the remaining samples. The samples weretaken up to 60 cm depth. The soil was dried in shade, ground,
Indian J. Ecol. (2012) 39(1) : 145-147Indian Journal
of Ecology

146
sieved and weighed. The soil was analyzed for thesulfosulfuron residue by using HPLC on Waters 600Controller and Pump and Waters 2487 Dual Absorption
Detector. The percentage recovery of sulfosulfuron from thefortified sample of soil was found to be 86 per cent.
The results obtained from the analysis of leachates
collected from the column base (Table 1) revealed that onfirst day the concentration of sulfosulfuron residues inleachates was 0.06, 0.11 and 0.19 ppm under X, 2X and 4Xdose, respectively. Assuming the concentration of
sulfosulfuron residues in leachates as 100 per cent on firstday, the concentration of sulfosulfuron residues in leachates,on second day, increased to 166.7, 172.7 and 126.3 per
cent and, on third day, the concentration of sulfosulfuronresidues in leachates decreased to 83.3, 72.7 and 57.9 percent under X, 2X and 4X dose, respectively. The
concentration of sulfosulfuron residues, on fourth day, againreduced to 50.0, 54.5 and 52.6 per cent against 37.3, 54.5and 42.1 per cent under X, 2X and 4X dose, on fifth day
respectively. Whereas, on sixth day, the concentration ofresidues of sulfosulfuron in leachates further reduced onseventh day, reached below detectable limit (<0.01ppm)
under X dose and it was reduced to 9.1 and 10.5 per centunder 2X and 4X dose, respectively. Further, on eighth day,
the concentration of residues of sulfosulfuron in leachatesreduced to below detectable limit under both X and 2X doseand it was 5.3 per cent under 4X dose. On ninth and tenth
days, the concentration of residues of sulfosulfuron wasbelow detectable even at 4X dose of sulfosulfuron. Theconcentration of sulfosulfuron residues took 7-9 days to go
below detectable limit indicating that sulfosulfuron persistsfor a long time. These observations gain support from thefindings of Eleftherohorinos et al. (2004) who also reportedthat sulfonylurea exhibit persistence even at low rates of
application.
The analysis of soil column revealed the highestconcentration of sulfosulfuron residues in the top 0-10 cm
depth (Table 2) while there was decrease in the residueconcentration in the soil at 10-20 cm and 20-30 cm soildepths under all the doses of herbicide. With every increase
in soil depth from 30-40 to 40-50 and 50-60 cm, theconcentration of sulfosulfuron from residue increased. Theresults indicated that at higher rates, sulfosulfuron takes
more time to leach down below detectable limit. Adsorptionof sulfosulfuron was more in the top 0- 20 cm soil depthand again in 30 to 60 cm soil depth. It might be due to the
presence of organic matter in the plough layer (0-20 cm)and due to higher clay content in the lower layers because
Table 1. Concentration of sulfosulfuron in leachate taken at different intervals
Sampling intervals Concentration of sulfosulfuron (ppm) in leachate at different concentrations
(days after treatment)
25 g ha-1 (X) 50 g ha-1(2X) 100 g ha-1(4X)
1 0.06 0.11 0.19
2 0.10 0.19 0.24
3 0.05 0.08 0.11
4 0.03 0.06 0.10
5 0.02 0.06 0.08
6 0.01 0.02 0.03
7 BDL 0.01 0.02
8 BDL BDL 0.01
BDL-Below detectable limit residue was below BDL after 8 day
Table 2. Concentration of sulfosulfuron in soil taken at different depths from the soil column
Soil depth (cm) Concentration of sulfosulfuron (ppm) in soil at different concentrations
25 g ha-1 50 g ha-1 100 g ha-1
0-10 0.06 0.11 0.22
10-20 0.05 0.06 0.13
20-30 0.04 0.05 0.06
30-40 0.04 0.06 0.12
40-50 0.05 0.06 0.14
50-60 0.06 0.07 0.17
S. K. Randhawa and Amandeep Singh Brar

147
as we go deeper in the soil profile clay content increases.Further, with the increase in the concentration of
sulfosulfuron there was increase in the adsorption.Srivastava et al. (2006) also reported that herbicide leachingwas more and adsorption was less in sandy soil and trend
was reverse in clay soil.
From the above studies, it may be concluded that theconcentration of sulfosulfuron residues was higher in the
leachates and it took more time to go below detectable limitwith the higher dose of application. Adsorption ofsulfosulfuron was more in the soil profile where organic
matter and clay content was higher and further, adsorptionwas more with higher dose of application.
REFERENCESEleftherohorinos, I., Dhima, K. and Vasilakoglou, I. (2004) Activity,
adsorption and field persistence of sulfosulfuron in soil. WeedSci. 32(3): 274-285.
Maheswari, S. T. and Ramesh, A. (2007) Adsorption and degradationof sulfosulfuron in soils. Environ. Monit. Assess. 127(1-3):97-103.
Ramesh, A. and Maheswari, S. T. (2003) Dissipation of sulfosulfuronin soil and wheat plant under predominant cropping conditionsand in a simulated model ecosystem. J. Agric. Food Chem.51(11): 3396-3400.
Srivastava, A., Agarwal, V., Srivastava, P. C., Guru, S. K. andSingh, G. (2006) Leaching of sulfosulfuron from two texturallydifferent soils under saturated moisture regime. J. Food Agric.Environ. 4(2): 287-290.
Yaron, B. (1989) General principles of pesticide movement togroundwater. Agric. Ecosystem Environ. 26(3-4): 275-297.Received 14 September, 2011; Accepted 10 February, 2012
Adsorption and Leaching Behaviour of Sulfosulfuron

Indian J. Ecol. (2012) 39(1) : 148-150Indian Journal
of Ecology
Screening of Seed Sources and Development of Powdery Mildew ofDalbergia sissoo Roxb.
K.S. Ahlawat*, J.C. Kaushik1, O.P. Lathwal and Avtar Singh2
Krishi Vigyan Kendra, Kurukshetra-136 118, India1Department of Forestry, CCS Haryana Agricultural University, Hisar-125 004, India
2PAU Regional Station,Bathinda-151 001, India*E-mail:[email protected]
Shisham (Dalbergia sissoo Roxb.) is an important
broad-leaved tree species of Indian subcontinent occurring
naturally from Indus to Assam. Its heartwood is strong and
durable, brown with dark figuring for which it is prized for
furniture and general wood work. It is extensively planted
under social forestry programme in northern Gangetic
plains. In the recent past, large scale mortality of shisham
has been recorded in different parts of India. Besides the
biotic causes, a number of stress factors such as changing
climatic conditions, water logging, longer dry spell, root
injury, soil compaction and salt accumulation are
responsible for shisham mortality (Shera and Saralch,
2006; Chauhan et al., 2007). A number of leaf spots and
powdery mildew fungi attack the foliage of shisham.
Powdery mildew is an important foliage disease caused
by Phyllactinia dalbergiae Prioz. is wide spread in
occurrence throughout the Indian subcontinent (Joshi and
Baral, 2000). Nautiyal (2007) has also highlighted the
growing problems in shisham and required improvement
strategies. However, meager information is available about
the role of climatic factors and development of powdery
mildew of shisham. Hence, the present investigation was
undertaken to screen the seed sources for disease
resistance and development of powdery mildew of
Dalbergia sissoo Roxb.
The present studies were carried out at theexperimental farm of Department of Agroforestry, CCSHaryana Agricultural University, Hisar (20o10/ N, 75o46/ E,
215 m above mean sea level), situated in the arid region ofnorth-western India. The maximum temperature duringsummer months ranges between 42 to 450C while the
minimum temperature during winter months sometimesgoes as low as 0oC or less sometimes even than that. Theaverage annual rainfall is about 350-425 mm, 75 per cent
is received from July to September and a few showers ofcyclonic rains are received in winter or late spring. In orderto find out the role of weather parameters on disease
development, the data on disease intensity were recorded
on three years old plantation under natural conditions at aninterval of 15 days from the initiation of disease.Simultaneously, the data on weather variables viz., maximum
and minimum temperature, relative humidity (morning andevening) and rainfall (mm) prevailing during the period ofstudy were obtained from Department of Meteorology, CCS
Haryana Agricultural University, Hisar. Screening of forty seedsources of Dalbergia sissoo Roxb. available at the researcharea of department of agroforestry, Hisar was undertaken
to find out the relative resistance against powdery mildewdisease under natural conditions. The seed sources weregraded under six different categories as immune (zero per
cent leaf area mildew), resistant (1-10 per cent leaf areamildew), moderately resistant (11-20 per cent leaf areamildew), moderately susceptible (21-40 per cent leaf area
mildew), susceptible (41-60 per cent leaf area mildew)and highly susceptible (61-100 per cent leaf area mildew).Hundred leaves were randomly graded from each seed
source and were examined carefully to calculate the percent disease intensity [{sum of all numerical rating/(totalnumber of leaves observed x highest grade)} x 100].
Out of the forty seed sources screened, none of theseed sources was found immune to the disease. Nineseed sources registered in the resistant group, nine in
moderately resistant group and seven seed sources inmoderately susceptible group. Rests of the seed sourceswere found susceptible to highly susceptible group (Table 1).
The pattern of disease progression amongst the nineseed sources recorded as Kurukshetra-419, Haldwani-24and Unna-Makdnmpur-52 (resistant), Manipur forest
fatehpur-56, Dabwali-26 and Haldwani S.B.412 (moderatelysusceptible), Tanakpur N.B.-431, Dabwali-210 and Sirsa-274 (highly susceptible). The environmental variables viz.,
temperature, relative humidity and rainfall are the mostcrucial, because they affect the pathogen. The diseaseappeared after the light showers in the last week of July and
first week of August. During July to August maximumtemperature ranged between 34.3-35.1oC and minimum

149
Tab
le 2
. P
er c
ent
dise
ase
inte
nsity
in
resi
stan
t, m
oder
atel
y an
d hi
ghly
sus
cept
ible
see
d so
urce
s of
shi
sham
at
fort
nigh
tly i
nter
val
Dat
e of
obs
erva
tions
Dis
ease
int
ensi
ty (
%)
(For
tnig
ht)*
Res
ista
nt s
eed
sour
ces
Mod
erat
ely
susc
eptib
le s
eed
sour
ces
Hig
hly
susc
eptib
le s
eed
sour
ces
Ku
ruks
he
tra
-41
9H
ald
wa
ni-
24
Unn
a-M
anip
ur f
ores
tD
ab
wa
li-2
6H
ald
wa
ni
Tana
kpur
Da
bw
ali-
21
0S
irsa
-27
4
mak
dnm
pur-
52fa
teh
pu
r-5
6S
.B.-
412
N.B
.-43
1
July
II-
--
--
-T
race
sT
race
sT
race
s
Aug
ust
I-
--
Tra
ces
Tra
ces
Tra
ces
4.89
8.62
4.23
Aug
ust
II-
--
3.82
2.62
4.85
8.23
9.23
8.69
Sep
tem
ber I
--
-5.
194.
246.
2810
.69
35.2
917
.62
Sep
tem
ber I
IT
race
sT
race
sT
race
s6.
468.
199.
1818
.30
21.2
324
.82
Oct
ober
I1.
001.
002.
008.
0011
.62
15.0
023
.62
30.3
933
.49
Oct
ober
II2.
532.
682.
9411
.92
15.4
318
.43
30.2
340
.62
45.2
8
Nov
embe
r I2.
702.
713.
0616
.45
17.6
921
.45
45.1
051
.30
58.4
3
Nov
embe
r II
2.70
2.80
3.60
18.4
919
.45
30.8
954
.65
58.7
262
.00
Dec
embe
r I3.
003.
804.
8621
.00
27.8
531
.69
60.1
364
.13
75.1
3
Dec
embe
r II
5.90
6.60
7.97
21.2
528
.49
36.0
062
.43
68.6
980
.00
Janu
ary
I6.
507.
208.
6222
.45
29.6
836
.49
65.1
372
.13
87.0
0
Janu
ary
II6.
508.
009.
5522
.45
30.1
538
.25
69.8
575
.00
87.6
5
*I-
Firs
t fo
rtni
ght
of m
onth
II- S
econ
d fo
rtni
ght
of m
onth
Tab
le 1
. R
eact
ion
of d
iffer
ent
seed
sou
rces
of
Dal
berg
ia s
isso
o ag
ains
t po
wde
ry m
ildew
dis
ease
und
er f
ield
con
ditio
ns
Rea
ctio
n C
ateg
ory
Cul
tivar
Imm
une
Nil
Res
ista
nce
(R)
Dab
wal
i-74
,Pro
geny
tes
t-35
,Kur
uksh
etra
-419
, H
aldw
ani-
290,
Pro
vena
nce
test
-4,
Hal
dwan
i-24
, U
nna-
Mak
dnm
pur-
52,
Hal
dwan
i-41
1, H
aldw
ani-
292
Mod
erat
ely
Res
ista
nt (
MR
)D
abw
ali-4
67,
Dab
wal
i-203
, H
aldw
ani-5
, S
irsa
(Bes
t)-1
7, D
abw
ali-6
2, M
ahen
der
naga
r (N
epal
)-44
2, H
aldw
ani-2
5, P
atia
la-5
7, H
aldw
ani-I
-23
Mod
erat
ely
Sus
cept
ible
( M
S)
Hal
dwan
i S
.B.-
412,
Dab
wal
i-269
, P
rove
nanc
e te
st-3
9, S
irsa-
209,
Man
ipur
for
est
fath
epur
-56,
Pro
vena
nce
test
-16
, P
rove
nanc
e te
st-4
8
Sus
cept
ible
(S
)S
irsa
-215
, S
irsa-
218,
Tan
akpu
r N
.B.-
432,
Pro
vena
nce
test
-271
, E
taha
wa-
54,
Sirs
a-21
4, L
udhi
ana-
107,
Pro
vena
nce
test
-53
Hig
hly
Sus
cept
ible
(H
S)
Dab
wal
i-210
, Ta
nakp
ur N
.B.-
431,
Hal
dwan
i-409
, S
irsa-
274,
Pro
vena
nce
test
-34,
Sirs
a-45
3, S
irsa-
I-75
150
temperature ranged between 23.0-24.7oC. The morningrelative humidity was in the range of 81.4-82.8 per cent,
while in the evening, it was between 59.1-66.1 per cent.The disease increased with the decrease in meantemperature and increase in percent relative humidity from
September onwards. The maximum disease intensity wasrecorded in the month of January when temperature rangedbetween 4.4-20.10C and relative humidity ranged between
63.4-97.0 per cent. With the progress of time, the diseasecontinued to increase in all the nine seed sources but variedin disease intensity. In resistant seed sources (Kurukshetra-
419, Haldwani-24 and Unna-Makdnmpur-52), the diseaseappeared in the second fortnight of September in tracesand progressed at slow rate and reached to maximum in
January (Table 2). In moderately susceptible seed sources(Manipur forest fathepur-56, Dabwali-269 and HaldwaniS.B.-412), the disease appeared in first fortnight of August
and progressed further upto January. Raghu and Mallaiah(1999) also observed that powdery mildew appeared onDalbergia sissoo in the month of August and maximum
was recorded in the month of January. In highly susceptibleseed sources (Tanakpur N.B.-431, Dabwali-210 and Sirsa-274), the disease appeared in the second fortnight of July
in traces and highest disease intensity was recorded inJanuary. The disease intensity in highly susceptible seedsources were also in variable ranges from 69.85 (Tanakpur
N.B.-431) to 87.65 per cent (Sirsa-274).
From the above study, it may be concluded that none ofseed sources was immune to the disease. The disease
appeared in first fortnight of August and continued to increasewith decrease in mean temperature and increase in relative
humidity. Appearance of Phyllactinia dalbergiae appearedfor a longer period of six months indicated that it couldwithstand wide range of temperature and relative humidity.
The maximum disease intensity was recorded in Januarywhen mean temperature was 12.4oC and mean relativehumidity was 79.1 per cent. The disease intensity also varied
among different sources ranging from 6.50 (Kurukshetra-419) to 87.65 per cent (Sirsa-274).
REFERENCESChauhan, R., Garg, R.K., Chauhan, S. and Saralch, H.S. (2007)
Tree mortality in Northern states of India-A review. In: Proc. ofRegional Seminar on Mortality of Agroforestry Trees, D.P.S.Nandal and J.C. Kaushik (Eds.) at HAU Hisar, pp. 11-17.
Joshi, R.B. and Baral, S.R. (2000). A report on dieback of Dalbergiasissoo In Nepal. In: Proc. of the Sub-Regional Seminar onDieback of Sissoo (Dalbergia sissoo), Katmandu, Nepal, 25-28 April 2000. pp.17-22.
Nautiyal, S. (2007) Dalbergia sissoo (shisham) mortality viz-a vizimprovement strategy for future. In: Proc. of Regional Seminaron Mortality of Agroforestry Trees, D.P.S. Nandal and J.C.Kaushik (Eds.) at HAU Hisar, pp. 27-34.
Raghu, R. and Mallaiah, K.V. (1999). Studies on foliar diseases oftree legumes caused by Cercosporaceous fungi. Ind. For.125:313-315.
Shera, P.S. and Saralch, H.S. (2006) Insect-pest and diseases ofshisham (Dalbergia sissoo Roxb.): A overview. In: Shishamand Kikar Mortality in India (S.S. Gill, S.K. Chauhan, H.N.Khajuria and R. Chauhan, Eds.), Agrotech Publi. Academy,Udaipur, pp.17-39.
Received 5 June, 2011; Accepted 25 September, 2011

Pigeonpea (Cajanus cajan L. Millsp.) is considered asone of the most important pulse crop grown in India and is
well adapted to tropical and sub-tropical conditions. It ishighly vulnerable to many plant parasitic nematodes andamong them root-knot nematode, Meloidogyne javanicahas emerged as potential threat to its production throughoutthe country. This nematode is widespread in all thepigeonpea growing states of India (Ali and Askary, 2001)
and its management is yet to be perfected because most ofthe nematicides are generally expensive and requires alarge quantity for its soil application. Therefore, the present
study was conducted to find out an economically successfuloption through pre-sowing seed coating with differentchemicals, bioagents and botanicals in the management
of M. javanica on short duration pigeonpea cv. UPAS 120.
The study was carried out during kharif season atexperimental research field of Indian Institute of Pulses
Research, Kanpur. Seeds of Pigeonpea cv. UPAS 120 wereused in the experiment. There were eight treatmentsincluding check (Table 1). Treated seeds were sown at a
spacing of 45×20 cm in 4×4m M. javanica infested sickmicroplots. One treatment of untreated seeds was takenas check plot in the experimental study. All the treatments
including check was replicated three times. Data regardingsymptoms and other plant characters were recorded onthe basis of regular field observations. The experiment
was terminated at maturity i.e., 135 days after sowing.
The present study indicated an increase in fresh anddry shoot and root weight, shoot length, number of rhizobial
nodules per root system and yield of pigeonpea in seedtreated plots as compared to check (Table 1). The belowground symptoms such as egg masses, number of galls
per root system as well as nematode population in soilwas significantly less in all the treatments as compared tountreated plots. These findings are in confirmation with the
work done by other researchers (Dahiya and Singh, 1985;Das and Mishra, 2000, 2003; Haseeb and Shukla, 2002).Although all the treatments were significantly effective in
reducing the nematode infection on pigeonpea plants as
Management of Root-Knot Nematode Meloidogyne javanica inPigeonpea through Seed Treatment
Tarique Hassan Askary Division of Entomology, Shere-Kashmir University of Agricultural Sciences and Technology of Kashmir,
Shalimar, Srinagar- 191 121, India.E-mail : tariq _askary@ rediffmail.com
Indian J. Ecol. (2012) 39(1) : 151-152Indian Journal
of Ecology
Tab
le 1
. E
ffect
of
diffe
rent
tre
atm
ents
on
plan
t gr
owth
cha
ract
ers
of p
igeo
npea
and
nem
atod
e po
pula
tion
Tre
atm
ents
Sho
otF
resh
Dry
Fre
shD
ryTo
tal
Egg
Num
ber
Nem
atod
eW
eigh
t of
leng
thsh
oot
shoo
tro
otro
otno
dule
s/m
ass
es/
of g
alls
/po
pula
tion/
see
ds
(g)/
(cm
)w
eig
ht
we
igh
tw
eig
ht
we
igh
tro
otro
otro
otK
g so
ilpl
ot(g
)(g
)(g
)(g
)sy
ste
msy
ste
msy
ste
m(4
×4m
)
Dim
etho
ate
30 E
C @
0.8
%16
7.3
9.6
3.6
9.2
3.0
4033
.039
.01
83
5.0
17
30
.0
Chl
orpy
ripho
s 20
EC
@ 1
%15
9.2
9.3
3.4
8.9
2.7
4035
.040
.01
91
0.0
16
60
.0
Tria
zoph
os 4
0 E
C @
3%
157.
59.
22.
58.
82.
438
40.0
44.0
19
40
.01
61
0.0
Asp
ergi
llus
nige
r @
2%
172.
29.
73.
69.
32.
941
31.0
35.0
16
10
.01
85
0.0
of 1
08 sp
ore/
ml
of s
uspe
nsio
n
Pae
cilo
myc
es l
ilaci
nus
@ 2
%18
3.5
10.2
4.1
9.7
3.4
4624
.028
.01
49
5.0
19
35
.0
of 1
08 sp
ore/
ml
of s
uspe
nsio
n
Cal
otro
pis
proc
era
@ 1
%17
9.5
10.2
3.9
9.8
3.2
4427
.030
.01
53
0.0
19
10
.0
Nee
m s
eed
pow
der
@ 5
%19
0.3
10.5
4.4
10.1
3.8
4818
.025
.01
47
0.0
19
70
.0
Che
ck (
Unt
reat
ed)
114.
76.
72.
36.
02.
125
64.0
69.0
2740
1140
.0
CD
(P=
0.05
)9.
31.
10.
10.
70.
88.
36.
86.
315
5.4
179.
4

152 Tarique Hassan Askary
well as increasing the plant growth characters and yield,however, the most promising was neem seed powder
followed by Paecilomyces lilacinus, Calotropis procera,Aspergillus niger, dimethoate and chlorpyriphos. The leasteffective among all the treatments was triazophos. Such
findings assure that seed treatment is an economic andeffective method in the management of root-knot nematodein pigeonpea.
REFERENCESAli, S.S. and Askary, T.H. (2001) Taxonomic status of
phytonematodes associated with pulse crops . Curr. Nematol.12: 75-84.
Dahiya, J.S. and Singh, D.P. (1985) Inhibitory effects of Aspergillusniger culture filtrate on mortality and hatching of larvae ofMeloidogyne spp. Pl. and Soil 86: 145-146.
Das, D. and Mishra, S. D. (2000) Effect of neem seed powder andneem based formulations as seed coating against Meloidogyneincognita, Heterodera cajani and Rotylenchulus reniformisinfecting pigeonpea. Curr. Nematol. 11: 13-23.
Das, D. and Mishra, S.D. (2003) Effect of neem seed powder andneem based formulations for the management of Meloidogyneincognita, Heterodera Cajani and Rolylenchulus reniformisinfecting pigeonpea. Ann. Pl. Prot. Sci. 11: 110-115.
Haseeb, A. and Shukla, P.K. (2002) Management of wilt disease ofchickpea by the application of chemicals, biopesticides andbio-agents under field conditions. Curr. Nematol. 13: 61-63.
Received 25 June, 2011; Accepted 15 February, 2012

The Tullgren funnel is a device used to extract small
invertebrate animals from soil samples (Tullgren, 1918).The sample is placed in a container with a base made fromgauze with a mesh designed to hold soil particles but permit
the organisms to pass. The container is arranged over afunnel, with a source of light above (Michael, 2009). TheTullgren funnel works on the principle that most organisms
move away from bright light and very warm/dry conditions.They move to the bottom of the samples, fall through thefine sieve into a collecting vessel, and are preserved for
examination (Michael et al., 1975). However, no realisticinformation is available on the standardization of soilarthropods extraction by using Tullgren funnel. For effective
extraction of soil arthropods from soil samples by usingTullgren funnel within a specific time, it is necessary tostandardize the method of extraction of soil arthropods. A
well-defined standard method would be of immense helpin investigations regarding soil arthropods as their effectiveextraction would be possible within a short period of time.
Three ecosystems (dairy farm, orchard and tea garden)were selected inside the campus of Assam AgriculturalUniversity, Jorhat, Assam.
Soil samples were collected randomly from six differentspots by using rectangular soil sampler (30 X 11 X 8 cm)upto a constant depth of 10 cm (from surface) from each of
the ecosystem. The soil inside the sampler was taken outwithout disturbing the soil profile and the soil arthropodswere extracted by using Tullgren funnel. The soil arthropods
were extracted by using 40, 60 and 100 watt electric bulbs,keeping in low, medium and high light intensities for 12, 24,36, 48 and 72 hours of exposure. The low, medium and
high light intensities for 40, 60 and 100 watt electric bulbswere measured by using a luxmeter. The light intensities at40 watt electric bulbs at low, medium and high intensities
were 300, 2000 and 4500 lux, respectively. At 60 watt electricbulbs, 750, 2700 and 6200 lux were recorded for low,medium and high intensities, whereas, 1200 (low), 8200
(medium) and 15700 lux (high) were recorded at 100 wattelectric bulbs. The soil temperature was recorded by using
Standardization of Method for Soil Arthropods Extraction byTullgren Funnel
Romila Akoijam* and Badal BhattacharyyaDepartment of Entomology, College of Agriculture, Assam Agricultural University, Jorhat-785 013, India
*E-mail: [email protected]
soil thermometer and the moisture content was determined
by Gravimetric method (Kishore et al., 2008 ). The collectedsoil samples were analyzed in the funnel and due to thelight and heat gradient as well as the effect of gravity, the
soil arthropods moved downwards through the mesh sievethat was attached at the bottom of the funnel.
The extracted soil arthropods were collected in
collecting tubes (40 ml) containing 70 per cent ethyl alcohol.The ethyl alcohol containing soil arthropods weretransferred into a clean petridish for counting and sorting
out.
The populations of extracted soil arthropods (no. m-2)were estimated by using the following formula (Singh et al.,1978)
P = (10,000 × X)/ [(B × L) n]Where, P = Population of soil arthropods per m2
X = Number of soil arthropods extracted from the funnel B = Breadth of the rectangular soil sampler (cm) L = Length of the rectangular soil sampler (cm)
n = Number of samples per ecosystem
When the Tullgren funnel was operated for 12, 24, 36,
48 and 72 hours with 40 watt electric bulbs at low, medium
and high light intensity, the maximum population of soil
arthropods (5241.9 m-2) was extracted by Tullgren funnel at
high light intensity (4500 lux) upto 72 hours of exposure
(Table 1). It was also observed that beyond 72 hours, very
negligible population of soil arthropods were extracted by
the funnel and at this exposure time, the soil samples were
observed to be too dried and friable because of the constant
heat generated by the 40 watt electric bulbs at high light
intensity. The reason for getting highest population of soil
arthropods for 72 hours of exposure reflects the inability of
soil arthropods to tolerate the 40ºC temperature generated
for 72 hours of exposure, which finally leads to vertical
movements of the soil arthropods to the collecting tubes.
Further, it can be mentioned that as a general behavior,
most of the soil arthropods avoid light and many of them do
not possess specialized eyes, well-developed tactile and
Indian J. Ecol. (2012) 39(1) : 153-155Indian Journal
of Ecology

154
chemoreceptors and communication signals. Most of themabsorb and lost water through their integument and are
highly dependable on water-saturated atmosphere for theirexistence (Didden, 1983). Therefore, after 72 hours ofexposure, the soil moisture content was drastically reduced
up to the extent of 1.76 per cent, which created an adverseenvironmental condition for the survival of soil arthropods(Table 2).
The heat generated by the funnel at 72 hours ofexposure might have adversely affected and killed othersoil fungi and bacteria leading to exhaustion of food for
soil arthropods. The second highest population of soilarthropods (3514.8 m-2) was obtained with 40 watt electricbulbs for 48 hours of exposure at high light intensity (Table 1).
While using 60 watt electric bulbs, the highest populationof soil arthropods (3120.9 m-2) was observed at 72 hours ofexposure in high light intensity (Table 1). It was the third
highest population of soil arthropods extracted per m2 in allthe observations. Tripathi and Sharma (2005) collected soilfauna by using 60 watt electric bulb in Tullgren funnel at 24
hours of exposure but they did not extend the exposure timebeyond 24 hours. However, Masan (2007) extracted differentmite species by using Berlese-Tullgren funnel with 60 watt
electric bulbs at an exposure of 48-72 hours. At 12, 24, 36,48 and 72 hours of exposure in high light intensity (6200lux), the soil arthropods populations were 60.6, 363.6,
1212.0, 1696.8 and 3120.9 (m-2), respectively (Table 1). Byusing 100 watt electric bulbs, the maximum number of soilarthropods (1787.7 m-2) was extracted at high light intensity
at an exposure of 72 hours (Table 1). This rate of extractionwas found to be considerably low as compared to the rateof extraction by using 40 and 60 watt bulbs. It may be due to
the fact that the 100 watt bulbs generated comparativelymore heat (38, 46, 53, 61 and 84°C at 12, 24, 36, 48 and 72hours of exposure, respectively) inside the funnel, which
was not found congenial for the survival of the soilarthropods (Table 2). The intense heat by 100 watt electricbulbs caused increase in soil temperature leading to
moisture deficit inside the funnel and hence, most of thesoil arthropods either they became inactive or died. Variousgroups of soil arthropods like collembolans, soil mites,
pseudoscorpions and many unidentified species wererecorded from all the observations. Among them, ninemorphologically dissimilar types of collembolans and
eleven morphologically dissimilar types of soil mites couldbe recorded.
The findings drawn from this investigation will pave the
way for other researchers to extract maximum numbers ofsoil arthropods within a short period of time by using Tullgrenfunnel. The methodology described in this paper may beTa
ble
1.
Soi
l ar
thro
pods
pop
ulat
ion
extr
acte
d by
Tul
lgre
n fu
nnel
by
usin
g 40
, 60
and
100
wat
t el
ectr
ic b
ulbs
fro
m d
iffer
ent
ecos
yste
ms
Bul
bE
cosy
ste
ms
Pop
ulat
ion
of s
oil
arth
ropo
ds/
sq.
m a
t fiv
e ex
posu
res
(tim
e)
12 h
ours
24 h
ours
36 h
ours
48 h
ours
72 h
ours
LM
HL
MH
LM
HL
MH
LM
H
40
wa
tt*
Dia
ry f
arm
0.00
0.00
15
1.5
00.
001
21
.20
66
6.6
060
.60
33
3.3
01
42
4.1
01
51
.50
81
8.1
01
78
7.7
01
81
.80
12
12
.00
27
87
.60
Orc
ha
rd0.
000.
0090
.90
0.00
30.3
01
81
.80
0.00
60.6
03
03
.00
30.3
090
.90
66
6.6
01
51
.50
30
3.0
08
18
.10
Tea
gard
en0.
000.
0030
.30
0.00
60.6
03
63
.60
0.00
90.9
08
18
.10
60.6
03
03
.00
10
60
.50
12
1.2
03
93
.90
16
36
.20
Tota
l0.
000.
002
72
.70
0.00
21
2.1
01
21
2.0
060
.60
48
4.8
02
54
5.2
02
42
.40
12
12
.00
35
14
.80
45
4.5
01
90
8.9
05
24
1.9
0
60 w
att*
*D
iary
far
m0.
000.
0060
.60
0.00
90.9
01
21
.20
90.9
02
12
.10
51
5.1
01
21
.20
63
6.3
06
66
.60
15
1.5
07
27
.20
14
84
.70
Orc
ha
rd0.
000.
000.
000.
000.
001
51
.50
30.3
01
81
.80
33
3.3
060
.60
24
2.4
04
24
.20
90.9
03
33
.30
60
6.0
0
Tea
gard
en0.
000.
000.
000.
0030
.30
90.9
030
.30
15
1.5
03
63
.60
60.6
02
12
.10
60
6.0
01
21
.20
60
6.0
01
03
0.2
0
Tota
l0.
000.
0060
.60
0.00
12
1.2
03
63
.60
15
1.5
05
45
.40
12
12
.00
24
2.4
01
09
0.8
01
69
6.8
03
63
.60
16
66
.50
31
20
.90
100
wat
t***
Dia
ry f
arm
90.9
060
.60
0.00
12
1.2
01
81
.80
12
1.2
02
72
.70
24
2.4
03
33
.30
57
5.7
05
15
.10
48
4.8
08
78
.70
90
9.0
08
18
.10
Orc
ha
rd0.
000.
0030
.30
0.00
30.3
090
.90
30.3
060
.60
15
1.5
060
.60
12
1.2
01
81
.80
15
1.5
02
12
.10
33
3.3
0
Tea
gard
en0.
000.
000.
0060
.60
90.9
030
.30
12
1.2
02
12
.10
27
2.7
03
03
.00
24
2.4
04
24
.20
54
5.4
06
66
.60
48
4.8
0
Tota
l90
.90
60.6
030
.30
18
1.8
03
03
.00
24
2.4
04
24
.20
51
5.1
07
57
.50
93
9.3
08
78
.70
10
90
.80
15
75
.60
17
87
.70
16
36
.20
*40
wat
t -
L: L
ow li
ght
inte
nsity
(30
0 lu
x),
M:
Med
ium
ligh
t in
tens
ity (
2000
lux)
and
H
: H
igh
Ligh
t in
tens
ity (
4500
lux)
;
**60
wat
t -L
: 75
0 lu
x, M
: 27
00 lu
x an
d H
: 62
00 lu
x an
d **
*100
wat
t -
L: 1
200
lux,
M:
8200
lux
and
H:
1570
0 lu
x
Romila Akoijam and Badal Bhattacharyya

155
tested to standardize other types of funnels like Berleseand O’Connor’s funnel to draw a logistic conclusion
extraction of soil arthropods with high levels of precision.The use of proper type of funnel for extracting soil arthropodsdepending on the physico-chemical properties of soil will
further intensify and generate more information on taxonomicidentity, species richness, distribution pattern, biology andbehavior of soil arthropods. Furthermore, the role of soil
arthropods and other microflora as possible bioindicatorsof the polluted and degraded soil ecosystem can beinvestigated effectively by using the above standardized
method. The effect of global climatic change on soilarthropods and their ability to recover after the cessation ofa climatic disturbance needs further comprehensive
research.
ACKNOWLEDGEMENT
The authors are thankful to Dr. Y.S. Mathur, Ex. Net WorkCoordinator, All India Network Project on white grubs and
other soil arthropods, Agricultural Research Station,Durgapura, Jaipur, Rajasthan, India for his encouragementduring the period of investigations.
REFERENCESDidden, W.A.M. (1983) Ecology of terrestrial Enchytraeidae.
Pedobiologia 37: 2-229.
Kishore, D. K., Sharma, S.K. and Pramanick, K.K. (2008) Temperatehorticulture: current scenario. New India Publishing Agency,New Delhi.
Masan, P. (2007) Olopachys (Olopachylaella) gronychi subgen.nov., sp. nov., a new species of mite from Bulgaria (Acari:Mesostigmata: Pachylaelapidae). Zootaxa 1509: 31-39.
Michael, A. (2009) A Dictionary of Zoology. Oxford University Press.pp. 554.
Michael, A., Tribe, Michael Eraut and Roger K. Snook (Eds.) (1975)Ecological principles. Interaction between organisms and theirliving environment. Cambridge University Press, pp. 65.
Singh, J., Mahajan, S.V. and Singh, R.K. (1978). Sampling, extractionand precision regarding some statistical studies for populationecology of soil mesofauna. Bull. Entomol. 19: 130-145.
Tripathi, G. and Sharma, B.M. (2005) Effects of habitats andpesticides on aerobic capacity and survival of soil fauna.Biomed. Environ. Sci. 18(3): 169-175.
Tullgren, A. (1918) Ein sehr einfacher Auslesgeapparat fur Terricole,Tierformen. Zeitschrift fur Angewandte Entomologie 4: 149-150.
Tab
le 2
. Ave
rage
tem
pera
ture
of
soil
sam
ples
rec
orde
d in
Tul
lgre
n fu
nnel
ope
rate
d by
usi
ng 4
0, 6
0 an
d 10
0 w
att
elec
tric
bul
bs in
diff
eren
t lig
ht in
tens
ities
at
diffe
rent
exp
osur
e tim
e
Bu
lb(w
att
)In
itial
Tim
e of
exp
osur
e (h
ours
)
tem
pera
ture
* 1
2 ho
urs
24
hour
s36
hou
rs 4
8 ho
urs
72 h
ours
(ºC
)L
MH
LM
HL
MH
LM
HL
MH
4026
.00
26.5
027
.00
28.5
027
.00
28.0
030
.00
28.0
030
.00
32.0
029
.00
32.5
034
.00
30.0
034
.50
40.0
0
(21
.24
)(1
.75
9)
6026
.00
28.0
029
.00
30.0
029
.00
31.0
034
.00
30.5
033
.50
39.0
032
.00
36.0
042
.00
35.0
039
.50
55.0
0
(21
.24
)(1
.02
8)
100
26.0
030
.00
34.5
038
.00
32.5
038
.00
46.0
036
.50
49.5
053
.00
40.0
052
.00
61.0
044
.50
70.0
084
.00
(21
.24
)(0
.42
6)
L: L
ow, M
: Med
ium
and
H: H
igh
light
inte
nsiti
es
*Fig
ures
in
the
pare
nthe
ses
are
the
moi
stur
e pe
r ce
nt v
alue
s
Received 30 December, 2011; Accepted 5 April, 2011
Method for Soil Arthropods Extraction
Present annual fish production of the Bihar state is
2.88 lakhs tones, which makes it fourth among all states.
About 1.5 lakhs tonnes comes from capture fisheries
resources comprising rivers and rest from culture
resources, which is about half of the annual requirement/
consumption of 4.56 lakhs tonnes. To bridge the gap, it is
essential to focus attention to promote aquaculture by
achieving optimum sustainable yield from flood plain
wetlands particularly from Ox-bow lake by ecological
management and fishery enhancement strategies. Vaas
(1997) and Ayyappan (2006) has reported the importance
of floodplain wetlands for fishers. Despite abundant aquatic
resources in terms of about 3,200 km of rivers, 100,000
hectares chaurs and floodplain wetlands, 9,000 hectares
of ox-bow lakes or mauns, 7,200 hectares of reservoirs
and 69,000 hectares of ponds and tanks, fish supply is
short of demand in the State of Bihar. Abraham (1990) has
suggested pen nursery technology for the development of
fisheries of Ox-bow lakes and reservoirs. Realizing the
importance of Ox-bow lakes, a study was conducted in the
year 2010 with an objective of documenting the problems
of fishers and suggesting strategies.
In Bihar, Muzaffarpur District of Trihut division (26°07´
N and 85°24´ E) is very rich in water bodies. In the present
study, an attempt was made to study the existing
management practices followed in the two lakes
Sikandarpur and Manika, Muzaffarpur, North Bihar. The data
has been collected by interacting with fishers, society heads,
head of SHGs and Department of Fisheries officials. The
problems faced by 100 fishers from Sikandarpur Ox-bow
lake and Manika Ox-bow lake were recorded through
interview method.
In the study, the area was the households dependenton the Sikandarpur Ox-bow lake and Manika Ox-bow lake.List of the households dependent on the two Ox-bow lake
was procured. It was found that there were 350 and 150households dependent on the Sikandarpur and Manikalake, respectively.
Strategies to Enhance Fish Production from Ox-bow Lakes ofMuzaffarpur, Bihar
Sujeet Rajak*, Arpita Sharma, S.K. Chakraborty, S.C. Rai, Dilip Kumar and A.K. JaiswarCentral Institute of Fisheries Education (CIFE), Deemed University
Indian Council of Agricultural Research Seven Bungalows, Versova, Mumbai – 400 061, India
*E-mail: [email protected]
A total of 50 households each form both the lakes were
selected randomly. Interview schedule was administeredto the head of the household usually a male. In case wherethe head of the household was absent or not available, the
lady of the household was interviewed. A total of 80 menand a total of 20 women comprised the sample.
Management practices adopted. Fisheries co-
operative society or the Self help Group (SHGs) sourcesfish seeds from Government department at subsidized costrates. They follow the fishing ban during breeding season
and during religious festivals, which helps in stocking. Weedmanifestation (Eicchornia, Hydrilla Vallisneria, etc.) ispresent in both the lakes, mainly there is a serious problemof water hyacinth. Farmers who are members of co-operative
society takes the responsibility of removing the weedsmanually from the lakes with the help of boats and fishers.Fishers catch fish with the help of traditional fishing gears
and crafts. They have their ancestral crafts like dengi (smallboat). The gears, which they use for catching the fish aregill net locally called ‘Phansi net’, cast net called ‘Jaliya’,drag net called ‘Mahajaal’.
The floats of the nets made up of plastic and round inshape are used. They also use thermo coal. Sinkers are
made up of cast iron, iron and burnt clay/soil. Nylon threadsare used to make the nets. It is coloured (one to five timesin a year) to extend the life of the net. Sometimes the fishers
rear the seeds in a confined area to grow it to fingerling sizethen they stock the lake. But usually it is not practicedbecause fishers cannot monitor this all the time. For
catching the fish they set their gill net in the night and inearly morning they remove the net with the help of boats.They also take the help of boats and swimmers to operate
the cast net and drag net. Fishers manage both the lakeswith the help of co-operative called Matasya Jalaj SahakariSamiti. During monsoon and post-monsoon season
fishers give fish holiday or ban fishing for the juveniles togrow. This is a natural way of giving fish holiday. There is noregular practice of stocking the lakes with cultured seed.
Indian J. Ecol. (2012) 39(1) : 156-157Indian Journal
of Ecology

157
The mesh size regulation is not followed, they are fishingwith gill net, drag net and cast net. The mesh is determined
roughly with their fingers. They only try to not catch the fish,which are less than 100g.
In Manika lake fish stock is managed at a place with
the help of bamboo reeds and strips, which acts as barrier,because water level is very low at some places.
Water, soil and weed management. On the issue of
water quantity, construction of earthen banks to preventoutflow of rainy water, and to reduce seepage andmaintaining inflow of water is required. Department of
Fisheries (DoF)/fishery society/SHG should have control orsay for sluice gate operation to maintain water level in caseof flooding or shortage of water. In Manika lake, there should
be intake and outflow of water by construction of sluice gate.As regards to soil and water quality periodical checks,reduction in sewage waste, maintaining the growth of
plankton, spray of lime and disiltation is suggested. Toreduce pollution, flow of sewage water should be divertedin other suitable direction or it should be collected and
poured only after mechanical/chemical purification, washingof clothes and waste disposal should be controlled, Earthenembankments should be constructed and not concrete
embankment. Weed infestation has to be kept under controlmanually or stocking of herbivorous fish.
Lake management. With reference to lake
management, good quality and quantity of seed supply hasto be ensured, only the fishes of proper growth and weightshould be marketed, artificial feed for the fishes may be
added regularly in lake. Community and society shouldcome together to solve the problem of poaching. Regulationof mesh size is required and spray of lime may be done in
addition to development of diagnostic kits. Nursery pondsfor rearing of juveniles providing water intake by pumphouse. Under infrastructure, storage, cold chain, auction
site, fish market, society office should be constructed. Cageculture can be started.
Human resource management. As regards to human
resource management, capacity development programmeson pisciculture, pen/cage culture, mesh size regulation,Integrated farming, alternative livelihoods should be
strengthened. Department of Fisheries (DoF) needs to bestrengthened and regular visits by DOF are required. Literacyprogrammes for fishers, awareness of government
schemes, support through mass awareness throughcommunication media, participation of youth (men and
women) in fisheries. Community management practicesand training on financial management (book keeping,
accounts etc), organization management, team work andleadership is required. As regards to financial management,provision of credit facilities, financial inclusion is required.
ACKNOWLEDGEMENTS
The authors would like to thank Dr. W.S. Lakra, Vice
Chancellor/Director CIFE, Mumbai for his valuable help andsupport for the work. The authors are also thankful to allfishers, Department of Fisheries Bihar who provided the
information.
REFERENCESAbraham, M. (1990) Pen nursery technology for the development
of fisheries of Ox-bow lakes and reservoirs. In: A.G. Jhingran,V.K. Unnithan and A. Ghosh. Contribution to the Fisheries ofInland Open Water Systems in India. Published by the InlandFisheries Society of India, Barrackpore, Part I, pp.71-76.
Ayyappan S. (2006) Oxbow lake fisheries. Handbook of Fisheriesand Aquaculture. ICAR, pp. 1-12.
Bhowmik, M.L. (1990) Pen culture- A means for higher fish yieldfrom Ox-bow lakes. In: A.G. Jhingran, V.K. Unnithan andA.Ghosh. Contribution to the Fisheries of Inland Open WaterSystem in India, Part I Published by the Inland Fisheries Societyof India, Barackpore, pp.46-52.
h t t p : / / p l a n n i n g c o m m i s s i o n . n i c . i n / d a t a / c e n t r a l /index.php?data=centab
http://ahd.bih.nic.in/Docs/ICAR-Report-Fisheries-Dev-Bihar.pdf
Vass, K. K. (1997) Floodplain wetlands - An important inlandfisheries resources of India. In: V.V. Sugunan and M. Sinha(Eds) Fisheries Enhancement of Small Reservoirs andFloodplains Lakes in India. Central Inland Fisheries ResearchInstitute, Barrackpore, Bulletin No. 75, pp.238-242.
Fig. 1. Strategy for Ox-bow lake management
Received 27 November, 2011; Accepted 5 April, 2012
Enhance of Fish Production from Ox-bow Lakes

Soybean (Glycine max L. Merrill) is a native of Asia. As
a leguminous crop, soybean fixes atmospheric N throughsymbiotic association with Bradyrhizobium japonicum (syn.Rhizobium japonicum). About 25 to 75 per cent of the crop’s
total N requirement is supplied through symbiotic N-fixationin soybean. The management of the preceding wheat cropresidue by turning it into soil can be a better option to reduce
N dose of the succeeding soybean crop. This may help inbetter N mobilization from wheat straw in soil, thusincreasing available N supply to crop besides improving
soil properties such as organic carbon content, nutrientsavailability and their uptake. The present investigations wereconducted to study the performance of soybean with cropresidue management practices and nitrogen levels in terms
of yield, nutrients uptake and soil properties.
Present studies were undertaken during kharif seasonof 2009 at the Students’ Research Farm, Department of
Agronomy, Punjab Agricultural University, Ludhiana. Thistract of India falls under Trans-Gangetic Agro-climatic Zonewith sub-tropical climate. The soil of the experimental field
was loamy sand in texture and alkaline in reaction (pH 8.1).The soil tested low in organic carbon (0.30%), availablenitrogen (145.63 kg ha-1), medium in available phosphorus
(12.70 kg ha-1) and available potassium (189.66 kg ha-1).
The experiment was conducted in split plot design withthree replications comprising of three residue levels {full(RF), half (RH) and no residue (RO)} in main plots and four
nitrogen levels {125% N (N125), 100% N (N100), 75% N (N75)and 50% N through inorganic source+ 50% N through FYM(N50 + N50 FYM)} in sub plots. The residues of preceding
wheat crop were kept as per treatments (full, half and noresidue) in main plots and these were turn down intoexperimental field with rotavator on April 21, 2009. The crop
variety ‘SL 525’ was sown on June 15, 2009 and harvestedon October 28, 2009. Recommended dose of nitrogen dosefor soybean is about 32 kg N ha-1. The total amount of rainfallreceived during crop season was 901.7 mm. The crop was
raised as per the package of practices of Punjab AgriculturalUniversity, Ludhiana. Chemical analysis of seed, straw andsoil were conducted after the harvest of the crop using
standard analytical methods.
The perusal of data (Table 1) revealed that crop residuemanagement practices did not significantly affect organic
carbon (%) in soil at 0-15 cm and 15-30 cm soil depth.However, the organic carbon increased with increasing levelof residues incorporation of preceding wheat crop. Similarly
Effect of Residue Management Practices and Nitrogen Levels onSoil Properties, Yield and Uptake of Nitrogen, Phosphorus and
Potassium in Soybean Sown after Preceding Wheat Crop
K. S. Saini and S. K. ChongthamDepartment of Agronomy, Punjab Agricultural University,
Ludhiana - 141 004, India
Table 1. Effect of crop residue management practices and nitrogen levels on organic carbon, available N, P and K in soil after harvest
Treatments Soil organic carbon (%) Available N Available P Available K
0-15 cm 15-30 cm (kg ha-1) (kg ha-1) (kg ha-1)
Residue management (RM)
RO (No residue) 0.36 0.30 164.76 12.21 184.85
RH (Half residue) 0.38 0.31 168.25 12.45 187.21
RF (Full residue) 0.44 0.33 171.10 12.48 185.11
CD (p=0.05) NS NS NS NS NS
Nitrogen levels (N)
N75 (75%) 0.37 0.32 164.56 12.60 185.14
N100
(100%) 0.39 0.31 170.10 12.71 183.93
N125 (125%) 0.40 0.31 172.35 12.35 187.21
N50 fertilizer + N50 FYM 0.42 0.33 173.15 12.75 186.35
CD (p=0.05) NS NS NS NS NS
Interaction (RMxN) NS NS NS NS NS
Indian J. Ecol. (2012) 39(1) : 158-159Indian Journal
of Ecology
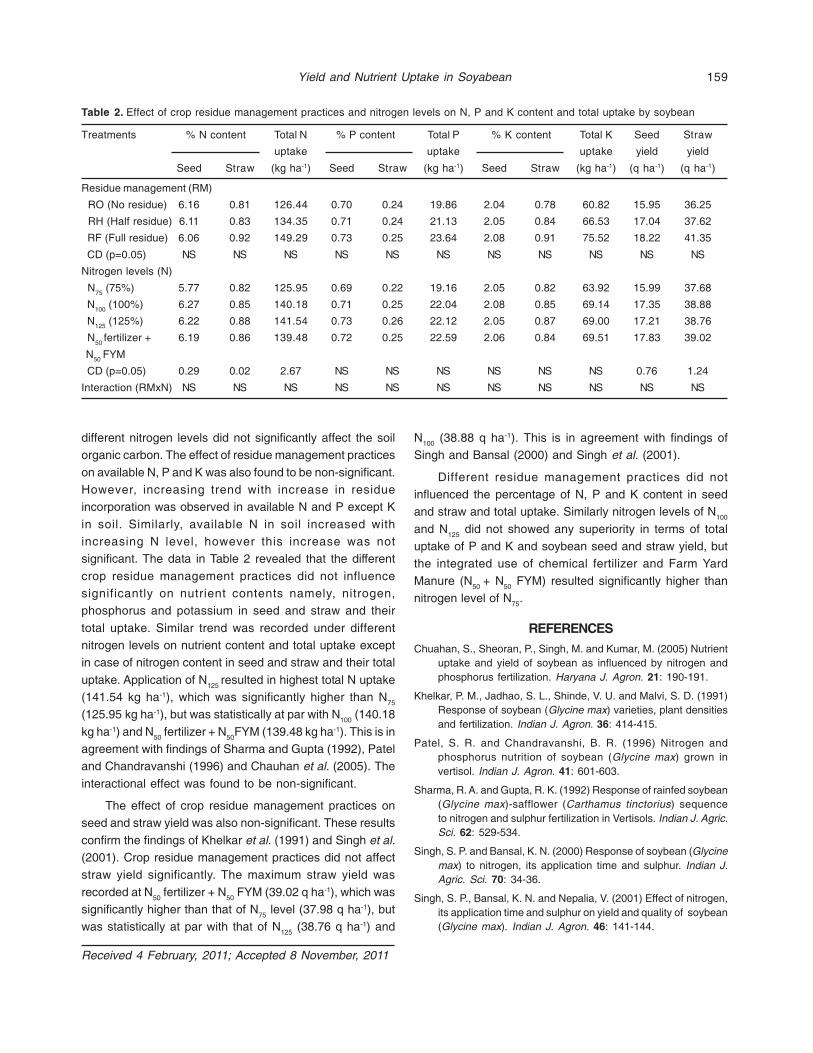
159
different nitrogen levels did not significantly affect the soilorganic carbon. The effect of residue management practices
on available N, P and K was also found to be non-significant.However, increasing trend with increase in residueincorporation was observed in available N and P except K
in soil. Similarly, available N in soil increased withincreasing N level, however this increase was notsignificant. The data in Table 2 revealed that the different
crop residue management practices did not influencesignificantly on nutrient contents namely, nitrogen,phosphorus and potassium in seed and straw and their
total uptake. Similar trend was recorded under differentnitrogen levels on nutrient content and total uptake exceptin case of nitrogen content in seed and straw and their total
uptake. Application of N125 resulted in highest total N uptake(141.54 kg ha-1), which was significantly higher than N75
(125.95 kg ha-1), but was statistically at par with N100 (140.18
kg ha-1) and N50 fertilizer + N50FYM (139.48 kg ha-1). This is inagreement with findings of Sharma and Gupta (1992), Pateland Chandravanshi (1996) and Chauhan et al. (2005). The
interactional effect was found to be non-significant.
The effect of crop residue management practices onseed and straw yield was also non-significant. These results
confirm the findings of Khelkar et al. (1991) and Singh et al.(2001). Crop residue management practices did not affectstraw yield significantly. The maximum straw yield was
recorded at N50 fertilizer + N50 FYM (39.02 q ha-1), which wassignificantly higher than that of N75 level (37.98 q ha-1), butwas statistically at par with that of N125 (38.76 q ha-1) and
Table 2. Effect of crop residue management practices and nitrogen levels on N, P and K content and total uptake by soybean
Treatments % N content Total N % P content Total P % K content Total K Seed Straw
uptake uptake uptake yield yield
Seed Straw (kg ha-1) Seed Straw (kg ha-1) Seed Straw (kg ha-1) (q ha-1) (q ha-1)
Residue management (RM)
RO (No residue) 6.16 0.81 126.44 0.70 0.24 19.86 2.04 0.78 60.82 15.95 36.25
RH (Half residue) 6.11 0.83 134.35 0.71 0.24 21.13 2.05 0.84 66.53 17.04 37.62
RF (Full residue) 6.06 0.92 149.29 0.73 0.25 23.64 2.08 0.91 75.52 18.22 41.35
CD (p=0.05) NS NS NS NS NS NS NS NS NS NS NS
Nitrogen levels (N)
N75 (75%) 5.77 0.82 125.95 0.69 0.22 19.16 2.05 0.82 63.92 15.99 37.68
N100 (100%) 6.27 0.85 140.18 0.71 0.25 22.04 2.08 0.85 69.14 17.35 38.88
N125 (125%) 6.22 0.88 141.54 0.73 0.26 22.12 2.05 0.87 69.00 17.21 38.76
N50
fertilizer + 6.19 0.86 139.48 0.72 0.25 22.59 2.06 0.84 69.51 17.83 39.02
N50 FYM
CD (p=0.05) 0.29 0.02 2.67 NS NS NS NS NS NS 0.76 1.24
Interaction (RMxN) NS NS NS NS NS NS NS NS NS NS NS
N100 (38.88 q ha-1). This is in agreement with findings ofSingh and Bansal (2000) and Singh et al. (2001).
Different residue management practices did notinfluenced the percentage of N, P and K content in seedand straw and total uptake. Similarly nitrogen levels of N100
and N125 did not showed any superiority in terms of totaluptake of P and K and soybean seed and straw yield, butthe integrated use of chemical fertilizer and Farm Yard
Manure (N50 + N50 FYM) resulted significantly higher thannitrogen level of N75.
REFERENCESChuahan, S., Sheoran, P., Singh, M. and Kumar, M. (2005) Nutrient
uptake and yield of soybean as influenced by nitrogen andphosphorus fertilization. Haryana J. Agron. 21: 190-191.
Khelkar, P. M., Jadhao, S. L., Shinde, V. U. and Malvi, S. D. (1991)Response of soybean (Glycine max) varieties, plant densitiesand fertilization. Indian J. Agron. 36: 414-415.
Patel, S. R. and Chandravanshi, B. R. (1996) Nitrogen andphosphorus nutrition of soybean (Glycine max) grown invertisol. Indian J. Agron. 41: 601-603.
Sharma, R. A. and Gupta, R. K. (1992) Response of rainfed soybean(Glycine max)-safflower (Carthamus tinctorius) sequenceto nitrogen and sulphur fertilization in Vertisols. Indian J. Agric.Sci. 62: 529-534.
Singh, S. P. and Bansal, K. N. (2000) Response of soybean (Glycinemax) to nitrogen, its application time and sulphur. Indian J.Agric. Sci. 70: 34-36.
Singh, S. P., Bansal, K. N. and Nepalia, V. (2001) Effect of nitrogen,its application time and sulphur on yield and quality of soybean(Glycine max). Indian J. Agron. 46: 141-144.
Received 4 February, 2011; Accepted 8 November, 2011
Yield and Nutrient Uptake in Soyabean

Wheat is the most important winter cereal crop of thecountry and cultivated on an area of 27.2 mha with an annualproduction of 74.9 mt at an average yield of 2.8 t ha-1 (Anon.,
2008). It has been projected that to feed 1.3 billionpopulation and diversified uses, India will have to produceat least 109 million tones of wheat by 2020 AD, which might
be possible through elevating the productivity up to 4 t ha-1
(Kulhari et al., 2003). The grain yield and quality areinfluenced by seed rate, time of planting and appropriate
planting methods along with nutrient management,irrigation, etc. Optimum seed rate is essential formaintaining plant population, which plays an important role
in increasing productivity and improving quality. Low plantpopulation per unit area is one of the major constraints forlow yield. Optimum plant number per unit area of a crop
varies with seed size, genotype, sowing time and season(Pandey and Prakash, 2003). The seed rate requirementalso varies with planting method. Sowing time is one of the
most important management factor involved in obtaininghigher yield. Timely sowing of wheat crop generally improvesthe yield and quality parameters like protein content. Under
late sowing situations, wheat yield is adversely affecteddue to low temperature during germination, causing delayedemergence and during early crop establishment period
resulting in slow growth and its exposure to highertemperature during reproduction phase reduces the periodof grain filling. However, the protein content, ß-carotene
content and sedimentation value is significantly higher inlate sown crop as compared to timely sown crop (Singhand Jain, 2000). This improvement is mainly an account of
shrivelling of grains due to improper filling, leading to thehigher proportion of browny layers. Yellow berry wasnegatively correlated with seed protein and higher in early
sown crop as compared to late sown crop. The selection ofsuitable method of sowing may also be important for theplacement of seed at proper depth, which ensures better
emergence and subsequent crop growth. Furrow irrigatedraised bed system (FIRBS) is a recently introduced conceptin wheat sowing to obtain better crop performance. In bed
Sowing Time, Seed Rate and Planting Method Effect on NitrogenUptake and Quality of Bread Wheat
Balkaran Singh, R.S. Uppal and R.P. Singh1
Deptt. of Agronomy, 1Deptt. of Plant Breeding and GeneticsPunjab Agricultural University, Ludhiana-141 004, India
E-mail: [email protected]
sowing, the planted area does not come in direct contactwith irrigation water. Since the wetted surface area in bedsowing is less in comparison to conventional flat sowing,
the water requirement for irrigation is also less, therefore,keeping above points in view the present investigation wascarried out to study the N-uptake and quality characteristics
of wheat under different seed rate, sowing time and plantingmethods.
The field experiment was conducted during rabi season2008-09 at Punjab Agricultural University, Ludhiana on sandyloam soil, low in available N (133 kg ha-1) and medium inavailable P (14 kg ha-1) and K (227.5 kg ha-1) with pH-8.0.The experiment was replicated thrice in split plot designwith three sowing time viz., 25th October, 5th November and15th November and two planting methods viz., bed plantingand flat sowing as main plot treatments while sub-plottreatments consisted of four seed rates (87.5, 100, 112.5and 125 kg ha-1). The crop received a uniform dose ofnutrients @ 125 kg N, 62.5 kg P2O5 and 30 kg K2O ha-1
through urea, single super phosphate and muriate ofpotash, respectively. Half of the nitrogen and full dose ofphosphorus and potash were applied as basal dose at thetime of sowing. The remaining nitrogen was applied afterfirst irrigation at crown-root initiation. The crop received sixirrigations at different growing stages. To check the weedgrowth, one hand hoeing was followed after first irrigation.Clodinafop 15 WP and 2,4-D were applied to control thegrowth of grassy and broad leaf weeds, respectively. Rogor30 EC (dimethoate) was applied to control aphids at grainfilling stage. Propaconazole 25 EC was applied at milk stageto check the infestation of head scab. The crop sown on25th October took 141 days to maturity as compared to 147and 145 days for the 5th and 15th November sowingrespectively. The yield was recorded at maturity and qualityparameters like grains appearance score, grain hardness,test weight, protein content, yellow berry content,sedimentation value and beta carotene contents wereanalyzed in the laboratory using standard methods. Thegrain appearance score was determined subjectively by
Indian J. Ecol. (2012) 39(1) : 160-163Indian Journal
of Ecology

161
visual observation on the merits of luster, color, shape andsize. Grains of each sample on the basis of these features
were graded on a scale 1-10. For grain, hardiness tester(OSK 8055, OGAWA SEIKI CO, LTD Tokyo Japan) was used.Test weight was determined using the apparatus developed
by Directorate of Wheat Research, Karnal, India. Proteincontent in grains was determined using, “Infratec 1241(FOSS)” near infrared transmittance grain analyzer. The SDS
sedimentation value of the wheat whole meal samples wasdetermined using the method of Axford et al. (1979). Yellowberry grains were separated manually and weighed. The
separated yellow berry grain weight was converted intopercentage by weight. Saturated butanol was used to extractthe B-carotene pigment. The data generated was
statistically analyzed.
The crop sown on 15th November producedsignificantly higher grain and straw yield but was statistically
at par with the crop sown on 5th November than sowing on25th October. This might be due to the more number of daystaken to maturity i.e., 147 and 145 for 5th and 15th November
sowing, respectively as compared to141 days for crop sownon 25th October. The early sown crop received mean hightemperature at early growth stage as compared to optimum
temperature for normal date of sowing. Due to this the cropwere able to synthesis more of the photosynthates andthereby increased the yield. Sowing time significantly
influenced the nitrogen uptake and quality parameters ofwheat. The nitrogen uptake by the grains was significantlyhigher when the crop was sown on 15th November which
was statistically at par with the crop sown on 5th Novemberand than the 25th October sown crop. The nitrogen uptake
by the straw and total nitrogen uptake of wheat crop as awhole were also significantly higher in the crop sown on15th November as compared to the crop sown on 25th
October and 5th November. This was due to the higher grainand straw yield (Table 1). The crop sown on 15th Novemberalso had maximum protein content in its grains, which was
statistically at par with that of crop sown on 5th Novemberand significantly higher than the crop sown on 25th October
due to the more nitrogen content in the grains. The effect of
sowing time was also significant on the grain protein
harvest. However, the wheat crop sown on 15th November
gave significantly higher protein harvest in grains than that
sown on 5th November and the crop sown 25th October.
The protein harvested in grains was significantly higher due
to significantly higher grain yield and protein content
(Table 1) observed for the 15th November crop as compared
to other sowing dates. Bangarwa and Ahlawat (1996) and
Kumar and Kumar (1997) also reported that the protein
content had the highest additive environmental effect in 15th
November and lowest in sowing of 1st November sown crop.
The incidence of yellow berry was significantly higher in the
crop sown on 25th October as compared to crop sown on 5th
November and 15th November. Yellow berry is negatively
correlated with protein content of grains. The higher yellow
berry in early sowing date of 25th October might be due tothe lower protein content in grains (Table 1). Sharma et al.(1999) also reported that the incidence of yellow berry
Table 1. Effect of sowing time, planting method and seed rate on nitrogen concentration, uptake and protein content in grain and strawof bread wheat
Treatment Grain yield Straw yield Nitrogen uptake N uptake Protein Protein
(q ha-1) (q ha-1) (kg ha-1) (total) content harvested
Grains Straw (kg ha-1) (%) (q ha-1)
Sowing time
25th October 47.02 52.27 83.89 27.85 111.74 11.24 5.28
5th November 55.60 61.52 101.67 32.61 136.27 11.51 6.41
15th November 56.51 62.76 104.83 35.27 140.10 11.68 6.60
CD (P=0.05) 1.72 2.40 3.16 1.35 4.32 0.28 0.20
Planting Method
Bed Planting 53.31 58.87 97.23 32.21 130.44 11.47 6.12
Flat sowing 52.77 58.82 96.36 31.94 128.30 11.49 6.07
CD (P=0.05) NS NS NS NS NS NS NS
Seed rate (kg/ha)
87.5 51.17 56.69 93.15 29.82 122.97 11.46 5.87
100 52.16 57.51 94.92 30.96 125.88 11.44 5.98
112.5 54.38 60.47 99.49 34.42 133.91 11.50 6.27
125 54.46 60.72 99.61 35.11 134.72 11.51 6.27
CD (P=0.05) 1.09 NS 1.98 0.72 2.51 NS 0.18
Nitrogen Uptake and Quality of Bread Wheat

162
decreased significantly with successive delay in sowing,whereas, the sedimentation value increased with delay in
sowing. Sowing time did not produce any significant effecton test weight, grain hardness and beta-carotene contentof wheat grains.
The planting method did not differ significantly inrespect of grain yield, straw yield, nitrogen uptake, proteincontent and quality parameters of wheat.
Significantly higher grain yield was recorded with 125and 112.5 kg seed rate ha-1 from 87.5 and 100 kg seedha-1. The straw yield of wheat crop was not significantly
influenced at different levels seed rates. The different seedrate had no significant effect on the protein content in grains,however nitrogen uptake was maximum in the crop sown
with 125 kg seed ha-1 used. This might be due to highergrain and straw yield due to the higher population underhigher seed rate. The total protein harvested in grains
increased with increase in seed rate from 87.5 kg seedha-1 to 125 kg seed ha-1 and maximum protein was harvestedin grains with 112.5 and 125 kg seed ha-1, which was
significantly higher than 100 kg seed ha-1 and 87.5 kg seedha-1. The protein harvested in grains was significantly higherdue to significantly higher grain yield in higher seed rate.
The different seed rates did not influence significantly onthe test weight, sedimentation value, yellow berry content,grain hardness and beta carotene. The result confirms the
findings of Pandey et al. (2004).
Thus, it was concluded that grain yield, straw yield,nitrogen uptake and protein content in the grains were
Table 2. Effect of sowing time, planting method and seed rate on quality parameters of bread wheat
Treatment Test weight Grain hardness SDS-sedimentation Yellow pigment Yellow berry
(kg hectolitre-1) (kg) value (cc) content (ppm) (%)
Sowing time
25 October 76.08 12.38 43.50 3.83 33.24
5 November 76.64 12.57 45.68 3.95 28.94
15 November 76.74 12.56 47.59 3.98 27.73
CD (P=0.05) NS NS 2.22 NS 0.40
Planting Method
Bed Planting 76.45 12.39 45.72 3.89 29.98
Flat sowing 76.52 12.62 45.45 3.95 29.96
CD (P=0.05) NS NS NS NS NS
Seed rate (kg/ha)
87.5 76.34 12.19 45.35 3.87 29.94
100 76.46 12.37 46.35 3.94 30.24
112.5 76.49 12.64 45.30 3.97 2958
125 76.65 12.81 45.35 3.89 30.10
CD (P=0.05) NS NS NS NS NS
maximum at 15th November sowing, which was statisticallyat par with sowing time of 5th November. Among different
seed rates, the maximum grain yield and nitrogen uptakeof wheat was obtained with 125 kg ha-1, which wasstatistically at par with 112.5 kg seed ha-1 and significantly
higher than 87.5 and 100 kg seed rate.
REFERENCESAACC (1990) Approval methods, Association of cereals chemists,
ST. Paul, Minnesota, USA
Anonymous (2008) Website: http// www.indiastat.com
Axford, D. W. E., McDEnmott, E. E. and Radman, D. G. (1979) Noteon sodium dodecyl sulphate test of bread making qualitycomparision with Pelshenke and Zeleny Test. Cereal Chem.56(6): 582-584.
Bangarwa, K. S. and Ahlawat, T. R. (1996) Effect of date of sowingon grain yield and quality in macaroni wheat. Annals of Agri.Bio. Res. 1(1-2):73-74.
Kulhari, S. C., Sharma, S. L. and Kantwa, S. R. (2003) Effect ofvarieties, sowing dates and nitrogen levels on yield, nutrientuptake and quality of durum wheat. Ann. Agric. Res. 24(2):332-336.
Kumar, R. and Kumar, S. (1997) Effect of time of sowing and nitrogenapplication on marcaroni wheat for yield and some qualityparameters in sandy loam soil of Haryana. Indian J. Agric.Sci. 67(11): 543-544.
Kumar, R., Nanwal, R. K. and Agarwal, S. K. (2006) NPK contentand uptake as affected by planting systems, seed rates and Nlevels in wheat (Triticum aestivum L.). Haryana Agric. Univ.J. Res. 36: 93-96.
Pandey, A. K. and Prakash, V. (2003) Response of wheat varietiesto seed rates under rainfed condition. Ann. Agric. Res. 24(3):567-569.
Balkaran Singh, R.S. Uppal and R.P. Singh

163
Pandey, I. B., Bharati, V., Bharati, R. C. and Mishra, S. S. (2004)Effect of fertilizer levels and seed rates on growth and yieldof surface-seeded wheat (Triticum aestivum L.) under lowlandrice ecosystem of north Bihar. Indian J. Agron. 49(1): 43-45.
Sharma, S. K., Sardana, V. and Randhawa, A. S. (1999) Effect oftime of sowing and levels of the NPK fertilizers on the grainyield and yellow berry incidence in duram wheat. J. Res.
Punjab Agric. Univ. 36(1-2): 9-13.
Singh, N. B. and Ahmad, Z. (1997) Response of wheat (Triticumaestivum) varities to different dates of sowing. Indian J. Agric.Sci. 67(5): 208-211.
Singh, A. K. and Jain, G. L. (2000) Effect of sowing time, irrigationand nitrogen on grain yield and quality of duram wheat. IndianJ. Agric. Sci. 70(8): 532-533.
Received 7 January, 2011; Accepted 17 November, 2011
Nitrogen Uptake and Quality of Bread Wheat

Rice (Oryza sativa L.) is one of the most importantcrop grown in Asia under varying hydrological conditions. It
has gained popularity because of food habit, its high yieldpotential as well as assured procurement at minimumsupport price by the Government. In Punjab, rice is a major
kharif crop cultivated on an area about 2.8 million hectareswith total production of 10.8 million tonnes (Anon., 2012).Rice seedlings are transplanted after puddling and this
operation requires large amount of irrigation water. Beforethe start of rice cultivation on large scale i.e., during 1960’s,the underground water level of Punjab state was very
shallow and with the increase in cropping intensity/continuous cultivation of puddled transplanted rice, watertable has declined drastically. It is estimated that in majorrice growing areas of the state, the ground water is declining
at the rate of 0.23 meter per year (Gupta et al., 1995) causingserious concern and raising doubt about the futuresustainability of rice-based system in the state. Therefore,
need has acutely been felt to develop technically viable andeconomically feasible alternate technique for growing ricein this area.
Already, various resource conservation technologies
for rice have been developed and used in Indo-Gangetic
plains. Direct seeding of rice under unpuddled conditions
is one such technique for better water use efficiency (Mann
et al., 2004), labour and cost-effective (Pandey and Velasco,
1999). It matures earlier (7-10 days) than the transplanted
rice due to absence of transplanting shock (Dhyani et al.,2005) and allows timely planting of succeeding wheat crop.
Direct seeded rice accounts for 36 per cent of the total rice
cultivated area in India (Nageshwari and Subhramaniyan,
2004). The direct seeded rice (DSR) was initiated on
approximately 500 acres of field located in 13 districts of
Punjab, which would be expanded up to 20,000 acres in
five districts of Punjab in the next 3 to 5 years. It is now fast
replacing traditional transplanted rice areas with good
drainage and weed control (Balasubhramanian and Hill,
2000). The present study aimed to evaluate the effect of
date of sowing and varieties on growth and crop yield of
direct seeded rice.
Performance of Direct Seeded Rice as Influenced by Variety andDate of Sowing
U. S. Walia*, S. S. Walia and Shelly NayyarDepartment of Agronomy,Punjab Agricultural University, Ludhiana-141 004, India
*E-mail: [email protected]
A field study was conducted during Kharif 2006 and2007 on loamy sand soil, which was low in available N and
medium in available P and K on the experimental farm ofPAU, Ludhiana. Experiment was laid out in split plot designby keeping two varieties of rice (PR115 and PR116) in the
main blocks. Four date of sowings i.e., 8, 15, 23 and 30June during the respective years, were in the sub-plots.These treatments were compared with conventional practice
of transplanting during both years. A seed rate of 40 kg ha-1
was used in all the direct seeding treatments. Sowing ofdirect seeded rice was done manually in the dry conditions
and the seed was hand drilled by keeping row to rowspacing of 20 cm. Light irrigation was applied immediatelyafter sowing and later on irrigations were applied at an
interval of 3-4 days. Pre-emergence application ofpendimethalin at 0.75 kg ha-1 was made within 2 days ofsowing and besides the application of herbicides, two hand
weeding were also given to keep the crop free from weeds.The direct seeded crop received 150 kg N ha-1 in three splits,i.e., during third, sixth and ninth week after sowing, whereas
transplanted crop was supplied with 120 kg N ha-1 in threesplits, i.e., 1/3rd each at transplanting, third and sixth weekafter transplanting. Fifty kg zinc sulphate ha-1 was also
applied at sowing.
The plots to be puddled were surrounded by bunds of15 cm height and flooded with 5–7 cm of water. The plots
were kept moist for the 15 days with light irrigation atalternate day intervals and thereafter, irrigation was applied3 days after the ponded water infiltrated in the plots. The
irrigation was continued till 15 days before the harvesting ofcrop. The irrigations were stopped during rains and furthercontinued at 3 days interval.
Plant height recorded up to the base of flag leaf of twovarieties was found to be similar (Table 1). The crop raisedby transplanting rice seedlings technique recorded
significantly higher plant height as compared to directseeded crop sown on 23rd June and 30th June. However,plant height of transplanted crop was at par with the crop
sown on 8th June and 15 June. The differences in numberof effective tillers m-2 recorded at harvest were found to be
Indian J. Ecol. (2012) 39(1) : 164-166Indian Journal
of Ecology

165
non-significant during 2006, however, during 2007, PR 115produced significantly higher tillers m-2. During 2006, crop
sown on 23rd June recorded significantly lower effectivetillers m-2 as compared to transplanted and direct seededrice sown on 8th June. During 2007, crop sown on 23rd
June and 30th June recorded significantly lower effectivetillers m-2 than the transplanting and direct-sown rice on 8thand 15th June. The lower effective tillers m-2 in direct seeded
rice sown on 23rd and 30th June during 2007 were due tosevere attack of stem borer in these treatments.
Panicle length of PR 115 and PR 116 was similar during
both the years of study (Table 2). Panicle length of the cropsown on 23rd and 30th June was found to be significantlylower than the crop sown on 8th and 15th June and
transplanting treatments. Direct sowing of rice on 8th and15th June yielded at par with conventional puddled
transplanted rice (Table 2). Late sowing of direct-seeded
rice (23rd and 30th June) resulted in significantly lower grain
yield as compared to transplanted rice. There was drastic
reduction in yield with delayed sowing during 2007, which
may be due to severe attack of stem borer on these plots.
Lower yields of direct-seeded rice sown on 23rd and 30th
June were due to less number of effective tillers and smaller
panicle length as compared to other treatments. On an
average of two years, transplanted and direct seeded rice
sown on 8th, 15th and 23rd June recorded 121, 108, 90
and 28 per cent higher yield, respectively, than direct seeded
rice sown on 30th June. Gill et al. (2006) observed that the
crop sown on 1st June gave grain yield at par with 10th
June and significantly higher by a margin of 9.4 q ha-1 than
20th June sown crop. All interaction effects were found non-
significant.
Table 2. Panicle length and grain yield of rice as influenced by variety and date of sowing
Treatment Panicle length (cm) Grain yield (q ha-1)
2006 2007 2006 2007
Varieties
PR 115 25.4 25.6 41.94 42.25
PR 116 24.1 23.6 38.75 35.91
LSD (P= 0.05%) NS NS NS NS
Sowing time
Direct Sowing on 8th June 27.1 27.4 44.09 53.61
Direct Sowing on 15th June 26.9 25.3 42.65 46.62
Direct Sowing on 23rd June 21.5 22.3 35.80 24.04
Direct Sowing on 30th June 19.4 21.8 31.66 15.22
Transplanting 4th July 28.4 28.1 47.53 55.93
CD (P = 0.05) 2.6 2.3 6.19 9.41
Table 1. Plant height and effective tillers of rice as influenced by variety and date of sowing
Treatment Plant height (cm) Effective tillers m-2
2006 2007 2006 2007
Varieties
PR 115 57.2 56.2 310.5 243.0
PR 116 56.8 53.4 301.5 217.5
LSD (P= 0.05%) NS NS NS 14.1
Sowing time
Direct Sowing on 8th June 58.7 62.9 311.5 317.0
Direct Sowing on 15th June 56.9 55.0 302.5 286.5
Direct Sowing on 23rd June 55.6 45.9 291.0 102.5
Direct Sowing on 30th June 53.1 47.4 302.5 104.5
Transplanting 4th July 61.0 62.6 306.4 324.0
CD (P = 0.05) 5.1 4.1 14.6 52.0
Varietal and Date of Sowing Response on Direct Seeded Rice

166
REFERENCESAnonymous (2012) Package and Practices for Kharif crops of
Punjab. Punjab Agricultural University, Ludhiana.
Balasubramanian, V. and Hill, J. (2000) Direct wet seeding of rice inAsia: Emerging issues and strategic research needs for the21st Century. Paper presented at Annual Workshop of theDirectorate of Rice Research, Hyderabad, Andhra Pradesh.
Dhyani, V. C., Singh V.P. and Singh, G. (2005) Response of ricecrop establishment and weed management. Indian J. WeedSci. 37: 260-262.
Gill, M. S., Kumar, A. and Kumar, P. (2006) Growth and yield of rice(Oryza sativa) cultivars under various methods and time ofsowing. Indian J. Agron. 51: 123-127.
Gupta, R. D., Mahajan, G. and Goyal, B. R. (1995) Availability andquality of ground water in Punjab state. In: Water Management.Punjab Agricultural University, Ludhiana, India, pp 18-42.
Nageshwari, R. and Subhramaniayan, B. (2004) Influence of delayedbasal dressing and split application of nitrogen in wet-seededrice (Oryza sativa). Indian J. Agron. 49: 40-42.
Mann, R.A., Munir, M. and Haqqani, A.M. (2004) Effect of resourceconserving techniques on crop productivity in rice–wheatcropping system. Pak. J. Agric. Res. 18: 58.
Pandey, S. and Velasco, L. (1999) Economics of direct seedling inAsia: Patterns of adoption and research priorities. Int. RiceRes. Newslett. 24: 6–11.
Received 4 July, 2011; Accepted 5 April, 2012
U. S. Walia, S. S. Walia and Shelly Nayyar

167
Physiological maturity (PM) of the seeds is the stage at
which the seeds attain its maximum dry weight and
represents maximum viability and vigour of the seed. The
change that occurs in the seeds beyond PM is mainly due
to dehydration without any accumulation of reserves. During
this period of dehydration, there is no change in the seed
quality in some of the crops. But in others maximum seed
quality in terms of germination is attained some times
beyond PM. So optimum time of harvest is very important.
This necessitates accurate and precise determination of
physiological maturity of the crop for the harvest of high
quality seeds. Harvesting the seeds at optimum fruit
maturity immensely declines the loss of the seed due to
germination and vigour. Since the fruit colour serves as
effective visual morphological index for physiological
maturity therefore it was correlated with the seed quality.
Further there are reports of dormancy in summer squash
which is more pronounced at lower temperature and being
altered at high temperature. Cucurbits are warm climate
crops which are both cold weather and frost sensitive and
most of them require relatively high temperatures for
germination (Nerson, 2007). Minimum and maximum
germination temperatures have been reported from 15 and
45°C, respectively, with large differences among cultivars
(Singh, 1991). Thus, objective of the study was to investigate
the effects of fruit colour at the time of seed extraction,
different germination temperatures and fruit storage on
germination and various vigour parameters of Cucurbitapepo L. seeds and to provide some practical suggestions.
The experiment was conducted at the experimentalarea of Seed Technology Center, PAU, Ludhiana. The cropwas sown during the first week of March 2010. At the time of
harvesting, the fruits were classified into three categoriesi.e., light yellow, deep yellow and deep orange. The seedsthus extracted were subjected to analysis of seed quality
parameters viz., percentage germination (Anon., 1996),fresh and dry weight of seedlings, root length, shoot length,vigour index I and II (Abdul Baki and Anderson,1973) and
100 seed weight. The germination tests were conducted
Effect of Fruit Maturity and Temperature on Seed Germination inSummer Squash (Cucurbita pepo L.)
Namarta Gupta*, S.S. Bal1 and H.S. Randhawa1
Seed Technology Center, 1Directorate of Seeds,Punjab Agricultural University, Ludhiana-141 004, India
*E-mail: [email protected]
using three replications of 50 seeds in each using roll towelpaper method. The germination was recorded on 8th daysper ISTA methods (Anon.,1996). The vigour index I
(percentage germination x seedling length) and vigour indexII ( percentage germination x dry weight of seedlings) werecomputed adopting the method of Abdul–Baki and Anderson
(1973).
In the present study, the significant differences wereobserved among the different harvest stages with respect
to seed quality parameters. All the quality parameters likepercent germination, fresh and dry weight of seedlings, rootlength, shoot length, vigour index I and II and 100 seed
weight increased as the stage of harvesting advances. Theseeds obtained from earlier stages were immature, poorand under developed which is evident from lower 100 seed
weight (4.03g in light yellow, 3.08g in orange yellow). As thefruit weight increased with the maturity stage (from 2.01 inlight yellow, 3.08 in orange yellow to 3.57g in deep orange),
the 100 seed weight also increased from 2.02 in light yellowand 3.08 in orange yellow to 7.14g in deep orange. Thehigher 100 seed weight at deep orange stage could be due
to further accumulation of photosynthates in the seed.
The deep orange coloured fruits recorded maximumpercent germination, fresh weight and dry weight of the
seedlings as compared to the fruits harvested at earlierstages. The seeds extracted from fruits from light yellowcolour had germination less than 50 per cent germination
(Table 1). However, when seeds were extracted from fruitsripened to orange yellow colour, their germination increasedto 77.5 per cent. Seeds from deep orange coloured fruits
achieved the maximum germination of 92.5 per cent. Thefresh and dry weight of the seedlings was maximum atdeep orange. Similarly the higher vigour index of the
seedling at deep orange stage indicated that seedpossesses maximum dry weight (0.041 g in deep orangeas compared to 0.025 g and 0.034 g ) and vigour (Vigour
Index II 18.96 at deep orange as compared to 13.33 and6.51 at earlier stages) at the stage of physiological maturity.However in some of the crops PM occurs a little before the
Indian J. Ecol. (2012) 39(1) : 167-168Indian Journal
of Ecology

168
harvest maturity as in capsicum (Naik et al., 1996; Alan andEser, 2008) and is correlated to high respiration rate andphotosynthetic partitioning at the time of seed maturity. When
the fruits were stored for a few weeks, they showed declinedpercentage germination due to the development of microflora on the pulp of fruit and even the seeds. This was
attributed to the reason that harvesting period of the seedcrop (end June and July) coincides with the arrival of hotand humid monsoons which result in the development of
the inoculums.
When the seed germination was tested at two different
temperatures, the per cent germination was more at all the
three stages (being 52.5 in light yellow, 77.5 in orange yellow
to 92.5 in deep orange) at 280C as compared to the
germination per cent at 220C (being 4..05 in light yellow,
62.5 in orange yellow to 67.5 in deep orange). This is
attributed to the optimum temperature for the activation of
biochemical reactions in the cell and activation of the
enzymes needed for the germination process. Our findings
are in accordance with the findings of Milani et al. (2007)
that optimum germination temperatures range from 20 to
32°C while 15 and 38°C are the minimum and maximum
germination temperatures, respectively.
Thus, from the study, it can be concluded that fruit ofdeep orange colour in summer squash (PCK-1) may beharvested for wet seed extraction, surface dried to have
best quality seeds. The fruits should not be stored for seedextraction for days or weeks. The seeds show highergermination per cent at 280C.
REFERENCESAbdul-Baki, A.A. and Anderson, J.D. (1973) Vigour determination in
soybean by multiple criteria. Crop Sci. 13: 630-633.
Alan, O. and Eser, B. (2008) The effect of fruit maturity and post-harvest ripening on seed quality in hot and chronic peppercultivars. Seed Sci. Tech. 36: 467-474.
Anonymous (1996) International rules for seed testing (ISTA): rules.Seed Sci. Tech. 24 Suppl.: 29-356
Milani, E., Seyed, M., Razavi, A., Koocheki, A,, Nikzadeh, V., Vahedi,N., MoeinFard, M. and Gholamhossein Pour, A. (2007) Moisturedependent physical properties of cucurbit seeds. Int.Agrophys. 21: 157-168.
Naik, L.B., Hebber, S.S. and Doijode, S.D. (1996) Effect of fruitmaturity on seed quality in capsicum (Capsicum annuum L.).Seed Res. 24: 154-155.
Nerson, H. (2007) Seed production and germinability of cucurbitcrops. Seed Sci Biotechnol. 1: 1-10.
Singh, D.K. (1991) Effect of temperature on seed germinability ofMomordica charantia cultivars. New Agriculturist 2: 23-26.
Table 1. Effect of different maturity stages of fruits and temperature on seed quality parameters in summer squash (Cucurbita pepo L)
Fruit Maturity % Shoot Root Seedling Fresh Dry Vigour Vigour
Stage Germination length length length weight weight index index
(cm) (cm) (cm) (g) (g) I II
Temperature (28°C)
Deep orange 92.5 25 20 45 1.11 0.041 4162.5 18.96
orange yellow 77.5 22 19 41 0.861 0.034 3177.5 13.33
Light yellow 52.5 20 16 36 0.697 0.025 1890.0 6.51
Temperature 22°C
Deep orange 67.5 20 17 37 0.973 0.035 2497.5 11.81
Orange yellow 62.5 18 14 32 0.816 0.033 2000.0 10.31
Light yellow 45.0 15 14 29 0.665 0.025 1305.0 5.54
Received 5 July, 2011; Accepted 4 March, 2012
Namarta Gupta, S.S. Bal and H.S. Randhawa

Wheat, being the most important cereal crop is of greatsignificance in agriculture for triggering green revolution
and will also play a vital role in stabilizing national foodsupply in coming decades. Phosphorus is the backbone ofany fertilizer management programme and plays a key role
in energy related activities and development of root system(Mehta et al., 2005). Zinc has been rated as the fifth mostimportant plant nutrient ranking behind nitrogen,
phosphorus, potassium and sulphur. Zinc plays animportant role in sustaining yield and quality of crops andis removed by crops in large quantities. The need for
applying micronutrient fertilizers to soils of Punjab was firstfelt with the appearance of zinc deficiency in rice and wheat.The adoption of intensive agriculture in irrigated areas
involving cultivation of high yielding crop cultivars, use of
high analysis macronutrient fertilizers, decreased use of
organic manures and crop residues resulted in depletion
of micronutrient reserves in soils due to bumper crop
harvests. The deficiency of zinc is mainly associated with
soils having coarse texture, high pH, low organic matter
content and high calcium carbonate content in the soils
(Takkar et al.,1999).The efficiency of applied P rarely exceeds
30 per cent and that of Zn more than 10 per cent in the soil
(Nayyar et al., 1990).Therefore, repeated application of
phosphorus over the years leads to its build up and
interactions in soil and/or plants affecting crop production.
However, both P and Zn deficiencies occur simultaneously
as compared to other nutrients in Indian soils. Hence, it
may be worthwhile to apply P and Zn together, which may
boost up the use efficiency of both the nutrients. In India,
zinc enriched diammonium phosphate and nitro-
phosphorus fertilizers have also been found to be effective
in rectifying zinc deficiency in crops (Savithri et al. 1999).
The information on Zn and P relationship in an important
crop like wheat is not adequate, especially in situations
where both the interacting nutrients (P and Zn) are deficientin soil. Keeping the above facts in view the presentinvestigation was carried out for two years to study the effect
Evaluation of N, P, Zn Complex Fertilizer for its Efficiency usingWheat as Test Crop in Indo–Gangetic Alluvial Soils of Northwestern
India
B.S. Brar, D.S. Benipal* and Jagdeep SinghDepartment of Soil Science, Punjab Agricultural University, Ludhiana-141 004, India
*E-mail: [email protected]
of soil application of different levels of phosphorus and zincon their uptake, response and yield of wheat.
A field experiment was conducted at PAU, ResearchFarm on wheat for two years in rice-wheat cropping systemusing wheat as test crop situated 30O 54’ N latitude 750 46’E
longitude at 280 m above mean sea level. The soils at PAUResearch farm were loamy sand, non-calcareous, TypicUstochrepts. The pH of the field under investigation was
8.2, the electrical conductivity (EC) of the field was 0.22 dSm-1 and the field was poor in organic carbon (3.2 g kg-1) asdetermined by standard methods. The soil tested low in
available P (11.5 kg ha-1) determined by the method givenby Olsen et al. (1954) and in available Zinc (0.50 ppm)determined by the method given by Lindsay and Norwell
(1978 ). The treatments included two phosphorus levels P0
and P66 kg P2O5 ha-1 with four Zn levels of 0, 1.8, 5 and 10 kgi.e., ha-1. Zinc was applied through mosaic complex fertilizer
N: P: Zn (10:50:1.5) in some treatments and through zincsulphate in other treatments. The experiment was conductedin randomized block design with three replicates. The grain
and straw yield of the crop were recorded and total uptakeof nutrients were also analyzed. The agronomic efficiency(AE) and nutrient use efficiency (NUE) were computed using
the following formulae:
Grain yield in fertilized plot- Grain yield in controlAE = ——————————————————————(kg grain kg-1 Amount of nutrient appliednutrient applied)
Nutrient uptake in fertilized plot- Nutrient uptake in controlNUE (%) = —————————————————————x 100 Amount of nutrient applied
The grain and straw yield of wheat increasedsignificantly with the application of 60 kg P ha-1, it improvedfurther to the tune of 5.1 and 4.2 q ha-1 when 5 kg zinc was
added through zinc sulphate along with 60 kg P ha-1 overcontrol. The grain and straw yield of wheat for both the yearswere at par when zinc was applied through mosaic zinc
Indian J. Ecol. (2012) 39(1) : 169-171Indian Journal
of Ecology

170
complex fertilizer. The grain and straw yield of wheat were
also similar by the application of 1.8 and 5.0 kg Zn ha-1
indicating that 1.8 kg zinc ha-1 is sufficient to meet the croprequirement in terms of increasing yield. (Table 1).In a field
experiment in wheat paddy system Khan et al. (2007) foundthat direct application of 5 and 10 kg zinc ha -1 to paddy gavean increase of 39 and 45 per cent, respectively. With the
application of 60 kg P, the grain and straw yields of wheatfor the years 2004-05 and 2005-06 increased by 27.7 and19.9 per cent over control, which may further increased to
the tune of 42.9 and 26.4 per cent with the application of 5kg zinc along with 60 kg P ha-1. The trends in grain andstraw yield of wheat remained almost same when the dose
of zinc was 1.8 kg ha-1 and it was applied either throughzinc sulphate or through mosaic zinc complex fertilizerindicating that 1.8 kg zinc ha-1 is sufficient for the requirement
of wheat crop and both the sources of zinc were at par inincreasing the wheat crop yields. In alluvial soils of Punjab.Brar et al. (2006) also evaluated this complex fertilizer on
paddy and found that the grain yield of paddy increased
significantly when zinc was applied through N P Zn complexfertilizer either alone or in combination with zinc sulphate.In a six year experiment, the mean response to zinc on a
Fatehpur loamy sand soil was 1.9 q ha-1 (Chandi andTakkar,1982). On moderately alkaline soil, according toTakkar and Randhawa (1978) the response of wheat to the
zinc varied from 8 to 17 q ha-1. In a field experiment, total Nuptake increased significantly with the application of P, itfurther improved with the addition of zinc (130.8 kg ha-1).
Total N uptake was highest in plots where NPZn compexfertilizer was applied (141.7 kg ha-1) and lowest in control.Similar type of trends were observed in total K uptake in the
crops for both the years. The uptake of N and K alsoincreased significantly with the application of P and zincindicating synergistic effect of integrated application of these
nutrients. Total uptake of P increased significantly with theapplication of P, its content improved when 5 kg Zn wasapplied along with P. Increase in P uptake with P application
Table 1. Grain and straw yield of wheat (q ha-1) as affected by levels and sources of P and Zn fertilizers (mean of two years)
Treatments Grain Straw % increase over % increase over
control (grain) control (straw)
P0 Zn0 33.5 57.6 - -
P60 Zn0 42.8 68.6 27.7 19.9
P60 Zn5 47.9 72.8 42.9 26.4
P60 Zn1.8+3.2* 47.6 79.1 42.1 37.3
P60
Zn0(DAP)
44.6 74.2 33.1 28.8
P60 Zn1:8* 47.6 76.9 42.1 33.5
P60 Zn1.8 47.3 76.8 41.2 33.4
P0 Zn5 43.9 75.5 31.0 30.3
P60 Zn10 44.7 71.6 33.4 24.0
P60 Zn1.8+3.2 47.2 78.5 41.0 36.3
CD (0.05) 4.1 6.1
* Applied through 10-50-0-1.5Zn
Table 2. Nutrient uptakes by wheat as affected by levels and sources of P and Zn fertilizers (mean of two years)
Treatments Total nutrient uptake (kg ha-1) (g ha-1)
N P K Zn
P0 Zn0 80.6 13.4 69.0 177.0
P60 Zn0 107.6 17.6 75.6 228.1
P60 Zn5 130.8 21.3 98.2 293.9
P60 Zn1.8+3.2* 141.7 22.5 122.0 323.8
P60 Zn0(DAP) 122.5 21.5 99.0 244.9
P60 Zn1:8* 131.7 19.3 113.8 281.7
P60 Zn1.8 115.0 21.2 106.4 275.7
P0 Zn5 110.3 17.5 96.4 242.3
P60 Zn10 139.8 18.0 97.7 259.3
P60 Zn1.8+3.2 128.4 22.6 116.4 223.9
CD (0.05) 15.8 2.7 13.4 38.2
B.S. Brar, D.S. Benipal and Jagdeep Singh

171
Table 3. Agronomic efficiency and apparent recoveries of phosphorus and zinc by wheat (mean of two years)
Treatments Agronomic efficiency Apparent P Agronomic efficiency Apparent Zn
for P (kg grain recovery (%) for Zn (g grain kg-1 recovery (%)
kg-1 P applied) Zn applied)
P0 Zn0 - - - -
P60 Zn0 44.8 24.1 - -
P60 Zn5 22.7 16.4 57.3 5.1
P60
Zn1.8+3.2*
23.5 19.3 61.3 5.6
P60 Zn1.8* 19.0 17.6 69.4 13.3
P60 Zn0 (DAP) 39.2 22.1 - -
P60 Zn1.8 17.0 15.8 59.8 4.8
P60 Zn1.8+3.2 21.8 17.3 58.2 11.6
has also been observed by Setia (2002). The contents oftotal P uptake in grain and straw of wheat were almostsimilar when the Zn was applied either through
heptahydrate or mosaic zinc complex fertilizer. The increasein P uptake was insignificant when the dose of zinc wasenhanced from 1.8 to 5.0 kg Zn ha-1. Total uptake of zinc
also increased significantly with the application of zinc atboth the levels i.e., 1.8 and 5.0 kg Zn ha-1. Total zinc uptakewas minimum in control (177.0 g ha-1) and maximum in
plots where mosaic zinc complex fertilizer was added (323.8g ha-1). When both the levels of zinc (1.8 and 5.0 kg zinc kgha-1) were compared, increase in total uptake of zinc wasinsignificant. The agronomic efficiency of P over control was
41.8 kg grain kg-1 P applied and it reduced with the applicationof zinc, similar trends were observed in apparent recoveryof P (Table 3). Value of agronomic efficiency of applied zinc
was highest (69.4 g grain kg-1 zinc) at its lower level ofapplication in mosaic zinc complex fertilizer treated plotsfollowed by zinc sulphate ( 59.8 g grain kg-1 zinc) treated
plots.
So from the present investigation it is concluded thatthe fields deficient in P and Zn, the N, P, Zn complex fertilizer
can be used for obtaining higher crop yields.
REFERENCESBrar,B.S., Benipal, D.S., Singh, Jagdeep and Mavi,M.S. (2006)
Evaluation of NPZn complex fertilizer for its efficiency usingrice as test crop in an alluvial soil of Punjab. Environ. Ecol.
24(S): 389-392.
Chandi,K.S. and Takkar,P.N. (1982) Effect of agricultural system onmicronutrient transformation. Pl. Soil. 69 :423-436.
Khan, R., Gurmani, A.R., Khan, M.S. and Gurmani, A.H. (2007) Effectof zinc application on rice yield under wheat rice system. Pak.J. Biol. Sci.10:235-239.
Lindsay,W.L. and Norwell, W.A. (1978) Development of DTPA soiltest for zinc, iron, manganese and copper. Soil Sci. Soc.Am.J.42:421-428.
Mehta,Y.K., Shaktawat, M.S. and Singhi,S.M. (2005) Influence of S,phosphorus and farmyard manure on yield attributes and yieldsof maize (Zea mays) in Southern Rajasthan conditions. IndianJ. Agron. 50 (3):203-205.
Nayyar, V.K.,Takkar, P.N., Bansal, R.L., Singh, S.P., Kaur, N.P. andSadana, U.S. (1990) Micronutrients in soils and crops of Punjab.Res. Bull. Depaprtment of Soils. Punjab Agric. Univ. Ludhiana,India, pp. 148.
Olsen, S.R., Cole, C. V., Watanabe, F.S. and Dean, L.A. (1954)Estimation of available P by extraction with sodium bicarbonate.USDA Circ 939.
Takkar, P.N. and Randhawa, N.S. (1978) Micronutrients in Indianagriculture. Fert. News 23: 3-26.
Takkar, P.N., Chhibba, I. M. and Mehta, S. K. (1999) Twenty years ofcoordinated research on micronutrients in soils and plants.Bull. I. Indian Inst. Soil Sci., Bhopal, India, pp. 314.
Savithri, P., Perumal, R. and Nagarajan, R. (1999) Soil and cropmanagement technologies for enhancing rice production undermicronutrient constraints. Nutr. Cycl. Agroecosys. 53:83-92.
Setia, R.K. (2002) Chemical pools of nutrients and their dynamics insoils under continuous maize-wheat system. M.Sc. Thesis,Punjab Agric. Univ., Ludhiana.
Evaluation of N, P, Zn Complex Fertilizer
Received 20 June, 2011; Accepted 4 January, 2012

Sprouting broccoli (Brassica oleracea var. italica Plank)
is the most important winter vegetables in India, whichbelongs to family Brassicaceae. It is herbaceous annualvegetable grown for its green tender curd and biennial for
seed production. United States of America is the largestproducer of broccoli in the world. In recent year, cultivationof broccoli has gained momentum in India. The progressive
use of fertilizers along with inorganic fertilizers may be theright answer to increase the productivity. The bio-fertilizersdenote all the nutrient inputs of biological origin for plant
growth. They possess unique ability to enhance productivityby biological nitrogen fixation and solublization of insolublephosphate or producing hormones, vitamins or other growth
factors required for plant growth. In recent years, uses ofmicrobial inoculants as source of bio-fertilizers havebecome a hope for most of the countries as far as
economical as well as environmental concerns. Therefore,in developing countries like India, it can solve the problemat high cost of fertilizer and help in saving the economy of
the country. The present study aimed to assess theperformance of broccoli under inorganic chemical and bio-fertilizers conditions.
The field experiment effect of bio-fertilizers withchemical fertilizers on growth and yield of broccoli (Brassicaoleracea L. var. italica Plank) cv. Fista was conducted at
Babasaheb Bhimrao Ambedkar University, Lucknow during2009-10 in randomized block design with three replications.There were ten treatments combinations of NPK and bio-
fertilizers. The plants were randomly selected and threeplants were tagged in each plot in the beginning forrecording various observations on 45th, 60th, 75th and 90th
day after transplanting on ten growth, yield and yieldattributing traits viz., height of plant (cm), number of leavesper plant, leaf length (cm), leaf width (cm), leaf weight per
plant (kg), stem diameter (cm), curd diameter (cm), grossweight of plant (kg), net weight of curd (kg) and yield (q ha-1).
Effect of Bio-fertilizers in Combination with Chemical Fertilizers onGrowth and Yield of Broccoli (Brassica oleracea Var. italica Plank)
Pradeep Kumar, Sanjay Kumar*, Yogesh Chandra Yadav and Adesh KumarDepartment of Applied Plant Science (Horticulture)
Babasaheb Bhimrao Ambedkar University Lucknow-226 025 (UP), India *E-mail: [email protected]
The effect of different treatment combinations of
chemical fertilizers along with bio-fertilizers on growth andyield of curd are given in Table 1. The maximum plant heightand number of leaves per plant on 45th and 90th day after
treatment (DAT) was recorded in treatment PSB + 50% Pand recommended dose N & K followed by Azotobacter +recommended of NPK and PSB+75% P and RD of N and
K. The maximum length and breadth also showed the sametrend. The maximum length of leaf, curd diameter grossweight of plant and net weight of curd gross weight of plant
and net weight of curd was recorded in PSB + 50% P andrecommended dose N & K through chemical fertilizersfollowed by Azotobacter + recommended of NPK and
PSB+75% P and RD of N and K at 90th DAT. The yield wassignificantly affected by various bio-fertilizers treatments.The maximum yield (362.96q ha-1) was obtained by PSB +
50% P and recommended dose N and K through chemicalfertilizers and was significantly superior over all thetreatments and control. Same findings were found by the
Bhattacharya et al. (1997) and Singh et al. (2006). Theminimum yield (285.18q ha-1) was observed withrecommended dose of chemical fertilizers (control).
On the basis of above observations, it could beconcluded that the application of PSB+50% P andrecommended dose (150, 60 & 60 kg ha-1) of NPK through
chemical fertilizers proved best for higher curd yield ofbroccoli.
REFERENCESBhattacharya, P., Jain, R.K., Paliwal, M..K. and Argar, M.Y. (1997)
Effect of azospirillum and azotobactor on growth, yield andquantity of knol-khol (Brassica oleracea var. gongylodes L.)Veg. Science 24(1): 16-19.
Singh, R., Chaurasia, S.N.S. and Singh, S.N. (2006) Response ofnutrient sources and spacing on growth and yield of broccoli(Brassica oleracea var. italica Plank). Veg. Science 33(2):198-200.
Indian J. Ecol. (2012) 39(1) : 172-173Indian Journal
of Ecology

173
Tab
le 1
. E
ffect
of
diffe
rent
tre
atm
ent
com
bina
tions
of
chem
ical
fer
tiliz
ers
alon
g w
ith b
io-f
ertil
izer
s on
gro
wth
and
yie
ld o
f br
occo
li
Tre
atm
ents
Hei
ght
ofN
umbe
r of
Leaf
len
gth
Le
af
Stem
Cur
dG
ross
Net
Yie
ld
plan
t (c
m)
leav
es p
er p
lant
(cm
)w
idth
diam
eter
diam
eter
we
igh
tw
eig
ht
(q h
a-1)
45th
90th
45th
90th
45th
90th
(cm
)(c
m)
(cm
)of
pla
nto
f cu
rd
DAT
DAT
DAT
DAT
DAT
DAT
(kg)
(kg)
Rec
omm
ende
d do
se o
f NP
K22
.40
41.9
86.
8014
.50
38.3
21.
190
1.06
2.27
10.8
22.
310.
750
28
5.1
8
Azo
toba
ctor
+50
% N
and
RD
of
P a
nd K
23.6
242
.90
7.90
15.2
138
.74
1.84
00.
983.
0411
.26
2.78
0.79
42
94
.07
Azo
toba
ctor
+75
% N
and
RD
tot
al24
.10
46.4
88.
6015
.87
40.9
91.
840
1.19
3.16
11.4
53.
150.
847
31
3.7
0
reco
mm
ende
d d
ose
of P
and
K
Azo
toba
cter
+ r
ecom
men
ded
of
NP
K27
.98
49.2
510
.60
17.4
246
.72
2.10
61.
513.
5012
.80
3.96
0.97
23
60
.00
PS
B +
50%
P a
nd R
D o
f N
and
K28
.20
50.4
110
.90
18.1
248
.90
2.19
01.
513.
5013
.47
4.59
0.98
03
62
.96
PS
B+
75%
P a
nd R
D o
f N a
nd K
26.9
249
.10
9.83
17.1
244
.73
2.00
41.
323.
3412
.45
3.54
0.96
83
58
.51
PS
B +
RD
of
NP
K26
.12
48.9
09.
6416
.50
43.0
91.
850
1.20
3.20
12.1
43.
250.
940
34
8.1
4
PB
+50
% P
and
RD
of N
and
K25
.82
47.4
59.
5816
.02
42.1
41.
710
1.12
3.10
11.4
02.
960.
820
30
3.7
0
PB
+75
% P
and
RD
of N
&K
25.9
047
.10
9.10
16.1
041
.26
1.66
01.
103.
0811
.20
2.88
0.80
52
98
.14
PB
+ R
D o
f NP
K24
.98
46.2
38.
3015
.20
41.1
01.
600
1.05
2.95
11.0
82.
580.
800
29
6.2
9
CD
(0.
05)
3.30
4.08
0.10
90.
129
3.25
0.13
90.
140.
250.
272
0.27
0.10
0.93
RD
: R
ecom
men
ded
dose
of
N,P
and
K 1
50,
60 a
nd 6
0 kg
ha-1
, re
spec
tivel
yD
AT
= D
ays
afte
r tr
ansp
lant
ing
PS
B=
Pho
spha
te S
olub
lizin
g B
acte
riaP
B=
Pho
spho
bact
eria
Effect of Bio-fertilizers of Broccoli
Rec
eive
d 24
Jul
y, 2
011;
Acc
epte
d 14
Jan
uary
, 20
12

INSTRUCTIONS TO THE CONTRIBUTORS
Original research papers concerned with various fields of ecology, both basic and applied, are accepted from themembers of the society if considered suitable by peer reviewers and the Editorial Board. It is presumed that the articlessubmitted for publication to Indian Journal of Ecology have not been previously and will not be simultaneously submittedand published in any other journal.
Manuscripts of full papers should be prepared under the following headings: Title, Affiliation, Abstract, Introduction,Material and Methods, Results and Discussion and References. Short notes should have no headings and abstract. Themanuscript should be submitted by email to Managing Editor Indian Journal of Ecology. Each MS must have names of threereviewers from institute other than place of work with email ID. Membership of all authors is mandatory. The manuscriptshould be in Times New Roman with font size 12.
Title must be short and specific. The byline should comprise name(s) of author(s), complete postal address and e-mailaddress. Title page must also include a running title of 4 to 5 words.
Abstract must be self-explanatory and should include the objectives, methodology, important points in the results anda conclusion. It should not, in any case, exceed 200 words. The authors should also suggest up to 5 key words below theabstract.
Introduction should be brief and include justification for undertaking the investigation and a short review of earlierwork. Key references related to the work must be cited.
Material and Methods should be clear and concise. This section can be subtitled for clarity.
Results should be written concisely in a logical order. All data must invariably be given in metric and decimal system.Data presented in figures should not be duplicated in tables and vice versa. All figures and tables should be cited in text andshould have concise and self-explanatory headings.
Discussion should be oriented towards explaining the significance and implications of the results obtained and shouldbe well connected with the previous work in this direction. The Results and Discussion section may preferably be combinedto avoid repetition.
References should be arranged alphabetically by the name of the first author and then by the second and third authorsas necessary. The World List of Scientific Periodicals should be followed for abbreviations of the titles of journals.
Illustrations should be very clear for photographic reproduction. Line drawings and photographs should be separatelygrouped. Photographs should be of high quality (preferably in glossy print) with sharp details and contrasts. The publicationcost of photographs will be charged separately at the prevailing market rates. Small figures should be grouped to fill a pageand full-page figure should be larger than 26 x 36 cm.
Review of manuscript -Two referees will review the article and revised article will have to be submitted within 15 days.Any further delay will result in change of date of receipt of article. Any articles without following the format of the journalwill not be considered.
For details kindly visit www.indianecologicalsociety.com
All editorial correspondence should be addressed to:
Managing Editor, Indian Journal of Ecology
Indian Ecological Society, College of Agriculture
Punjab Agricultural University, Ludhiana – 141004, India
(e-mail: [email protected])
Back VolumesAll the back volumes of Indian Journal of Ecology are available at the current subscription rates.
NAAS Rating : 3.3

Place of Publication College of Agriculture
Punjab Agricultural University
Ludhiana-141001, India
Periodicity of Publication Half yearly
Printer’s Name Dr A.K. Dhawan
Nationality Indian
Address Punjab Agricultural University
Ludhiana-141004
Name and Address of individuals who Indian Ecological Society
own the newspaper and partners/ Ludhiana-141004
shareholders holding more than one (Registration No. 67 of 1974-75
per cent of the total capital Chandigarh, dated 14.6.74)
I, A.K. Dhawan, hereby declare that the particulars given above are true to the best of my knowledge and belief.
Sd/ A.K. Dhawan(Signature of Publisher)
STATEMENT OF OWNERSHIP AND OTHER PARTICULARSABOUT INDIAN JOURNAL OF ECOLOGY
(See Rule 8)