Embed Size (px)
Citation preview
“Kv1.3 inhibitors in the treatment of glioma and melanoma”
Inaugural-Dissertation
Zur
Erlangung des Doktorgrades
Dr. rer. Nat.
der Fakultät für
Biologie
an der
Universität Duisburg-Essen
Vorgelegt von
Elisa Venturini
Aus Vicenza, Italy
August 2015

I
Die der vorliegenden Arbeit zugrunde liegenden Experimente wurden am Institut für
Molekularbiologie am Universitätsklinikum Essen durchgeführt.
1. Gutachter: Prof. Dr. Erich Gulbins
2. Gutachter: Prof. Dr. Shirley Knauer
Vorsitzender des Prüfungsausschusses: Prof. Dr. Herbert de Groot
Tag der mündlichen Prüfung: 25.11.2015
_______________________________

II
E se avessi il dono della profezia
e conoscessi tutti i misteri e tutta la scienza,
e possedessi la pienezza della fede così da trasportare le montagne,
ma non avessi l'amore,
non sarei nulla.
(Corinzi 13:2)

III
INDEX
LIST OF FIGURES
ABBREVIATIONS ................................................................................................................... I
1. INTRODUCTION .......................................................................................................... 1
1.1 Apoptosis ..................................................................................................................... 1
1.1.1 The extrinsic or ‘death receptor-mediated’ pathway ............................................ 1
1.1.2 The intrinsic or ‘mitochondrial’ pathway ............................................................. 2
1.2 Kv1.3 ............................................................................................................................ 5
1.2.1 Kv1.3 inhibitors .................................................................................................... 9
1.2.2 Kv1.3 ‘new inhibitors’: PAP-1 derivatives ........................................................ 10
1.2.3 Mitochondrial Kv1.3 and apoptosis .................................................................... 11
1.2.4 mtKv1.3 and cancer ............................................................................................ 14
1.3 Glioblastoma .............................................................................................................. 15
1.3.1 GBM and K+ channels ........................................................................................ 15
1.4 Aims of the study ....................................................................................................... 17
2 MATERIALS ................................................................................................................ 18
2.1 Chemicals ................................................................................................................... 18
2.2 Tissue culture ............................................................................................................. 21
2.3 Cell lines .................................................................................................................... 23
2.4 Equipment .................................................................................................................. 23
2.5 Buffers and solutions ................................................................................................. 25
2.6 Animals ...................................................................................................................... 27
3 METHODS .................................................................................................................... 28
3.1 Cell culture techniques ............................................................................................... 28
3.1.1 Culture and passage of established cell lines ...................................................... 28
3.1.2 Freezing and thawing of cells ............................................................................. 28
3.2 PAP-1 derivatives ...................................................................................................... 28
3.3 Cell viability assay ..................................................................................................... 28
3.3.1 Trypan blue ......................................................................................................... 28
3.3.2 MTT assay .......................................................................................................... 29
3.4 Biochemical techniques ............................................................................................. 29
3.4.1 Cell membrane fraction enrichment ................................................................... 29
3.4.2 Mitochondria isolation ........................................................................................ 29
IV
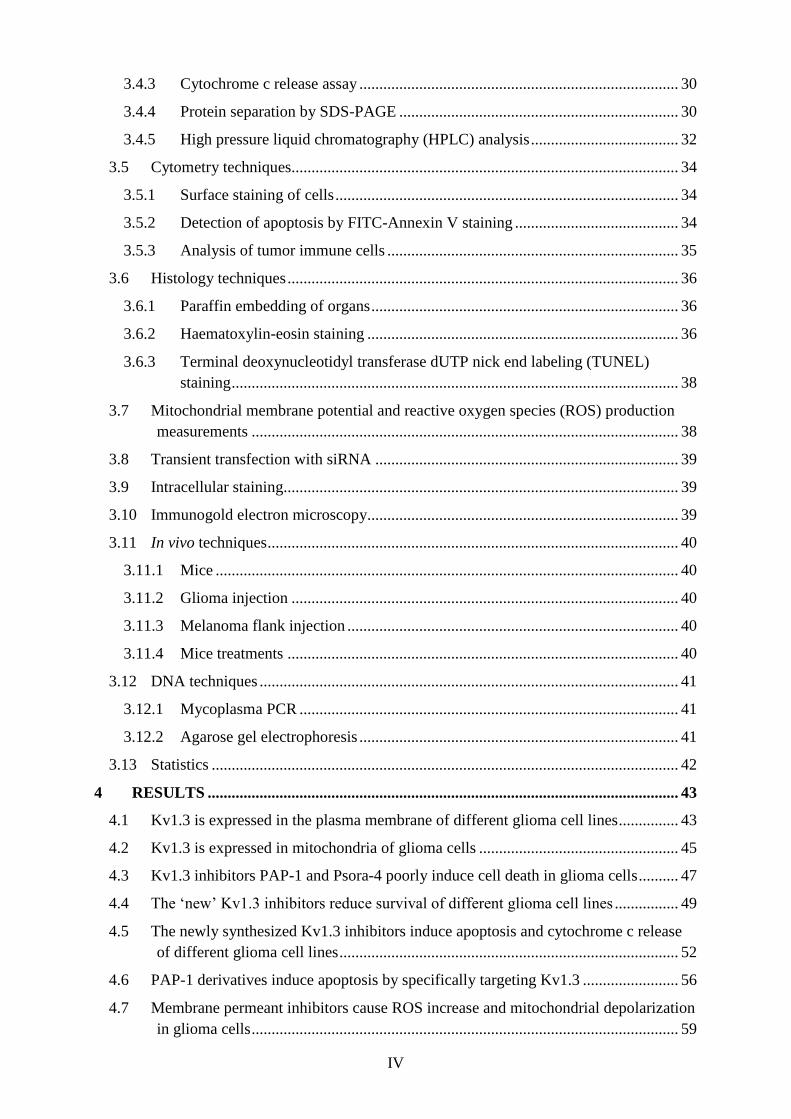
3.4.3 Cytochrome c release assay ................................................................................ 30
3.4.4 Protein separation by SDS-PAGE ...................................................................... 30
3.4.5 High pressure liquid chromatography (HPLC) analysis ..................................... 32
3.5 Cytometry techniques................................................................................................. 34
3.5.1 Surface staining of cells ...................................................................................... 34
3.5.2 Detection of apoptosis by FITC-Annexin V staining ......................................... 34
3.5.3 Analysis of tumor immune cells ......................................................................... 35
3.6 Histology techniques .................................................................................................. 36
3.6.1 Paraffin embedding of organs ............................................................................. 36
3.6.2 Haematoxylin-eosin staining .............................................................................. 36
3.6.3 Terminal deoxynucleotidyl transferase dUTP nick end labeling (TUNEL)
staining ................................................................................................................ 38
3.7 Mitochondrial membrane potential and reactive oxygen species (ROS) production
measurements ........................................................................................................... 38
3.8 Transient transfection with siRNA ............................................................................ 39
3.9 Intracellular staining................................................................................................... 39
3.10 Immunogold electron microscopy.............................................................................. 39
3.11 In vivo techniques ....................................................................................................... 40
3.11.1 Mice .................................................................................................................... 40
3.11.2 Glioma injection ................................................................................................. 40
3.11.3 Melanoma flank injection ................................................................................... 40
3.11.4 Mice treatments .................................................................................................. 40
3.12 DNA techniques ......................................................................................................... 41
3.12.1 Mycoplasma PCR ............................................................................................... 41
3.12.2 Agarose gel electrophoresis ................................................................................ 41
3.13 Statistics ..................................................................................................................... 42
4 RESULTS ...................................................................................................................... 43
4.1 Kv1.3 is expressed in the plasma membrane of different glioma cell lines ............... 43
4.2 Kv1.3 is expressed in mitochondria of glioma cells .................................................. 45
4.3 Kv1.3 inhibitors PAP-1 and Psora-4 poorly induce cell death in glioma cells .......... 47
4.4 The ‘new’ Kv1.3 inhibitors reduce survival of different glioma cell lines ................ 49
4.5 The newly synthesized Kv1.3 inhibitors induce apoptosis and cytochrome c release
of different glioma cell lines ..................................................................................... 52
4.6 PAP-1 derivatives induce apoptosis by specifically targeting Kv1.3 ........................ 56
4.7 Membrane permeant inhibitors cause ROS increase and mitochondrial depolarization
in glioma cells ........................................................................................................... 59
V
4.8 Clofazimine and PAP-1 derivatives do not reduce glioma growth in vivo ................ 62
4.9 In vivo accumulation of clofazimine and PAP-1 derivatives in different organs ...... 64
4.10 PAP-1 derivatives prevent melanoma growth in vivo ................................................ 65
4.11 Kv1.3 inhibitors synergize with chemotherapeutic treatment to reduce melanoma
in vivo ....................................................................................................................... 70
4.12 Antioxidants prevent melanoma reduction induced by PAP-1 derivatives in vivo .... 71
4.13 PAP-1 derivatives do not change the composition of immune cell sub-population
within the tumor ........................................................................................................ 72
5 DISCUSSION ................................................................................................................ 74
5.1 Kv1.3 expression in glioma........................................................................................ 74
5.2 Induction of apoptosis through mtKv1.3 inhibition in different glioma cell lines..... 75
5.3 PAP-1 derivatives are not able to prevent glioma growth in vivo ............................. 78
5.4 PAP-1 derivatives accumulation in organs ................................................................ 79
5.5 PAP-1 derivatives prevent melanoma growth in vivo ................................................ 80
5.6 ROS and synergistic effect with PAP-1 derivatives .................................................. 81
5.7 Lymphotoxicity-free tumor apoptosis induction by PAP-1 derivatives .................... 83
6 SUMMARY ................................................................................................................... 85
REFERENCES
CURRICULUM VITAE
PUBLICATIONS AND CONFERENCES
ACKNOWLEDGEMENTS
VI
LIST OF FIGURES
Figure 1.1 Intrinsic and extrinsic pathways in apoptosis
(adapted from Youle R.J. et al 2008) .................................................................... 5
Figure 1.2. Kv channel structure (D’Amico M et al 2013) ..................................................... 6
Figure 1.3. Psora-4 structure (Schmitz A et al 2005) ............................................................ 10
Figure 1.4. Model for the intrinsic apoptosis induction via mtKv1.3 inhibition
(Leanza L et al 2014b) ........................................................................................ 13
Figure 4.1. Kv1.3 is expressed in the plasma membrane of glioma cells ............................. 44
Figure 4.2. Kv1.3 is expressed in mitochondria of glioma cells ........................................... 46
Figure 4.3. Kv1.3 inhibitors PAP-1 and Psora-4 poorly induce cell
death of glioma cell lines ............................................................................... 48-49
Figure 4.4. EC50 of clofazimine and ‘new’ Kv1.3 inhibitors ............................................... 50
Figure 4.5. The ‘new’ Kv1.3 inhibitors reduce survival of glioma cell lines ........................ 51
Figure 4.6. The ‘new’ Kv1.3 inhibitors induce apoptosis in
different glioma cell lines .............................................................................. 53-55
Figure 4.7. Clofazimine and the ‘new’ Kv1.3 inhibitors induce cytochrome c
release in glioma cells ......................................................................................... 56
Figure 4.8. Clofazimine and PAP-1 derivatives induce apoptosis
by specifically targeting Kv1.3 in glioma cells .............................................. 57-58
Figure 4.9. Clofazimine induces mitochondrial ROS increase and mitochondrial
depolarization in glioma cells ........................................................................ 60-61
Figure 4.10. Clofazimine and PAP-1 derivatives do not reduce glioma growth in vivo ........ 63
Figure 4.11. Clofazimine and PAP-1 derivatives in vivo accumulation
in different organs ............................................................................................... 65
Figure 4.12. PAP-1 derivatives efficiently kill B16F10 cells ................................................. 66
Figure 4.13. Downregulation of Kv1.3 prevents cell death effects induced
by PAP-1 and its derivatives ............................................................................... 66
Figure 4.14. PAP-1 derivatives reduce B16F10 melanoma tumor in vivo ........................ 67-69
Figure 4.15. PAP-1 derivatives synergize with chemoterapeutic drug cisplatin in the
reduction of melanoma growth ........................................................................... 70
Figure 4.16. Anti-oxidant N-acetylcysteine prevented the cell death effects of PAP-1
derivatives on melanoma tumor growth in vivo ................................................. 71
Figure 4.17. PAP-1 derivatives treatment does not alter the immune cell sub-populations
within the tumor .................................................................................................. 73
VII
ABBREVIATIONS
A
Ampere
AIF
Apoptosis inducing factor
Apaf-1
Apoptosis protease activating factor 1
BBB
Blood brain barrier
Bcl-2 B-cell lymphoma 2 protein
BH3
Bcl-2 Homology domain 3
CD95
Cluster of differentiation 95
CNS
Central nervous system
dATP Deoxyadenosine triphosphate
DD Death domain
DED
Death effector domain
DISC
Death-inducing signaling complex
DKO
Double knockout
DRs
Death receptors
EtOH Ethanol
FADD Fas-associated death domain
IAP
Inhibitors of apoptosis proteins
IMM Inner mitochondrial membrane
IMS
Inter-membrane space
i.p. Intraperitoneally
IR
Irradiation
kb
Kilobase
kDa Kilodalton
µg
Microgram
µl Microliter
VIII
ml Milliliter
MPTP
Mitochondrial permeability transition pore
NAC
N-acetylcysteine
nm
Nanometre
OMM Outer mitochondrial membrane
O/N
Over-night
PM
Plasma membrane
p.o.
Per oral
ROS
Reactive oxygen species
sec
Second(s)
siRNA
Small interfering RNA
Smac/DIABLO Second mitochondria-derived activator of
caspases/direct inhibitor of apoptosis protein
IAP-binding protein with low PI
t-Bid
C-terminal truncated Bid
TNF Tumor necrosis factor
TRAIL TNF-related apoptosis inducing factor
UV
Ultraviolet
V Volt
VDAC
Voltage dependent anion channel
W Watt
w/o Without

INTRODUCTION
1
1. INTRODUCTION
1.1 Apoptosis
Apoptosis, also called ‘programmed cell death’, is a highly evolutionally conserved
mechanism aimed to remove excess-cells from an organism. It plays an important role in
physiological processes such as development, during organogenesis, and in adult tissues
homoeostasis, controlling cell proliferation, lymphocytes selection within the immune system
and elimination of old, differentiated cells with self-renewal capacity. Dysregulation of
apoptosis has been implicated in various human diseases, including cancer, autoimmunity and
neurodegenerative disorders (Thompson C.B. 1995).
Apoptosis is characterized by a series of morphological changes, which include plasma
membrane blebbing, cell shrinkage, nuclear fragmentation, chromatin condensation and
chromosomal DNA fragmentation, eventually leading to vesicles (‘apoptotic bodies’)
formation and their rapid phagocytosis (Kerr J.F. et al 1972). Apoptosis can be triggered by
two main pathways: the extrinsic or ‘death receptor-mediated’ pathway and the intrinsic or
‘mitochondrial’ pathway (Hengartner M.O. 2000) (Figure 1.1).
1.1.1 The extrinsic or ‘death receptor-mediated’ pathway
The extrinsic or ‘death receptor-mediated’ pathway is activated by the binding of
characteristic molecules, such as the Fas-ligand (or CD95L), TRAIL and TNF-α, to the
surface receptors of the plasma membrane, called ‘death receptors’ or DRs, which mainly
include members of the TNF receptor protein superfamily (e.g. CD95 or Fas/Apo1, TRAIL-
R1 and TNF-R1) (Ashkenazi A. et al 1998). DRs contain an intracellular death domain (DD)
which is able, after oligomerization with other DDs, to recruit adaptor molecules such as
FADD. Adaptor molecules, in turn, recruit procaspase-8 through their death effector domain
(DED) to form the DISC complex, where oligomerization and auto-proteolytic cleavage of
caspase-8 occur, eventually leading to activation of downstream effector caspases, such as
caspase-3 and 7 (Walczak H. et al 2000). Caspase-8 can also indirectly trigger the intrinsic
pathway of apoptosis by cutting the BH3-only protein Bid at the C-terminal level (Li H. et al
1998). Truncated Bid (t-Bid) is then transferred to mitochondria, where it initiates the outer
mitochondrial membrane (OMM) permeabilization through interaction with other Bcl-2
proteins (see below).
INTRODUCTION
2
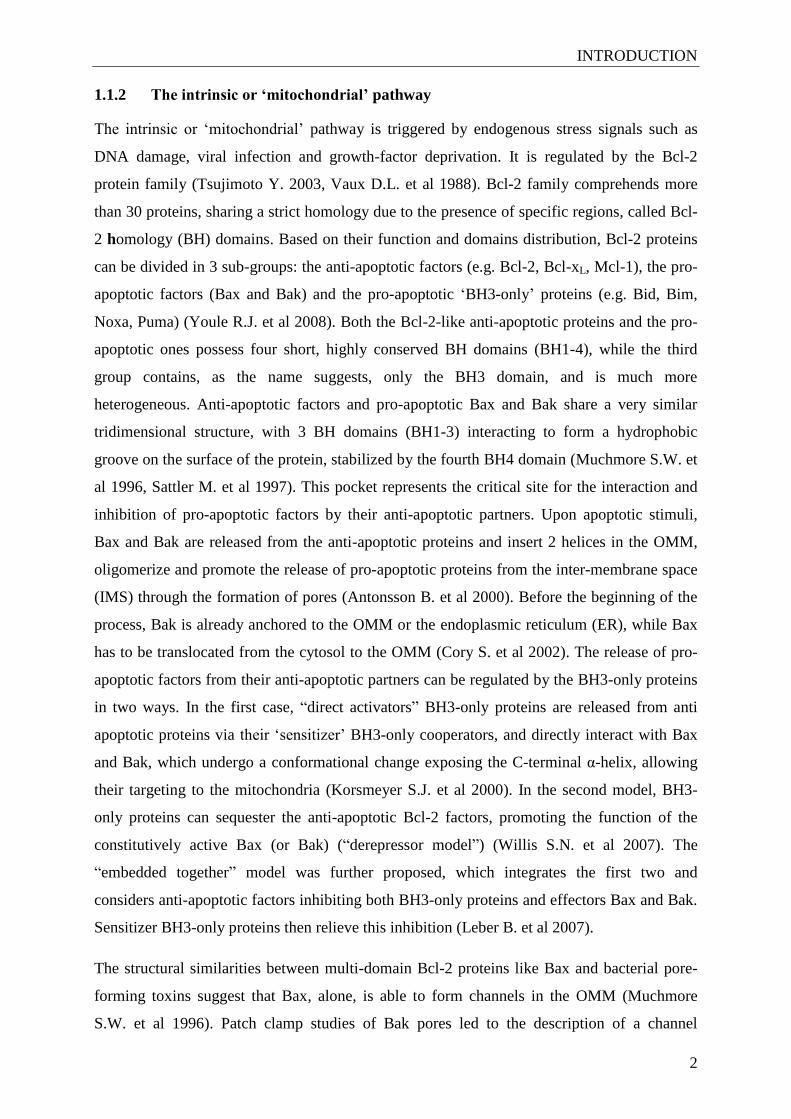
1.1.2 The intrinsic or ‘mitochondrial’ pathway
The intrinsic or ‘mitochondrial’ pathway is triggered by endogenous stress signals such as
DNA damage, viral infection and growth-factor deprivation. It is regulated by the Bcl-2
protein family (Tsujimoto Y. 2003, Vaux D.L. et al 1988). Bcl-2 family comprehends more
than 30 proteins, sharing a strict homology due to the presence of specific regions, called Bcl-
2 homology (BH) domains. Based on their function and domains distribution, Bcl-2 proteins
can be divided in 3 sub-groups: the anti-apoptotic factors (e.g. Bcl-2, Bcl-xL, Mcl-1), the pro-
apoptotic factors (Bax and Bak) and the pro-apoptotic ‘BH3-only’ proteins (e.g. Bid, Bim,
Noxa, Puma) (Youle R.J. et al 2008). Both the Bcl-2-like anti-apoptotic proteins and the pro-
apoptotic ones possess four short, highly conserved BH domains (BH1-4), while the third
group contains, as the name suggests, only the BH3 domain, and is much more
heterogeneous. Anti-apoptotic factors and pro-apoptotic Bax and Bak share a very similar
tridimensional structure, with 3 BH domains (BH1-3) interacting to form a hydrophobic
groove on the surface of the protein, stabilized by the fourth BH4 domain (Muchmore S.W. et
al 1996, Sattler M. et al 1997). This pocket represents the critical site for the interaction and
inhibition of pro-apoptotic factors by their anti-apoptotic partners. Upon apoptotic stimuli,
Bax and Bak are released from the anti-apoptotic proteins and insert 2 helices in the OMM,
oligomerize and promote the release of pro-apoptotic proteins from the inter-membrane space
(IMS) through the formation of pores (Antonsson B. et al 2000). Before the beginning of the
process, Bak is already anchored to the OMM or the endoplasmic reticulum (ER), while Bax
has to be translocated from the cytosol to the OMM (Cory S. et al 2002). The release of pro-
apoptotic factors from their anti-apoptotic partners can be regulated by the BH3-only proteins
in two ways. In the first case, “direct activators” BH3-only proteins are released from anti
apoptotic proteins via their ‘sensitizer’ BH3-only cooperators, and directly interact with Bax
and Bak, which undergo a conformational change exposing the C-terminal α-helix, allowing
their targeting to the mitochondria (Korsmeyer S.J. et al 2000). In the second model, BH3-
only proteins can sequester the anti-apoptotic Bcl-2 factors, promoting the function of the
constitutively active Bax (or Bak) (“derepressor model”) (Willis S.N. et al 2007). The
“embedded together” model was further proposed, which integrates the first two and
considers anti-apoptotic factors inhibiting both BH3-only proteins and effectors Bax and Bak.
Sensitizer BH3-only proteins then relieve this inhibition (Leber B. et al 2007).
The structural similarities between multi-domain Bcl-2 proteins like Bax and bacterial pore-
forming toxins suggest that Bax, alone, is able to form channels in the OMM (Muchmore
S.W. et al 1996). Patch clamp studies of Bak pores led to the description of a channel
INTRODUCTION
3
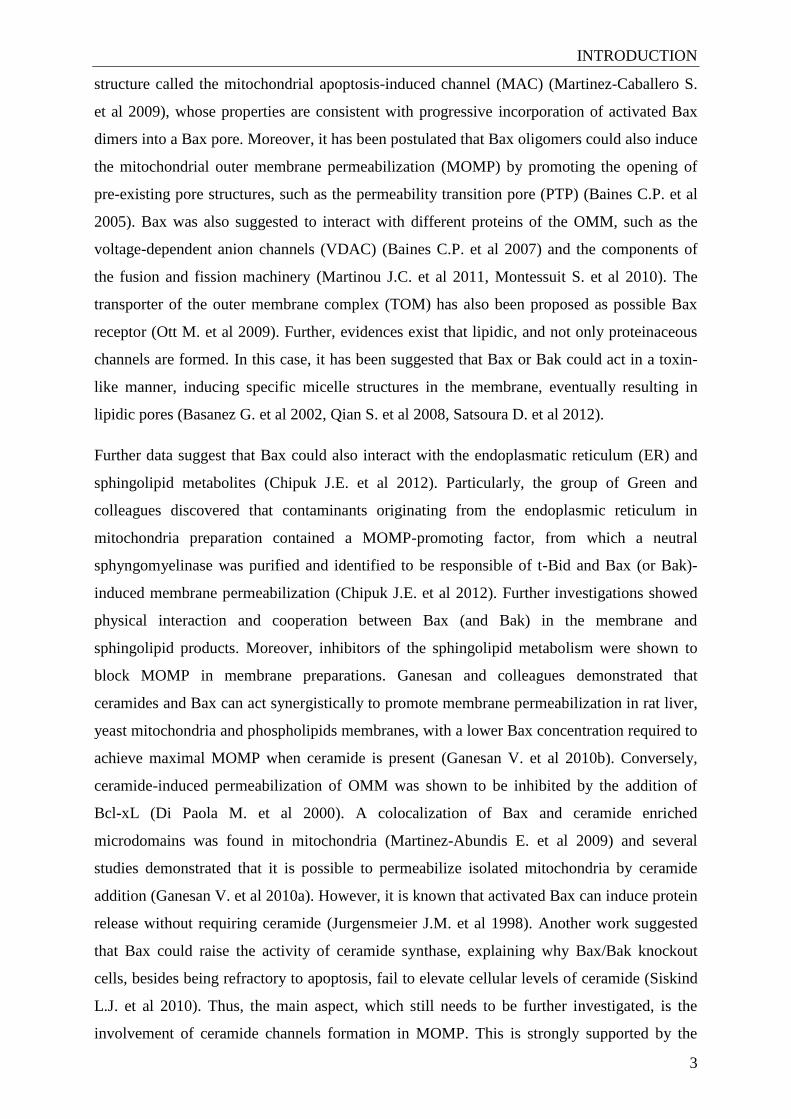
structure called the mitochondrial apoptosis-induced channel (MAC) (Martinez-Caballero S.
et al 2009), whose properties are consistent with progressive incorporation of activated Bax
dimers into a Bax pore. Moreover, it has been postulated that Bax oligomers could also induce
the mitochondrial outer membrane permeabilization (MOMP) by promoting the opening of
pre-existing pore structures, such as the permeability transition pore (PTP) (Baines C.P. et al
2005). Bax was also suggested to interact with different proteins of the OMM, such as the
voltage-dependent anion channels (VDAC) (Baines C.P. et al 2007) and the components of
the fusion and fission machinery (Martinou J.C. et al 2011, Montessuit S. et al 2010). The
transporter of the outer membrane complex (TOM) has also been proposed as possible Bax
receptor (Ott M. et al 2009). Further, evidences exist that lipidic, and not only proteinaceous
channels are formed. In this case, it has been suggested that Bax or Bak could act in a toxin-
like manner, inducing specific micelle structures in the membrane, eventually resulting in
lipidic pores (Basanez G. et al 2002, Qian S. et al 2008, Satsoura D. et al 2012).
Further data suggest that Bax could also interact with the endoplasmatic reticulum (ER) and
sphingolipid metabolites (Chipuk J.E. et al 2012). Particularly, the group of Green and
colleagues discovered that contaminants originating from the endoplasmic reticulum in
mitochondria preparation contained a MOMP-promoting factor, from which a neutral
sphyngomyelinase was purified and identified to be responsible of t-Bid and Bax (or Bak)-
induced membrane permeabilization (Chipuk J.E. et al 2012). Further investigations showed
physical interaction and cooperation between Bax (and Bak) in the membrane and
sphingolipid products. Moreover, inhibitors of the sphingolipid metabolism were shown to
block MOMP in membrane preparations. Ganesan and colleagues demonstrated that
ceramides and Bax can act synergistically to promote membrane permeabilization in rat liver,
yeast mitochondria and phospholipids membranes, with a lower Bax concentration required to
achieve maximal MOMP when ceramide is present (Ganesan V. et al 2010b). Conversely,
ceramide-induced permeabilization of OMM was shown to be inhibited by the addition of
Bcl-xL (Di Paola M. et al 2000). A colocalization of Bax and ceramide enriched
microdomains was found in mitochondria (Martinez-Abundis E. et al 2009) and several
studies demonstrated that it is possible to permeabilize isolated mitochondria by ceramide
addition (Ganesan V. et al 2010a). However, it is known that activated Bax can induce protein
release without requiring ceramide (Jurgensmeier J.M. et al 1998). Another work suggested
that Bax could raise the activity of ceramide synthase, explaining why Bax/Bak knockout
cells, besides being refractory to apoptosis, fail to elevate cellular levels of ceramide (Siskind
L.J. et al 2010). Thus, the main aspect, which still needs to be further investigated, is the
involvement of ceramide channels formation in MOMP. This is strongly supported by the

INTRODUCTION
4
regulation of these channels by the Bcl-2 family proteins, which could act on their stability
influencing the dynamic equilibrium between different ceramide forms (Ganesan V. et al
2010a, Ganesan V. et al 2010b).
The role of cardiolipin, a mitochondrial membranes specific lipid, was also pointed out in
pores formation, since different studies found its requirement in t-Bid/Bax-induced liposomes
permeabilization (Kuwana T. et al 2002, Terrones O. et al 2004). However, as for ceramide, it
is still under debate whether or not cardiolipin is required for MOMP in vivo, since its
concentration in the OMM is low, being primarily found in the IMM. It could be that
cardiolipin becomes enriched in OMM-IMM contact sites (Lutter M. et al 2001). Another
possibility is that OMM proteins, such as the TOM complex or the fusion-fission machinery
proteins, could substitute the lipid in this role (Ott M. et al 2009).
MOMP culminates in the release of soluble proteins, such as cytochrome c and Smac, from
the IMS to the cytosol (Liu X. et al 1996). Cytochrome c forms the apoptosome cytosolic
complex together with Apaf-1 and the pro-caspase 9 in presence of dATP. The activity of
caspase-9 (but also of others caspases) is normally suppressed by the inhibitors of apoptosis
(IAP) proteins such as XIAP and survivin, which are in turn inhibited by Smac/DIABLO
(Fulda S. et al 2012). Activated caspase-9 is then released from the IAPs, proteolyses caspase-
3 and 7, triggering the executive pathway of apoptosis as in the extrinsic pathway. As
mentioned above, caspase-3 can be also directly activated by caspase-8, consequently to the
translocation of tBid to mitochondria, thus determining the cross talk between the intrinsic
and extrinsic pathways. Beyond apoptosome formation promoting factors, mitochondria also
release intermembrane proteins, such as AIF and endonuclease G which, upon translocation to
the nucleus, can directly cause large-scale DNA fragmentation and chromatin condensation,
independently of caspases (Li L.Y. et al 2001, Susin S.A. et al 1999).
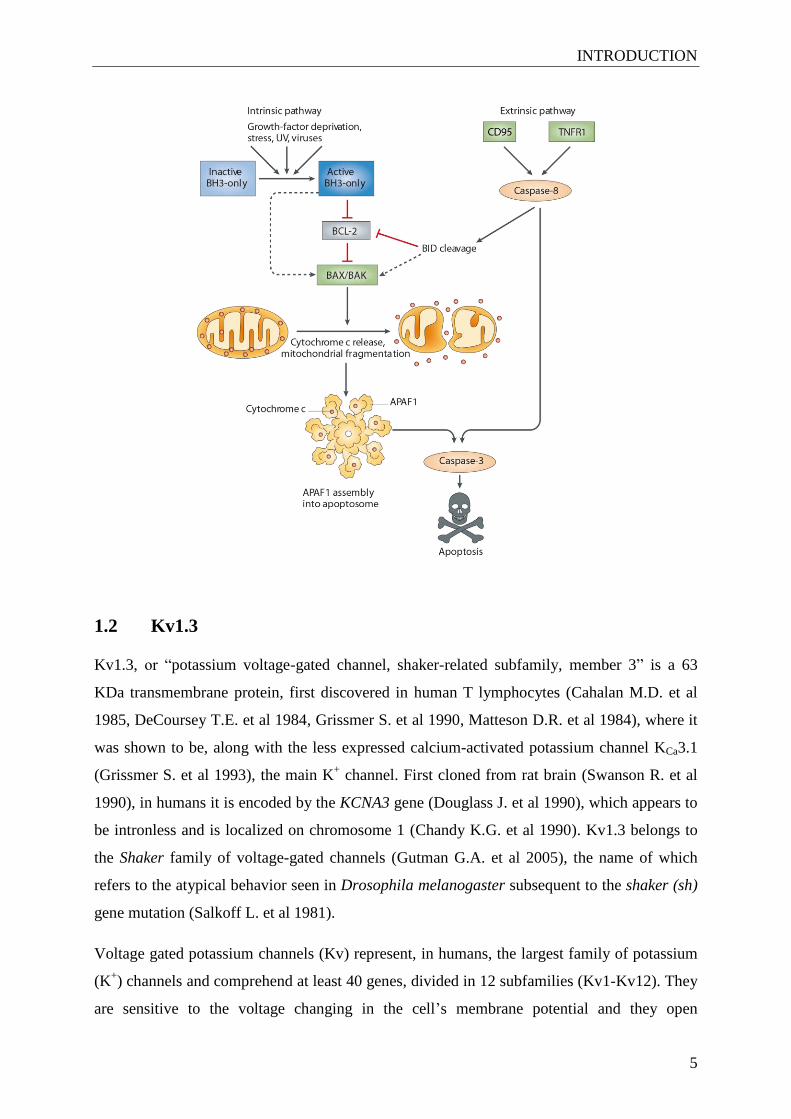
Figure 1.1. Intrinsic and extrinsic pathways in apoptosis. The instrinsic apoptotic pathway can be initiated by
exposure to stress signals such as growth factor deprivation, radiation or viruses, which in turn activate the BH3-
only proteins. Activated BH3-only proteins can trigger the release of pro-apoptotic proteins Bax and Bak by
direct interaction with them or by releasing them from their anti-apoptotic partners (e.g.: Bcl-2). Released Bax
and Bak insert 2 helices in the outer mitochondrial membrane (OMM), where they oligomerize and promote the
release of pro-apoptotic proteins, such as cytochrome c, and mitochondrial fragmentation. This leads to the
activation of APAF-1 into the apoptosome complex, which in turn activates caspase 9. Activated caspase 3 by
caspase 9 cleaves other substrates, activates DNases and triggers apoptosis. The extrinsic pathway is initiated by
the binding of specific molecules to the death receptors of the TNF superfamily (e.g. TNFR1, CD95). This leads
to activation of caspase-8, which triggers activation of effector caspases, such as caspase-3. Activated caspase-8
can also indirectly initiate the intrinsic apoptotic pathway by cleaving the BH3-only protein Bid, which is
translocated to the mitochondria and triggers the OMM permeabilization by inhibiting the anti-apoptotic proteins
or by activating the pro-apoptotic ones (adapted from (Youle R.J. et al 2008)).
INTRODUCTION
5
1.2 Kv1.3
Kv1.3, or “potassium voltage-gated channel, shaker-related subfamily, member 3” is a 63
KDa transmembrane protein, first discovered in human T lymphocytes (Cahalan M.D. et al
1985, DeCoursey T.E. et al 1984, Grissmer S. et al 1990, Matteson D.R. et al 1984), where it
was shown to be, along with the less expressed calcium-activated potassium channel KCa3.1
(Grissmer S. et al 1993), the main K+ channel. First cloned from rat brain (Swanson R. et al
1990), in humans it is encoded by the KCNA3 gene (Douglass J. et al 1990), which appears to
be intronless and is localized on chromosome 1 (Chandy K.G. et al 1990). Kv1.3 belongs to
the Shaker family of voltage-gated channels (Gutman G.A. et al 2005), the name of which
refers to the atypical behavior seen in Drosophila melanogaster subsequent to the shaker (sh)
gene mutation (Salkoff L. et al 1981).
Voltage gated potassium channels (Kv) represent, in humans, the largest family of potassium
(K+) channels and comprehend at least 40 genes, divided in 12 subfamilies (Kv1-Kv12). They
are sensitive to the voltage changing in the cell’s membrane potential and they open
INTRODUCTION
6
consequently to a membrane depolarization: K+ ions flow out following their electrochemical
gradient ([K+] in >> [K
+] out), eventually leading to a hyperpolarization of the membrane. Kv
channels share, as all K+ channels, a homo- or hetero-tetrameric structure, constituted by 4
subunits (α), each characterized by 6 transmembrane helices (S1–S6) with both the N-
terminus and C-terminus located in the intracellular side of the membrane (Bright J.N. et al
2002) (Figure 1.2). The channel voltage sensor is formed by the first 4 helices (with the S4
helix containing four positively charged arginine residues acting as voltage-sensor domain)
(Long S.B. et al 2007), while the pore region is given by the last two helices (S5-S6), together
with a distinctive P-loop structure formed by 5 conserved amino acidic residues (GYGD), and
representing the selectivity filter for K+ (Treptow W. et al 2004, Tytgat J. 1994). In particular,
the accessibility of K+ to the filter is given by the four electronegative carbonyl oxygen atoms,
exposed by the four residues, which mimic the ion hydration sphere, allowing K+ to overcome
the membrane lypophilicity barrier (Aiyar J. et al 1996). Current properties of Kv channels
differ based on additional regulatory subunits (e.g. β, γ and δ) associating around the ion
conducting central pore. Further, post-translational modifications and alternative splicing also
contribute to the functional diversity of Kv channels (Gutman G.A. et al 2005).
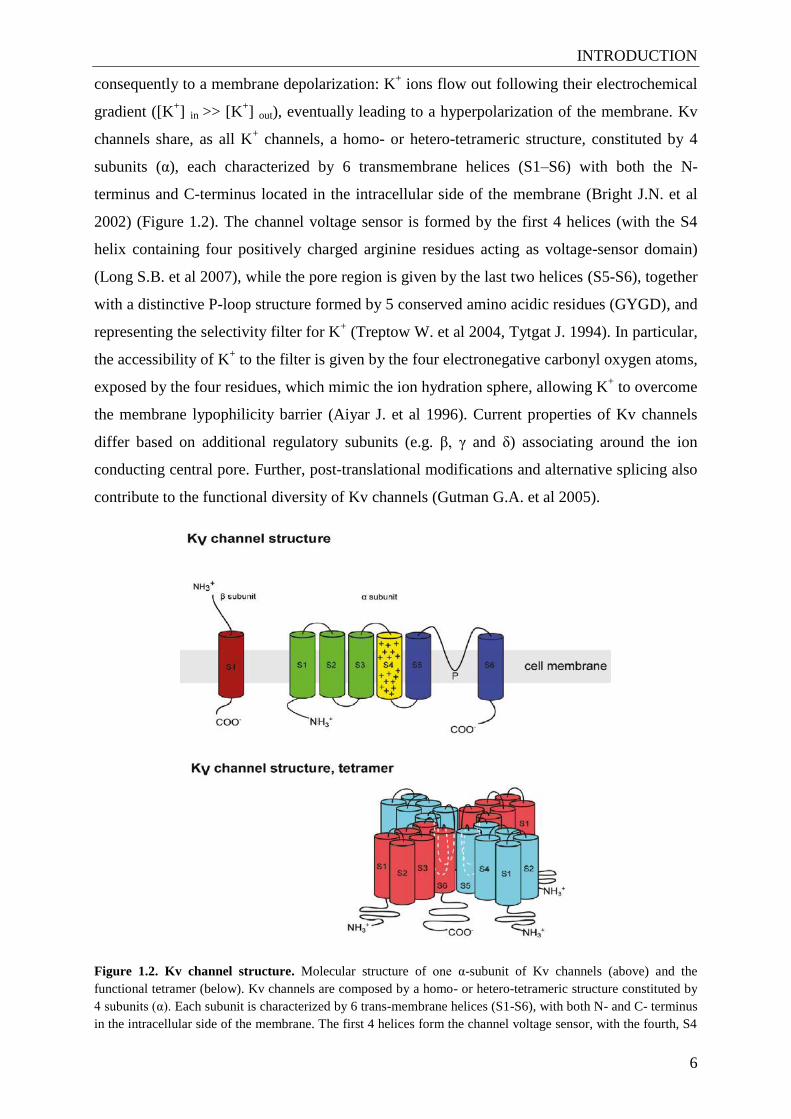
Figure 1.2. Kv channel structure. Molecular structure of one α-subunit of Kv channels (above) and the
functional tetramer (below). Kv channels are composed by a homo- or hetero-tetrameric structure constituted by
4 subunits (α). Each subunit is characterized by 6 trans-membrane helices (S1-S6), with both N- and C- terminus
in the intracellular side of the membrane. The first 4 helices form the channel voltage sensor, with the fourth, S4
INTRODUCTION
7
helix containing four positively charged arginine residues, thus acting as voltage-sensor domain. The last two
(S5-S6) helices constitute the pore region, containing a distinctive P-loop structure formed by 5 conserved
aminoacids, which represent the selectivity filter for K+. Additional regulatory subunits (e.g. β) can associate
around the ion conducting pore, thus differently contributing to channel current properties (D'Amico M. et al
2013).
Kv1.x channels (or mammalian Shaker family), to which Kv1.3 belongs, are largely
expressed and control the frequency of action potential in the central nervous system (CNS),
where most of the eight known pore forming subunits (Kv1.1-Kv1.8) have been shown to
form heteromultimers, containing at least one Kv1.1 and/or Kv1.2 subunit (Coleman S.K. et
al 1999). Moreover, Shaker family is also present in different peripheral tissues, included
heart, vessels and immune system. Particularly, Kv1.5 plays a critical role in the atrial action
potential repolarization (Wettwer E. et al 2004).
Beyond T lymphocytes, Kv1.3 has been demonstrated to be present in the plasma membrane
(PM) of several tissues and cells types (Gutman G.A. et al 2005) including brain, lung,
tonsils, islets, lymph node, thymus, testis, liver, spleen, kidney, skeletal muscle, epithelia
(Grunnet M. et al 2003), fibroblasts, platelets (Maruyama Y. 1987), CNS (Mourre C. et al
1999), hippocampal neurons (Bednarczyk P. et al 2010), astrocytes (Cheng Y. et al 2010),
oligodendrocytes (Chittajallu R. et al 2002), osteoclasts (Arkett S.A. et al 1994), brown and
white fat (Xu J. et al 2003), macrophages (Mackenzie A.B. et al 2003, Vicente R. et al 2003)
and B lymphocytes (Gutman G.A. et al 2003, Szabo I. et al 2005).
Together with the other members of the Kv family, Kv1.3 controls the resting plasma
membrane potential, the frequency of action potentials and the neurotransmitter release from
excitable cells (Shoudai K. et al 2007). Moreover, it regulates cell volume (Lang F. et al
2004), proliferation (Cahalan M.D. et al 2009) and apoptosis (Szabo I. et al 2010) in non-
excitable tissues (Armstrong C.M. 2003, MacKinnon R. 2003).
Kv1.3 has been demonstrated to play a crucial role in T cells activation by the use of several
non-selective K+ blockers, like 4-aminopyridine (4-AP) (Chandy K.G. et al 1984, DeCoursey
T.E. et al 1984). Particularly, Kv1.3 expression is increased to 4- to 5-fold in activated
CD4+/CD8
+ effector-memory cells (TEM) cells (Wulff H. et al 2003). In contrast, naïve T cells
and central memory T cells (TCM) upregulate KCa3.1 upon activation (Grissmer S. et al 1993).
After T-cell receptor activation by antigen, K+ efflux through Kv1.3 (or KCa3.1) channel
hyperpolarizes the PM potential, promoting Ca2+
entry through the calcium-release activated
channel (CRAC). Rise in cytosolic Ca2+
concentration induces the translocation of the nuclear
factor of activated T cells (NFAT) to the nucleus, where it initiates transcription, eventually
INTRODUCTION
8
leading to cytokine secretion and T cell proliferation. If K+ efflux through Kv1.3 (and KCa3.1)
is interrupted, cells depolarize, reducing Ca2+
influx, which prevents T cell activation.
Therefore, Kv1.3 channel has been proposed as a novel mean for therapeutic
immunosuppression to treat autoimmune disorders in which TEM cells are involved (Chandy
K.G. et al 2004), such as multiple sclerosis (MS), rheumatoid arthritis (RA), type-1 diabetes
(Beeton C. et al 2006) and psoriasis (Azam P. et al 2007, Gilhar A. et al 2011). Selective
blockers have been successfully used in the treatment of autoimmune encephalomyelitis
(EAE), a model for multiple sclerosis (Beeton C. et al 2001). Moreover, the lipophilic small
molecule Kv1.3 inhibitor PAP-1 has been shown to successfully suppress delayed-type
hypersensitivity (DTH) by preventing TEM activation and migration to inflamed tissue
(Matheu M.P. et al 2008). This compound has also been efficient in preventing spontaneous
autoimmune type-1 diabetes in rats, by decreasing intra-islet T cells and macrophage
infiltration (Beeton C. et al 2006), in the treatment of contact dermatitis, a simple animal
model for psoriasis (Azam P. et al 2007), and in a SCID mouse psoriasis-xenograft model
(Kundu-Raychaudhuri S. et al 2014). Recently, PAP-1 has also been demonstrated to suppress
the development of atherosclerosis by inhibiting exocytosis of cytoplasmic granules from
CD4+/CD28
null T lymphocytes in a rat model (Wu X. et al 2015). Moreover, in a xenograft
model, blockage of Kv1.3 by clofazimine was shown to inhibit human T-cell mediated skin
graft rejection (Ren Y.R. et al 2008). Kv1.3 also participates in the formation of the
immunological synapse during antigen presentation, since it appears to be physically coupled
to the T-cell receptor signaling complex (Panyi G. et al 2004). However, its blockade does not
prevent the synapse formation (Beeton C. et al 2006).
During apoptosis induced by CD95/Fas and ceramide, Kv1.3 is tyrosine phosphorylated and
functionally inhibited in T lymphocytes (Gulbins E. et al 1997, Szabo I. et al 1996).
Particularly, to study the involvement of Kv1.3 in apoptosis, IL-2 dependent murine cytotoxic
T lymphocytes (CTLL-2), known to be deficient for Kv1.3, were used (Deutsch C. et al
1993). Stably transfected CTLL-2 with Kv1.3 (CTLL-2/Kv1.3) were shown to be susceptible
to apoptosis induced by various stimuli including ceramide, staurosporine, actinomycin D,
sphingomyelinase and TNF-α, whereas control-transfected CTLL-2 (CTLL-2/pJK) were
resistant to the same agents (Bock J. et al 2002). Importantly, these findings were also
confirmed in genetically non-manipulated Kv1.3-expressing cells, including Jurkat
lymphocytes and activated peripheral blood lymphocytes, where siRNA-mediated
downregulation of the channel hindered cell death (Szabo I. et al 2008). Kv1.3-deficient mice
generated by the group of Desir (Xu J. et al 2003) display an increase in platelets number, in
INTRODUCTION
9
accordance with a role of Kv1.3 in apoptosis of platelets or their precursors (McCloskey C. et
al 2010). However, these mice, despite the crucial role of Kv1.3 in lymphocyte activation,
show no alterations of the immune system and no defects in either lymphocytes proliferation
or apoptosis (Koni P.A. et al 2003). Instead, the complete loss of Kv1.3 current in the
thymocytes of these mice was found together with an upregulation of Kv1 genes and a
chloride channel, thus suggesting a possible compensatory mechanism.
Based on experiments with Kv1.3 knockout mice, Kv1.3 has also been suggested to be
involved in the regulation of energy homeostasis and body weight, but the underlying
mechanism is still poorly understood (Xu J. et al 2003). Particularly, Kv1.3 blockade seems to
improve insulin sensitivity in adipose and skeletal muscle by facilitating the translocation of
the glucose transporter GLUT4 to the PM. The same group demonstrated that deletion of
Kv1.3 can reduce adiposity and increase lifespan in a genetic model of obesity (Xu J.C. et al
2004).
1.2.1 Kv1.3 inhibitors
Because of its role in T cell activation, Kv1.3 has a well-characterized pharmacology. After
the discovery that the scorpion venom derived peptide charybdotoxin (ChTx) (Sands S.B. et al
1989) was able to inhibit Kv channels (but also KCa3.1 channels) at nanomolar concentrations,
more selective toxins were isolated, such as margatoxin (MgTx) (Garcia-Calvo M. et al 1993,
Koo G.C. et al 1997) and the sea anemone toxin Stichodactyla (ShK) (Pennington M.W. et al
1996), which represents the most potent inhibitor of Kv1.3, blocking the channel at high
affinity (Kd = 11 pM) and showing a 1000-fold higher selectivity with respect to other Kv and
KCa channels (Kalman K. et al 1998, Rauer H. et al 1999). All these peptides, usually
containing 18-60 amino acids (3-6 KDa), present a strategic positive amino acid, a lysine,
which interacts with the overall negative charge imparted by a set of acidic amino acids
specifically present in the vestibule of Kv channels, occluding the channel pore like a ‘cork a
bottle’ (Chandy K.G. et al 2001, Yu K. et al 2004). The substitution of the critical lysine with
neutral residues has shown to reduce the affinity of the toxin for the channel, indicating that
other residues do not bind efficiently to the channel pore vestibule (Lanigan M.D. et al 2002).
Other toxins also exist, which approach the channel via the membrane lipid bilayer and
interact with the voltage sensor (Swartz K.J. et al 1997, Swartz K.J. 2007).
Besides peptide toxins, small organic molecules were also discovered (200-500 Da), which
act by binding the inner pore or interfacing between Kv1.3 subunits. Differently from peptide
inhibitors, they can permeate biomembranes, thus reaching and inhibiting the mitochondrial

INTRODUCTION
10
Kv1.3. Among them, the most potent is Psora-4, a 5-phenylalkoxypsoralen (5-MOP) derived
from the Ruta graveolens plant, which blocks the channel with EC50=3 nM and a 17-70 fold
selectivity for Kv1.3 over Kv1 channel family, with the exception of Kv1.5 (Vennekamp J. et
al 2004) (Figure 1.3). Therefore, a more selective compound was synthesized, PAP-1 (EC50=2
nM) (Schmitz A. et al 2005). However, patch clamp experiments showed that both inhibitors
can act also on other Kv channels, if used at higher concentrations. Recently, the already
known anti-mycobacterial drug clofazimine was found to inhibit Kv1.3 with EC50= 400 nM
(Ren Y.R. et al 2008). This highly lipophilic drug, belonging to the riminophenazine family,
has been used since 1960, marketed as Lamprene, to treat various dermatological diseases
included leprosy (Karat A.B. et al 1970), pustular psoriasis (Chuaprapaisilp T. et al 1978) and
lupus erythematosus (Mackey J.P. et al 1974).
Figure 1.3. Psora-4 structure, derivative of the major K+ channel blocking compound from plant R. Graveolens,
5-metoxypsoralen (5-MOP), and EC50 values relative to Kv1.3 and Kv1.5 channels (Schmitz A. et al 2005).
1.2.2 Kv1.3 ‘new inhibitors’: PAP-1 derivatives
Despite the promising results obtained in vitro, in vivo and ex vivo (Leanza L. et al 2012,
Leanza L. et al 2013), PAP-1 and Psora-4 are two poorly water soluble and highly
hydrophobic drugs. Their molecular characteristics limit their use in humans, since only
relatively high concentrations have to be used to obtain effects. On the other hand,
clofazimine, even if highly lipophilic, has shown to have a very good safety profile and was
already administered orally to patients with leprosy and antibiotic resistant tuberculosis
(Dooley K.E. et al 2013). Furthermore, all these compounds are dissolved in DMSO, which is
an organosulfur and toxic compound. In collaboration with the group of Prof. C. Paradisi of
the Department of Chemical Sciences, University of Padua (Italy), PAP-1 derivatives have
been synthetized both to improve the water solubility and to target an inhibitor to the
mitochondria. Importantly, all chemical modifications should lead the derivatives still to

INTRODUCTION
11
inhibit Kv1.3. All these improvements will favor their orally bio availability. The ability of
the compounds to reach mitochondria was augmented. PAP-1 and Psora-4 have a high log P
(P, partition coefficient), which reflects the tendency of a compound to accumulate in
biological membranes and serum. This increases the concentration required to reach the
correct target in the cell and induce cell death. Thus, a positive phosphonium group was added
to the precursors, allowing the accumulation of the derivatives in mitochondria driven by the
membrane potential, without a specific mechanism of uptake. In particular, since lipophilic
cations easily move throughout phospholipid bilayers – because the activation energy required
for the movement from a biological membrane is far lower than that needed from other
cations – a TPP (tetraphenylphosphonium) group was added, whose highly lipophilic
positivity permits the crossing of the membranes, including the highly negative mitochondrial
one (Sassi N. et al 2012). In this case, two groups have been developed: a first one, in which
the TPP is covalently bound to the PAP-1 molecule, and a second one, in which TPP is linked
to the PAP-1 by a carbamate group that can be hydrolyzed, intracellularly releasing the free
PAP-1. Furthermore, the derivatives have been modified to become more water soluble. This
was achieved by adding to the PAP-1 four to six PEG (polyethylene glycol) functional
groups, which are known to improve solubility.
1.2.3 Mitochondrial Kv1.3 and apoptosis
Kv1.3 was the first functionally active Kv channel to be identified in the inner mitochondrial
membrane (IMM) (Szabo I. et al 2005). Mitochondrial Kv1.3 (mtKv1.3) was initially
characterized in freshly isolated peripheral human blood lymphocytes by using transmission
electron microscopy and western blot. Functional expression was shown by patch clamp on
mitoplasts from Jurkat T lymphocytes (Szabo I. et al 2005), known to endogenously express
Kv1.3 (Cahalan M.D. et al 1985). Channel identity was also determined by using the genetic
model of CTLL-2 cells transfected with Kv1.3, where colocalization with PTP and the 107-pS
channel in the IMM was found. Differently from the PM located one, mtKv1.3 seem to be
active also at very negative voltages (resting potential) of mitochondria, thus contributing to
the basal K+ conductance in mitochondria (Bernardi P. 1999). The presence of the channel
was further shown in mitochondria of macrophages (Vicente R. et al 2006) and hippocampal
(Bednarczyk P. et al 2010) and presynaptic neurons (Gazula V.R. et al 2010).
Although mtKv1.3 is expected, similarly to other IMM K+
channels, to regulate mitochondrial
membrane potential, volume and ROS production, the role of this channel in physiological
conditions has not been yet clarified. However, a crucial role for mtKv1.3 in apoptosis has
INTRODUCTION
12
become evident, first in lymphocytes, and then in other systems as well (Szabo I. et al 2008).
Particularly, it was shown in the CTLL-2 model (see above) that expression of a
mitochondria-targeted Kv1.3 construct was able to sensitize apoptosis-resistant CTLL-2 T
lymphocytes, lacking Kv channels, to different apoptotic stimuli (Szabo I. et al 2008). The
specificity of mtKv1.3 involvement was also shown by the use of membrane-permeable
Kv1.3 inhibitors Psora-4, PAP-1 and clofazimine, which induced cell death in Kv1.3-
expressing cells, while membrane-impermeable blockers, such as MgTx, did not.
Among apoptotic stimuli able to induce mtKv1.3-mediated apoptosis, also Bax was found.
Structural analysis revealed that, after incorporation in the OMM, only two amino-acids of the
protein, 127 and the lysine 128, protrude in the IMS facing the IMM (Annis M.G. et al 2005).
The fact that the lysine seem to be highly conserved among all pro-apoptotic members and
excluded in the anti-apoptotic ones of the same family (Szabo I. et al 2011) led to the
hypothesis that Bax (and Bak) induce apoptosis in a toxin-like manner. Studies on isolated
Kv1.3-positive mitochondria incubated with recombinant Bax, t-Bid or Kv1.3-targeting toxins
showed the induction of apoptotic events, whereas Kv1.3-deficient mitochondria were
resistant to the same stimuli (Szabo I. et al 2008). Moreover, patch clamp and mutation
analysis revealed a functional interaction between Kv1.3 and Bax upon apoptosis, which is
strictly dependent on the presence of the positively charged lysine at position 128, since
mutation of this residual into a negatively charged glutamate (Bax K128E), corresponding to
K128 in Bax, abrogated the apoptotic effects. On the contrary, conversion of glutamate 158
into lysine in the anti-apoptotic Bcl-xL (Bcl-xLE158K) restored these effects (Szabo I. et al
2011). Transfection of Bax/Bak double knockout mouse embryonic fibroblasts cells (DKO
MEFs) with wild-type Bax, Bax K128E or Bcl-xL E158 also confirmed the hypothesis, by
showing that apoptosis affected Bax and Bcl-xL E158 transfected DKO cells, but not Bax
K128E transfected ones.
Bax-mediated inhibition of Kv1.3 was shown to induce hyperpolarization, formation of ROS,
release of cytochrome c and marked depolarization of the mitochondrial membrane of Kv1.3-
positive mitochondria (Szabo I. et al 2008). These findings, confirmed also by the use of
pharmacological inhibitors ShK, MgTx and Psora-4, led to hypothesize a model of action of
mtKv1.3 in apoptosis (Figure 1.4). Particularly, Bax interaction with mtKv1.3, after ROS- or
apoptotic stimuli-dependent translocation to the OMM, blocks the positive inward K+ flux,
triggering an initial hyperpolarization of the mitochondrial membrane. Mitochondrial
membrane hyperpolarization causes reduction of respiratory chain complexes, such as Fe/S
centres, cytochrome c and ubiquinone pool, uncoupling the H+ gradient and causing an

INTRODUCTION
13
increase of ROS production (Murphy M.P. 2009, O'Rourke B. et al 2005). ROS can activate
the PTP through oxidation of cysteine residues, leading to depolarization of the mitochondrial
membrane and release of mitochondrial proteins (Costantini P. et al 1996, Giorgio M. et al
2005, Scorrano L. 2009, Zoratti M. et al 1995). ROS can also favor the detachment of
cytochrome c from the cristae by changing the oxidation state of membrane lipids, such as
cardiolipin, that bind to cytochrome c (Iverson S.L. et al 2004, Ott M. et al 2007), but other
yet unknown mechanisms might also be important for this process. Cytochrome c is then
released through OMM rupture and Bax oligomers triggering, once in the cytosol, the
activation of the intrinsic apoptotic pathway. It has been demonstrated that Bax can also
interact with other channels than Kv1.3, including Kv1.5 and Kv1.1 (Szabo I. et al 2011).
Moreover, cytochrome c release has been shown to occur also through the interaction of Bax
with big potassium (BK)-channels in the IMM, but whether the mechanism is similar to the
Kv1.3-Bax interaction still has to be understood (Cheng Y. et al 2011).
Figure 1.4. Model for the intrinsic apoptosis induction via mtKv1.3 inhibition. Membrane permeant Kv1.3
inhibitors PAP-1, Psora-4 and clofazimine induce intrinsic apoptosis blocking the mtKv1.3 in a Bax-similar
manner, triggering a hyperpolarization of the mitochondrial membrane and increase of ROS production. ROS
can both activate the permeability transition pore (PTP), leading to depolarization of the mitochondrial
membrane and release of mitochondrial proteins, and favor the detachment of cytochrome c from the cristae.
Cytochrome c is then released through OMM ruptures or Bax oligomers triggering, once in the cytosol, the
activation of the intrinsic apoptotic pathway (Leanza L. et al 2014b).
INTRODUCTION
14
1.2.4 mtKv1.3 and cancer
The crucial role of Kv channels in apoptosis and proliferation is underlined by their
differential expression in various tumor cells (Arcangeli A. et al 2009). Particularly, changes
in Kv1.3 expression have been detected in various cancers, including large B-cell lymphoma
(Alizadeh A.A. et al 2000), melanoma (Artym V.V. et al 2002), glioma (Bielanska J. et al
2009, Preussat K. et al 2003), prostate and pancreas (Abdul M. et al 2006), colon (Abdul M.
et al 2002), breast (Jang S.H. et al 2009) and gastric cancer (Lan M. et al 2005). Moreover,
Kv1.3 has been found in mitochondria of lymphoma and B-CLL leukemia, MEF cells,
melanoma B16F10 and osteosarcoma SAOS-2 cells, prostate PC3 and breast cancer MCF-7
cell lines (Gulbins E. et al 2010, Leanza L. et al 2013).
Standing to this knowledge, the above mentioned model of Kv1.3 Bax-mediated inhibition
was applied to induce apoptosis in different cancer cell lines, showing that the use of specific
membrane-permeable inhibitors Psora-4, PAP-1 and clofazimine mimic the effects of Bax-
mtKv1.3 interaction. The inhibitors successfully induced apoptosis in Kv1.3-expressing
Jurkat, B16F10 and SAOS-2 cancer cell lines, whereas cells displaying a low or absent Kv1.3
current such as, respectively, HEK293 or K562 cells, failed to undergo apoptosis when treated
with these inhibitors (Leanza L. et al 2013). Importantly, experiments with Bax/Bak-double
knockout human (DKO) Jurkat leukemic T cells and Bax/Bak DKO MEFs demonstrated that
these apoptotic effects are independent from the presence of the pro-apoptotic proteins Bax
and Bak (Szabo I. et al 2011). In vivo, a B16F10 melanoma mouse model showed a 90%
reduction when treated with the Kv1.3 inhibitor clofazimine. Moreover, primary human
cancer B cells from patients with chronic lymphocytic leukemia (B-CLL) were shown to
express a higher level of functional channel compared to B cells of healthy subjects. When
treated with different Kv1.3 blockers, malignant cells underwent apoptosis, whereas healthy
cells were spared (Leanza L. et al 2013). Interestingly, apoptosis-inducing effect of Kv1.3
inhibitors were absent in pathologic B cells pretreated with ROS detoxifying enzymes, as well
as in CTLL-2 cells exposed to oxidative stress. Conversely, pre-treatment with pro-oxidant
agents alone was not able to induce cell death in healthy B cells, which encountered apoptosis
only after addition of Kv1.3 inhibitors. These findings show a synergistic action of Kv1.3
expression and altered redox state of malignant cells which contributes to the sensitivity to the
drugs.
INTRODUCTION
15
1.3 Glioblastoma
Glioblastoma (also called glioblastoma multiforme, GBM or grade IV Astrocytoma) is the
most common and malignant tumor among glia neoplasms (Louis D.N. et al 2007). GBM is
composed by a heterogeneous mixture of scarcely differentiated astrocytes and it usually
localizes in the cerebrum, less frequently in the brain stem or in the spinal cord. It affects
mostly but not only adults. Unlike other cancers and as all glial tumors, it does not expand out
of the central nervous system by spreading through blood, but it invades the brain and spinal
cord by active cell migration. GBM usually develops de novo (‘primary’ tumor) but can also
arise from a fibrillary (or diffuse, grade II) astrocytoma or from an anaplastic astrocytoma
(grade III), in that cases is called ‘secondary’ tumor (Ohgaki H. et al 2007). GBM current
standard of care for newly diagnosed patients, established in 2005, consist of maximal
surgical resection, followed by temozolomide (TMZ)-based chemotherapy in combination
with radiation therapy (RT) (Stupp R. et al 2005). However, due to the high recurrent rates
(~90%), patient average survival does not exceed 15 months after diagnosis (Johnson D.R. et
al 2012).
One of the major obstacles to the treatment is represented by the migratory invasive behavior
of glioblastoma cells. Indeed, even if, especially in GBM, but also in the other brain tumors,
the blood brain barrier (BBB) is altered, showing hypercellularity, pleomorphism, high
mitoses, central necrosis and excessive vascularization (Wolburg H. et al 2012), the BBB
breakage is highly heterogeneous, often presenting the tumor core much more permeable than
the proliferating tumor periphery (Neuwelt E.A. et al 1982). Thus, although chemotherapeutic
drugs can reach GBM, it is very difficult to act on single tumor cells in the infiltration zone
where the BBB is less or not altered. On the other hand, the treatment of a high grade
glioblastoma, easier to reach thanks to the higher permeability, but with necrotic center,
results to be too tardive.
1.3.1 GBM and K+ channels
To control migration through the narrow extracellular spaces, glioma cells possess a devoted
ion channel apparatus that finely regulates ion and water fluxes. Sontheimer’s laboratory
highlighted an intricate network of ion channel expression studying both glioma cell lines and
primary samples (Cuddapah V.A. et al 2011). Particularly, glioma cells seem to shrink their
volume, thanks to K+
channels which, together with Cl- channels, promote cell shrinkage
initiating an efflux of KCl. The main K+ channel expressed by gliomas is gBK, encoded by
KCNMA1 or KCa1.1, a splice variant of the hslo BK channel gene (Liu X. et al 2002, Ransom
INTRODUCTION
16
C.B. et al 2001), which is exclusively found in glioma. BK currents in glioma cells are more
sensitive to cytosolic Ca2+
compared to BK channels of healthy glial cells (Ransom C.B. et al
2002). Inhibitors of this channel potently block glioma cell invasion, in vitro and in situ.
However, concentrations of inhibitors sufficient to block the channel do not affect
glioblastoma growth in vitro (Abdullaev I.F. et al 2010). Biopsies from patients with
malignant glioma showed an overexpression of BK channels compared to nonmalignant
cortical tissues, and a positive correlation with tumor malignancy of BK channels expression
was found (Liu X. et al 2002). Kv10.1, the Kv channel with the broader expression in
different cancers, is expressed in neuroblastoma, and its targeted inhibition decreases cancer
cell proliferation, also in human glioma cells (Jeon S.H. et al 2011, Pardo L.A. et al 2012).
Glioma cells show, both in vitro and in situ, a depolarized resting membrane potential (-20 to
-40 mV) (Bordey A. et al 1998)compared to the very negative one of normal glial cells (-80 to
-90 mV) (Newman E.A. 1993), which is proposed to be due to intracellular
localization/mislocalization of inwardly rectifying (Kir) channels, since no significant
downregulation of Kir channels was found (Olsen M.L. et al 2004). Furthermore, in glioma,
hERG (or Kv11.1, hERG1) channel current seems to substitute the IRK (Kir, inwardly
rectifying channels) expression normally found in glial cells, thus also suggesting a
contribution to cell depolarization typical of neoplastic transformation (Bianchi L. et al 1998).
Regarding Kv1.3, this channel was shown to be expressed in neuroblastomas (Friederich P. et
al 2002). Preussat and colleagues have previously shown that voltage gated channel subtypes
Kv1.3, together with Kv1.5, contribute to growth related properties of normal glia, and that
Kv1.5 expression correlated with glioma entities and malignancy grade (Preussat K. et al
2003). Such correlation was not found for Kv1.3 expression. Also, another work from Bonnet
et al. demonstrated an apoptosis inducing effect after the normalization of a mitochondria-K+
channel axis by the Kv1.5-upregulating drug dichloroacetate (DCA) on a glioma cell line
(Bonnet S. et al 2007). Particularly, it has been shown that is possible to induce cell death in
different glioma cell lines expressing low level of Kv1.5. The same group already used DCA
in patients with promising results in a small study (Michelakis E.D. et al 2010).

INTRODUCTION
17
1.4 Aims of the study
The groups of Prof.s Szabò and Gulbins demonstrated that the inhibition of the mtKv1.3 by
different membrane-permeant specific drugs is able to induce apoptosis in different cancer
cell lines in vitro, ex vivo in B-CLL cells and in a in vivo orthotopic mouse melanoma model
(Leanza L. et al 2012, Leanza L. et al 2013).
Here, I tested different Kv1.3 inhibitors on their ability to influence tumor growth in two
types of models, glioma and melanoma. In particular, I investigated whether these drugs are
able to induce cell death by depolarizing the mitochondrial membrane, increasing ROS
production, eventually leading to cytochrome c release in different cancer cell lines.
Thanks to their augmented solubility and mitochondrial targeting ability, the newly
synthesized drugs, together with clofazimine, were applied, after a pharmacokinetic analysis,
in vivo to a syngeneic glioma model and to the orthotopic melanoma model. Beside the
impact on tumor growth, the synergistic effect with ROS level, previously proposed in the in
vitro studies, was analyzed.
The last part of the study focused on the mechanism of the in vivo action of the precursor and
the derivatives in the reduction of melanoma tumor, addressing the influence of these
compounds on the immune system. Specifically, an analysis of the response of different
immune cell subtypes (macrophages, T and B lymphocytes, regulatory T cells, neutrophils) to
Kv1.3 inhibitors was performed.
MATERIALS
18
2 MATERIALS
2.1 Chemicals
Acetic acid (C2H4O2)
Sigma-Aldrich Chemie GmbH, Steinheim,
Germany
Acetone
Sigma-Aldrich Chemie GmbH, Steinheim,
Germany
Acetonitrile (CH3CN) Sigma-Aldrich Chemie GmbH, Steinheim,
Germany
Acrylamide Carl Roth GmbH & Co. KG, Karlsruhe,
Germany
Ammonium persulfate (APS) Sigma-Aldrich Chemie GmbH, Steinheim,
Germany
Aprotinin Serva Electrophoresis GmbH, Heidelberg,
Germany
Aqua ad iniectabilia
B. Braun Melsungen AG, Melsungen,
Germany
Atipamezole (Antisedan)
Orion Pharma, Espoo, Finland
Bovine serum albumin (BSA) Carl Roth GmbH & Co. KG, Karlsruhe,
Germany
Bromophenol blue Sigma-Aldrich Chemie GmbH, Steinheim,
Germany
Calcium chloride (CaCl2)
Sigma-Aldrich Chemie GmbH, Steinheim,
Germany
CDP Star reagent Perkin Elmer, Waltham, MA, USA
Cell dissociation buffer enzyme-free, PBS
Life Technologies GmbH, Darmstadt,
Germany
Cell Titer96 AQueous One Solution Cell
Proliferation assay
Promega GmbH, Mannheim, Germany
Cisplatin
Teva GmbH, Ulm, Germany
Clofazimine Sigma-Aldrich Chemie GmbH, Steinheim,
Germany
Dabco
Sigma-Aldrich Chemie GmbH, Steinheim,
Germany
Dimethyl sulfoxide (DMSO)
Sigma-Aldrich Chemie GmbH, Steinheim,
Germany
Dithiothreitol (DTT)
Sigma-Aldrich Chemie GmbH, Steinheim,
Germany
DNAse
Roche Molecular Biochemicals, Penzberg,
Germany
EDTA
Carl Roth GmbH & Co. KG, Karlsruhe,
Germany
EGTA Carl Roth GmbH & Co. KG, Karlsruhe,
MATERIALS
19
Germany
Eosin
Sigma-Aldrich Chemie GmbH, Steinheim,
Germany
Ethanol (C2H5OH)
Sigma-Aldrich Chemie GmbH, Steinheim,
Germany
Ethidium bromide
Sigma-Aldrich Chemie GmbH, Steinheim,
Germany
Fentanyl
Rotexmedica GmbH Arzneimittelwerk,
Trittau, Germany
Flumazenil
Hameln pharma plus GmbH, Hameln,
Germany
Gelatin
Sigma-Aldrich Chemie GmbH, Steinheim,
Germany
Glycerol
Carl Roth GmbH & Co. KG, Karlsruhe,
Germany
Glycine Carl Roth GmbH & Co. KG, Karlsruhe,
Germany
Hematoxylin solution, Mayer´s
Carl Roth GmbH & Co. KG, Karlsruhe,
Germany
Heparin
Ratiopharm GmbH, Ulm, Germany
HEPES Carl Roth GmbH & Co. KG, Karlsruhe,
Germany
Leupeptin Serva Electrophoresis GmbH, Heidelberg,
Germany
Magnesium chloride (MgCl2)
Sigma-Aldrich Chemie GmbH, Steinheim,
Germany
Magnesium sulfate (MgSO4)
Sigma-Aldrich Chemie GmbH, Steinheim,
Germany
Medetomidin Domitor
Orion Pharma, Espoo, Finland
2-Mercaptoethanol
Sigma-Aldrich Chemie GmbH, Steinheim,
Germany
Methanol (CH3OH) (Baker)
Avantor Performance Materials, Center
Valley, PA, USA
5-Methoxypsoralen (5-MOP)
Synthesized by the Department of Chemical
Sciences, University of Padua, Italy
Midazolam
Ratiopharm GmbH, Ulm, Germany
Milk powder
Sigma-Aldrich Chemie GmbH, Steinheim,
Germany
Mowiol Kuraray Europe GmbH, Hattersheim am
Main, Germany
N-acetylcysteine
Sigma-Aldrich Chemie GmbH, Steinheim,
Germany
Naloxone
Inresa Arzneimittel GmbH, Freiburg,
Germany
NP-40 (Igepal)
Sigma-Aldrich Chemie GmbH, Steinheim,
Germany
Paraformaldehyde (PFA) Sigma-Aldrich Chemie GmbH, Steinheim,
Germany
Paraplast plus Leica Microsystem, Mannheim, Germany
MATERIALS
20
Percoll
Sigma-Aldrich Chemie GmbH, Steinheim,
Germany
5-(4-Phenoxybutoxy) psoralen (PAP-1)
Sigma-Aldrich Chemie GmbH, Steinheim,
Germany
Potassium chloride (KCl)
Carl Roth GmbH & Co. KG, Karlsruhe,
Germany
Potassium dihydrogen phosphate
(KH2PO4)
Sigma-Aldrich Chemie GmbH, Steinheim,
Germany
Protease inhibitors (tablets)
Sigma-Aldrich Chemie GmbH, Steinheim,
Germany
Proteinase K
Qiagen, Hilden, Germany
Psora-4 Sigma-Aldrich Chemie GmbH, Steinheim,
Germany
Sodium bicarbonate (NaHCO3)
Sigma-Aldrich Chemie GmbH, Steinheim,
Germany
Sodium carbonate (Na2CO3)
Sigma-Aldrich Chemie GmbH, Steinheim,
Germany
Sodium chloride (NaCl)
Carl Roth GmbH & Co. KG, Karlsruhe,
Germany
Sodium citrate
Sigma-Aldrich Chemie GmbH, Steinheim,
Germany
Sodium dodecyl sulphate (SDS) Carl Roth GmbH & Co. KG, Karlsruhe,
Germany
Sodium hydroxide (NaOH)
Sigma-Aldrich Chemie GmbH, Steinheim,
Germany
Sodium phosphate dibasic (Na2HPO4) Sigma-Aldrich Chemie GmbH, Steinheim,
Germany
Staurosporine Sigma-Aldrich Chemie GmbH, Steinheim,
Germany
Sucrose Carl Roth GmbH & Co. KG, Karlsruhe,
Germany
SuperSignal West Pico Chemiluminescent
Substrate
Thermo Fisher Scientific Inc., Waltham,
MA, USA
TES
Sigma-Aldrich Chemie GmbH, Steinheim,
Germany
Tetramethylethylenediamine (TEMED) Sigma-Aldrich Chemie GmbH, Steinheim,
Germany
Tris Carl Roth GmbH & Co. KG, Karlsruhe,
Germany
Triton X-100 Sigma-Aldrich Chemie GmbH, Steinheim,
Germany
Trypan blue solution 0.4 % Sigma-Aldrich Chemie GmbH, Steinheim,
Germany
Tween 20 Sigma-Aldrich Chemie GmbH, Steinheim,
Germany
Urea
Sigma-Aldrich Chemie GmbH, Steinheim,
Germany
Xylene cyanol
Carl Roth GmbH & Co. KG, Karlsruhe,
Germany

MATERIALS
21
2.2 Tissue culture
Dulbecco’s modified eagle medium
(DMEM) – 31053
Gibco/Invitrogen, Karlsruhe, Germany
Dulbecco’s modified eagle medium
(DMEM) - 41965
Gibco/Invitrogen, Karlsruhe, Germany
Minimum Essential Medium (MEM) -
21090
Gibco/Invitrogen, Karlsruhe, Germany
Opti-MEM
Gibco/Invitrogen, Karlsruhe, Germany
RPMI-1640
Gibco/Invitrogen, Karlsruhe, Germany
L-Glutamine
Gibco/Invitrogen, Karlsruhe, Germany
Sodium pyruvate
Gibco/Invitrogen, Karlsruhe, Germany
Penicillin/Streptomycin
Gibco/Invitrogen, Karlsruhe, Germany
MEM non-essential aminoacids
Gibco/Invitrogen, Karlsruhe, Germany
Fetal Calf Serum
Gibco/Invitrogen, Karlsruhe, Germany
2.5 % Trypsin
Gibco/Invitrogen, Karlsruhe, Germany
0.05 % Trypsin-EDTA Gibco/Invitrogen, Karlsruhe, Germany
2.3. Antibodies and ligands
AllStars negative control siRNA-Alexa 555 Qiagen, Hilden, Germany
Annexin-V-FLUOS
Roche Molecular Biochemicals, Penzberg,
Germany
Anti-Bax
Santa Cruz Biotechnology, Inc., Delaware
Ave, CA, USA
Anti-CD3-PE
BD Pharmigen, San Diego, CA, USA
Anti-CD4-FITC
Affymetrix eBioscience, San Diego, CA,
USA
Anti-CD8-APC
Affymetrix eBioscience, San Diego, CA,
USA
Anti-CD11b-bio
Affymetrix eBioscience, San Diego, CA,
USA
Anti-CD11c-Alexa 488
Affymetrix eBioscience, San Diego, CA,
USA
MATERIALS
22
Anti-CD19-PE
Affymetrix eBioscience, San Diego, CA,
USA
Anti-CD25-bio
Becton Dickinson Labware, Le Pont de
Claix, France
Anti-CD204-APC
BioRad, München, Germany
Anti-cytochrome c
BD Pharmigen, San Diego, CA, USA
Anti-F4/80-Alexa 488
Affymetrix eBioscience, San Diego, CA,
USA
Anti-FoxP3-PE
Affymetrix eBioscience, San Diego, CA,
USA
Anti-GADPH
EMD Millipore, MA, USA
Anti-KCNA3 siRNA-Alexa 555 Qiagen, Hilden, Germany
Anti-Kv1.3
Alomone Labs, Jerusalem, Israel
(Neuromab) Antibodies Inc., Davis, CA,
USA
Pineda
„home made“ (affinity purified)
Anti-Kv1.3-FITC
Sigma-Aldrich Chemie GmbH, Steinheim,
Germany
Anti-Ly6G-APC
Affymetrix eBioscience, San Diego, CA,
USA
Anti-MHCII-APC
Affymetrix eBioscience, San Diego, CA,
USA
Anti-mouse IgG-AP
Santa Cruz Biotechnology, CA, USA
Anti-mouse IgG-HRP
Santa Cruz Biotechnology, CA, USA
Anti-rabbit IgG-AP
Santa Cruz Biotechnology, CA, USA
Anti-rabbit IgG-HRP
Santa Cruz Biotechnology, CA, USA
Anti-streptavidin-APC
BD Pharmigen, San Diego, CA, USA
Anti-streptavidin-PE
BD Pharmigen, San Diego, CA, USA
Anti-Tim23
BD Pharmigen, San Diego, CA, USA
Anti-Tom20
BD Pharmigen, San Diego, CA, USA
Anti-tubulin alpha
Epitomics, Burlingame, CA, USA
Cy3-anti mouse IgG
Jackson Immunoresearch, West Grove, PA,
USA
Cy3-anti rabbit IgG Jackson Immunoresearch, West Grove, PA,
USA
Dylight-649 anti mouse IgG
Jackson Immunoresearch, West Grove, PA,
USA
MATERIALS
23
FoxP3 intracellular staining 005523 Affymetrix eBioscience, San Diego, CA,
USA
In situ cell death detection kit, TMR red
dUTP
Roche Molecular Biochemicals, Penzberg,
Germany
Lipofectamine 2000 Life Technologies GmbH, Darmstadt,
Germany
MitoSOX Red Mitochondrial Superoxide
Indicator
Life Technologies GmbH, Darmstadt,
Germany
Tetramethylrhodamine, methyl ester
(TMRM)
Life Technologies GmbH, Darmstadt,
Germany
2.3 Cell lines
A172 (ATCC CRL 1620) Established human glioblastoma cell line.
Kind gift from Prof. Dr. M. Weller
(University of Zürich)
B16F10 (ATCC CRL 6475)
Established murine melanoma cell line
GL261
Established mouse glioma cell line. Kind gift
from Prof. Dr. M. Weller (University of
Zürich)
Jurkat (ATCC TIB 152)
Established human T-lymphocytes cell line
K562 (ATCC CCL 243)
Established human myelogenous leukemia
cell line
LN308
Established human glioblastoma cell line.
Kind gift from Prof. Dr. M. Weller
(University of Zürich)
2.4 Equipment
BD FACSCalibur flow cytometer
BD Biosciences, San Jose, CA, USA
Caliper
Mitutoyo GmbH, Neuss, Germany
Cell culture incubator
ThermoFisher Scientific, Waltham, MA,
USA
Cell culture flask Corning Inc., NY, USA
Cell culture, 6, 24 and 96 well plate Corning Inc., NY, USA
MATERIALS
24
Cell scraper, 24 cm TPP, Trasadingen, Switzerland
Cell strainer, 40 µm Becton Dickinson Labware, Le Pont de
Claix, France
Cryo 1C Freezing container
Nalgene, USA
Cryotubes
ThermoFisher Scientific, Waltham, MA,
USA
Embedding cassettes
Fisher Scientific, The Hague, The
Netherlands
FACS polystyrene round-bottom tubes
Becton Dickinson Labware, Le Pont de
Claix, France
Glass pestle (Glas Col) ABCR GmbH & Co. KG, Karlsruhe,
Germany
HPLC machine
Agilent Technologies Inc., Santa Clara, CA,
USA
HPLC column
Agilent Technologies Inc., Santa Clara, CA,
USA
Hybond ECL nitrocellulose membrane
GE Healthcare, USA
Interlocked vial with fused glass insert,
screw top
Sigma-Aldrich Chemie GmbH, Steinheim,
Germany
Laminar flow hood
Biohit/Sartorius Antares, Milano, Italy
Leica DMI-4000 fluorescence microscope
Leica Microsystem, Mannheim, Germany
Leica TCS SP5 confocal microscope
Leica Microsystem, Mannheim, Germany
Micro fine U-40 insulin syringes 29G Becton Dickinson Labware, Le Pont de
Claix, France
Microliter syringe Zefa-Laborservice GmbH, Harthausen,
Germany
Microscope slide 76x26 mm Gerhard Menzel GmbH, Braunschweig,
Germany
Microtome
ThermoFisher Scientific, Waltham, MA,
USA
Neubauer chamber 0.1 mm Paul Marienfeld GmbH & Co. KG, Lauda-
Königshofen, Germany
Packard Spectracount absorbance
microplate reader
Cole Parmer, East Bunker Court Vernon
Hills, IL, USA
Pellet pestles blue polypropylene Sigma-Aldrich Chemie GmbH, Steinheim,
Germany
Pellet pestles cordless motor Sigma-Aldrich Chemie GmbH, Steinheim,
Germany
Polyvinylidene fluoride membrane (PVDF) Pall Corporation, Pensacola, USA
Precision Drill
Proxxon, Niersbach, Germany
Scalpels, sterile disposable Servoprax GmbH, Wesel, Germany
MATERIALS
25
Screw cap (open top) with liner Sigma-Aldrich Chemie GmbH, Steinheim,
Germany
Spectrophotometer
Bachofer, Reutlingen, Germany
SpeedVac
ThermoFisher Scientific, Waltham, MA,
USA
Stereotaxic instrument
TSE Systems GmbH, Bad Homburg,
Germany
X-ray films Amersham Biosciences, Buckinghamshire,
UK
2.5 Buffers and solutions
Agarose gel (0.8%) 0.8 g agarose
100 ml TAE buffer
Alcaline phosphatase wash buffer
100 mM Tris/HCl pH 9.5
100 mM NaCl
Annexin-binding buffer 10 mM Hepes pH 7.4
140 mM NaCl
5 mM CaCl2
Cell membrane enrichment lysis buffer 5 mM Tris/HCl pH 7.5
0.25 % Triton X100
1 mM EDTA
1 mM DTT
Protease inhibitors
0.2 M NaCl
Complete DMEM, MEM, Optimem or
RPMI
500 ml DMEM, MEM, Optimem or RPMI
10% FCS
10 mM Hepes pH 7.4
2 mM L-Glutamine
1 mM Sodium pyruvate
100 µM non-essential amino acids
100 U/ml penicillin
100 µg/ml streptomycin
Hepes/Saline (H/S) 20 mM Hepes pH 7.4
132 mM NaCl
1 mM CaCl2
0.7 mM MgCl2
0.8 mM MgSO4
5.4 mM KCl
Mowiol
2.5 g Mowiol
2.5 % Dabco
MATERIALS
26
Percoll gradient
60 % Percoll (in TES buffer)
30 % Percoll (in TES buffer)
18 % Percoll (in TES buffer)
PFA stock solution
8% PFA
in PBS
Phosphate buffered saline (PBS), pH 7.4 137 mM NaCl
2.7 mM KCl
10 mM Na2HPO4
1.8 mM KH2PO4
PBS-T 137 mM NaCl
2.7 mM KCl
10 mM Na2HPO4
1.8 mM KH2PO4
0.05 % Tween 20
PCR-buffer (10X)
200 mM Tris-HCl pH 8.3
500 mM KCl
14 mM MgCl2
0.1 % Gelatin
Running buffer 25 mM Tris
192 mM glycine
0.1 % SDS
Sample buffer (5X) 250 mM Tris pH 6.8
20 % Glycine
4 % SDS
8 % β-mercaptoethanol
0.2 % bromophenol blue
TAE buffer (50X)
2 M Tris
1 M Acetic acid
0.05 M EDTA pH 8
TBS, pH 7.4 20 mM Tris
150 mM NaCl
TBS-T 20 mM Tris
150 mM NaCl
0.05 % Tween 20
TES buffer 300 mM Sucrose
10 mM TES pH 7.4 (KOH)
1 mM EGTA pH 7.4 (KOH)
Protease inhibitors
MATERIALS
27
TLB buffer
0.5 mM MgCl2
10 % 10X PCR-Buffer
0.045 % Tween 20
0.045 % NP-40 (Igepal)
300 µg/ml Proteinase K
Transfer buffer (for nitrocellulose)
25 mM Tris
192 mM glycine
10 % Methanol
Transfer buffer (for PVDF) 10 mM NaHCO3
3 mM Na2CO3
10 % Methanol
Trypsin (0.25%) pH 7.4 10X Trypsin (2.5%)
0.05 % EDTA
5 mM Glucose
10X PBS
2.6 Animals
Mice were bred and housed in a special pathogen free facility at the University of Duisburg-
Essen, with 12h light/dark cycle at constant temperature and humidity, allowed daily food and
water ad libitum. All experiments were funded by G1093/09 grant and approved by the
Animal Care and Use Committee of the Bezirksregierung Düsseldorf, Düsseldorf, Germany.
METHODS
28
3 METHODS
3.1 Cell culture techniques
3.1.1 Culture and passage of established cell lines
Jurkat and K562 cell lines were maintained in complete RPMI medium (see Materials);
B16F10 cells were maintained in complete MEM medium at 37°C in a 5% CO2 atmosphere.
GL261, A172 and LN308 cells were cultured in complete DMEM medium at 37°C with 10%
CO2. For passage, adherent cells were washed once with PBS, incubated with 0.25% trypsin
(or 0.05% Trypsin-EDTA for GL261 cells) for 5 min at 37°C and re-suspended in fresh
medium. All cells were maintained at a sub-confluent state, which was ordinarily assessed by
light microscopy. All cell lines were tested monthly by PCR to exclude mycoplasma
contaminations.
3.1.2 Freezing and thawing of cells
Cells were frozen after centrifugation at 400 x g for 10 min at RT and re-suspending the cell
pellet in complete medium supplemented with 10% FCS and 10% DMSO. 1 ml aliquots were
transferred to cryotubes and frozen in a freezing container at -80°C. After 2-3 days, cryotubes
were placed in liquid nitrogen for long-term storage. Cells were thawed in a water bath at
37°C and immediately transferred in a T25 flask containing complete medium and let grow
O/N at 37°C. Medium was then replaced and cells eventually transferred to a T75 flask.
3.2 PAP-1 derivatives
PAP-1 derivatives PEGME, PCARBMTP and PAPTP were synthesized by the Department of
Chemical Sciences of the University of Padua (Italy) as described in the patent license
number PD2015A000006. For treatments, all derivatives were dissolved in DMSO while, in
all cases, the final concentration of DMSO was lower than 0.5%.
3.3 Cell viability assay
3.3.1 Trypan blue
To assess cell viability, 5 x 10⁴ cells per well were seeded in a 12 well plate in 1 ml complete
medium over-night (O/N). After treatment with compounds, supernatant were collected and
cells were trypsinized for 5 min at 37°C. Supernatants were added to the cells and centrifuged
METHODS
29
at 500 x g for 5 min at RT. Cells were then re-suspended in 100 µl PBS and 50 µl of this
suspension were added to 50 µl 0.4% Trypan blue solution. After 3-5 min incubation at RT,
10 µl were analyzed in a Neubauer chamber. Viable and non-viable cells were counted by
light microscopy.
3.3.2 MTT assay
To assess cell survival, colorimetric MTT assay was used. The assay exploits the activity of
the mitochondrial dehydrogenases, which, if active, reduce the yellow tetrazolium salt MTT
3-(4, 5-dimethylthiazol-2-yl)-2, 5-diphenyltetrazolium bromide to a purple insoluble
compound, the formazan. Absorbance values are proportional to the amount of produced
formazan and thus, to the metabolic activity of the cells. 0.005 x 10⁶ cells/ well were seeded
in a 96 well plate O/N and treated with different compounds or left untreated in DMEM w/o
phenol red and w/o FCS. According to the manufacturer’s protocol, 20 µl Cell Titer 96
AQUEOUS One Solution were added to each well and incubated between 2-3 h at 37°C in the
dark. Absorbance was read at 490 nm by spectrophotometry.
3.4 Biochemical techniques
3.4.1 Cell membrane fraction enrichment
Channels are present in membranes in much lower concentration compared to soluble
proteins, therefore they are slightly detectable in a whole cell total extract. To improve
channel detection, a cell membrane enrichment protocol was used. 0.8 x 10⁶ adherent cells
were seeded in a 100 mm tissue culture dish O/N. The day after, adherent cells were washed
once in 0.9% NaCl, scraped in 285 µl ice cold lysis-buffer and transferred to a 1.5 ml tube on
ice. For suspension cells, 1.5 x 10⁶ cells were collected at 400 x g for 5 min at RT and re-
suspended in the same volume of lysis buffer. All cells were vortexed 50 sec, then 15 µl of 4
M NaCl were added and vortexed for further 15 sec. Broken cells were centrifuged at 20000 x
g for 10 min at 4°C. The resulting pellet (cell membrane fraction) was re-suspended in 100 µl
lysis buffer and stored at -80°C.
3.4.2 Mitochondria isolation
Approximately 2 x 10⁸ cells were washed twice with 10 ml PBS and scraped in 2-3 ml PBS.
Cells were collected and washed two times in 40 ml PBS at 500 x g for 10 min at RT. Each
pellet was re-suspended in 1 ml ice cold TES buffer and dounce homogenized 75 times in a
glass pestle (tight) after assessing the degree of rupture by Trypan blue. From this

METHODS
30
homogenate, 200 µl were rescued as fraction 1 (total lysate). The remaining lysate was
divided in 4 parts and centrifuged at 600 x g for 10 min at 4°C to pellet unbroken cells.
Supernatants were collected, while pellets were re-suspended in 500 µl TES buffer and
dounce homogenized for further 75 times. The lysate was centrifuged as described above and
the resulting supernatant was added to the previous one. Supernatants were centrifuged at 800
x g for 10 min at 4°C to remove remaining unbroken cells. Supernatants were collected and
centrifuged at 8000 x g for 10 min at 4°C to pellet organelles, among which mitochondria.
Pellets were re-suspended in a total volume of 800 µl TES buffer and 200 µl of this
suspension was rescued as fraction 4. The remaining 600 µl were carefully added on the top
of Percoll gradients and centrifuged at 8500 x g for 10 min at 4°C with soft brake. 500 µl
were rescued from each M1 fraction (isolated mitochondria, between 18% and 30% Percoll
phases) and washed three times with 1.5 ml TES buffer at 20000 x g for 10 min at 4°C to
eliminate Percoll. The obtained pellet (mitochondria) was re-suspended in 40 µl TES buffer
and stored at -80°C.
3.4.3 Cytochrome c release assay
To detect the release of cytochrome c, 0.2 x 10⁶ cells / well were seeded in a 6 wells plate
O/N and either treated with different compounds or left untreated. Medium was then removed
and centrifuged at 1000 x g for 5 min at 4°C, to collect detached cells. In the meanwhile, cells
of each well were gently washed once with PBS, scraped in 200 µl ice cold TES buffer per
well and immediately collected in a 1.5 ml tube. Pelleted cells were added to the cells by
resuspending it in the same TES buffer. After 30 min incubation on ice, cells were broken
with a pellet pestle for 1 min and 15 sec on ice, according to the rupture test previously done
with Trypan blue. The lysate was then centrifuged at 19000 x g for 10 min at 4°C. The
supernatant (cytosolic fraction) was collected and the pellet (mitochondrial fraction) was re-
suspended in 50 µl TES buffer. Both cytosolic and mitochondrial fractions were stored at -
80°C.
3.4.4 Protein separation by SDS-PAGE
Proteins were analyzed by using SDS-PAGE technique (sodium dodecyl sulphate
polyacrylamide gel electrophoresis). Prior to loading, samples were solubilized in 5-fold
sample buffer for 5 min at 96°C, except where differently specified. Equal amounts of
material were loaded in a 10% or 12% acrylamide gel (prepared as described below):

METHODS
31
Running gel (without urea) 10%:
Solution A 3.75 ml
Solution B 5.0 ml
H2O 6.11 ml
SDS 20 % 0.075 ml
TEMED 0.03 ml
APS 10 % 0.03 ml
Stacking gel:
Solution A 0.63 ml
Solution C 0.21 ml
H2O 4.1 ml
SDS 20 % 0.025 ml
TEMED 0.02 ml
APS 10 % 0.02 ml
Running gel (with urea) 10%:
Urea 3.63 g
H2O 2.09 ml
Solution B 2.67 ml
Solution A 2.5 ml
TEMED 0.0055 ml
APS 10 % 0.055 ml
Running gel 12%:
Solution A 3 ml
Solution B 1.24 ml
H2O 5.66 ml
SDS 10 % 0.1 ml
TEMED 0.02 ml
APS 10 % 0.03 ml

METHODS
32
Stacking gel:
Solution A 0.373 ml
Tris 0.313 M pH 6.8 1 ml
H2O 1.62 ml
TEMED 0.0035 ml
APS 10 % 0.035 ml
Solution A: 40 % Acrylamide (39.2 g Acrylamide/ 100 ml; 0.8 g Bis-acrylamide/ 100 ml)
Solution B: 3 M Tris pH 8.8
Solution C: 3 M Tris pH 6.8
10% and 12% gels were run at 15 mA (stacking gel) and 50 mA (running gel). Samples were
transferred by tank blotting method from the gel to either a nitrocellulose or PVDF
membrane, at 25 mA or 40 V, respectively, O/N at 4°C. The transfer buffer was prepared as
written in the Materials. Nitrocellulose or PVDF membranes were then washed once in PBS
(or TBS for PVDF) for 10 min and blocked in 4% BSA (in PBS) or 10% milk (in TBS),
respectively, for 1h at RT. Membranes were washed again in PBS (or TBS) for 10 min and
incubated with the primary antibody for 1h at RT or O/N at 4°C. Nitrocellulose and PVDF
membranes were washed in PBS-T (6 x 5 min) or TBS-T (3 x 10 min) respectively, and
incubated with the secondary antibody (alkaline phosphatase or horseradish peroxidase-
conjugated) for 1h at RT. Membranes were then washed as above; PVDF membranes were
additionally washed with alkaline-phosphatase wash buffer for 5 min. Membranes were then
incubated with CDP-Star or SuperSignal West Pico Chemiluminescent substrates,
respectively, for 5 min at RT. Radiation was detected after several minutes exposure to an X-
ray film in the dark. When needed, nitrocellulose or PVDF membranes were stripped for 10
min in 0.2 M NaOH or for 1h in Stripping solution, respectively, then blocked and re-
incubated with another primary antibody. Quantification was performed by using Multi
Gauge 3.0 software.
3.4.5 High pressure liquid chromatography (HPLC) analysis
a) Sample preparation
Mice were sacrificed at the desired time point and 50 µl blood were immediately collected
from the heart and transferred in a 1.5 ml tube with 30 µl heparin (Cst: 25000 U/ml). To obtain
METHODS
33
plasma, blood was centrifuged at 400 x g for 10 min at 4°C and the resulting supernatant was
carefully collected. Blood was treated within 10 min from collection as described below. 60
µl were taken from the tube and supplemented with the following compounds:
1/10 vol acetic acid 4.35 M
1/10 vol 5-MOP 100 µM (in acetone)
10 volumes acetone
Samples were mixed by inversion 20 times, sonicated for 2 min and centrifuged at 12000 x g
for 7 min at 4°C. Then, 600 µl of the supernatant were collected and stored at -20°C.
Maximum 150 mg of the other organs were removed from the mouse, put in a 2 ml tube and
weighted. 1 volume of cold PBS was added and organs were homogenized with an electronic
pestle. Before the homogenization, organs (except brains) were cut in small pieces. Samples
were then vortexed for 2 min and the same amounts of compounds written above for blood
were added (volumes referred to the initial volume of the organ). Samples were then
processed as written for blood and eventually 600 µl of supernatant was stored at -20°C. All
organs were concentrated in the SpeedVac until 50-100 µl of the initial volume was left.
Samples were then re-suspended in 40-60 µl acetone (20 µl step-wise, mixing) and
centrifuged at 12000 x g for 5 min at 4°C to precipitate proteins. An accurately measured
portion of supernatant was collected and stored at -80°C for further HPLC analysis.
b) Calibration/ standard curves
Standard solutions of clofazimine, PAPTP, PAP-1, PCARBMTP and PEGME in acetonitrile
(in the concentration range of 0.1-20 µM) were analyzed by HPLC/UV as described below;
peak area at the maximum absorption wavelength (286 nm for clofazimine and 320 nm for
PAP-1 and its derivatives) was plotted against concentration to determine the correlation
between peak area and amount analyzed.
c) HPLC analysis
2 µl samples were analyzed by HPLC/UV (1290 Infinity LC System, Agilent Technologies)
using a reverse phase column (ZORBAX Extend-C18, 3.0 x 50 mm, 1.8 µm, Agilent
Technologies) and a UV diode array detector (190-500 nm). Water containing solvents A and
B were 0.1 % TFA and acetonitrile, respectively. The gradient for B for clofazimine, PAP-1
and derivatives was as follows: 10% for 0.5 min, from 10% to 100% in 4.5 min, 100% for 1
min; 0.6 ml/min flow rate. The eluate was preferentially detected at 286, 310 and 320 nm
(corresponding to absorbance of clofazimine, internal standard and PAP-1 and its derivatives,
METHODS
34
respectively). The temperature of the column was kept at 35°C. I established the procedure in
Padua (Italy) and later sent the samples, prepared as described in a), to be analyzed.
d) Recovery yields
To establish the recovery yields of clofazimine and PAP-1 derivatives from blood and organs,
the sample preparation protocols for blood or tissues were applied to samples spiked with a
known amount of clofazimine or PAP-1 derivative. 1 ml blood from untreated animal was
spiked with 5 nmoles clofazimine or PAP-1 derivative (dilution from a 1000x stock solution
in DMSO). 100 µl aliquots were then taken and processed as described above. 1 g of tissue
from untreated animal was mixed with 1 ml PBS containing 5 nmoles clofazimine or PAP-1
derivative (dilution from a 100X stock solution in DMSO), and homogenized. 200 mg
aliquots of the homogenate were taken and processed as mentioned above. Recoveries of
clofazimine, PAP-1, PAP-1 derivatives and internal standard were determined by the
Department of Biomedical Sciences in Padua (Italy) as described in (Azzolini M. et al 2014).
3.5 Cytometry techniques
3.5.1 Surface staining of cells
1 x 10⁶ cells were collected at 500 x g for 10 min at RT. Cells were then re-suspended in 1µg
of FITC labeled anti-Kv1.3 antibody in 50 µl DMEM w/o phenol red and w/o FCS for 1h in
ice at 4°C. After adding 350 µl of DMEM w/o phenol red and w/o FCS to the cells, Kv1.3
signal was detected at the FACS. FITC was excited with a 488-nm laser and detected at 525
nm in the FL1 channel using a BD CellQuest Pro software.
3.5.2 Detection of apoptosis by FITC-Annexin V staining
To detect apoptosis induced by different inhibitors, 5 x 10⁴ cells per well were seeded in a 12
well plate O/N at 37°C. The next day, cells were either treated with different compounds or
left untreated. At the desired time points, supernatant were collected and cells were
trypsinized after gently washing once in PBS. Trypsinized cells were collected in 1 ml
medium and added to the supernatants, centrifuged at 500 x g for 5 min at 4°C and washed
once in 1 ml Annexin V wash buffer as above. Pellets were then incubated with FITC-
Annexin V FLUOS (1:100 in Annexin V wash buffer) for 15 min at RT in the dark. 200 µl
Annexin V wash buffer were added, the samples transferred to FACS tubes and analyzed at
the FACS Calibur. FITC was excited by using a 488-nm laser and detected at 525 nm (FL1)
through a BD CellQuest Pro software.
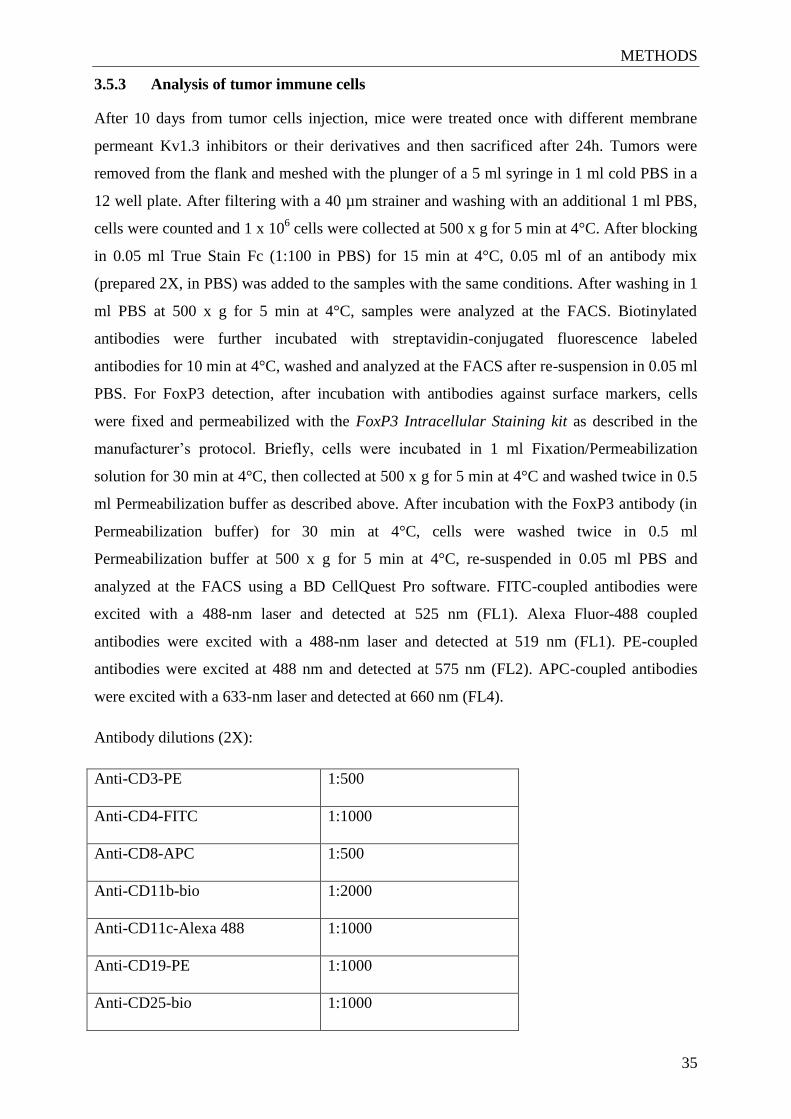
METHODS
35
3.5.3 Analysis of tumor immune cells
After 10 days from tumor cells injection, mice were treated once with different membrane
permeant Kv1.3 inhibitors or their derivatives and then sacrificed after 24h. Tumors were
removed from the flank and meshed with the plunger of a 5 ml syringe in 1 ml cold PBS in a
12 well plate. After filtering with a 40 µm strainer and washing with an additional 1 ml PBS,
cells were counted and 1 x 10⁶ cells were collected at 500 x g for 5 min at 4°C. After blocking
in 0.05 ml True Stain Fc (1:100 in PBS) for 15 min at 4°C, 0.05 ml of an antibody mix
(prepared 2X, in PBS) was added to the samples with the same conditions. After washing in 1
ml PBS at 500 x g for 5 min at 4°C, samples were analyzed at the FACS. Biotinylated
antibodies were further incubated with streptavidin-conjugated fluorescence labeled
antibodies for 10 min at 4°C, washed and analyzed at the FACS after re-suspension in 0.05 ml
PBS. For FoxP3 detection, after incubation with antibodies against surface markers, cells
were fixed and permeabilized with the FoxP3 Intracellular Staining kit as described in the
manufacturer’s protocol. Briefly, cells were incubated in 1 ml Fixation/Permeabilization
solution for 30 min at 4°C, then collected at 500 x g for 5 min at 4°C and washed twice in 0.5
ml Permeabilization buffer as described above. After incubation with the FoxP3 antibody (in
Permeabilization buffer) for 30 min at 4°C, cells were washed twice in 0.5 ml
Permeabilization buffer at 500 x g for 5 min at 4°C, re-suspended in 0.05 ml PBS and
analyzed at the FACS using a BD CellQuest Pro software. FITC-coupled antibodies were
excited with a 488-nm laser and detected at 525 nm (FL1). Alexa Fluor-488 coupled
antibodies were excited with a 488-nm laser and detected at 519 nm (FL1). PE-coupled
antibodies were excited at 488 nm and detected at 575 nm (FL2). APC-coupled antibodies
were excited with a 633-nm laser and detected at 660 nm (FL4).
Antibody dilutions (2X):
Anti-CD3-PE
1:500
Anti-CD4-FITC
1:1000
Anti-CD8-APC
1:500
Anti-CD11b-bio
1:2000
Anti-CD11c-Alexa 488
1:1000
Anti-CD19-PE
1:1000
Anti-CD25-bio
1:1000
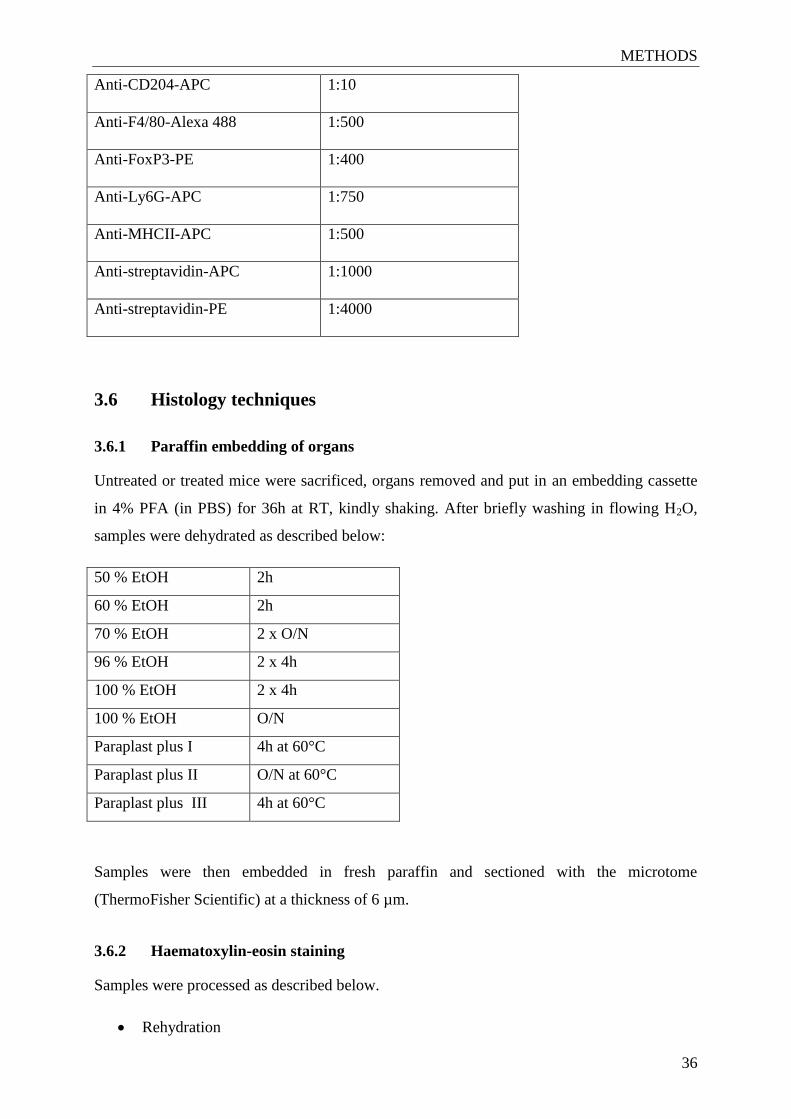
METHODS
36
Anti-CD204-APC
1:10
Anti-F4/80-Alexa 488
1:500
Anti-FoxP3-PE
1:400
Anti-Ly6G-APC
1:750
Anti-MHCII-APC
1:500
Anti-streptavidin-APC
1:1000
Anti-streptavidin-PE
1:4000
3.6 Histology techniques
3.6.1 Paraffin embedding of organs
Untreated or treated mice were sacrificed, organs removed and put in an embedding cassette
in 4% PFA (in PBS) for 36h at RT, kindly shaking. After briefly washing in flowing H2O,
samples were dehydrated as described below:
50 % EtOH 2h
60 % EtOH 2h
70 % EtOH 2 x O/N
96 % EtOH 2 x 4h
100 % EtOH 2 x 4h
100 % EtOH O/N
Paraplast plus I 4h at 60°C
Paraplast plus II O/N at 60°C
Paraplast plus III 4h at 60°C
Samples were then embedded in fresh paraffin and sectioned with the microtome
(ThermoFisher Scientific) at a thickness of 6 µm.
3.6.2 Haematoxylin-eosin staining
Samples were processed as described below.
Rehydration
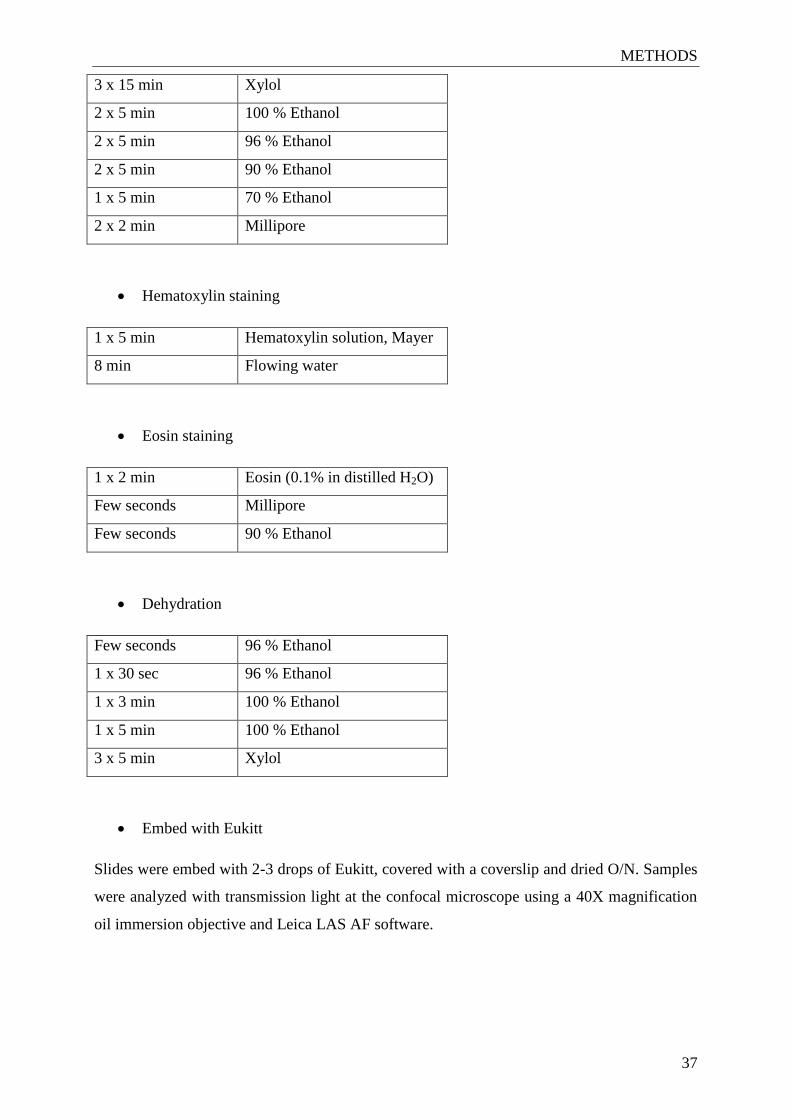
METHODS
37
3 x 15 min Xylol
2 x 5 min 100 % Ethanol
2 x 5 min 96 % Ethanol
2 x 5 min 90 % Ethanol
1 x 5 min 70 % Ethanol
2 x 2 min Millipore
Hematoxylin staining
1 x 5 min Hematoxylin solution, Mayer
8 min Flowing water
Eosin staining
1 x 2 min Eosin (0.1% in distilled H2O)
Few seconds Millipore
Few seconds 90 % Ethanol
Dehydration
Few seconds 96 % Ethanol
1 x 30 sec 96 % Ethanol
1 x 3 min 100 % Ethanol
1 x 5 min 100 % Ethanol
3 x 5 min Xylol
Embed with Eukitt
Slides were embed with 2-3 drops of Eukitt, covered with a coverslip and dried O/N. Samples
were analyzed with transmission light at the confocal microscope using a 40X magnification
oil immersion objective and Leica LAS AF software.
METHODS
38
3.6.3 Terminal deoxynucleotidyl transferase dUTP nick end labeling (TUNEL)
staining
To detect cell death within tissues, paraffin was removed and sections were re-hydrated as
written in the rehydration step of Hematoxylin-eosin staining. Then, samples were heated by
microwave in 0.1 M sodium citrate pH 6.0 at 350 W for 5 min. Samples were then washed 2 x
2 min in PBS and incubated with 50 µl of TUNEL reaction mixture, prepared as described by
the manufacturer of the In situ cell death detection kit, TMR red dUTP. Briefly, 4 parts
Labelling solution were mixed with 1 part Enzyme solution and added to 5 parts Buffer
solution. The staining was performed by incubating samples for 1h at 37°C in a humid
chamber. For positive control, slides were pre-incubated with 3000 U/ml DNAse (in 50 mM
Tris-HCl pH 7.5 and 1mg/ml BSA) for 10 min at RT. All slides were then washed 3 x 1 min
in PBS, heated for 10 min at 70°C in PBS, washed again for 1 min in PBS and covered with
12 µl Mowiol. A coverslip was applied and samples were stored at 4°C in the dark until
detection at the confocal microscope. TMRM was excited at 543 nm and detected between
570-630 nm. For bright field, transmission light was used. Images were detected with a 40X
magnification oil immersion objective using Leica LAS AF software.
3.7 Mitochondrial membrane potential and reactive oxygen species
(ROS) production measurements
MitoSOX Red reagent is a fluorogenic dye specifically targeted to mitochondria in living
cells. Oxidation of MitoSOX Red by superoxide produces red fluorescence.
Tetramethylrhodamine, methyl ester (TMRM) is a cell-permeant, cationic, red-orange
fluorescent dye that is readily sequestered by active mitochondria. To detect ROS production
and mitochondrial membrane potential changes upon incubation with inhibitors, 0.05 x 10⁶
cells were seeded on 24 mm round coverslip in a 6 well plate O/N. The coverslip was then
removed from the plate, placed in a sealed coverslip dish and incubated with 1 µM MitoSOX
Red reagent or 20 nM TMRM in 1 ml DMEM w/o phenol red and w/o FCS for 20 min at
37°C in the dark. Fluorescence was detected at the confocal microscope at t=0, then the
different compounds were added and a 45 min long kinetic was acquired every 3 min.
MitoSOX and TMRM were excited with a 543-nm laser and detected between 570-630 nm.
For bright images, transmission light was used. Images were acquired through a 40X
magnification oil immersion objective with a Leica SP5 confocal microscope and analyzed by
the LAS AF software.

METHODS
39
3.8 Transient transfection with siRNA
To transiently transfect cells with siRNA, 0.02 x 10⁶ cells per well were seeded in a 24 well
plate in complete medium O/N. Cells were then transfected using Lipofectamine 2000
Reagent as indicated by the manufacturer. Briefly, 2 µl Lipofectamine reagent and 1 µg
plasmid DNA (scramble-siRNA or siRNA for Kv1.3, Qiagen) per well were separately
diluted in 75 µl Opti-MEM medium and incubated for 5 min at RT. Diluted Lipofectamine
reagent was then gently added to the diluted DNA and incubated for 20 min at RT in the dark.
In the meanwhile, medium of the cells was changed to DMEM without (w/o) phenol red and
w/o FCS. Then, 150 µl DNA-lipid complexes were added drop by drop to the cells and
incubated for 4h at 37°C. Medium was then replaced with complete DMEM and cells were
incubated for 48h at 37°C. Cells were treated with different Kv1.3 inhibitors in DMEM w/o
phenol red and w/o FCS for the desired time, then incubated with FITC-Annexin V (1:150)
for 1h at 37°C and visualized at the fluorescence microscope with a 40X magnification oil
immersion objective. Excitation beam was 488 nm for FITC and 543 nm for Alexa 555. FITC
fluorescence was detected between 500-525 nm, whereas Alexa 555 was detected between
590-630 nm. The Leica LAS AF software was used to acquire the images.
3.9 Intracellular staining
For intracellular staining of cells, 3 x 10⁴ cells/well were seeded on 12 mm round coverslip in
a 24 well plate in 400 µl complete DMEM O/N. Cells were then washed 2 x PBS, fixed with
2% PFA/PBS for 15 min at RT and washed 3 x PBS. After permeabilization with 0.1%
Triton/PBS for 10 min, samples were washed 3 x PBS, blocked with 0.05% Tween/5%
FCS/PBS for 10 min at RT and washed 1 x PBS. After incubation with primary antibodies in
50 µl H/S+ 1% FCS for 45 min at RT, coverslips were washed 3 x PBS+ 0.05% Tween, 1 x
PBS and incubated with corresponding secondary antibodies coupled to fluorescent dyes in
H/S+ 1% FCS for 45 min in the dark at RT. After washing as described above for primary
antibodies, samples were embedded with 8 µl Mowiol. Signals were detected at the confocal
microscope with 100X magnification oil objective exciting with a 561 nm (Cy3) or 633 nm
(Dylight649) laser. Detection was done between 570-620 nm for Cy3 and between 650-750
nm for Dylight649. Leica LAS AF software was used to acquire the images.
3.10 Immunogold electron microscopy
For immunogold staining, 0.5 x 10⁶ cells/ well were seeded in a 22 cm
2 O/N. Cells were then
washed 1 x PBS and fixed in 2% PFA+ 0.1% glutaraldehyde in 0.1 M cacoldylate buffer for
METHODS
40
1h at RT. Samples were then washed 3 x 0.1 M cacodylate buffer, scraped and pelleted at 400
x g for 5 min at RT. Samples were further processed by the Imaging Center of Essen
(IMCES). Images were acquired by the IMCES with a Zeiss transmission electron microscope
(EM 902A).
3.11 In vivo techniques
3.11.1 Mice
All mice were 5-7 weeks old C57BL/6 wild-type mice.
3.11.2 Glioma injection
To perform glioma injection, GL261 cells were trypsinized from a sub-confluent flask and
collected in medium at 400 x g for 5 min at 4°C. Cells were then washed 2 x H/S as above
and re-suspended in H/S at a concentration of 2 x 10⁷ cells/ml. C57BL/6 mice were narcotized
i.p. with 10 µl/g mouse FMM (Fentanyl, Midazolam and Medetomidin) and a clear cut was
done with a scalpel on the head skin. A hole was drilled 2 mm lateral and 1 mm posterior to
the bregma of the skull. After fixing the animal within a stereotaxic instrument, 1 µl (2 x 10⁴
cells) cell suspension was injected in the striatum of the brain with a microliter syringe.
Mouse skin was then sewed and a subcutaneous injection of 10 µl/g mouse antidote (Naloxon,
Flumazenil and Atipamezol) was done. Mice were then monitored for glioma symptoms
daily.
3.11.3 Melanoma flank injection
To inject melanoma in the flank of the mouse, B16F10 cells were detached with 1 ml Cell
Dissociation buffer from a sub-confluent flask and collected at 400 x g for 5 min at 4°C. Cells
were then washed 2 x PBS as above and re-suspended in PBS at a concentration of 1 x 10⁶
cells/ml. Cells were divided in 50 µl aliquots (5 x 10⁴ cells/ mouse), carefully aspired in 1 ml
insulin syringe and injected subcutaneously in the flank of the mouse.
3.11.4 Mice treatments
Treatments with Kv1.3 inhibitors were performed at days 5, 7, 9 and 11 post tumor injection,
except where differently written. After dissolving in DMSO, drugs were administered
intraperitoneally in 100 µl 0.9 % NaCl or orally, directly dissolved at 4 mg/ml in peanut oil,
with a syringe connected to the appropriate needle. Mice were sacrificed at day 16 post tumor
injection to measure tumor size, except where differently specified. In survival experiments,
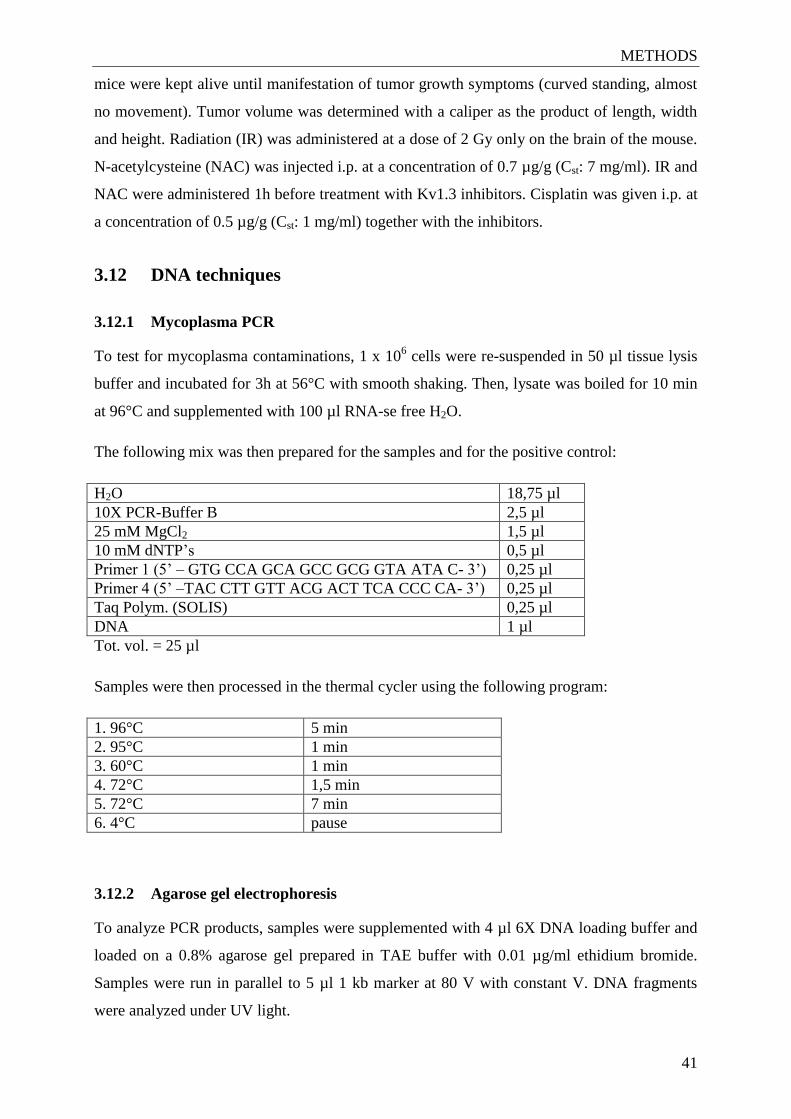
METHODS
41
mice were kept alive until manifestation of tumor growth symptoms (curved standing, almost
no movement). Tumor volume was determined with a caliper as the product of length, width
and height. Radiation (IR) was administered at a dose of 2 Gy only on the brain of the mouse.
N-acetylcysteine (NAC) was injected i.p. at a concentration of 0.7 µg/g (Cst: 7 mg/ml). IR and
NAC were administered 1h before treatment with Kv1.3 inhibitors. Cisplatin was given i.p. at
a concentration of 0.5 µg/g (Cst: 1 mg/ml) together with the inhibitors.
3.12 DNA techniques
3.12.1 Mycoplasma PCR
To test for mycoplasma contaminations, 1 x 10⁶ cells were re-suspended in 50 µl tissue lysis
buffer and incubated for 3h at 56°C with smooth shaking. Then, lysate was boiled for 10 min
at 96°C and supplemented with 100 µl RNA-se free H2O.
The following mix was then prepared for the samples and for the positive control:
H2O 18,75 µl
10X PCR-Buffer B 2,5 µl
25 mM MgCl2 1,5 µl
10 mM dNTP’s 0,5 µl
Primer 1 (5’ – GTG CCA GCA GCC GCG GTA ATA C- 3’) 0,25 µl
Primer 4 (5’ –TAC CTT GTT ACG ACT TCA CCC CA- 3’) 0,25 µl
Taq Polym. (SOLIS) 0,25 µl
DNA 1 µl
Tot. vol. = 25 µl
Samples were then processed in the thermal cycler using the following program:
1. 96°C 5 min
2. 95°C 1 min
3. 60°C 1 min
4. 72°C 1,5 min
5. 72°C 7 min
6. 4°C pause
3.12.2 Agarose gel electrophoresis
To analyze PCR products, samples were supplemented with 4 µl 6X DNA loading buffer and
loaded on a 0.8% agarose gel prepared in TAE buffer with 0.01 µg/ml ethidium bromide.
Samples were run in parallel to 5 µl 1 kb marker at 80 V with constant V. DNA fragments
were analyzed under UV light.

METHODS
42
3.13 Statistics
Data are shown as the mean ± SD. Since all values had a normal distribution, one-way
ANOVA and Bonferroni’s multiple comparison test were applied. Significances are indicated
by asterisks (* p≤0.05; ** p≤0.01; *** p≤0.001).
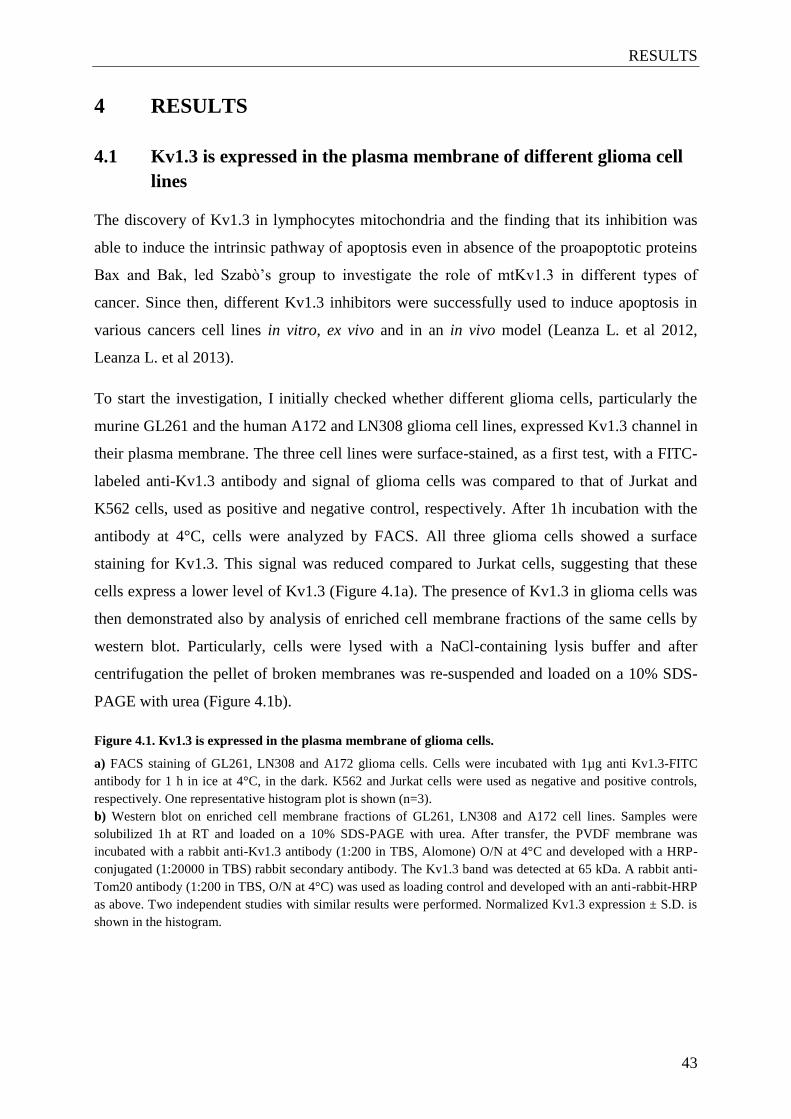
RESULTS
43
4 RESULTS
4.1 Kv1.3 is expressed in the plasma membrane of different glioma cell
lines
The discovery of Kv1.3 in lymphocytes mitochondria and the finding that its inhibition was
able to induce the intrinsic pathway of apoptosis even in absence of the proapoptotic proteins
Bax and Bak, led Szabò’s group to investigate the role of mtKv1.3 in different types of
cancer. Since then, different Kv1.3 inhibitors were successfully used to induce apoptosis in
various cancers cell lines in vitro, ex vivo and in an in vivo model (Leanza L. et al 2012,
Leanza L. et al 2013).
To start the investigation, I initially checked whether different glioma cells, particularly the
murine GL261 and the human A172 and LN308 glioma cell lines, expressed Kv1.3 channel in
their plasma membrane. The three cell lines were surface-stained, as a first test, with a FITC-
labeled anti-Kv1.3 antibody and signal of glioma cells was compared to that of Jurkat and
K562 cells, used as positive and negative control, respectively. After 1h incubation with the
antibody at 4°C, cells were analyzed by FACS. All three glioma cells showed a surface
staining for Kv1.3. This signal was reduced compared to Jurkat cells, suggesting that these
cells express a lower level of Kv1.3 (Figure 4.1a). The presence of Kv1.3 in glioma cells was
then demonstrated also by analysis of enriched cell membrane fractions of the same cells by
western blot. Particularly, cells were lysed with a NaCl-containing lysis buffer and after
centrifugation the pellet of broken membranes was re-suspended and loaded on a 10% SDS-
PAGE with urea (Figure 4.1b).
Figure 4.1. Kv1.3 is expressed in the plasma membrane of glioma cells.
a) FACS staining of GL261, LN308 and A172 glioma cells. Cells were incubated with 1µg anti Kv1.3-FITC
antibody for 1 h in ice at 4°C, in the dark. K562 and Jurkat cells were used as negative and positive controls,
respectively. One representative histogram plot is shown (n=3).
b) Western blot on enriched cell membrane fractions of GL261, LN308 and A172 cell lines. Samples were
solubilized 1h at RT and loaded on a 10% SDS-PAGE with urea. After transfer, the PVDF membrane was
incubated with a rabbit anti-Kv1.3 antibody (1:200 in TBS, Alomone) O/N at 4°C and developed with a HRP-
conjugated (1:20000 in TBS) rabbit secondary antibody. The Kv1.3 band was detected at 65 kDa. A rabbit anti-
Tom20 antibody (1:200 in TBS, O/N at 4°C) was used as loading control and developed with an anti-rabbit-HRP
as above. Two independent studies with similar results were performed. Normalized Kv1.3 expression ± S.D. is
shown in the histogram.
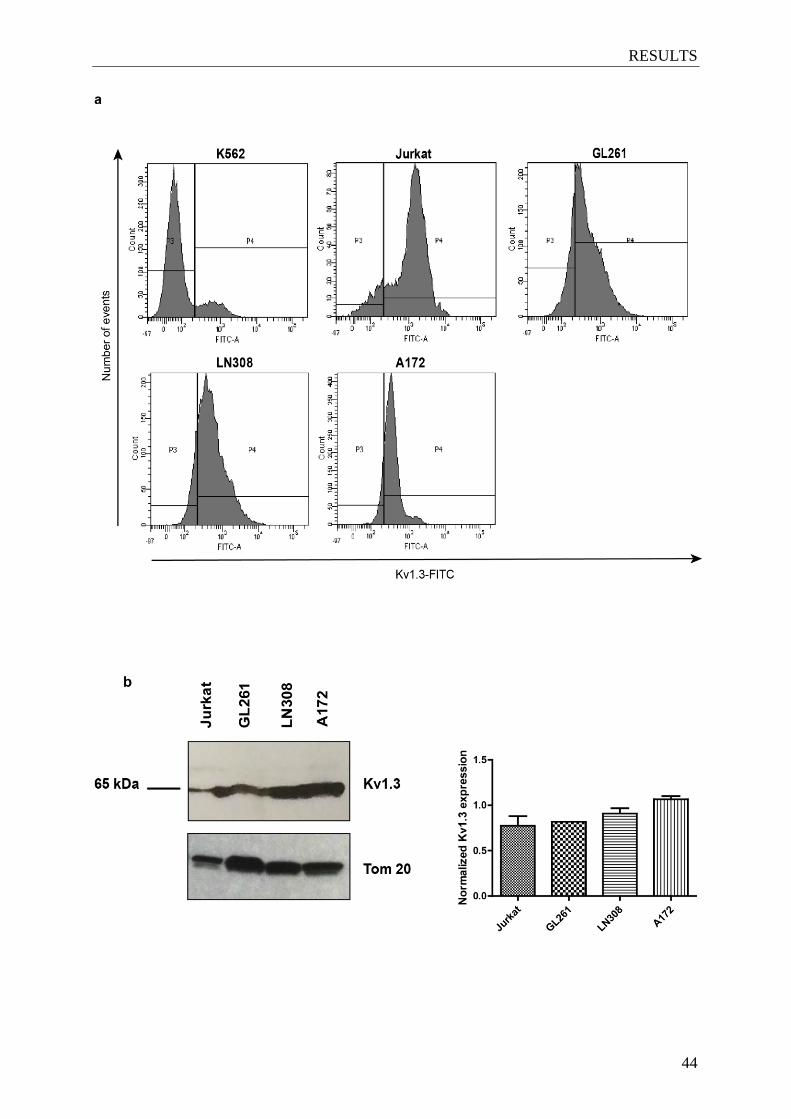
RESULTS
44
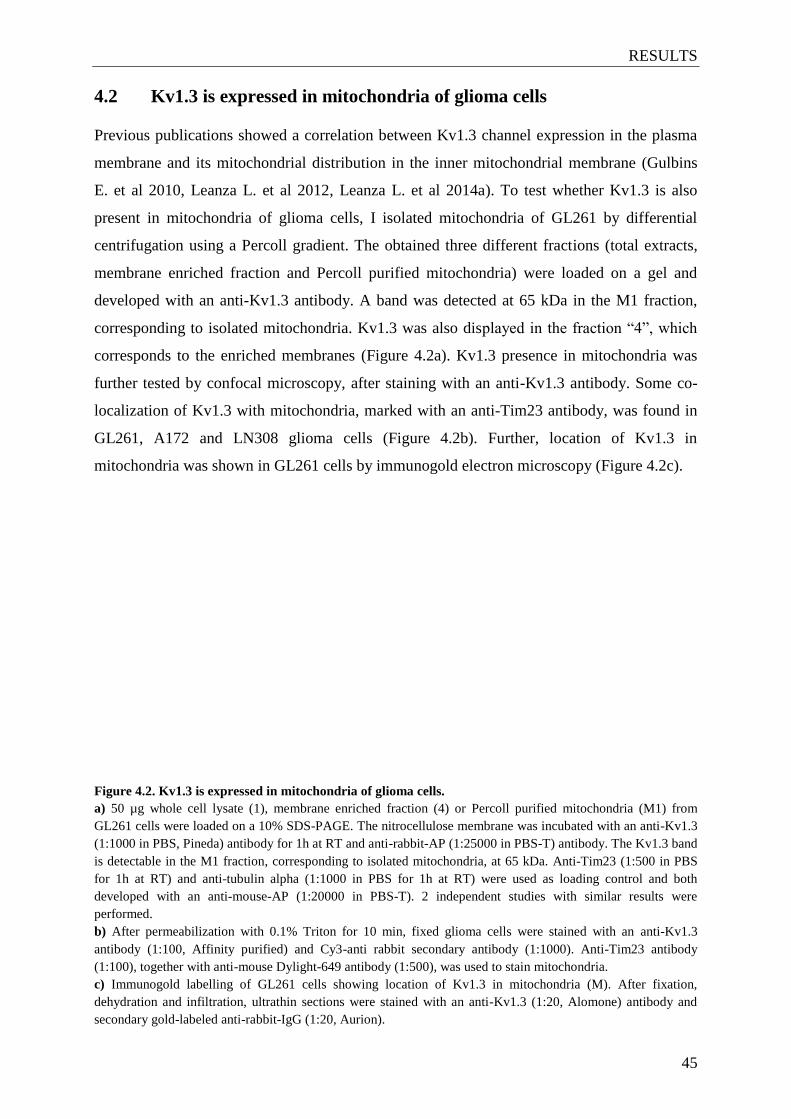
RESULTS
45
4.2 Kv1.3 is expressed in mitochondria of glioma cells
Previous publications showed a correlation between Kv1.3 channel expression in the plasma
membrane and its mitochondrial distribution in the inner mitochondrial membrane (Gulbins
E. et al 2010, Leanza L. et al 2012, Leanza L. et al 2014a). To test whether Kv1.3 is also
present in mitochondria of glioma cells, I isolated mitochondria of GL261 by differential
centrifugation using a Percoll gradient. The obtained three different fractions (total extracts,
membrane enriched fraction and Percoll purified mitochondria) were loaded on a gel and
developed with an anti-Kv1.3 antibody. A band was detected at 65 kDa in the M1 fraction,
corresponding to isolated mitochondria. Kv1.3 was also displayed in the fraction “4”, which
corresponds to the enriched membranes (Figure 4.2a). Kv1.3 presence in mitochondria was
further tested by confocal microscopy, after staining with an anti-Kv1.3 antibody. Some co-
localization of Kv1.3 with mitochondria, marked with an anti-Tim23 antibody, was found in
GL261, A172 and LN308 glioma cells (Figure 4.2b). Further, location of Kv1.3 in
mitochondria was shown in GL261 cells by immunogold electron microscopy (Figure 4.2c).
Figure 4.2. Kv1.3 is expressed in mitochondria of glioma cells.
a) 50 µg whole cell lysate (1), membrane enriched fraction (4) or Percoll purified mitochondria (M1) from
GL261 cells were loaded on a 10% SDS-PAGE. The nitrocellulose membrane was incubated with an anti-Kv1.3
(1:1000 in PBS, Pineda) antibody for 1h at RT and anti-rabbit-AP (1:25000 in PBS-T) antibody. The Kv1.3 band
is detectable in the M1 fraction, corresponding to isolated mitochondria, at 65 kDa. Anti-Tim23 (1:500 in PBS
for 1h at RT) and anti-tubulin alpha (1:1000 in PBS for 1h at RT) were used as loading control and both
developed with an anti-mouse-AP (1:20000 in PBS-T). 2 independent studies with similar results were
performed.
b) After permeabilization with 0.1% Triton for 10 min, fixed glioma cells were stained with an anti-Kv1.3
antibody (1:100, Affinity purified) and Cy3-anti rabbit secondary antibody (1:1000). Anti-Tim23 antibody
(1:100), together with anti-mouse Dylight-649 antibody (1:500), was used to stain mitochondria.
c) Immunogold labelling of GL261 cells showing location of Kv1.3 in mitochondria (M). After fixation,
dehydration and infiltration, ultrathin sections were stained with an anti-Kv1.3 (1:20, Alomone) antibody and
secondary gold-labeled anti-rabbit-IgG (1:20, Aurion).
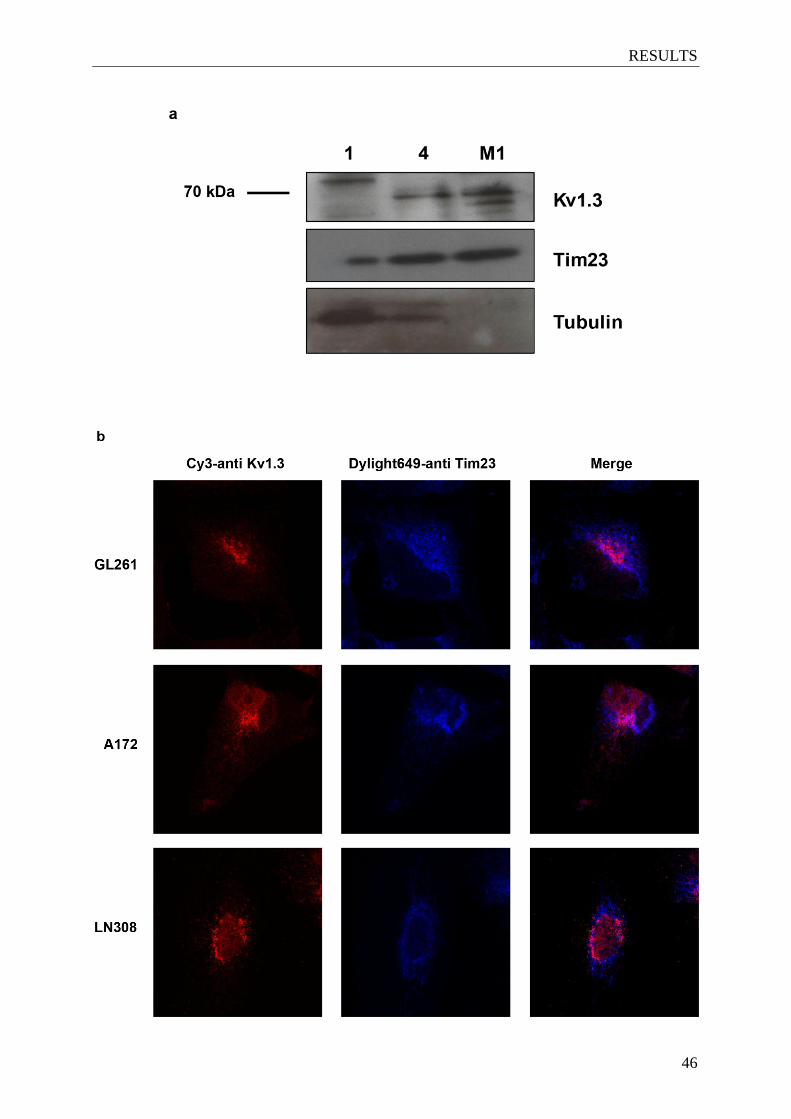
RESULTS
46
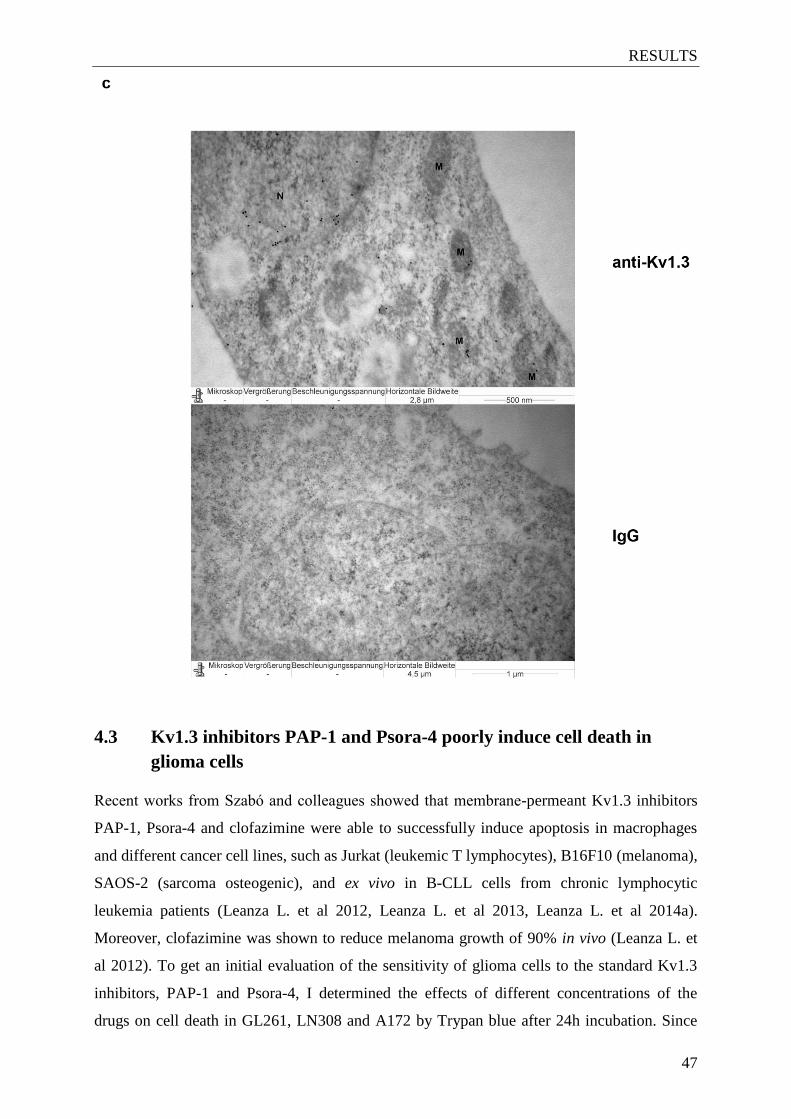
RESULTS
47
4.3 Kv1.3 inhibitors PAP-1 and Psora-4 poorly induce cell death in
glioma cells
Recent works from Szabό and colleagues showed that membrane-permeant Kv1.3 inhibitors
PAP-1, Psora-4 and clofazimine were able to successfully induce apoptosis in macrophages
and different cancer cell lines, such as Jurkat (leukemic T lymphocytes), B16F10 (melanoma),
SAOS-2 (sarcoma osteogenic), and ex vivo in B-CLL cells from chronic lymphocytic
leukemia patients (Leanza L. et al 2012, Leanza L. et al 2013, Leanza L. et al 2014a).
Moreover, clofazimine was shown to reduce melanoma growth of 90% in vivo (Leanza L. et
al 2012). To get an initial evaluation of the sensitivity of glioma cells to the standard Kv1.3
inhibitors, PAP-1 and Psora-4, I determined the effects of different concentrations of the
drugs on cell death in GL261, LN308 and A172 by Trypan blue after 24h incubation. Since

RESULTS
48
many tumor cells extrude drugs by multidrug resistance pumps (MDR), MDR pump inhibitors
(MDRi) Cyclosporine H (CSH) and probenecid were used in combination with Kv1.3
inhibitors to prevent export of the drugs from the intracellular milieu and, thus, amplify the
effect of Kv1.3 blockers. All three cell lines GL261 (Figure 4.3a), LN308 (Figure 4.3b) and
A172 (Figure 4.3c) were rather resistant to the treatments, which induced at most 20% more
cell death compared to the control.
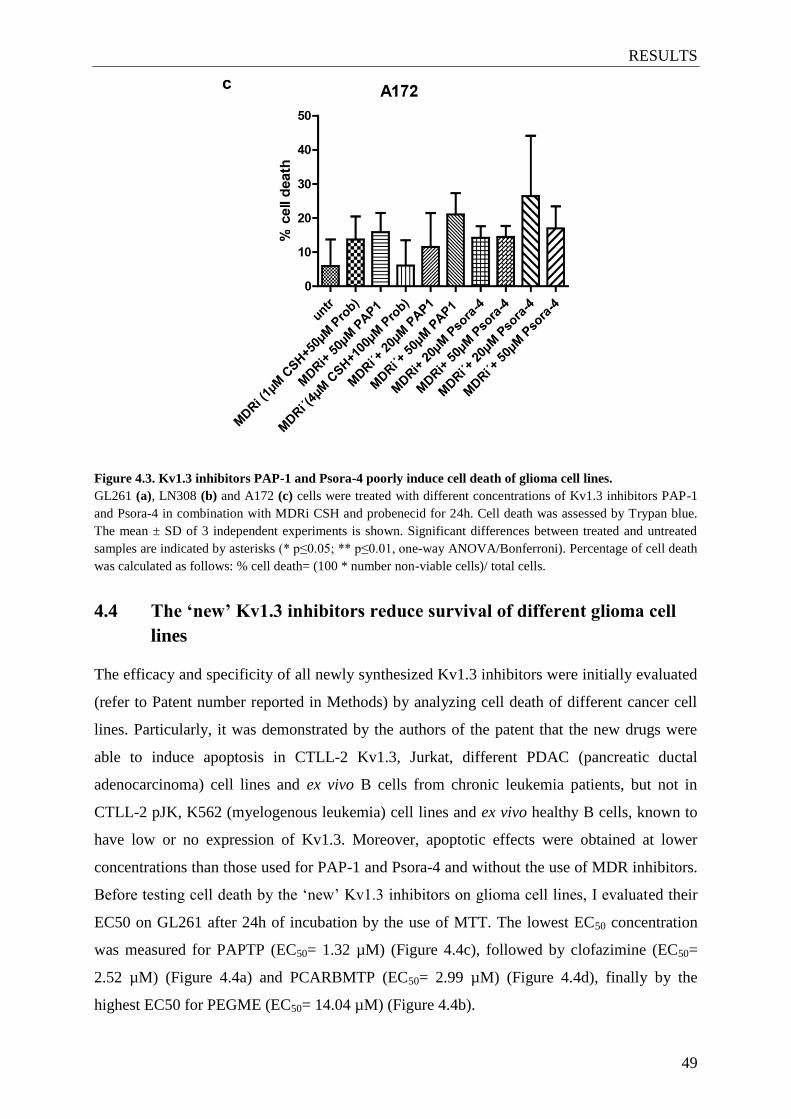
RESULTS
49
Figure 4.3. Kv1.3 inhibitors PAP-1 and Psora-4 poorly induce cell death of glioma cell lines.
GL261 (a), LN308 (b) and A172 (c) cells were treated with different concentrations of Kv1.3 inhibitors PAP-1
and Psora-4 in combination with MDRi CSH and probenecid for 24h. Cell death was assessed by Trypan blue.
The mean ± SD of 3 independent experiments is shown. Significant differences between treated and untreated
samples are indicated by asterisks (* p≤0.05; ** p≤0.01, one-way ANOVA/Bonferroni). Percentage of cell death
was calculated as follows: % cell death= (100 * number non-viable cells)/ total cells.
4.4 The ‘new’ Kv1.3 inhibitors reduce survival of different glioma cell
lines
The efficacy and specificity of all newly synthesized Kv1.3 inhibitors were initially evaluated
(refer to Patent number reported in Methods) by analyzing cell death of different cancer cell
lines. Particularly, it was demonstrated by the authors of the patent that the new drugs were
able to induce apoptosis in CTLL-2 Kv1.3, Jurkat, different PDAC (pancreatic ductal
adenocarcinoma) cell lines and ex vivo B cells from chronic leukemia patients, but not in
CTLL-2 pJK, K562 (myelogenous leukemia) cell lines and ex vivo healthy B cells, known to
have low or no expression of Kv1.3. Moreover, apoptotic effects were obtained at lower
concentrations than those used for PAP-1 and Psora-4 and without the use of MDR inhibitors.
Before testing cell death by the ‘new’ Kv1.3 inhibitors on glioma cell lines, I evaluated their
EC50 on GL261 after 24h of incubation by the use of MTT. The lowest EC50 concentration
was measured for PAPTP (EC50= 1.32 µM) (Figure 4.4c), followed by clofazimine (EC50=
2.52 µM) (Figure 4.4a) and PCARBMTP (EC50= 2.99 µM) (Figure 4.4d), finally by the
highest EC50 for PEGME (EC50= 14.04 µM) (Figure 4.4b).

RESULTS
50
Figure 4.4. EC50 of clofazimine and ‘new’ Kv1.3 inhibitors.
Gl261 cells were incubated with different concentrations of clofazimine (a) and the new Kv1.3 inhibitors
PEGME (b), PAPTP (c) and PCARBMTP (d). After 24h, cell survival was determined by MTT assay. The mean
± SD of 2 independent experiments is shown. The EC50 value was calculated by fitting the survival data of each
drug with a second-order exponential decay function. The results are shown as percentage values normalized to
the control.
Further, I evaluated the sensibility of glioma cell lines to clofazimine and PAP-1 derivatives
PEGME, PAPTP and PCARBMTP by measuring cell survival through MTT assay after 24h.
Staurosporine, a classical inducer of the endogenous apoptotic pathway, was used as positive
control. After treatment and incubation with MTT, absorbance was read at 490 nm. GL261
(Figure 4.5a), LN308 (Figure 4.5b) and A172 (Figure 4.5c) resulted to be sensitive to the
treatments, since all four inhibitors were able to induce a reduction of cell survival. A172 cell
line resulted to be more resistant compared to the other two glioma cell lines. Clofazimine
induced over 50% reduction of cell survival, even at the low dose of 1 M, in both GL261
and LN308. The most effective inhibitor PAPTP, as shown above to have the lowest EC50,
was able to reduce proliferation of A172 by almost 90%. PEGME seem to have a relevant
effect only if used at higher concentrations in combination with clofazimine. These results,
taken together, prove that the new Kv1.3 inhibitors PEGME, PAPTP and PCARBMTP induce
cell death of glioma cell lines.
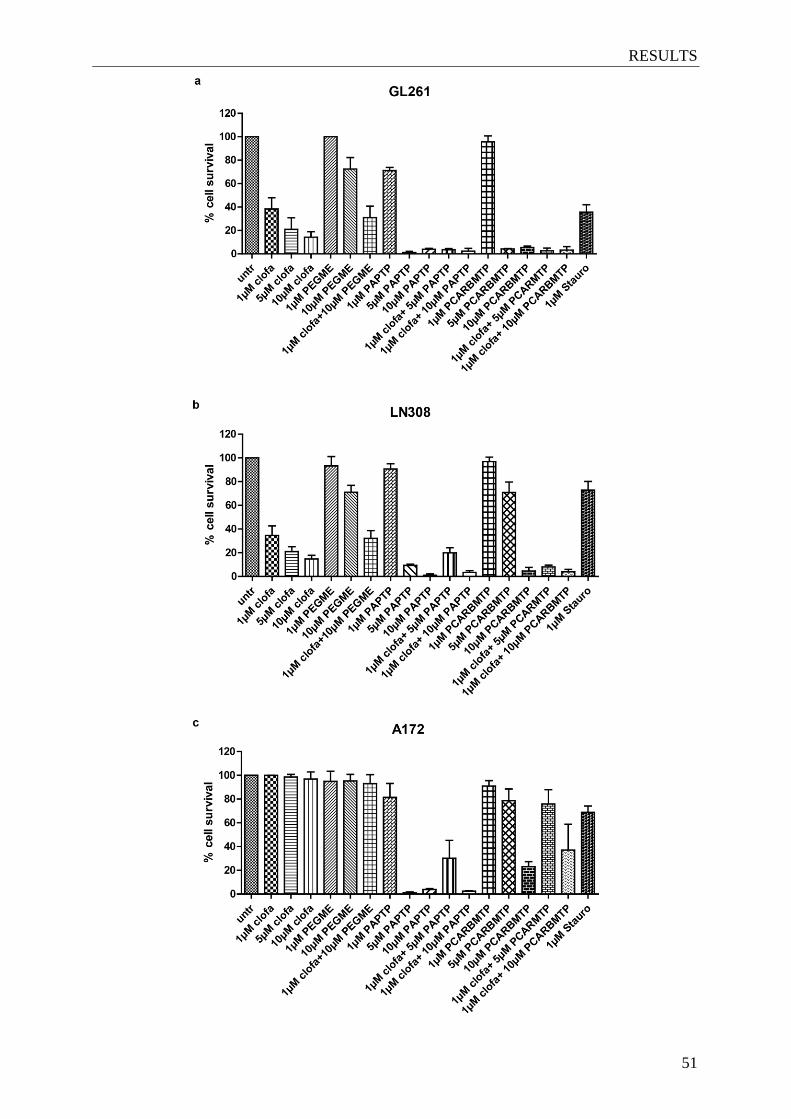
RESULTS
51
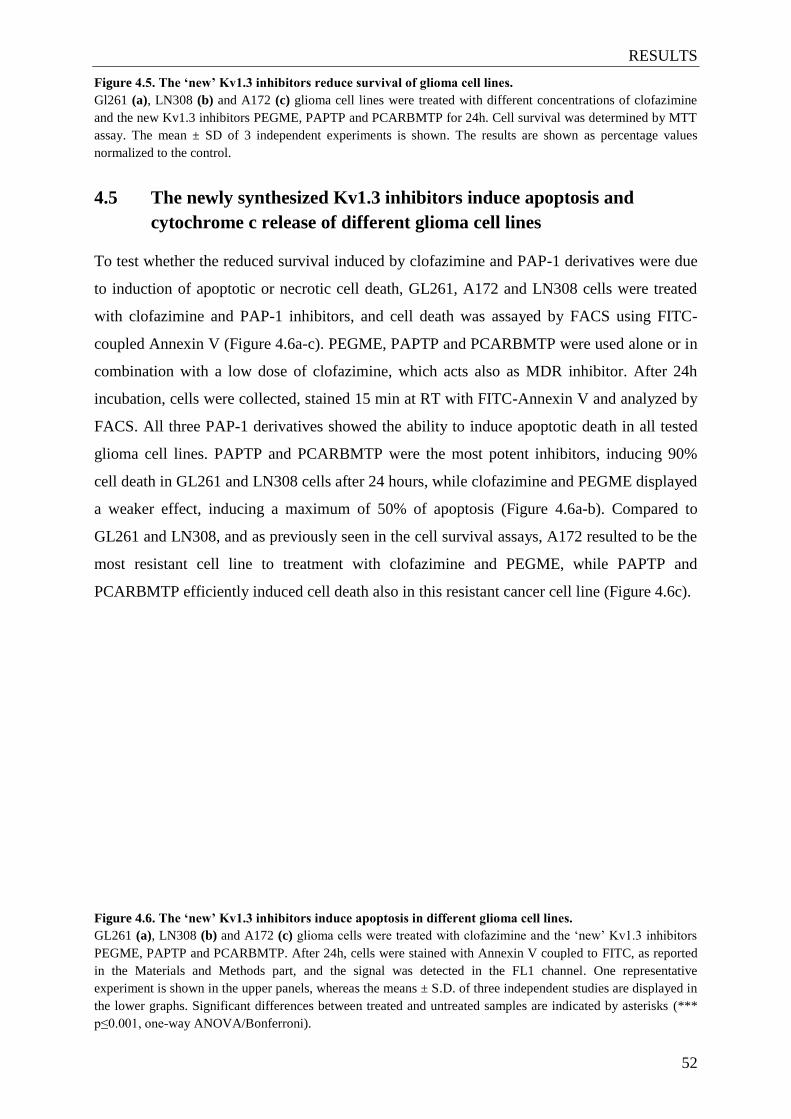
RESULTS
52
Figure 4.5. The ‘new’ Kv1.3 inhibitors reduce survival of glioma cell lines.
Gl261 (a), LN308 (b) and A172 (c) glioma cell lines were treated with different concentrations of clofazimine
and the new Kv1.3 inhibitors PEGME, PAPTP and PCARBMTP for 24h. Cell survival was determined by MTT
assay. The mean ± SD of 3 independent experiments is shown. The results are shown as percentage values
normalized to the control.
4.5 The newly synthesized Kv1.3 inhibitors induce apoptosis and
cytochrome c release of different glioma cell lines
To test whether the reduced survival induced by clofazimine and PAP-1 derivatives were due
to induction of apoptotic or necrotic cell death, GL261, A172 and LN308 cells were treated
with clofazimine and PAP-1 inhibitors, and cell death was assayed by FACS using FITC-
coupled Annexin V (Figure 4.6a-c). PEGME, PAPTP and PCARBMTP were used alone or in
combination with a low dose of clofazimine, which acts also as MDR inhibitor. After 24h
incubation, cells were collected, stained 15 min at RT with FITC-Annexin V and analyzed by
FACS. All three PAP-1 derivatives showed the ability to induce apoptotic death in all tested
glioma cell lines. PAPTP and PCARBMTP were the most potent inhibitors, inducing 90%
cell death in GL261 and LN308 cells after 24 hours, while clofazimine and PEGME displayed
a weaker effect, inducing a maximum of 50% of apoptosis (Figure 4.6a-b). Compared to
GL261 and LN308, and as previously seen in the cell survival assays, A172 resulted to be the
most resistant cell line to treatment with clofazimine and PEGME, while PAPTP and
PCARBMTP efficiently induced cell death also in this resistant cancer cell line (Figure 4.6c).
Figure 4.6. The ‘new’ Kv1.3 inhibitors induce apoptosis in different glioma cell lines.
GL261 (a), LN308 (b) and A172 (c) glioma cells were treated with clofazimine and the ‘new’ Kv1.3 inhibitors
PEGME, PAPTP and PCARBMTP. After 24h, cells were stained with Annexin V coupled to FITC, as reported
in the Materials and Methods part, and the signal was detected in the FL1 channel. One representative
experiment is shown in the upper panels, whereas the means ± S.D. of three independent studies are displayed in
the lower graphs. Significant differences between treated and untreated samples are indicated by asterisks (***
p≤0.001, one-way ANOVA/Bonferroni).
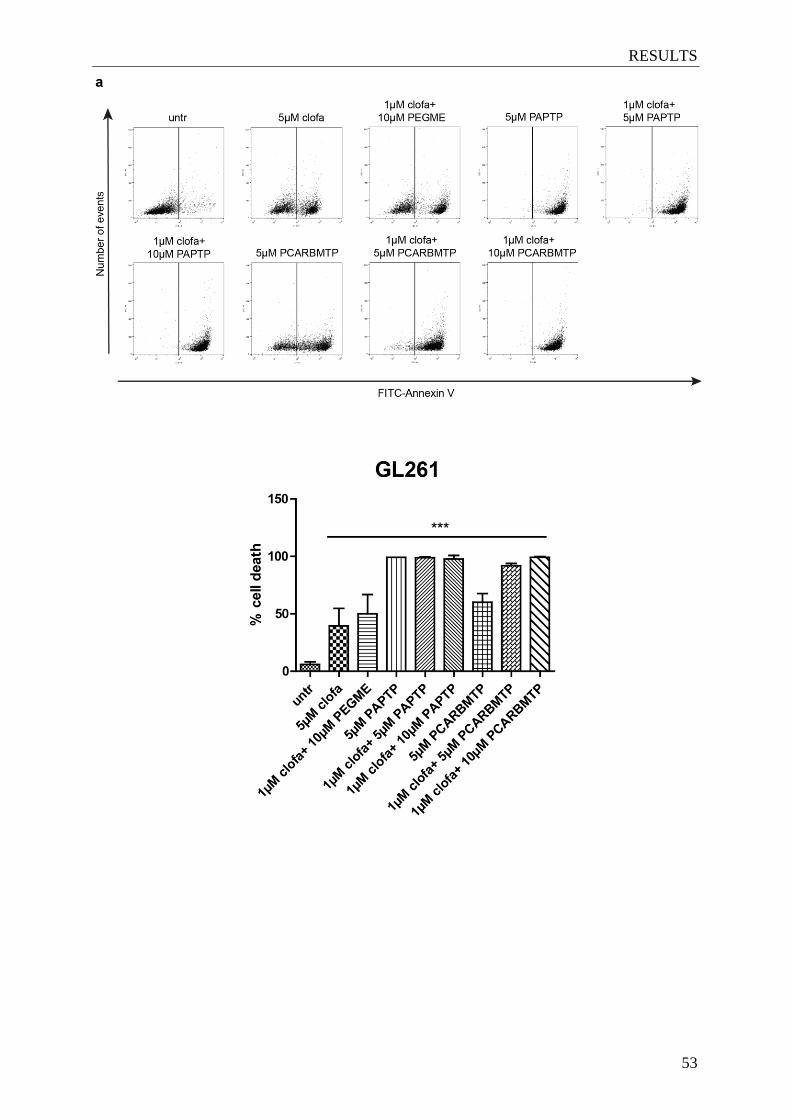
RESULTS
53

RESULTS
54
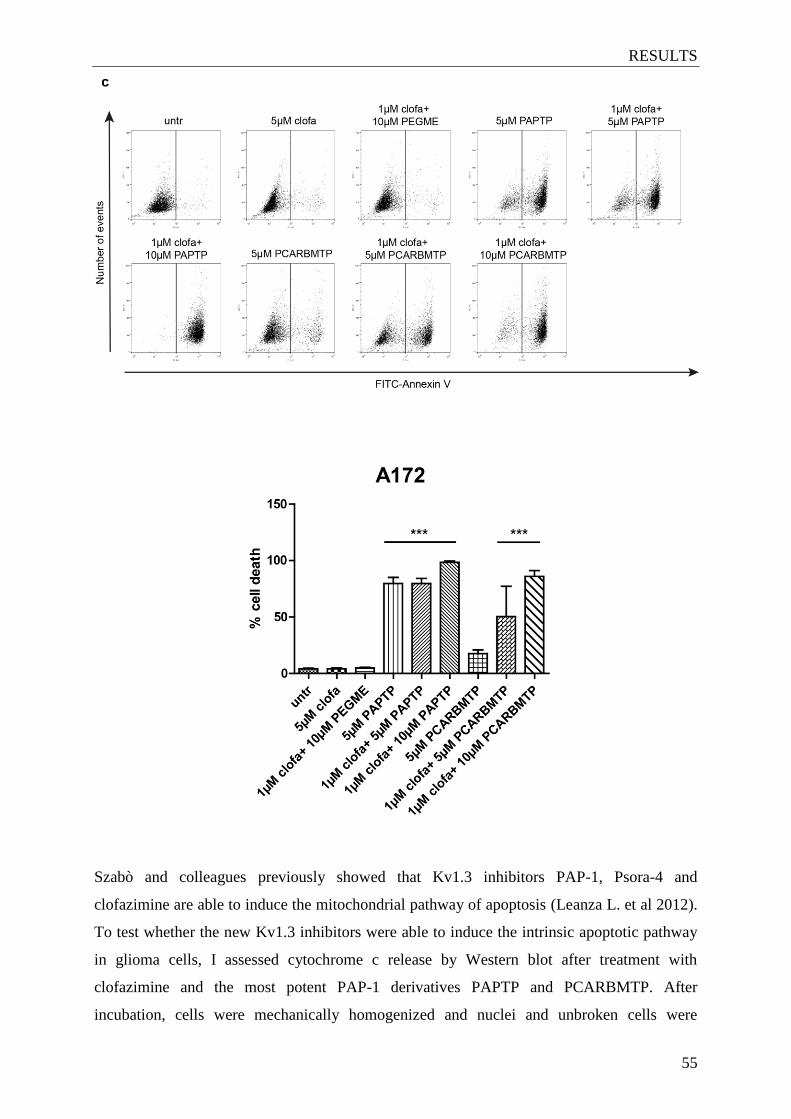
RESULTS
55
Szabò and colleagues previously showed that Kv1.3 inhibitors PAP-1, Psora-4 and
clofazimine are able to induce the mitochondrial pathway of apoptosis (Leanza L. et al 2012).
To test whether the new Kv1.3 inhibitors were able to induce the intrinsic apoptotic pathway
in glioma cells, I assessed cytochrome c release by Western blot after treatment with
clofazimine and the most potent PAP-1 derivatives PAPTP and PCARBMTP. After
incubation, cells were mechanically homogenized and nuclei and unbroken cells were
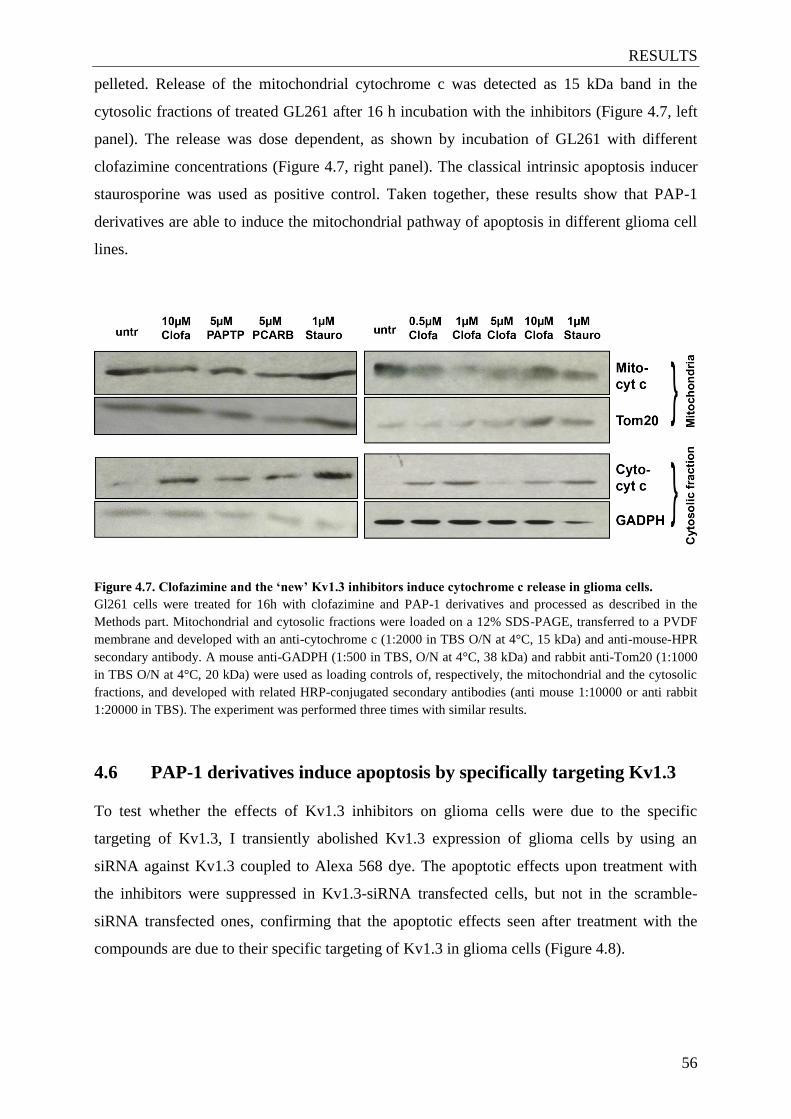
RESULTS
56
pelleted. Release of the mitochondrial cytochrome c was detected as 15 kDa band in the
cytosolic fractions of treated GL261 after 16 h incubation with the inhibitors (Figure 4.7, left
panel). The release was dose dependent, as shown by incubation of GL261 with different
clofazimine concentrations (Figure 4.7, right panel). The classical intrinsic apoptosis inducer
staurosporine was used as positive control. Taken together, these results show that PAP-1
derivatives are able to induce the mitochondrial pathway of apoptosis in different glioma cell
lines.
Figure 4.7. Clofazimine and the ‘new’ Kv1.3 inhibitors induce cytochrome c release in glioma cells.
Gl261 cells were treated for 16h with clofazimine and PAP-1 derivatives and processed as described in the
Methods part. Mitochondrial and cytosolic fractions were loaded on a 12% SDS-PAGE, transferred to a PVDF
membrane and developed with an anti-cytochrome c (1:2000 in TBS O/N at 4°C, 15 kDa) and anti-mouse-HPR
secondary antibody. A mouse anti-GADPH (1:500 in TBS, O/N at 4°C, 38 kDa) and rabbit anti-Tom20 (1:1000
in TBS O/N at 4°C, 20 kDa) were used as loading controls of, respectively, the mitochondrial and the cytosolic
fractions, and developed with related HRP-conjugated secondary antibodies (anti mouse 1:10000 or anti rabbit
1:20000 in TBS). The experiment was performed three times with similar results.
4.6 PAP-1 derivatives induce apoptosis by specifically targeting Kv1.3
To test whether the effects of Kv1.3 inhibitors on glioma cells were due to the specific
targeting of Kv1.3, I transiently abolished Kv1.3 expression of glioma cells by using an
siRNA against Kv1.3 coupled to Alexa 568 dye. The apoptotic effects upon treatment with
the inhibitors were suppressed in Kv1.3-siRNA transfected cells, but not in the scramble-
siRNA transfected ones, confirming that the apoptotic effects seen after treatment with the
compounds are due to their specific targeting of Kv1.3 in glioma cells (Figure 4.8).
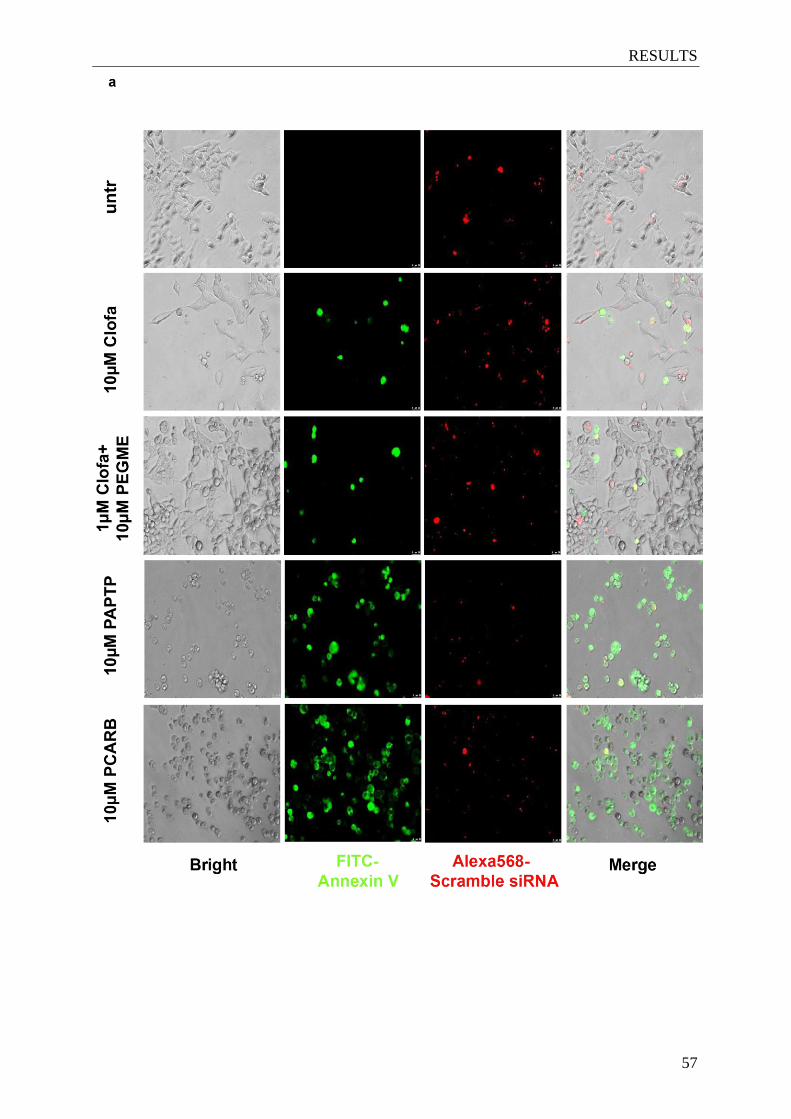
RESULTS
57
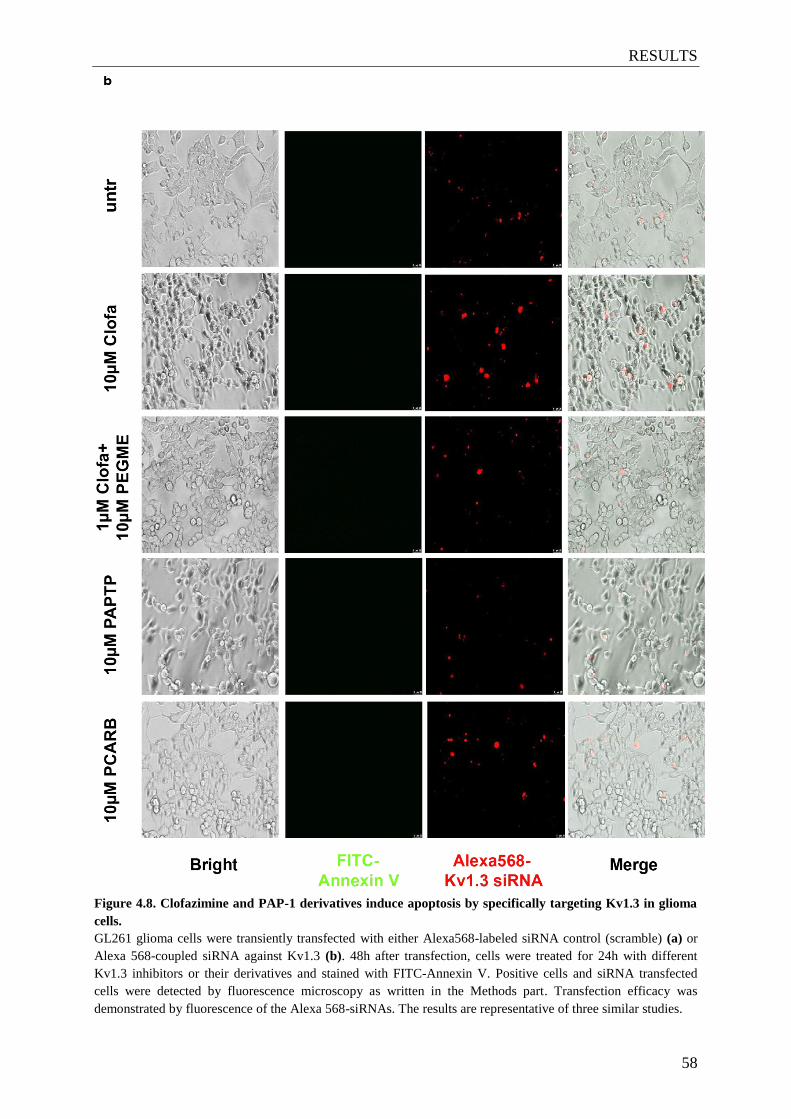
RESULTS
58
Figure 4.8. Clofazimine and PAP-1 derivatives induce apoptosis by specifically targeting Kv1.3 in glioma
cells.
GL261 glioma cells were transiently transfected with either Alexa568-labeled siRNA control (scramble) (a) or
Alexa 568-coupled siRNA against Kv1.3 (b). 48h after transfection, cells were treated for 24h with different
Kv1.3 inhibitors or their derivatives and stained with FITC-Annexin V. Positive cells and siRNA transfected
cells were detected by fluorescence microscopy as written in the Methods part. Transfection efficacy was
demonstrated by fluorescence of the Alexa 568-siRNAs. The results are representative of three similar studies.
RESULTS
59
4.7 Membrane permeant inhibitors cause ROS increase and
mitochondrial depolarization in glioma cells
Since membrane permeant inhibitors are expected to target the mtKv1.3 and previous studies
demonstrated the role of ROS in mitochondrial Kv1.3-mediated apoptosis (Szabo I. et al
2008), I studied the effect of clofazimine on mitochondrial ROS production and mitochondrial
membrane potential in GL261 glioma cells. After incubation with MitoSOX or TMRM dye,
the inhibitor was added and cells were monitored for 45 min. A time dependent enhancement
of MitoSOX fluorescence was detected in clofazimine treated GL261 but not in the control,
indicating an increase in mitochondrial ROS production induced by the blocking of the
channel (Figure 4.9a). Decrease in TMRM fluorescence after 30 min incubation with
clofazimine indicated Kv1.3 inhibition dependent- mitochondrial depolarization (Figure 4.9b).
Figure 4.9. Clofazimine induces mitochondrial ROS increase and mitochondrial depolarization in glioma
cells.
GL261 cells were incubated with either MitoSOX (a) or TMRM (b) for 20 min at 37°C in the dark. Then,
clofazimine was added at t=0 and a 45 min long kinetics was acquired by detecting MitoSOX or TMRM
fluorescence with confocal microscopy. The results are representative of two similar studies.
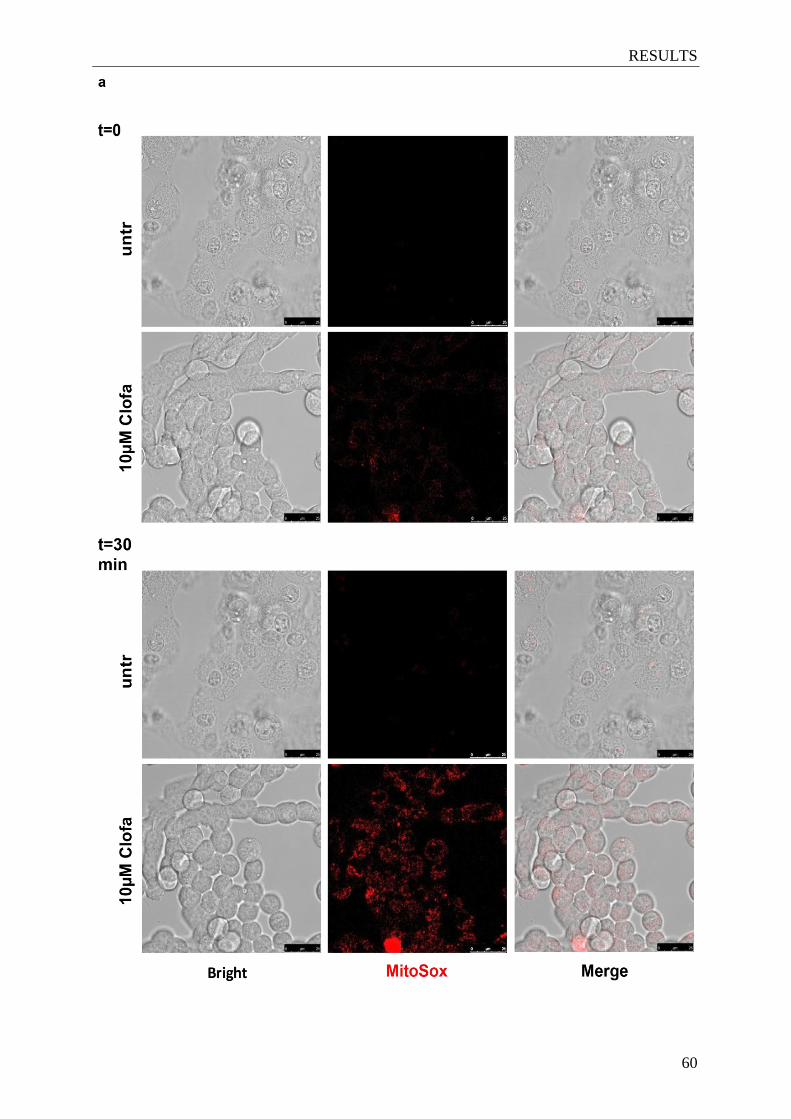
RESULTS
60
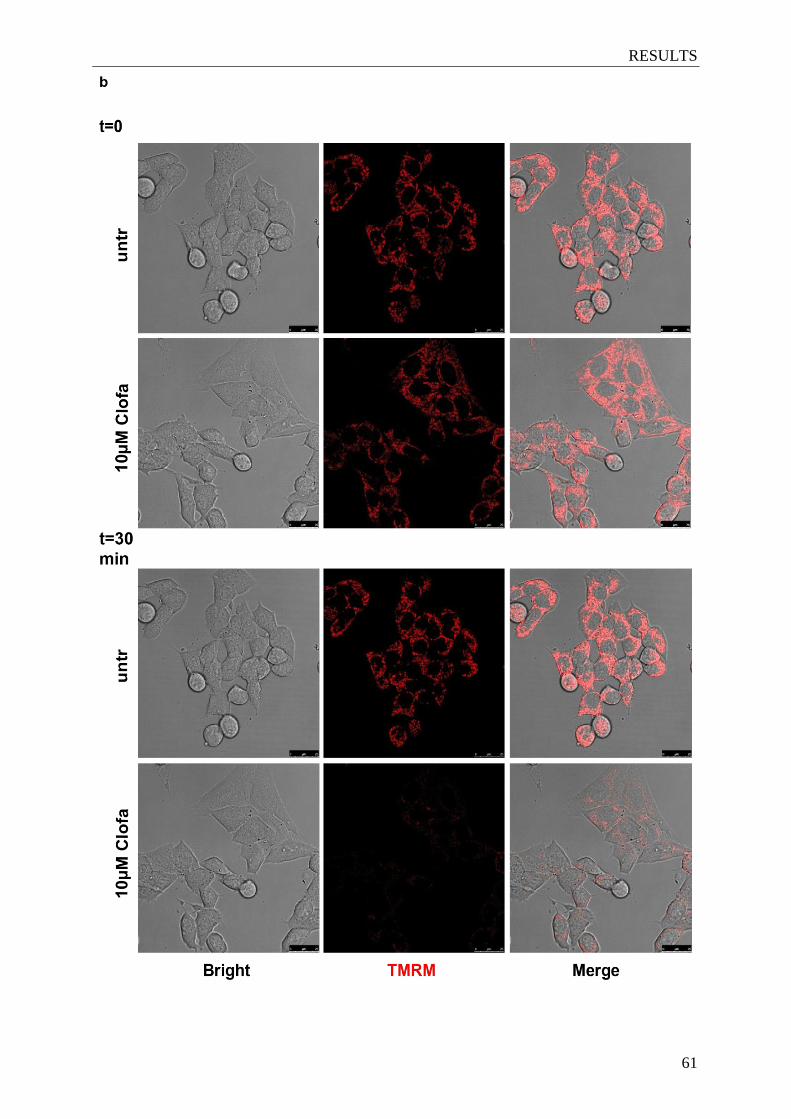
RESULTS
61

RESULTS
62
4.8 Clofazimine and PAP-1 derivatives do not reduce glioma growth
in vivo
To test whether clofazimine and PAP-1 derivatives are able to exert a cancer cell death effect
also in vivo, I used an established syngeneic model, which does not require a deficient
immune system and closely mimics growth characteristics of human GBM, including invasive
and angiogenic properties (Jacobs V.L. et al 2011). Clofazimine (10 nmol/g) and PAP-1
derivatives, PAPTP and PCARBMTP, were administered intraperitoneally (i.p.) at days 5, 7,
9 and 11 post tumor injection and a survival curve was assessed (Figure 4.10a-b). Treatment
with clofazimine was preceded by irradiation (2 Gy) to increase the permeability of the blood
brain barrier for the drug. Furthermore, clofazimine was also administrated p.o. Neither i.p.
and p.o. clofazimine nor the two PAP-1 derivatives were able to trigger a better survival rate
compared to the untreated mice (Figure 4.10a-b). Considering the death induced in vitro by
these compounds, an explanation for these negative results was suggested by the preliminary
HPLC data (Figure 4.10c). Glioma injected mice treated with clofazimine were sacrificed
after 2 h and compound amount in the brain, plasma and spleen was determined by HPLC. No
clofazimine was detected in the brain of treated animals, suggesting that the drug does not
reach the tumor tissues in vivo (Figure 4.10c). The same experiment was performed for
PAPTP as well, but no detectable peaks were available, indicating no accumulation in the
brain (not shown).
Figure 4.10. Clofazimine and PAP-1 derivatives do not reduce glioma growth in vivo.
a) Glioma injected mice were left untreated (n=6) or treated with 10 nmol/g i.p. clofazimine alone or in
combination with irradiation (IR, n=4). The mean of n independent experiments is reported in the graphs.
b) Glioma injected mice were left untreated (n=3) or treated with 20 nmol/g p.o. clofazimine (n=3), 4 nmol/g i.p.
PAPTP (n=3) or 8 nmol/g i.p. PCARBMTP (n=3) at days 5, 7, 9 and 11 post injection. The mean of n
independent experiments is reported in the graphs.
c) Glioma injected mice were treated with clofazimine i.p. or p.o. in DMSO or peanut oil at day 16 after tumor
injection. 2h after administration, mice were sacrificed and brain, blood and spleen were removed. After
processing as described in the Methods part, samples were analyzed by HPLC. The means ± SD (n=2) are
reported in the graphs. HPLC analysis was performed in Padua (Italy).

RESULTS
63
RESULTS
64
4.9 In vivo accumulation of clofazimine and PAP-1 derivatives in
different organs
According to previous results, I decided to test whether PAP-1 derivatives are able to reach
the different mouse organs, also to get a larger overview of Kv1.3 inhibitors accumulation in
vivo. For these reasons, I treated mice with PEGME plus low dose of clofazimine (as MDRi),
PAPTP, PCARBMTP or the precursor, PAP-1. After 2h, 4h or 8h post injection, mice were
sacrificed and blood, brain, heart, liver, spleen and kidney were removed, processed as written
in the Methods part and analyzed by HPLC (Figure 4.11a-d). PEGME was not detected in
treated mice while only clofazimine was revealed (Figure 4.11c). PCARBMTP, the pro-drug
compound, is not stable in blood and organs and is rapidly hydrolyzed to PAP-1-OH, which
has been detected by the HPLC already 2 h after mice injection (PAPOH, Figure 4.11b).
Contrarily, PAPTP, which is a stable drug, was detected in the samples of PAPTP treated
mice where present, but was quite fast eliminated by the body as shown in Figure 4.11a. None
of the compounds was present in the brain (Figure 4.11a-d). Almost no accumulation of the
four inhibitors was also seen in heart and blood. All four inhibitors were mostly present in
liver and kidney. From 2h to 8h, all derivatives concentration in tissues decreased, except for
clofazimine. In blood, PAPTP disappeared after 2h, PAP-1-OH after 4h, but not clofazimine
and PAP-1, which were present until 8h.
Figure 4.11. Clofazimine and PAP-1 derivatives in vivo accumulation in different organs.
Mice were treated once with i.p. 5 nmol/g PAPTP, 10 nmol/g PCARBMTP, 10 nmol/g PEGME+ 2 nmol/g
clofazimine or 20 nmol/g PAP-1 and sacrificed 2h, 4h or 8h post injection. Blood, brain, heart, liver, spleen and
kidney were collected and processed for HPLC analysis as described in Methods. Accumulation of PAPTP (a),
PCARBMTP (PAPOH) (b), clofazimine (c) and PAP-1 (d) are reported in the histograms as the mean ±SD of
three independent experiments. HPLC analysis was performed in Padua (Italy).
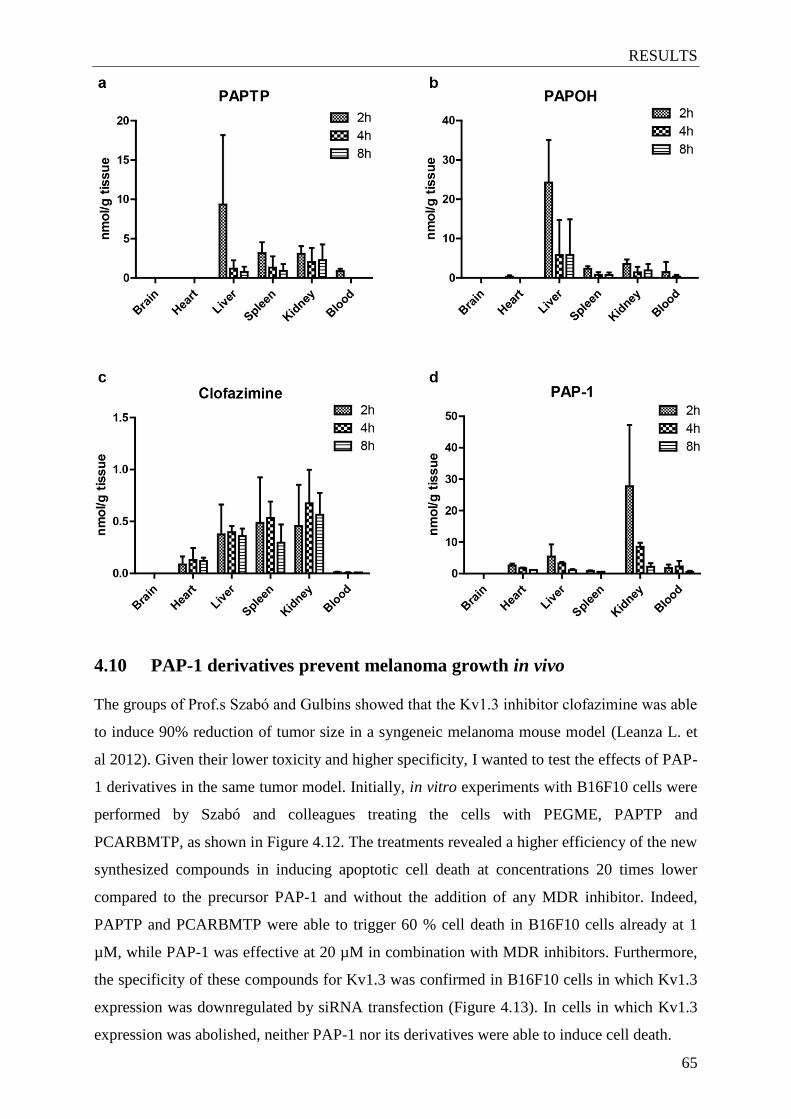
RESULTS
65
4.10 PAP-1 derivatives prevent melanoma growth in vivo
The groups of Prof.s Szabό and Gulbins showed that the Kv1.3 inhibitor clofazimine was able
to induce 90% reduction of tumor size in a syngeneic melanoma mouse model (Leanza L. et
al 2012). Given their lower toxicity and higher specificity, I wanted to test the effects of PAP-
1 derivatives in the same tumor model. Initially, in vitro experiments with B16F10 cells were
performed by Szabó and colleagues treating the cells with PEGME, PAPTP and
PCARBMTP, as shown in Figure 4.12. The treatments revealed a higher efficiency of the new
synthesized compounds in inducing apoptotic cell death at concentrations 20 times lower
compared to the precursor PAP-1 and without the addition of any MDR inhibitor. Indeed,
PAPTP and PCARBMTP were able to trigger 60 % cell death in B16F10 cells already at 1
µM, while PAP-1 was effective at 20 µM in combination with MDR inhibitors. Furthermore,
the specificity of these compounds for Kv1.3 was confirmed in B16F10 cells in which Kv1.3
expression was downregulated by siRNA transfection (Figure 4.13). In cells in which Kv1.3
expression was abolished, neither PAP-1 nor its derivatives were able to induce cell death.
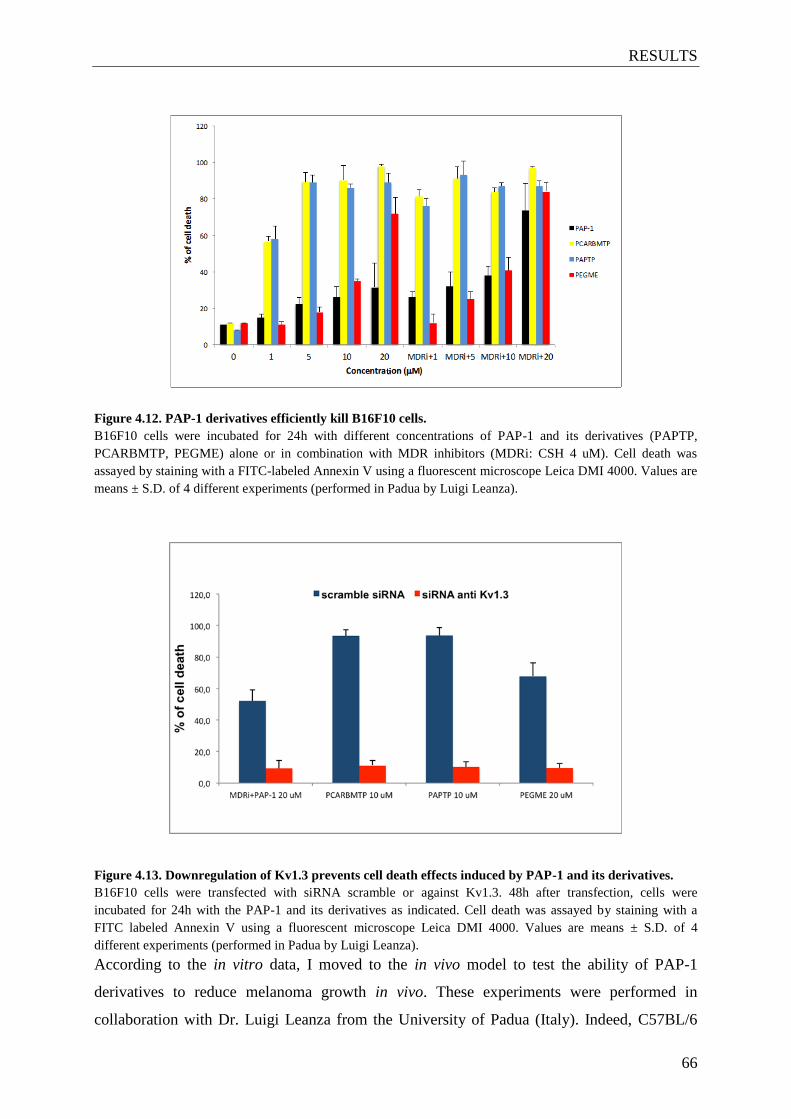
RESULTS
66
Figure 4.12. PAP-1 derivatives efficiently kill B16F10 cells.
B16F10 cells were incubated for 24h with different concentrations of PAP-1 and its derivatives (PAPTP,
PCARBMTP, PEGME) alone or in combination with MDR inhibitors (MDRi: CSH 4 uM). Cell death was
assayed by staining with a FITC-labeled Annexin V using a fluorescent microscope Leica DMI 4000. Values are
means ± S.D. of 4 different experiments (performed in Padua by Luigi Leanza).
Figure 4.13. Downregulation of Kv1.3 prevents cell death effects induced by PAP-1 and its derivatives.
B16F10 cells were transfected with siRNA scramble or against Kv1.3. 48h after transfection, cells were
incubated for 24h with the PAP-1 and its derivatives as indicated. Cell death was assayed by staining with a
FITC labeled Annexin V using a fluorescent microscope Leica DMI 4000. Values are means ± S.D. of 4
different experiments (performed in Padua by Luigi Leanza).
According to the in vitro data, I moved to the in vivo model to test the ability of PAP-1
derivatives to reduce melanoma growth in vivo. These experiments were performed in
collaboration with Dr. Luigi Leanza from the University of Padua (Italy). Indeed, C57BL/6
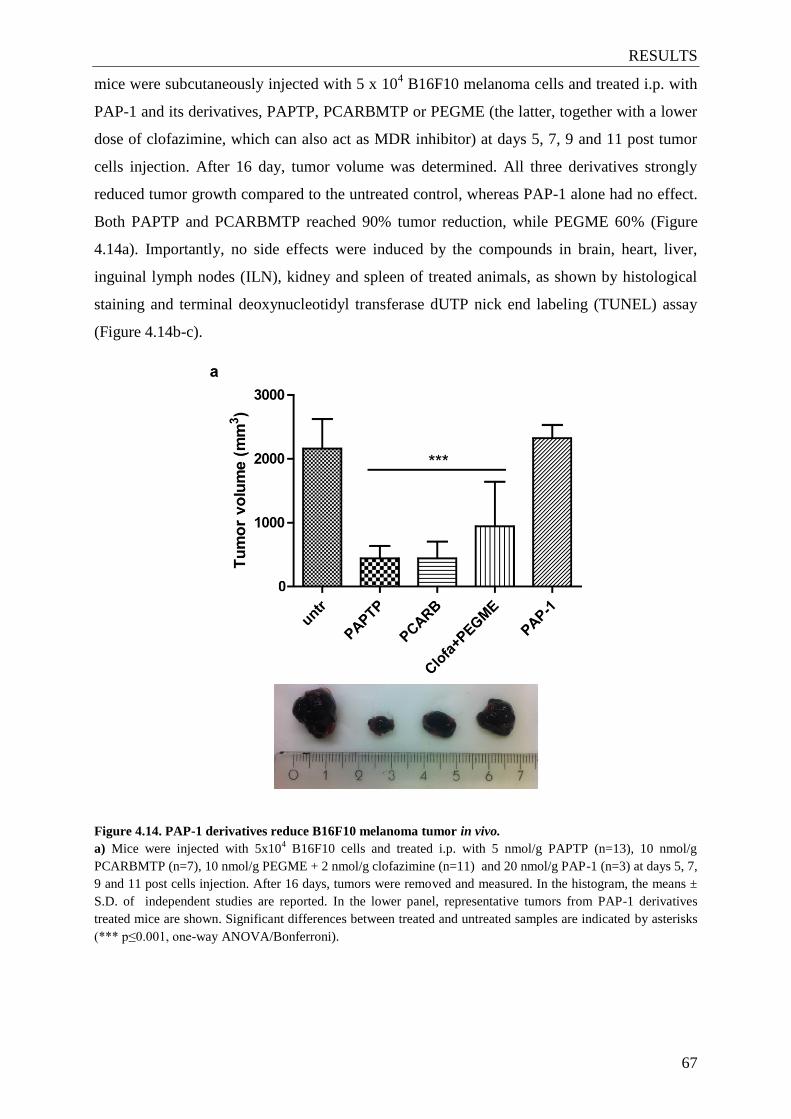
RESULTS
67
mice were subcutaneously injected with 5 x 10⁴ B16F10 melanoma cells and treated i.p. with
PAP-1 and its derivatives, PAPTP, PCARBMTP or PEGME (the latter, together with a lower
dose of clofazimine, which can also act as MDR inhibitor) at days 5, 7, 9 and 11 post tumor
cells injection. After 16 day, tumor volume was determined. All three derivatives strongly
reduced tumor growth compared to the untreated control, whereas PAP-1 alone had no effect.
Both PAPTP and PCARBMTP reached 90% tumor reduction, while PEGME 60% (Figure
4.14a). Importantly, no side effects were induced by the compounds in brain, heart, liver,
inguinal lymph nodes (ILN), kidney and spleen of treated animals, as shown by histological
staining and terminal deoxynucleotidyl transferase dUTP nick end labeling (TUNEL) assay
(Figure 4.14b-c).
Figure 4.14. PAP-1 derivatives reduce B16F10 melanoma tumor in vivo.
a) Mice were injected with 5x10⁴ B16F10 cells and treated i.p. with 5 nmol/g PAPTP (n=13), 10 nmol/g
PCARBMTP (n=7), 10 nmol/g PEGME + 2 nmol/g clofazimine (n=11) and 20 nmol/g PAP-1 (n=3) at days 5, 7,
9 and 11 post cells injection. After 16 days, tumors were removed and measured. In the histogram, the means ±
S.D. of independent studies are reported. In the lower panel, representative tumors from PAP-1 derivatives
treated mice are shown. Significant differences between treated and untreated samples are indicated by asterisks
(*** p≤0.001, one-way ANOVA/Bonferroni).

RESULTS
68
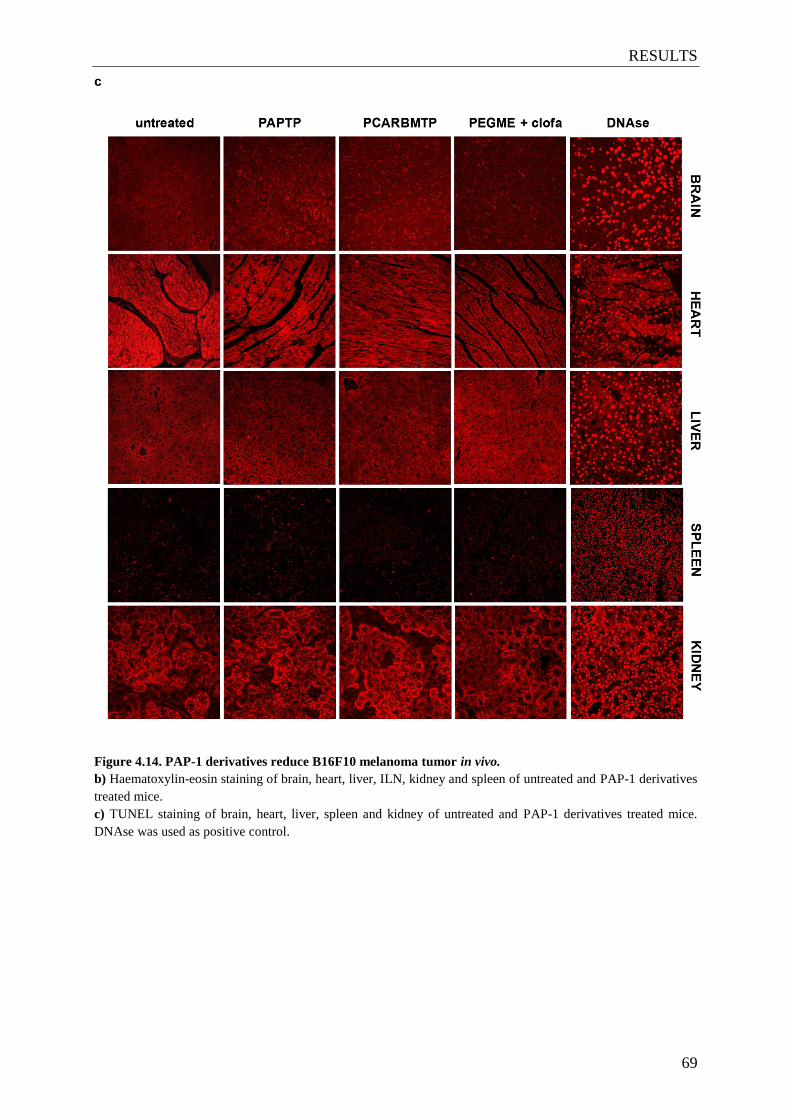
RESULTS
69
Figure 4.14. PAP-1 derivatives reduce B16F10 melanoma tumor in vivo.
b) Haematoxylin-eosin staining of brain, heart, liver, ILN, kidney and spleen of untreated and PAP-1 derivatives
treated mice.
c) TUNEL staining of brain, heart, liver, spleen and kidney of untreated and PAP-1 derivatives treated mice.
DNAse was used as positive control.
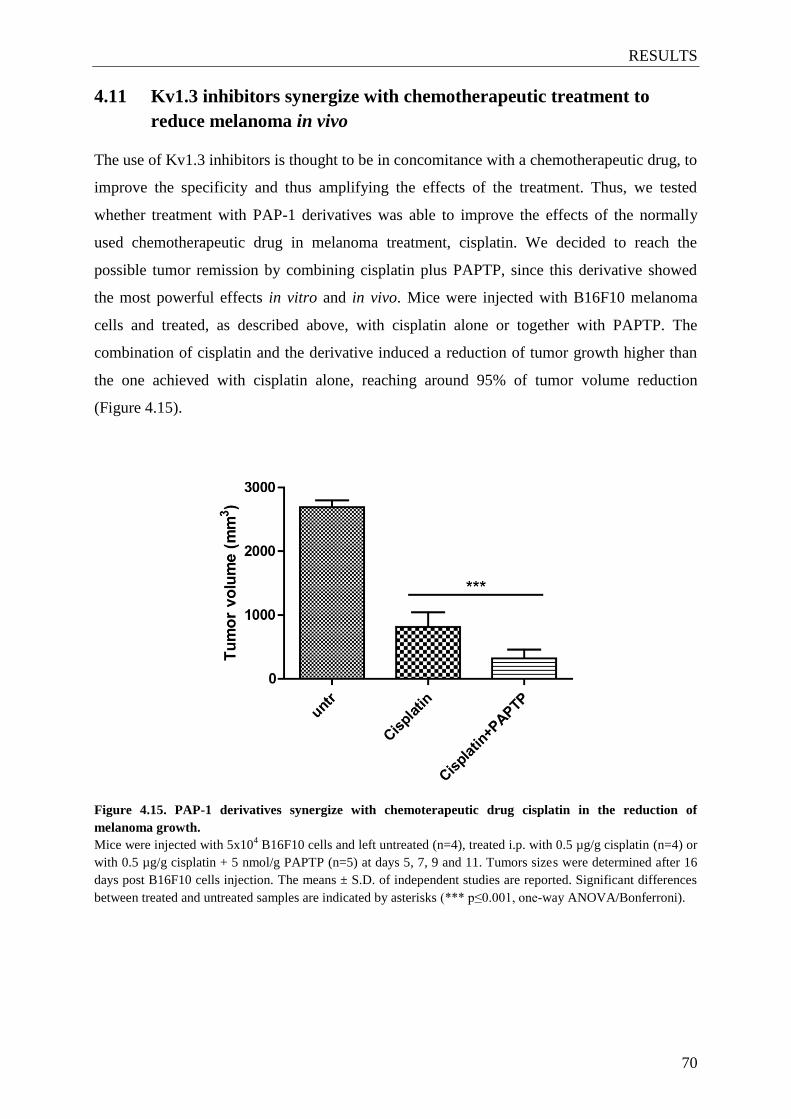
RESULTS
70
4.11 Kv1.3 inhibitors synergize with chemotherapeutic treatment to
reduce melanoma in vivo
The use of Kv1.3 inhibitors is thought to be in concomitance with a chemotherapeutic drug, to
improve the specificity and thus amplifying the effects of the treatment. Thus, we tested
whether treatment with PAP-1 derivatives was able to improve the effects of the normally
used chemotherapeutic drug in melanoma treatment, cisplatin. We decided to reach the
possible tumor remission by combining cisplatin plus PAPTP, since this derivative showed
the most powerful effects in vitro and in vivo. Mice were injected with B16F10 melanoma
cells and treated, as described above, with cisplatin alone or together with PAPTP. The
combination of cisplatin and the derivative induced a reduction of tumor growth higher than
the one achieved with cisplatin alone, reaching around 95% of tumor volume reduction
(Figure 4.15).
Figure 4.15. PAP-1 derivatives synergize with chemoterapeutic drug cisplatin in the reduction of
melanoma growth.
Mice were injected with 5x10⁴ B16F10 cells and left untreated (n=4), treated i.p. with 0.5 µg/g cisplatin (n=4) or
with 0.5 µg/g cisplatin + 5 nmol/g PAPTP (n=5) at days 5, 7, 9 and 11. Tumors sizes were determined after 16
days post B16F10 cells injection. The means ± S.D. of independent studies are reported. Significant differences
between treated and untreated samples are indicated by asterisks (*** p≤0.001, one-way ANOVA/Bonferroni).
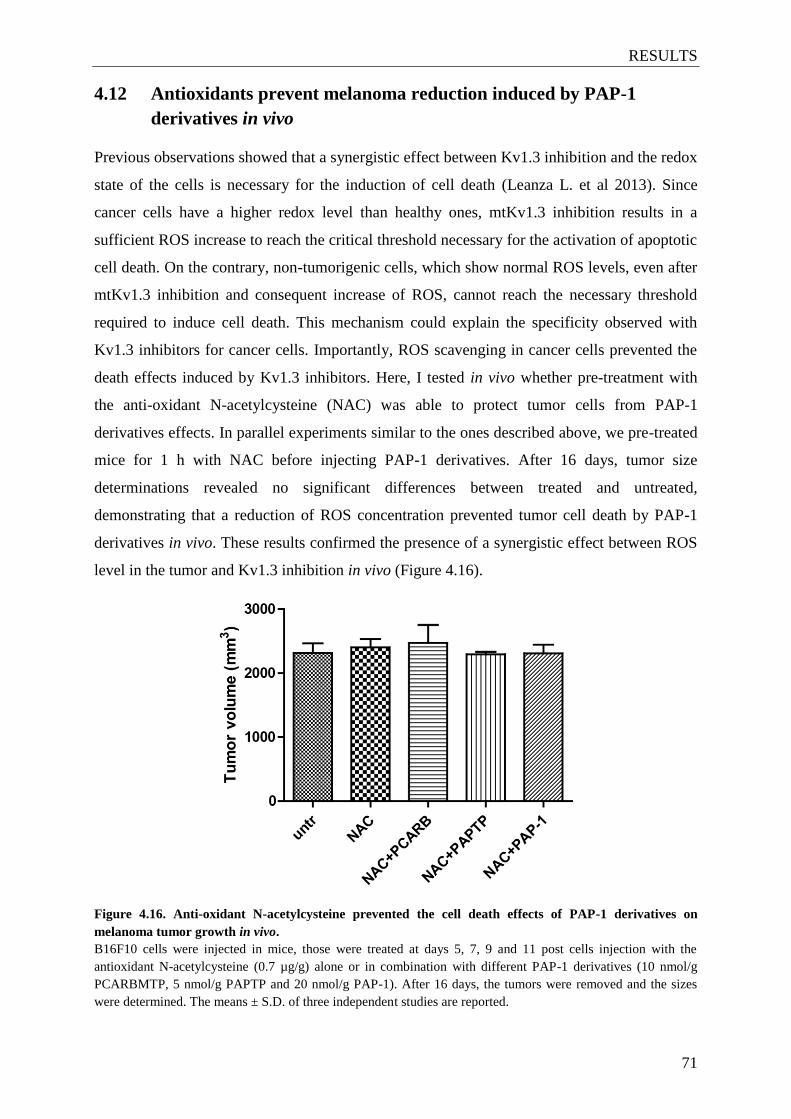
RESULTS
71
4.12 Antioxidants prevent melanoma reduction induced by PAP-1
derivatives in vivo
Previous observations showed that a synergistic effect between Kv1.3 inhibition and the redox
state of the cells is necessary for the induction of cell death (Leanza L. et al 2013). Since
cancer cells have a higher redox level than healthy ones, mtKv1.3 inhibition results in a
sufficient ROS increase to reach the critical threshold necessary for the activation of apoptotic
cell death. On the contrary, non-tumorigenic cells, which show normal ROS levels, even after
mtKv1.3 inhibition and consequent increase of ROS, cannot reach the necessary threshold
required to induce cell death. This mechanism could explain the specificity observed with
Kv1.3 inhibitors for cancer cells. Importantly, ROS scavenging in cancer cells prevented the
death effects induced by Kv1.3 inhibitors. Here, I tested in vivo whether pre-treatment with
the anti-oxidant N-acetylcysteine (NAC) was able to protect tumor cells from PAP-1
derivatives effects. In parallel experiments similar to the ones described above, we pre-treated
mice for 1 h with NAC before injecting PAP-1 derivatives. After 16 days, tumor size
determinations revealed no significant differences between treated and untreated,
demonstrating that a reduction of ROS concentration prevented tumor cell death by PAP-1
derivatives in vivo. These results confirmed the presence of a synergistic effect between ROS
level in the tumor and Kv1.3 inhibition in vivo (Figure 4.16).
Figure 4.16. Anti-oxidant N-acetylcysteine prevented the cell death effects of PAP-1 derivatives on
melanoma tumor growth in vivo.
B16F10 cells were injected in mice, those were treated at days 5, 7, 9 and 11 post cells injection with the
antioxidant N-acetylcysteine (0.7 µg/g) alone or in combination with different PAP-1 derivatives (10 nmol/g
PCARBMTP, 5 nmol/g PAPTP and 20 nmol/g PAP-1). After 16 days, the tumors were removed and the sizes
were determined. The means ± S.D. of three independent studies are reported.
RESULTS
72
4.13 PAP-1 derivatives do not change the composition of immune cell
sub-population within the tumor
PAP-1 derivatives were able to selectively eliminate cancer cells in vivo, without inducing
any side effect in different healthy organs. Nevertheless, I checked their possible effects on
the immune system cells, e.g. B and T lymphocytes and macrophages, which have also been
demonstrated to express functional Kv1.3. I verified the possible changes in the composition
of immune cells populations within the tumor of mice treated with PAP-1 and its derivatives,
separating by FACS using the staining from different and specific antibodies, the following
sub-populations of immune cells: T helper cells, cytotoxic T cells, B lymphocytes, regulatory
T cells (Treg), macrophages (M1/M2) and neutrophils. The analysis revealed no significant
differences in the number and in the distribution of the different sub-populations of immune
cells in treated mice compared to the controls (Figure 4.17). These data demonstrated that
PAP-1 derivatives specifically act targeting mtKv1.3 within the tumor cells, without affecting
the cells responsible for the immune surveillance.
Figure 4.17. PAP-1 derivatives treatment does not alter the immune cell sub-populations within the tumor.
B16F10 cells were injected in mice, which were treated once after 10 days post cells injection with PAPTP (5
nmol/g), PCARBMTP (10 nmol/g) or PAP-1 (20 nmol/g). After 24h, the tumor was removed, homogenized and
filtered. 1x10⁶ cells were collected and stained for the following sub-populations of immune cells: T helper
(CD3, CD4) or cytotoxic T cells (CD3, CD8) (a), B cells (CD19, MHCII) (b), Treg (CD4, CD25, FoxP3) (c),
M1/M2 macrophages (CD11b, F4/80, CD204) (d), neutrophils (CD11b, CD11c, Ly6G) (e). The numbers of the
different cell subpopulations were obtained by FACS analysis. The means ± S.D. of four independent studies are
reported. Results are shown as the fold change of the different populations in relation to the mean value of the
untreated.
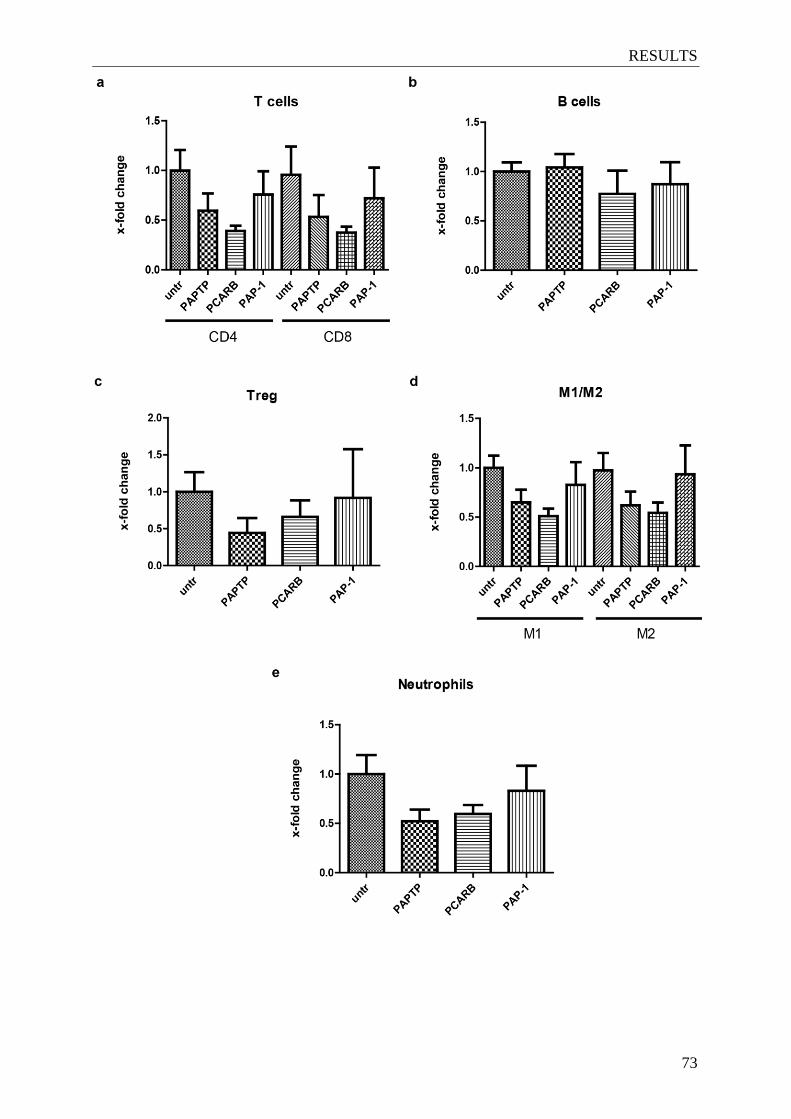
RESULTS
73
DISCUSSION
74
5 DISCUSSION
In the present study I showed that different derivatives of the membrane permeant Kv1.3
blocker PAP-1 are able to induce apoptosis in glioma cell lines and prevent melanoma growth
in vivo. After checking Kv1.3 presence in their mitochondria, I used the standard Kv1.3
inhibitors PAP-1, Psora-4 and clofazimine, or the newly synthesized PAP-1-derivatives
PEGME, PCARBMTP and PAPTP, to assess glioma cell lines for apoptotic cell death,
including the characteristics of the intrinsic pathway. To evaluate their efficacy on tumor
growth in vivo, I applied the new inhibitors to two kinds of syngeneic models, melanoma and
glioma. In concomitance, to gain insight into the drugs accumulation mechanism, I did a
pharmacokinetic analysis which helped me to explain the in vivo results.
5.1 Kv1.3 expression in glioma
The present study showed that glioma cell lines, in particular GL261 (murine), A172 and
LN308 (human), express Kv1.3 in their plasma membrane (PM) and mitochondria. To better
underline the presence of the channel in the PM, which displays -as all other channels- very
low concentrations compared to soluble proteins, I used a protocol which allows the
enrichment of the overall cell membrane fractions by eliminating the soluble portion of
proteins. Percoll-purified mitochondria analyzed by western blot demonstrated a significant
increase of Kv1.3 expression compared to total extracts and enriched membrane fraction from
the same samples. Some co-localization of Kv1.3 with mitochondria was shown by confocal
microscopy by using a mitochondrial marker (Tim23). To remove the background that arises
from overlapping emission wavelength, acquisition in the sequential scanning mode was
performed, which permits the separate detection of different channels fluorescence, which is
later added up. Biochemical observation was further confirmed by immunogold electron
microscopy, showing Kv1.3 in mitochondria of GL261 cells.
Few groups investigated Kv1.3 in glioma until now. My results are in accordance with
previous findings which showed Kv1.3 expression in a variety of glial tumors, beside
proliferative normal glial cells (Preussat K. et al 2003). Particularly, starting from the
knowledge that voltage-gated K+ channels (Kv) subtypes Kv1.3 and Kv1.5 contribute to
growth-related properties of normal glia (Attali B. et al 1997, Chittajallu R. et al 2002),
Preußat and colleagues conducted a screening of Kv1.3 and Kv1.5 channels expression in
different human glioma samples, demonstrating an inverse correlation with glioma
malignancy grades for Kv1.5 (e.g. high channel expression in low grade tumor), though no

DISCUSSION
75
correlation was found for Kv1.3 (Preussat K. et al 2003). These findings were also confirmed
by the group of Felipe, which showed an increased Kv1.5 expression in different human
cancers compared to the normal counterpart, whereas Kv1.3 level did not change, or was
either decreased (Bielanska J. et al 2009). In other tissues and tumor types, however, a
correlation was found. An upregulation of Kv1.3 gene expression was found in activated B-
like diffuse large B cell lymphoma by Alizadeh and colleagues (Alizadeh A.A. et al 2000). A
positive correlation between Kv1.3 expression level and breast cancer stage was also found
(Abdul M. et al 2003, Jang S.H. et al 2009). However, Brevet and colleagues found an inverse
correlation, where normal breast tissues expressed more Kv1.3 than the cancerous one (Brevet
M. et al 2008). Down-regulation of Kv1.3 in high grade tumor was also found in prostate
cancers and pancreatic adenocarcinomas (Abdul M. et al 2006, Brevet M. et al 2009).
This is the first study to put evidence on the mitochondrial presence of Kv1.3 in glioma cells,
which was not evaluated in the reverse-transcriptase studies of the previous group (Preussat
K. et al 2003). In accordance to my findings, other groups already suggested dual localization
of the protein, both in PM and mitochondria, in hippocampal cells, macrophages, breast
cancer MCF-7 and prostate cancer PC3 cell lines (Bednarczyk P. et al 2010, Gulbins E. et al
2010, Vicente R. et al 2006). However, the mechanism of dual targeting, and whether this is
used by other Kv channel types, is still not known. Until now, only Kv1.5 was reported to
display organellar localization but the exact site was not addressed (Bonnet S. et al 2007).
Potassium channels other than Kv1.3, including BKCa, IKCa and TASK-3, have also been
found to display a dual localization (De Marchi U. et al 2009, Kovacs I. et al 2005, Rusznak
Z. et al 2008, Xu W. et al 2002).
5.2 Induction of apoptosis through mtKv1.3 inhibition in different
glioma cell lines
I demonstrated that mitochondrial Kv1.3 (mtKv1.3) expressing glioma cells GL261, LN308
and A172 are not significantly susceptible to Kv1.3 standard inhibitors PAP-1 and Psora-4,
whereas undergo massive apoptosis when treated with the PAP-1 derivatives PEGME,
PCARBMTP and PAPTP. Compared to PAP-1 and Psora-4, which displayed minimal or no
induction of cell death up to 20 µM, PEGME, PCARBMTP and PAPTP showed higher
selectivity even at low concentrations (1 and 5 µM). Moreover, unlike PAP-1 and Psora-4
blockers, PAP-1 derivatives could exert their effect in absence of multidrug resistance pump
inhibitors (MDRi). Additional preliminary studies proved the new blockers selectivity up to
10 µM. Furthermore, they showed on different cancer cell lines that their effect was the same,

DISCUSSION
76
if not enhanced, when the derivatives were used without MDRi (see Patent in Materials and
Methods). The higher effectiveness of the new compounds, with respect to the standard
psoralens PAP-1 and Psora-4, has to be ascribed to their chemical properties, which improve
the problems of low water solubility and consequently need of high dosages, and target them
to the direct site, the mitochondria, by a positive charge attached. Indeed, the engineered
groups of the new inhibitors confer them, respectively, a better water solubility and a lower
partition coefficient (by the polyethylene glycol, PEG group, to PEGME), and the capability
to be targeted to mitochondria (by the tetraphenylphosphonium, TPP group, to PCARBMTP
and PAPTP), thus allowing a more efficient crossing of biological membranes and targeting
of the mitochondrial channel. Furthermore, the increased ability of PAPTP and PCARBMTP
to reach mitochondria also represents an advantage, since it avoids side effects that could arise
from drug accumulation in the plasma membrane or in other subcellular compartments where
the channel is present. Moreover, PCARBMTP has been developed as pro-drug: indeed, it has
a big TPP ion bound to PAP-1 by a carbamate linker, which can be hydrolyzed inside the cells
by esterase, thus releasing the free PAP-1 directly in the right site of action. Importantly, this
large modification leads to a lower affinity in Kv1.3 inhibition, hence decreasing its capability
to block the plasma membrane Kv1.3, thereby reducing its possible effects on immune system
cells. Nevertheless, PCARBMTP is more labile and less efficient compared to the more stable
PAPTP. Clofazimine needs to be discussed separately. Indeed, since clofazimine is also
working as MDR inhibitor (MDRi), it can reduce cell survival at lower concentrations than
the standard inhibitors PAP-1 and Psora-4. This drug can induce apoptosis also in other
manners than specific targeting the mtKv1.3, e.g. via direct caspase-3 activation or in a
phospholipase-dependent manner (Fukutomi Y. et al 2011, Van Rensburg C.E. et al 1994).
However, the apoptotic effect I saw after glioma cells treatment specifically depends on
Kv1.3 inhibition, since the siRNA downregulation of Kv1.3 prevents cell death upon
treatment with the compounds. Specificity for Kv1.3 was shown in the same experiment also
for all other newly synthesized inhibitors.
Regulation of apoptosis by voltage gated potassium (Kv) channels has already been shown in
rat retinal ganglion, where Kv1.1 or Kv1.3 siRNA transfection showed to greatly reduce
apoptosis after optic nerve transection (Koeberle P.D. et al 2010). A role for apoptosis
induction through mitochondrial channels was ascribed to Kv1.1, Kv1.5, Kv2.1 and Kv11.1
(hERG). For example, increased expression of Kv1.1 was found in apoptotic cerebellar
granular neurons, whereas Kv1.1 knock-down in these cells increased neuron viability (Hu
C.L. et al 2008). In contrast to these results, overexpression of Kv1.5 in human pulmonary
artery smooth muscle cells enhanced apoptosis, whereas its pharmacological inhibition
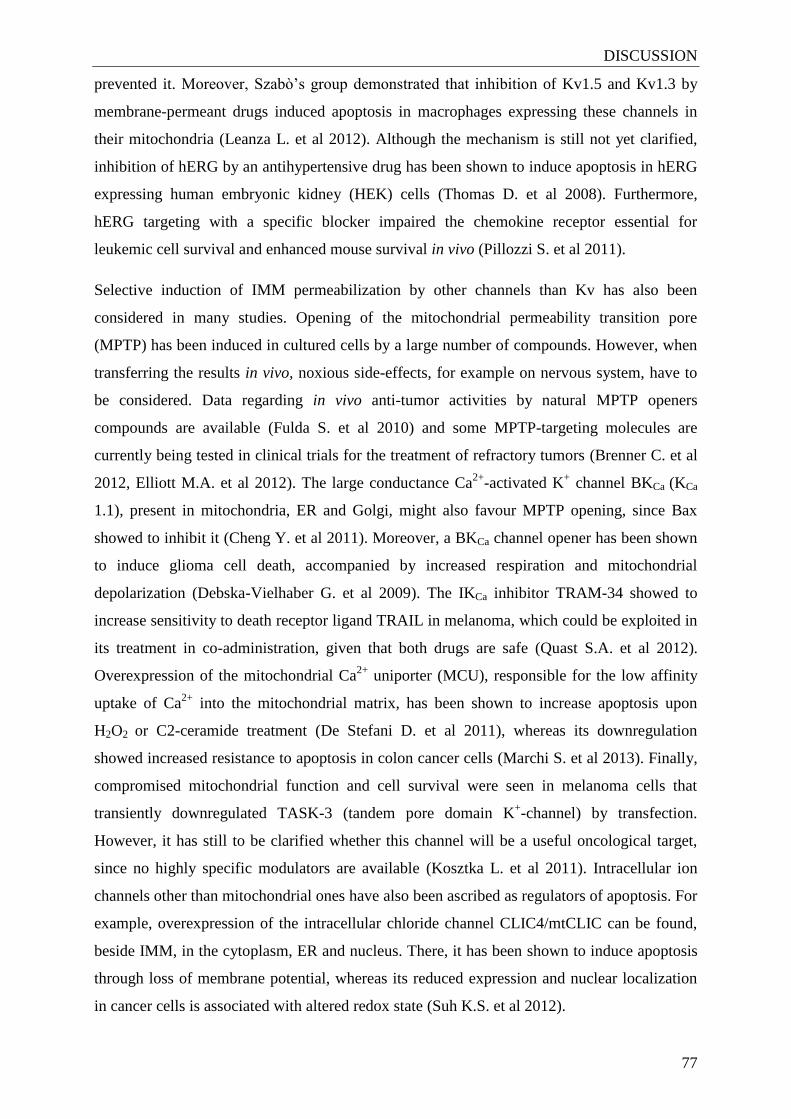
DISCUSSION
77
prevented it. Moreover, Szabò’s group demonstrated that inhibition of Kv1.5 and Kv1.3 by
membrane-permeant drugs induced apoptosis in macrophages expressing these channels in
their mitochondria (Leanza L. et al 2012). Although the mechanism is still not yet clarified,
inhibition of hERG by an antihypertensive drug has been shown to induce apoptosis in hERG
expressing human embryonic kidney (HEK) cells (Thomas D. et al 2008). Furthermore,
hERG targeting with a specific blocker impaired the chemokine receptor essential for
leukemic cell survival and enhanced mouse survival in vivo (Pillozzi S. et al 2011).
Selective induction of IMM permeabilization by other channels than Kv has also been
considered in many studies. Opening of the mitochondrial permeability transition pore
(MPTP) has been induced in cultured cells by a large number of compounds. However, when
transferring the results in vivo, noxious side-effects, for example on nervous system, have to
be considered. Data regarding in vivo anti-tumor activities by natural MPTP openers
compounds are available (Fulda S. et al 2010) and some MPTP-targeting molecules are
currently being tested in clinical trials for the treatment of refractory tumors (Brenner C. et al
2012, Elliott M.A. et al 2012). The large conductance Ca2+
-activated K+ channel BKCa (KCa
1.1), present in mitochondria, ER and Golgi, might also favour MPTP opening, since Bax
showed to inhibit it (Cheng Y. et al 2011). Moreover, a BKCa channel opener has been shown
to induce glioma cell death, accompanied by increased respiration and mitochondrial
depolarization (Debska-Vielhaber G. et al 2009). The IKCa inhibitor TRAM-34 showed to
increase sensitivity to death receptor ligand TRAIL in melanoma, which could be exploited in
its treatment in co-administration, given that both drugs are safe (Quast S.A. et al 2012).
Overexpression of the mitochondrial Ca2+
uniporter (MCU), responsible for the low affinity
uptake of Ca2+
into the mitochondrial matrix, has been shown to increase apoptosis upon
H2O2 or C2-ceramide treatment (De Stefani D. et al 2011), whereas its downregulation
showed increased resistance to apoptosis in colon cancer cells (Marchi S. et al 2013). Finally,
compromised mitochondrial function and cell survival were seen in melanoma cells that
transiently downregulated TASK-3 (tandem pore domain K+-channel) by transfection.
However, it has still to be clarified whether this channel will be a useful oncological target,
since no highly specific modulators are available (Kosztka L. et al 2011). Intracellular ion
channels other than mitochondrial ones have also been ascribed as regulators of apoptosis. For
example, overexpression of the intracellular chloride channel CLIC4/mtCLIC can be found,
beside IMM, in the cytoplasm, ER and nucleus. There, it has been shown to induce apoptosis
through loss of membrane potential, whereas its reduced expression and nuclear localization
in cancer cells is associated with altered redox state (Suh K.S. et al 2012).
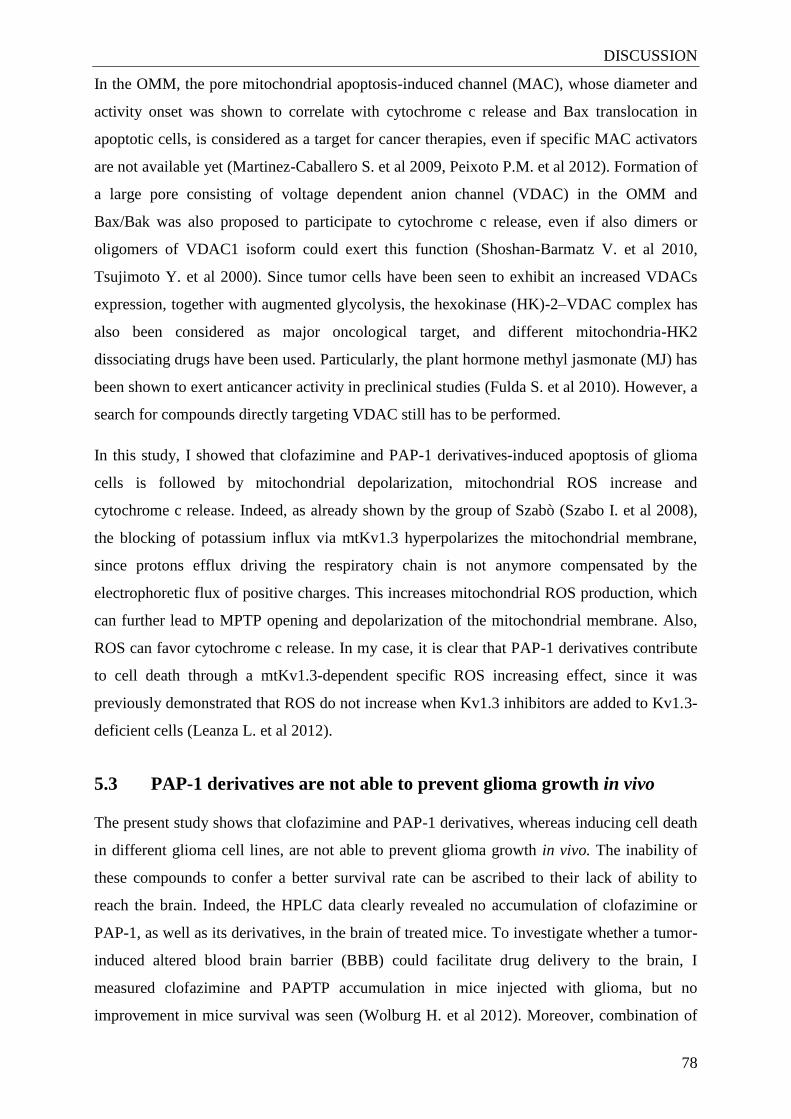
DISCUSSION
78
In the OMM, the pore mitochondrial apoptosis-induced channel (MAC), whose diameter and
activity onset was shown to correlate with cytochrome c release and Bax translocation in
apoptotic cells, is considered as a target for cancer therapies, even if specific MAC activators
are not available yet (Martinez-Caballero S. et al 2009, Peixoto P.M. et al 2012). Formation of
a large pore consisting of voltage dependent anion channel (VDAC) in the OMM and
Bax/Bak was also proposed to participate to cytochrome c release, even if also dimers or
oligomers of VDAC1 isoform could exert this function (Shoshan-Barmatz V. et al 2010,
Tsujimoto Y. et al 2000). Since tumor cells have been seen to exhibit an increased VDACs
expression, together with augmented glycolysis, the hexokinase (HK)-2–VDAC complex has
also been considered as major oncological target, and different mitochondria-HK2
dissociating drugs have been used. Particularly, the plant hormone methyl jasmonate (MJ) has
been shown to exert anticancer activity in preclinical studies (Fulda S. et al 2010). However, a
search for compounds directly targeting VDAC still has to be performed.
In this study, I showed that clofazimine and PAP-1 derivatives-induced apoptosis of glioma
cells is followed by mitochondrial depolarization, mitochondrial ROS increase and
cytochrome c release. Indeed, as already shown by the group of Szabò (Szabo I. et al 2008),
the blocking of potassium influx via mtKv1.3 hyperpolarizes the mitochondrial membrane,
since protons efflux driving the respiratory chain is not anymore compensated by the
electrophoretic flux of positive charges. This increases mitochondrial ROS production, which
can further lead to MPTP opening and depolarization of the mitochondrial membrane. Also,
ROS can favor cytochrome c release. In my case, it is clear that PAP-1 derivatives contribute
to cell death through a mtKv1.3-dependent specific ROS increasing effect, since it was
previously demonstrated that ROS do not increase when Kv1.3 inhibitors are added to Kv1.3-
deficient cells (Leanza L. et al 2012).
5.3 PAP-1 derivatives are not able to prevent glioma growth in vivo
The present study shows that clofazimine and PAP-1 derivatives, whereas inducing cell death
in different glioma cell lines, are not able to prevent glioma growth in vivo. The inability of
these compounds to confer a better survival rate can be ascribed to their lack of ability to
reach the brain. Indeed, the HPLC data clearly revealed no accumulation of clofazimine or
PAP-1, as well as its derivatives, in the brain of treated mice. To investigate whether a tumor-
induced altered blood brain barrier (BBB) could facilitate drug delivery to the brain, I
measured clofazimine and PAPTP accumulation in mice injected with glioma, but no
improvement in mice survival was seen (Wolburg H. et al 2012). Moreover, combination of

DISCUSSION
79
clofazimine treatment with irradiation, which has previously been shown to enhance BBB
disruption, was not able to ameliorate the survival rate (Li Y.Q. et al 2003). Siegal and
colleagues found increased vascular permeability in mice spinal cord 18h after a single dose
of 15 Gy (Siegal T. et al 1996). The group of Wong demonstrated acute BBB disruption in the
CNS 24h after a 50 Gy dose, and that disruption of the BBB was associated in a dose-
dependent manner to that of spinal cord of mice (Li Y.Q. et al 2003). Although they represent
very high doses, we chose 2 Gy to avoid influence of radiation on tumor growth outcome
(Ganai S. et al 2009). Moreover, 2 Gy is the dose currently used in humans for non-
myeloablative bone marrow transplantation to suppress the host immune system (Thomas
E.D. et al 1982). Thus, the inefficacy of the drugs administered in presence of the tumor, as
well as the combined treatment, could be ascribed to the chemical properties of the
compounds, which prevent them from retention within the brain tissues. Regarding
clofazimine, Mansfield already reported the crossing of the BBB by the compound in very
small amounts (Mansfield R.E. 1974), whereas a more recent multiscale bio-distribution
analysis revealed no accumulation of the drug in brain (Baik J. et al 2013). Since the brain is,
compared to other organs such as blood, a highly lipophilic organ, due to the high presence of
cells and membranes, it is expected that clofazimine, which is highly lipophilic, is strongly
retained. Thus, it is likely that the timing and dose chosen for radiation did not properly
disrupt the BBB.
Until now, few groups used specific K+ channel inhibition to reduce tumor growth in vivo in
glioma. Mostly, K+ channels were used to induce cell death by targeting the plasma
membrane channel. In a recent study, Michelakis and colleagues successfully applied the
small molecule dichloroacetate (DCA), which indirectly upregulates Kv1.5 in a NFAT
(nuclear factor of activated T cells) mechanism in the plasma membrane leading to apoptosis,
in humans (Michelakis E.D. et al 2010). Beside this study, the use of a Kv channel inhibitor
was never tested in vivo in glioma. This represents the first attempt to test the ability of a Kv
channel inhibitor to exert an apoptotic effect on glioma growth in vivo.
5.4 PAP-1 derivatives accumulation in organs
Previous in vitro stability experiments on PAP-1 derivatives demonstrated that PAP-1 and the
EsaGME (PEGME) and PAPTP derivatives are stable at least 24h at 37°C both in PBS and in
rat blood, whereas the TPP-carbamoyl PCARBMTP hydrolyzes slowly in PBS (50%
hydrolized in 24h) but rapidly in rat blood (50% in 30 min). The analysis of the accumulation
after in vivo treatment with the different compounds firstly revealed that none of the tissues
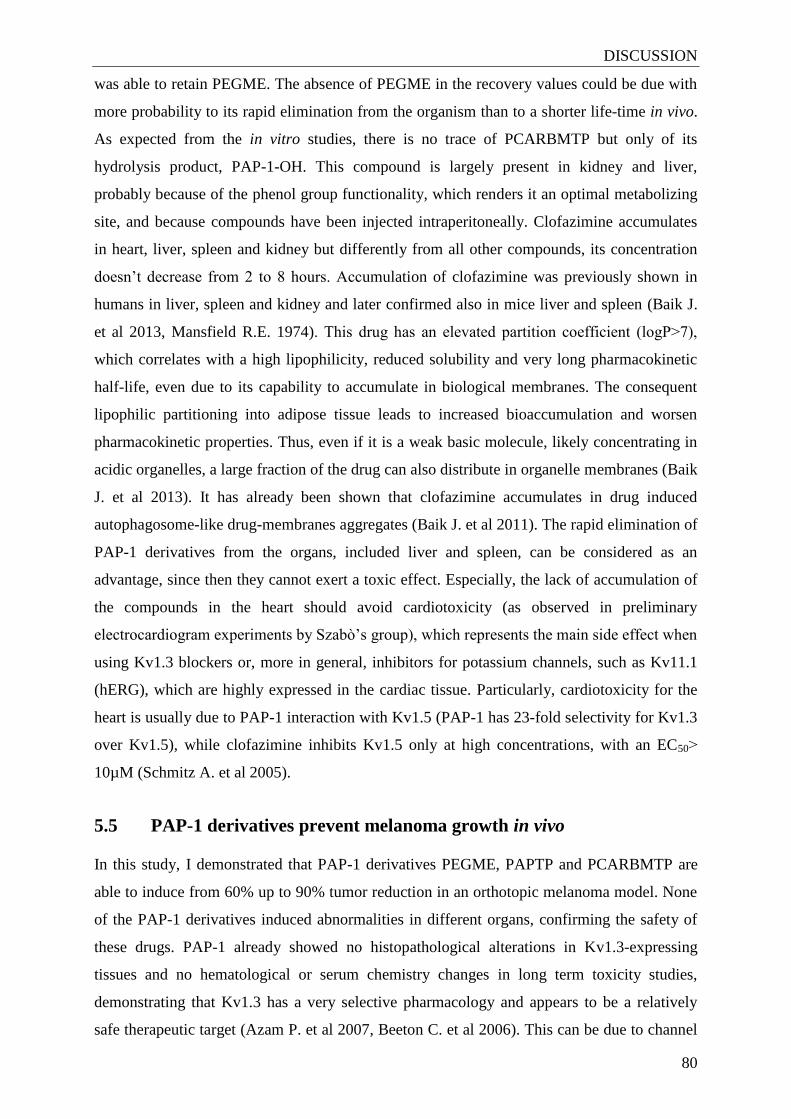
DISCUSSION
80
was able to retain PEGME. The absence of PEGME in the recovery values could be due with
more probability to its rapid elimination from the organism than to a shorter life-time in vivo.
As expected from the in vitro studies, there is no trace of PCARBMTP but only of its
hydrolysis product, PAP-1-OH. This compound is largely present in kidney and liver,
probably because of the phenol group functionality, which renders it an optimal metabolizing
site, and because compounds have been injected intraperitoneally. Clofazimine accumulates
in heart, liver, spleen and kidney but differently from all other compounds, its concentration
doesn’t decrease from 2 to 8 hours. Accumulation of clofazimine was previously shown in
humans in liver, spleen and kidney and later confirmed also in mice liver and spleen (Baik J.
et al 2013, Mansfield R.E. 1974). This drug has an elevated partition coefficient (logP˃7),
which correlates with a high lipophilicity, reduced solubility and very long pharmacokinetic
half-life, even due to its capability to accumulate in biological membranes. The consequent
lipophilic partitioning into adipose tissue leads to increased bioaccumulation and worsen
pharmacokinetic properties. Thus, even if it is a weak basic molecule, likely concentrating in
acidic organelles, a large fraction of the drug can also distribute in organelle membranes (Baik
J. et al 2013). It has already been shown that clofazimine accumulates in drug induced
autophagosome-like drug-membranes aggregates (Baik J. et al 2011). The rapid elimination of
PAP-1 derivatives from the organs, included liver and spleen, can be considered as an
advantage, since then they cannot exert a toxic effect. Especially, the lack of accumulation of
the compounds in the heart should avoid cardiotoxicity (as observed in preliminary
electrocardiogram experiments by Szabò’s group), which represents the main side effect when
using Kv1.3 blockers or, more in general, inhibitors for potassium channels, such as Kv11.1
(hERG), which are highly expressed in the cardiac tissue. Particularly, cardiotoxicity for the
heart is usually due to PAP-1 interaction with Kv1.5 (PAP-1 has 23-fold selectivity for Kv1.3
over Kv1.5), while clofazimine inhibits Kv1.5 only at high concentrations, with an EC50˃
10µM (Schmitz A. et al 2005).
5.5 PAP-1 derivatives prevent melanoma growth in vivo
In this study, I demonstrated that PAP-1 derivatives PEGME, PAPTP and PCARBMTP are
able to induce from 60% up to 90% tumor reduction in an orthotopic melanoma model. None
of the PAP-1 derivatives induced abnormalities in different organs, confirming the safety of
these drugs. PAP-1 already showed no histopathological alterations in Kv1.3-expressing
tissues and no hematological or serum chemistry changes in long term toxicity studies,
demonstrating that Kv1.3 has a very selective pharmacology and appears to be a relatively
safe therapeutic target (Azam P. et al 2007, Beeton C. et al 2006). This can be due to channel
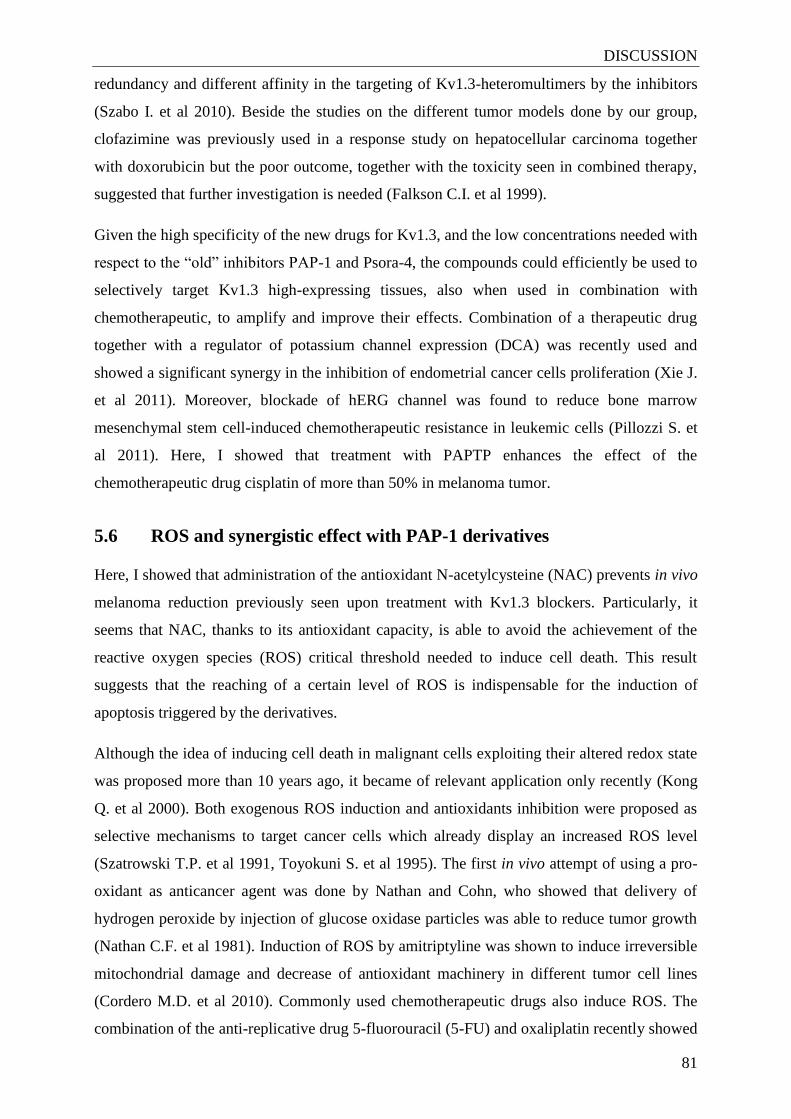
DISCUSSION
81
redundancy and different affinity in the targeting of Kv1.3-heteromultimers by the inhibitors
(Szabo I. et al 2010). Beside the studies on the different tumor models done by our group,
clofazimine was previously used in a response study on hepatocellular carcinoma together
with doxorubicin but the poor outcome, together with the toxicity seen in combined therapy,
suggested that further investigation is needed (Falkson C.I. et al 1999).
Given the high specificity of the new drugs for Kv1.3, and the low concentrations needed with
respect to the “old” inhibitors PAP-1 and Psora-4, the compounds could efficiently be used to
selectively target Kv1.3 high-expressing tissues, also when used in combination with
chemotherapeutic, to amplify and improve their effects. Combination of a therapeutic drug
together with a regulator of potassium channel expression (DCA) was recently used and
showed a significant synergy in the inhibition of endometrial cancer cells proliferation (Xie J.
et al 2011). Moreover, blockade of hERG channel was found to reduce bone marrow
mesenchymal stem cell-induced chemotherapeutic resistance in leukemic cells (Pillozzi S. et
al 2011). Here, I showed that treatment with PAPTP enhances the effect of the
chemotherapeutic drug cisplatin of more than 50% in melanoma tumor.
5.6 ROS and synergistic effect with PAP-1 derivatives
Here, I showed that administration of the antioxidant N-acetylcysteine (NAC) prevents in vivo
melanoma reduction previously seen upon treatment with Kv1.3 blockers. Particularly, it
seems that NAC, thanks to its antioxidant capacity, is able to avoid the achievement of the
reactive oxygen species (ROS) critical threshold needed to induce cell death. This result
suggests that the reaching of a certain level of ROS is indispensable for the induction of
apoptosis triggered by the derivatives.
Although the idea of inducing cell death in malignant cells exploiting their altered redox state
was proposed more than 10 years ago, it became of relevant application only recently (Kong
Q. et al 2000). Both exogenous ROS induction and antioxidants inhibition were proposed as
selective mechanisms to target cancer cells which already display an increased ROS level
(Szatrowski T.P. et al 1991, Toyokuni S. et al 1995). The first in vivo attempt of using a pro-
oxidant as anticancer agent was done by Nathan and Cohn, who showed that delivery of
hydrogen peroxide by injection of glucose oxidase particles was able to reduce tumor growth
(Nathan C.F. et al 1981). Induction of ROS by amitriptyline was shown to induce irreversible
mitochondrial damage and decrease of antioxidant machinery in different tumor cell lines
(Cordero M.D. et al 2010). Commonly used chemotherapeutic drugs also induce ROS. The
combination of the anti-replicative drug 5-fluorouracil (5-FU) and oxaliplatin recently showed
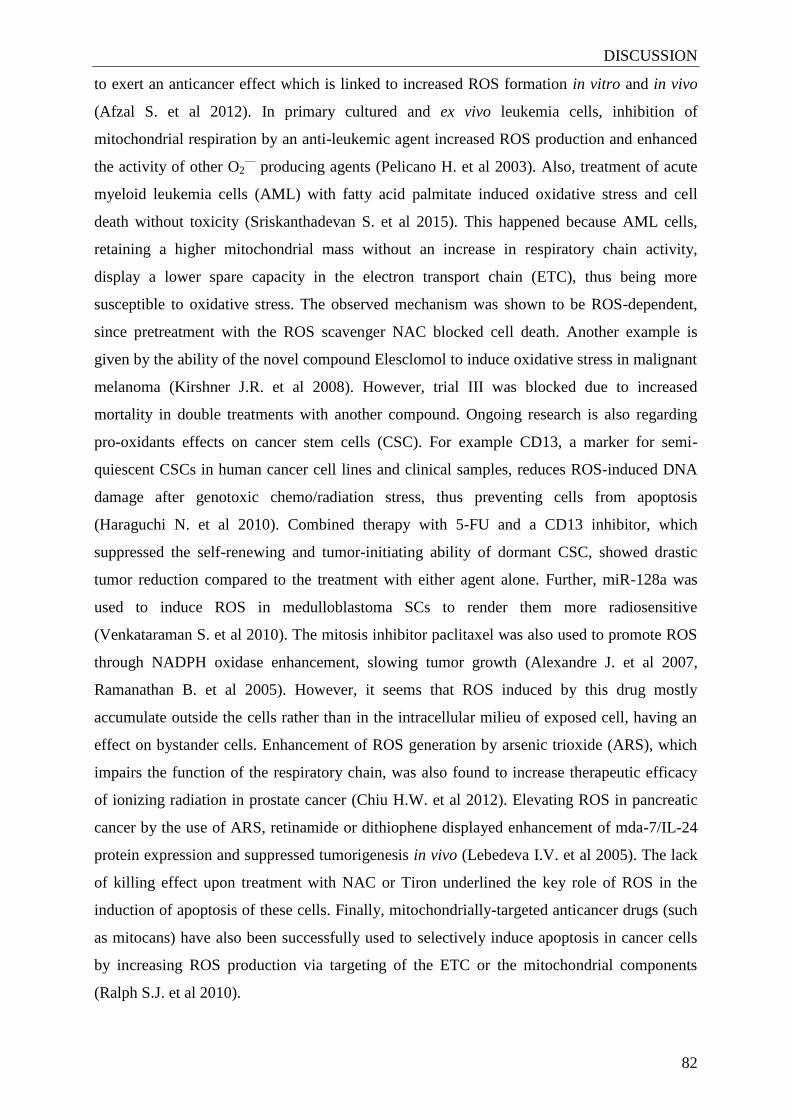
DISCUSSION
82
to exert an anticancer effect which is linked to increased ROS formation in vitro and in vivo
(Afzal S. et al 2012). In primary cultured and ex vivo leukemia cells, inhibition of
mitochondrial respiration by an anti-leukemic agent increased ROS production and enhanced
the activity of other O2—
producing agents (Pelicano H. et al 2003). Also, treatment of acute
myeloid leukemia cells (AML) with fatty acid palmitate induced oxidative stress and cell
death without toxicity (Sriskanthadevan S. et al 2015). This happened because AML cells,
retaining a higher mitochondrial mass without an increase in respiratory chain activity,
display a lower spare capacity in the electron transport chain (ETC), thus being more
susceptible to oxidative stress. The observed mechanism was shown to be ROS-dependent,
since pretreatment with the ROS scavenger NAC blocked cell death. Another example is
given by the ability of the novel compound Elesclomol to induce oxidative stress in malignant
melanoma (Kirshner J.R. et al 2008). However, trial III was blocked due to increased
mortality in double treatments with another compound. Ongoing research is also regarding
pro-oxidants effects on cancer stem cells (CSC). For example CD13, a marker for semi-
quiescent CSCs in human cancer cell lines and clinical samples, reduces ROS-induced DNA
damage after genotoxic chemo/radiation stress, thus preventing cells from apoptosis
(Haraguchi N. et al 2010). Combined therapy with 5-FU and a CD13 inhibitor, which
suppressed the self-renewing and tumor-initiating ability of dormant CSC, showed drastic
tumor reduction compared to the treatment with either agent alone. Further, miR-128a was
used to induce ROS in medulloblastoma SCs to render them more radiosensitive
(Venkataraman S. et al 2010). The mitosis inhibitor paclitaxel was also used to promote ROS
through NADPH oxidase enhancement, slowing tumor growth (Alexandre J. et al 2007,
Ramanathan B. et al 2005). However, it seems that ROS induced by this drug mostly
accumulate outside the cells rather than in the intracellular milieu of exposed cell, having an
effect on bystander cells. Enhancement of ROS generation by arsenic trioxide (ARS), which
impairs the function of the respiratory chain, was also found to increase therapeutic efficacy
of ionizing radiation in prostate cancer (Chiu H.W. et al 2012). Elevating ROS in pancreatic
cancer by the use of ARS, retinamide or dithiophene displayed enhancement of mda-7/IL-24
protein expression and suppressed tumorigenesis in vivo (Lebedeva I.V. et al 2005). The lack
of killing effect upon treatment with NAC or Tiron underlined the key role of ROS in the
induction of apoptosis of these cells. Finally, mitochondrially-targeted anticancer drugs (such
as mitocans) have also been successfully used to selectively induce apoptosis in cancer cells
by increasing ROS production via targeting of the ETC or the mitochondrial components
(Ralph S.J. et al 2010).
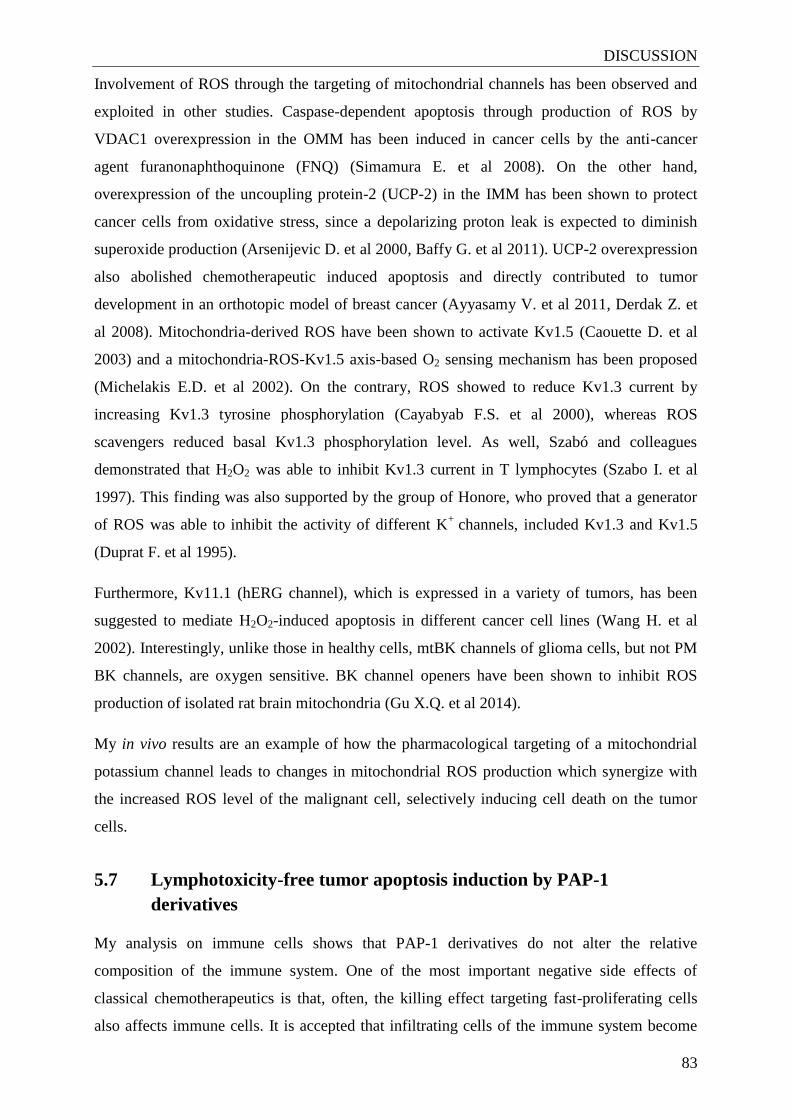
DISCUSSION
83
Involvement of ROS through the targeting of mitochondrial channels has been observed and
exploited in other studies. Caspase-dependent apoptosis through production of ROS by
VDAC1 overexpression in the OMM has been induced in cancer cells by the anti-cancer
agent furanonaphthoquinone (FNQ) (Simamura E. et al 2008). On the other hand,
overexpression of the uncoupling protein-2 (UCP-2) in the IMM has been shown to protect
cancer cells from oxidative stress, since a depolarizing proton leak is expected to diminish
superoxide production (Arsenijevic D. et al 2000, Baffy G. et al 2011). UCP-2 overexpression
also abolished chemotherapeutic induced apoptosis and directly contributed to tumor
development in an orthotopic model of breast cancer (Ayyasamy V. et al 2011, Derdak Z. et
al 2008). Mitochondria-derived ROS have been shown to activate Kv1.5 (Caouette D. et al
2003) and a mitochondria-ROS-Kv1.5 axis-based O2 sensing mechanism has been proposed
(Michelakis E.D. et al 2002). On the contrary, ROS showed to reduce Kv1.3 current by
increasing Kv1.3 tyrosine phosphorylation (Cayabyab F.S. et al 2000), whereas ROS
scavengers reduced basal Kv1.3 phosphorylation level. As well, Szabó and colleagues
demonstrated that H2O2 was able to inhibit Kv1.3 current in T lymphocytes (Szabo I. et al
1997). This finding was also supported by the group of Honore, who proved that a generator
of ROS was able to inhibit the activity of different K+
channels, included Kv1.3 and Kv1.5
(Duprat F. et al 1995).
Furthermore, Kv11.1 (hERG channel), which is expressed in a variety of tumors, has been
suggested to mediate H2O2-induced apoptosis in different cancer cell lines (Wang H. et al
2002). Interestingly, unlike those in healthy cells, mtBK channels of glioma cells, but not PM
BK channels, are oxygen sensitive. BK channel openers have been shown to inhibit ROS
production of isolated rat brain mitochondria (Gu X.Q. et al 2014).
My in vivo results are an example of how the pharmacological targeting of a mitochondrial
potassium channel leads to changes in mitochondrial ROS production which synergize with
the increased ROS level of the malignant cell, selectively inducing cell death on the tumor
cells.
5.7 Lymphotoxicity-free tumor apoptosis induction by PAP-1
derivatives
My analysis on immune cells shows that PAP-1 derivatives do not alter the relative
composition of the immune system. One of the most important negative side effects of
classical chemotherapeutics is that, often, the killing effect targeting fast-proliferating cells
also affects immune cells. It is accepted that infiltrating cells of the immune system become
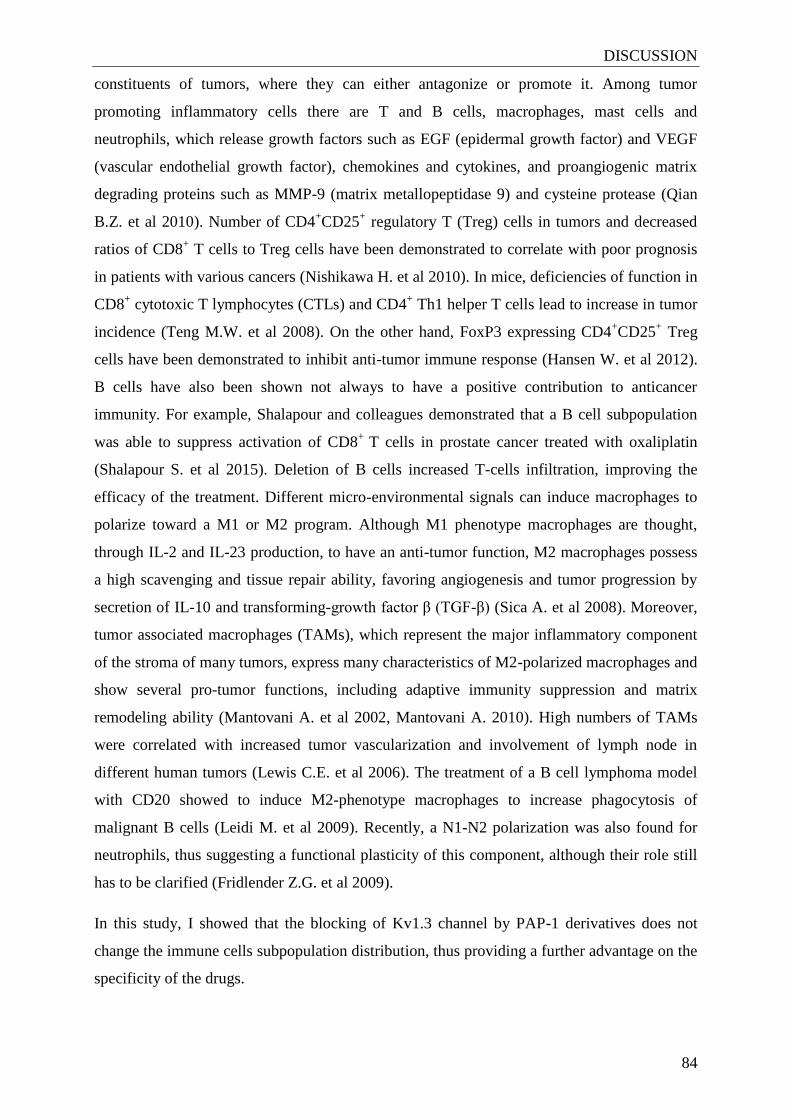
DISCUSSION
84
constituents of tumors, where they can either antagonize or promote it. Among tumor
promoting inflammatory cells there are T and B cells, macrophages, mast cells and
neutrophils, which release growth factors such as EGF (epidermal growth factor) and VEGF
(vascular endothelial growth factor), chemokines and cytokines, and proangiogenic matrix
degrading proteins such as MMP-9 (matrix metallopeptidase 9) and cysteine protease (Qian
B.Z. et al 2010). Number of CD4+CD25
+ regulatory T (Treg) cells in tumors and decreased
ratios of CD8+ T cells to Treg cells have been demonstrated to correlate with poor prognosis
in patients with various cancers (Nishikawa H. et al 2010). In mice, deficiencies of function in
CD8+ cytotoxic T lymphocytes (CTLs) and CD4
+ Th1 helper T cells lead to increase in tumor
incidence (Teng M.W. et al 2008). On the other hand, FoxP3 expressing CD4+CD25
+ Treg
cells have been demonstrated to inhibit anti-tumor immune response (Hansen W. et al 2012).
B cells have also been shown not always to have a positive contribution to anticancer
immunity. For example, Shalapour and colleagues demonstrated that a B cell subpopulation
was able to suppress activation of CD8+
T cells in prostate cancer treated with oxaliplatin
(Shalapour S. et al 2015). Deletion of B cells increased T-cells infiltration, improving the
efficacy of the treatment. Different micro-environmental signals can induce macrophages to
polarize toward a M1 or M2 program. Although M1 phenotype macrophages are thought,
through IL-2 and IL-23 production, to have an anti-tumor function, M2 macrophages possess
a high scavenging and tissue repair ability, favoring angiogenesis and tumor progression by
secretion of IL-10 and transforming-growth factor β (TGF-β) (Sica A. et al 2008). Moreover,
tumor associated macrophages (TAMs), which represent the major inflammatory component
of the stroma of many tumors, express many characteristics of M2-polarized macrophages and
show several pro-tumor functions, including adaptive immunity suppression and matrix
remodeling ability (Mantovani A. et al 2002, Mantovani A. 2010). High numbers of TAMs
were correlated with increased tumor vascularization and involvement of lymph node in
different human tumors (Lewis C.E. et al 2006). The treatment of a B cell lymphoma model
with CD20 showed to induce M2-phenotype macrophages to increase phagocytosis of
malignant B cells (Leidi M. et al 2009). Recently, a N1-N2 polarization was also found for
neutrophils, thus suggesting a functional plasticity of this component, although their role still
has to be clarified (Fridlender Z.G. et al 2009).
In this study, I showed that the blocking of Kv1.3 channel by PAP-1 derivatives does not
change the immune cells subpopulation distribution, thus providing a further advantage on the
specificity of the drugs.
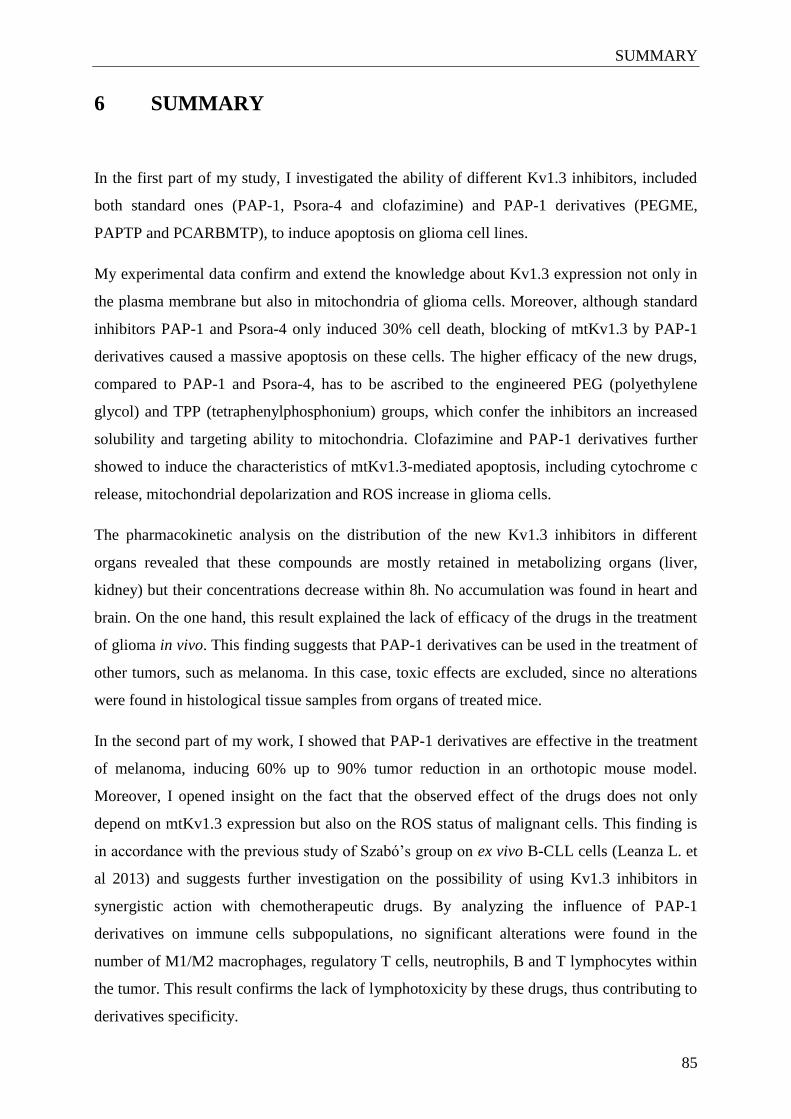
SUMMARY
85
6 SUMMARY
In the first part of my study, I investigated the ability of different Kv1.3 inhibitors, included
both standard ones (PAP-1, Psora-4 and clofazimine) and PAP-1 derivatives (PEGME,
PAPTP and PCARBMTP), to induce apoptosis on glioma cell lines.
My experimental data confirm and extend the knowledge about Kv1.3 expression not only in
the plasma membrane but also in mitochondria of glioma cells. Moreover, although standard
inhibitors PAP-1 and Psora-4 only induced 30% cell death, blocking of mtKv1.3 by PAP-1
derivatives caused a massive apoptosis on these cells. The higher efficacy of the new drugs,
compared to PAP-1 and Psora-4, has to be ascribed to the engineered PEG (polyethylene
glycol) and TPP (tetraphenylphosphonium) groups, which confer the inhibitors an increased
solubility and targeting ability to mitochondria. Clofazimine and PAP-1 derivatives further
showed to induce the characteristics of mtKv1.3-mediated apoptosis, including cytochrome c
release, mitochondrial depolarization and ROS increase in glioma cells.
The pharmacokinetic analysis on the distribution of the new Kv1.3 inhibitors in different
organs revealed that these compounds are mostly retained in metabolizing organs (liver,
kidney) but their concentrations decrease within 8h. No accumulation was found in heart and
brain. On the one hand, this result explained the lack of efficacy of the drugs in the treatment
of glioma in vivo. This finding suggests that PAP-1 derivatives can be used in the treatment of
other tumors, such as melanoma. In this case, toxic effects are excluded, since no alterations
were found in histological tissue samples from organs of treated mice.
In the second part of my work, I showed that PAP-1 derivatives are effective in the treatment
of melanoma, inducing 60% up to 90% tumor reduction in an orthotopic mouse model.
Moreover, I opened insight on the fact that the observed effect of the drugs does not only
depend on mtKv1.3 expression but also on the ROS status of malignant cells. This finding is
in accordance with the previous study of Szabó’s group on ex vivo B-CLL cells (Leanza L. et
al 2013) and suggests further investigation on the possibility of using Kv1.3 inhibitors in
synergistic action with chemotherapeutic drugs. By analyzing the influence of PAP-1
derivatives on immune cells subpopulations, no significant alterations were found in the
number of M1/M2 macrophages, regulatory T cells, neutrophils, B and T lymphocytes within
the tumor. This result confirms the lack of lymphotoxicity by these drugs, thus contributing to
derivatives specificity.

SUMMARY
86
Concluding, highly specific Kv1.3-dependent apoptosis induction by PAP-1 derivatives was
found in the treatment of glioma in vitro and melanoma in vivo. Kv1.3 expression level seems
to synergize together with the altered redox status in malignant cells to provide these effects.
Thus, selectivity of these drugs, together with safety profile, could be used in the treatment of
melanoma and other cancers. The possibility of a combined treatment with a
chemotherapeutic is also suggested.
87
REFERENCES
1 Abdul M., Hoosein N. (2002). Voltage-gated potassium ion channels in colon cancer.
Oncol Rep 9: 961-964.
2 Abdul M., Santo A., Hoosein N. (2003). Activity of potassium channel-blockers in
breast cancer. Anticancer Res 23: 3347-3351.
3 Abdul M., Hoosein N. (2006). Reduced Kv1.3 potassium channel expression in human
prostate cancer. J Membr Biol 214: 99-102.
4 Abdullaev I.F., Rudkouskaya A., Mongin A.A., Kuo Y.H. (2010). Calcium-activated
potassium channels BK and IK1 are functionally expressed in human gliomas but do not
regulate cell proliferation. PLoS One 5: e12304.
5 Afzal S., Jensen S.A., Sorensen J.B., Henriksen T., Weimann A., Poulsen H.E. (2012).
Oxidative damage to guanine nucleosides following combination chemotherapy with 5-
fluorouracil and oxaliplatin. Cancer Chemother Pharmacol 69: 301-307.
6 Aiyar J., Rizzi J.P., Gutman G.A., Chandy K.G. (1996). The signature sequence of
voltage-gated potassium channels projects into the external vestibule. J Biol Chem 271:
31013-31016.
7 Alexandre J., Hu Y., Lu W., Pelicano H., Huang P. (2007). Novel action of paclitaxel
against cancer cells: bystander effect mediated by reactive oxygen species. Cancer Res
67: 3512-3517.
8 Alizadeh A.A., Eisen M.B., Davis R.E., Ma C., Lossos I.S., Rosenwald A., Boldrick
J.C., Sabet H., Tran T., Yu X., Powell J.I., Yang L., Marti G.E., Moore T., Hudson J.,
Jr., Lu L., Lewis D.B., Tibshirani R., Sherlock G., Chan W.C., Greiner T.C.,
Weisenburger D.D., Armitage J.O., Warnke R., Levy R., Wilson W., Grever M.R., Byrd
J.C., Botstein D., Brown P.O., Staudt L.M. (2000). Distinct types of diffuse large B-cell
lymphoma identified by gene expression profiling. Nature 403: 503-511.
9 Annis M.G., Soucie E.L., Dlugosz P.J., Cruz-Aguado J.A., Penn L.Z., Leber B.,
Andrews D.W. (2005). Bax forms multispanning monomers that oligomerize to
permeabilize membranes during apoptosis. Embo J 24: 2096-2103.
10 Antonsson B., Montessuit S., Lauper S., Eskes R., Martinou J.C. (2000). Bax
oligomerization is required for channel-forming activity in liposomes and to trigger
cytochrome c release from mitochondria. Biochem J 345 Pt 2: 271-278.
11 Arcangeli A., Crociani O., Lastraioli E., Masi A., Pillozzi S., Becchetti A. (2009).
Targeting ion channels in cancer: a novel frontier in antineoplastic therapy. Curr Med
Chem 16: 66-93.
88
12 Arkett S.A., Dixon J., Yang J.N., Sakai D.D., Minkin C., Sims S.M. (1994).
Mammalian osteoclasts express a transient potassium channel with properties of Kv1.3.
Receptors Channels 2: 281-293.
13 Armstrong C.M. (2003). Voltage-gated K channels. Sci STKE 2003: re10.
14 Arsenijevic D., Onuma H., Pecqueur C., Raimbault S., Manning B.S., Miroux B.,
Couplan E., Alves-Guerra M.C., Goubern M., Surwit R., Bouillaud F., Richard D.,
Collins S., Ricquier D. (2000). Disruption of the uncoupling protein-2 gene in mice
reveals a role in immunity and reactive oxygen species production. Nat Genet 26: 435-
439.
15 Artym V.V., Petty H.R. (2002). Molecular proximity of Kv1.3 voltage-gated potassium
channels and beta(1)-integrins on the plasma membrane of melanoma cells: effects of
cell adherence and channel blockers. J Gen Physiol 120: 29-37.
16 Ashkenazi A., Dixit V.M. (1998). Death receptors: signaling and modulation. Science
281: 1305-1308.
17 Attali B., Wang N., Kolot A., Sobko A., Cherepanov V., Soliven B. (1997).
Characterization of delayed rectifier Kv channels in oligodendrocytes and progenitor
cells. J Neurosci 17: 8234-8245.
18 Ayyasamy V., Owens K.M., Desouki M.M., Liang P., Bakin A., Thangaraj K.,
Buchsbaum D.J., LoBuglio A.F., Singh K.K. (2011). Cellular model of Warburg effect
identifies tumor promoting function of UCP2 in breast cancer and its suppression by
genipin. PLoS One 6: e24792.
19 Azam P., Sankaranarayanan A., Homerick D., Griffey S., Wulff H. (2007). Targeting
effector memory T cells with the small molecule Kv1.3 blocker PAP-1 suppresses
allergic contact dermatitis. J Invest Dermatol 127: 1419-1429.
20 Azzolini M., La Spina M., Mattarei A., Paradisi C., Zoratti M., Biasutto L. (2014).
Pharmacokinetics and tissue distribution of pterostilbene in the rat. Mol Nutr Food Res
58: 2122-2132.
21 Baffy G., Derdak Z., Robson S.C. (2011). Mitochondrial recoupling: a novel therapeutic
strategy for cancer? Br J Cancer 105: 469-474.
22 Baik J., Rosania G.R. (2011). Molecular imaging of intracellular drug-membrane
aggregate formation. Mol Pharm 8: 1742-1749.
23 Baik J., Stringer K.A., Mane G., Rosania G.R. (2013). Multiscale distribution and
bioaccumulation analysis of clofazimine reveals a massive immune system-mediated
xenobiotic sequestration response. Antimicrob Agents Chemother 57: 1218-1230.
89
24 Baines C.P., Kaiser R.A., Purcell N.H., Blair N.S., Osinska H., Hambleton M.A.,
Brunskill E.W., Sayen M.R., Gottlieb R.A., Dorn G.W., Robbins J., Molkentin J.D.
(2005). Loss of cyclophilin D reveals a critical role for mitochondrial permeability
transition in cell death. Nature 434: 658-662.
25 Baines C.P., Kaiser R.A., Sheiko T., Craigen W.J., Molkentin J.D. (2007). Voltage-
dependent anion channels are dispensable for mitochondrial-dependent cell death. Nat
Cell Biol 9: 550-555.
26 Basanez G., Sharpe J.C., Galanis J., Brandt T.B., Hardwick J.M., Zimmerberg J. (2002).
Bax-type apoptotic proteins porate pure lipid bilayers through a mechanism sensitive to
intrinsic monolayer curvature. J Biol Chem 277: 49360-49365.
27 Bednarczyk P., Kowalczyk J.E., Beresewicz M., Dolowy K., Szewczyk A., Zablocka B.
(2010). Identification of a voltage-gated potassium channel in gerbil hippocampal
mitochondria. Biochem Biophys Res Commun 397: 614-620.
28 Beeton C., Wulff H., Barbaria J., Clot-Faybesse O., Pennington M., Bernard D.,
Cahalan M.D., Chandy K.G., Beraud E. (2001). Selective blockade of T lymphocyte
K(+) channels ameliorates experimental autoimmune encephalomyelitis, a model for
multiple sclerosis. Proc Natl Acad Sci U S A 98: 13942-13947.
29 Beeton C., Wulff H., Standifer N.E., Azam P., Mullen K.M., Pennington M.W., Kolski-
Andreaco A., Wei E., Grino A., Counts D.R., Wang P.H., LeeHealey C.J., B S.A.,
Sankaranarayanan A., Homerick D., Roeck W.W., Tehranzadeh J., Stanhope K.L.,
Zimin P., Havel P.J., Griffey S., Knaus H.G., Nepom G.T., Gutman G.A., Calabresi
P.A., Chandy K.G. (2006). Kv1.3 channels are a therapeutic target for T cell-mediated
autoimmune diseases. Proc Natl Acad Sci U S A 103: 17414-17419.
30 Bernardi P. (1999). Mitochondrial transport of cations: channels, exchangers, and
permeability transition. Physiol Rev 79: 1127-1155.
31 Bianchi L., Wible B., Arcangeli A., Taglialatela M., Morra F., Castaldo P., Crociani O.,
Rosati B., Faravelli L., Olivotto M., Wanke E. (1998). herg encodes a K+ current highly
conserved in tumors of different histogenesis: a selective advantage for cancer cells?
Cancer Res 58: 815-822.
32 Bielanska J., Hernandez-Losa J., Perez-Verdaguer M., Moline T., Somoza R., Ramon
Y.C.S., Condom E., Ferreres J.C., Felipe A. (2009). Voltage-dependent potassium
channels Kv1.3 and Kv1.5 in human cancer. Curr Cancer Drug Targets 9: 904-914.
33 Bock J., Szabo I., Jekle A., Gulbins E. (2002). Actinomycin D-induced apoptosis
involves the potassium channel Kv1.3. Biochem Biophys Res Commun 295: 526-531.
90
34 Bonnet S., Archer S.L., Allalunis-Turner J., Haromy A., Beaulieu C., Thompson R., Lee
C.T., Lopaschuk G.D., Puttagunta L., Harry G., Hashimoto K., Porter C.J., Andrade
M.A., Thebaud B., Michelakis E.D. (2007). A mitochondria-K+ channel axis is
suppressed in cancer and its normalization promotes apoptosis and inhibits cancer
growth. Cancer Cell 11: 37-51.
35 Bordey A., Sontheimer H. (1998). Properties of human glial cells associated with
epileptic seizure foci. Epilepsy Res 32: 286-303.
36 Brenner C., Moulin M. (2012). Physiological roles of the permeability transition pore.
Circ Res 111: 1237-1247.
37 Brevet M., Ahidouch A., Sevestre H., Merviel P., El Hiani Y., Robbe M., Ouadid-
Ahidouch H. (2008). Expression of K+ channels in normal and cancerous human breast.
Histol Histopathol 23: 965-972.
38 Brevet M., Fucks D., Chatelain D., Regimbeau J.M., Delcenserie R., Sevestre H.,
Ouadid-Ahidouch H. (2009). Deregulation of 2 potassium channels in pancreas
adenocarcinomas: implication of KV1.3 gene promoter methylation. Pancreas 38: 649-
654.
39 Bright J.N., Shrivastava I.H., Cordes F.S., Sansom M.S. (2002). Conformational
dynamics of helix S6 from Shaker potassium channel: simulation studies. Biopolymers
64: 303-313.
40 Cahalan M.D., Chandy K.G., DeCoursey T.E., Gupta S. (1985). A voltage-gated
potassium channel in human T lymphocytes. J Physiol 358: 197-237.
41 Cahalan M.D., Chandy K.G. (2009). The functional network of ion channels in T
lymphocytes. Immunol Rev 231: 59-87.
42 Caouette D., Dongmo C., Berube J., Fournier D., Daleau P. (2003). Hydrogen peroxide
modulates the Kv1.5 channel expressed in a mammalian cell line. Naunyn
Schmiedebergs Arch Pharmacol 368: 479-486.
43 Cayabyab F.S., Khanna R., Jones O.T., Schlichter L.C. (2000). Suppression of the rat
microglia Kv1.3 current by src-family tyrosine kinases and oxygen/glucose deprivation.
Eur J Neurosci 12: 1949-1960.
44 Chandy K.G., DeCoursey T.E., Cahalan M.D., McLaughlin C., Gupta S. (1984).
Voltage-gated potassium channels are required for human T lymphocyte activation. J
Exp Med 160: 369-385.
45 Chandy K.G., Williams C.B., Spencer R.H., Aguilar B.A., Ghanshani S., Tempel B.L.,
Gutman G.A. (1990). A family of three mouse potassium channel genes with intronless
coding regions. Science 247: 973-975.
91
46 Chandy K.G., Cahalan M., Pennington M., Norton R.S., Wulff H., Gutman G.A. (2001).
Potassium channels in T lymphocytes: toxins to therapeutic immunosuppressants.
Toxicon 39: 1269-1276.
47 Chandy K.G., Wulff H., Beeton C., Pennington M., Gutman G.A., Cahalan M.D.
(2004). K+ channels as targets for specific immunomodulation. Trends Pharmacol Sci
25: 280-289.
48 Cheng Y., Debska-Vielhaber G., Siemen D. (2010). Interaction of mitochondrial
potassium channels with the permeability transition pore. FEBS Lett 584: 2005-2012.
49 Cheng Y., Gulbins E., Siemen D. (2011). Activation of the permeability transition pore
by Bax via inhibition of the mitochondrial BK channel. Cell Physiol Biochem 27: 191-
200.
50 Chipuk J.E., McStay G.P., Bharti A., Kuwana T., Clarke C.J., Siskind L.J., Obeid L.M.,
Green D.R. (2012). Sphingolipid metabolism cooperates with BAK and BAX to
promote the mitochondrial pathway of apoptosis. Cell 148: 988-1000.
51 Chittajallu R., Chen Y., Wang H., Yuan X., Ghiani C.A., Heckman T., McBain C.J.,
Gallo V. (2002). Regulation of Kv1 subunit expression in oligodendrocyte progenitor
cells and their role in G1/S phase progression of the cell cycle. Proc Natl Acad Sci U S
A 99: 2350-2355.
52 Chiu H.W., Chen Y.A., Ho S.Y., Wang Y.J. (2012). Arsenic trioxide enhances the
radiation sensitivity of androgen-dependent and -independent human prostate cancer
cells. PLoS One 7: e31579.
53 Chuaprapaisilp T., Piamphongsant T. (1978). Treatment of pustular psoriasis with
clofazimine. Br J Dermatol 99: 303-305.
54 Coleman S.K., Newcombe J., Pryke J., Dolly J.O. (1999). Subunit composition of Kv1
channels in human CNS. J Neurochem 73: 849-858.
55 Cordero M.D., Sanchez-Alcazar J.A., Bautista-Ferrufino M.R., Carmona-Lopez M.I.,
Illanes M., Rios M.J., Garrido-Maraver J., Alcudia A., Navas P., de Miguel M. (2010).
Acute oxidant damage promoted on cancer cells by amitriptyline in comparison with
some common chemotherapeutic drugs. Anticancer Drugs 21: 932-944.
56 Cory S., Adams J.M. (2002). The Bcl2 family: regulators of the cellular life-or-death
switch. Nat Rev Cancer 2: 647-656.
57 Costantini P., Chernyak B.V., Petronilli V., Bernardi P. (1996). Modulation of the
mitochondrial permeability transition pore by pyridine nucleotides and dithiol oxidation
at two separate sites. J Biol Chem 271: 6746-6751.
92
58 Cuddapah V.A., Sontheimer H. (2011). Ion channels and transporters [corrected] in
cancer. 2. Ion channels and the control of cancer cell migration. Am J Physiol Cell
Physiol 301: C541-549.
59 D'Amico M., Gasparoli L., Arcangeli A. (2013). Potassium channels: novel emerging
biomarkers and targets for therapy in cancer. Recent Pat Anticancer Drug Discov 8: 53-
65.
60 De Marchi U., Sassi N., Fioretti B., Catacuzzeno L., Cereghetti G.M., Szabo I., Zoratti
M. (2009). Intermediate conductance Ca2+-activated potassium channel (KCa3.1) in the
inner mitochondrial membrane of human colon cancer cells. Cell Calcium 45: 509-516.
61 De Stefani D., Raffaello A., Teardo E., Szabo I., Rizzuto R. (2011). A forty-kilodalton
protein of the inner membrane is the mitochondrial calcium uniporter. Nature 476: 336-
340.
62 Debska-Vielhaber G., Godlewski M.M., Kicinska A., Skalska J., Kulawiak B.,
Piwonska M., Zablocki K., Kunz W.S., Szewczyk A., Motyl T. (2009). Large-
conductance K+ channel openers induce death of human glioma cells. J Physiol
Pharmacol 60: 27-36.
63 DeCoursey T.E., Chandy K.G., Gupta S., Cahalan M.D. (1984). Voltage-gated K+
channels in human T lymphocytes: a role in mitogenesis? Nature 307: 465-468.
64 Derdak Z., Mark N.M., Beldi G., Robson S.C., Wands J.R., Baffy G. (2008). The
mitochondrial uncoupling protein-2 promotes chemoresistance in cancer cells. Cancer
Res 68: 2813-2819.
65 Deutsch C., Chen L.Q. (1993). Heterologous expression of specific K+ channels in T
lymphocytes: functional consequences for volume regulation. Proc Natl Acad Sci U S A
90: 10036-10040.
66 Di Paola M., Cocco T., Lorusso M. (2000). Ceramide interaction with the respiratory
chain of heart mitochondria. Biochemistry 39: 6660-6668.
67 Dooley K.E., Obuku E.A., Durakovic N., Belitsky V., Mitnick C., Nuermberger E.L.
(2013). World Health Organization group 5 drugs for the treatment of drug-resistant
tuberculosis: unclear efficacy or untapped potential? J Infect Dis 207: 1352-1358.
68 Douglass J., Osborne P.B., Cai Y.C., Wilkinson M., Christie M.J., Adelman J.P. (1990).
Characterization and functional expression of a rat genomic DNA clone encoding a
lymphocyte potassium channel. J Immunol 144: 4841-4850.
69 Duprat F., Guillemare E., Romey G., Fink M., Lesage F., Lazdunski M., Honore E.
(1995). Susceptibility of cloned K+ channels to reactive oxygen species. Proc Natl Acad
Sci U S A 92: 11796-11800.
93
70 Elliott M.A., Ford S.J., Prasad E., Dick L.J., Farmer H., Hogg P.J., Halbert G.W.
(2012). Pharmaceutical development of the novel arsenical based cancer therapeutic
GSAO for Phase I clinical trial. Int J Pharm 426: 67-75.
71 Falkson C.I., Falkson G. (1999). A phase II evaluation of clofazimine plus doxorubicin
in advanced, unresectable primary hepatocellular carcinoma. Oncology 57: 232-235.
72 Fridlender Z.G., Sun J., Kim S., Kapoor V., Cheng G., Ling L., Worthen G.S., Albelda
S.M. (2009). Polarization of tumor-associated neutrophil phenotype by TGF-beta: "N1"
versus "N2" TAN. Cancer Cell 16: 183-194.
73 Friederich P., Benzenberg D., Urban B.W. (2002). Bupivacaine inhibits human neuronal
Kv3 channels in SH-SY5Y human neuroblastoma cells. Br J Anaesth 88: 864-866.
74 Fukutomi Y., Maeda Y., Makino M. (2011). Apoptosis-inducing activity of clofazimine
in macrophages. Antimicrob Agents Chemother 55: 4000-4005.
75 Fulda S., Galluzzi L., Kroemer G. (2010). Targeting mitochondria for cancer therapy.
Nat Rev Drug Discov 9: 447-464.
76 Fulda S., Vucic D. (2012). Targeting IAP proteins for therapeutic intervention in cancer.
Nat Rev Drug Discov 11: 109-124.
77 Ganai S., Arenas R.B., Forbes N.S. (2009). Tumour-targeted delivery of TRAIL using
Salmonella typhimurium enhances breast cancer survival in mice. Br J Cancer 101:
1683-1691.
78 Ganesan V., Colombini M. (2010a). Regulation of ceramide channels by Bcl-2 family
proteins. FEBS Lett 584: 2128-2134.
79 Ganesan V., Perera M.N., Colombini D., Datskovskiy D., Chadha K., Colombini M.
(2010b). Ceramide and activated Bax act synergistically to permeabilize the
mitochondrial outer membrane. Apoptosis 15: 553-562.
80 Garcia-Calvo M., Leonard R.J., Novick J., Stevens S.P., Schmalhofer W., Kaczorowski
G.J., Garcia M.L. (1993). Purification, characterization, and biosynthesis of margatoxin,
a component of Centruroides margaritatus venom that selectively inhibits voltage-
dependent potassium channels. J Biol Chem 268: 18866-18874.
81 Gazula V.R., Strumbos J.G., Mei X., Chen H., Rahner C., Kaczmarek L.K. (2010).
Localization of Kv1.3 channels in presynaptic terminals of brainstem auditory neurons.
J Comp Neurol 518: 3205-3220.
82 Gilhar A., Bergman R., Assay B., Ullmann Y., Etzioni A. (2011). The beneficial effect
of blocking Kv1.3 in the psoriasiform SCID mouse model. J Invest Dermatol 131: 118-
124.
94
83 Giorgio M., Migliaccio E., Orsini F., Paolucci D., Moroni M., Contursi C., Pelliccia G.,
Luzi L., Minucci S., Marcaccio M., Pinton P., Rizzuto R., Bernardi P., Paolucci F.,
Pelicci P.G. (2005). Electron transfer between cytochrome c and p66Shc generates
reactive oxygen species that trigger mitochondrial apoptosis. Cell 122: 221-233.
84 Grissmer S., Dethlefs B., Wasmuth J.J., Goldin A.L., Gutman G.A., Cahalan M.D.,
Chandy K.G. (1990). Expression and chromosomal localization of a lymphocyte K+
channel gene. Proc Natl Acad Sci U S A 87: 9411-9415.
85 Grissmer S., Nguyen A.N., Cahalan M.D. (1993). Calcium-activated potassium
channels in resting and activated human T lymphocytes. Expression levels, calcium
dependence, ion selectivity, and pharmacology. J Gen Physiol 102: 601-630.
86 Grunnet M., Rasmussen H.B., Hay-Schmidt A., Klaerke D.A. (2003). The voltage-gated
potassium channel subunit, Kv1.3, is expressed in epithelia. Biochim Biophys Acta
1616: 85-94.
87 Gu X.Q., Pamenter M.E., Siemen D., Sun X., Haddad G.G. (2014). Mitochondrial but
not plasmalemmal BK channels are hypoxia-sensitive in human glioma. Glia 62: 504-
513.
88 Gulbins E., Szabo I., Baltzer K., Lang F. (1997). Ceramide-induced inhibition of T
lymphocyte voltage-gated potassium channel is mediated by tyrosine kinases. Proc Natl
Acad Sci U S A 94: 7661-7666.
89 Gulbins E., Sassi N., Grassme H., Zoratti M., Szabo I. (2010). Role of Kv1.3
mitochondrial potassium channel in apoptotic signalling in lymphocytes. Biochim
Biophys Acta 1797: 1251-1259.
90 Gutman G.A., Chandy K.G., Adelman J.P., Aiyar J., Bayliss D.A., Clapham D.E.,
Covarriubias M., Desir G.V., Furuichi K., Ganetzky B., Garcia M.L., Grissmer S., Jan
L.Y., Karschin A., Kim D., Kuperschmidt S., Kurachi Y., Lazdunski M., Lesage F.,
Lester H.A., McKinnon D., Nichols C.G., O'Kelly I., Robbins J., Robertson G.A., Rudy
B., Sanguinetti M., Seino S., Stuehmer W., Tamkun M.M., Vandenberg C.A., Wei A.,
Wulff H., Wymore R.S. (2003). International Union of Pharmacology. XLI.
Compendium of voltage-gated ion channels: potassium channels. Pharmacol Rev 55:
583-586.
91 Gutman G.A., Chandy K.G., Grissmer S., Lazdunski M., McKinnon D., Pardo L.A.,
Robertson G.A., Rudy B., Sanguinetti M.C., Stuhmer W., Wang X. (2005).
International Union of Pharmacology. LIII. Nomenclature and molecular relationships
of voltage-gated potassium channels. Pharmacol Rev 57: 473-508.
95
92 Hansen W., Hutzler M., Abel S., Alter C., Stockmann C., Kliche S., Albert J.,
Sparwasser T., Sakaguchi S., Westendorf A.M., Schadendorf D., Buer J., Helfrich I.
(2012). Neuropilin 1 deficiency on CD4+Foxp3+ regulatory T cells impairs mouse
melanoma growth. J Exp Med 209: 2001-2016.
93 Haraguchi N., Ishii H., Mimori K., Tanaka F., Ohkuma M., Kim H.M., Akita H.,
Takiuchi D., Hatano H., Nagano H., Barnard G.F., Doki Y., Mori M. (2010). CD13 is a
therapeutic target in human liver cancer stem cells. J Clin Invest 120: 3326-3339.
94 Hengartner M.O. (2000). The biochemistry of apoptosis. Nature 407: 770-776.
95 Hu C.L., Zeng X.M., Zhou M.H., Shi Y.T., Cao H., Mei Y.A. (2008). Kv 1.1 is
associated with neuronal apoptosis and modulated by protein kinase C in the rat
cerebellar granule cell. J Neurochem 106: 1125-1137.
96 Iverson S.L., Orrenius S. (2004). The cardiolipin-cytochrome c interaction and the
mitochondrial regulation of apoptosis. Arch Biochem Biophys 423: 37-46.
97 Jacobs V.L., Valdes P.A., Hickey W.F., De Leo J.A. (2011). Current review of in vivo
GBM rodent models: emphasis on the CNS-1 tumour model. ASN Neuro 3: e00063.
98 Jang S.H., Kang K.S., Ryu P.D., Lee S.Y. (2009). Kv1.3 voltage-gated K(+) channel
subunit as a potential diagnostic marker and therapeutic target for breast cancer. BMB
Rep 42: 535-539.
99 Jeon S.H., Kim S.H., Kim Y., Kim Y.S., Lim Y., Lee Y.H., Shin S.Y. (2011). The
tricyclic antidepressant imipramine induces autophagic cell death in U-87MG glioma
cells. Biochem Biophys Res Commun 413: 311-317.
100 Johnson D.R., O'Neill B.P. (2012). Glioblastoma survival in the United States before
and during the temozolomide era. J Neurooncol 107: 359-364.
101 Jurgensmeier J.M., Xie Z., Deveraux Q., Ellerby L., Bredesen D., Reed J.C. (1998). Bax
directly induces release of cytochrome c from isolated mitochondria. Proc Natl Acad
Sci U S A 95: 4997-5002.
102 Kalman K., Pennington M.W., Lanigan M.D., Nguyen A., Rauer H., Mahnir V.,
Paschetto K., Kem W.R., Grissmer S., Gutman G.A., Christian E.P., Cahalan M.D.,
Norton R.S., Chandy K.G. (1998). ShK-Dap22, a potent Kv1.3-specific
immunosuppressive polypeptide. J Biol Chem 273: 32697-32707.
103 Karat A.B., Jeevaratnam A., Karat S., Rao P.S. (1970). Double-blind controlled clinical
trial of clofazimine in reactive phases of lepromatous leprosy. Br Med J 1: 198-200.
104 Kerr J.F., Wyllie A.H., Currie A.R. (1972). Apoptosis: a basic biological phenomenon
with wide-ranging implications in tissue kinetics. Br J Cancer 26: 239-257.
96
105 Kirshner J.R., He S., Balasubramanyam V., Kepros J., Yang C.Y., Zhang M., Du Z.,
Barsoum J., Bertin J. (2008). Elesclomol induces cancer cell apoptosis through
oxidative stress. Mol Cancer Ther 7: 2319-2327.
106 Koeberle P.D., Wang Y., Schlichter L.C. (2010). Kv1.1 and Kv1.3 channels contribute
to the degeneration of retinal ganglion cells after optic nerve transection in vivo. Cell
Death Differ 17: 134-144.
107 Kong Q., Beel J.A., Lillehei K.O. (2000). A threshold concept for cancer therapy. Med
Hypotheses 55: 29-35.
108 Koni P.A., Khanna R., Chang M.C., Tang M.D., Kaczmarek L.K., Schlichter L.C.,
Flavella R.A. (2003). Compensatory anion currents in Kv1.3 channel-deficient
thymocytes. J Biol Chem 278: 39443-39451.
109 Koo G.C., Blake J.T., Talento A., Nguyen M., Lin S., Sirotina A., Shah K., Mulvany K.,
Hora D., Jr., Cunningham P., Wunderler D.L., McManus O.B., Slaughter R., Bugianesi
R., Felix J., Garcia M., Williamson J., Kaczorowski G., Sigal N.H., Springer M.S.,
Feeney W. (1997). Blockade of the voltage-gated potassium channel Kv1.3 inhibits
immune responses in vivo. J Immunol 158: 5120-5128.
110 Korsmeyer S.J., Wei M.C., Saito M., Weiler S., Oh K.J., Schlesinger P.H. (2000). Pro-
apoptotic cascade activates BID, which oligomerizes BAK or BAX into pores that result
in the release of cytochrome c. Cell Death Differ 7: 1166-1173.
111 Kosztka L., Rusznak Z., Nagy D., Nagy Z., Fodor J., Szucs G., Telek A., Gonczi M.,
Ruzsnavszky O., Szentandrassy N., Csernoch L. (2011). Inhibition of TASK-3
(KCNK9) channel biosynthesis changes cell morphology and decreases both DNA
content and mitochondrial function of melanoma cells maintained in cell culture.
Melanoma Res 21: 308-322.
112 Kovacs I., Pocsai K., Czifra G., Sarkadi L., Szucs G., Nemes Z., Rusznak Z. (2005).
TASK-3 immunoreactivity shows differential distribution in the human gastrointestinal
tract. Virchows Arch 446: 402-410.
113 Kundu-Raychaudhuri S., Chen Y.J., Wulff H., Raychaudhuri S.P. (2014). Kv1.3 in
psoriatic disease: PAP-1, a small molecule inhibitor of Kv1.3 is effective in the SCID
mouse psoriasis--xenograft model. J Autoimmun 55: 63-72.
114 Kuwana T., Mackey M.R., Perkins G., Ellisman M.H., Latterich M., Schneiter R.,
Green D.R., Newmeyer D.D. (2002). Bid, Bax, and lipids cooperate to form
supramolecular openings in the outer mitochondrial membrane. Cell 111: 331-342.
97
115 Lan M., Shi Y., Han Z., Hao Z., Pan Y., Liu N., Guo C., Hong L., Wang J., Qiao T., Fan
D. (2005). Expression of delayed rectifier potassium channels and their possible roles in
proliferation of human gastric cancer cells. Cancer Biol Ther 4: 1342-1347.
116 Lang F., Gulbins E., Szabo I., Lepple-Wienhues A., Huber S.M., Duranton C., Lang
K.S., Lang P.A., Wieder T. (2004). Cell volume and the regulation of apoptotic cell
death. J Mol Recognit 17: 473-480.
117 Lanigan M.D., Kalman K., Lefievre Y., Pennington M.W., Chandy K.G., Norton R.S.
(2002). Mutating a critical lysine in ShK toxin alters its binding configuration in the
pore-vestibule region of the voltage-gated potassium channel, Kv1.3. Biochemistry 41:
11963-11971.
118 Leanza L., Henry B., Sassi N., Zoratti M., Chandy K.G., Gulbins E., Szabo I. (2012).
Inhibitors of mitochondrial Kv1.3 channels induce Bax/Bak-independent death of
cancer cells. EMBO Mol Med 4: 577-593.
119 Leanza L., Trentin L., Becker K.A., Frezzato F., Zoratti M., Semenzato G., Gulbins E.,
Szabo I. (2013). Clofazimine, Psora-4 and PAP-1, inhibitors of the potassium channel
Kv1.3, as a new and selective therapeutic strategy in chronic lymphocytic leukemia.
Leukemia 27: 1782-1785.
120 Leanza L., O'Reilly P., Doyle A., Venturini E., Zoratti M., Szegezdi E., Szabo I.
(2014a). Correlation between potassium channel expression and sensitivity to drug-
induced cell death in tumor cell lines. Curr Pharm Des 20: 189-200.
121 Leanza L., Zoratti M., Gulbins E., Szabo I. (2014b). Mitochondrial ion channels as
oncological targets. Oncogene 33: 5569-5581.
122 Lebedeva I.V., Su Z.Z., Sarkar D., Gopalkrishnan R.V., Waxman S., Yacoub A., Dent
P., Fisher P.B. (2005). Induction of reactive oxygen species renders mutant and wild-
type K-ras pancreatic carcinoma cells susceptible to Ad.mda-7-induced apoptosis.
Oncogene 24: 585-596.
123 Leber B., Lin J., Andrews D.W. (2007). Embedded together: the life and death
consequences of interaction of the Bcl-2 family with membranes. Apoptosis 12: 897-
911.
124 Leidi M., Gotti E., Bologna L., Miranda E., Rimoldi M., Sica A., Roncalli M., Palumbo
G.A., Introna M., Golay J. (2009). M2 macrophages phagocytose rituximab-opsonized
leukemic targets more efficiently than m1 cells in vitro. J Immunol 182: 4415-4422.
125 Lewis C.E., Pollard J.W. (2006). Distinct role of macrophages in different tumor
microenvironments. Cancer Res 66: 605-612.

98
126 Li H., Zhu H., Xu C.J., Yuan J. (1998). Cleavage of BID by caspase 8 mediates the
mitochondrial damage in the Fas pathway of apoptosis. Cell 94: 491-501.
127 Li L.Y., Luo X., Wang X. (2001). Endonuclease G is an apoptotic DNase when released
from mitochondria. Nature 412: 95-99.
128 Li Y.Q., Chen P., Haimovitz-Friedman A., Reilly R.M., Wong C.S. (2003). Endothelial
apoptosis initiates acute blood-brain barrier disruption after ionizing radiation. Cancer
Res 63: 5950-5956.
129 Liu X., Kim C.N., Yang J., Jemmerson R., Wang X. (1996). Induction of apoptotic
program in cell-free extracts: requirement for dATP and cytochrome c. Cell 86: 147-
157.
130 Liu X., Chang Y., Reinhart P.H., Sontheimer H. (2002). Cloning and characterization of
glioma BK, a novel BK channel isoform highly expressed in human glioma cells. J
Neurosci 22: 1840-1849.
131 Long S.B., Tao X., Campbell E.B., MacKinnon R. (2007). Atomic structure of a
voltage-dependent K+ channel in a lipid membrane-like environment. Nature 450: 376-
382.
132 Louis D.N., Ohgaki H., Wiestler O.D., Cavenee W.K., Burger P.C., Jouvet A.,
Scheithauer B.W., Kleihues P. (2007). The 2007 WHO classification of tumours of the
central nervous system. Acta Neuropathol 114: 97-109.
133 Lutter M., Perkins G.A., Wang X. (2001). The pro-apoptotic Bcl-2 family member tBid
localizes to mitochondrial contact sites. BMC Cell Biol 2: 22.
134 Mackenzie A.B., Chirakkal H., North R.A. (2003). Kv1.3 potassium channels in human
alveolar macrophages. Am J Physiol Lung Cell Mol Physiol 285: L862-868.
135 Mackey J.P., Barnes J. (1974). Clofazimine in the treatment of discoid lupus
erythematosus. Br J Dermatol 91: 93-96.
136 MacKinnon R. (2003). Potassium channels. FEBS Lett 555: 62-65.
137 Mansfield R.E. (1974). Tissue concentrations of clofazimine (B663) in man. Am J Trop
Med Hyg 23: 1116-1119.
138 Mantovani A., Sozzani S., Locati M., Allavena P., Sica A. (2002). Macrophage
polarization: tumor-associated macrophages as a paradigm for polarized M2
mononuclear phagocytes. Trends Immunol 23: 549-555.
139 Mantovani A. (2010). Molecular pathways linking inflammation and cancer. Curr Mol
Med 10: 369-373.
140 Marchi S., Lupini L., Patergnani S., Rimessi A., Missiroli S., Bonora M., Bononi A.,
Corra F., Giorgi C., De Marchi E., Poletti F., Gafa R., Lanza G., Negrini M., Rizzuto R.,
99
Pinton P. (2013). Downregulation of the mitochondrial calcium uniporter by cancer-
related miR-25. Curr Biol 23: 58-63.
141 Martinez-Abundis E., Correa F., Pavon N., Zazueta C. (2009). Bax distribution into
mitochondrial detergent-resistant microdomains is related to ceramide and cholesterol
content in postischemic hearts. Febs J 276: 5579-5588.
142 Martinez-Caballero S., Dejean L.M., Kinnally M.S., Oh K.J., Mannella C.A., Kinnally
K.W. (2009). Assembly of the mitochondrial apoptosis-induced channel, MAC. J Biol
Chem 284: 12235-12245.
143 Martinou J.C., Youle R.J. (2011). Mitochondria in apoptosis: Bcl-2 family members and
mitochondrial dynamics. Dev Cell 21: 92-101.
144 Maruyama Y. (1987). A patch-clamp study of mammalian platelets and their voltage-
gated potassium current. J Physiol 391: 467-485.
145 Matheu M.P., Beeton C., Garcia A., Chi V., Rangaraju S., Safrina O., Monaghan K.,
Uemura M.I., Li D., Pal S., de la Maza L.M., Monuki E., Flugel A., Pennington M.W.,
Parker I., Chandy K.G., Cahalan M.D. (2008). Imaging of effector memory T cells
during a delayed-type hypersensitivity reaction and suppression by Kv1.3 channel
block. Immunity 29: 602-614.
146 Matteson D.R., Deutsch C. (1984). K channels in T lymphocytes: a patch clamp study
using monoclonal antibody adhesion. Nature 307: 468-471.
147 McCloskey C., Jones S., Amisten S., Snowden R.T., Kaczmarek L.K., Erlinge D.,
Goodall A.H., Forsythe I.D., Mahaut-Smith M.P. (2010). Kv1.3 is the exclusive
voltage-gated K+ channel of platelets and megakaryocytes: roles in membrane potential,
Ca2+ signalling and platelet count. J Physiol 588: 1399-1406.
148 Michelakis E.D., Hampl V., Nsair A., Wu X., Harry G., Haromy A., Gurtu R., Archer
S.L. (2002). Diversity in mitochondrial function explains differences in vascular oxygen
sensing. Circ Res 90: 1307-1315.
149 Michelakis E.D., Sutendra G., Dromparis P., Webster L., Haromy A., Niven E.,
Maguire C., Gammer T.L., Mackey J.R., Fulton D., Abdulkarim B., McMurtry M.S.,
Petruk K.C. (2010). Metabolic modulation of glioblastoma with dichloroacetate. Sci
Transl Med 2: 31ra34.
150 Montessuit S., Somasekharan S.P., Terrones O., Lucken-Ardjomande S., Herzig S.,
Schwarzenbacher R., Manstein D.J., Bossy-Wetzel E., Basanez G., Meda P., Martinou
J.C. (2010). Membrane remodeling induced by the dynamin-related protein Drp1
stimulates Bax oligomerization. Cell 142: 889-901.
100
151 Mourre C., Chernova M.N., Martin-Eauclaire M.F., Bessone R., Jacquet G., Gola M.,
Alper S.L., Crest M. (1999). Distribution in rat brain of binding sites of kaliotoxin, a
blocker of Kv1.1 and Kv1.3 alpha-subunits. J Pharmacol Exp Ther 291: 943-952.
152 Muchmore S.W., Sattler M., Liang H., Meadows R.P., Harlan J.E., Yoon H.S.,
Nettesheim D., Chang B.S., Thompson C.B., Wong S.L., Ng S.L., Fesik S.W. (1996).
X-ray and NMR structure of human Bcl-xL, an inhibitor of programmed cell death.
Nature 381: 335-341.
153 Murphy M.P. (2009). How mitochondria produce reactive oxygen species. Biochem J
417: 1-13.
154 Nathan C.F., Cohn Z.A. (1981). Antitumor effects of hydrogen peroxide in vivo. J Exp
Med 154: 1539-1553.
155 Neuwelt E.A., Barnett P.A., Bigner D.D., Frenkel E.P. (1982). Effects of adrenal
cortical steroids and osmotic blood-brain barrier opening on methotrexate delivery to
gliomas in the rodent: the factor of the blood-brain barrier. Proc Natl Acad Sci U S A
79: 4420-4423.
156 Newman E.A. (1993). Inward-rectifying potassium channels in retinal glial (Muller)
cells. J Neurosci 13: 3333-3345.
157 Nishikawa H., Sakaguchi S. (2010). Regulatory T cells in tumor immunity. Int J Cancer
127: 759-767.
158 O'Rourke B., Cortassa S., Aon M.A. (2005). Mitochondrial ion channels: gatekeepers of
life and death. Physiology (Bethesda) 20: 303-315.
159 Ohgaki H., Kleihues P. (2007). Genetic pathways to primary and secondary
glioblastoma. Am J Pathol 170: 1445-1453.
160 Olsen M.L., Sontheimer H. (2004). Mislocalization of Kir channels in malignant glia.
Glia 46: 63-73.
161 Ott M., Zhivotovsky B., Orrenius S. (2007). Role of cardiolipin in cytochrome c release
from mitochondria. Cell Death Differ 14: 1243-1247.
162 Ott M., Norberg E., Zhivotovsky B., Orrenius S. (2009). Mitochondrial targeting of
tBid/Bax: a role for the TOM complex? Cell Death Differ 16: 1075-1082.
163 Panyi G., Vamosi G., Bacso Z., Bagdany M., Bodnar A., Varga Z., Gaspar R., Matyus
L., Damjanovich S. (2004). Kv1.3 potassium channels are localized in the
immunological synapse formed between cytotoxic and target cells. Proc Natl Acad Sci
U S A 101: 1285-1290.
101
164 Pardo L.A., Gomez-Varela D., Major F., Sansuk K., Leurs R., Downie B.R., Tietze
L.F., Stuhmer W. (2012). Approaches targeting K(V)10.1 open a novel window for
cancer diagnosis and therapy. Curr Med Chem 19: 675-682.
165 Peixoto P.M., Dejean L.M., Kinnally K.W. (2012). The therapeutic potential of
mitochondrial channels in cancer, ischemia-reperfusion injury, and neurodegeneration.
Mitochondrion 12: 14-23.
166 Pelicano H., Feng L., Zhou Y., Carew J.S., Hileman E.O., Plunkett W., Keating M.J.,
Huang P. (2003). Inhibition of mitochondrial respiration: a novel strategy to enhance
drug-induced apoptosis in human leukemia cells by a reactive oxygen species-mediated
mechanism. J Biol Chem 278: 37832-37839.
167 Pennington M.W., Mahnir V.M., Krafte D.S., Zaydenberg I., Byrnes M.E., Khaytin I.,
Crowley K., Kem W.R. (1996). Identification of three separate binding sites on SHK
toxin, a potent inhibitor of voltage-dependent potassium channels in human T-
lymphocytes and rat brain. Biochem Biophys Res Commun 219: 696-701.
168 Pillozzi S., Masselli M., De Lorenzo E., Accordi B., Cilia E., Crociani O., Amedei A.,
Veltroni M., D'Amico M., Basso G., Becchetti A., Campana D., Arcangeli A. (2011).
Chemotherapy resistance in acute lymphoblastic leukemia requires hERG1 channels
and is overcome by hERG1 blockers. Blood 117: 902-914.
169 Preussat K., Beetz C., Schrey M., Kraft R., Wolfl S., Kalff R., Patt S. (2003).
Expression of voltage-gated potassium channels Kv1.3 and Kv1.5 in human gliomas.
Neurosci Lett 346: 33-36.
170 Qian B.Z., Pollard J.W. (2010). Macrophage diversity enhances tumor progression and
metastasis. Cell 141: 39-51.
171 Qian S., Wang W., Yang L., Huang H.W. (2008). Structure of transmembrane pore
induced by Bax-derived peptide: evidence for lipidic pores. Proc Natl Acad Sci U S A
105: 17379-17383.
172 Quast S.A., Berger A., Buttstadt N., Friebel K., Schonherr R., Eberle J. (2012). General
Sensitization of melanoma cells for TRAIL-induced apoptosis by the potassium channel
inhibitor TRAM-34 depends on release of SMAC. PLoS One 7: e39290.
173 Ralph S.J., Rodriguez-Enriquez S., Neuzil J., Moreno-Sanchez R. (2010). Bioenergetic
pathways in tumor mitochondria as targets for cancer therapy and the importance of the
ROS-induced apoptotic trigger. Mol Aspects Med 31: 29-59.
174 Ramanathan B., Jan K.Y., Chen C.H., Hour T.C., Yu H.J., Pu Y.S. (2005). Resistance to
paclitaxel is proportional to cellular total antioxidant capacity. Cancer Res 65: 8455-
8460.
102
175 Ransom C.B., Sontheimer H. (2001). BK channels in human glioma cells. J
Neurophysiol 85: 790-803.
176 Ransom C.B., Liu X., Sontheimer H. (2002). BK channels in human glioma cells have
enhanced calcium sensitivity. Glia 38: 281-291.
177 Rauer H., Pennington M., Cahalan M., Chandy K.G. (1999). Structural conservation of
the pores of calcium-activated and voltage-gated potassium channels determined by a
sea anemone toxin. J Biol Chem 274: 21885-21892.
178 Ren Y.R., Pan F., Parvez S., Fleig A., Chong C.R., Xu J., Dang Y., Zhang J., Jiang H.,
Penner R., Liu J.O. (2008). Clofazimine inhibits human Kv1.3 potassium channel by
perturbing calcium oscillation in T lymphocytes. PLoS One 3: e4009.
179 Rusznak Z., Bakondi G., Kosztka L., Pocsai K., Dienes B., Fodor J., Telek A., Gonczi
M., Szucs G., Csernoch L. (2008). Mitochondrial expression of the two-pore domain
TASK-3 channels in malignantly transformed and non-malignant human cells.
Virchows Arch 452: 415-426.
180 Salkoff L., Wyman R. (1981). Genetic modification of potassium channels in
Drosophila Shaker mutants. Nature 293: 228-230.
181 Sands S.B., Lewis R.S., Cahalan M.D. (1989). Charybdotoxin blocks voltage-gated K+
channels in human and murine T lymphocytes. J Gen Physiol 93: 1061-1074.
182 Sassi N., Biasutto L., Mattarei A., Carraro M., Giorgio V., Citta A., Bernardi P., Garbisa
S., Szabo I., Paradisi C., Zoratti M. (2012). Cytotoxicity of a mitochondriotropic
quercetin derivative: mechanisms. Biochim Biophys Acta 1817: 1095-1106.
183 Satsoura D., Kucerka N., Shivakumar S., Pencer J., Griffiths C., Leber B., Andrews
D.W., Katsaras J., Fradin C. (2012). Interaction of the full-length Bax protein with
biomimetic mitochondrial liposomes: a small-angle neutron scattering and fluorescence
study. Biochim Biophys Acta 1818: 384-401.
184 Sattler M., Liang H., Nettesheim D., Meadows R.P., Harlan J.E., Eberstadt M., Yoon
H.S., Shuker S.B., Chang B.S., Minn A.J., Thompson C.B., Fesik S.W. (1997).
Structure of Bcl-xL-Bak peptide complex: recognition between regulators of apoptosis.
Science 275: 983-986.
185 Schmitz A., Sankaranarayanan A., Azam P., Schmidt-Lassen K., Homerick D., Hansel
W., Wulff H. (2005). Design of PAP-1, a selective small molecule Kv1.3 blocker, for
the suppression of effector memory T cells in autoimmune diseases. Mol Pharmacol 68:
1254-1270.
186 Scorrano L. (2009). Opening the doors to cytochrome c: changes in mitochondrial shape
and apoptosis. Int J Biochem Cell Biol 41: 1875-1883.
103
187 Shalapour S., Font-Burgada J., Di Caro G., Zhong Z., Sanchez-Lopez E., Dhar D.,
Willimsky G., Ammirante M., Strasner A., Hansel D.E., Jamieson C., Kane C.J., Klatte
T., Birner P., Kenner L., Karin M. (2015). Immunosuppressive plasma cells impede T-
cell-dependent immunogenic chemotherapy. Nature 521: 94-98.
188 Shoshan-Barmatz V., Keinan N., Abu-Hamad S., Tyomkin D., Aram L. (2010).
Apoptosis is regulated by the VDAC1 N-terminal region and by VDAC
oligomerization: release of cytochrome c, AIF and Smac/Diablo. Biochim Biophys Acta
1797: 1281-1291.
189 Shoudai K., Nonaka K., Maeda M., Wang Z.M., Jeong H.J., Higashi H., Murayama N.,
Akaike N. (2007). Effects of various K+ channel blockers on spontaneous glycine
release at rat spinal neurons. Brain Res 1157: 11-22.
190 Sica A., Larghi P., Mancino A., Rubino L., Porta C., Totaro M.G., Rimoldi M., Biswas
S.K., Allavena P., Mantovani A. (2008). Macrophage polarization in tumour
progression. Semin Cancer Biol 18: 349-355.
191 Siegal T., Pfeffer M.R., Meltzer A., Shezen E., Nimrod A., Ezov N., Ovadia H. (1996).
Cellular and secretory mechanisms related to delayed radiation-induced microvessel
dysfunction in the spinal cord of rats. Int J Radiat Oncol Biol Phys 36: 649-659.
192 Simamura E., Shimada H., Ishigaki Y., Hatta T., Higashi N., Hirai K. (2008).
Bioreductive activation of quinone antitumor drugs by mitochondrial voltage-dependent
anion channel 1. Anat Sci Int 83: 261-266.
193 Siskind L.J., Mullen T.D., Romero Rosales K., Clarke C.J., Hernandez-Corbacho M.J.,
Edinger A.L., Obeid L.M. (2010). The BCL-2 protein BAK is required for long-chain
ceramide generation during apoptosis. J Biol Chem 285: 11818-11826.
194 Sriskanthadevan S., Jeyaraju D.V., Chung T.E., Prabha S., Xu W., Skrtic M., Jhas B.,
Hurren R., Gronda M., Wang X., Jitkova Y., Sukhai M.A., Lin F.H., Maclean N.,
Laister R., Goard C.A., Mullen P.J., Xie S., Penn L.Z., Rogers I.M., Dick J.E., Minden
M.D., Schimmer A.D. (2015). AML cells have low spare reserve capacity in their
respiratory chain that renders them susceptible to oxidative metabolic stress. Blood 125:
2120-2130.
195 Stupp R., Mason W.P., van den Bent M.J., Weller M., Fisher B., Taphoorn M.J.,
Belanger K., Brandes A.A., Marosi C., Bogdahn U., Curschmann J., Janzer R.C.,
Ludwin S.K., Gorlia T., Allgeier A., Lacombe D., Cairncross J.G., Eisenhauer E.,
Mirimanoff R.O. (2005). Radiotherapy plus concomitant and adjuvant temozolomide
for glioblastoma. N Engl J Med 352: 987-996.
104
196 Suh K.S., Malik M., Shukla A., Ryscavage A., Wright L., Jividen K., Crutchley J.M.,
Dumont R.A., Fernandez-Salas E., Webster J.D., Simpson R.M., Yuspa S.H. (2012).
CLIC4 is a tumor suppressor for cutaneous squamous cell cancer. Carcinogenesis 33:
986-995.
197 Susin S.A., Lorenzo H.K., Zamzami N., Marzo I., Snow B.E., Brothers G.M., Mangion
J., Jacotot E., Costantini P., Loeffler M., Larochette N., Goodlett D.R., Aebersold R.,
Siderovski D.P., Penninger J.M., Kroemer G. (1999). Molecular characterization of
mitochondrial apoptosis-inducing factor. Nature 397: 441-446.
198 Swanson R., Marshall J., Smith J.S., Williams J.B., Boyle M.B., Folander K., Luneau
C.J., Antanavage J., Oliva C., Buhrow S.A., et al. (1990). Cloning and expression of
cDNA and genomic clones encoding three delayed rectifier potassium channels in rat
brain. Neuron 4: 929-939.
199 Swartz K.J., MacKinnon R. (1997). Hanatoxin modifies the gating of a voltage-
dependent K+ channel through multiple binding sites. Neuron 18: 665-673.
200 Swartz K.J. (2007). Tarantula toxins interacting with voltage sensors in potassium
channels. Toxicon 49: 213-230.
201 Szabo I., Gulbins E., Apfel H., Zhang X., Barth P., Busch A.E., Schlottmann K., Pongs
O., Lang F. (1996). Tyrosine phosphorylation-dependent suppression of a voltage-gated
K+ channel in T lymphocytes upon Fas stimulation. J Biol Chem 271: 20465-20469.
202 Szabo I., Nilius B., Zhang X., Busch A.E., Gulbins E., Suessbrich H., Lang F. (1997).
Inhibitory effects of oxidants on n-type K+ channels in T lymphocytes and Xenopus
oocytes. Pflugers Arch 433: 626-632.
203 Szabo I., Bock J., Jekle A., Soddemann M., Adams C., Lang F., Zoratti M., Gulbins E.
(2005). A novel potassium channel in lymphocyte mitochondria. J Biol Chem 280:
12790-12798.
204 Szabo I., Bock J., Grassme H., Soddemann M., Wilker B., Lang F., Zoratti M., Gulbins
E. (2008). Mitochondrial potassium channel Kv1.3 mediates Bax-induced apoptosis in
lymphocytes. Proc Natl Acad Sci U S A 105: 14861-14866.
205 Szabo I., Zoratti M., Gulbins E. (2010). Contribution of voltage-gated potassium
channels to the regulation of apoptosis. FEBS Lett 584: 2049-2056.
206 Szabo I., Soddemann M., Leanza L., Zoratti M., Gulbins E. (2011). Single-point
mutations of a lysine residue change function of Bax and Bcl-xL expressed in Bax- and
Bak-less mouse embryonic fibroblasts: novel insights into the molecular mechanisms of
Bax-induced apoptosis. Cell Death Differ 18: 427-438.
105
207 Szatrowski T.P., Nathan C.F. (1991). Production of large amounts of hydrogen peroxide
by human tumor cells. Cancer Res 51: 794-798.
208 Teng M.W., Swann J.B., Koebel C.M., Schreiber R.D., Smyth M.J. (2008). Immune-
mediated dormancy: an equilibrium with cancer. J Leukoc Biol 84: 988-993.
209 Terrones O., Antonsson B., Yamaguchi H., Wang H.G., Liu J., Lee R.M., Herrmann A.,
Basanez G. (2004). Lipidic pore formation by the concerted action of proapoptotic BAX
and tBID. J Biol Chem 279: 30081-30091.
210 Thomas D., Bloehs R., Koschny R., Ficker E., Sykora J., Kiehn J., Schlomer K., Gierten
J., Kathofer S., Zitron E., Scholz E.P., Kiesecker C., Katus H.A., Karle C.A. (2008).
Doxazosin induces apoptosis of cells expressing hERG K+ channels. Eur J Pharmacol
579: 98-103.
211 Thomas E.D., Clift R.A., Hersman J., Sanders J.E., Stewart P., Buckner C.D., Fefer A.,
McGuffin R., Smith J.W., Storb R. (1982). Marrow transplantation for acute
nonlymphoblastic leukemic in first remission using fractionated or single-dose
irradiation. Int J Radiat Oncol Biol Phys 8: 817-821.
212 Thompson C.B. (1995). Apoptosis in the pathogenesis and treatment of disease. Science
267: 1456-1462.
213 Toyokuni S., Okamoto K., Yodoi J., Hiai H. (1995). Persistent oxidative stress in
cancer. FEBS Lett 358: 1-3.
214 Treptow W., Maigret B., Chipot C., Tarek M. (2004). Coupled motions between pore
and voltage-sensor domains: a model for Shaker B, a voltage-gated potassium channel.
Biophys J 87: 2365-2379.
215 Tsujimoto Y., Shimizu S. (2000). VDAC regulation by the Bcl-2 family of proteins.
Cell Death Differ 7: 1174-1181.
216 Tsujimoto Y. (2003). Cell death regulation by the Bcl-2 protein family in the
mitochondria. J Cell Physiol 195: 158-167.
217 Tytgat J. (1994). Mutations in the P-region of a mammalian potassium channel (RCK1):
a comparison with the Shaker potassium channel. Biochem Biophys Res Commun 203:
513-518.
218 Van Rensburg C.E., Anderson R., Myer M.S., Joone G.K., O'Sullivan J.F. (1994). The
riminophenazine agents clofazimine and B669 reverse acquired multidrug resistance in
a human lung cancer cell line. Cancer Lett 85: 59-63.
219 Vaux D.L., Cory S., Adams J.M. (1988). Bcl-2 gene promotes haemopoietic cell
survival and cooperates with c-myc to immortalize pre-B cells. Nature 335: 440-442.

106
220 Venkataraman S., Alimova I., Fan R., Harris P., Foreman N., Vibhakar R. (2010).
MicroRNA 128a increases intracellular ROS level by targeting Bmi-1 and inhibits
medulloblastoma cancer cell growth by promoting senescence. PLoS One 5: e10748.
221 Vennekamp J., Wulff H., Beeton C., Calabresi P.A., Grissmer S., Hansel W., Chandy
K.G. (2004). Kv1.3-blocking 5-phenylalkoxypsoralens: a new class of
immunomodulators. Mol Pharmacol 65: 1364-1374.
222 Vicente R., Escalada A., Coma M., Fuster G., Sanchez-Tillo E., Lopez-Iglesias C., Soler
C., Solsona C., Celada A., Felipe A. (2003). Differential voltage-dependent K+ channel
responses during proliferation and activation in macrophages. J Biol Chem 278: 46307-
46320.
223 Vicente R., Escalada A., Villalonga N., Texido L., Roura-Ferrer M., Martin-Satue M.,
Lopez-Iglesias C., Soler C., Solsona C., Tamkun M.M., Felipe A. (2006). Association
of Kv1.5 and Kv1.3 contributes to the major voltage-dependent K+ channel in
macrophages. J Biol Chem 281: 37675-37685.
224 Walczak H., Krammer P.H. (2000). The CD95 (APO-1/Fas) and the TRAIL (APO-2L)
apoptosis systems. Exp Cell Res 256: 58-66.
225 Wang H., Zhang Y., Cao L., Han H., Wang J., Yang B., Nattel S., Wang Z. (2002).
HERG K+ channel, a regulator of tumor cell apoptosis and proliferation. Cancer Res 62:
4843-4848.
226 Wettwer E., Hala O., Christ T., Heubach J.F., Dobrev D., Knaut M., Varro A., Ravens
U. (2004). Role of IKur in controlling action potential shape and contractility in the
human atrium: influence of chronic atrial fibrillation. Circulation 110: 2299-2306.
227 Willis S.N., Fletcher J.I., Kaufmann T., van Delft M.F., Chen L., Czabotar P.E., Ierino
H., Lee E.F., Fairlie W.D., Bouillet P., Strasser A., Kluck R.M., Adams J.M., Huang
D.C. (2007). Apoptosis initiated when BH3 ligands engage multiple Bcl-2 homologs,
not Bax or Bak. Science 315: 856-859.
228 Wolburg H., Noell S., Fallier-Becker P., Mack A.F., Wolburg-Buchholz K. (2012). The
disturbed blood-brain barrier in human glioblastoma. Mol Aspects Med 33: 579-589.
229 Wu X., Xu R., Cao M., Ruan L., Wang X., Zhang C. (2015). Effect of the Kv1.3
voltage-gated potassium channel blocker PAP-1 on the initiation and progress of
atherosclerosis in a rat model. Heart Vessels 30: 108-114.
230 Wulff H., Beeton C., Chandy K.G. (2003). Potassium channels as therapeutic targets for
autoimmune disorders. Curr Opin Drug Discov Devel 6: 640-647.
107
231 Xie J., Wang B.S., Yu D.H., Lu Q., Ma J., Qi H., Fang C., Chen H.Z. (2011).
Dichloroacetate shifts the metabolism from glycolysis to glucose oxidation and exhibits
synergistic growth inhibition with cisplatin in HeLa cells. Int J Oncol 38: 409-417.
232 Xu J., Koni P.A., Wang P., Li G., Kaczmarek L., Wu Y., Li Y., Flavell R.A., Desir G.V.
(2003). The voltage-gated potassium channel Kv1.3 regulates energy homeostasis and
body weight. Hum Mol Genet 12: 551-559.
233 Xu J.C., Wang P.L., Li Y.Y., Li G.Y., Kaczmarek L.K., Wu Y.L., Koni P.A., Flavell
R.A., Desir G.V. (2004). The voltage-gated potassium channel Kv1.3 regulates
peripheral insulin sensitivity. Proc Natl Acad Sci U S A 101: 3112-3117.
234 Xu W., Liu Y., Wang S., McDonald T., Van Eyk J.E., Sidor A., O'Rourke B. (2002).
Cytoprotective role of Ca2+- activated K+ channels in the cardiac inner mitochondrial
membrane. Science 298: 1029-1033.
235 Youle R.J., Strasser A. (2008). The BCL-2 protein family: opposing activities that
mediate cell death. Nat Rev Mol Cell Biol 9: 47-59.
236 Yu K., Fu W., Liu H., Luo X., Chen K.X., Ding J., Shen J., Jiang H. (2004).
Computational simulations of interactions of scorpion toxins with the voltage-gated
potassium ion channel. Biophys J 86: 3542-3555.
237 Zoratti M., Szabo I. (1995). The mitochondrial permeability transition. Biochim
Biophys Acta 1241: 139-176.
108
PUBLICATIONS AND CONFERENCES
Leanza L, Venturini E, Kadow S, Carpinteiro A, Gulbins E, Becker KA. Targeting a
mitochondrial potassium channel to fight cancer. Cell Calcium 2015 Jul 1. Review.
Leanza L, O' Reilly P, Doyle A, Venturini E, Zoratti M, Szegezdi E, Szabo I. Correlation
between potassium channel expression and sensitivity to drug-induced cell death in tumor cell
lines. Curr Pharm Des. 2014; 20(2):189-200.
European Cell Death Organization (ECDO) 2014, Oct, Crete (Greece): Poster presentation
with the title: ‘Targeting mitochondrial potassium channel Kv1.3 to reduce glioblastoma’.
Research day at the University of Duisburg-Essen 2014, Nov (Medicine Faculty): Poster
presentation.
109
ACKNOWLEDGEMENTS
I would firstly like to thank Prof. Dr. Erich Gulbins for giving me the opportunity to do my
PhD in his laboratory under his excellent scientific guidance.
Secondly, I would like to thank my former supervisor, Prof. Dr. Ildikó Szabó, for suggesting
me such a good laboratory and for supporting me throughout the work.
I am very grateful to Dr. Katrin Becker-Flegler for her dedicated personal and academic
support, and for her enthusiasm for research and life.
I am particularly thankful to Dr. Luigi Leanza, for his constant presence and precious
suggestions, which helped me to surpass some critical moments. Further, I would like to thank
him, Dr. Mario Zoratti and Dr. Michele Azzolini for our collaboration with the Department of
Biomedical Sciences and the Department of Chemical Sciences in Padua (Italy). Moreover, I
would like to thank the IMCES of Essen.
I thank all my colleagues, who helped me in the laboratory: Simone Keitsch, Barbara Wilker,
Carolin Sehl, Matthias Soddemann, Melanie Kramer, Gabi Hessler, Bärbel Edelmann,
Barbara Pollmeier, Deepa Sharma, Nadine Beckmann, Li Cao, Huiming Peng, Andrea Riehle,
Dr. Alexander Carpinteiro, Dr. Stephanie Kadow, Dr. Heike Grassmé, Bettina Peter, Claudine
Kühn, Hannelore Disselhoff.
My particular thanks go to Siegfried Moyrer for his constant help throughout these years.
Finally, I would like to thank all my friends in Essen and farer, for their unconditioned
friendship and love, who made me a better person and made this place a nice world to live in.
I will be forever grateful to my family, who always sustained me and never let me give up.
110
Erklärung:
Hiermit erkläre ich, gem. § 6 Abs. 2, g der Promotionsordnung der Fakultät für Biologie zur
Erlangung der Dr. rer. nat., dass ich das Arbeitsgebiet, dem das Thema „Kv1.3 inhibitors in
the treatment of glioma and melanoma“ zuzuordnen ist, in Forschung und Lehre vertrete und
den Antrag von Elisa Venturini befürworte.
Essen, den ________ ______________________ ________________________________
Prof. Dr. E. Gulbins - Unterschrift d. wissenschaftl. Betreuers
Mitglied der Universität Duisburg-Essen
Erklärung:
Hiermit erkläre ich, gem. § 7 Abs. 2, d und f der Promotionsordnung der Fakultät für Biologie
zur Erlangung des Dr. rer. nat., dass ich die vorliegende Dissertation selbständig verfasst und
mich keiner anderen als der angegebenen Hilfsmittel bedient habe und alle wörtlich oder
inhaltlich übernommenen Stellen als solche gekennzeichnet habe.
Essen, den _________________ ______________________________
Unterschrift des/r Doktoranden/in
Erklärung:
Hiermit erkläre ich, gem. § 7 Abs. 2, e und g der Promotionsordnung der Fakultät für Biologie
zur Erlangung des Dr. rer. nat., dass ich keine anderen Promotionen bzw. Promotionsversuche
in der Vergangenheit durchgeführt habe, dass diese Arbeit von keiner anderen Fakultät
abgelehnt worden ist, und dass ich die Dissertation nur in diesem Verfahren einreiche.
Essen, den _________________ ______________________________
Unterschrift des/r Doktoranden/in