Embed Size (px)
Citation preview
“KZN as a prosperous Province with healthy, secure and skilled population, living in dignity and harmony, acting as a gateway between Africa and the World”
KwaZulu-Natal
1
THE KZN PROVINCIAL PLANNING
COMMISSION AND THE PROVINCIAL
GROWTH AND DEVELOPMENT
STRATEGY AND PLAN14 September 2017
By 2035 KwaZulu-Natal will be a prosperous Province with
a healthy, secure and skilled population, living in dignity
and harmony, acting as a gateway to Africa and the World.
“KZN as a prosperous Province with healthy, secure and skilled population, living in dignity and harmony, acting as a gateway between Africa and the World”
1. Establishment of the Provincial Planning
Commission;
2. Background to the PGDS/P - Timeline since
2011;
3. The 2016 PGDS;
4. Moving from Strategy to Plan - The 2017/18
PGDP;
5. Catalytic Projects; and
6. Institutional framework for implementation and
continued refinement.
2
OUTLINE OF PRESENTATION
One Province – One Plan – One Future
“KZN as a prosperous Province with healthy, secure and skilled population, living in dignity and harmony, acting as a gateway between Africa and the World”3
1.
THE KZN PLANNING
COMMISSION
“KZN as a prosperous Province with healthy, secure and skilled population, living in dignity and harmony, acting as a gateway between Africa and the World”
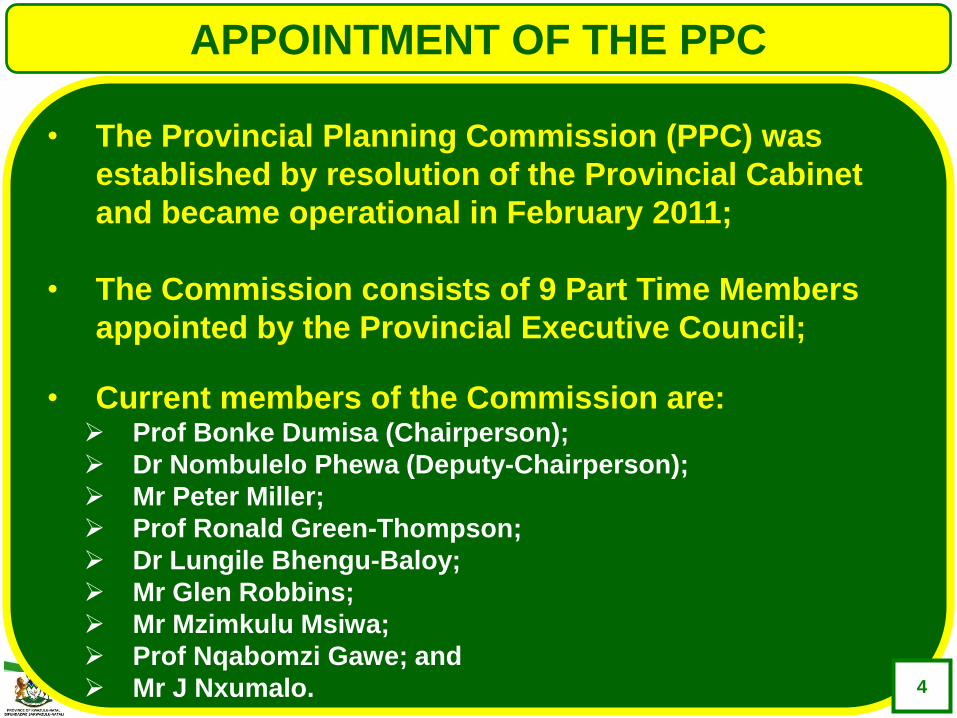
• The Provincial Planning Commission (PPC) was
established by resolution of the Provincial Cabinet
and became operational in February 2011;
• The Commission consists of 9 Part Time Members
appointed by the Provincial Executive Council;
• Current members of the Commission are: Prof Bonke Dumisa (Chairperson);
Dr Nombulelo Phewa (Deputy-Chairperson);
Mr Peter Miller;
Prof Ronald Green-Thompson;
Dr Lungile Bhengu-Baloy;
Mr Glen Robbins;
Mr Mzimkulu Msiwa;
Prof Nqabomzi Gawe; and
Mr J Nxumalo. 4
APPOINTMENT OF THE PPC
“KZN as a prosperous Province with healthy, secure and skilled population, living in dignity and harmony, acting as a gateway between Africa and the World”
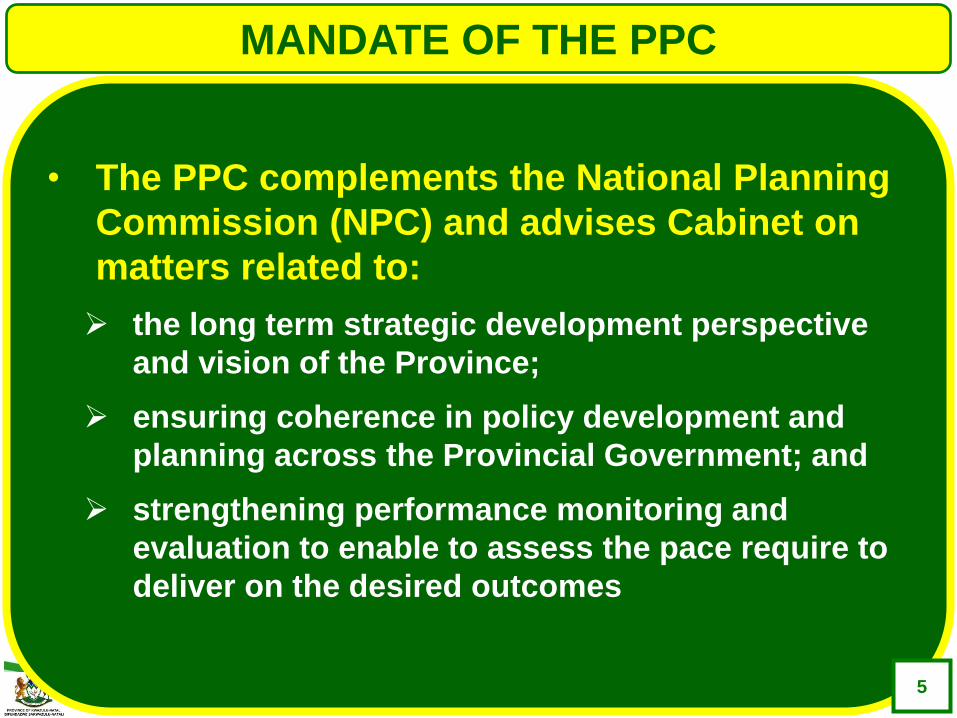
• The PPC complements the National Planning
Commission (NPC) and advises Cabinet on
matters related to:
the long term strategic development perspective
and vision of the Province;
ensuring coherence in policy development and
planning across the Provincial Government; and
strengthening performance monitoring and
evaluation to enable to assess the pace require to
deliver on the desired outcomes
5
MANDATE OF THE PPC
“KZN as a prosperous Province with healthy, secure and skilled population, living in dignity and harmony, acting as a gateway between Africa and the World”6
2.
TIMELINE SINCE 2011
“KZN as a prosperous Province with healthy, secure and skilled population, living in dignity and harmony, acting as a gateway between Africa and the World”7
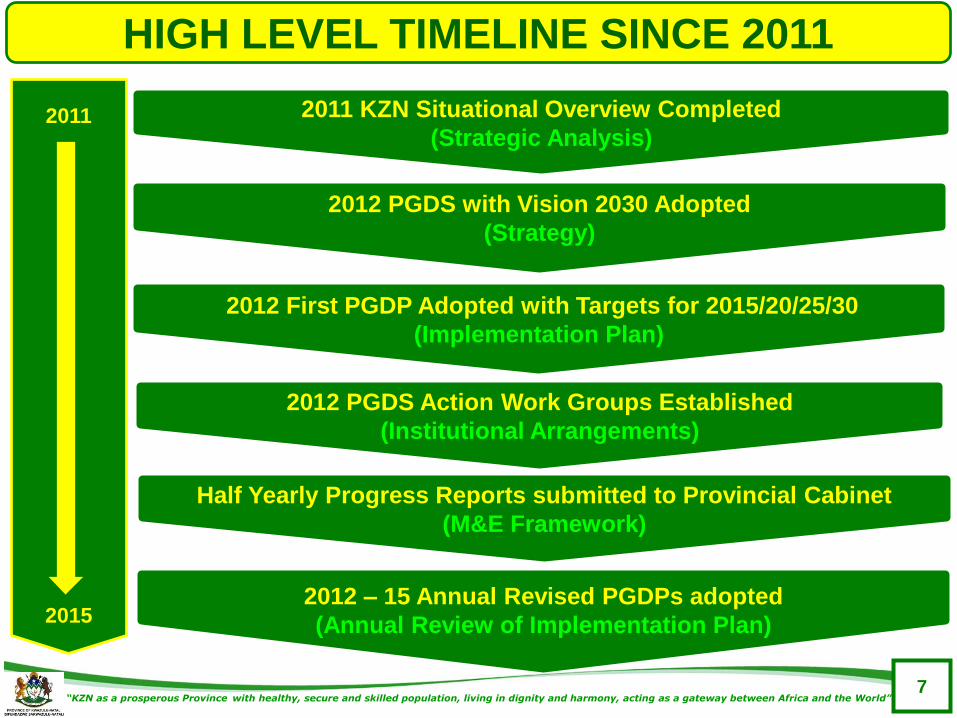
HIGH LEVEL TIMELINE SINCE 2011
2012 PGDS with Vision 2030 Adopted
(Strategy)
2011 KZN Situational Overview Completed
(Strategic Analysis)
2012 PGDS Action Work Groups Established
(Institutional Arrangements)
2012 – 15 Annual Revised PGDPs adopted
(Annual Review of Implementation Plan)
2011
2015
Half Yearly Progress Reports submitted to Provincial Cabinet
(M&E Framework)
2012 First PGDP Adopted with Targets for 2015/20/25/30
(Implementation Plan)
“KZN as a prosperous Province with healthy, secure and skilled population, living in dignity and harmony, acting as a gateway between Africa and the World”8
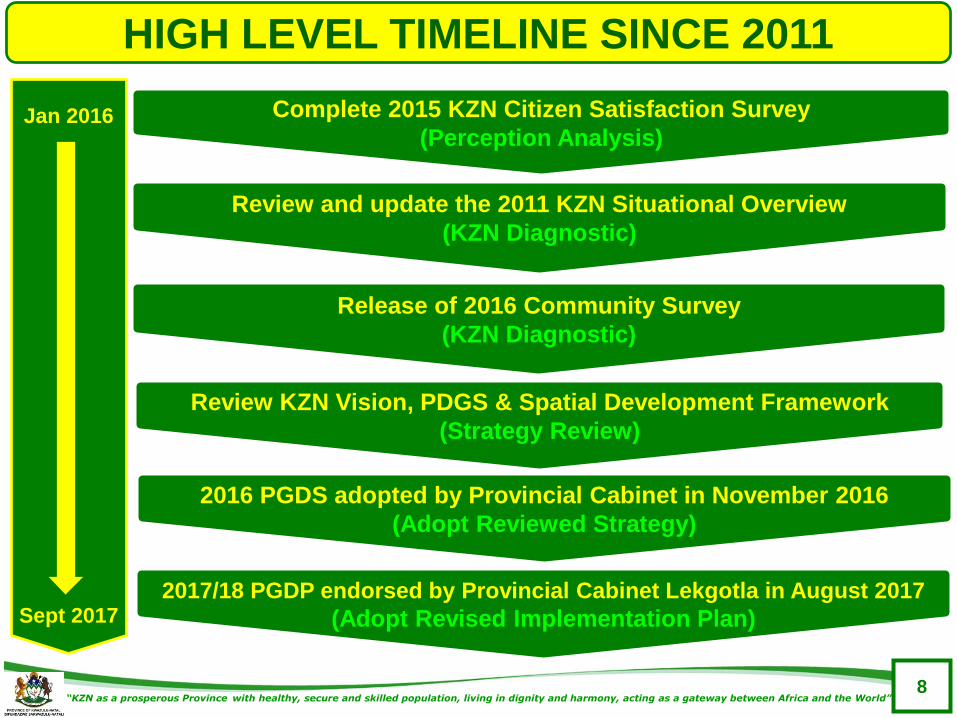
HIGH LEVEL TIMELINE SINCE 2011
Review and update the 2011 KZN Situational Overview
(KZN Diagnostic)
Complete 2015 KZN Citizen Satisfaction Survey
(Perception Analysis)
Review KZN Vision, PDGS & Spatial Development Framework
(Strategy Review)
2017/18 PGDP endorsed by Provincial Cabinet Lekgotla in August 2017
(Adopt Revised Implementation Plan)
Jan 2016
Sept 2017
2016 PGDS adopted by Provincial Cabinet in November 2016
(Adopt Reviewed Strategy)
Release of 2016 Community Survey
(KZN Diagnostic)
“KZN as a prosperous Province with healthy, secure and skilled population, living in dignity and harmony, acting as a gateway between Africa and the World”9
3.
THE 2016 PGDSNOW FOCUSSING ON VISION 2035
“KZN as a prosperous Province with healthy, secure and skilled population, living in dignity and harmony, acting as a gateway to Africa and the World”
SD
Gs
10
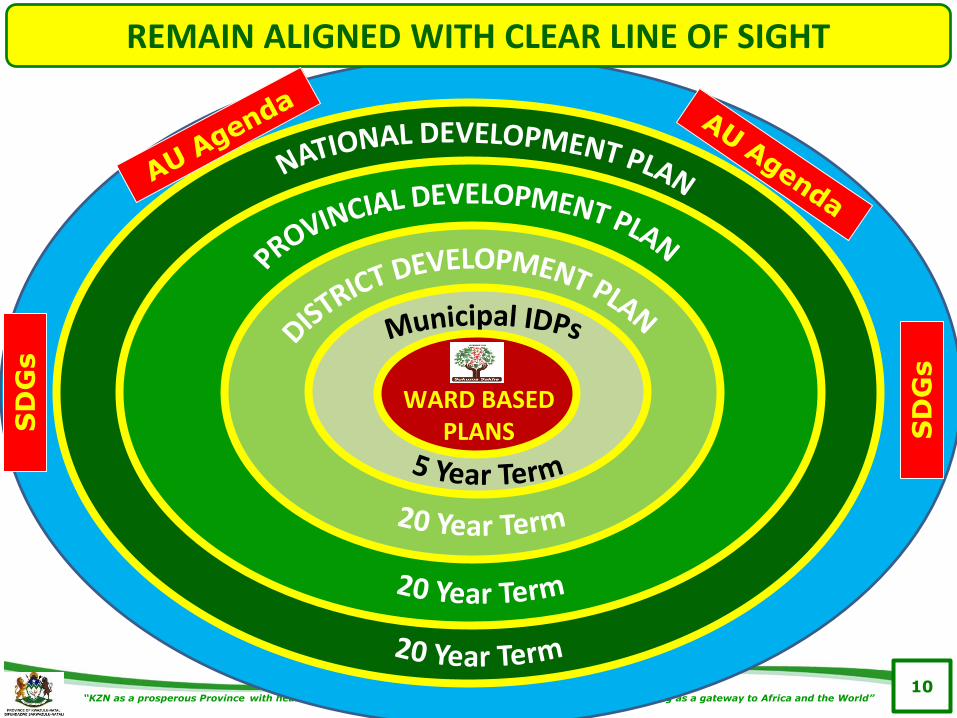
REMAIN ALIGNED WITH CLEAR LINE OF SIGHT
WARD BASED PLANSS
DG
s
“KZN as a prosperous Province with healthy, secure and skilled population, living in dignity and harmony, acting as a gateway between Africa and the World”11
KZN VISION 2035
“By 2035 KwaZulu-Natal will be a prosperous Province with a healthy,
secure and skilled population, living in dignity and harmony, acting as a gateway to Africa and the World”
“KZN as a prosperous Province with healthy, secure and skilled population, living in dignity and harmony, acting as a gateway between Africa and the World”12
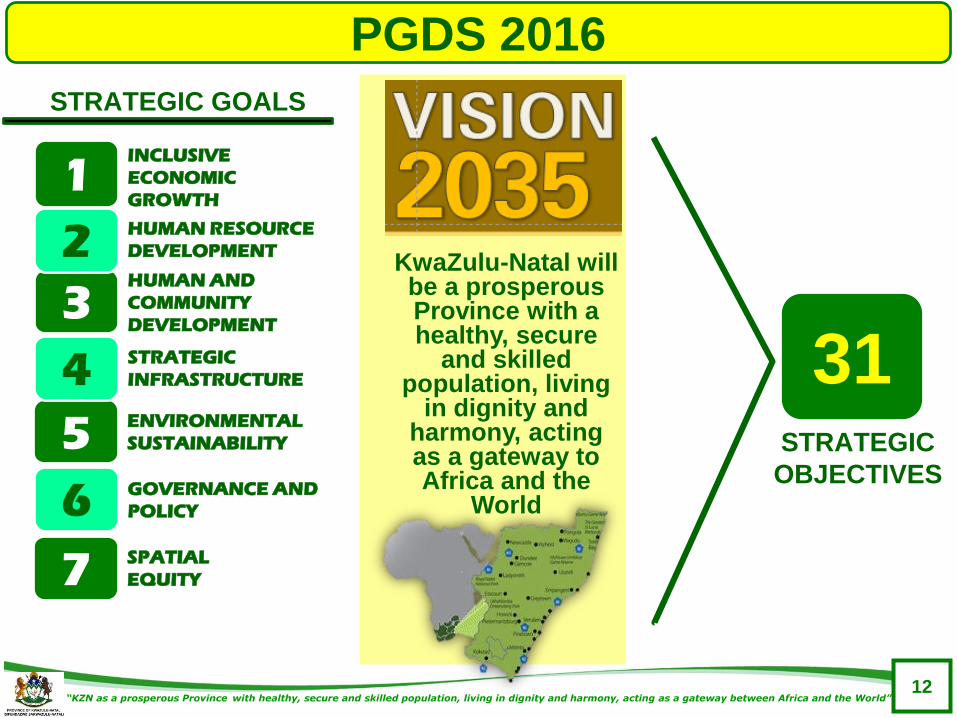
PGDS 2016
STRATEGIC GOALS
3HUMAN AND
COMMUNITY
DEVELOPMENT
5 ENVIRONMENTAL
SUSTAINABILITY
4 STRATEGIC
INFRASTRUCTURE
2 HUMAN RESOURCE
DEVELOPMENT
7 SPATIAL
EQUITY
6 GOVERNANCE AND
POLICY
1INCLUSIVE
ECONOMIC
GROWTH
KwaZulu-Natal will be a prosperous Province with a healthy, secure
and skilled population, living
in dignity and harmony, acting as a gateway to Africa and the
World
STRATEGIC
OBJECTIVES
31
“KZN as a prosperous Province with healthy, secure and skilled population, living in dignity and harmony, acting as a gateway between Africa and the World”
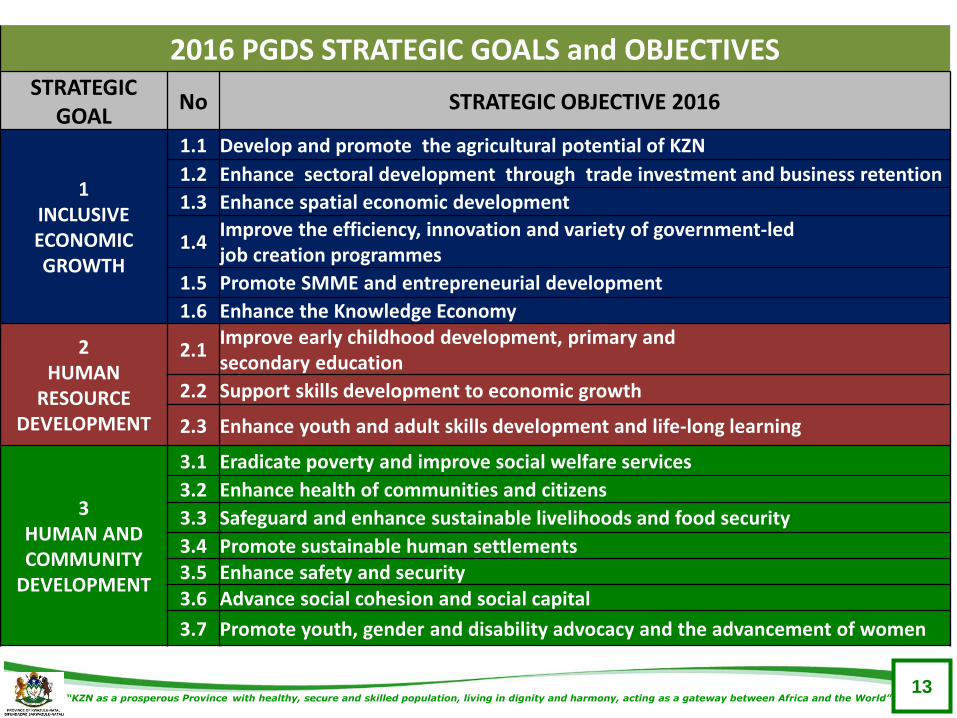
2016 PGDS STRATEGIC GOALS and OBJECTIVESSTRATEGIC
GOALNo STRATEGIC OBJECTIVE 2016
1INCLUSIVE ECONOMIC GROWTH
1.1 Develop and promote the agricultural potential of KZN
1.2 Enhance sectoral development through trade investment and business retention
1.3 Enhance spatial economic development
1.4Improve the efficiency, innovation and variety of government-ledjob creation programmes
1.5 Promote SMME and entrepreneurial development
1.6 Enhance the Knowledge Economy
2HUMAN
RESOURCE DEVELOPMENT
2.1Improve early childhood development, primary andsecondary education
2.2 Support skills development to economic growth
2.3 Enhance youth and adult skills development and life-long learning
3HUMAN AND COMMUNITY
DEVELOPMENT
3.1 Eradicate poverty and improve social welfare services
3.2 Enhance health of communities and citizens
3.3 Safeguard and enhance sustainable livelihoods and food security
3.4 Promote sustainable human settlements3.5 Enhance safety and security3.6 Advance social cohesion and social capital
3.7 Promote youth, gender and disability advocacy and the advancement of women
13
“KZN as a prosperous Province with healthy, secure and skilled population, living in dignity and harmony, acting as a gateway between Africa and the World”14
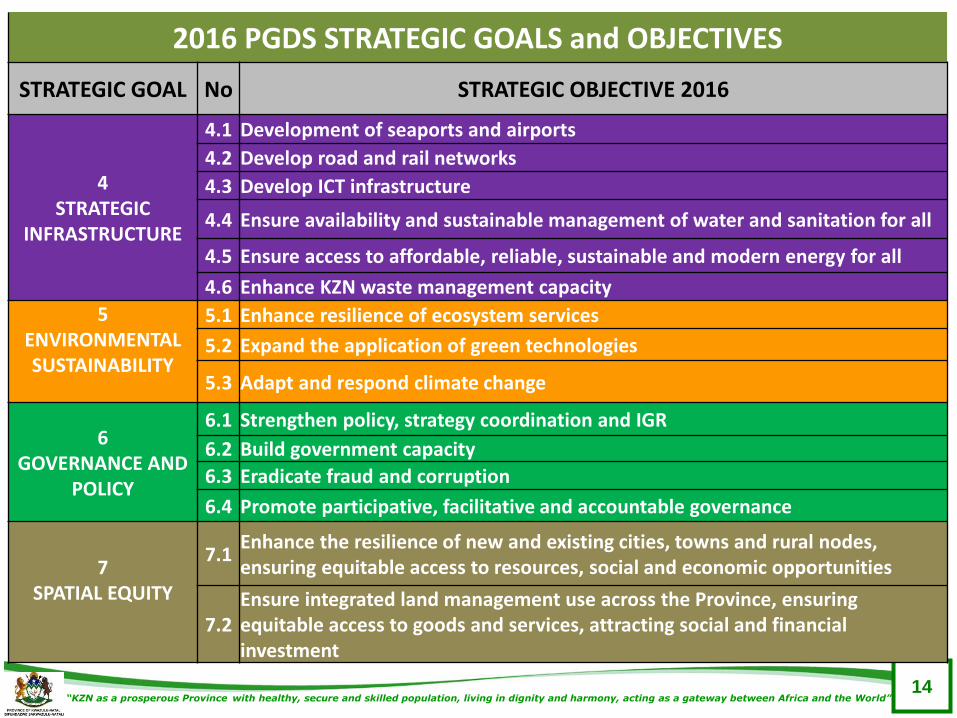
2016 PGDS STRATEGIC GOALS and OBJECTIVES
STRATEGIC GOAL No STRATEGIC OBJECTIVE 2016
4STRATEGIC
INFRASTRUCTURE
4.1 Development of seaports and airports
4.2 Develop road and rail networks
4.3 Develop ICT infrastructure
4.4 Ensure availability and sustainable management of water and sanitation for all
4.5 Ensure access to affordable, reliable, sustainable and modern energy for all
4.6 Enhance KZN waste management capacity
5ENVIRONMENTAL SUSTAINABILITY
5.1 Enhance resilience of ecosystem services
5.2 Expand the application of green technologies
5.3 Adapt and respond climate change
6GOVERNANCE AND
POLICY
6.1 Strengthen policy, strategy coordination and IGR
6.2 Build government capacity
6.3 Eradicate fraud and corruption
6.4 Promote participative, facilitative and accountable governance
7SPATIAL EQUITY
7.1Enhance the resilience of new and existing cities, towns and rural nodes, ensuring equitable access to resources, social and economic opportunities
7.2Ensure integrated land management use across the Province, ensuring equitable access to goods and services, attracting social and financial investment
“KZN as a prosperous Province with healthy, secure and skilled population, living in dignity and harmony, acting as a gateway between Africa and the World”15
PROVINCIAL SPATIAL
DEVELOPMENT
FRAMEWORK
IT IS NOT ONLY ABOUT WHAT, BUT ALSO ABOUT WHERE
“KZN as a prosperous Province with healthy, secure and skilled population, living in dignity and harmony, acting as a gateway between Africa and the World”
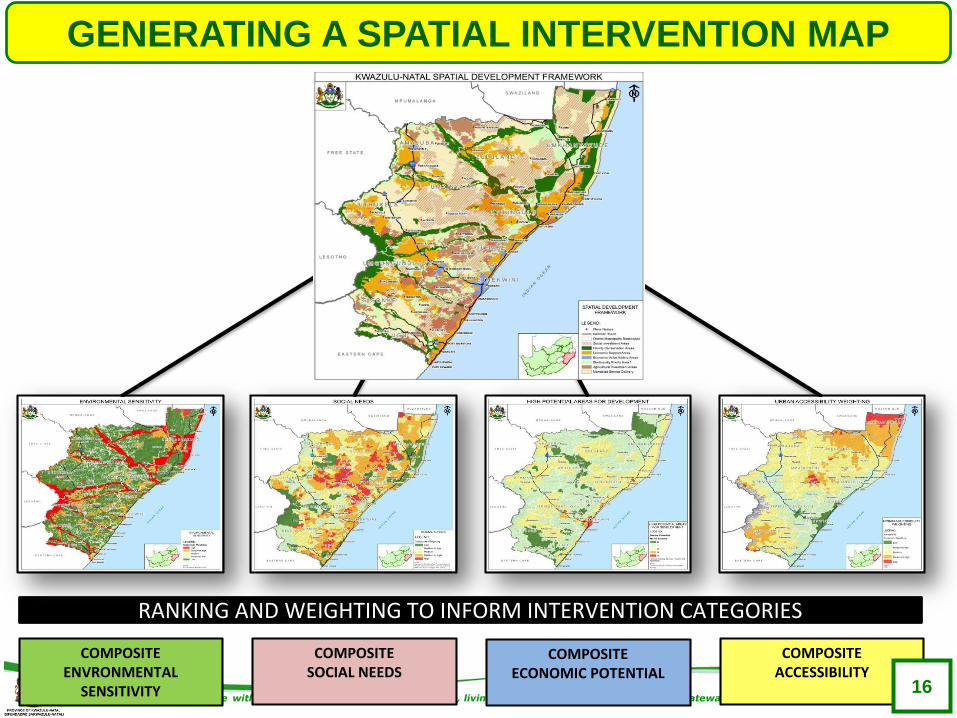
GENERATING A SPATIAL INTERVENTION MAP
COMPOSITESOCIAL NEEDS
COMPOSITE ENVRONMENTAL
SENSITIVITY
COMPOSITEECONOMIC POTENTIAL
COMPOSITEACCESSIBILITY
RANKING AND WEIGHTING TO INFORM INTERVENTION CATEGORIES
16
“KZN as a prosperous Province with healthy, secure and skilled population, living in dignity and harmony, acting as a gateway between Africa and the World”17
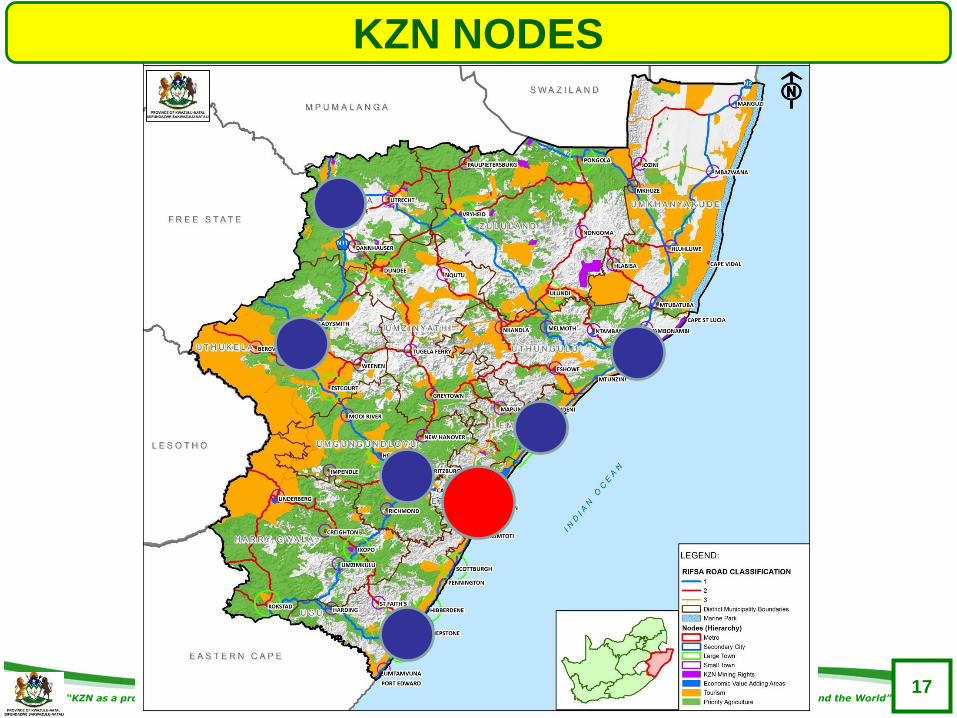
KZN NODES
“KZN as a prosperous Province with healthy, secure and skilled population, living in dignity and harmony, acting as a gateway between Africa and the World”18
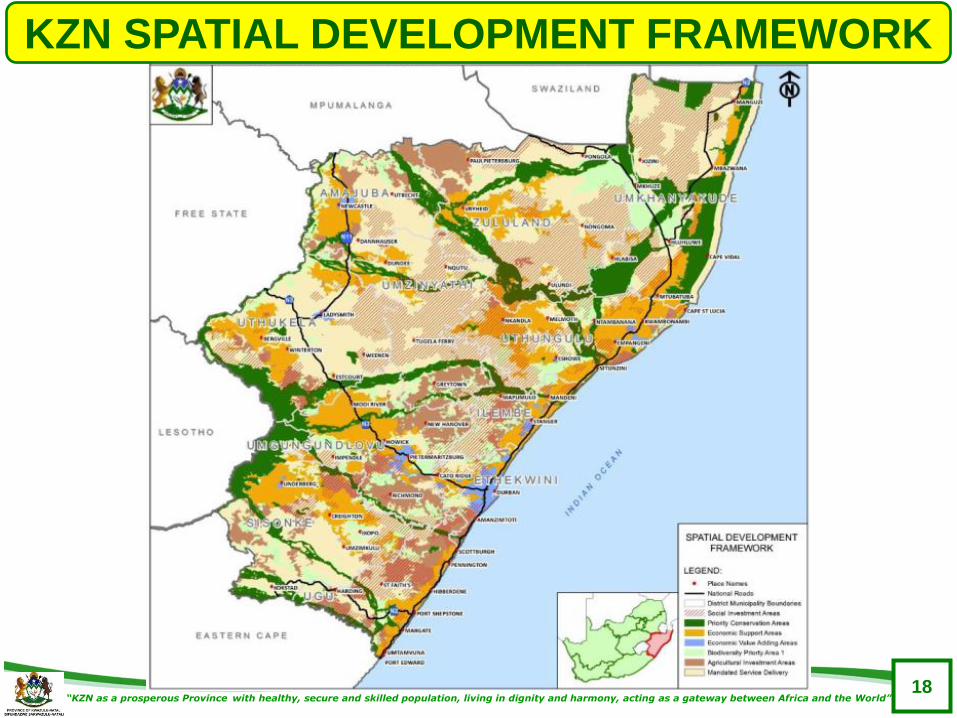
KZN SPATIAL DEVELOPMENT FRAMEWORK
“KZN as a prosperous Province with healthy, secure and skilled population, living in dignity and harmony, acting as a gateway between Africa and the World”19
4.
THE 2017/18 PGDP
“KZN as a prosperous Province with healthy, secure and skilled population, living in dignity and harmony, acting as a gateway between Africa and the World”20
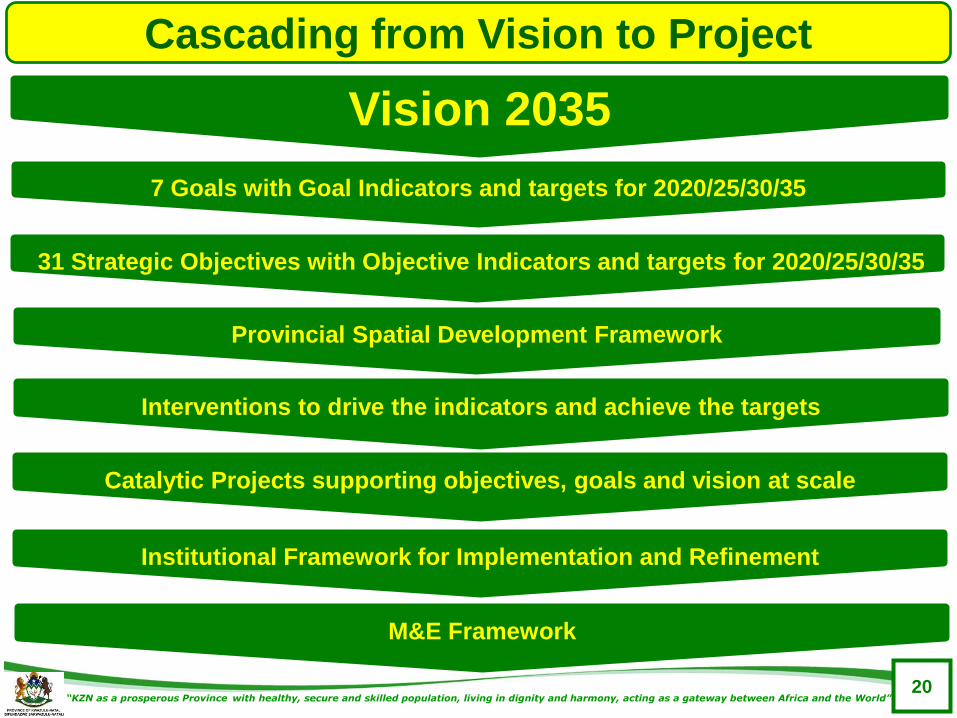
Cascading from Vision to Project
7 Goals with Goal Indicators and targets for 2020/25/30/35
Vision 2035
Provincial Spatial Development Framework
Catalytic Projects supporting objectives, goals and vision at scale
Interventions to drive the indicators and achieve the targets
31 Strategic Objectives with Objective Indicators and targets for 2020/25/30/35
Institutional Framework for Implementation and Refinement
M&E Framework
“KZN as a prosperous Province with healthy, secure and skilled population, living in dignity and harmony, acting as a gateway between Africa and the World”21
GOAL 1
Inclusive Economic Growth
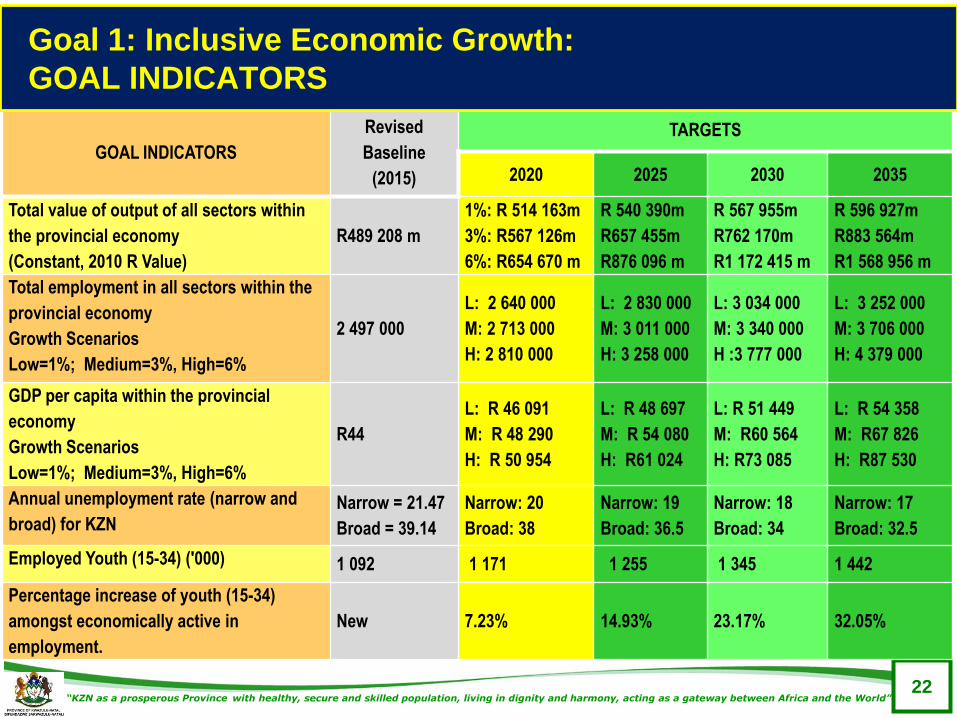
“KZN as a prosperous Province with healthy, secure and skilled population, living in dignity and harmony, acting as a gateway between Africa and the World”22
GOAL INDICATORS
Revised
Baseline
(2015)
TARGETS
2020 2025 2030 2035
Total value of output of all sectors within
the provincial economy
(Constant, 2010 R Value)
R489 208 m
1%: R 514 163m
3%: R567 126m
6%: R654 670 m
R 540 390m
R657 455m
R876 096 m
R 567 955m
R762 170m
R1 172 415 m
R 596 927m
R883 564m
R1 568 956 m
Total employment in all sectors within the
provincial economy
Growth Scenarios
Low=1%; Medium=3%, High=6%
2 497 000
L: 2 640 000
M: 2 713 000
H: 2 810 000
L: 2 830 000
M: 3 011 000
H: 3 258 000
L: 3 034 000
M: 3 340 000
H :3 777 000
L: 3 252 000
M: 3 706 000
H: 4 379 000
GDP per capita within the provincial
economy
Growth Scenarios
Low=1%; Medium=3%, High=6%
R44
L: R 46 091
M: R 48 290
H: R 50 954
L: R 48 697
M: R 54 080
H: R61 024
L: R 51 449
M: R60 564
H: R73 085
L: R 54 358
M: R67 826
H: R87 530
Annual unemployment rate (narrow and
broad) for KZNNarrow = 21.47
Broad = 39.14
Narrow: 20
Broad: 38
Narrow: 19
Broad: 36.5
Narrow: 18
Broad: 34
Narrow: 17
Broad: 32.5
Employed Youth (15-34) ('000) 1 092 1 171 1 255 1 345 1 442
Percentage increase of youth (15-34)
amongst economically active in
employment.
New 7.23% 14.93% 23.17% 32.05%
Goal 1: Inclusive Economic Growth:
GOAL INDICATORS
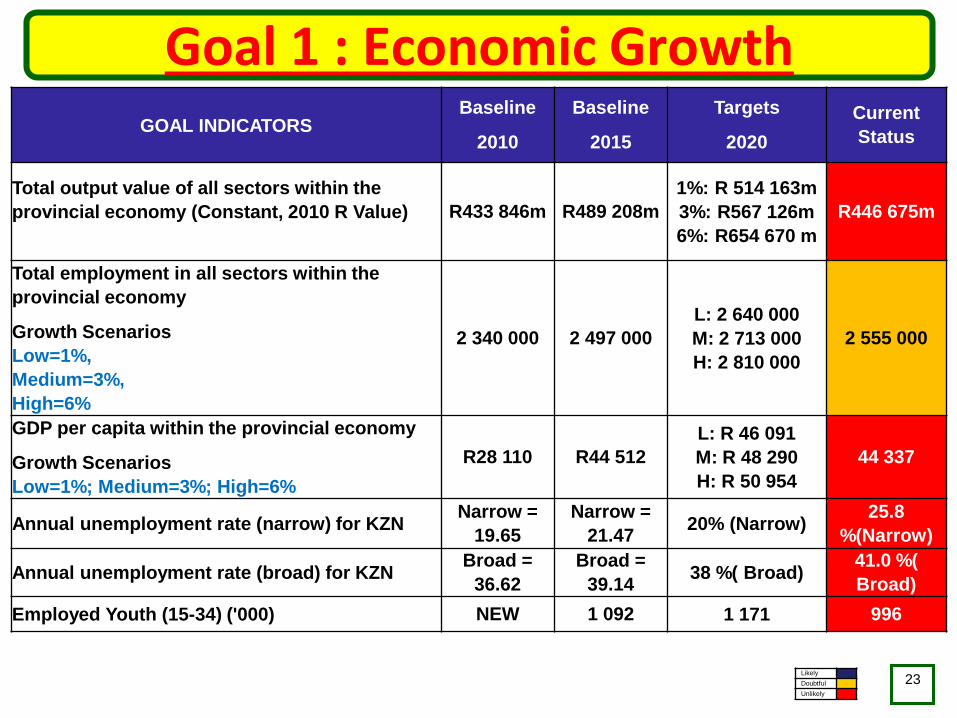
Goal 1 : Economic Growth
23
GOAL INDICATORSBaseline
2010
Baseline
2015
Targets
2020
Current
Status
Total output value of all sectors within the
provincial economy (Constant, 2010 R Value) R433 846m R489 208m
1%: R 514 163m
3%: R567 126m
6%: R654 670 m
R446 675m
Total employment in all sectors within the
provincial economy
Growth Scenarios
Low=1%,
Medium=3%,
High=6%
2 340 000 2 497 000
L: 2 640 000
M: 2 713 000
H: 2 810 000
2 555 000
GDP per capita within the provincial economy
Growth Scenarios
Low=1%; Medium=3%; High=6%
R28 110 R44 512
L: R 46 091
M: R 48 290
H: R 50 954
44 337
Annual unemployment rate (narrow) for KZNNarrow =
19.65
Narrow =
21.4720% (Narrow)
25.8
%(Narrow)
Annual unemployment rate (broad) for KZNBroad =
36.62
Broad =
39.1438 %( Broad)
41.0 %(
Broad)
Employed Youth (15-34) ('000) NEW 1 092 1 171 996
Likely
Doubtful
Unlikely
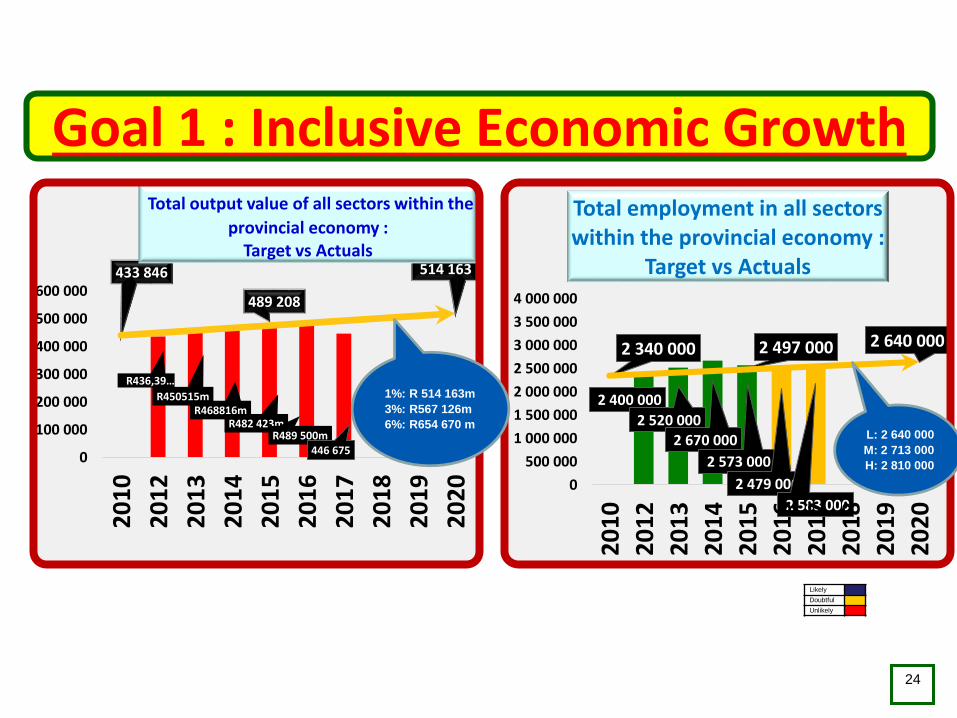
Goal 1 : Inclusive Economic Growth
24
Likely
Doubtful
Unlikely
R436,39…
R450515mR468816m
R482 423mR489 500m
446 675
433 846
489 208
514 163
0
100 000
200 000
300 000
400 000
500 000
600 000
20
10
20
12
20
13
20
14
20
15
20
16
20
17
20
18
20
19
20
20
Total output value of all sectors within the
provincial economy :Target vs Actuals
2 400 000
2 520 0002 670 000
2 573 000
2 479 000
2 583 000
2 340 000 2 497 000 2 640 000
0
500 000
1 000 000
1 500 000
2 000 000
2 500 000
3 000 000
3 500 000
4 000 000
20
10
20
12
20
13
20
14
20
15
20
16
20
17
20
18
20
19
20
20
Total employment in all sectors within the provincial economy :
Target vs Actuals
1%: R 514 163m
3%: R567 126m
6%: R654 670 mL: 2 640 000
M: 2 713 000
H: 2 810 000
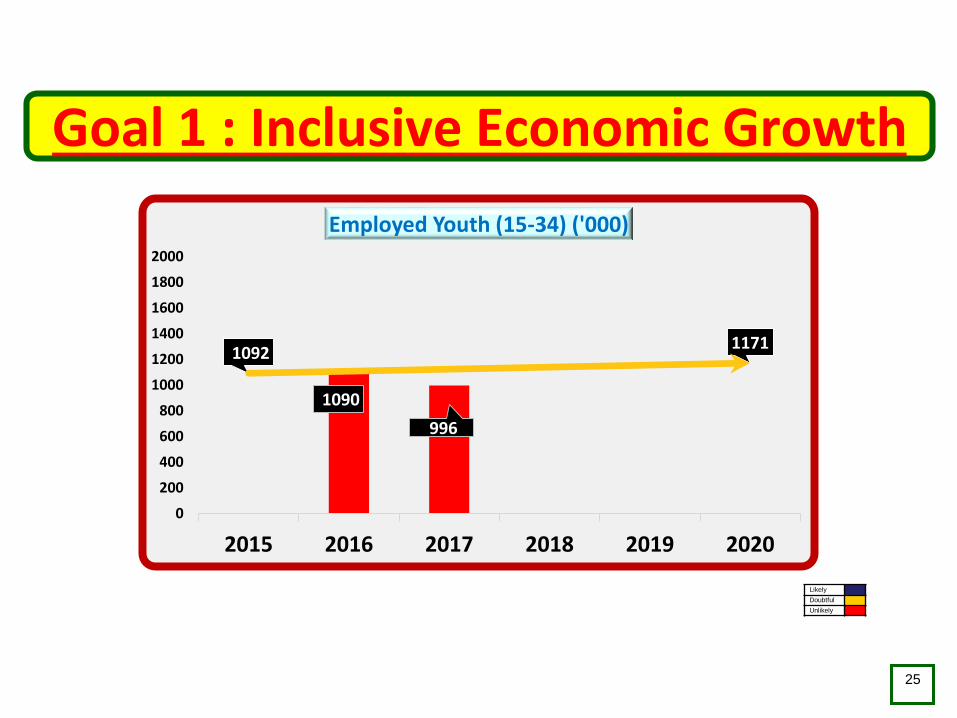
Goal 1 : Inclusive Economic Growth
25
Likely
Doubtful
Unlikely
1090
996
10921171
0
200
400
600
800
1000
1200
1400
1600
1800
2000
2015 2016 2017 2018 2019 2020
Employed Youth (15-34) ('000)
“KZN as a prosperous Province with healthy, secure and skilled population, living in dignity and harmony, acting as a gateway between Africa and the World”26
GOAL 2
Human Resource Development
“KZN as a prosperous Province with healthy, secure and skilled population, living in dignity and harmony, acting as a gateway between Africa and the World”
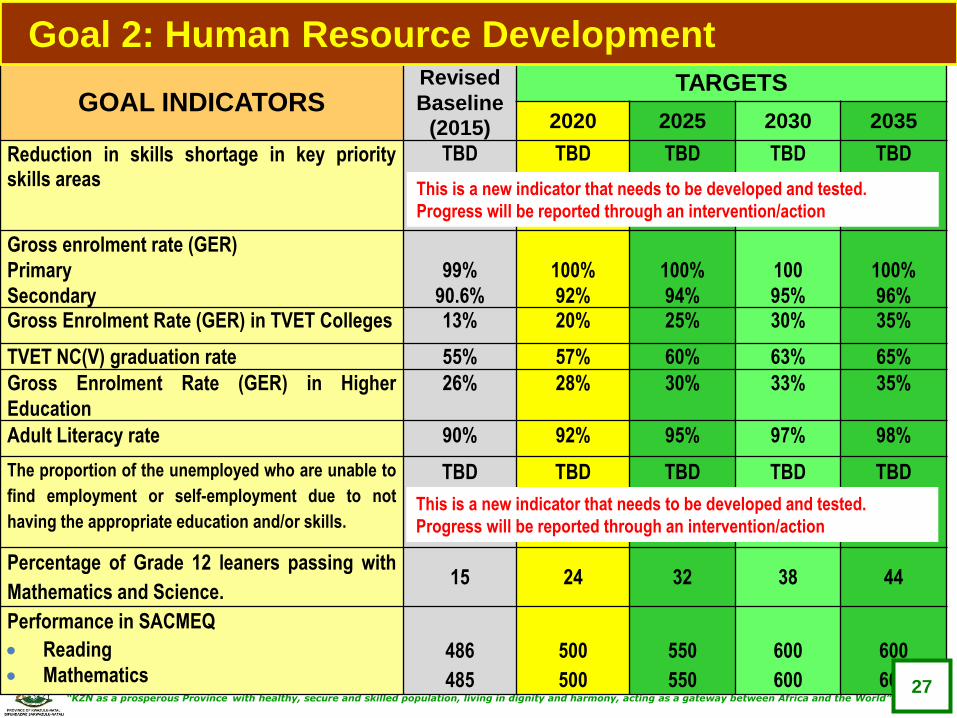
GOAL INDICATORSRevised
Baseline
(2015)
TARGETS
2020 2025 2030 2035
Reduction in skills shortage in key priorityskills areas
TBD TBD TBD TBD TBD
Gross enrolment rate (GER)
Primary
Secondary
99%
90.6%
100%
92%
100%
94%
100
95%
100%
96%Gross Enrolment Rate (GER) in TVET Colleges 13% 20% 25% 30% 35%
TVET NC(V) graduation rate 55% 57% 60% 63% 65%
Gross Enrolment Rate (GER) in Higher
Education
26% 28% 30% 33% 35%
Adult Literacy rate 90% 92% 95% 97% 98%
The proportion of the unemployed who are unable to
find employment or self-employment due to not
having the appropriate education and/or skills.
TBD TBD TBD TBD TBD
Percentage of Grade 12 leaners passing with
Mathematics and Science.15 24 32 38 44
Performance in SACMEQ
Reading
Mathematics486
485
500
500
550
550
600
600
600
600
Goal 2: Human Resource Development
This is a new indicator that needs to be developed and tested.
Progress will be reported through an intervention/action
27
This is a new indicator that needs to be developed and tested.
Progress will be reported through an intervention/action
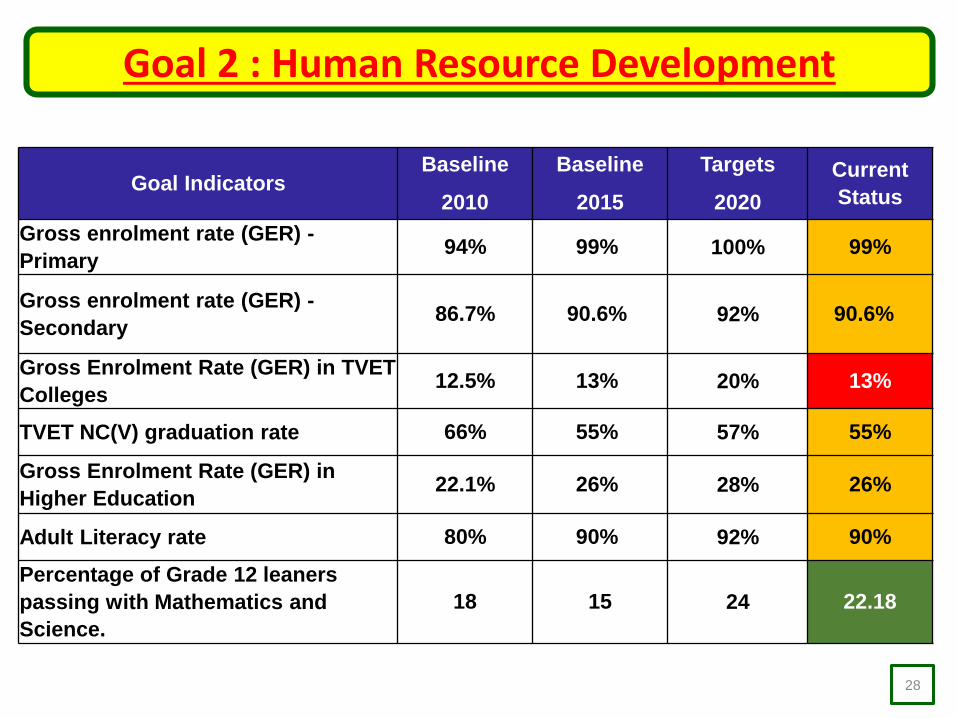
Goal 2 : Human Resource Development
Goal IndicatorsBaseline
2010
Baseline
2015
Targets
2020
Current
Status
Gross enrolment rate (GER) -
Primary94% 99% 100% 99%
Gross enrolment rate (GER) -
Secondary86.7% 90.6% 92% 90.6%
Gross Enrolment Rate (GER) in TVET
Colleges 12.5% 13% 20% 13%
TVET NC(V) graduation rate 66% 55% 57% 55%
Gross Enrolment Rate (GER) in
Higher Education 22.1% 26% 28% 26%
Adult Literacy rate 80% 90% 92% 90%
Percentage of Grade 12 leaners
passing with Mathematics and
Science.
18 15 24 22.18
28
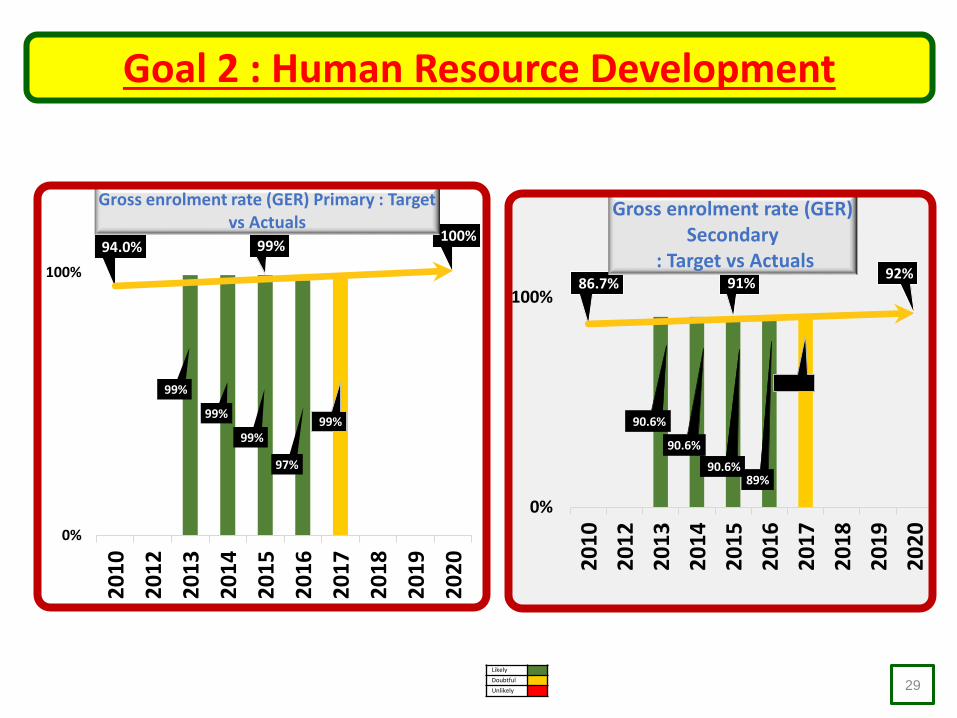
Goal 2 : Human Resource Development
29
99%
99%
99%
97%
99%
94.0% 99%100%
0%
100%
20
10
20
12
20
13
20
14
20
15
20
16
20
17
20
18
20
19
20
20
Gross enrolment rate (GER) Primary : Target vs Actuals
90.6%
90.6%
90.6%89%
86.7% 91%92%
0%
100%
20
10
20
12
20
13
20
14
20
15
20
16
20
17
20
18
20
19
20
20
Gross enrolment rate (GER) Secondary
: Target vs Actuals
Likely
Doubtful
Unlikely
“KZN as a prosperous Province with healthy, secure and skilled population, living in dignity and harmony, acting as a gateway between Africa and the World”30
GOAL 3
Human and Community Development
“KZN as a prosperous Province with healthy, secure and skilled population, living in dignity and harmony, acting as a gateway between Africa and the World”31
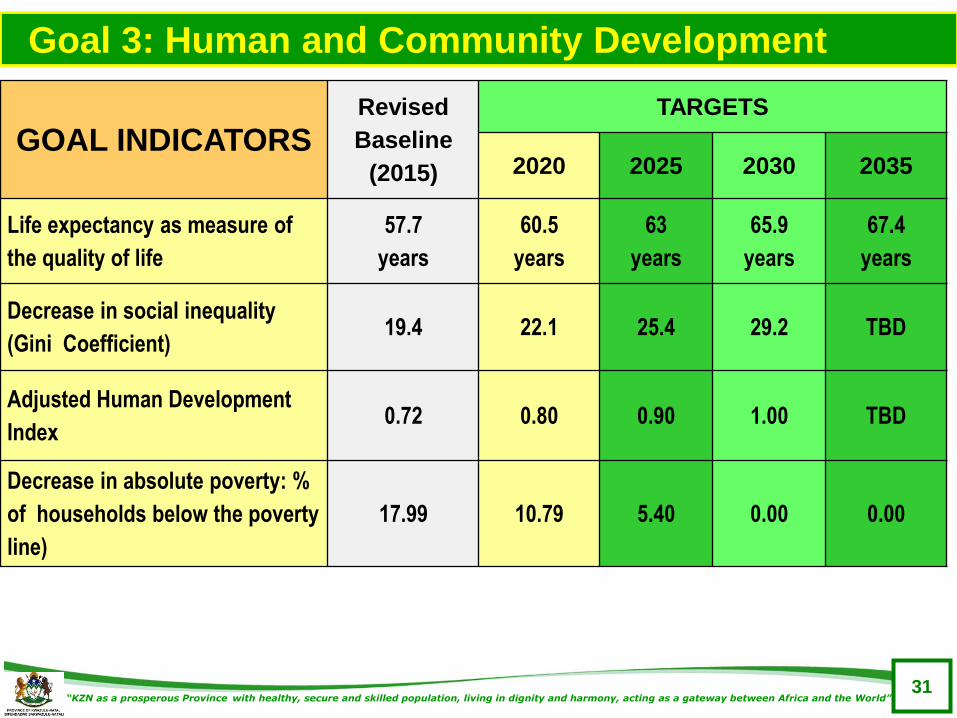
GOAL INDICATORSRevised
Baseline
(2015)
TARGETS
2020 2025 2030 2035
Life expectancy as measure of
the quality of life
57.7
years
60.5
years
63
years
65.9
years
67.4
years
Decrease in social inequality
(Gini Coefficient)19.4 22.1 25.4 29.2 TBD
Adjusted Human Development
Index0.72 0.80 0.90 1.00 TBD
Decrease in absolute poverty: %
of households below the poverty
line)
17.99 10.79 5.40 0.00 0.00
Goal 3: Human and Community Development
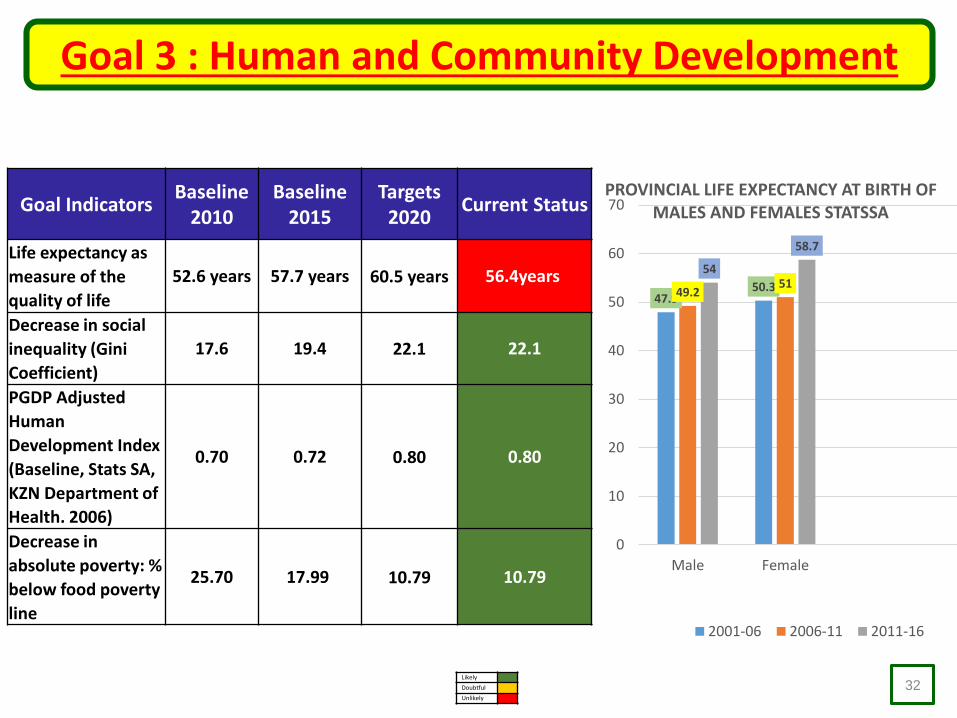
Goal 3 : Human and Community Development
32
Goal IndicatorsBaseline
2010Baseline
2015Targets
2020Current Status
Life expectancy as
measure of the
quality of life
52.6 years 57.7 years 60.5 years 56.4years
Decrease in social
inequality (Gini
Coefficient)
17.6 19.4 22.1 22.1
PGDP Adjusted
Human
Development Index
(Baseline, Stats SA,
KZN Department of
Health. 2006)
0.70 0.72 0.80 0.80
Decrease in
absolute poverty: %
below food poverty
line
25.70 17.99 10.79 10.79
Likely
Doubtful
Unlikely
47.950.349.2
5154
58.7
0
10
20
30
40
50
60
70
Male Female
PROVINCIAL LIFE EXPECTANCY AT BIRTH OF MALES AND FEMALES STATSSA
2001-06 2006-11 2011-16
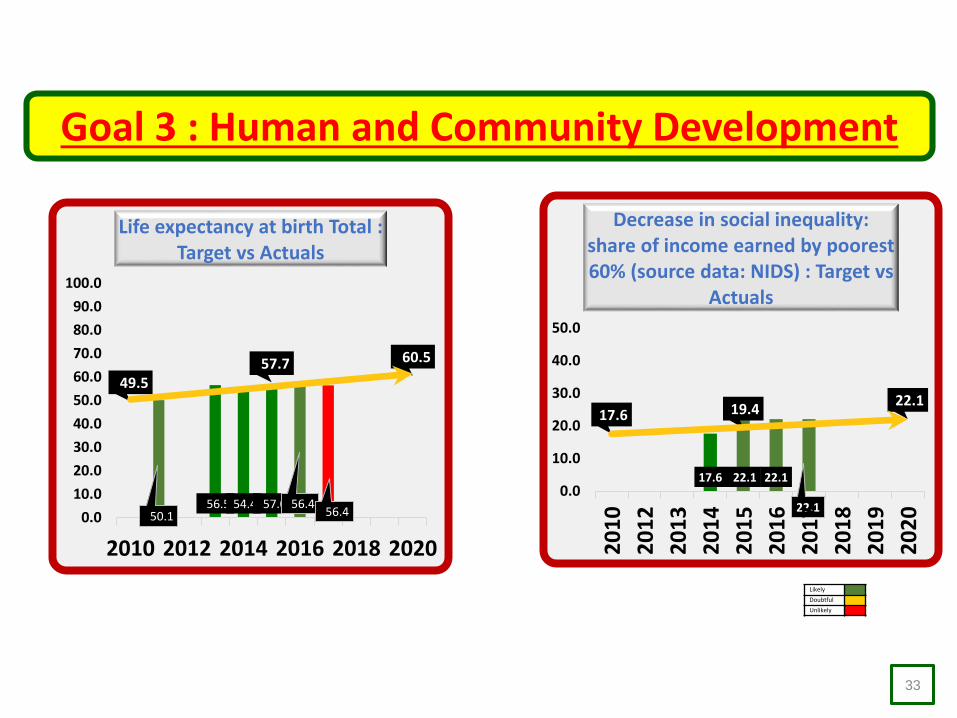
Goal 3 : Human and Community Development
33
50.156.5 54.4 57.0 56.4
56.4
49.557.7 60.5
0.0
10.0
20.0
30.0
40.0
50.0
60.0
70.0
80.0
90.0
100.0
2010 2012 2014 2016 2018 2020
Life expectancy at birth Total : Target vs Actuals
17.6 22.1 22.1
22.1
17.6 19.422.1
0.0
10.0
20.0
30.0
40.0
50.0
20
10
20
12
20
13
20
14
20
15
20
16
20
17
20
18
20
19
20
20
Decrease in social inequality: share of income earned by poorest 60% (source data: NIDS) : Target vs
Actuals
Likely
Doubtful
Unlikely
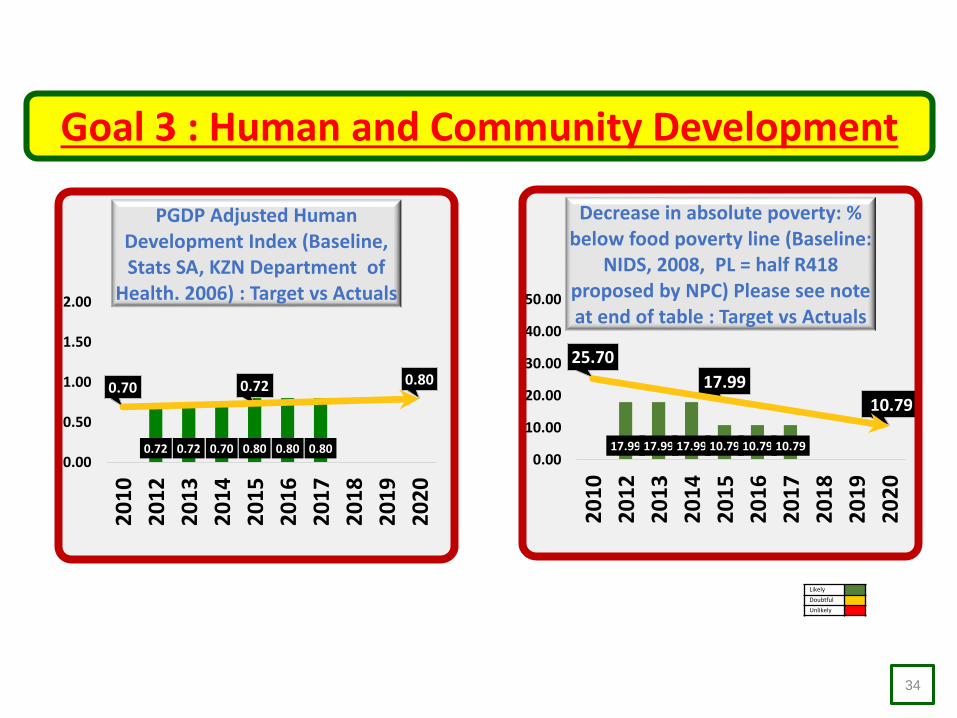
Goal 3 : Human and Community Development
34
0.72 0.72 0.70 0.80 0.80 0.80
0.70 0.72 0.80
0.00
0.50
1.00
1.50
2.00
20
10
20
12
20
13
20
14
20
15
20
16
20
17
20
18
20
19
20
20
PGDP Adjusted Human Development Index (Baseline, Stats SA, KZN Department of
Health. 2006) : Target vs Actuals
17.99 17.99 17.99 10.79 10.79 10.79
25.70
17.9910.79
0.00
10.00
20.00
30.00
40.00
50.00
20
10
20
12
20
13
20
14
20
15
20
16
20
17
20
18
20
19
20
20
Decrease in absolute poverty: % below food poverty line (Baseline:
NIDS, 2008, PL = half R418 proposed by NPC) Please see note at end of table : Target vs Actuals
Likely
Doubtful
Unlikely
“KZN as a prosperous Province with healthy, secure and skilled population, living in dignity and harmony, acting as a gateway between Africa and the World”35
GOAL 4
Strategic Infrastructure
“KZN as a prosperous Province with healthy, secure and skilled population, living in dignity and harmony, acting as a gateway between Africa and the World”36
36
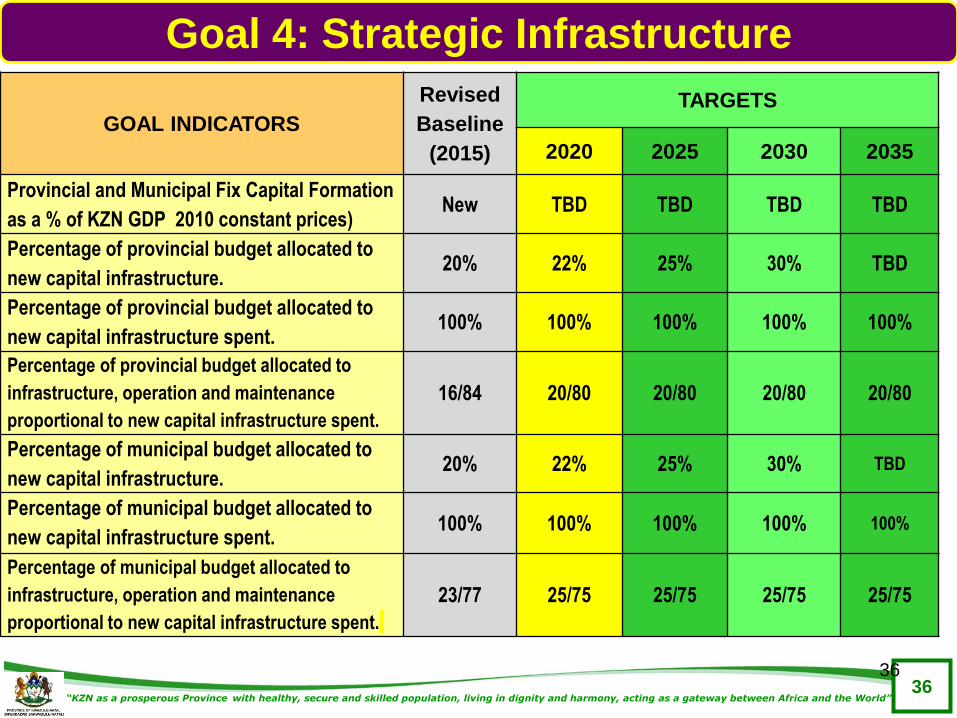
GOAL INDICATORS
Revised
Baseline
(2015)
TARGETS
2020 2025 2030 2035
Provincial and Municipal Fix Capital Formation
as a % of KZN GDP 2010 constant prices)New TBD TBD TBD TBD
Percentage of provincial budget allocated to
new capital infrastructure. 20% 22% 25% 30% TBD
Percentage of provincial budget allocated to
new capital infrastructure spent.100% 100% 100% 100% 100%
Percentage of provincial budget allocated to
infrastructure, operation and maintenance
proportional to new capital infrastructure spent.
16/84 20/80 20/80 20/80 20/80
Percentage of municipal budget allocated to
new capital infrastructure.20% 22% 25% 30% TBD
Percentage of municipal budget allocated to
new capital infrastructure spent.100% 100% 100% 100% 100%
Percentage of municipal budget allocated to
infrastructure, operation and maintenance
proportional to new capital infrastructure spent.
23/77 25/75 25/75 25/75 25/75
Goal 4: Strategic Infrastructure
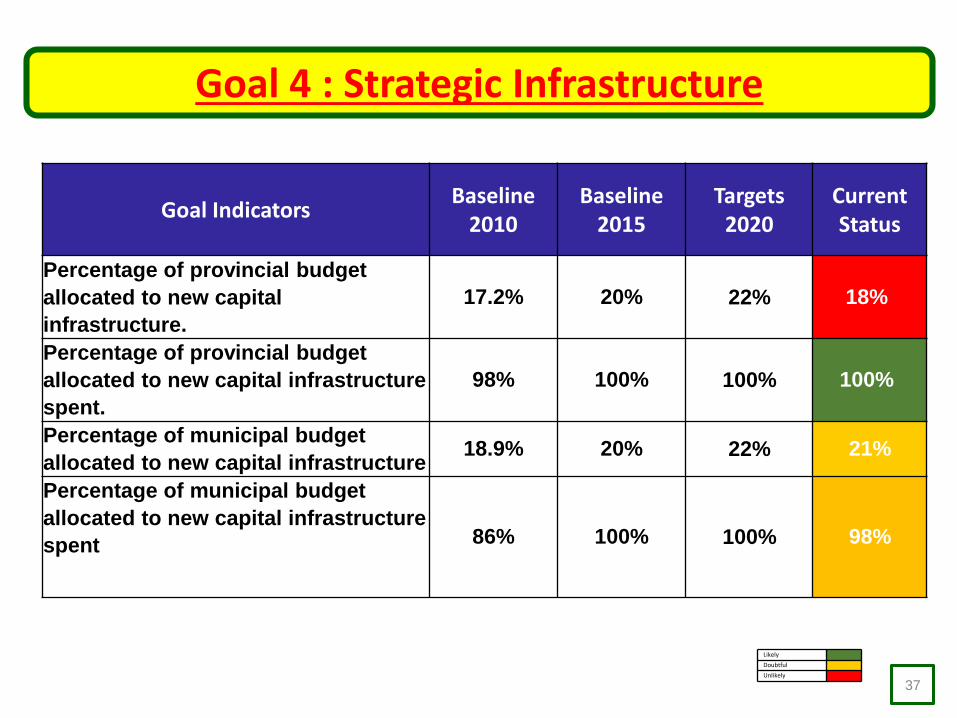
Goal 4 : Strategic Infrastructure
37
Goal IndicatorsBaseline
2010Baseline
2015Targets
2020CurrentStatus
Percentage of provincial budget
allocated to new capital
infrastructure.
17.2% 20% 22% 18%
Percentage of provincial budget
allocated to new capital infrastructure
spent.
98% 100% 100% 100%
Percentage of municipal budget
allocated to new capital infrastructure18.9% 20% 22% 21%
Percentage of municipal budget
allocated to new capital infrastructure
spent 86% 100% 100% 98%
Likely
Doubtful
Unlikely
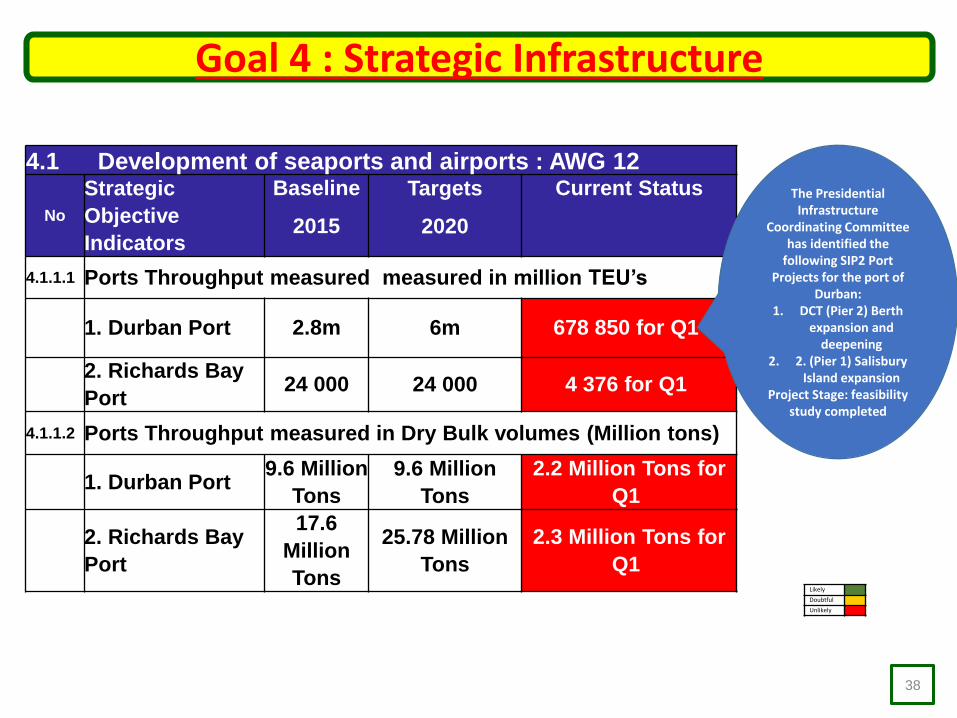
Goal 4 : Strategic Infrastructure
38
4.1 Development of seaports and airports : AWG 12
No
Strategic
Objective
Indicators
Baseline
2015
Targets
2020
Current Status
4.1.1.1 Ports Throughput measured measured in million TEU’s
1. Durban Port 2.8m 6m 678 850 for Q1
2. Richards Bay
Port24 000 24 000 4 376 for Q1
4.1.1.2 Ports Throughput measured in Dry Bulk volumes (Million tons)
1. Durban Port9.6 Million
Tons
9.6 Million
Tons
2.2 Million Tons for
Q1
2. Richards Bay
Port
17.6
Million
Tons
25.78 Million
Tons
2.3 Million Tons for
Q1Likely
Doubtful
Unlikely
The Presidential Infrastructure
Coordinating Committee has identified the
following SIP2 Port Projects for the port of
Durban:1. DCT (Pier 2) Berth
expansion and deepening
2. 2. (Pier 1) Salisbury Island expansion
Project Stage: feasibility study completed
Goal 4 : Strategic Infrastructure
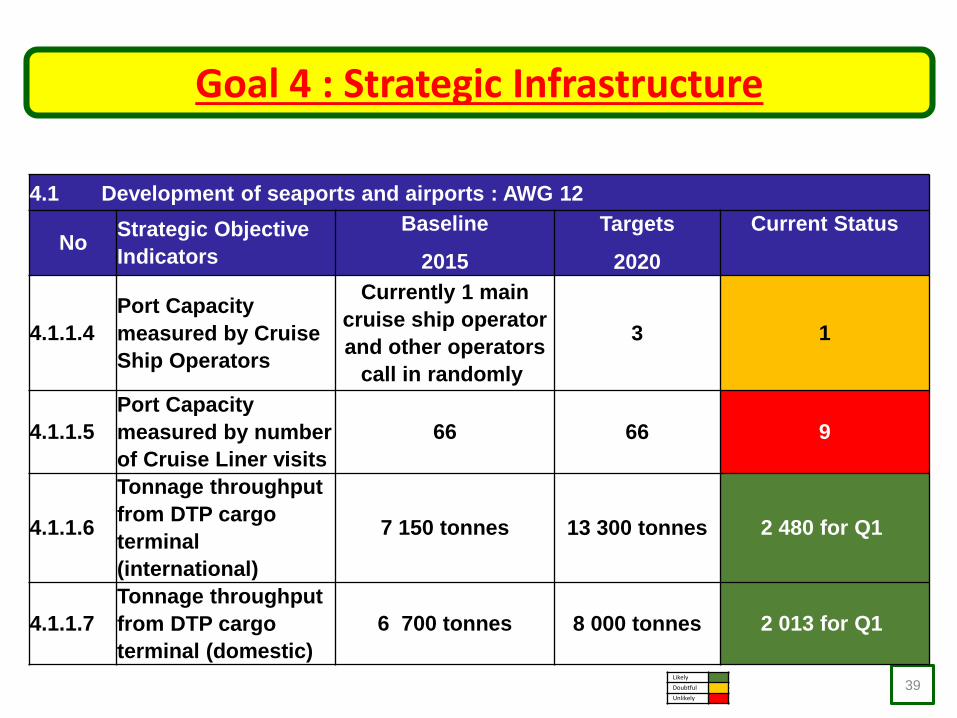
39
4.1 Development of seaports and airports : AWG 12
NoStrategic Objective
Indicators
Baseline
2015
Targets
2020
Current Status
4.1.1.4
Port Capacity
measured by Cruise
Ship Operators
Currently 1 main
cruise ship operator
and other operators
call in randomly
3 1
4.1.1.5
Port Capacity
measured by number
of Cruise Liner visits
66 66 9
4.1.1.6
Tonnage throughput
from DTP cargo
terminal
(international)
7 150 tonnes 13 300 tonnes 2 480 for Q1
4.1.1.7
Tonnage throughput
from DTP cargo
terminal (domestic)
6 700 tonnes 8 000 tonnes 2 013 for Q1
Likely
Doubtful
Unlikely
Goal 4 : Strategic Infrastructure
40
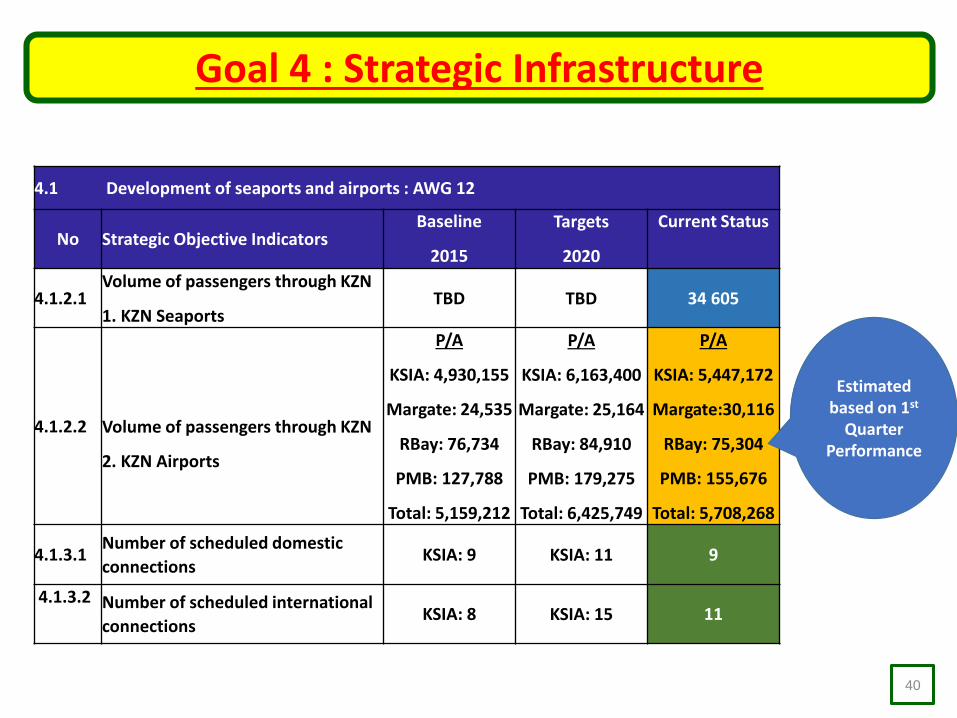
4.1 Development of seaports and airports : AWG 12
No Strategic Objective Indicators Baseline
2015
Targets
2020
Current Status
4.1.2.1Volume of passengers through KZN
1. KZN SeaportsTBD TBD 34 605
4.1.2.2 Volume of passengers through KZN
2. KZN Airports
P/A
KSIA: 4,930,155
Margate: 24,535
RBay: 76,734
PMB: 127,788
Total: 5,159,212
P/A
KSIA: 6,163,400
Margate: 25,164
RBay: 84,910
PMB: 179,275
Total: 6,425,749
P/A
KSIA: 5,447,172
Margate:30,116
RBay: 75,304
PMB: 155,676
Total: 5,708,268
4.1.3.1Number of scheduled domestic
connectionsKSIA: 9 KSIA: 11 9
4.1.3.2 Number of scheduled international
connectionsKSIA: 8 KSIA: 15 11
Estimated based on 1st
Quarter Performance
“KZN as a prosperous Province with healthy, secure and skilled population, living in dignity and harmony, acting as a gateway between Africa and the World”41
GOAL 5
Environmental Sustainability
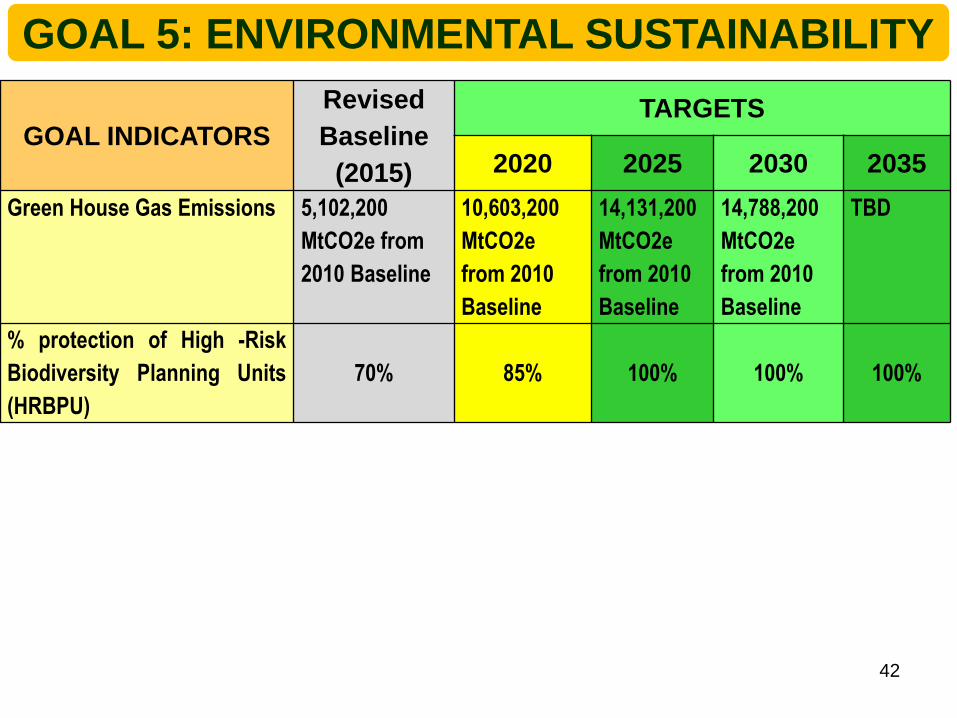
42
GOAL INDICATORS
Revised
Baseline
(2015)
TARGETS
2020 2025 2030 2035
Green House Gas Emissions 5,102,200
MtCO2e from
2010 Baseline
10,603,200
MtCO2e
from 2010
Baseline
14,131,200
MtCO2e
from 2010
Baseline
14,788,200
MtCO2e
from 2010
Baseline
TBD
% protection of High -Risk
Biodiversity Planning Units
(HRBPU)
70% 85% 100% 100% 100%
GOAL 5: ENVIRONMENTAL SUSTAINABILITY
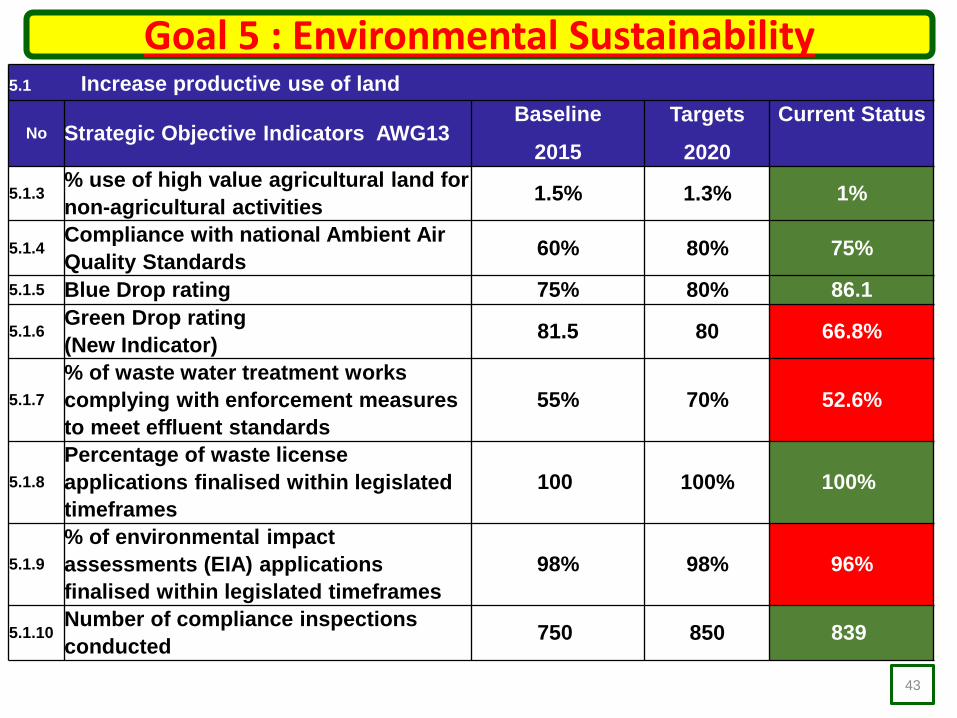
Goal 5 : Environmental Sustainability
43
5.1 Increase productive use of land
No Strategic Objective Indicators AWG13Baseline
2015
Targets
2020
Current Status
5.1.3% use of high value agricultural land for
non-agricultural activities1.5% 1.3% 1%
5.1.4Compliance with national Ambient Air
Quality Standards60% 80% 75%
5.1.5 Blue Drop rating 75% 80% 86.1
5.1.6 Green Drop rating
(New Indicator) 81.5 80 66.8%
5.1.7
% of waste water treatment works
complying with enforcement measures
to meet effluent standards
55% 70% 52.6%
5.1.8
Percentage of waste license
applications finalised within legislated
timeframes
100 100% 100%
5.1.9
% of environmental impact
assessments (EIA) applications
finalised within legislated timeframes
98% 98% 96%
5.1.10Number of compliance inspections
conducted750 850 839
“KZN as a prosperous Province with healthy, secure and skilled population, living in dignity and harmony, acting as a gateway between Africa and the World”44
GOAL 6
Governance and Policy
45
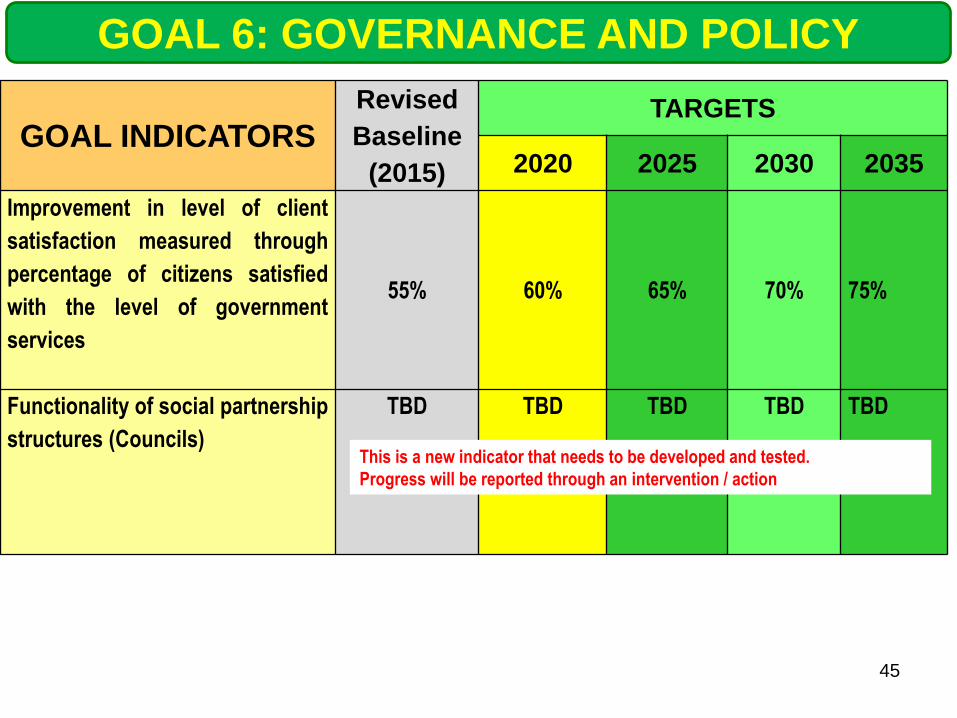
GOAL INDICATORS
Revised
Baseline
(2015)
TARGETS
2020 2025 2030 2035
Improvement in level of client
satisfaction measured through
percentage of citizens satisfied
with the level of government
services
55% 60% 65% 70% 75%
Functionality of social partnership
structures (Councils)
TBD TBD TBD TBD TBD
GOAL 6: GOVERNANCE AND POLICY
This is a new indicator that needs to be developed and tested.
Progress will be reported through an intervention / action
“KZN as a prosperous Province with healthy, secure and skilled population, living in dignity and harmony, acting as a gateway between Africa and the World”46
GOAL 7
Spatial Equity
47
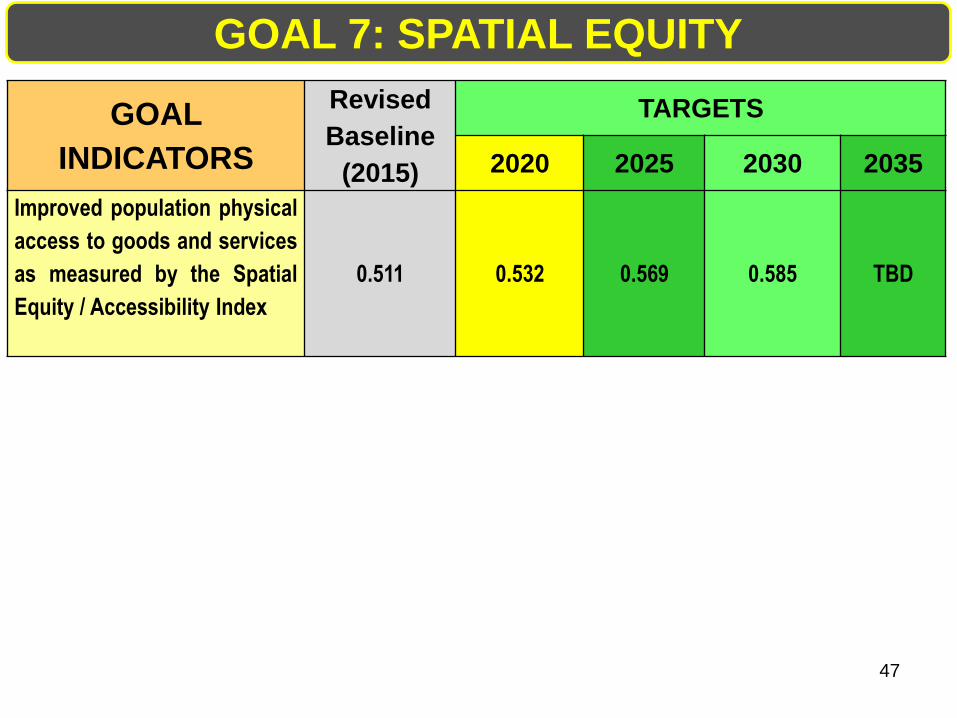
GOAL
INDICATORS
Revised
Baseline
(2015)
TARGETS
2020 2025 2030 2035
Improved population physical
access to goods and services
as measured by the Spatial
Equity / Accessibility Index
0.511 0.532 0.569 0.585 TBD
GOAL 7: SPATIAL EQUITY
“KZN as a prosperous Province with healthy, secure and skilled population, living in dignity and harmony, acting as a gateway between Africa and the World”48
www.kznppc.gov.za
“KZN as a prosperous Province with healthy, secure and skilled population, living in dignity and harmony, acting as a gateway between Africa and the World”49
5.
CATALYTIC PROJECTS
“KZN as a prosperous Province with healthy, secure and skilled population, living in dignity and harmony, acting as a gateway between Africa and the World”50
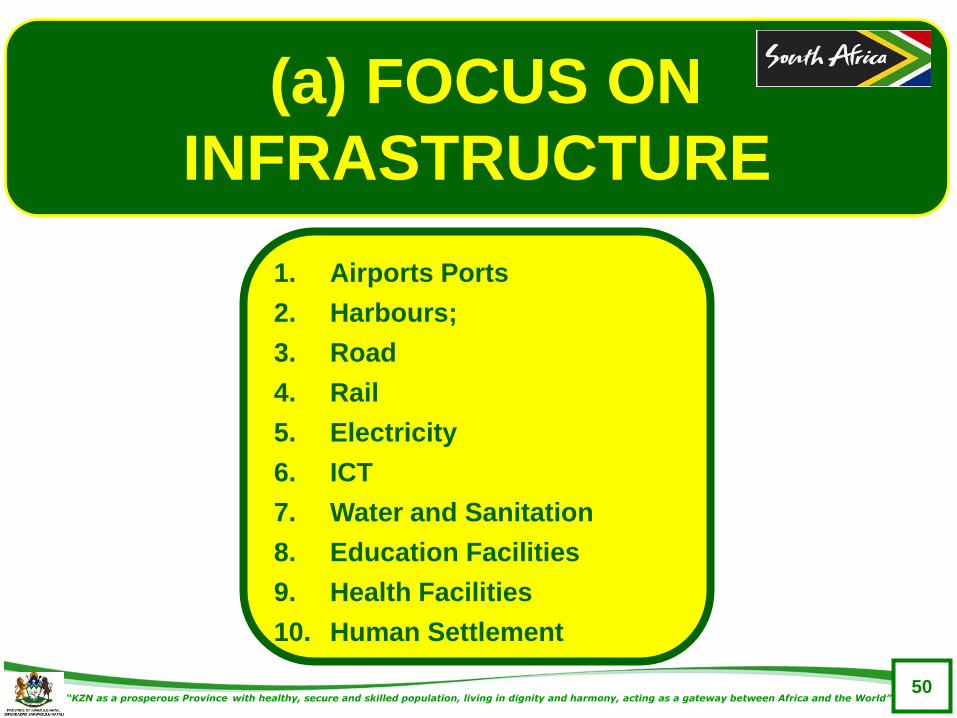
(a) FOCUS ON
INFRASTRUCTURE
1. Airports Ports
2. Harbours;
3. Road
4. Rail
5. Electricity
6. ICT
7. Water and Sanitation
8. Education Facilities
9. Health Facilities
10. Human Settlement
“KZN as a prosperous Province with healthy, secure and skilled population, living in dignity and harmony, acting as a gateway between Africa and the World”51
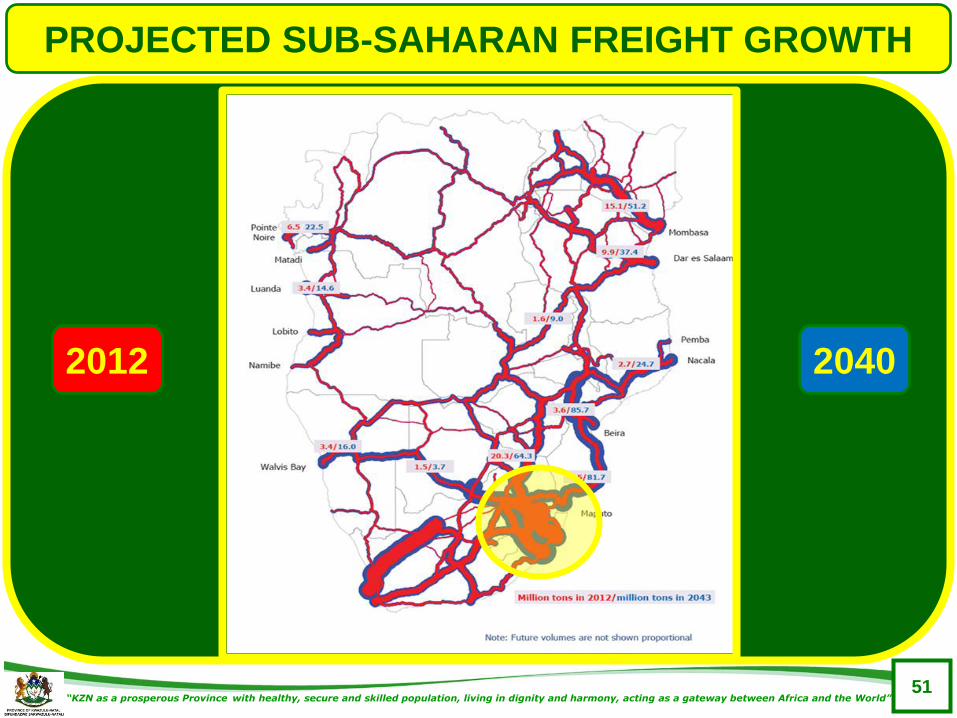
PROJECTED SUB-SAHARAN FREIGHT GROWTH
2012 2040
“KZN as a prosperous Province with healthy, secure and skilled population, living in dignity and harmony, acting as a gateway between Africa and the World”52
SUPPORTING CATALYTIC
PROJECTS
“KZN as a prosperous Province with healthy, secure and skilled population, living in dignity and harmony, acting as a gateway between Africa and the World”53
CATALYTIC PROJECTS
Clear and emphatic emphasis on processes and mechanisms
to enhance implementation of the Strategy.
Whilst recognising the value of a long term vision and
strategy, there is an equal recognition of the need for a clear
implementation plan with a focus on immediate action and
the attainment of short term gains.
One of the processes to be pursued in this regard is to
ensure that the strategy and its objectives are driven by a
range of Catalytic Projects.
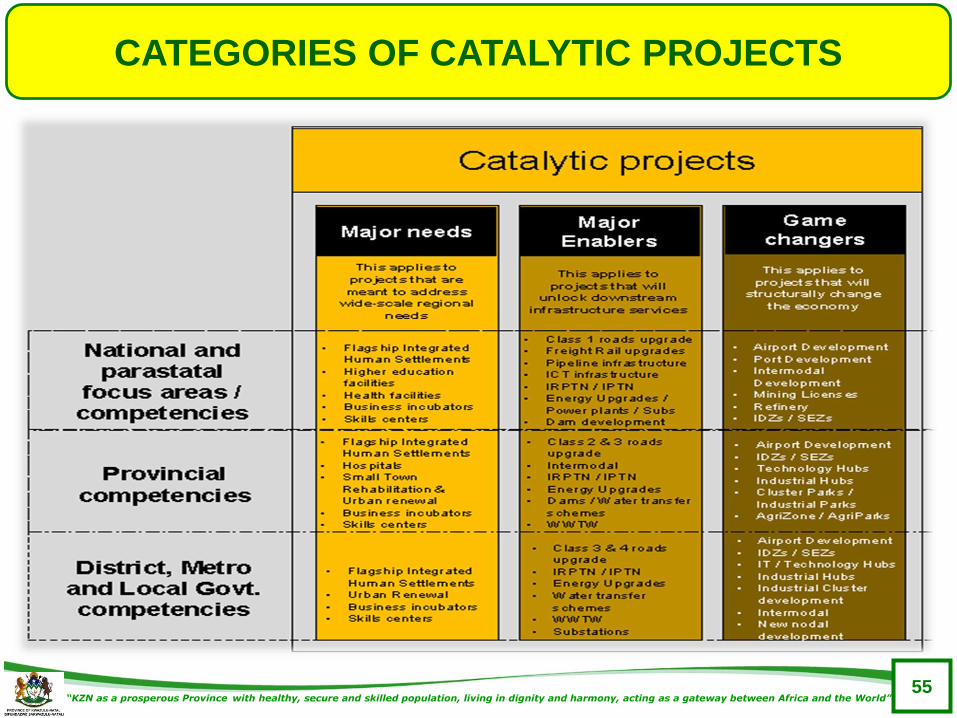
A Catalytic Project is defined as a project of significant scale
and scope that will make a substantial impact and
contribution to the achievement of the vision and goals of the
Province.
“KZN as a prosperous Province with healthy, secure and skilled population, living in dignity and harmony, acting as a gateway between Africa and the World”54
CATALYTIC PROJECTS
The significance of a project being awarded “Catalytic
status” is that it will confirm that such a project had been
subjected to a screening and prioritisation process of the
Provincial Planning Commission and the Economic Sector
and Infrastructure Development Cluster;
Catalytic Projects will receive preferential facilitation support
and guidance, in recognition of the contribution such a
project can make to achieve the growth targets of the
Province.
Catalytic Projects will form an integral part of the Provincial
Growth and Development Plan (PGDP), which will be
reviewed and adopted by the Provincial Executive Council
annually.
“KZN as a prosperous Province with healthy, secure and skilled population, living in dignity and harmony, acting as a gateway between Africa and the World”55
CATEGORIES OF CATALYTIC PROJECTS
“KZN as a prosperous Province with healthy, secure and skilled population, living in dignity and harmony, acting as a gateway between Africa and the World”56
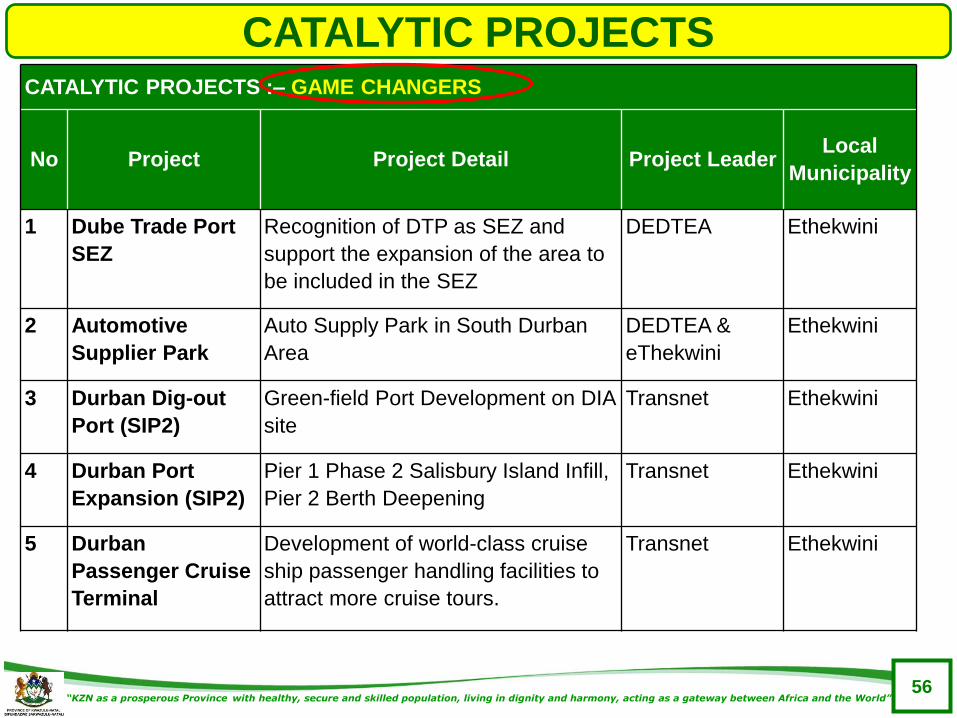
CATALYTIC PROJECTSCATALYTIC PROJECTS :– GAME CHANGERS
No Project Project Detail Project LeaderLocal
Municipality
1 Dube Trade Port
SEZ
Recognition of DTP as SEZ and
support the expansion of the area to
be included in the SEZ
DEDTEA Ethekwini
2 Automotive
Supplier Park
Auto Supply Park in South Durban
Area
DEDTEA &
eThekwini
Ethekwini
3 Durban Dig-out
Port (SIP2)
Green-field Port Development on DIA
site
Transnet Ethekwini
4 Durban Port
Expansion (SIP2)
Pier 1 Phase 2 Salisbury Island Infill,
Pier 2 Berth Deepening
Transnet Ethekwini
5 Durban
Passenger Cruise
Terminal
Development of world-class cruise
ship passenger handling facilities to
attract more cruise tours.
Transnet Ethekwini
“KZN as a prosperous Province with healthy, secure and skilled population, living in dignity and harmony, acting as a gateway between Africa and the World”57
6.
INSTITUTIONAL
FRAMEWORK FOR
IMPLEMENTATION
“KZN as a prosperous Province with healthy, secure and skilled population, living in dignity and harmony, acting as a gateway between Africa and the World”58
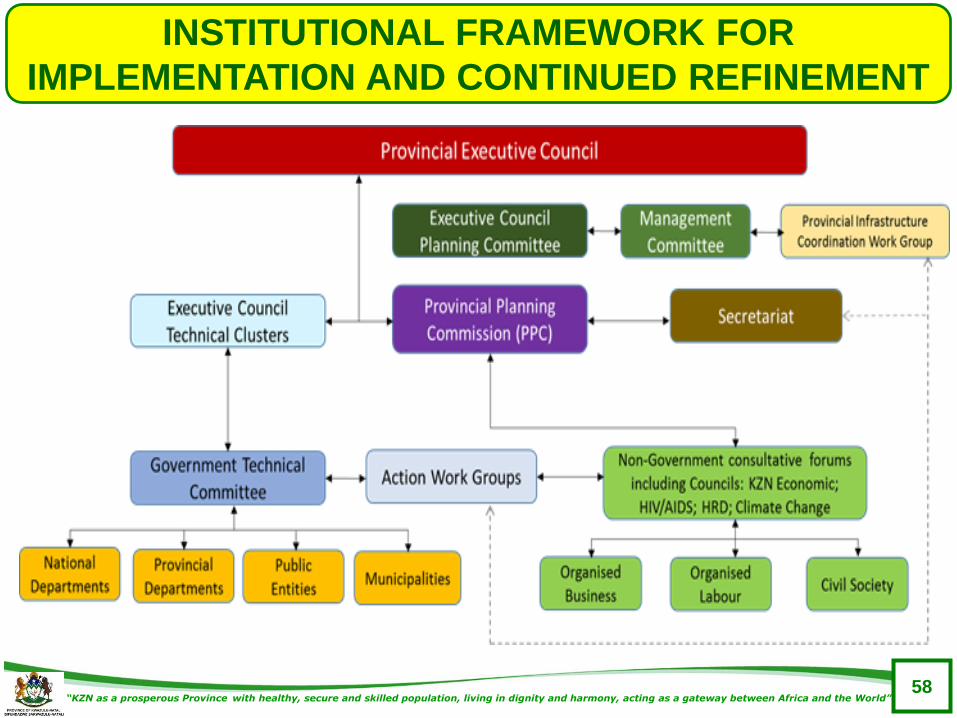
INSTITUTIONAL FRAMEWORK FOR
IMPLEMENTATION AND CONTINUED REFINEMENT
“KZN as a prosperous Province with healthy, secure and skilled population, living in dignity and harmony, acting as a gateway between Africa and the World”59
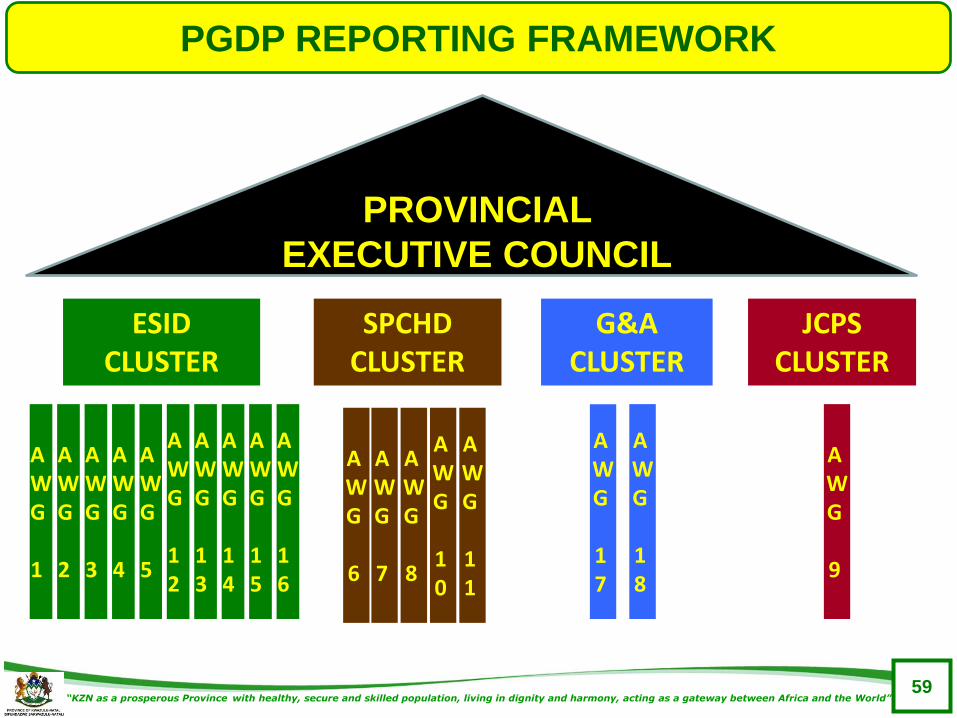
PGDP REPORTING FRAMEWORK
AWG
9
AWG
6
AWG
7
AWG
8
AWG
10
AWG
11
AWG
17
AWG
18
ESIDCLUSTER
SPCHDCLUSTER
G&ACLUSTER
JCPSCLUSTER
PROVINCIAL
EXECUTIVE COUNCIL
AWG
1
AWG
2
AWG
3
AWG
4
AWG
5
AWG
12
AWG
13
AWG
14
AWG
15
AWG
16
“KZN as a prosperous Province with healthy, secure and skilled population, living in dignity and harmony, acting as a gateway between Africa and the World”60
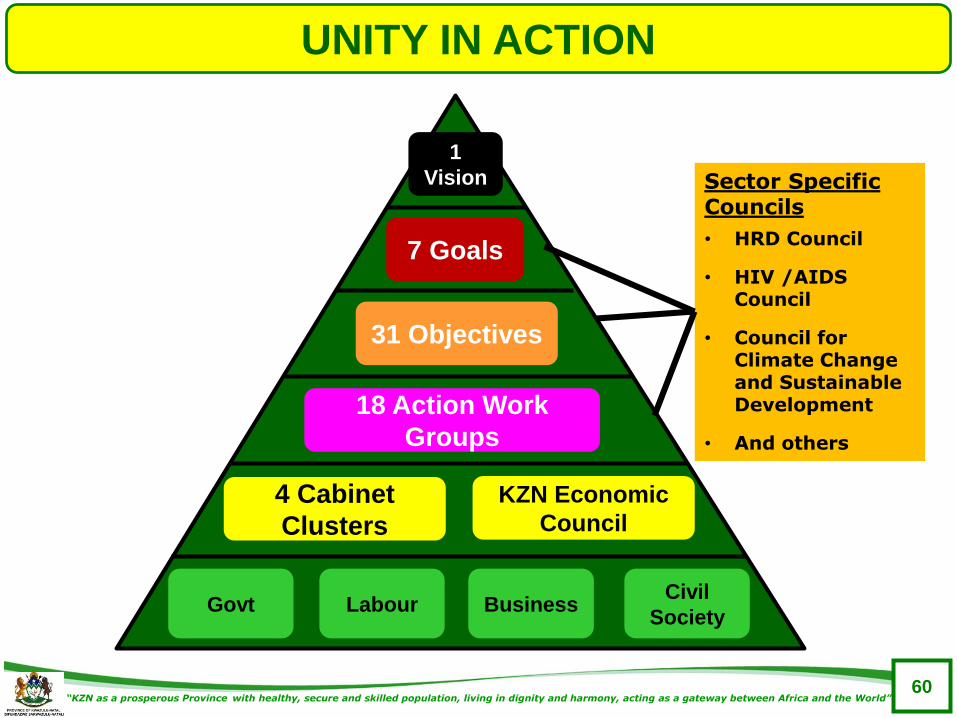
UNITY IN ACTION
18 Action Work
Groups
31 Objectives
1
Vision
KZN Economic
Council
Govt Labour BusinessCivil
Society
7 Goals
4 Cabinet
Clusters
Sector Specific Councils
• HRD Council
• HIV /AIDS Council
• Council for Climate Change and Sustainable Development
• And others
“KZN as a prosperous Province with healthy, secure and skilled population, living in dignity and harmony, acting as a gateway between Africa and the World”
Siyabonga - Thank You
www.kznppc.gov.za
61
PGDS 2016 and PGDP 2017/18
“Working Together to achieve
KZN Vision 2035”