Embed Size (px)
Citation preview

Biogeosciences, 18, 739–753, 2021https://doi.org/10.5194/bg-18-739-2021© Author(s) 2021. This work is distributed underthe Creative Commons Attribution 4.0 License.
L-band vegetation optical depth as an indicator of plant waterpotential in a temperate deciduous forest standNataniel M. Holtzman1, Leander D. L. Anderegg2,3, Simon Kraatz4, Alex Mavrovic5, Oliver Sonnentag6,Christoforos Pappas6, Michael H. Cosh7, Alexandre Langlois8, Tarendra Lakhankar9, Derek Tesser9,Nicholas Steiner10, Andreas Colliander11, Alexandre Roy5, and Alexandra G. Konings1
1Department of Earth System Science, Stanford University, Stanford, CA 94305, USA2Department of Integrative Biology, University of California Berkeley, Berkeley, CA, USA3Department of Ecology, Evolution and Marine Biology, University of California Santa Barbara, Santa Barbara, CA, USA4Department of Electrical and Computer Engineering, University of Massachusetts, Amherst, MA, USA5Département des Sciences de l’Environnement, Université du Québec à Trois-Rivières (UQTR),Trois-Rivières, Quebec, Canada6Département de géographie, Université de Montréal, Montréal, Quebec, H2V 2B8, Canada7Hydrology and Remote Sensing Laboratory, USDA ARS, Beltsville, MD, USA8Département de Géomatique Appliquée, Université de Sherbrooke, Sherbrooke, Quebec, Canada9NOAA-CESSRST, The City College of New York, City University of New York, New York, NY, USA10Department of Earth and Atmospheric Sciences, The City College of New York, City University of New York,New York, NY, USA11Jet Propulsion Laboratory, California Institute of Technology, Pasadena, CA, USA
Correspondence: Nataniel M. Holtzman ([email protected]) and Alexandra G. Konings ([email protected])
Received: 8 October 2020 – Discussion started: 16 October 2020Accepted: 14 December 2020 – Published: 1 February 2021
Abstract. Vegetation optical depth (VOD) retrieved from mi-crowave radiometry correlates with the total amount of waterin vegetation, based on theoretical and empirical evidence.Because the total amount of water in vegetation varies withrelative water content (as well as with biomass), this correla-tion further suggests a possible relationship between VODand plant water potential, a quantity that drives plant hy-draulic behavior. Previous studies have found evidence forthat relationship on the scale of satellite pixels tens of kilo-meters across, but these comparisons suffer from significantscaling error. Here we used small-scale remote sensing totest the link between remotely sensed VOD and plant wa-ter potential. We placed an L-band radiometer on a towerabove the canopy looking down at red oak forest stand duringthe 2019 growing season in central Massachusetts, UnitedStates. We measured stem xylem and leaf water potentialsof trees within the stand and retrieved VOD with a single-channel algorithm based on continuous radiometer measure-ments and measured soil moisture. VOD exhibited a diurnal
cycle similar to that of leaf and stem water potential, with apeak at approximately 05:00 eastern daylight time (UTC−4).VOD was also positively correlated with both the measureddielectric constant and water potentials of stem xylem overthe growing season. The presence of moisture on the leavesdid not affect the observed relationship between VOD andstem water potential. We used our observed VOD–water-potential relationship to estimate stand-level values for a ra-diative transfer parameter and a plant hydraulic parameter,which compared well with the published literature. Our find-ings support the use of VOD for plant hydraulic studies intemperate forests.
1 Introduction
To supply water for transpiration, plants transport water up-wards from soil to leaf through their xylem tissue under neg-ative pressure (tension). The rate of this transport process af-
Published by Copernicus Publications on behalf of the European Geosciences Union.
740 N. M. Holtzman et al.: Vegetation optical depth as indicator of plant water potential
fects the water status of leaves – leaf water potential resultsfrom the balance of water lost to transpiration and water re-filled through xylem. Through its effect on stomatal closure(Venturas et al., 2017), leaf water potential in turn controlstranspiration and photosynthesis rates. Accounting for planthydraulics has been shown to improve models of stomatalconductance (Anderegg et al., 2017; Liu et al., 2020; Sabotet al., 2020; Wolf et al., 2016). This has motivated the re-cent inclusion of plant hydraulics in a number of land sur-face models (Christoffersen et al., 2016; Eller et al., 2020;Kennedy et al., 2019). Beyond influencing water and car-bon fluxes, reductions in stem water potential (Adams et al.,2017) or water content (Rao et al., 2020) can cause drought-induced tree mortality, an increased risk under rising tem-peratures (Williams et al., 2013), and evaporative demand(Novick et al., 2016). The dynamics of how water flowsthrough vegetation can also affect fire risk (Nolan et al.,2020), crop yields (Konings et al., 2019), and phenology (Xuet al., 2016).
Spatiotemporally distributed data on plant water potentialcould therefore improve our global understanding of plant–water interactions, including aiding in the parametrizationand testing of the latest generation of global land surfacemodels. However, current measurements of plant water po-tential are taken on individual plants, using psychrometers orpressure chambers. These methods are expensive and labor-intensive. Furthermore, they are difficult to scale up from theplant to the ecosystem level because in many stands plantswith very different hydraulic strategies and associated wa-ter potential dynamics grow together (Matheny et al., 2017;Skelton et al., 2015). If remote sensing data could providesignals related to plant water potential, that data would nat-urally provide spatially aggregated and continuous informa-tion on plant water potential at scales relevant for land sur-face modeling (parameterization and validation) and policymaking (hot spots of areas vulnerable to drought stress). Pas-sive microwave remote sensing is sensitive to the water con-tent of vegetation through vegetation optical depth (VOD)and may therefore be a useful tool for monitoring ecosystem-scale plant water potential.
In grasslands and agricultural fields, VOD has been shownto be closely related to the total amount of water in veg-etation (Jackson and Schmugge, 1991) based on a varietyof campaigns with destructive measurements. Although de-structive measurements of water content are far more difficultin forests, electromagnetic theory suggests that this is alsothe case for forests (Ferrazzoli and Guerriero, 1996; Kurumet al., 2011). Furthermore, VOD at a range of electromag-netic frequencies has been found to scale with biomass inforests (Chaparro et al., 2019; Liu et al., 2015; Mialon et al.,2020) – a relationship that is formed through VOD’s sen-sitivity to water content. Relative water content (which in-fluences the canopy water content per unit area observed byremote sensing) and water potential in vegetation are mono-tonically related, as has been measured for countless species
by ecophysiologists using so-called pressure–volume curves(Barnard et al., 2011; Bartlett et al., 2012). VOD’s sensitiv-ity to vegetation water content therefore suggests it may alsobe sensitive to the water potential of aboveground vegetationcomponents, including leaves and stems. However, this hasnot yet been explicitly demonstrated.
Indirect evidence nevertheless suggests a relationship be-tween VOD and leaf water potential. Konings and Gentine(2017) showed that, if VOD is assumed to be linearly relatedto leaf water potential, it can be used to estimate ecosystem-scale patterns of isohydricity around the world, displayingthe expected global patterns. Momen et al. (2017) comparedfluctuations in satellite-based X-band VOD to in situ leafwater potential measurements in three forest and woodlandsites. After biomass changes were also accounted for throughthe leaf area index (LAI), they were able to predict VOD withR2= 0.6–0.8. Zhang et al. (2019) extended this approach by
estimating leaf water potential based on root zone soil mois-ture measurements in Oklahoma grasslands and using the as-sumption of predawn water equilibrium between soil mois-ture and leaf water potential. The resulting datasets were usedin combination with the normalized difference vegetation in-dex (NDVI) to study the variations of X-band VOD, find-ing that while biomass changes (estimated through NDVI)were the dominant driver of VOD changes on timescalesfrom daily to seasonal, water potential did provide some ad-ditional utility in predicting VOD. Both the Momen et al.(2017) and Zhang et al. (2019) studies suggest that leaf waterpotential may influence VOD, but the interpretation of bothof those studies is limited by the scale mismatch betweenwater potential data (individual plants) and VOD data (pix-els tens of kilometers wide). In this study, we aim to over-come the scale problem by using a microwave radiometermounted on a tower, instead of satellite data. The radiome-ter’s 20 m by 25 m field of view is approximately 5 ordersof magnitude smaller than the pixel size of satellite-basedVOD datasets. Furthermore, the field of view was dominatedby a single tree species. At this scale, measuring the waterpotentials of a few trees could give a good estimate of theaverage water potential of all vegetation within the radiome-ter’s view. Lastly, while microwave satellites typically maketwo overpasses per day for any given location, our radiome-ter provided temporally continuous data, allowing us to cap-ture the significant diurnal cycle in plant water potential. Wecombined the tower-based radiometer with measurements ofleaf and stem water potential, along with other environmentaldata, to investigate three research questions.
– How are VOD and plant water potential related at theforest stand scale?
– In a period of roughly constant biomass, how (if at all)does VOD change along with plant water potential ontimescales from hours to days?
Biogeosciences, 18, 739–753, 2021 https://doi.org/10.5194/bg-18-739-2021

N. M. Holtzman et al.: Vegetation optical depth as indicator of plant water potential 741
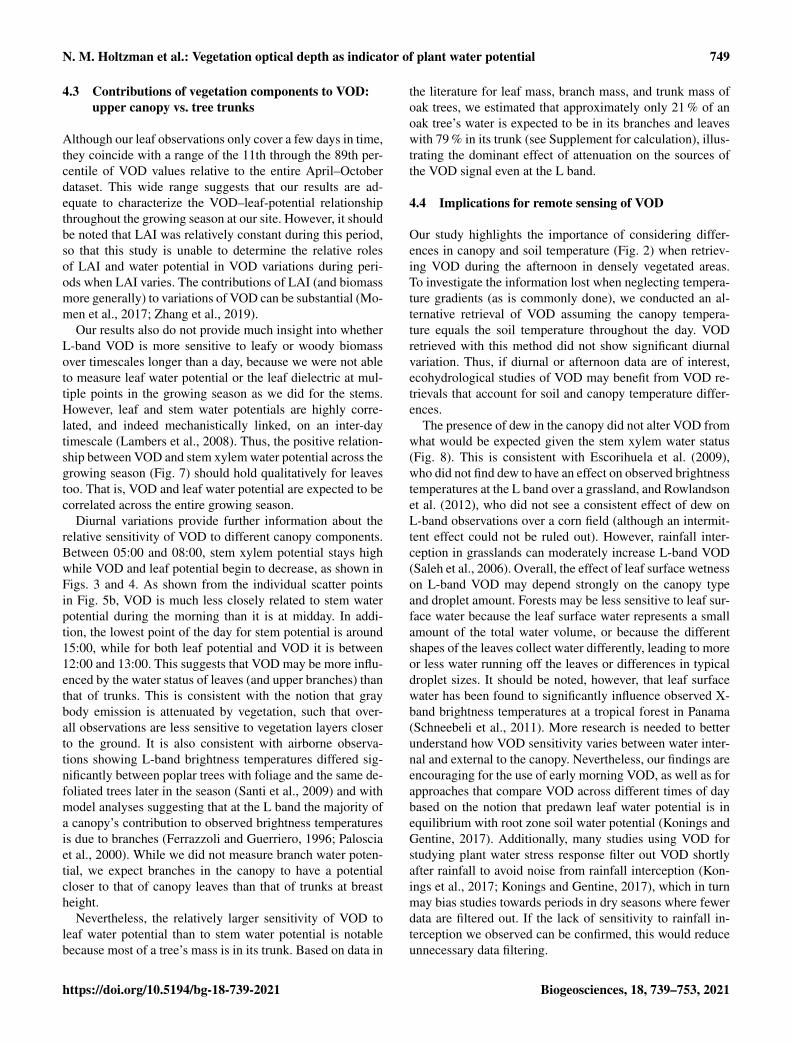
Figure 1. Radiometer setup at the Harvard Forest hardwood walk-up tower.
– What is the relative sensitivity of VOD to the water po-tential of woody stems vs. the water potential of leaves?
We also note that the effects of electromagnetic observationalfrequency on the sensitivity and utility of VOD for plantwater stress studies remain uncertain. Past studies of VODfor plant water stress have mostly focused on X-band (i.e.,∼ 10 GHz) VOD datasets from the Advanced MicrowaveScanning Radiometer for EOS (AMSR-E) and AdvancedMicrowave Scanning Radiometer 2 datasets, which allowscreation of a relatively long data record (Du et al., 2017;Moesinger et al., 2020). More recently, VOD datasets at theL band (∼ 1.2 GHz) have also been derived from the Euro-pean Space Agency (ESA) Soil Moisture and Ocean Salin-ity (SMOS) (Fernandez-Moran et al., 2017) and the NationalAeronautics and Space Administration (NASA) Soil Mois-ture Active Passive (SMAP; Konings et al., 2017) satellites.The relatively longer wavelengths of L-band observations re-duce sensitivity to atmospheric humidity and increase pene-tration throughout the vegetation canopy. We therefore focuson L-band observations in this study.
2 Methods
2.1 Field site
All data collection was conducted in 2019 near the hardwoodwalk-up tower in Harvard Forest (central Massachusetts,USA, 42.54◦ N, 72.17◦W). The site has a humid continen-tal climate, with an average summer temperature of 17.9 ◦Cduring June, July, and August 2019. The precipitation doesnot have a strong seasonality and totals to an annual valueof about 110 cm (Waring et al., 1995). The site is a temperatedeciduous forest dominated by red oak (Quercus rubra). Fig-ure 1 shows the view from the top of the tower in early July,
including the radiometer. The radiometer and certain otherinstruments were installed at the site in late April and col-lected data until they were taken down in early December.An intensive field campaign to collect leaf water potentialdata and to install additional instruments took place from 9to 12 July, with additional shorter visits thereafter.
2.2 Measurements
2.2.1 Microwave radiometer
As part of the SMAP Validation Experiment 2019–2021(SMAPVEX19-21) campaign (Colliander et al., 2020), adownward-looking radiometer was installed at Harvard For-est. On 28 April 2019, a dual-polarization L-band (1.4 GHz)radiometer (Potter Horn PR-1475, Radiometrics Inc., Boul-der, CO) was installed at 28 m above the ground surface on adouble-scaffold tower, viewing the forest canopy from aboveat an oblique viewing angle. This radiometer has previouslybeen used to study VOD and freeze–thaw state in a borealforest (Roy et al., 2020). The PR-1475 radiometer has an an-tenna with a 30◦ half-power beamwidth (−3 dB) with an inte-gration time of 8 s. The hourly median brightness was used infurther analysis to retrieve VOD. The antenna angle of inci-dence was adjusted manually with a hand crank and a digitallevel. The radiometer was set to take continuous measure-ments of brightness temperature (TB) above the canopy at anincidence angle from nadir of 40◦. The footprint dimensionsat 40◦ are 25 m long and 20 m wide. In addition, through-out the campaign, 15 calibrations were carried out using anambient black body as a warm target and sky measurementas a cold target (5 K). Based on these calibrations, the ra-diometer accuracy at V polarization was approximately 2 K(Rowlandson et al., 2018). While both V-polarization and H-polarization brightness temperatures were measured, the H-polarization data showed unexplained fluctuations through-out the campaign and were discarded from the analysis.
2.2.2 Plant physiological sensors
A variety of in situ soil and plant water sensors were alsoinstalled to better understand the drivers of the radiometricobservations. However, due to logistical constraints, each ofthe instruments had a different observation period. The mea-surements are summarized in Table 1. Stem water potentialwas measured by PSY-1 stem psychrometers (ICT Instru-ments) installed on the main trunks of three trees at breastheight. Two psychrometers were installed on 9 July 2019 andremoved on 12 July of the same year. A third psychrome-ter was installed on 10 July and continued operating until17 July when it ceased to collect realistic data, presumablydue to extruded tree sap entering the sensor. This psychrom-eter was cleaned and reinstalled twice, both times collectingdata for a few weeks before ceasing to collect data. In ad-dition to the first operating period in July, the psychrometer
https://doi.org/10.5194/bg-18-739-2021 Biogeosciences, 18, 739–753, 2021
742 N. M. Holtzman et al.: Vegetation optical depth as indicator of plant water potential
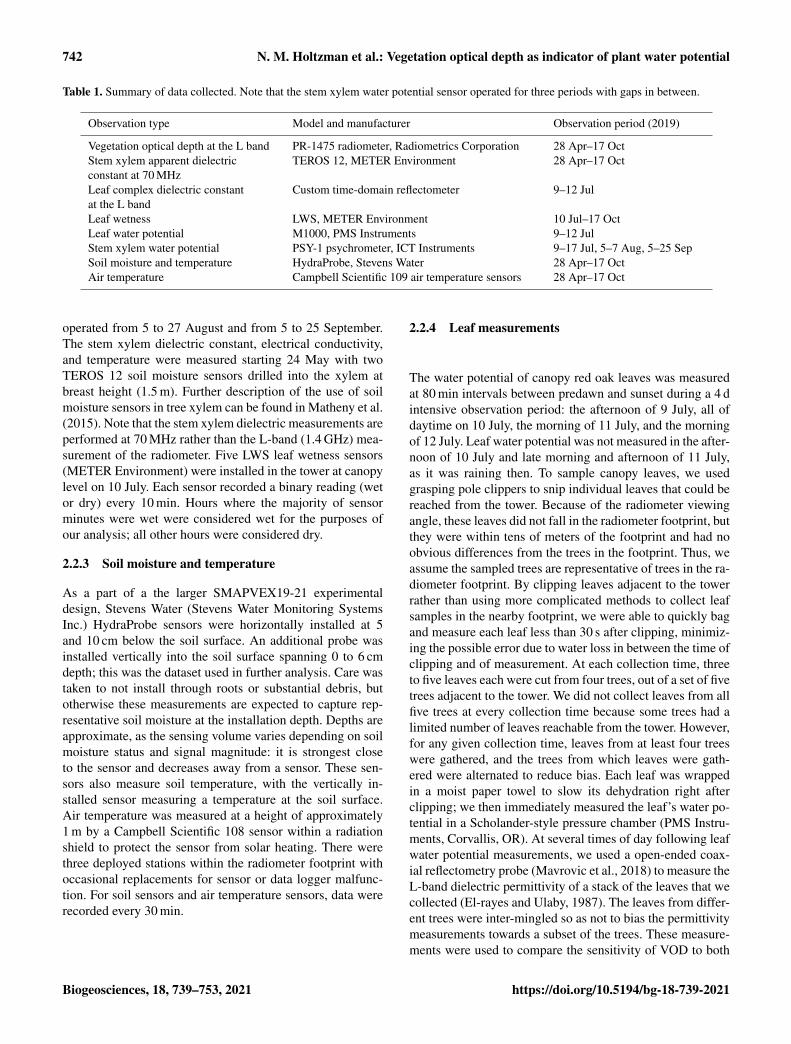
Table 1. Summary of data collected. Note that the stem xylem water potential sensor operated for three periods with gaps in between.
Observation type Model and manufacturer Observation period (2019)
Vegetation optical depth at the L band PR-1475 radiometer, Radiometrics Corporation 28 Apr–17 OctStem xylem apparent dielectricconstant at 70 MHz
TEROS 12, METER Environment 28 Apr–17 Oct
Leaf complex dielectric constantat the L band
Custom time-domain reflectometer 9–12 Jul
Leaf wetness LWS, METER Environment 10 Jul–17 OctLeaf water potential M1000, PMS Instruments 9–12 JulStem xylem water potential PSY-1 psychrometer, ICT Instruments 9–17 Jul, 5–7 Aug, 5–25 SepSoil moisture and temperature HydraProbe, Stevens Water 28 Apr–17 OctAir temperature Campbell Scientific 109 air temperature sensors 28 Apr–17 Oct
operated from 5 to 27 August and from 5 to 25 September.The stem xylem dielectric constant, electrical conductivity,and temperature were measured starting 24 May with twoTEROS 12 soil moisture sensors drilled into the xylem atbreast height (1.5 m). Further description of the use of soilmoisture sensors in tree xylem can be found in Matheny et al.(2015). Note that the stem xylem dielectric measurements areperformed at 70 MHz rather than the L-band (1.4 GHz) mea-surement of the radiometer. Five LWS leaf wetness sensors(METER Environment) were installed in the tower at canopylevel on 10 July. Each sensor recorded a binary reading (wetor dry) every 10 min. Hours where the majority of sensorminutes were wet were considered wet for the purposes ofour analysis; all other hours were considered dry.
2.2.3 Soil moisture and temperature
As a part of a the larger SMAPVEX19-21 experimentaldesign, Stevens Water (Stevens Water Monitoring SystemsInc.) HydraProbe sensors were horizontally installed at 5and 10 cm below the soil surface. An additional probe wasinstalled vertically into the soil surface spanning 0 to 6 cmdepth; this was the dataset used in further analysis. Care wastaken to not install through roots or substantial debris, butotherwise these measurements are expected to capture rep-resentative soil moisture at the installation depth. Depths areapproximate, as the sensing volume varies depending on soilmoisture status and signal magnitude: it is strongest closeto the sensor and decreases away from a sensor. These sen-sors also measure soil temperature, with the vertically in-stalled sensor measuring a temperature at the soil surface.Air temperature was measured at a height of approximately1 m by a Campbell Scientific 108 sensor within a radiationshield to protect the sensor from solar heating. There werethree deployed stations within the radiometer footprint withoccasional replacements for sensor or data logger malfunc-tion. For soil sensors and air temperature sensors, data wererecorded every 30 min.
2.2.4 Leaf measurements
The water potential of canopy red oak leaves was measuredat 80 min intervals between predawn and sunset during a 4 dintensive observation period: the afternoon of 9 July, all ofdaytime on 10 July, the morning of 11 July, and the morningof 12 July. Leaf water potential was not measured in the after-noon of 10 July and late morning and afternoon of 11 July,as it was raining then. To sample canopy leaves, we usedgrasping pole clippers to snip individual leaves that could bereached from the tower. Because of the radiometer viewingangle, these leaves did not fall in the radiometer footprint, butthey were within tens of meters of the footprint and had noobvious differences from the trees in the footprint. Thus, weassume the sampled trees are representative of trees in the ra-diometer footprint. By clipping leaves adjacent to the towerrather than using more complicated methods to collect leafsamples in the nearby footprint, we were able to quickly bagand measure each leaf less than 30 s after clipping, minimiz-ing the possible error due to water loss in between the time ofclipping and of measurement. At each collection time, threeto five leaves each were cut from four trees, out of a set of fivetrees adjacent to the tower. We did not collect leaves from allfive trees at every collection time because some trees had alimited number of leaves reachable from the tower. However,for any given collection time, leaves from at least four treeswere gathered, and the trees from which leaves were gath-ered were alternated to reduce bias. Each leaf was wrappedin a moist paper towel to slow its dehydration right afterclipping; we then immediately measured the leaf’s water po-tential in a Scholander-style pressure chamber (PMS Instru-ments, Corvallis, OR). At several times of day following leafwater potential measurements, we used a open-ended coax-ial reflectometry probe (Mavrovic et al., 2018) to measure theL-band dielectric permittivity of a stack of the leaves that wecollected (El-rayes and Ulaby, 1987). The leaves from differ-ent trees were inter-mingled so as not to bias the permittivitymeasurements towards a subset of the trees. These measure-ments were used to compare the sensitivity of VOD to both
Biogeosciences, 18, 739–753, 2021 https://doi.org/10.5194/bg-18-739-2021
N. M. Holtzman et al.: Vegetation optical depth as indicator of plant water potential 743
water potential and the dielectric constant for both leaves andstem xylem.
On the last day of the intensive observation period(12 July), three leaves and three 5 cm long terminal brancheswere collected predawn and saved in closed plastic bags withmoist paper towels. A pressure–volume curve relating watercontent to water potential was created for each of these sam-ples by repeatedly measuring its mass and its water potentialas it dried.
2.3 Vegetation optical depth (VOD) retrieval
To retrieve VOD, we employed a single-channel algorithm(SCA) using V-polarized L-band brightness temperaturefrom the tower-based radiometer. Based on the zeroth-orderradiative transfer model commonly called the tau–omegamodel (Mo et al., 1982; Ulaby and Long, 2014), brightnesstemperature at V polarization can be written as follows:
TB,V = (1− rV)γ Ts+ωγ (1+ rVγ )Tc, (1)
where TB is the V-polarized brightness temperature, r isrough soil reflectivity in the same polarization, γ is vegeta-tion transmissivity, ω is vegetation single-scattering albedo,Ts is soil temperature, and Tc is canopy temperature. Trans-missivity is a function of VOD:
γ = exp(−
VODcosθ
), (2)
where θ is the incidence angle of the sensor. Here, θ wasfixed at θ = 40◦ to match the observational conditions of theSMAP satellite. Single-channel algorithms for soil moistureretrieval commonly first assume a value of VOD and solveEq. (2) for soil reflectivity, which is sensitive to soil mois-ture (Ulaby and Long, 2014). In this study we take the oppo-site approach, using soil moisture from in situ observationsand solving for VOD. Once rV is known, Eq. (1) is exactlysolvable for γ (and thus for VOD) if all other variables areknown. As is common in satellite-based studies (Owe et al.,2001), we did not attempt to retrieve VOD during hours whenprecipitation was occurring, to avoid VOD retrievals beinginfluenced by water in the atmosphere as opposed to water invegetation. For this purpose, we used precipitation data fromthe Fisher Meteorological Station at Harvard Forest, locatedin an open field approximately 1.3 km from the site of theradiometer.
A common assumption in microwave radiometry is thatthe soil and canopy are in thermal equilibrium, and their tem-peratures can be treated as equal, for early morning satel-lite overpasses (06:00 for both SMAP and SMOS) (O’Neillet al., 2019). In this study, we use observations from all timesof day, not just the early morning. Thus, we did not assumeTs = Tc; instead we used different sources of data for soiland canopy temperature. Soil temperature was measured atthe soil surface. Although canopy biological temperature was
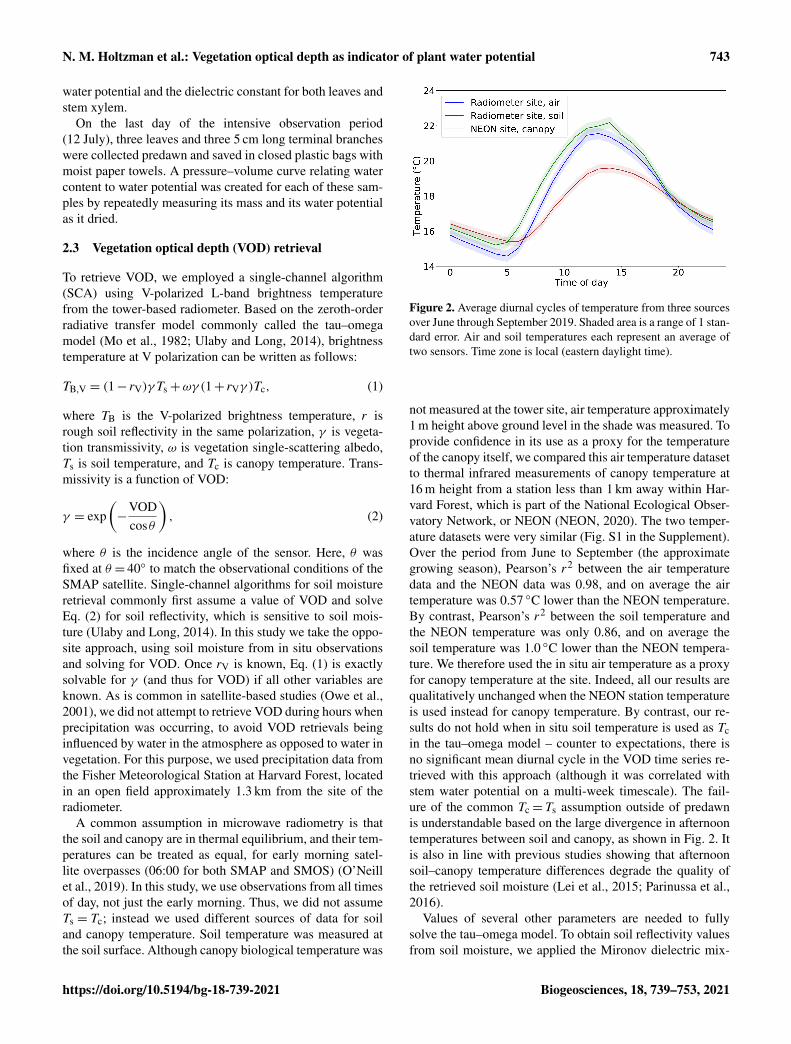
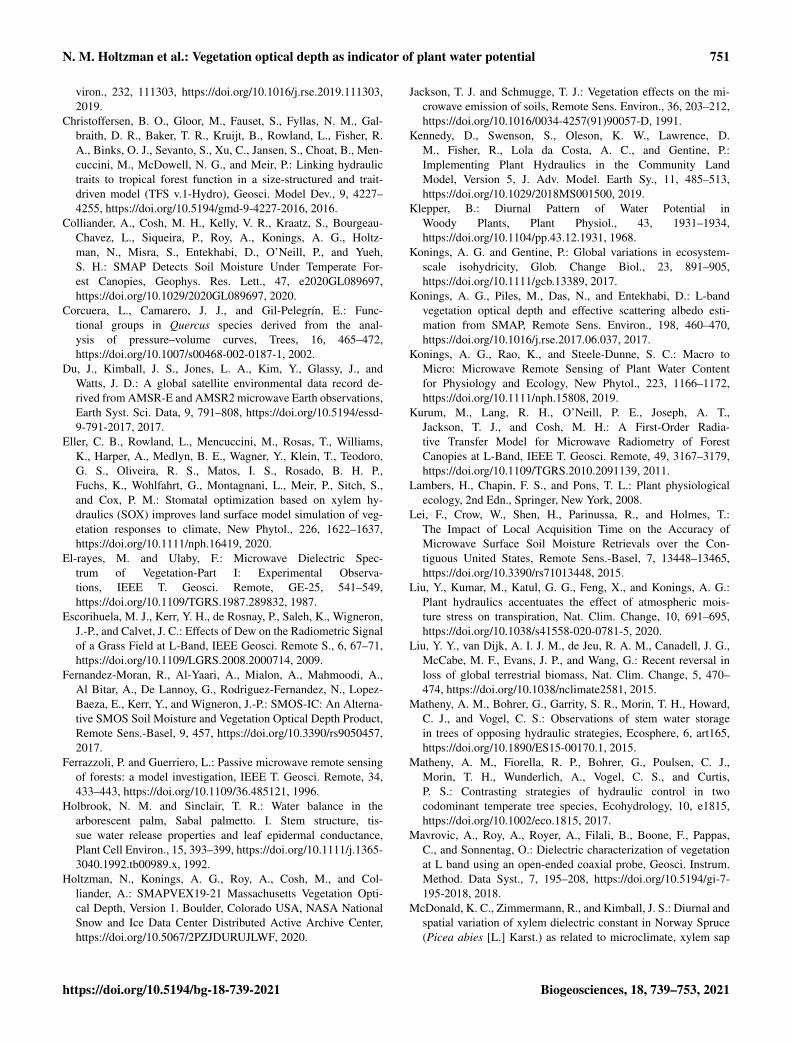
Figure 2. Average diurnal cycles of temperature from three sourcesover June through September 2019. Shaded area is a range of 1 stan-dard error. Air and soil temperatures each represent an average oftwo sensors. Time zone is local (eastern daylight time).
not measured at the tower site, air temperature approximately1 m height above ground level in the shade was measured. Toprovide confidence in its use as a proxy for the temperatureof the canopy itself, we compared this air temperature datasetto thermal infrared measurements of canopy temperature at16 m height from a station less than 1 km away within Har-vard Forest, which is part of the National Ecological Obser-vatory Network, or NEON (NEON, 2020). The two temper-ature datasets were very similar (Fig. S1 in the Supplement).Over the period from June to September (the approximategrowing season), Pearson’s r2 between the air temperaturedata and the NEON data was 0.98, and on average the airtemperature was 0.57 ◦C lower than the NEON temperature.By contrast, Pearson’s r2 between the soil temperature andthe NEON temperature was only 0.86, and on average thesoil temperature was 1.0 ◦C lower than the NEON tempera-ture. We therefore used the in situ air temperature as a proxyfor canopy temperature at the site. Indeed, all our results arequalitatively unchanged when the NEON station temperatureis used instead for canopy temperature. By contrast, our re-sults do not hold when in situ soil temperature is used as Tcin the tau–omega model – counter to expectations, there isno significant mean diurnal cycle in the VOD time series re-trieved with this approach (although it was correlated withstem water potential on a multi-week timescale). The fail-ure of the common Tc= Ts assumption outside of predawnis understandable based on the large divergence in afternoontemperatures between soil and canopy, as shown in Fig. 2. Itis also in line with previous studies showing that afternoonsoil–canopy temperature differences degrade the quality ofthe retrieved soil moisture (Lei et al., 2015; Parinussa et al.,2016).
Values of several other parameters are needed to fullysolve the tau–omega model. To obtain soil reflectivity valuesfrom soil moisture, we applied the Mironov dielectric mix-
https://doi.org/10.5194/bg-18-739-2021 Biogeosciences, 18, 739–753, 2021

744 N. M. Holtzman et al.: Vegetation optical depth as indicator of plant water potential
ing model to the in situ soil moisture time series (Mironovet al., 2002) using a value of 9 % clay content that McFar-lane et al. (2013) measured at Harvard Forest. The scatter-ing albedo (ω = 0.05) and the effect of soil surface rough-ness were parametrized as in the SMAP soil moisture prod-uct with parameters for temperate broadleaf forest. Using adifferent soil roughness correction shifts the retrieved VODupward or downward but does not substantially change itstrend or diurnal cycle. For example, doubling the root-mean-square (rms) height in the roughness correction lowers theaverage VOD by 0.067 and results in a VOD that is corre-lated to the original VOD with r2
= 0.99. Using a lowerscattering albedo also shifts the retrieved VOD. For exam-ple, lowering the scattering albedo from 0.05 to 0.03 low-ers the average VOD by 0.30 and results in a VOD that iscorrelated to the original VOD with r2
= 0.75. By contrast,when a higher scattering albedo is used, the retrieval fails toconverge for large periods of time (i.e., there are no solu-tions to the tau–omega equation for which γ is a real num-ber). For example, as the albedo is increased from 0.05 to0.06 to 0.07, the fraction of hours where retrieval is success-ful decreases from 0.90 to 0.40 to 0.075. Finally, we com-pared our tower-based single-channel VOD retrievals withVOD retrieved from SMAP satellite data using the multi-temporal dual-channel algorithm (MT-DCA) (Konings et al.,2017). The spatial resolution of this SMAP dataset is 9 km.The SMAP pixel containing the Harvard Forest tower site ismasked out in the MT-DCA data, as are the adjacent pix-els to the west and south, because of proximity to a wa-ter body (the Quabbin Reservoir). Thus, we compared ourtower-based VOD to the MT-DCA VOD from the adjacentSMAP pixels to the east and north of the tower site.
2.4 Interpretation of VOD–plant-water-potentialrelationship
To aid in interpretation, we characterized the relationship be-tween plant water potential and VOD using a simple multi-plicative model, noting that vegetation water content (VWC)scales with both dry biomass (AGB) and the amount of waterper unit biomass (relative water content, RWCB). We use thesame model as in Momen et al. (2017):
VOD= b ·VWC= b ·AGB ·RWCB. (3)
Above, b is the slope of the relationship between VOD andtotal water content. In physiological studies, it is customaryto define another type of relative water content: the watercontent of the plant divided by its maximum possible watercontent (i.e., the fully hydrated water content). We will callthis quantity RWCH. It is possible to convert between thetwo types of relative water content based on the average drymatter content of the plant (DMC, dry mass per total mass atfull hydration):
RWCB =1−DMC
DMC·RWCH. (4)
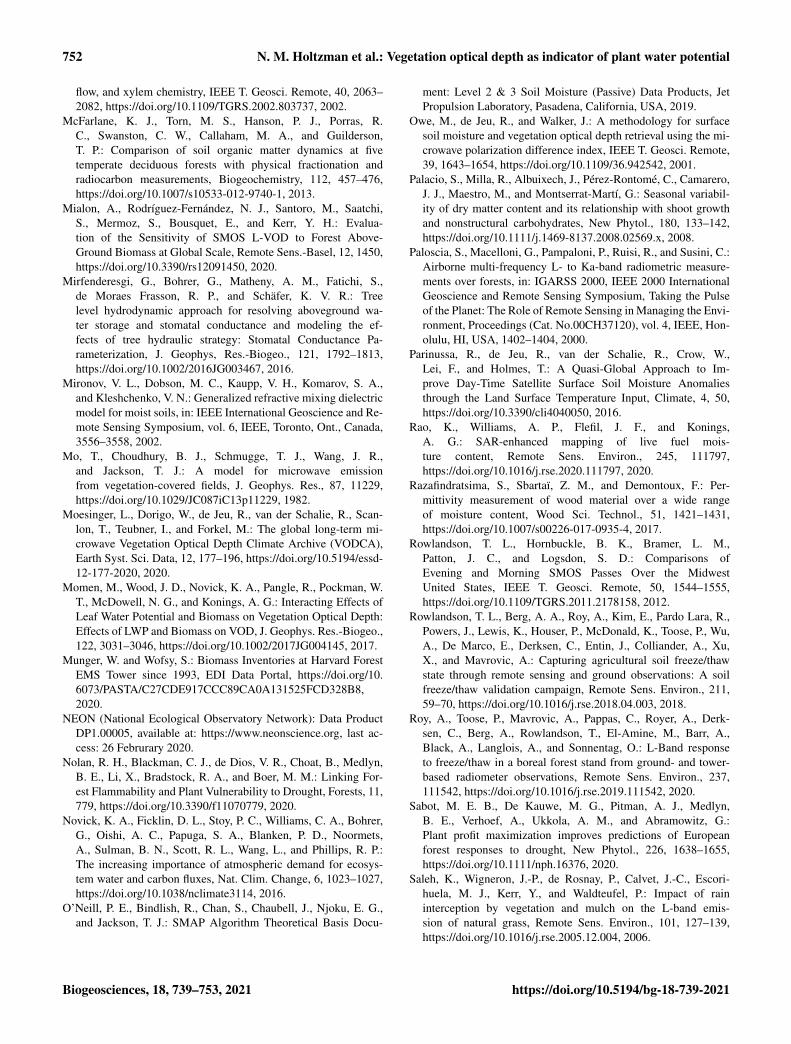
Figure 3. VOD, the stem xylem dielectric constant at 70 MHz, andplant water potential during the intensive observation period. Notethat stem water potential and leaf water potential were measured ondifferent sets of trees.
In this equation, the quantity (1−DMC)/DMC representsthe ratio between water mass and dry mass for a fully hy-drated plant.
While the relationship between RWCH and plant water po-tential is usually nonlinear, especially at very low water po-tentials (Barnard et al., 2011; Bartlett et al., 2012), here weapproximate the plant’s pressure–volume curve over the typ-ically observed water potential range as a linear function:
RWCH = 1+ψ/ε. (5)
In this equation, the maximum possible RWCH value of 1is achieved when potential (ψ) is 0, and more negative valuesof potential produce a lower water content. The bulk modulusof elasticity ε represents the change in water potential perchange in RWCH. Combining Eqs. (3), (4), and (5), VODcan be modeled as
VOD= b ·AGB ·1−DMC
DMC· (1+ψ/ε). (6)
When biomass is constant, Eq. (6) takes the form of a lin-ear relationship between plant water potential and VOD. Inthis study, we measured changes in VOD and plant water po-tential during a period of several days in midsummer, duringwhich biomass was assumed to be constant. A linear functionwas fitted to the observed relationship between VOD and leafwater potential, and values of the ε and b parameters werecalculated from the slope and intercept of that function.
3 Results
3.1 Temporal dynamics of VOD and plant water status
The retrieved VOD time series ranges from 0.18 to 2.09,with a mean of 1.00, a 25th percentile of 0.87, and a
Biogeosciences, 18, 739–753, 2021 https://doi.org/10.5194/bg-18-739-2021

N. M. Holtzman et al.: Vegetation optical depth as indicator of plant water potential 745
75th percentile of 1.14 (Fig. S2). These are realistic val-ues for a dense forest (Konings et al., 2017). There is adeclining trend of VOD over the course of the summerfrom June through September (slope=−0.10± 0.0033 permonth), which may correspond to drying conditions; soilmoisture also showed a decreasing trend over the same pe-riod (slope=−0.053± 0.00086 cm3 cm−3 per month). Theminimum values of VOD, stem water potential, and soilmoisture are all achieved during the same few days in mid-September (Fig. S2). VOD, the stem dielectric, and bothleaf and stem water potential all show a diurnal oscillation(Fig. 3). They are lowest around midday and afternoon andhighest between midnight and predawn hours. This daily cy-cle in water potential and the stem xylem dielectric has beenobserved extensively in prior studies and represents the sig-nature of plant water usage (Klepper, 1968; Matheny et al.,2017). During daytime the plant loses water to transpiration,and during night it refills its water by drawing on soil mois-ture. There is additional variation on VOD on top of this gen-eral diurnal pattern, which are at least partially attributableto transient meteorological conditions. For example, around13:00 on 10 July, the weather at the site changed from sunnyto cloudy for an hour, leading to temporarily decreased tran-spiration rate and thus causing plant water potential and VODto increase during that hour (Fig. 3).
As illustrated in Fig. S2, the magnitude of VOD retrievedfrom the tower-based radiometer using the single-channel al-gorithm is similar to VOD retrieved from the SMAP satel-lite over nearby pixels using the MT-DCA. This close matchadds to our confidence that our retrieved VOD is in a real-istic range for the Harvard Forest site. However, VOD fromthe tower radiometer shows more detailed temporal dynam-ics than what is seen from SMAP. For example, between 7and 15 August the tower VOD first increases and then de-creases, following the changes in the stem dielectric. In con-trast, SMAP VOD shows little change over that time period,likely due to spatial heterogeneity within the SMAP footprintthat does not affect the tower radiometer footprint.
The similarity between the diurnal patterns of water po-tential and VOD is even more apparent when the entire VODrecord is composited into an average daily cycle (Fig. 4).In this view, leaf water potential starts decreasing approxi-mately 3 h before stem xylem water potential does. This laghas been seen in models and field studies (Zweifel et al.,2001) and is due to the leaves being exposed to the sun anddrying out faster than the signal of decreasing water poten-tial propagates down to the lower trunk. The diurnal courseof VOD starts decreasing early in the morning, with the mag-nitude, start of the decline, and daily minimum time all moresimilar to leaf potential than to stem xylem potential. The im-plications of this difference are discussed further in Sect. 4.3.The average diurnal cycle of VOD over only 9 July through17 July (the period shown in Fig. 3) is not as smooth as thataveraged over the longer period, but it has the same qualita-tive features.
Figure 4. Average diurnal cycles of VOD and plant water potential.Shaded area is a range of 1 standard error for VOD.
Figure 5. Scatter plots and regression lines of VOD compared toleaf and stem xylem potential, averaged over all samples at eachtime point, during 9–12 July 2019.
3.2 Leaf and stem influence on VOD
When simultaneous measurements of VOD, leaf water po-tential, and stem xylem water potential are all compared,VOD is strongly positively correlated with both average stemand average leaf water potential (Fig. 5). However, the VOD–stem-water-potential relationship breaks down at very wetvalues of stem xylem water potential in the early morn-ing hours, possibly due to lack of sensitivity of the psy-chrometer in this regime. It is not clear from this analysiswhich part of the plant influences VOD more. When us-ing linear regression to predict VOD from a weighted av-erage of leaf and stem potential, the leaf potential has ap-proximately 1.5 times the weight of stem potential (VOD=1.15+0.18ψleaf+0.12ψstem, R2
= 0.66, p < 0.0001). How-ever, the results of this regression should be taken with cau-tion for two reasons. First, collinearity between leaf and stemxylem potential means the weights have very large standarderrors (0.18± 0.08 and 0.12± 0.07, respectively). Second,we measured more trees for leaf potential (n= 5) than for
https://doi.org/10.5194/bg-18-739-2021 Biogeosciences, 18, 739–753, 2021

746 N. M. Holtzman et al.: Vegetation optical depth as indicator of plant water potential
Figure 6. Scatter plots of leaf water potential, the leaf dielectricconstant at the L band (real part), and VOD. Leaf measurementswere taken 9–12 July. For leaf water potential, each point repre-sents a mean of several single-leaf measurements per tree from fivetrees. For the leaf dielectric, each point represents a mean of mea-surements from five trees, with multiple vertically stacked leavesper tree contributing to each measurement. Error bars represent 1standard error. The dashed line represents a linear regression.
stem xylem potential (n= 2) during the time period whereleaf and stem measurements overlapped, so we would expectless noise in the leaf measurements once they are averaged.
The parameters ε and b in Eq. (6) can be estimated usingthe measured relationship between leaf water potential andVOD shown in Fig. 5a. To do so, we assumed a typical above-ground biomass value for Harvard Forest of 12.5 kgm−2
(Munger and Wofsy, 2020). Furthermore, we assumed thatthe tree-scale dry matter content falls in the range of 0.37to 0.57 that Palacio et al. (2008) observed in oak branchesin Spain. Depending on the unknown DMC at our site, weestimate a possible range of 0.055 to 0.13 for b, the slope be-tween VOD and the total vegetation water content (VWC),and a value of 4.1 MPa for ε, the modulus of elasticity. Re-sults were similar when stem water potential was used in-stead of leaf water potential in this procedure, yielding esti-mates of 0.050 to 0.11 for b and 4.4 MPa for ε.
Figure 7. Scatter plots of stem xylem water potential, the stemxylem apparent dielectric permittivity at 70 MHz, and VOD withlinear fits. Stem measurements are from a single tree. The 3 monthslabeled by color correspond to three successive installations of thestem psychrometer used to measure stem water potential. For eachscatter plot, Pearson correlations (R) are shown for the whole periodas well. See Table S1 in the Supplement for Pearson correlations andSpearman rank correlations for each installation.
Based on electromagnetic theory, the L-band dielectricconstant (rather than water content or potential) is the phys-ical variable that should directly control L-band VOD. Inter-estingly, as shown in Fig. 6, leaf water potential can actuallypredict VOD (Fig. 6c) slightly better than direct measure-ments of the L-band leaf dielectric constant can (Fig. 6b).This finding may be due to differing noise levels in the mea-surement systems we used for potential compared to thedielectric constant. The VOD–leaf-potential correlation inFig. 6 is different from that in Fig. 5, because Fig. 6 is limitedto leaf water potential observations that coincided with a leafdielectric constant observation. Over several months, VOD ispositively correlated with stem xylem water potential, as wellas with the stem dielectric constant at 70 MHz (Fig. 7). Thisfinding suggests that the potential–VOD relationship holdsover the entire growing season.
Biogeosciences, 18, 739–753, 2021 https://doi.org/10.5194/bg-18-739-2021
N. M. Holtzman et al.: Vegetation optical depth as indicator of plant water potential 747
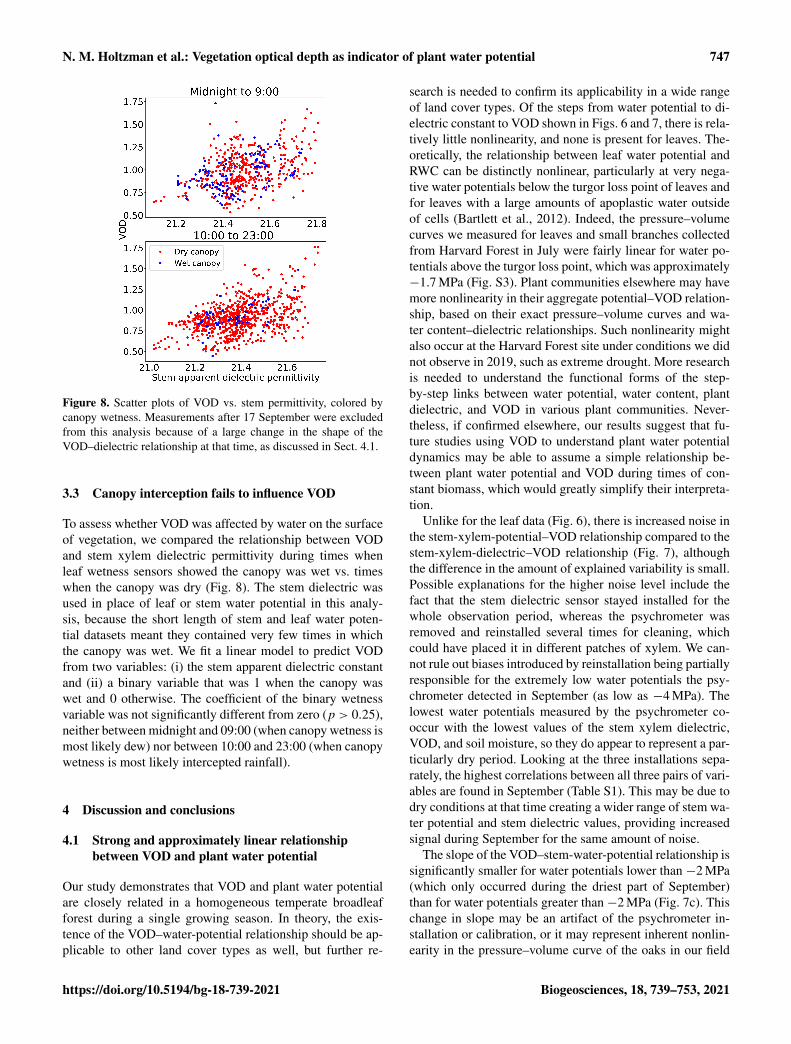
Figure 8. Scatter plots of VOD vs. stem permittivity, colored bycanopy wetness. Measurements after 17 September were excludedfrom this analysis because of a large change in the shape of theVOD–dielectric relationship at that time, as discussed in Sect. 4.1.
3.3 Canopy interception fails to influence VOD
To assess whether VOD was affected by water on the surfaceof vegetation, we compared the relationship between VODand stem xylem dielectric permittivity during times whenleaf wetness sensors showed the canopy was wet vs. timeswhen the canopy was dry (Fig. 8). The stem dielectric wasused in place of leaf or stem water potential in this analy-sis, because the short length of stem and leaf water poten-tial datasets meant they contained very few times in whichthe canopy was wet. We fit a linear model to predict VODfrom two variables: (i) the stem apparent dielectric constantand (ii) a binary variable that was 1 when the canopy waswet and 0 otherwise. The coefficient of the binary wetnessvariable was not significantly different from zero (p > 0.25),neither between midnight and 09:00 (when canopy wetness ismost likely dew) nor between 10:00 and 23:00 (when canopywetness is most likely intercepted rainfall).
4 Discussion and conclusions
4.1 Strong and approximately linear relationshipbetween VOD and plant water potential
Our study demonstrates that VOD and plant water potentialare closely related in a homogeneous temperate broadleafforest during a single growing season. In theory, the exis-tence of the VOD–water-potential relationship should be ap-plicable to other land cover types as well, but further re-
search is needed to confirm its applicability in a wide rangeof land cover types. Of the steps from water potential to di-electric constant to VOD shown in Figs. 6 and 7, there is rela-tively little nonlinearity, and none is present for leaves. The-oretically, the relationship between leaf water potential andRWC can be distinctly nonlinear, particularly at very nega-tive water potentials below the turgor loss point of leaves andfor leaves with a large amounts of apoplastic water outsideof cells (Bartlett et al., 2012). Indeed, the pressure–volumecurves we measured for leaves and small branches collectedfrom Harvard Forest in July were fairly linear for water po-tentials above the turgor loss point, which was approximately−1.7 MPa (Fig. S3). Plant communities elsewhere may havemore nonlinearity in their aggregate potential–VOD relation-ship, based on their exact pressure–volume curves and wa-ter content–dielectric relationships. Such nonlinearity mightalso occur at the Harvard Forest site under conditions we didnot observe in 2019, such as extreme drought. More researchis needed to understand the functional forms of the step-by-step links between water potential, water content, plantdielectric, and VOD in various plant communities. Never-theless, if confirmed elsewhere, our results suggest that fu-ture studies using VOD to understand plant water potentialdynamics may be able to assume a simple relationship be-tween plant water potential and VOD during times of con-stant biomass, which would greatly simplify their interpreta-tion.
Unlike for the leaf data (Fig. 6), there is increased noise inthe stem-xylem-potential–VOD relationship compared to thestem-xylem-dielectric–VOD relationship (Fig. 7), althoughthe difference in the amount of explained variability is small.Possible explanations for the higher noise level include thefact that the stem dielectric sensor stayed installed for thewhole observation period, whereas the psychrometer wasremoved and reinstalled several times for cleaning, whichcould have placed it in different patches of xylem. We can-not rule out biases introduced by reinstallation being partiallyresponsible for the extremely low water potentials the psy-chrometer detected in September (as low as −4 MPa). Thelowest water potentials measured by the psychrometer co-occur with the lowest values of the stem xylem dielectric,VOD, and soil moisture, so they do appear to represent a par-ticularly dry period. Looking at the three installations sepa-rately, the highest correlations between all three pairs of vari-ables are found in September (Table S1). This may be due todry conditions at that time creating a wider range of stem wa-ter potential and stem dielectric values, providing increasedsignal during September for the same amount of noise.
The slope of the VOD–stem-water-potential relationship issignificantly smaller for water potentials lower than −2 MPa(which only occurred during the driest part of September)than for water potentials greater than −2 MPa (Fig. 7c). Thischange in slope may be an artifact of the psychrometer in-stallation or calibration, or it may represent inherent nonlin-earity in the pressure–volume curve of the oaks in our field
https://doi.org/10.5194/bg-18-739-2021 Biogeosciences, 18, 739–753, 2021
748 N. M. Holtzman et al.: Vegetation optical depth as indicator of plant water potential
site. The pressure–volume curves we measured for leavesand branches only contain water potentials greater than−2.5 MPa, so they do not provide information on hydraulicbehavior at very low water potentials (Fig. S3). However, anonlinear pressure–volume curve in which the slope of thewater-content–water-potential relationship (1/ε) decreasesas water potential becomes more negative has been foundin a hydraulic model of oaks (Mirfenderesgi et al., 2016).A water-content–water-potential relationship with that con-vex shape could lead to the same convex shape in the VOD–water-potential relationship we observed at Harvard Forest(Fig. 7c).
The relationship between stem xylem water potential andthe dielectric constant loses sensitivity at high values, as alsoseen in Fig. 7. These high values mostly occur at nighttimebut could also occur under very wet conditions. This couldbe attributable to a loss of sensitivity of water content to wa-ter potential at near-zero stem water potential values and/or aloss of sensitivity of the dielectric constant to water contentat high water content values, as has previously been observedin some species (Razafindratsima et al., 2017). As shown bythe different colors of points in Fig. 7a, the y intercept of therelationship between stem dielectric and xylem water poten-tial changes over the growing season, indicating a drift in thedielectric constant that is not representative of water poten-tial changes. Previous studies have found that the stem xylemdielectric is sensitive to temperature and sap chemistry (inaddition to xylem water content) and may vary significantlybased on the sensor’s location within a tree (McDonald et al.,2002). Thus, we may not expect all observed changes in thestem dielectric to be reflected in xylem water potential. Adrift over time in the relationship between the stem dielec-tric and VOD is also observable in Fig. 7b. It is possible thatthis drift represents conditions specific to the individual treein which the dielectric sensor was installed, which may av-erage away when scaling up to the scale of the radiometerfootprint. Such a drift is not present in the stem-potential–VOD relationship, despite stem potential being measured onthe same single tree as the xylem dielectric. A possible expla-nation for this difference is that the hydraulic behavior mayhave been relatively uniform among trees in the stand, whilethe other conditions that influence the stem dielectric (e.g.,sap chemistry) varied more from tree to tree.
4.2 Interpreting the VOD–water-potential relationshipin physiological terms
From the relationship we observed between VOD and leafwater potential, as well as ancillary data on biomass and treedry matter content, we estimated b, the slope between VODand total vegetation water content (VWC), to lie in the rangeof 0.05 to 0.13. We can compare this estimate to values as-sembled from several studies of agricultural fields using ra-diometry in H polarization using destructive measurementsof vegetation water content (Van de Griend and Wigneron,
2004). For L-band measurements, the b values in Van deGriend and Wigneron (2004) ranged from 0.05 to 0.182,containing the range we calculate in this paper. However,it should be noted that relatively little is known about theb factor in forests, where destructive comparisons of VODand VWC have not been performed. Furthermore, the com-parison is made more uncertain because of the difference inpolarization between prior measurements at H polarizationand our observations at V polarization. Nevertheless, the factthat our estimate of b falls within the range of prior observa-tions, despite deriving from a different land cover type anddifferent methodology, lends confidence to our analysis.
We estimated a value of 4.1 MPa for ε, the vegetationbulk modulus of elasticity that relates RWCH and ψ (or4.4 MPa based on stem xylem instead of leaf water po-tential data). We can also calculate this parameter directlyfrom the pressure–volume curves we measured on individ-ual leaves and twigs collected from Harvard Forest (Fig. S3).The pressure–volume analysis gives elastic moduli of 16 and18 MPa for branches and leaves, respectively – much largerthan the value calculated based on VOD. Several previousstudies that analyzed pressure–volume curves for oaks alsofound relatively larger elastic moduli compared to our VOD-based value. Bahari et al. (1985) found elastic moduli rangingfrom 6.6 to 8.8 MPa in red oak leaves from a temperate forestin Missouri. Corcuera et al. (2002) found a range of approxi-mately 10 to 20 MPa for elastic moduli in leaf-bearing shootsfrom 11 species of temperate-climate oaks.
An elastic modulus calculated from VOD represents, in asense, the slope of an effective pressure–volume curve acrossthe entire stand, aggregating the roles of leaves, branches,and trunks in proportion to their contribution to VOD. To ourknowledge, no study has simultaneously measured the elas-tic moduli of these three vegetation components in oaks. Inthe palm tree Sabal palmetto, Holbrook and Sinclair (1992)measured a modulus of elasticity that was 346 times smallerfor stem parenchyma than for leaves. If their observation of asmaller modulus of elasticity for trunks than for leaves holdsqualitatively for oaks, then the fact that our VOD-derivedelastic modulus is lower than leaf-derived values is to be ex-pected, as the VOD-derived estimate includes a contributionfrom trunks that would make the aggregate value lower thanthe leaf value. Model-based studies may provide further de-tails on how effective pressure–volume curves scale from tis-sue to tree to stand. For a stand in Michigan containing a mix-ture of species, 96 % of which were oaks, Mirfenderesgi et al.(2016) used a plant hydraulic model calibrated with sap flowmeasurements to infer an aggregate stem pressure–volumecurve with an elastic modulus of approximately 5.0 MPa,which is closer to our VOD-based value than the values basedon leaf or shoot pressure–volume curves are.
Biogeosciences, 18, 739–753, 2021 https://doi.org/10.5194/bg-18-739-2021
N. M. Holtzman et al.: Vegetation optical depth as indicator of plant water potential 749
4.3 Contributions of vegetation components to VOD:upper canopy vs. tree trunks
Although our leaf observations only cover a few days in time,they coincide with a range of the 11th through the 89th per-centile of VOD values relative to the entire April–Octoberdataset. This wide range suggests that our results are ad-equate to characterize the VOD–leaf-potential relationshipthroughout the growing season at our site. However, it shouldbe noted that LAI was relatively constant during this period,so that this study is unable to determine the relative rolesof LAI and water potential in VOD variations during peri-ods when LAI varies. The contributions of LAI (and biomassmore generally) to variations of VOD can be substantial (Mo-men et al., 2017; Zhang et al., 2019).
Our results also do not provide much insight into whetherL-band VOD is more sensitive to leafy or woody biomassover timescales longer than a day, because we were not ableto measure leaf water potential or the leaf dielectric at mul-tiple points in the growing season as we did for the stems.However, leaf and stem water potentials are highly corre-lated, and indeed mechanistically linked, on an inter-daytimescale (Lambers et al., 2008). Thus, the positive relation-ship between VOD and stem xylem water potential across thegrowing season (Fig. 7) should hold qualitatively for leavestoo. That is, VOD and leaf water potential are expected to becorrelated across the entire growing season.
Diurnal variations provide further information about therelative sensitivity of VOD to different canopy components.Between 05:00 and 08:00, stem xylem potential stays highwhile VOD and leaf potential begin to decrease, as shown inFigs. 3 and 4. As shown from the individual scatter pointsin Fig. 5b, VOD is much less closely related to stem waterpotential during the morning than it is at midday. In addi-tion, the lowest point of the day for stem potential is around15:00, while for both leaf potential and VOD it is between12:00 and 13:00. This suggests that VOD may be more influ-enced by the water status of leaves (and upper branches) thanthat of trunks. This is consistent with the notion that graybody emission is attenuated by vegetation, such that over-all observations are less sensitive to vegetation layers closerto the ground. It is also consistent with airborne observa-tions showing L-band brightness temperatures differed sig-nificantly between poplar trees with foliage and the same de-foliated trees later in the season (Santi et al., 2009) and withmodel analyses suggesting that at the L band the majority ofa canopy’s contribution to observed brightness temperaturesis due to branches (Ferrazzoli and Guerriero, 1996; Palosciaet al., 2000). While we did not measure branch water poten-tial, we expect branches in the canopy to have a potentialcloser to that of canopy leaves than that of trunks at breastheight.
Nevertheless, the relatively larger sensitivity of VOD toleaf water potential than to stem water potential is notablebecause most of a tree’s mass is in its trunk. Based on data in
the literature for leaf mass, branch mass, and trunk mass ofoak trees, we estimated that approximately only 21 % of anoak tree’s water is expected to be in its branches and leaveswith 79 % in its trunk (see Supplement for calculation), illus-trating the dominant effect of attenuation on the sources ofthe VOD signal even at the L band.
4.4 Implications for remote sensing of VOD
Our study highlights the importance of considering differ-ences in canopy and soil temperature (Fig. 2) when retriev-ing VOD during the afternoon in densely vegetated areas.To investigate the information lost when neglecting tempera-ture gradients (as is commonly done), we conducted an al-ternative retrieval of VOD assuming the canopy tempera-ture equals the soil temperature throughout the day. VODretrieved with this method did not show significant diurnalvariation. Thus, if diurnal or afternoon data are of interest,ecohydrological studies of VOD may benefit from VOD re-trievals that account for soil and canopy temperature differ-ences.
The presence of dew in the canopy did not alter VOD fromwhat would be expected given the stem xylem water status(Fig. 8). This is consistent with Escorihuela et al. (2009),who did not find dew to have an effect on observed brightnesstemperatures at the L band over a grassland, and Rowlandsonet al. (2012), who did not see a consistent effect of dew onL-band observations over a corn field (although an intermit-tent effect could not be ruled out). However, rainfall inter-ception in grasslands can moderately increase L-band VOD(Saleh et al., 2006). Overall, the effect of leaf surface wetnesson L-band VOD may depend strongly on the canopy typeand droplet amount. Forests may be less sensitive to leaf sur-face water because the leaf surface water represents a smallamount of the total water volume, or because the differentshapes of the leaves collect water differently, leading to moreor less water running off the leaves or differences in typicaldroplet sizes. It should be noted, however, that leaf surfacewater has been found to significantly influence observed X-band brightness temperatures at a tropical forest in Panama(Schneebeli et al., 2011). More research is needed to betterunderstand how VOD sensitivity varies between water inter-nal and external to the canopy. Nevertheless, our findings areencouraging for the use of early morning VOD, as well as forapproaches that compare VOD across different times of daybased on the notion that predawn leaf water potential is inequilibrium with root zone soil water potential (Konings andGentine, 2017). Additionally, many studies using VOD forstudying plant water stress response filter out VOD shortlyafter rainfall to avoid noise from rainfall interception (Kon-ings et al., 2017; Konings and Gentine, 2017), which in turnmay bias studies towards periods in dry seasons where fewerdata are filtered out. If the lack of sensitivity to rainfall in-terception we observed can be confirmed, this would reduceunnecessary data filtering.
https://doi.org/10.5194/bg-18-739-2021 Biogeosciences, 18, 739–753, 2021

750 N. M. Holtzman et al.: Vegetation optical depth as indicator of plant water potential
More generally, the observed relationships between VODand plant hydraulic quantities in this study reflect only asingle stand and do not account for significant changes inbiomass. To fully mature the use of passive microwave ra-diometry for studies of plant water use, we recommend ad-ditional validation field studies measuring leaf or stem wa-ter potential, as well as further study of differences in waterpotential – water content relationships between species andecosystems, as well as the electromagnetic effect of standtype and vegetation geometry on the sensitivity of VOD atdifferent frequencies to water potential in different tree com-ponents. Improved understanding of these issues will enablenew applications of passive microwave remote sensing.
Data availability. The authors have submitted relevant data tothe National Snow and Ice Data Center (NSIDC). The dataare publicly available at https://nsidc.org/data/SV19MA_VOD/versions/1 (last access: 25 January 2021). The data DOI ishttps://doi.org/10.5067/2PZJDURUJLWF (Holtzman et al., 2020).
Supplement. The supplement related to this article is available on-line at: https://doi.org/10.5194/bg-18-739-2021-supplement.
Author contributions. AGK, NMH, LDLA, AR, and AC designedthe experiment. NMH, LDLA, SK, AM, OS, CP, MHC, AL, TL,DT, NS, AR, and AGK installed sensors and collected data. NMH,LDLA, and AGK interpreted the data, with contributions from allauthors. NMH and AGK wrote the first draft of the manuscript andall authors assisted in editing the manuscript.
Competing interests. The authors declare that they have no conflictof interest.
Special issue statement. This article is part of the special is-sue “Microwave remote sensing for improved understanding ofvegetation–water interactions (BG/HESS inter-journal SI)”. It is notassociated with a conference.
Acknowledgements. We are grateful to Mark VanScoy and Au-drey Plotkin-Barker for logistical support at Harvard Forest.
Financial support. This research has been supported by the Na-tional Aeronautics and Space Administration (Future Investiga-tors in NASA Earth and Space Science and Technology, award19-EARTH20-0078; New Investigator Program, Terrestrial Ecol-ogy, award 80NSSC18K0715; and the Carbon Cycle ScienceProgram) and the National Oceanic and Atmospheric Adminis-tration (Modeling, Analysis, Predictions and Projections, awardNA17OAR4310127). Support also came from the Canadian SpaceAgency, the Natural Sciences and Engineering Research Council of
Canada, and the Canadian Foundation for Innovation. Further sup-port came from the Woods Institute for the Environment at StanfordUniversity and a McGee/Levorsen research grant from the StanfordUniversity School of Earth, Energy, and Environmental Sciences.Andreas Colliander made his contribution to this work at the JetPropulsion Laboratory, California Institute of Technology, under acontract with NASA.
Review statement. This paper was edited by Tim van Emmerik andreviewed by two anonymous referees.
References
Adams, H. D., Zeppel, M. J. B., Anderegg, W. R. L., Hartmann, H.,Landhäusser, S. M., Tissue, D. T., Huxman, T. E., Hudson, P. J.,Franz, T. E., Allen, C. D., Anderegg, L. D. L., Barron-Gafford, G.A., Beerling, D. J., Breshears, D. D., Brodribb, T. J., Bugmann,H., Cobb, R. C., Collins, A. D., Dickman, L. T., Duan, H., Ewers,B. E., Galiano, L., Galvez, D. A., Garcia-Forner, N., Gaylord,M. L., Germino, M. J., Gessler, A., Hacke, U. G., Hakamada,R., Hector, A., Jenkins, M. W., Kane, J. M., Kolb, T. E., Law,D. J., Lewis, J. D., Limousin, J.-M., Love, D. M., Macalady, A.K., Martínez-Vilalta, J., Mencuccini, M., Mitchell, P. J., Muss,J. D., O’Brien, M. J., O’Grady, A. P., Pangle, R. E., Pinkard, E.A., Piper, F. I., Plaut, J. A., Pockman, W. T., Quirk, J., Reinhardt,K., Ripullone, F., Ryan, M. G., Sala, A., Sevanto, S., Sperry, J.S., Vargas, R., Vennetier, M., Way, D. A., Xu, C., Yepez, E. A.,and McDowell, N. G.: A multi-species synthesis of physiologicalmechanisms in drought-induced tree mortality, Nature Ecology& Evolution, 1, 1285–1291, https://doi.org/10.1038/s41559-017-0248-x, 2017.
Anderegg, W. R. L., Wolf, A., Arango-Velez, A., Choat, B.,Chmura, D. J., Jansen, S., Kolb, T., Li, S., Meinzer, F.,Pita, P., Resco de Dios, V., Sperry, J. S., Wolfe, B. T.,and Pacala, S.: Plant water potential improves predictionof empirical stomatal models, PLOS ONE, 12, e0185481,https://doi.org/10.1371/journal.pone.0185481, 2017.
Bahari, Z. A., Pallardy, S. G., and Parker, W. C.: Photosynthesis,Water Relations, and Drought Adaptation in Six Woody Speciesof Oak-Hickory Forests in Central Missouri, Forest Sci., 31, 557–569, 1985.
Barnard, D. M., Meinzer, F. C., Lachenbruch, B., Mcculloh, K.A., Johnson, D. M., and Woodruff, D. R.: Climate-relatedtrends in sapwood biophysical properties in two conifers:avoidance of hydraulic dysfunction through coordinated ad-justments in xylem efficiency, safety and capacitance: Sap-wood biophysical properties, Plant Cell Environ., 34, 643–654,https://doi.org/10.1111/j.1365-3040.2010.02269.x, 2011.
Bartlett, M. K., Scoffoni, C., and Sack, L.: The determinants of leafturgor loss point and prediction of drought tolerance of speciesand biomes: a global meta-analysis: Drivers of plant drought tol-erance, Ecol. Lett., 15, 393–405, https://doi.org/10.1111/j.1461-0248.2012.01751.x, 2012.
Chaparro, D., Duveiller, G., Piles, M., Cescatti, A., Vall-llossera,M., Camps, A., and Entekhabi, D.: Sensitivity of L-band vegeta-tion optical depth to carbon stocks in tropical forests: a compar-ison to higher frequencies and optical indices, Remote Sens. En-
Biogeosciences, 18, 739–753, 2021 https://doi.org/10.5194/bg-18-739-2021
N. M. Holtzman et al.: Vegetation optical depth as indicator of plant water potential 751
viron., 232, 111303, https://doi.org/10.1016/j.rse.2019.111303,2019.
Christoffersen, B. O., Gloor, M., Fauset, S., Fyllas, N. M., Gal-braith, D. R., Baker, T. R., Kruijt, B., Rowland, L., Fisher, R.A., Binks, O. J., Sevanto, S., Xu, C., Jansen, S., Choat, B., Men-cuccini, M., McDowell, N. G., and Meir, P.: Linking hydraulictraits to tropical forest function in a size-structured and trait-driven model (TFS v.1-Hydro), Geosci. Model Dev., 9, 4227–4255, https://doi.org/10.5194/gmd-9-4227-2016, 2016.
Colliander, A., Cosh, M. H., Kelly, V. R., Kraatz, S., Bourgeau-Chavez, L., Siqueira, P., Roy, A., Konings, A. G., Holtz-man, N., Misra, S., Entekhabi, D., O’Neill, P., and Yueh,S. H.: SMAP Detects Soil Moisture Under Temperate For-est Canopies, Geophys. Res. Lett., 47, e2020GL089697,https://doi.org/10.1029/2020GL089697, 2020.
Corcuera, L., Camarero, J. J., and Gil-Pelegrín, E.: Func-tional groups in Quercus species derived from the anal-ysis of pressure–volume curves, Trees, 16, 465–472,https://doi.org/10.1007/s00468-002-0187-1, 2002.
Du, J., Kimball, J. S., Jones, L. A., Kim, Y., Glassy, J., andWatts, J. D.: A global satellite environmental data record de-rived from AMSR-E and AMSR2 microwave Earth observations,Earth Syst. Sci. Data, 9, 791–808, https://doi.org/10.5194/essd-9-791-2017, 2017.
Eller, C. B., Rowland, L., Mencuccini, M., Rosas, T., Williams,K., Harper, A., Medlyn, B. E., Wagner, Y., Klein, T., Teodoro,G. S., Oliveira, R. S., Matos, I. S., Rosado, B. H. P.,Fuchs, K., Wohlfahrt, G., Montagnani, L., Meir, P., Sitch, S.,and Cox, P. M.: Stomatal optimization based on xylem hy-draulics (SOX) improves land surface model simulation of veg-etation responses to climate, New Phytol., 226, 1622–1637,https://doi.org/10.1111/nph.16419, 2020.
El-rayes, M. and Ulaby, F.: Microwave Dielectric Spec-trum of Vegetation-Part I: Experimental Observa-tions, IEEE T. Geosci. Remote, GE-25, 541–549,https://doi.org/10.1109/TGRS.1987.289832, 1987.
Escorihuela, M. J., Kerr, Y. H., de Rosnay, P., Saleh, K., Wigneron,J.-P., and Calvet, J. C.: Effects of Dew on the Radiometric Signalof a Grass Field at L-Band, IEEE Geosci. Remote S., 6, 67–71,https://doi.org/10.1109/LGRS.2008.2000714, 2009.
Fernandez-Moran, R., Al-Yaari, A., Mialon, A., Mahmoodi, A.,Al Bitar, A., De Lannoy, G., Rodriguez-Fernandez, N., Lopez-Baeza, E., Kerr, Y., and Wigneron, J.-P.: SMOS-IC: An Alterna-tive SMOS Soil Moisture and Vegetation Optical Depth Product,Remote Sens.-Basel, 9, 457, https://doi.org/10.3390/rs9050457,2017.
Ferrazzoli, P. and Guerriero, L.: Passive microwave remote sensingof forests: a model investigation, IEEE T. Geosci. Remote, 34,433–443, https://doi.org/10.1109/36.485121, 1996.
Holbrook, N. M. and Sinclair, T. R.: Water balance in thearborescent palm, Sabal palmetto. I. Stem structure, tis-sue water release properties and leaf epidermal conductance,Plant Cell Environ., 15, 393–399, https://doi.org/10.1111/j.1365-3040.1992.tb00989.x, 1992.
Holtzman, N., Konings, A. G., Roy, A., Cosh, M., and Col-liander, A.: SMAPVEX19-21 Massachusetts Vegetation Opti-cal Depth, Version 1. Boulder, Colorado USA, NASA NationalSnow and Ice Data Center Distributed Active Archive Center,https://doi.org/10.5067/2PZJDURUJLWF, 2020.
Jackson, T. J. and Schmugge, T. J.: Vegetation effects on the mi-crowave emission of soils, Remote Sens. Environ., 36, 203–212,https://doi.org/10.1016/0034-4257(91)90057-D, 1991.
Kennedy, D., Swenson, S., Oleson, K. W., Lawrence, D.M., Fisher, R., Lola da Costa, A. C., and Gentine, P.:Implementing Plant Hydraulics in the Community LandModel, Version 5, J. Adv. Model. Earth Sy., 11, 485–513,https://doi.org/10.1029/2018MS001500, 2019.
Klepper, B.: Diurnal Pattern of Water Potential inWoody Plants, Plant Physiol., 43, 1931–1934,https://doi.org/10.1104/pp.43.12.1931, 1968.
Konings, A. G. and Gentine, P.: Global variations in ecosystem-scale isohydricity, Glob. Change Biol., 23, 891–905,https://doi.org/10.1111/gcb.13389, 2017.
Konings, A. G., Piles, M., Das, N., and Entekhabi, D.: L-bandvegetation optical depth and effective scattering albedo esti-mation from SMAP, Remote Sens. Environ., 198, 460–470,https://doi.org/10.1016/j.rse.2017.06.037, 2017.
Konings, A. G., Rao, K., and Steele-Dunne, S. C.: Macro toMicro: Microwave Remote Sensing of Plant Water Contentfor Physiology and Ecology, New Phytol., 223, 1166–1172,https://doi.org/10.1111/nph.15808, 2019.
Kurum, M., Lang, R. H., O’Neill, P. E., Joseph, A. T.,Jackson, T. J., and Cosh, M. H.: A First-Order Radia-tive Transfer Model for Microwave Radiometry of ForestCanopies at L-Band, IEEE T. Geosci. Remote, 49, 3167–3179,https://doi.org/10.1109/TGRS.2010.2091139, 2011.
Lambers, H., Chapin, F. S., and Pons, T. L.: Plant physiologicalecology, 2nd Edn., Springer, New York, 2008.
Lei, F., Crow, W., Shen, H., Parinussa, R., and Holmes, T.:The Impact of Local Acquisition Time on the Accuracy ofMicrowave Surface Soil Moisture Retrievals over the Con-tiguous United States, Remote Sens.-Basel, 7, 13448–13465,https://doi.org/10.3390/rs71013448, 2015.
Liu, Y., Kumar, M., Katul, G. G., Feng, X., and Konings, A. G.:Plant hydraulics accentuates the effect of atmospheric mois-ture stress on transpiration, Nat. Clim. Change, 10, 691–695,https://doi.org/10.1038/s41558-020-0781-5, 2020.
Liu, Y. Y., van Dijk, A. I. J. M., de Jeu, R. A. M., Canadell, J. G.,McCabe, M. F., Evans, J. P., and Wang, G.: Recent reversal inloss of global terrestrial biomass, Nat. Clim. Change, 5, 470–474, https://doi.org/10.1038/nclimate2581, 2015.
Matheny, A. M., Bohrer, G., Garrity, S. R., Morin, T. H., Howard,C. J., and Vogel, C. S.: Observations of stem water storagein trees of opposing hydraulic strategies, Ecosphere, 6, art165,https://doi.org/10.1890/ES15-00170.1, 2015.
Matheny, A. M., Fiorella, R. P., Bohrer, G., Poulsen, C. J.,Morin, T. H., Wunderlich, A., Vogel, C. S., and Curtis,P. S.: Contrasting strategies of hydraulic control in twocodominant temperate tree species, Ecohydrology, 10, e1815,https://doi.org/10.1002/eco.1815, 2017.
Mavrovic, A., Roy, A., Royer, A., Filali, B., Boone, F., Pappas,C., and Sonnentag, O.: Dielectric characterization of vegetationat L band using an open-ended coaxial probe, Geosci. Instrum.Method. Data Syst., 7, 195–208, https://doi.org/10.5194/gi-7-195-2018, 2018.
McDonald, K. C., Zimmermann, R., and Kimball, J. S.: Diurnal andspatial variation of xylem dielectric constant in Norway Spruce(Picea abies [L.] Karst.) as related to microclimate, xylem sap
https://doi.org/10.5194/bg-18-739-2021 Biogeosciences, 18, 739–753, 2021
752 N. M. Holtzman et al.: Vegetation optical depth as indicator of plant water potential
flow, and xylem chemistry, IEEE T. Geosci. Remote, 40, 2063–2082, https://doi.org/10.1109/TGRS.2002.803737, 2002.
McFarlane, K. J., Torn, M. S., Hanson, P. J., Porras, R.C., Swanston, C. W., Callaham, M. A., and Guilderson,T. P.: Comparison of soil organic matter dynamics at fivetemperate deciduous forests with physical fractionation andradiocarbon measurements, Biogeochemistry, 112, 457–476,https://doi.org/10.1007/s10533-012-9740-1, 2013.
Mialon, A., Rodríguez-Fernández, N. J., Santoro, M., Saatchi,S., Mermoz, S., Bousquet, E., and Kerr, Y. H.: Evalua-tion of the Sensitivity of SMOS L-VOD to Forest Above-Ground Biomass at Global Scale, Remote Sens.-Basel, 12, 1450,https://doi.org/10.3390/rs12091450, 2020.
Mirfenderesgi, G., Bohrer, G., Matheny, A. M., Fatichi, S.,de Moraes Frasson, R. P., and Schäfer, K. V. R.: Treelevel hydrodynamic approach for resolving aboveground wa-ter storage and stomatal conductance and modeling the ef-fects of tree hydraulic strategy: Stomatal Conductance Pa-rameterization, J. Geophys, Res.-Biogeo., 121, 1792–1813,https://doi.org/10.1002/2016JG003467, 2016.
Mironov, V. L., Dobson, M. C., Kaupp, V. H., Komarov, S. A.,and Kleshchenko, V. N.: Generalized refractive mixing dielectricmodel for moist soils, in: IEEE International Geoscience and Re-mote Sensing Symposium, vol. 6, IEEE, Toronto, Ont., Canada,3556–3558, 2002.
Mo, T., Choudhury, B. J., Schmugge, T. J., Wang, J. R.,and Jackson, T. J.: A model for microwave emissionfrom vegetation-covered fields, J. Geophys. Res., 87, 11229,https://doi.org/10.1029/JC087iC13p11229, 1982.
Moesinger, L., Dorigo, W., de Jeu, R., van der Schalie, R., Scan-lon, T., Teubner, I., and Forkel, M.: The global long-term mi-crowave Vegetation Optical Depth Climate Archive (VODCA),Earth Syst. Sci. Data, 12, 177–196, https://doi.org/10.5194/essd-12-177-2020, 2020.
Momen, M., Wood, J. D., Novick, K. A., Pangle, R., Pockman, W.T., McDowell, N. G., and Konings, A. G.: Interacting Effects ofLeaf Water Potential and Biomass on Vegetation Optical Depth:Effects of LWP and Biomass on VOD, J. Geophys. Res.-Biogeo.,122, 3031–3046, https://doi.org/10.1002/2017JG004145, 2017.
Munger, W. and Wofsy, S.: Biomass Inventories at Harvard ForestEMS Tower since 1993, EDI Data Portal, https://doi.org/10.6073/PASTA/C27CDE917CCC89CA0A131525FCD328B8,2020.
NEON (National Ecological Observatory Network): Data ProductDP1.00005, available at: https://www.neonscience.org, last ac-cess: 26 Februrary 2020.
Nolan, R. H., Blackman, C. J., de Dios, V. R., Choat, B., Medlyn,B. E., Li, X., Bradstock, R. A., and Boer, M. M.: Linking For-est Flammability and Plant Vulnerability to Drought, Forests, 11,779, https://doi.org/10.3390/f11070779, 2020.
Novick, K. A., Ficklin, D. L., Stoy, P. C., Williams, C. A., Bohrer,G., Oishi, A. C., Papuga, S. A., Blanken, P. D., Noormets,A., Sulman, B. N., Scott, R. L., Wang, L., and Phillips, R. P.:The increasing importance of atmospheric demand for ecosys-tem water and carbon fluxes, Nat. Clim. Change, 6, 1023–1027,https://doi.org/10.1038/nclimate3114, 2016.
O’Neill, P. E., Bindlish, R., Chan, S., Chaubell, J., Njoku, E. G.,and Jackson, T. J.: SMAP Algorithm Theoretical Basis Docu-
ment: Level 2 & 3 Soil Moisture (Passive) Data Products, JetPropulsion Laboratory, Pasadena, California, USA, 2019.
Owe, M., de Jeu, R., and Walker, J.: A methodology for surfacesoil moisture and vegetation optical depth retrieval using the mi-crowave polarization difference index, IEEE T. Geosci. Remote,39, 1643–1654, https://doi.org/10.1109/36.942542, 2001.
Palacio, S., Milla, R., Albuixech, J., Pérez-Rontomé, C., Camarero,J. J., Maestro, M., and Montserrat-Martí, G.: Seasonal variabil-ity of dry matter content and its relationship with shoot growthand nonstructural carbohydrates, New Phytol., 180, 133–142,https://doi.org/10.1111/j.1469-8137.2008.02569.x, 2008.
Paloscia, S., Macelloni, G., Pampaloni, P., Ruisi, R., and Susini, C.:Airborne multi-frequency L- to Ka-band radiometric measure-ments over forests, in: IGARSS 2000, IEEE 2000 InternationalGeoscience and Remote Sensing Symposium, Taking the Pulseof the Planet: The Role of Remote Sensing in Managing the Envi-ronment, Proceedings (Cat. No.00CH37120), vol. 4, IEEE, Hon-olulu, HI, USA, 1402–1404, 2000.
Parinussa, R., de Jeu, R., van der Schalie, R., Crow, W.,Lei, F., and Holmes, T.: A Quasi-Global Approach to Im-prove Day-Time Satellite Surface Soil Moisture Anomaliesthrough the Land Surface Temperature Input, Climate, 4, 50,https://doi.org/10.3390/cli4040050, 2016.
Rao, K., Williams, A. P., Flefil, J. F., and Konings,A. G.: SAR-enhanced mapping of live fuel mois-ture content, Remote Sens. Environ., 245, 111797,https://doi.org/10.1016/j.rse.2020.111797, 2020.
Razafindratsima, S., Sbartaï, Z. M., and Demontoux, F.: Per-mittivity measurement of wood material over a wide rangeof moisture content, Wood Sci. Technol., 51, 1421–1431,https://doi.org/10.1007/s00226-017-0935-4, 2017.
Rowlandson, T. L., Hornbuckle, B. K., Bramer, L. M.,Patton, J. C., and Logsdon, S. D.: Comparisons ofEvening and Morning SMOS Passes Over the MidwestUnited States, IEEE T. Geosci. Remote, 50, 1544–1555,https://doi.org/10.1109/TGRS.2011.2178158, 2012.
Rowlandson, T. L., Berg, A. A., Roy, A., Kim, E., Pardo Lara, R.,Powers, J., Lewis, K., Houser, P., McDonald, K., Toose, P., Wu,A., De Marco, E., Derksen, C., Entin, J., Colliander, A., Xu,X., and Mavrovic, A.: Capturing agricultural soil freeze/thawstate through remote sensing and ground observations: A soilfreeze/thaw validation campaign, Remote Sens. Environ., 211,59–70, https://doi.org/10.1016/j.rse.2018.04.003, 2018.
Roy, A., Toose, P., Mavrovic, A., Pappas, C., Royer, A., Derk-sen, C., Berg, A., Rowlandson, T., El-Amine, M., Barr, A.,Black, A., Langlois, A., and Sonnentag, O.: L-Band responseto freeze/thaw in a boreal forest stand from ground- and tower-based radiometer observations, Remote Sens. Environ., 237,111542, https://doi.org/10.1016/j.rse.2019.111542, 2020.
Sabot, M. E. B., De Kauwe, M. G., Pitman, A. J., Medlyn,B. E., Verhoef, A., Ukkola, A. M., and Abramowitz, G.:Plant profit maximization improves predictions of Europeanforest responses to drought, New Phytol., 226, 1638–1655,https://doi.org/10.1111/nph.16376, 2020.
Saleh, K., Wigneron, J.-P., de Rosnay, P., Calvet, J.-C., Escori-huela, M. J., Kerr, Y., and Waldteufel, P.: Impact of raininterception by vegetation and mulch on the L-band emis-sion of natural grass, Remote Sens. Environ., 101, 127–139,https://doi.org/10.1016/j.rse.2005.12.004, 2006.
Biogeosciences, 18, 739–753, 2021 https://doi.org/10.5194/bg-18-739-2021
N. M. Holtzman et al.: Vegetation optical depth as indicator of plant water potential 753
Santi, E., Paloscia, S., Pampaloni, P., and Pettinato, S.:Ground-Based Microwave Investigations of Forest Plotsin Italy, IEEE T. Geosci. Remote, 47, 3016–3025,https://doi.org/10.1109/TGRS.2009.2021613, 2009.
Schneebeli, M., Wolf, S., Kunert, N., Eugster, W., and Mätzler, C.:Relating the X-band opacity of a tropical tree canopy to sapflow,rain interception and dew formation, Remote Sens. Envi-ron., 115, 2116–2125, https://doi.org/10.1016/j.rse.2011.04.016,2011.
Skelton, R. P., West, A. G., and Dawson, T. E.: Predictingplant vulnerability to drought in biodiverse regions usingfunctional traits, P. Natl. Acad. Sci. USA, 112, 5744–5749,https://doi.org/10.1073/pnas.1503376112, 2015.
Ulaby, F. T. and Long, D. G.: Microwave radar and radiometric re-mote sensing, The University of Michigan Press, Ann Arbor.,2014.
Van de Griend, A. A. and Wigneron, J.-P.: The b-factoras a function of frequency and canopy type at H-polarization, IEEE T. Geosci. Remote, 42, 786–794,https://doi.org/10.1109/TGRS.2003.821889, 2004.
Venturas, M. D., Sperry, J. S., and Hacke, U. G.: Plant xylem hy-draulics: What we understand, current research, and future chal-lenges: Plant xylem hydraulics, J. Integr. Plant Biol., 59, 356–389, https://doi.org/10.1111/jipb.12534, 2017.
Waring, R. H., Law, B. E., Goulden, M. L., Bassow, S. L.,McCreight, R. W., Wofsy, S. C., and Bazzaz, F. A.: Scal-ing gross ecosystem production at Harvard Forest with re-mote sensing: a comparison of estimates from a constrainedquantum-use efficiency model and eddy correlation, PlantCell Environ., 18, 1201–1213, https://doi.org/10.1111/j.1365-3040.1995.tb00629.x, 1995.
Williams, A. P., Allen, C. D., Macalady, A. K., Griffin, D., Wood-house, C. A., Meko, D. M., Swetnam, T. W., Rauscher, S.A., Seager, R., Grissino-Mayer, H. D., Dean, J. S., Cook,E. R., Gangodagamage, C., Cai, M., and McDowell, N. G.:Temperature as a potent driver of regional forest droughtstress and tree mortality, Nat. Clim. Change, 3, 292–297,https://doi.org/10.1038/nclimate1693, 2013.
Wolf, S., Keenan, T. F., Fisher, J. B., Baldocchi, D. D., Desai,A. R., Richardson, A. D., Scott, R. L., Law, B. E., Litvak,M. E., Brunsell, N. A., Peters, W., and van der Laan-Luijkx,I. T.: Warm spring reduced carbon cycle impact of the 2012US summer drought, P. Natl. Acad. Sci. USA, 113, 5880–5885,https://doi.org/10.1073/pnas.1519620113, 2016.
Xu, X., Medvigy, D., Powers, J. S., Becknell, J. M., andGuan, K.: Diversity in plant hydraulic traits explains sea-sonal and inter-annual variations of vegetation dynamics inseasonally dry tropical forests, New Phytol., 212, 80–95,https://doi.org/10.1111/nph.14009, 2016.
Zhang, Y., Zhou, S., Gentine, P., and Xiao, X.: Can vegetation opti-cal depth reflect changes in leaf water potential during soil mois-ture dry-down events?, Remote Sens. Environ., 234, 111451,https://doi.org/10.1016/j.rse.2019.111451, 2019.
Zweifel, R., Item, H., and Hasler, R.: Link between diurnal stemradius changes and tree water relations, Tree Physiol., 21, 869–877, https://doi.org/10.1093/treephys/21.12-13.869, 2001.
https://doi.org/10.5194/bg-18-739-2021 Biogeosciences, 18, 739–753, 2021
![Countersink Depth Gage Calibration Instructions - Trulok · Depth Gage Calibration Instructions Indicator model: 543-342BTL . Turn the indicator on by pressing the [ON/OFF] button](https://img.pdfslide.net/doc/110x75/5ce1542c88c993700d8c1c78/countersink-depth-gage-calibration-instructions-depth-gage-calibration-instructions.jpg)