Embed Size (px)
Citation preview
www.geojit.com
Retail Equity Research
L G Balakrishnan& Bros Ltd Automobile Ancillaries
BSE CODE:500250 NSE CODE: LGBBROSLTD
BLOOMBERG CODE: LGBB IN SENSEX : 31,390
Buy
12M Investment Period Rating as per Small Cap
CMP Rs195 TARGET Rs239 RETURN 22%
(Closing: 16-03-20)
16th March, 2020
COMPANY UPDATE
Buy for long term… Strong fundamentals LG Balakrishnan & Bros (LGB) is India’s leading Manufactures in 2W-chain transmission (Drive chains) and sprockets with a domestic market share of 75% and around 50% in replacement market.
LGB to benefit from the new capacity addition and its strong client base. We expect the revenue from Transmission to grow by 11% and factor 8% revenue CAGR over FY20E-22E owing to subdued growth from metal forging business
Q3FY19 revenue de-grew by 7%YoY due to flat growth from the chain transmission segment and –33%YoY from the metal forming
Despite weak sales, EBITDA margin improved by 170bps owing to 280bps decline in the RM cost. However, Higher depreciation and interest cost led the PAT to de-grew by –11.YoY.
However considering the near term headwinds owing to lower 2W demand and higher fixed cost, we expect the PAT to grow by 12% CAGR over FY20E-22E respectively.
The stock is currently trading at 6x and 5x over FY21E and FY22E EPS, which is lower to its historical average. Given strong fundamentals and lower base we roll over our valuation to FY22 and value at 6x FY22 EPS and recommend buy rating at CMP.
Company Data
Market Cap (cr) Rs. 612
Enterprise Value (cr) Rs. 720
Outstanding Shares (cr) 3.1
Free Float 52%
Dividend Yield 2.6%
52 week high Rs. 414
52 week low 169
6m average volume (cr) 0.01 Beta 1.3 Face value Rs10
Shareholding (%) Q1FY19 Q2FY20 Q3FY20
Promoters 48.0 48.3 47.7
FII’s 0.5 0.5 0.5
MFs/Insti 16.7 17.5 17.5
Public 34.8 33.8 34.3
Total 100.0 100.0 100.0
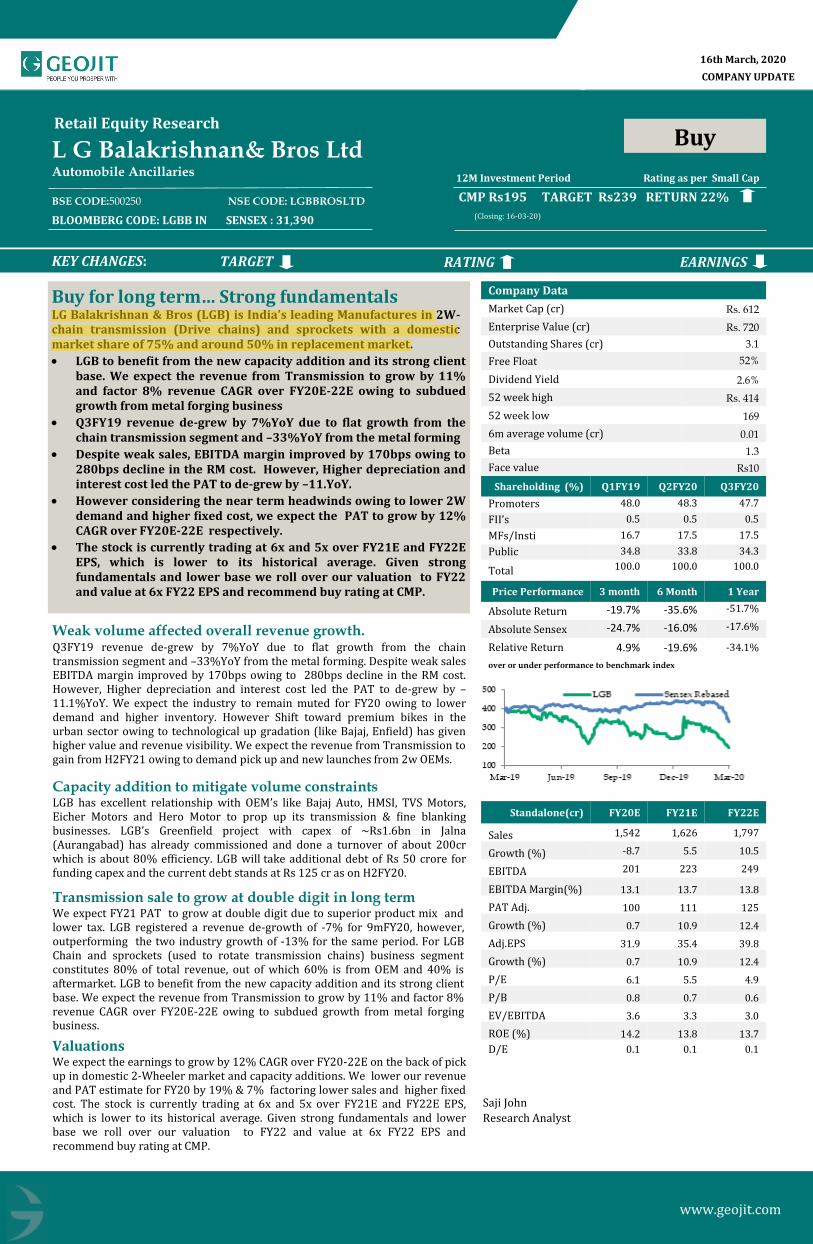
Price Performance 3 month 6 Month 1 Year
Absolute Return -19.7% -35.6% -51.7%
Absolute Sensex -24.7% -16.0% -17.6%
Relative Return 4.9% -19.6% -34.1%
over or under performance to benchmark index
Standalone(cr) FY20E FY21E FY22E
Sales 1,542 1,626 1,797
Growth (%) -8.7 5.5 10.5
EBITDA 201 223 249
EBITDA Margin(%) 13.1 13.7 13.8
PAT Adj. 100 111 125
Growth (%) 0.7 10.9 12.4
Adj.EPS 31.9 35.4 39.8
Growth (%) 0.7 10.9 12.4
P/E 6.1 5.5 4.9
P/B 0.8 0.7 0.6
EV/EBITDA 3.6 3.3 3.0
ROE (%) 14.2 13.8 13.7 D/E 0.1 0.1 0.1
Saji John
Research Analyst
KEY CHANGES: TARGET RATING EARNINGS
Weak volume affected overall revenue growth. Q3FY19 revenue de-grew by 7%YoY due to flat growth from the chain transmission segment and –33%YoY from the metal forming. Despite weak sales EBITDA margin improved by 170bps owing to 280bps decline in the RM cost. However, Higher depreciation and interest cost led the PAT to de-grew by –11.1%YoY. We expect the industry to remain muted for FY20 owing to lower demand and higher inventory. However Shift toward premium bikes in the urban sector owing to technological up gradation (like Bajaj, Enfield) has given higher value and revenue visibility. We expect the revenue from Transmission to gain from H2FY21 owing to demand pick up and new launches from 2w OEMs.
Capacity addition to mitigate volume constraints LGB has excellent relationship with OEM’s like Bajaj Auto, HMSI, TVS Motors, Eicher Motors and Hero Motor to prop up its transmission & fine blanking businesses. LGB’s Greenfield project with capex of ~Rs1.6bn in Jalna (Aurangabad) has already commissioned and done a turnover of about 200cr which is about 80% efficiency. LGB will take additional debt of Rs 50 crore for funding capex and the current debt stands at Rs 125 cr as on H2FY20.
Transmission sale to grow at double digit in long term We expect FY21 PAT to grow at double digit due to superior product mix and lower tax. LGB registered a revenue de-growth of -7% for 9mFY20, however, outperforming the two industry growth of -13% for the same period. For LGB Chain and sprockets (used to rotate transmission chains) business segment constitutes 80% of total revenue, out of which 60% is from OEM and 40% is aftermarket. LGB to benefit from the new capacity addition and its strong client base. We expect the revenue from Transmission to grow by 11% and factor 8% revenue CAGR over FY20E-22E owing to subdued growth from metal forging business.
Valuations We expect the earnings to grow by 12% CAGR over FY20-22E on the back of pick up in domestic 2-Wheeler market and capacity additions. We lower our revenue and PAT estimate for FY20 by 19% & 7% factoring lower sales and higher fixed cost. The stock is currently trading at 6x and 5x over FY21E and FY22E EPS, which is lower to its historical average. Given strong fundamentals and lower base we roll over our valuation to FY22 and value at 6x FY22 EPS and recommend buy rating at CMP.
www.geojit.com
Quarterly Financials (Consolidated)
Profit & Loss
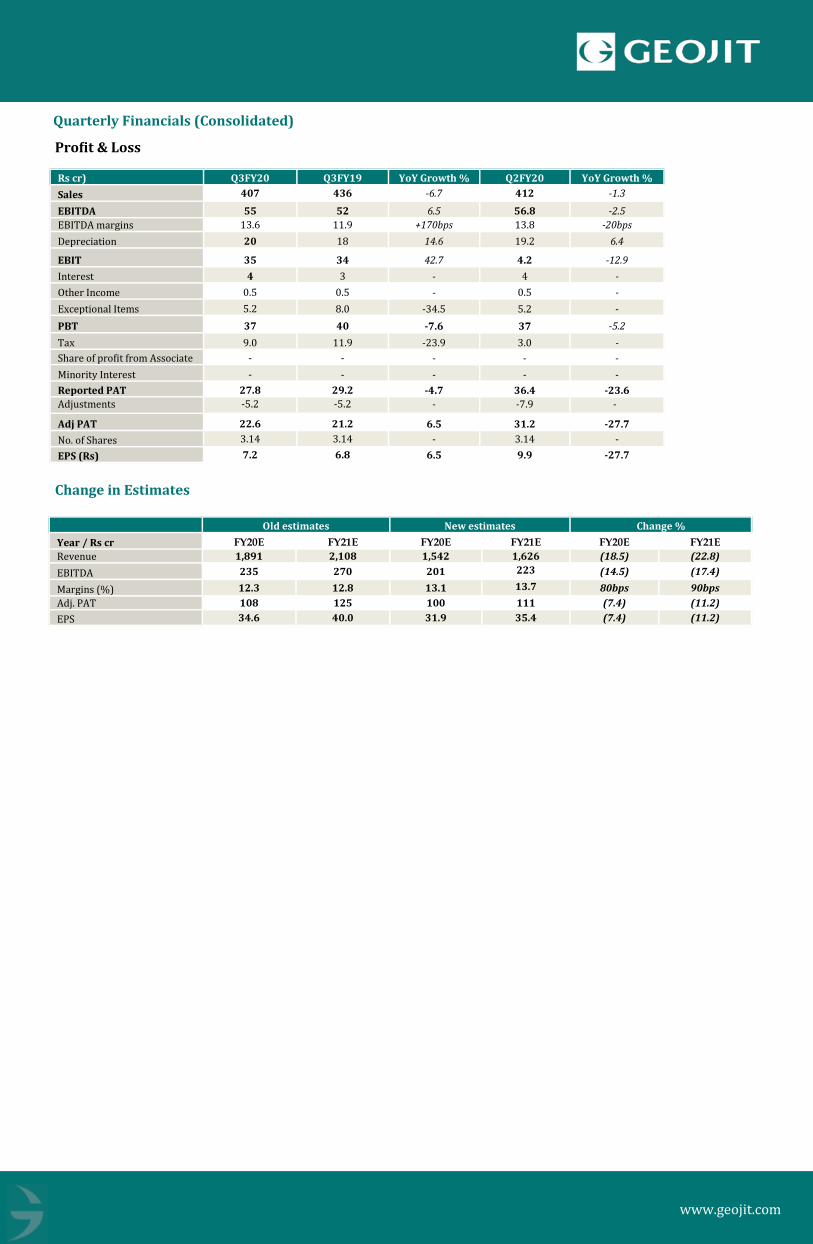
Change in Estimates
Old estimates New estimates Change %
Year / Rs cr FY20E FY21E FY20E FY21E FY20E FY21E
Revenue 1,891 2,108 1,542 1,626 (18.5) (22.8)
EBITDA 235 270 201 223 (14.5) (17.4)
Margins (%) 12.3 12.8 13.1 13.7 80bps 90bps
Adj. PAT 108 125 100 111 (7.4) (11.2)
EPS 34.6 40.0 31.9 35.4 (7.4) (11.2)
Rs cr) Q3FY20 Q3FY19 YoY Growth % Q2FY20 YoY Growth %
Sales 407 436 -6.7 412 -1.3
EBITDA 55 52 6.5 56.8 -2.5 EBITDA margins 13.6 11.9 +170bps 13.8 -20bps
Depreciation 20 18 14.6 19.2 6.4
EBIT 35 34 42.7 4.2 -12.9 Interest 4 3 - 4 - Other Income 0.5 0.5 - 0.5 -
Exceptional Items 5.2 8.0 -34.5 5.2 -
PBT 37 40 -7.6 37 -5.2
Tax 9.0 11.9 -23.9 3.0 - Share of profit from Associate - - - - -
Minority Interest - - - - -
Reported PAT 27.8 29.2 -4.7 36.4 -23.6
Adjustments -5.2 -5.2 - -7.9 -
Adj PAT 22.6 21.2 6.5 31.2 -27.7
No. of Shares 3.14 3.14 - 3.14 -
EPS (Rs) 7.2 6.8 6.5 9.9 -27.7
www.geojit.com
27th December 2018
Consolidated Financials
PROFIT & LOSS BALANCE SHEET
RATIOS CASH FLOW
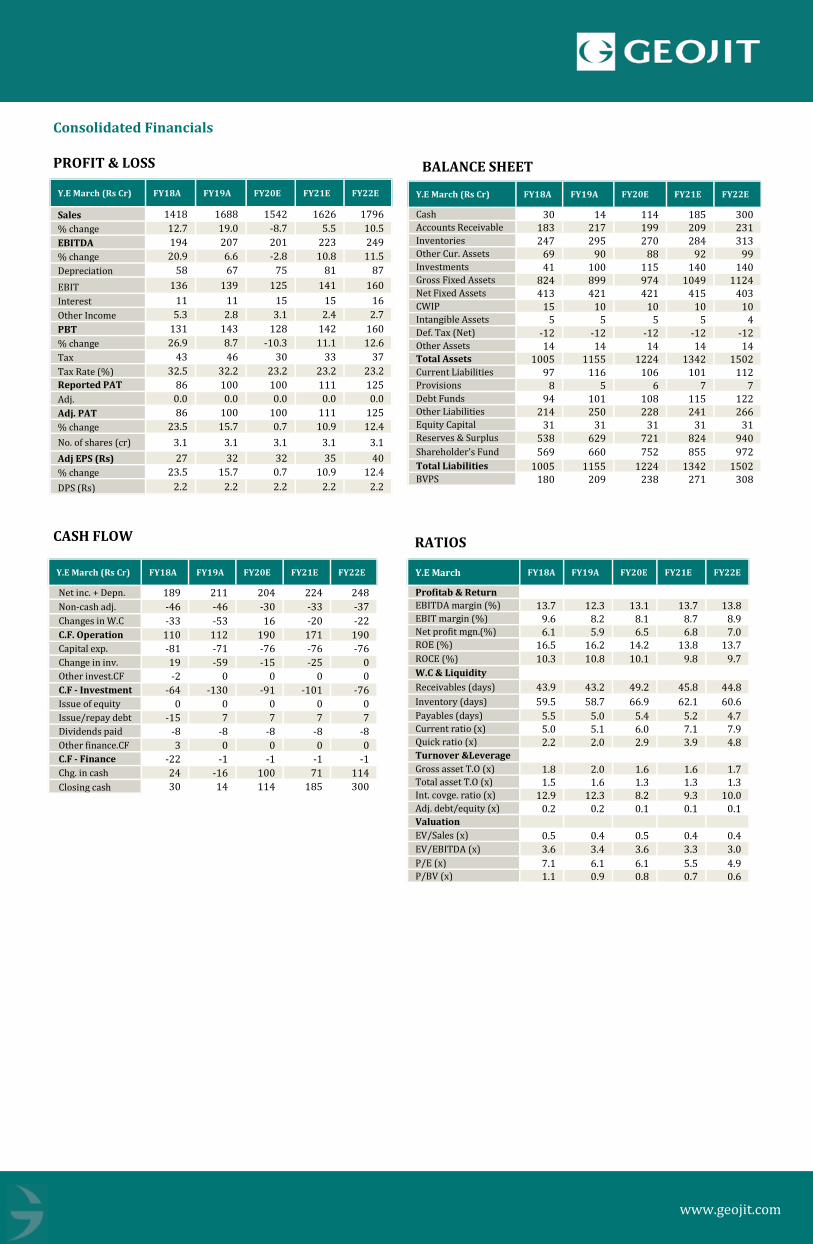
Y.E March (Rs Cr) FY18A FY19A FY20E FY21E FY22E
Sales 1418 1688 1542 1626 1796
% change 12.7 19.0 -8.7 5.5 10.5
EBITDA 194 207 201 223 249
% change 20.9 6.6 -2.8 10.8 11.5
Depreciation 58 67 75 81 87
EBIT 136 139 125 141 160
Interest 11 11 15 15 16
Other Income 5.3 2.8 3.1 2.4 2.7
PBT 131 143 128 142 160
% change 26.9 8.7 -10.3 11.1 12.6
Tax 43 46 30 33 37
Tax Rate (%) 32.5 32.2 23.2 23.2 23.2
Reported PAT 86 100 100 111 125
Adj. 0.0 0.0 0.0 0.0 0.0
Adj. PAT 86 100 100 111 125
% change 23.5 15.7 0.7 10.9 12.4
No. of shares (cr) 3.1 3.1 3.1 3.1 3.1
Adj EPS (Rs) 27 32 32 35 40
% change 23.5 15.7 0.7 10.9 12.4
DPS (Rs) 2.2 2.2 2.2 2.2 2.2
Y.E March (Rs Cr) FY18A FY19A FY20E FY21E FY22E
Net inc. + Depn. 189 211 204 224 248
Non-cash adj. -46 -46 -30 -33 -37
Changes in W.C -33 -53 16 -20 -22
C.F. Operation 110 112 190 171 190
Capital exp. -81 -71 -76 -76 -76
Change in inv. 19 -59 -15 -25 0
Other invest.CF -2 0 0 0 0
C.F - Investment -64 -130 -91 -101 -76
Issue of equity 0 0 0 0 0
Issue/repay debt -15 7 7 7 7
Dividends paid -8 -8 -8 -8 -8
Other finance.CF 3 0 0 0 0
C.F - Finance -22 -1 -1 -1 -1
Chg. in cash 24 -16 100 71 114
Closing cash 30 14 114 185 300
Y.E March FY18A FY19A FY20E FY21E FY22E
Profitab & Return
EBITDA margin (%) 13.7 12.3 13.1 13.7 13.8 EBIT margin (%) 9.6 8.2 8.1 8.7 8.9 Net profit mgn.(%) 6.1 5.9 6.5 6.8 7.0 ROE (%) 16.5 16.2 14.2 13.8 13.7
ROCE (%) 10.3 10.8 10.1 9.8 9.7
W.C & Liquidity
Receivables (days) 43.9 43.2 49.2 45.8 44.8
Inventory (days) 59.5 58.7 66.9 62.1 60.6
Payables (days) 5.5 5.0 5.4 5.2 4.7 Current ratio (x) 5.0 5.1 6.0 7.1 7.9 Quick ratio (x) 2.2 2.0 2.9 3.9 4.8 Turnover &Leverage Gross asset T.O (x) 1.8 2.0 1.6 1.6 1.7 Total asset T.O (x) 1.5 1.6 1.3 1.3 1.3 Int. covge. ratio (x) 12.9 12.3 8.2 9.3 10.0 Adj. debt/equity (x) 0.2 0.2 0.1 0.1 0.1 Valuation EV/Sales (x) 0.5 0.4 0.5 0.4 0.4 EV/EBITDA (x) 3.6 3.4 3.6 3.3 3.0
P/E (x) 7.1 6.1 6.1 5.5 4.9 P/BV (x) 1.1 0.9 0.8 0.7 0.6
Y.E March (Rs Cr) FY18A FY19A FY20E FY21E FY22E
Cash 30 14 114 185 300 Accounts Receivable 183 217 199 209 231 Inventories 247 295 270 284 313 Other Cur. Assets 69 90 88 92 99 Investments 41 100 115 140 140 Gross Fixed Assets 824 899 974 1049 1124 Net Fixed Assets 413 421 421 415 403 CWIP 15 10 10 10 10 Intangible Assets 5 5 5 5 4 Def. Tax (Net) -12 -12 -12 -12 -12 Other Assets 14 14 14 14 14 Total Assets 1005 1155 1224 1342 1502 Current Liabilities 97 116 106 101 112 Provisions 8 5 6 7 7 Debt Funds 94 101 108 115 122 Other Liabilities 214 250 228 241 266 Equity Capital 31 31 31 31 31 Reserves & Surplus 538 629 721 824 940
Shareholder’s Fund 569 660 752 855 972
Total Liabilities 1005 1155 1224 1342 1502 BVPS 180 209 238 271 308
www.geojit.com
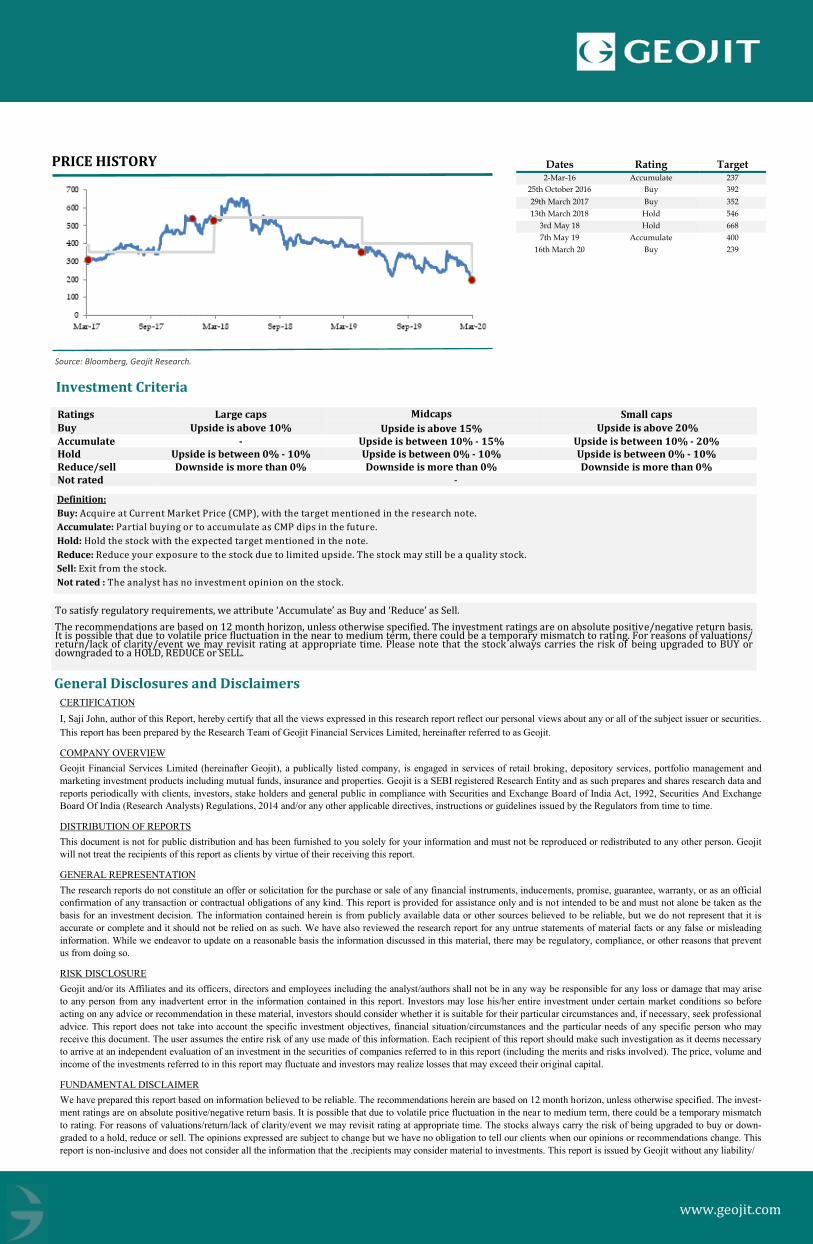
Source: Bloomberg, Geojit Research.
27th December 2018
Dates Rating Target 2-Mar-16 Accumulate 237
25th October 2016 Buy 392
29th March 2017 Buy 352
13th March 2018 Hold 546
3rd May 18 Hold 668
7th May 19 Accumulate 400 16th March 20 Buy 239
General Disclosures and Disclaimers
PRICE HISTORY
Investment Criteria
CERTIFICATION
I, Saji John, author of this Report, hereby certify that all the views expressed in this research report reflect our personal views about any or all of the subject issuer or securities.
This report has been prepared by the Research Team of Geojit Financial Services Limited, hereinafter referred to as Geojit.
COMPANY OVERVIEW
Geojit Financial Services Limited (hereinafter Geojit), a publically listed company, is engaged in services of retail broking, depository services, portfolio management and
marketing investment products including mutual funds, insurance and properties. Geojit is a SEBI registered Research Entity and as such prepares and shares research data and
reports periodically with clients, investors, stake holders and general public in compliance with Securities and Exchange Board of India Act, 1992, Securities And Exchange
Board Of India (Research Analysts) Regulations, 2014 and/or any other applicable directives, instructions or guidelines issued by the Regulators from time to time.
DISTRIBUTION OF REPORTS
This document is not for public distribution and has been furnished to you solely for your information and must not be reproduced or redistributed to any other person. Geojit
will not treat the recipients of this report as clients by virtue of their receiving this report.
GENERAL REPRESENTATION
The research reports do not constitute an offer or solicitation for the purchase or sale of any financial instruments, inducements, promise, guarantee, warranty, or as an official
confirmation of any transaction or contractual obligations of any kind. This report is provided for assistance only and is not intended to be and must not alone be taken as the
basis for an investment decision. The information contained herein is from publicly available data or other sources believed to be reliable, but we do not represent that it is
accurate or complete and it should not be relied on as such. We have also reviewed the research report for any untrue statements of material facts or any false or misleading
information. While we endeavor to update on a reasonable basis the information discussed in this material, there may be regulatory, compliance, or other reasons that prevent
us from doing so.
RISK DISCLOSURE
Geojit and/or its Affiliates and its officers, directors and employees including the analyst/authors shall not be in any way be responsible for any loss or damage that may arise
to any person from any inadvertent error in the information contained in this report. Investors may lose his/her entire investment under certain market conditions so before
acting on any advice or recommendation in these material, investors should consider whether it is suitable for their particular circumstances and, if necessary, seek professional
advice. This report does not take into account the specific investment objectives, financial situation/circumstances and the particular needs of any specific person who may
receive this document. The user assumes the entire risk of any use made of this information. Each recipient of this report should make such investigation as it deems necessary
to arrive at an independent evaluation of an investment in the securities of companies referred to in this report (including the merits and risks involved). The price, volume and
income of the investments referred to in this report may fluctuate and investors may realize losses that may exceed their original capital.
FUNDAMENTAL DISCLAIMER
We have prepared this report based on information believed to be reliable. The recommendations herein are based on 12 month horizon, unless otherwise specified. The invest-
ment ratings are on absolute positive/negative return basis. It is possible that due to volatile price fluctuation in the near to medium term, there could be a temporary mismatch
to rating. For reasons of valuations/return/lack of clarity/event we may revisit rating at appropriate time. The stocks always carry the risk of being upgraded to buy or down-
graded to a hold, reduce or sell. The opinions expressed are subject to change but we have no obligation to tell our clients when our opinions or recommendations change. This
report is non-inclusive and does not consider all the information that the .recipients may consider material to investments. This report is issued by Geojit without any liability/
Ratings Large caps Midcaps Small caps
Buy Upside is above 10% Upside is above 15% Upside is above 20%
Accumulate - Upside is between 10% - 15% Upside is between 10% - 20% Hold Upside is between 0% - 10% Upside is between 0% - 10% Upside is between 0% - 10% Reduce/sell Downside is more than 0% Downside is more than 0% Downside is more than 0% Not rated -
Definition:
Buy: Acquire at Current Market Price (CMP), with the target mentioned in the research note.
Accumulate: Partial buying or to accumulate as CMP dips in the future.
Hold: Hold the stock with the expected target mentioned in the note.
Reduce: Reduce your exposure to the stock due to limited upside. The stock may still be a quality stock.
Sell: Exit from the stock.
Not rated : The analyst has no investment opinion on the stock.
To satisfy regulatory requirements, we attribute ‘Accumulate’ as Buy and ‘Reduce’ as Sell.
The recommendations are based on 12 month horizon, unless otherwise specified. The investment ratings are on absolute positive/negative return basis. It is possible that due to volatile price fluctuation in the near to medium term, there could be a temporary mismatch to rating. For reasons of valuations/return/lack of clarity/event we may revisit rating at appropriate time. Please note that the stock always carries the risk of being upgraded to BUY or downgraded to a HOLD, REDUCE or SELL.
www.geojit.com
27th December 2018
undertaking/commitment on the part of itself or anyof its entities. We may have issued or may issue on the companies covered herein, reports, recommendations or information
which is contrary to those contained in this report. The projections and forecasts described in this report should be evaluated keeping in mind the fact that these are based on
estimates and assumptions and will vary from actual results over a period of time. The actual performance of the companies represented in the report may vary from those
projected. These are not scientifically proven to guarantee certain intended results and hence, are not published as a warranty and do not carry any evidentiary value whatsoever.
These are not to be relied on in or as contractual, legal or tax advice. Prospective investors and others are cautioned that any forward-looking statements are not predictions and
may be subject to change without notice.
JURISDICTION
The securities described herein may not be eligible for sale in all jurisdictions or to all categories of investors. The countries in which the companies mentioned in
this report are organized may have restrictions on investments, voting rights or dealings in securities by nationals of other countries. Distributing/taking/sending/
dispatching/transmitting this document in certain foreign jurisdictions may be restricted by law, and persons into whose possession this document comes should
inform themselves about, and observe any such restrictions. Failure to comply with this restriction may constitute a violation of any foreign jurisdiction laws. For-
eign currencies denominated securities are subject to fluctuations in exchange rates that could have an adverse effect on the value or price of or income derived from
the investment. Investors in securities such as ADRs, the value of which are influenced by foreign currencies effectively assume currency risk.
REGULATORY DISCLOSURES:
Geojit’s Associates consists of privately held companies such as Geojit Technologies Private Limited (GTPL- Software Solutions provider), Geojit Credits Private
Limited (GCPL- NBFC Services provider), Geojit Investment Services Limited (GISL- Corporate Agent for Insurance products), Geojit Financial Management
Services Private Limited (GFMSL) & Geojit Financial Distribution Private Limited (GFDPL), (Distributors of Insurance and MF Units).In the context of the SEBI
Regulations on Research Analysts (2014), Geojit affirms that we are a SEBI registered Research Entity and in the course of our business as a stock market intermedi-
ary, we issue research reports /research analysis etc that are prepared by our Research Analysts. We also affirm and undertake that no disciplinary action has been
taken against us or our Analysts in connection with our business activities.
In compliance with the above mentioned SEBI Regulations, the following additional disclosures are also provided which may be considered by the reader before
making an investment decision:
1. Disclosures regarding Ownership*:
Geojit confirms that:
It/its associates have no financial interest or any other material conflict in relation to the subject company (ies) covered herein.
It/its associates have no actual beneficial ownership greater than 1% in relation to the subject company (ies) covered herein.
Further, the Analyst confirms that:
he, his associates and his relatives have financial interest in the subject company (ies) covered herein, and they have no other material conflict in the subject compa-
ny.
he, his associates and his relatives have no actual/beneficial ownership greater than 1% in the subject company covered
2. Disclosures regarding Compensation:
During the past 12 months, Geojit or its Associates:
(a) Have not received any compensation from the subject company; (b) Have not managed or co-managed public offering of securities for the subject company (c)
Have not * received any compensation for investment banking or merchant banking or brokerage services from the subject company. (d) Have not received any
compensation for products or services other than investment banking or merchant banking or brokerage services from the subject company (e) Have not received any
compensation or other benefits from the subject company or third party in connection with the research report (f) The subject company is / was not a client during
twelve months preceding the date of distribution of the research report.
3. Disclosure by Geojit regarding the compensation paid to its Research Analyst:
Geojit hereby confirms that no part of the compensation paid to the persons employed by it as Research Analysts is based on any specific brokerage services or
transactions pertaining to trading in securities of companies contained in the Research Reports.
4. Disclosure regarding the Research Analyst’s connection with the subject company:
It is affirmed that I, Saji John Research Analyst(s) of Geojit have not served as an officer, director or employee of the subject company
5. Disclosure regarding Market Making activity:
Neither Geojit/its Analysts have engaged in market making activities for the subject company.
Please ensure that you have read the “Risk Disclosure Documents for Capital Market and Derivatives Segments” as prescribed by the Securities and Exchange board
of India.
Geojit Financial Services Ltd. (formerly known as Geojit BNP Paribas Financial Services Ltd.), Registered Office: 34/659-P, Civil Line Road, Padivattom, Kochi-
682024, Kerala, India. Phone: +91 484-2901000, Website: www.geojit.com. For investor queries: [email protected], For grievances: grievanc-
[email protected], For compliance officer: [email protected].
Corporate Identity Number: L67120KL1994PLC008403, SEBI Stock Broker Registration No INZ000104737, Research Entity SEBI Reg No: INH200000345,
Investment Adviser SEBI Reg No: INA200002817, Portfolio Manager: INP000003203, Depository Participant: IN-DP-325-2017, ARN Regn.Nos:0098, IRDA
Corporate Agent (Composite) No.: CA0226