Embed Size (px)
Citation preview

International Journal of Engineering and Technology Volume 3 No. 7, July, 2013
ISSN: 2049-3444 © 2013 – IJET Publications UK. All rights reserved. 746
Quarrying of Sand and Proposed Reclamation Method in Akure, Nigeria
1Akande J.M.,
2Jimoh B. O.
1Department of Mining Engineering, The Federal University of Technology, Akure 2Department of Mineral Resources Engineering, Federal Polytechnic, Ado-Ekiti.
ABSTRACT
The paper reports the study of extraction of sand from the deposit. The objective of the research was achieved by taken soil
and water samples from seven locations in Akure. Strip mining was used to excavate sand in all the deposits. The samples
were analyzed for physical and chemical properties which include temperature and colour and the amount of macro and
micronutrients such as Ca, Mg, K, Na, Fe, Cu, Pb, Mn, Zn, Cl, Acidity Alkalinity and Organic matter. The result show that
the subsoil are acidic (pH varies from 5.0 – 7.0). While the topsoil varies from slightly acidic to highly basic (pH ranges from
5.7 – 8.1). Cultural, Aquaculture and Nature trial recreation are however suggested for reclamation.
Keywords: words: Sand, Topsoil, Subsoil, Akure, Mining, Chemical Properties.
1. INTRODUCTION
Sand refers to fine loose grain resulting from the erosion
of rocks especially siliceous rocks forming the seashore
and desert. Most sand deposits represent one of the
following principal types; river channel deposit, flood
plain deposits, delta deposits, shore (sand dune) deposits
formed by sedimentation in standing water and residual
soils formed in place by weathering. Sand deposit in
Akure and its environment are either of these two; (i) the
flood plain deposit (those carried from the source
depending on the capacity of the agents of transportation)
and (ii) the residual soils (sand) formed in place by
weathering (Rahaman, 1997). Mining is the act of
reconverting the ground in order to win valuable and
economic viable mineral deposits from the earth crust for
the benefit of mankind. In Nigeria mining started with
exploitation of cassiterite, produced about a thousand ton
in 1909, Nigeria Mining Corporation (NMC) was
responsible for the mining of Gold in 1914, coal in 1915
(in collaboration with Nigeria Coal Corporation NCC)
and lead and zinc in 1947 (National policy of solid
mineral, 1999). Exploration of crude oil started in 1958 by
shell petroleum. The mining of some industrial mineral
like Talc, mica, banter sand and limestone have been
limited to individuals who have been authorized by
Federal Ministry of Solid Mineral through the issuance of
mining right and licenses (Williams, 2001).
From time mining companies were hold responsible for
primary restoration of mined out areas. The power to
declare any area closed to prospecting and mining was
vested on the minister of mines and power under section
8(1) of the Act. The first record of reclamation work was
carried out with the planting of eucalyptus trees directly
into the overburden heap near Barkin Ladi. The success
recorded influenced the establishment of the Mines Land
Reclamation Unit (MLRU) in 1948 by the then Northern
Regional Government (Mallo, 1995). Sand grains are
worn and rounded owing to movement by rivers, streams
and wind. This gradually turns the sand from sharp
angular grains into more rounded grain. Sand is a range of
grain size of material; it’s however defined as materials
between 1/16mm to 2mm in size (John, 1998). Many of
the method employed and principle of control in hard rock
quarries are equally applicable in sand mining (Ferguson,
1974). Three types of in stream sand mining exist. Dry pit
mining refers to pits excavated on dry ephemeral
streambeds. Wet pit mining involves removal of sand
from below the water table or in perennial stream channel
(Imasiku, 2002). Bar skimming or scalping requires
scraping off the top layer from a gravel bar without
excavating below the water level.
1.1 Quarrying Method Used in Akure Sand
The mining method use for Akure sand is strip mining.
Strip mining or shoveling according to Opafunso, 1990 is
a method of mining used in loose deposit such as sand any
type of loose overburden. It makes use of two major tools:
1. Diggers for loosing of the sand where it is compacted
and
2. Shovel for packing/scooping the loose material and
loading.
3. 3 – 6 tons truck for haulage.
The following impacts were noticeable from the sand
quarrying sites:
(i) surface disturbance and loss of aesthetic value
from pits left as a result of quarrying,
(ii) loss of land use for agriculture and forestry,

International Journal of Engineering and Technology (IJET) – Volume 3 No. 7, July, 2013
ISSN: 2049-3444 © 2013 – IJET Publications UK. All rights reserved. 747
(iii) the elimination of habitat for animal species due
to loss of bio-diversity,
displacement or extinction of animal species due to loss of
habitat.
2. MATERIALS AND FIELD STUDY
2.1 Location of the Study Area
The study areas are: Ado road located at Isinigbo/Igoba
along Akure-Ado-Ekiti road;
Owo road; Abo; and Oda; Igbatoro, located on the North
east of Akure; Itaoniyan; and Olokuta are located on the
southwestern region of the metropolis (Fig.1).
Thirty-five soil samples and twenty-one water samples
were taken from the quarries. Random sampling
technique was used to collect five soil samples in each of
the quarries. To these is added a control sample taken at
an average distance of about 200m to the quarry site.
Hand held auger drill was used in taken the soil samples.
Three grab water samples were equally taken at each of
the pits formed in the quarry.
2.2 Determination of Total Solids (TS), Total
Dissolved solid (TDS), Total Suspended
solid (TSS) and Total Hardness (TH)
The amount of total solid was determined in the
laboratory by
Total Solids (ppm) =
610ofsamplemlvol
inweightDifference
(1)
Total Dissolved solid (ppm) =
610
ofsamplemlvol
inweightDifference
(2)
Suspended solid (ppm) =
Dissolved solid (ppm) - Total Solids (ppm) (3)
Total Hardness (ppm) = Titre x 1000 (4)
Vol (ml) of sample
2.3 Determination of Organic Matter And
Total Nitrogen In The Soil Samples
Walkey-Black method (Awojobi, 2002) was employed to
determine the percentage of carbon in the soil sample.
% organic carbon in soil is calculated using the following
formula:
iedsandweightofdr
fMeqFeSOOCrMeqKC
3.0% 4722 (5)
f = correction factor = 1.33
Meq = Molarity of Solution x vol (ml) of solution used.
% Nitrogen content in the sample is calculated as follows:
ilusedweightofso
MTN
10014%
(6)
Where T = titre value
M = Molarity of HCL
2.4 Determination of NO3 and SO4 in the
Water Samples
Sulphate (SO4) in the water sample was determined by
adding 1% solution of hydroxylamine hydrochloride and
20ml of benzidene hydrochloride to 250ml of the water
sample in a beaker. The precipitate obtained after
filtration was titrated with 0.05m NaOH after adding 3
drops of phenolphthalein indicator.
SO4 (ppm) = vol (ml) of 0.05molar of NaOH 6.0 (7)
The nitrate (NO3) was determined by adding 2ml of
bruicine reagent. Absorbance at 470nm was measured
after allowing the mixture to stand for 5 minutes.
2.5 Determination of Na, K, Ca, Mg, Fe, Zn,
Cu, in the water samples
Na, K, Ca, Mg, Fe, Zn, Cu were extracted using Acetic
acid, ammonium hydroxide and ammonium acetate.
Amount of Na, K, Ca were determined using flame
photometer while Mg, Fe, Zn, Cu were determined using
an atomic absorption spectrometer.
3. RESULTS AND DISCUSSION
The temperature of the water samples is in the range of
27.80C-27.9
0C (fig. 2) thus representing the mean
temperature around Akure metropolis. Water for drinking
purposes has better taste at lower temperature around
150C (Akande and Awojobi, 2003). However, higher
temperature does not imply impurities or contamination.
The colour of Samples of pond water from Abo, Owo,
Itaoniyan and Olokuta could be observed to have higher
values of 70, 110, 80 and 120pcu while samples from
Ado, Igbatoro and Oda fall within acceptable limits of
50pcu (WHO, 1982). Turbidity values from the seven
quarries range from range from 10.32NTU which fall

International Journal of Engineering and Technology (IJET) – Volume 3 No. 7, July, 2013
ISSN: 2049-3444 © 2013 – IJET Publications UK. All rights reserved. 748
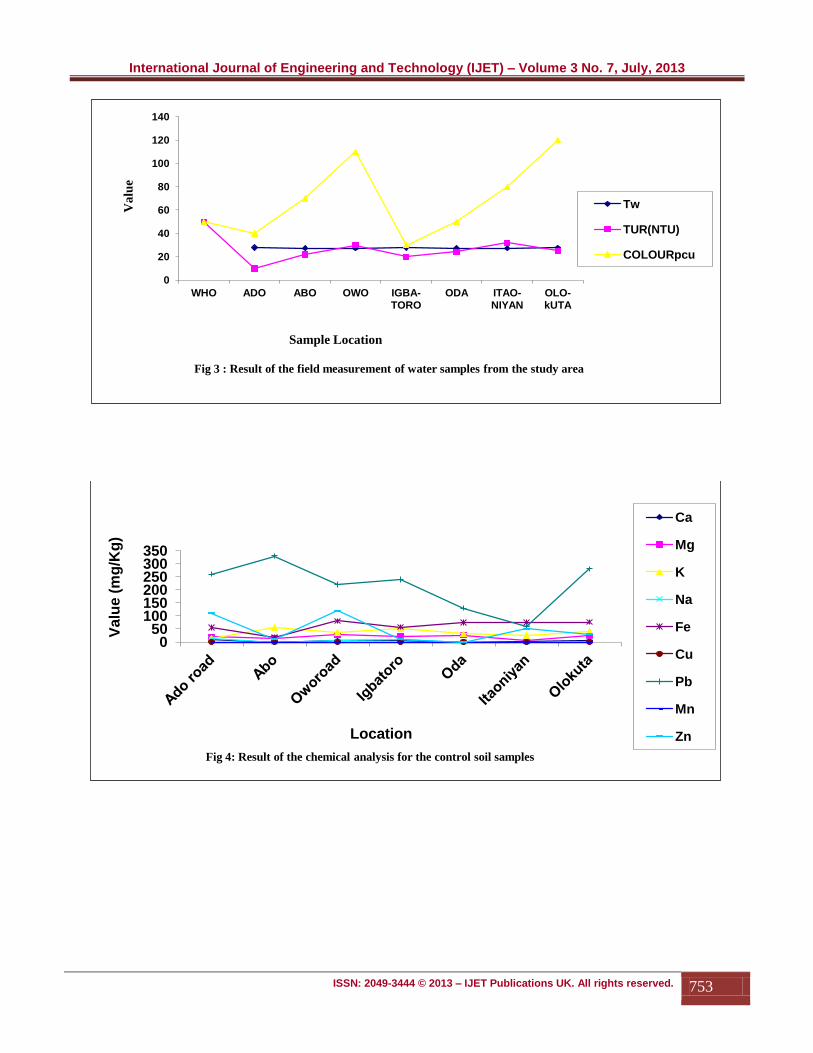
within permissible values of WHO, 1992. Results from
the topsoil and the subsoil (Fig. 3 and 4) samples indicate
that Ca has lesser values than 80mg/kg as recommended
by Adulayi and Ekong, 1981. The presence of Calcium in
the subsoil samples suggests the use of Calcium rich
fertilizer because plants except lower crops cannot
successfully grow in these areas as drought is evidenced
on them. Mg is present in sufficient values in thye control
samples except Abo and Itaoniyan. However the presence
of Mg in Ado road and Owo road are adequate in the
subsoil; unlike samples from Abo, Igbatoro, Oda,
Itaoniyan, which have less value. Olokuta has value that is
close to the critical value of 15mg/kg as suggested by
Akande and Awojobi (2003). It is however noticed that
there is concentration of the said nutrient in the topsoil.
Application of fertilizer and manure could be used to
improve the supply of the magnesium ion. Higher values
of K are obtained in the topsoil except Ado road and Owo
road in the subsoil than the topsoil (15 and 36mg/kg
against 38 and 48mg/kg) this could be as a result of
leaching of the nutrient. The subsoil could be treated with
NPK fertilizer to improve on the nutrient uptake by plant.
None of the values could be seen to match with the
acceptable limit suggested value of 58.5ppm by Sobulo
and Osiname (1981).
12mg/Kg of Na was obtained from Ado road sample
topsoil while Owo road; Igbatoro and Olokuta are with 4,
8 and 3mg/Kg respectively. The subsoil samples have less
values of the nutrient than the topsoil except those of Oda
and Itaoniyan. Values from Owo road are the same; but
all the samples could be seen to have fallen bellow the
required Na level of 80ppm suggested by Tisade and
Werner (1985).
The acceptable limit of Fe is about 30 – 150ppm
(Wendell, 1966). Results show that all the samples fall
within the required limit except that of Abo topsoil.
However, there is evidence of leaching of the nutrient
comparing the topsoil to the subsoil samples. The high
presence of iron may be responsible for the acidic nature
of the subsoil samples more so the absence of manganese
and copper that might oxidize it to a less soluble form of
it.
Lead value range from 60 to 330mg/kg in the all the soil
samples; while Manganese and copper were however not
present in measurable amount in all the samples.
Manganese fertilizer and CuSO4 could be applied to
introduce the missing ions.
Zinc is absent in both the control and subsoil samples of
Oda; while the control samples from Igbatoro and
Olokuta show that the soils are depleted of the element
(10 and 30mg/kg against 50 and 40mg/kg respectively).
There are more Zn in the topsoil of Ado road, Owo road
and Itaoniyan than in the subsoil. However Owo road
Igbatoro and Olokuta subsoil samples fall within
acceptable limit. Samples from Abo and Igbatoro have
10mg/kg which fall below the required value of 25-
150ppm.
The acceptable limit of Chlorine according to Wendell
(1966), Awojobi (2002) and Akande and Awojobi (2003)
is about 250ppm. There are higher values of 380, 270, 320
and 260mg/kg respectively for Ado, Abo, Igbatoro and
Olokuta (Figs. 5 and 6) indicating a good support for plant
growth; while other topsoil samples are slightly below the
acceptable limit, a good rainfall will favour its balance on
the soil. However, 100mg/kg was recorded for the subsoil
sample of Owo road while others fall below this limit.
The result obtained from the study areas show that
Itaoniyan subsoil has more sulphate (250mg/kg) than the
control sample (10mg/kg); this may be due to leaching
effect on the topsoil. It is however noticed that Igbatoro,
Owo road and Olokuta top and subsoil samples are reach
in sulphate nutrient (400 and 300, 300 and 170 and 500
and 310mg/kg respectively). All the samples show a good
representation of sulphate that could support plant growth.
According to Awojobi (2002), soil with about 2-20ppm
will support plant growth. More nitrogen is present in the
subsoil except in Igbatoro and Olokuta than the topsoil,
this may be attributed to leaching (Figs 5 and 6). It is
likely not going to support yield of fruits or grains. The
pH in soil is between 3 to 10 (Rowel, 1993,). When it is
lower or higher than 5.6 it is acting either as an acid or
base. The result obtained from the study areas show that
the control samples are all within the range of normal soil
and their values range from 5.7 – 8.1. Comparing, the
subsoil samples range from 5.0 – 7.0 which can be said to
be slightly acidic except for samples from Ado road, Owo
road and Igbatoro. This could be attributed to Fact that is
present in large quantity and the absence of Mn and Cu.
In this type of environment, most plants could still
survive. Almond fruit, Oil palm and even Melaina being
some examples.
The Organic matter of soil have been removed by
quarrying, this could be noticed when comparing the
topsoil with the subsoil samples. It ranges from 0.25- 0.85
in the topsoil, and 0.10-0.35 in the subsoil samples. Only
Olokuta sample has the same value of organic matter
(Figs. 7 and 8).
The Suspended Solid values range from 47.2 to 80mg/l
which are above the WHO recommended value of 25mg/l.
The range of value for the pH is 5.6 to 8.1for all the pond
water at the quarry sites. However the recommended
range of WHO, 1981 is 6.5-9.2 in which only Abo and
Oda fall bellow this limit.
The Electrical conductance is a function of total amount
of dissolved solids in water. Drinking water is
recommended to have not more than 500mg/l of dissolved
solids, although water with up to 1000 mg/l is allowed

International Journal of Engineering and Technology (IJET) – Volume 3 No. 7, July, 2013
ISSN: 2049-3444 © 2013 – IJET Publications UK. All rights reserved. 749
where there is no alternative source. Range obtained was
between 110.1s/cm for Abo pond water to 390 s/cm
Ado pond. This indicates that stream water draining into
the mine site has low degree of contamination or pollution
coupled with no level of contamination from the mined
out space (Fig. 9).
Acidity and Alkalinity in water is a function of hydroxyl
ions and this is closely related to the pH of the water.
Values obtained for all the samples range between34.8 to
86.2mg/l for acidity and 90.1 to 150mg/l for alkalinity
thereby falling within permissible limits of 500mg/l
recommended by WHO, 1992. The water samples have
values that range from 18 to 130mg/l of hardness (fig.
10). This classes all the water samples between soft water
to hard water and fall below the recommended value of
500mg/l by WHO, 1982. The level of Na and K could not
be traced to any environmental problem in that the range
of values obtained are 0 to 10.2mg/l Na and 22 to 45mg/l
which fall bellow the acceptable WHO limit for the two
ions. The presence of Ca and Mg in the water samples do
not indicate contamination. WHO accepts 200 and
150mg/l. The level of Mn and Cu in the water samples
could not be determined. The level of Fe in the water
indicates that Abo and Ado road has 0.1 and 0.09mg/l
respectively while others have higher values that range
between 0.23 to 0.73mg/l.
The chlorine level in the water samples fall below
acceptable limit of WHO (250mg/l) (fig 11). The samples
present values that range between 0.028-0.075mg/l, this
range could support aquaculture. Sulphate is present in
minimal quantity in all the samples giving a value of
49mg/l for Ado road; others are however having less
value. The values obtained fall below the recommended
limit of the World Health Organization of 500mg/l. All
the samples of water indicate that there is low level of
Nitrate (NO3) in them. The value range from 0.12 (Ado)
to 0.70mg/l (Itaoniyan), conforming to the recommended
WHO standard of 44mg/l.
Reclamation: It is a process by which previously
unusable land is returned to a state whereby some use
may be made of it. According to James et al, 1998, it
refers to areas which were heavily contaminate or were
geologically unstable, and may now be used for civil
reengineering, construction or limited growth such as
sports fields which require high inputs to be maintained.
3.1 Possible Reclamation Method
Cultural: Rehabilitation of claimed mined areas, as in
the opinion of Mallo, 1999 will start with the planting of
trees such as casuarinas trees, oil palm, almond fruit,
ticks, eucalyptus as the case may be in addition to this
many species of insects reptiles birds and mammals could
be introduced into the young forest to aids the
development of the ecosystem.
Aquaculture: The chemical and physical analysis of
this study have shown the presence of an unpolluted water
draining into the quarry underlying ground water which
suggests that the development of aquaculture projects
could be possible both for rehabilitation purposes and as
economic venture.
Nature Trial Recreation: The essence is to create
new habitats with expanding food sources to provide wide
range of animals, birds and insects. The establishment of
such a green haven can attract tourism (game reserve).
4. CONCLUSION AND
RECOMMENDATION
Sand is a vital material in construction hence it has a great
role it plays in national development. The range of grains
sizes of sand is between 0.0625 – 1.000mm and could be
quarried by Dry pit, Wet pit, Bar skimming, and even the
use of modern machineries such as front end loaders,
power shovel and the like. The presence of macronutrients
such as Ca, Mg and K in most of the samples are
inadequate when compared with standard values. The pH
of the subsoil varies from5.0 to 7.0. This indicates that the
subsoil is acidic. While the pH of the topsoil ranges from
5.7-8.1 which indicate soil that is slightly acidic to highly
basic. The pH values of the water sample vary from 5.6 to
8.1 indicating slightly acidic to highly basic water. The
stream water draining into all the ponds are not of a
polluted or contaminated source.
The abandoned pit resulting from mining should be used
as a refuse dump. After some period of time the
decomposed refuse can be mixed together and spread over
the pit. This could successfully allow the growth of plants
on it thereby reclaiming the land for agricultural practices.
A commission such as Industrial Mineral Producing Areas
development commission [IMPADEC] should be set up
by the federal government to supervise the reclamation of
the devastated lands where sand and other industrial
minerals are extracted. The Federal Government should
uphold and implement the FEPA requirements that every
proposal for mining be accompanied by an appropriate
environmental impact statement. There has to be the
closest possible liaison between the environmental and
engineering teams so that all relevant environmental
parameters are considered.
REFERENCES
[1] Adulaji E.A. And Ekong E.E.(1981); General
Agriculture And Tool. London Cassell. Pp. 100 –
106.

International Journal of Engineering and Technology (IJET) – Volume 3 No. 7, July, 2013
ISSN: 2049-3444 © 2013 – IJET Publications UK. All rights reserved. 750
[2] Akande J.M. And Awojobi D.A., 2003, Assessment
Of Environmental Impacts Of Exploitation Ofd
Granite Deposits In Ilorin, Journal Of Engineering
And Technology 10 (2) 4891-4900.
[3] Aso Isife And Adeloye A.O. (2001), Introduction To
Mining Vol. 1 Pp65-85
[4] Awojobi, D.A. (2002); Environmental Impact
Assessment Of Exploitation Of Granite Deposits In
Ilorin, MENG Project FUTA.
[5] FAO (Food and Agriculture Organization) (1993):
Soils Bulletin 68
[6] Ferguson S.R. (1974), The Velocity Of The Sea-Bed
And Basement Rocks Between Leigh And The
Mokohinau Islands. Msc Thesis, University Of
Auckland.
[7] Hilson G. (2002): An overview of land use conflicts
in mining communities. Land Use Policy vol. 19 No.
1.
[8] Imasiku, A.N., (2002): Economic, Environmental and
Social Impacts of Small Scale Mining.
http://www.32igc.org.
[9] James A, Harris, Paul Birch and John P. Palmer,
(1998): Land Restoration And Reclamation;
Principles And Practices., Addison Wesley Longman
Limited Pp. 3 –25.
[10] Opafunso Z.O. (1990): Personal communication
[11] Rahaman M.A., (1997): Review of Basement
Geology of south-western Nigeria by C.A. Kogbe
(ED), Elizabethan Publication Co. Lagos, Nigeria.
41-51.
[12] Rowel D.L., (1993), Soil Science. Methods And
Applications Pp 232-249.
[13] Sobolu A.R. And Osiname B., 1981; Sales And Of
Fertilizer In Nigeria I.A.R.T. Res. Bulletin No. 11,
Pp. 42.
[14] Stephen Malloy J, (1999): Reclamation of mined out
areas: A case study of the Jos Plateau. Nigeria mining
journal Vol. 3. (1); Pg 19 & 20).
[15] Tisdale S and Werner N (1985); Soil Fertility And
Fertilizers. Macmillan Books: New York, 4th
Edition
Pp 64 – 69.
[16] Wendell H., (1966): Compilation Of Soil Science
Lecture Series For Students Of University Of Nsuka.
[17] WHO (World Health Organization) (1982):
guidelines for Drinking Water quality in Small
Communities. World Health Organization. Geneva
[18] WHO (World Health Organization) (1992): Our
Planet Report of the WHO commission on health and
environment. Geneva
[19] Williams F.A. (2001): Disposal mining in Lagos
state, an unpublished HND thesis, the federal
polytechnic, Ado Ekiti 23-32

International Journal of Engineering and Technology (IJET) – Volume 3 No. 7, July, 2013
ISSN: 2049-3444 © 2013 – IJET Publications UK. All rights reserved. 751
5
Akure
Fig: 1. Map of Nigeria indicating Akure in Ondo state

International Journal of Engineering and Technology (IJET) – Volume 3 No. 7, July, 2013
ISSN: 2049-3444 © 2013 – IJET Publications UK. All rights reserved. 752
Fig 2: Location Map Showing The Study Area
(Source: Area Photography, Ground Control and Compilation)
International Journal of Engineering and Technology (IJET) – Volume 3 No. 7, July, 2013
ISSN: 2049-3444 © 2013 – IJET Publications UK. All rights reserved. 753
0
20
40
60
80
100
120
140
WHO ADO ABO OWO IGBA-TORO
ODA ITAO-NIYAN
OLO-kUTA
Va
lue
Sample Location
Fig 3 : Result of the field measurement of water samples from the study area
Tw
TUR(NTU)
COLOURpcu
0 50
100 150 200 250 300 350
Valu
e (
mg
/Kg
)
Location
Fig 4: Result of the chemical analysis for the control soil samples
Ca
Mg
K
Na
Fe
Cu
Pb
Mn
Zn

International Journal of Engineering and Technology (IJET) – Volume 3 No. 7, July, 2013
ISSN: 2049-3444 © 2013 – IJET Publications UK. All rights reserved. 754
0
50
100
150
200
250
300
350
Ado road Abo Oworoad Igbatoro Oda Itaoniyan Olokuta
Val
ue
(mg/K
g)
Location
Fig 5 : Result of the chemical analysis for the sub-soil samples
Ca
Mg
K
Na
Fe
Cu
Pb
Mn
Zn
0
100
200
300
400
500
600
700
800
900
1000
Ado road Abo Oworoad Igbatoro Oda Itaoniyan Olokuta
Val
ue
(mg/K
g)
Location
Fig 6: Result of the chemical analysis for the control soil samples
Cl-
SO4
NO3

International Journal of Engineering and Technology (IJET) – Volume 3 No. 7, July, 2013
ISSN: 2049-3444 © 2013 – IJET Publications UK. All rights reserved. 755
0
100
200
300
400
500
600
700
800
900
1000
Ado road Abo Oworoad Igbatoro Oda Itaoniyan Olokuta
Val
ue
(mg/K
g)
Location
Fig 7 : Result of the chemical analysis for the sub-soil samples.
Cl-
SO4
NO3
0
1
2
3
4
5
6
7
8
9
10
Val
ue
(mg/K
g)
&%
Location
Fig 8 Result of the chemical analysis for the control soil samples
pH
Conductivity x100
Acidityx100
Alkalinityx100
% or ganic matter

International Journal of Engineering and Technology (IJET) – Volume 3 No. 7, July, 2013
ISSN: 2049-3444 © 2013 – IJET Publications UK. All rights reserved. 756
0
1
2
3
4
5
6
7
8
9
val
ue
(mg/K
g)
and %
Location
Fig 9 : Result of the chemical analysis for the sub-soil samples.
pH mg/Kg
Conductivity x100mg/Kg
AcidItyx100 mg/Kg
AlkalInity x100mg/Kg
% or ganic matter
0
200
400
600
800
1000
1200
Val
ue
(mg/K
g)
Sample Location
Fig 10 : Result of the field measurement of water samples from the study
area
pH
EC us/cm
Alkalinity Mg/l
Acidity mg/l
TH mg/l
SS mg/l
TDS mg/l

International Journal of Engineering and Technology (IJET) – Volume 3 No. 7, July, 2013
ISSN: 2049-3444 © 2013 – IJET Publications UK. All rights reserved. 757
0
50
100
150
200
250
cati
ons
(mg/l
)
sampling locations
Fig 11 :Result of the field measurement of water samples from the study area
K mg/l
Na mg/l
Ca mg/l
Mg mg/l
Mn mg/l
Cu mg/l
Fe mg/l
0
100
200
300
400
500
600
WHO ADO ABO OWO IGBA-TORO
ODA ITAO-NIYAN
OLO-kUTA
Val
ue
(mg/K
g)
Sample Location
Fig 12 : Result of the field measurement of water samples from the study area
Cl mg/l
SO4 mg/l
HCO3 mg/l
NO3 mg/l