Embed Size (px)
Citation preview
L6172 Law and Social Science
Review
April 23, 2007
Daubert and the FREs
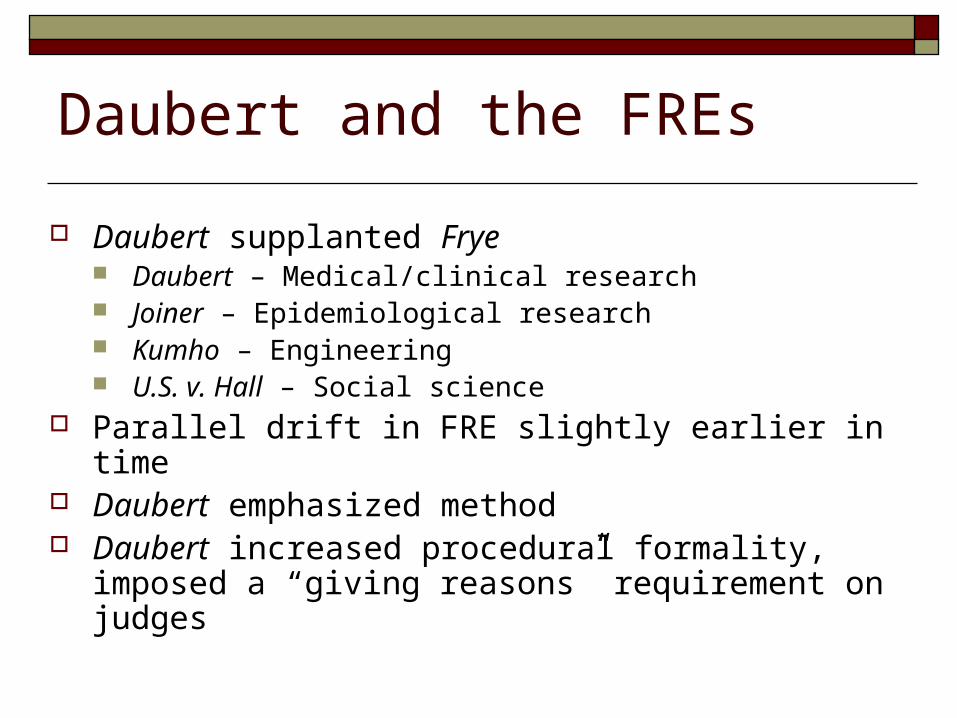
Daubert supplanted Frye Daubert – Medical/clinical research Joiner – Epidemiological research Kumho – Engineering U.S. v. Hall – Social science
Parallel drift in FRE slightly earlier in time Daubert emphasized method Daubert increased procedural formality, imposed a
“giving reasons” requirement on judges
Daubert in Action
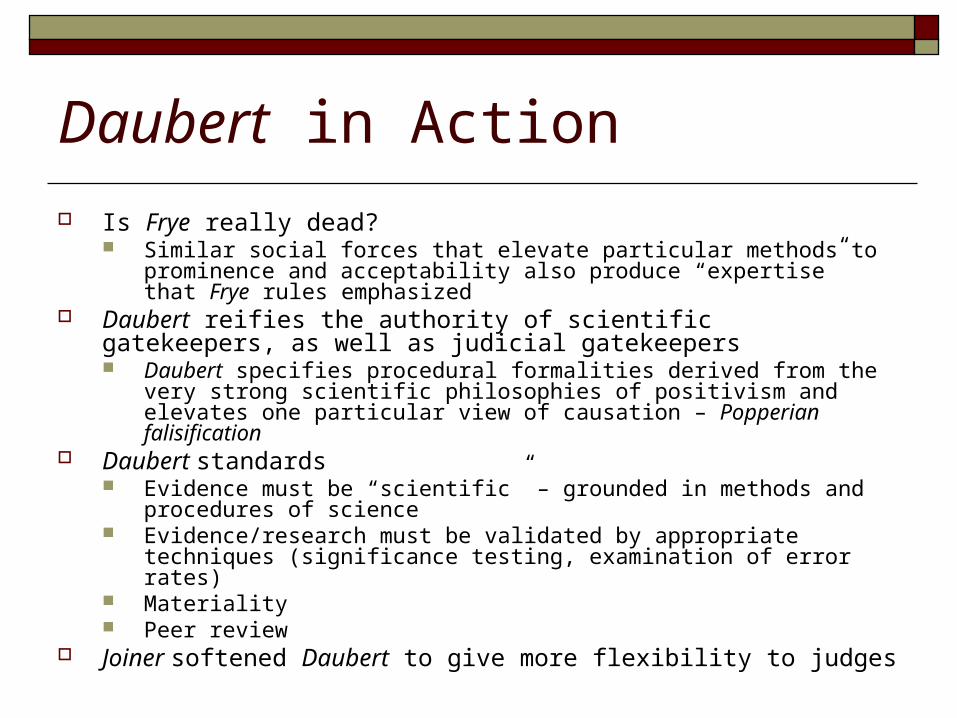
Is Frye really dead? Similar social forces that elevate particular methods to prominence and
acceptability also produce “expertise” that Frye rules emphasized Daubert reifies the authority of scientific gatekeepers, as well as judicial
gatekeepers Daubert specifies procedural formalities derived from the very strong
scientific philosophies of positivism and elevates one particular view of causation – Popperian falisification
Daubert standards Evidence must be “scientific” – grounded in methods and procedures of
science Evidence/research must be validated by appropriate techniques (significance
testing, examination of error rates) Materiality Peer review
Joiner softened Daubert to give more flexibility to judges
Causation in Law
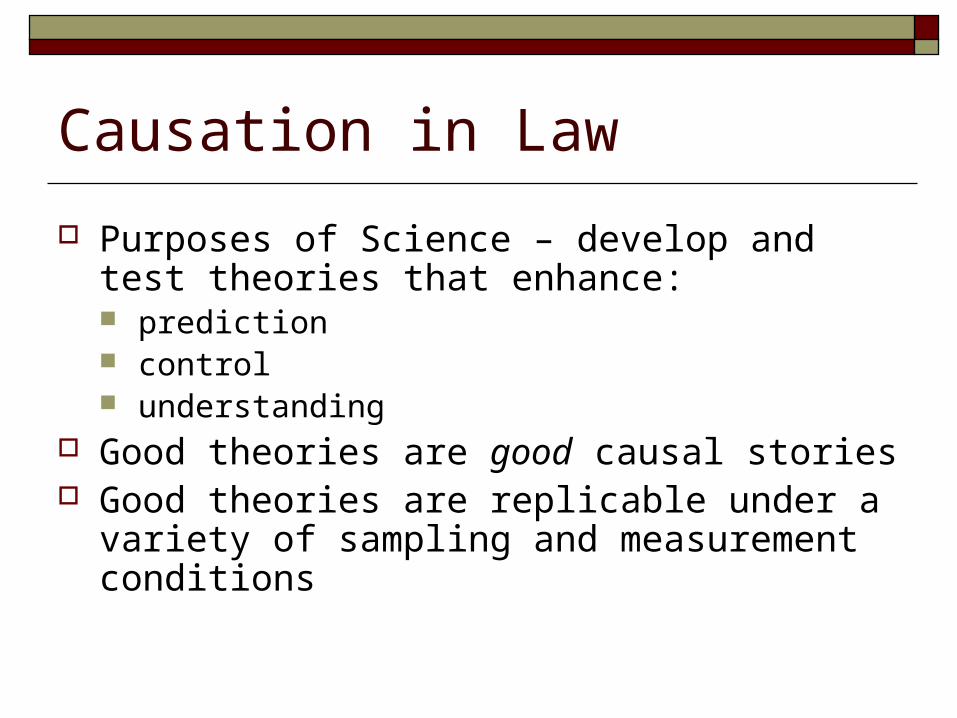
Purposes of Science – develop and test theories that enhance: prediction control understanding
Good theories are good causal stories Good theories are replicable under a variety
of sampling and measurement conditions

Elements of Causal Theories The distinction between causal theory and causal
explanation On need not demand that the precise causal mechanisms can be
tested in order to make a causal claim, but instead observe that there is a consistent relationship between an outcome and an event
“A hit B in the head and he died” versus “A’s assault gave B led to his death”
Critical elements Correlation (or “continguity between presumed cause and
effect”) Temporal precedence Absence of spurious (“third party” effects) Constant conjunction (“cause-present/cause-absent”
requirement) – Hume Falsification – threshold for falsification? How negative
observations do we need to disprove a theory?
Experimental versus Epidemiological Causation Experiments test specific hypotheses through
manipulation and control of experimental conditions
Epidemiological studies presumes a probabilistic view of causation based on observations of phenomena with a natural distribution across populations Attempt to isolate and control for mediating factors
and multiple causes to isolate specific causal effects of interest (example … innoculations, mercury exposure and autism)
Criteria for Causal Inference Strength (is the risk so large that we can easily rule out other factors) Consistency (have the results have been replicated by different
researchers and under different conditions) Specificity (is the exposure associated with a very specific disease as
opposed to a wide range of diseases) Temporality (did the exposure precede the disease) Biological gradient (are increasing exposures associated with increasing
risks of disease) Plausibility (is there a credible scientific mechanism that can explain the
association) Coherence (is the association consistent with the natural history of the
disease) Experimental evidence (does a physical intervention show results
consistent with the association) Analogy (is there a similar result to which we can draw a relationship)
Source: Sir Austin Bradford Hill, The Environment and Disease: Association or Causation, 58 Proc. R. Soc. Med. 295 (1965)
Errors in Causal Inference
Two Types of Error Type I Error (α) – a false positive, or the probability of
falsely rejecting the null hypothesis of no relationship Type II Error (β) – a false negative, or the probability of
falsely accepting the null hypothesis of no relationship The two types of error are related in study design, and one
makes a tradeoff in the error bias in a study Statistical Power = 1 – β -- probability of correctly
rejecting the null hypothesis

Scientific Process
From theory, specify a conceptual model of causal relationships, translate relationships into constructs, operationalize constructs into measures, and test Example – deterring tax cheaters
Choices between experimental designs and epidemiological designs Both are valid paths to causal inference
Types of Research Designs
Case studies good for generating hypotheses, for understanding and illustrating causal linkages Not good for testing hypotheses, or for generalizing to other populations
Correlational studies studies that assess simultaneous changes in independent and dependent variables.
Example: income levels and voter preferences on surveys Example: diet and disease (epi causation model)
You can still make predictions from correlational studies if you have ruled out other causes, but you cannot achieve “control” without understanding directionality of effect.
True experiments random assignment of subjects to groups, unequal treatment of similarly situated
people Examples: Perry PreSchool, MTO
Quasi-experiments Nonrandom assignment, with approximations and control for between-group
differences Selection effects, use propensity scores to adjust for selection differences
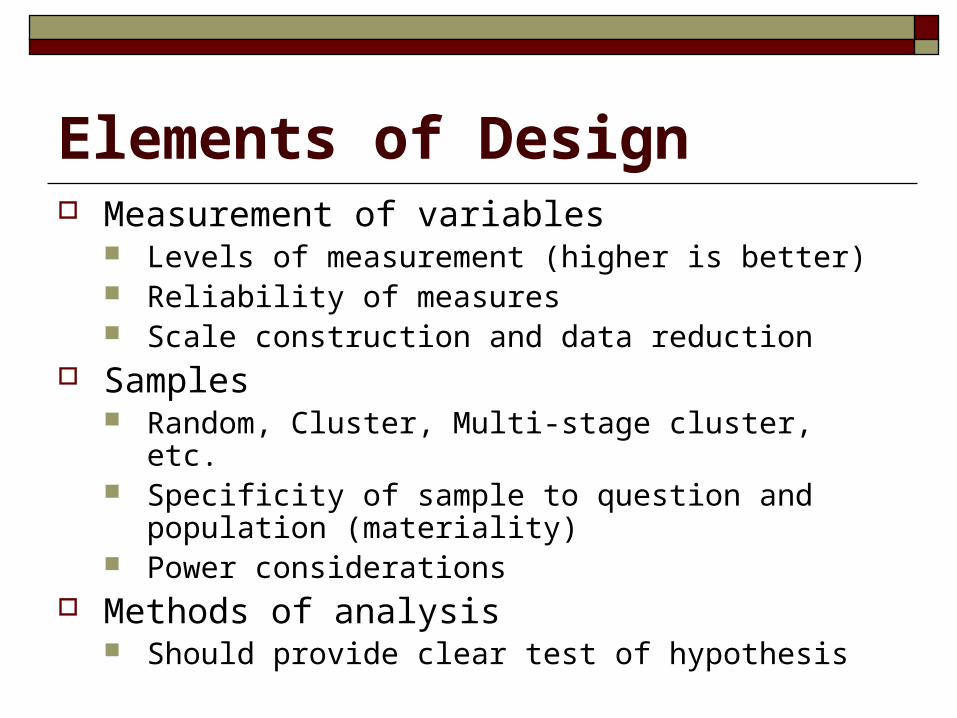
Elements of Design Measurement of variables
Levels of measurement (higher is better) Reliability of measures Scale construction and data reduction
Samples Random, Cluster, Multi-stage cluster, etc. Specificity of sample to question and population
(materiality) Power considerations
Methods of analysis Should provide clear test of hypothesis
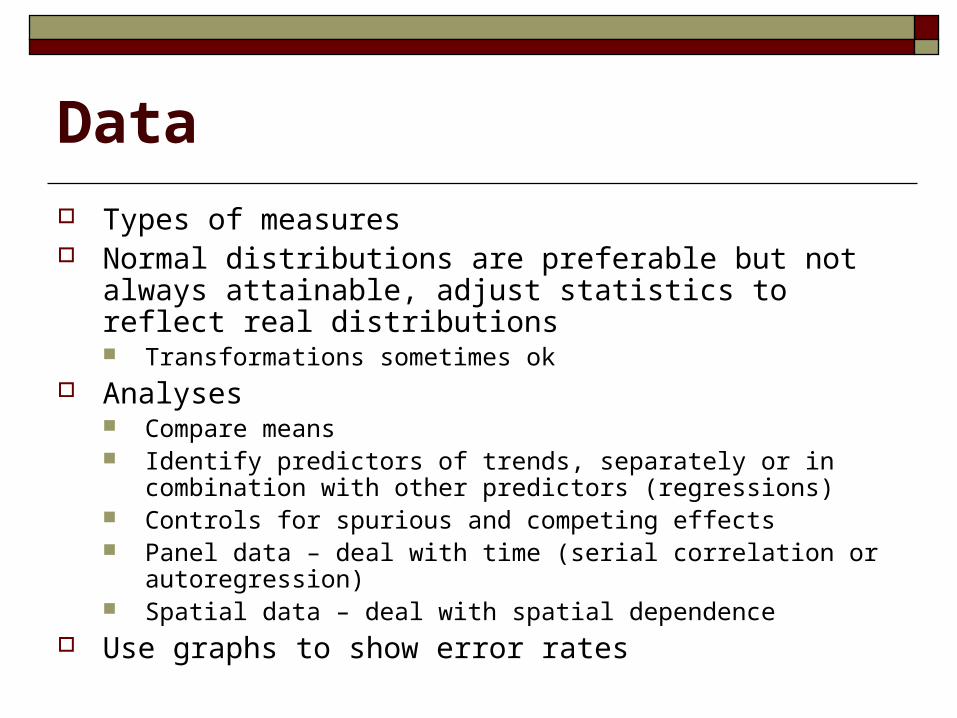
Data
Types of measures Normal distributions are preferable but not always attainable,
adjust statistics to reflect real distributions Transformations sometimes ok
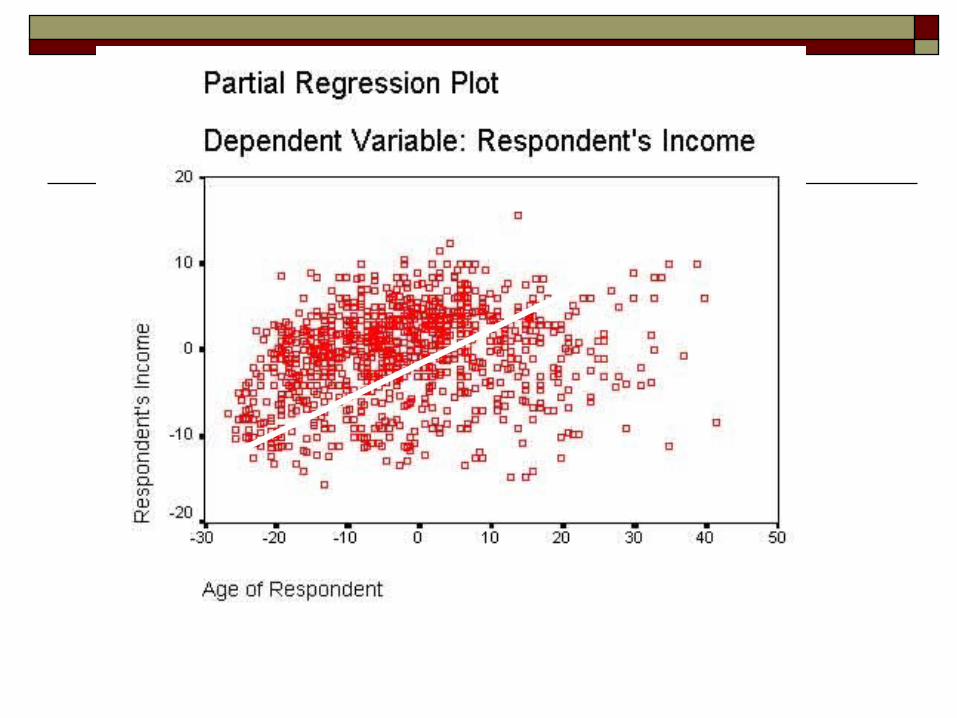
Analyses Compare means Identify predictors of trends, separately or in combination with other
predictors (regressions) Controls for spurious and competing effects Panel data – deal with time (serial correlation or autoregression) Spatial data – deal with spatial dependence
Use graphs to show error rates
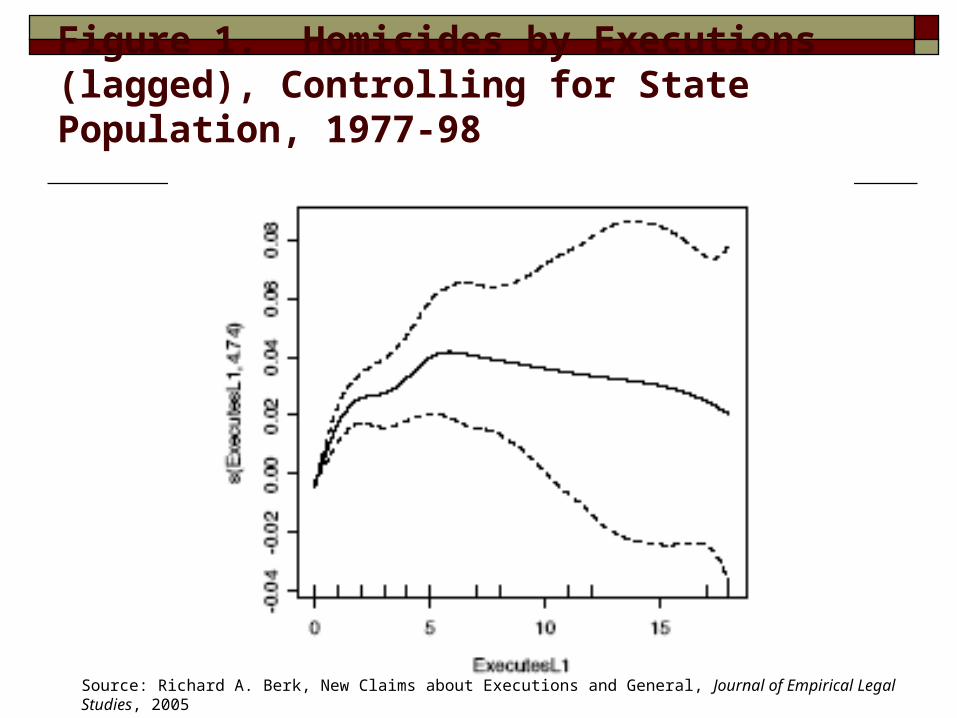
Figure 1. Homicides by Executions (lagged), Controlling for State Population, 1977-98
Source: Richard A. Berk, New Claims about Executions and General, Journal of Empirical Legal Studies, 2005
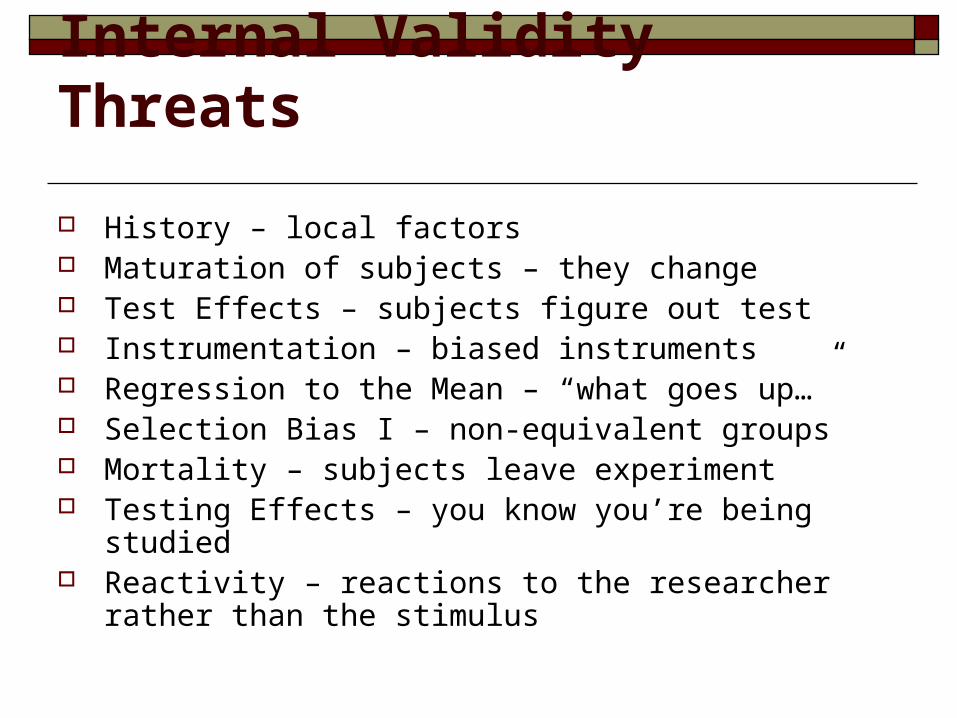
Internal Validity Threats
History – local factors Maturation of subjects – they change Test Effects – subjects figure out test Instrumentation – biased instruments Regression to the Mean – “what goes up…” Selection Bias I – non-equivalent groups Mortality – subjects leave experiment Testing Effects – you know you’re being studied Reactivity – reactions to the researcher rather than the stimulus

External Validity Threats
Selection Bias II -- groups are unrepresentative of general populations
Multiple treatment inference -- more than one independent variable operating
Halo effects -- conferring status or label that influences behavior
Local history – changing contexts Diffusion of treatment -- controls imitate experimental
subjects Compensatory equalization of treatment -- controls want to
receive experimental treatment Decay -- erosion of treatment Contamination -- C's receive some of E treatment
Types of Samples Probability Samples
Simple Random Samples Stratified Random Samples Cluster Samples Matched Samples (Case Controls)
Non-Probability Samples Systematic Samples Quota Samples Purposive Samples Theoretical Samples

http://www.stat.sc.edu/~ogden/javahtml/power/power.html

Multivariate Models
Ordinary Least Squares (OLS) Regression, or Multiple Regression tells you which combination of variables, and in what priority, influence the
distribution of a dependent variable. It should be used with ratio or interval variables, although there is a
controversy regarding its validity when used with ordinal-level variables. OLS regression is used more often in survey research and non-
experimental research, although it can be used to isolate a specific variable whose influence you want to test
You can introduce interaction terms that isolate the effects to specific subgroups (eg, race by gender).
If you do it right, you can control and eliminate statistical correlations between the independent variables
Logistic Regression is a form of regression specifically designed for binary dependent variables (e.g., group membership)

How Good is the Model? What Does It Tell Us?
Most multivariate models generate probability estimates for each variable in the model, and also for the overall model
Model Statistics: “model fit” or “explained variance” are the two most important
Independent Variables Coefficient estimate Standard Error Statistical Significance
Omitted variable biases TV Violence example: who chooses to watch TV? Are those factors also
related to violence? E.g., thrill-seeking
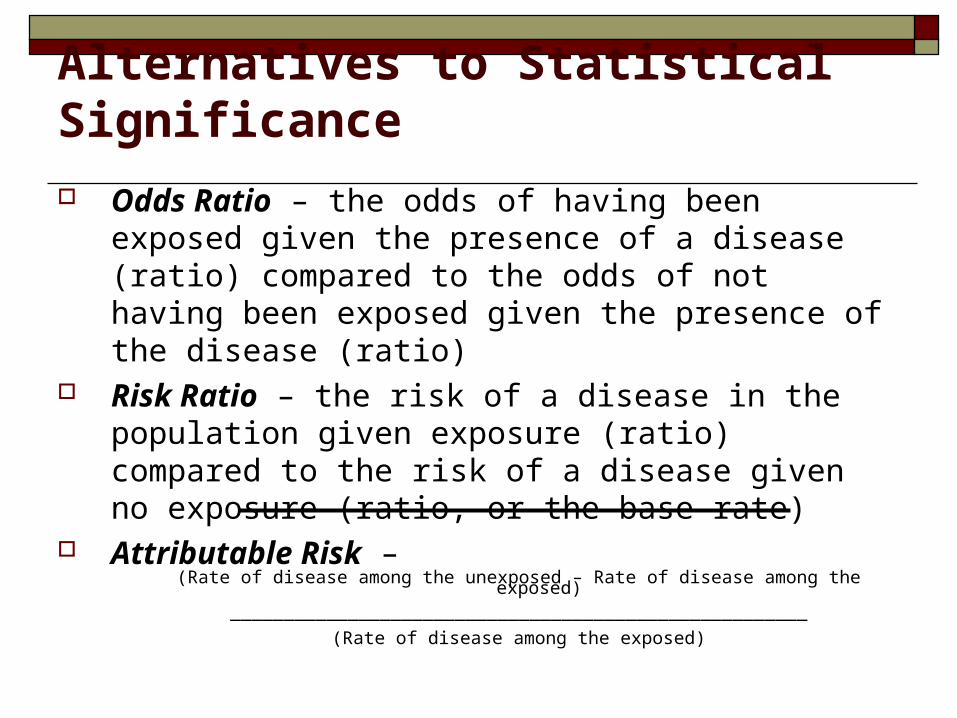
Odds Ratio – the odds of having been exposed given the presence of a disease (ratio) compared to the odds of not having been exposed given the presence of the disease (ratio)
Risk Ratio – the risk of a disease in the population given exposure (ratio) compared to the risk of a disease given no exposure (ratio, or the base rate)
Attributable Risk – (Rate of disease among the unexposed – Rate of disease among the exposed)
______________________________________________________
(Rate of disease among the exposed)
Alternatives to Statistical Significance