Embed Size (px)
Citation preview
II II ar· II I I I I II ~ \,,N'
I I I I
• • I
4
tr I
LA-13330-MS
Baseline Geochemistry of Soil and Bedrock
Tshirege Member of the Band,elier Tuff
atMDA-P
Los Alamos NATIONAL LABORATORY
Los Alamos National Laboratory is opera1 for the United States Department of Ener.
111111111111111111111111111111 3550
~ Q
• Ill· ~· Baseline Geochemistry of Soil and Bedrqck
Tshirege Member of the Bandelier Tuff at MDA-P
Richard G. Warren Eric V. McDonald Randall T. Ryti
Los Alamos NATIONAL LABORATORY
Los Alamos, New Mexico 87545
% I
LA-13330-MS
UC-2100 Issued: August 1997

• " --; • • ,_: '
-,. •• • • • • • •
TABLE OF CONTENTS
ABSTRACT ......................................................................................................................................... 1
1.0. INTRODUCTION .................................................................................................................... 2
2.0. SAMPLING SITES AND FIELD METHODS ........................................................................ 2
3.0. SAMPLE PREPARATION AND ANALYTICAL METHODS ............................................... 7
4.0. DESCRIPTION OF SOILS NEAR MDA-P AND A STATISTICAL APPROACH ............... 9 FOR ANALYSIS OF RESULTS
4.1. Soil and Colluvium Stratigraphy .................................................................................. 9
4.2. Statistical Analysis of Soil Horizons .......................................................................... 10
4.3. Background Screening Value Data Sets Used For Soils ............................................. 10
5.0. RESULTS AND DISCUSSION FOR SOILS ........................................................................ 10
5.1. Distribution ofBa, Cu, Hg, and Zn in Soils ............................................................... 10
5.2. Distribution of Other Constituents in Soils ................................................................ 19
5.3. Other Elements Above Local and LANL Soil Background Screening Levels ........... 20
6.0. DESCRIPTION OF BEDROCK NEAR MDA-P AND GRAPHICAL ................................. 20 APPROACH FOR ANALYSIS OF RESULTS
6.1. Geologic Factors and Their Potential Chemical Effects on Background and ............ 20 Baseline Chemistry of Bedrock at MDA-P
6.2. Graphical Representation of Background and Baseline Chemical Data for .............. 22 Bedrock at MDA-P
7.0. GENERAL PATTERNS IN BACKGROUND AND BASELINE CHEMISTRY ................. 23 FOR BEDROCK AT MDA-P
7 .1. Statistical Summary of EPA SW846 Chemical Analyses for Background and .......... 23 Baseline Samples Near MDA-P
7 .2. General Patterns Related to Analytical Bias in Bedrock and Soil .............................. 25
7 .3. General Patterns Related to Stratigraphic Level of Bedrock at MDA-P .................... 30
v
I 7.4. General Patterns Related to Alteration of Bedrock at MDA-P ................................... 31 I 7.5. General Patterns Related to Burial of Bedrock by Soil at MD A-P ............................ 3 2
8.0. DISCUSSION OF EXCURSIONS FROM TYPICAL PATTERNS IN ................................. 33
BACKGROUND AND BASELINE CHEMICAL DATA FOR BEDROCK
ATMDA-P
8.1. Excursions in Bedrock Related to Alteration and Weathering at MDA-P .................. 34
8.2. Excursions in Bedrock Related to Association with a Hydrologically ...................... ~ 34
Transmissive Zone and Concentration due to Extreme Mobility at MDA-P
8.3. Excursions in Bedrock Related to Contamination at MDA-P .................................... 34
8.4. Summary of General Patterns in Background and Baseline Chemical Data for ........ 35
Bedrock at MDA-P and Excursions from These Patterns
9.0. RELATIONSHIPS BETWEEN SOIL AND BEDROCK AT MDA-P ................................... 36
10.0. CONCLUSIONS FROM BASELINE STUDY OF MDA-P ................................................. 39
ACKNOWLEDGMENTS .................................................................................................................. 43
REFERENCES ................................................................................................................................... 43
APPENDIX A ..................................................................................................................................... 45
APPENDIX B ..................................................................................................................................... 46
APPENDIX C ..................................................................................................................................... 57
APPENDIX E ..................................................................................................................................... 62
APPENDIX F ..................................................................................................................................... 63
APPENDIX G ..................................................................................................................................... 65
APPENDIX H ..................................................................................................................................... 66
APPENDIX I ...................................................................................................................................... 67
APPENDIX J ...................................................................................................................................... 68
vi
j
1 I 1
1
1
I (
I (
11 f
'-··
I. l t l lr
•
Baseline Geochemistry of Soil and Bedrock Tshirege Member of the Bandelier Thff at MDA-P
Richard G. Warren, Eric V. McDonald, and Randall T. Ryti
ABSTRACT
We collected 18 samples of soil and 23 samples of bedrock tuff to provide a baseline chemical characterization of 3 sites near MDA-P. These sites, planned for use in the remediation of MDA-P, are the Segregation Area, Decontamination Pad, and Staging Area 1. All samples were analyzed for the HN03-leachable fraction of 28 chemical elements, and the soil samples were also analyzed for the -total concentrations of 25 of these elements. The analyses of these 41 baseline samples represent locations that might have been contaminated from operations near MDA-P to compare with previously reported background analyses of samples that represent soil and bedrock near MDA-P that were sampled where contamination was not expected.
Soil profiles were sampled at five locations in one of the sites at MDA-P, and profiles of fill were sampled at several locations in the other two sites. Concentrations ofHN03-leachable Ba in soil layers sampled within the Segregation Area and Decontamination Pad are generally two to five times greater than Ba concentrations in background MDA-P soil A horizons and LANL-wide combined soil horizons. Concentrations of total Ba are also above site-specific MDA-P screening background levels for most of the samples collected from the Segregation Area and Decontamination Pad. Concentrations of acid-leachable and total Ba are within the background range for samples collected from the Staging Area.
Total element and nitric acid-leachable abundances and the abundances of primary (phenocryst) minerals within Unit 4 of the Tshirege Member of the Bandelier Tuff at MDA-P vary strongly in a systematic pattern that reflects a primary (magmatic) reverse zonation in bedrock. This zonation results in chemical variations for some elements within Unit 4 within a factor of three and variations for some phenocryst abundances that exceed two orders of magnitude. Because of this effect, accurate chemical comparisons for bedrock are possible only when the stratigraphic level within Unit 4 is accurately known, and large standard deviations can result from simple statistical analyses of data from Unit 4. The problem of distinguishing chemical excursions from this extreme chemical variation within Unit 4 is addressed by examining plots of data versus stratigraphic level. At MDA-P, perfectly horizontal attitudes for units of the Tshirege Member are a fortunate consequence of geologic structure, allowing the equation of stratigraphic level to sample elevation. From plots of data versus sample elevation, recognizable chemical excursions are attributed to analytical errors, hydrologically transmissive zones and extreme chemical mobility, extreme weathering, and contamination from anthropogenic activities at MDA-P. On the other hand, no differences in general chemistry were recognized that could be attrib,uted to rock alteration (glassy versus vitric ), general weathering, or to burial (exposed tuff versus tuff covered with soil).
The data contained in this report, taken together with the results of previously reported background studies for MDA-P, indicate that wind-borne contamination is widespread from burning pits located south of the waste pile at MDA-P. Near this contaminating source, both amounts of HN03-leachable Ba and fractions of HN03-leachable Ba relative to total Ba are highly enriched in both soil and bedrock. Near source, both amounts and relative fractions of HN03-leachable Pb and Ag are also significantly enriched in soils, and either amounts or relative fractions of HN03-leachable U, Cu, and Ca are significantly enriched. Farther from the source, background soil samples show the same enrichment patterns for Ba, Pb, and U, indicating widespread wind-borne contamination for these elements .
1.0. INTRODUCTION
This report provides "baseline" geochemistry for soils (including fill), and for bedrock within three specific areas that are planned for use in the remediation of Material Disposal Area P (MDA-P) at Technical Area 16 (TA-16). The baseline chemistry includes leachable element concentrations for both soils and bedrock and total element concentrations for all soil samples and for two selected bedrock samples. Bedrock near MDA-P consists of Units 3 through 5 of the Tshirege Member of the Bandelier Tuff. Petrographic analyses for selected samples of this bedrock provide important supplementary data that allow recognition of unusual and pronounced geochemical zonation inherent within Unit 4. This large, naturally occurring intraunit variation must be recognized to accurately ·assess the cause for chemical variations among samples of Unit 4.
MDA-P operated from the early 1950s to 1984 as a landfill for rubble and debris generated by the burning of high explosives (HE) at the TA-16 Burning Ground, HE-contaminated equipment and material, barium nitrate sand, building materials, and trash (Los Alamos National Laboratory: Technical Area 16, Material Disposal Area P Closure Plan, Revision 0, February 1995). Previous reports provided "background" geochemistry for soils and colluvium (McDonald et al., 1996) and for bedrock (Broxton et al., 1996) to characterize the region surrounding MDA-P. The background geochemistry was obtained from sample locations that avoided known sources of contamination. In contrast, contamination is expected for the two sites near the TA-16 Burning Ground sampled for this report.
The aim of this report is to establish causes for recognizable chemical differences between the background and baseline data sets. In many cases, we conclude that recognizable differences represent natural enrichments. In other cases, differences are best attributed to analytical problems. But most importantly, the comparison of background and baseline geochemistry demonstrates significant contamination for several elements not only at the two remedial sites near the TA-16 Burning Ground, but also within the entire region of the background study. This contamination is highly localized very near to the surface in soil and fill, and probably also in bedrock; consequently, upper tolerance limits (UTLs) calculated as upper 95% confidence limits of the 95th percentile are of little value and thus are not provided. This report instead provides basic statistical summaries and graphical comparisons for background and baseline samples to guide strategies for remediation of the three sites to be used in the restoration of MDA-P.
2.0. SAMPLING SITES AND FIELD METHODS
During November and December, 1995, 18 samples of soil and 23 samples of bedrock tuff were collected for baseline study from 3 sites planned for use during the remediation of MDA-P (Table 1; Fig~. 1, 2, and 3). Soil within the Segregation Area and fill within the Decontamination Pad were sampled from hand-excavated soil pits, and fill within the Staging area was sampled from holes excavated using a soil-bucket auger. Soils and fill were sampled vertically by genetic horizon or layer with a single, representative bulk sample of approximately 1 to 2 kilograms (kg) collected for each horizon. Depths and numbers of individual soil horizons or layers sampled varied among sample sites. Soil was continuously sampled between the surface (excluding 0 horizons) to the top of the underlying tuff (depths varied from 4 to 37 em) within the Segregation Area and Decontamination Pad. Fill was sampled from selected 10- to 15-cm intervals within 62 to 112 em of the surface within the Staging area.
2
.. I
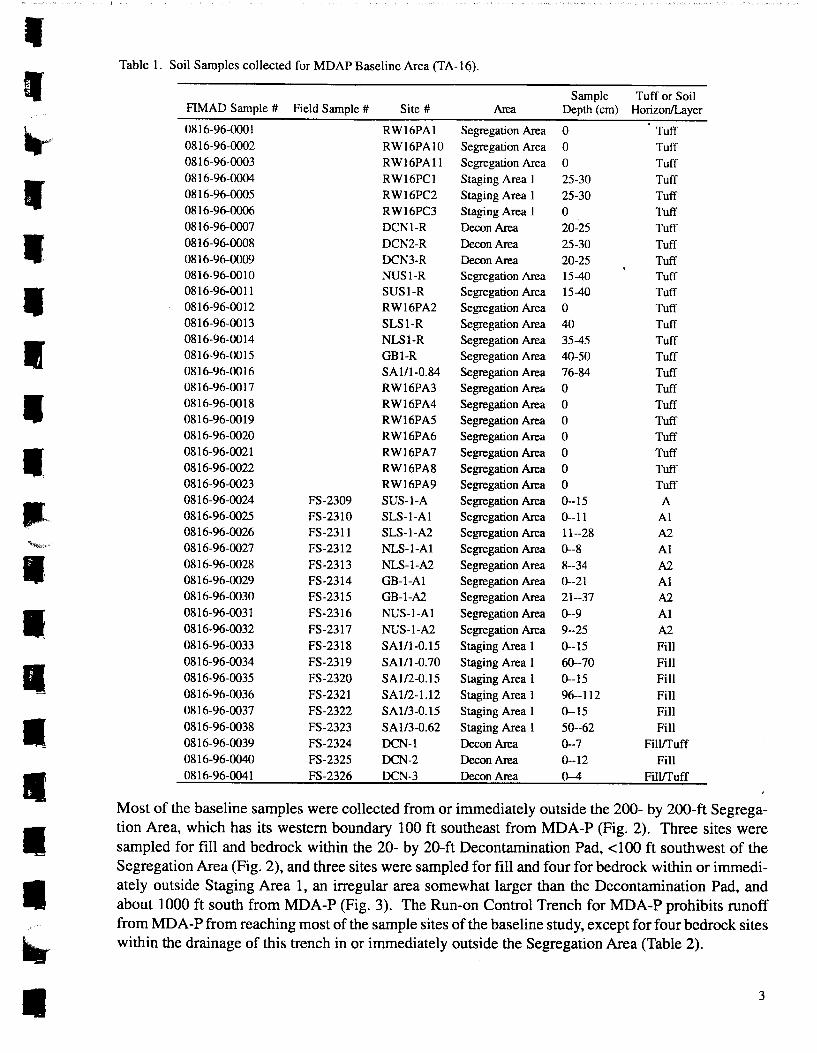
' Table 1. Soil Samples collected for MDAP Baseline Area (TA-16).
' Sample Tuff or Soil FIMAD Sample # Field Sample # Site# Area Depth (em) Horizon/Layer
~c 0816-96-0001 RW16PA1 Segregation Area 0 Tuff 0816-96-0002 RW16PA10 Segregation Area 0 Tuff 0816-96-0003 RW16PA11 Segregation Area 0 Tuff
' 0816-96-0004 RW16PC1 Staging Area 1 25-30 Tuff 0816-96-0005 RW16PC2 Staging Area 1 25-30 Tuff 0816-96-0006 RW16PC3 Staging Area 1 0 Tuff 0816-96-0007 DCN1-R Decon Area 20-25 Tuff • 0816-96-0008 DCN2-R DeconArea 25-30 Tuff 0816-96-0009 DCN3-R DeconArea 20-25 Tuff 0816-96-0010 NUSI-R Segregation Area 15-40 Tuff
• 0816-96-0011 SUS1-R Segregation Area 15-40 Tuff 0816-96-0012 RW16PA2 Segregation Area 0 Tuff 0816-96-0013 SLS1-R Segregation Area 40 Tuff
I 0816-96-0014 NLS1-R Segregation Area 35-45 Tuff 0816-96-0015 GB1-R Segregation Area 40-50 Tuff 0816-96-0016 SA111-0.84 Segregation Area 76-84 Tuff 0816-96-0017 RW16PA3 Segregation Area 0 Tuff
' 0816-96-0018 RW16PA4 Segregation Area 0 Tuff 0816-96-0019 RW16PA5 Segregation Area 0 Tuff 0816-96-0020 RW16PA6 Segregation Area 0 Tuff
• 0816-96-0021 RW16PA7 Segregation Area 0 Tuff 0816-96-0022 RW16PA8 Segregation Area 0 Tuff 0816-96-0023 RW16PA9 Segregation Area 0 Tuff
ll 0816-96-0024 FS-2309 SUS-1-A Segregation Area 0--15 A 0816-96-0025 FS-2310 SLS-1-A1 Segregation Area 0--11 A1 0816-96-0026 FS-2311 SLS-1-A2 Segregation Area 11--28 A2
"'<t~~ 0816-96-0027 FS-2312 NLS-1-A1 Segregation Area 0--8 A1
•• 0816-96-0028 FS-2313 NLS-1-A2 Segregation Area 8--34 A2 0816-96-0029 FS-2314 GB-1-A1 Segregation Area 0--21 A1 0816-96-0030 FS-2315 GB-1-A2 Segregation Area 21--37 A2
I 0816-96-0031 FS-2316 NUS-1-A1 Segregation Area 0--9 A1 0816-96-0032 FS-2317 NUS-1-A2 Segregation Area 9--25 A2 0816-96-0033 FS-2318 SA111-0.15 Staging Area 1 0--15 Fill
I 0816-96-0034 FS-2319 SA111-0.70 Staging Area 1 60--70 Fill 0816-96-0035 FS-2320 SAl/2-0.15 Staging Area 1 0--15 Fill 0816-96-0036 FS-2321 SA112-1.12 Staging Area 1 96--112 Fill 0816-96-0037 FS-2322 SA1/3-0.15 Staging Area 1 0--15 Fill
• 0816-96-0038 FS-2323 SA1/3-0.62 Staging Area 1 50--62 Fill 0816-96-0039 FS-2324 DCN-1 DeconArea 0--7 Fill/Tuff 0816-96-0040 FS-2325 DCN-2 DeconArea 0--12 Fill
• 0816-96-0041 FS-2326 DCN-3 DeconArea 0--4 Fill/Tuff
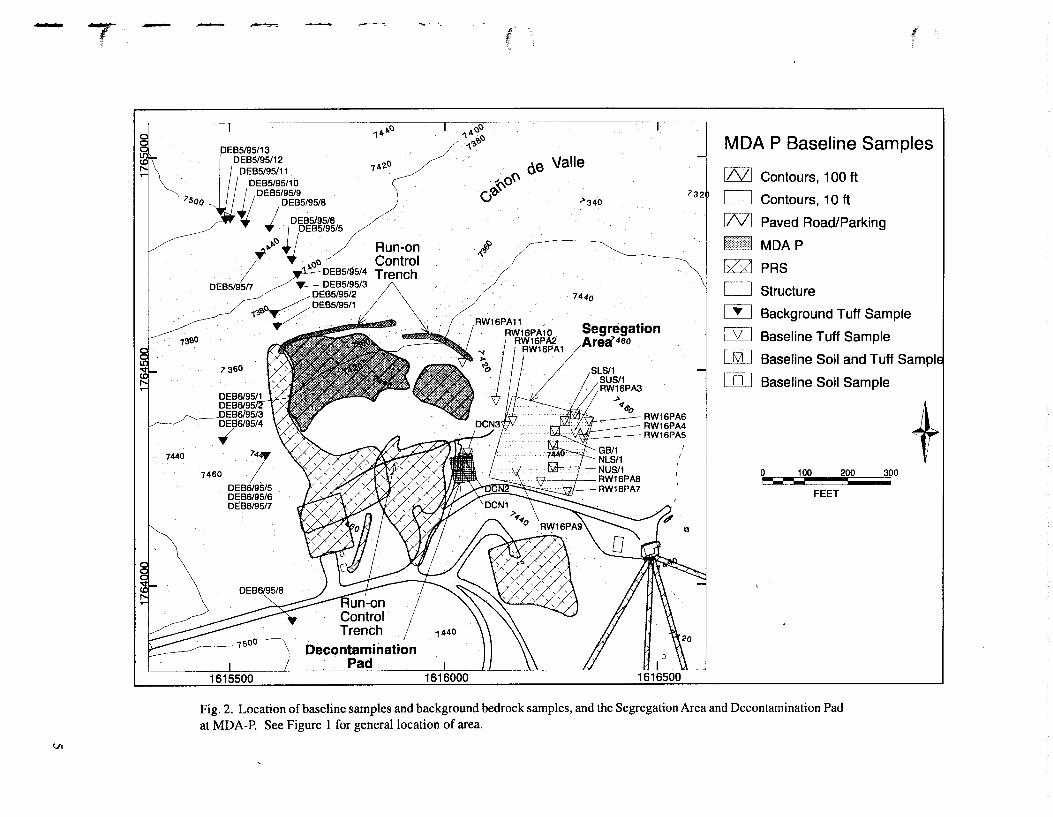
Most of the baseline samples were collected from or immediately outside the 200- by 200-ft Segrega-
I tion Area, which has its western boundary 100ft southeast from MDA-P (Fig. 2). Three sites were sampled for fill and bedrock within the 20- by 20-ft Decontamination Pad, <100ft southwest of the Segregation Area (Fig. 2), and three sites were sampled for fill and four for bedrock within or immedi-
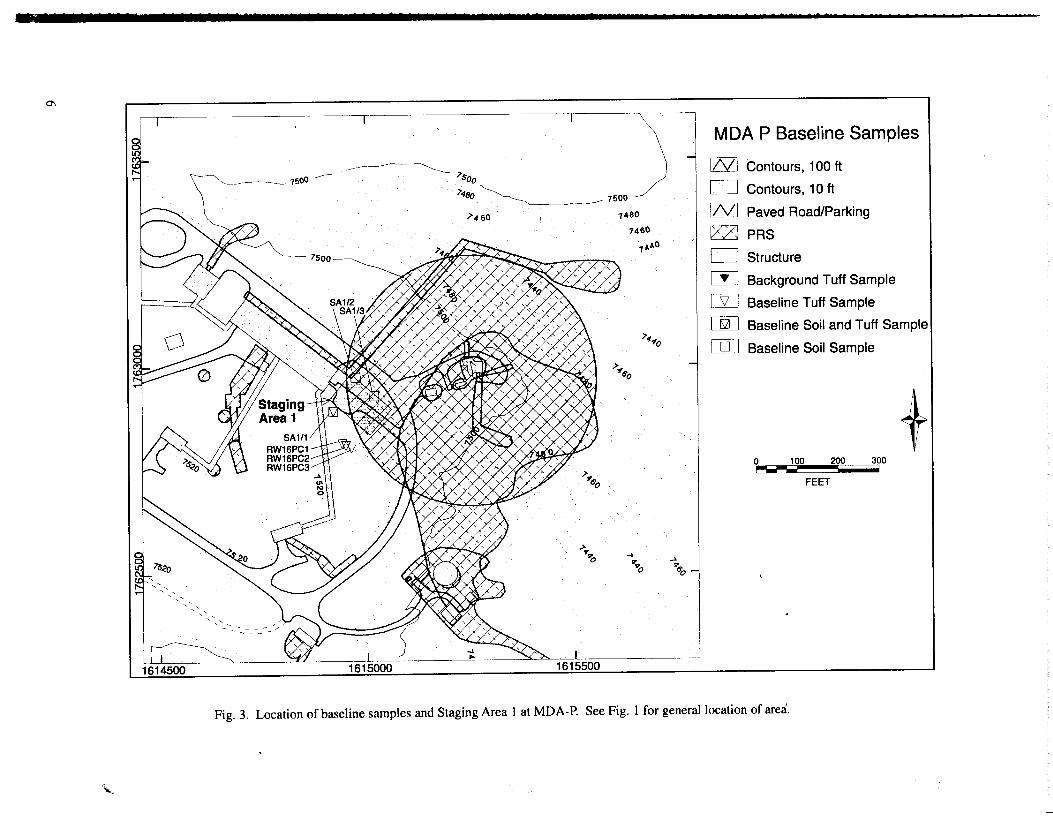
• ately outside Staging Area 1, an irregular area somewhat larger than the Decontamination Pad, and about 1000 ft south from MDA-P (Fig. 3). The Run-on Control Trench for MDA-P prohibits runoff from MDA-P from reaching most of the sample sites of the baseline study, except for four bedrock sites
a. within the drainage of this trench in or immediately outside the Segregation Area (Table 2).
• 3
4
i-·-·-. J I L.l
:·l :--·_] .I I ·-·-·-·-·-·_j
. I I .
j LOS ALAMOS COUNTY ~--. ·-··-·-·-. .
I I
I
I
I
I
I
I
I
/i
Nation a F o r e
~MDA-P
~ Segregation Area and Decontamination Pad
I
sIt
I
0 1 2
~--MILES
FIMAD G105354 03 Jan 97
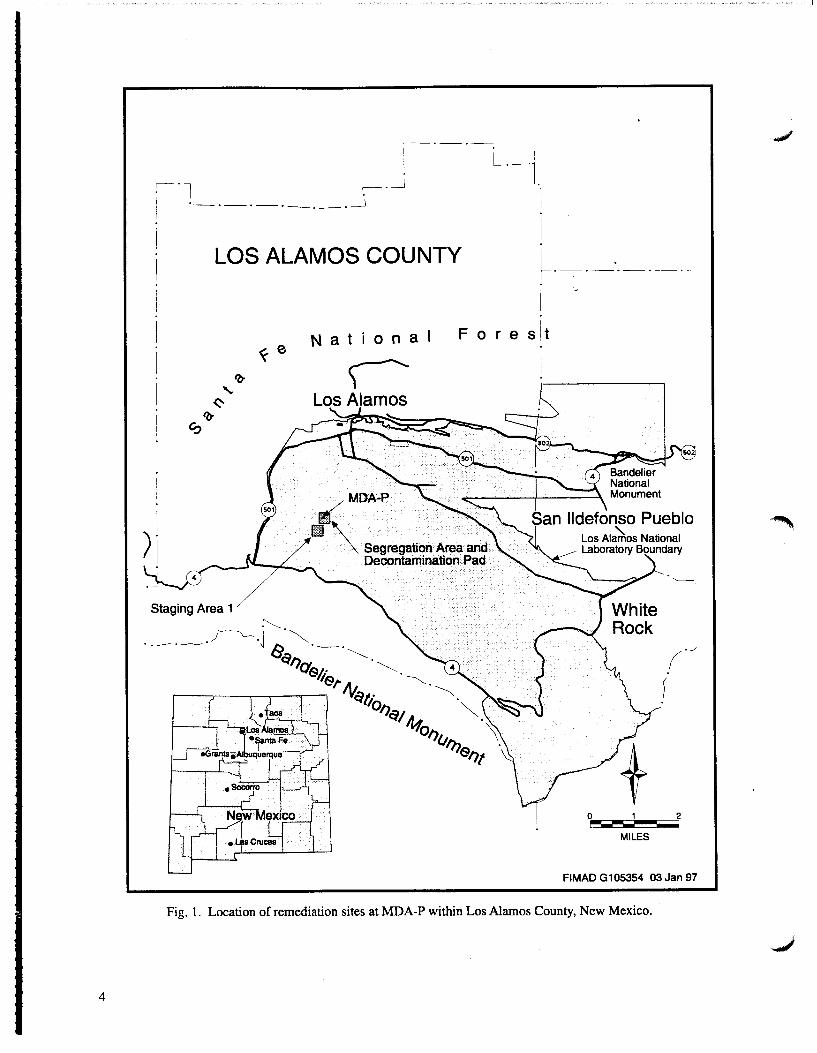
Fig. 1. Location of remediation sites at MDA-P within Los Alamos County, New Mexico.
- 7
Ul
- _...,..., .. --""!
14~0
74'2.0
DEB5/95/10
-· ._
"' ae Valle
k (
MDA P Baseline Samples
CZSZJ Contours, 100ft
7soo J DEB5/95/9
DEB5/95/8 11 I DEB5/95/6/
~0'' v'lf
>340 c:::J Contours, 1 0 ft
7440
~· ,.,J[~' I~. ~o DEB5/!i5/4
. _ DEB5/95/3 DEB5/95/7 "' DEB5/95/2
~ DEB5/95/1 1~ov
Run-on Control Trench
,_#
INI Paved Road/Parking
MDAP
[ll PRS
744o c:::J Structure
m Background Tuff Sample Segr_egation
460 . W Baseline Tuff Sample
7360 CETI Baseline Soil and Tuff Sampl
7460
Decontamination Pad
1616000
I
I
II
[OJ Baseline Soil Sample
I 0 100 200 300
!"'!'.. ... -FEET
Fig. 2. Location of baseline samples and background bedrock samples, and the Segregation Area and Decontamination Pad at MDA-P. See Figure l for general location of area. '
+
0\ ,,
'
T
~7500---- >soo 74Bo
)'4 so
---~7500
>v 6'o
7480
7460
7,.e.o
7.,.,0
>,-6'0
MDA P Baseline Samples
[ZQ] Contours, 100 ft
D Contours, 10 ft
INI Paved Road/Parking
lZZJ PAS
D Structure
CYJ Background Tuff Sample
[3[] Baseline Tuff Sample
[&[] Baseline Soil and Tuff Sample
05J Baseline Soil Sample
+ 0 100 200 300
~- FEET
Fig. 3. Location of baseline samples and Staging Area 1 at MDA-P. See Fig. 1 for general location of area'.
• II
--· • •• •• • • • • • • • .
• •
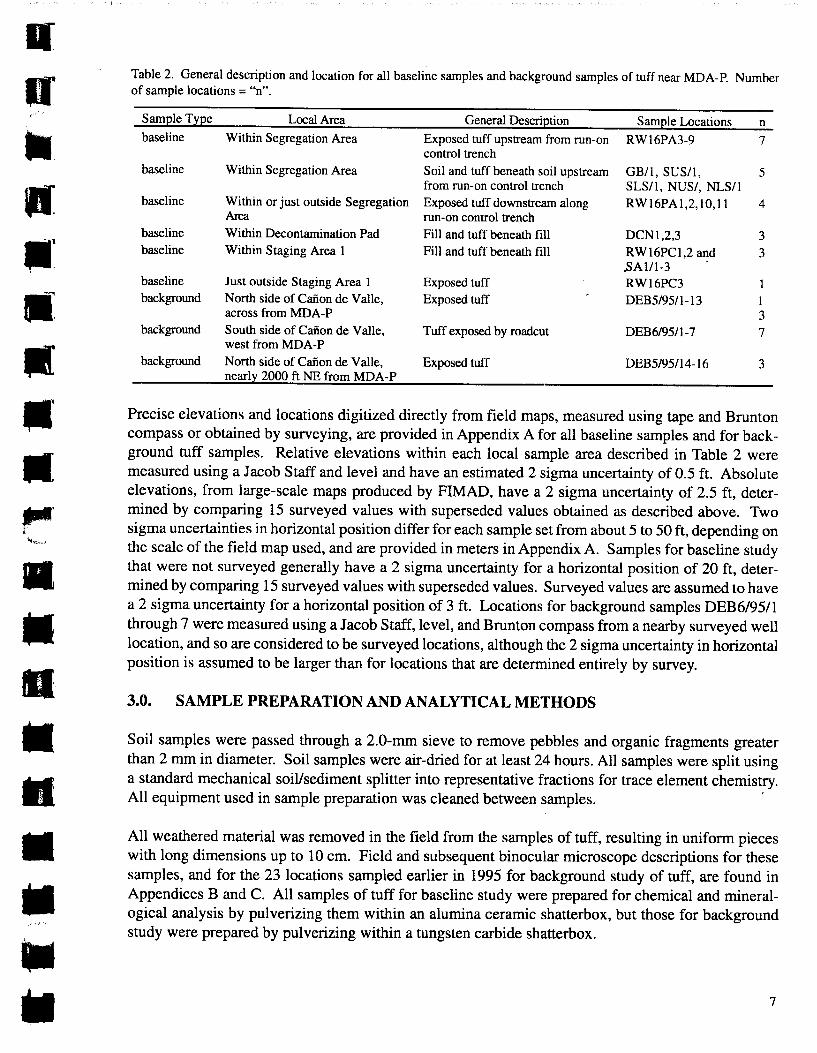
Table 2. General description and location for all baseline samples and background samples of tuff near MDA-P. Number of sample locations= "n".
SamEleT~Ee Local Area General DescriEtion SamEle Locations n baseline Within Segregation Area Exposed tuff upstream from run-on RW16PA3-9 7
control trench baseline Within Segregation Area Soil and tuff beneath soil upstream GB/1, SUS/1, 5
from run-on control trench SLS/1, NUS/, NLS/1 baseline Within or just outside Segregation Exposed tuff downstream along RW16PA1,2,10,11 4
Area run-on control trench baseline Within Decontamination Pad Fill and tuff beneath fill DCN1,2,3 3 baseline Within Staging Area 1 Fill and tuff beneath fill RW16PC1,2 and 3
,SAl/1-3 baseline Just outside Staging Area I Exposed tuff RWI6PC3 1 background North side of Caiion de Valle, Exposed tuff DEB5/95/l-13 1
across from MDA-P 3 background South side of Caiion de Valle, Tuff exposed by roadcut DEB6/95/l-7 7
west from MDA-P background North side of Caiion de Valle, Exposed tuff DEB5/95/14-16 3
nearl~ 2000 ft NE from MDA-P
Precise elevations and locations digitized directly from field maps, measured using tape and Brunton compass or obtained by surveying, are provided in Appendix A for all baseline samples and for background tuff samples. Relative elevations within each local sample area described in Table 2 were measured using a Jacob Staff and level and have an estimated 2 sigma uncertainty of 0.5 ft. Absolute elevations, from large-scale maps produced by FIMAD, have a 2 sigma uncertainty of 2.5 ft, determined by comparing 15 surveyed values with superseded values obtained as described above. Two sigma uncertainties in horizontal position differ for each sample set from about 5 to 50ft, depending on the scale of the field map used, and are provided in meters in Appendix A. Samples for baseline study that were not surveyed generally have a 2 sigma uncertainty for a horizontal position of 20ft, determined by comparing 15 surveyed values with superseded values. Surveyed values are assumed to have a 2 sigma uncertainty for a horizontal position of 3 ft. Locations for background samples DEB6/9511 through 7 were measured using a Jacob Staff, level, and Brunton compass from a nearby surveyed well location, and so are considered to be surveyed locations, although the 2 sigma uncertainty in horizontal position is assumed to be larger than for locations that are determined entirely by survey .
3.0. SAMPLE PREPARATION AND ANALYTICAL METHODS
Soil samples were passed through a 2.0-rnrn sieve to remove pebbles and organic fragments greater than 2 rnrn in diameter. Soil samples were air-dried for at least 24 hours. All samples were split using a standard mechanical soil/sediment splitter into representative fractions for trace element chemistry . All equipment used in sample preparation was cleaned between samples. '
All weathered material was removed in the field from the samples of tuff, resulting in uniform pieces with long dimensions up to 10 ern. Field and subsequent binocular microscope descriptions for these samples, and for the 23 locations sampled earlier in 1995 for background study of tuff, are found in Appendices B and C. All samples of tuff for baseline study were prepared for chemical and mineralogical analysis by pulverizing them within an alumina ceramic shatterbox, but those for background study were prepared by pulverizing within a tungsten carbide shatterbox .
7

Concentrations of trace elements were analyzed using two sample digestion methods:
(1) Total element concentrations extracted from the complete digestion of soil material using concentrated hydrofluoric acid (HF). This method was applied only for soil samples.
(2) Partial element concentrations extracted from the partial digestion of soil and bedrock using concentrated nitric acid (HN03) at pH 1 (EPA Method 3050A; EPA, 1986).
The HN03 digestion method (also referred to as HN03-leachable) is used for estimating the bioavailabilty of elements, information required for performing risk analyses, by approximating the partial dissolution of soil particles and particle coatings, including clay minerals, ferric ( oxy)hydroxides, and calcium carbonate, that might occur in a low-pH environment inside the human gastrointestinal system (LANL unpubl.; EPA, 1986). Unless analyses are erroneous or differences are within analytical uncertainties, element concentrations from partial digestion techniques must be less than the total element concentrations obtained using HF extraction or X -ray fluorescence.
Trace element chemistry was determined using EPA-SW846 analytical methods (Table 3), which are described in detail in EPA ( 1986), Gautier and Gladney ( 1986), and Gladney et al. ( 1980, 1981 ). Concentrations were measured for 28leachable elements: Ag, AI, As, Ba, Be, Ca, Cd, CI-, Co, Cr, Cu, Fe, Hg, K, Mg, Mn, Na, Ni, Pb, Sb, Se, S042-, Ta, Th, Tl, U, V, and Zn. Except for CI-, Hg, S042-, total concentrations were also measured for these same elements. Radioactive isotopes were not analyzed in this investigation, although gross alpha and beta activities were measured for all bedrock samples. Quality control samples, including duplicates and spiked samples, were analyzed at frequencies speci-fied by the EPA (1986). ~.
Table 3. Summary of analytical techniques used for chemical characterization of elements in area near MDA-P. Techniques are IC =ion chromatography; ES =inductively coupled plasma emission spectroscopy; EV =electrothermal vapor atomic absorption spectroscopy; MS =inductively coupled plasma mass spectrometry; CV =cold vapor atomic absorption spectroscopy; GF = graphite furnace absorption spectroscopy. Detection limits are in ppm; multiple values for the same technique indicate different limits for different datasets. No values are provided for all analyses that are above detection limits. Datasets are 1 = baseline soil; 2 = baseline bedrock; 3 = background soil; 4 = background bedrock.
El Tech Ag MS Ag ES AI ES As ES As EV As GF Ba ES Be ES Ca ES Cd MS Cd ES Cl IC Co ES Cr ES Cu ES Fe ES Hg cv K ES
8
Det
0.1 0.1, 0.4
0.1 0.1, 0.2
0.6
0.02
Sets
2, 3,4 all
1, 2 3 4
all all all
1, 3 2, 4
1, 2, 4 all all all all
1, 2 all
El Tech Mg ES Mn ES Na ES Ni ES Pb MS Pb ES Sb MS Sb ES Se GF Se ES
so4 IC Ta MS Tl MS Tl ES Th MS u MS v ES Zn ES
Det
0.1 3.3
0.2 0.2
0.1 0.1 0.2
Sets all all all all
1, 3,4 2
I, 3, 4 2 4
1, 2, 3 1, 2, 4
1, 3 1, 3, 4
2 all all all all
~
• • llr
• • • • •• • ,...
• •
•
Sample digestion and analyses were performed by Rust-Geotech, Grand Junction Projects Office Analytical Laboratory, Grand Junction, Colorado. Complete documentation of analytical results from Rust-Geotech is reported under request number LANL 1859 and Project numb~rs 6LA414623 and 6LA414624 for soils, and request number LANL 1794 and Project number 6LA414541 for bedrock. Analytical results are reported in Appendices D, E, and F.
Two samples collected for baseline study were analyzed for total element contents by X-ray fluorescence (Appendix G) and for bulk mineralogy by X-ray diffraction (Appendix H), following methods described in Broxton et al. (1996). Samples of individual pumices collected at site DEB6/95/8 during background sampling were not chemically analyzed but are described in appendices in case they might be useful for future work .
Comparisons between analytical datasets relevant to this study suggest analytical errors for elements in some datasets. Elements with clear or probable analytical errors include As, Cd, Tl, Na, K, and gross alpha. These problems are discussed below, where such problems must be addressed to define the nature of chemical trends within bedrock samples.
4.0. DESCRIPTION OF SOILS NEAR MDA-P AND A STATISTICAL APPROACH FOR ANALYSIS OF RESULTS
4.1. Soil and Colluvium Stratigraphy
Soils within the Segregation Area are generally undisturbed, shallow (<50 em), and consist of simple A to R horizon soil profiles. Both A horizons (Table 1) and underlying bedrock were sampled at each site. The bedrock samples are described in the section below. Total sampled soil A horizon thickness ranges from 15 to 37 em. A horizons are surface and near-surface soil layers that are strongly influenced by the accumulation of organic matter and by biologic activity (e.g., plant roots). A horizons near MDA-P generally have sandy-loam textures with clay-sized material ( < 2 micrometers) ranging from 5.4% to 20.5% by weight (McDonald et al., 1996). The A horizons of soils on north-facing slopes are covered by an 0 horizon that ranges in thickness from 2 to 4 em. 0 horizons on south-facing slopes range in thickness from 0 to 3 em. 0 horizons are layers that largely consist of solid organic matter composed of forest litter for the most part. 0 horizons were not sampled as part of this baseline investigation.
R horizons are common in soils formed on slopes along drainages cut into the Bandelier Tuff . R horizons near MDA-P consist of weakly weathered and highly fractured Units 3 to 5 of the Tshirege Member of the Bandelier Tuff. R horizons near MDA-P differ from the local bedrock in that R horizons are usually more fractured than the underlying Tshirege Member, may show signs of incipi~nt weathering, and contain abundant soil matrix along fractures. Although this horizon was sampled in the bottom of all baseline soil pits, all weathered material was removed from bedrock during sample collection so that samples from the bottom of baseline soil pits represent bedrock and not R horizon.
The soil cover within the Decontamination Pad and Staging Area has been disrupted by site modifications. The soil cover mainly consists of a mixture of undifferentiated fill, probably derived from local soils, and rubble derived from Units 4 and 5 of the Tshirege Member.
9
4.2. Statistical Analysis of Soil Horizons
The mean, standard deviation, maximum, and minimum values for each analyte \Yere determined for each of three baseline areas. Separate values are calculated for each baseline area as a result of varia- """""'' tions in the composition of the soil (i.e., disrupted or nondisrupted) and proximity to the MDA-P burning ground and landfill site. The Decontamination Pad and Segregation Area are in close proxim-ity to MDA-P, but the Staging Area is several hundred meters away.
Upper tolerance limit (UTL) values for inorganic analytes are not calculated for these samples for two reasons. First, better background screening layers (BSL) exist based on soil background studies conducted at MDA-P (McDonald et al., 1996) and Laboratory wide (Longmire et al., 1997). Second, initial analysis of analyte data indicates that contamination of several Qf the soils had probably occurred (discussed more below); therefore, calculating UTL values for these soil samples would be inaccurate and potentially misleading. Analyte results from baseline soils are instead compared to existing background screening values for soils. Background screening values are calculated for each analyte for individual soil horizons (i.e., A, B, C, R) and for combined soil horizons (all soil background data) by using either UTLs or the maximum reported values for infrequently detected analytes or sparsely sampled soil horizons. Separate background values have been calculated for the acid leachable results and the total sample results of each inorganic chemical.
4.3. Background Screening Value Data Sets Used for Soils
Background screening level data sets were selected based on established guidelines for the application of LANL background data (Ryti, et al., 1996). Baseline soil acid-leachable results from the Segrega- """"' tion area are compared with background screening values calculated for (1) site-specific MDA-P soil A horizons and (2) Laboratory-wide combined soil horizons. Baseline soil acid leachable results from the Staging Area and Decontamination Pad are compared with background screening values calculated for (1) site-specific MDA-P combined soil horizons and (2) Laboratory-wide combined soil horizons.
Total sample results from the Segregation Area are compared with background screening values calculated for (1) site-specific MDA-P soil A horizons and (2) MDA-P combined soil horizons. Total sample results from the Staging Area and Decontamination Pad are compared with background screening values calculated for (1) site-specific MDA-P combined soil horizons and (2) MDA-P combined soil horizons. Background screening values have not been calculated for Laboratory-wide combined soils horizons.
5.0. RESULTS AND DISCUSSION FOR SOILS
Tables 4 through 9 contain results for leachable (HN03 sample digestion) and total soil (HF digestion) inorganic analytes measured in each MDA-P baseline soil sample collected from the Decontamination Pad, and Segregation and Staging Areas, as well as a statistical summary of these analyses. Tables 10 and 11 summarize means, standard deviations, minima, and maxima for both acid-leachable and total analytes for each of the three baseline areas and provide a summary of background screening levels.
5.1. Distribution of Ba, Cu, Hg, and Zn in Soils
Soil concentrations ofHN03-leachable Ba, Cu, Hg, and Zn are important because the MDA-P waste-pile contains debris that has concentrations of these metals that are significantly above background
10
_,1
' I
•• ~ ~- II II II 111 ·- II ' • .. • • • .. 6/lf . - ..
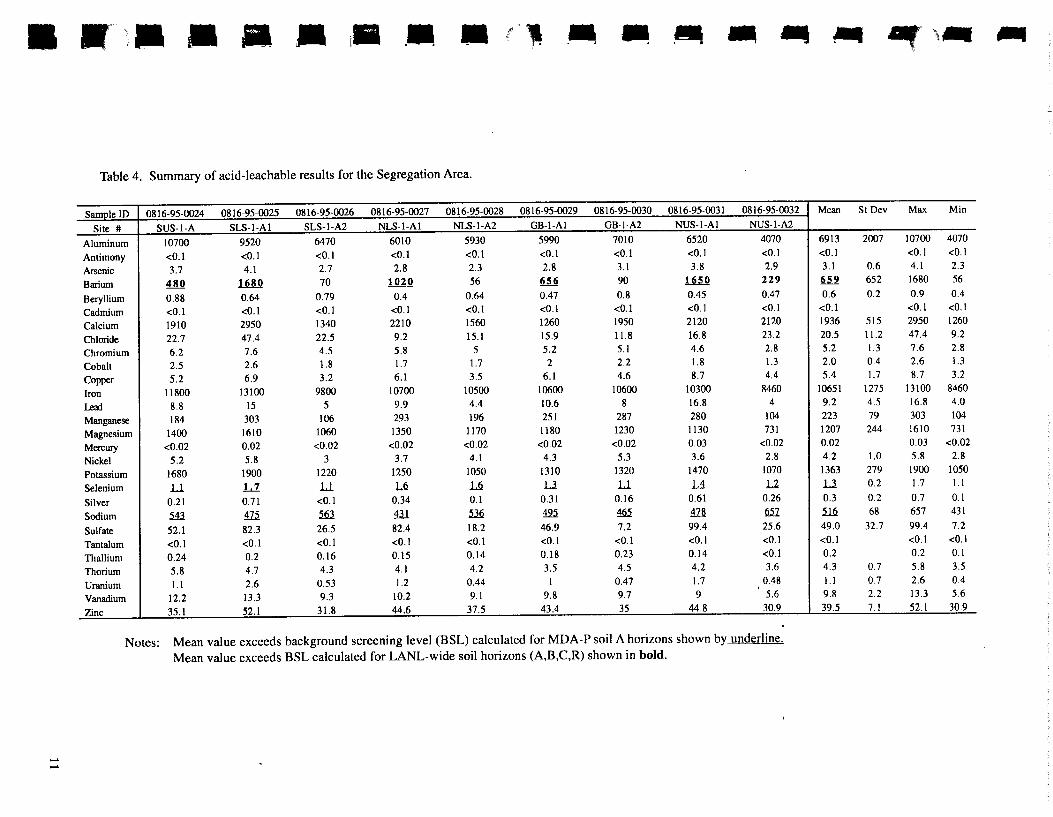
Table 4. Summary of acid-leachable results for the Segregation Area.
Sample ID 0816-95-0024 0816-95-0025 0816-95-0026 0816-95-0027 0816-95-0028 0816-95-0029 0816-95-0030 0816-95-0031 0816-95-0032 Mean St Dev Max Min
Site # SUS-1-A SLS-1-A1 SLS-1-A2 NLS-1-A1 NLS-1-A2 GB-1-A1 GB-I-A2 NUS-1-A1 NUS-1-A2
Aluminum 10700 9520 6470 6010 5930 5990 7010 6520 4070 6913 2007 10700 4070
Antimony <0.1 <0.1 <0.1 <0.1 <0.1 <0.1 <0.1 <0.1 <0.1 <0.1 <0.1 <0.1
Arsenic 3.7 4.1 2.7 2.8 2.3 2.8 3.1 3.8 2.9 3.1 0.6 4.1 2.3
Barium ~ 1680 70 1020 56 656 90 1650 229 ~ 652 1680 56
Beryllium 0.88 0.64 0.79 0.4 0.64 0.47 0.8 0.45 0.47 0.6 0.2 0.9 0.4
Cadmium <0.1 <0.1 <0.1 <0.1 <0.1 <0.1 <0.1 <0.1 <0.1 <0.1 <0.1 <0.1
Calcium 1910 2950 1340 2210 1560 1260 1950 2120 2120 1936 515 2950 1260
Chloride 22.7 47.4 22.5 9.2 15.1 15.9 11.8 16.8 23.2 20.5 11.2 47.4 9.2
Chromium 6.2 7.6 4.5 5.8 5 5.2 5.1 4.6 2.8 5.2 1.3 7.6 2.8
Cobalt 2.5 2.6 1.8 1.7 1.7 2 2.2 1.8 1.3 2.0 0.4 2.6 1.3
Copper 5.2 6.9 3.2 6.1 3.5 6.1 4.6 8.7 4.4 5.4 1.7 8.7 3.2
Iron 11800 13100 9800 10700 10500 10600 10600 10300 8460 10651 1275 13100 8460
Leal 8.8 15 5 9.9 4.4 10.6 8 16.8 4 9.2 4.5 16.8 4.0
Manganese 184 303 106 293 196 251 287 280 104 223 79 303 104
Magnesium 1400 1610 1060 1350 1170 1180 1230 1130 731 1207 244 1610 731
Mercury <0.02 0.02 <0.02 <0.02 <0.02 <0.02 <0.02 0.03 <0.02 0.02 0.03 <0.02
Nickel 5.2 5.8 3 3.7 4.1 4.3 5.3 3.6 2.8 4.2 1.0 5.8 2.8
Potassium 1680 1900 1220 1250 1050 1310 1320 1470 1070 1363 279 1900 1050
Selenium l.l L1 Ll u. u. .1...3. l.l lA u 1...3. 0.2 1.7 1.1
Silver 0.21 0.71 <0.1 0.34 0.1 0.31 0.16 0.61 0.26 0.3 0.2 0.7 0.1
Sodium lli. ill. ill. ill ~ 12.5. ID lli ~ lli 68 657 431
Sulfate 52.1 82.3 26.5 82.4 18.2 46.9 7.2 99.4 25.6 49.0 32.7 99.4 7.2
Tantalum <0.1 <0.1 <0.1 <0.1 <0.1 <0.1 <0.1 <0.1 <0.1 <0.1 <0.1 <0.1
Thallium 0.24 0.2 0.16 0.15 0.14 0.18 0.23 0.14 <0.1 0.2 0.2 0.1
Thorium 5.8 4.7 4.3 4.1 4.2 3.5 4.5 4.2 3.6 4.3 0.7 5.8 3.5
Uranium 1.1 2.6 0.53 1.2 0.44 I 0.47 1.7 0.48 1.1 0.7 2.6 0.4 I
Vanadium 12.2 13.3 9.3 10.2 9.1 9.8 9.7 9 5.6 9.8 2.2 13.3 5.6
Zinc 35.1 52.1 ----31.8 44.6 37.5 43.4 35 44.8 30.9
------__12.5 7.1 52.1 30.9
---~·
Notes: Mean value exceeds background screening level (BSL) calculated for MDA-P soil A horizons shown by underline.
Mean value exceeds BSL calculated for LANL-wide soil horizons (A,B,C,R) shown in bold.
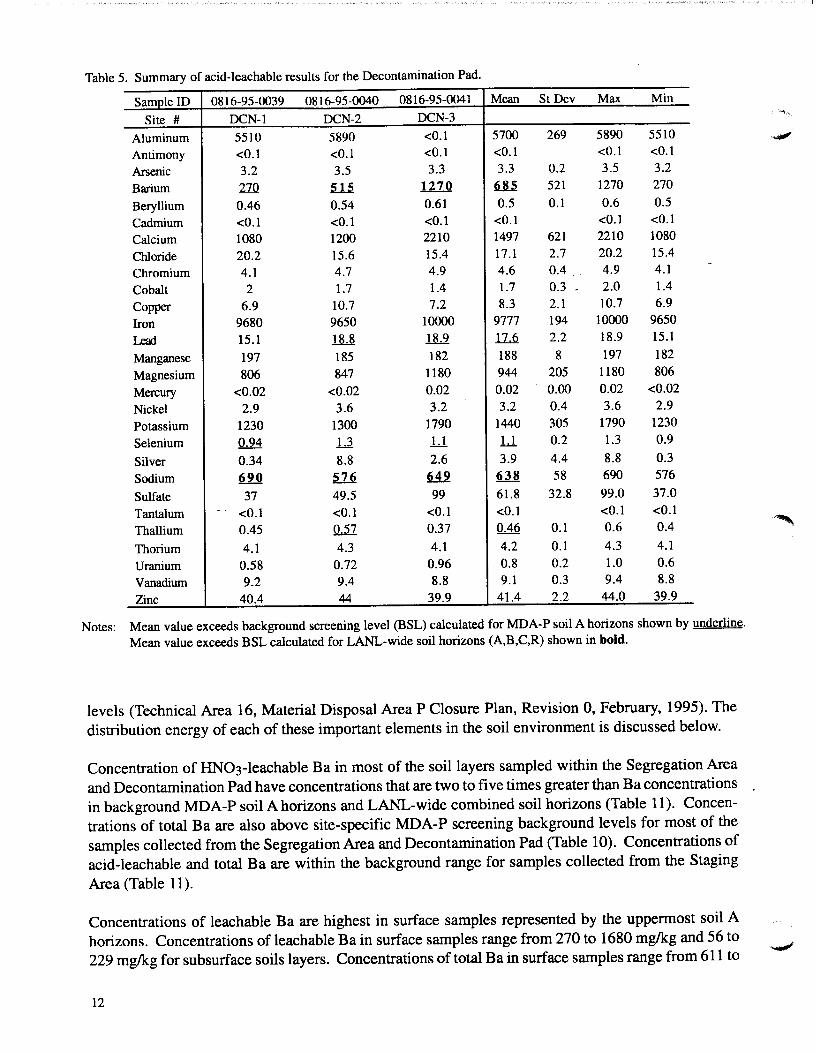
Table 5. Summary of acid-leachable results for the Decontamination Pad.
Sample ID 0816-95-0039 0816-95-0040 0816-95-0041 Mean St Dev Max Min
Site # DCN-1 DCN-2 DCN-3
Aluminum 5510 5890 <0.1 5700 269 5890 5510
Antimony <0.1 <0.1 <0.1 <0.1 <0.1 <0.1
Arsenic 3.2 3.5 3.3 3.3 0.2 3.5 3.2
Barium 210 ~ 1270 685 521 1270 270
Beryllium 0.46 0.54 0.61 0.5 0.1 0.6 0.5
Cadmium <0.1 <0.1 <0.1 <0.1 <0.1 <0.1
Calcium 1080 1200 2210 1497 621 2210 1080
Chloride 20.2 15.6 15.4 17.1 2.7 20.2 15.4
Chromium 4.1 4.7 4.9 4.6 0.4 4.9 4.1
Cobalt 2 1.7 1.4 1.7 0.3 - 2.0 1.4
Copper 6.9 10.7 7.2 8.3 2.1 10.7 6.9
Iron 9680 9650 10000 9777 194 10000 9650
Lead 15.1 .l.U ll..2 11....6 2.2 18.9 15.1
Manganese 197 185 182 188 8 197 182
Magnesium 806 847 1180 944 205 1180 806
Mercury <0.02 <0.02 0.02 0.02 0.00 0.02 <0.02
Nickel 2.9 3.6 3.2 3.2 0.4 3.6 2.9
Potassium 1230 1300 1790 1440 305 1790 1230
Selenium 0.94 .u. .L.l .L.l 0.2 1.3 0.9
Silver 0.34 8.8 2.6 3.9 4.4 8.8 0.3
Sodium 690 576 649 638 58 690 576
Sulfate 37 49.5 99 61.8 32.8 99.0 37.0
Tantalum - <0.1 <0.1 <0.1 <0.1 <0.1 <0.1
Thallium 0.45 0.57 0.37 0.46 0.1 0.6 0.4
Thorium 4.1 4.3 4.1 4.2 0.1 4.3 4.1
Uranium 0.58 0.72 0.96 0.8 0.2 1.0 0.6
Vanadium 9.2 9.4 8.8 9.1 0.3 9.4 8.8
Zinc 40.4 44 39.9 41.4 2.2 44.0 39.9
Notes: Mean value exceeds background screening level (BSL) calculated for MDA-P soil A horizons shown by underline.
Mean value exceeds BSL calculated for LANL-wide soil horizons (A,B,C,R) shown in bold.
levels (Technical Area 16, Material Disposal Area P Closure Plan, Revision 0, February, 1995). The
distribution energy of each of these important elements in the soil environment is discussed below.
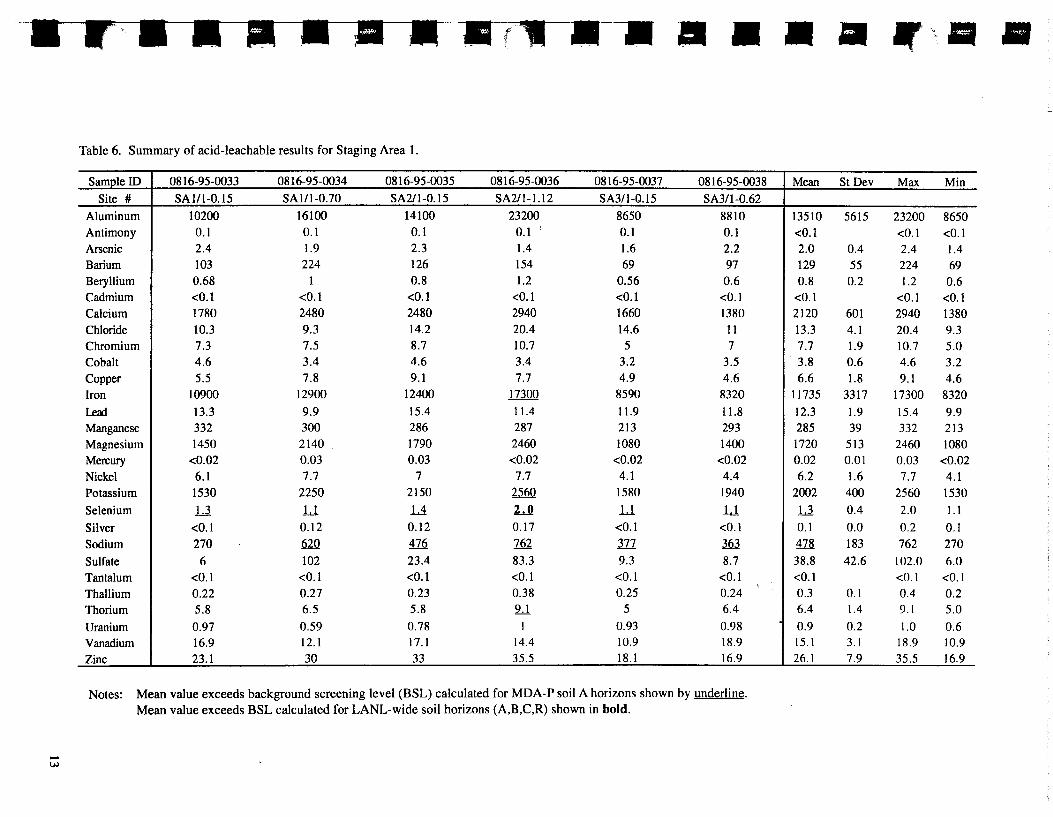
Concentration of HN03-leachable Ba in most of the soil layers sampled within the Segregation Area
and Decontamination Pad have concentrations that are two to five times greater than Ba concentrations
in background MDA-P soil A horizons and LANL-wide combined soil horizons (Table 11). Concen
trations of total Ba are also above site-specific MDA-P screening background levels for most of the
samples collected from the Segregation Area and Decontamination Pad (Table 10). Concentrations of
acid-leachable and total Ba are within the background range for samples collected from the Staging
Area (Table 11).
Concentrations of leachable Ba are highest in surface samples represented by the uppermost soil A
horizons. Concentrations of leachable Ba in surface samples range from 270 to 1680 mg/kg and 56 to
229 mg/kg for subsurface soils layers. Concentrations of total Ba in surface samples range from 611 to
12
---.. II - - Ill II II ~\- II
Table 6. Summary of acid-leachable results for Staging Area 1.
Sample ID 0816-95-0033 0816-95-0034 0816-95-0035 0816-95-0036 0816-95-0037 0816-95-0038 Mean St Dev Max Min Site # SA111-0.15 SA111-0.70 SA2/1-0.15 SA211-1.12 SA311-0.15 SA3/1-0.62
Aluminum 10200 16100 14100 23200 8650 8810 13510 5615 23200 8650 Antimony 0.1 0.1 0.1 0.1 0.1 0.1 <0.1 <0.1 <0.1 Arsenic 2.4 1.9 2.3 1.4 1.6 2.2 2.0 0.4 2.4 1.4 Barium 103 224 126 154 69 97 129 55 224 69 Beryllium 0.68 1 0.8 1.2 0.56 0.6 0.8 0.2 1.2 0.6 Cadmium <0.1 <0.1 <0.1 <0.1 <0.1 <0.1 <0.1 <0.1 <0.1 Calcium 1780 2480 2480 2940 1660 1380 2120 601 2940 1380 Chloride 10.3 9.3 14.2 20.4 14.6 11 13.3 4.1 20.4 9.3 Chromium 7.3 7.5 8.7 10.7 5 7 7.7 1.9 10.7 5.0 Cobalt 4.6 3.4 4.6 3.4 3.2 3.5 3.8 0.6 4.6 3.2 Copper 5.5 7.8 9.1 7.7 4.9 4.6 6.6 1.8 9.1 4.6 Iron 10900 12900 12400 17300 8590 8320 11735 3317 17300 8320
Lead 13.3 9.9 15.4 11.4 11.9 11.8 12.3 1.9 15.4 9.9 Manganese 332 300 286 287 213 293 285 39 332 213 Magnesium 1450 2140 1790 2460 1080 1400 1720 513 2460 1080 Mercury <0.02 0.03 0.03 <0.02 <0.02 <0.02 0.02 0.01 0.03 <0.02 Nickel 6.1 7.7 7 7.7 4.1 4.4 6.2 1.6 7.7 4.1 Potassium 1530 2250 2150 ll6Q 1580 1940 2002 400 2560 1530
Selenium u lJ. lA 2.0 lJ. Ll u 0.4 2.0 1.1
Silver <0.1 0.12 0.12 0.17 <0.1 <0.1 0.1 0.0 0.2 0.1 Sodium 270 620 476 762 m l6J. ill 183 762 270
Sulfate 6 102 23.4 83.3 9.3 8.7 38.8 42.6 102.0 6.0 Tantalum <0.1 <0.1 <0.1 <0.1 <0.1 <0.1 <0.1 <0.1 <0.1
' Thallium 0.22 0.27 0.23 0.38 0.25 0.24 0.3 0.1 0.4 0.2 Thorium 5.8 6.5 5.8 2.J. 5 6.4 6.4 1.4 9.1 5.0
Uranium 0.97 0.59 0.78 1 0.93 0.98 0.9 0.2 1.0 0.6 Vanadium 16.9 12.1 17.1 14.4 10.9 18.9 15.1 3.1 18.9 10.9 Zinc 23.1 30 33 35.5 18.1 16.9 26.1 7.9 35.5 16.9
Notes: Mean value exceeds background screening level (BSL) calculated for MDA-P soil A horizons shown by underline. Mean value exceeds BSL calculated for LANL-wide soil horizons (A,B,C,R) shown in bold.
-Vol
........ ·•·•·. -----~--~----~------------------
.... ~
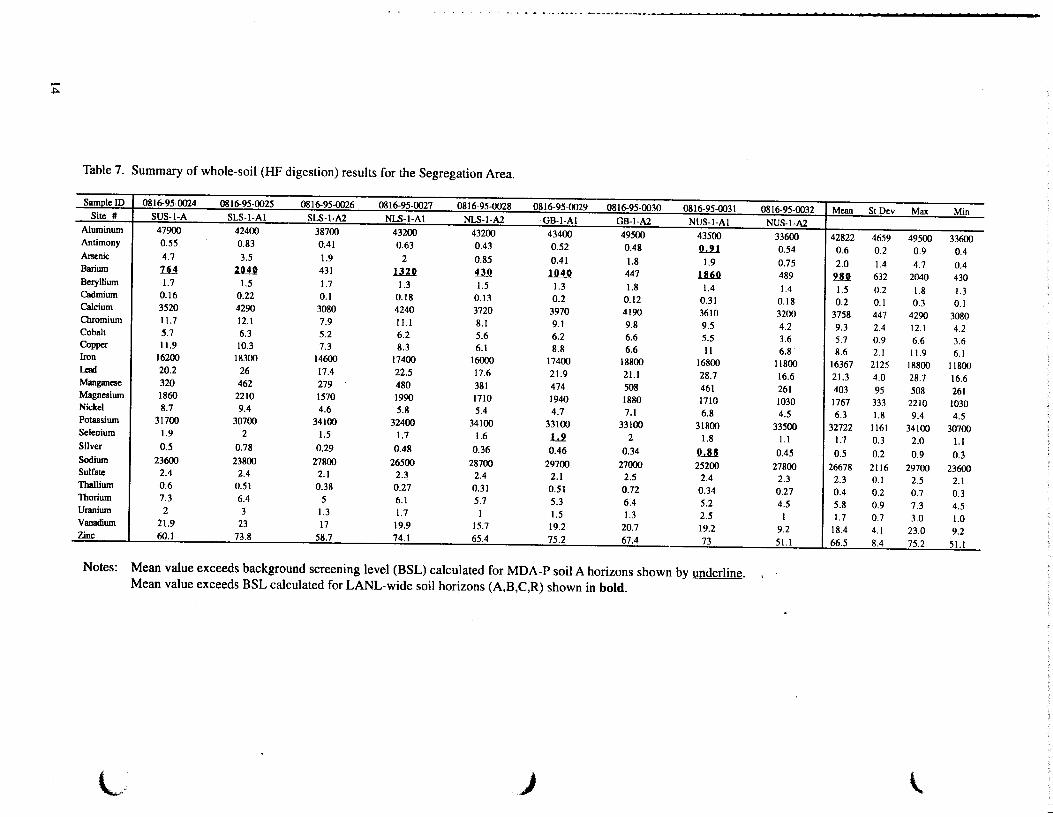
Table 7. Summary of whole-soil (HF digestion) results for the Segregation Area.
SampleiD 0816-95-0024 0816-95-0025 0816-95-0026 0816-95-0027 0816-95-0028 0816-95-0029 0816-95-0030 0816-95-0031 0816-95-0032 Mean St Dev Max Min Site # SUS-I-A SLS-1-AI SLS-I-A2 NLS-1-Al NLS-I-A2 GB-1-Al GB-I-A2 NUS-I-AI NUS-l-A2 Aluminum 47900 42400 38700 43200 43200 43400 49500 43500 33600 42822 4659 49500 33600 Antimony 0.55 0.83 0.41 0.63 0.43 0.52 0.48 !l.li 0.54 0.6 0.2 0.9 0.4 Arsenic 4.7 3.5 1.9 2 0.85 0.41 1.8 1.9 0.75 2.0 1.4 4.7 0.4 Barium ill 1.11..4.11 431 lUll UJl l.ll..iO 447 lUll 489 tlll 632 2040 430 Beryllium 1.7 1.5 1.7 1.3 1.5 1.3 1.8 1.4 1.4 1.5 0.2 1.8 1.3 Cadmium 0.16 0.22 0.1 0.18 0.13 0.2 0.12 0.31 0.18 0.2 0.1 0.3 0.1 Calcium 3520 4290 3080 4240 3720 3970 4190 3610 3200 3758 447 4290 3080 Otromium 11.7 12.1 7.9 11.1 8.1 9.1 9.8 9.5 4.2 9.3 2.4 12.1 4.2 Cobalt 5.7 6.3 5.2 6.2 5.6 6.2 6.6 5.5 3.6 5.7 0.9 6.6 3.6 Copper 11.9 10.3 7.3 8.3 6.1 8.8 6.6 11 6.8 8.6 2.1 11.9 6.1 Iron 16200 18300 14600 17400 16000 17400 18800 16800 11800 16367 2125 18800 11800 Lead 20.2 26 17.4 22.5 17.6 21.9 21.1 28.7 16.6 21.3 4.0 28.7 16.6 Manganese 320 462 279 480 381 474 508 461 261 403 95 508 261 Magnesium 1860 2210 1570 1990 1710 1940 1880 1710 1030 1767 333 2210 1030 Nickel 8.7 9.4 4.6 5.8 5.4 4.7 7.1 6.8 4.5 6.3 1.8 9.4 4.5 Potassium 31700 30700 34100 32400 34100 33100 33100 31800 33500 32722 1161 34100 30700 Selenium 1.9 2 1.5 1.7 1.6 1.....2 2 1.8 1.1 1.7 0.3 2.0 1.1 Silver 0.5 0.78 0.29 0.48 0.36 0.46 0.34 l!....ll 0.45 0.5 0.2 0.9 0.3 Sodium 23600 23800 27800 26500 28700 29700 27000 25200 27800 26678 2116 29700 23600 Sulfate 2.4 2.4 2.1 2.3 2.4 2.1 2.5 2.4 2.3 2.3 0.1 2.5 2.1 Thallium 0.6 0.51 0.38 0.27 0.31 0.51 0.72 0.34 0.27 0.4 0.2 0.7 0.3 Thorium 7.3 6.4 5 6.1 5.7 5.3 6.4 5.2 4.5 5.8 0.9 7.3 4.5 Uranium 2 3 1.3 1.7 I 1.5 1.3 2.5 I 1.7 0.7 3.0 1.0 Vanadium 21.9 23 17 19.9 15.7 19.2 20.7 19.2 9.2 18.4 4.1 23.0 9.2 Zinc 60.1 73.8 58.7 74.1 65.4 75.2 67.4 73 51.1 66.5 8.4 75.2 51.1
Notes: Mean value exceeds background screening level (BSL) calculated for MDA-P soil A horizons shown by underline. Mean value exceeds BSL calculated for LANL-wide soil horizons (A,B,C,R) shown in bold.
L- .J l
•• ·--
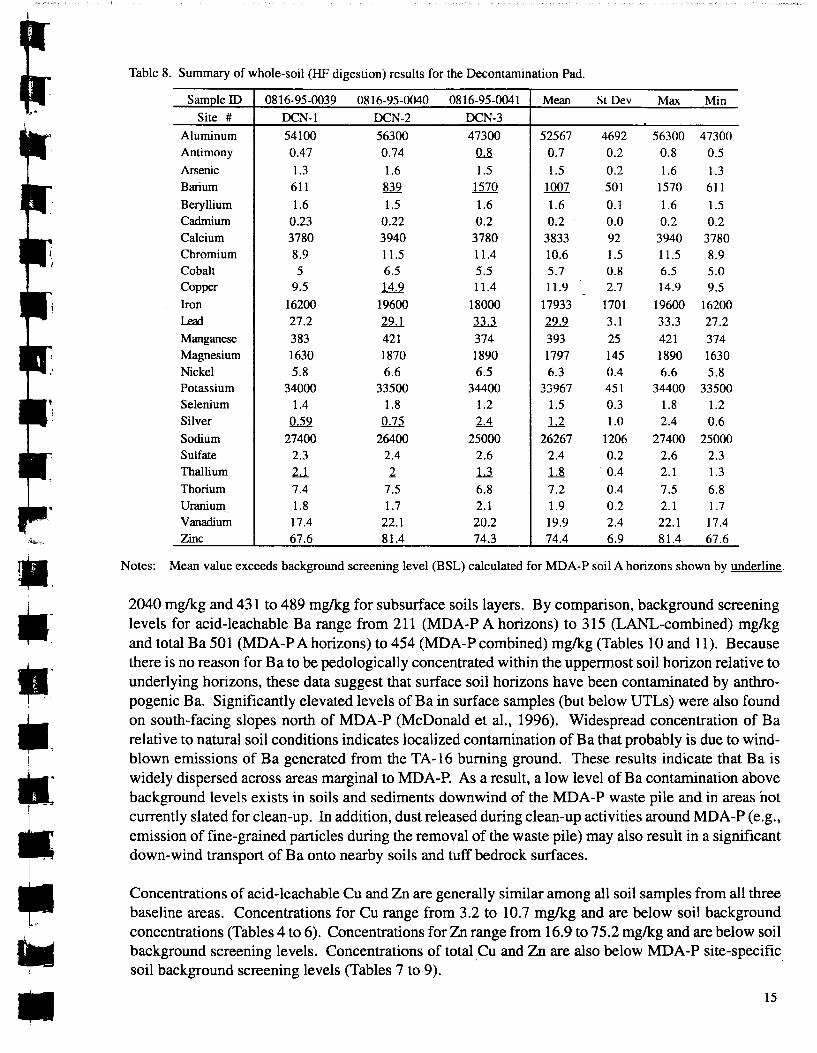
Table 8. Summary of whole-soil (HF digestion) results for the Decontamination Pad.
Sample ID 0816-95-0039 0816-95-0040 0816-95-0041 Mean St Dev Max Min Site # DCN-1 DCN-2 DCN-3
Aluminum 54100 56300 47300 52567 4692 56300 47300 Antimony 0.47 0.74 0.8 0.7 0.2 0.8 0.5 Arsenic 1.3 1.6 1.5 1.5 0.2 1.6 1.3 Barium 611 .8.3.2 1570 1007 501 1570 611 Beryllium 1.6 1.5 1.6 1.6 0.1 1.6 1.5 Cadmium 0.23 0.22 0.2 0.2 0.0 0.2 0.2 Calcium 3780 3940 3780 3833 92 3940 3780 Chromium 8.9 11.5 11.4 10.6 1.5 11.5 8.9 Cobalt 5 6.5 5.5 5.7 0.8 6.5 5.0 Copper 9.5 ~ 11.4 11.9 2.7 14.9 9.5 -Iron 16200 19600 18000 17933 1701 19600 16200 Leal 27.2 2.2..1 ll..3. 2.2....2 3.1 33.3 27.2 Manganese 383 421 374 393 25 421 374 Magnesium 1630 1870 1890 1797 145 1890 1630 Nickel 5.8 6.6 6.5 6.3 0.4 6.6 5.8 Potassium 34000 33500 34400 33967 451 34400 33500 Selenium 1.4 1.8 1.2 1.5 0.3 1.8 1.2 Silver Q..j2 0.75 2.4 u 1.0 2.4 0.6 Sodium 27400 26400 25000 26267 1206 27400 25000 Sulfate 2.3 2.4 2.6 2.4 0.2 2.6 2.3 Thallium 2.J. 2 .L.3. .L.8. 0.4 2.1 1.3 Thorium 7.4 7.5 6.8 7.2 0.4 7.5 6.8 Uranium 1.8 1.7 2.1 1.9 0.2 2.1 1.7 Vanadium 17.4 22.1 20.2 19.9 2.4 22.1 17.4 Zinc 67.6 81.4 74.3 74.4 6.9 81.4 67.6
Notes: Mean value exceeds background screening level (BSL) calculated for MDA-P soil A horizons shown by underline.
2040 mg/kg and 431 to 489 mg/kg for subsurface soils layers. By comparison, background screening levels for acid-leachable Ba range from 211 (MDA-P A horizons) to 315 (LANL-combined) mg/kg and total Ba 501 (MDA-P A horizons) to 454 (MDA-P combined) mg/kg (Tables 10 and 11). Because there is no reason for Ba to be pedologically concentrated within the uppermost soil horizon relative to underlying horizons, these data suggest that surface soil horizons have been contaminated by anthropogenic Ba. Significantly elevated levels ofBa in surface samples (but below UTLs) were also found on south-facing slopes north of MDA-P (McDonald et al., 1996). Widespread concentration of Ba relative to natural soil conditions indicates localized contamination of Ba that probably is due to windblown emissions of Ba generated from the TA-16 burning ground. These results indicate that Ba is widely dispersed across areas marginal to MDA-P. As a result, a low level ofBa contamination above background levels exists in soils and sediments downwind of the MDA-P waste pile and in areas not currently slated for clean-up. In addition, dust released during clean-up activities around MDA-P (e.g., emission of fine-grained particles during the removal of the waste pile) may also result in a significant down-wind transport of Ba onto nearby soils and tuff bedrock surfaces.
Concentrations of acid-leachable Cu and Zn are generally similar among all soil samples from all three baseline areas. Concentrations for Cu range from 3.2 to 10.7 mg/kg and are below soil background concentrations (Tables 4 to 6). Concentrations for Zn range from 16.9 to 75.2 mg/kg and are below soil background screening levels. Concentrations of total Cu and Zn are also below MDA-P site-specific. soil background screening levels (Tables 7 to 9).
15
-0'\
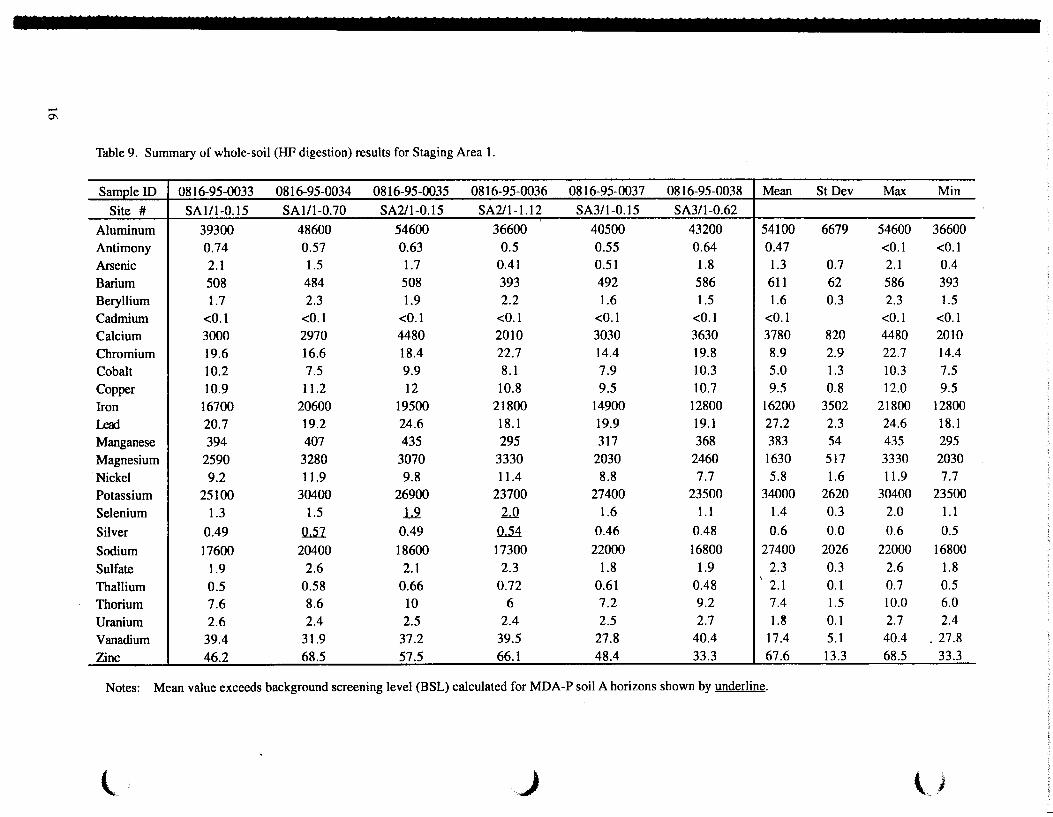
Table 9. Summary of whole-soil (HF digestion) results for Staging Area 1.
Sample ID 0816-95-0033 0816-95-0034 0816-95-0035 0816-95-0036 0816-95-0037 0816-95-0038 Mean St Dev Max Min
Site # SA1/l-0.15 SA1/1-0.70 SA211-0.15 SA211-1.12 SA3/l-0.15 SA3/l-0.62
Aluminum 39300 48600 54600 36600 40500 43200 54100 6679 54600 36600
Antimony 0.74 0.57 0.63 0.5 0.55 0.64 0.47 <0.1 <0.1
Arsenic 2.1 1.5 1.7 0.41 0.51 1.8 1.3 0.7 2.1 0.4
Barium 508 484 508 393 492 586 611 62 586 393
Beryllium 1.7 2.3 1.9 2.2 1.6 1.5 1.6 0.3 2.3 1.5
Cadmium <0.1 <0.1 <0.1 <0.1 <0.1 <0.1 <0.1 <0.1 <0.1
Calcium 3000 2970 4480 2010 3030 3630 3780 820 4480 2010
Chromium 19.6 16.6 18.4 22.7 14.4 19.8 8.9 2.9 22.7 14.4
Cobalt 10.2 7.5 9.9 8.1 7.9 10.3 5.0 1.3 10.3 7.5
Copper 10.9 11.2 12 10.8 9.5 10.7 9.5 0.8 12.0 9.5
Iron 16700 20600 19500 21800 14900 12800 16200 3502 21800 12800
LeOO 20.7 19.2 24.6 18.1 19.9 19.1 27.2 2.3 24.6 18.1
Manganese 394 407 435 295 317 368 383 54 435 295
Magnesium 2590 3280 3070 3330 2030 2460 1630 517 3330 2030
·Nickel 9.2 11.9 9.8 11.4 8.8 7.7 5.8 1.6 11.9 7.7
Potassium 25100 30400 26900 23700 27400 23500 34000 2620 30400 23500
Selenium 1.3 1.5 L2 2.0 1.6 1.1 1.4 0.3 2.0 1.1
Silver 0.49 Q..ii 0.49 ~ 0.46 0.48 0.6 0.0 0.6 0.5
Sodium 17600 20400 18600 17300 22000 16800 27400 2026 22000 16800
Sulfate 1.9 2.6 2.1 2.3 1.8 1.9 2.3 0.3 2.6 1.8 '
Thallium 0.5 0.58 0.66 0.72 0.61 0.48 2.1 0.1 0.7 0.5
Thorium 7.6 8.6 10 6 7.2 9.2 7.4 1.5 10.0 6.0
Uranium 2.6 2.4 2.5 2.4 2.5 2.7 1.~ 0.1 2.7 2.4
Vanadium 39.4 31.9 37.2 39.5 27.8 40.4 17.4 5.1 40.4 . 27.8
Zinc 46.2 68.5 57.5 66.1 48.4 33.3 67.6 13.3 68.5 33.3
Notes: Mean value exceeds background screening level (BSL) calculated for MDA-P soil A horizons shown by underline.
l J t.J
-
--..,J
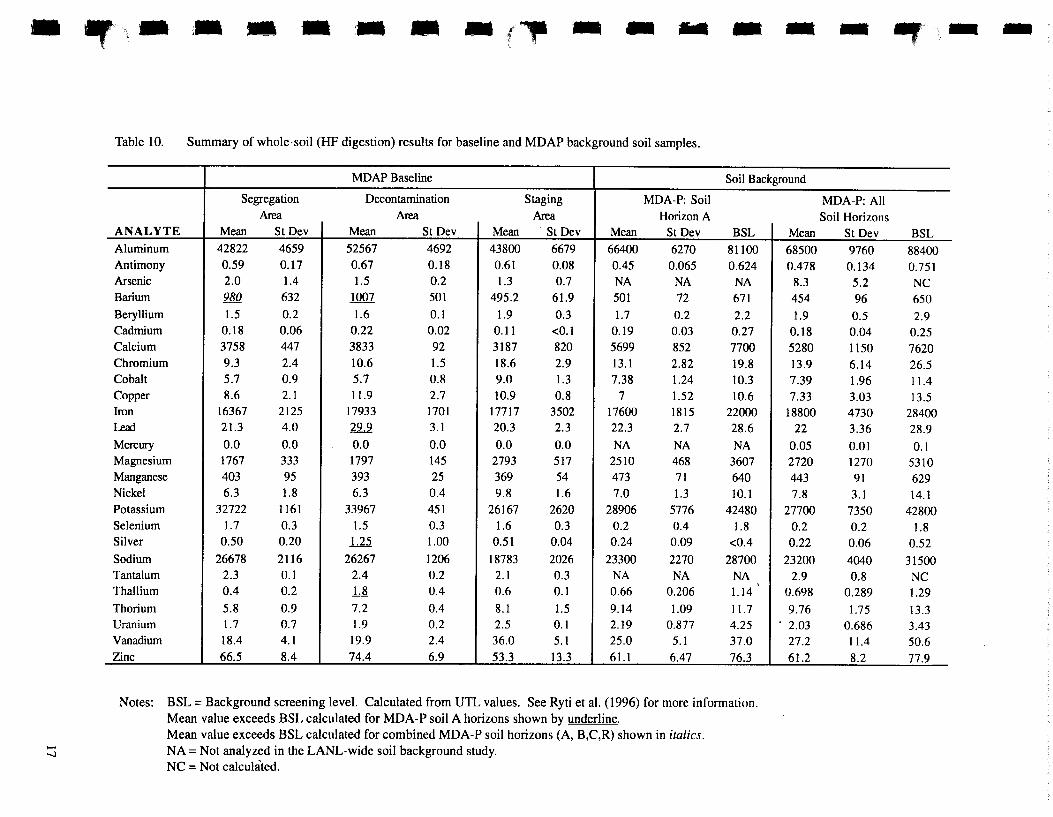
.,.., - i- - - - - - ,. .. - .. - -Table 10. Summary of whole-soil (HF digestion) results for baseline and MDAP background soil samples.
MDAP Baseline Soil Background
Segregation Decontamination Staging MDA-P: Soil Area Area Area Horizon A
ANALYTE Mean St Dev Mean St Dev Mean St Dev Mean StDev BSL Mean Aluminum 42822 4659 52567 4692 43800 6679 66400 6270 81100 68500 Antimony 0.59 0.17 0.67 0.18 0.61 0.08 0.45 0.065 0.624 0.478 Arsenic 2.0 1.4 1.5 0.2 1.3 0.7 NA NA NA 8.3 Barium 980 632 1007 501 495.2 61.9 501 72 671 454 Beryllium 1.5 0.2 1.6 0.1 1.9 0.3 1.7 0.2 2.2 1.9 Cadmium 0.18 0.06 0.22 0.02 0.11 <0.1 0.19 0.03 0.27 0.18 Calcium 3758 447 3833 92 3187 820 5699 852 7700 5280 Chromium 9.3 2.4 10.6 1.5 18.6 2.9 13.1 2.82 19.8 13.9 Cobalt 5.7 0.9 5.7 0.8 9.0 1.3 7.38 1.24 10.3 7.39 Copper 8.6 2.1 11.9 2.7 10.9 0.8 7 1.52 10.6 7.33 Iron 16367 2125 17933 1701 17717 3502 17600 1815 22000 18800 Leal 21.3 4.0 22.2 3.1 20.3 2.3 22.3 2.7 28.6 22 Mercury 0.0 0.0 0.0 0.0 0.0 0.0 NA NA NA 0.05 Magnesium 1767 333 1797 145 2793 517 2510 468 3607 2720 Manganese 403 95 393 25 369 54 473 71 640 443 Nickel 6.3 1.8 6.3 0.4 9.8 1.6 7.0 1.3 10.1 7.8 Potassium 32722 1161 33967 451 26167 2620 28906 5776 42480 27700 Selenium 1.7 0.3 1.5 0.3 1.6 0.3 0.2 0.4 1.8 0.2 Silver 0.50 0.20 1.25 1.00 0.51 0.04 0.24 0.09 <0.4 0.22 Sodium 26678 2116 26267 1206 18783 2026 23300 2270 28700 23200 Tantalum 2.3 0.1 2.4 0.2 2.1 0.3 NA NA NA 2.9
I
Thallium 0.4 0.2 il 0.4 0.6 0.1 0.66 0.206 1.14 0.698 Thorium 5.8 0.9 7.2 0.4 8.1 1.5 9.14 1.09 11.7 9.76 Uranium 1.7 0.7 1.9 0.2 2.5 0.1 2.19 0.877 4.25 . 2.03 Vanadium 18.4 4.1 19.9 2.4 36.0 5.1 25.0 5.1 37.0 27.2 Zinc 66.5 8.4 74.4 6.9 53.3 13.3 61.1 6.47 76.3 61.2
Notes: BSL = Background screening level. Calculated from UTL values. See Ryti et al. (1996) for more information. Mean value exceeds BSL calculated for MDA-P soil A horizons shown by underline. Mean value exceeds BSL calculated for combined MDA-P soil horizons (A, B,C,R) shown in italics. NA =Not analyzed in the LANL-wide soil background study. NC = Not calculated.
- ., - -
MDA-P: All Soil Horizons
St Dev BSL
9760 88400 0.134 0.751 5.2 NC 96 650 0.5 2.9 0.04 0.25 1150 7620 6.14 26.5 1.96 11.4 3.03 13.5 4730 28400 3.36 28.9 0.01 0.1 1270 5310 91 629 3.1 14.1
7350 42800 0.2 1.8 0.06 0.52 4040 31500 0.8 NC
0.289 1.29 1.75 13.3
0.686 3.43 11.4 50.6 8.2 77.9
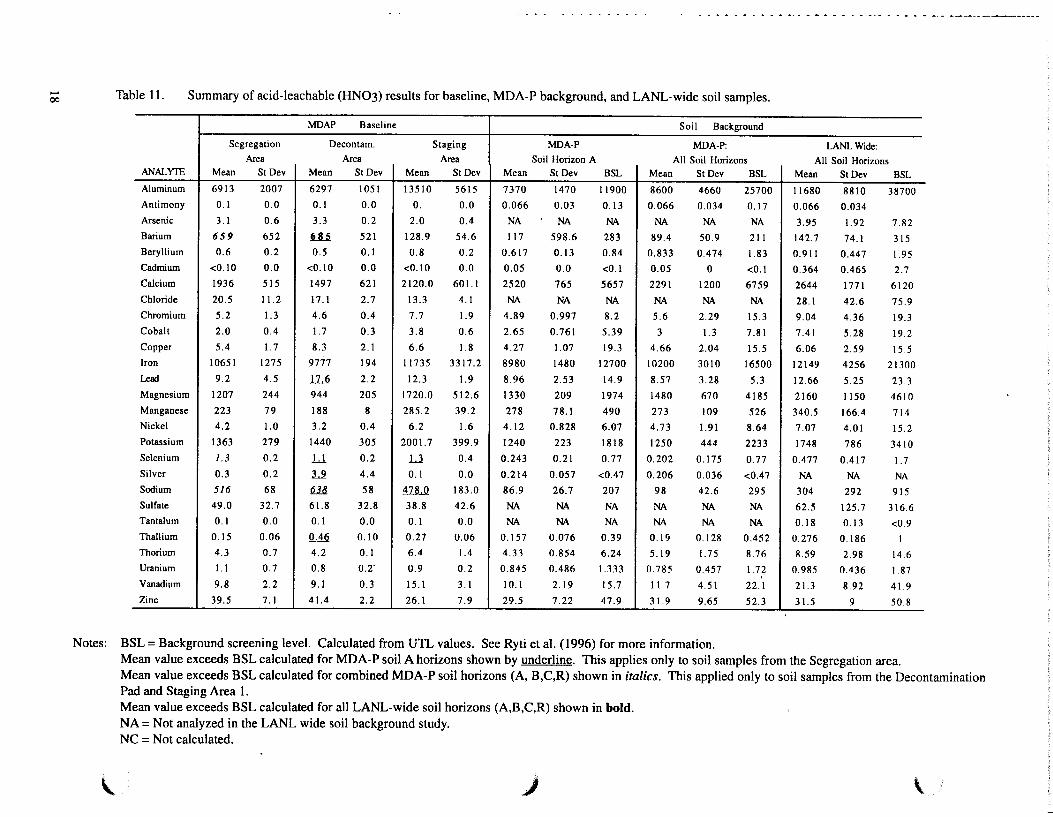
-00 Table 11. Summary of acid-leachable (HN03) results for baseline, MDA-P background, and LANL-wide soil samples.
MDAP Baseline Soil Background
Segregation Decontam. Staging MDA-P MDA-P: LANLWide: Area Area Area Soil Horizon A All Soil Horizons All Soil Horizons
ANALYffi Mean StDev Mean StDev Mean StDev Mean StDev BSL Mean St Dev BSL Mean StDev BSL Aluminum 6913 2007 6297 1051 13510 5615 7370 1470 11900 8600 4660 25700 11680 8810 38700 Antimony 0.1 0.0 0.1 0.0 0. 0.0 0.066 0.03 0.13 0.066 0.034 0.17 0.066 0.034 Arsenic 3.1 0.6 3.3 0.2 2.0 0.4 NA NA NA NA NA NA 3.95 1.92 7.82 Barium 659 652 u.s 521 128.9 54.6 117 598.6 283 89.4 50.9 211 142.7 74.1 315 Beryllium 0.6 0.2 0.5 0.1 0.8 0.2 0.617 0.13 0.84 0.833 0.474 1.83 0.911 0.447 1.95 Cadmium <0.10 0.0 <0.10 0.0 <0.10 0.0 0.05 0.0 <0.1 0.05 0 <0.1 0.364 0.465 2.7 Calcium 1936 515 1497 621 2120.0 601.1 2520 765 5657 2291 1200 6759 2644 1771 6120 Chloride 20.5 11.2 17.1 2.7 13.3 4.1 NA NA NA NA NA NA 28.1 42.6 75.9 Chromium 5.2 1.3 4.6 0.4 7.7 1.9 4.89 0.997 8.2 5.6 2.29 15.3 9.04 4.36 19.3 Cobalt 2.0 0.4 1.7 0.3 3.8 0.6 2.65 0.761 5.39 3 1.3 7.81 7.41 5.28 19.2 Copper 5.4 1.7 8.3 2.1 6.6 1.8 4.27 1.07 19.3 4.66 2.04 15.5 6.06 2.59 15.5 Iron 10651 1275 9777 194 11735 3317.2 8980 1480 12700 10200 3010 16500 12149 4256 21300 Lead 9.2 4.5 .11....6 2.2 12.3 1.9 8.96 2.53 14.9 8.57 3.28 5.3 12.66 5.25 23.3 Magnesium 1207 244 944 205 1720.0 512.6 1330 209 1974 1480 670 4185 2160 1150 4610 Manganese 223 79 188 8 285.2 39.2 278 78.1 490 273 109 526 340.5 166.4 714 Nickel 4.2 1.0 3.2 0.4 6.2 1.6 4.12 0.828 6.07 4.73 1.91 8.64 7.07 4.01 15.2 Potassium 1363 279 1440 305 200 I. 7 399.9 1240 223 1818 1250 444 2233 1748 786 3410 Selenium 1.3 0.2 L1 0.2 .L1 0.4 0.243 0.21 0.77 0.202 0.175 0.77 0.477 0.417 1.7 Silver 0.3 0.2 l...2 4.4 0.1 0.0 0.214 0.057 <0.47 0.206 0.036 <0.47 NA NA NA Sodium 516 68 ill 58 tlB...Q 183.0 86.9 26.7 207 98 42.6 295 304 292 915 Sulfate 49.0 32.7 61.8 32.8 38.8 42.6 NA NA NA NA NA NA 62.5 125.7 316.6 Tantalum 0.1 0.0 0.1 0.0 0.1 0.0 NA NA NA NA NA NA 0.18 0.13 <0.9 Thallium 0.15 0.06 ~ 0.10 0.27 0.06 0.157 0.076 0.39 0.19 0.128 0.452 0.276 0.186 I Thorium 4.3 0.7 4.2 0.1 6.4 1.4 4.33 0.854 6.24 5.19 I. 75 8.76 8.59 2.98 14.6 Uranium 1.1 0.7 0.8 0.2" 0.9 0.2 0.845 0.486 1.333 0.785 0.457 1.72 0.985 0.436 1.87
' Vanadium 9.8 2.2 9.1 0.3 15.1 3.1 10.1 2.19 15.7 11.7 4.51 22.1 21.3 8.92 41.9 Zinc 39.5 7.1 41.4 2.2 26.1 7.9 ~~-- 7.22 47.9 31.9 9.65 52.3 31.5 9 50.8
·- - ----
Notes: BSL = Background screening level. Calculated from UTL values. See Ryti et al. ( 1996) for more information.
\.
Mean value exceeds BSL calculated for MDA-P soil A horizons shown by underline. This applies only to soil samples from the Segregation area. Mean value exceeds BSL calculated for combined MDA-P soil horizons (A, B,C,R) shown in italics. This applied only to soil samples from the Decontamination Pad and Staging Area 1. Mean value exceeds BSL calculated for all LANL-wide soil horizons (A,B,C,R) shown in bold. NA = Not analyzed in the LANL wide soil background study. NC = Not calculated.
. .J \
• •
~·.
• ~ c
Concentrations of acid-leachable mercury are low in all soil samples from all three baseline areas and are similar to LANL background concentrations (Tables 4 to 6). Laboratory-wide investigations of soil background concentrations of Hg indicate that Hg naturally occurs at very low levels (less than 0.1 ppm) in soils across the Pajarito Plateau (Longmire, et al, 1997).
5.2. Distribution of Other Constituents in Soils
Other metals, including Ag, Be, Cr, Cd, Fe, Pb, and U are also of some concern because these metals may be associated with materials deposited at MDA-P. Acid-leachable concentrations of Ag are slightly above site-specific MDA-P background screening levels for two soil layers sampled at the Segregation Area (0816-95-0025, A 1 horizon; 0816-95-0031; A 1 horizon; Table 4 ). The acid-leachable concentration of Be in a single surface A horizon sampled from the Segregation Area (0816-95-0024, A horizon) is slightly above site-specific MDA-P background screening levels for A horizons. Acid-leachable concentrations of Fe are slightly above site-specific MDA-P background screening levels for soil layers sampled at the Segregation Area (0816-95-0025, A1 horizon) and one sample within Staging Area 1 (0816-95-0036, fill). Concentrations of acid-leachable F~ are below LANL-combined background screening levels. Acid-leachable concentrations of Ph are slightly above site-specific MDA-P background levels for soil layers sampled at the Segregation Area (0816-95-0025, A 1) and one sample within Staging Area 1 (0816-95-0035, fill). Concentrations of acid-leachable Ph in these samples are below LANL-combined background levels. Uranium concentrations exceed acid-leachable Laboratory-wide screening levels in only one soil sample (0816-95-0025, A1). Uranium concentrations are below HF digestible (total) Laboratory-wide background screening levels for all soil samples. Elevated levels ofAg, Be, Fe, Ph, and U in some samples within the Segregation Area and Decontamination Pad suggest localized contamination from MDA-P activities. Alternatively, these elevated levels might represent natural background as "statistical artifacts." But both the Segregation Area and Decontamination Pad are downwind from the TA-16 burning pit, so airborne contamination from that source is likely. Acid-leachable concentrations of Cr, Cd, Fe, and Ph within baseline areas are below Laboratory-wide mean acid-leachable background levels.
Total concentrations of Ag are above site-specific MDA -P background levels for two soil layers sampled at the SegregationArea(0816-95-0025,A1; 0816-95-0031; AI; Table 7), for all three soil layers sampled at the Decontamination Pad, and for two soil layers sampled at Staging Area 1 (0816-95-0034, fill; 0816-95-0036, fill; Tables 8 and 9). Total concentrations of Ph are above site-specific MDA-P background levels for two soil layers sampled at the Decontamination Pad (0816-95-0040, 0816-95-0041). Total concentrations of Be, Cr, Cd, Fe, and U within baseline areas are below Laboratory-wide mean acid-leachable background levels.
Nitrates are also of some concern because this compound is as~ociated with materials deposited at MDA-P. Nitrates were not analyzed as part of the soil background data, nor was N03- analyzed as part of the Laboratory-wide background data. Nitrates are generally low in soil environments that are not under active cultivation. Previous sampling of soils and sediments at MDA-P indicates that concentrations of nitrates are low (Technical Area 16, Material Disposal Area P Closure Plan, Revision 0, February, 1995). Additional analysis for nitrate will be required to determine if elevated levels of nitrate are present within the area surrounding MDA-P.
19
5.3. Other Elements above Local and LANL Soil Background Screening Levels
Several other elements were measured at concentrations above background screening levels. Concentrations of acid-leachable selenium occurred above MDA-P site-specific background screening levels for nearly all samples at all three baseline areas and above LANL combined soil background screening values for two samples (0816-95-0025, 0816-95-0036; Tables 4 to 6). Total Se concentrations for several samples are also above MDA-P site-specific background concentrations (Tables 7 and 8). Concentrations of acid-leachable Na are above MDA-P site-specific background screening levels for nearly all samples in all three baseline areas, and above LANL combined background screening for several samples. Acid-leachable Na concentration in the tuff is about twice its concentration in soil background levels. Elevated levels of Na at all three baseline areas suggest th·at local influence from Units 4 and 5 of the Bandelier Tuff may be one potential source of elevated levels of these elements. More likely, the elevated levels of Na are the result of analytical errors, as discussed in detail below. Concentrations of acid-leachable Th occur above MDA-P site-specific background screening values for one soil layer at the Decontamination Pad (0816-95-0040). Concentrations of total Th also occur above MDA-P site-specific background screening values for two soil layers at the Decontamination Pad (0816-95-0040, 0816-95-0039).
6.0. DESCRIPTION OF BEDROCK NEAR MDA-P AND GRAPIDCAL APPROACH FOR ANALYSIS OF RESULTS
Just as soils are best described as a series of horizontal layers, so is bedrock best described as a sequence of stratigraphic layers. The Tshirege Member of the Bandelier Tuff is the sole bedrock unit at MDA-P and throughout much of the Laboratory. Previous studies of the lower part of the Tshirege Member, summarized by Broxton et al. (1996), have shown that Units 1 through 3 are relatively homogeneous, and therefore amenable to simple statistical analysis. But our results for the upper part of the Tshirege Member show that the uppermost part of Units 3, 4, and 5 are not homogeneous, due to very strong magmatic zonation. In addition, we have found that natural processes produce abnormally high concentrations of many elements that might be misinterpreted as contamination. Therefore, we rely on a thorough consideration of potential natural processes and plots of concentrations versus stratigraphic level as much as on our statistical analyses to assess the occurrence of contamination in baseline bedrock samples at MDA-P.
6.1. Geologic Factors and Their Potential Chemical Effects on Background and Baseline Chemistry of Bedrock at MDA-P
Geologic factors and their potential chemical effects are summarized below in Table 12 .. Four geologic factors typically described for rock samples that might exert an influence on the chemistry of bedrock samples are the stratigraphic unit, sample type, lithology, and alteration, which are provided for each baseline and background sample in Appendix C. The influence of stratigraphic unit within the Tshirege Member has been demonstrated in previous work, but these other potentially important geologic factors have not been investigated. Alteration essentially describes bulk mineralogy of a sample, and markedly different bulk mineralogies might respond very differently to chemical leaching procedures. In particular, vitric samples, which consist primarily of glass, might behave differently than devitrified samples, which consist primarily of feldspar and cristobalite or quartz. Bulk mineralogy is best determined by X-ray diffraction, or less accurately from binocular examination by an experienced volcanologist (Appendix B). Samples of bedrock buried beneath soil are subject to different weathering conditions than those exposed at the surface. Tuff samples with poorly nonwelded or partially 20
. I
·~ •: •• •-•: • • •
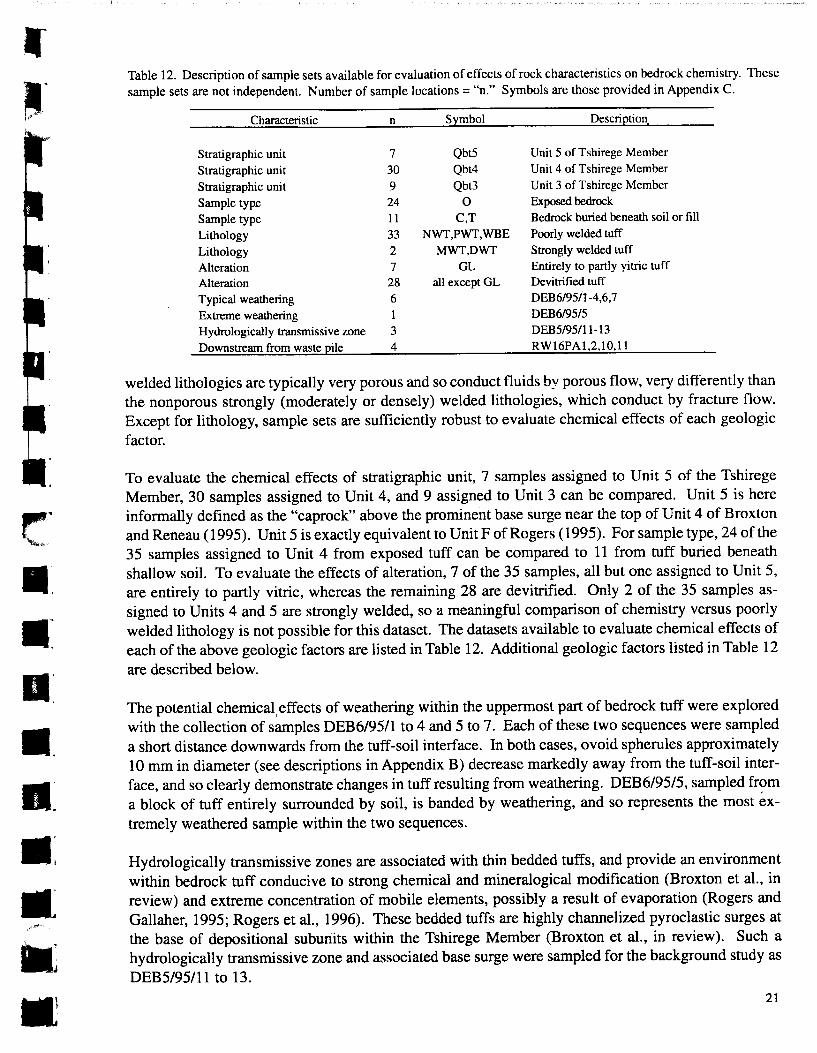
Table 12. Description of sample sets available for evaluation of effects of rock characteristics on bedrock chemistry. These
sample sets are not independent. Number of sample locations= "n." Symbols are those provided in Appendix C.
Characteristic n Symbol Description.
Stratigraphic unit 7 Qbt5 Unit 5 ofTshirege Member
Stratigraphic unit 30 Qbt4 Unit 4 of Tshirege Member
Stratigraphic unit 9 Qbt3 Unit 3 ofTshirege Member
Sample type 24 0 Exposed bedrock
Sample type 11 C,T Bedrock buried beneath soil or fill
Lithology 33 NWT,PWT,WBE Poorly welded tuff
Lithology 2 MWT,DWT Strongly welded tuff
Alteration 7 GL Entirely to partly yitric tuff
Alteration 28 all except GL Devitrified tuff
Typical weathering 6 DEB6/95/l-4,6, 7
Extreme weathering DEB6/95/5
Hydrologically transmissive zone 3 DEB5/95/11-13
Downstream from waste pile 4 RW16PA1,2,10,11
welded lithologies are typically very porous and so conduct fluids by porous flow, very differently than
the nonporous strongly (moderately or densely) welded lithologies, which conduct by fracture flow.
Except for lithology, sample sets are sufficiently robust to evaluate chemical effects of each geologic
factor.
To evaluate the chemical effects of stratigraphic unit, 7 samples assigned to Unit 5 of the Tshirege
Member, 30 samples assigned to Unit 4, and 9 assigned to Unit 3 can be compared. Unit 5 is here
informally defined as the "caprock" above the prominent base surge near the top of Unit 4 of Broxton
and Reneau ( 1995). Unit 5 is exactly equivalent to Unit F of Rogers ( 1995). For sample type, 24 of the
35 samples assigned to Unit 4 from exposed tuff can be compared to 11 from tuff buried beneath
shallow soil. To evaluate the effects of alteration, 7 of the 35 samples, all but one assigned to Unit 5,
are entirely to partly vitric, whereas the remaining 28 are devitrified. Only 2 of the 35 samples as
signed to Units 4 and 5 are strongly welded, so a meaningful comparison of chemistry versus poorly
welded lithology is not possible for this dataset. The datasets available to evaluate chemical effects of
each of the above geologic factors are listed in Table 12. Additional geologic factors listed in Table 12
are described below.
The potential chemical,effects of weathering within the uppermost part of bedrock tuff were explored
with the collection of samples DEB6/95/1 to 4 and 5 to 7. Each of these two sequences were sampled
a short distance downwards from the tuff-soil interface. In both cases, ovoid spherules approximately
10 mm in diameter (see descriptions in Appendix B) decrease markedly away from the tuff-soil inter
face, and so clearly demonstrate changes in tuff resulting from weathering. DEB6/95/5, sampled from
a block of tuff entirely surrounded by soil, is banded by weathering, and so represents the most ex
tremely weathered sample within the two sequences.
Hydrologically transmissive zones are associated with thin bedded tuffs, and provide an environment
within bedrock tuff conducive to strong chemical and mineralogical modification (Broxton et al., in
review) and extreme concentration of mobile elements, possibly a result of evaporation (Rogers and
Gallaher, 1995; Rogers et al., 1996). These bedded tuffs are highly channelized pyroclastic surges at
the base of depositional subunits within the Tshirege Member (Broxton et al., in review). Such a
hydrologically transmissive zone and associated base surge were sampled for the background study as
DEB5/95111 to 13 . 21
6.2. Graphical Representation of Background and Baseline Chemical Data for Bedrock at
MDA-P
Stratigraphic effects on the chemistry of samples of the Tshirege Member are well known (Broxton et
al., in review) and must be considered for any interpretation of results. Although background and
baseline samples are scattered in local sets up to 1.1 km apart, the estimated elevation for the contact
between Units 3 and 4 ranges between 7411 and 7421 ft throughout the entire area, and the contact
between Units 4 and 5 ranges between 7490 and 7497 ft (Appendix C), both with a two sigma uncer
tainty of 20ft. Thus, both stratigraphic contacts are perfectly flat within this uncertainty, and strati
graphic level can be represented simply by the sample elevation. Ordering the chemical analyses of
background and baseline samples by their elevation (Appendix F) thus provides a list in stratigraphic
order. Thus, plots of elevation versus chemical data provide an accurat~ view not only to compare
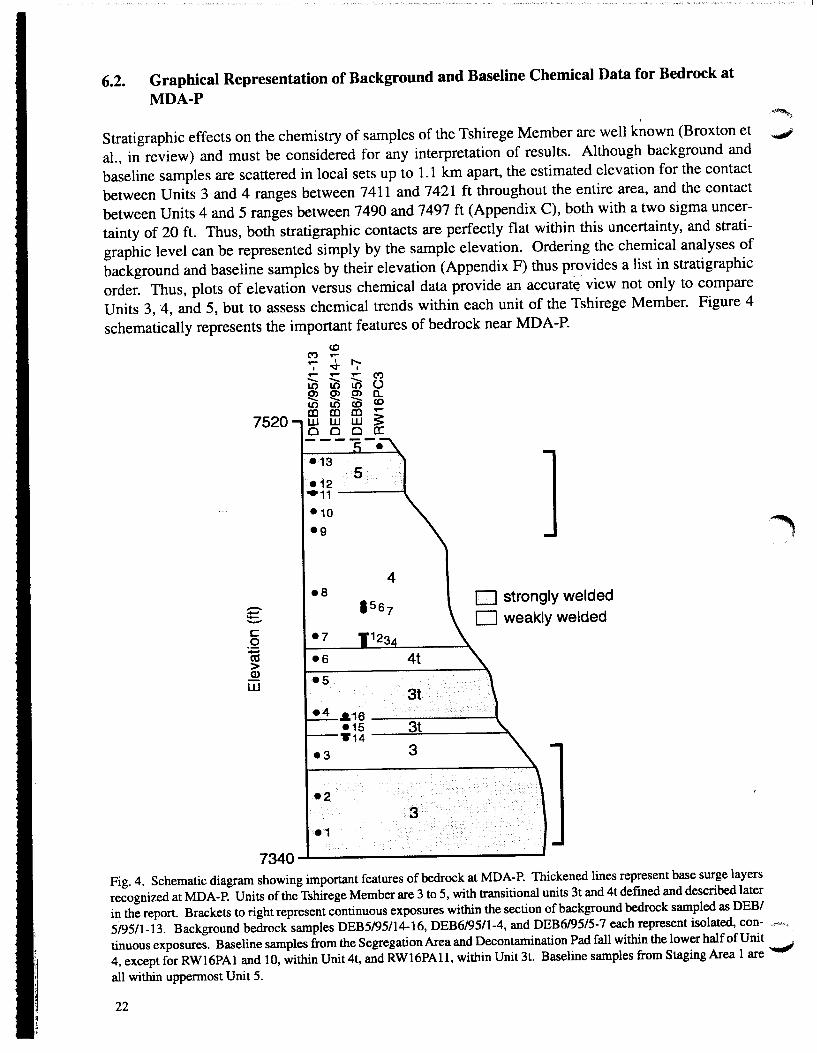
Units 3, 4, and 5, but to assess chemical trends within each unit of the Tshirege Member. Figure 4
schematically represents the important features of bedrock near MDA-P.
<0 C') ,... ,... I 1"-
I v I ,... ,... ,... C') --- () LO LO LO 0> ~ 0> c.. - - <0 LO LO <0 IIl IIl cc ,...
7520 w w w :5: Cl Cl Cl a:
•13 5
•12 .,, •10
•g
4 eB D strongly welded - l5s7 ..... D weakly welded --c: •7 0
:0:: ttl •s > Q) •s w 3t
•4 .&16 •15 3t 'W'14
•3 3
•2 3 .,
7340
~
Fig. 4. Schematic diagram showing important features of bedrock at MDA-P. Thickened lines represent base surge layers
recognized at MDA-P. Units of the Tshirege Member are 3 to 5, with transitional units 3t and 4t defined and described later
in the report. Brackets to right represent continuous exposures within the section of background bedrock sampled as DEB/
5/95/1-13. Background bedrock samples DEB5/95114-16, DEB6/95/1-4, and DEB6/95/5-7 each represent isolated, con
tinuous exposures. Baseline samples from the Segregation Area and Decontamination Pad fall within the lower half of Unit
4, except for RW16PA1 and 10, within Unit4t, and RW16PA11, within Unit 3t. Baseline samples from Staging Area 1 are"""""""'
all within uppermost Unit 5.
22
, I
I{
11
• • • • .
• •
Although the consistency of structural data probably precludes significant variations in the character of the rock column near MDA-P, base surge layers here are observed, as typical, to be discontinuous (see field description for samples DEB5/95/14 to 16 in Appendix C). As discussed above, base surge layers
can be associated with a very different hydrologic character than that observed within massive ash flow layers. Thus, any conclusions based on the stratigraphic equivalence of samples at the same elevation near MDA-P can be applied only to massive ash flow layers. Base surge layers probably account for
<1% of the bedrock volume near MDA-P and therefore do not significantly affect general patterns of
chemistry versus stratigraphic level near MDA-P.
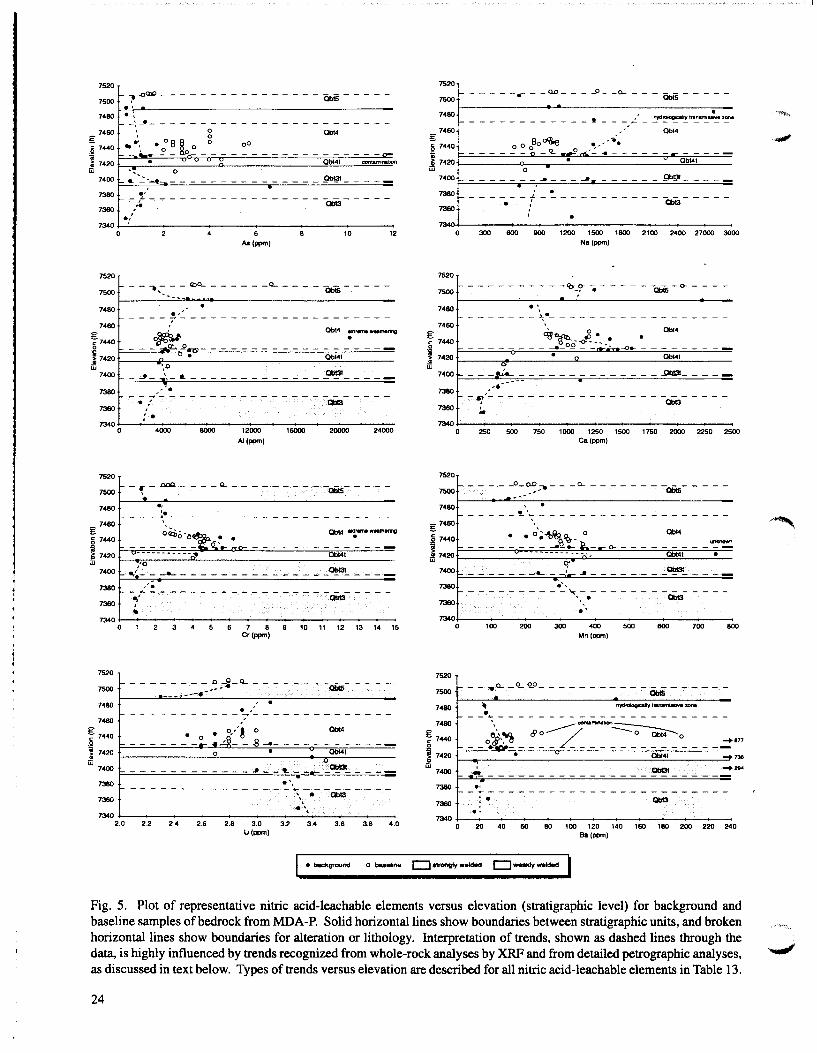
Each element with most values above detection limits defines a general pattern with respect to stratigraphic position (elevation), with exceptions for a few elements caused by analytical inconsistencies between background and baseline chemical data sets for bedrock (Table13). Plots of elevation versus chemical data are provided for elements with most values above detection limits that represent most
patterns described in Table 13 (Fig. 5). Additionally, for many elements, a few analyses, termed excursions, all positive or relatively high values (Table 14), do not conform to these patterns, for reasons inferred in the discussion below.
7.0.
7.1.
GENERAL PATTERNS IN BACKGROUND AND BASELINE CHEMISTRY FOR BEDROCK AT MDA-P
Statistical Summary of EPA SW846 Chemical Analyses for Background and Baseline Samples near MDA-P
Basic statistics for background and baseline bedrock samples from MDA-P are provided in Table 15. Table 15 provides useful central measures, but chemical values are strongly influenced by geologic factors, analytical biases, or contamination, as described below, which complicate the use of simple statistical measures to define differences between bedrock datasets. Chemical differences are significant between baseline samples of Units 4 and 5 for 10 elements, and between baseline and background
samples of Unit 4 for 8 elements (Table 16). But in only two cases are baseline values significantly higher than background values for Unit 4, quite opposite the result expected from such a comparison,
considering the likelihood that baseline samples are contaminated .
Table 13. Summary of patterns related to stratigraphic level in background and baseline chemical data for bedrock samples
from MDA-P. Elements listed in order of decreasingly good fit to pattern. Patterns are not well defined for elements with
asterisk because most analyses are below detection limits .
Pattern
Large analytical bias between background and baseline chemical data; background analyses spurious from contaminant introduced by pulverizing in tungsten carbide shatterbox .
Large analytical bias between background and baseline chemical data; pattern indeterminate for Cd.
Small, analytical bias between background and baseline chemical data; pattern recognizable.
Continuous increase with stratigraphic level.
Increase with stratigraphic level is discontinuous between Units 3 and 4.
Discontinuous increase between Units 3 and 4 to highest values at base of Unit 4, decreasing upward in Unit 4.
Continuous decrease with stratigraphic level.
Decrease with stratigraphic level is discontinuous between Units 3 and 4. Decrease with stratigraphic level but values increase upward in Unit 4.
Elements
Co
Alpha, As, Cd*, Tl*
Beta, Na, K
AI, S, Be
Ba, Ni, Mg, K, Na, Hg*, Se*
V, Cr, Ca, Cu, Fe, Tl*
Zn, As, Mn
Th, U, Alpha, Beta
Pb, Cl
23
7520
7500 ~~~----------------~-----
7480 ~~L--------------------------------------.. ~~------------------------
N80 , g
~ 7440 --~·~ ,._•; ~ ~o; - o_ - - ~o- - - - - - - - - - - - - o-~ ~20t-~~~--O~--v---v~~----------------~Q~~4~1--~~==~~~~M~~ --
7400 F-'--=--=-=---=:--"'·""'-=-c_;-=-...:-=--=:-=--=-:...=-...:-=--=-=--=-=--=---=--=-=--=:-:...=-:...=-_:.Qb131=-...:_=--=_:....::_c.;_=-...:_::....;;_ .
W4
. , -~------------------------
7380
7360 ,,. Qbt3 .,
~~------------------~----------------------0 6 10 12
As (ppm)
7520
7500 - - ~:- - - <t>O.... - - - - - _o.... - - - - QbiS- - - - -
-----·---· 7480 •
----~~--------------------7480 ,
~~ Obt4 .at~ .. thenng
~ 7440 '"'ifO::--g ___ -.,.ct_.s;..., __________________ _
~~20~----~~--v-•----------------------~Ob~t~M~-------jjj 'O
7400 - _,- ~\ - ._ - - - - - - - - - - - - - ~- - - - -
7380 ---~~---------------------7380
•: ~
: . ~~--~----------------~~------~--~--------0 4000 8000 12000 18000 20000 24000
At (ppm)
7520
7500 ---~----~----------~-----·. .. ---~----------------------
7480 .
7400 '0
: Qbt3t ~---~---------------------
7380 ~r------------------~-----, 7360 Ja
3 7 8 10 11 12 13 14 15 Cr(ppm)
7520
7500 ---~~~:;~~-0....--------~-----7480
-----------~~-------------7480
gc 7440 • • o,,'~ o Qbt4
Q -- - - - - -~ ·~- - -8 _._ ----- --- - -~ 7420 f---------------"0'----------·------...,..:~=o:.' -----w 7400 u Qbt3t
F--=--=-=--=-:....::-:....::-...:-=--=-=--=-=-=-~-=--=-=--=::....::J:....::...:-=--=~~r=~...:=--=:=-~~=--==--= •\. 7380
----------------~---------\ • Obt3 . 7360 ... 7340~--------------------------~-----------2.0 2.2 2.4 2.6 2.8 3.0 32 3.4 3.6 3.8 4.0
U(ppm)
7520
7500 -----.-- _ao_-- _p_ -o...--- &tS-----
..... 7480
7480 Obt4 g ~~ , 5 7440 o 0 08o...-UIC 0 ~~ ............. . 'i f- - - - - - - "0 - Q.. .-.-i'rn.- .. - - - - - - ... - - - --~ 7420 Qbt4t w 0 •
g g . ~ w
7400 - - - - - - - .... - - - _. - - - - - - .9b~ - - - -
7380 r- - - - - - ·_ .:.' - ~ - - - - - - - - - - - - - - - - -• / Q)13
7380
0
7520
7500
7480
7480
7440
7420
7400
7380
7380
~ 0
7520
7500
7480
300 800 900 1200 1500 1800 2100 2400 27000 3000 Na (ppm)
-------- - -~-?" ... - --- - ""Qi5- ()-.--- -. . . .. .. -------,------------------' 0 Qbt4 ~"~- .,__. . .
--- ---- - _._0_2 ~ -~~'-,-e-0 ... - -- - - -- --• 0 ~~
C>
-- _,;._ ------ - -- -- - -- ..tlbl3t_ ----
,-• --:'----------------- -abia-----. .•
250 500 750 1000 1250 1500 1750 2000 2250 2500 Ca(ppm)
----~~~~---~--------~-----
• -----~~-------------------
q'
7400F'-'=-'=--"=-=~...:=-~--~~~=--=:~~:...=~~~=...:=--=:~Qbt3t~~=...:=--=:~=
---------~~---------------", • Qbt3
7380
7360 .. 7340~--~-----+----------------------~--------~
0 100 200 300 400 500 800 700 800 Mn (ppm)
7520
7500 --~~-~@-----------~------
7480
--~-----------------------7480
;g 7440 g
\ ~FYWWtiOn
__ oi~-~:'l __ ~o ____ -•77
J ~~ ~~-------·----------------------~~~4~1--------~~no w
7400
7380
7380
. -! • . ..
Qbt3t --7340+-------~--~--~--~------~--~------~------
0 20 40 80 80 100 120 140 180 180 200 220 240 Ba(ppm)
• background o baoel1ne c::J otrongty welded c::J w.kty -d
Fig. 5. Plot of representative nitric acid-leachable elements versus elevation (stratigraphic level) for background and baseline samples of bedrock from MDA-P. Solid horizontal lines show boundaries between stratigraphic units, and broken horizontal lines show boundaries for alteration or lithology. Interpretation of trends, shown as dashed lines through the data, is highly influenced by trends recognized from whole-rock analyses by XRF and from detailed petrographic analyses, as discussed in text below. Types of trends versus elevation are described for all nitric acid-leachable elements in Table 13.
24
•• •• • • •• •
•
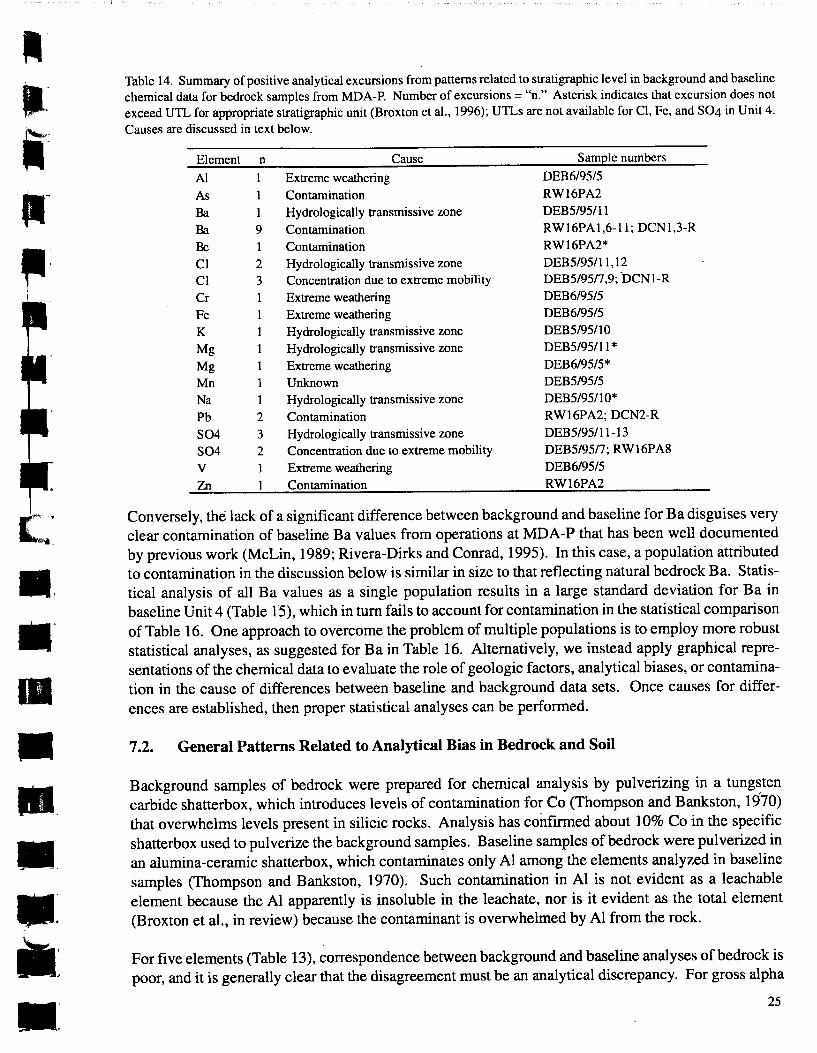
Table 14. Summary of positive analytical excursions from patterns related to stratigraphic level in background and baseline
chemical data for bedrock samples from MDA-P. Number of excursions= "n." Asterisk indicates that excursion does not
exceed UTL for appropriate stratigraphic unit (Broxton et al., 1996); UTLs are not available for Cl, Fe, and S04 in Unit 4.
Causes are discussed in text below.
Element n Cause SamEle numbers
Al Extreme weathering DEB6/95/5
As Contamination RW16PA2
Ba 1 Hydrologically transmissive zone DEB5/95/11
Ba 9 Contamination RW16PA1,6-11; DCN1,3-R
Be 1 Contamination RW16PA2*
Cl 2 Hydrologically transmissive zone DEB5/95!11,12
Cl 3 Concentration due to extreme mobility DEB5/95n,9; .DCNl-R
Cr Extreme weathering DEB6/95/5
Fe Extreme weathering DEB6/95/5
K Hydrologically transmissive zone DEB5/95/10
Mg Hydrologically transmissive zone DEB5/95!11 *
Mg Extreme weathering DEB6/95/5*
Mn Unknown DEB5/95/5
Na Hydrologically transmissive zone DEB5/95!1 0*
Pb 2 Contamination RW16PA2; DCN2-R
S04 3 Hydrologically transmissive zone DEB5/95/11-13
S04 2 Concentration due to extreme mobility DEB5195n; RW16PA8
v 1 Extreme weathering DEB6/95/5
Zn Contamination RW16PA2
Conversely, the lack of a significant difference between background and baseline for Ba disguises very
clear contamination of baseline Ba values from operations at MDA-P that has been well documented
by previous work (McLin, 1989; Rivera-Dirks and Conrad, 1995). In this case, a population attributed
to contamination in the discussion below is similar in size to that reflecting natural bedrock Ba. Statis
tical analysis of all Ba values as a single population results in a large standard deviation for Ba in
baseline Unit 4 (Table 15), which in tum fails to account for contamination in the statistical comparison
of Table 16. One approach to overcome the problem of multiple populations is to employ more robust
statistical analyses, as suggested for Ba in Table 16. Alternatively, we instead apply graphical repre
sentations of the chemical data to evaluate the role of geologic factors, analytical biases, or contamina
tion in the cause of differences between baseline and background data sets. Once causes for differ
ences are established, then proper statistical analyses can be performed .
7 .2. General Patterns Related to Analytical Bias in Bedrock and Soil
Background samples of bedrock were prepared for chemical analysis by pulverizing in a tungsten
carbide shatterbox, which introduces levels of contamination for Co (Thompson and Bankston, 1 970)
that overwhelms levels present in silicic rocks. Analysis has confirmed about 10% Co in the specific
shatterbox used to pulverize the background samples. Baseline samples of bedrock were pulverized in
an alumina-ceramic shatterbox, which contaminates only AI among the elements analyzed in baseline
samples (Thompson and Bankston, 1970). Such contamination in AI is not evident as a leachable
element because the AI apparently is insoluble in the leachate, nor is it evident as the total element
(Broxton et al., in review) because the contaminant is overwhelmed by AI from the rock.
For five elements (Table 13), correspondence between background and baseline analyses of bedrock is
poor, and it is generally clear that the disagreement must be an analytical discrepancy. For gross alpha
25
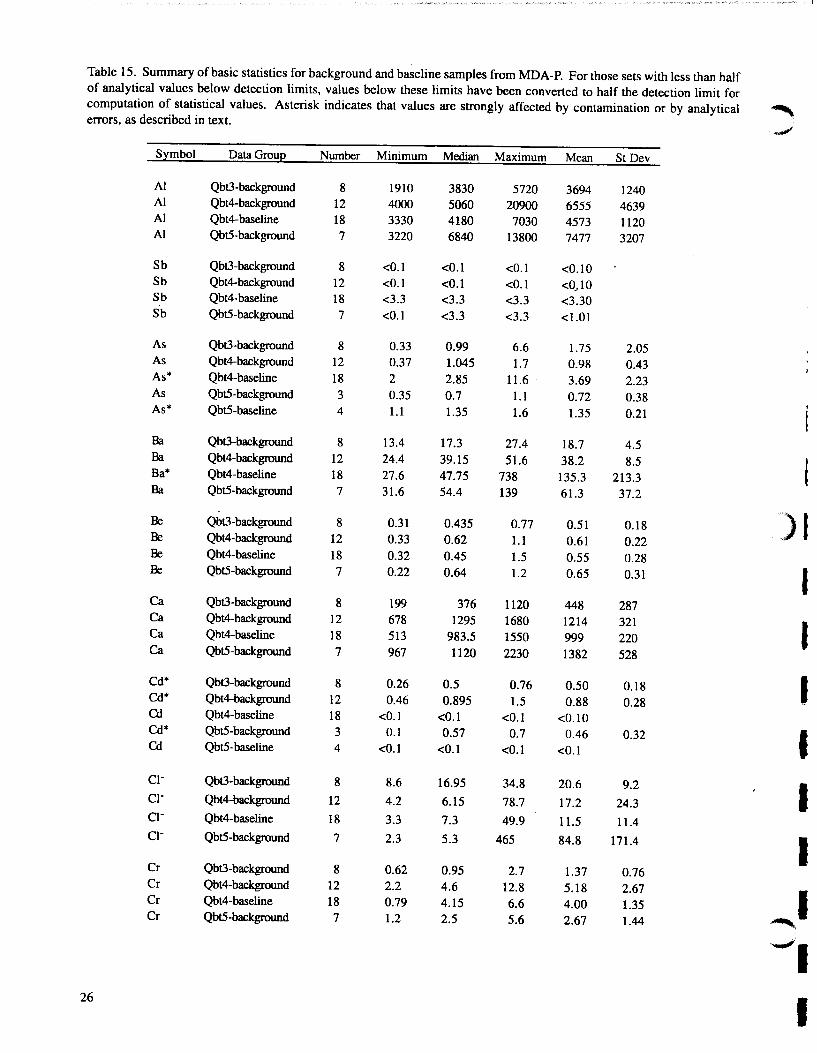
Table 15. Summary of basic statistics for background and baseline samples from MDA-P. For those sets with less than half of analytical values below detection limits, values below these limits have been converted to half the detection limit for computation of statistical values. Asterisk indicates that values are strongly affected by contamination or by analytical '"' errors, as described in text.
.~
Symbol Data Group Number Minimum Median Maximum Mean St Dev
AI Qbt3-background 8 1910 3830 5720 3694 1240 AI Qbt4-background 12 4000 5060 20900 6555 4639 AI Qbt4-baseline 18 3330 4180 7030 4573 1120 AI Qbt5-background 7 3220 6840 13800 7477 3207
Sb Qbt3-background 8 <0.1 <0.1 <0.1 <0.10 Sb Qbt4-background 12 <0.1 <0.1 <0.1 <0J10 Sb Qbt4-baseline 18 <3.3 <3.3 <3.3 <3.30 Sb Qbt5-background 7 <0.1 <3.3 <3.3 <1.01
As Qbt3-background 8 0.33 0.99 6.6 1.75 2.05 As Qbt4-background 12 0.37 1.045 1.7 0.98 0.43 As* Qbt4-baseline 18 2 2.85 11.6 3.69 2.23 As Qbt5-background 3 0.35 0.7 1.1 0.72 0.38 As* Qbt5-baseline 4 1.1 1.35 1.6 1.35 0.21
Ba Qbt3-background 8 13.4 17.3 27.4 18.7 4.5 Ba Qbt4-background 12 24.4 39.15 51.6 38.2 8.5 Ba* Qbt4-baseline 18 27.6 47.75 738 135.3 213.3 Ba Qbt5-background 7 31.6 54.4 139 61.3 37.2
Be Qbt3-background 8 0.31 0.435 0.77 0.51 0.18 )J Be Qbt4-background 12 0.33 0.62 1.1 0.61 0.22 Be Qbt4-baseline 18 0.32 0.45 1.5 0.55 0.28 Be Qbt5-background 7 0.22 0.64 1.2 0.65 0.31 I Ca Qbt3-background 8 199 376 1120 448 287 Ca Qbt4-background 12 678 1295 1680 1214 321
I Ca Qbt4-baseline 18 513 983.5 1550 999 220 Ca Qbt5-background 7 967 1120 2230 1382 528
Cd* Qbt3-background 8 0.26 0.5 0.76 0.50 0.18 I Cd* Qbt4-background 12 0.46 0.895 1.5 0.88 0.28 Cd Qbt4-baseline 18 <0.1 <0.1 <0.1 <0.10 Cd* Qbt5-background 3 0.1 0.57 0.7 0.46 0.32 I Cd Qbt5-baseline 4 <0.1 <0.1 <0.1 <0.1
CI- Qbt3-background 8 8.6 16.95 34.8 20.6 9.2
I ci- Qbt4-background 12 4.2 6.15 78.7 17.2 24.3 Cl- Qbt4-baseline 18 3.3 7.3 49.9 11.5 11.4 ci- Qbt5-background 7 2.3 5.3 465 84.8 171.4 I Cr Qbt3-background 8 0.62 0.95 2.7 1.37 0.76 Cr Qbt4-background 12 2.2 4.6 12.8 5.18 2.67
.~I Cr Qbt4-baseline 18 0.79 4.15 6.6 4.00 1.35 Cr Qbt5-background 7 1.2 2.5 5.6 2.67 1.44
--'I 26
I
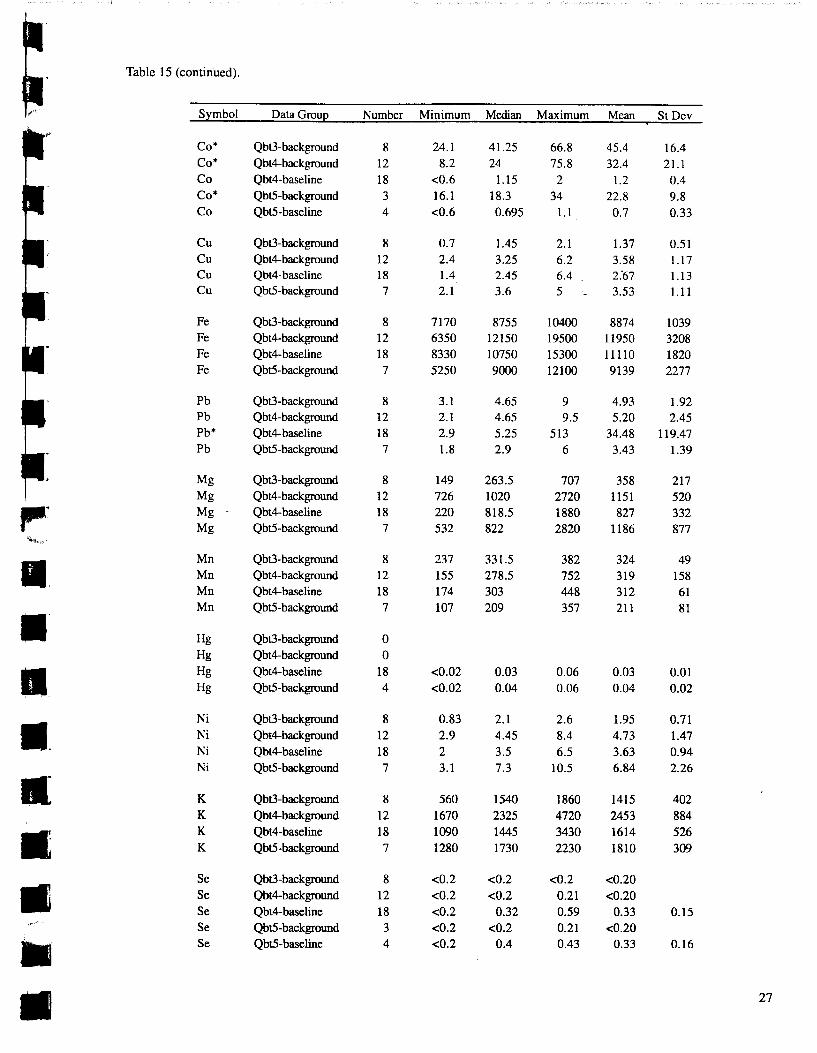
• • • •• • • •
Table 15 (continued).
Symbol Data Group
Co* Qbt3-background Co* Qbt4-background Co Qbt4-base1ine Co* Qbt5-background Co Qbt5-baseline
Cu Qbt3-background Cu Qbt4-background Cu Qbt4-baseline Cu Qbt5-background
Fe Qbt3-background Fe Qbt4-background Fe Qbt4-base1ine Fe Qbt5-background
Pb Qbt3-background Pb Qbt4-background Pb* Qbt4-baseline Pb Qbt5-background
Mg Mg Mg Mg
Mn Mn Mn Mn
Hg Hg Hg Hg
Ni Ni Ni Ni
K K K K
Se Se Se Se Se
Qbt3-background Qbt4-background Qbt4-baseline Qbt5-background
Qbt3-background Qbt4-background Qbt4-baseline Qbt5-background
Qbt3-background Qbt4-background Qbt4-baseline Qbt5-background
Qbt3-background Qbt4-background Qbt4-baseline Qbt5-background
Qbt3-background Qbt4-background Qbt4-base1ine Qbt5-background
Qbt3-background Qbt4-background Qbt4-base1ine Qbt5-background Qbt5-baseline
Number Minimum Median Maximum Mean St Dev
8 24.1 41.25 66.8 45.4 16.4 12 8.2 24 75.8 32.4 21.1 18 <0.6 1.15 2 1.2 0.4 3 16.1 18.3 34 22.8 9.8 4 <0.6 0.695 1.1 0. 7 0.33
8 0.7 1.45 2.1 1.37 0.51 12 2.4 3.25 6.2 3.58 1.17 18 1.4 2.45 6.4 2."67 1.13 7 2.1 3.6 5 3.53 1.11
8 7170 8755 10400 8874 1039 12 6350 12150 19500 11950 3208 18 8330 10750 15300 11110 1820 7 5250 9000 12100 9139 2277
8 3.1 4.65 9 4.93 1.92 12 2.1 4.65 9.5 5.20 2.45 18 2.9 5.25 513 34.48 119.47 7 1.8 2.9 6 3.43 1.39
8 12 18 7
8 12 18 7
0 0
18 4
8 12 18 7
8 12 18 7
8 12 18 3 4
149 263.5 726 1020 220 818.5 532 822
237 331.5 155 278.5 174 303 107 209
<0.02 0.03 <0.02 0.04
0.83 2.1 2.9 4.45 2 3.5 3.1 7.3
560 1540 1670 2325 1090 1445 1280 1730
<0.2 <0.2 <0.2 <0.2 <0.2 0.32 <0.2 <0.2 <0.2 0.4
707 2720 1880 2820
382 752 448 357
0.06 0.06
2.6 8.4 6.5
10.5 .
1860 4720 3430 2230
<0.2 0.21 0.59 0.21 0.43
358 1151 827
1186
324 319 312 211
0.03 0.04
1.95 4.73 3.63 6.84
1415 2453 1614 1810
<0.20 <0.20
0.33 <0.20
0.33
217 520 332 877
49 158 61 81
0.01 0.02
0.71 1.47 0.94 2.26
402 884 526 309
0.15
0.16
27
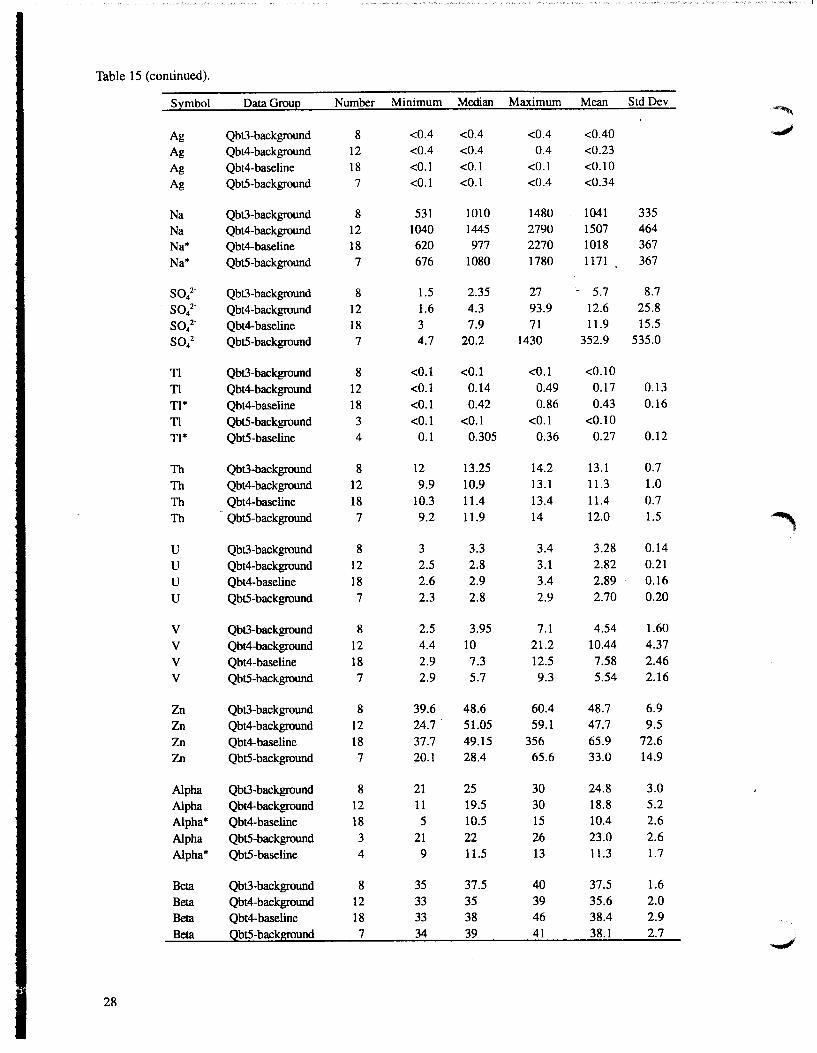
Table 15 (continued).
Symbol Data Group Number Minimum Median Maximum Mean Std Dev
""""' Ag Qbt3-background 8 <0.4 <0.4 <0.4 <0.40 ...,.,
Ag Qbt4-background 12 <0.4 <0.4 0.4 <0.23
Ag Qbt4-baseline 18 <0.1 <0.1 <0.1 <0.10
Ag Qbt5-background 7 <0.1 <0.1 <0.4 <0.34
Na Qbt3-background 8 531 1010 1480 1041 335
Na Qbt4-background 12 1040 1445 2790 1507 464
Na* Qbt4-baseline 18 620 977 2270 1018 367
Na* Qbt5-background 7 676 1080 1780 1171 367
SO/ Qbt3-background 8 1.5 2.35 27 - 5.7 8.7
so42- Qbt4-background 12 1.6 4.3 93.9 12.6 25.8
so42- Qbt4-baseline 18 3 7.9 71 11.9 15.5
so42- Qbt5-background 7 4.7 20.2 1430 352.9 535.0
Tl Qbt3-background 8 <0.1 <0.1 <0.1 <0.10
Tl Qbt4-background 12 <0.1 0.14 0.49 0.17 0.13
Tl* Qbt4-baseline 18 <0.1 0.42 0.86 0.43 0.16
Tl Qbt5-background 3 <0.1 <0.1 <0.1 <0.10
Tl* Qbt5-baseline 4 0.1 0.305 0.36 0.27 0.12
Th Qbt3-background 8 12 13.25 14.2 13.1 0.7
Th Qbt4-background 12 9.9 10.9 13.1 11.3 1.0
Th Qbt4-base1ine 18 10.3 11.4 13.4 11.4 0.7
Th Qbt5-background 7 9.2 11.9 14 12.0 1.5
u Qbt3-background 8 3 3.3 3.4 3.28 0.14
u Qbt4-background 12 2.5 2.8 3.1 2.82 0.21
u Qbt4-baseline 18 2.6 2.9 3.4 2.89 0.16
u Qbt5-background 7 2.3 2.8 2.9 2.70 0.20
v Qbt3-background 8 2.5 3.95 7.1 4.54 1.60
v Qbt4-background 12 4.4 10 21.2 10.44 4.37
v Qbt4-baseline 18 2.9 7.3 12.5 7.58 2.46
v Qbt5-background 7 2.9 5.7 9.3 5.54 2.16
Zn Qbt3-background 8 39.6 48.6 60.4 48.7 6.9
Zn Qbt4-background 12 24.7 51.05 59.1 47.7 9.5
Zn Qbt4-baseline 18 37.7 49.15 356 65.9 72.6
Zn Qbt5-background 7 20.1 28.4 65.6 33.0 14.9
Alpha Qbt3-background 8 21 25 30 24.8 3.0
Alpha Qbt4-background 12 11 19.5 30 18.8 5.2
Alpha* Qbt4-baseline 18 5 10.5 15 10.4 2.6
Alpha Qbt5-background 3 21 22 26 23.0 2.6
Alpha* Qbt5-baseline 4 9 11.5 13 11.3 1.7
Beta Qbt3-background 8 35 37.5 40 37.5 1.6
Beta Qbt4-background 12 33 35 39 35.6 2.0
Beta Qbt4-baseline 18 33 38 46 38.4 2.9
Beta Qbt5-back8!2und 7 34 39 41 38.1 2.7
28
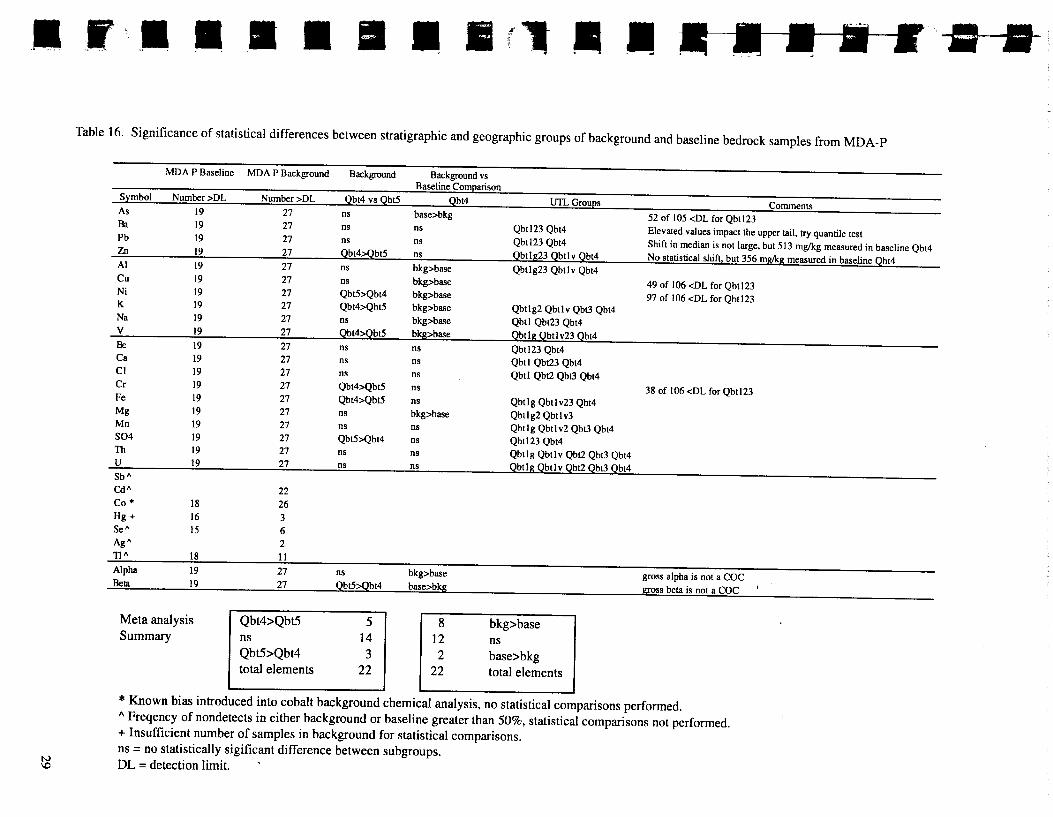
•r••••••• . ..... ., - .. . . . . . . ., ••
~
Table 16. Significance of statistical differences between stratigraphic and geographic groups of background and baseline bedrock samples from MDA-P
MDA P Baseline MDA P Background Background Background vs Baseline Comparison
Symbol Number >DL Num~ >DL _ __Qbt4 vs Qbt5 Qbt4 UTL Groups As 19 27 ns base>bkg 52 of 105 <DL for Qbtl23
Comments
Ba 19 27 ns ns Qbt123 Qbt4 Elevated values impact the upper tail, try quantile test Pb 19 27 Zn 19 27 AI 19 27 Cu 19 27 Ni 19 27 K 19 27 Na 19 27 v 19 27 Be 19 27 Ca 19 27 Cl 19 27 Cr 19 27 Fe 19 27 Mg 19 27 Mn 19 27 S04 19 27 Th 19 27 u 19 27 Sb" Cdll 22 Co* 18 26 Hg + 16 3 Se" 15 6 Ag" 2 11" 18 II Alpha 19 27 Beta 19 27
Meta analysis Qbt4>Qbt5 Summary ns
Qbt5>Qbt4 total elements
ns ns Qbtl23 Qbt4 Shift in median is not large, but 513 mglkg measured in baseline Qbt4 Qbt4::>Ql&_ ns Qbt1g23 Qbt1v Qbt4 _No statistical ~ift, I:Ju_t 35_§ mg/kg measured in baseline Qbt4 ns bkg>base Qbtlg23 Qbt1v Qbt4 ns bkg>base Qbt5>Qbt4 bkg>base Qbt4>Qbt5 bkg>base Qbt1g2 Qbt1v Qbt3 Qbt4 ns bkg>base Qbt1 Qbt23 Qbt4 Qbt4>Qbt5 bkg>base Qbt1g Qbt1 v23 Qbt4 ns ns Qbt123 Qbt4 ns ns Qbt1 Qbt23 Qbt4 ns ns Qbt1 Qbt2 Qbt3 Qbt4 Qbt4>Qbt5 ns Qbt4>Qbt5 ns Qbtlg Qbtlv23 Qbt4 ns bkg>base Qbtlg2 Qbt1v3 ns ns Qbt1g Qbtlv2 Qbt3 Qbt4 Qbt5>Qbt4 ns Qbt123 Qbt4 ns ns Qbt1g Qbt1v Qbt2 Qbt3 Qbt4 ns ns Qbt1g Qbt1v Qbt2 Qbt3 Qbt4
49 of 106 <DL for Qbt123 97 of 106 <DL for Qbt123
38 of 106 <DL for Qbt123
ns bkg>base gross alpha is not a COC Qbt5>Qbt4 base>bkg gross beta is not a COC
5 14 3
22
8 12 2
22
bkg>base ns base>bkg total elements
* Known bias introduced into cobalt background chemical analysis, no statistical comparisons performed. " Freqency of non detects in either background or baseline greater than 50%, statistical comparisons not performed. + Insufficient number of samples in background for statistical comparisons. ns = no statistically sigificant difference between subgroups. DL = detection limit.
--JJ--11-
and Cd, background and baseline analyses of bedrock used the same method. For Cd, HN03-leachable baseline analyses by inductively coupled plasma emission spectroscopy (ICPES), uniformly <0.1 ppm (Appendix F), are lower than total element values typical for silicic rocks of 0.1 to 0.2 ppm (Wedepohl, 1978), whereas background analyses are higher, averaging 0.5 to 0.9 ppm for Units 3 to 5 (see discus- ~ sion below). It is conceivable that the higher Cd values for the background samples reflect contamina-tion from pulverizing in a tungsten carbide shatterbox. Thompson and Bankston (1970) provide no data for Cd to evaluate this possibility, but they do demonstrate extremely low levels of contamination by Zn, a strongly associated element. Thus, it is unlikely that Cd was introduced during sample prepa-ration. Both background and baseline soil samples from MDA-P, analyzed for Cd by the superior method of inductively coupled plasma mass spectrometry (ICPMS), like baseline bedrock analyses, show HN03-leachable Cd contents (Table 11) uniformly <0.1 ppm (Appendix D-). The much higher LANL-wide average value for Cd of 0.4 ppm in all soil horizons shown in_ Table 11 was obtained by ICPES (Table 2 in McDonald et al., 1996). Such a discrepancy is most likely due to erroneously high Cd by ICPES. But this conclusion is consistent with analyses for bedrock only if baseline Cd was actually analyzed by ICPMS, rather than by ICPES as reported in request number LANL 1794. Such may be the case because the detection limit of 0.1 ppm reported for baseline Cd (Appendix F) matches that for soils (Appendices D, E), which were analyzed by ICPMS, but is lower than that reported for background bedrock (0.2 ppm), analyzed by ICPES (Broxton et al., 1996).
For background samples, As was analyzed by superior methods (graphite furnace absorption spectroscopy for bedrock and electrothermal vapor atomic absorption spectroscopy for soil), whereas for baseline samples, As was analyzed by ICPES (Table 3). Neutron activation analysis (NAA) for As in nine samples of Unit 4 bedrock average 1.00 ppm (David E. Broxton, personal communication), similar to an average of 0.98 ppm for background analyses (Broxton et al., 1996). Baseline analyses average ~ nearly four times higher, as described later in the report. Because As should be almost entirely in leachable form, and because NAA is a superior analytical method for As, background analyses are probably correct and baseline analyses are erroneously high. The possibility that all baseline samples are contaminated with As is highly unlikely because most baseline samples show no evidence of contamination, as discussed below. For As in soils, HN03-leachable values average more than twice those for total element values, providing very direct evidence for the poor quality of As analyses by ICPES.
Analyses for Tl in both background and baseline soil samples and in background bedrock samples were by the superior method of ICPMS, as opposed to ICPES for baseline samples of bedrock. The baseline samples of bedrock exhibit much higher values for Tl than the other three datasets so these Tl values are undoubtedly erroneously high.
For several additional elements, analyses were performed by the same method but values are statistically different between datasets without any apparent natural or anthropogenic cause. These differ- . ences certainly reflect small analytical biases between datasets for gross beta, Na, and Kin bedrock (Table 13), and a large, statistically significant analytical bias between datasets for Na in soil (Table 11). Baseline analyses for Na in bedrock (Appendix F) were flagged with a relatively low-quality level, but Na analyses for background analyses (Broxton et al., 1996) were not, indicating that the background analyses for Na are superior.
7.3. General Patterns Related to Stratigraphic Level of Bedrock at MDA-P
The variety of patterns in background and baseline chemistry for the leachable portions of elements at MDA-P (Table 13) closely resemble the general patterns for total element present or phenocryst miner-
30
' I
~ •: •• • • •• •• • k
•
alogy at MDA-P (Appendix I; Broxton et al., 1996), and at other areas where the Tshirege Member has been analyzed (Broxton et al., in review). Chemical trends that are obscured by the relatively poor analytical quality of EPA-SW846 analytical methods are clearly recognizable from XRF analyses, which have 2 sigma accuracies as good as 1% of the value (see Appendix G and Broxton et al., 1996 for estimated accuracies of each analysis). Petrographic trends are revealing because phenocryst abundances may differ within a zoned tuff by orders of magnitude, such as apatite abundances within Units 3 to 5 of the Tshirege Member. Taken together, the remarkable co variation of total element present by XRF analyses and phenocryst mineralogy defines an unusual pattern of reverse primary (magmatic) zonation within Unit 4 of the Tshirege Member.
The patterns that demonstrate reverse zonation within the Tshirege Member are illustrated for two element/phenocryst pairs in Fig. 6. Apatite represents compatible minerals such as mafic minerals and P20s represents compatible elements such as transition elements. Such phenocryst minerals and elements generally concentrate in upper parts of zoned tuffs such as the Tshirege Member, reflecting their concentration in the lower parts of magma chambers. Quartz represents incompatible minerals such as sphene (not present in Tshirege Member) and Si02 represents incompatible elements such as U and Th that concentrate in residual glass. Such phenocryst minerals and elements generally concentrate in lower parts of zoned tuffs such as the Tshirege Member, reflecting their concentration in the upper parts of magma chambers. Previous work (Broxton et al., 1996; Smith and Bailey, 1966) has demonstrated a general pattern of normal zonation within the Tshirege Member, which is observed in Fig. 6 as a general upward increase in compatible minerals and elements, together with a general upward decrease in incompatible minerals and elements. But a large upward decrease in apatite and P20s, together with a slight upward increase in quartz and Si02, define a reverse zonation within Unit 4 that has been previously unrecognized. This reverse zonation results in a three-fold systematic variation within Unit 4 for P20s and several other elements, such as CaO, Sr, and Fe203 (see Broxton et al., 1996). The associated variation in phenocryst content is nearly two orders of magnitude for apatite.
Subunits that are transitional in chemistry and petrography between Units 3 and 4 are also defined from the XRF analyses, detailed petrography, and field characteristics. These subunits are Unit 3t, which is chemically indistinguishable from Unit 3, but contains a much lower content of quartz phenocrysts, and Unit4t, which is petrographically indistinguishable from Unit 4, but chemically intermediate between Units 3 and 4 (Fig. 6) .
It is remarkable that patterns for leachable portions follow magmatic patterns defined from total element concentrations, considering the large differences in leachable fraction for each element. For example, transition metal elements such as Fe and Zn occur in 50% to 100% leachable form, primarily within magnetite, mafic minerals (mostly pyroxene), and their alteration products. ButAl and Ca also show patterns similar to magmatic patterns even though only about 7% of the Aland 25% of theCa occurs in leachable form. The similarities between leachable and total element concentrations are demonstrated for representative elements in Fig. 7 .
7.4. General Patterns Related to Alteration of Bedrock at MDA-P
Plots of elevation versus HN03-leachable chemical data (Fig. 5) show that vitric samples of bedrock, which are the eight samples in these plots with the highest elevations (except for the fifth highest) conform to the same patterns as devitrified samples. This conclusion is tentative because it is based on few samples and somewhat obscured by excursions for many elements in samples DEBS/95111-13,
31
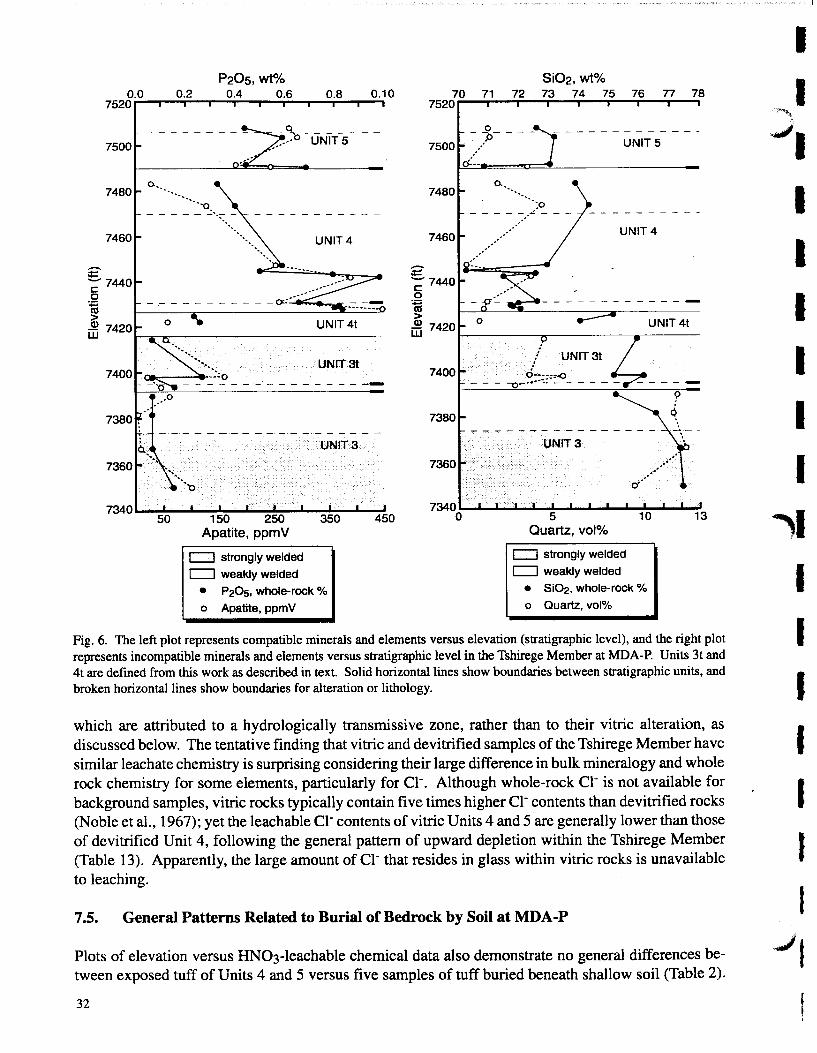
0.0 7520
7500
7480 0.
P20s, wt% 0.2 0.4 0.6
............
c:::J strongly welded
c:::J weakly welded
0.8
UNJT3t
UNIT3
• P20s, whole-rock %
o Apatite, ppmV
0.10
2
Si02, wt% 70 71 72 73 74 75 76 77 78
7520
7500
7480
7460
~ .. -:~>----cf---
o. ........ _:o - - - - ~-:;~~..! - - -
,,·''
.· ~~·#''" ..
UNITS
UNIT4
-; 7440 0
~ > ~ 7420~--------~--------~~-----
.' UNIT3t
- - - -o~~;:;_:::_..O- - - - -
7380
UNIT3
7360
7340~~~~~~~~~~._~~~-J 0 5
Quartz, vol%
c:::J strongly welded
c:::J weakly welded
• Si02, whole-rock %
o Quartz, vol%
Fig. 6. The left plot represents compatible minerals and elements versus elevation (stratigraphic level), and the right plot represents incompatible minerals and elements versus stratigraphic level in the Tshirege Member at MDA-P. Units 3t and 4t are defined from this work as described in text. Solid horizontal lines show boundaries between stratigraphic units, and broken horizontal lines show boundaries for alteration or lithology.
which are attributed to a hydrologically transmissive zone, rather than to their vitric alteration, as discussed below. The tentative finding that vitric and devitrified samples of the Tshirege Member have similar leachate chemistry is surprising considering their large difference in bulk mineralogy and whole rock chemistry for some elements, particularly for Cl-. Although whole-rock Cl- is not available for background samples, vitric rocks typically contain five times higher Cl- contents than devitrified rocks (Noble et al., 1967); yet the leachable Cl- contents ofvitric Units 4 and 5 ·are generally lower than those of devitrified Unit 4, following the general pattern of upward depletion within the Tshirege Member (Table 13). Apparently, the large amount of Cl- that resides in glass within vitric rocks is unavailable to leaching.
7.5. General Patterns Related to Burial of Bedrock by Soil at MDA-P
Plots of elevation versus HN03-leachable chemical data also demonstrate no general differences between exposed tuff of Units 4 and 5 versus five samples of tuff buried beneath shallow soil (Table 2).
32
, I
I
I -'a
I I I I I I
~I
I I I I I I
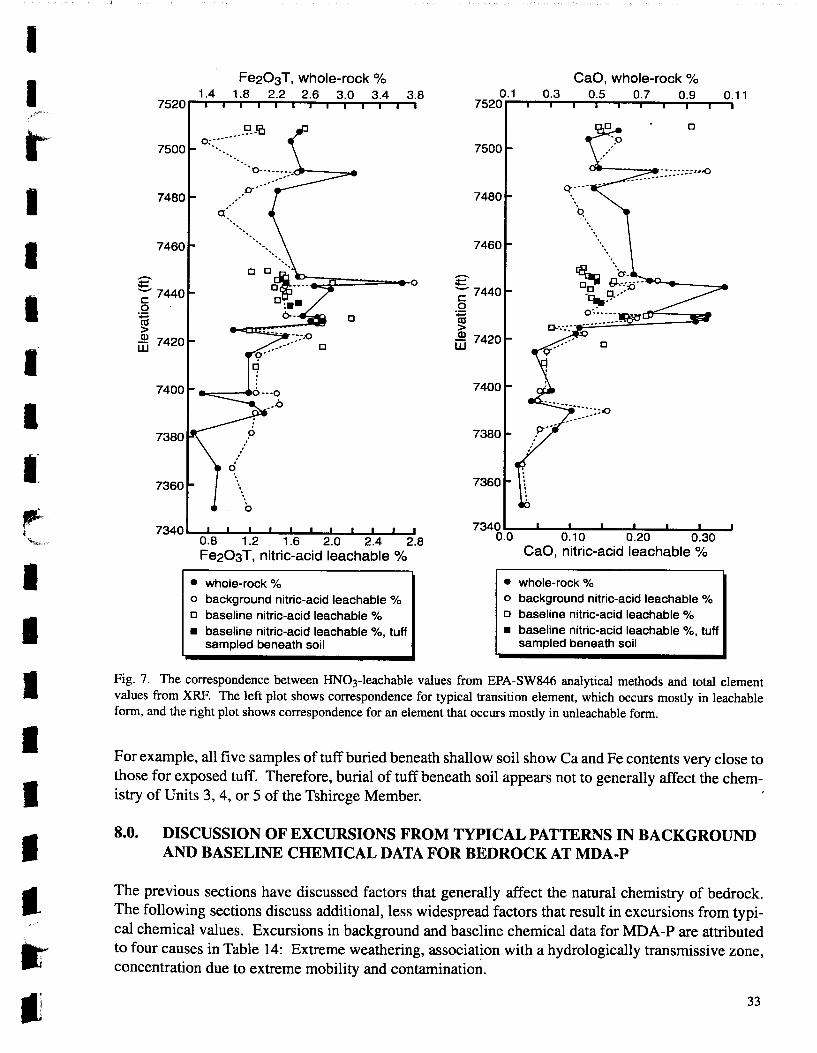
I
I I
I
I
I
I
I
I
I I.
7500
7480
7460
E'
_____ r::uo o:·--· .. ..........
E'
CaO, whole-rock% 0.1 0.3 0.5 0.7 0.9 0.11
7520~~~~T-~~~~~~~~~
7500
7480
7460
--; 7440 --; 7440 0 0
~ Q)
w
7360
0
• whole-rock % o background nitric-acid leachable % o baseline nitric-acid leachable % • baseline nitric-acid leachable %, tuff
sampled beneath soil
~ ~ 7420
7400
• whole-rock % o background nitric-acid leachable % o baseline nitric-acid leachable % • baseline nitric-acid leachable %, tuff
sampled beneath soil
Fig. 7. The correspondence between HN03-leachable values from EPA-SW846 analytical methods and total element values from XRF. The left plot shows correspondence for typical transition element, which occurs mostly in leachable form, and the right plot shows correspondence for an element that occurs mostly in unleachable form.
For example, all five samples of tuff buried beneath shallow soil show Ca and Fe contents very close to those for exposed tuff. Therefore, burial of tuff beneath soil appears not to generally affect the chemistry of Units 3, 4, or 5 of the Tshirege Member.
8.0. DISCUSSION OF EXCURSIONS FROM TYPICAL PATTERNS IN BACKGROUND AND BASELINE CHEMICAL DATA FOR BEDROCK AT MDA-P
The previous sections have discussed factors that generally affect the natural chemistry of bedrock. The following sections discuss additional, less widespread factors that result in excursions from typical chemical values. Excursions in background and baseline chemical data for MDA-P are attributed to four causes in Table 14: Extreme weathering, association with a hydrologically transmissive zone, concentration due to extreme mobility and contamination.
33
8.1. Excursions in Bedrock Related to Alteration and Weathering at MDA-P
Two sets of samples were collected to evaluate a common weathering effect, recognizable by the formation of spherules in samples collected from MDA-P (Table 12). No sample from either set showed any deviation from the general pattern observed for Unit 4 of the Tshirege Member, indicating that such effects occur within an effectively closed chemical system on the 1 0-cm scale of sampling at MDA-P. But one extremely weathered sample, DEB6/95/5, sampled as an alteration-banded block surrounded by soil (Table 12), provided excursions for five elements (Table 14); all five elements showed similar excursions for total element present (Broxton et al., 1996).
8.2. Excursions in Bedrock Related to Association with a Hydrologically Transmissive Zone and Concentration due to Extreme Mobility at MDA-P
Cations mobile in aqueous solution, Na, K, and Mg, each show a single positive excursion from the typical general pattern versus stratigraphic level, but all cases are confined to samples DEBS/95111-13 (Table 14 ). The value for each element, each just below its UTL, is the highest value for each element in Appendix IV of Broxton et al. (1996). Samples DEBS/95/11-13 comprise a lithologic sequence, including and above a base surge that generally forms hydrologically transmissive zones throughout the Tshirege Member that can easily concentrate elements from solutions passing through preferentially (Rogers and Gallaher, 1995; Broxton et al., in review; Rogers et al., 1996). This zone at MDAp is also an enormous sink for cl- and S042-, which travel as anions. Apparently, these anions are so extremely mobile in the weathering environment that they can also be concentrated, but to a lesser degree, in less optimum environments, as indicated by the listing of several excursions in Table 14. The excursions attributed to extreme mobility are those >49.9 ppm for Ct and those ~71 ppm for *"" S042- in Appendix F and Appendix IV of Broxton et al. (1996).
Alternatively, most of the excursions attributed to a hydrologically transmissive zone might instead be the result of vitric alteration. However, two observations argue against this interpretation: (1) DEBS/ 95110, immediately below the base surge, is vitric as are all four samples from Staging Area 1, but none of these samples show a single excursion, and (2) DEBS/95113, a devitrified densely welded tuff that lies within the hydrologically transmissive zone shows an extreme excursion for S042-.
8.3. Excursions in Bedrock Related to Contamination at MDA-P
Large excursions from the general patterns of chemistry versus stratigraphic level occur for Pb and Zn in sample RW16PA2, and small excursions occur for As and Be in this same sample (Table 14). These excursions exceed UTLs for Unit 4 (Broxton et al, 1996), except for Be, which therefore cannot be confidently defined as an excursion. These elements are not highly mobile within the weathering environment, so their abnormal values in this sample are attributed instead to contamination from operations at the TA-16 burning ground. Table 2 in Rivera-Dirks and Conrad (1995) reports concentrations for the same suite of elements within a soil sample (PRS 16-01 OB 14) that are two orders of magnitude higher in Pb and As than any of the other 27 soil samples reported; Zn was not analyzed. This sample also has the highest levels for Ag, Cd, Cr, and Se shown in their Table 2. Samples RW16PA2 and PRSOlOB 14 suggest the presence of an uncommon contaminant with a distinctive chemical signature of Pb, Zn, As, and Cd, and much lesser Be and Se. It is also possible that these two samples might reflect natural enhancements resulting from absorption by iron oxides and hydroxides, as demonstrated """"" for As and Be in soils of the Pajarito Plateau (Figures 17 and 18 in Longmire et al., 1996). Indeed,
34
• • II
• • •• ~·
..,. ........ ·
• • • • •
sample RW16PA2 (the baseline value plotted in Fig. 7 at 7430 ft elevation) is enriched in Fe (Fe is not reported for sample PRS16-0IOB14). But sample RW16PA2 is also enriched in other compatible elements (e.g., Ca as seen in Fig. 7), so that the elevated Fe may simply reflect magmatic zonation. Although the small degree of enrichment in As and particularly Be might reflect natural enhancement resulting from absorption by iron oxides and hydroxides, the Pb value for sample RW16PA2 exceeds the highest background value for soils (Table 7 in Longmire, et al., 1996) by nearly an order of magnitude and certainly reflects contamination .
Baseline bedrock samples show evidence of widespread Ba contamination at MDA-P, similar to that found for soils and discussed earlier within this report (Fig. 5). Although sample RW16PA2 does not exhibit an excursion for Ba, all three other samples collected along the -Run-on Control Trench (Table 2) show large to small excursions, and six other samples collected from the Segregation Area and Decontamination Pad near the waste pile show large excursions. Except for samples DCN 1-R and DCN3-R, collected from the Decontamination Pad very near to the waste pile and covered by very shallow fill (Table 2), samples of tuff that are protectively buried beneath soil exhibit Ba values that closely follow the general patterns of chemistry versus stratigraphic level. Contamination from Ba has been clearly defined in previous work at MDA-P for soils and sediment (McLin, 1989; Rivera-Dirks and Conrad, 1995; McDonald et al., 1996). This work indicates that Ba contaminates bedrock exposed near the TA-16 burning ground as well.
8.4. Summary of General Patterns in Background and Baseline Chemical Data for Bedrock at MDA-P and Excursions from These Patterns
Consistent and realistic values indicate a generally good quality for most analyses of the leachable portions of 27 elements and for two measurements of gross radioactivity. However, an inconsistency between background and baseline analyses identifies major analytical problems for four elements (gross alpha, As, Tl, and Cd), and minor analytical problems for 3 others (gross beta, Na, and K). Excluding those elements with major analytical problems and several elements with most values below detection limits, all elements analyzed generally follow patterns of chemistry versus stratigraphic level that reflect primary (magmatic) zonation of the Tshirege Member, which is well defined at MDA-P from total element analyses by XRF and detailed petrographic analyses. Magmatic chemical or petrographic trends are mimicked even though the fraction of element leached varies from near 100% for many transition metal elements to < 10% for Al.
Within the set of 46 background and baseline samples are several subsets of samples that allow an assessment of factors other than stratigraphic level that might affect the chemical data (Table 14). These factors include the effect of burial by soil, weathering within uppermost bedrock, and rock alteration (vitric versus devitrified tuff). In all cases, these factors appear to have a negligible effect on the general patterns of chemistry versus stratigraphic level, and only extreme weathering is recognizable as a cause of excursions from the general patterns. Excursions are very important, because they can be the result of contamination from cultural sources, but this work demonstrates that many have natural causes.
Many of the 34 excursions from the general patterns of chemistry versus stratigraphic level identified within the 1311 background and baseline analyses are attributed to contamination from operations at the TA-16 burning ground (Table 14). The majority of excursions attributed to contamination are for a single element, Ba, which is expected to be the most prominent contaminant. The contamination of Ba
35
depends upon the nature and location of the sample; samples downstream from the waste pile are most strongly contaminated, but those protected by soil are slightly contaminated only at locations extremely close to the waste pile.
Most of the other excursions are attributed to two natural causes: association with a hydrologically transmissive zone and extreme weathering (Table 14). Hydrologically transmissive zones apparently can foster enrichment for many elements that may be extreme for highly mobile species such as CIand S042-. These environments are recognized by applying an understanding of the processes of hydrology and weathering to thorough geologic observations made at each local sampling area and at each sample site, such as the observations provided in Appendix B.
9.0. RELATIONSHIPS BETWEEN SOIL AND BEDROCK AT MDA-P
The geochemical development of soils is a very complex process that depends on the relative amounts of windblown and waterborne material that are added to bedrock, plus the degree to which this mixture has been weathered. Considering the complexities, underlying bedrock provides the simplest available reference to gauge the geochemical development of soils. Closely matching compositions of bedrock and soil suggest the addition of relatively small amounts of added windblown and waterborne material, as well as minimal weathering. In addition, a comparison of the HN03-leachable fraction of each element provides an assessment of the similarity in mineralogy between soil and bedrock.
Leachable element values are grossly similar between soil and bedrock at MDA-P. Mean values for the A2 horizon of background soils compare within a factor of 2 with those of bedrock buried beneath the Segregation Area for 75% of elements available for comparison (Fig. 8). Of the five elements outside this range, Na and Tl are untrustworthy because of analytical problems, and Ba is strongly affected by contamination even within the A2 horizon, as discussed below. The HN03-leachable fraction for each element is also generally similar between bedrock and soil; both have very low fractions of leachable alkali elements and relatively high fractions of transition elements (Fig. 9).
Soils sampled elsewhere on the Pajarito Plateau (generally well east ofMDA-P, from stratigraphically lower Units 1 to 3) show greater chemical discrepancies with bedrock than at MDA-P. All elements enriched in soil versus bedrock at MDA-P (Fig. 8) are more enriched in soils elsewhere on the plateau (compare chemical values of all soil horizons for MDA-P versus those LANL-wide in Table 11). These same elements are more depleted in bedrock elsewhere on the plateau, from a comparison of values for Unit 4, representing MDA-P, versus those for Unit 3 (Broxton et al., 1996), representing bedrock elsewhere. This general trend of eastward elemental enrichment with decreasing elevation for soils and eastward elemental depletion with increasingly lower stratigraphic level for bedrock is illustrated for Ni in Fig. 10. Thus soil at MDA-P is more closely related to bedrock at MDA-P than · elsewhere on the Pajarito Plateau, and a chemical comparison between soil and bedrock is less complicated by the processes of soil development for MDA-P than elsewhere on the Pajarito Plateau.
Despite the significant chemical control by unknown pedologic processes, comparisons between the chemistry of individual soil horizons and underlying bedrock clearly reveal contamination from anthropogenic activities at MDA-P. Figure 11 compares leachable element values for soils directly with those from underlying bedrock, and Fig. 12 shows the leachable fraction of each element for these same soils. The correspondence between elemental concentrations elevated within the upper part of ~ the soil A horizon (Fig. 11) and those with elevated leachable fractions (Fig. 12) is striking, and
36
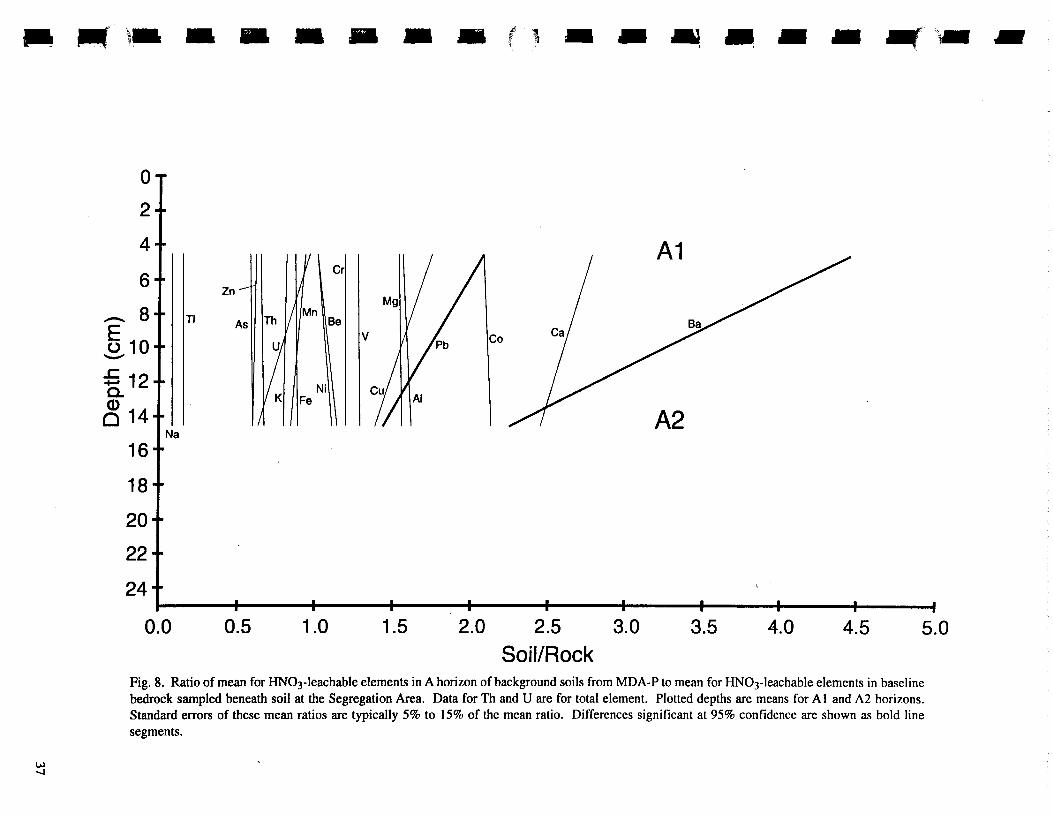
-
\.>.) o,J
·\- - - -0
2
4
6 Zn
Cr
- 8TIITI
5 10 -Be As
£12 a. ~ 14
16
18
20
22
24 1-
0.0 0.5 1.0
- - -
v
1.5 2.0
it~ 'I f lJ -
Co
2.5
Soil/Rock
-
3.0
~ ... - - ...
A1
A2
3.5 4.0 4.5 5.0
Fig. 8. Ratio of mean for HN03-leachable elements in A horizon of background soils from MDA-P to mean for HN03-leachable elements in baseline bedrock sampled beneath soil at the Segregation Area. Data for Th and U are for total element. Plotted depths are means for A I and A2 horizons. Standard errors of these mean ratios are typically 5% to 15% of the mean ratio. Differences significant at 95% confidence are shown as bold line segments.
..
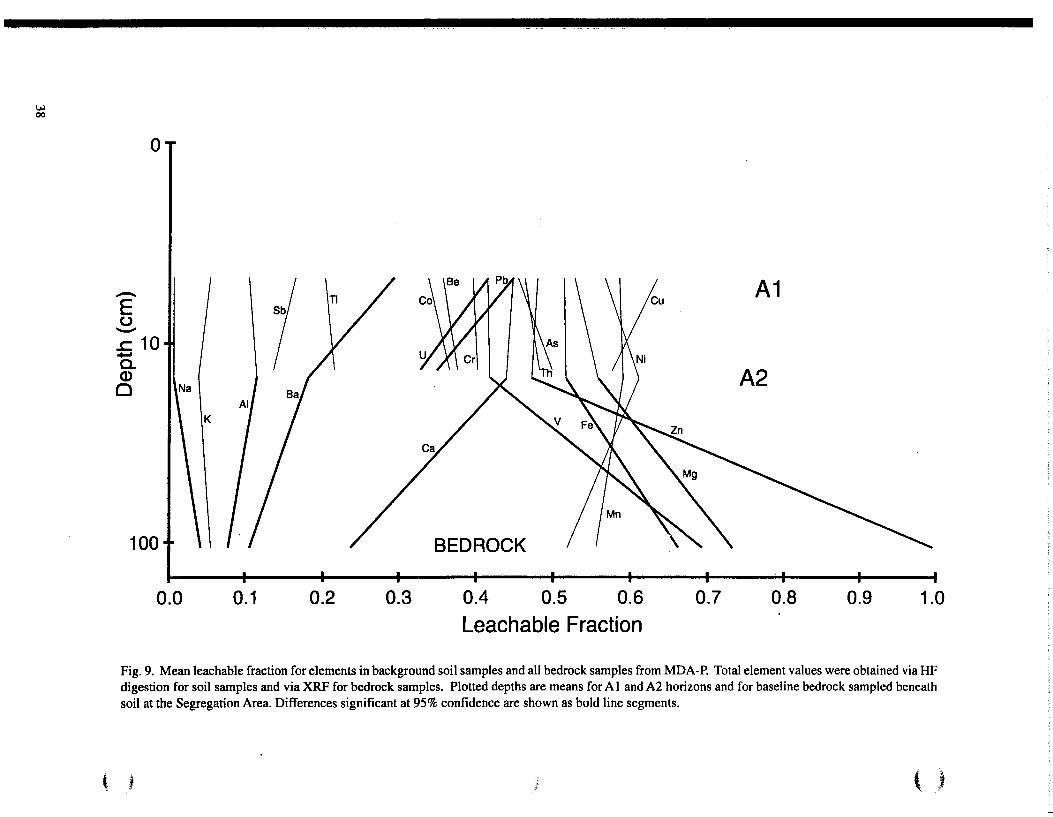
w 00
0
-E 0 -..c 10 +-' a. Q)
0
100
0.0 0.1 0.2 0.3
A1
A2
BEDROCK
0.4 0.5 0.6 0.7 0.8 0.9 1.0
Leachable Fraction
Fig. 9. Mean leachable fraction for elements in background soil samples and all bedrock samples from MDA-P. Total element values were obtained via HF digestion for soil samples and via XRF for bedrock samples. Plotted depths are means for A 1 and A2 horizons and for baseline bedrock sampled beneath soil at the Segregation Area. Differences significant at 95% confidence are shown as bold line segments.
• J ~ ,J
I
I I I II I I
I I I I I I
-
demonstrates with statistical significance that Ba, Pb, Ag, S042- are concentrated in soluble form near the surface. We attribute the concentration of these elements to anthropogenic contamination because there is no pedologic reason for these species to concentrate within the uppermost .soil horizon relative to underlying horizons. Figures 8 and 9 demonstrate with statistical significance that Ba and Pb are concentrated in soluble form near the surface at much greater distances from the sources of anthropogenic contamination than the baseline samples; such widespread contamination does not occur for Ag, and data are unavailable to evaluate S042-. Figures 8, 9, 11, and 12 also define consistent widespread enrichment of U, Cu, and Ca in soluble form near the surface, probably because of contamination, although differences are not statistically significant in all cases. Concentrations of U that are above LANL-wide background have been recognized in places across the Laboratory (Longmire et al., 1997). These elevated concentrations of U appear to have resulted from aerosolic dispersal from firing sites. Elevated levels of U near MDA-P may also reflect possible contributions from firing sites located at TA-67 (Pajarito Mesa), TA-9, or TA-15.
A single element, Be, appears to vary appreciably within the soil A horizon as a result of pedologic processes. Downward decreasing concentrations and fractions of leachable Be consistently occur within both baseline and background samples. Such chemical trends are very rare and obviously cannot reflect contamination. ·
10.0. CONCLUSIONS FROM BASELINE STUDY OF MDA-P
The chemical analyses reported herein, when combined with field observations and detailed petrographic analyses also shown here, and the results of background studies (Broxton et al., 1966; McDonald et al., 1996), lead us to conclude that wind-borne contamination is widespread from the TA-16 burning ground. Near this contaminating source at the Segregation Area and Decontamination Pad, both amounts and relative fractions ofHN03-leachable Ba are highly enriched in both soil and bedrock. Near source, amounts and relative fractions of HN03-leachable Pb and Ag are also enriched in soil. Farther from the source, background soil samples show the same enrichment patterns for Ba and Pb, indicating widespread wind-borne contamination for these elements. Although enrichments in soils are not statistically significant for all comparisons of U, Cu, and Ca, these elements consistently show the same enrichment patterns as Ba and Pb, so they too are probably widespread contaminants in soils.
Both HN03-leachable and total element contents, as well as the abundances of primary (phenocryst) minerals within the upper part of the Tshirege Member vary strongly within Unit 4 in a systematic pattern that reflects a primary (magmatic) reverse zonation. This zonation results in chemical variations for some elements within Unit 4 within a factor of three and variations for some phenocryst abundances that exceed two orders of magnitude. Because of this effect, accurate chemical comparisons are possible only when the stratigraphic level within Unit 4 is accurately known. In cases where Unit 4 is sampled uniformly, large standard deviations will result from simple statistical analyses of data from Unit 4. In cases where restricted parts of Unit 4 are preferentially sampled, significant chemical differences between datasets may be calculated if the parts sampled are at different stratigraphic levels, as is the case for the comparison between baseline and background bedrock for Unit 4 at MDA-P. The problem of distinguishing chemical excursions from this extreme chemical variation within Unit 4 is addressed by examining plots of data versus stratigraphic level. Within the entire area sampled for baseline and background study of MDA-P, perfectly horizontal attitudes for units of the Tshirege Member are a fortunate consequence of geologic structure, allowing the equation of stratigraphic level to sample elevation. From plots of data versus sample elevation, recognizable chemical
39
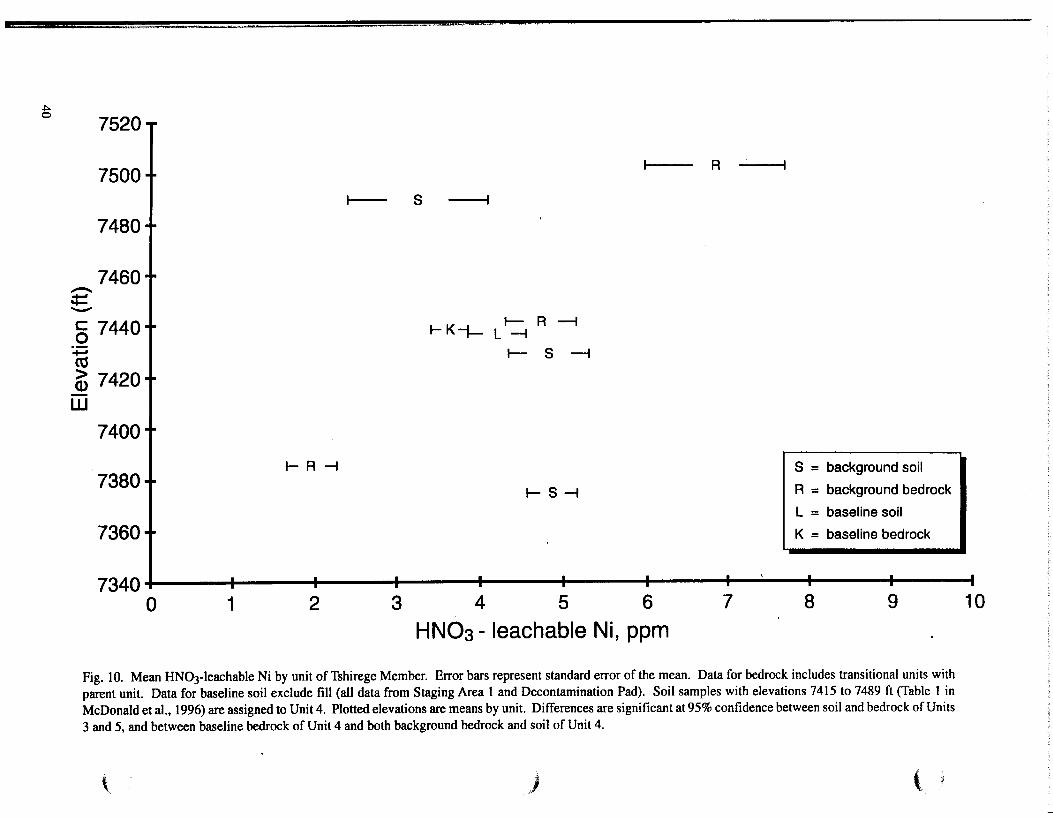
~ 0 7520
7500
7480
7460 -~ -§ 7440 ~
ca a; 7420 w
7400
7380
7360
7340 0 1
.,_____ s --I
1-K-t- L~ R -i
1-- s -i
R
.__ R -1 I S = background soil
1-S-1
2 3 4 5 6 7
HNOa- leachable Ni, ppm
R = background bedrock
L = baseline soil
K = baseline bedrock
8 9
Fig. 10. Mean HN03-leachable Ni by unit ofTshirege Member. Error bars represent standard error of the mean. Data for bedrock includes transitional units with
parent unit. Data for baseline soil exclude fill (all data from Staging Area 1 and Decontamination Pad). Soil samples with elevations 7415 to 7489 ft (Table 1 in
McDonald eta!., 1996) are assigned to Unit 4. Plotted elevations are means by unit. Differences are significant at 95% confidence between soil and bedrock of Units
3 and 5, and between baseline bedrock of Unit 4 and both background bedrock and soil of Unit 4.
\ ) ,_
10
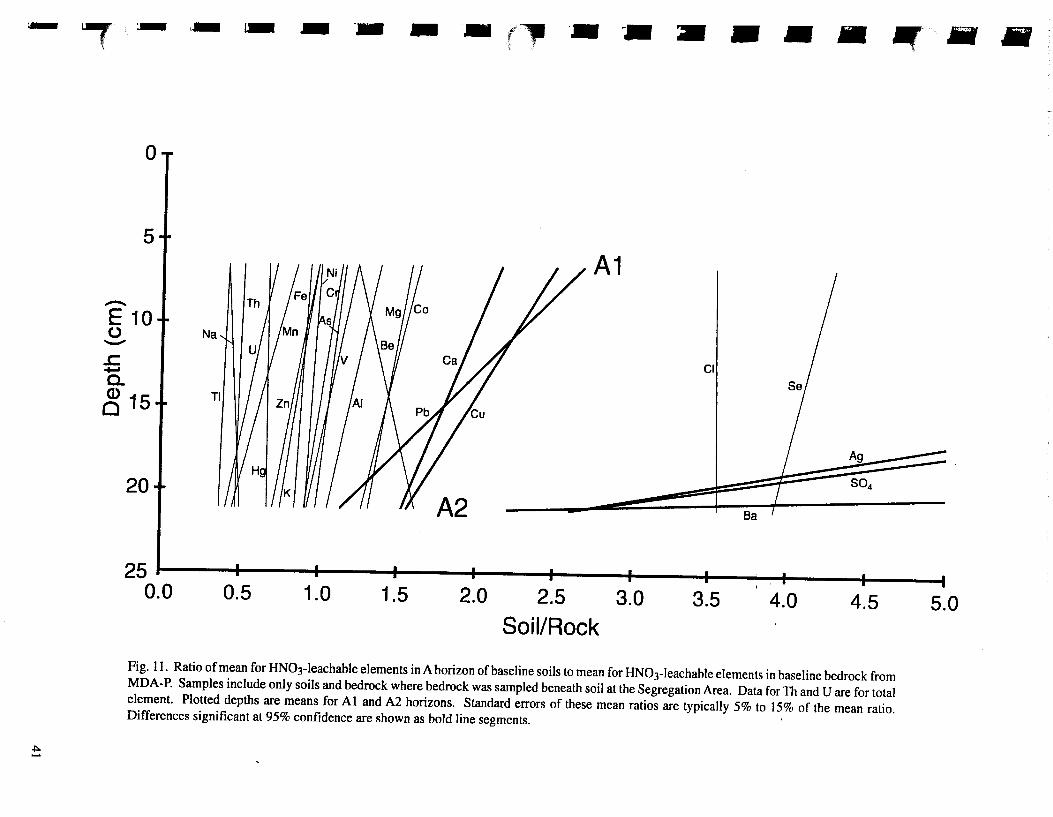
~
.j:. ....
f :.- .--.. ~ .. -- - -~~ -- .• - • - - ~--0
5 -A1
I ~ L. ~ !Fellr~1/l\ I II I 1/ .-E 10 0 I Na -.c I I I u; 1/ /J I 1//v I \ II caf /1 Cl +""' a. ~ 15 I Tl
20
25 0.0 0.5 1.0 1.5
A2 Ba
2.0 2.5 3.0 3.5 4.0 4.5 Soil/Rock
Fig. II. Ratio of mean for HN03-leachable elements in A horizon of baseline soils to mean for HN03-leachable elements in baseline bedrock from MDA-P. Samples include only soils and bedrock where bedrock was sampled beneath soil at the Segregation Area. Data forTh and U are for total element. Plotted depths are means for Al and A2 horizons. Standard errors of these mean ratios are typically 5% to 15% of the mean ratio. Differences significant at 95% confidence are shown as bold line segments. '
5.0
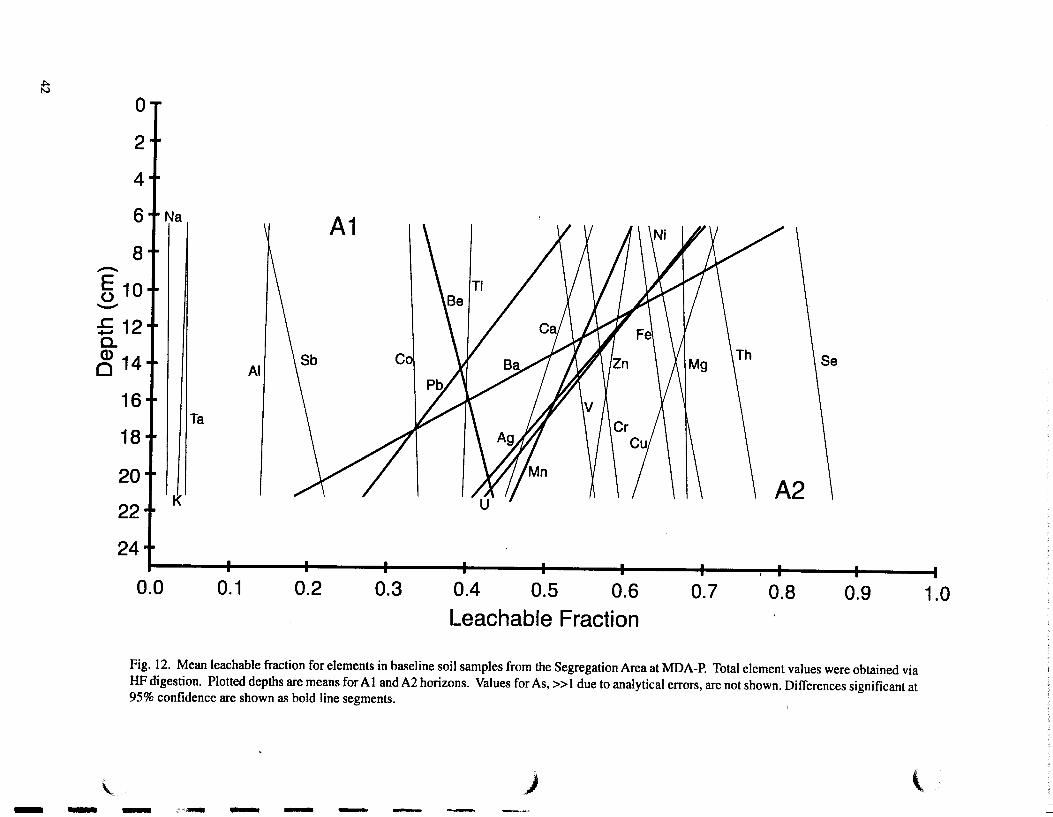
.p. N
0
2
4
6 Tial ~ A1 8 -E 10 (.) -
£12 a. Q) 0 14T I II AI
16 I I lira
18
20 I I~
22 A2
24 I I I
0.0 0.1 0.2 0.3 0.4 0.5 0.6 0.7 0.8 0.9 Leachable Fraction
Fig. 12. Mean leachable fraction for elements in baseline soil samples from the Segregation Area at MDA-P. Total element values were obtained via HF digestion. Plotted depths are means for A 1 and A2 horizons. Values for As, >> 1 due to analytical errors, are not shown. Differences significant at 95% confidence are shown as bold line segments.
1.0
' ) \ --- ,,,_---- -
r
r
I I I I
I I I I I I I
• I
excursions are attributed to analytical errors, hydrologically transmissive zones and extreme chemical mobility, extreme weathering, and contamination from anthropogenic activities at MDA-P.
Individual baseline samples of both soil and bedrock provide a few large, positive excursions from mean values. For bedrock, most such excursions are attributed to natural causes, but most samples of bedrock at the Segregation Area not protected by soil display large excursions attributed to contamination from Ba. Pb and Zn show large excursions, and As and possibly Be show small excursions in a single sample that is attributed to contamination. These excursions are corroborated by a analysis of a soil sample reported by Rivera-Dirks and Conrad (1995). Unfortunately, baseline analyses are probably erroneous for As, Na, and K, and for baseline analyses of bedrock for Cd <md Tl. Except for Na and K, all such values appear to be erroneously high, and they thus represent ttpper limits for these analytes.
ACKNOWLEDGMENTS
This work was funded by the Los Alamos National Laboratory Environmental Restoration Project as part of closure activities for MDA-P. We thank Ken Bostick for his support as project leader. Emily Kluk provided chemical analyses by X-ray fluorescence and Steve Chipera provided mineralogical analyses by X-ray diffraction. Don Hickmott and Brent Newman critically reviewed this document.
REFERENCES
Broxton, D. E., Los Alamos National Laboratory, personal communication, June 1996. Broxton, D. E., and S. L. Reneau, August 1995, "Stratigraphic Nomenclature of the Bandelier Tuff for
the Environmental Restoration Project at Los Alamos National Laboratory," Los Alamos National Laboratory report LA-13010-MS, 21 pp.
Broxton, D. E., R. T. Ryti, D. Carlson, R. G. Warren, E. C. Kluk, and S. J. Chipera, March 1996, "Natural Background Geochemistry of the Bandelier Tuff at MDA P, Los Alamos National Laboratory, New Mexico," Los Alamos National Laboratory informal report LA-UR-96-1151, 42 pp.
Broxton, D. E., C. LaDelfe, S. J. Chipera, and E. C. Kluk, (in review), "Stratigraphy, Mineralogy, and Chemistry of Bedrock Tuffs at Mesa del Buey," Los Alamos National Laboratory, New Mexico.
EPA (US Environmental Protection Agency), 1986, "Test Methods for Evaluating Solid Waste," Volume 1A; in "Laboratory Manual Physical/Chemical Methods," Washington DC, Office of Solid Waste, Waste Management Division, US Environmental Protection Agency.
Gautier, M.A., and Gladney, E. S., 1986, "Health and Environmental Data Management, and Quality Assurance: Los Alamos," Los Alamos National Laboratory report LA-10300-MS, Vols. I and II.
Gladney, E. S., Curtis, D. B., Perrin, D. R., Owens, J. W., and Goode, W. E., 1980, "Nuclear Techniques for the Chemical Analysis of Environmental Materials," Los Alamos National Laboratory Report LA-8192-MS.
Gladney, E. S., Owens, J. W., Gunderson, T. C., and Goode, W. E., March 1981, "Quality Assurance for Environmental Analytical Chemistry: 1976-1979," Los Alamos National Laboratory report LA-8730-MS.
Longmire, P. A., S. L. Reneau, P. A. Watt, L. D. McFadden, J. N. Gardner, C. J. Duffy, and R. T. Ryti, May 1996, "Natural Background Geochemistry, Geomorphology, and Pedogenesis of Selected Profiles and Bandelier Tuff, New Mexico," Los Alamos National Laboratory report LA-12913-MS .
43
Longmire, P. A., McDonald, E. V., Ryti, R. T., Reneau, S. L., and'Watt, P. M., 1997, "Natural Background Geochemistry and Statistical Analysis of Selected Soil Profiles, Los Alamos, New Mexico," in "Natural Background Geochemistry and Statistical Analysis of Selected Soil Profiles, Sediments, and Bandelier Tuff, Los Alamos, New Mexico," P. A. Longmire, D. E. Broxton, and S. L. Reneau, Eds, Los Alamos National Laboratory report LA-UR-95-3468.
McDonald, E. V., Ryti, R. T., Longmire, P .A., and Reneau, S. L., 1996, "Background Geochemistry of Soils and Colluvium at MDA-P," Los Alamos National Laboratory report, LA-UR-96-1092.
McLin, S. G., August 18, 1989, "Vadose Zone Monitoring Observations at the TA-16 Area P Landfill," Los Alamos National Laboratory preliminary report, 74 pp.
Noble, D. C., V. C. Smith, and L. C. Peck, 1967, "Loss of Halogens from Crystallized and Glassy Silicic Volcanic Rocks," Geochim. Cosmochim. Acta, Vol. 31, pp. 215-223. ·
Rivera-Dirks, C., and R. Conrad, October 10, 1995, TA-16 Site Burning Grounds, ESH-19, Waste Site Studies Soil Sampling Project, Summary Report, unpublished report to Hillary Noskin.
Rogers, D. B., B. M. Gallaher, and E. L. Void, 1996, "Vadose Zone Infiltration beneath the Pajarito Plateau at Los Alamos National Laboratory," in "New Mexico Geological Society Guidebook, 47th Field Conference, Jemez Mountains Region," F. Goff, B. S. Kues, M. A. Rogers, L. D. McFadden, and J. N. Gardner, Eds., pp. 413-420.
Rogers, D. B., and B. M. Gallaher, September 1995, "The Unsaturated Zone Hydraulic Characteristics of the Bandelier Tuff," Los Alamos National Laboratory report LA-12968-MS, 76 pp.
Rogers, M.A., 1995, "Geologic Map of Los Alamos National Laboratory Reservation," New Mexico Environment Department, scale 1 :4800.
Ryti, R., Longmire, P., and McDonald, E., 1996, "Application ofLANL Background Data to ER Project Decision-Making Part 1: Inorganics," Los Alamos document LA-UR-96-1534.
Smith, R. L., and R. A. Bailey, 1966, "The Bandelier Tuff: A Study of Ash-Flow Eruption Cycles from Zoned Magma Chambers," Bull. Volcanologique, Vol. 29, pp. 83-103.
Thompson, G., and D. C. Bankston, 1970, "Sample Contamination from Grinding and Sieving Determined by Emission Spectrometry," Applied Spectroscopy, Vol. 24, No.2, pp. 210-219.
Warren, R. G., F. M. Byers, Jr., D. E. Broxton, S. H. Freeman, and R. C. Hagan, May 10, 1989, "Phenocryst Abundances and Glass and Phenocryst Compositions as Indicators of Magmatic Environments of Large-Volume Ash-Flow Sheets in Southwestern Nevada," J. Geophys. Res., Vol. 94, No. B5, pp. 5987-6020.
Warren, R. G., D. A. Sawyer, F. M. Byers, Jr., and G. L. Cole, "A Petrographic/Geochemical Database and Stratigraphic and Structural Framework for the Southwestern Nevada Volcanic Field," Los Alamos National Laboratory report (in press).
Wedepohl, K. H. (Exec. Ed.), 1978, Handbook of Geochemistry, Vol. II, (Springer-Verlag, New York).
44
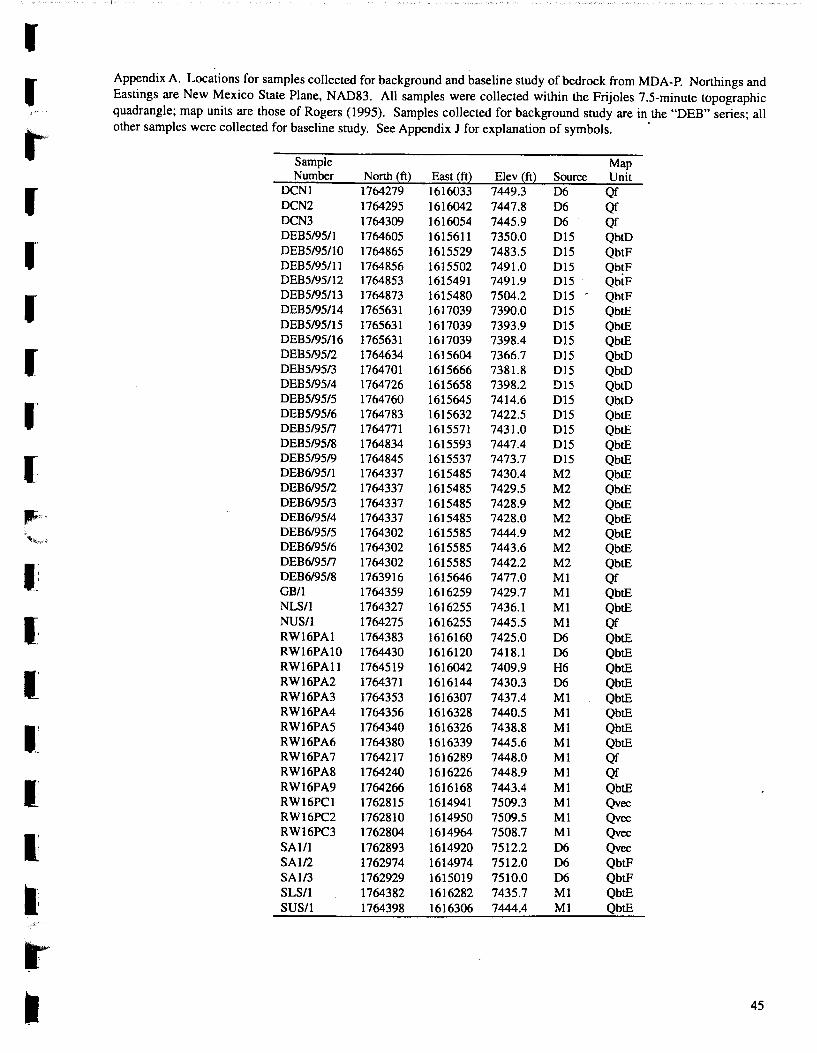
r I Appendix A. Locations for samples collected for background and baseline study of bedrock from MDA-P. Northings and
Eastings are New Mexico State Plane, NAD83. All samples were collected within the Frijoles 7.5-minute topographic ,l" quadrangle; map units are those of Rogers (1995). Samples collected for background study are in. the "DEB" series; all
t' other samples were collected for baseline study. See Appendix 1 for explanation of symbols.
Sample Map Number North ~fQ East ~fQ Elev ~fQ Source Unit
r DCN1 1764279 1616033 7449.3 D6 Qf DCN2 1764295 1616042 7447.8 D6 Qf DCN3 1764309 1616054 7445.9 D6 Qf DEB5/9511 1764605 1615611 7350.0 DI5 QbtD 1 .. DEB5/95/10 1764865 1615529 7483.5 D15 QbtF DEB5/95/11 1764856 1615502 7491.0 DI5 Qb~F DEB5/95112 1764853 161S491 7491.9 DIS QbtF
r DEB5/95!13 1764873 161S480 7504.2 DIS - QbtF DEB5/95/14 1765631 1617039 7390.0 DIS QbtE DEBS/9S/IS 1765631 1617039 7393.9 DIS QbtE DEB5/9S/16 176S631 1617039 7398.4 DI5 QbtE
[ DEB5/9512 1764634 1615604 7366.7 DI5 QbtD DEB5/95/3 1764701 1615666 7381.8 DI5 QbtD DEB5/95/4 1764726 1615658 7398.2 Dl5 QbtD DEB5/95/5 1764760 1615645 7414.6 DI5 QbtD I. DEB5/95/6 1764783 1615632 7422.5 DI5 QbtE DEB5195n 1764771 1615571 7431.0 DI5 QbtE DEB5/95/8 1764834 1615593 7447.4 DI5 QbtE
[ DEB5/95/9 1764845 1615537 7473.7 DI5 QbtE DEB6/9511 1764337 1615485 7430.4 M2 QbtE DEB6/9512 1764337 1615485 7429.5 M2 QbtE DEB6/95/3 1764337 1615485 7428.9 M2 QbtE
JF'· DEB6/95/4 1764337 161S48S 7428.0 M2 QbtE DEB6/95/5 1764302 1615585 7444.9 M2 QbtE DEB6/95/6 1764302 1615585 7443.6 M2 QbtE
l".i DEB6195n 1764302 1615585 7442.2 M2 QbtE DEB6/95/8 1763916 1615646 7477.0 M1 Qf GB/1 1764359 1616259 7429.7 M1 QbtE NLS/1 1764327 1616255 7436.1 M1 QbtE
(. NUS/I 1764275 1616255 7445.5 Ml Qf RW16PA1 1764383 1616160 7425.0 D6 QbtE RW16PA10 1764430 1616120 7418.1 D6 QbtE RW16PAII 1764519 1616042 7409.9 H6 QbtE
(' RW16PA2 1764371 1616144 7430.3 D6 QbtE RW16PA3 1764353 1616307 7437.4 M1 QbtE RW16PA4 1764356 1616328 7440.5 M1 QbtE
1.~ RW16PA5 1764340 1616326 7438.8 M1 QbtE RW16PA6 1764380 1616339 7445.6 M1 QbtE RW16PA7 1764217 1616289 7448.0 M1 Qf RW16PA8 1764240 1616226 7448.9 M1 Qf
( RW16PA9 1764266 1616168 7443.4 M1 QbtE RW16PC1 1762815 1614941 7509.3 M1 Qvec RW16PC2 1762810 1614950 7509.5 M1 Qvec RW16PC3 1762804 1614964 7508.7 M1 Qvec
I SAl/1 1762893 1614920 7512.2 D6 Qvec SAl/2 1762974 1614974 7512.0 D6 QbtF SAl/3 1762929 1615019 7510.0 D6 QbtF
r~ SLS/1 1764382 1616282 7435.7 M1 QbtE SUS/I 1764398 1616306 7444.4 Ml QbtE
l' I
I 45
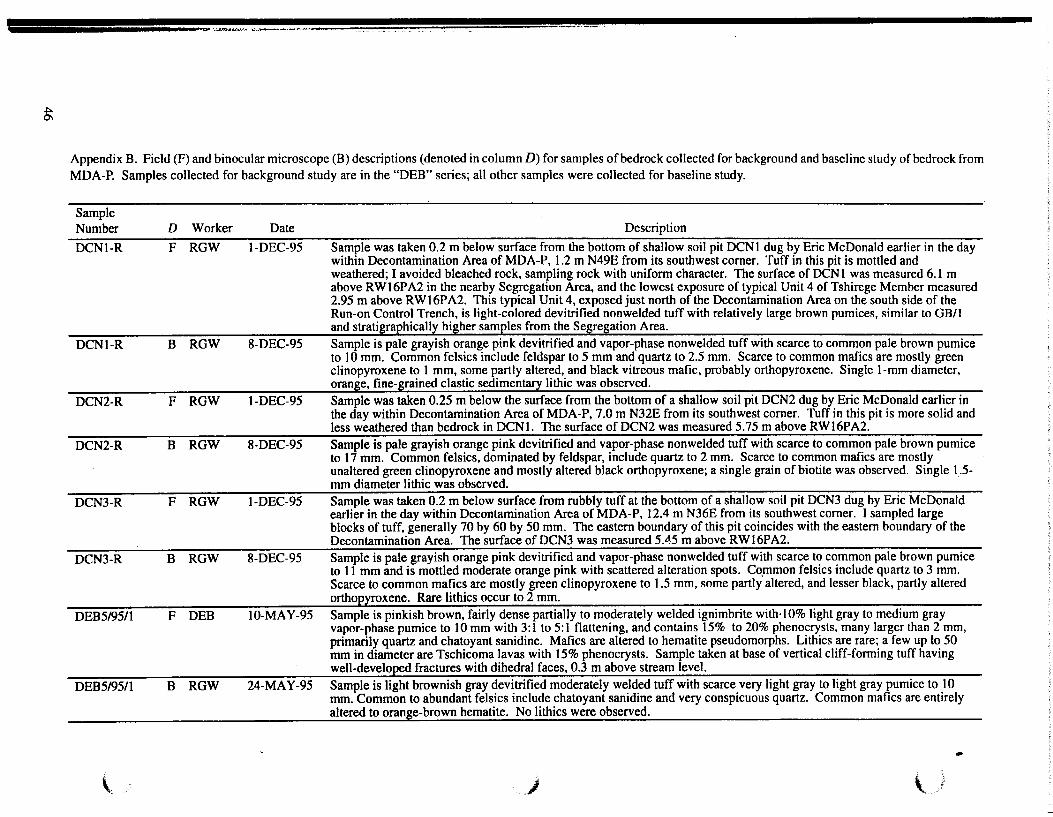
~
-.:..-.J"JX14.!~1--:.; • .--- -======;:::::::;:======~=;;:;;;::;:::======-~--
Appendix B. Field (F) and binocular microscope (B) descriptions (denoted in column D) for samples of bedrock collected for background and baseline study of bedrock from
MDA-P. Samples collected for background study are in the "DEB" series; all other samples were collected for baseline study.
Sample Number
DCNl-R
DCNl-R
DCN2-R
DCN2-R
DCN3-R
DCN3-R
DEB5/95/1
DEB5/95/1
\
D Worker Date Description
F RGW 1-DEC-95 Sample was taken 0.2 m below surface from the bottom of shallow soil pit DCNl dug by Eric McDonald earlier in the day within Decontamination Area of MDA-P, 1.2 m N49E from its southwest corner. Tuff in this pit is mottled and weathered; I avoided bleached rock, sampling rock with uniform character. The surface of DCN1 was measured 6.1 m above RW16PA2 in the nearby Segregation Area, and the lowest exposure of typical Unit 4 of Tshirege Member measured 2.95 m above RW16PA2. This typical Unit 4, exposed just north of the Decontamination Area on the south side of the Run-on Control Trench, is light-colored devitrified nonwelded tuff with relatively large brown pumices, similar to GB/1 and stratigraphically higher samples from the Segregation Area.
B RGW 8-DEC-95 Sample is pale grayish orange pink devitrified and vapor-phase nonwelded tuff with scarce to common pale brown pumice to 10 mm. Common felsics include feldspar to 5 mm and quartz to 2.5 mm. Scarce to common mafics are mostly green clinopyroxene to I mm, some partly altered, and black vitreous mafic, probably orthopyroxene. Single 1-mm diameter, orange, fine-grained clastic sedimentary lithic was observed.
F RGW 1-DEC-95 Sample was taken 0.25 m below the surface from the bottom of a shallow soil pit DCN2 dug by Eric McDonald earlier in the day within Decontamination Area of MDA-P, 7.0 m N32E from its southwest comer. Tuff in this pit is more solid and less weathered than bedrock in DCNl. The surface of DCN2 was measured 5.75 m above RW16PA2.
B RGW 8-DEC-95 Sample is pale grayish orange pink devitrified and vapor-phase nonwelded tuff with scarce to common pale brown pumice to 17 mm. Common felsics, dominated by feldspar, include quartz to 2 mm. Scarce to common mafics are mostly unaltered green clinopyroxene and mostly altered black orthopyroxene; a single grain of biotite was observed. Single 1.5-mrn diameter lithic was observed.
F RGW 1-DEC-95 Sample was taken 0.2 m below surface from rubbly tuff at the bottom of a shallow soil pit DCN3 dug by Eric McDonald earlier in the day within Decontamination Area of MDA-P, 12.4 m N36E from its southwest comer. I sampled large blocks of tuff, generally 70 by 60 by 50 mm. The eastern boundary of this pit coincides with the eastern boundary of the Decontamination Area. The surface of DCN3 was measured 5 . .:1.5 m above RW16PA2.
B RGW 8-DEC-95 Sample is pale grayish orange pink devitrified and vapor-phase nonwelded tuff with scarce to common pale brown pumice to 11 mm and is mottled moderate orange pink with scattered alteration spots. Cqmmon felsics include quartz to 3 mm. Scarce to common mafics are mostly green clinopyroxene to 1.5 mm, some partly altered, and lesser black, partly altered orthopyroxene. Rare lithics occur to 2 mm.
F DEB 1 0-MA Y -95 Sample is pinkish brown, fairly dense partially to moderately welded ignimbrite with·! 0% light gray to medium gray vapor-phase pumice to 10 mm with 3:1 to 5:1 flattening, and contains 15% to 20% phenocrysts, many larger than 2 mm, primarily quartz and chatoyant sanidine. Mafics are altered to hematite pseudomorphs. Lithics are rare; a few up to 50 mrn in diameter are Tschicoma lavas with 15% phenocrysts. Sample taken at base of vertical cliff-forming tuff having well-developed fractures with dihedral faces, 0.3 m above stream level.
B RGW 24-MAY-95 Sample is light brownish gray devitrified moderately welded tuff with scarce very light gray to light gray pumice to lO mrn. Common to abundant felsics include chatoyant sanidine and very conspicuous quartz. Common mafics are entirely altered to orange-brown hematite. No lithics were observed.
-J \
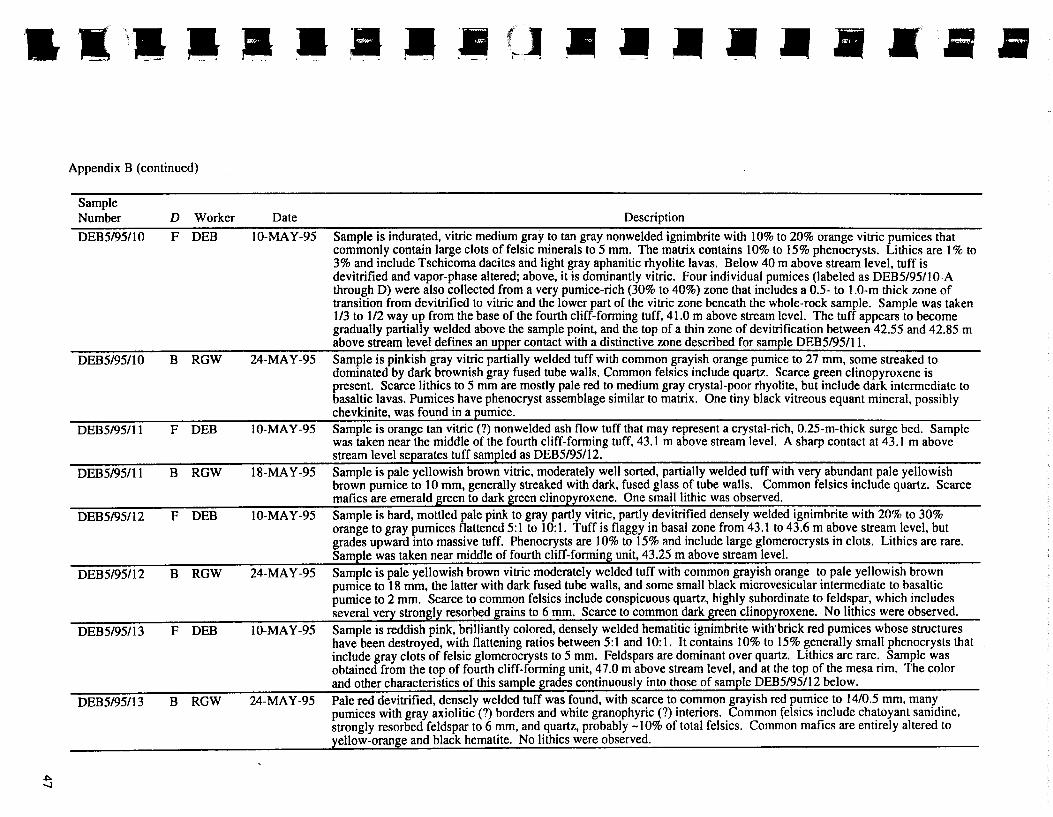
•••••••• • (~] '-" ,..._.~· •••••••••
~ -.J
Appendix B (continued)
Sample Number
DEB5/95/10
DEB5/95/10
DEB5/95111
DEB5/95/11
DEB5/95/12
DEB5/95/12
DEB5/95/13
DEB5/95/13
D Worker Date Description
F DEB 10-MA Y-95 Sample is indurated, vitric medium gray to tan gray nonwelded ignimbrite with 10% to 20% orange vitric pumices that commonly contain large clots of felsic minerals to 5 mm. The matrix contains 10% to 15% phenocrysts. Lithics are 1% to 3% and include Tschicoma dacites and light gray aphanitic rhyolite lavas. Below 40 m above stream level, tuff is devitrified and vapor-phase altered; above, it is dominantly vitric. Four individual pumices (labeled as DEB5/95/I 0-A through D) were also collected from a very pumice-rich (30% to 40%) zone that includes a 0.5- to 1.0-m thick wne of transition from devitrified to vitric and the lower part of the vitric zone beneath the whole-rock sample. Sample was taken 113 to 1/2 way up from the base of the fourth cliff-forming tuff, 41.0 m above stream level. The tuff appears to become gradually partially welded above the sample point, and the top of a thin zone of devitrification between 42.55 and 42.85 m above stream level defines an upper contact with a distinctive zone described for sample DEB5/95/11.
B RGW 24-MA Y -95 Sample is pinkish gray vitric partially welded tuff with common grayish orange pumice to 27 mm, some streaked to dominated by dark brownish gray fused tube walls. Common felsics include quartz. Scarce green clinopyroxene is present. Scarce lithics to 5 mm are mostly pale red to medium gray crystal-poor rhyolite, but include dark intermediate to basaltic lavas. Pumices have phenocryst assemblage similar to matrix. One tiny black vitreous equant mineral, possibly chevkinite, was found in a pumice.
F DEB 10-MA Y -95 Sample is orange tan vitric (?) nonwe1ded ash flow tuff that may represent a crystal-rich, 0.25-m-thick surge bed. Sample was taken near the middle of the fourth cliff-forming tuff, 43.1 m above stream level. A sharp contact at 43.1 m above stream level separates tuff sampled as DEB5/95/12.
B RGW 18-MAY -95 Sample is pale yellowish brown vitric, moderately well sorted, partially welded tuff with very abundant pale yellowish brown pumice to 10 mm, generally streaked with dark, fused glass of tube walls. Common felsics include quartz. Scarce mafics are emerald green to dark gre~n(;linopyroxene. One small lithic was observed.
F DEB 10-MA Y-95 Sample is hard, mottled pale pink to gray partly vitric, partly devitrified densely welded ignimbrite with 20% to 30% orange to gray pumices flattened 5:1 to 10:1. Tuff is flaggy in basal zone from 43.1 to 43.6 m above stream level, but grades upward into massive tuff. Phenocrysts are 10% to 15% and include large glomerocrysts in clots. Lithics are rare. Sample was taken near middle of fourth (;liff-forming unit, 43.25 m above stream level.
B RGW 24-MAY-95 Sample is pale yellowish brown vitric moderately welded tuff with common grayish orange to pale yellowish brown pumice to 18 mm, the latter with dark fused tube walls, and some small black microvesicular intermediate to basaltic pumice to 2 mm. Scarce to common felsics include conspicuous quartz, highly subordinate to feldspar, which includes several very strongly resorbed grains to 6 mm. Scarce to common dark green cliJl!>I'Yroxene. No lithics were observed.
F DEB 10-MAY-95 Sample is reddish pink, brilliantly colored, densely welded hematitic ignimbrite with'brick red pumices whose structures have been destroyed, with flattening ratios between 5:1 and 10: I. It contains 10% to 15% generally small phenocrysts that include gray clots of felsic glomerocrysts to 5 mm. Feldspars are dominant over quartz. Lithics are rare. Sample was obtained from the top of fourth cliff- forming unit, 4 7.0 m above stream level, and at the top of the mesa rim. The color and other characteristics of this sample grades continuously into those of sample DEB5/95/12 below.
B RGW 24-MAY -95 Pale red devitrified, densely welded tuff was found, with scarce to common grayish red pumice to 14/0.5 mm, many pumices with gray axiolitic (?) borders and white granophyric (?) interiors. Common felsics include chatoyant sanidine, strongly resorbed feldspar to 6 mm, and quartz, probably -10% of total felsics. Common mafics are entirely altered to yellow-orange and black hematite. No lithics were observed.
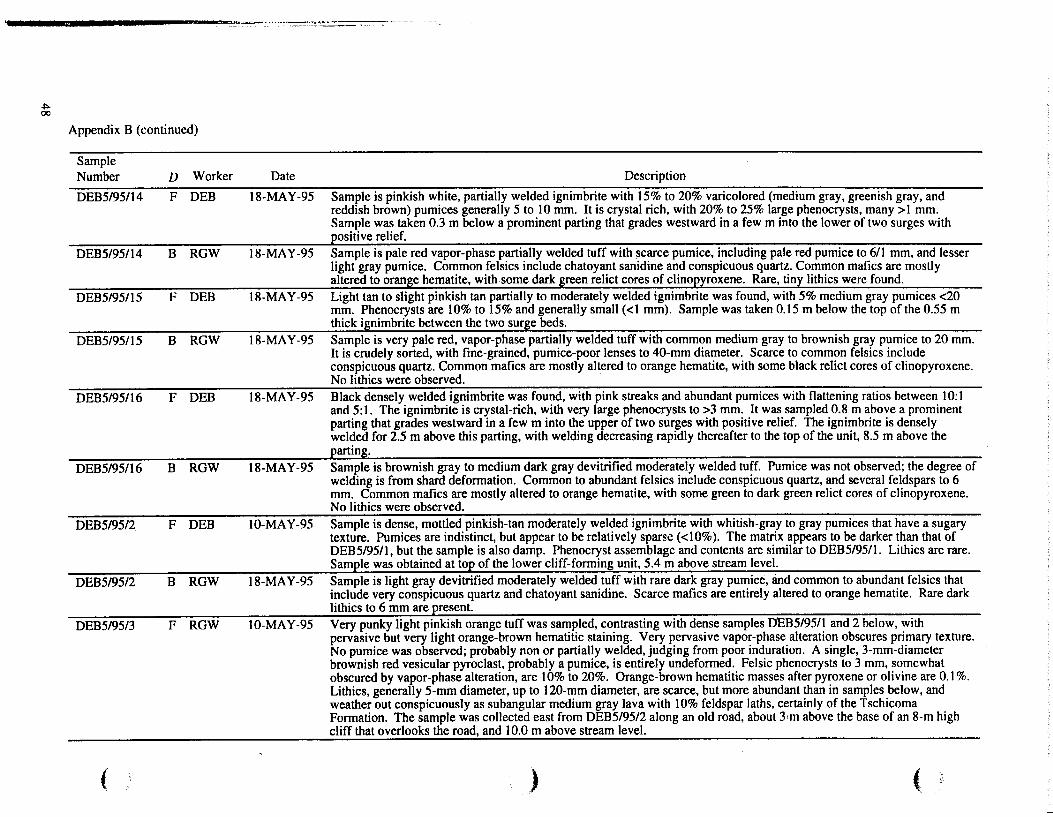
.j:>. 00
- :=-~-'·~~~·~··~-·~·'~'~ __ ·-;_-:_-_-.--~
Appendix B (continued)
Sample Number
DEB5/95114
DEB5/95114
DEB5/95115
DEB5/95115
DEB5/95116
DEB5/95/16
DEB5/95/2
DEB5/95/2
DEB5/95/3
(
D Worker Date Description
F DEB 18-MAY-95 Sample is pinkish white, partially welded ignimbrite with 15% to 20% varicolored (medium gray, greenish gray, and reddish brown) pumices generally 5 to 10 mm. It is crystal rich, with 20% to 25% large phenocrysts, many >I mm. Sample was taken 0.3 m below a prominent parting that grades westward in a few m into the lower of two surges with positive relief.
B RGW 18-MAY -95 Sample is pale red vapor-phase partially welded tuff with .scarce pumice, including pale red pumice to 6/1 mm, and lesser light gray pumice. Common felsics include chatoyant sanidine and conspicuous quartz. Common mafics are mostly altered to orange hematite, with some dark green relict cores of clinopyroxene. Rare, tiny lithics were found.
F DEB 18-MA Y-95 Light tan to slight pinkish tan partially to moderately welded ignimbrite was found, with 5% medium gray pumices <20 mm. Phenocrysts are 10% to 15% and generally small (<1 mm). Sample was taken 0.15 m below the top of the 0.55 m thick ignimbrite between the two surge beds.
B RGW 18-MA Y -95 Sample is very pale red, vapor-phase partially welded tuff with common medium gray to brownish gray pumice to 20 mm. It is crudely sorted, with fine-grained, pumice-poor lenses to 40-mm diameter. Scarce to common felsics include conspicuous quartz. Common mafics are mostly altered to orange hematite, with some black relict cores of clinopyroxene. No lithics were observed.
F DEB 18-MAY -95 Black densely welded ignimbrite was found, with pink streaks and abundant pumices with flattening ratios between 10:1 and 5:1. The ignimbrite is crystal-rich, with very large phenocrysts to >3 mm. It was sampled 0.8 m above a prominent parting that grades westward in a few m into the upper of two surges with positive relief. The ignimbrite is densely welded for 2.5 m above this parting, with welding decreasing rapidly thereafter to the top of the unit, 8.5 m above the parting.
B RGW 18-MAY -95 Sample is brownish gray to medium dark gray devitrified moderately welded tuff. Pumice was not observed; the degree of welding is from shard deformation. Common to abundant felsics include conspicuous quartz, and several feldspars to 6 mm. Common mafics are mostly altered to orange hematite, with some green to dark green relict cores of clinopyroxene. No lithics were observed.
F DEB 10-MAY-95 Sample is dense, mottled pinkish-tan moderately welded ignimbrite with whitish-gray to gray pumices that have a sugary texture. Pumices are indistinct, but appear to be relatively spar~e ( <1 0% ). The matrix appears to be darker than that of DEB5/9511, but the sample is also damp. Phenocryst assemblage and contents are similar to DEB5/9511. Lithics are rare. Sample was obtained at top of the l_o~er cliff-forming unit, 5.4 m above stream level.
B RGW 18-MAY -95 Sample is light gray devitrified moderately welded tuff with rare dark gray pumice, and common to abundant felsics that include very conspicuous quartz and chatoyant sanidine. Scarce mafics are entirely altered to orange hematite. Rare dark lithics to 6 mm are present.
F RGW 10-MAY-95 Very punky light pinkish orange tuff was sampled, contrasting with dense samples DEB5/9511 and 2 below, with pervasive but very light orange-brown hematitic staining. Very pervasive vapor-phase alteration obscures primary texture. No pumice was observed; probably non or partially welded, judging from poor induration. A single, 3-mm-diameter brownish red vesicular pyroclast, probably a pumice, is entirely undeformed. Felsic phenocrysts to 3 mm, somewhat obscured by vapor-phase alteration, are 10% to 20%. Orange-brown hematitic masses after pyroxene or olivine are 0.1 %. Lithics, generally 5-mm diameter, up to 120-mm diameter, are scarce, but more abundant than in samples below, and weather out conspicuously as subangular medium gray lava with 10% feldspar laths, certainly of the Tschicoma Formation. The sample was collected east from DEB5/95/2 along an old road, about 3•m above the base of an 8-m high cliff that overlooks the road, and I 0.0 m above stream level.
) (
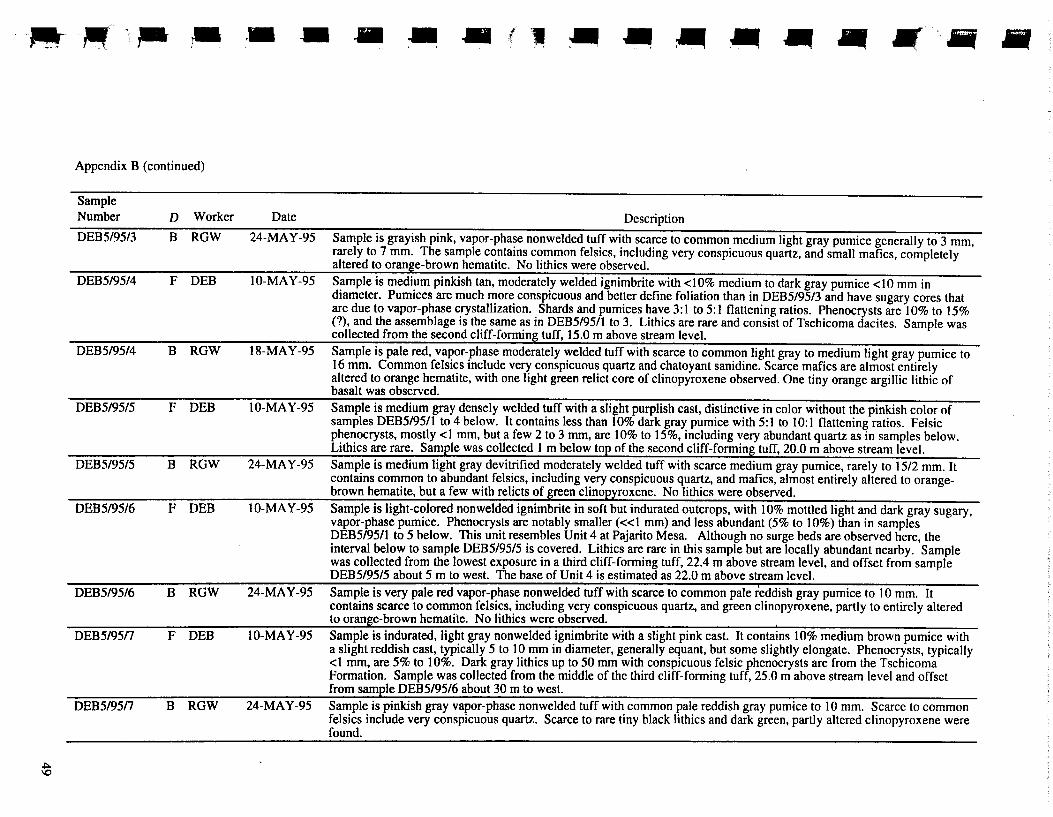
-~--~ ~ - •• - - - - l w ~ ~ ' ~ - - ... • • - • Appendix B (continued)
~
Sample Number
DEBS/95/3
DEBS/95/4
DEBS/95/4
DEBS/95/5
DEBS/95/5
DEBS/95/6
DEBS/95/6
DEB5/95n
DEB5/95n
D Worker Date Description
B RGW 24-MA Y-95 Sample is grayish pink, vapor-phase nonwelded tuff with scarce to common medium light gray pumice generally to 3 mm, rarely to 7 mm. The sample contains common felsics, including very conspicuous quartz, and small mafics, completely altered to orange-brown hematite. No lithics were observed.
F DEB 10-MA Y-95 Sample is medium pinkish tan, moderately welded ignimbrite with <10% medium to dark gray pumice <10 mm in diameter. Pumices are much more conspicuous and better define foliation than in DEBS/95/3 and have sugary cores that are due to vapor-phase crystallization. Shards and pumices have 3:1 to 5:1 flattening ratios. Phenocrysts are 10% to 15% (?), and the assemblage is the same as in DEBS/9511 to 3. Lithics are rare and consist of Tschicoma dacites. Sample was collected from the second cliff-forming tuff, 15.0 m above stream level.
B RGW 18-MAY-95 Sample is pale red, vapor-phase moderately welded tuff with scarce to common light gray to medium light gray pumice to 16 mm. Common felsics include very conspicuous quartz and chatoyant sanidine. Scarce mafics are almost entirely altered to orange hematite, with one light green relict core of clinopyroxene observed. One tiny orange argillic lithic of basalt was observed.
F DEB 10-MAY-95 Sample is medium gray densely welded tuff with a slight purplish cast, distinctive in color without the pinkish color of samples DEBS/9511 to 4 below. It contains less than 10% dark gray pumice with 5:1 to 10:1 flattening ratios. Felsic phenocrysts, mostly <1 mm, but a few 2 to 3 mm, are 10% to 15%, including very abundant quartz as in samples below. Lithics are rare. Sample was collected 1 m below top of the second cliff-forming tuff, 20.0 m above stream level.
B RGW 24-MA Y -95 Sample is medium light gray devitrified moderately welded tuff with scarce medium gray pumice, rarely to 15/2 mm. It contains common to abundant felsics, including very conspicuous quartz, and mafics, almost entirely altered to orangebrown hematite, but a few with relicts of green clinopyroxene. No lithics were observed.
F DEB 10-MAY-95 Sample is light-colored nonwelded ignimbrite in soft but indurated outcrops, with 10% mottled light and dark gray sugary, vapor-phase pumice. Phenocrysts are notably smaller (<<1 mm) and Jess abundant (5% to 10%) than in samples DEBS/95/1 to 5 below. This unit resembles Unit 4 at Pajarito Mesa. Although no surge beds are observed here, the interval below to sample DEBS/95/5 is covered. Lithics are rare in this sample but are locally abundant nearby. Sample was collected from the lowest exposure in a third cliff-forming tuff, 22.4 m above stream level, and offset from sample DEBS/95/5 about 5 m to west. The base of Unit 4 is estimated as 22.0 m above stream level.
B RGW 24-MA Y -95 Sample is very pale red vapor-phase non welded tuff with scarce to common pale reddish gray pumice to 10 mm. It contains scarce to common felsics, including very conspicuous quartz, and green clinopyroxene, partly to entirely altered to orange-bro\\'n.hernatite. _l'f~l_i_thlcs were observed.
F DEB 10-MAY-95 Sample is indurated, light gray nonwelded ignimbrite with a slight pink cast. It contains 10% medium brown pumice with a slight reddish cast, typically 5 to 10 mm in diameter, generally equant, but some slightly elongate. Phenocrysts, typically <1 mm, are 5% to 10%. Dark gray lithics up to 50 mm with conspicuous felsic phenocrysts are from the Tschicoma Formation. Sample was collected from the middle of the third cliff-forming tuff, 25.0 m above stream level and offset from sample DEBS/95/6 about 30 m to west.
B RGW 24-MA Y-95 Sample is pinkish gray vapor-phase non welded tuff with common pale reddish gray pumice to 10 mm. Scarce to common felsics include very conspicuous quartz. Scarce to rare tiny black lithics and dark green, partly altered clinopyroxene were found.
•
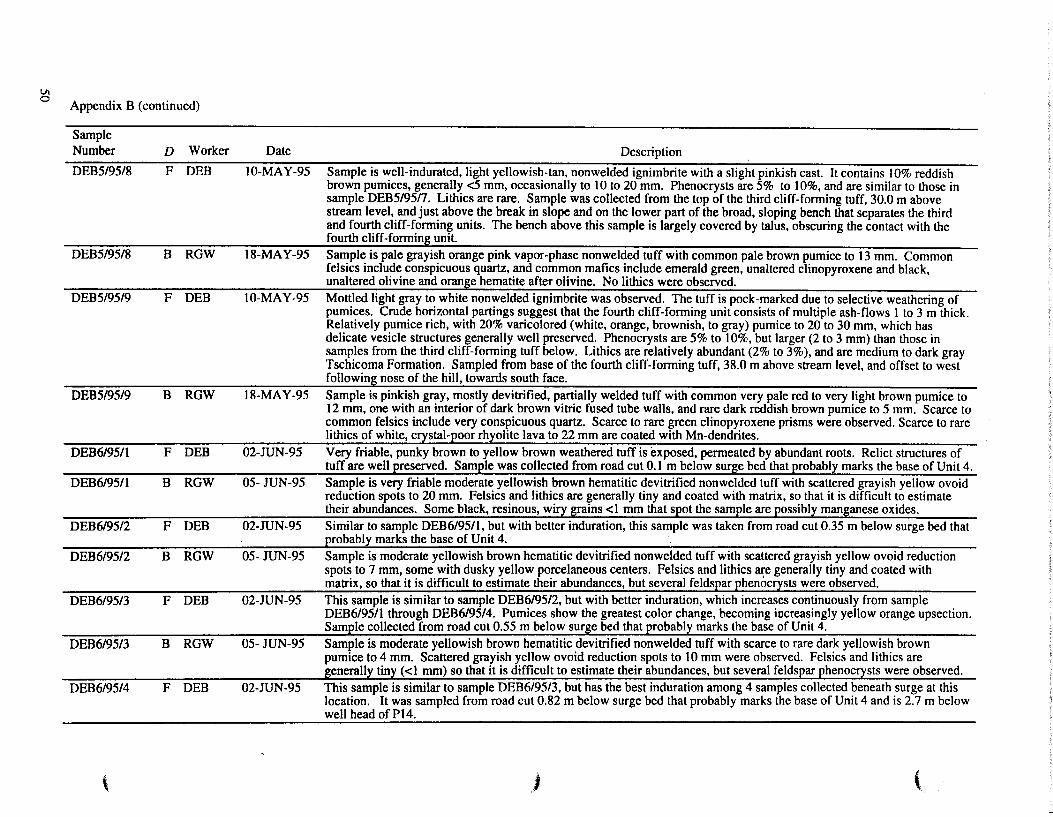
VI 0
Appendix B (continued)
Sample Number
DEB5/95/8
DEB5/95/8
DEB5/95/9
DEB5/95/9
DEB6/95/l
DEB6/9511
DEB6/95/2
DEB6/95/2
DEB6/95/3
DEB6/95/3
DEB6/95/4
\
D Worker Date Description
F DEB 10-MA Y-95 Sample is well-indurated, light yellowish-tan, nonwelded ignimbrite with a slight pinkish cast. It contains 10% reddish brown pumices, generally <5 mm, occasionally to 10 to 20 mm. Phenocrysts are 5% to 10%, and are similar to those in sample DEB5/95n. Lithics are rare. Sample was collected from the top of the third cliff-forming tuff, 30.0 m above stream level, and just above the break in slope and on the lower part of the broad, sloping bench that separates the third and fourth cliff-forming units. The bench above this sample is largely covered by talus, obscuring the contact with the fourth cliff-forming unit.
B RGW 18-MA Y-95 Sample is pale grayish orange pink vapor-phase nonwelded tuff with common pale brown pumice to 13 mm. Common felsics include conspicuous quartz, and common mafics include emerald green, unaltered clinopyroxene and black, unaltered olivine and orange hematite after olivine. No lithics were observed.
F DEB 10-MAY-95 Mottled light gray to white nonwelded ignimbrite was observed. The tuff is pock-marked due to selective weathering of pumices. Crude horizontal partings suggest that the fourth cliff-forming unit consists of multiple ash-flows I to 3 m thick. Relatively pumice rich, with 20% varicolored (white, orange, brownish, to gray) pumice to 20 to 30 mm, which has delicate vesicle structures generally well preserved. Phenocrysts are 5% to 10%, but larger (2 to 3 mm) than those in samples from the third cliff-forming tuff below. Lithics are relatively abundant (2% to 3% ), and are medium to dark gray Tschicoma Formation. Sampled from base of the fourth cliff-forming tuff, 38.0 m above stream level, and offset to west following nose of the hill, towards south face.
B RGW 18-MAY-95 Sample is pinkish gray, mostly devitrified, partially welded tuff with common very pale red to very light brown pumice to 12 mm, one with an interior of dark brown vitric fused tube walls, and rare dark reddish brown pumice to 5 mm. Scarce to common felsics include very conspicuous quartz. Scarce to rare green clinopyroxene prisms were observed. Scarce to rare lithics of white, crystal-poor rhyolite lava to 22 mm are coated with Mn-dendrites.
F DEB
B RGW
F DEB
B RGW
F DEB
B RGW
F DEB
02-JUN-95
05- JUN-95
02-JUN-95
05- JUN-95
02-JUN-95
05- JUN-95
02-JUN-95
Very friable, punky brown to yellow brown weathered tuff is exposed, permeated by abundant roots. Relict structures of tuff are well preserved. Sample was collected from road cut O.l_rn below surge bed that probably marks the base of Unit 4. Sample is very friable moderate yellowish brown hematitic devitrified non welded tuff with scattered grayish yellow ovoid reduction spots to 20 mm. Felsics and lithics are generally tiny and coated with matrix, so that it is difficult to estimate their abundances. Some black, resinous, wiry grains -s!_mm that spot the sample are possibly manganese oxides. Similar to sample DEB6/9511, but with better induration, this sample was taken from road cut 0.35 m below surge bed that probably marks the base of Unit 4. Sample is moderate yellowish brown hematitic devitrified non welded tuff with scattered grayish yellow ovoid reduction spots to 7 mm, some with dusky yellow porcelaneous centers. Felsics and lithics are generally tiny and coated with matrix, so that it is difficult to estimate their abundances, but several feldspar phenocrysts were observed. This sample is similar to sample DEB6/95/2, but with better induration, which increases continuously from sample DEB6/95/l through DEB6/95/4. Pumices show the greatest color change, becoming increasingly yellow orange upsection. Sample collected from road cut 0.55 m below surge bed that probably marks the base of Unit 4. Sample is moderate yellowish brown hematitic devitrified non welded tuff with scarce to rare dark yellowish brown pumice to 4 mm. Scattered grayish yellow ovoid reduction spots to 10 mm were observed. Felsics and lithics are generally tiny (<1 mm) so that it is difficult t()~~tirn_ate their abundances, but several feldspar phenocrysts were observed. This sample is similar to sample DEB6/95/3, but has the best induration among 4 samples collected beneath surge at this location. It was sampled from road cut 0.82 m below surge bed that probably marks the base of Unit 4 and is 2.7 m below well head of PI4.
) \,

·-- • • :Jill .Ill - - - ( ·~ -- -- - -- - - ~ ..
VI .....
Appendix B (continued)
Sample Number D Worker Date Description
DEB6/95/4 B RGW 05- JUN-95 Sample is pale yellowish brown hematitic devitrified nonwelded tuff with scarce dark yellowish brown pumice to 10 mm. Scattered grayish yellow ovoid reduction spots to 4 mm were observed. Felsics, nearly unrecognizable except for a few quartz to 1 mm, are probably scarce to common. ~c_arc_eto C0!11_montiny{<1-mm) lithics are present.
DEB6/95/5 F DEB 02-JUN-95 We sampled a weathered tuff block floating in finer grained sandy matrix, at the base of a 0.5-m thick rubble zone between bedrock and soil. The sample is 2.4 m above well head of P14 and above surge that probably marks the base of Unit 4.
DEB6/95/5 B RGW
DEB6/95/6 F DEB
DEB6/95/6 B RGW
DEB6/9517 F DEB
DEB6/9517 B RGW
DEB6/95/8 F DEB
DEB6/95/8- B RGW AA
DEB6/95/8-D B RGW
DEB6/95/8-H B RGW
05- JUN-95 Sample is mostly moderate yellowish brown hematitic devitrified nonwelded tuff with 15/5-mm lenses of pale grayish orange pink non hematitic tuff. Lenses of hematitic tuff become increasingly narrower and elongate towards top of sample, where rock was not sampled but is entirely nonhematitic. Common felsics to 2 mm include conspicuous quartz. Scarce to common lithics to 2.5 mm were observed.
02-JUN-95 Light tan nonwelded tuff crops out with 5% to 10% small (<10 mm) light brown pumices. It was sampled 2.0 m above well head of P14, from highly fractured bedrock just below rubble zone, and above surge that probably marks the base of Unit 4. Fractures, which show evidence of alteration, were avoided for this sample, which shows little apparent weathering.
05- JUN-95 Sample is very pale brown devitrified non welded tuff with scarce to common moderate yellowish brown pumice to 10 mm, and common felsics to 3.5 mm that include very conspicuous_quartz._Scarce lithics to 3 mm are present.
02-JUN-95 This sample is similar to DEB6/95/6, very pumice- and crystal-poor, massive, well indurated, and apparently unaltered. It was sampled 1.6 m above well head ofP14, from less fractured bedrock 0.5 m below rubble zone and above surge that probably marks the base of Unit 4.
05- JUN-95 Sample is pale grayish orange pink devitrified non welded tuff with scarce to common yellowish brown pumice to 13 mm. Generally very small felsics, to 2 mm, appear to be scarce to common, and include conspicuous quartz. Several small black mafics indicate that they are scarce to rare. Scarce to common lithics, generally dark gray, to 3 mm were observed.
02-JUN-95 Thirty-one vitric pumices (DEB6/95/8-A through -Z, -AA through AE) were sampled from a 9.5-m thick white to light gray vitric tuff. They were sampled from a 4-m-thick interval 6.0 m below a surge bed and are equivalent to DEB5/95/ll, which was sampled on the north side of Canon de Valle. The ,,itric zone extends to 0.5 m below the surge bed beneath mesa-capping tuff sampled on the north side of Cafion de Valle as DEB5/95/13 and grades abruptly downward into reddish brown devitrified tuff. Thus, the vitric zone within Unit 4 is much thicker here, south of Cafion de Valle, than north of the canyon. Samples were collected from bedrock in road cut just WSW of building 16-295 at MDA-P, south of paved road. Above the sample_po_i_nt, the surge bed is displaced 0.35 m down to the southwest along a NW -trending fault.
05-JUN-95 Sample is a 60 by 50 by 35 mm pumice clast of very pale reddish gray vitric fine tube pumice. Scarce to common felsics include several probable but no definite quartz and several feldspar to 2.5 mm. Single green clinopyroxene prism was observed. Host is described for sample DEB6/95/8-Z.
05-JUN-95 Sample is a 150 by 100 by 55 mm pumice clast of moderate yellowish brown vitric long tube pumice with common felsics (-12%) that include conspicuous quartz. Scarce to rare mafics include dark green clinopyroxene and black vitreous olivine. Host is described for sample DEB6/95/8-Z.
05-JUN-95 Sample is a 110 by 65 by 45 mm pumice clast of grayish orange vitric long tube pumice, with scarce to common felsics ( -7% ). Several probable but no definite quartz phenocrysts were observed in hand sample. One probable quartz was examined in immersion oil, n = 1.55, confirming its identity. The quartz content appears to be much higher than for sample DEB6/95/8-Z. Scarce to rare mafics include dark green granular clinopyroxene, and black vitreous olivine. Host is described for sample DEB6/95/8-Z.
•
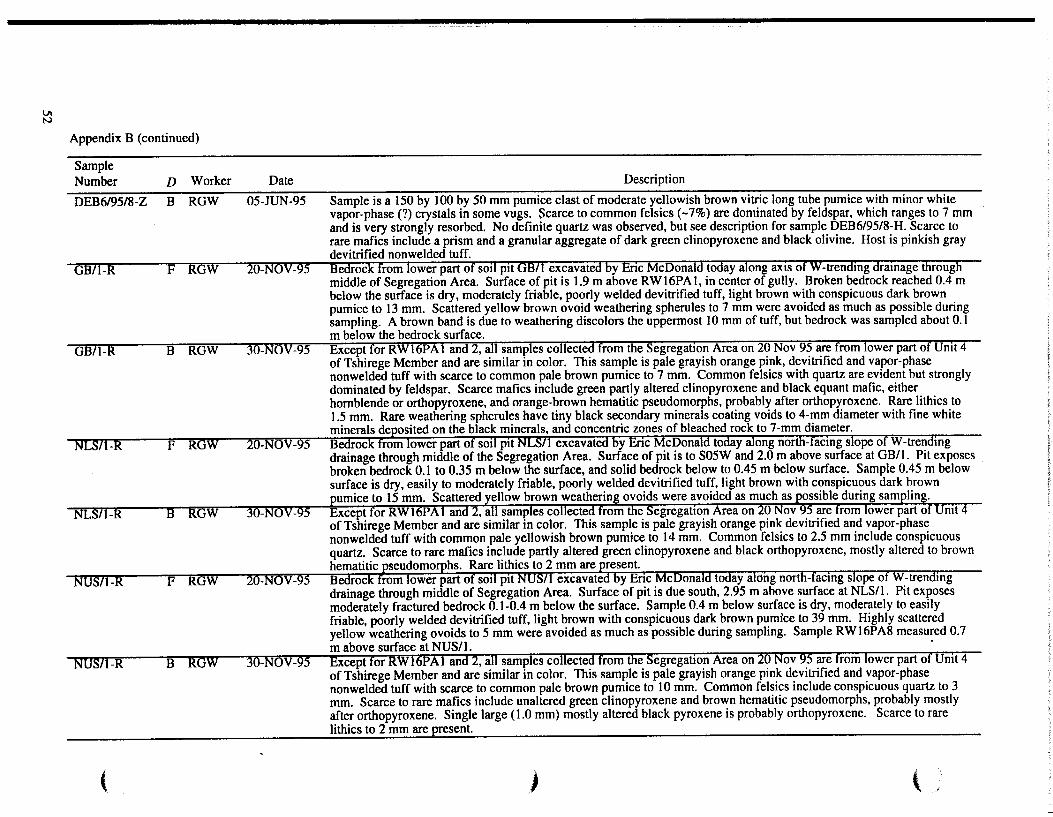
lll N
Appendix B (continued)
Sample Number D Worker
DEB6/95/8-Z B RGW
Date
05-JUN-95
Description
Sample is a 150 by 100 by 50 mm pumice clast of moderate yellowish brown vitric long tube pumice with minor white vapor-phase(?) crystals in some vugs. Scarce to common felsics (-7%) are dominated by feldspar, which ranges to 7 mm and is very strongly resorbed. No definite quartz was observed, but see description for sample DEB6/95/8-H. Scarce to rare mafics include a prism and a granular aggregate of dark green clinopyroxene and black olivine. Host is pinkish gray devitrified nonwelded tuff.
GBil-R F RGW 20-NOV-95 Bedrock from lower part ofsoil pit GB/1 excavated by Enc McDonald today along axts of W-trending drainage through middle of Segregation Area. Surface of pit is 1.9 m above RW16PA 1, in center of gully. Broken bedrock reached 0.4 m below the surface is dry, moderately friable, poorly welded devitrified tuff, light brown with conspicuous dark brown pumice to 13 mm. Scattered yellow brown ovoid weathering spherules to 7 mm were avoided as much as possible during sampling. A brown band is due to weathering discolors the uppermost 10 mm of tuff, but bedrock was sampled about 0.1 m below the bedrock surface.
GB/1-R B RGW 30-NOV-95 Except for RWI6PA1 and2, all samples collected from the Segregation Area on 20 Nov 95 are from lower part of Unit 4 of Tshirege Member and are similar in color. This sample is pale grayish orange pink, devitrified and vapor-phase non welded tuff with scarce to common pale brown pumice to 7 mm. Common felsics with quartz are evident but strongly dominated by feldspar. Scarce mafics include green partly altered clinopyroxene and black equant mafic, either hornblende or orthopyroxene, and orange-brown hematitic pseudomorphs, probably after orthopyroxene. Rare lithics to 1.5 mm. Rare weathering spherules have tiny black secondary minerals coating voids to 4-mm diameter with fine white minerals deposited on the black minerals, and concentric zones of bleached rock to 7-mm diameter. Bedrock fri:m11ower part of soil pit NLS/1 excavated by Eric McDonald today along north~fiii::ing slope of W-trenomg drainage through middle of the Segregation Area. Surface of pit is to SOSW and 2.0 m above surface at GB/1. Pit exposes broken bedrock 0.1 to 0.35 m below the surface, and solid bedrock below to 0.45 m below surface. Sample 0.45 m below surface is dry, easily to moderately friable, poorly welded devitrified tuff, light brown with conspicuous dark brown umice to 15 mm. Scattered vellow brown weatherinl! ovoids were avoided as much as possible durin!! samolinl! . . xcept for RW16PA1 and2, all samples collected from the ~gregation Area on 20 Nov 95 are from lower part of Unit 4
of Tshirege Member and are similar in color. This sample is pale grayish orange pink devitrified and vapor-phase non welded tuff with common pale yellowish brown pumice to 14 mm. Common felsics to 2.5 mm include conspicuous quartz. Scarce to rare mafics include partly altered green clinopyroxene and black orthopyroxene, mostly altered to brown hematitic pseudomorohs. Rare lithics to 2 mm are oresent. Bedrock from lower part of soil pit NUS/I excavated by En'CMCDonald toaay alelng north~Thi::ing slope ofW -trendmg drainage through middle of Segregation Area. Surface of pit is due south, 2.95 m above surface at NLS/1. Pit exposes moderately fractured bedrock 0.1-0.4 m below the surface. Sample 0.4 m below surface is dry, moderately to easily friable, poorly welded devitrified tuff, light brown with conspicuous dark brown pumice to 39 mm. Highly scattered yellow weathering ovoids to 5 mm were avoided as much as possible during sampling. Sample RW16PA8 measured 0.7 m above surface at NUS/1. ·
NUS/1-R B RGW 30-NOV-95 Except for RW16PA1 and 2, all samples collected from the SegregatiOn Area on 20 Nov 95 are from lower part of Unit 4 of Tshirege Member and are similar in color. This sample is pale grayish orange pink devitrified and vapor-phase
(
non welded tuff with scarce to common pale brown pumice to 10 mm. Common felsics include conspicuous quartz to 3 mm. Scarce to rare mafics include unaltered green clinopyroxene and brown hematitic pseudomorphs, probably mostly after orthopyroxene. Single large (1.0 mm) mostly altered black pyroxene is probably orthopyroxene. Scarce to rare lithics to 2 mm are present.
) '
,. '1. ,. • .• II Ill • -- .. ~ ,1111 • ~ --·-··
Ul Ul
Appendix B (continued)
Sample Number D Worker
RW16PA1 F RGW
RW16PA1 B RGW
RW16PAIO F RGW
RW16PAIO B RGW
RW16PA11 F RGW
RWI6PA11 B RGW
RWI6PA2 F RGW
RWI6PA2 B RGW
RWI6PA3 F RGW
Date
20-NOV-95
29-NOV-95
1-DEC-95
8-DEC-95
1-DEC-95
8-DEC-95
20-NOV-95
29-NOV-95
20-NOV-95
Description
Moderately friable devitrified tuff was dug out from axis of Run-on Control Trench for MDA-P, 11 m down-axis from bottom of asphalt covering that extends upditch another 20m or so. The rock is uniformly brown, and quite moist. Sample was from interior of coherent block 20 em on a side that was dug out and is apparently free from yellowish ovoid alteration centers 6 to 10 mm in diameter. This location and those of all other samples that I collected today were marked on a largescale map from MDA-P sampling plan. Measured using Jacob Staff and level, this sample is 1.0 m above the lowest point in the Segregation Area. Sample is grayish orange pink devitrified and vapor-phase non welded tuff with scarce to common very pale brown pumice to 8 mm. Common felsics to 2 mm are generally small (<I mm), and dominated by feldspar; only a single definite quartz phenocryst observed. No lithics or mafics are observed; mafics appear to be entirely altered to brown hematitic pseudomorphs. Sample may be from top of Unit 3 of base of Unit 4 of Tshirege Member.
Dark, poorly welded, moderately friable tuff was sampled from the highest exposure jn gully, 2.1 m below and 18.95 m N40W from RW16PA1, just outside Segregation Area. Although exposures are good between RWI6PAIO and 11, they are not continuous, and so this sample, like RW16PA1 and 2, might reside within uppermost Unit 3 or lowermost Unit 4.
Sample is mottled, mostly very pale red and lesser grayish pink devitrified and vapor-phase nonwelded tuff with scarce to common pale grayish red pumice to 11 mm. Common felsics include feldspar to 2.5 mm and quartz to 2 mm, with only a few quartz grains observed. Scarce mafics are mostly green, partly altered clinopyroxene to 1.5 mm. Two black vitreous, partly altered mafics o~served are prob!ibly orthopyroxene. A single 3-mm diameter lithic is observed.
Sampled from dark, poorly welded, somewhat friable tuff from top of cliff that is continuously exposed down to stream level in Canon de Valle, Unit 3 of Tshirege Member. Moderately welded tuff is exposed in gully just downstream, 0.1 m below sample site. From this site, it is 37.3 m S64E and 2.5 m up to RWI6PAIO upstream in the same gully. Note added later: this location does not plot in gully, so the direction must be in error. This sample was obtained just outside the Segregation Area to characterize definite Unit 3 ofTshirege Member as close as possible to the Segregation Area. Use of chemical data from RWI6PAIO and II might resolve whether samples RWI6PAI and 2 reside within uppermost Unit 3 or lowermost Unit 4. All other samples from the Segregation, Decontamination, and Staging I Areas of MDA-P definitely reside within Unit 4 of Tshirege Member. Sample is very pale red devitrified and vapor-phase moderately welded tuff with common medium light gray pumice to I3/2.5 mm. Common felsics include sanidine, some chatoyant, and very conspicuous quartz, both to 3 mm. Scarce to common mafics are mostly altered to orange hematitic pseudomorphs, but several relicts of black vitreous mafic, probably orthopyroxene, and singleJight greencliitl:)l')'roxene relict were observed. No lithics were observed.
This sample was collected directly up Run-on Control Trench S60W from RWI6Pl'\ I, at I.6-m higher elevation. It is moderately friable tuff, about 20 em above axis of trench on south side, about 10 em from the end of the asphalt cover, and just inside the boundary of the Segregation Area, as verified by sighting along line of boundary stakes. Tuff is dry in appearance, in contrast to appearance of RWI6PAI and of adjacent tuff in axis of trench. Bedrock is massive nonwelded tuff continuously exposed within axis of trench down to sample RWI6PAI; then everywhere in the Segregation Area below is covered by at least 20 c.'l!of soil._ See also field notes for sample DCN3-R.
Sample is very pale orange devitrified and vapor-phase non welded tuff with scarce to common pale yellowish brown pumice to 8 mm. Common felsics to 2 mm include conspicuous quartz; few exceed I nun. Scarce to rare small green clinopyroxene prisms are unaltered. Brown hematitic masses are probably pseudomorphs after orthopyroxene. Rare lithics are present to 3 mm. Sam~ may be from to!' of Unit 3 of base of Unit 4 of Tshirege Member.
Sample is natural outcrop S80E from RWI6PAI on north side of natural drainage, 3.8 m above RW16PAI. This is the closest of 3 natural bedrock exposures east of RW16PA I. The sample was taken from south side of this 1.3 by 0.9 by 0.5 m outcrop, and is dry, poorly welded light brown devitrified tuff with dark brown pumice. The tuff contains occasional yellow-brown spherules, centers to 10 mm, and concentric bleached zones to 16-mm diameters, which were avoided in sampling as much as possible. Tuff is moderately friable; like RW16PA1 and 2, and breakable by hand.
Ul .f>. Appendix B (continued)
Sample Number D Worker
RWI6PA3 B RGW
RWI6PA4 F RGW
RWI6PA4 B RGW
RWI6PA5 F RGW
RWI6PA5 B RGW
RW16PA6 F RGW
RWI6PA6 B RGW
RW16PA7 F RGW
RWI6PA7 B RGW
(
Date
29-NOV-95
20-NOV-95
29-NOV-95
20-NOV-95
29-NOV-95
20-NOV-95
29-NOV-95
20-NOV-95
30-NOV-95
Description
Except for RWI6PAI and 2, all samples collected from the Segregation Area on 20 Nov 95 are from lower part of Unit 4 of
Tshirege Member and are similar in color. This sample is pale grayish orange pink devitrified and vapor-phase nonwelded
tuff with common pale brown pumice to 13 mm. Common felsics to 2.5 mm include conspicuous quartz. Several grains of
unaltered green clinopyroxene are observed, as well as brown hematitic masses, probably pseudomorphs after
orthopyroxene. Scarce lithics are much more abundant than in RWI6PAI and 2, suggesting that these two samples are
uppermost Unit 3 and RW16PA3 is lovvermost Unit 4, because lithics are generally most abundant at the base of a unit.
Sample is natural outcrop of light brown, dry, moderately friable, poorly welded tuff with conspicuous dark brown pumice,
N82E up side gully from RWI6PA3, 4.9 m above RWI6PAI. Outcrop is 1.8 by 1.7 by 1.3 m; sampled from east end,
about halfway up. Tuff also contains yellow-brown ovoids to 8 mm sparsely throughout rock, which were avoided in
sampling as much as possible by sampling the interior of a 20-cm block.
Except for RWI6PA I and 2, all samples collected from the Segregation Area on 20 Nov 95 are from lower part of Unit 4 of
Tshirege Member and are similar in color. This sample is pale grayish orange pink devitrified and vapor-phase nonwelded
tuff with scarce to common yellowish brown pumice to 13 mm. Common felsics to 2.5 mm include conspicuous quartz;
few exceed I mm. Scarce green clinopyroxene occurs, some partly altered with hematitic rims, as well as brown hematitic
masses, probably pseu(}om!J!I>!Js a~ter ortllop_yroxene. Scarce to rare lithics to 1.5 mm.
Sample was taken about halfway up from the western end of a third separate outcrop, 4.0 by 1.8 by 1.1 m, a short distance
S50E from RWI6PA3, 4.3 m above RWI6PAI. This outcrop is dry, moderately friable, poorly welded tuff, light brown
with conspicuous dark brown pumice to 23 mm. The eastern end of the outcrop coincides with the eastern boundary of the
Segregation Area. Except for RWI6PA 1 and 2, all samples collected from the Segregation Area on 20 Nov 95 are from lower part of Unit 4 of
Tshirege Member and are similar in color. This sample is pale grayish orange pink devitrified and vapor-phase nonwelded
tuff with scarce to common moderate yellowish brown pumice to 12 mm. Common felsics to 2 mm include conspicuous
quartz; few exceed 1 mm. Scarce unaltered small green clinopyroxene; small brown hematitic masses are probably
pseudomorphs after orthopyroxene. Scarce to rare lithics are found to 1.5 mm.
I sampled from a low outcrop, 1.7 by 1.1 m area, 6.4 m above RW16PA1, 4.7 m S50W from the NE comer of the
Segregation Area. The sample is dry, moderately friable poorly welded tuff, light brown with conspicuous dark brown
pumice to 24 mm. It was taken beneath a 20-mm flake removed from top surface. Rare yellow brown ovoid weathering
spherules to4 mm were avoided as much as possible during sampling.
Except for RWI6PA I and 2, all samples collected from the Segregation Area on 20 Nov 95 are from lower part of Unit 4 of
Tshirege Member and are similar in color. This sample is pale grayish orange pink devitrified and vapor-phase nonwelded
tuff with scarce to common pale brown pumice to 5 mm. Common felsics to 2 mm, most to I mm, include conspicuous
quartz, although a single 4-mm feldspar was observed. Scarce mafics include partly' altered small green clinopyroxene and
brown hematitic pseudomorph_s, probably after orthopyroxene. Scarce (relatively abundant) lithics are present to 5 mm.
This sample was obtained from low outcrop 7.6 m above RWI6PA I, 7.0 m N31 W from the SE comer stake of the
Segregation Area, and about the same distance north from the paved road. It was sampled beneath a 20-mm flake removed
from top surface. The sample is dry, moderately friable poorly welded tuff, light brown with very conspicuous dark brown
pumice to 21 mm. Except for RWI6PA I and 2, all samples collected from the Segregation Area on 20 Nov 95 are from lower part of Unit 4 of
Tshirege Member and are similar in color. This sample is pale grayish orange pink devitrified and vapor-phase nonwelded
tuff with scarce to common pale brown pumice to 11 mm. Common felsics to 2.5 mm include conspicuous quartz. Scarce
mafics include green clinopyroxene and black orthopyroxene, both mostly altered to orange hematitic pseudomorphs.
Scarce to rare lithics, generally <l mm, include one 4.5-mm-diameter clast.
,) \
•
VI VI
- • • • • Ill ~ ~ 1 • • • - - - ~;-
Appendix 8 (continued)
Sample Number
RWI6PA8
RWI6PA8
RW16PA9
RWI6PA9
RWI6PCI
RWI6PC1
RW16PC2
D Worker Date Description
F RGW 20-NOV-95 The sample was collected from low outcrop 0.2 m below RWI6PA7 and thus 7.4 m above RWI6PAI, 9 m north from the paved road, north of the bar ditch, about halfway between SE and SW corner stakes of the Segregation Area. Rare yellow brown spheroids to 7-mm inner diameter, with concentric bleached zones to 14 mm were avoided in sampling beneath 40-mm flake removed from top surface. The sample is dry, moderately to easily friable, poorly welded devitrified tuff, light brown with dark brown pumice to 24 mm.
8 RGW 30-NOV -95 Except for RWI6PA 1 and 2, all samples collected from the Segregation Area on 20 Nov 95 are from lower part of Unit 4 of Tshirege Member and are similar in color. This sample is pale grayish orange pink devitrified and vapor-phase non welded tuff with scarce to common pale brown pumice to 13 mm. Common felsics to 3 mm, most to 1 mm, include conspicuous quartz. Scarce mafics include unaltered green clinopyroxene prisms and brown hematitic pseudomorphs, probably after orthopyr(}xene. One tiny acic1Jlar mafic, probably hornblende, is 0.3 mm long. Scarce to rare lithics measure to 1.5 mm.
F RGW 20-NOV-95 I sampled on NE side of outlet for bar ditch, in fractured bedrock 2.0 m below RW16PA8 and thus 5.4 m above RW16PA1 as measured through the entire sequence of samples, versus 5.55 m above RW16PA1 as measured directly. The sample is dry, moderately friable, poorly welde(}~evitrified tuff, light brown with conspicuous dark brown pumice to I4 mm.
8 RGW 30-NOV -95 Except for RW16PA I and 2, all samples collected from the Segregation Area on 20 Nov 95 are from lower part of Unit 4 of Tshirege Member and are similar in color. This sample is pale grayish orange pink devitrified and vapor-phase nonwelded tuff with scarce to common moderate yellowish brown pumice generally to 9 mm, with one exceptionally large 28-mmdiameter pumice. Common felsics to 2.5 mm include conspicuous quartz. Scarce mafics include green clinopyroxene, mostly unaltered but partly altered in vapor-phase pumice, and brown hematitic pseudomorphs, probably after orthopyroxene. One black pyroxene, probably orthopyroxene, is only partly altered. Rare lithics measured to I.5 mm.
F RGW I-DEC-95 All samples of tuff from Staging Area 1 (RWI6PC series and SAl/1) are at relatively high elevation, >7510 ft, and undoubtedly within uppermost Unit 4 of Tshirege Member, above base surge sampled as DEB5/9511I, and caprock above this base surge sampled as DEB5/95113. Bedrock is well exposed by shallow roadcuts between 100ft southeast to 300ft southwest of south corner of Staging Area I. All measurements of distances and elevations for these samples were by tape and Brunton compass and/or Jacob Staff. RW16PC1 is 3.2 m normal to the boundary and within Staging Area 1, as measured from a 100-m tape laid out for 18m from the south corner to the east corner, or 7.2 m NI6E from south corner of Staging Area 1. Bedrock is 20 em beneath soil on a 30-degree slope about2 ft downslope from a 20-ft-tall ponderosa. The moderately moist sample was obtained I.5 m below elevation of the south comer of Staging Area I from the uppermost 0.1 m of bedrock, exposed by digging over a 0.4-m width of slope to ensure that the rock was not a large boulder. It is friable, vitric, poorly welded tuff with extraordinarily_ large resorbed feldspar to II mm.
B RGW 8-DEC-95 Sample is moderate yellowish brown vitric, partially welded tuff with scarce, partly fused pumice to 7 mm, composed of very light gray unfused and moderate yellowish brown fused tube walls. One dark 2-mm blocky shard and one 4-mm banded vesicular blocky shard observed. Dark brown spots scattered throughout rock may represent secondary staining or dark pyroclasts. Common feldspar is found to II mm, with the largest grains strongly resorbed. One definite and several probable grains of quartz are observed. Scarce to rare green clinopyroxene and black orthopyroxene both occur in prisms to I mm. Scarce lithics are present to 2.5 mm.
F RGW I-DEC-95 See field description of RW16PCI for general description of samples from Staging Area I. RW16PC2 lies exactly on the boundary of Staging Area 1, as measured from a 100-m tape laid out for 18 m from the south corner to the east corner, or 7.1 m N42E from and 1.55 m below south corner of Staging Area I. Sample was collected from upper 0.1 m of coherent, moderately to slightly moist bedrock; it is here overlain by 0.2 m of fractured rock and soil and an additional 0.1 m of soil covered by pine needles on 30-degree slope into gully to northeast. The gully here is 2.35 m below south corner of Staging Area 1. Sample is orange-brown, friable, poorly w~l~ed tuff with_l_arge vitric pumices and feldspar, similar to RW16PC1.
-
VI 0'1
-
Appendix B (continued)
Sample Number
RW16PC2
RW16PC3
RW16PC3
SAl/1-0.84
SAl/1-0.84
SLS/1-R
SLS/1-R
SUS/1-R
SUS/1-R
\ -
D Worker Date Description B RGW 8-DEC-95 Sample is moderate yellowish brown vitric, partially welded tuff with scarce, partly fused pumice to 8 mm, composed of very light gray unfused and moderate yellowish brown fused tube walls. Dark brown spots scattered throughout rock may represent secondary staining or dark pyroclasts. Common feldspar occurs to 7 mm, with the largest grains generally strongly resorbed and in pumice, where they are held together in a very fragile condition during transportation in the eruptive cloud. One probable grain of quartz is observed. Scarce, unaltered green clinopyroxene prisms were observed to 2 mm, but no black mafics were observed. Rare lithics occur to 1.5 mm. F RGW 1-DEC-95 See field description ofRW16PC1 for general description of samples from Staging Area 1. RW16PC3 is 4.7 m normal to the boundary and outside Staging Area 1, 8.1 m northeastward along a 100-m tape laid out for 18m from the south corner to the east corner, or 9.35 m N65E from south corner of Staging Area 1. I sampled from uppermost 5 em of exposed bedrock that is 1.8 m below south corner of Staging Area 1 where a gully is 2.25 m below south corner. Note that here this gully is measured lower than at RW16PC2 due to its southeast slope; the higher measured value is within measurement error of 15 em for this nearly flat drainage. The sample is dry, moderately friable (easily breakableby handJ or11nge_brown vitric poorly welded tuff with large vitric pumices and feldspar. B RGW 8-DEC-95 Sample is moderate yellowish brown vitric partially welded tuff with scarce moderate yellowish brown pumice to 24 mm. Common feldspar occurs to 6 mm, with the largest grains strongly resorbed. Two probable grains of quartz are observed. Scarce to common unaltered green clinopyroxene prisms occur to 2 mm, and scarce to rare lithics occur to 1.5 mm. A small piece (40 by 25 mm) was removed for a polished thin section. F RGW 1-DEC-95 See field description of RW16PC1 for general description of samples from Staging Area 1. Sample is at 0.76 to 0.84 m below surface from auger hole SAl/1. The surface_of SA1il_is_Q.54 m IJ_elow S()l)th corner of S~g Area 1 and 8.7 m S32E from west corner. B RGW 8-DEC-95 Sample is moderate yellowish brown vitric partially welded tuff with scarce pumice, mostly moderate yellowish brown to 13 mm. Scarce to common feldspar occurs to 5 mm, with the largest grains strongly resorbed. No quartz is observed. Scarce green clinopyroxene prisms exist to 2 mm, and much Jesser black orthopyroxene to 0.5 mm, with pyroxene cleavage evident. Scarce lithics are present to 11 mm, with lithic surfaces and apparent fractures thinly coated with white secondary mineral, probably calcite. Coherent pieces were removed from this largely disaggregatedsam_ple for pulv~riza_tion_in prep!!fati<l_n for chemi~l analysis. F RGW 20-NOV -95 This sample is bedrock from the lower part of soil pit SLS/1 excavated by Eric McDonald today along south-facing slope of W -trending drainage through middle of Segregation Area. Surface of pit is to N48E, 1.7 m above surface at GB/1. Pit exposes broken bedrock 0.1 m below the surface and solid bedrock 0.3 to 0.4 m below surface. The sample 0.4 m below surface is dry, moderately friable, poorly welded devitrified tuff, light brown with conspicuous dark brown pumice to 10 mm. Scattered yellow brown weathering ovoids to 5 mm were avoided as much as possible duringsat11pling.
B RGW 30-NOV-95 Except for RW16PA1 and 2, all samples collected from the Segregation Area on 20 Nov 95 are from lower part of Unit 4 of Tshirege Member and are similar in color. This sample is pale grayish orange pink uevitrified and vapor-phase non welded tuff with scarce to common pale brown pumice to 8 mm. Common felsics to 2 mm include conspicuous quartz. Scarce to rare mafics include unaltered green clino{lyro~ne and orange-brown hematitic pseudomorphs, probably after orthopyroxene. Rare lithics occur to 2.5 mm. F RGW 20-NOV -95 This sample is bedrock from the lower part of soil pit SUS/1 excavated by Eric McDonald today along south-facing slope of W -trending drainage through middle of Segregation Area. Surface of pit is to N62E, 2.8 m above surface at SLS/1, and measured 0.1 m below RW16PA6. Thus SUS/1 and RW16PA6 both measure 6.4 m above RW16PA1, a discrepancy ofO.l m. The pit exposes fairly solid bedrock 0.15 m below the surface to 0.4 m. Sample 0.4 m below surface is moderately to easily friable, poorly welded devitrified tuff, light brown with conspicuous dark brown pumice generally to 14 mm, but with one giant light gray pumice with a dark brown border, with a long axis of 45 mm. The tuff in this pit is strongly altered along root-infested fractures that were avoided during sampling. B RGW 30-NOV-95 Except for RW16PA1 and 2, all samples collected from the Segregation Area on 20 Nov 95 are from lower part of Unit 4 ofTshirege Member and are similar in color. This sample is pale grayish orange pink devitrified and vapor-phase non welded tuff with common pale yellowish brown pumice to 19 mm. Common felsics include very conspicuous quartz to 3.5 mm. Scarce mafics include partly altered green clinopyro~ene__lllld dark brown hematitic pseudomorphs, probably after orthopyroxene. Rare lithics occur to 1.5 mm.
} \ - ~ - - - - - - -- -
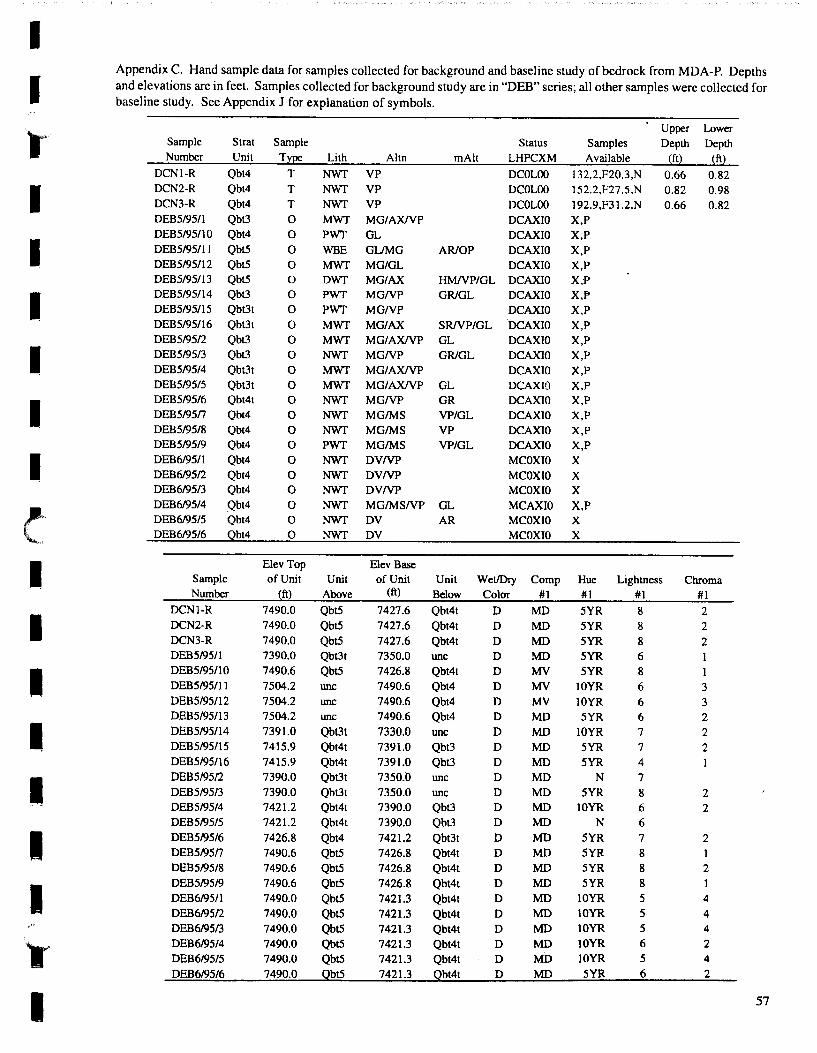
I I
I I I I I I
l I
I
I I I I I ~
I
Appendix C. Hand sample data for samples collected for background and baseline study of bedrock from MDA-P. Depths and elevations arc in feet. Samples collected for background study are in "DEB" series; all other samples were collected for baseline study. See Appendix J for explanation of symbols.
Sample
Number
Strat
Unit
DCNl-R
DCN2-R
DCN3-R
DEB5/9511
DEB5/95110
DEB5/95111
DEB5/95/12 DEB5/95/13
DEB5/95114
DEB5/95/15
DEB5/95116
DEB5/95/2
DEB5/95/3
DEB5/95/4
DEB5/95/5 DEB5/95/6
DEB5/95n
DEB5/95/8 DEB5/95/9
DEB6/9511
DEB6/95/2 DEB6/95/3
DEB6/95/4 DEB6/95/5
DEB6/95/6
Qbt4
Qbt4
Qbt4
Qbt3
Qbt4
Qbt5
Qbt5
Qbt5 Qbt3
Qbt3t
Qbt3t
Qbt3 Qbt3
Qbt3t
Qbt3t Qbt4t
Qbt4
Qbt4
Qbt4
Qbt4
Qbt4 Qbt4
Qbt4 Qbt4
Qbt4
Sample
Number
DCNI-R
DCN2-R
DCN3-R
DEB5/95/1
DEB5/95/10
DEB5/95/11
DEB5/95112
DEB5/95113
DEB5/95114
DEB5/95/15
DEB5/95/16
DEB5/95/2
DEB5/95/3 DEB5/95/4
DEB5/95/5
DEB5/95/6
DEB5/95n
DEB5/95/8
DEB5/95/9
DEB6/95/l
DEB6/95/2
DEB6/95/3
DEB6/95/4
DEB6/95/5
DEB6/95/6
Sample
Tvpe Lith Altn
NWT VP NWT VP NWT VP MWf MG/AXIVP
PWf GL
mAlt
Status
LHPCXM
DCOLOO
DCOLOO
DCOLOO
DCAXIO
DCAXIO
T T T 0 0 0 0 0 0 0 0 0 0 0 0 0 0 0 0 0 0 0 0 0 0
WBE GLIMG ARIOP DCAXIO
DCAXIO MWf MG/GL DWf MG/AX PWf MGNP
PWf MGNP
MWf MG/AX
HMIVP/GL DCAXIO
GR/GL DCAXIO
DCAXIO
SRIVP/GL DCAXIO MWf MG/AXIVP GL DCAXIO
DCAXIO
DCAXIO
DCAXIO
DCAXIO
DCAXIO
DCAXIO
DCAXIO
MCOXIO
MCOXIO MCOXIO
MCAXIO
MCOXIO MCOXIO
NWT MGNP
MWf MG/AXIVP GR/GL
MWf MG/AXIVP GL NWT MGNP GR
NWT MGIMS
NWT MGIMS PWf MG/MS
NWT DVIVP
NWT DVIVP NWT DVIVP
VP/GL
VP VP/GL
NWT MG/MSNP GL NWT DV
NWT DV
ElevTop of Unit Unit
(ft) Above
7490.0 Qbt5
7490.0 Qbt5
7490.0 Qbt5
7390.0 Qbt3t
7490.6 Qbt5
7504.2 unc
7504.2 unc
7504.2 unc
7391.0 Qbt3t
7415.9 Qbt4t
7415.9 Qbt4t
7390.0 Qbt3t
7390.0 Qbt3t
7421.2 Qbt4t
7421.2 Qbt4t
7426.8 Qbt4
7490.6 Qbt5
7490.6 Qbt5
7490.6 Qbt5
7490.0 Qbt5
7490.0 Qbt5
7490.0 Qbt5
7490.0 Qbt5 7490.0 Qbt5
7490.0 Qbt5
Elev Base of Unit
(ft)
7427.6
7427.6
7427.6
7350.0
7426.8
7490.6
7490.6
7490.6
7330.0
7391.0
7391.0
7350.0
7350.0
7390.0
7390.0
7421.2
7426.8
7426.8
7426.8
7421.3
7421.3
7421.3
7421.3
7421.3
7421.3
AR
Unit
Below
Qbt4t
Qbt4t
Qbt4t
unc
Qbt4t
Qbt4
Qbt4
Qbt4
unc
Qbt3
Qbt3
unc
unc Qbt3
Qbt3
Qbt3t
Qbt4t
Qbt4t
Qbt4t
Qbt4t
Qbt4t
Qbt4t
Qbt4t
Qbt4t
Qbt4t
Wet/Dry Comp
Color #I
D MD D MD D MD D MD D MY
D MY
D MY
D MD D MD D MD D MD D MD D MD D MD D MD D MD D MD D MD D MD D MD D MD D MD D MD D MD D MD
Samples
Available
132.2,F20.3,N
152.2,F27.5,N
192.9,F31.2,N
X,P
X,P
X,P
X,P X,P
X,J> X,P
X,P
X,P
X,P
X,P
X,P X,P
X,P X,P
X,P
X X X X,P
X X
Upper
Depth (ft)
0.66
0.82
0.66
Lower
Depth (ft)
0.82
0.98
0.82
Hue Lightness Chroma
#I #I #I
5YR 8
5YR 8
5YR 8
5YR 6
5YR 8
IOYR 6
IOYR 6
5YR 6
IOYR 7
5YR 7 5YR 4
N 7 5YR 8
IOYR 6
N 6 5YR 7
5YR 8
5YR 8
5YR 8
10YR 5
IOYR 5 10YR 5
10YR 6
IOYR 5
5YR 6
2 2
2
1
3 3
2 2 2
2 2
2 1
2
4 4 4 2 4
2
57

i I
I Appendix C (continued) I
_. Sample Comp Hue Lightness Chroma Comp Hue Lightness Chroma Comp Hue I Number #2 #2 #2 #2 #3 #3 #3 #3 #4 #4
DCN1-R PU 5YR 5 2 DCN2-R PU 5YR 5 2
I DCN3-R MD 5YR 8 4 PU 5YR 5 2 DEB5/9511 PU N 8 PU N 7 DEB5/95110 PU lOYR 7 4 PU 5YR 3 u 5YR DEB5/95111 PU 10YR 6 2 I DEB5/95112 PU 10YR 6 2 DEB5/95/13 PU 5YR 4 2 DEB5/95/14 PU lOYR 6 2 PU N 7
I DEB5/95/15 PU N 5 PU 5YR 4 DEB5/95/16 MD N 4 DEB5/9512 PU N 3 DEB5/9513 PU N 6 I DEB5/95/4 PU N 7 PU N 6 DEB5/95/5 PU N 5 DEB5/95/6 PU 5YR 6
I DEB5/95n PU 5YR 6 1 DEB5/95/8 PU 5YR 5 2 DEB5/95/9 PU 10YR 7 2 PU 10YR 7 4 PU 10YR DEB6/9511 AN 5YR 8 4 I DEB6/9512 AN 5YR 8 4 AN 5Y 6 4 DEB6/9513 PU lOYR 4 2 AN 5Y 8 4 DEB6/95/4 PU lOYR 4 2 AN 5Y 8 4 11 DEB6/95/5 MD 5YR 8 2 DEB6/95/6 PU 10YR 5 4
Sample Lightness Chroma Comp Hue Lightness Chroma Collect I Number #4 #4 #5 #5 #5 #5 SamQler Date Reference DCN1-R RGW 01-DEC-95 DCN2-R RGW 01-DEC-95
I DCN3-R RGW 01-DEC-95 DEB5/9511 RGW/FAC 10-MAY-95 DEB5/95/10 6 2 u N 5 RGW/FAC 10-MAY-95 DEB5/95111 RGW/FAC 10-MAY-95 I DEB5/95112 RGW/FAC 10-MAY-95 DEB5/95113 RGW/FAC 10-MAY-95 DEB5/95114 RGW/FAC 10-MAY-95
I DEB5/95115 RGW/FAC 10-MAY-95 DEB5/95116 RGW/FAC 10-MAY-95 DEB5/95/2 RGW/FAC 10-MAY-95 DEB5/95/3 DEB/FAC 10-MAY-95 I DEB5/95/4 RGW/FAC 10-MAY-95 DEB5/95/5 RGW/FAC 10-MAY-95 DEB5/95/6 RGW/FAC 10-MAY-95
I DEB5/95n RGW/FAC 10-MAY-95 DEB5/95/8 RGW/FAC 10-MAY-95 DEB5/95/9 3 4 RGW/FAC 10-MAY-95 DEB6/9511 RGW 05-JUN-95 Rog,1995(E) I DEB6/95!2 RGW 05-JUN-95 Rog,1995(E) DEB6/95/3 RGW 05-JUN-95 Rog,1995(E) DEB6/95/4 RGW 05-JUN-95 Rog,1995(E) -~· I DEB6/95/5 RGW 05-JUN-95 Rog,1995(E) DEB6/95/6 RGW 05-JUN-95 Rog,1995(E)
58 I

I I
• I
• • • I I .. I I I I 11 I
• • •
Appendix C (continued)
Sample Number
DEB6/95n DEB6/95/8-AA DEB6/95/8-D DEB6/95/8-H DEB6/95/8-Z GB/1-R NLS/1-R NUS/1-R RW16PA1 RW16PA10 RW16PA11 RW16PA2 RW16PA3 RW16PA4 RW16PA5 RW16PA6 RW16PA7 RW16PA8 RW16PA9 RW16PC1 RW16PC2 RW16PC3 SAI/1-0.84 SLS/1-R SUS/1-R
Sample Number
DEB6/95n
DEB6/95/8-AA
DEB6/95/8-D DEB6/95/8-H
DEB6/95/8-Z
GB/1-R
NLS/1-R
NUS/1-R
RW16PA1 RW16PA10 RW16PA11 RW16PA2 RW16PA3 RW16PA4 RW16PA5 RW16PA6 RW16PA7 RW16PA8 RW16PA9 RW16PC1 RW16PC2 RW16PC3 SAl/1-0.84 SLS/1-R
SUS/1-R
Strat Unit
Qbt4 Qbt4 Qbt4 Qbt4 Qbt4 Qbt4 Qbt4
Sample Type
0 OP OP OP OP T
Qbt4 Qbt4t 0 Qbt4t 0 Qbt3t 0 Qbt4 0 Qbt4
T T
0 Qbt4 Qbt4 Qbt4 Qbt4 Qbt4 Qbt4 Qbt5 Qbt5 Qbt5 Qbt5 Qbt4 Qbt4
0 0 0 0 0 0 T T 0 c T T
ElevTop of Unit
(ft)
7490.0 7496.7 7496.7 7496.7 7496.7 7490.0 7490.0 7490.0 7427.6 7427.6 7410.6 7490.0 7490.0 7490.0 7490.0 7490.0 7490.0 7490.0 7490.0
7490.0 7490.0
Lith Altn
NWT MG/MS NWT DV NWT DV NWT DV NWT DV NWT VP NWT VP NWT VP NWT DV NWT VP MWT VP NWT VP NWT VP NWT VP NWT VP NWT VP NWT VP NWT VP NWT VP PWT GL PWT GL PWT GL PWT GL NWT VP NWT VP
Unit Above
Qbt5 Qbt5 Qbt5 Qbt5 Qbt5 Qbt5 Qbt5 Qbt5 Qbt4 Qbt4 Qbt4t Qbt5 Qbt5 Qbt5 Qbt5 Qbt5 Qbt5 Qbt5 Qbt5 unc unc unc unc Qbt5 Qbt5
Elev Base of Unit
(ft)
7421.3 7422.7 7422.7 7422.7 7422.7 7427.6 7427.6 7427.6 7410.6 7410.6 7390.6 7427.6 7427.6 7427.6 7427.6 7427.6 7427.6 7427.6 7427.6 7500.0 7500.0 7500.0 7498.0 7427.6 7427.6
mAlt
GL
VP
VP
Status LHPCXM
MCAXIO MCOOOO MCOOOO MCOOOO MCOOOO MCOLOO MCOLOO MCOLOO DCOXIO DCOLOO HCOLOO MCOLOO MCOLOO MCOLOO MCOLOO MCOLOO MCOLOO MCOLOO MCOLOO MCOLOO MCOLOO DCAXIO DCOLOO MCOLOO MCOLOO
Unit Below
Wet/Dry Color
Qbt4t Qbt4t
Qbt4t Qbt4t Qbt4t Qbt4t Qbt4t Qbt4t Qbt3t Qbt3t Qbt3 Qbt4t Qbt4t Qbt4t Qbt4t Qbt4t Qbt4t Qbt4t Qbt4t Qbt4 Qbt4 Qbt4 Qbt4 Qbt4t Qbt4t
D D D D D D D D D D D D D D D D D D D D D D D D D
X,P
Samples Available
111.9,F47.9,N 167.6,F47.1,N 139.8,F33.5,N 158.3,F2L7,A.8,X·,N 291.7,F33,N 223.2,F31.3,N 123.4,F37.3,N 164.4,F28.6,N 162.1,F34.2,N 159.3,F42.6,N 135.F29.7,N 89.7,F43.5,N 109,F31.4,N 110.8,F29.2,N 160,F29.5,N 159.7,F29.7,N 191.6,Fl9.8,A.7,X,P,N 435,F28.4,N 91.3,F46.1,N 134.4,F22.6,N
Upper Depth
(ft)
1.31
1.15 0.49
0.66 0.66
2.49 1.31 0.49
Comp #1
Hue Lightness
MD PU
PU
PU
MD MD MD MD MD MD MD MD MD MD MD MD MD MD MD MV MV MV MV MD MD
#1 #1
5YR 8
5R 7 IOYR 5
10YR 7 5YR 8
5YR 8 5YR 8 5YR 8 5YR 7
5R 7 5R 7
10YR 8
5YR 8 5YR 8
5YR 8
5YR 8
5YR 8
5YR 8
5YR 8
10YR 5
IOYR 5
10YR 5 IOYR 5 5YR 8
5YR 8
Lower Depth
(ft)
1.64
1.48
!-31
0.98 0.98
2.76 1.31 1.31
Chroma #1
2
4 4 I 2 2 2 2 2 2 3
2 2 2 2 2 2 2 5 5 5 5 2 2
59
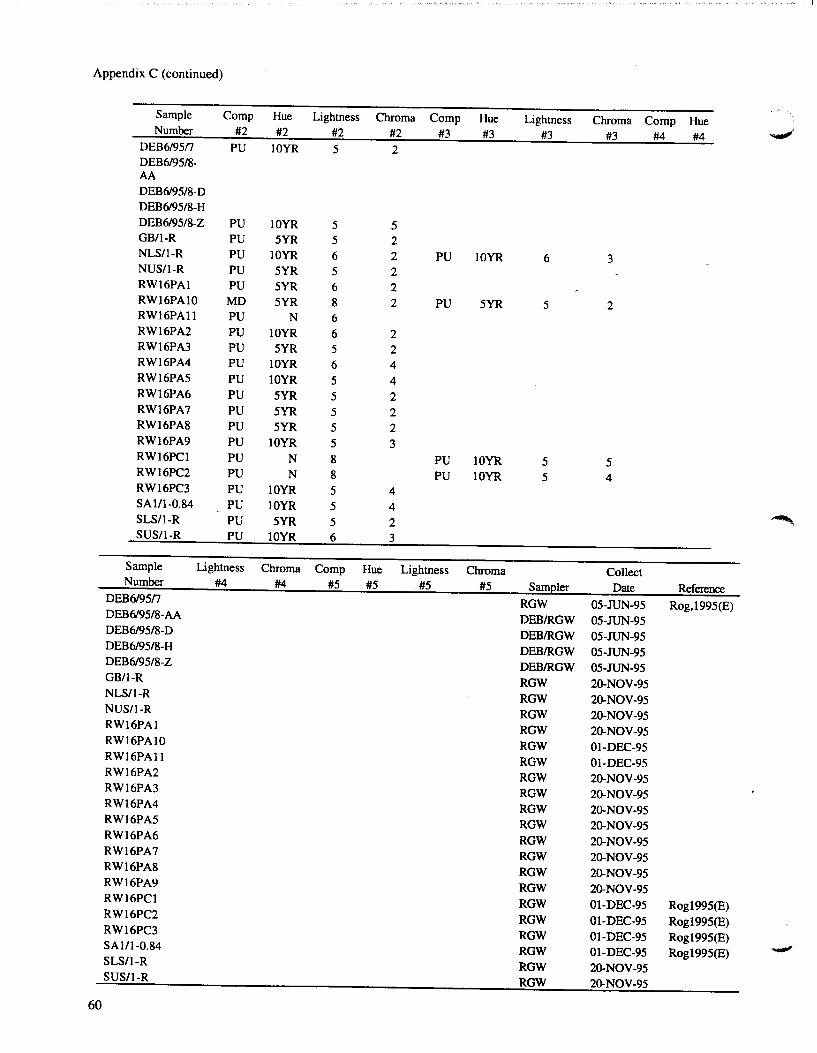
Appendix C (continued)
Sample Comp Hue Lightness Chroma Comp Hue Lightness Chroma Comp Hue Number #2 #2 #2 #2 #3 #3 #3 #3 #4 #4
DEB6/95n PU IOYR 5 2 DEB6/95/8-AA DEB6/95/8-D DEB6/95/8-H DEB6/95/8-Z PU IOYR 5 5 GB/1-R PU 5YR 5 2 NLS/1-R PU IOYR 6 2 PU IOYR 6 3 NUS/1-R PU 5YR 5 2 RWI6PAI PU 5YR 6 2 RWI6PAIO MD 5YR 8 2 PU 5YR 5 2 RWI6PAII PU N 6 RWI6PA2 PU IOYR 6 2 RWI6PA3 PU 5YR 5 2 RWI6PA4 PU IOYR 6 4 RWI6PA5 PU IOYR 5 4 RWI6PA6 PU 5YR 5 2 RWI6PA7 PU 5YR 5 2 RWI6PA8 PU 5YR 5 2 RWI6PA9 PU IOYR 5 3 RWI6PCI PU N 8 PU IOYR 5 5 RWI6PC2 PU N 8 PU 10YR 5 4 RWI6PC3 PU lOYR 5 4 SAl/1-0.84 PU 10YR 5 4 SLS/1-R PU 5YR 5 2 SUS/1-R PU 10YR 6 3
Sample Lightness Chroma Comp Hue Lightness Chroma Collect Number #4 #4 #5 #5 #5 #5 SamEier Date Reference
DEB6/95n RGW 05-JUN-95 Rog,1995(E) DEB6/95/8-AA DEBIRGW 05-JUN-95 DEB6/95/8-D DEBIRGW 05-JUN-95 DEB6/95/8-H DEBIRGW 05-JUN-95 DEB6/95/8-Z DEBIRGW 05-JUN-95 GB/1-R RGW 20-NOV-95 NLS/1-R RGW 20-NOV-95 NUS/1-R RGW 20-NOV-95 RW16PAI RGW 20-NOV-95 RWI6PAIO RGW 01-DEC-95 RWI6PA11 RGW 01-DEC-95 RWI6PA2 RGW 20-NOV-95 RWI6PA3 RGW 20-NOV-95 RW16PA4 RGW 20-NOV-95 RWI6PA5 RGW 20-NOV-95 RW16PA6 RGW 20-NOV-95 RWI6PA7 RGW 20-NOV-95 RW16PA8 RGW 20-NOV-95 RW16PA9 RGW 20-NOV-95 RW16PC1 RGW 01-DEC-95 Rog1995(E) RWI6PC2 RGW 01-DEC-95 Rog1995(E) RWI6PC3 RGW 01-DEC-95 Rog1995(E) SA111-0.84 RGW 01-DEC-95 Rog1995(E) SLS/1-R RGW 20-NOV-95 SUS/1-R RGW 20-NOV-95
60
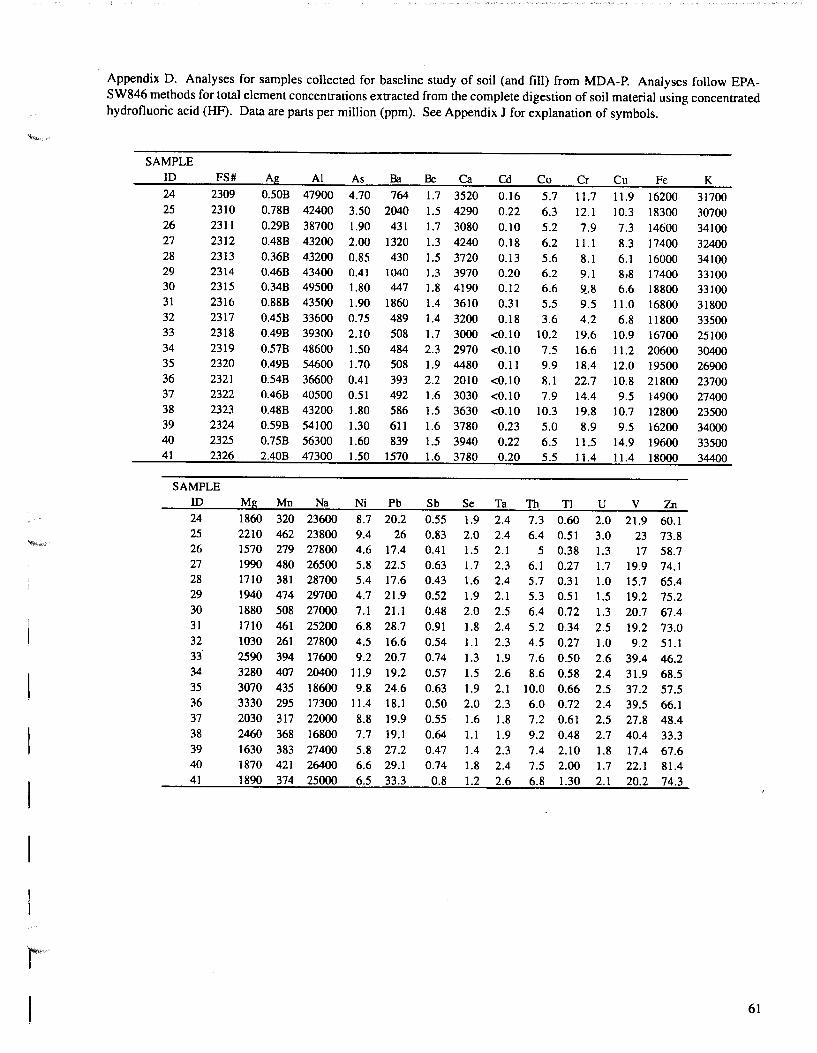
Appendix D. Analyses for samples collected for baseline study of soil (and fill) from MDA-P. Analyses follow EPASW846 methods for total element concentrations extracted from the complete digestion of soil material using concentrated hydrofluoric acid (HF). Data are parts per million (ppm). See Appendix J for explanation of symbols.
SAMPLE ID
24 25 26 27 28 29 30 31 32 33 34 35 36 37 38 39 40 41
FS#
2309 2310 2311 2312 2313 2314 2315 2316 2317 2318 2319 2320 2321 2322 2323 2324 2325 2326
SAMPLE ID 24 25 26 27 28 29 30 31 32 33 34 35 36 37 38 39 40 41
Ag AI As Ba 0.50B 47900 4.70 764 0.78B 42400 3.50 2040 0.29B 38700 1.90 431 0.48B 43200 2.00 1320 0.36B 43200 0.85 430 0.46B 43400 0.41 1040 0.34B 49500 1.80 447 0.88B 43500 1.90 1860 0.45B 33600 0.75 489 0.49B 39300 2.10 508 0.57B 48600 1.50 484 0.49B 54600 1.70 508 0.54B 36600 0.41 393 0.46B 40500 0.51 492 0.48B 43200 1.80 586 0.59B 54100 1.30 611
Be Ca
1.7 3520 1.5 4290 1.7 3080 1.3 4240 1.5 3720
Cd
0.16 0.22 0.10 0.18 0.13
1.3 3970 0.20 1.8 4190 0.12 1.4 3610 0.31 1.4 3200 0.18 1.7 3000 <0.10 2.3 2970 <0.10 1.9 4480 0.11 2.2 2010 <0.10 1.6 3030 <0.10 1.5 3630 <0.10 1.6 3780 0.23
Co
5.7 6.3 5.2 6.2 5.6 6.2 6.6 5.5 3.6
10.2 7.5 9.9 R.1 7.9
10.3 5.0
Cr
11.7 12.1 7.9
11.1 8.1
Cu Fe
11.9 16200 10.3 18300 7.3 14600 8.3 17400 6.1 16000
9.1 8:8 17400 9~8 6.6 18800 9.5 11.0 16800 4.2 6.8 11800
19.6 10.9 16700 16.6 11.2 20600 18.4 12.0 19500 22.7 10.8 21800 14.4 9.5 14900 19.8 10.7 12800 8.9 9.5 16200
K
31700 30700 34100 32400 34100 33100 33100 31800 33500 25100 30400 26900 23700 27400 23500 34000
0.75B 56300 1.60 839 1.5 3940 0.22 6.5 11.5 14.9 19600 33500 2.40B 47300 1.50 1570 1.6 3780 0.20 5.5 11.4 11.4 18000 34400
Mg Mn Na Ni Pb 1860 320 23600 8.7 20.2 2210 462 23800 9.4 26 1570 279 27800 4.6 17.4 1990 480 26500 5.8 22.5 1710 381 28700 1940 474 29700 1880 508 27000 1710 461 25200
5.4 17.6 4.7 21.9 7.1 21.1 6.8 28.7
1030 261 27800 4.5 16.6 2590 394 17600 9.2 20.7 3280 407 20400 11.9 19.2 3070 435 18600 9.8 24.6 3330 295 17300 11.4 18.1 2030 317 22000 8.8 19.9 2460 368 16800 7.7 19.1 1630 383 27400 5.8 27.2 1870 421 26400 6.6 29.1 1890 374 25000 6.5 33.3
Sb Se Ta Th Tl u v Zn 0.55 1.9 2.4 7.3 0.60 2.0 21.9 60.1 0.83 2.0 2.4 6.4 0.51 3.0 23 73.8 0.41 1.5 2.1 5 0.38 1.3 17 58.7 0.63 1.7 2.3 6.1 0.27 1.7 19.9 74.1 0.43 1.6 2.4 0.52 1.9 2.1 0.48 2.0 2.5 0.91 1.8 2.4
5.7 0.31 1.0 15.7 65.4 5.3 0.51 1.5 19.2 75.2 6.4 0.72 1.3 20.7 67.4 5.2 0.34 2.5 19.2 73.0
0.54 0.74 0.57 0.63 0.50 0.55 0.64 0.47 0.74
0.8
1.1 2.3 4.5 0.27 1.3 1.9 7.6 0.50 1.5 2.6 8.6 0.58 1.9 2.1 10.0 0.66 2.0 2.3 6.0 0.72 1.6 1.8 7.2 0.61 1.1 1.9 9.2 0.48 1.4 2.3 7.4 2.10 1.8 2.4 7.5 2.00 1.2 2.6 6.8 1.30
1.0 9.2 51.1 2.6 39.4 46.2 2.4 31.9 68.5 2.5 37.2 57.5 2.4 39.5 66.1 2.5 27.8 48.4 2.7 40.4 33.3 1.8 17.4 67.6 1.7 22.1 81.4 2.1 20.2 74.3
61
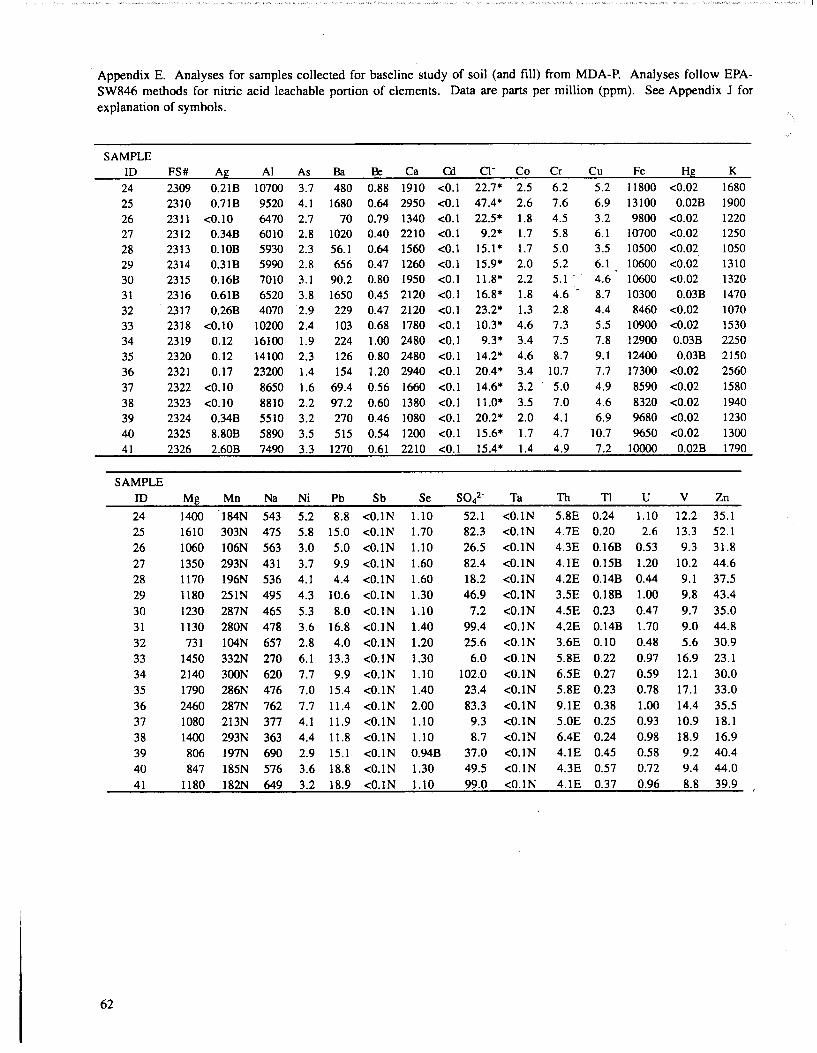
Appendix E. Analyses for samples collected for baseline study of soil (and fill) from MDA-P. Analyses follow EPASW846 methods for nitric acid leachable portion of elements. Data are parts per million (ppm). See Appendix 1 for explanation of symbols.
SAMPLE ID
62
24 25 26 27 28 29 30 31 32 33 34 35 36 37 38 39 40 41
SAMPLE
ID
24 25 26 27 28 29 30 31 32 33 34 35 36 37 38 39 40 41
FS# Ag AI As
2309 0.21B 10700 3.7 2310 0.71B 9520 4.1 2311 <0.10 6470 2.7 2312 0.34B 6010 2.8 2313 0.10B 5930 2.3 2314 0.31B 5990 2.8 2315 0.16B 7010 3.1 2316 0.61B 6520 3.8 2317 0.26B 4070 2.9 2318 <0. 1 0 10200 2.4 2319 0.12 16100 1.9
Ba Be Ca Cd
480 0.88 1910 <0.1 1680 0.64 2950 <0.1
70 0.79 1340 <0.1 1020 0.40 2210 <0.1 56.1 0.64 1560 <0.1 656 0.47 1260 <0.1
90.2 0.80 1950 <0.1 1650 0.45 2120 <0.1 229 0.47 2120 <0.1 103 0.68 1780 <0.1 224 1.00 2480 <0.1
CJ- Co
22.7* 2.5 47.4* 2.6 22.5* 1.8
9.2* 1.7 15.1* 1.7 15.9* 2.0 11.8* 2.2 16.8* 1.8 23.2* 1.3 10.3* 4.6 9.3* 3.4
Cr Cu
6.2 5.2 7.6 6.9 4.5 3.2 5.8 6.1 5.0 3.5 5.2 6.1 5.1 . 4.6 4.6 - 8.7 2.8 4.4 7.3 5.5 7.5 7.8
Fe Hg
11800 <0.02 13100 0.02B 9800 <0.02
10700 <0.02 10500 <0.02 10600 <0.02 10600 <0.02 10300 0.03B
K
2320 0.12 2321 0.17
14100 2.3 23200 1.4
8650 1.6 8810 2.2 5510 3.2 5890 3.5 7490 3.3
126 154
69.4 97.2 270 515
0.80 2480 <0.1 1.20 2940 <0.1 0.56 1660 <0.1 0.60 1380 <0.1 0.46 1080 <0.1 0.54 1200 <0.1 0.61 2210 <0.1
14.2* 4.6 8.7 20.4* 3.4 10.7
9.1 7.7 4.9 4.6 6.9
8460 <0.02 10900 <0.02 12900 0.03B 12400 O.Q3B 17300 <0.02
1680 1900 1220 1250 1050 1310 1320 1470 1070 1530 2250 2150 2560 1580 1940 1230 1300 1790
2322 <0.10 2323 <0.10 2324 0.34B 2325 8.80B 2326 2.60B
Mg
1400 1610 1060 1350 1170 1180 1230 1130 731
1450 2140 1790 2460 1080 1400
806 847
1180
Mn Na
184N 543 303N 475 106N 563 293N 431 196N 536 251N 495 287N 465 280N 478 104N 657 332N 270 300N 620 286N 476 287N 762 213N 377 293N 363 197N 690 185N 576 182N 649
1270
Ni Pb Sb Se
5.2 8.8 <0.1N 1.10 5.8 15.0 <0.1N 1.70 3.0 5.0 <0.1N 1.10 3.7 9.9 <0.1N 1.60 4.1 4.4 <0.1N 1.60 4.3 10.6 <0.1N 1.30 5.3 8.0 <0.1N 1.10 3.6 16.8 <0.1N 1.40 2.8 4.0 <0.1N 6.1 13.3 <0.1N 7.7 9.9 <0.1N 7.0 15.4 <0.1N 7.7 11.4 <0.1N 4.1 11.9 <0.1N 4.4 11.8 <0.1N 2.9 15.1 <0.1N 3.6 18.8 <0.1N 3.2 18.9 <0.1N
1.20 1.30 1.10 1.40 2.00 1.10 1.10 0.94B 1.30 1.10
14.6* 3.2 5.0 11.0* 3.5 7.0 20.2* 2.0 4.1 15.6* 1.7 4.7 10.7
7.2
8590 <0.02 8320 <0.02 9680 <0.02 9650 <0.02
15.4* 1.4 4.9 1 0000 0. 02B
52.1 82.3 26.5 82.4 18.2 46.9
7.2 99.4 25.6
6.0 102.0 23.4 83.3 9.3 8.7
37.0 49.5 99.0
Ta
<0.1N <0.1N <0.1N <0.1N <0.1N <0.1N <0.1N <0.1N <0.1N <0.1N <0.1N <0.1N <0.1N <0.1N <0.1N <0.1N <0.1N <0.1N
Th Tl U
5.8E 0.24 1.10 4.7E 0.20 2.6 4.3E 0.16B 0.53 4.1E 0.15B 1.20 4.2E 0.14B 0.44 3.5E 0.18B 1.00 4.5E 0.23 0.47 4.2E 0.14B 1.70 3.6E 0.10 5.8E 0.22 6.5E 0.27 5.8E 0.23 9.1E 0.38 5.0E 0.25 6.4E 0.24 4.1E 0.45 4.3E 0.57 4.1E 0.37
0.48 0.97 0.59 0.78 1.00 0.93 0.98 0.58 0.72 0.96
V Zn
12.2 35.1 13.3 52.1 9.3 31.8
10.2 44.6 9.1 37.5 9.8 43.4 9.7 35.0 9.0 44.8 5.6 30.9
16.9 23.1 12.1 30.0 17.1 14.4 10.9 18.9 9.2 9.4 8.8
33.0 35.5 18.1 16.9 40.4 44.0 39.9
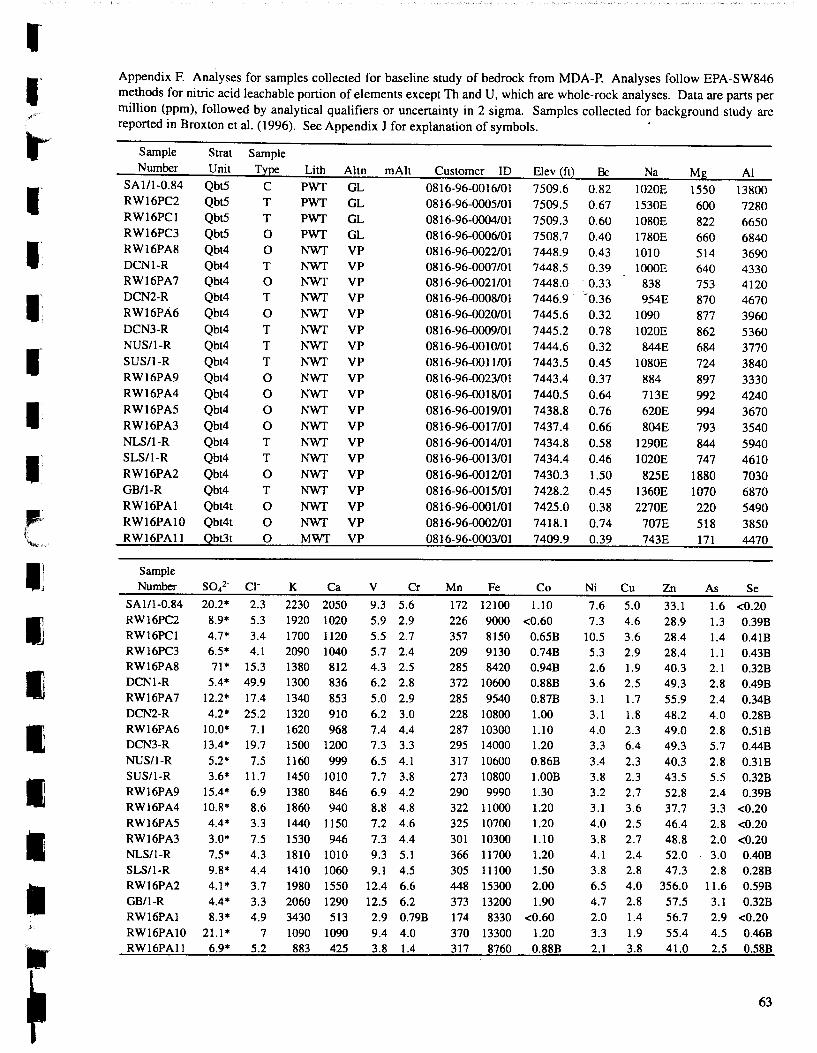
(
I I
I! I I I I I I
Appendix F. Analyses for samples collected for baseline study of bedrock from MDA-P. Analyses follow EPA-SW846 methods for nitric acid leachable portion of elements except Th and U, which are whole-rock analyses. Data are parts per million (ppm), followed by analytical qualifiers or uncertainty in 2 sigma. Samples collected for background study are reported in Broxton et al. (1996). See Appendix J for explanation of symbols. ·
Sample Number
SA1/l-0.84 RW16PC2 RW16PCI RW16PC3 RW16PA8 DCN1-R RW16PA7 DCN2-R RW16PA6 DCN3-R NUS/1-R SUS/1-R RW16PA9 RW16PA4 RW16PA5 RW16PA3 NLS/1-R SLS/1-R RW16PA2 GB/1-R RW16PA1 RW16PA10 RW16PA11
Sample Number
SAI/1-0.84 RW16PC2 RW16PC1 RW16PC3 RW16PA8 DCNI-R RW16PA7 DCN2-R RW16PA6 DCN3-R NUS/1-R SUS/1-R RW16PA9 RW16PA4
Strat Unit
Qbt5 Qbt5 Qbt5 Qbt5 Qbt4 Qbt4 Qbt4 Qbt4 Qbt4 Qbt4 Qbt4 Qbt4 Qbt4 Qbt4 Qbt4 Qbt4 Qbt4 Qbt4 Qbt4 Qbt4 Qbt4t Qbt4t Qbt3t
Sample Type
c T T 0 0 T 0 T 0 T T T 0 0 0 0 T T 0 T 0 0 0
20.2* 2.3 8.9* 5.3 4.7* 3.4 6.5* 4.1 71 * 15.3
5.4* 49.9 12.2* 17.4
Lith Altn PWT GL PWT GL PWT GL PWT GL NWT VP NWT VP NWT VP NWT VP NWT VP NWT VP NWT VP NWT VP NWT VP NWT VP NWT VP NWT VP NWT VP NWT VP NWT VP NWT VP NWT VP NWT VP MWT VP
K Ca
2230 2050 1920 1020 1700 1120 2090 1040 1380 812 1300 836 1340 853
4.2* 25.2 1320 910 10.0* 7.1 1620 968 13.4* 19.7 1500 1200 5.2* 7.5 1160 999 3.6* 11.7 1450 1010
15.4* 6.9 1380 846 10.8* 8.6 1860 940
mAlt
V Cr
9.3 5.6 5.9 2.9 5.5 2.7 5.7 2.4 4.3 2.5 6.2 2.8 5.0 2.9 6.2 3.0 7.4 4.4 7.3 3.3 6.5 4.1 7.7 3.8 6.9 4.2 8.8 4.8
RW16PA5 4.4* 3.3 1440 1150 7.2 4.6 RW16PA3 3.0* 7.5 1530 946 7.3 4.4 NLS/1-R 7.5* 4.3 1810 1010 9.3 5.1 SLS/1-R 9.8* 4.4 1410 1060 9.1 4.5 RW16PA2 4.1* 3.7 1980 1550 12.4 6.6 GB/1-R 4.4* 3.3 2060 1290 12.5 6.2
Customer ID
0816-96-0016/01 0816-96-0005/01 0816-96-0004/01 0816-96-0006/01 0816-96-0022/01 0816-96-0007/01 0816-96-0021/0 I 0816-96-0008/01 0816-96-0020/01 0816-96-0009/01 0816-96-0010/01 0816-96-0011101 0816-96-0023/01 0816-96-0018/01 0816-96-0019/01 0816-96-0017/01 0816-96-0014/01 0816-96-0013/01 0816-96-0012/01 0816-96-0015/01 0816-96-0001101 0816-96-0002/01 0816-96-0003/01
Mn Fe
Elev (ft) Be
7509.6 0.82 7509.5 0.67 7509.3 0.60 7508.7 0.40 7448.9 0.43 7448.5 0.39 7448.0 . 0.33 7446.9 -0.36 7445.6 0.32 7445.2 0.78 7444.6 0.32 7443.5 0.45 7443.4 0.37 7440.5 0.64 7438.8 0.76 7437.4 0.66 7434.8 0.58 7434.4 0.46 7430.3 1.50 7428.2 0.45 7425.0 0.38 7418.1 0.74 7409.9 0.39
Na
1020E 1530E 1080E 1780E 1010 IOOOE
838 954E
1090 1020E
844E 1080E
884 713E 620E 804E
1290E 1020E
825E 1360E 2270E
707E 743E
Co Ni Cu Zn
172 12100 1.10 7.6 5.0 33.1 28.9 28.4 28.4 40.3 49.3 55.9
226 9000 <0.60 7.3 4.6 357 8150 0.65B 10.5 3.6 209 9130 0.74B 5.3 2.9 285 8420 0.94B 2.6 1.9 372 10600 0.88B 3.6 2.5 285 9540 0.87B 3.1 1.7
Mg
1550 600 822 660 514 640 753 870 877 862 684 724 897 992 994 793 844 747
1880 1070 220 518 171
AI
13800 7280 6650 6840 3690 4330 4120 4670 3960 5360 3770 3840 3330 4240 3670 3540 5940 4610 7030 6870 5490 3850 4470
As Se
1.6 <0.20 1.3 0.39B 1.4 0.41B 1.1 0.43B 2.1 0.32B 2.8 0.49B 2.4 0.34B
228 10800 1.00 3.1 1.8 48.2 4.0 0.28B 287 10300 1.1 0 4.0 2.3 49.0 2.8 0.51B 295 14000 1.20 3.3 6.4 49.3 5.7 0.44B 317 10600 0.86B 3.4 2.3 40.3 2.8 0.31B 273 10800 l.OOB 3.8 2.3 43.5 5.5 0.32B 290 9990 1.30 3.2 2.7 52.8 2.4 0.39B 322 11000 1.20 3.1 3.6 37.7 3.3 <0.20 325 10700 1.20 4.0 2.5 46.4 2.8 <0.20 301 10300 1.10 3.8 2.7 48.8 2.0 <0.20 366 11700 1.20 4.1 2.4 52.0 3.0 0.40B 305 11100 1.50 3.8 2.8 47.3 2.8 0.28B 448 15300 2.00 6.5 4.0 356.0 11.6 0.59B 373 13200 1.90 4.7 2.8 57.5 3.1 0.32B
RW16PA1 8.3* 4.9 3430 513 2.9 0.79B 174 8330 <0.60 2.0 1.4 56.7 2.9 <0.20 RWI6PA10 21.1 * RW16PA11 6.9*
7 1090 1090 9.4 4.0 5.2 883 425 3.8 1.4
370 13300 1.20 3.3 1.9 55.4 4.5 0.46B 317 8760 0.88B 2.1 3.8 41.0 2.5 0.58B
63
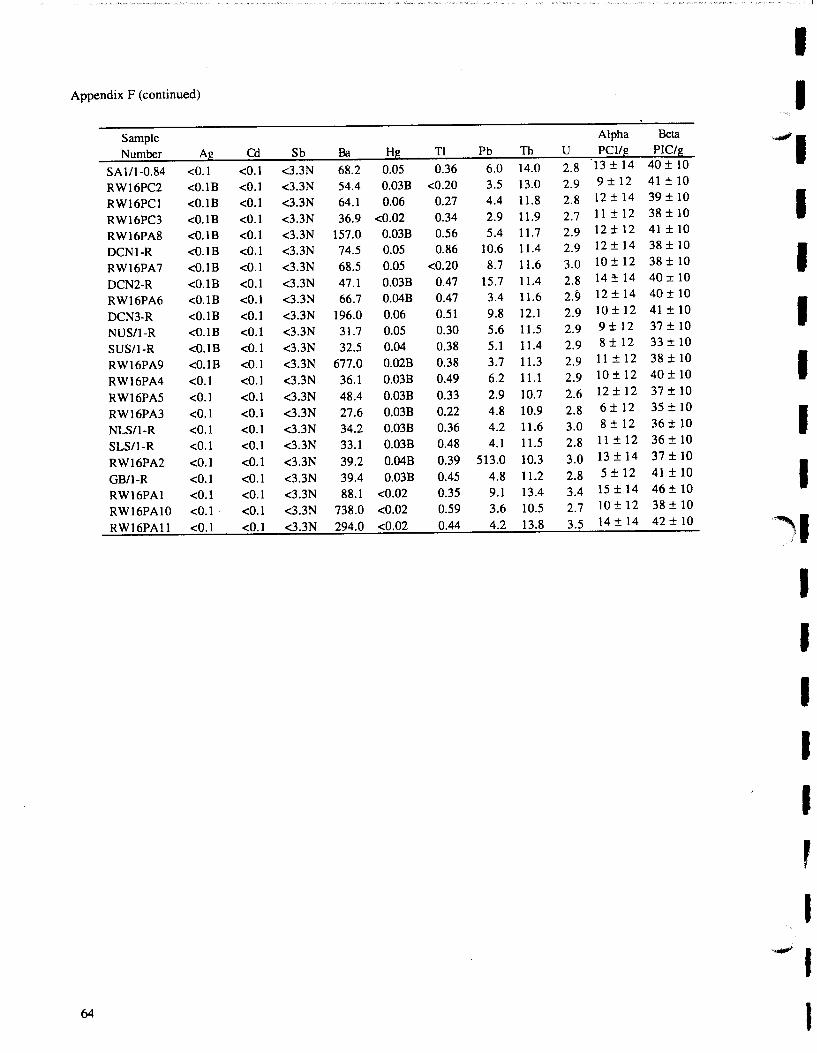
I Appendix F (continued) I
Sample Alpha Beta ~,
Number Ag Cd Sb Ba Hg Tl Pb Th u PCl/g PIC/g
SA1/1-0.84 <0.1 <0.1 <3.3N 68.2 0.05 0.36 6.0 14.0 2.8 13 ± 14 40 ± 10
RW16PC2 <0.1B <0.1 <3.3N 54.4 0.03B <0.20 3.5 13.0 2.9 9 ± 12 41 ± 10
RW16PC1 <0.1B <0.1 <3.3N 64.1 0.06 0.27 4.4 11.8 2.8 12 ± 14 39 ± 10 I RW16PC3 <0.1B <0.1 <3.3N 36.9 <0.02 0.34 2.9 11.9 2.7 11 ± 12 38 ± 10
RW16PA8 <0.1B <0.1 <3.3N 157.0 0.03B 0.56 5.4 11.7 2.9 12 ± 12 41 ± 10
DCN1-R <0.1B <0.1 <3.3N 74.5 0.05 0.86 10.6 11.4 2.9 12 ± 14 38 ± 10 I RW16PA7 <O.lB <0.1 <3.3N 68.5 0.05 <0.20 8.7 11.6 3.0 10 ± 12 38 ± 10
DCN2-R <0.1B <0.1 <3.3N 47.1 0.03B 0.47 15.7 11.4 2:8 14::!:: 14 40 ± 10
RW16PA6 <0.1B <0.1 <3.3N 66.7 0.04B 0.47 3.4 11.6 2.9 12 ± 14 40 ± 10
DCN3-R <0.1B <0.1 <3.3N 196.0 0.06 0.51 9.8 12.1 2.9 10 ± 12 41 ± 10 I NUS/1-R <0.1B <0.1 <3.3N 31.7 0.05 0.30 5.6 11.5 2.9 9 ± 12 37 ± 10
SUS/1-R <0.1B <0.1 <3.3N 32.5 0.04 0.38 5.1 11.4 2.9 8 ± 12 33 ± 10
RW16PA9 <0.1B <0.1 <3.3N 677.0 0.02B 0.38 3.7 11.3 2.9 11 ± 12 38 ± 10 I RW16PA4 <0.1 <0.1 <3.3N 36.1 0.03B 0.49 6.2 11.1 2.9 10 ± 12 40 ± 10
RW16PA5 <0.1 <0.1 <3.3N 48.4 0.03B 0.33 2.9 10.7 2.6 12 ± 12 37 ± 10
RW16PA3 <0.1 <0.1 <3.3N 27.6 0.03B 0.22 4.8 10.9 2.8 6 ± 12 35 ± 10
I NLS/1-R <0.1 <0.1 <3.3N 34.2 0.03B 0.36 4.2 11.6 3.0 8 ± 12 36 ± 10
SLS/1-R <0.1 <0.1 <3.3N 33.1 0.03B 0.48 4.1 11.5 2.8 11 ± 12 36 ± 10
RW16PA2 <0.1 <0.1 <3.3N 39.2 0.04B 0.39 513.0 10.3 3.0 13 ± 14 37 ± 10
GB/1-R <0.1 <0.1 <3.3N 39.4 0.03B 0.45 4.8 11.2 2.8 5 ± 12 41 ± 10 I RW16PA1 <0.1 <0.1 <3.3N 88.1 <0.02 0.35 9.1 13.4 3.4 15 ± 14 46 ± 10
RW16PA10 <0.1· <0.1 <3.3N 738.0 <0.02 0.59 3.6 10.5 2.7 10 ± 12 38 ± 10
RW16PA11 <0.1 <0.1 <3.3N 294.0 <0.02 0.44 4.2 13.8 3.5 14 + 14 42 + 10 ~I
I I I I I
' I _,
I 64 I
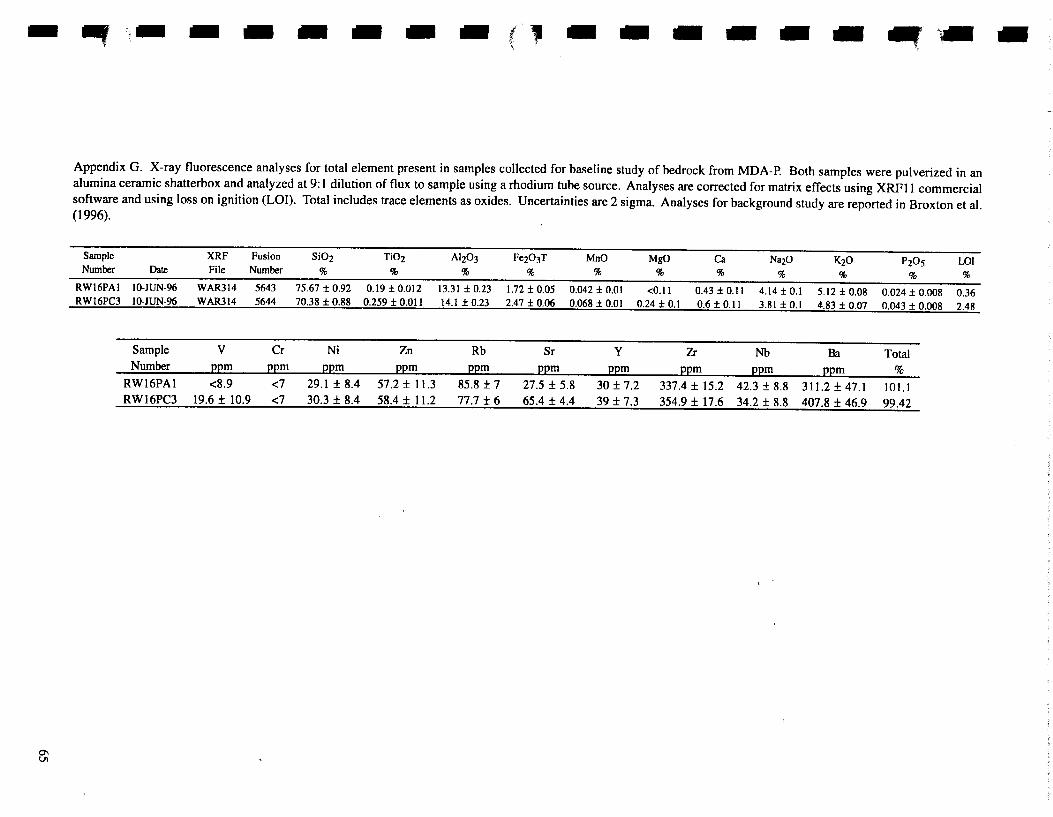
-
0'1 Ul
lllf. ·- .. .. - - - - t' t 'i - - - - - .. ~ .. Appendix G. X-ray fluorescence analyses for total element present in samples collected for baseline study of bedrock from MDA-P. Both samples were pulverized in an alumina ceramic shatterbox and analyzed at 9: 1 dilution of flux to sample using a rhodium tube source. Analyses are corrected for matrix effects using XRFll commercial software and using loss on ignition (LOI). Total includes trace elements as oxides. Uncertainties are 2 sigma. Analyses for background study are reported in Broxton et al. (1996).
Sample XRF Fusion Si02 Ti02 AI203 Fe203T MnO MgO Ca NazO KzO P205 WI Number Date File Number % % % % % % % % % % %
RWI6PAI 10-JUN-96 WAR314 5643 75.67 ± 0.92 0.19 ± 0.012 13.31 ± 0.23 1.72 ± 0.05 0.042 ± 0.01 <0.11 0.43 ± 0.11 4.14 ± 0.1 5.12 ± 0.08 0.024 ± 0.008 0.36 RW16PC3 10-JUN-96 WAR314 5644 70.38 ± 0.88 0.259 ± 0.011 14.1 ± 0.23 2.47 ± 0.06 0.068 ± 0.01 0.24 ± 0.1 0.6 ± 0.11 3.81 ± 0.1 4.83 ± O.Q7 0.043 ± 0.008 2.48
Sample v Cr Ni Zn Rb Sr y Zr Nb Ba Total Number EEID EEID EEID EEID EEID EEID EEID EEID EEID EEID %
RW16PA1 <8.9 <7 29.1±8.4 57.2± 11.3 85.8 ± 7 27.5 ± 5.8 30 ± 7.2 337.4 ± 15.2 42.3 ± 8.8 311.2±47.1 101.1 RW16PC3 19.6 ± 10.9 <7 30.3 ± 8.4 58.4 ± 11.2 77.7 ± 6 65.4 ± 4.4 39 ± 7.3 354.9 ± 17.6 34.2 ± 8.8 407.8 ± 46.9 99.42
..
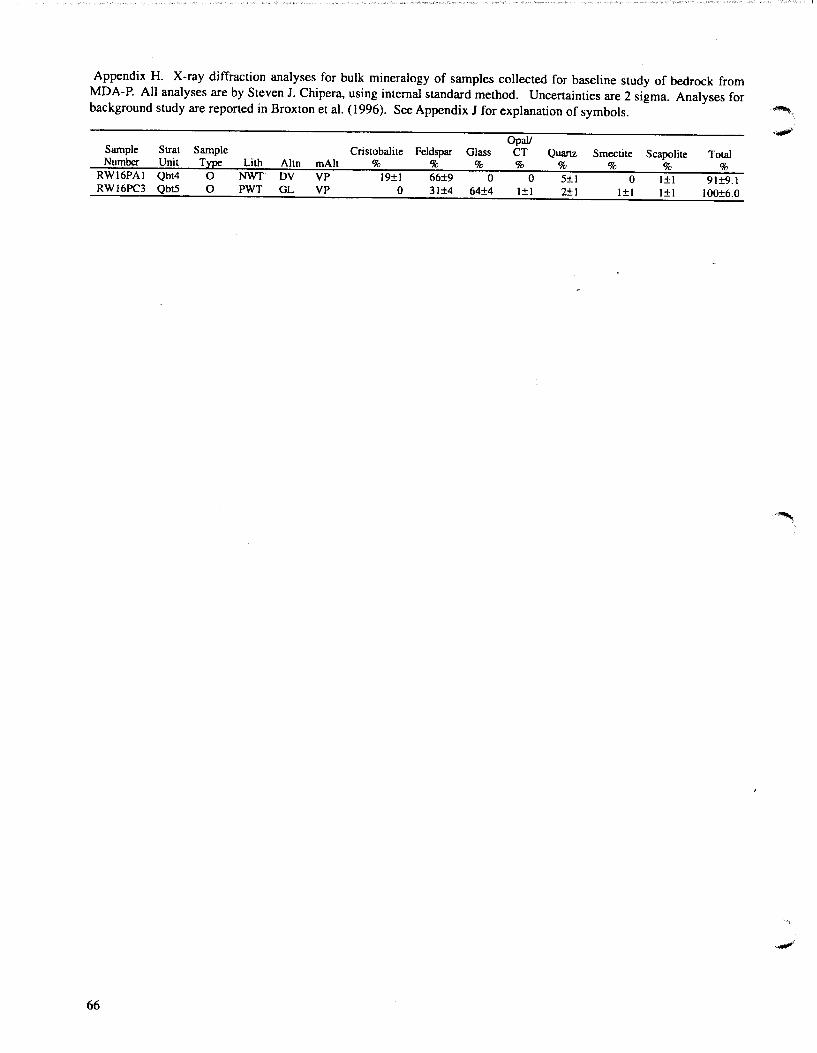
Appendix H. X-ray diffraction analyses for bulk mineralogy of samples co11ected for baseline study of bedrock from MDA-P. A11 analyses are by Steven J. Chipera, using internal standard method. Uncertainties are 2 sigma. Analyses for background study are reported in Broxton et al. ( 1996). See Appendix J for explanation of symbols.
Opal/ Sample Strat Sample Cristobalite Feldspar Glass CT Quanz Smectite Scapolite Total Number Unit T~ Lith Altn mAlt % % % % % % % %
RW16PAI Qbt4 0 NWT· DV VP 19±1 66±9 0 0 5±1 0 1±1 91±9.1 RWI6PC3 Qbt5 0 PWT GL VP 0 31±4 64±4 1±1 2±1 1±1 1±1 100±6.0
66
~ ..
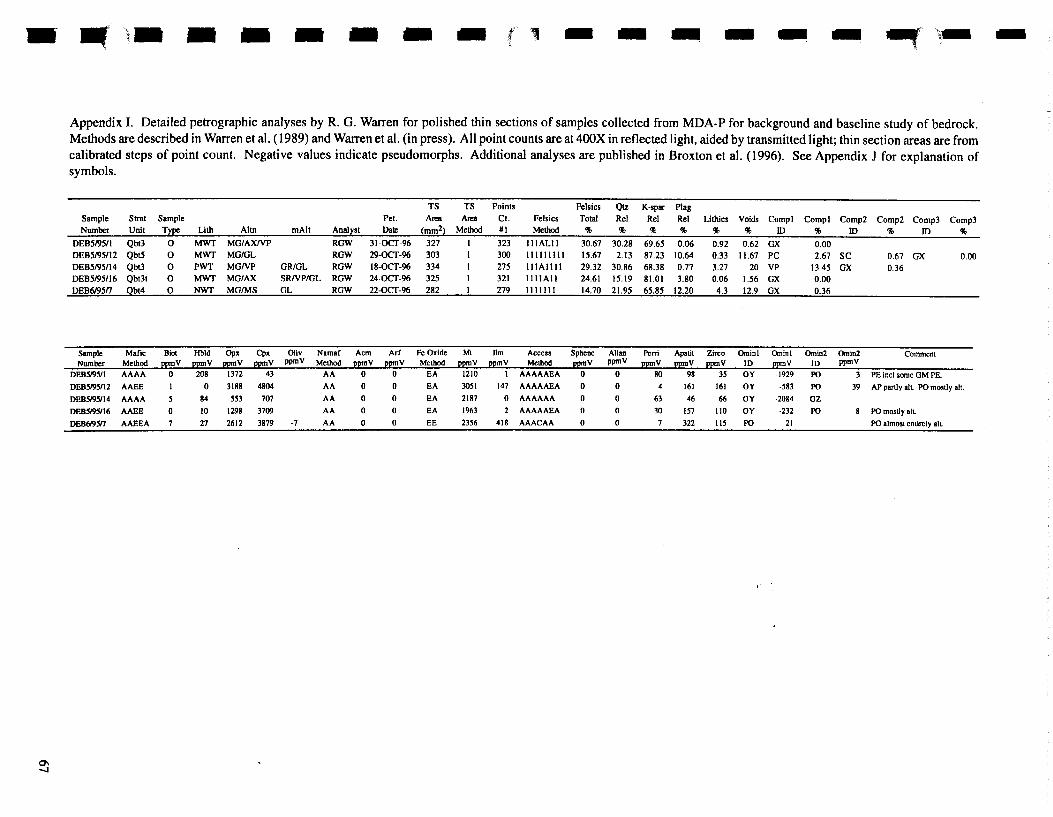
--
C7'l -J
~· - - - - - - .. , - - - - - - ~·--
Appendix I. Detailed petrographic analyses by R. G. Warren for polished thin sections of samples collected from MDA-P for background and baseline study of bedrock. Methods are described in Warren eta!. ( 1989) and Warren eta!. (in press). All point counts are at 400X in reflected light, aided by transmitted light; thin section areas are from calibrated steps of point count. Negative values indicate pseudomorphs. Additional analyses are published in Broxton et a!. (1996). See Appendix J for explanation of symbols.
Sample Strat Number Unit
OEB5195/I Qbt3 DEB5195/12 Qbt5 DEB5195/14 Qbt3 DEB5195/16 Qbt3t DEB6195n Qbt4
Sample Mafic Number Method
DEBS/9511 AAAA
DEB5/95112 AAEE
DEB5195114 AAAA
DEB5195116 AAEE
DEB6195n AAEEA
TS TS Points Felsics Qtz K-spar Plag Sample Pet. Area Area Ct. Pel sics Total Rei Rei Rei Lithics Voids Compl Compl Comp2 Comp2 Comp3 Comp3 Type Lith Altn mAlt Analyst Dam (mm2) Method Ill Method % % % % % % ID % ID % ID %
0 MWT MG/AX/VP RGW 31-0CT-96 327 I 323 111ALII 30.67 30.28 69.65 0.06 0.92 0.62 GX 0.00 0 MWT MG/GL RGW 29-0CT-96 303 I 300 II II IIIli 15.67 2.13 87.23 10.64 0.33 11.67 PC 2.67 sc 0.67 GX 0.00 0 PWT MG/VP GR/GL RGW 18-0CT-96 334 I 275 II lAIII! 29.32 30.86 68.38 0.77 3.27 20 VP 13.45 GX 0.36 0 MWT MG/AX SRNP/GL RGW 24-0CT-96 325 I 321 IIIlA II 24.61 15.19 81.01 3.80 0.06 1.56 GX 0.00 0 NWT MG/MS GL RGW 22-0CT-96 282 I 279 1111111 14.70 21.95 65.85 12.20 4.3 12.9 GX 0.36
Biot Hbld Opx Cpx Otiv Namaf Acm Arf Fe Oxide Ml fim Accc,. Spbene Allan Perri Apatil Zirco Ominl Ominl Omin2 Omin2 Comment ppmV ppmV ppmV ppmV ppmV Method ppmV ppmV Method ppmV ppmV Method ppmV ppmV ppmV ppmV ppmV tD ppmV 1D ppmV
0 208 1372 43 AA 0 0 EA 1210 I AAAAAEA 0 0 80 98 35 OY -1929 PO 3 PE inclsome GM PE. 0 3188 4804 AA 0 0 EA 3051 147 AAAAAEA 0 0 4 161 161 OY -583 PO 39 AP partly aiL PO mostly all.
0
84 553 707 AA 0 0 EA 2187 0 AAAAAA 0 0 63 46 66 OY -2084 GZ to 1298 3709
27 2612 3879 . 7
AA
AA
0
0
0
0
EA
EE
1963
2356
2 AAAAAEA
418 AAACAA
0
0
0
0
30 157
322
Ito OY ·232 PO
liS PO 21
8 PO mostly aiL
PO almosl entirely all.
..
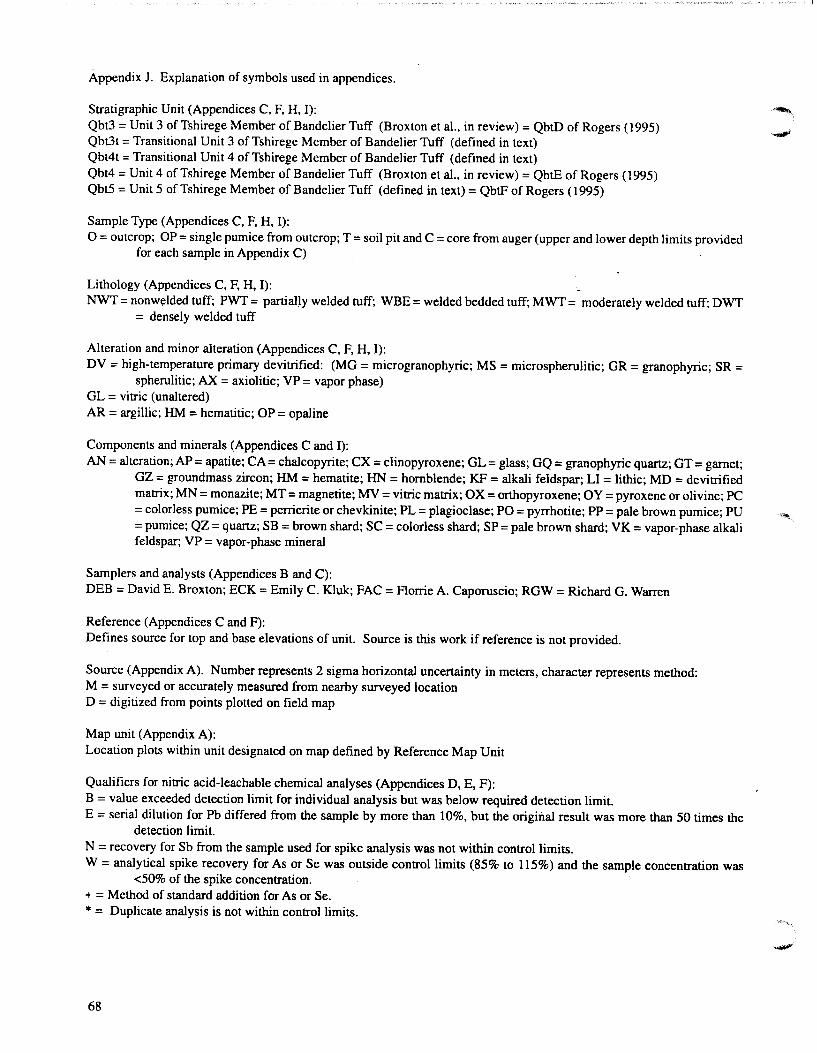
Appendix J. Explanation of symbols used in appendices.
Stratigraphic Unit (Appendices C, F, H, 1): Qbt3 =Unit 3 ofTshirege Member of Bandelier Tuff (Broxton et al., in review)= QbtD of Rogers (1995) Qbt3t =Transitional Unit 3 of Tshirege Member of Bandelier Tuff (defined in text) Qbt4t =Transitional Unit 4 ofTshirege Member of Bandelier Tuff (defined in text) Qbt4 = Unit 4 of Tshirege Member of Bandelier Tuff (Broxton et al., in review) = QbtE of Rogers ( 1995) Qbt5 =Unit 5 of Tshirege Member of Bandelier Tuff (defined in text)= QbtF of Rogers ( 1995)
Sample Type (Appendices C, F, H, 1): 0 = outcrop; OP = single pumice from outcrop; T = soil pit and C = core from auger (upper and lower depth limits provided
for each sample in Appendix C)
Lithology (Appendices C, F, H, 1): NWT =non welded tuff; PWT = partially welded tuff; WBE = welded bedded tuff; MWT = moderately welded tuff; DWT
= densely welded tuff
Alteration and minor alteration (Appendices C, F, H, 1): DV = high-temperature primary devitrified: (MG = microgranophyric; MS = microspherulitic; GR = granophyric; SR =
spherulitic; AX= axiolitic; VP =vapor phase) GL = vitric (unaltered) AR = argillic; HM = hematitic; OP = opaline
Components and minerals (Appendices C and I): AN= alteration; AP = apatite; CA =chalcopyrite; CX =clinopyroxene; GL = glass; GQ = granophyric quartz; GT =garnet;
GZ = groundmass zircon; HM = hematite; HN = hornblende; KF = alkali feldspar; Ll = lithic; MD = devitrified matrix; MN =monazite; MT =magnetite; MV = vitric matrix; OX= orthopyroxene; OY =pyroxene or olivine; PC =colorless pumice; PE = perrierite or chevkinite; PL =plagioclase; PO= pyrrhotite; PP =pale brown pumice; PU '""" =pumice; QZ = quartz; SB =brown shard; SC = colorless shard; SP =pale brown shard; VK = vapor-phase alkali feldspar; VP = vapor-phase mineral
Samplers and analysts (Appendices B and C): DEB =David E. Broxton; ECK =Emily C. Kluk; FAC =Florrie A. Caporuscio; RGW =Richard G. Warren
Reference (Appendices C and F): Defines source for top and base elevations of unit. Source is this work if reference is not provided.
Source (Appendix A). Number represents 2 sigma horizontal uncertainty in meters, character represents method: M = surveyed or accurately measured from nearby surveyed location D = digitized from points plotted on field map
Map unit (Appendix A): Location plots within unit designated on map defined by Reference Map Unit
Qualifiers for nitric acid-leachable chemical analyses (Appendices D, E, F): B =value exceeded detection limit for individual analysis but was below required detection limit. E =serial dilution for Pb differed from the sample by more than 10%, but the original result was more than 50 times the
detection limit. N = recovery for Sb from the sample used for spike analysis was not within control limits. W =analytical spike recovery for As or Se was outside control limits (85% to 115%) and the sample concentration was
<50% of the spike concentration. + = Method of standard addition for As or Se. * = Duplicate analysis is not within control limits.
68
' I
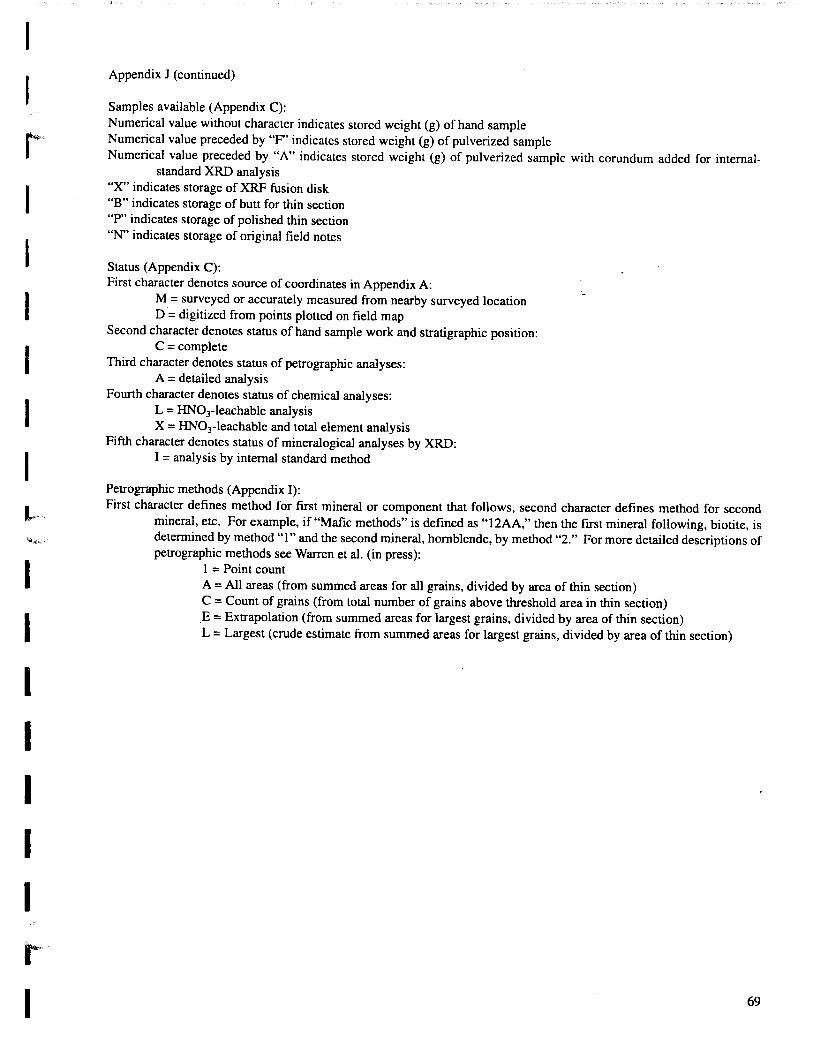
I
I I I I I I I t
I
Appendix 1 (continued)
Samples available (Appendix C): Numerical value without character indicates stored weight (g) of hand sample Numerical value preceded by "F" indicates stored weight (g) of pulverized sample Numerical value preceded by "A" indicates stored weight (g) of pulverized sample with corundum added for internal-
standard XRD analysis "X" indicates storage of XRF fusion disk "B" indicates storage of butt for thin section "P" indicates storage of polished thin section "N" indicates storage of original field notes
Status (Appendix C): First character denotes source of coordinates in Appendix A:
M = surveyed or accurately measured from nearby surveyed location D = digitized from points plotted on field map
Second character denotes status of hand sample work and stratigraphic position: C =complete
Third character denotes status of petrographic analyses: A = detailed analysis
Fourth character denotes status of chemical analyses: L = HNOrleachable analysis X= HN03-leachable and total element analysis
Fifth character denotes status of mineralogical analyses by XRD: I = analysis by internal standard method
Petrographic methods (Appendix 1): First character defines method for first mineral or component that follows, second character defines method for second
mineral, etc. For example, if "Mafic methods" is defined as "12AA," then the first mineral following, biotite, is determined by method "1" and the second mineral, hornblende, by method "2." For more detailed descriptions of petrographic methods see Warren et al. (in press):
I = Point count A= All areas (from summed areas for all grains, divided by area of thin section) C = Count of grains (from total number of grains above threshold area in thin section) .E = Extrapolation (from summed areas for largest grains, divided by area of thin section) L =Largest (crude estimate from summed areas for largest grains, divided by area of thin section)
69