Embed Size (px)
Citation preview
2011HYDRAULICS
MANUAL
Hydraulics (225) 379-1306
STATE OF LOUISIANADEPARTMENT OF TRANSPORTATION AND DEVELOPMENTP.O. Box 94245Baton Rouge, Louisiana 70804-9245http://www.dotd.la.gov/

PREFACE The following text is a comprehensive documentation of LADOTD’s Hydraulic Design Policies. This Manual is intended to be used in conjunction with LADOTD’s Roadway Design Procedures and Details Manual. While design procedures must always be subject to refinement, the material presented herein represents current LADOTD policies. The Manual is divided into categories based on topics with similar design criteria. The first part of a chapter gives LADOTD’s design policies. Important theoretical information of applicable hydraulics for the region is highlighted in the additional parts of a chapter, such as Part A, Part B, etc. Included in the theoretical parts are lists of resource references and approved computer programs for the required hydraulic calculations. The theoretical portion of a chapter does not cover all information and should not be considered a substitute for the designer having a thorough working knowledge of hydraulics. Although the writer of this Manual has strived for thoroughness, questions will undoubtedly arise which have not been covered. Such questions should be addressed to the Hydraulics Design Unit and amendments or revisions to this Manual may be made as the need arises.

This page intentionally left blank.
LADOTD HYDRAULICS MANUAL TABLE OF CONTENTS 2011
CHAPTER 1 – GENERAL REQUIREMENTS
1.1 PURPOSE ----------------------------------------------------------------------------------- 1 – 1 1.1.1 Design Waivers -------------------------------------------------------------------- 1 – 1 1.2 PROJECT CLASSIFICATION ----------------------------------------------------------- 1 – 1 1.2.1 Rural --------------------------------------------------------------------------------- 1 – 1 1.2.2 Urban -------------------------------------------------------------------------------- 1 – 1 1.3 DESIGN STORM FREQUENCY -------------------------------------------------------- 1 – 1 Table 1.3-1 Design Storm Frequencies ----------------------------------------- 1 – 2 1.3.1 Determination of 25 or 50 Year Frequency ------------------------------------ 1 – 2 1.3.2 Other Conditions to Consider a 50 Year Design Frequency ----------------- 1 – 2 1.4 PEAK DISCHARGE ----------------------------------------------------------------------- 1 – 3 1.4.1 General ------------------------------------------------------------------------------ 1 – 3 1.4.2 Gaged Stations --------------------------------------------------------------------- 1 – 3 1.4.3 Ungaged Sites ---------------------------------------------------------------------- 1 – 3 1.5 ROADWAY GRADE ---------------------------------------------------------------------- 1 – 3 1.5.1 Design Flood Stage ---------------------------------------------------------------- 1 – 4 1.5.2 Special Considerations for Urban Sections ------------------------------------- 1 – 4 1.5.3 Raising the Roadway in an Urban Section ------------------------------------- 1 – 4 1.5.4 Drainage Patterns in an Urban Section ------------------------------------------ 1 – 4 1.5.5 Flood Stage Investigation --------------------------------------------------------- 1 – 5 1.5.6 Impacts on Road vs. Impacts on Property -------------------------------------- 1 – 5 1.5.7 Traffic Considerations------------------------------------------------------------- 1 – 6 1.6 FIELD SURVEY ESSENTIALS --------------------------------------------------------- 1 – 6 1.7 DRAINAGE DESIGN FOR DETOURS ------------------------------------------------ 1 – 7 1.7.1 Detour Types ----------------------------------------------------------------------- 1 – 7 1.7.2 Hydraulic Capacity --------------------------------------------------------------- 1 – 7 1.7.3 Bridge Detours -------------------------------------------------------------------- 1 – 7 1.8 EROSION CONTROL --------------------------------------------------------------------- 1 – 8 1.8.1 Temporary Erosion Control ------------------------------------------------------ 1 – 8 1.8.2 Permanent Erosion Control ------------------------------------------------------ 1 – 8 1.9 REFERENCES ------------------------------------------------------------------------------ 1 – 8
CHAPTER 2 – REPORT AND PLAN PREPARATION 2.1 GENERAL INFORMATION ------------------------------------------------------------- 2 – 1 2.2 HYDRAULICS REPORT ----------------------------------------------------------------- 2 – 1 2.2.1 Report Contents -------------------------------------------------------------------- 2 – 1 2.2.2 Bridge Hydraulic Reports -------------------------------------------------------- 2 – 2 2.3 PRELIMINARY PLANS ------------------------------------------------------------------ 2 – 2 2.3.1 Sheets Required -------------------------------------------------------------------- 2 – 2 2.3.2 Plan Revisions --------------------------------------------------------------------- 2 – 2 2.3.3 pH & Resistivity ------------------------------------------------------------------- 2 – 3 2.3.4 Detours ------------------------------------------------------------------------------ 2 – 3
i
LADOTD HYDRAULICS MANUAL TABLE OF CONTENTS 2011 2.4 PLAN-IN-HAND --------------------------------------------------------------------------- 2 – 3 2.4.1 Existing Conditions ---------------------------------------------------------------- 2 – 3 2.4.2 Proposed Design -------------------------------------------------------------------- 2 – 3 2.4.3 Culvert Extensions ----------------------------------------------------------------- 2 – 3 2.5 FINAL PLAN PREPARATION ---------------------------------------------------------- 2 – 4 2.5.1 Sheets Required -------------------------------------------------------------------- 2 – 4 2.5.2 Plan Submittal ---------------------------------------------------------------------- 2 – 4 2.6 DRAINAGE SHEETS REQUIRED IN THE PLANS --------------------------------- 2 – 4 2.6.1 Existing Drainage Map ------------------------------------------------------------ 2 – 4 2.6.2 Design Drainage Map -------------------------------------------------------------- 2 – 5 2.6.3 Plan / Profile Sheets ---------------------------------------------------------------- 2 – 6 2.6.4 Storm Drain Plan / Profile Sheets ------------------------------------------------ 2 – 7 2.6.5 General Bridge Plan Sheet ------------------------------------------------------- 2 – 8 2.6.6 Summary of Drainage Structures Sheet ----------------------------------------- 2 – 8 2.6.7 Summary of Estimated Quantities Sheet ---------------------------------------- 2 – 9 2.6.8 Standard Plans ---------------------------------------------------------------------- 2 – 9 2.6.9 Special Details ---------------------------------------------------------------------- 2 – 9 2.6.10 Reinforced Concrete Box Extension -------------------------------------------- 2 – 10
CHAPTER 3 – PEAK DISCHARGE 3.1 PURPOSE ------------------------------------------------------------------------------------ 3 – 1 3.2 RUNOFF DETERMINATION ------------------------------------------------------------ 3 – 1 3.2.1 Peak Rates of Discharge ----------------------------------------------------------- 3 – 1 3.3 GAGED STATIONS ----------------------------------------------------------------------- 3 – 1 3.4 UNGAGED SITES ------------------------------------------------------------------------- 3 – 2 Table 3.4-1 Peak Discharge Determination for Ungaged Sites -------------- 3 – 2 3.4.1 USGS Method ---------------------------------------------------------------------- 3 – 2 3.4.2 NRCS Method --------------------------------------------------------------------- 3 – 2 3.4.3 Rational Method ------------------------------------------------------------------- 3 – 2 Figure 3.4-1 Mean Annual Precipitation for the USGS Method ------------ 3 – 3 Table 3.4-2 Louisiana Rainfall Depths for NRCS Method ------------------- 3 – 4 Figure 3.4-2 Louisiana Rainfall Regions --------------------------------------- 3 – 5 Figure 3.4-3 Region 1 Rainfall Intensity Curve (Rational Method) -------- 3 – 6 Figure 3.4-4 Region 2 Rainfall Intensity Curve (Rational Method) -------- 3 – 7 Figure 3.4-5 Region 3 Rainfall Intensity Curve (Rational Method) -------- 3 – 8
ii
LADOTD HYDRAULICS MANUAL TABLE OF CONTENTS 2011
CHAPTER 3 – PART A UNITED STATES GEOLOGICAL SURVEY (USGS) METHOD
3-A.1 INTRODUCTION ------------------------------------------------------------------ 3(A) – 1 3-A.2 COMPUTER PROGRAMS ------------------------------------------------------- 3(A) – 1 3-A.3 USGS GAGE LOCATIONS ------------------------------------------------------- 3(A) – 1 3-A.4 UNGAGED LOCATIONS -------------------------------------------------------- 3(A) – 1 3-A.5 INPUT REQUIREMENTS -------------------------------------------------------- 3(A) – 2 3-A.6 LIMITATIONS ---------------------------------------------------------------------- 3(A) – 2 3-A.6.1 Locations ------------------------------------------------------------------ 3(A) – 2 3-A.6.2 Altered Features ---------------------------------------------------------- 3(A) – 2 3-A.6.3 Basin and Climatic Characteristics ------------------------------------ 3(A) – 2 Table 3-A.6-1 RIRM Ranges ------------------------------------------- 3(A) – 3 3-A.7 URBANIZATION MODIFICATION -------------------------------------------- 3(A) – 3 3-A.8 BASIN DEVELOPMENT FACTOR (BDF) ------------------------------------ 3(A) – 6 Figure 3-A.8-1 Typical Drainage Basin Shapes and Subdivision into Basin Thirds ----------------------- 3(A) – 5 3-A.8.1 Division of Drainage Area Basins ------------------------------------- 3(A) – 6 3-A.9 BDF DIVISION CODES ----------------------------------------------------------- 3(A) – 6 3-A.9.1 Channel Modifications -------------------------------------------------- 3(A) – 6 3-A.9.2 Channel Linings ---------------------------------------------------------- 3(A) – 6 3-A.9.3 Storm Drains -------------------------------------------------------------- 3(A) – 7 3-A.9.4 Curb and Gutter Streets ------------------------------------------------- 3(A) – 7 3-A.9.5 Overall BDF Number ---------------------------------------------------- 3(A) – 7
CHAPTER 3 – PART B NATURAL RESOURCES CONSERVATION SERVICE (NRCS) METHOD
3-B.1 INTRODUCTION ------------------------------------------------------------------ 3(B) – 1 3-B.2 COMPUTER PROGRAMS ------------------------------------------------------- 3(B) – 1 3-B.3 DESIGN CRITERIA --------------------------------------------------------------- 3(B) – 1 3-B.4 WATERSHED FACTORS -------------------------------------------------------- 3(B) – 1 3-B.5 TIME OF CONCENTRATION --------------------------------------------------- 3(B) – 1 3-B.6 HYDROLOGIC SOIL GROUPS ------------------------------------------------- 3(B) – 2 Table 3-B.6-1 Soil Group Definitions ------------------------------- 3(B) – 2 Table 3-B.6-2 Hydrologic Classification of Soils ------------------ 3(B) – 4 3-B.7 CURVE NUMBER ----------------------------------------------------------------- 3(B) – 3 Table 3-B.7-1 Runoff Curve Number (CN) ------------------------- 3(B) – 6 3-B.8 DESIGN INPUT -------------------------------------------------------------------- 3(B) – 7 3-B.8.1 Drainage Basin ----------------------------------------------------------- 3(B) – 7 3-B.8.2 Runoff Curve Number --------------------------------------------------- 3(B) – 7 3-B.8.3 Rainfall -------------------------------------------------------------------- 3(B) – 7
iii
LADOTD HYDRAULICS MANUAL TABLE OF CONTENTS 2011
CHAPTER 3 – PART C RATIONAL METHOD
3-C.1 INTRODUCTION ------------------------------------------------------------------- 3(C) – 1 3-C.2 DESIGN ASSUMPTIONS --------------------------------------------------------- 3(C) – 1 3-C.3 HYDROLOGIC ANALYSIS ------------------------------------------------------ 3(C) – 1 3-C.3.1 Runoff Coefficient, C ---------------------------------------------------- 3(C) – 2 Table 3-C.3-1 Runoff Coefficients ------------------------------------- 3(C) – 2 3-C.3.2 Time Of Concentration -------------------------------------------------- 3(C) – 2 Figure 3-C.3-1 Time of Concentration -------------------------------- 3(C) – 4
CHAPTER 4 – OPEN CHANNELS 4.1 PURPOSE ------------------------------------------------------------------------------------- 4 – 1 4.2 DESIGN STORM FREQUENCY --------------------------------------------------------- 4 – 1 4.3 PEAK DISCHARGE ------------------------------------------------------------------------ 4 – 1 4.3.1 Lateral Channels --------------------------------------------------------------------- 4 – 1 4.4 SHAPE AND SIDE SLOPES -------------------------------------------------------------- 4 – 1 4.4.1 Roadside Channels ------------------------------------------------------------------ 4 – 1 4.4.2 Lateral Channels --------------------------------------------------------------------- 4 – 1 4.5 ROADSIDE CHANNEL GRADE --------------------------------------------------------- 4 – 2 4.5.1 Driveways ---------------------------------------------------------------------------- 4 – 2 4.6 LATERAL CHANNELS -------------------------------------------------------------------- 4 – 2 4.6.1 Drainage Servitude ------------------------------------------------------------------ 4 – 2 4.6.2 Spoil Banks -------------------------------------------------------------------------- 4 – 2 4.7 EQUALIZERS ------------------------------------------------------------------------------- 4 – 2 4.8 CHANNEL BLOCKS ----------------------------------------------------------------------- 4 – 3 Figure 4.8-1 Channel Block – Side Drain (Erosion) Example ---------------- 4 – 3 4.9 CHANNEL LININGS ----------------------------------------------------------------------- 4 – 4 4.9.1 Rigid Linings ------------------------------------------------------------------------ 4 – 4 4.9.2 Flexible Linings --------------------------------------------------------------------- 4 – 4 4.10 EROSION CONTROL PRODUCTS ------------------------------------------------------ 4 – 5 4.10.1 Roadside Ditch Lining Selection -------------------------------------------------- 4 – 5 4.10.2 Lateral Channels, Outfall Channels and Larger Roadside Ditches ----------- 4 – 5 Table 4.10-1 Erosion Control Protection for Roadside Ditches --------------- 4 – 6
CHAPTER 4 – PART A OPEN CHANNEL HYDRAULICS
4-A.1 INTRODUCTION --------------------------------------------------------------------- 4(A) – 1 4-A.2 COMPUTER PROGRAMS ---------------------------------------------------------- 4(A) – 1 4-A.3 MANNING’S COEFFICIENT ------------------------------------------------------- 4(A) – 1 Table 4-A.3-1 Manning’s Roughness Coefficient for Channels ------ 4(A) – 2
iv
LADOTD HYDRAULICS MANUAL TABLE OF CONTENTS 2011 4-A.4 UNIFORM GEOMETRIC SHAPED CHANNEL -------------------------------- 4(A) – 3 4-A.4.1 Trapezoidal Sections ------------------------------------------------------- 4(A) – 3 Figure 4-A.4-1 Trapezoidal Cross Section of an Open Channel ---- 4(A) – 4 4-A.4.2 Symmetrical Trapezoidal Sections --------------------------------------- 4(A) – 4 4-A.5 IRREGULAR SHAPED CHANNEL ----------------------------------------------- 4(A) – 4 4-A.5.1 Example Problem ---------------------------------------------------------- 4(A) – 5 Figure 4-A.5-1(a) Channel Cross Section for Example --------------- 4(A) – 5 Figure 4-A.5-1(b) Stage Discharge Curve for Example --------------- 4(A) – 7 4-A.6 EROSION CONTROL PROTECTION -------------------------------------------- 4(A) – 8 4-A.6.1 Open Channels and Roadside Ditches ----------------------------------- 4(A) – 8 4-A.6.2 Lateral Channels ------------------------------------------------------------ 4(A) – 8
CHAPTER 5 – CULVERT MATERIALS AND INSTALLATIONS 5.1 PURPOSE ----------------------------------------------------------------------------------- 5 – 1 5.2 PIPE MATERIAL -------------------------------------------------------------------------- 5 – 1 5.2.1 Pipes under Railroads ------------------------------------------------------------- 5 – 1 5.3 DESIGN SERVICE LIFE FOR CULVERTS------------------------------------------- 5 – 1 5.4 GAGE & COATING REQUIREMENTS ----------------------------------------------- 5 – 2 5.5 JOINT TYPES ------------------------------------------------------------------------------ 5 – 2 5.6 ALLOWABLE FILL HEIGHTS --------------------------------------------------------- 5 – 2 5.6.1 Corrugated Metal Pipe Allowable Fill Heights -------------------------------- 5 – 2 5.6.2 Plastic Pipe Allowable Fill Heights --------------------------------------------- 5 – 2 5.6.3 Reinforced Concrete Pipe Allowable Fill Heights----------------------------- 5 – 2 5.6.4 Reinforced Concrete Box Culverts Allowable Fill Heights ------------------ 5 – 2 5.7 MULTIPLE PIPES ------------------------------------------------------------------------- 5 – 3 Table 5.7-1 Minimum Spacing for Multiple Lines of Pipes ------------------ 5 – 3 5.7.1 Skewed Multiple Pipe ------------------------------------------------------------- 5 – 3 5.8 CULVERT BEDDINGS ------------------------------------------------------------------- 5 – 4 5.9 CULVERT INSTALLATIONS----------------------------------------------------------- 5 – 4 5.9.1 Embankment Installation --------------------------------------------------------- 5 – 4 5.9.2 Trench Installation ----------------------------------------------------------------- 5 – 4 Figure 5.9-1 Typical Culvert Installations ------------------------------------- 5 – 5 5.10 PIPES TO BE BORED OR JACKED --------------------------------------------------- 5 – 4 5.11 SPECIAL INSTALLATIONS ------------------------------------------------------------ 5 – 6 5.11.1 Limited Construction Time ------------------------------------------------------- 5 – 6
CHAPTER 6 – CROSS DRAIN CULVERTS 6.1 PURPOSE ----------------------------------------------------------------------------------- 6 – 1 6.2 DESIGN STORM FREQUENCY -------------------------------------------------------- 6 – 1 6.3 PEAK DISCHARGE ----------------------------------------------------------------------- 6 – 1 6.4 RUNOFF HYDROGRAPH --------------------------------------------------------------- 6 – 1
v
LADOTD HYDRAULICS MANUAL TABLE OF CONTENTS 2011 6.5 CULVERT SELECTION ---------------------------------------------------------------- 6 – 2 6.5.1 Use of Reinforced Concrete Box Culverts instead of Pipe ----------------- 6 – 2 6.6 SIZE OF STRUCTURES ---------------------------------------------------------------- 6 – 2 6.6.1 Sizes of Reinforced Concrete Box Culverts ---------------------------------- 6 – 2 Table 6.6-1 Minimum Culvert Size -------------------------------------------- 6 – 3 6.6.2 Minimum Culvert Size ---------------------------------------------------------- 6 – 3 6.6.3 Sizing Pipes for Alternate Materials ------------------------------------------- 6 – 3 6.7 CONSTRUCTION CLEARANCE ----------------------------------------------------- 6 – 3 6.7.1 Limited Headroom --------------------------------------------------------------- 6 – 4 6.7.2 Burying Culverts ----------------------------------------------------------------- 6 – 4 6.8 CULVERT SLOPE ----------------------------------------------------------------------- 6 – 4 6.8.1 Flow Line (FL) ------------------------------------------------------------------- 6 – 4 6.9 BACKWATER ---------------------------------------------------------------------------- 6 – 5 6.9.1 Differential Head (ΔH) ---------------------------------------------------------- 6 – 5 6.9.2 Allowable Headwater (AHW) & AHW Elevation -------------------------- 6 – 5 6.9.3 Future Development ------------------------------------------------------------- 6 – 5 Table 6.9-1 Design Guidelines for AHW and AΔH ------------------------- 6 – 6 Figure 6.9-1 Allowable Headwater Elevation -------------------------------- 6 – 7 6.10 OUTLET VELOCITY -------------------------------------------------------------------- 6 – 8 6.11 SCOUR PROTECTION AT CULVERT OUTLETS -------------------------------- 6 – 8 6.11.1 Scour Protection ------------------------------------------------------------------ 6 – 8 Table 6.11-1 Maximum depths of scour without protection ---------------- 6 – 8 6.12 LENGTH OF CULVERTS -------------------------------------------------------------- 6 – 9 6.12.1 Calculation of Cross Drain Pipe Lengths ------------------------------------- 6 – 9 6.12.2 Use of Pipe Headwalls ----------------------------------------------------------- 6 – 9 Figure 6.12-1 Computing Lengths for Pipes without Headwalls ---------- 6 – 10 Figure 6.12-2 Computing Lengths for Culverts with Headwalls ----------- 6 – 11 6.12.3 Reinforced Concrete Box Extension ------------------------------------------ 6 – 9
CHAPTER 6 – PART A CULVERT HYDRAULICS
6-A.1 INTRODUCTION --------------------------------------------------------------------- 6(A) – 1 6-A.2 COMPUTER PROGRAMS ---------------------------------------------------------- 6(A) – 1 6-A.3 TERMINOLOGY ---------------------------------------------------------------------- 6(A) – 1 6-A.4 MANNING’S COEFFICIENT ------------------------------------------------------- 6(A) – 2 Table 6-A.4-1 Manning’s Roughness Coefficient for Culverts ------- 6(A) – 2 6-A.5 DESIGN HEADWATER ------------------------------------------------------------- 6(A) – 2 6-A.6 INLET CONTROL -------------------------------------------------------------------- 6(A) – 2 Figure 6-A.6-1 Examples of Inlet Control ------------------------------- 6(A) – 3 6-A.6.1 Headwater Computation for Inlet Control Conditions ----------------- 6(A) – 4 6-A.6.2 Depth of Flow Computation for Inlet Control Conditions ------------- 6(A) – 4 6-A.6.3 Outlet Velocity Computation for Inlet Control Conditions ----------- 6(A) – 4
vi
LADOTD HYDRAULICS MANUAL TABLE OF CONTENTS 2011 Table 6-A.6-1 Inlet Control Headwater Coefficients ----------------- 6(A) – 5 6-A.7 OUTLET CONTROL ---------------------------------------------------------------- 6(A) – 6 6-A.7.1 Headwater Computation for Outlet Control Conditions -------------- 6(A) – 6 Figure 6-A.7-1 Examples of Outlet Control --------------------------- 6(A) – 7 Table 6-A.7-1 Entrance Loss Coefficients, Ke ----------------------- 6(A) – 8 6-A.7.2 Head Computation for Outlet Control Conditions, Full Flow ------- 6(A) – 8 6-A.7.3 Critical Depth of Flow Computation for Outlet Control ------------ 6(A) – 9 Table 6-A.7-2 Velocity Distribution Factor α for Culverts ---------- 6(A) – 9 6-A.7.4 Part-full Flow in Outlet Control Conditions --------------------------- 6(A) – 10 Figure 6-A.7-2 M1 and M2 Curves ------------------------------------- 6(A) – 10 6-A.7.5 Outlet Velocity Computation for Outlet Control Conditions -------- 6(A) – 11 6-A.8 DEPTH OF SCOUR ----------------------------------------------------------------- 6(A) – 12 Table 6-A.8-1 Adjustments for Hydrologic Soil Groups ------------- 6(A) – 13 Form: Hydrologic Summary Table ---------------------------------------------- 6(A) – 15
CHAPTER 7– SIDE AND MEDIAN DRAINS 7.1 PURPOSE ------------------------------------------------------------------------------------- 7 – 1 7.1.1 Exceptions ---------------------------------------------------------------------------- 7 – 1 7.2 DESIGN STORM FREQUENCY ---------------------------------------------------------- 7 – 1 7.3 PEAK DISCHARGE ------------------------------------------------------------------------- 7 – 1 7.4 CULVERT SELECTION -------------------------------------------------------------------- 7 – 1 7.5 SIZE OF STRUCTURES -------------------------------------------------------------------- 7 – 2 7.5.1 Minimum Culvert Size -------------------------------------------------------------- 7 – 2 Table 7.5-1 Minimum Culvert Size ----------------------------------------------- 7 – 2 7.6 CONSTRUCTION CLEARANCE --------------------------------------------------------- 7 – 2 7.6.1 Limited Headroom ------------------------------------------------------------------- 7 – 2 7.7 SIZING PIPES FOR ALTERNATE MATERIALS ------------------------------------- 7 – 3 7.7.1 Flow Line (FL) ----------------------------------------------------------------------- 7 – 3 7.8 SIDE DRAINS -------------------------------------------------------------------------------- 7 – 3 7.8.1 Size Determination ------------------------------------------------------------------ 7 – 3 Table 7.8-1 Maximum Contributory Drainage Area for Side Drains --------- 7 – 4 7.9 MEDIAN DRAINS --------------------------------------------------------------------------- 7 – 4 7.9.1 Hydraulic Clearances ---------------------------------------------------------------- 7 – 6 7.9.2 Ponding ------------------------------------------------------------------------------- 7 – 6 Figure 7.9-1 Pipe Layout Examples ----------------------------------------------- 7 – 5 7.10 LENGTH OF CULVERTS ------------------------------------------------------------------ 7 – 6 7.10.1 Side Drain Lengths ------------------------------------------------------------------ 7 – 6 Figure 7.10-1 Side Drain Length Calculations ----------------------------------- 7 – 7
vii
LADOTD HYDRAULICS MANUAL TABLE OF CONTENTS 2011
CHAPTER 8 – STORM DRAIN SYSTEMS 8.1 PURPOSE ------------------------------------------------------------------------------------ 8 – 1 8.2 POLLUTION PREVENTION ------------------------------------------------------------ 8 – 1 8.3 DESIGN STORM FREQUENCY -------------------------------------------------------- 8 – 1 8.3.1 Design Waivers --------------------------------------------------------------------- 8 – 1 8.3.2 Lower Service Class Streets ------------------------------------------------------ 8 – 1 8.3.3 Lateral Ditches & Cross Drain Culverts ----------------------------------------- 8 – 1 8.4 PEAK DISCHARGE ----------------------------------------------------------------------- 8 – 2 8.5 ROADWAY GRADE ---------------------------------------------------------------------- 8 – 2 8.5.1 Minimum Cross Slope ------------------------------------------------------------- 8 – 2 8.5.2 Minimum Longitudinal Grade ---------------------------------------------------- 8 – 2 8.6 BASIC DESIGN CONCEPTS ------------------------------------------------------------ 8 – 2 8.6.1 Preliminary Investigation---------------------------------------------------------- 8 – 2 8.7 OUTFALLS ---------------------------------------------------------------------------------- 8 – 3 8.7.1 Outfall Pipe ------------------------------------------------------------------------- 8 – 3 8.8 SPACING AND LOCATION OF INLETS --------------------------------------------- 8 – 3 8.8.1 Maximum Inlet Spacing ----------------------------------------------------------- 8 – 3 8.8.2 Maximum Width of Flooding ----------------------------------------------------- 8 – 3 8.8.3 Width of Flooding Reduction ----------------------------------------------------- 8 – 3 8.8.4 Width of Flooding for Interstates ------------------------------------------------ 8 – 4 8.8.5 Geometric Controls ---------------------------------------------------------------- 8 – 4 8.9 CATCH BASIN TYPES ------------------------------------------------------------------- 8 – 4 8.9.1 Outside of Pavement --------------------------------------------------------------- 8 – 5 8.9.2 Traffic, Pedestrians or Bicycles -------------------------------------------------- 8 – 5 Table 8.9-1 Guide to Catch Basin Selection ------------------------------------ 8 – 5 8.9.3 Sag Locations ----------------------------------------------------------------------- 8 – 6 8.9.4 Standard Catch Basins and Manholes ------------------------------------------- 8 – 6 8.10 HYDRAULIC DESIGN OF CONDUIT SYSTEMS ----------------------------------- 8 – 6 8.10.1 Pipe Size ----------------------------------------------------------------------------- 8 – 6 8.10.2 Pipe Length ------------------------------------------------------------------------- 8 – 6 Table 8.10-1 Maximum Length of Pipe without Access ---------------------- 8 – 7 8.10.3 Pipe Slope --------------------------------------------------------------------------- 8 – 6 8.10.4 Flow Lines -------------------------------------------------------------------------- 8 – 6 8.10.5 Pipe Location ----------------------------------------------------------------------- 8 – 7 8.10.6 Outlet Velocity --------------------------------------------------------------------- 8 – 7 8.10.7 Scour Protection -------------------------------------------------------------------- 8 – 7 8.10.8 Hydraulic Grade Line -------------------------------------------------------------- 8 – 7 8.11 MANHOLE REQUIREMENTS ---------------------------------------------------------- 8 – 8 8.11.1 Conditions Which Require Manholes ------------------------------------------- 8 – 8 8.11.2 Conditions Which Do Not Require Manholes ---------------------------------- 8 – 8 8.12 CONSTRUCTION CLEARANCE ------------------------------------------------------- 8 – 9 8.12.1 Underground Utilities -------------------------------------------------------------- 8 – 9 8.12.2 Sanitary Sewer Conflicts ---------------------------------------------------------- 8 – 9 Figure 8.12-1 Dealing with Sanitary Sewer Conflicts ------------------------- 8 – 10
viii
LADOTD HYDRAULICS MANUAL TABLE OF CONTENTS 2011
CHAPTER 8 – PART A GRATE AND CURB INLETS
8-A.1 INTRODUCTION -------------------------------------------------------------------- 8(A) – 1 8-A.2 COMPUTER PROGRAMS --------------------------------------------------------- 8(A) – 1 8-A.3 HYDROLOGIC ANALYSIS ------------------------------------------------------- 8(A) – 2 Figure 8-A.3-1 Weir Crest Length of Grate Inlets -------------------- 8(A) – 2 8-A.4 DEPTH OF PONDING FOR GRATE INLETS ---------------------------------- 8(A) – 3 8-A.4.1 Weir Conditions ----------------------------------------------------------- 8(A) – 3 8-A.4.2 Orifice Conditions --------------------------------------------------------- 8(A) – 3 8-A.4.3 Example Depth of Ponding Calculation -------------------------------- 8(A) – 3 8-A.5 SPREAD FOR GRATE INLETS OUTSIDE OF PAVEMENT --------------- 8(A) – 4 8-A.6 INLET CAPACITY – OUTSIDE THE PAVEMENT --------------------------- 8(A) – 6 Figure 8-A.6-1 Capacities for Grate Inlets Outside of Pavement --- 8(A) – 5 8-A.7 GUTTER CAPACITIES ------------------------------------------------------------ 8(A) – 6 8-A.7.1 Superelevations ------------------------------------------------------------ 8(A) – 6 Figure 8-A.7-1 Gutter Capacities for Uniform Cross Slope --------- 8(A) – 9 8-A.8 INLET CAPACITY – INSIDE THE PAVEMENT ------------------------------ 8(A) – 7 8-A.8.1 Inlets on a Grade ---------------------------------------------------------- 8(A) – 7 8-A.8.2 Inlets in a Sag -------------------------------------------------------------- 8(A) – 7 8-A.8.3 Gutter Flow and Interception Ratio ------------------------------------- 8(A) – 7 Figure 8-A.8-1 CB-06 Inlet Capacity Curve --------------------------- 8(A) – 10 Figure 8-A.8-2 CB-07 Inlet Capacity Curve --------------------------- 8(A) – 11 Figure 8-A.8-3 CB-08 Inlet Capacity Curve --------------------------- 8(A) – 12 Figure 8-A.8-4 CB-09 Inlet Capacity Curve --------------------------- 8(A) – 13 Figure 8-A.8-5 Capacities of Catch Basins at Low Points ----------- 8(A) – 14 8-A.9 INLET SELECTION AND PLACEMENT --------------------------------------- 8(A) – 15 8-A.9.1 Design Procedure for Placement and Selection of Inlets ------------- 8(A) – 15 8-A.9.2 Example of Inlet Selection and Placement ----------------------------- 8(A) – 19 Figure 8-A.9-1(a) Profile of the Roadway for Example -------------- 8(A) – 20 Figure 8-A.9-1(b) Plan View of Inlet Spacing for Example --------- 8(A) – 23 Figure 8-A.9-1(c) Summary Spreadsheet of Inlet Spacing ---------- 8(A) – 24 Form: Inlet Spacing and Selection Spreadsheet ------------------------------ 8(A) – 25
CHAPTER 8 – PART B CONDUIT SYSTEMS HYDRAULICS
8-B.1 INTRODUCTION -------------------------------------------------------------------- 8(B) – 1 8-B.2 COMPUTER PROGRAMS --------------------------------------------------------- 8(B) – 1 8-B.3 HYDROLOGIC ANALYSIS ------------------------------------------------------- 8(B) – 1 8-B.3.1 Energy Grade Line -------------------------------------------------------- 8(B) – 2 8-B.3.2 Velocity Head -------------------------------------------------------------- 8(B) – 2 8-B.3.3 Hydraulic Grade Line ----------------------------------------------------- 8(B) – 2 8-B.4 ENERGY LOSSES ------------------------------------------------------------------- 8(B) – 2
ix
LADOTD HYDRAULICS MANUAL TABLE OF CONTENTS 2011 8-B.4.1 Head Losses/Junction Losses ------------------------------------------- 8(B) – 2 8-B.4.2 Head Loss in Bends and Transitions ----------------------------------- 8(B) – 3 8-B.4.3 Entrance Losses ----------------------------------------------------------- 8(B) – 3 8-B.4.4 Exit Losses ----------------------------------------------------------------- 8(B) – 3 8-B.4.5 Friction Losses ------------------------------------------------------------ 8(B) – 4 8-B.5 HYDRAULIC GRADIENT COMPUTATIONS -------------------------------- 8(B) – 4 8-B.5.1 Stage Elevation ------------------------------------------------------------ 8(B) – 4 8-B.5.2 HGL for Various Pipe Locations --------------------------------------- 8(B) – 5 8-B.5.3 HGL for Various Pipe Water Level Conditions ---------------------- 8(B) – 5 Table 8-B.5-1 HGL for Various Pipe Water Level Conditions ----- 8(B) – 6 8-B.6 PIPE SELECTION AND PLACEMENT ----------------------------------------- 8(B) – 7 8-B.6.1 Design Procedure for Determining Pipe Capacity -------------------- 8(B) – 7 8-B.6.2 Hydraulic Gradient Computations -------------------------------------- 8(B) – 10 8-B.6.3 Flow Line Determination ------------------------------------------------ 8(B) – 10 Figure 8-B.6-1 Flow for Circular Pipe Flowing Full ----------------- 8(B) – 11 Figure 8-B.6-2 Flow for Arch Pipe Flowing Full --------------------- 8(B) – 12 8-B.6.4 Example of Pipe Size Selection and Placement ----------------------- 8(B) – 13 Figure 8-B.6-1(a) Plan View of Example Problem ------------------- 8(B) – 13 Figure 8-B.6-1(b) Profile View of Example Problem ---------------- 8(B) – 17 Figure 8-B.6-1(c) Summary Spreadsheet of Pipe Selection -------- 8(B) – 18 Form: Storm Drain System Design Spreadsheet ----------------------------- 8(B) – 19
CHAPTER 9 – DRAINAGE DESIGN IN WETLANDS 9.1 PURPOSE ------------------------------------------------------------------------------------ 9 – 1 9.2 TERMINOLOGY --------------------------------------------------------------------------- 9 – 1 9.3 DESIGN STORM FREQUENCY -------------------------------------------------------- 9 – 2 9.4 DRAINAGE AREA ------------------------------------------------------------------------ 9 – 2 9.4.1 Stream Size -------------------------------------------------------------------------- 9 – 2 9.4.2 Direction of Sheet Flow ----------------------------------------------------------- 9 – 2 9.4.3 Channels ----------------------------------------------------------------------------- 9 – 2 9.5 CHANNEL REQUIREMENTS ----------------------------------------------------------- 9 – 3 9.5.1 Channel Depth ---------------------------------------------------------------------- 9 – 3 9.5.2 Required Channel Dimensions --------------------------------------------------- 9 – 3 9.5.3 Channel Grade ---------------------------------------------------------------------- 9 – 3 9.6 CULVERT REQUIREMENTS ----------------------------------------------------------- 9 – 3 9.6.1 Minimum Spacing ------------------------------------------------------------------ 9 – 3 9.6.2 Flow Lines -------------------------------------------------------------------------- 9 – 3 9.6.3 Structure Size ----------------------------------------------------------------------- 9 – 4 9.6.4 Differential Head ------------------------------------------------------------------- 9 – 4 9.6.5 Soffits -------------------------------------------------------------------------------- 9 – 4 9.7 WETLANDS DRAINAGE DESIGN EXAMPLE -------------------------------------- 9 – 4 9.7.1 Flow Characteristic ---------------------------------------------------------------- 9 – 4 9.7.2 Drainage Area ---------------------------------------------------------------------- 9 – 5
x
LADOTD HYDRAULICS MANUAL TABLE OF CONTENTS 2011 Figure 9.7-1 Wetland Drainage Design Example ------------------------------ 9 – 6 9.7.3 Discharge --------------------------------------------------------------------------- 9 – 7 9.7.4 Structure Size ----------------------------------------------------------------------- 9 – 7 9.7.5 Structure Spacing ------------------------------------------------------------------ 9 – 8 9.7.6 Collector and Distributor Channels ---------------------------------------------- 9 – 8 Table 9.7-1 Major and Minor Structures Required ---------------------------- 9 – 9
CHAPTER 10 – STORM WATER PUMPING STATIONS 10.1 GENERAL -------------------------------------------------------------------------------- 10 – 1 10.2 DESIGN FREQUENCIES -------------------------------------------------------------- 10 – 1 10.3 INFLOW HYDROGRAPH ------------------------------------------------------------- 10 – 1 10.3.1 Future Development ---------------------------------------------------------- 10 – 2 10.4 WET WELLS ----------------------------------------------------------------------------- 10 – 2 10.4.1 Pump Capacity ----------------------------------------------------------------- 10 – 2 10.4.2 Wet Well Volume ------------------------------------------------------------- 10 – 2 10.5 STORM WATER PUMPING STATIONS HYDRAULICS ----------------------- 10 – 3
CHAPTER 11 – BRIDGE HYDRAULIC DESIGN 11.1 PURPOSE -------------------------------------------------------------------------------- 11 – 1 11.2 DEFINITION ---------------------------------------------------------------------------- 11 – 1 11.3 ANALYSIS/DESIGN ------------------------------------------------------------------ 11 – 1 11.4 DESIGN POLICY ----------------------------------------------------------------------- 11 – 2 11.4.1 General Policy --------------------------------------------------------------- 11 – 2 11.4.2 FEMA Floodplain Compliance -------------------------------------------- 11 – 2 11.5 DESIGN CRITERIA -------------------------------------------------------------------- 11 – 2 11.5.1 AASHTO General Criteria ------------------------------------------------- 11 – 2 11.5.2 LADOTD Criteria ----------------------------------------------------------- 11 – 3 11.6 DESIGN PROCEDURE ---------------------------------------------------------------- 11 – 4 11.6.1 Hydraulic Performance of Bridges ---------------------------------------- 11 – 4 11.6.2 Design Procedure ------------------------------------------------------------ 11 – 4 11.7 SCOUR ----------------------------------------------------------------------------------- 11 – 7 11.7.1 Scour Estimates -------------------------------------------------------------- 11 – 7 11.7.2 LADOTD Policy For Predicting The Scour Elevation For Bridges -- 11 – 8 11.7.3 Scour Protection and Countermeasures ----------------------------------- 11 – 9 11.8 DECK DRAINAGE -------------------------------------------------------------------- 11 – 10 11.8.1 Spread Standards ------------------------------------------------------------ 11 – 10 11.8.2 Scupper and Slot Drains ---------------------------------------------------- 11 – 10 11.8.3 Bridge End Drains ----------------------------------------------------------- 11 – 10 11.9 DOCUMENTATION ------------------------------------------------------------------ 11 – 11 11.9.1 Sample Table of Contents of a Bridge Hydraulics Report ------------- 11 – 11 11.10 REFERENCES -------------------------------------------------------------------------- 11 – 12
xi

LADOTD HYDRAULICS MANUAL TABLE OF CONTENTS 2011
xii
This page intentionally left blank.
LADOTD HYDRAULICS MANUAL GENERAL REQUIREMENTS 2011
CHAPTER 1 GENERAL REQUIREMENTS
1.1 PURPOSE One of the many problems in the design of highway projects is the satisfactory disposal of surface runoff. The water from the roadway, roadside channels and streams crossing the project must be disposed of properly without causing property or highway damage due to flooding or erosion. This Hydraulics Manual sets forth drainage design standards for Louisiana Department of Transportation & Development (LADOTD) projects. 1.1.1 Design Waivers If unusual conditions warrant a deviation from the policies and procedures set in this manual, the Hydraulics Engineer Administrator should be consulted. A “design waiver” may be necessary. Further clarification of this procedure can be found in the Roadway Design Procedures and Details Manual. 1.2 PROJECT CLASSIFICATION Projects are generally classified into one of two design types: urban or rural. However, some of the required hydraulics are the same for either case, such as the design of cross drain culverts or bridges. 1.2.1 Rural Rural drainage design has open ditch facilities to catch the roadway runoff. 1.2.2 Urban Urban drainage design usually consists of curb and gutter with storm drain pipe systems to drain runoff from the roadway and surrounding land. 1.3 DESIGN STORM FREQUENCY Frequency is the number of times a flood of a given magnitude can be expected to occur on an average over a long period of time. Frequency is actually the probability that a flood of a given magnitude may be exceeded in one year. Frequency is an important design parameter in that it identifies the level of risk acceptance for the design of highway structures.
1 − 1

LADOTD HYDRAULICS MANUAL GENERAL REQUIREMENTS 2011 When a storm frequency is selected for a particular location, the designer is implying that the estimated effect of a larger storm on property, traffic and the environment does not justify constructing a larger structure at the time. Also, it should be noted that designing for small, frequent storms can result in traffic interruptions and can be costly since expensive repairs and damage to property can be high. The general design storm frequency for a project will be determined as a function of the 20 year Projected Annual Average Daily Traffic (PAADT). The current AADT and PAADT should be requested through the Project Manager. Table 1.3-1 lists the frequencies for different drainage considerations. Frequencies for other conditions are discussed in their corresponding sections. If unusual conditions warrant, a “design waiver” to use a different frequency will be required.
Table 1.3-1 Design Storm Frequencies
DRAINAGE CLASSIFICATION FREQUENCY
Interstates 50 years Roadway Grade, Bridges, Cross Drains, or Side Drains under important side roads 25 or 50 years
Side Drains under private drives & average conditions 5 year Median Drains 10 years Storm Drains and Inlets 10 years Roadside Channel 5 years Detour Road Structures 1 year minimum
1.3.1 Determination of 25 or 50 Year Frequency
a.) 25 year frequency is required when the PAADT is ≤ 3000. b.) 50 year frequency is required when the PAADT is > 3000.
1.3.2 Other Conditions to Consider a 50 Year Design Frequency A 50 year frequency may be justified at individual sites on a project where: a.) The site is on a primary route for emergency vehicles or community
evacuation. b.) The structure is considered a major drainage structure in a designated
wetland area. c.) It is for urban arterial roads and streets. d.) The roads and streets have four or more lanes. e.) Ramps and approach roadways are within control of access boundaries of
freeways.
1 − 2
LADOTD HYDRAULICS MANUAL GENERAL REQUIREMENTS 2011 1.4 PEAK DISCHARGE 1.4.1 General Design peak rates of runoff are to be based upon the watershed conditions that are expected to exist 20 years in the future. 1.4.2 Gaged Stations The United States Geological Survey (USGS) carries on a continuous program of stream gaging. This stream gaging data (gaging station locations, high water stages, and discharge records) should be used whenever it is applicable. For location of gaging stations and specific site data, refer to the USGS publications: “Magnitude and Frequency of Floods for Small Watersheds in Louisiana”, United States Geological Survey, 1979 and “Floods in Louisiana, Magnitude and Frequency”, 5th Edition, United States Geological Survey, 1998 which are available through LADOTD. USGS has a yearly publication of the gage data collected. These should be used in conjunction with the above-mentioned references. For more information, contact the USGS office. The U.S. Army Corps of Engineers also has gages around the state. For information concerning their gages, contact their New Orleans or Vicksburg office. The methods for determining the peak discharge from gage data are described in the FHWA publication HDS-2 – Highway Hydrology. It is available on the FHWA website. 1.4.3 Ungaged Sites When gage data is insufficient or unavailable, LADOTD uses three methods to estimate peak runoff rates essential to the hydraulic design of channels and structures. The methods vary according to the size of the area contributing runoff and to the structure application. See Chapter 3 for the methods LADOTD uses for estimating peak rates of runoff in the design of highway drainage structures when insufficient or no observed data is available. 1.5 ROADWAY GRADE When it is necessary to locate a highway within the limits of a floodplain, as is frequently the case in Louisiana, the presence of the highway can influence the ultimate flood stage and its impacts, while the flood stage can likewise have impact upon the highway. The impacts of the highway upon the flood and of the flood upon the highway are interdependent factors which must be balanced by design. A primary element of preliminary design is the selection of a proper roadway grade or elevation. The history of past floods, their effect on existing
1 − 3
LADOTD HYDRAULICS MANUAL GENERAL REQUIREMENTS 2011 drainage systems and their damage to property are of exceptional value in setting roadway grades. It is, therefore, essential that all aspects of grade selection be thoroughly studied and resolved very early in the preliminary design process. 1.5.1 Design Flood Stage By definition, the road should not be overtopped by a flood of design frequency. Furthermore, it is generally desirable to maintain one (1) foot freeboard between the lowest elevation of the paved surface and the design flood stage. The procedure for setting the minimum roadway grade is dependent upon the determination of the design flood stage for the roadway in question. Setting a roadway grade is based upon the road remaining open and usable for a flood of selected magnitude. A design storm frequency of either 25 years or 50 years should be utilized in setting the roadway grade, even for projects with storm drain systems or urban sections. Proper evaluation of the flood potential factors in the planning stage of the project is essential, and may very well influence the choice of whether a rural or urban type section should be utilized. 1.5.2 Special Considerations for Urban Sections Some will question why we would set grade based upon a 25 or 50 year frequency flood stage in an urban section, while designing the storm drain system for only a 10 year frequency. It is important to distinguish between the nuisance type surface flooding which may result from the drainage system being overburdened, and the complete inundation of the roadway by floodwaters. Placing the surface of the road above significant flood elevation and providing for surface drainage for lesser storms are two separate issues, both of which cannot always be achieved. 1.5.3 Raising the Roadway in an Urban Section It may not be practical to raise the roadway above the design event if this is considerably higher than the existing roadway. Having to raise the roadway grade in urban sections may result in right-of-way acquisition problems, undesirable grades for driveways and other connections to the roadway, as well as storm water impoundment outside of the right-of-way. 1.5.4 Drainage Patterns in an Urban Section For urban sections, the grade should not be set any lower than is necessary to permit drainage only of those areas which naturally slope toward the project. Sometimes, areas naturally draining toward the project are so large that, if allowed to drain over the curb, adequate surface drainage of the roadway becomes impractical or impossible. In such cases it may be necessary to set a grade which limits or prevents over-the-curb drainage and to intercept overland flow behind the curb. Other factors influencing grade in urban situations are
1 − 4
LADOTD HYDRAULICS MANUAL GENERAL REQUIREMENTS 2011 available right-of-way, utility conflicts and driveway connections. Setting low points at intersections and driveways should be avoided. 1.5.5 Flood Stage Investigation The roadway grade determination is based on information gathered in conducting a flood stage investigation for the proposed alignment. The flood stage investigation must be performed before any culvert or bridge analysis can begin. The calculated headwater for minor structures should not be used to set roadway grades. It is important that the flood stage investigation be conducted over the entire route of the proposed roadway to determine any areas of inadequacy. Several tools and methods to be used in the investigation are outlined below: a.) When gage data is available at a site, a statistical analysis, such as the
Log-Pearson Type III analysis, should be performed to determine the stage for the design event. For a complete description of this design process, see the FHWA publication HDS-2 – Highway Hydrology.
b.) In the absence of gage data, information gathered from persons having
knowledge or records of past floods in the study area should be taken into consideration when determining the grade. This should include, but not be limited to: long-time residents, LADOTD district maintenance personnel, District Engineers and parish or city engineers. These interviews should be included in the hydraulics report with information on the person interviewed such as: length of residency, depth and length of time of roadway overtopping and approximate frequency of overtopping, etc. The designer should assign frequencies to reports of high water, and use sound engineering judgment to predict the stage for the design event.
c.) Flood studies performed by the U. S. Corps of Engineers or USGS can be
used if available. d.) FEMA Flood Insurance Rate Maps should be reviewed; however, these
maps should not be used as the sole source of the flood stage investigation. 1.5.6 Impacts on Road vs. Impacts on Property The concept is to select a minimum roadway elevation based upon the relative importance of keeping the road open and usable and the consequences of having the road closed or damaged by flood waters. An equally important consideration is the flood impact to adjacent property which is chargeable to the highway. This factor is especially important when raising the grade of a roadway which has a history of overtopping.
1 − 5

LADOTD HYDRAULICS MANUAL GENERAL REQUIREMENTS 2011 1.5.7 Traffic Considerations Traffic interruptions due to flooding are always a serious occurrence. Interruptions and short delays due to floods may sometimes be warranted. However, the seriousness of the situation must be evaluated by considering all related factors including traffic volume, length of predicted delays, availability of alternate routes, overall importance of the route, etc. Under some circumstances, over-the-road flow may be designed for with the documented concurrence of the Chief Engineer. 1.6 FIELD SURVEY ESSENTIALS For a complete guideline of LADOTD’s survey criteria, consult the LADOTD Location & Survey Manual. Below is a list of the minimum information needed to perform an adequate hydraulic analysis to determine the required cross drain (culvert or bridge), its size, and proper location. The following data should be secured at the time normal field survey is in progress: A.) Drainage areas in acres contributing flow to streams crossing the project. B.) Type of terrain and land use. C.) Ridge lines. D.) Size, angle of crossing and flow lines of existing drainage structures. E.) Size of adjacent structures, upstream and downstream. F.) High water elevations for streams crossing the project, both upstream and
downstream. (Show source of information.) G.) The low tide, high tide, and average tide elevations on streams affected by
tidal movements. H.) Adequate elevation information for the designer to determine the general
cross section and slope of any ditches or streams crossing the project. For streams which may require bridges or large culverts, a traverse, a profile, and cross sections for a distance far enough upstream and downstream to obtain a true representation of the floodplain should be provided.
1 − 6
LADOTD HYDRAULICS MANUAL GENERAL REQUIREMENTS 2011 1.7 DRAINAGE DESIGN FOR DETOURS Where feasible, traffic should be diverted around the construction over state routes. When this is impractical, detour roads adjacent to the construction must be provided. 1.7.1 Detour Types LADOTD recommends three different types of detours, namely B, C and D. These detours are discussed in detail and shown in chapters 4 and 8 of the Roadway Design Procedures and Details Manual. For low profile runarounds, used on off-system projects only with a current ADT of 250 or less, the contractor shall be responsible for the drainage requirements. In the event the detours are damaged by flood waters due to insufficient hydraulic capacity, the contractor is responsible for the costs of restoring the detours to their original condition. 1.7.2 Hydraulic Capacity Drainage structure openings for Types B, C, and D detours will be determined by the designer and shown on the detour layout. LADOTD will assume the responsibility for the hydraulic capacity of these detours, and, in the event the detours are damaged by flood waters due to insufficient hydraulic capacity, will reimburse the contractor for the costs of restoring the detours to their original condition. Drainage structure openings for Type B, C and D detours are designed according to the following design criteria.
a.) The design storm frequency should be calculated in accordance with the AASHTO Model Drainage Manual, Chapter 19 - “Construction”, Appendix 19A - “Temporary Hydraulic Facilities”. The minimum design storm frequency for the detour is two (2) years.
b.) The design discharge is estimated by methods previously described in this chapter using the computed design storm frequency.
c.) The allowable headwater shall be set at ½ ft (6 in.) below finished grade of
the detour, unless other controls govern the situation, such as surrounding development or predicted excessive outlet erosion.
d.) The detour should be lower than the main road in order to provide relief in
case of a large storm event occurring while the detour is in place. 1.7.3 Bridge Detours When a bridge is necessary for the detour structure, 20′ spans with bulkheads should be used for hydraulic computations. The length should be based on the type of detour or must clear the channel, (bulkheads should not be placed in the channel).
1 − 7
LADOTD HYDRAULICS MANUAL GENERAL REQUIREMENTS 2011
1 − 8
1.8 EROSION CONTROL 1.8.1 Temporary Erosion Control Temporary erosion control products are used in sediment control from construction sites. Their placement and measures for this use in the Storm Water Prevention Pollution Plan are described in the publication “LADOTD Erosion Control Guidelines”. A copy of this publication is available on LADOTD’s website. 1.8.2 Permanent Erosion Control The measurement and inclusion of permanent erosion controls on design plans are described in the publication “LADOTD Erosion Control Guidelines”. When to use permanent erosion controls and how to design for them are described elsewhere in this manual in the applicable chapters. 1.9 REFERENCES
A.) Model Drainage Manual, Third Edition, AASHTO, 2005
LADOTD HYDRAULICS MANUAL REPORT AND PLAN PREPARATION 2011
CHAPTER 2 REPORT AND PLAN PREPARATION
2.1 GENERAL INFORMATION The Roadway Design Procedures and Details Manual covers roadway plan preparation in Chapter 8. What is listed below is not intended to replace this procedure but instead highlight and emphasize parts pertaining to drainage structures. The Hydraulics Manual and the Roadway Design Procedures and Details Manual are independently written and updated. If there is a discrepancy between the two manuals, then both the Hydraulics Unit and the Project Manager should be consulted as to what should be required for a specific project. 2.2 HYDRAULICS REPORT The submittal of preliminary plans to the Hydraulics Unit for review should be accompanied with one bound report that is properly indexed, typed and neatly arranged. Pages are to be numbered for referencing purposes when reviews are sent back to the designer. Also include in the report, the name of the firm and designer along with a phone number to contact the designer during normal business hours should questions arise about the design. The Hydraulics Unit will review the report for adherence to LADOTD’s current policy. However, the hydraulic design is the responsibility of the designer. All submitted reports must have the stamp, date and signature of the Professional Engineer in charge. 2.2.1 Report Contents Included in the report should be: a.) Design Classification: Design classification of the project should be noted in the transmittal
letter or on the title sheet when a project is submitted to the Hydraulics Unit.
b.) Site Conditions: Brief commentary should be included describing the conditions of the
site, the reasons for the proposed major structure(s) and what kind of effect these structure(s) will have on the site.
c.) Design Assumptions: Thorough documentation of all design assumptions and design decisions
is critical. All factors, especially judgmental factors, governing the selection of design parameters such as allowable backwater, allowable headwater, permissible velocity, outfall stage, etc., must be documented by the designer. However, the basis for the selection of the limiting
2 – 1
LADOTD HYDRAULICS MANUAL REPORT AND PLAN PREPARATION 2011
factors must be defensible by sound engineering principle. Any decisions reached between the designer and the Project Manager affecting the hydraulic design should also be explained in the document.
d.) Calculations: All calculations contributing to the design of the proposed hydraulic
structures (i.e., how the tailwater or stage elevation was determined, the discharge calculations and the sizing of any structures, etc.) are to be included in the report. The designer should ensure that the numbers and values shown on the corresponding plans match the calculations submitted.
e.) Photographs: When there is a major stream crossing or special design requirements on
a site, color photographs showing the conditions should be included in the report.
2.2.2 Bridge Hydraulic Reports The requirement for a bridge hydraulic report is discussed in Chapter 11. 2.3 PRELIMINARY PLANS 2.3.1 Sheets Required Preliminary plans are to include: a.) Existing Drainage Map b.) Design Drainage Map c.) Plan/Profile sheets 2.3.2 Plan Revisions When plans are returned after being reviewed by the Hydraulics Unit, any changes, additions, or deletions are to be incorporated in the plans where appropriate. It is important that the calculations always match what is shown on the plans. Calculations should be revised when necessary and those changes incorporated into the plans. In most cases, the revised plans and calculations should be resubmitted to the Hydraulics Unit for another review.
2 – 2

LADOTD HYDRAULICS MANUAL REPORT AND PLAN PREPARATION 2011 2.3.3 pH & Resistivity During the early stages of preliminary planning, pH, resistivity, and channel probings should be requested through the Pavement and Geotechnical Services Section by the Project Manager. The District Laboratory will furnish the Pavement and Geotechnical Services Section with a soil report. This report will include channel probings (when required), soil and water pH and resistivity values along with notes on abnormal situations such as high iron ore concentrations, industrial runoff, etc. 2.3.4 Detours When a detour is specified, the recommended size and type drainage structure needed is detailed on the plans. The finished grade elevation of the detour road should also be shown. 2.4 PLAN-IN-HAND All hydraulics related comments and recommendations should be forwarded to the Hydraulics Unit for further study. 2.4.1 Existing Conditions The existing structures as shown on the plans should be verified. Significant physical characteristics of the site should be indicated on the plans such as:
• erosion • evidence of flooding • recent property development.
2.4.2 Proposed Design At the plan-in-hand inspection, each structure site should be examined and a judgment made as to whether the design information used for the structure is appropriate. For larger culverts, the design headwater as shown on the prints should be verified with site conditions. Comments concerning topography, nature of channel, necessary channel changes, etc. should be recorded on the prints. 2.4.3 Culvert Extensions When a culvert is to be extended, the following information needs to be verified in the field:
• size • number of openings • angle of crossing • material type • distance to left and right of the centerline
2 – 3
LADOTD HYDRAULICS MANUAL REPORT AND PLAN PREPARATION 2011
• type of end treatment (headwall, etc.) For multi-barrel reinforced concrete boxes, the interior wall(s) thickness also needs to be verified. 2.5 FINAL PLAN PREPARATION 2.5.1 Sheets Required Final plans are to include: a.) Summary of Estimated Quantities sheets b.) Summary of Drainage Structures sheets c.) Standard Plans/Special Details required for the project. 2.5.2 Plan Submittal Upon completion of final plans, the plans are submitted to the Hydraulics Unit for final review. The drainage, including locations, descriptions, structure sizes, lengths, flow lines, Standard Plans/Special Details, allowable materials, quantities and field inspection notes are reviewed and checked thoroughly during final hydraulics review. Any changes from plan-in-hand regarding the structures should be incorporated into the final plans. 2.6 DRAINAGE SHEETS REQUIRED IN THE PLANS The following sheets are required for an adequate check and comprehension of a drainage design. 2.6.1 Existing Drainage Map A map showing existing drainage is furnished as part of the survey information for most projects. The primary purpose of this map is to show:
a.) Drainage Areas: Size, shape, and direction of flow of all drainage areas that will affect the proposed roadway drainage, including existing cross drains.
b.) Existing Drainage Structures: Size of all existing drainage structures under
existing roadways and railroads in the vicinity. c.) Documented high water elevations at the existing cross drains. d.) Other pertinent information, such as areas where flooding of the existing
roadway occurs.
2 – 4
LADOTD HYDRAULICS MANUAL REPORT AND PLAN PREPARATION 2011 Sample Existing Drainage Maps for rural and urban projects are shown in Figures 8-41 and 8-42 in the Road Design Procedures and Details Manual. 2.6.2 Design Drainage Map Preparation of a comprehensive Design Drainage Map is fundamental to a good drainage design. The Design Drainage Map (DDM) serves to document design information and procedures, and may serve as a valuable reference long after the project has been built. The elements of this map include: a.) pH and Resistivity: The pH and resistivity table and probings (when required) are located on
the Design Drainage Map (DDM). b.) Cross Drain Structures: Required cross drain structures are plotted at their actual location and are
numbered consecutively with structure numbers increasing towards the end of the project. Their corresponding watershed boundaries and flow directions are also plotted. When cross drains are required on a project, a Hydrologic Summary Table is required to be on the DDM giving the appropriate information for each cross drain. (See Chapter 6 for a sample Hydrologic Summary Table.)
c.) Rural Drainage (Open Ditch Design): For a rural design, the DDM is a composite of the existing drainage and
contours from a USGS quadrangle map for the area. This is for the purpose of determining watershed areas and their corresponding slopes and hydraulic lengths. Repeating information about the existing structures is not shown unless the existing structure is part of the new design. The proposed centerline of the project and the accompanying station notations including beginning and ending station notes are included on the DDM. See Figure 8-43 in the Road Design Procedures and Details Manual.
d.) Urban Drainage (Storm Drain Systems or Curb and Gutter Design): For urban projects the DDM is used to show basic design data for the
storm drain system. The proposed geometric layout for the project is plotted along with intersecting streets in the vicinity. All proposed storm drain structures, including all pipes, catch basins, manholes, junction boxes, etc., are identified by a structure number. Structures are numbered consecutively with structure numbers increasing in the direction of flow. Drainage areas entering each individual inlet structure are plotted. The drainage area (acres), runoff coefficient (C), and the computed design discharge (cfs) for each pipe are written next to the individual structure or may be presented in a tabular form instead for clarity. See Figure 8-44 in the Road Design Procedures and Details Manual.
2 – 5
LADOTD HYDRAULICS MANUAL REPORT AND PLAN PREPARATION 2011 Other information required to initiate the inlet spacing design includes
overland slope and length of strip for the various general areas and the longitudinal slope of the roadway. These items may be included on the DDM, but are not required.
2.6.3 Plan / Profile Sheets a.) Grades: A profile of adjacent ground elevations plotted on the plan-profile sheets
is an essential design tool which gives immediate visual evidence of whether gutter (or swale ditch) grades are low enough to provide for drainage, as well as illustrating where grade cuts for over-the-curb drainage are excessive. Therefore, profiles of ground elevations at or near the right-of-way line are shown on the 60% Preliminary Plans submitted to the Hydraulics Unit for drainage review, as well as on 60% Final Plans for all projects, or portions of projects, where storm drains systems are used. The profiles are not shown on Final Contract Plans.
b.) Channel Grades: Channel grades are shown only if a channel is required to be cut to an
elevation different from the standard depth of channel shown on the typical section sheet.
c.) Side Drain Structures: For side drain structures, the station, size and type are noted in the plan
view. Side Drain pipes under intersecting state highways or other paved roads are classified as cross drains for the intersecting highway.
d.) Existing Structures: In most cases the existing structures will be removed and are noted as
such. However, in situations where any existing drainage structures will remain, they are properly noted on the plans and are accounted for in the design calculations.
e.) Proposed Cross Drain Structures: The structures are identified in both the plan and profile views with the
same number used in the Design Drainage Map. The station, structure type (CDP, RCB, SD, etc.), number of openings, size, length and angle of crossing if not at 90º are also included in the notation for each cross drain structure. Any erosion protection needed at the inlet or outlet of a cross drain structure is also noted.
2 – 6
LADOTD HYDRAULICS MANUAL REPORT AND PLAN PREPARATION 2011 f.) Culvert Extensions: Where the plans call for the extension of a culvert, pipe or box, the size,
number of openings, angle of crossing, distance to left and right of the centerline are shown on the plans. The culvert is to be extended with the same material. Therefore, on the plans specify the material of the pipe or box.
g.) Storm Drain Structures: The structures are identified in both the plan and profile views with the
same number used in the Design Drainage Map. The station, size, length, percent grade and flow lines are also included in the profile for each drainage structure. When there is a trunk line on each side of the roadway, a profile for each trunk line is shown.
h.) Flow Line Elevations: Structure lengths and flow line (invert) elevations given should permit a
mathematical check of the slope for each drainage structure. i.) Fittings and Connections: Fabricated pipe fittings are noted on Plan-Profile sheets and are measured
per each fitting. When yard drain pipes are stubbed into the trunk line, each stub-in is noted on Plan-Profile sheets.
j.) Sanitary/Utility Lines: Any existing or proposed sanitary/utility lines which will affect the
placement of a drainage structure are drawn in the profile with vertical clearances shown.
k.) Servitudes: Drainage servitude or construction servitude is occasionally required to:
improve lateral channels for the proper function and maintenance of the highway, to improve the outfall for proper function of a storm drain system, or to align meandering channels crossing the highway. The Hydraulics Unit should be consulted on the type of required servitude.
2.6.4 Storm Drain Plan / Profile Sheets The Roadway Design Procedures and Details Manual defines four cases when it is desirable to show proposed storm drain system notes on sheets other than the plan-profile sheets. These sheets will serve either as a supplement to or in lieu of the proposed drainage notes on the plan-profile sheets.
2 – 7
LADOTD HYDRAULICS MANUAL REPORT AND PLAN PREPARATION 2011
2 – 8
2.6.5 General Bridge Plan Sheet The cross section of the bridge opening is plotted on the General Bridge Plan Sheet. The length, finished grade elevation, design water surface elevation and predicted scour elevation/scour line are also shown. The Hydraulic Data Table along with pertinent notes is required to be on the General Bridge Plan Sheet. 2.6.6 Summary of Drainage Structures Sheet Summary of Drainage Structures is a part of final plan preparation and shows a detailed description of all required drainage structures listed in tabular form by stations in consecutive order. An example is shown in the Roadway Design Procedures and Details Manual, Figure 8-45.
a.) Column Headings: Each Summary of Drainage Structure Sheet has column headings for:
• Structure Number, • Station, • Remarks (description or structure), • Plan (standard plan/special detail name), • Type (type of structure CDP, SD, SDP, etc.), and • Quantity columns headed by type, material reference notation,
type of joint, size, unit of measure
b.) Material Reference Notations: For each structure type, a separate note giving the allowable materials is
listed on the last page of the Summary of Drainage Structures Sheet. c.) Gage Data: When metal pipes are specified, gage and coating requirements (based on
design service life, pH, resistivity and fill height) are shown on the Summary of Drainage Structures Sheet for each type of pipe.
d.) Different Classes of Reinforced Concrete Pipe: When various classes of reinforced concrete pipe are used, they should
appear under separate column headings on the Summary of Drainage Structures sheets.
e.) Jack and Bored Pipe: When a pipe is to be bored or jacked, it is noted under a separate column
heading on the Summary of Drainage Structures sheets.
LADOTD HYDRAULICS MANUAL REPORT AND PLAN PREPARATION 2011 f.) Column Totals: Each quantity column is subtotaled on each sheet and the sum total for the
project is shown on the last sheet of Summary of Drainage Structures. When two or more projects are included in one contract, a total for each project followed by a sum total for all the projects is shown.
2.6.7 Summary of Estimated Quantities Sheet A single pay item number shall be used for each combination of RCP/PCP and CMP sizes. Pay item descriptions shown in the Summary of Estimated Quantities will not show gage, coating, joint or class requirements. Such information will be shown in the Summary of Drainage Structures and in the specifications. When different classes of reinforced concrete pipe are used, they should appear under separate pay items on the Summary of Estimated Quantities sheets. 2.6.8 Standard Plans LADOTD has a large inventory of Standard Plans for reinforced concrete box culverts, catch basins, and miscellaneous hydraulic structures. On any drawing which is used as a Standard Plan by LADOTD, all of the information which is necessary and sufficient to build the structure is shown, in either detail or in reference to another Standard Plan. Standard drainage structures require no detailing on the plans. Simply list the appropriate Standard Plan in the index on the title sheet and on the Summary of Drainage Structures sheets. When a Standard Plan for a RCB is required, the Special Detail/Standard Plan (PRCB-01) for Precast Boxes should also be included in the plans unless the design calls for cast-in-place only. A book entitled “Standard Plans” may be purchased through LADOTD’s General Files Section. It contains a listing and ½ size copy of the most commonly used LADOTD standard plans from all design departments (road, hydraulics, bridge, etc.). 2.6.9 Special Details
Situations often arise where a structure is required for which there is no Standard Plan. In such situations, a special detail must be prepared. Special details are required to be as thorough in information provided as are the Standard Plans. Standard plans used by LADOTD show all sections, details, information, and quantities necessary to construct typical drainage structures. The Special Details should be similar to the Standard Plans in style, and all structural design shall be in accordance with the latest AASHTO specifications. In cases where a Standard Plan is referenced for a portion of the structure, the nomenclature for dimensions and reinforcing steel should be the same on the special detail as on the Standard Plan so that there is continuity between the two drawings. Except in cases where the structure is to be paid for as a unit in place, a bill of reinforcing steel and total quantities are required with all special details.
2 – 9
LADOTD HYDRAULICS MANUAL REPORT AND PLAN PREPARATION 2011
2 – 10
LADOTD has some special details that can be used in many cases such as Pipe Headwalls and Pipe Toewalls. 2.6.10 Reinforced Concrete Box Extension Many times extending the existing box culvert is sufficient for a project. Whether a special detail is required to be designed for the extension depends on the following criteria: a.) If the existing box culvert has the same cross-sectional dimensions as
LADOTD’s current Standard Plan, the box may be extended by specifying the appropriate box culvert Standard Plan and Standard Plan RCB-EXTENSION, which details the construction procedure for extending reinforced concrete boxes. No special detail is required.
b.) If the existing box culvert is of a size no longer being built under
LADOTD’s current Standard Plans or the interior wall thickness varies from the current Standard Plan in the case of multiple barrels, a special detail is required.
LADOTD HYDRAULICS MANUAL PEAK DISCHARGE 2011
CHAPTER 3 PEAK DISCHARGE
3.1 PURPOSE This chapter contains the procedures and information such as rainfall charts, maps and tables that are needed to determine the peak discharge or runoff a drainage structure must handle. 3.2 RUNOFF DETERMINATION The quantity of surface runoff reaching a culvert or bridge is determined by hydrologic analysis of the regional rainfall events and characteristics of the watershed. A variation of rate of runoff with time is defined as a runoff hydrograph. A runoff hydrograph is normally used when upstream storage volume is to be considered in the design of culverts and a reservoir routing routine is employed. Generally, however, only peak runoff rate is used as a design parameter in design of culverts and bridges. Methods of estimating peak runoff rate by LADOTD are described in the following sections. 3.2.1 Peak Rates of Discharge Design peak rates of runoff are to be based upon the watershed conditions that are expected to exist 20 years in the future. 3.3 GAGED STATIONS The United States Geological Survey (USGS) carries on a continuous program of stream gaging. This stream gaging data (gaging station locations, high water stages, and discharge records) should be used whenever it is applicable. For location of gaging stations and specific site data refer to the USGS publications: “Magnitude and Frequency of Floods for Small Watersheds in Louisiana”, United States Geological Survey, 1979 and “Floods in Louisiana, Magnitude and Frequency”, 5th Edition, United States Geological Survey, 1998 which are available through LADOTD. USGS has a yearly publication of the gage data collected. These should be used in conjunction with the above-mentioned references. For more information, contact the USGS office. The U.S. Army Corps of Engineers also has gages around the state. For information concerning their gages, contact their New Orleans or Vicksburg office.
3 – 1
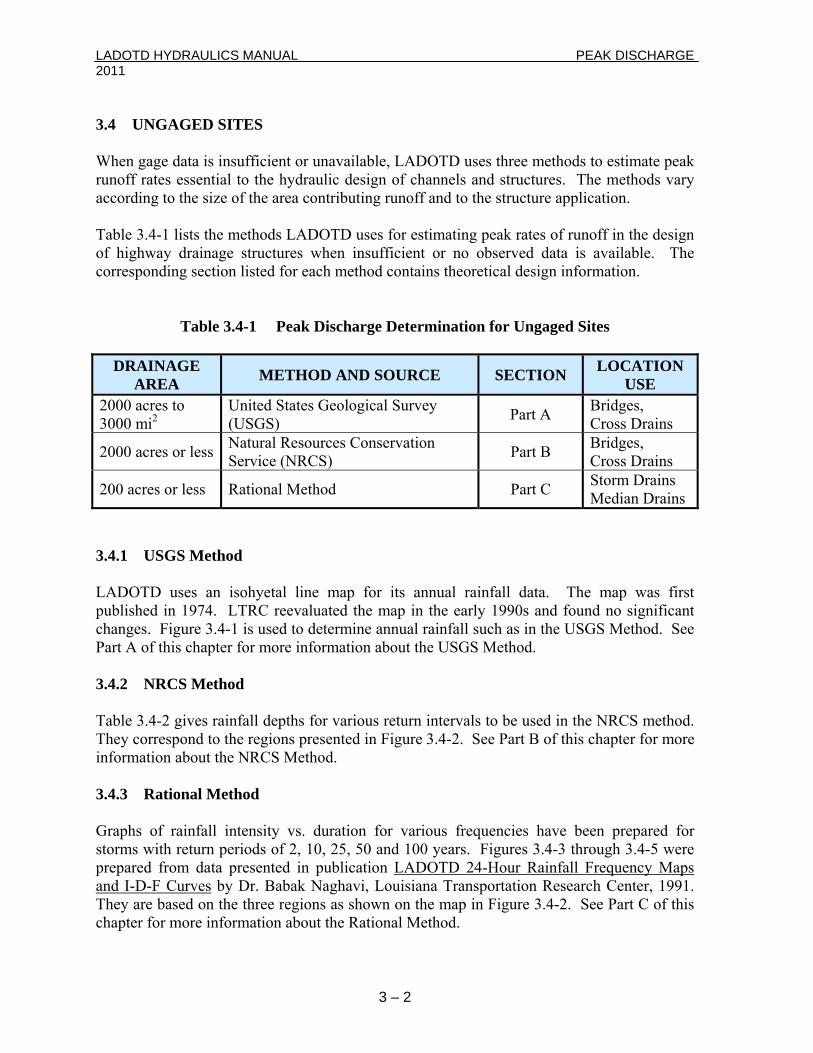
LADOTD HYDRAULICS MANUAL PEAK DISCHARGE 2011 3.4 UNGAGED SITES When gage data is insufficient or unavailable, LADOTD uses three methods to estimate peak runoff rates essential to the hydraulic design of channels and structures. The methods vary according to the size of the area contributing runoff and to the structure application. Table 3.4-1 lists the methods LADOTD uses for estimating peak rates of runoff in the design of highway drainage structures when insufficient or no observed data is available. The corresponding section listed for each method contains theoretical design information.
Table 3.4-1 Peak Discharge Determination for Ungaged Sites
DRAINAGE AREA METHOD AND SOURCE SECTION LOCATION
USE 2000 acres to 3000 mi2
United States Geological Survey (USGS) Part A Bridges,
Cross Drains
2000 acres or less Natural Resources Conservation Service (NRCS) Part B Bridges,
Cross Drains
200 acres or less Rational Method Part C Storm Drains Median Drains
3.4.1 USGS Method LADOTD uses an isohyetal line map for its annual rainfall data. The map was first published in 1974. LTRC reevaluated the map in the early 1990s and found no significant changes. Figure 3.4-1 is used to determine annual rainfall such as in the USGS Method. See Part A of this chapter for more information about the USGS Method. 3.4.2 NRCS Method Table 3.4-2 gives rainfall depths for various return intervals to be used in the NRCS method. They correspond to the regions presented in Figure 3.4-2. See Part B of this chapter for more information about the NRCS Method. 3.4.3 Rational Method Graphs of rainfall intensity vs. duration for various frequencies have been prepared for storms with return periods of 2, 10, 25, 50 and 100 years. Figures 3.4-3 through 3.4-5 were prepared from data presented in publication LADOTD 24-Hour Rainfall Frequency Maps and I-D-F Curves by Dr. Babak Naghavi, Louisiana Transportation Research Center, 1991. They are based on the three regions as shown on the map in Figure 3.4-2. See Part C of this chapter for more information about the Rational Method.
3 – 2
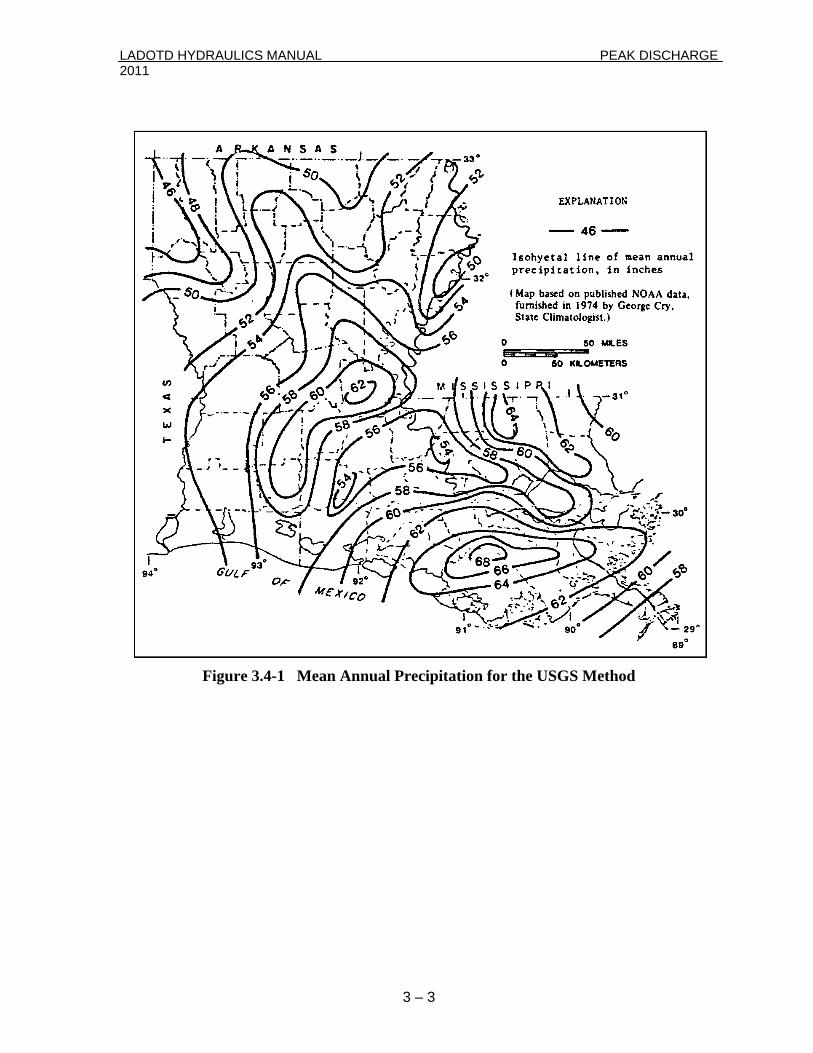
LADOTD HYDRAULICS MANUAL PEAK DISCHARGE 2011
Figure 3.4-1 Mean Annual Precipitation for the USGS Method
3 – 3
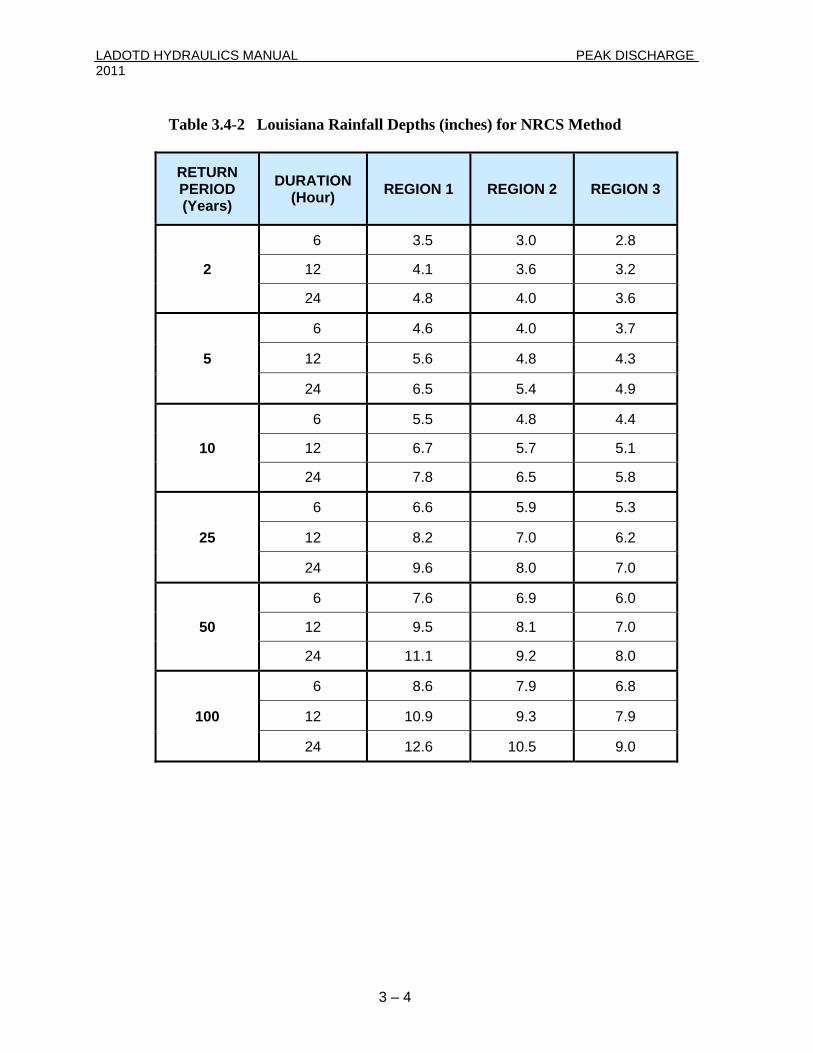
LADOTD HYDRAULICS MANUAL PEAK DISCHARGE 2011
Table 3.4-2 Louisiana Rainfall Depths (inches) for NRCS Method
RETURN PERIOD (Years)
DURATION (Hour) REGION 1 REGION 2 REGION 3
2
6 3.5 3.0 2.8
12 4.1 3.6 3.2
24 4.8 4.0 3.6
5
6 4.6 4.0 3.7
12 5.6 4.8 4.3
24 6.5 5.4 4.9
10
6 5.5 4.8 4.4
12 6.7 5.7 5.1
24 7.8 6.5 5.8
25
6 6.6 5.9 5.3
12 8.2 7.0 6.2
24 9.6 8.0 7.0
50
6 7.6 6.9 6.0
12 9.5 8.1 7.0
24 11.1 9.2 8.0
100
6 8.6 7.9 6.8
12 10.9 9.3 7.9
24 12.6 10.5 9.0
3 – 4
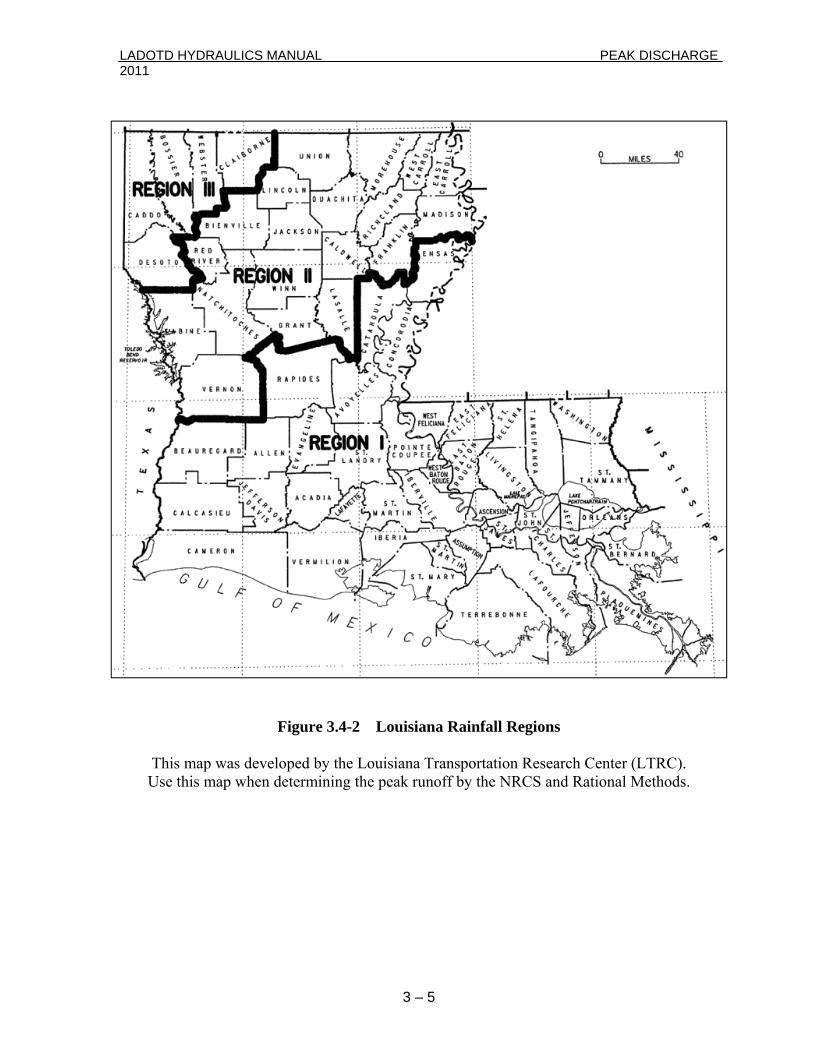
LADOTD HYDRAULICS MANUAL PEAK DISCHARGE 2011
Figure 3.4-2 Louisiana Rainfall Regions
This map was developed by the Louisiana Transportation Research Center (LTRC). Use this map when determining the peak runoff by the NRCS and Rational Methods.
3 – 5
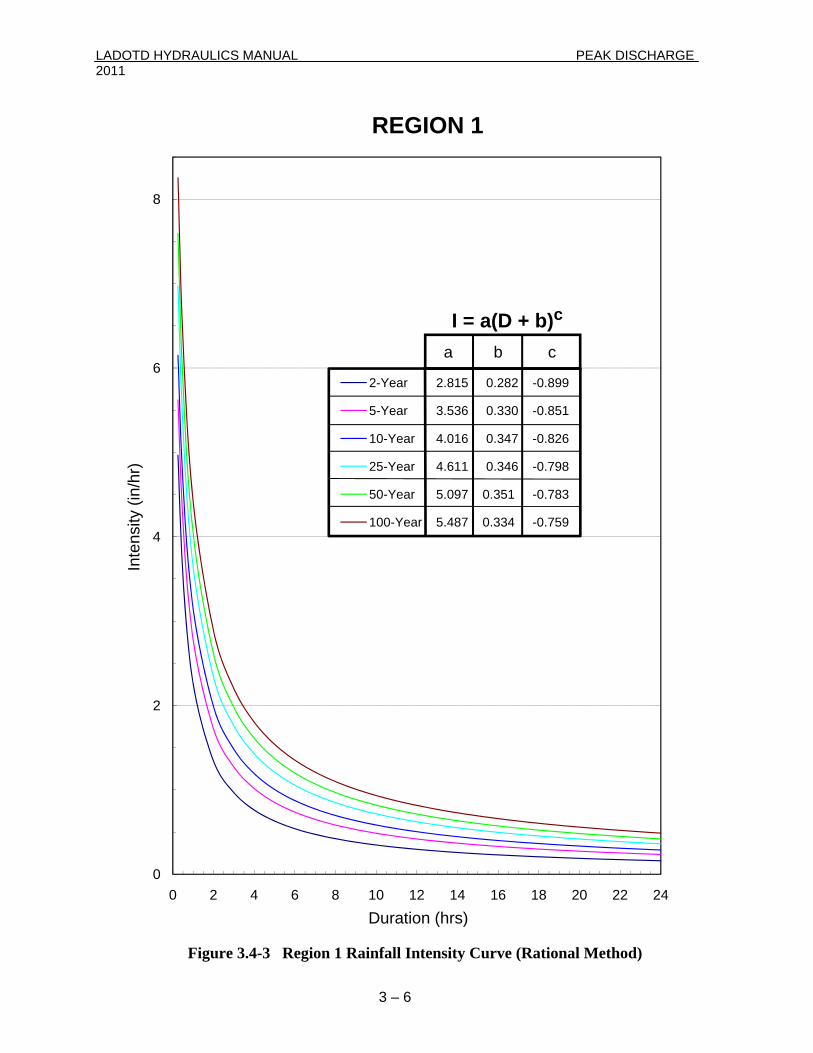
LADOTD HYDRAULICS MANUAL PEAK DISCHARGE 2011
0
2
4
6
8
0 2 4 6 8 10 12 14 16 18 20 22 24
Inte
nsity
(in/
hr)
Duration (hrs)
REGION 1
Figure 3.4-3 Region 1 Rainfall Intensity Curve (Rational Method)
a b c
I = a(D + b)c
2-Year 2.815 0.282 -0.899
5-Year 3.536 0.330 -0.851
10-Year 4.016 0.347 -0.826
25-Year 4.611 0.346 -0.798
50-Year 5.097 0.351 -0.783
100-Year 5.487 0.334 -0.759
3 – 6
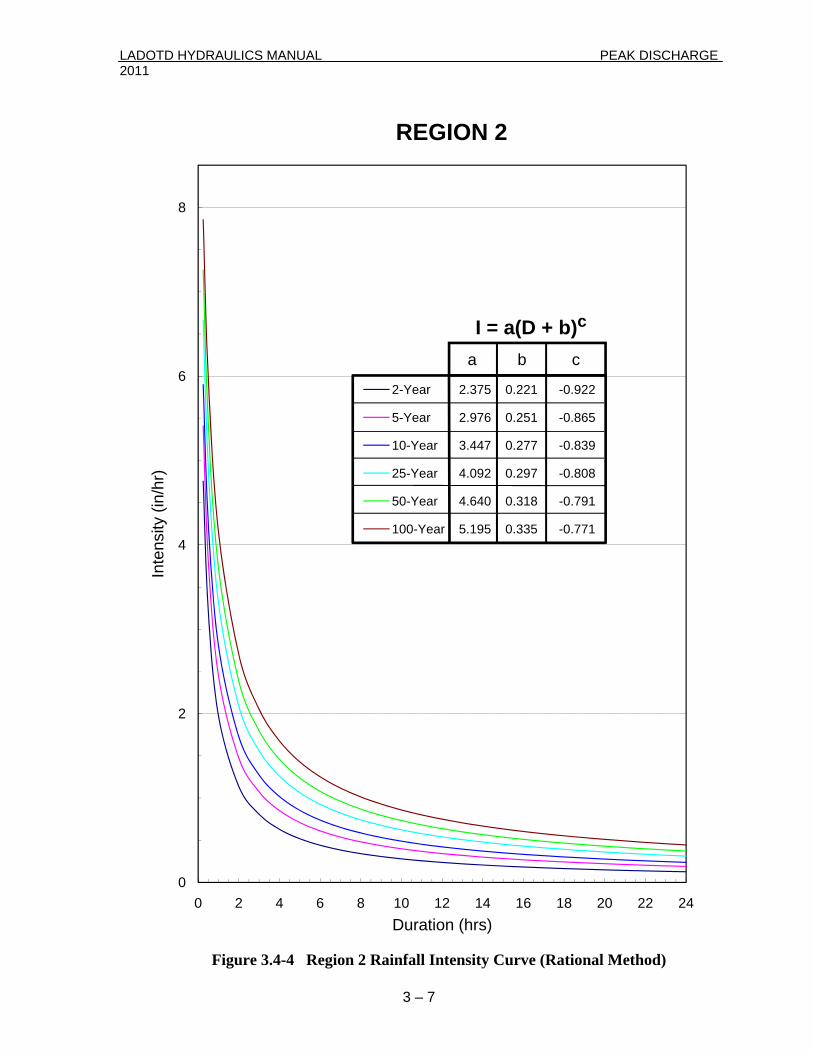
LADOTD HYDRAULICS MANUAL PEAK DISCHARGE 2011
0
2
4
6
8
0 2 4 6 8 10 12 14 16 18 20 22 24
Inte
nsity
(in/
hr)
Duration (hrs)
REGION 2
Figure 3.4-4 Region 2 Rainfall Intensity Curve (Rational Method)
a b c
I = a(D + b)c
2-Year 2.375 0.221 -0.922
5-Year 2.976 0.251 -0.865
10-Year 3.447 0.277 -0.839
25-Year 4.092 0.297 -0.808
50-Year 4.640 0.318 -0.791
100-Year 5.195 0.335 -0.771
3 – 7
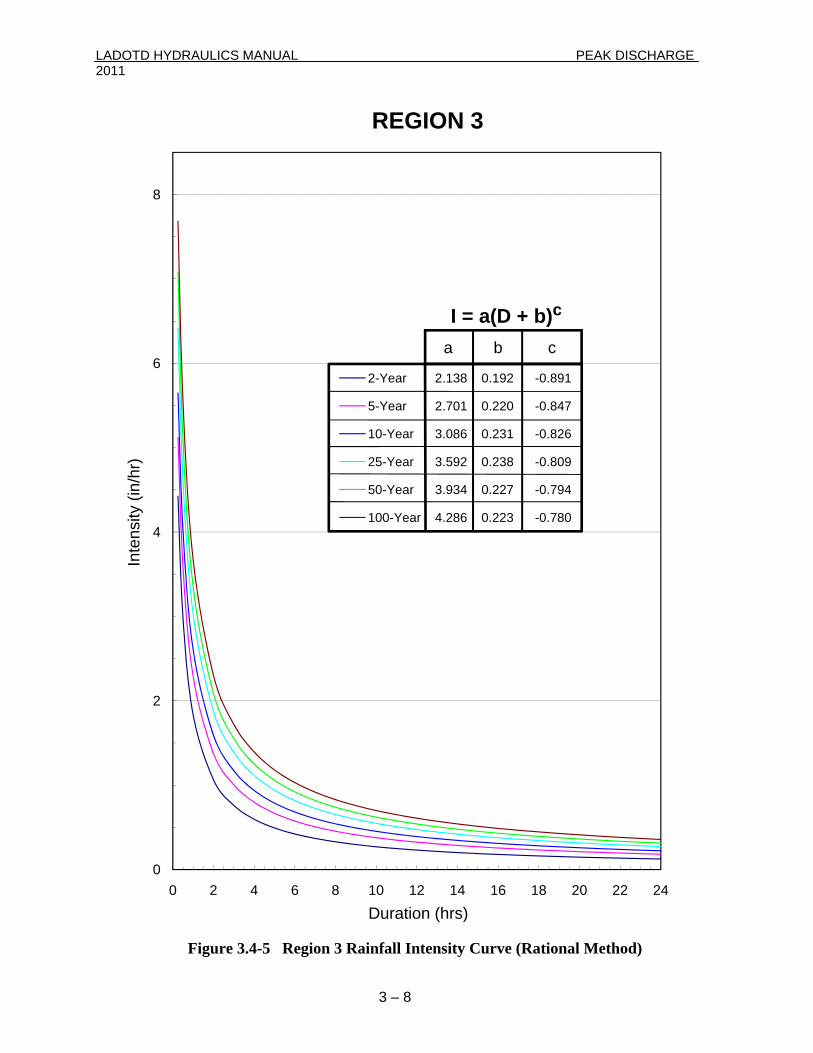
LADOTD HYDRAULICS MANUAL PEAK DISCHARGE 2011
3 – 8
0
2
4
6
8
0 2 4 6 8 10 12 14 16 18 20 22 24
Inte
nsity
(in/
hr)
Duration (hrs)
REGION 3
Figure 3.4-5 Region 3 Rainfall Intensity Curve (Rational Method)
a b c
I = a(D + b)c
2-Year 2.138 0.192 -0.891
5-Year 2.701 0.220 -0.847
10-Year 3.086 0.231 -0.826
25-Year 3.592 0.238 -0.809
50-Year 3.934 0.227 -0.794
100-Year 4.286 0.223 -0.780
LADOTD HYDRAULICS MANUAL USGS METHOD 2011
CHAPTER 3 – PART A UNITED STATES GEOLOGICAL SURVEY (USGS) METHOD
3-A.1 INTRODUCTION For more information on the USGS Procedure, refer to these references or the latest publications/websites from the following agencies: A.) Floods In Louisiana, Magnitude and Frequency – 5th Edition, Technical
Report No. 60, United States Department of the Interior, Geological Survey, Baton Rouge, LA, 5th Edition, 1998.
B.) Highway Hydrology, Hydraulic Design Series No. 2, FHWA, Washington, D.C., 2nd Edition, October 2002.
C.) Sauer, V. B., W. O. Thomas, Jr., V. A. Stricker, and K. V. Wilson, Flood Characteristics of Urban Watersheds in the United States, USGS Water-Supply Paper 2207, United States Department of the Interior, Geological Survey, 1984.
3-A.2 COMPUTER PROGRAMS The following programs have been approved for use in the design of hydraulic structures for LADOTD highways: A.) The LADOTD computer program HYDR1130: “Peak Runoff, USGS” is
based on the procedures outlined in this chapter. 3-A.3 USGS GAGE LOCATIONS For locations of gaging stations and specific site data refer to Floods in Louisiana, Magnitude and Frequency and the USGS website. 3-A.4 UNGAGED LOCATIONS The 1998 USGS computer modeling program uses what is called the Region of Influence Regression Model (RIRM). This method develops a new set of equations each time the program is run. Based on the data for the ungaged site the user inputs (drainage area, main channel slope and mean annual precipitation), the computer program selects from its data base stream flow gaging stations that have similar basin and climatic characteristics and uses them in the regression analysis.
3(A) – 1
LADOTD HYDRAULICS MANUAL USGS METHOD 2011 3-A.5 INPUT REQUIREMENTS A.) Drainage Area (A), mi2 B.) Mean Annual Precipitation (P), in. (See Figure 3.4-1) C.) Slope of the Main Channel (S), ft/mi. The slope used in this procedure is measured between two points
along the main channel. One point at 10 percent of the channel length and another point at 85 percent of the channel length, measured upstream from the point under consideration.
3-A.6 LIMITATIONS The 1998 USGS RIRM computer modeling program is based on annual maximum discharge data for natural, unaltered streams. 3-A.6.1 Locations The RIRM method is for use in rural areas of Louisiana, but not for urban areas. Section 3-A.7 describes the procedure to use for calculating the peak discharge in urban areas. 3-A.6.2 Altered Features Do not use RIRM where dams, flood-detention structures, or other man-made works will have a substantial effect on annual maximum discharge. The RIRM modeling is also not suitable for channels that have been dredged or are affected by backwater. Under such conditions, stream-system studies, which involve reservoir and open-channel routing, may be required to properly evaluate flood frequency. 3-A.6.3 Basin and Climatic Characteristics Table 3-A.6-1 gives the allowable ranges of the different basin and climatic characteristics for use in the 1998 USGS RIRM computer modeling program. If an ungaged site’s basin and climatic characteristics fall outside the range of the data, the RIRM will print a warning.
3(A) – 2
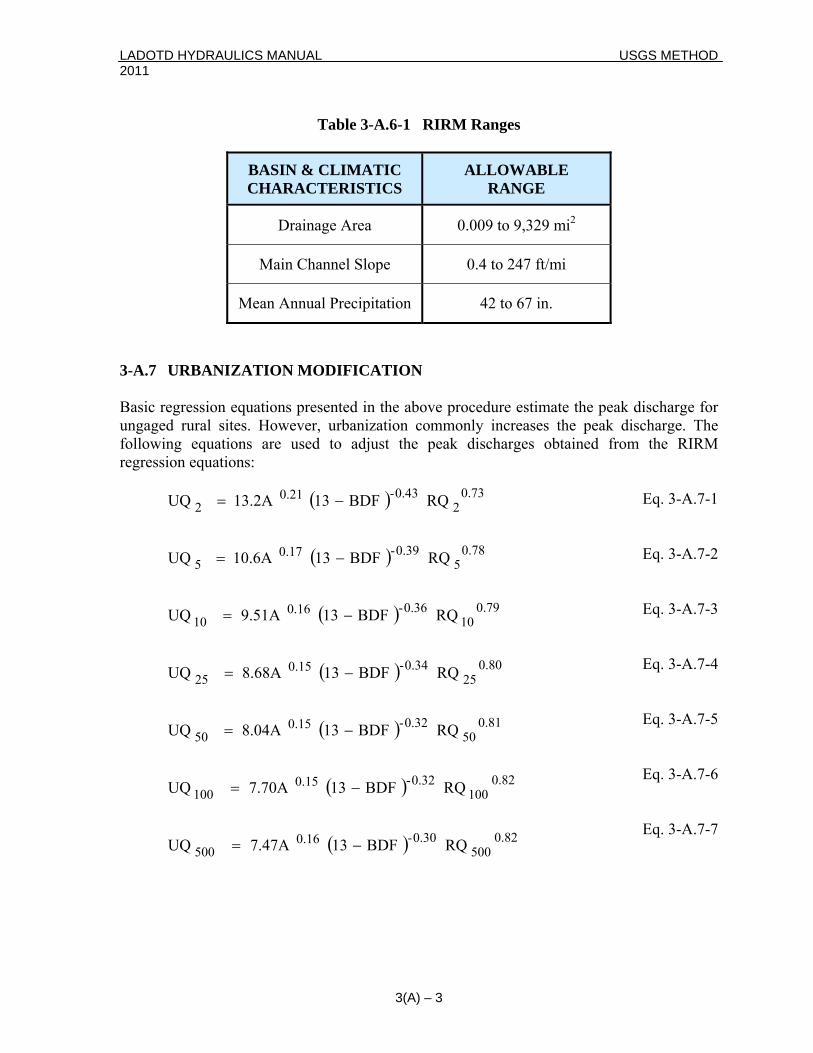
LADOTD HYDRAULICS MANUAL USGS METHOD 2011
Table 3-A.6-1 RIRM Ranges
BASIN & CLIMATIC CHARACTERISTICS
ALLOWABLE RANGE
Drainage Area 0.009 to 9,329 mi2
Main Channel Slope 0.4 to 247 ft/mi
Mean Annual Precipitation 42 to 67 in.
3-A.7 URBANIZATION MODIFICATION Basic regression equations presented in the above procedure estimate the peak discharge for ungaged rural sites. However, urbanization commonly increases the peak discharge. The following equations are used to adjust the peak discharges obtained from the RIRM regression equations:
( )
( )
( )
( )
( )
( )
( ) 0.82500
0.30-0.16500
0.82100
0.32-0.15100
0.8150
0.32-0.1550
0.8025
0.34-0.1525
0.7910
0.36-0.1610
0.785
0.39-0.175
0.732
0.43-0.212
RQ BDF 13 7.47A UQ
RQ BDF 13 7.70A UQ
RQ BDF 13 8.04A UQ
RQ BDF 13 8.68A UQ
RQ BDF 13 9.51A UQ
RQ BDF 13 10.6A UQ
RQ BDF 13 13.2A UQ
−=
−=
−=
−=
−=
−=
−= Eq. 3-A.7-1 Eq. 3-A.7-2 Eq. 3-A.7-3 Eq. 3-A.7-4 Eq. 3-A.7-5 Eq. 3-A.7-6 Eq. 3-A.7-7
3(A) – 3
LADOTD HYDRAULICS MANUAL USGS METHOD 2011 Where: UQX = urban peak discharge for X recurrence intervals,
(ft3/s) A = contributing drainage area; in urban areas,
drainage systems sometimes cross topographic divides. Such drainage changes should be accounted for when computing A, (mi2)
RQX = peak discharge for an equivalent rural drainage
basin in the same hydrologic area as the urban basin, for a recurrence interval of X years; equivalent rural peak discharges are computed from the rural equations, (ft3/s)
BDF = basin development factor, an index of the
prevalence of the urban drainage improvements; See Section 3-A.8 for more details.
3(A) – 4
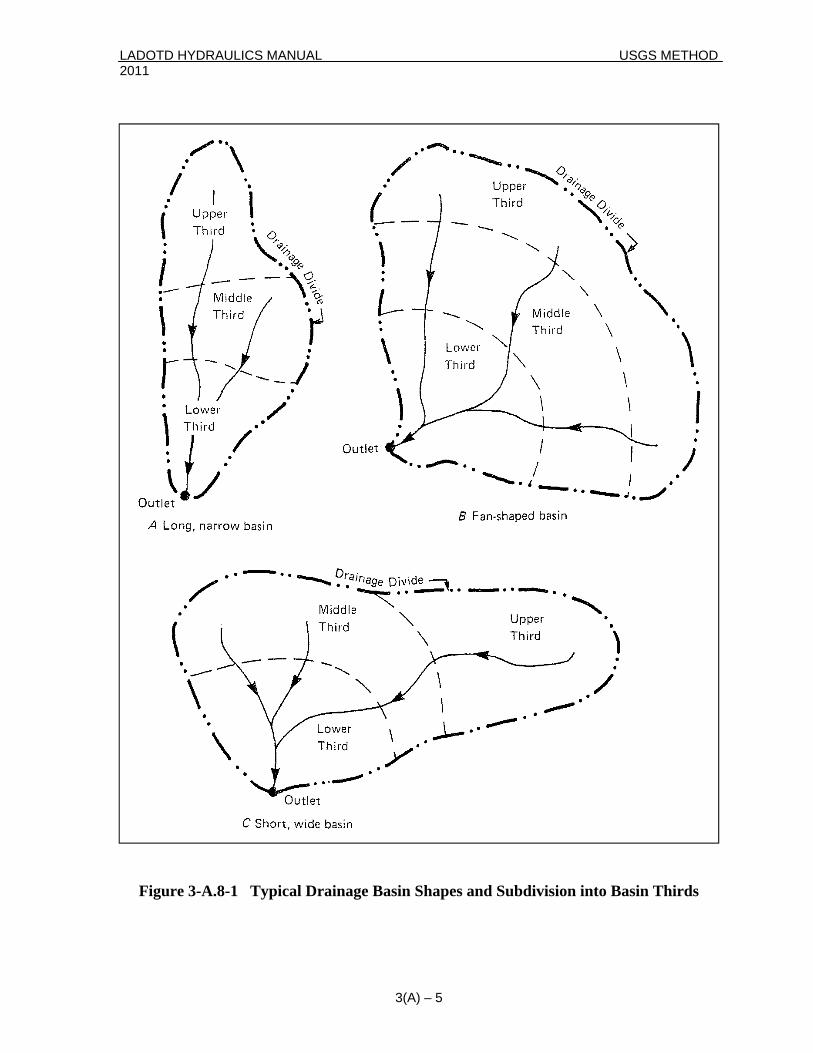
LADOTD HYDRAULICS MANUAL USGS METHOD 2011
3(A) – 5
Figure 3-A.8-1 Typical Drainage Basin Shapes and Subdivision into Basin Thirds
LADOTD HYDRAULICS MANUAL USGS METHOD 2011 3-A.8 BASIN DEVELOPMENT FACTOR (BDF) The basin development factor is statistically very significant and offers a simple and effective way of accounting for drainage development and runoff response in urban areas. It can easily be determined from drainage maps and field inspections of the drainage basin. 3-A.8.1 Division of Drainage Area Basins The basin is first divided into upper, middle, and lower thirds on a drainage map. Each third should contain about one-third of the contributing drainage area. Within each third, the travel distance of two or more streams should be equal. Schematic examples of three typical basin shapes and their division into thirds are shown in Figure 3-A.8-1 – A, B, C. All the thirds of the basin do not have to have equal travel distance with respect to each other. For instance, in Figure 3-A.8-1 – C the stream distances of the lower third are all about equal, but are longer than those in the middle third. Precise measurement of these basin dividing lines is not considered necessary. Engineering judgment should be used for subdividing more complex basin shapes and drainage patterns. 3-A.9 BDF DIVISION CODES These guidelines for determining the various drainage-system codes are not intended to be precise measurements. A certain amount of subjectivity will necessarily be involved. Field checking should be performed to obtain the best estimate. The 50 percent guideline will usually not be difficult to evaluate because many urban areas tend to use the same design criteria, and therefore, have similar drainage aspects throughout. Within each third of the drainage basin as described in Section 3-A.8.1, four aspects of the drainage system are evaluated and each assigned a code as follows. 3-A.9.1 Channel Modifications When channel modifications such as straightening, enlarging, deepening, and clearing are prevalent for the main drainage channels and principal tributaries (those that drain directly into the main channel), then a code of one is assigned. Any or all of these improvements would qualify for a code of one. To be considered prevalent, at least 50 percent of the main drainage channels and principal tributaries must be improved to some degree over natural conditions. If channel improvements are not prevalent, then a code of zero is assigned. 3-A.9.2 Channel Linings If more than 50 percent of the length of the main drainage channels and principal tributaries has been lined with an impervious material, such as concrete, then a code of one is assigned to this aspect. If less than 50 percent of these channels are lined, then a code of zero is assigned. It is assumed that the presence of channel linings is an indication of channel
3(A) – 6
LADOTD HYDRAULICS MANUAL USGS METHOD 2011 improvements as well. Therefore, this is an added factor and indicates a more highly developed drainage system. 3-A.9.3 Storm Drains Storm drains are defined as enclosed drainage structures (usually pipes), frequently used on the secondary tributaries where the drainage is received directly from streets or parking lots. Many of these drains empty into open channels; however, in some basins they empty into channels enclosed as box or pipe culverts. When more than 50 percent of the secondary tributaries within a subarea (third) consist of storm drains, then a code of one is assigned to this aspect; if less than 50 percent of the secondary tributaries consists of storm drains, then a code of zero is assigned. It should be noted that if 50 percent or more of the main drainage channels and principal tributaries are enclosed, then the aspects of channel improvements and channel linings would also be assigned a code of one. 3-A.9.4 Curb and Gutter Streets If more than 50 percent of a subarea (third) is urbanized (covered by residential, commercial, and/or industrial development), and if more than 50 percent of the streets and highways in the subarea are constructed with curbs and gutters, then a code of one would be assigned to this aspect. Otherwise, it would receive a code of zero. Drainage from curb and gutter streets frequently empties into storm drains. 3-A.9.5 Overall BDF Number The basin development factor (BDF) is the sum of the assigned codes. Therefore, with three subareas (thirds) per basin, and four drainage aspects to which codes are assigned in each subarea, the maximum urban effects on peaks for a fully developed drainage system would give a value of 12. Conversely, if the drainage system were totally undeveloped, then a BDF of zero would result. Such a condition does not necessarily mean that the basin is unaffected by urbanization. In fact, a basin could be partially urbanized, have some impervious area, have some improvement of secondary tributaries, and still have an assigned BDF of zero. This can still cause peak discharges to increase. The BDF is a fairly easy index to estimate for an existing urban basin. The BDF is also convenient for projecting future development. Projections of full development or intermediate stages of development can usually be obtained from city engineers.
3(A) – 7

LADOTD HYDRAULICS MANUAL USGS METHOD 2011
3(A) – 8
This page intentionally left blank.
LADOTD HYDRAULICS MANUAL NRCS METHOD 2011
CHAPTER 3 – PART B NATURAL RESOURCES CONSERVATION SERVICE (NRCS)
(Formally the SCS Method) 3-B.1 INTRODUCTION For more information on the NRCS Procedure, refer to these references or the latest publications/websites from the following agencies: A.) Urban Hydrology For Small Watersheds, Technical Release No. 55,
USDA Natural Resources Conservation Service, June 1986. B.) Highway Hydrology, Hydraulic Design Series No. 2, FHWA,
Washington, D.C., 2nd Edition, October 2002. 3-B.2 COMPUTER PROGRAMS The following program has been approved for use in the design of hydraulic structures for LADOTD highways: A.) The LADOTD computer program HYDR1130: “Peak Runoff” is based
on the procedures outlined in this section. 3-B.3 DESIGN CRITERIA The NRCS method is used to estimate peak rates of runoff for ungaged rural and urban watersheds of 2000 acres or less. The rate and volume of runoff is influenced by the rainfall depth, duration, distribution over the duration period, and antecedent rainfall events. 3-B.4 WATERSHED FACTORS The watershed size, shape, slope, soil type and land use also influence the peak rate of runoff. These factors are considered in the development of the equations for time of concentration and runoff. 3-B.5 TIME OF CONCENTRATION
Time of concentration is defined as the flow time from the hydraulically most remote point in the drainage area to the point under consideration.
3(B) − 1
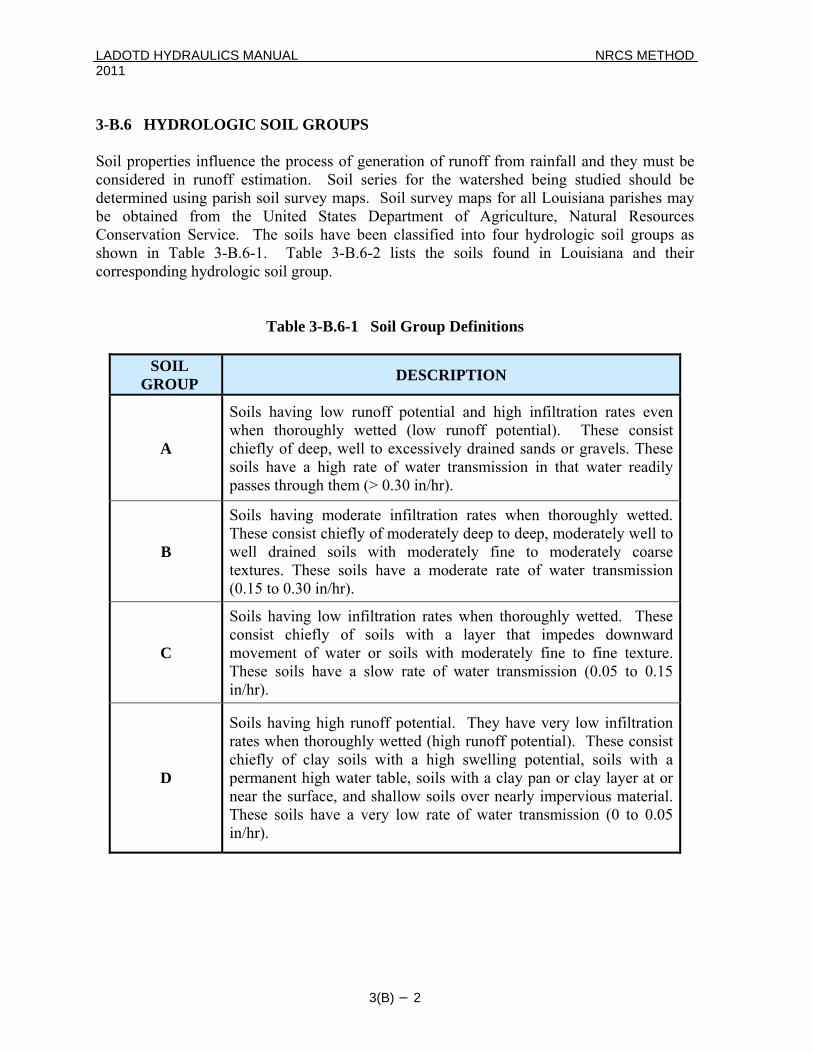
LADOTD HYDRAULICS MANUAL NRCS METHOD 2011 3-B.6 HYDROLOGIC SOIL GROUPS Soil properties influence the process of generation of runoff from rainfall and they must be considered in runoff estimation. Soil series for the watershed being studied should be determined using parish soil survey maps. Soil survey maps for all Louisiana parishes may be obtained from the United States Department of Agriculture, Natural Resources Conservation Service. The soils have been classified into four hydrologic soil groups as shown in Table 3-B.6-1. Table 3-B.6-2 lists the soils found in Louisiana and their corresponding hydrologic soil group.
Table 3-B.6-1 Soil Group Definitions
SOIL GROUP DESCRIPTION
A
Soils having low runoff potential and high infiltration rates even when thoroughly wetted (low runoff potential). These consist chiefly of deep, well to excessively drained sands or gravels. These soils have a high rate of water transmission in that water readily passes through them (> 0.30 in/hr).
B
Soils having moderate infiltration rates when thoroughly wetted. These consist chiefly of moderately deep to deep, moderately well to well drained soils with moderately fine to moderately coarse textures. These soils have a moderate rate of water transmission (0.15 to 0.30 in/hr).
C
Soils having low infiltration rates when thoroughly wetted. These consist chiefly of soils with a layer that impedes downward movement of water or soils with moderately fine to fine texture. These soils have a slow rate of water transmission (0.05 to 0.15 in/hr).
D
Soils having high runoff potential. They have very low infiltration rates when thoroughly wetted (high runoff potential). These consist chiefly of clay soils with a high swelling potential, soils with a permanent high water table, soils with a clay pan or clay layer at or near the surface, and shallow soils over nearly impervious material. These soils have a very low rate of water transmission (0 to 0.05 in/hr).
3(B) − 2

LADOTD HYDRAULICS MANUAL NRCS METHOD 2011 3-B.7 CURVE NUMBER The hydrologic soil group of the watershed soil is used in conjunction with land use to determine a runoff curve number (CN) for the watershed. Runoff curve number (CN) values for various hydrologic classifications of soils and land use are also presented in Table 3-B.7-1. The selected runoff curve number (CN) should represent conditions which may be expected to exist 20 years in the future. When the watershed consists of several classes of soils, a weighted runoff curve number should be used. Values of runoff curve number given in Table 3.B.7-1 are for average antecedent moisture condition (AMC-II). For estimations with lower limit (AMC-I) and upper limit (AMC-III) of moisture conditions, refer to the NRCS website.
3(B) − 3
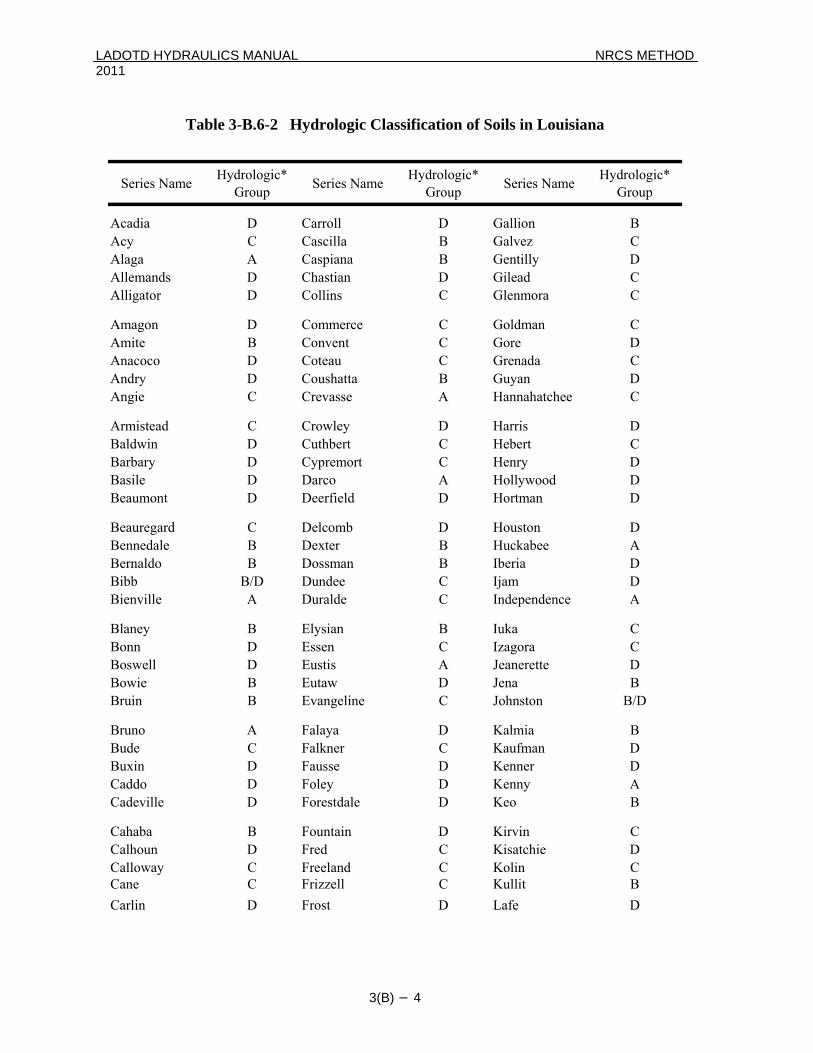
LADOTD HYDRAULICS MANUAL NRCS METHOD 2011
Table 3-B.6-2 Hydrologic Classification of Soils in Louisiana
Series Name Hydrologic*Group Series Name Hydrologic*
Group Series Name Hydrologic*Group
Acadia D Carroll D Gallion BAcy C Cascilla B Galvez CAlaga A Caspiana B Gentilly DAllemands D Chastian D Gilead CAlligator D Collins C Glenmora C
Amagon D Commerce C Goldman CAmite B Convent C Gore DAnacoco D Coteau C Grenada CAndry D Coushatta B Guyan DAngie C Crevasse A Hannahatchee C
Armistead C Crowley D Harris DBaldwin D Cuthbert C Hebert CBarbary D Cypremort C Henry DBasile D Darco A Hollywood DBeaumont D Deerfield D Hortman D
Beauregard C Delcomb D Houston DBennedale B Dexter B Huckabee ABernaldo B Dossman B Iberia DBibb B/D Dundee C Ijam DBienville A Duralde C Independence A
Blaney B Elysian B Iuka CBonn D Essen C Izagora CBoswell D Eustis A Jeanerette DBowie B Eutaw D Jena BBruin B Evangeline C Johnston B/D
Bruno A Falaya D Kalmia BBude C Falkner C Kaufman DBuxin D Fausse D Kenner DCaddo D Foley D Kenny ACadeville D Forestdale D Keo B
Cahaba B Fountain D Kirvin CCalhoun D Fred C Kisatchie DCalloway C Freeland C Kolin CCane C Frizzell C Kullit BCarlin D Frost D Lafe D
3(B) − 4
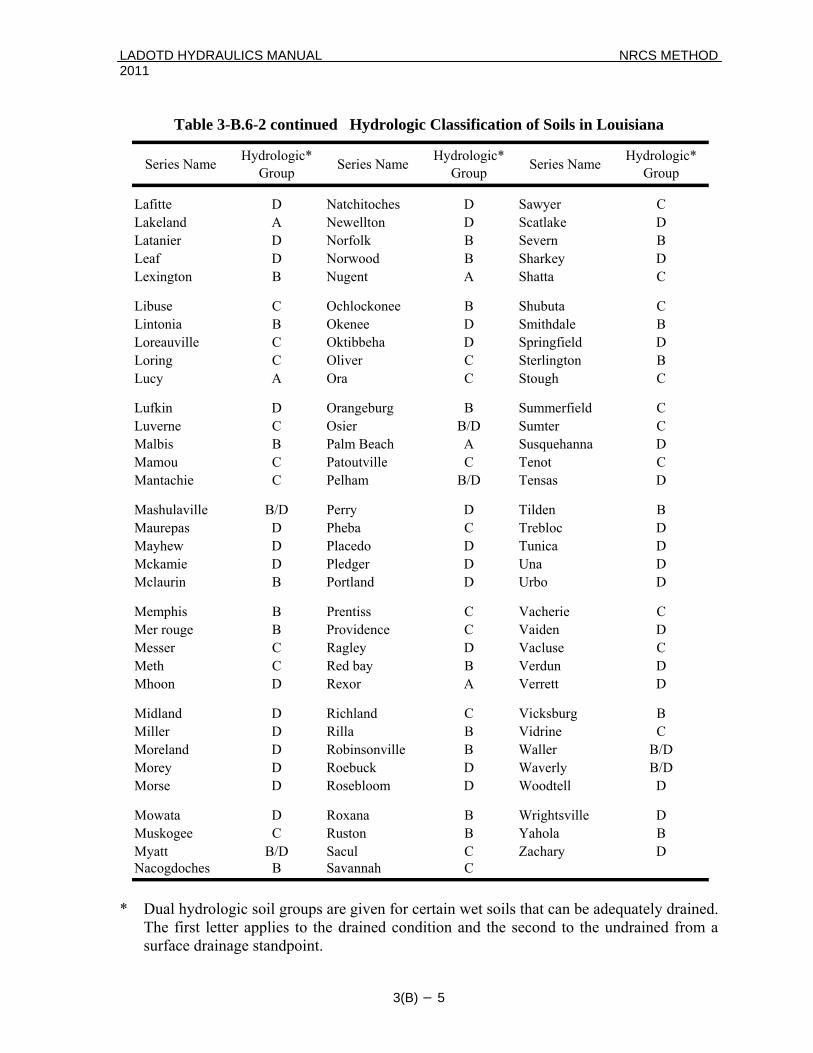
LADOTD HYDRAULICS MANUAL NRCS METHOD 2011
Table 3-B.6-2 continued Hydrologic Classification of Soils in Louisiana
* Dual hydrologic soil groups are given for certain wet soils that can be adequately drained. The first letter applies to the drained condition and the second to the undrained from a surface drainage standpoint.
Series Name Hydrologic*Group Series Name Hydrologic*
Group Series Name Hydrologic*Group
Lafitte D Natchitoches D Sawyer CLakeland A Newellton D Scatlake DLatanier D Norfolk B Severn BLeaf D Norwood B Sharkey DLexington B Nugent A Shatta C
Libuse C Ochlockonee B Shubuta CLintonia B Okenee D Smithdale BLoreauville C Oktibbeha D Springfield DLoring C Oliver C Sterlington BLucy A Ora C Stough C
Lufkin D Orangeburg B Summerfield CLuverne C Osier B/D Sumter CMalbis B Palm Beach A Susquehanna DMamou C Patoutville C Tenot CMantachie C Pelham B/D Tensas D
Mashulaville B/D Perry D Tilden BMaurepas D Pheba C Trebloc DMayhew D Placedo D Tunica DMckamie D Pledger D Una DMclaurin B Portland D Urbo D
Memphis B Prentiss C Vacherie CMer rouge B Providence C Vaiden DMesser C Ragley D Vacluse CMeth C Red bay B Verdun DMhoon D Rexor A Verrett D
Midland D Richland C Vicksburg BMiller D Rilla B Vidrine CMoreland D Robinsonville B Waller B/DMorey D Roebuck D Waverly B/DMorse D Rosebloom D Woodtell D
Mowata D Roxana B Wrightsville DMuskogee C Ruston B Yahola BMyatt B/D Sacul C Zachary DNacogdoches B Savannah C
3(B) − 5

LADOTD HYDRAULICS MANUAL NRCS METHOD 2011
Table 3-B.7-1 Runoff Curve Number (CN) for Selected Agricultural, Suburban, and Urban Land Uses (Antecedent Moisture Condition II) 1
HYDROLOGIC SOIL
GROUP LAND USE A B C D
Woods or forest land 37 61 74 80 Pasture or range land 52 70 80 85 Cultivated land 67 76 83 86 Open spaces, lawns, parks, golf courses, cemeteries, etc.:2
Good condition: grass cover on 75% or more of the area 39 61 74 80 Fair condition: grass cover on 50% to 75% of the area 49 69 79 84 Poor condition: grass cover less than 50% of the area 68 79 86 89
Residential: Average lot size Average % impervious 3
⅛ acre or less 65 77 85 90 92 ¼ acre 38 61 75 83 87 ⅓ acre 30 57 72 81 86 ½ acre 25 54 70 80 85 1 acre 20 51 68 79 84 2 acre 12 46 65 77 82 Commercial and business area (85% impervious) 89 92 94 95 Industrial districts (72% impervious) 81 88 91 93 Paved parking lots, roofs, driveways, etc. (excluding right of way) 98 98 98 98
Paved streets and roads: Streets with curbs and storm drains (excluding right of way) 98 98 98 98
Roads with open ditches. (including right of way) 83 89 92 93
Gravel (including right of way) 76 85 89 91 Dirt (including right-of-way) 72 82 87 89
1 – Average runoff condition, and Ia = 0.2S 2 – CNs shown are equivalent to those of pasture. Composite CNs may be computed for
other combinations of open space type.
e a CN of 98, and pervious areas are considered equivalent to open space in good hydrologic condition.
3 – The average % impervious area shown was used to develop the composite CNs. Other assumptions are as follows: Impervious areas are directly connected to the drainage system, impervious areas hav
3(B) − 6
LADOTD HYDRAULICS MANUAL NRCS METHOD 2011 3
he following input criteria are needed to estimate peak rates of runoff for ungaged watersheds. It is assumed that the topography is such that you rm surface flow into channels, drains, and streams. The peak rates of runoff are approxim tely the same as those obtained by preparing flood hydrographs a vallepoint of design. 3-B.8.1 Drainage Basin T inage basin:
he di e t uno usttraverse fro ydraulically distant portion of the watershed to
der cons rage watershed land slope The weighted average slope should be calculated using elevations along
the hydraulic length of watersh Soil type(s) and hydrologic soi ing the drainage area. The soil type can be determin om Soil Cons tion vic rish
ing for the ious l ty are
3 Determine the ru to be assigned to each drainag area by u .1 and the curve number guide (see Table 3-B.7-1). A weighted curve num may be required wat eds ingd d on predicted land use for 20 y 3
he rainfall region is determined from Figure 3.4-2. Then use the 24-hour rainfall mount of rainfall (inches) associated with
-B.8 DESIGN INPUT
T have approximately unifo
and y flood routing to the
he following information should be determined for the dra
a.) Drainage Area (A), acres
b.) Hydraulic Length of Watershed, ft. The hydraulic length of the watershed is t stanc he r ff m
m the most hthe point un ideration.
c.) Ave (%)
ed.
d.) l group(s) form ed fr erva Ser e pa
soil survey maps. Hydrologic groupincluded in Table 3-B.6-2.
var soi pes
-B.8.2 Runoff Curve Number
noff curve number (CN) e sing the information in Section 3-B.8
ber (CN) for ersh hav ifferent soil types and/or land use. Is should be baseears in the future.
-B.8.3 Rainfall Tduration from Table 3.4-2 to determine the athe design frequency storm.
3(B) − 7

LADOTD HYDRAULICS MANUAL NRCS METHOD 2011
3(B) − 8
This page intentionally left blank.
LADOTD HYDRAULICS MANUAL RATIONAL METHOD 2011
CHAPTER 3 – PART C RATIONAL METHOD
3-C.1 INTRODUCTION The Rational Method computes only peak runoff values, neglecting flow variations with time and routing of the flow throug system. For a more detailed discussion of the theory and use of the Rational Method, refer to these references or the latest publications/websites from the following agencies: A.) ASCE Manual of Engineering Practice No. 37
h the watershed and the collection
, Chapter IV, Design and Construction of Sanitary and Storm Sewers, 1976.
B.) Highway Hydrology, Hydraulic Design Series No. 2, FHWA, Washington, D.C., 2nd Edition, October 2002.
3-C.2 DESIGN ASSUMPTIONS Assumptions basic to the Rational Method are: A.) Limited to drainage areas less than 200 acres B.) The maximum runoff rate to any location is a function of the average
rate of rainfall during the time of concentration. C.) The maximum rate of rainfall occurs during the time of concentration. D.) The variability of the storm pattern is not taken into consideration. 3-C.3 HYDROLOGIC ANALYSIS The Rational Method Equation is: Q=CiA Eq. 3-C.3-1
Where: Q = Peak runoff rate (ft3/s) C = Runoff coefficient (Section 3-C.3.1) i = Average rainfall intensity at the time of
concentration (in./hr) (Section 3-C.3.2 and Section 3.4.3) A = Drainage area (acres)
3(C) − 1
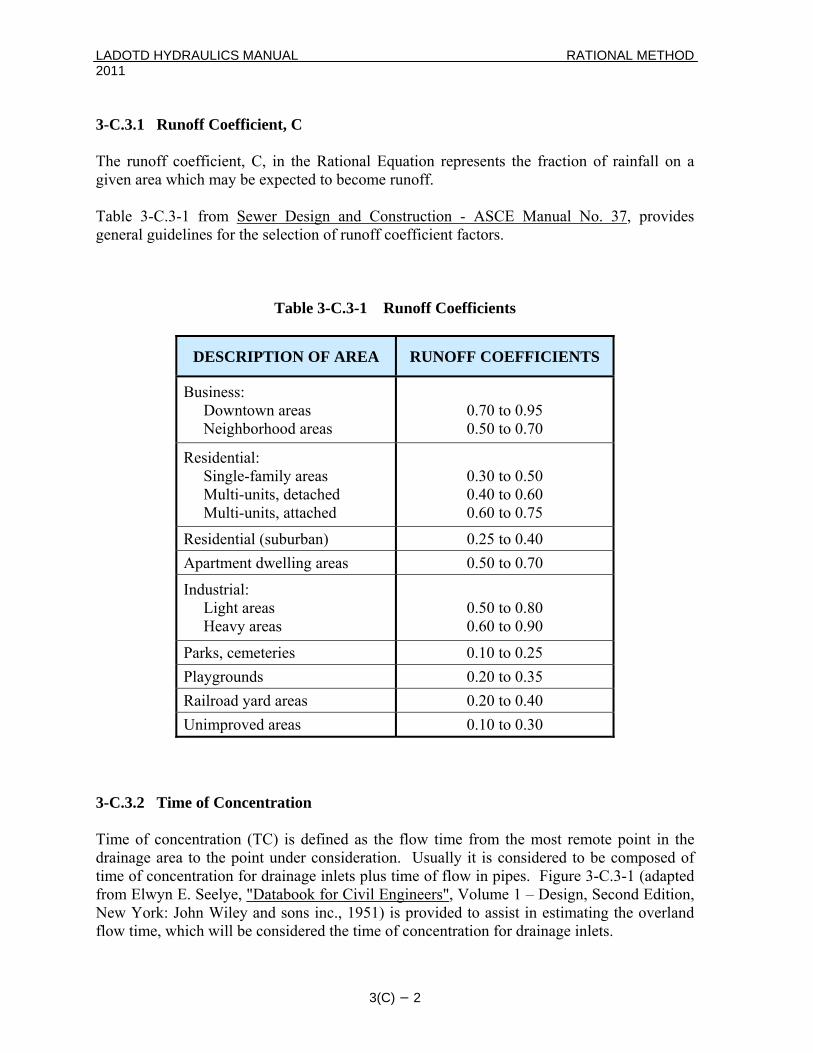
LADOTD HYDRAULICS MANUAL RATIONAL METHOD 2011 3-C.3.1 Runoff Coefficient, C The runoff coefficient, C, in the Rational Equation represents the fraction of rainfall on a given area which may be expected to become runoff. Table 3-C.3-1 from Sewer Design and Construction - ASCE Manual No. 37, provides general guidelines for the selection of runoff coefficient factors.
Table 3-C.3-1 Runoff Coefficients
DESCRIPTION OF AREA RUNOFF COEFFICIENTS
Business: Downtown areas Neighborhood areas
0.70 to 0.95 0.50 to 0.70
Residential: Single-family areas Multi-units, detached Multi-units, attached
0.30 to 0.50 0.40 to 0.60 0.60 to 0.75
Residential (suburban) 0.25 to 0.40 Apartment dwelling areas 0.50 to 0.70
Industrial: Light areas Heavy areas
0.50 to 0.80 0.60 to 0.90
Parks, cemeteries 0.10 to 0.25 Playgrounds 0.20 to 0.35 Railroad yard areas 0.20 to 0.40 Unimproved areas 0.10 to 0.30
3-C.3.2 Time of Concentration Time of concentration (TC) is defined as the flow time from the most remote point in the drainage area to the point under consideration. Usually it is considered to be composed of time of concentration for drainage inlets plus time of flow in pipes. Figure 3-C.3-1 (adapted from Elwyn E. Seelye, "Databook for Civil Engineers", Volume 1 – Design, Second Edition, New York: John Wiley and sons inc., 1951) is provided to assist in estimating the overland flow time, which will be considered the time of concentration for drainage inlets.
3(C) − 2

LADOTD HYDRAULICS MANUAL RATIONAL METHOD 2011
3(C) − 3
Time of concentration for drai n 5 minutes.nage inlets shall not be less tha
ote: The charts in Figures 3.4-3 to 3.4-5 use the variable “Duration” in hours to determine ns is the time of concentration as determined in Section 3-C.3-2
Nthe rainfall intensity. Duratioonverted into hours. c
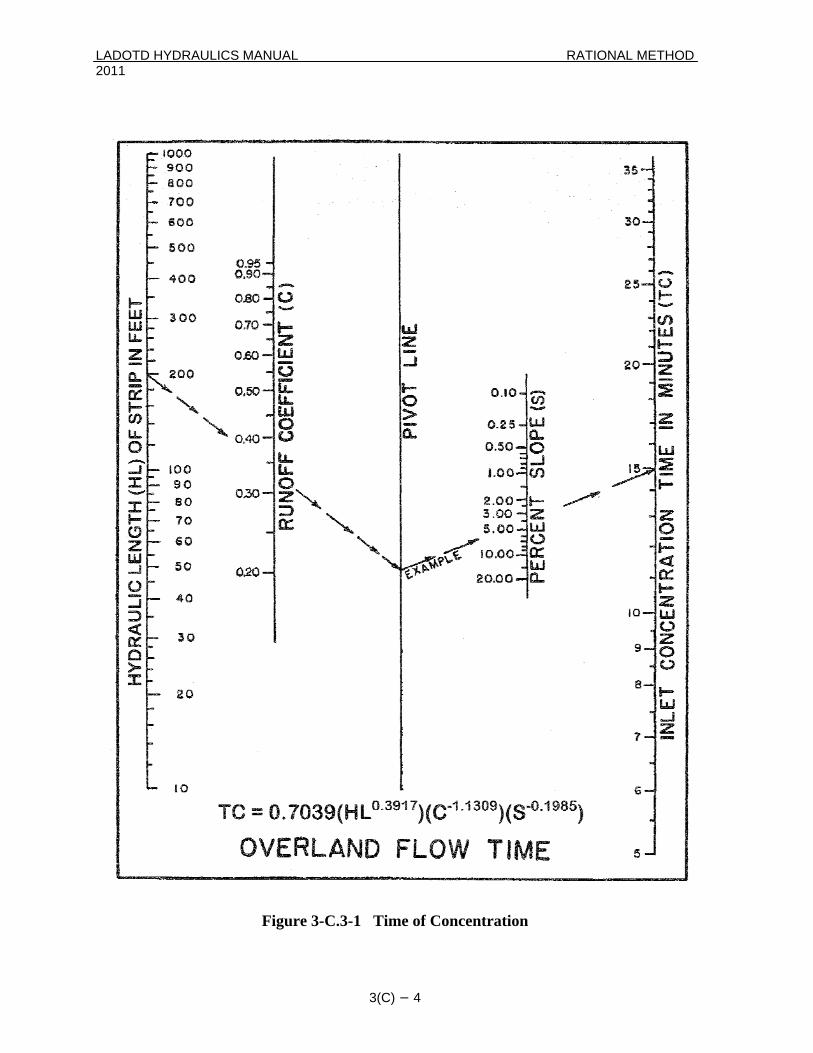
LADOTD HYDRAULICS MANUAL RATIONAL METHOD 2011
Figure 3-C.3-1 Time of Concentration
3(C) − 4
LADOTD HYDRAULICS MANUAL OPEN CHANNELS 2011
CHAPTER 4 OPEN CHANNELS
4.1 PURPOSE This chapter presents standards for the design of artificial or manmade roadside channels, including roadside ditches, median ditches and interceptor ditches, outfalls and canals. Open channels shall be sized according to Manning's equation to accommodate the design flow from the area draining into the channel. For detailed information on open channel hydraulics, refer to Part A at the end of this chapter. Erosion control measures for open channels will be based on the policies presented in this chapter. 4.2 DESIGN STORM FREQUENCY Roadside channels will be designed according to the criteria presented in Chapter 1 unless the channel is providing an outfall or is the major approach channel for a cross drain, in which case the design storm for the roadside channel will be the same as for a cross drain. 4.3 PEAK DISCHARGE The methods for determining peak discharge are described in Chapter 1. 4.3.1 Lateral Channels Lateral channels are designed to convey the design discharge of the culvert or culverts which they serve. 4.4 SHAPE AND SIDE SLOPES 4.4.1 Roadside Channels Trapezoidal sections are normally used with side slopes not to be steeper than 3:1. Where erosive soils are present, consideration should be given to using flatter slopes. 4.4.2 Lateral Channels Trapezoidal sections are normally used with side slopes to be no steeper than 2:1. When lateral excavations are necessary, a channel cross section and profile, as well as a plan layout should be included in the plans.
4 – 1
LADOTD HYDRAULICS MANUAL OPEN CHANNELS 2011 4.5 ROADSIDE CHANNEL GRADE A minimum channel grade of 0.1% shall be maintained. 4.5.1 Driveways During preliminary design, careful attention should be paid to the ditches. In many cases, a ditch grade can be established so that a driveway is at the high point in the ditch grade, thus eliminating the need for a side drain structure. Such driveways are referred to as dry ramps. 4.6 LATERAL CHANNELS Occasionally, the need arises to improve an existing channel, to change a channel alignment, or to design a new channel altogether. The primary reason for such channel improvements is generally economics. Improvement of laterals is not routinely done and must be justified. Improvement or construction of a lateral channel is normally justified by a need to lower the design headwater at a culvert site in order to prevent or relieve flooding of the roadway or upstream property. It should be noted that the owner of the channel is the responsible party. 4.6.1 Drainage Servitude Parameters for determining required widths of drainage servitude are channel top width, bank width needed for construction and maintenance, and amount of spoil. 4.6.2 Spoil Banks Where spoil banks will be used, servitude width should be sufficient to allow a minimum distance of 10 feet from the toe of the spoil bank to the bank of the channel. In all cases, a minimum bank width (on one side) of 10 feet will be required to allow equipment usage. A minimum bank width of 5 feet on the opposite side will be sufficient. Spoil banks should be broken to allow for local drainage. 4.7 EQUALIZERS On long continuous grades which are unbroken by lateral outfalls, "cross drain equalizers" shall be used at intervals of approximately 1000 feet – 1500 feet. The purpose of equalizers is to distribute the flow between the roadside channels. Equalizers shall be 24-inch diameter pipes or round equivalent pipe arches.
4 – 2
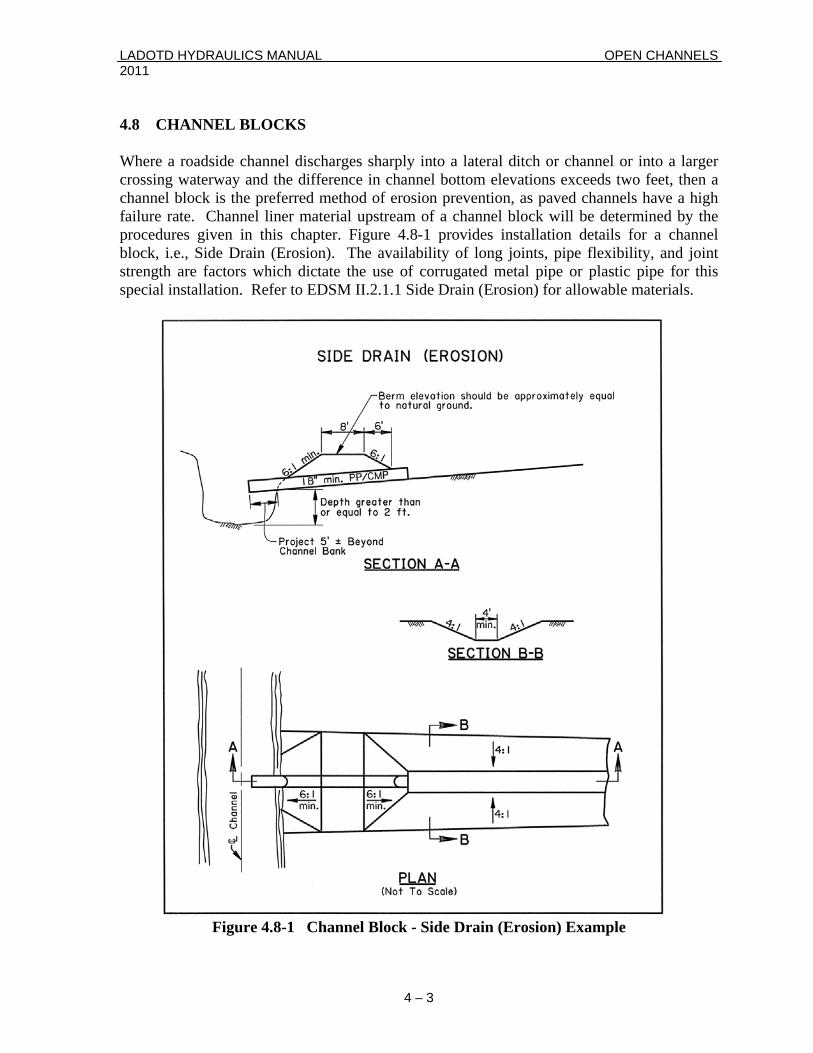
LADOTD HYDRAULICS MANUAL OPEN CHANNELS 2011 4.8 CHANNEL BLOCKS Where a roadside channel discharges sharply into a lateral ditch or channel or into a larger crossing waterway and the difference in channel bottom elevations exceeds two feet, then a channel block is the preferred method of erosion prevention, as paved channels have a high failure rate. Channel liner material upstream of a channel block will be determined by the procedures given in this chapter. Figure 4.8-1 provides installation details for a channel block, i.e., Side Drain (Erosion). The availability of long joints, pipe flexibility, and joint strength are factors which dictate the use of corrugated metal pipe or plastic pipe for this special installation. Refer to EDSM II.2.1.1 Side Drain (Erosion) for allowable materials.
Figure 4.8-1 Channel Block - Side Drain (Erosion) Example
4 – 3
LADOTD HYDRAULICS MANUAL OPEN CHANNELS 2011 4.9 CHANNEL LININGS After channel grades have been established, the hydraulic adequacy of the proposed channel section and the need for and station limits for any required erosion control measure should be determined. Erosion in channels can become severe even at fairly mild highway grades. Therefore, channels often require stabilization against erosion. Factors that should be considered when selecting a channel lining are:
• velocity • lining limitations • construction and maintenance considerations • safety
Channel linings can be rigid or flexible. 4.9.1 Rigid Linings Advantages:
Rigid channel linings can sustain a much higher magnitude of erosive force than flexible linings. They also can provide a much higher capacity and in some cases may be the only alternative.
Disadvantages:
Rigid linings tend to fail when a portion of the lining is damaged 4.9.2 Flexible Linings Advantages:
The primary advantage of flexible linings from an erosion control standpoint is that flexible linings can sustain some change in channel shape while maintaining the overall integrity of the channel lining.
Flexible linings permit infiltration and exfiltration, are less expensive than rigid linings, and have a natural appearance.
Disadvantages:
Flexible linings have the disadvantage of being limited in the magnitude of erosive force they can sustain without damage to either the channel or the lining. In some cases, flexible linings may provide only temporary protection against erosion while allowing vegetation to be established. The vegetation will then provide permanent
4 – 4
LADOTD HYDRAULICS MANUAL OPEN CHANNELS 2011
4 – 5
erosion control in the channel. However, vegetative channel linings are not suited to sustained flow conditions or long periods of submergence.
4.10 EROSION CONTROL PRODUCTS LADOTD has a classification system for flexible erosion control products to use for slope protection and channel linings. They are listed in the latest specification book under Erosion Control Systems and currently include Types A through F. The types are based on the shear stress the material can withstand, increasing in order of needed protection. The LADOTD Material Lab’s QPL (Qualified Products List) 72 shows the specific products a contractor may use for the protection type called for on the plans. As new products are developed and approved, QPL 72 is updated on LADOTD’s website under the construction/materials lab/qualified products list section. 4.10.1 Roadside Ditch Lining Selection The Hydraulics Unit has adapted LADOTD’s Erosion Control Systems for use on roadside ditches based on the ditch slope. It is described in Table 4.10-1. Table 4.10-1 is only for roadside ditches for the following criteria:
• the contributing drainage area is less than or equal to 10 acres, • bottom slope does not exceed 10%, • a depth of flow is not expected to exceed 1′.
4.10.2 Lateral Channels, Outfall Channels and Larger Roadside Ditches For any channel that does not fit the criteria presented in Section 4.10.1, the methods as outlined in FHWA Publication, HEC 15 should be followed to determine the appropriate erosion protection.

LADOTD HYDRAULICS MANUAL OPEN CHANNELS 2011
TABLE 4.10-1 – Erosion Control Protection for Roadside Ditches (Refer to LADOTD’s QPL for specific applicable products)
Range of Ditch Slope
(%)
Type of Protection
Shear Stress Range
Maximum Sediment
Loss
Minimum Vegetation
Density (%)
0.10 to 0.50 vegetative mulch − − −
0.51 to 2.50 A − 0.06 lb/yd2 (0.034 kg/m2) 80
2.51 to 3.00 C 0 – 2 psf (0 – 96 Pa)
0.45″ (11.5 mm) 70
3.01 to 6.00 D 0 – 4 psf (0 – 192 Pa)
0.40″ (10.0 mm) 70
6.01 to 8.00 E 0 – 6 psf (0 – 287 Pa)
0.40″ (10.0 mm) 70
8.01 to 10.00 F 0 – 8 psf (0 – 383 Pa)
0.30″ (8.0 mm) 70
Paved ditch alternates will not be allowed as a substitute for Erosion Control System Flexible Channel Liners.
4 – 6
LADOTD HYDRAULICS MANUAL OPEN CHANNEL HYDRAULICS 2011
CHAPTER 4 – PART A OPEN CHANNEL HYDRAULICS
4-A.1 INTRODUCTION Open channels (roadside and lateral ditches and outfalls) shall be sized or analyzed according to the Manning’s equation to accommodate the design flow from the area draining into the channel. For more information on the design of open channels, refer to these references or the latest publications from the following agencies: A.) Urban Hydrology For Small Watersheds, Technical Release No. 55,
USDA Natural Resources Conservation Service, June 1986. B.) SCS National Engineering Handbook, Section 4 (Hydrology), U.S. Soil
Conservation Service, 1972. C.) Design of Roadside Channels with Flexible Linings, Hydraulic
Engineering Circular 15, FHWA, Washington, D.C., April 1988 D.) Design of Riprap Revetment, Hydraulic Engineering Circular 11,
FHWA, Washington, D.C., 1989. 4-A.2 COMPUTER PROGRAMS The following programs have been approved for use in the design of small open channels for LADOTD highways:
A.) The LADOTD computer program HYDR1110: “Normal Water Surface” is a computer program which computes the normal water surface elevation, area of opening, and average velocity for a given irregular shaped channel cross-section as outlined in Section 4-A.5.
B.) The LADOTD computer program HYDR1140: “Open Channel Flow” is a computer program which computes the normal depth of water, bottom width or design discharge for a given uniform shaped cross-section as outlined in this Section 4-A.4.
4-A.3 MANNING’S COEFFICIENT Table 4-A.3-1 lists Manning’s roughness coefficients for flood plains and for channels with vegetative linings and artificial linings. The probable condition of the channel when the design event is anticipated shall be considered when a Manning’s “n” value is selected.
4(A) – 1
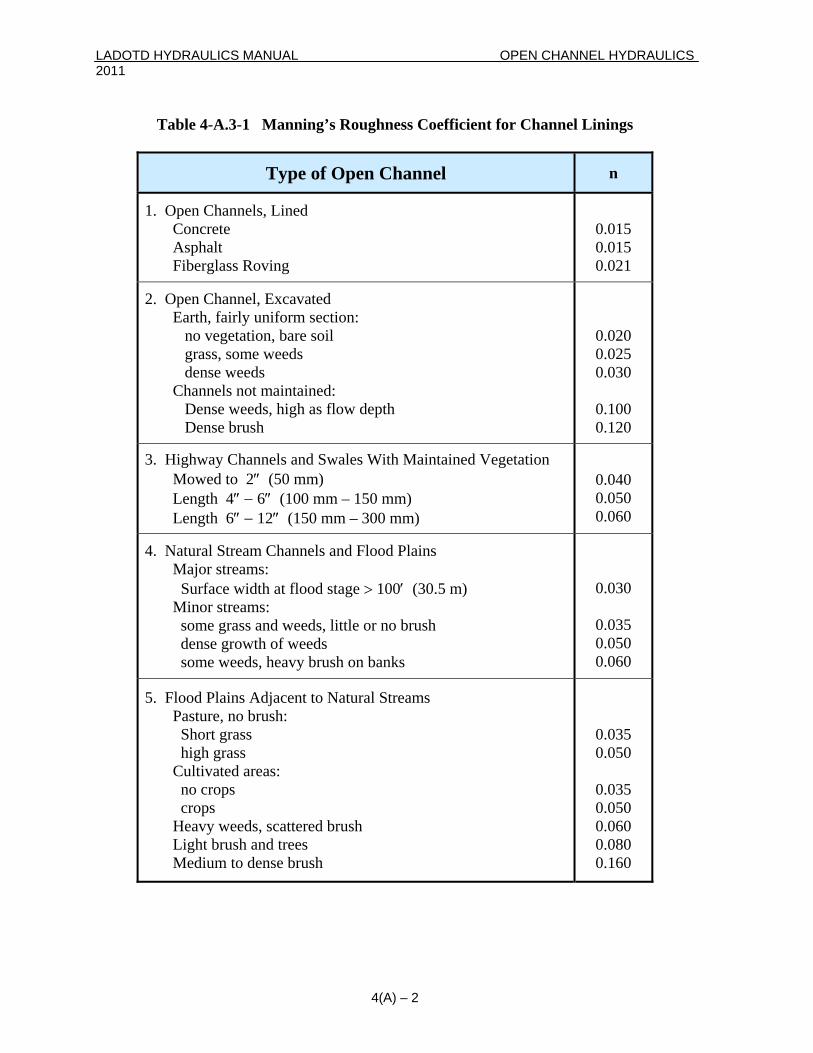
LADOTD HYDRAULICS MANUAL OPEN CHANNEL HYDRAULICS 2011
4(A) – 2
Table 4-A.3-1 Manning’s Roughness Coefficient for Channel Linings
Type of Open Channel n
1. Open Channels, Lined Concrete Asphalt Fiberglass Roving
0.015 0.015 0.021
2. Open Channel, Excavated Earth, fairly uniform section: no vegetation, bare soil grass, some weeds dense weeds Channels not maintained: Dense weeds, high as flow depth Dense brush
0.020 0.025 0.030
0.100 0.120
3. Highway Channels and Swales With Maintained Vegetation Mowed to 2″ (50 mm) Length 4″ − 6″ (100 mm – 150 mm) Length 6″ − 12″ (150 mm – 300 mm)
0.040 0.050 0.060
4. Natural Stream Channels and Flood Plains Major streams: Surface width at flood stage > 100′ (30.5 m) Minor streams: some grass and weeds, little or no brush dense growth of weeds some weeds, heavy brush on banks
0.030
0.035 0.050 0.060
5. Flood Plains Adjacent to Natural Streams Pasture, no brush: Short grass high grass Cultivated areas: no crops crops Heavy weeds, scattered brush Light brush and trees Medium to dense brush
0.035 0.050
0.035 0.050 0.060 0.080 0.160
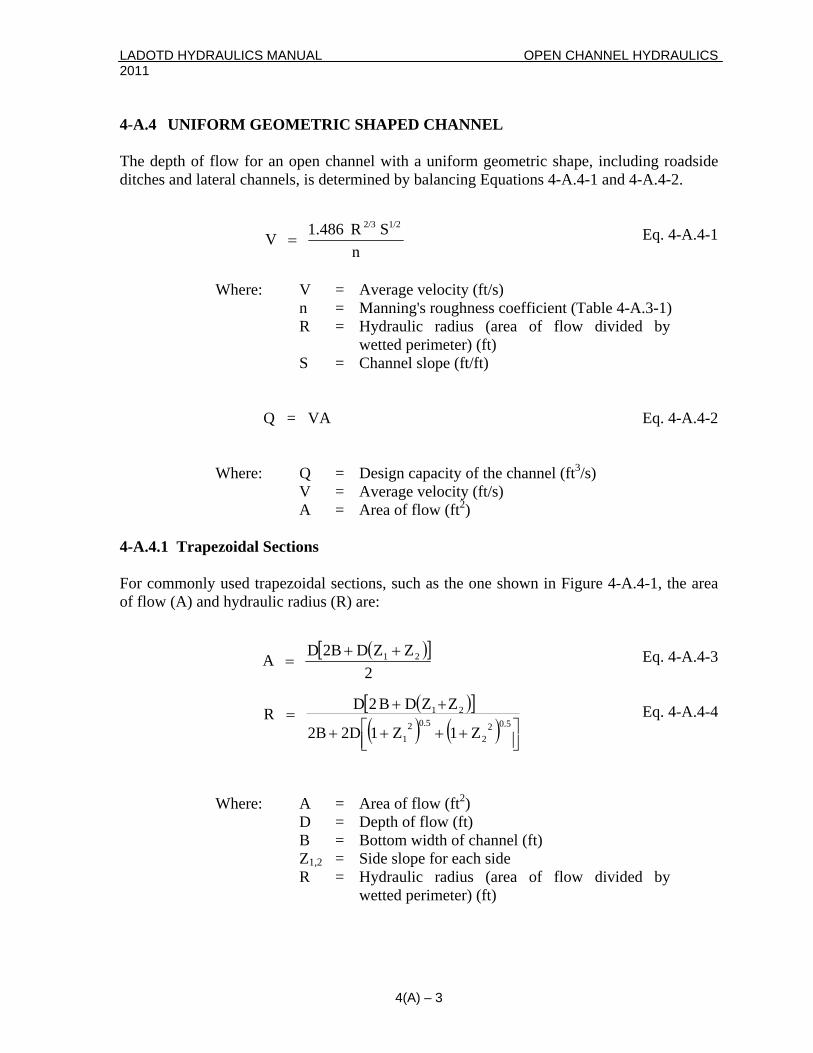
LADOTD HYDRAULICS MANUAL OPEN CHANNEL HYDRAULICS 2011 4-A.4 UNIFORM GEOMETRIC SHAPED CHANNEL The depth of flow for an open channel with a uniform geometric shape, including roadside ditches and lateral channels, is determined by balancing Equations 4-A.4-1 and 4-A.4-2. Eq. 4-A.4-1
nS R 1.486 V
1/22/3
= Where: V = Average velocity (ft/s) n = Manning's roughness coefficient (Table 4-A.3-1) R = Hydraulic radius (area of flow divided by
wetted perimeter) (ft) S = Channel slope (ft/ft) Q = VA Eq. 4-A.4-2 Where: Q = Design capacity of the channel (ft3/s) V = Average velocity (ft/s) A = Area of flow (ft2) 4-A.4.1 Trapezoidal Sections For commonly used trapezoidal sections, such as the one shown in Figure 4-A.4-1, the area of flow (A) and hydraulic radius (R) are: Eq. 4-A.4-3 ( )[ ]
2ZZD 2BD A 21 ++
= Eq. 4-A.4-4 ( )[ ]
( ) ( )
0.522
0.521
21
Z1Z 12D 2B
ZZ D B2D R
⎥⎦⎤
⎢⎣⎡ ++++
++=
Where: A = Area of flow (ft2) D = Depth of flow (ft) B = Bottom width of channel (ft) Z1,2 = Side slope for each side R = Hydraulic radius (area of flow divided by
wetted perimeter) (ft)
4(A) – 3
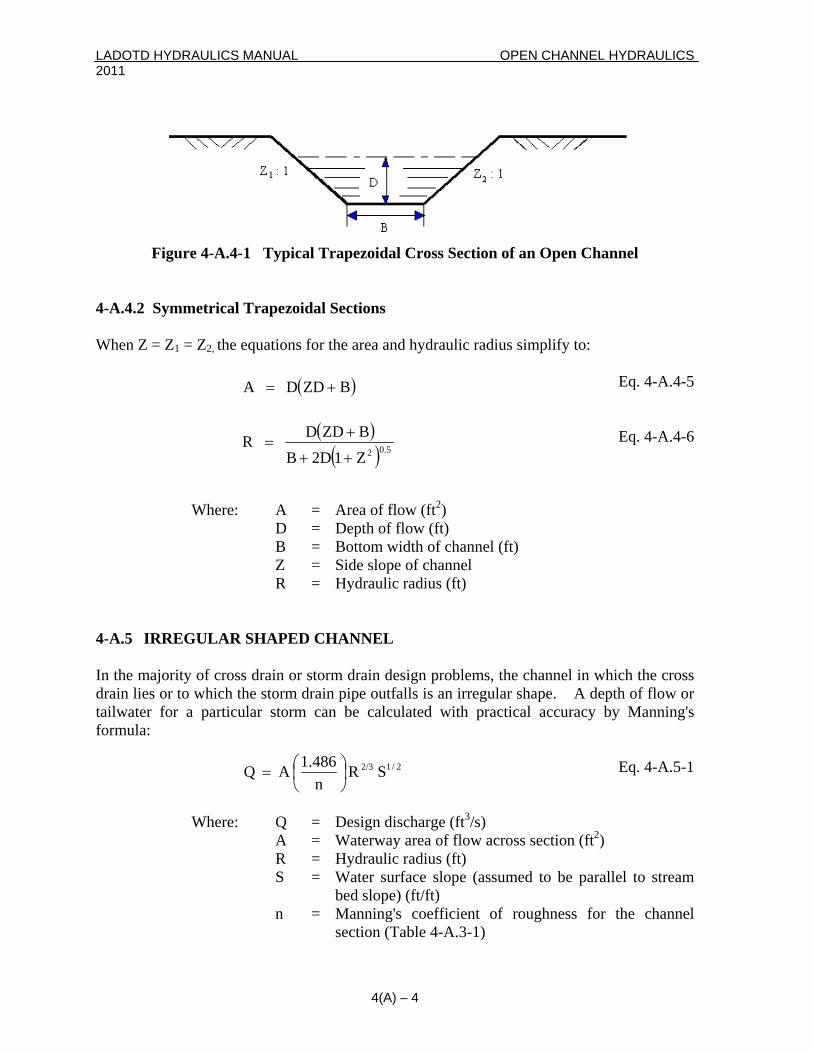
LADOTD HYDRAULICS MANUAL OPEN CHANNEL HYDRAULICS 2011
Figure 4-A.4-1 Typical Trapezoidal Cross Section of an Open Channel 4-A.4.2 Symmetrical Trapezoidal Sections When Z = Z1 = Z2, the equations for the area and hydraulic radius simplify to:
Eq. 4-A.4-5 ( ) B ZDD A += Eq. 4-A.4-6 ( )
( )
Z 12D BB ZDD R 0.52++
+=
Where: A = Area of flow (ft2) D = Depth of flow (ft) B = Bottom width of channel (ft) Z = Side slope of channel R = Hydraulic radius (ft)
4-A.5 IRREGULAR SHAPED CHANNEL In the majority of cross drain or storm drain design problems, the channel in which the cross drain lies or to which the storm drain pipe outfalls is an irregular shape. A depth of flow or tailwater for a particular storm can be calculated with practical accuracy by Manning's formula: Eq. 4-A.5-1 S R
n1.486A Q 2/12/3⎟
⎠⎞
⎜⎝⎛=
Where: Q = Design discharge (ft3/s) A = Waterway area of flow across section (ft2) R = Hydraulic radius (ft) S = Water surface slope (assumed to be parallel to stream
bed slope) (ft/ft) n = Manning's coefficient of roughness for the channel
section (Table 4-A.3-1)
4(A) – 4
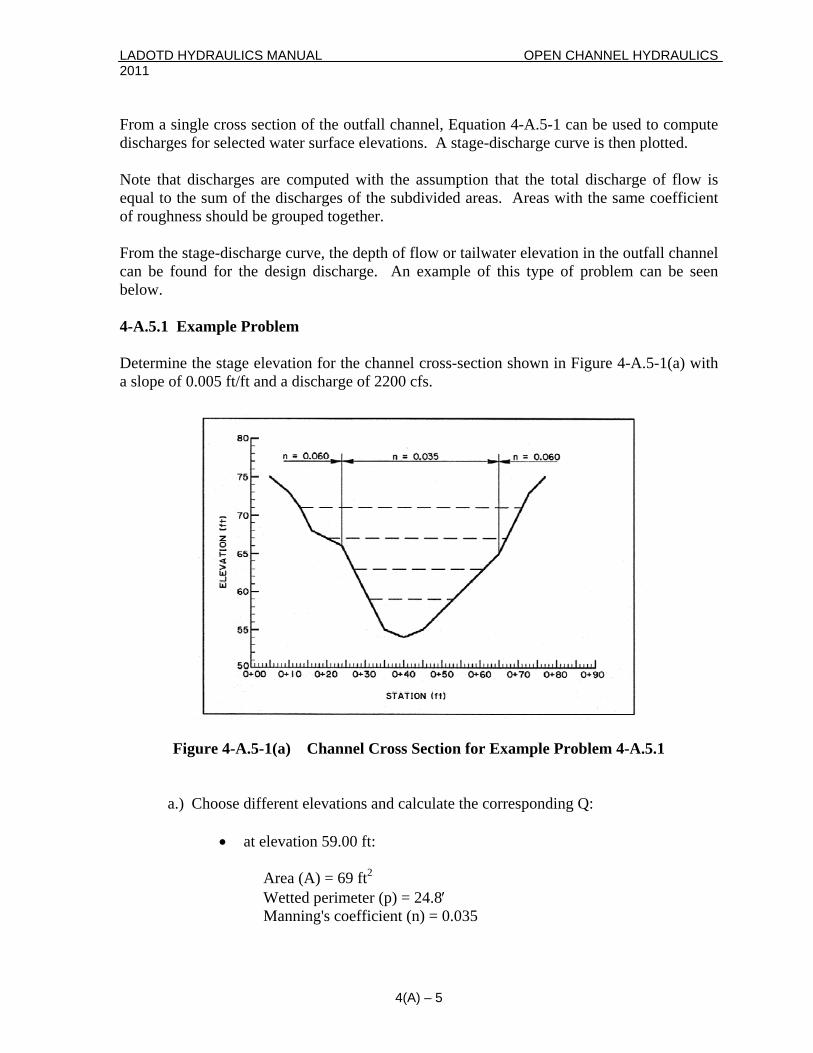
LADOTD HYDRAULICS MANUAL OPEN CHANNEL HYDRAULICS 2011 From a single cross section of the outfall channel, Equation 4-A.5-1 can be used to compute discharges for selected water surface elevations. A stage-discharge curve is then plotted. Note that discharges are computed with the assumption that the total discharge of flow is equal to the sum of the discharges of the subdivided areas. Areas with the same coefficient of roughness should be grouped together. From the stage-discharge curve, the depth of flow or tailwater elevation in the outfall channel can be found for the design discharge. An example of this type of problem can be seen below. 4-A.5.1 Example Problem Determine the stage elevation for the channel cross-section shown in Figure 4-A.5-1(a) with a slope of 0.005 ft/ft and a discharge of 2200 cfs.
Figure 4-A.5-1(a) Channel Cross Section for Example Problem 4-A.5.1
a.) Choose different elevations and calculate the corresponding Q:
• at elevation 59.00 ft:
Area (A) = 69 ft2 Wetted perimeter (p) = 24.8′ Manning's coefficient (n) = 0.035
4(A) – 5
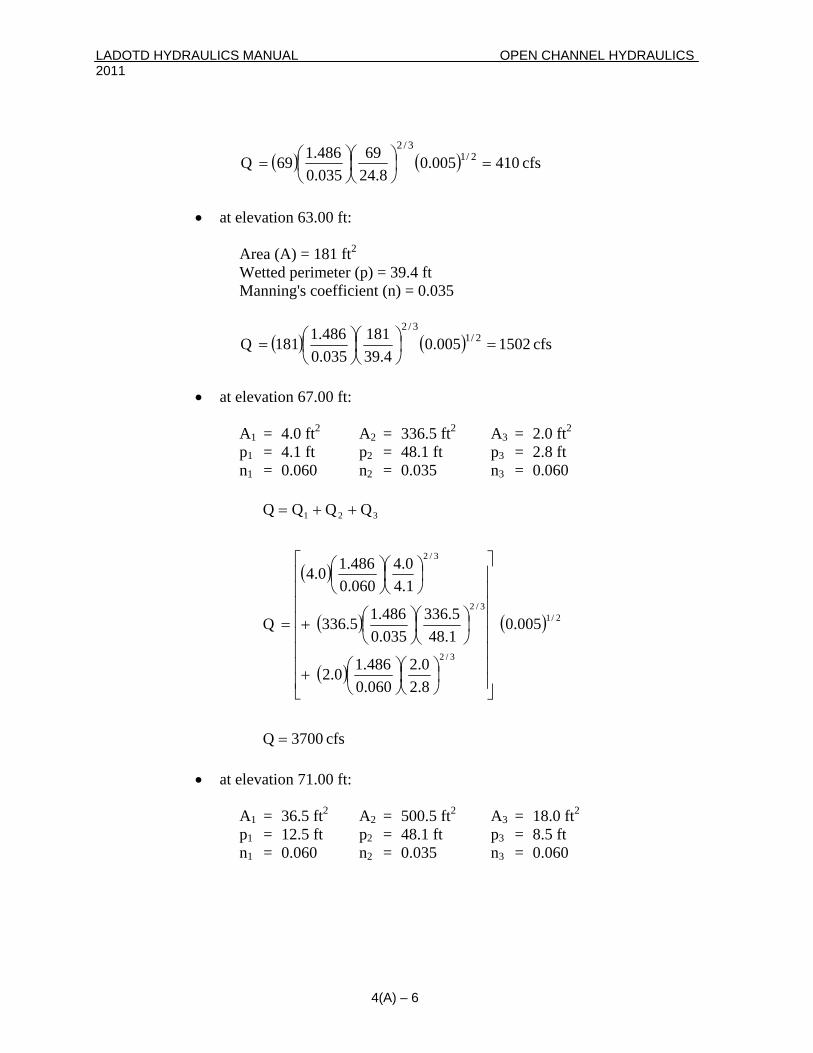
LADOTD HYDRAULICS MANUAL OPEN CHANNEL HYDRAULICS 2011
( ) ( ) cfs 410005.08.24
69035.0486.169 Q 2/1
3/2
=⎟⎠⎞
⎜⎝⎛⎟⎠⎞
⎜⎝⎛=
• at elevation 63.00 ft:
Area (A) = 181 ft2 Wetted perimeter (p) = 39.4 ft Manning's coefficient (n) = 0.035
at elevation 67.00 ft:
A1 = 4.0 ft A2 = 336.5 ft2 A3 = 2.0 ft2
• at elevation 71.00 ft:
A1 = 36.5 ft A2 = 500.5 ft2 A3 = 18.0 ft2
( ) ( ) cfs 1502005.04.39
181035.0486.1181 Q 2/1
3/2
=⎟⎠⎞
⎜⎝⎛⎟⎠⎞
⎜⎝⎛=
•
2 p1 = 4.1 ft p2 = 48.1 ft p3 = 2.8 ft n1 = 0.060 n2 = 0.035 n3 = 0.060
( )
( )
( )
( )
cfs 3700Q
005.0
8.20.2
060.0486.10.2
1.485.336
035.0486.15.336
1.40.4
060.0486.10.4
Q 2/1
3/2
3/2
3/2
321
=
⎥⎥⎥⎥⎥⎥⎥⎥
⎦
⎤
⎢⎢⎢⎢⎢⎢⎢⎢
⎣
⎡
⎟⎠⎞
⎜⎝⎛⎟⎠⎞
⎜⎝⎛+
⎟⎠⎞
⎜⎝⎛⎟⎠⎞
⎜⎝⎛+
⎟⎠⎞
⎜⎝⎛⎟⎠⎞
⎜⎝⎛
=
QQQQ += +
2 p1 = 12.5 ft p2 = 48.1 ft p3 = 8.5 ft n1 = 0.060 n2 = 0.035 n3 = 0.060
4(A) – 6
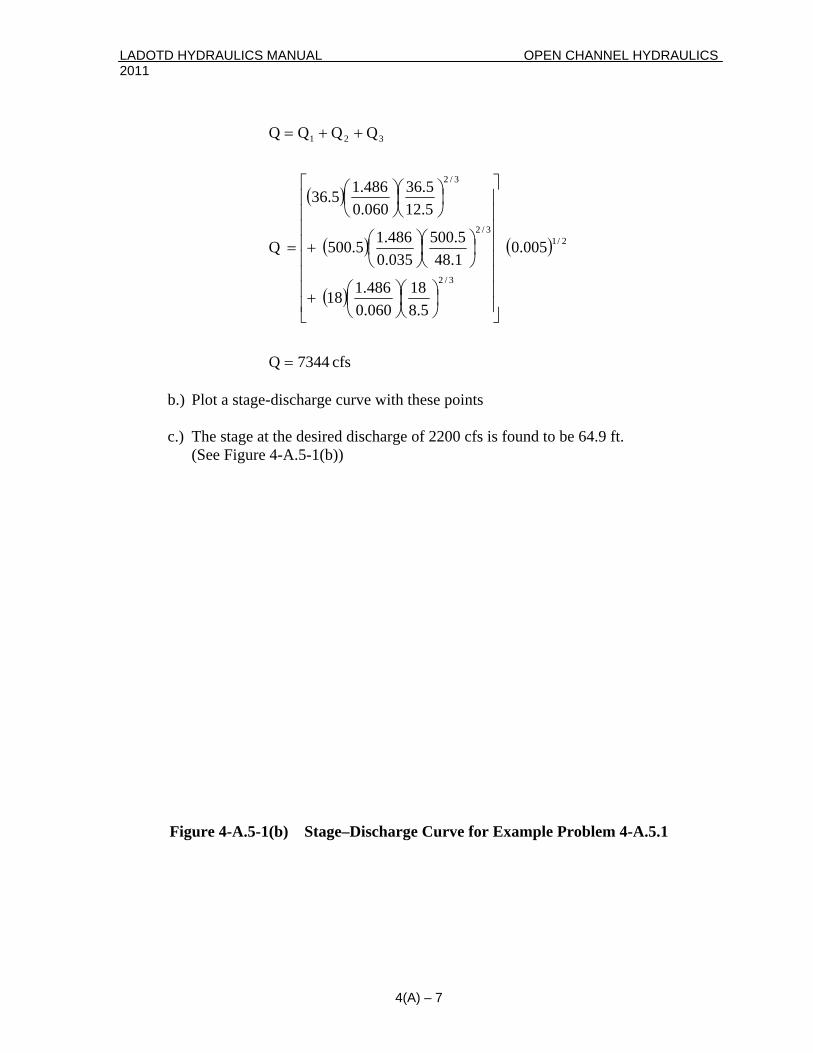
LADOTD HYDRAULICS MANUAL OPEN CHANNEL HYDRAULICS 2011
4(A) – 7
( )
( )
( )
( )
cfs 7344Q
005.0
5.8
18060.0486.118
1.485.500
035.0486.15.500
5.125.36
060.0486.15.36
Q
QQQQ
2/1
3/2
3/2
3/2
321
=
⎥⎥⎥⎥⎥⎥⎥⎥
⎦
⎤
⎢⎢⎢⎢⎢⎢⎢⎢
⎣
⎡
⎟⎠⎞
⎜⎝⎛⎟⎠⎞
⎜⎝⎛+
⎟⎠⎞
⎜⎝⎛⎟⎠⎞
⎜⎝⎛+
⎟⎠⎞
⎜⎝⎛⎟⎠⎞
⎜⎝⎛
=
++=
b.) Plot a stage-discharge curve with these points
c.) The stage at the desired discharge of 2200 cfs is found to be 64.9 ft. (See Figure 4-A.5-1(b))
Figure 4-A.5-1(b) Stage–Discharge Curve for Example Problem 4-A.5.1

LADOTD HYDRAULICS MANUAL OPEN CHANNEL HYDRAULICS 2011 4-A.6 EROSION CONTROL PROTECTION 4-A.6.1 Open Channels and Roadside Ditches One method commonly applied to determine if a channel is stable is the permissible tractive force (shear stress) method. The hydrodynamic force of water flowing in a channel is known as the tractive force. The basis for stable channel design is that flow-induced tractive force should not exceed the permissible shear stress of the selected erosion control level. The design procedure for determining the shear stress a channel must sustain is outlined in FHWA Publication, HEC 15. (Reference C in Section 4-A.1) 4-A.6.2 Lateral Channels A similar procedure as noted in Section 4-A.6.1 may be followed for lateral channels except that the design discharge of the culvert or culverts they serve should be used to evaluate the level of permanent erosion protection.
4(A) – 8

LADOTD HYDRAULICS MANUAL CULVERT MATERIALS & INSTALLATION 2011
CHAPTER 5 CULVERT MATERIALS AND INSTALLATION
5.1 PURPOSE This chapter presents standards and practices for specifying culvert materials and installation of all culverts used in cross drains, side drains, median drains and storm drains. 5.2 PIPE MATERIAL It is LADOTD’s policy to allow alternate materials and options for pipe culverts. The LADOTD pipe material policy is covered by the following sections of LADOTD’s Engineering Directives and Standards Manual (EDSM): A.) II.2.1.1 – "Pipe Material Selection Policy for Cross Drains, Side Drains
and Storm Drains" B.) II.2.1.6 – "Procedure for Determining Coating and Gage (Thickness)
Requirements for Metal Pipe" C.) II.2.1.13 – "Procedure for Quality Assurance, Fill Heights and Installation Requirements for Plastic Pipe Used in Cross Drains, Side
Drains and Storm Drains" The current approved copy may be found on the LADOTD website: http://webmail.dotd.louisiana.gov/ppmemos.nsf 5.2.1 Pipes under Railroads When it is necessary to place or replace a cross drain (pipe or pipe arch) under a railroad, the designer should contact the specific Railroad Company to determine the type of pipe material they require under their railroad tracks. 5.3 DESIGN SERVICE LIFE FOR CULVERTS The design service life is defined as the estimated expectancy of how many years the pipe material will last before failure. The required design service life for different pipe applications is defined in EDSM II.2.1.1.
5 –1
LADOTD HYDRAULICS MANUAL CULVERT MATERIALS & INSTALLATION 2011 5.4 GAGE & COATING REQUIREMENTS Estimated service life for metal pipe depends on soil and water conditions in the field. Gage (thickness) and coating for corrugated metal pipes will be selected in accordance to the latest EDSM II.2.1.6 and Standard Plan SAM-1. 5.5 JOINT TYPES The type of joints required for each structure classification, (Cross Drain Pipe, Storm Drain Pipe or Side Drain), shall be in accordance to the latest EDSM II.2.1.1. 5.6 ALLOWABLE FILL HEIGHTS Allowable fill height is the distance in feet from the top of the culvert to the top of the paved surface. 5.6.1 Corrugated Metal Pipe Allowable Fill Heights Allowable fill heights for various metal gages for corrugated steel and corrugated aluminum pipes (or pipe arches) are given in Standard Plan SAM-1. 5.6.2 Plastic Pipe Allowable Fill Heights Allowable fill heights for plastic pipes shall be in accordance to the latest EDSM II.2.1.13. 5.6.3 Reinforced Concrete Pipe Allowable Fill Heights Generally, Class III reinforced concrete pipe is used unless the allowable fill height for Class III reinforced concrete pipe is exceeded. Recommended allowable fill heights are: a.) 18′ for Class III reinforced concrete pipe, b.) 26′ for Class IV reinforced concrete pipe, or c.) 40′ for Class V reinforced concrete pipe.
5.6.4 Reinforced Concrete Box Culverts Allowable Fill Heights Fill heights for cast-in-place boxes are in accordance with the standard plans. If a greater fill height is needed, contact the Hydraulics Unit.
5 –2
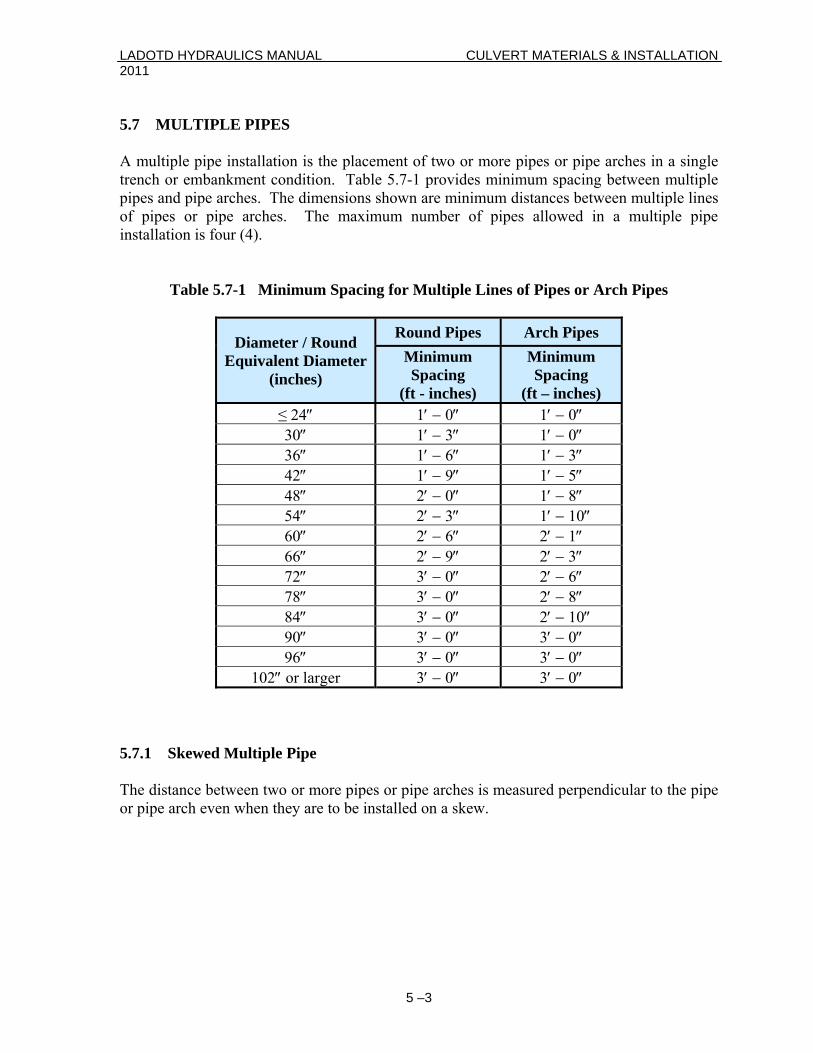
LADOTD HYDRAULICS MANUAL CULVERT MATERIALS & INSTALLATION 2011 5.7 MULTIPLE PIPES A multiple pipe installation is the placement of two or more pipes or pipe arches in a single trench or embankment condition. Table 5.7-1 provides minimum spacing between multiple pipes and pipe arches. The dimensions shown are minimum distances between multiple lines of pipes or pipe arches. The maximum number of pipes allowed in a multiple pipe installation is four (4).
Table 5.7-1 Minimum Spacing for Multiple Lines of Pipes or Arch Pipes
Diameter / Round Equivalent Diameter
(inches)
Round Pipes Arch Pipes Minimum Spacing
(ft - inches)
Minimum Spacing
(ft – inches) ≤ 24″ 1′ − 0″ 1′ − 0″ 30″ 1′ − 3″ 1′ − 0″ 36″ 1′ − 6″ 1′ − 3″ 42″ 1′ − 9″ 1′ − 5″ 48″ 2′ − 0″ 1′ − 8″ 54″ 2′ − 3″ 1′ − 10″ 60″ 2′ − 6″ 2′ − 1″ 66″ 2′ − 9″ 2′ − 3″ 72″ 3′ − 0″ 2′ − 6″ 78″ 3′ − 0″ 2′ − 8″ 84″ 3′ − 0″ 2′ − 10″ 90″ 3′ − 0″ 3′ − 0″ 96″ 3′ − 0″ 3′ − 0″
102″ or larger 3′ − 0″ 3′ − 0″ 5.7.1 Skewed Multiple Pipe The distance between two or more pipes or pipe arches is measured perpendicular to the pipe or pipe arch even when they are to be installed on a skew.
5 –3
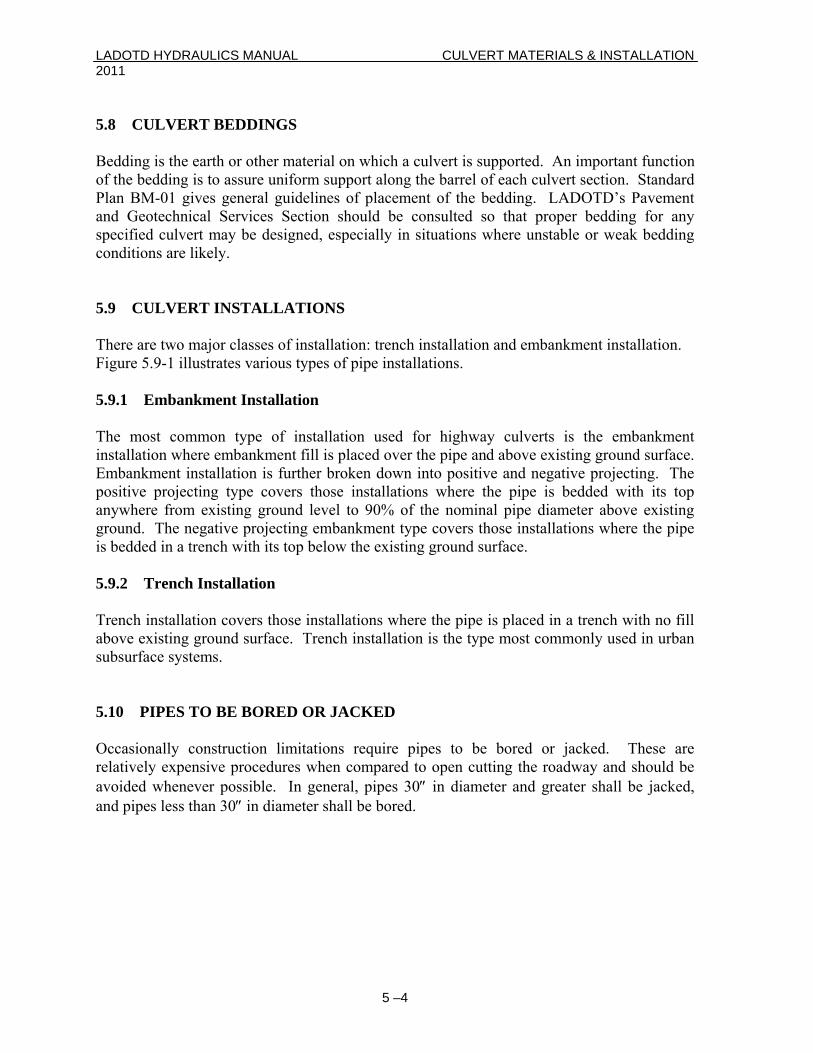
LADOTD HYDRAULICS MANUAL CULVERT MATERIALS & INSTALLATION 2011 5.8 CULVERT BEDDINGS Bedding is the earth or other material on which a culvert is supported. An important function of the bedding is to assure uniform support along the barrel of each culvert section. Standard Plan BM-01 gives general guidelines of placement of the bedding. LADOTD’s Pavement and Geotechnical Services Section should be consulted so that proper bedding for any specified culvert may be designed, especially in situations where unstable or weak bedding conditions are likely. 5.9 CULVERT INSTALLATIONS There are two major classes of installation: trench installation and embankment installation. Figure 5.9-1 illustrates various types of pipe installations. 5.9.1 Embankment Installation The most common type of installation used for highway culverts is the embankment installation where embankment fill is placed over the pipe and above existing ground surface. Embankment installation is further broken down into positive and negative projecting. The positive projecting type covers those installations where the pipe is bedded with its top anywhere from existing ground level to 90% of the nominal pipe diameter above existing ground. The negative projecting embankment type covers those installations where the pipe is bedded in a trench with its top below the existing ground surface. 5.9.2 Trench Installation Trench installation covers those installations where the pipe is placed in a trench with no fill above existing ground surface. Trench installation is the type most commonly used in urban subsurface systems. 5.10 PIPES TO BE BORED OR JACKED Occasionally construction limitations require pipes to be bored or jacked. These are relatively expensive procedures when compared to open cutting the roadway and should be avoided whenever possible. In general, pipes 30″ in diameter and greater shall be jacked, and pipes less than 30″ in diameter shall be bored.
5 –4
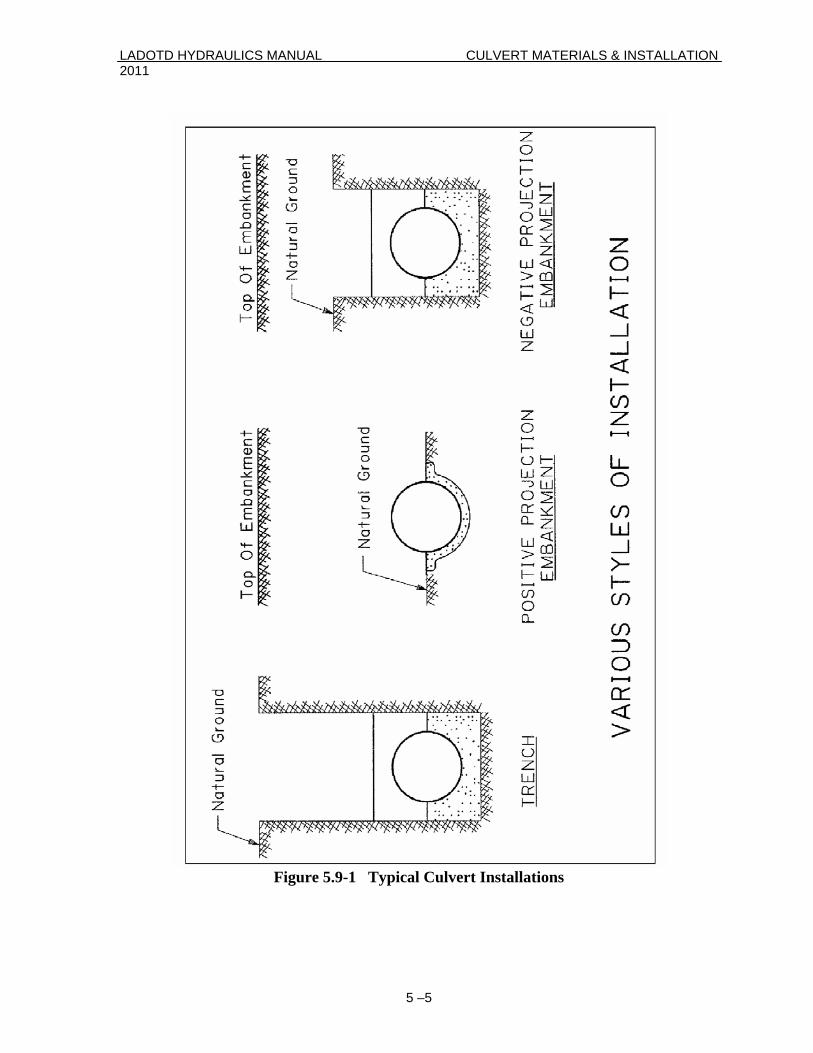
LADOTD HYDRAULICS MANUAL CULVERT MATERIALS & INSTALLATION 2011
5 –5
Figure 5.9-1 Typical Culvert Installations

LADOTD HYDRAULICS MANUAL CULVERT MATERIALS & INSTALLATION 2011 5.11 SPECIAL INSTALLATIONS Special installation conditions may warrant special design features, or they may justify the specification of one material type without alternate. 5.11.1 Limited Construction Time Occasionally, the speed of construction may overshadow importance of economics. In such instances, pipes or precast reinforced concrete box culverts may be chosen over cast-in-place reinforced concrete box culverts.
5 –6

LADOTD HYDRAULICS MANUAL CROSS DRAIN CULVERTS 2011
CHAPTER 6 CROSS DRAIN CULVERTS
6.1 PURPOSE This chapter presents standards and procedures for the design of culverts for adequate hydraulic capacity to carry the natural flow underneath a roadway. The hydraulic design of a cross drain consists of an analysis of the performance of the culvert in conveying flow from one side of the roadway to the other. To meet this conveyance function adequately, the design must include consideration of variables such as design discharge, tailwater elevation, headwater elevation, proper alignment, outlet velocity and maintenance problems. For detailed information of the hydraulic theory used in cross drain culvert design, refer to Part A of this chapter. A sample Hydrologic Summary Table is provided at the end of this chapter. It is useful in the design of culverts as well as being required on the plans. 6.2 DESIGN STORM FREQUENCY The selection of design flood and headwater elevations should be based on the following risk conditions:
• Damage to adjacent properties • Damage to the culvert and the roadway • Traffic interruption • Hazard to human life • Damage to stream and floodplain environment.
The design storm frequency will be determined as a function of the Projected Annual Average Daily Traffic (PAADT). For further details on design frequency, see Chapter 1. 6.3 PEAK DISCHARGE The methods for determining peak discharge are described in Chapter 3. 6.4 RUNOFF HYDROGRAPH A variation of rate of runoff with time is defined as a runoff hydrograph. A runoff hydrograph is normally used when upstream storage volume is to be considered in the design of culverts and a reservoir routing routine is employed. Generally, however, only the peak runoff rate is used as a design parameter in the design of culverts.
6 – 1
LADOTD HYDRAULICS MANUAL CROSS DRAIN CULVERTS 2011 6.5 CULVERT SELECTION Conventional culverts include those commonly installed, such as circular pipes: reinforced concrete pipe (RCP), plastic pipe (PP) and corrugated metal pipe (CMP); arch pipes: reinforced concrete pipe arch (RCPA) and corrugated metal pipe arch (CMPA); and reinforced concrete box culverts (RCB). All such conventional culverts have a uniform barrel cross section throughout. The culvert inlet may consist of the culvert barrel projected from the roadway fill, mitered to the embankment slope, or it may have headwalls. Whenever possible, the selected culvert should be the most economical alternative which meets the hydraulic, structural, and service life requirements. Generally, pipes may be installed more economically than reinforced concrete boxes; a single line of pipe is less expensive than double or multiple lines of smaller pipe; round pipe is less expensive than arch pipe. In some circumstances, there are factors other than material cost which may govern the selection of the culvert. For these factors influencing culvert material selection including installation procedures, refer to Chapter 5 – Culvert Materials and Installation. 6.5.1 Use of Reinforced Concrete Box Culverts instead of Pipe Conditions which may warrant the exclusive use of Reinforced Concrete Boxes: a.) In low headroom situations requiring multiple openings, reinforced
concrete boxes have a geometric advantage in that more area of opening can be concentrated in a given width. This may result in not only an economic advantage, but also an operational advantage.
b.) In urban areas, where the channel is paved or is to be paved, reinforced
concrete boxes may “fit” the channel better. 6.6 SIZE OF STRUCTURES Structures shall be sized based on their calculated hydraulic capacity as determined by an approved hydraulic analysis procedure. Culverts should be sized to fit the opening of the stream as much as possible, both vertically and horizontally. Where necessary, multiple lines of pipe may be used. See Chapter 5 for installation details. 6.6.1 Sizes of Reinforced Concrete Box Culverts The Department has many Standard Plans for reinforced concrete boxes. They are included in the Department’s Standard Plans Booklet which is available through the General Files Section.
6 – 2
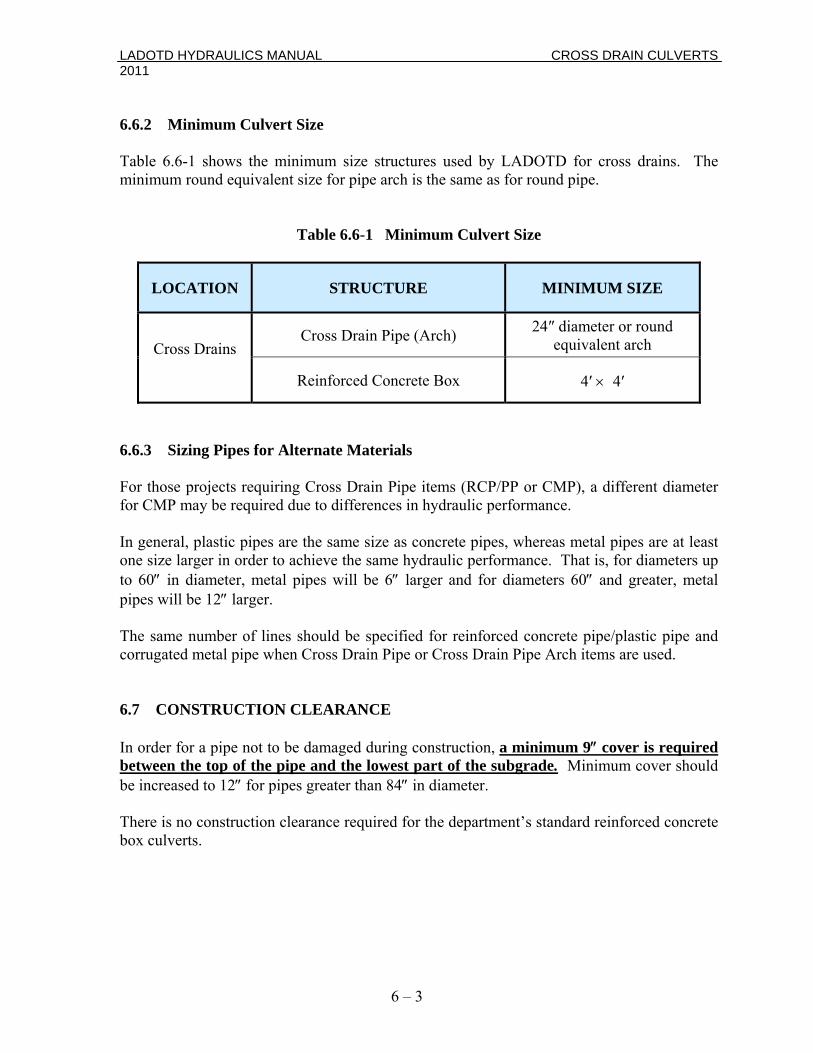
LADOTD HYDRAULICS MANUAL CROSS DRAIN CULVERTS 2011 6.6.2 Minimum Culvert Size Table 6.6-1 shows the minimum size structures used by LADOTD for cross drains. The minimum round equivalent size for pipe arch is the same as for round pipe.
Table 6.6-1 Minimum Culvert Size
LOCATION STRUCTURE MINIMUM SIZE
Cross Drains
Cross Drain Pipe (Arch) 24″ diameter or round equivalent arch
Reinforced Concrete Box 4′ × 4′
6.6.3 Sizing Pipes for Alternate Materials For those projects requiring Cross Drain Pipe items (RCP/PP or CMP), a different diameter for CMP may be required due to differences in hydraulic performance. In general, plastic pipes are the same size as concrete pipes, whereas metal pipes are at least one size larger in order to achieve the same hydraulic performance. That is, for diameters up to 60″ in diameter, metal pipes will be 6″ larger and for diameters 60″ and greater, metal pipes will be 12″ larger. The same number of lines should be specified for reinforced concrete pipe/plastic pipe and corrugated metal pipe when Cross Drain Pipe or Cross Drain Pipe Arch items are used. 6.7 CONSTRUCTION CLEARANCE In order for a pipe not to be damaged during construction, a minimum 9″ cover is required between the top of the pipe and the lowest part of the subgrade. Minimum cover should be increased to 12″ for pipes greater than 84″ in diameter. There is no construction clearance required for the department’s standard reinforced concrete box culverts.
6 – 3
LADOTD HYDRAULICS MANUAL CROSS DRAIN CULVERTS 2011 6.7.1 Limited Headroom In cases of limited headroom, it is often necessary to specify arch pipe instead of round pipe in order to achieve the necessary hydraulic capacity. Round and arch pipes may not be mixed within a conduit item. Each cross drain pipe site requires either round pipe or arch pipe. 6.7.2 Burying Culverts In order to accommodate possible future development, or in cases of limited headroom, the flow line of the structure may be buried below the channel bottom by a distance of up to: a.) one-third (1/3) the diameter of the round pipe, b.) one-fourth (¼) the rise of the pipe arch, c.) one-third (1/3) the box height The maximum depth any culvert may be buried is one foot. 6.8 CULVERT SLOPE Culverts are generally installed on the same slope as the natural streambed slope. Modified culvert slopes or slopes other than that of the natural stream should be given special attention to ensure that detrimental effects do not result from the change. 6.8.1 Flow Line (FL) Flow line is defined as the elevation of the bottom of the inside of a culvert. Flow lines should be set to match the natural stream bed and slope, or to match design stream bed in cases where channel improvements are being made. Invert elevations will usually be the same for all alternates.
6 – 4

LADOTD HYDRAULICS MANUAL CROSS DRAIN CULVERTS 2011 6.9 BACKWATER Table 6.9-1 summarizes the choice of the correct allowable headwater (AHW) and/or differential head (∆H). Below are the definitions and when to incorporate each one in the design. 6.9.1 Differential Head (ΔH) Differential head is the difference between the headwater and tailwater. At conditions of flat gradients and greater existing or potential development, differential head is the most practical design parameter. Where Differential Head (∆H) governs, it should not be greater than one foot. In areas that are “flood sensitive” (such as urban areas in low spots that flood frequently), ΔH should be kept to a minimal increase without exceeding 0.5 ft. It should be remembered that the horizontal extent of ponding for a given differential head will be much greater in flat areas than in hilly areas. 6.9.2 Allowable Headwater (AHW) & Allowable Headwater Elevation (AHWE) In general, when the gradient of the upstream land is appreciable, and the existing development is minimal, then the Allowable Headwater (AHW) will be more important than the Differential Head (ΔH). However, the Differential Head should never exceed 1 foot. Allowable Headwater Elevation for the design event should be at least one foot below the lowest elevation of the paved surface (excluding the shoulder), but may not exceed three (3) feet above the top opening elevation of the pipe. See Figure 6.9-1 6.9.3 Future Development Existing and potential development (houses, commercial establishments, etc.) must be considered. The differential head (ΔH) is especially important in locations that have greater potential for development. In all cases, headwater elevations should be set at reasonable distances below existing slab elevations or reasonable forecasts of future slab elevations.
6 – 5
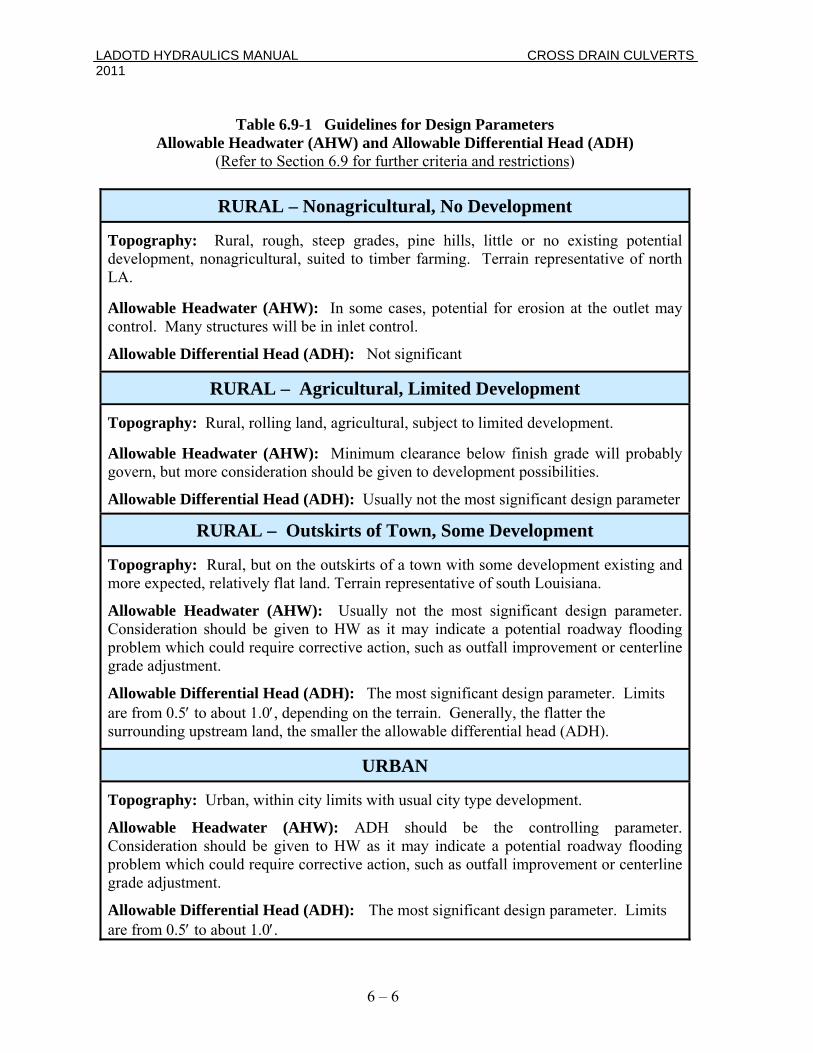
LADOTD HYDRAULICS MANUAL CROSS DRAIN CULVERTS 2011
Table 6.9-1 Guidelines for Design Parameters Allowable Headwater (AHW) and Allowable Differential Head (ADH)
(Refer to Section 6.9 for further criteria and restrictions)
RURAL – Nonagricultural, No Development
Topography: Rural, rough, steep grades, pine hills, little or no existing potential development, nonagricultural, suited to timber farming. Terrain representative of north LA.
Allowable Headwater (AHW): In some cases, potential for erosion at the outlet may control. Many structures will be in inlet control.
Allowable Differential Head (ADH): Not significant
RURAL – Agricultural, Limited Development
Topography: Rural, rolling land, agricultural, subject to limited development. Allowable Headwater (AHW): Minimum clearance below finish grade will probably govern, but more consideration should be given to development possibilities.
Allowable Differential Head (ADH): Usually not the most significant design parameter .
RURAL – Outskirts of Town, Some Development
Topography: Rural, but on the outskirts of a town with some development existing and more expected, relatively flat land. Terrain representative of south Louisiana.
Allowable Headwater (AHW): Usually not the most significant design parameter. Consideration should be given to HW as it may indicate a potential roadway flooding problem which could require corrective action, such as outfall improvement or centerline grade adjustment.
Allowable Differential Head (ADH): The most significant design parameter. Limits are from 0.5′ to about 1.0′, depending on the terrain. Generally, the flatter the surrounding upstream land, the smaller the allowable differential head (ADH).
URBAN
Topography: Urban, within city limits with usual city type development.
Allowable Headwater (AHW): ADH should be the controlling parameter. Consideration should be given to HW as it may indicate a potential roadway flooding problem which could require corrective action, such as outfall improvement or centerline grade adjustment.
Allowable Differential Head (ADH): The most significant design parameter. Limits are from 0.5′ to about 1.0′.
6 – 6
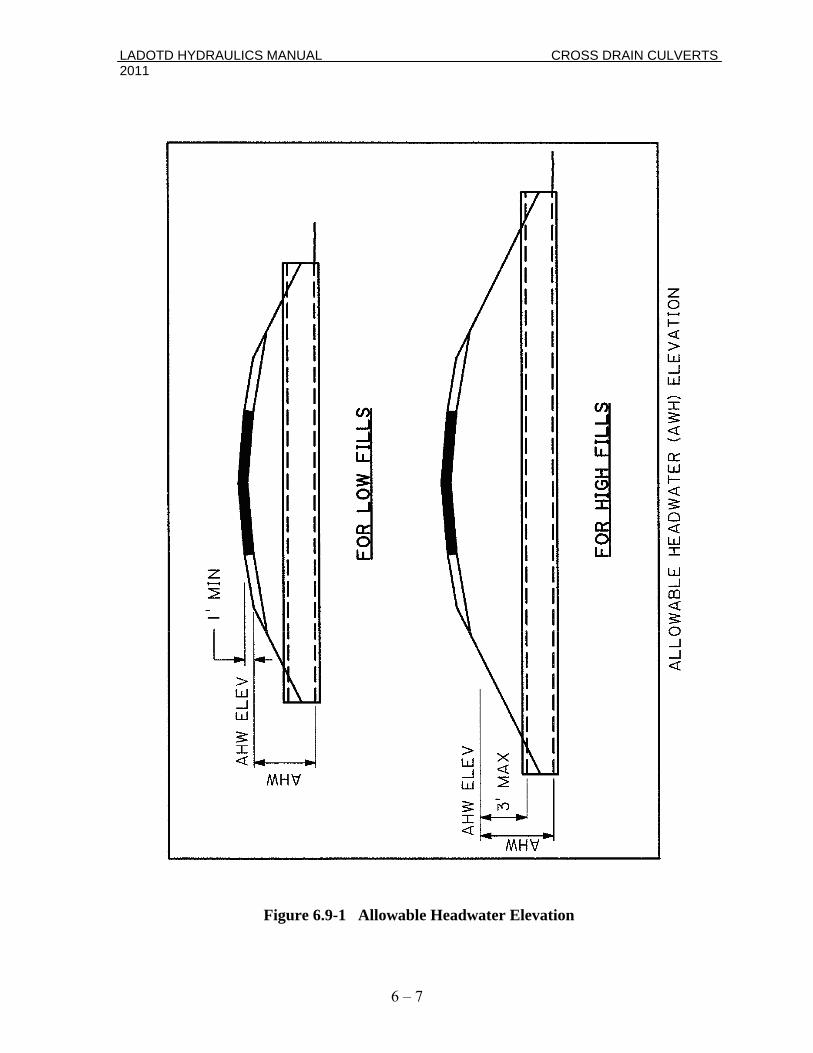
LADOTD HYDRAULICS MANUAL CROSS DRAIN CULVERTS 2011
Figure 6.9-1 Allowable Headwater Elevation
6 – 7
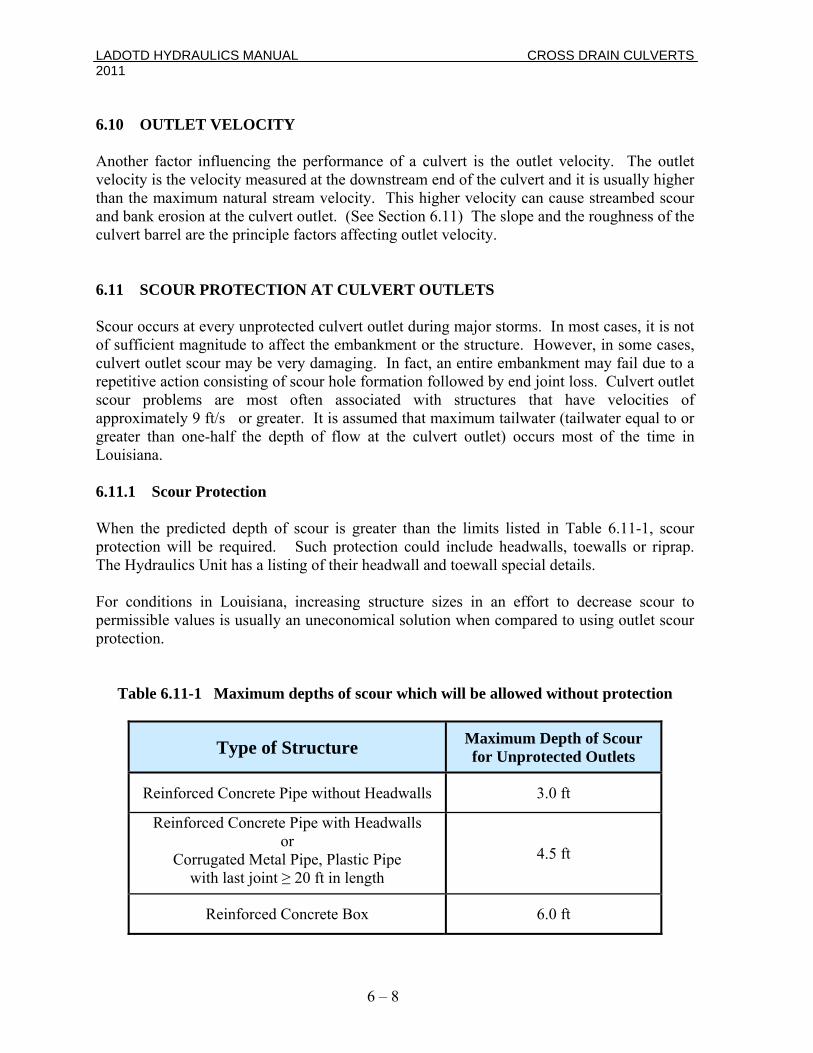
LADOTD HYDRAULICS MANUAL CROSS DRAIN CULVERTS 2011 6.10 OUTLET VELOCITY Another factor influencing the performance of a culvert is the outlet velocity. The outlet velocity is the velocity measured at the downstream end of the culvert and it is usually higher than the maximum natural stream velocity. This higher velocity can cause streambed scour and bank erosion at the culvert outlet. (See Section 6.11) The slope and the roughness of the culvert barrel are the principle factors affecting outlet velocity. 6.11 SCOUR PROTECTION AT CULVERT OUTLETS Scour occurs at every unprotected culvert outlet during major storms. In most cases, it is not of sufficient magnitude to affect the embankment or the structure. However, in some cases, culvert outlet scour may be very damaging. In fact, an entire embankment may fail due to a repetitive action consisting of scour hole formation followed by end joint loss. Culvert outlet scour problems are most often associated with structures that have velocities of approximately 9 ft/s or greater. It is assumed that maximum tailwater (tailwater equal to or greater than one-half the depth of flow at the culvert outlet) occurs most of the time in Louisiana. 6.11.1 Scour Protection When the predicted depth of scour is greater than the limits listed in Table 6.11-1, scour protection will be required. Such protection could include headwalls, toewalls or riprap. The Hydraulics Unit has a listing of their headwall and toewall special details. For conditions in Louisiana, increasing structure sizes in an effort to decrease scour to permissible values is usually an uneconomical solution when compared to using outlet scour protection.
Table 6.11-1 Maximum depths of scour which will be allowed without protection
Type of Structure Maximum Depth of Scour for Unprotected Outlets
Reinforced Concrete Pipe without Headwalls 3.0 ft
Reinforced Concrete Pipe with Headwalls or
Corrugated Metal Pipe, Plastic Pipe with last joint ≥ 20 ft in length
4.5 ft
Reinforced Concrete Box 6.0 ft
6 – 8
LADOTD HYDRAULICS MANUAL CROSS DRAIN CULVERTS 2011
6 – 9
6.12 LENGTH OF CULVERTS Lengths of all pipe and pipe arch culverts will be specified in multiples of 2 ft. Lengths of all reinforced concrete box culverts are rounded off to the whole foot. The barrel length of a box culvert is measured from inside to inside of the headwall. 6.12.1 Calculation of Cross Drain Pipe Lengths Lengths of cross drain structures are calculated by procedures described in Figures 6.12-1 and 6.12-2. Lengths of cross drain pipes without headwalls will be calculated based on the average elevation of the pipe centerlines (spring line elevation for pipe arches) of the alternates. 6.12.2 Use of Pipe Headwalls The use of headwalls seldom reduces the length of a pipe culvert enough to offset the cost of the headwall. For this reason, pipe headwalls will generally not be used except for the following reasons: a.) When a cost estimate based upon latest unit prices indicates that the
culvert will be less expensive with headwalls than without. b.) When necessary to keep the length of the culvert within the right-of-way
or other physical constraints. c.) For special hydraulic requirements, such as the need for retaining walls,
etc. d.) When required for erosion protection.
End structures used to separate storm water from irrigation water (rice flumes) are a special case of pipe headwalls, and the above discussion does not apply to those structures. 6.12.3 Reinforced Concrete Box Extension Sometimes if an existing box culvert is extended, a Special Detail is required. (See Chapter 2)
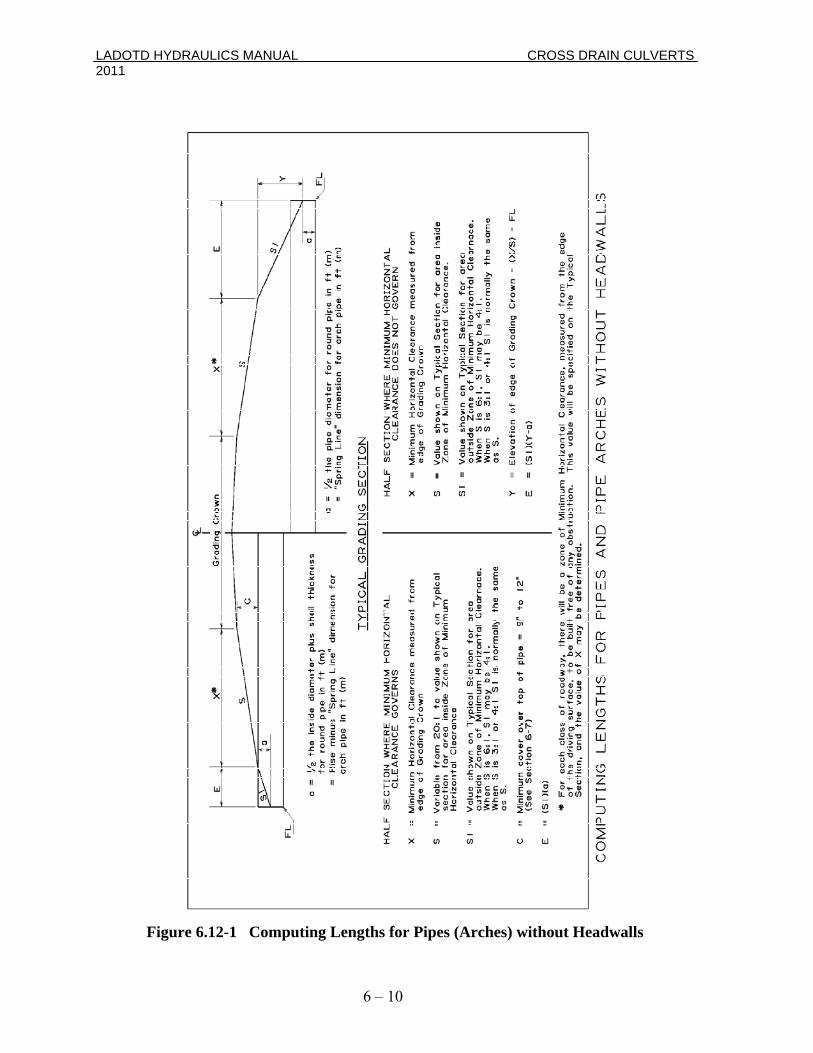
LADOTD HYDRAULICS MANUAL CROSS DRAIN CULVERTS 2011
F igure 6.12-1 Computing Lengths for Pipes (Arches) without Headwalls
6 – 10
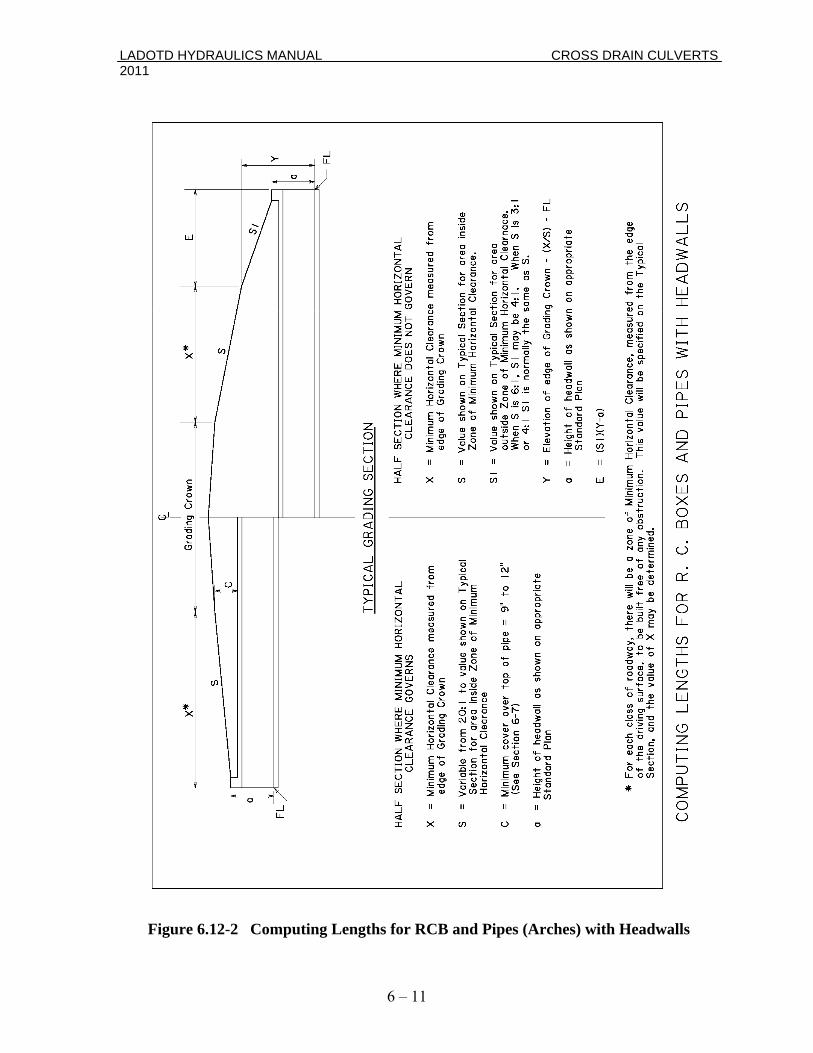
LADOTD HYDRAULICS MANUAL CROSS DRAIN CULVERTS 2011
Figure 6.12-2 Computing Lengths for RCB and Pipes (Arches) with Headwalls
6 – 11

LADOTD HYDRAULICS MANUAL CROSS DRAIN CULVERTS 2011
6 – 12
This page intentionally left blank.
LADOTD HYDRAULICS MANUAL CULVERT HYDRAULICS 2011
CHAPTER CULVERT HYDRAULICS
6-A.1 INTRODUCTION There are two major conditions of culvert flow: (1) flow with inlet control and, (2) flow with outlet control. To find more information on the theory of culvert hydraulics, refer to the following reference: A.) Hydraulic Design of Highway Culverts
6 – PART A
, Hydraulic Design Series No. 5, FHWA, Washington, D.C., September 2001, revised May 2005.
6-A.2 COMPUTER PROGRAMS The following programs have been approved for use in the design of hydraulic structures for LADOTD highways: A.) The LADOTD computer program HYDR1120: “Hydraulic Analysis of
Culverts” is based on the procedures outlined in this section. B.) HY 8 – FHWA computer program for hydraulic analysis of culverts. 6-A.3 TERMINOLOGY A.) Differential Head (DH or ΔH): The difference between headwater and
tailwater. B.) Flow Line (FL): Flow line is defined as the elevation of the bottom of
the inside of a culvert. C.) Headwater (HW): Any culvert which constricts the natural stream flow
will cause a rise in upstream water surface to some extent. Headwater (HW) is defined as the total flow depth of the upstream water surface measured from the culvert inlet flow line.
D.) Tailwater (TW): Tailwater (TW) is defined as the flow depth of water
downstream of the culvert measured from the flow line of the culvert outlet. Tailwater can be an important factor in culvert hydraulic design because a submerged outlet may cause culverts to flow full rather than partially full.
6(A) – 1
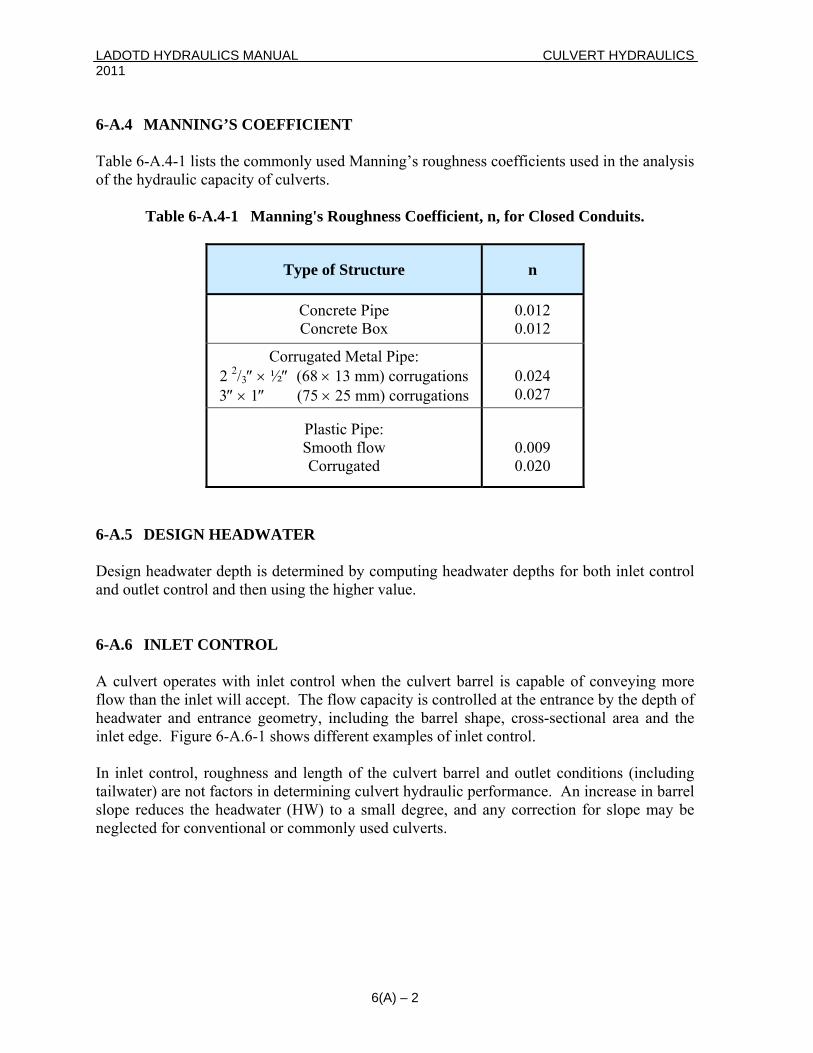
LADOTD HYDRAULICS MANUAL CULVERT HYDRAULICS 2011 6-A.4 MANNING’S COEFFICIENT Table 6-A.4-1 lists the commonly used Manning’s roughness coefficients used in the analysis of the hydraulic capacity of culverts.
Table 6-A.4-1 Man r Closed Conduits.
ning's Roughness Coefficient, n, fo
Type of Structure n
Concrete Pipe Concrete Box
0.012 0.012
Corrugated Metal Pipe: 2 2/3″ × ½″ (68 × 13 mm) corrugations 3″ × 1″ (75 × 25 mm) corrugations
0.024 0.027
Plastic Pipe: Smooth flow Corrugated
0.009 0.020
6-A.5 DESIGN HEADWATER Design headwater depth is determined by computing headwater depths for both inlet control and outlet control and then using the higher value. 6-A.6 INLET CONTROL A culvert operates with inlet control when the culvert barrel is capable of conveying more flow than the inlet will accept. The flow capacity is controlled at the entrance by the depth of headwater and entrance geometry, including the barrel shape, cross-sectional area and the inlet edge. Figure 6-A.6-1 shows different examples of inlet control. In inlet control, roughness and length of the culvert barrel and outlet conditions (including tailwater) are not factors in determining culvert hydraulic performance. An increase in barrel slope reduces the headwater (HW) to a small degree, and any correction for slope may be neglected for conventional or commonly used culverts.
6(A) – 2
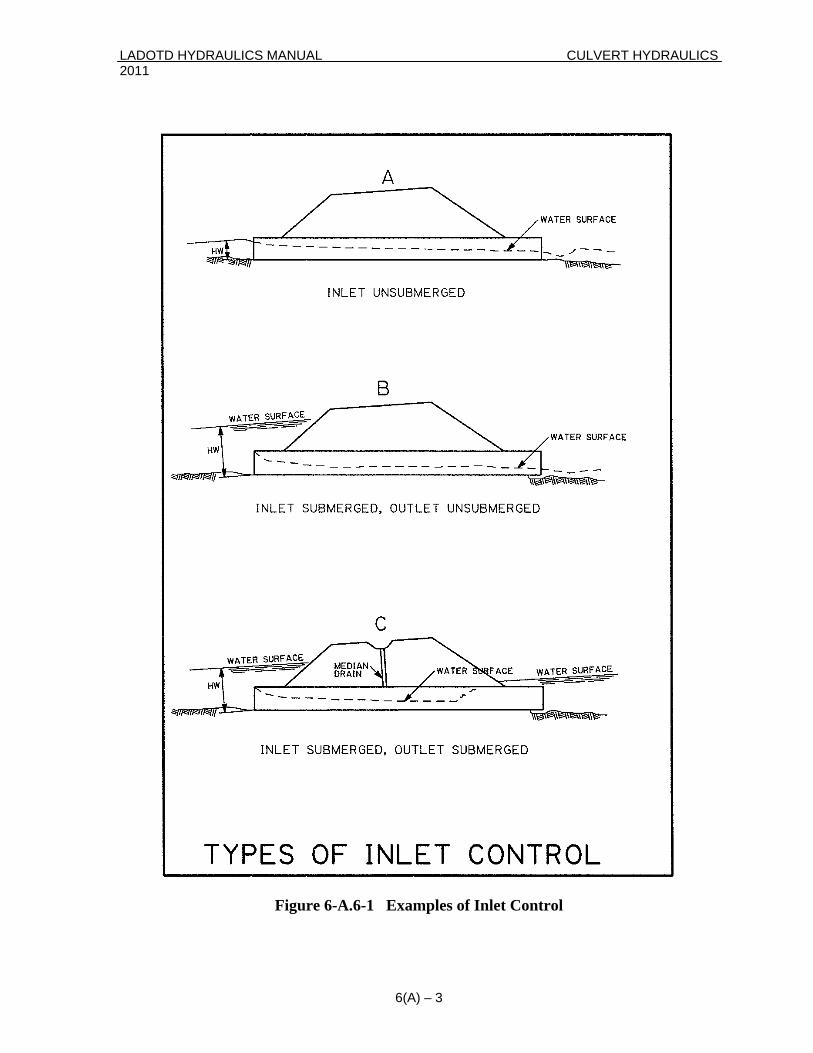
LADOTD HYDRAULICS MANUAL CULVERT HYDRAULICS 2011
Figure 6-A.6-1 Examples of Inlet Control
6(A) – 3
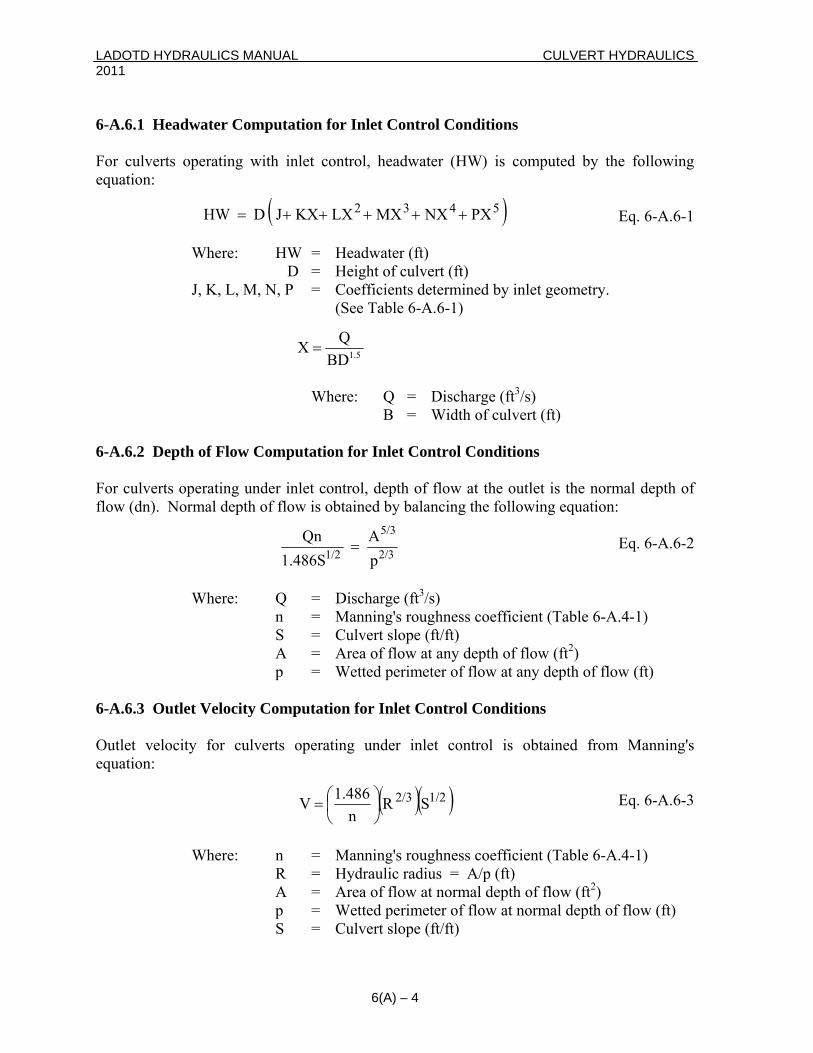
LADOTD HYDRAULICS MANUAL CULVERT HYDRAULICS 2011 6-A.6.1 Headwater Computation for Inlet Control Conditions
-A.6-1
Where: HW = Headwater (ft) lvert (ft) J, K, L, M, N, P = Coefficients determined by inlet geometry. e 6-A.6-1)
rge (ft B = Width of culvert (ft)
6-A.6.2 Depth of Flow Compu et Control Condit
or culverts operating under inlet control, depth of flow at the outlet is the normal depth of ow (dn). Normal depth of flow is obtained by balancing the following equation:
Eq. 6-A.6-2
/s) n = Manning's roughness coefficient (Table 6-A.4-1)
= Culvert slope (ft/ft) = Area of flow at any depth of flow (ft2)
ained from Manning's
Where: n = Manning's roughness coefficient (Table 6-A.4-1) R = Hydraulic radius = A/p (ft) A = Area of flow at normal depth of flow (ft2) p = Wetted perimeter of flow at normal depth of flow (ft)
S = Culvert slope (ft/ft)
For culverts operating with inlet control, headwater (HW) is computed by the following equation:
( ) PXNXMXLXKXJ D HW 5432 +++++=
Eq. 6
D = Height of cu
(See Tabl
Where: Q = Discha 3/s)
1.5BDX =
Q
tation for Inl ions
Ffl
Where: Q = Discharge (ft3
S
A p = Wetted perimeter of flow at any depth of flow (ft) 6-A.6.3 Outlet Velocity Computation for Inlet Control Conditions
utlet velocity for culverts operating under inlet control is obtOequation: Eq. 6-A.6-3
p1.486SA 2/3
5/3
1/2 =Qn
( )( ) SRn
1.486V 1/22/3⎟⎠⎞
⎜⎝⎛=
6(A) – 4
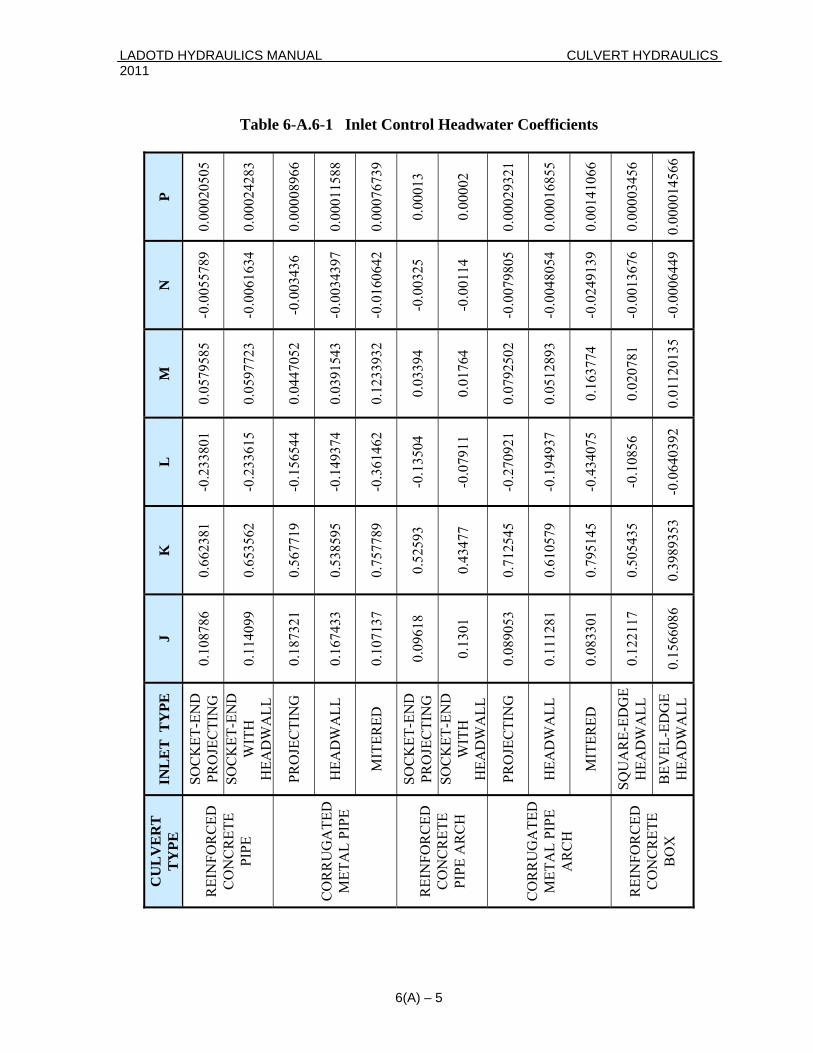
LADOTD HYDRAULICS MANUAL CULVERT HYDRAULICS 2011
Table 6-A.6-1 Inlet Control Headwater Coefficients
P
0.00
0205
05
0.00
0242
83
0.00
0089
66
0.00
0115
88
0.00
0767
39
0.00
013
0.00
002
0.00
0293
21
0.00
0168
55
0.00
1410
66
0.00
0034
56
0.00
0014
566
N
-0.0
0557
89
-0.0
0616
34
-0.0
0343
6
-0.0
0343
97
-0.0
1606
42
-0.0
0325
-0.0
0114
-0.0
0798
05
-0.0
0480
54
-0.0
2491
39
-0.0
0136
76
-0.0
0064
49
M
0.05
7958
5
0.05
9772
3
0.04
4705
2
0.03
9154
3
0.12
3393
2
0.03
394
0.01
764
0.07
9250
2
0.05
1289
3
0.16
3774
0.02
0781
0.01
1201
35
L
-0.2
3380
1
-0.2
3361
5
-0.1
5654
4
-0.1
4937
4
-0.3
6146
2
-0.1
3504
-0.0
7911
-0.2
7092
1
-0.1
9493
7
-0.4
3407
5
-0.1
0856
-0.0
6403
92
K
0.66
2381
0.65
3562
0.56
7719
0.53
8595
0.75
7789
0.52
593
0.43
477
0.71
2545
0.61
0579
0.79
5145
0.50
5435
0.39
8935
3
J
0.10
8786
0.11
4099
0.18
7321
0.16
7433
0.10
7137
0.09
618
0.13
01
0.08
9053
0.11
1281
0.08
3301
0.12
2117
0.15
6608
6
INL
ET
TY
PE
SOC
KET
-EN
D
PRO
JEC
TIN
G
SOC
KET
-EN
D
WIT
H
HEA
DW
ALL
PRO
JEC
TIN
G
HEA
DW
ALL
MIT
ERED
SOC
KET
-EN
D
PRO
JEC
TIN
G
SOC
KET
-EN
D
WIT
H
HEA
DW
ALL
PRO
JEC
TIN
G
HEA
DW
ALL
MIT
ERED
SQU
AR
E-ED
GE
HEA
DW
ALL
B
EVEL
-ED
GE
HEA
DW
ALL
CU
LV
ER
T
TY
PE
REI
NFO
RC
ED
CO
NC
RET
E PI
PE
CO
RR
UG
ATE
D
MET
AL
PIPE
REI
NFO
RC
ED
CO
NC
RET
E PI
PE A
RC
H
CO
RR
UG
ATE
D
MET
AL
PIPE
A
RC
H
REI
NFO
RC
ED
CO
NC
RET
E B
OX
6(A) – 5
LADOTD HYDRAULICS MANUAL CULVERT HYDRAULICS 2011 6-A.7 OUTLET CONTROL Outlet control flow occurs when the culvert barrel is not capable of conveying as much flow as the inlet opening will accept. The control section for outlet control flow in a culvert is
cated at the barrel exit or further downstream. In outlet control, the culvert hydraulic erformance is determined by the following factors: depth of headwater, entranccluding the barrel shape, cross-sectional area and the inlet edge, plus the controlling water
hness of the culvert barrel. A culvert ope o on various combinations of the above factors. Figure 6-A.7-1 shows different examples of outlet control. 6-A.7.1
eadwater depth (HW) for culverts operating under outlet control and flowing full can be
q. 6-A.7-1
Where: HW = Headwater depth (ft) H = Head for full flow (ft) (See Section 6-A.7.2)
ert (ft)
from the
= D when d ≥ D and D > TW 2 > TW
= TW when TW > D or TW > (d +D)/2
Where: TW = Tailwater (ft) D = Height of culvert (ft) dc = Critical depth of flow in cu (See Section 6-A.7.3)
lop e geometry, insurface elevation at the outlet and the slope, length, and roug
rating in outlet contr l may flow full or partly full, depending
Headwater Computation for Outlet Control Conditions
Hdetermined by the following equation: E( ) SL Ho H HW ×−+= L = Length of the culv S = Slope of the culvert (ft/ft) Ho = Distance to the hydraulic grade line
outlet invert (ft) c = (dc+D)/2 when dc < D and (dc+D)/ c
lvert (ft)
6(A) – 6
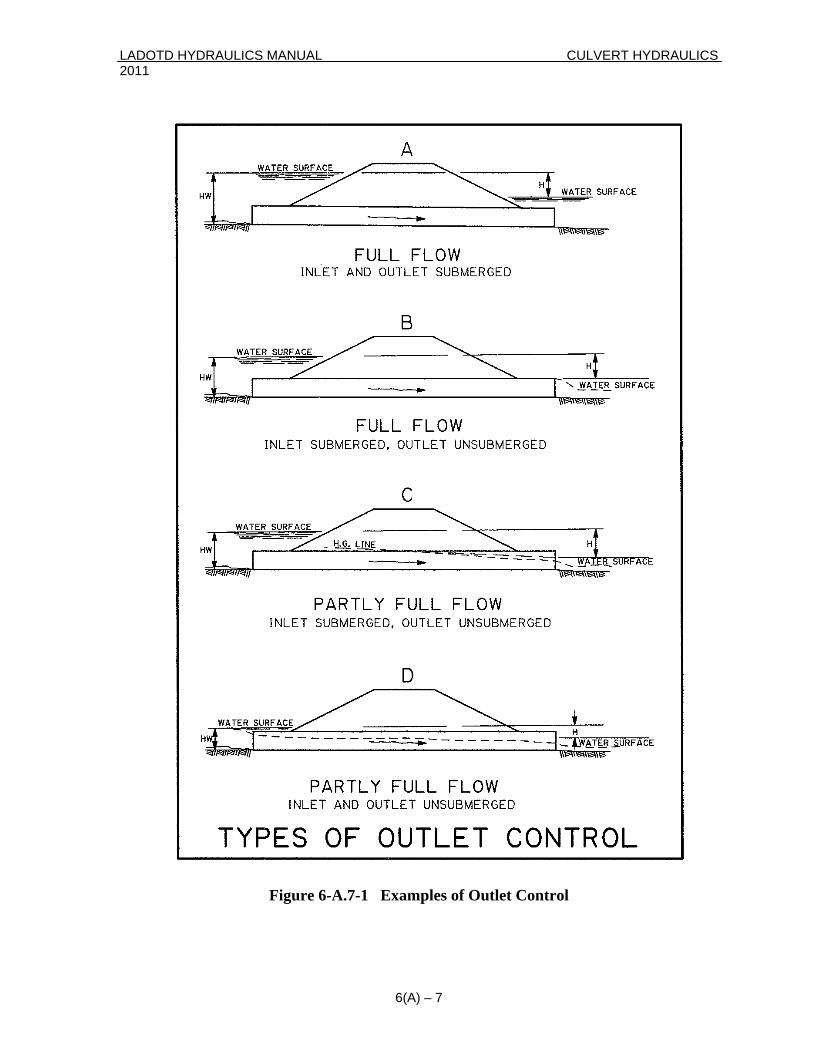
LADOTD HYDRAULICS MANUAL CULVERT HYDRAULICS 2011
Figure 6-A.7-1 Examples of Outlet Control
6(A) – 7
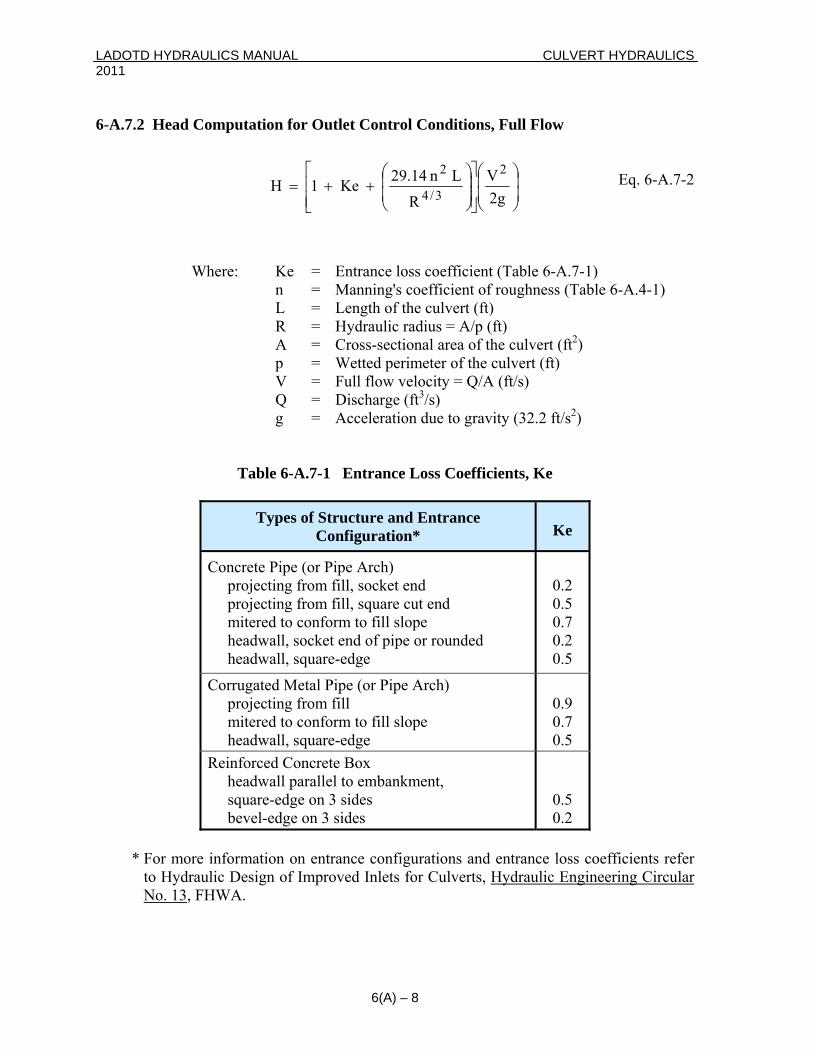
LADOTD HYDRAULICS MANUAL CULVERT HYDRAULICS 2011 6-A.7.2 Head Computation for Outlet Control Conditions, Full Flow
Where: Ke = Entrance loss coefficient (Table 6-A.7-1)
Length of the culvert (ft) R = Hydraulic radius = A/p (ft)
f the culvert (ft2) p = Wetted perimeter of the culvert (ft) V = Full flow velocity = Q/A (ft/s)
g = Acceleration due to gravity (32.2 ft/s2)
Table 6-A.7-1 Entrance Loss Coefficients, Ke
Eq. 6-A.7-2
g2
VR
L n 14.29 Ke 1 H2
3/4
2
⎟⎟⎠
⎞⎜⎜⎝
⎛
⎥⎥⎦
⎤
⎢⎢⎣
⎡
⎟⎟⎠
⎞⎜⎜⎝
⎛++=
n = Manning's coefficient of roughness (Table 6-A.4-1) L = A = Cross-sectional area o Q = Discharge (ft3/s)
Types of Structure and Entrance
Ke Configuration*
Concrete Pipe (or Pipe Arch) project from f project from f mitered co headwall, socket end of pipe or rounded headwa
0.5 0.7 0.2
ing ill, socket end 0.2 ing ill, square cut end to nform to fill slope
ll, square-edge 0.5 Corrugated Metal Pipe (or Pipe Arch) pro ing from fill mi to co or
0.9 jecttered
headwa , sq e
nf m to fill slope ll uar -edge
0.7 0.5
Reinforced Concrete Box headwall parallel to embankm
ent,
squ on 3 side be n 3 sides
0.5 0.2
are-edge s vel-edge o
* For more information on entrance configurations and entrance loss coefficients refer
to Hydraulic Design of Improved Inlets for Culverts, Hydraulic Engineering Circular No. 13, FHWA.
6(A) – 8
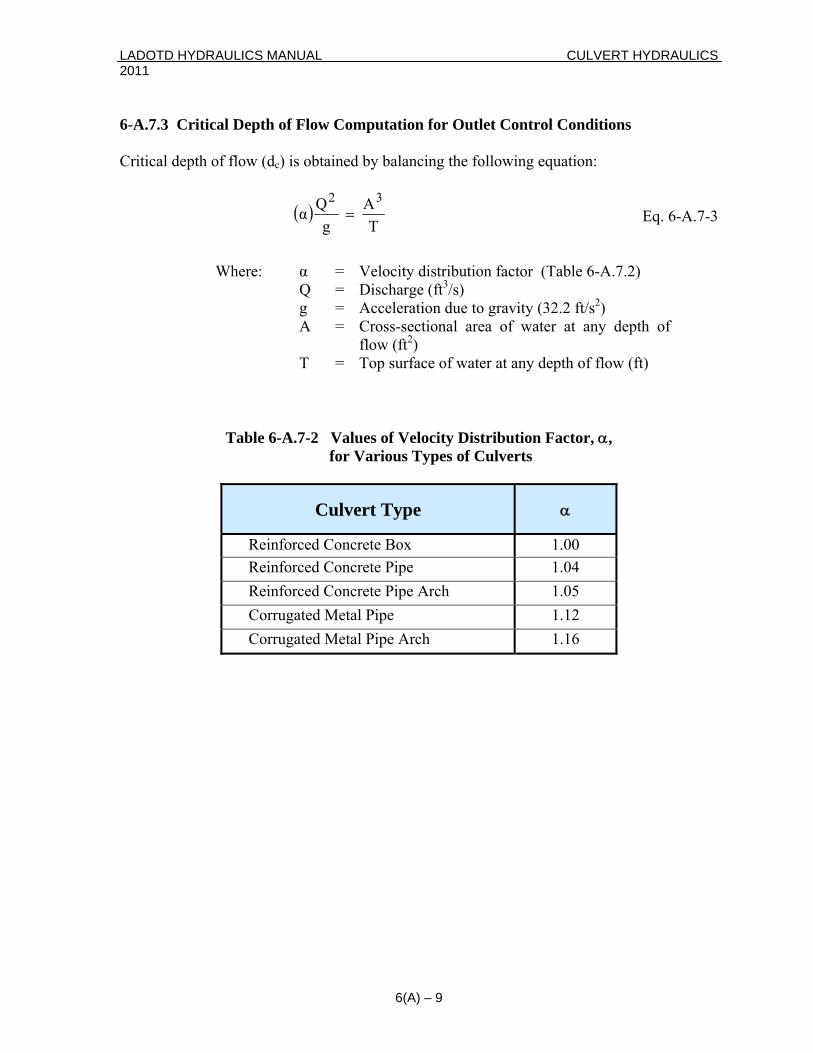
LADOTD HYDRAULICS MANUAL CULVERT HYDRAULICS 2011 6-A.7.3 Critical Depth of Flow Computation for Outlet Control Conditions
ritical depth of flow (dc) is obtained by balancing the following equation:
Eq. 6-A.7-3
Where: α = Velocity distribution factor (Table 6-A.7.2) Q = Discharge (ft3/s) g = Acceleration due to gravity (32.2 ft/s2) A = Cross-sectional area of water at any depth of
flow (ft2) T = Top surface of water at any depth of flow (ft)
Table 6-A.7-2 Values of Velocity Distribution Factor, α, for Various Types of Culverts
C
( )
TA
gQα
32=
Culvert Type α
Reinforced Concrete Box 1.00 Reinforced Concrete Pipe 1.04 Reinforced Concrete Pipe Arch 1.05 Corrugated Metal Pipe 1.12 Corrugated Metal Pipe Arch 1.16
6(A) – 9
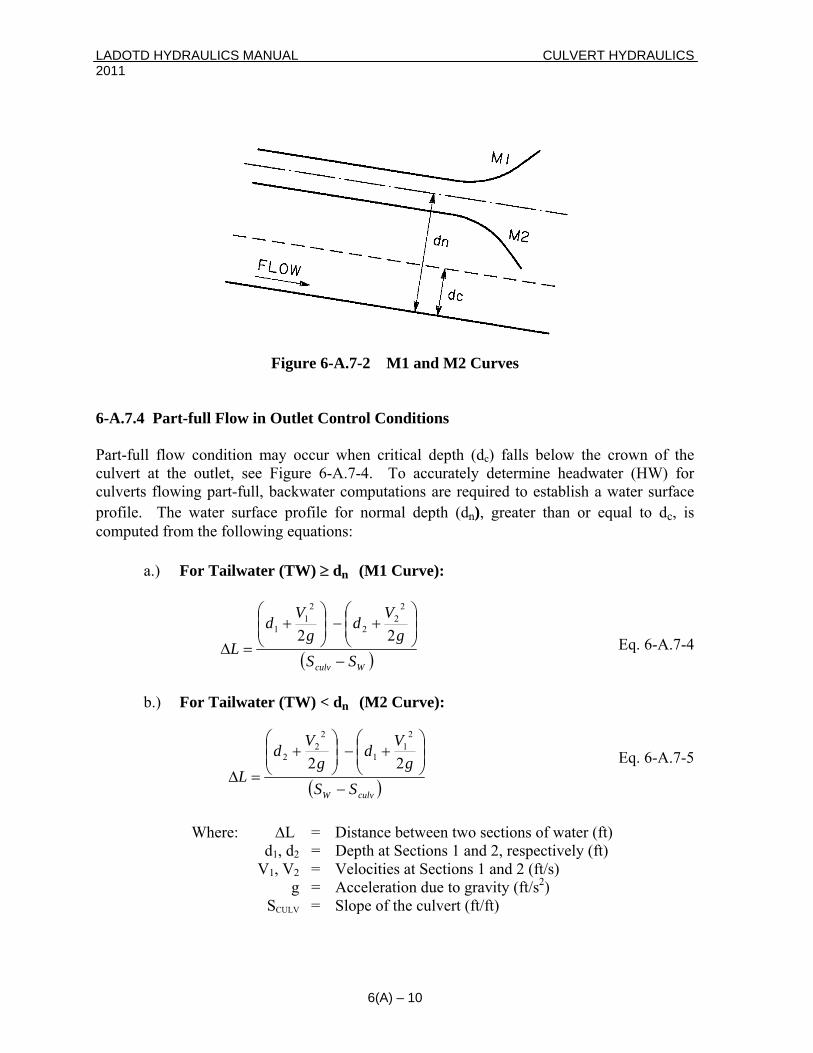
LADOTD HYDRAULICS MANUAL CULVERT HYDRAULICS 2011
F ur -
-A.7.4 Part- ll Flow in Outlet Co
art-full flow condition may occur when critical depth (dc) falls below the crown of the culvert at the outlet, eadwater (HW) for ulverts flowing part-full, backwater computations are required to establish a water surface
profile. The water surf greater tha or equal to dc, is computed from the following equa a.) For urve): Eq. 6-A.7-4 b.) For (M2 Curve): Eq. 6-A.7-5
Where: ΔL = Distance between two sections of water (ft)
SCULV = Slope of the culvert (ft/ft)
ig e 6 A.7-2 M1 and M2 Curves 6 fu ntrol Conditions P
see Figure 6-A.7-4. To accurately determine hc
ace profile for normal depth (dn), ntions:
Tailwater (TW) ≥ dn (M1 C
Tailwater (TW) < dn
( ) 22 21
gg ⎟⎠
⎜⎝
⎟⎠
⎜⎝
22 ⎞⎛⎞⎛ 21 Vd Vd ⎟⎜ +−⎟⎜ +
SSL
Wculv −=Δ
( ) L−
⎠=Δ2
1
gV
⎟⎟⎞
+2 12 g ⎜
⎝⎟⎠
⎜⎝
222 d Vd ⎜
⎛−⎟
⎞⎜⎛
+
SS culvW
d1, d2 = Depth at Sections 1 and 2, respectively (ft) V1, V2 = Velocities at Sections 1 and 2 (ft/s)
g = Acceleration due to gravity (ft/s2)
6(A) – 10
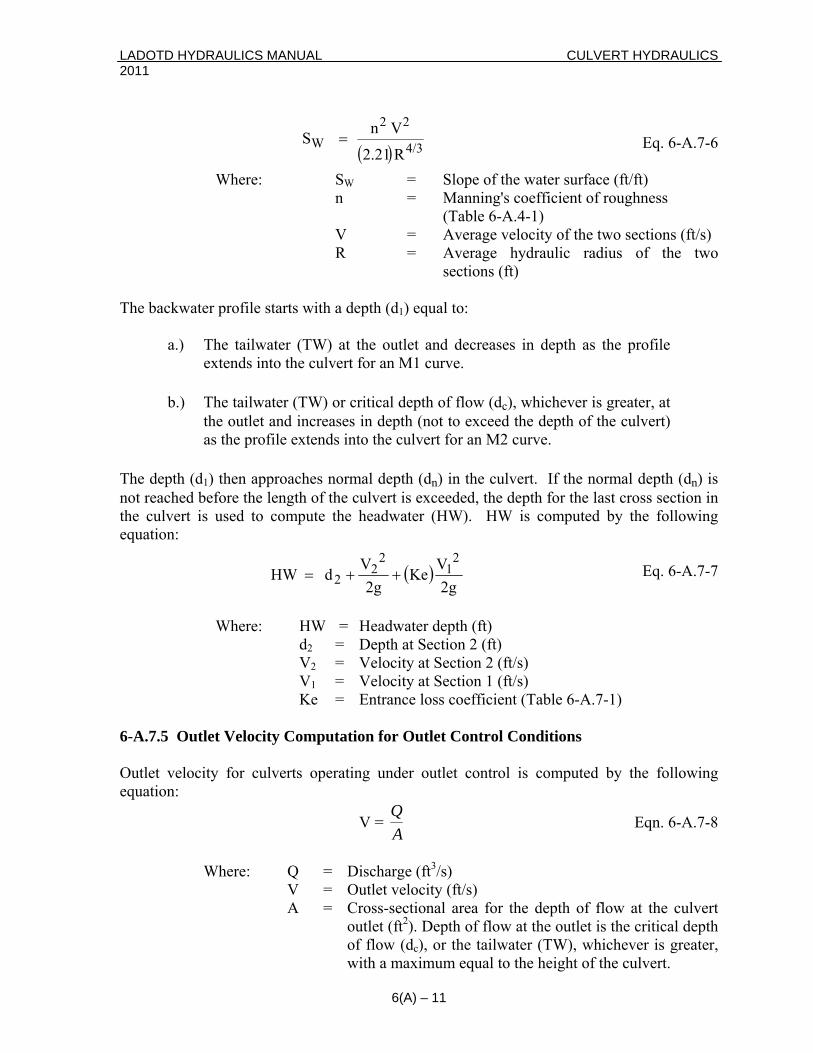
LADOTD HYDRAULICS MANUAL CULVERT HYDRAULICS 2011
Eq. 6-A.7-6
Where: SW = Slope of the water surface (ft/ft) n = Manning's coefficient of roughness (Table 6-A.4-1) V = Average velocity of the two sections (ft/s)
R = Average hydraulic radius of the two
he ba water rofile starts with a de
a.) The tailwater (TW) at t and decreases in depth as the profile
b.) The tailwater (TW) or critical depth of flow (dc), whichever is greater, at the outlet and increases in depth (not to exceed the depth of the culvert) as
he depth (d1) then approaches normal depth (dn) in the culvert. If the normal depth (dn) is
not reached before the length ceeded, the depth fo e last cross section in the culvert is used to compu (HW). HW is com ted by the following equation: Eq. 6-A.7-7 W epth (ft) tion 2 (ft)
V2 = Velocity at Section 2 (ft/s) V1 = Velocity at Section 1 (ft/s) Ke = Entrance loss coefficient (Table 6-A.7-1)
-A.7.5 Outlet Velocity Computation for Outlet Control Conditions
utlet velocity for culverts operating under outlet control is computed by the following quation:
V =
sections (ft) T ck p pth (d1) equal to:
he outlet extends into the culvert for an M1 curve.
the profile extends into the culvert for an M2 curve.
Tof the culvert is exte the headwater
r thpu
here: HW = Headwater dd2 = Depth at Sec
6 Oe
AQ
Eqn. 6-A.7-8
Where: Q = Discharge (ft3/s) V = Outlet velocity (ft/s)
A = Cross-sectional area for the depth of flow at the culvert outlet (ft2). Depth of flow at the outlet is the critical depth of flow (dc), or the tailwater (TW), whichever is greater, with a maximum equal to the height of the culvert.
( ) V n S
22=W
R 2.21 4/3
( )g2g22
Ve
21K
Vd HW
22 ++=
6(A) – 11
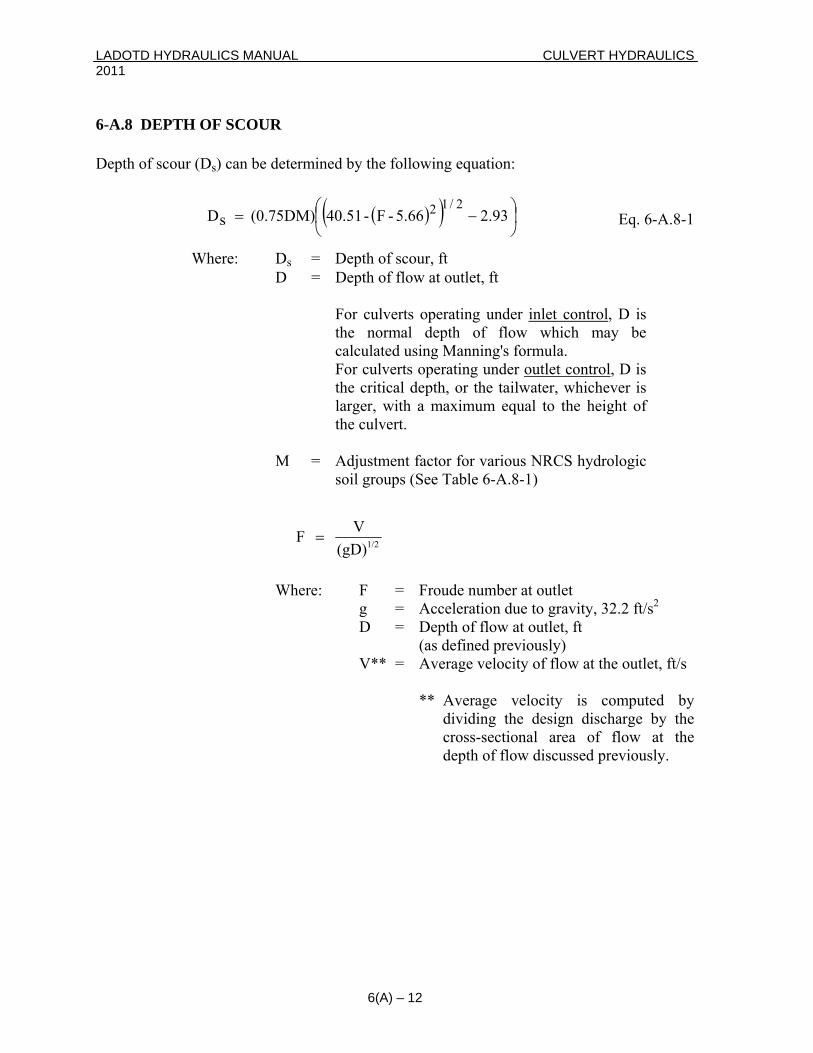
LADOTD HYDRAULICS MANUAL CULVERT HYDRAULICS 2011 6-A.8 DEPTH OF SCOUR
epth of scour (Ds) can be determined by the following equation:
Eq. 6-A.8-1
Where: Ds = Depth of scour, ft D = Depth of flow at outlet, ft
For culverts operating under inlet control
D
( )( ) 93.25.66 - F - 40.51(0.75DM) sD
2/12 ⎟⎠⎞
⎜⎝⎛ −=
, D is
the normal depth of flow which may be mula. calculated using Manning's for
For culverts operating under outlet control, D is the critical depth, or the tailwater, whichever is
imum equal to the height of
Where: F = Froude number at outlet g = Acceleration due to gravity, 32.2 ft/s2 D = Depth of flow at outlet, ft
(as defined previously) V** = Average velocity of flow at the outlet, ft/s
verage velocity is computed by dividing the design discharge by the cross-sectional area of flow at the depth of flow discussed pre
larger, with a maxthe culvert.
M = Adjustment factor for various NRCS hydrologic
soil groups (See Table 6-A.8-1)
1/2(gD)V F =
** A
viously.
6(A) – 12
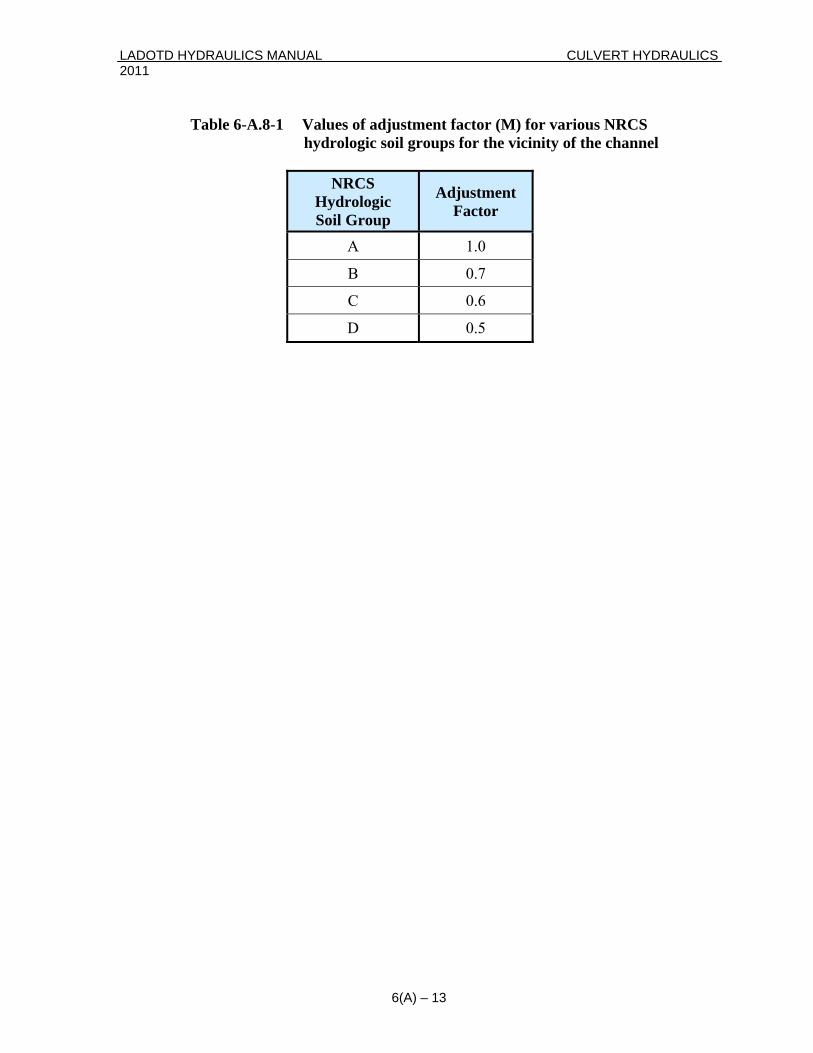
LADOTD HYDRAULICS MANUAL CULVERT HYDRAULICS 2011
Table 6-A.8-1 Values of adjustment factor (M) for various NRCS hydrologic soil groups for the vicinity of the channel
NRCS Adjustment Hydrologic Factor So il Group
A 1.0
B 0.7
C 0.6
D 0.5
6(A) – 13

LADOTD HYDRAULICS MANUAL CULVERT HYDRAULICS 2011
6(A) – 14
This page intentionally left blank.
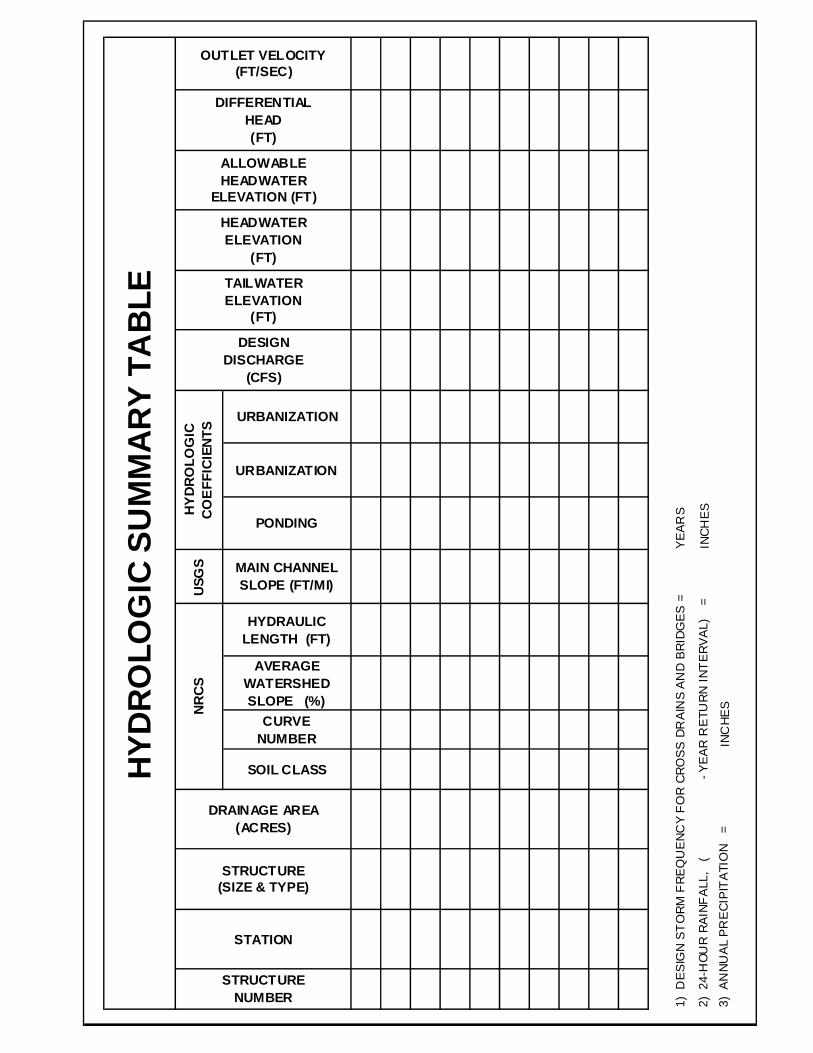
URBANIZATION
URBANIZATION
PONDING
YEAR
S
INCH
ES
USG
S MAIN CHANNELSLOPE (FT/MI)
HYDRAULICLENGTH (FT)
AVERAGEWATERSHEDSLOPE (%)
CURVENUMBER
SOIL CLASSHYD
RO
LOG
IC S
UM
MA
RY
BLE
INC
HES
STRUCTURENUMBER
STATION
STRUCTURE(SIZE & TYPE)
DRAINAGE AREA(ACRES)
TAILWATERELEVATION
(FT)
DESIGNDISCHARGE
(CFS)
HY
DR
OLO
GIC
CO
EFF
ICIE
NTS
NR
CS
- Y
EAR
RE
TUR
N IN
TER
VAL)
=
1) D
ESI
GN
ST
ORM
FRE
QU
ENC
Y FO
R CR
OSS
DR
AIN
S A
ND
BRID
GES
=
3) A
NNU
AL
PRE
CIPI
TATI
ON
=
2) 2
4-H
OUR
RAIN
FAL
L,
(
OUTLET VELOCITY(FT/SEC)
DIFFERENTIAL
ALLOWABLEHEADWATER
ELEVATION (FT
HEADWATERELEVATION
(FT)
HEAD(FT)
TA
)

This page intentionally left blank.

LADOTD HYDRAULICS MANUAL SIDE AND MEDIAN DRAINS 2011
CHAPTER 7 SIDE AND MEDIAN DRAINS
7.1 PURPOSE This chapter presents standards and procedures for the hydraulic design of side drains and median drains carrying low flow. 7.1.1 Exceptions There will be situations where the side drain or median drain functions more as a cross drain culvert or times when the discharge from a cross drain goes into a roadside ditch and through a side drain before reaching the outfall. In those situations, the methods in this chapter do not apply. The procedures and policy for design of a cross drain culvert as outlined in Chapter 6 should then be followed. 7.2 DESIGN STORM FREQUENCY Chapter 1 describes the LADOTD criteria for design frequency. 7.3 PEAK DISCHARGE The methods for determining peak discharge are described in Chapter 3. 7.4 CULVERT SELECTION Conventional culverts include those commonly installed, such as circular pipes: reinforced concrete pipe (RCP), plastic pipe (PP) and corrugated metal pipe (CMP); arch pipes: reinforced concrete pipe arch (RCPA) and corrugated metal pipe arch (CMPA); and reinforced concrete box culverts (RCB). All such conventional culverts have a uniform barrel cross section throughout. Whenever possible, the selected culvert should be the most economical alternative which meets the hydraulic, structural, and service life requirements. Generally, a single line of pipe is less expensive than double or multiple lines of smaller pipe; round pipe is less expensive than pipe arch.
7 – 1
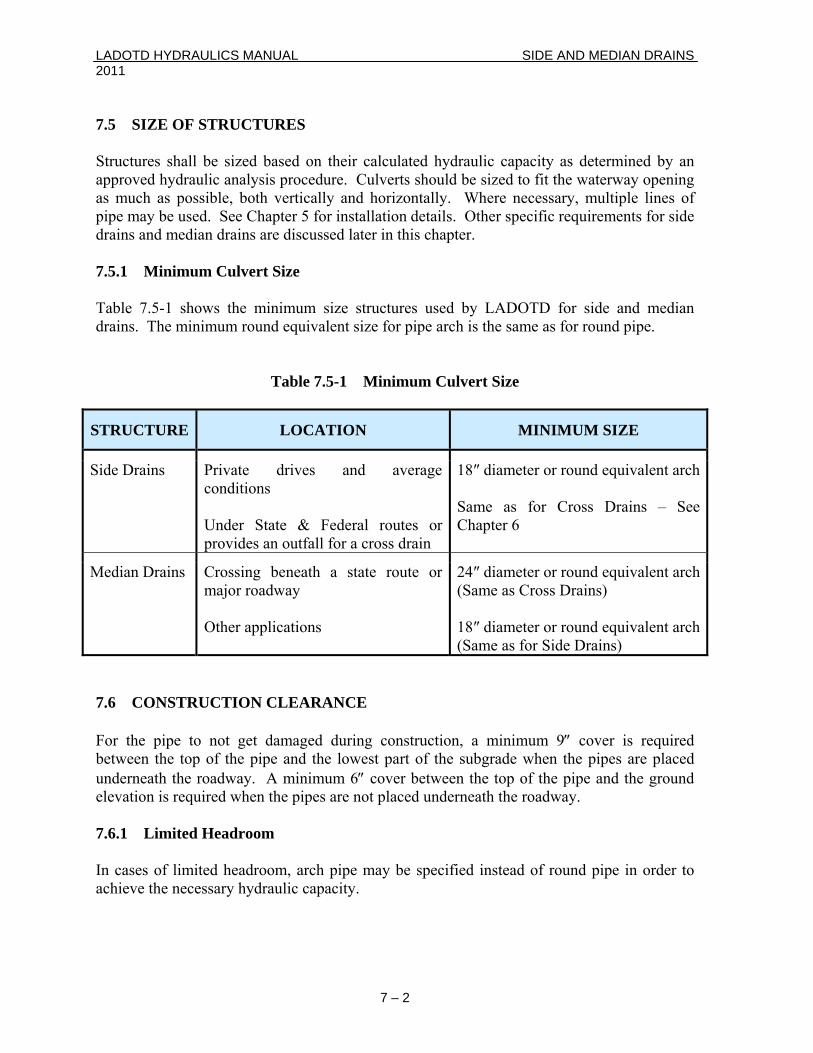
LADOTD HYDRAULICS MANUAL SIDE AND MEDIAN DRAINS 2011 7.5 SIZE OF STRUCTURES Structures shall be sized based on their calculated hydraulic capacity as determined by an approved hydraulic analysis procedure. Culverts should be sized to fit the waterway opening as much as possible, both vertically and horizontally. Where necessary, multiple lines of pipe may be used. See Chapter 5 for installation details. Other specific requirements for side drains and median drains are discussed later in this chapter. 7.5.1 Minimum Culvert Size Table 7.5-1 shows the minimum size structures used by LADOTD for side and median drains. The minimum round equivalent size for pipe arch is the same as for round pipe.
Table 7.5-1 Minimum Culvert Size
STRUCTURE LOCATION MINIMUM SIZE
Side Drains Private drives and average conditions Under State & Federal routes or provides an outfall for a cross drain
18″ diameter or round equivalent arch Same as for Cross Drains – See Chapter 6
Median Drains Crossing beneath a state route or major roadway Other applications
24″ diameter or round equivalent arch (Same as Cross Drains) 18″ diameter or round equivalent arch (Same as for Side Drains)
7.6 CONSTRUCTION CLEARANCE For the pipe to not get damaged during construction, a minimum 9″ cover is required between the top of the pipe and the lowest part of the subgrade when the pipes are placed underneath the roadway. A minimum 6″ cover between the top of the pipe and the ground elevation is required when the pipes are not placed underneath the roadway. 7.6.1 Limited Headroom In cases of limited headroom, arch pipe may be specified instead of round pipe in order to achieve the necessary hydraulic capacity.
7 – 2
LADOTD HYDRAULICS MANUAL SIDE AND MEDIAN DRAINS 2011 7.7 SIZING PIPES FOR ALTERNATE MATERIALS Side drains and median drains usually carry such low flows that it is not necessary to specify different diameters between different pipe materials. 7.7.1 Flow Line (FL) Flow line (invert) is defined as the elevation of the bottom of the inside of a culvert. Invert elevations will usually be the same for all alternates. 7.8 SIDE DRAINS When an entrance to adjacent property crosses the roadside channel, a drainage structure and driveway or a "dry" ramp (ramp without a drainage structure) will be required. The type of drainage structure required is usually a Side Drain, although Side Drain Arch or multiple lines of pipe may be specified where headroom is a problem. For ramps in fill (where the ramp elevation at the right-of-way line is lower than at the shoulder), the grade of the ramp between the shoulder and the side drain structure may be 0.00% if necessary to obtain sufficient cover. The ramp grade (in fill) should never be "humped" or sloped to the shoulder in order to achieve sufficient cover. 7.8.1 Size Determination Table 7.8-1 is used to determine the required diameter of a Side Drain (Arch) for a 5 year return interval only. The drainage area in Table 7.8-1 is in acres and the 24-hour rainfall storm is rounded to the nearest inch. The terrain classification for the general area of the side drain is based on the roadway centerline grades as follows:
a.) Flat - centerline grades average between 0.00% and 0.50%.
b.) Rolling - centerline grades average between 0.51% and 1.50%. c.) Hilly - centerline grades greater than 1.50%
7 – 3
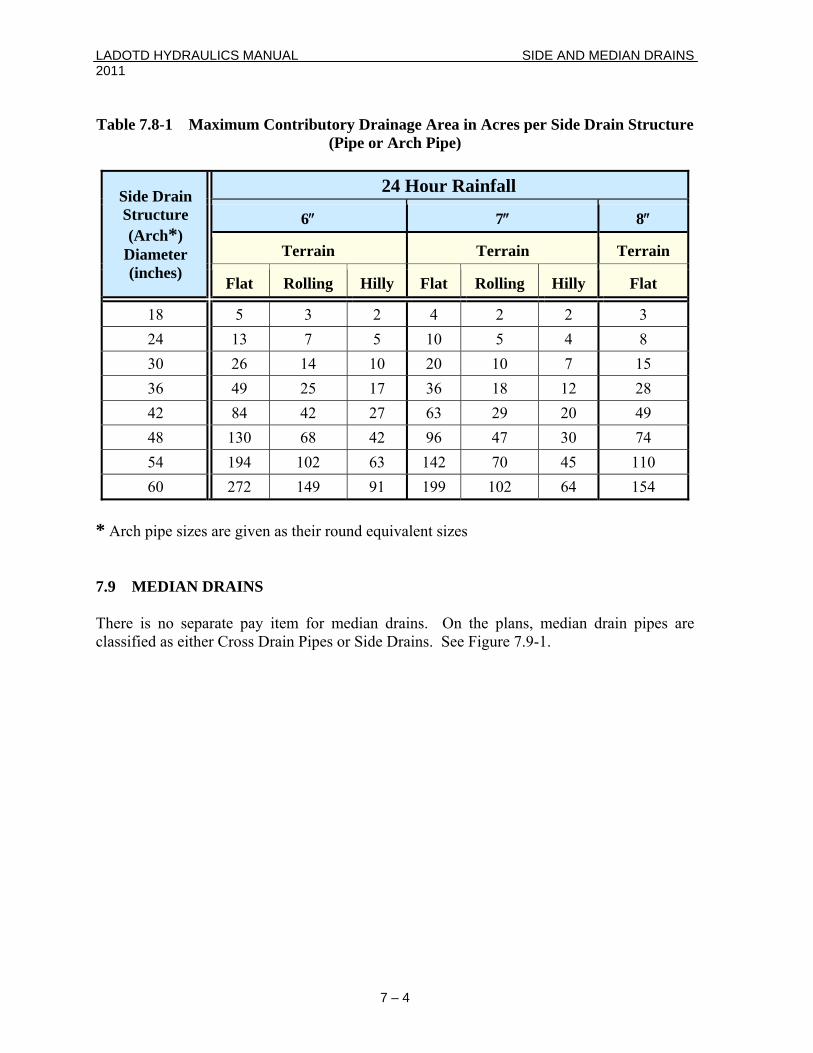
LADOTD HYDRAULICS MANUAL SIDE AND MEDIAN DRAINS 2011 Table 7.8-1 Maximum Contributory Drainage Area in Acres per Side Drain Structure
(Pipe or Arch Pipe)
Side Drain Structure (Arch*)
Diameter (inches)
24 Hour Rainfall
6″ 7″ 8″
Terrain Terrain Terrain
Flat Rolling Hilly Flat Rolling Hilly Flat
18 5 3 2 4 2 2 3 24 13 7 5 10 5 4 8 30 26 14 10 20 10 7 15 36 49 25 17 36 18 12 28 42 84 42 27 63 29 20 49 48 130 68 42 96 47 30 74 54 194 102 63 142 70 45 110 60 272 149 91 199 102 64 154
* Arch pipe sizes are given as their round equivalent sizes
7.9 MEDIAN DRAINS There is no separate pay item for median drains. On the plans, median drain pipes are classified as either Cross Drain Pipes or Side Drains. See Figure 7.9-1.
7 – 4
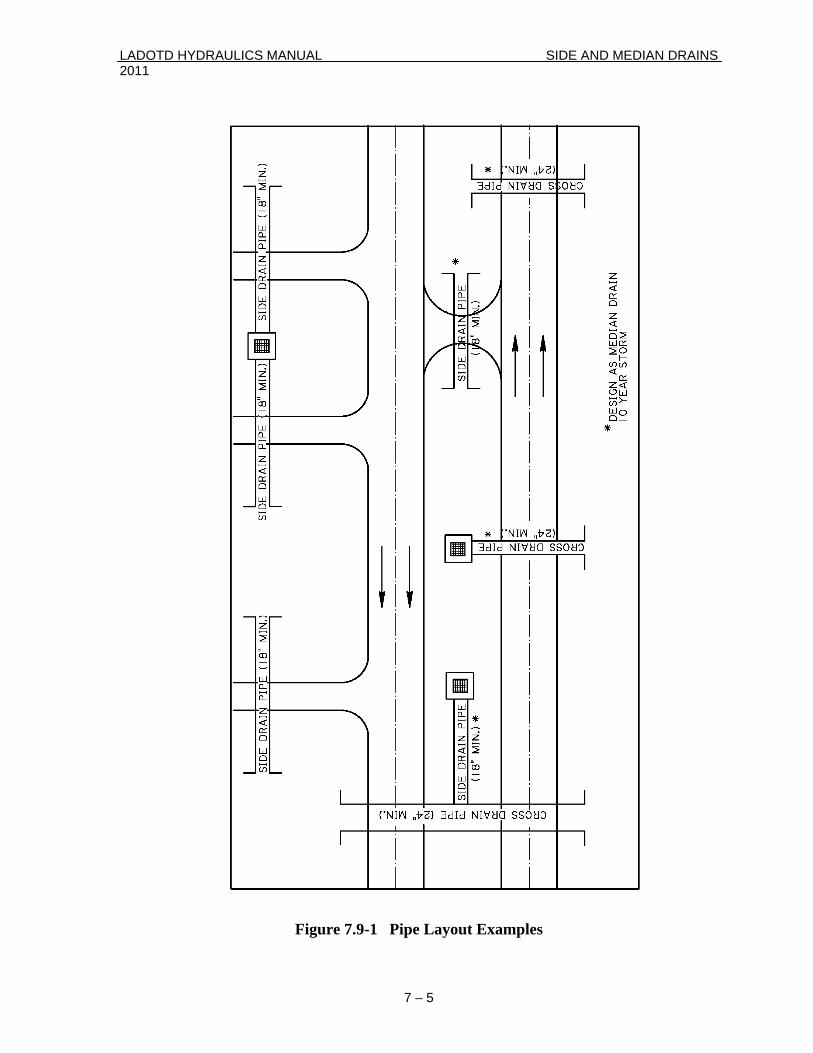
LADOTD HYDRAULICS MANUAL SIDE AND MEDIAN DRAINS 2011
Figure 7.9-1 Pipe Layout Examples
7 – 5
LADOTD HYDRAULICS MANUAL SIDE AND MEDIAN DRAINS 2011 7.9.1 Hydraulic Clearances Calculated depth of ponding or the hydraulic gradient, whichever is greater, should be one foot below the lowest part of the finish grade. In situations where a grate inlet is not used, the computed headwater should be one foot below the lowest part of the finish grade. 7.9.2 Ponding When a grate inlet is used, or there will be a sag, the depth of ponding should be calculated according to the procedure described in Chapter 8 – Part A, Grate Inlets. 7.10 LENGTH OF CULVERTS Lengths of all pipe and pipe arch culverts will be specified in multiples of 2 ft. Lengths of all reinforced concrete box culverts are rounded off to the whole foot. The barrel length of a box culvert is measured from inside to inside of the headwall. 7.10.1 Side Drain Lengths Figure 7.10-1 describes the procedure to determine the length of Side Drain pipes and also shows the typical detail and grading section for a residential driveway.
7 – 6
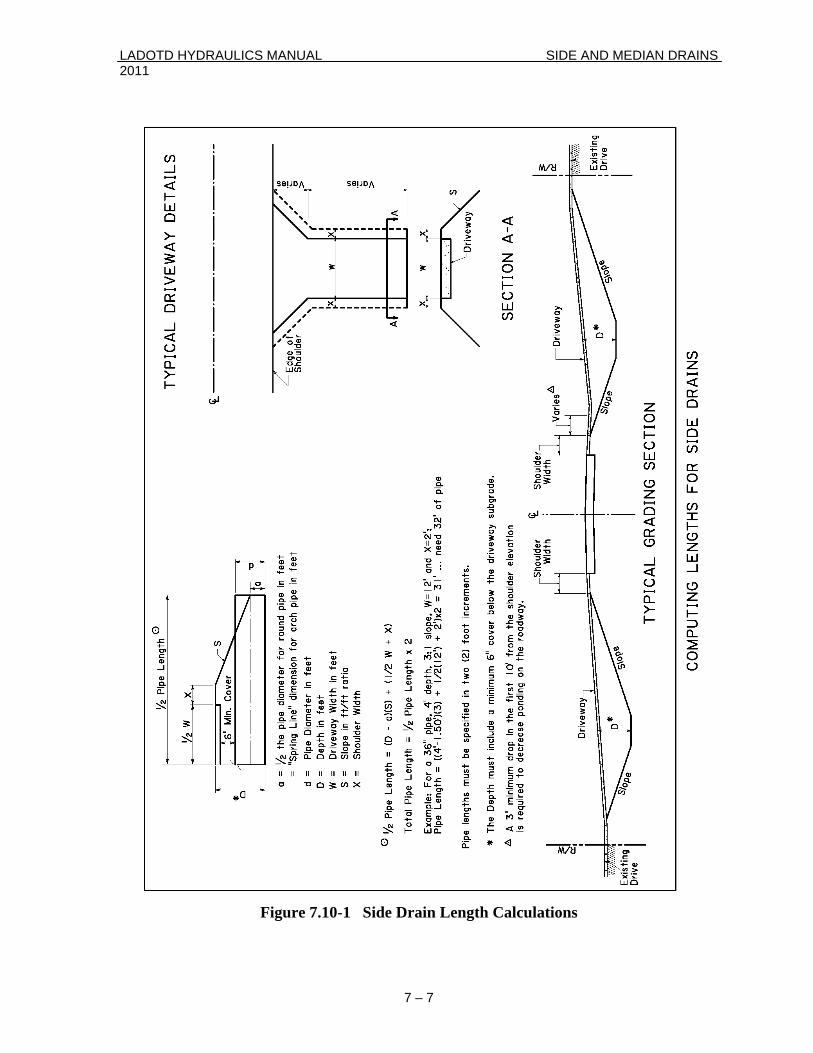
LADOTD HYDRAULICS MANUAL SIDE AND MEDIAN DRAINS 2011
Figure 7.10-1 Side Drain Length Calculations
7 – 7

LADOTD HYDRAULICS MANUAL SIDE AND MEDIAN DRAINS 2011
7 – 8
This page intentionally left blank.

LADOTD HYDRAULICS MANUAL GRATE AND CURB INLETS 2011
CHAPTER 8 STORM DRAIN SYSTEMS
8.1 PURPOSE A storm drain system consists of curb and gutter drainage that is used for collecting storm water runoff from LADOTD highways and adjacent properties in urban sections and directing that water into a natural stream. The main purpose of storm drain systems is to prevent flooding of streets and highways during the storm by quickly and efficiently transferring rainwater into an outfall. This chapter presents the procedures and guidelines for designing such systems. 8.2 POLLUTION PREVENTION Storm drain systems are for clean rainwater only. The Environmental Protection Agency (EPA) requires cities, through National Pollutant Discharge Elimination System (NPDES) permits, to monitor the quality of water that flows from storm drain systems into the waterways. 8.3 DESIGN STORM FREQUENCY Chapter 1 describes the LADOTD criteria for design frequency. 8.3.1 Design Waivers If unusual conditions warrant, a “design waiver” to use a different frequency will be required. (See Chapter 1) 8.3.2 Lower Service Class Streets For lower service class streets, if the 10 year design cannot be met, or creates significant design burden, the design may be amended to a 5 year or 2 year storm, with the concurrence of the Chief Design Engineer. 8.3.3 Lateral Ditches & Cross Drain Culverts If there are any lateral ditches or other storm drainage structures intersecting the project, which are currently picked up in the existing highway system, their discharge will have to be picked up in the new system. When such laterals cross the centerline of the project and a cross drain must be provided, the structure shall be designed in accordance with the methods described in Chapter 6, Cross Drain Culverts. Structures conveying water from catch basins
8 – 1
LADOTD HYDRAULICS MANUAL GRATE AND CURB INLETS 2011 to trunk lines on the opposite side of the roadway are not considered as cross drains and will be designed as part of the storm drain system by methods described here. 8.4 PEAK DISCHARGE The methods for determining peak discharge are described in Chapter 3. 8.5 ROADWAY GRADE Details on roadway grade design are presented in Chapter 1. 8.5.1 Minimum Cross Slope A minimum cross slope of 0.025 ft/ft shall be used. 8.5.2 Minimum Longitudinal Grade A minimum longitudinal grade of 0.0040 ft/ft shall be maintained. 8.6 BASIC DESIGN CONCEPTS Runoff from areas draining toward the highway pavement should be intercepted by roadside channels where practical, or inlets where open channels cannot be used. This applies to drainage from side streets and other areas alongside the pavement. The drainage should be intercepted before it reaches the highway pavement. The design of storm drain systems consist of two phases. The first phase deals with removal of water from the roadway and involves the spacing and locating of the catch basin inlets. The second phase involves designing the conduit or pipe system to carry this water to an outfall. A storm drain system is designed to receive all the pavement runoff, any rainfall falling in the highway right-of-way, plus any overland flow from adjacent properties while keeping the natural flow patterns of the land. 8.6.1 Preliminary Investigation Before beginning the design of a storm drain system, the designer should be familiar with the:
• project site • history of past floods • effects of floods on the properties near the highway • effects of floods on the existing drain systems • natural outfalls near the project
8 – 2
LADOTD HYDRAULICS MANUAL GRATE AND CURB INLETS 2011 8.7 OUTFALLS It is LADOTD policy in urban areas to only improve outfalls to the right-of-way line. The local governing authority will be responsible for the construction and maintenance of any improvements beyond the right-of-way, and they should be notified. Outfalls should only be modified if absolutely necessary for the proper functioning of a subsurface drainage system. If modifications are necessary and performed by parties other than LADOTD or its contractor, particular attention will be given to agreements made. These agreements will be brought to the attention of the Hydraulics Unit and will be noted on the plans. This drainage work will also be covered in any environmental assessment written for the project. 8.7.1 Outfall Pipe For Storm Drain Pipe (Outfall) materials, refer to EDSM II.2.1.1. 8.8 SPACING AND LOCATION OF INLETS It is good engineering practice and LADOTD policy to design inlet spacing so that water is removed from the roadway at a rate that prevents the roadway from becoming unusable or unduly hazardous during a storm of design recurrence interval. 8.8.1 Maximum Inlet Spacing A maximum spacing of 200 ft is to be used between inlets or between a high point in grade and an inlet. 8.8.2 Maximum Width of Flooding The primary design control for spacing of inlets is the width of flooding of the travel lane. It is the general policy of LADOTD that the system be designed so that at least one half (½) of the outer travel lane remains free of inundation during the design storm. This should not be deviated from without first consulting with the Hydraulics Unit. 8.8.3 Width of Flooding Reduction To reduce the width of flooding, inlets may be spaced closer together. Other means to reduce the limits of flooding include: intercepting water behind the curb, providing a gutter section with greater conveyance capacity, etc.
8 – 3
LADOTD HYDRAULICS MANUAL GRATE AND CURB INLETS 2011 8.8.4 Width of Flooding for Interstates Width of flooding criteria for interstate systems may be more prohibitive, and should be evaluated on a case-by-case basis with LADOTD's Hydraulics Unit. 8.8.5 Geometric Controls Pavement drainage inlet locations are often established by geometric features rather than by spread of water on the pavement and inlet spacing capacity. In general, inlets should be placed: a.) At all low points in the gutter grade b.) Upstream of street intersections c.) On both sides of street intersections where water would flow towards the
project (water will not be carried across intersections in valley gutters) d.) Upstream of driveways, where practical e.) On side street at intersections where drainage would flow on to the
highway pavement. f.) Upgrade of bridges to prevent pavement drainage from flowing on to
bridge decks g.) Downgrade of bridges to intercept drainage from the bridge h.) On low side of super elevated curves i.) Crossover points in super elevation transitions j.) Behind curb, shoulder, or sidewalk to drain low spots. 8.9 CATCH BASIN TYPES LADOTD uses three types of drainage inlets: A.) Open Top – water enters through a grate located in the top of the catch
basin. B.) Curb-opening – water enters through an opening in the curb face. C.) Combination – a combination catch basin has both a curb-opening inlet
and a grate opening in the pavement to catch water. A guide to selection of catch basins is provided in Table 8.9-1 for inlets used by LADOTD. If an inlet of another type is to be used for roadway drainage, LADOTD's Hydraulics Unit should be consulted. See Part A of this chapter for more information on determining the capacity of LADOTD’s catch basins.
8 – 4
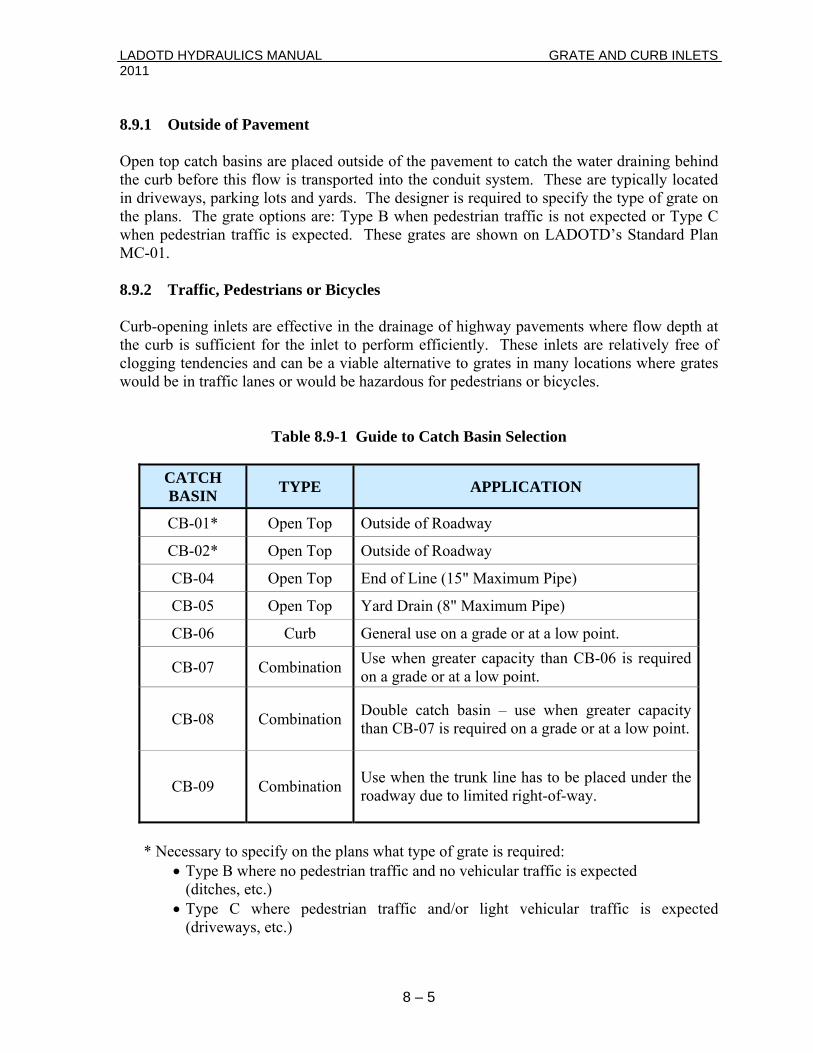
LADOTD HYDRAULICS MANUAL GRATE AND CURB INLETS 2011 8.9.1 Outside of Pavement Open top catch basins are placed outside of the pavement to catch the water draining behind the curb before this flow is transported into the conduit system. These are typically located in driveways, parking lots and yards. The designer is required to specify the type of grate on the plans. The grate options are: Type B when pedestrian traffic is not expected or Type C when pedestrian traffic is expected. These grates are shown on LADOTD’s Standard Plan MC-01. 8.9.2 Traffic, Pedestrians or Bicycles Curb-opening inlets are effective in the drainage of highway pavements where flow depth at the curb is sufficient for the inlet to perform efficiently. These inlets are relatively free of clogging tendencies and can be a viable alternative to grates in many locations where grates would be in traffic lanes or would be hazardous for pedestrians or bicycles.
Table 8.9-1 Guide to Catch Basin Selection
CATCH BASIN TYPE APPLICATION
CB-01* Open Top Outside of Roadway
CB-02* Open Top Outside of Roadway
CB-04 Open Top End of Line (15" Maximum Pipe)
CB-05 Open Top Yard Drain (8" Maximum Pipe)
CB-06 Curb General use on a grade or at a low point.
CB-07 Combination Use when greater capacity than CB-06 is required on a grade or at a low point.
CB-08 Combination Double catch basin – use when greater capacity than CB-07 is required on a grade or at a low point.
CB-09 Combination Use when the trunk line has to be placed under the roadway due to limited right-of-way.
* Necessary to specify on the plans what type of grate is required:
• Type B where no pedestrian traffic and no vehicular traffic is expected (ditches, etc.)
• Type C where pedestrian traffic and/or light vehicular traffic is expected (driveways, etc.)
8 – 5
LADOTD HYDRAULICS MANUAL GRATE AND CURB INLETS 2011 8.9.3 Sag Locations Combination inlets are required in sags or low points. The efficiency of inlets in passing debris is critical in sag locations because all runoff which enters the sag must be passed through the inlet. Total or partial clogging of inlets in these locations can result in hazardous ponding conditions. Therefore, combination inlets consisting of a grate and a curb-opening are considered advisable for use in sags where hazardous ponding can occur. 8.9.4 Standard Catch Basins and Manholes LADOTD has many Standard Plans for catch basins and manholes. There are various types to fit different situations, e.g., the location of the trunk line in front of or behind the curb, varying sizes and/or number of pipes, and differing depths of structure. These are included in LADOTD’s Standard Plan Booklet which is available through the General Files Section. 8.10 HYDRAULIC DESIGN OF CONDUIT SYSTEMS Pipes are designed for surcharged-full flow conditions and sized to carry 100 percent of the runoff, even though during the inlet spacing phase of the design it is recognized that a portion of the flow bypasses inlets on a grade. 8.10.1 Pipe Size A minimum diameter, or round equivalent diameter for pipe arches, of 15″ should be used for trunk lines and principal laterals. In progressing downstream, pipe sizes should never decrease. 8.10.2 Pipe Length Pipe lengths for storm drains are rounded off to the whole foot. The maximum length of pipe without a manhole or other structure with access is given in Table 8.10-1.
8.10.3 Pipe Slope To minimize excavation, the pipe slope should conform approximately to existing surface grade. 8.10.4 Flow Lines Flow line elevations should be set so that pipe centerlines in a manhole will be approximately in the same plane.
8 – 6
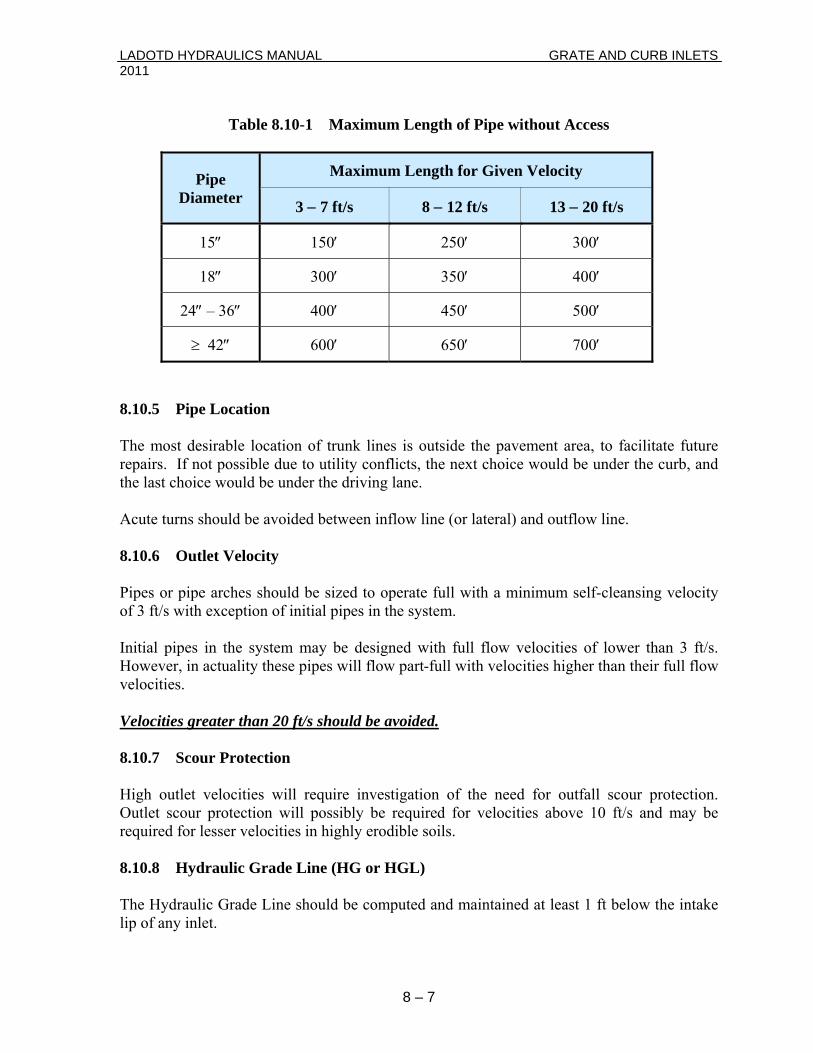
LADOTD HYDRAULICS MANUAL GRATE AND CURB INLETS 2011
Table 8.10-1 Maximum Length of Pipe without Access
Pipe Diameter
Maximum Length for Given Velocity
3 − 7 ft/s 8 − 12 ft/s 13 − 20 ft/s
15″ 150′ 250′ 300′
18″ 300′ 350′ 400′
24″ – 36″ 400′ 450′ 500′
≥ 42″ 600′ 650′ 700′
8.10.5 Pipe Location The most desirable location of trunk lines is outside the pavement area, to facilitate future repairs. If not possible due to utility conflicts, the next choice would be under the curb, and the last choice would be under the driving lane. Acute turns should be avoided between inflow line (or lateral) and outflow line. 8.10.6 Outlet Velocity Pipes or pipe arches should be sized to operate full with a minimum self-cleansing velocity of 3 ft/s with exception of initial pipes in the system. Initial pipes in the system may be designed with full flow velocities of lower than 3 ft/s. However, in actuality these pipes will flow part-full with velocities higher than their full flow velocities. Velocities greater than 20 ft/s should be avoided. 8.10.7 Scour Protection High outlet velocities will require investigation of the need for outfall scour protection. Outlet scour protection will possibly be required for velocities above 10 ft/s and may be required for lesser velocities in highly erodible soils. 8.10.8 Hydraulic Grade Line (HG or HGL) The Hydraulic Grade Line should be computed and maintained at least 1 ft below the intake lip of any inlet.
8 – 7
LADOTD HYDRAULICS MANUAL GRATE AND CURB INLETS 2011 8.11 MANHOLE REQUIREMENTS 8.11.1 Conditions Which Require Manholes Locations which will require a manhole (assuming a catch basin is not appropriate) are: a.) Wherever necessary to keep maximum lengths as noted in Table 8.10-1. b.) At points of conflict with utility lines which cannot be moved c.) At all angles in storm drains d.) At points where grade of storm drain changes e.) At points where size of storm drain changes f.) At junctions of storm drain lines except for the conditions in Section
8.11.2 8.11.2 Conditions Which Do Not Require Manholes Locations which will not require a manhole at junction of storm drain lines are:
a.) When grate inlets (outside the pavement) such as CB-01, CB-02, or CB-04 are used, 15" through 24" pipes may be connected to the trunk line by a fabricated pipe fitting (wye or tee) if the trunk size does not exceed 36" and length of the lateral pipe (between the grate inlet and the fabricated pipe fitting) does not exceed 50 ft . Fabricated pipe fittings will be noted on Plan-Profile sheets and will be measured per each fitting. When the trunk line is greater than 36", a stub-in pipe may be used instead of a fabricated pipe fitting provided it is less than or equal to half the diameter of the trunk line.
b.) When stubbing into an RCB, the stub-in cannot be greater than half the rise of the RCB. When setting the flowline of the stub-in, the stub-in should clear the haunch area of the RCB.
c.) When yard drain (CB-05) is used, 8" yard drain pipe may be
stubbed-into the trunk line. Such stubbing of conduits will be noted on Plan/Profile sheets and will not be measured for payment.
8 – 8
LADOTD HYDRAULICS MANUAL GRATE AND CURB INLETS 2011 8.12 CONSTRUCTION CLEARANCE A minimum clearance of 9″ shall be maintained between the top of the pipe and the lowest part of the subgrade. Minimum clearance should be increased to 12″ for pipes greater than 84″ in diameter. 8.12.1 Underground Utilities Approximately 1 ft of clearance should be maintained between storm drains and underground utilities. 8.12.2 Sanitary Sewer Conflicts Where it is necessary for a sanitary sewer line to pass through a manhole, at least 1 ft of clearance should be maintained between the bottom of the sanitary sewer line and the flow line of the manhole. Ductile iron pipe of sufficient length to insure approximately 2 ft of bearing on compacted soil beyond the walls of the manhole should be required in such cases. Figure 8.12-1 may be referred to for guidance in dealing with conflicts between storm drain and sanitary sewer lines.
8 – 9
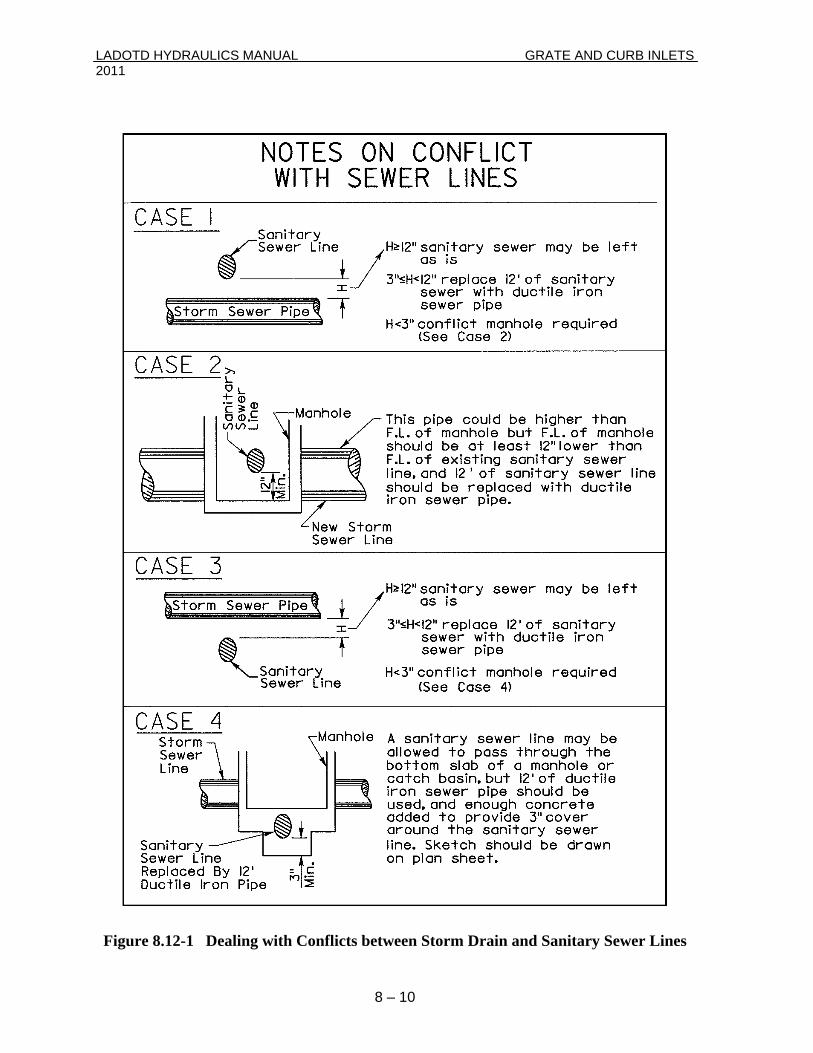
LADOTD HYDRAULICS MANUAL GRATE AND CURB INLETS 2011
8 – 10
Figure 8.12-1 Dealing with Conflicts between Storm Drain and Sanitary Sewer Lines
LADOTD HYDRAULICS MANUAL GRATE AND CURB INLETS 2011
CHAPTER 8 – PART A GRATE AND CURB INLETS
8-A.1 INTRODUCTION The following methodology is to be used in determining the capacity and depth of ponding for grate inlets. For more information, refer to these references or the latest publications/websites from the following agencies: A.) Urban Drainage Design Manual Third Edition, Hydraulic Engineering
Circular No. 22, FHWA, Washington, D.C., September 2009. B.) Drainage of Highway Pavements, Hydraulic Engineering Circular No.
12, FHWA, Washington, D.C., March 1984. C.) Pavement and Geometric Design Criteria for Minimizing Hydroplaning,
FHWA Report No. FHWA-RD-79-31, FHWA, Washington, D.C., December 1979.
The capacity curves presented in this section were developed from experimental data based on a study conducted by Louisiana State University for the Louisiana Department of Transportation and Development (W. A. Wintz, Jr. and Y. H. Kuo, "A Study of Storm Water Inlet Capacities", 1970). These graphs are a representation of empirical data which was collected in research of these inlet types only, and they should not be used for any other inlet types. 8-A.2 COMPUTER PROGRAMS The following programs have been approved for use in the design of curb inlet spacing in storm drain systems for LADOTD highways: A.) The LADOTD computer program HYDR6000: “Inlet Spacing” is only good for
uniform cross slopes of 0.025 ft./ft. Curb Inlets on any other cross slope including superelevated roadways should be calculated based on the procedures outlined in this section.
There is not a computer program available through LADOTD to calculate capacity or depth of ponding for grate inlets outside the pavement.
8(A) – 1
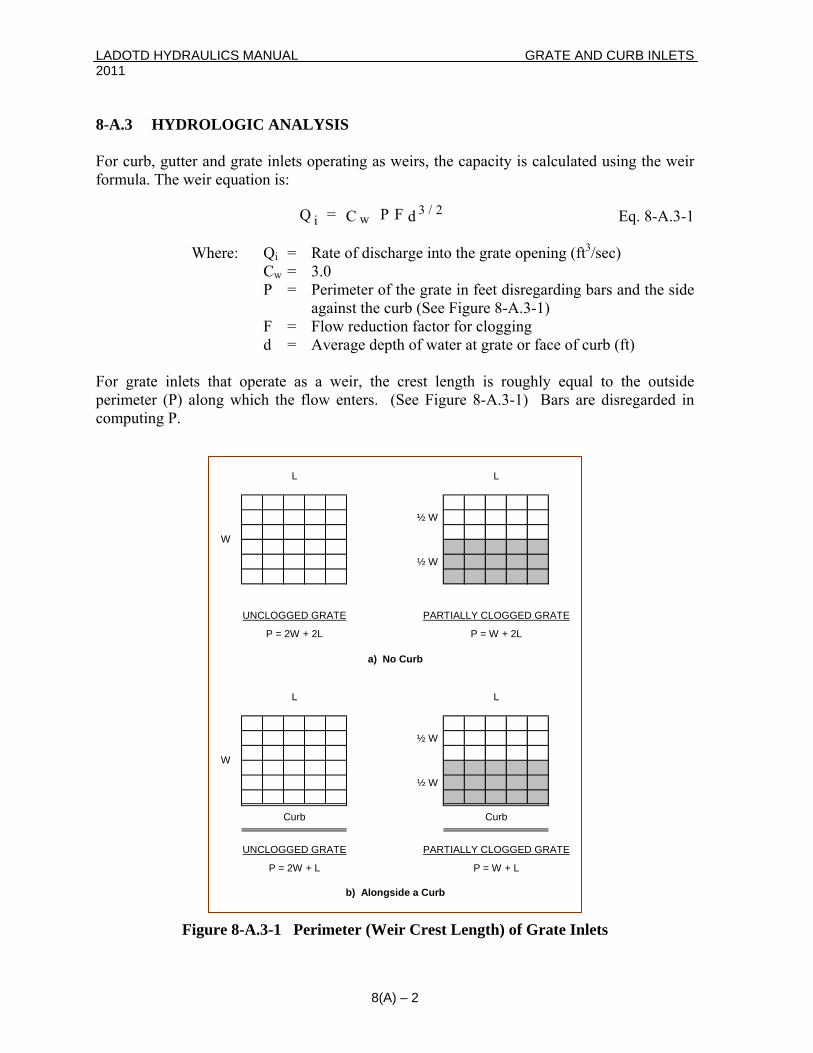
LADOTD HYDRAULICS MANUAL GRATE AND CURB INLETS 2011 8-A.3 HYDROLOGIC ANALYSIS For curb, gutter and grate inlets operating as weirs, the capacity is calculated using the weir formula. The weir equation is: Eq. 8-A.3-1 d F P C = Q 2/3
wi Where: Qi = Rate of discharge into the grate opening (ft3/sec)
Cw = 3.0 P = Perimeter of the grate in feet disregarding bars and the side
against the curb (See Figure 8-A.3-1) F = Flow reduction factor for clogging d = Average depth of water at grate or face of curb (ft)
For grate inlets that operate as a weir, the crest length is roughly equal to the outside perimeter (P) along which the flow enters. (See Figure 8-A.3-1) Bars are disregarded in computing P.
L L
½ W
½ W
L L
½ W
½ W
b) Alongside a Curb
a) No Curb
W
UNCLOGGED GRATE PARTIALLY CLOGGED GRATE
P = 2W + L P = W + L
Curb Curb
W
P = 2W + 2L
UNCLOGGED GRATE PARTIALLY CLOGGED GRATE
P = W + 2L
Figure 8-A.3-1 Perimeter (Weir Crest Length) of Grate Inlets
8(A) – 2
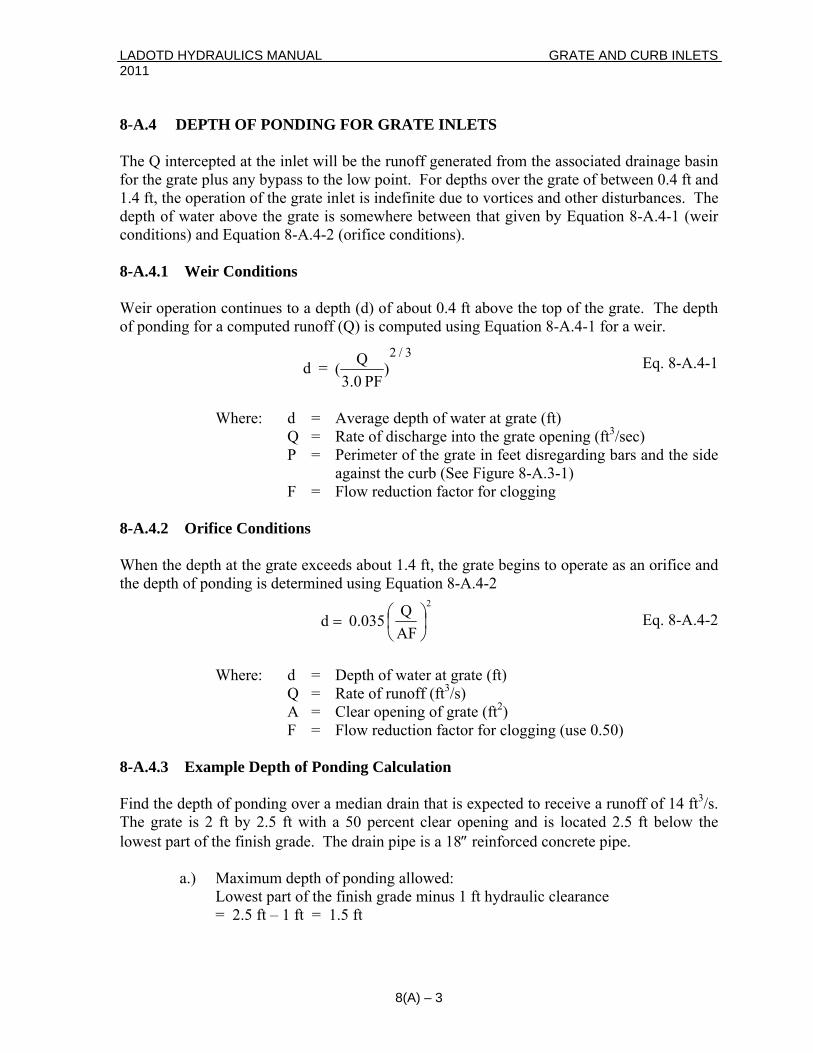
LADOTD HYDRAULICS MANUAL GRATE AND CURB INLETS 2011 8-A.4 DEPTH OF PONDING FOR GRATE INLETS The Q intercepted at the inlet will be the runoff generated from the associated drainage basin for the grate plus any bypass to the low point. For depths over the grate of between 0.4 ft and 1.4 ft, the operation of the grate inlet is indefinite due to vortices and other disturbances. The depth of water above the grate is somewhere between that given by Equation 8-A.4-1 (weir conditions) and Equation 8-A.4-2 (orifice conditions). 8-A.4.1 Weir Conditions Weir operation continues to a depth (d) of about 0.4 ft above the top of the grate. The depth of ponding for a computed runoff (Q) is computed using Equation 8-A.4-1 for a weir. Eq. 8-A.4-1 )
PF 0.3Q( = d
3/2
Where: d = Average depth of water at grate (ft)
Q = Rate of discharge into the grate opening (ft3/sec) P = Perimeter of the grate in feet disregarding bars and the side
against the curb (See Figure 8-A.3-1) F = Flow reduction factor for clogging
8-A.4.2 Orifice Conditions When the depth at the grate exceeds about 1.4 ft, the grate begins to operate as an orifice and the depth of ponding is determined using Equation 8-A.4-2 Eq. 8-A.4-2
2
AFQ 035.0 d ⎟
⎠⎞
⎜⎝⎛=
Where: d = Depth of water at grate (ft) Q = Rate of runoff (ft3/s) A = Clear opening of grate (ft2) F = Flow reduction factor for clogging (use 0.50) 8-A.4.3 Example Depth of Ponding Calculation Find the depth of ponding over a median drain that is expected to receive a runoff of 14 ft3/s. The grate is 2 ft by 2.5 ft with a 50 percent clear opening and is located 2.5 ft below the lowest part of the finish grade. The drain pipe is a 18″ reinforced concrete pipe. a.) Maximum depth of ponding allowed: Lowest part of the finish grade minus 1 ft hydraulic clearance = 2.5 ft – 1 ft = 1.5 ft
8(A) – 3
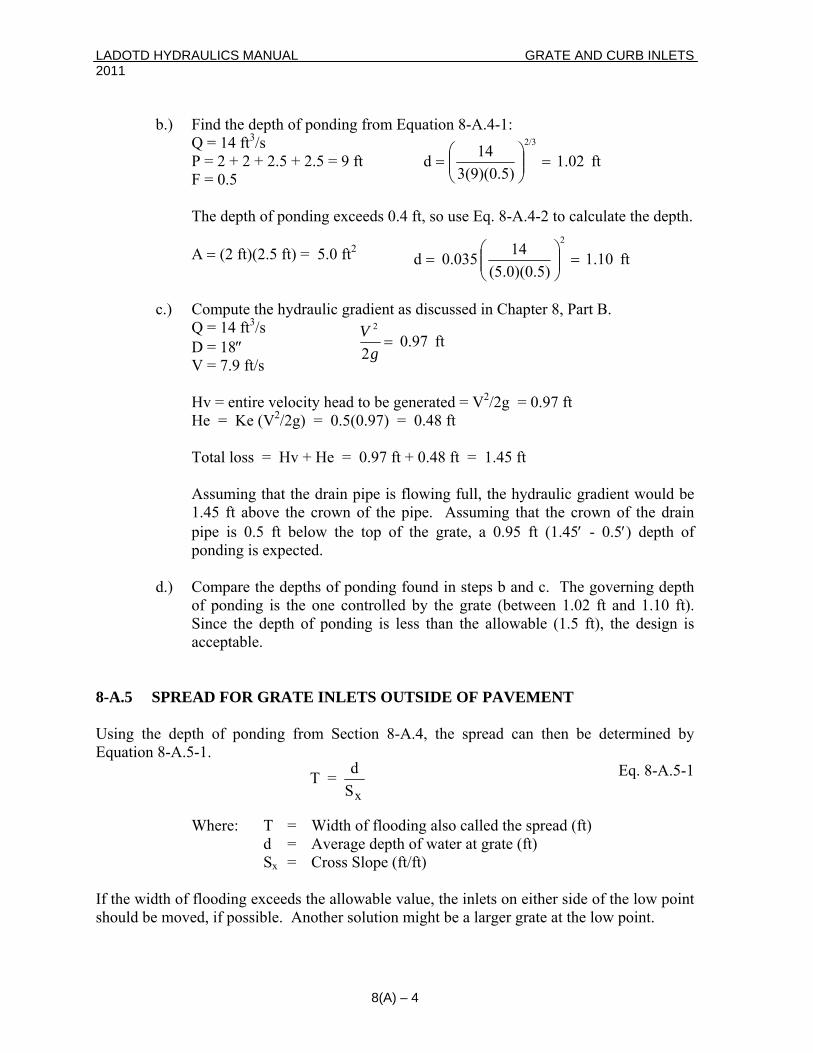
LADOTD HYDRAULICS MANUAL GRATE AND CURB INLETS 2011 b.) Find the depth of ponding from Equation 8-A.4-1: Q = 14 ft3/s
ft 02.1 3(9)(0.5)
14d2/3
=⎟⎟⎠
⎞⎜⎜⎝
⎛= P = 2 + 2 + 2.5 + 2.5 = 9 ft
F = 0.5 The depth of ponding exceeds 0.4 ft, so use Eq. 8-A.4-2 to calculate the depth.
ft 1.10 (5.0)(0.5)
14 035.0 d2
=⎟⎟⎠
⎞⎜⎜⎝
⎛= A = (2 ft)(2.5 ft) = 5.0 ft2
c.) Compute the hydraulic gr Q = 14 ft3/s
adient as discussed in Chapter 8, Part B.
D = 18″
Hv = entire velocity head to be generated = V /2g = 0.97 ft
Total loss = Hv + He = 0.97 ft + 0.48 ft = 1.45 ft
Assuming that the drain pipe is flowing full, the hydraulic gradient would be
d.) Compare the depths of ponding found in steps b and c. The governing depth
SPREAD FOR GRATE INLETS OUTSIDE OF PAVEMENT
sing the depth of ponding from Section 8-A.4, the spread can then be determined by
Eq. 8-A.5-1
dth of flooding also called the spread (ft)
the width of flooding exceeds the allowable value, the inlets on either side of the low point
ft 0.97 2
2
=g
V
V = 7.9 ft/s
2 He = Ke (V2/2g) = 0.5(0.97) = 0.48 ft
1.45 ft above the crown of the pipe. Assuming that the crown of the drain pipe is 0.5 ft below the top of the grate, a 0.95 ft (1.45′ - 0.5′) depth of ponding is expected.
of ponding is the one controlled by the grate (between 1.02 ft and 1.10 ft). Since the depth of ponding is less than the allowable (1.5 ft), the design is acceptable.
8-A.5 UEquation 8-A.5-1.
S
= Tx
d
Where: T = Wi d = Average depth of water at grate (ft) Sx = Cross Slope (ft/ft) Ifshould be moved, if possible. Another solution might be a larger grate at the low point.
8(A) – 4
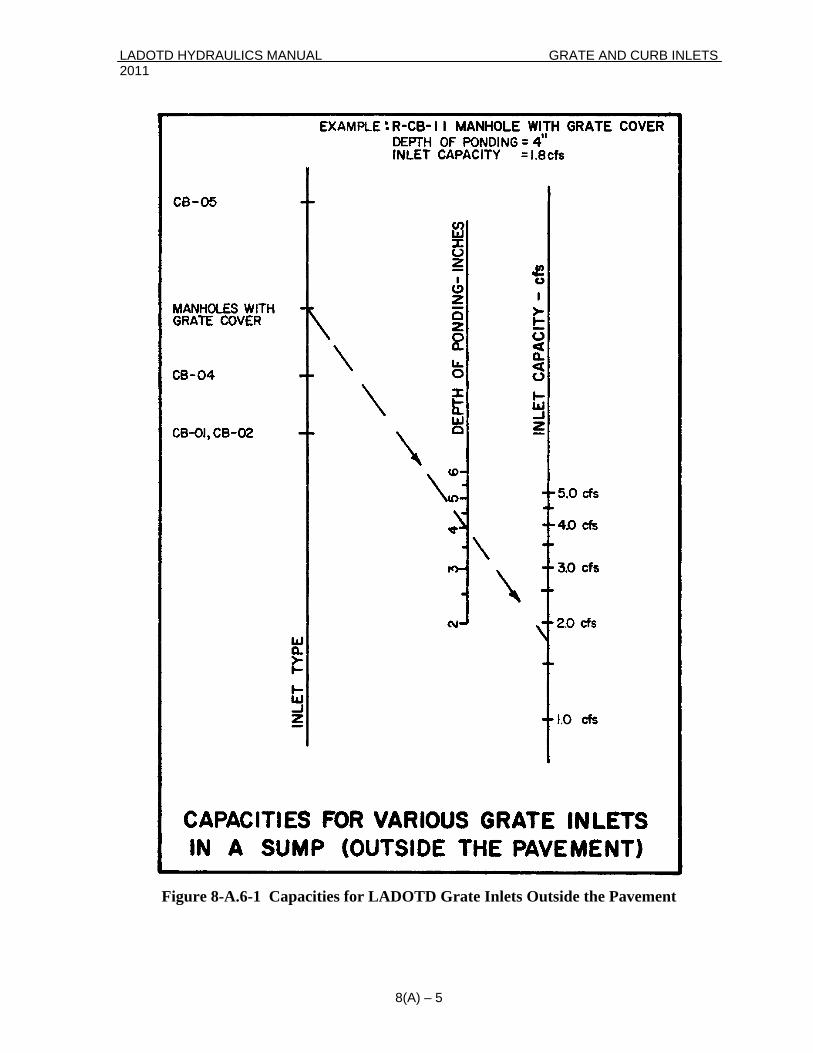
LADOTD HYDRAULICS MANUAL GRATE AND CURB INLETS 2011
Figure 8-A.6-1 Capacities for LADOTD Grate Inlets Outside the Pavement
8(A) – 5
LADOTD HYDRAULICS MANUAL GRATE AND CURB INLETS 2011 8-A.6 INLET CAPACITY – OUTSIDE THE PAVEMENT LADOTD uses open top grate openings in catch basins and manholes when needing to collect water behind the curb or “outside the pavement” at low spots, sags or sumps. They are: A.) CB-01 (grate outside dimensions 2′– 4¼" × 3′– 4"; fits pipes 24"×36") B.) CB-02 (grate outside dimensions 2′– 4¼" × 3′– 4"; fits pipes 42"×72") C.) CB-04 (grate outside dimensions 2′– 4" × 2′– 4"; end of line, 15" max pipe) D.) CB-05 (grate outside dimensions 1′– 1½" × 1′– 1½"; yard drain, 8" max pipe) E.) Manhole round grate cover (outside diameter 1′– 11½") The capacity of these grate inlets depends upon the depth of water at the inlet and the inlet geometry. These inlets most likely function as a weir except in extreme cases of ponding. The capacities for open top grates are given in Figure 8-A.6-1. They were computed from Equation 8-A.3-1 (weir formula) with a flow reduction factor of 0.50 for clogging. Value of P, perimeter of grate opening, in Equation 8-A.3-1 includes all four sides of the grate opening in this case. Figure 8-A.6-1 may be used to determine the capacity of an inlet by selecting a desirable depth of ponding at the inlet (usually less than or equal to 6 inches) or the depth of ponding at the inlet by knowing the design flow into the inlet. More information on depth of ponding is in Section 8-A.4. 8-A.7 GUTTER CAPACITIES Capacities of gutters with a uniform cross slope of 0.025 ft./ft. are given in Figure 8-A.7-1. 8-A.7.1 Superelevations Gutter capacities for other sections with uniform cross slopes or superelevations may be computed from Equation 8-A.7-1 or Equation 8-A.7-2: Eq. 8-A.7-1 S T S
n56.0 Q 2/13/83/5
X⎟⎠⎞
⎜⎝⎛=
Where: Q = Rate of flow (ft3/s) n = Manning's coefficient of roughness (use n = 0.015 for concrete or asphalt pavements) SX = Cross slope (ft/ft) T = Width of flow or Spread (ft) S = Longitudinal slope (ft/ft)
8(A) – 6
LADOTD HYDRAULICS MANUAL GRATE AND CURB INLETS 2011 Eq. 8-A.7-2 d S
nz 0.56 Q 3/82/1=
Where: Q = Rate of flow (ft3/s) n = Manning's coefficient of roughness (n = 0.015 for concrete or asphalt pavements) z = 1/SX , (SX = Cross slope (ft/ft)) d = maximum depth of flow at the gutter; (T = Width of flow or Spread (ft) = zd) S = Longitudinal slope (ft/ft) 8-A.8 INLET CAPACITY – INSIDE THE PAVEMENT There are four catch basins used by LADOTD that have either a curb opening or a combination curb and grate opening. The openings are along the curb and for those that have grates, the grates are in the pavement/gutter area. These inlets are considered “inside the pavement” and can be placed either on a grade or in a sag (low point). They are: A.) CB-06 (curb opening) B.) CB-07 (curb and grate opening) C.) CB-08 (double curb and grate opening) D.) CB-09 (curb and grate opening – trunk line is under the roadway) 8-A.8.1 Inlets on a Grade The capacity curves for these four catch basins when they are placed on a grade are given in Figures 8-A.8-1 through 8-A.8-4. 8-A.8.2 Inlets in a Sag The capacity of curb-opening, gutter, or combination inlets used in a sag, or a low point in grade, depends upon the depth of water at the inlet and the inlet geometry. The inlets operate as a weir until the water submerges the entrance. Capacity curves for the inlet types used by LADOTD are given in Figure 8-A.8-5. They were developed from the weir formula, (see Section 8-A.3). A flow reduction factor of 1.00 was used. 8-A.8.3 Gutter Flow and Interception Ratio When the appropriate, interception ratio chart (Figure 8-A.8-1, 8-A.8-2, 8-A.8-3, 8-A.8-4) is aligned with the right-hand side of the appropriate gutter flow capacity chart (Figure 8-A.7-1), the gutter flow and interception ratio for a given grade may be determined simultaneously.
8(A) – 7
LADOTD HYDRAULICS MANUAL GRATE AND CURB INLETS 2011 Begin by locating the desired longitudinal roadway grade on the horizontal axis of the left-hand chart, and from that point draw a vertical line which will intersect with the curve representing the desired width of flooding. Carry a horizontal line from this point until the vertical axis (ordinate) is intersected, indicating the flow capacity of the gutter under the specified limits of flooding. Extend the horizontal line into the right-hand chart until the curve representing the appropriate longitudinal grade is intersected, and from that point draw a vertical line which intersects the horizontal axis (abscissa) of the right-hand chart, indicating the fraction of the total gutter flow which will be intercepted by the inlet.
8(A) – 8
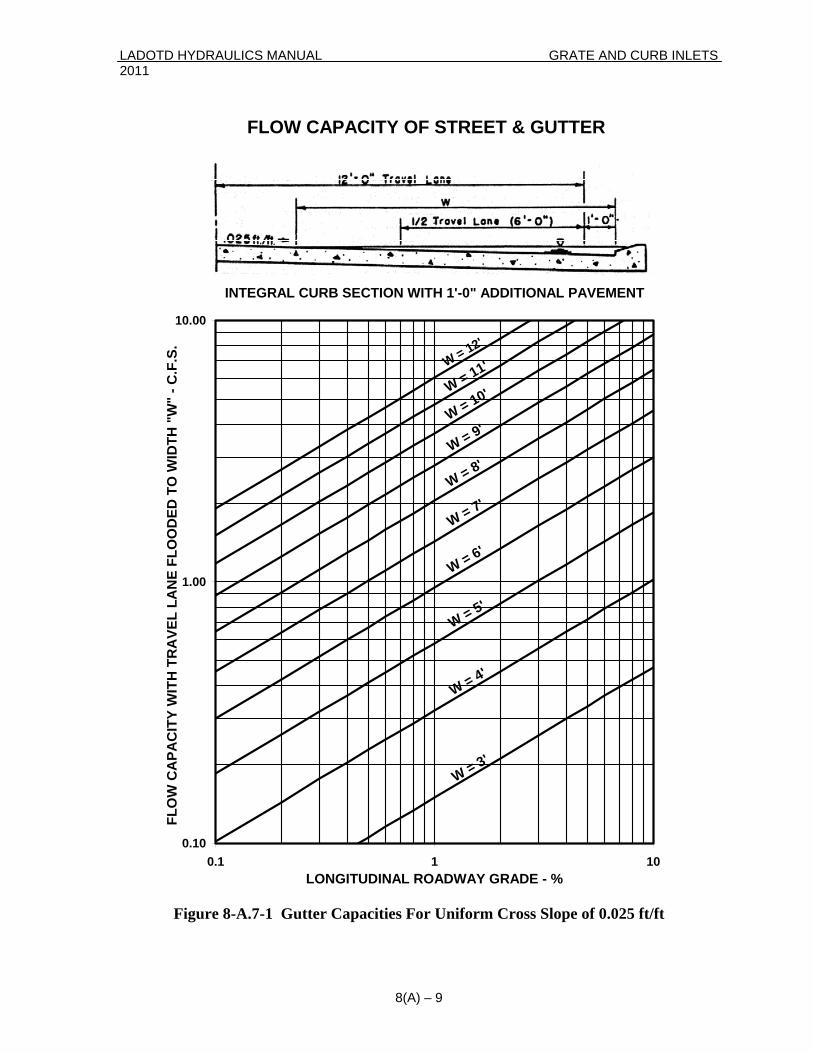
LADOTD HYDRAULICS MANUAL GRATE AND CURB INLETS 2011
8(A) – 9
FLOW CAPACITY OF STREET & GUTTER
W = 3'
W = 4'
W = 5'
W = 6'
W = 7'W = 8'W = 9'W = 10'W = 11'W = 12'
0.10
1.00
10.00
0.1 1 10LONGITUDINAL ROADWAY GRADE - %
INTEGRAL CURB SECTION WITH 1'-0" ADDITIONAL PAVEMENT
FLO
W C
APA
CIT
Y W
ITH
TR
AVE
L LA
NE
FLO
OD
ED T
O W
IDTH
"W
" - C
.F.S
.
Figure 8-A.7-1 Gutter Capacities For Uniform Cross Slope of 0.025 ft/ft
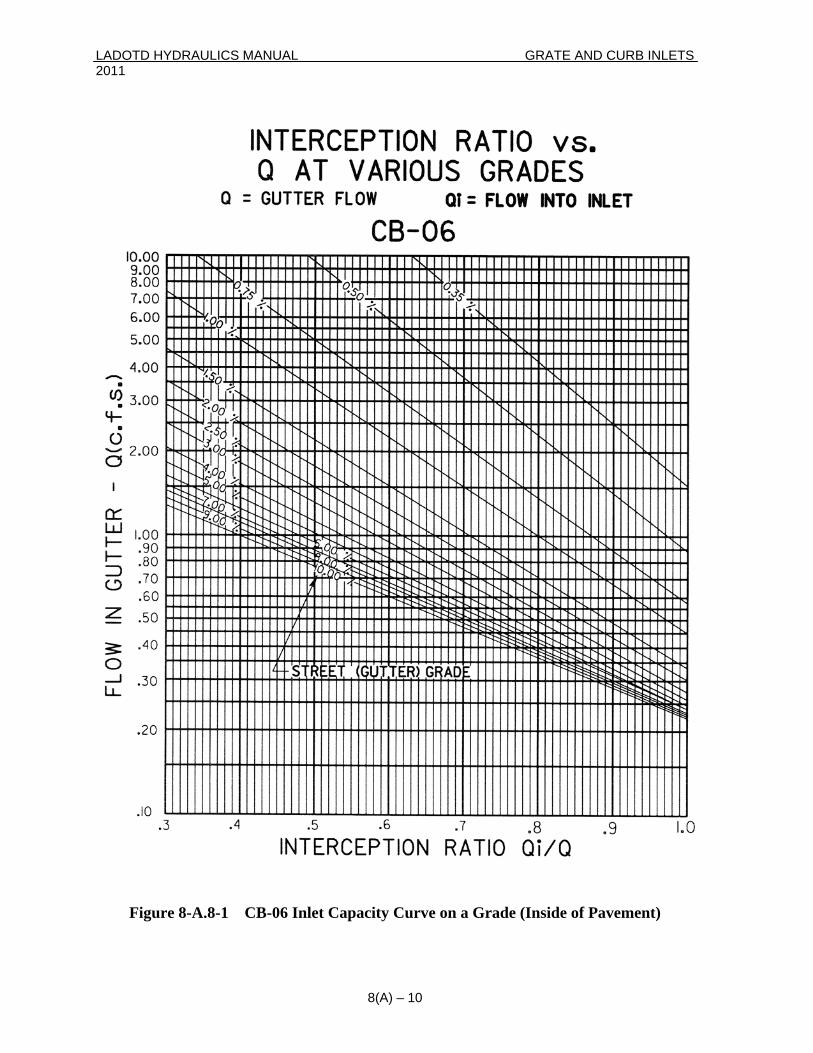
LADOTD HYDRAULICS MANUAL GRATE AND CURB INLETS 2011
Figure 8-A.8-1 CB-06 Inlet Capacity Curve on a Grade (Inside of Pavement)
8(A) – 10
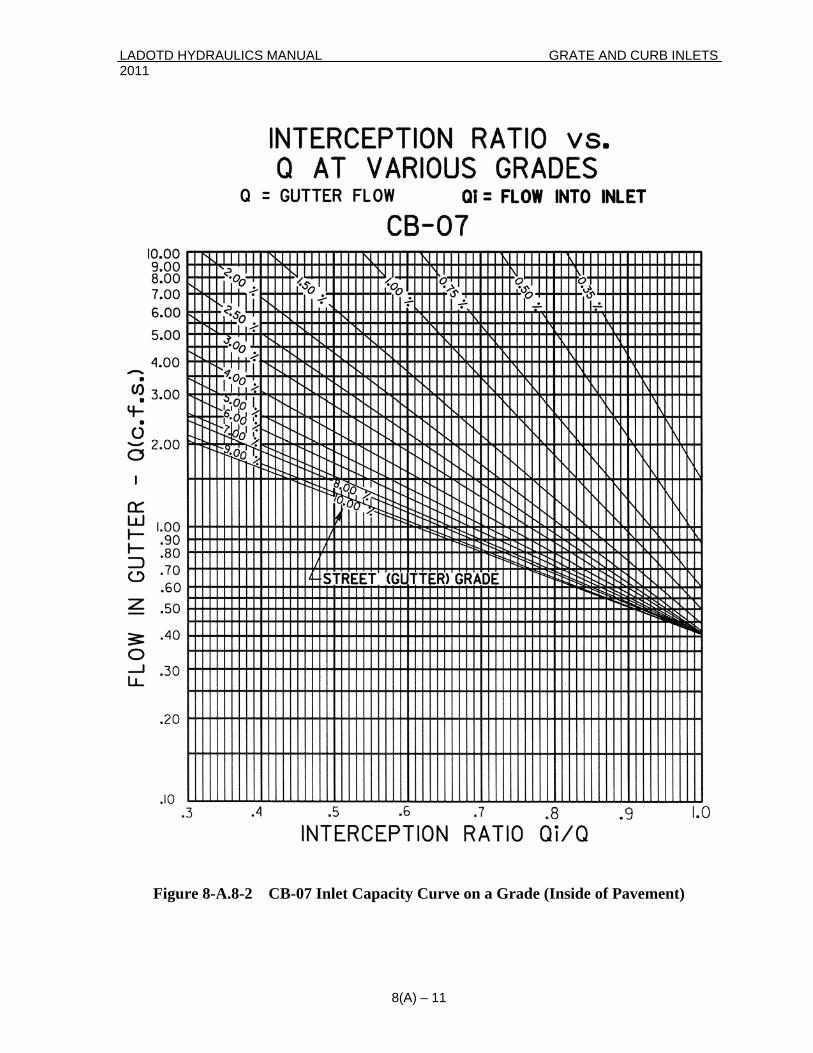
LADOTD HYDRAULICS MANUAL GRATE AND CURB INLETS 2011
Figure 8-A.8-2 CB-07 Inlet Capacity Curve on a Grade (Inside of Pavement)
8(A) – 11
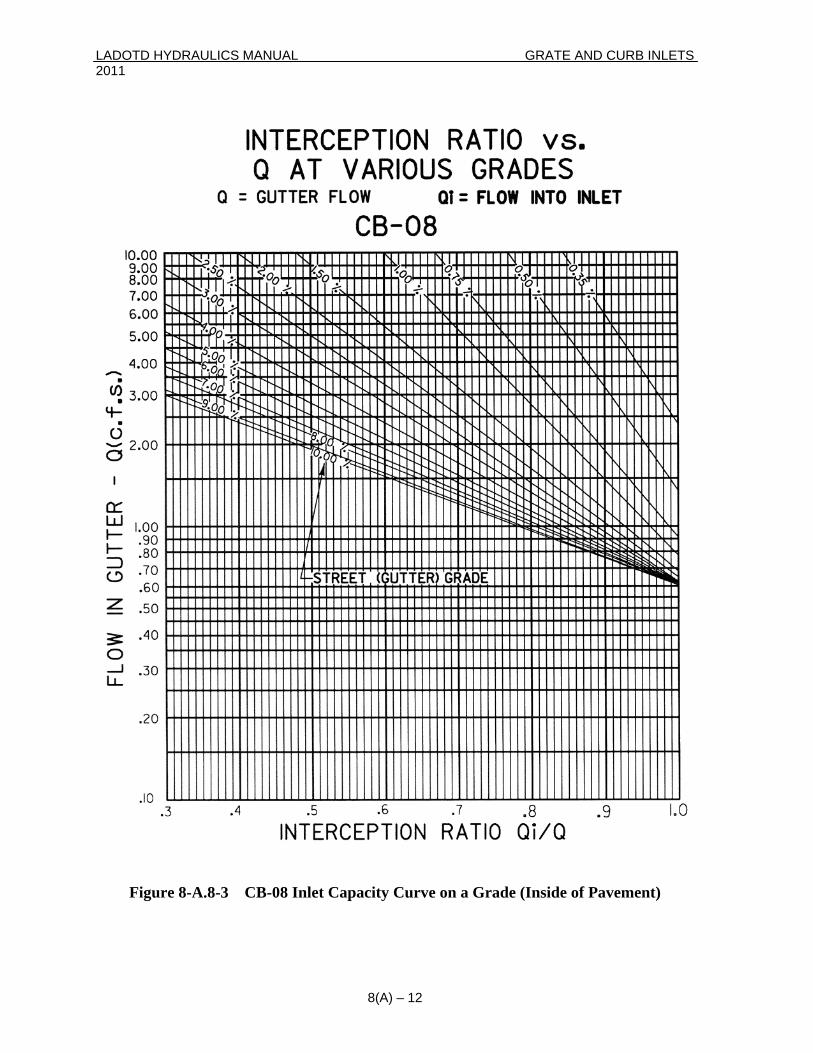
LADOTD HYDRAULICS MANUAL GRATE AND CURB INLETS 2011
Figure 8-A.8-3 CB-08 Inlet Capacity Curve on a Grade (Inside of Pavement)
8(A) – 12
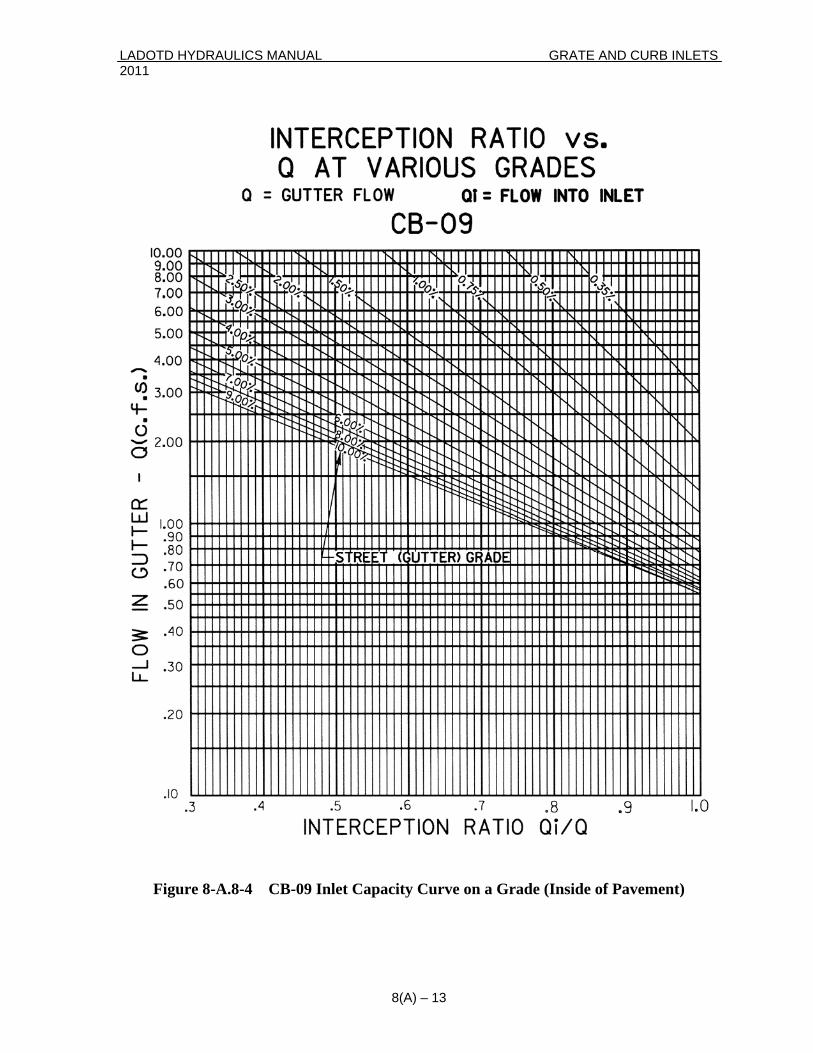
LADOTD HYDRAULICS MANUAL GRATE AND CURB INLETS 2011
Figure 8-A.8-4 CB-09 Inlet Capacity Curve on a Grade (Inside of Pavement)
8(A) – 13
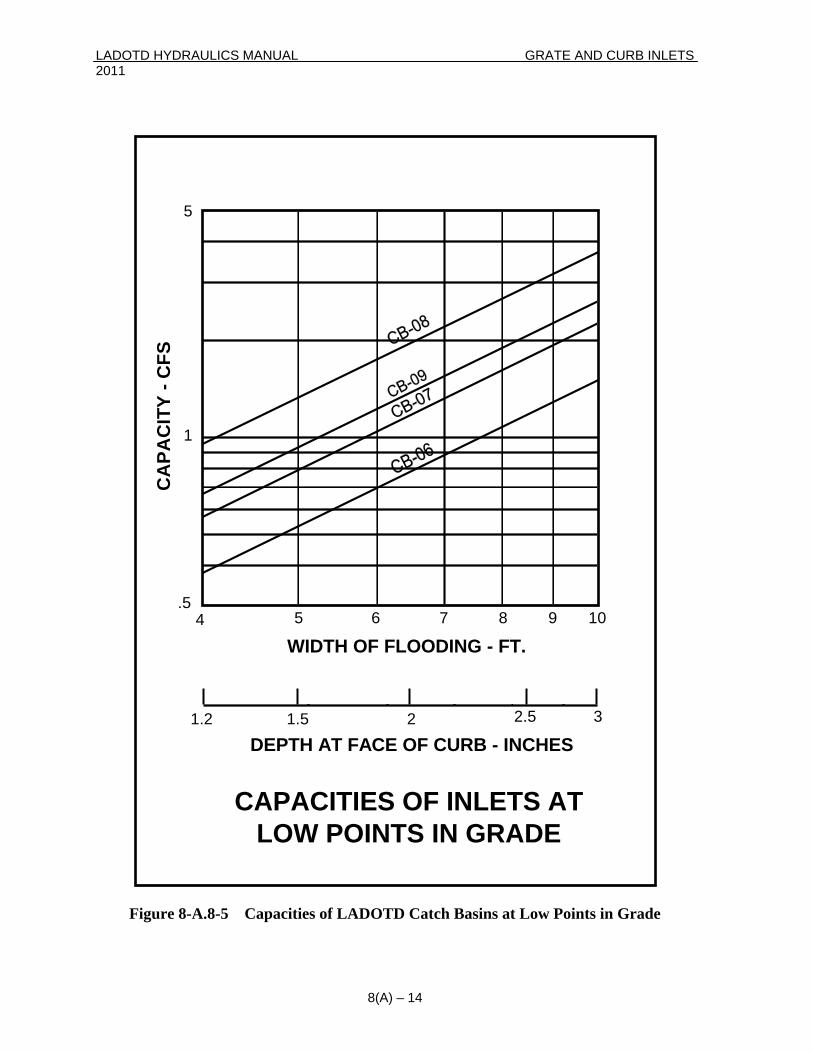
LADOTD HYDRAULICS MANUAL GRATE AND CURB INLETS 2011
2.5
4 5 6 7 8 9 10.5
1
5
WIDTH OF FLOODING - FT.
1.2 1.5 2 3
CAPACITIES OF INLETS ATLOW POINTS IN GRADE
CA
PAC
ITY
- CFS
DEPTH AT FACE OF CURB - INCHES
Figure 8-A.8-5 Capacities of LADOTD Catch Basins at Low Points in Grade
8(A) – 14
LADOTD HYDRAULICS MANUAL GRATE AND CURB INLETS 2011 8-A.9 INLET SELECTION AND PLACEMENT To space inlets on a grade, the capacity of the gutter section is determined first. The capacity of the gutter section for a desired flood width is determined using Figure 8-A.7-1 or Equation 8-A.7-1 where applicable. The capacity of the gutter under desirable limits of flooding will vary as the longitudinal slope varies. It is beneficial to compute the conveyance of the section and plot a graph of capacity vs. slope to save work. Once the amount of runoff necessary to bring e gutter to capacity flow is calculated, the next step is to determine the width (width measured parallel to the roadway) of the drainage area which will have a peak discharge equal to that flow. This is a trial and error procedure. A width of drainage area is assumed, and the runoff from the drainage area so defined is computed according to Chapter 3 – Rational Method. If the runoff computed from this drainage area is equal to or slightly less than the desired amount, then the location of the inlet is set. If, however, the computed runoff is gr e area must be reduced by moving the location of the inlet. The idea is to know how much runoff can be allowed to accumulate in the gutter before placing an inlet to intercept it. On very flat grades or for the first inlet on a grade, this value is equal to the gutter capacity. However, for inlets on a moderate grade, a certain amount of water may be expected to by-pass any given inlet and continue on in the gutter. A design should allow for this by-pass flow which may range from negligible on grades less than 0.5% to as much as forty to sixty percent of tota gutter flow for grades of 3.0% or greater. Considering this fact, the permissible accumu tion becomes gutter capacity minus residual gutter flow (or by-pass) from the last inlet upstream. Figures 8-A.8-1 through 8-A.8-4 provide a me ng the by-pass flow at various grades for the four inlet types which are most commonly used by LADOTD. These graphs are a representation of empirical data which were collected in research of these inlet types only, and they should not be used for any other inlet types. The following design procedure is provided for spacing and selection of catch basins. A design example with solution is also illustrated 8-A.9.1 Design Procedure for Placement a Inlets (catch basins) are used to collect pavem nt runoff, any rainfall falling in the right-of-way and any overland flow from adjacent properties. The following are the steps that should be taken to determine placement of inlets for a curb and gutter drainage system. At the end of Part A of this chapter is a spread sheet to be used as an aid. (HYDR 6000 calculates most of the information required on this spread sheet, however, it is best to understand the process so as a.) Roadway Grade
th
eater, then the width of the drainag
l la
thod of predicti
.
nd Selection of Inlets
e
to make good engineering decisions on inlet locations.)
– Select a roadway grade and roadway width. (See Chapter 1.)
8(A) – 15
LADOTD HYDRAULICS MANUAL GRATE AND CURB INLETS 2011 b.) Gutter Profile – Plot the gutter profile and the ground elevation at or
near the right-of-way on the plan/profile sheets. Find all low point and high point stations and elevations.
c.) Allowable Width of Flooding – Determine the allowable width of
flooding. (See Section 8.8) d.) Catch Basin Location – The first three columns give the location of
the catch basin on the plan/profile sheets. Column 1: Sheet No. of the Plan / Profile Sheet.
Column 2: Structure (inlet) no. Column 3: Station e.) Drainage Area – A width of drainage area is assumed (This is where
the inlet will be located. See Section 8.8 for guidelines and
Column 4: Drainage Length, L in ft; It is the length of the
th of the drainage area as determined by the stations of the inlets.)
th in feet (the longest length for the water to travel, usually the diagonal length on
f.) Drainage area of roadway which goes into the inlet
restrictions of inlet spacing.) Columns 4 through 8 are for information of the behind the curb or
the paved roadway drainage basin, whichever is greater. (In HYDR 6000, if the drainage length, slope and runoff coefficient are input as 0, it is assumed that there is only roadway drainage and no over the curb drainage.)
drainage basin/area perpendicular (⊥) to the roadway. (This is the value input into HYDR 6000. HYDR 6000 computes the hydraulic length based on this value and the wid
Column 5: Hydraulic Leng
rectangular shaped drainage basins.) Column 6: Slope in %, of the drainage basin Column 7: Area in acres Column 8: C, runoff coefficient Column 9: AC, area (Column 7) multiplied by the runoff
coefficient (Column 8) .
Column 10: Drainage Area of Roadway in acres
8(A) – 16
LADOTD HYDRAULICS MANUAL GRATE AND CURB INLETS 2011 Column 11: AC for Drainage Area of Roadway,
g.) Time of Concentration
Area (Column 10) multiplied by C of 0.95 for pavement.
– The time to inlet equals the time of
e paved roadway area, whichever is greater.
minutes, calculated using Chapter 3 – Rational Method.
h.)
concentration for the drainage basin input into Columns 5 – 8 for behind the curb area or th
Column 12: Time to Inlet (TC) in
Rainfall Intensity – Find the rainfall intensity for the drainage basin.
Column 13: Intensity (I) with units of in./hour, from the
from Column 12 converted from minutes to hours. (This is called time of duration.)
i.)
appropriate Rainfall Intensity Curve found in Chapter 3, Section 3.4.3, using the time of concentration
Compute the total AC.
Column 14: Σ AC, add the AC for the area behind the curb and
the AC for the paved roadway area.
j.) Discharge – The discharge is computed by the Rational Method
Q in cfs, multiply rainfall intensity (Column 13) by ∑AC (Column 14).
(See Chapter 3)
Column 15:
k.) Gutter Grade information .
Column 16:
)
Gutter Grade in %, enter the actual gutter grade at the location of the catch basin (inlet).
l. Catch Basin Type – From Table 8.9-1, select the appropriate catch
Column 23: me.
basin. Column 22: Low Point? If it is, note that in this column.
Required Catch Basin na
8(A) – 17
LADOTD HYDRAULICS MANUAL GRATE AND CURB INLETS 2011 m.) e mine the inD ter terception ratio for the required catch basin.
Column 17: Interception Ratio, Qi/Q, from Figures 8-A.8-1
n.)
through 8-A.8-4.
Determine the bypass information
Colu mn 18: Bypass Q in cfs; multiply the interception ratio,
Qi/Q, (Column 17) by Q (Column 15) and subtract
Column 19: at the bypass Q goes to
o.) Total Discharge
from Q (Column15). To Inlet No., the catch basin th
– The total discharge going into the inlet is
Column 20:
p.) Width of Flooding
computed. This discharge equals the computed Q plus the bypass Q.
Q + QBypass in cfs, Add the computed Q (Column 15) plus the bypass Q (Column 18).
– The actual width of flooding is determined.
Column 21: Non Low Points – Width of Flooding in ft, is
OR
Low Points
estimated from Figure 8-A.7-1.
Column 21: – Width of Flooding in ft, is estimated from Figure 8-A.8-5.
Note: If the runoff and width acceptable limits, then the required catch basin is set. If not, a larger capacity catch basin or even multiple catch
the inlet/catch basin may need to be adjusted.
q.) Catch basin prof
of flooding is within
basins may be required or the location of
ile information.
Column 24: Gutter Elevation
Col umn 25: Catch Basin Invert Elevation
em r.) R arks Column 26: It is reserved for any special note needed for the
inlet. Repeat the process for every inlet required on the job.
8(A) – 18
LADOTD HYDRAULICS MANUAL GRATE AND CURB INLETS 2011 8-A.9.2 Example of Inlet Selection and Placement
he following is an example of determining the spacing and required catch basins for a storm
ns 100+00 and 108+00. Travel lanes are
be 14 feet and the cross slope is 0.025 ft./ft. Determine how many catch basins are needed d the siz nd ca
• A roadway grad
A lo
Beginning grade: – 1% Ending grade: – 0.4%
P 400 ft. Vertical Curve 400 ft. Vertical Curve
Tdrain (curb and gutter) system.
A curb and gutter section is required between Statiotoan e a lo tion of these catch basins.
e was selected. p t of the profile is shown in Figure 8-A.9-1(a).
P.I. Station 102+00 P.I. Station 106+00
.I. Elev. 120.00 ft. P.I. Elev. 124.00 ft.
8(A) – 19
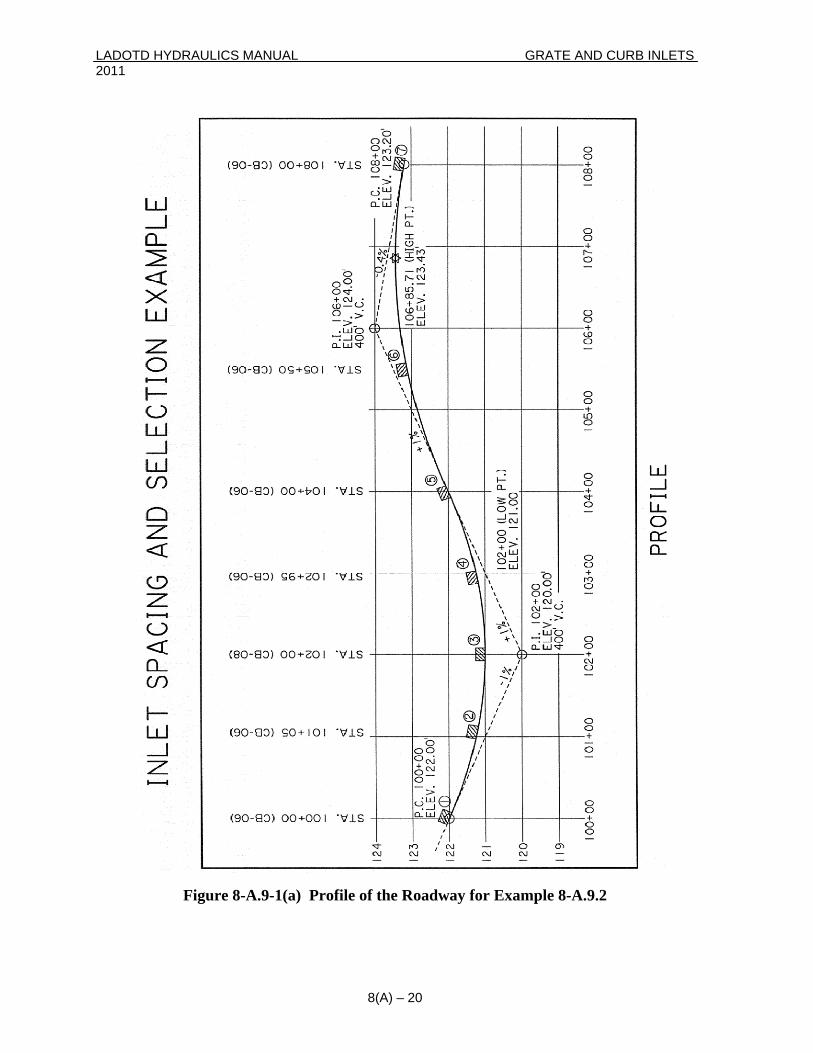
LADOTD HYDRAULICS MANUAL GRATE AND CURB INLETS 2011
Figure 8-A.9-1(a) Profile of the Roadway for Example 8-A.9.2
8(A) – 20
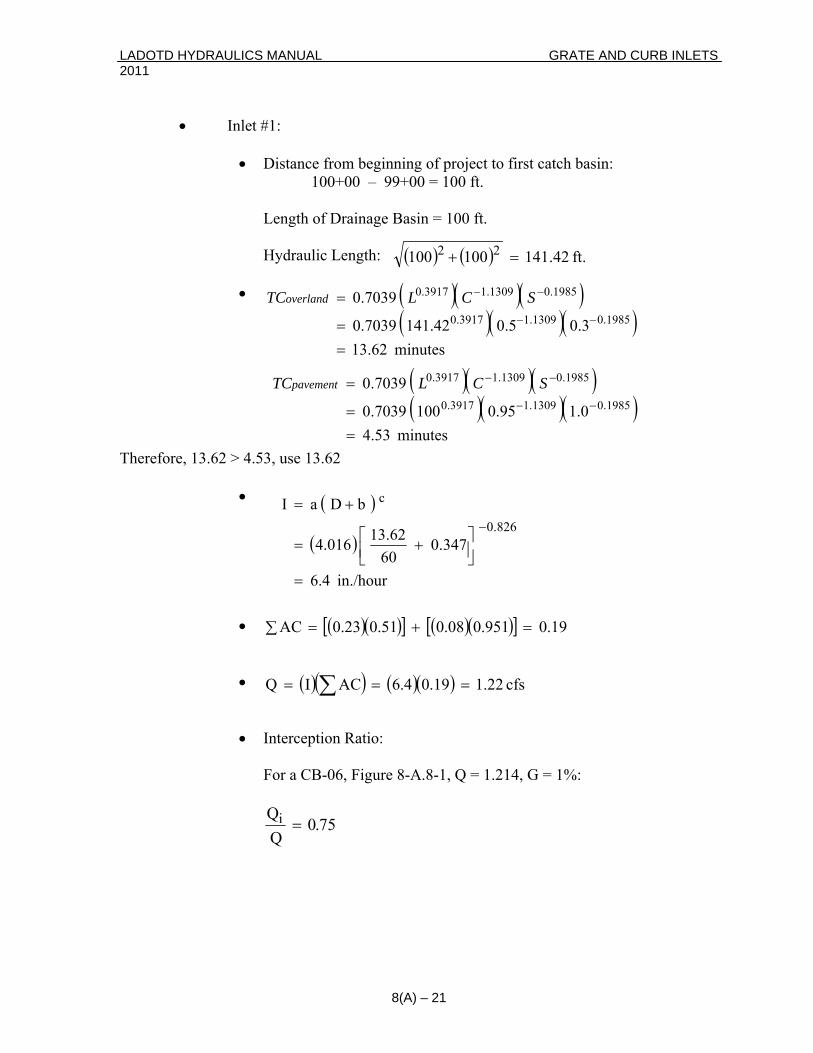
LADOTD HYDRAULICS MANUAL GRATE AND CURB INLETS 2011
• Inlet #1:
• Distance from beginning of project to first catch basin: 100+00 – 99+00 = 100 ft.
Length of Drainage Basin = 100 ft. Hydraulic Le
herefore, 13.62 > 4.53, use 13.62
•
• Interception Ratio:
For a CB-06, Figure 8-A.8-1, Q = 1.214, G = 1%:
ngth: ( ) ( ) .ft 42.141 100100 22 =+
• ( )( )( )( )( )(
minutes 62.13 0.3 0.5 141.42 7039.0
7039.0 1985.01309.13917.0
1985.01309.13917.0
==
=−−
−− SCLTCoverland ) ( )( )( )
( )( )(minutes 4.53
1.0 0.95 100 7039.0
7039.0 1985.01309.13917.0
1985.01309.13917.0
==
=−−
−− SCLTCpavement
) T
( )
( )
in./hour 6.4
347.0 60
13.62 4.016
b D a I.0
c
=
⎥⎦⎤
⎢⎣⎡ +=
+=−
826
( )( )[ ] ( )( )[ ] .0 951.008.0 51.023.0 AC•
19=∑ +=
•
( )( ) ( )( ) 22.1 19.04.6 ACI Q === ∑ cfs
75.0 QQi =
8(A) – 21
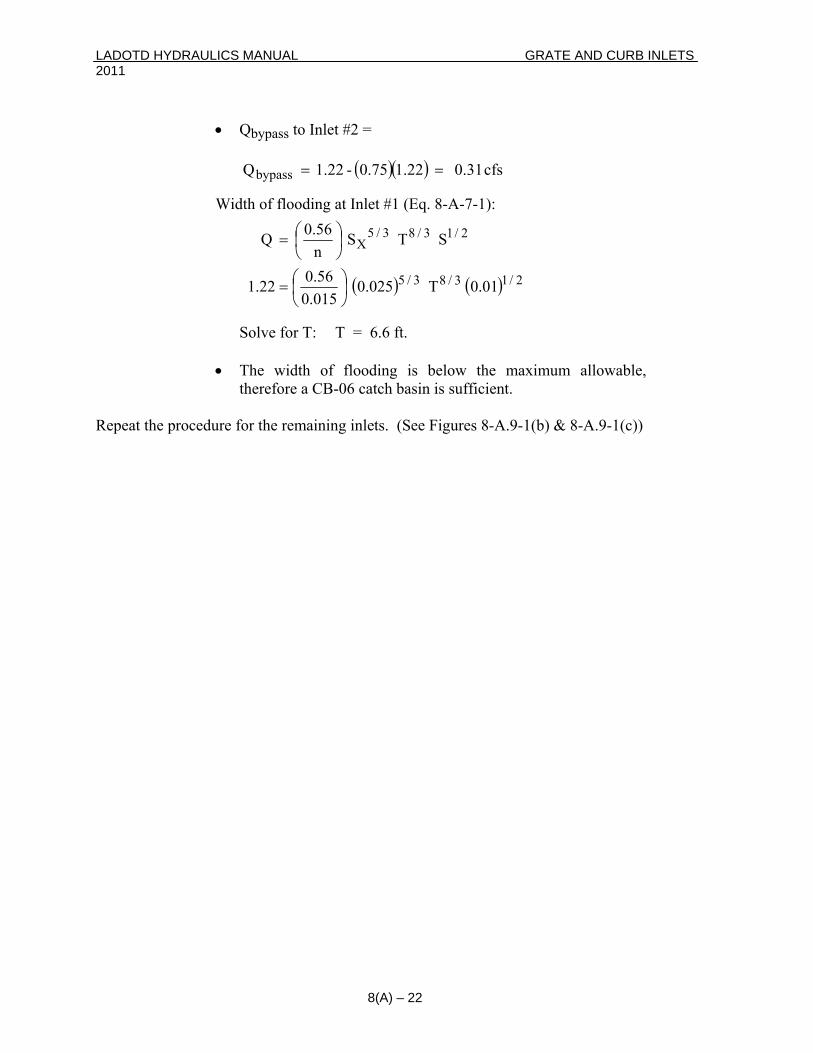
LADOTD HYDRAULICS MANUAL GRATE AND CURB INLETS 2011
8(A) – 22
• Qby
( )( ) cfs 0.31 22.175.0-1.22 Qbypass ==
pass to Inlet #2 =
Width of flooding at Inlet #1 (Eq. 8-A-7-1):
Solve for T: T = 6.6 ft.
• The width of flooding is below the maximum allowable, therefore a CB-06 catch basin is sufficient.
epeat the procedure for the remaining inlets. (See Figures 8-A.9-1(b) & 8-A.9-1(c))
( ) ( ) 0.01 T 0.025 015.056.01.22
S T S n X
⎠⎝56.0 3/5⎞⎛ Q
2/13/83/5
2/13/8
⎟⎠⎞
⎜⎝⎛=
⎟⎜=
R
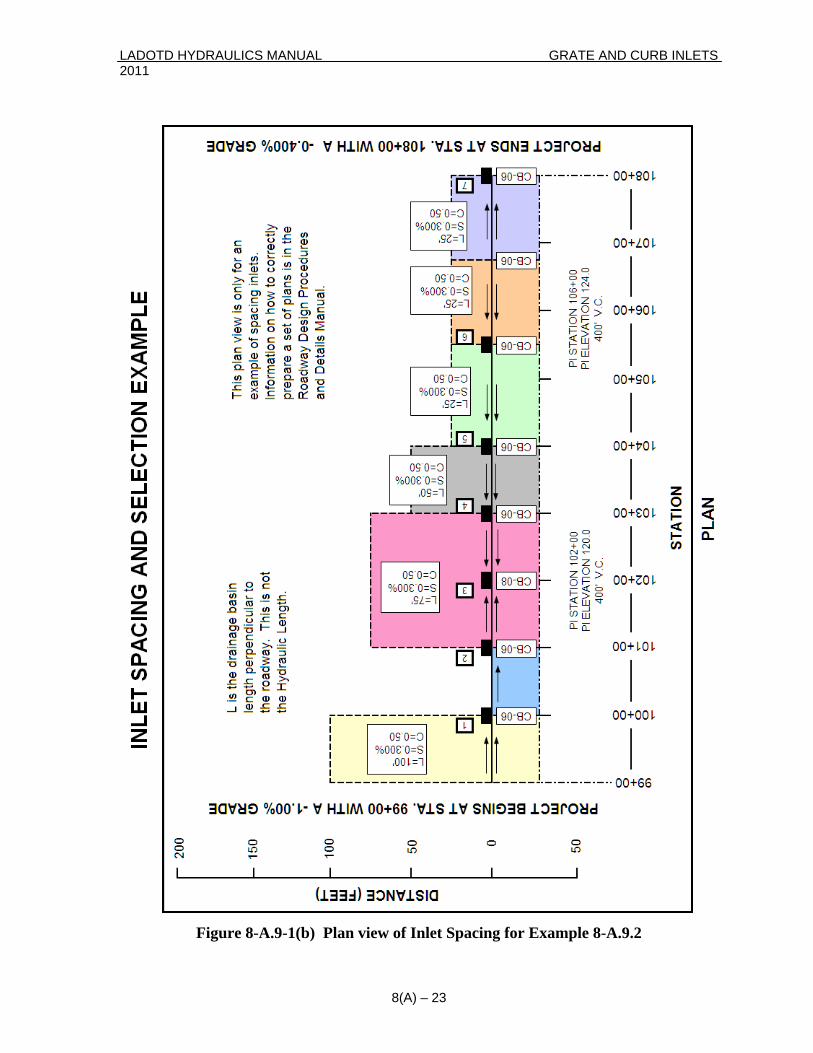
LADOTD HYDRAULICS MANUAL GRATE AND CURB INLETS 2011
Figure 8-A.9-1(b) Plan view of Inlet Spacing for Example 8-A.9.2
8(A) – 23
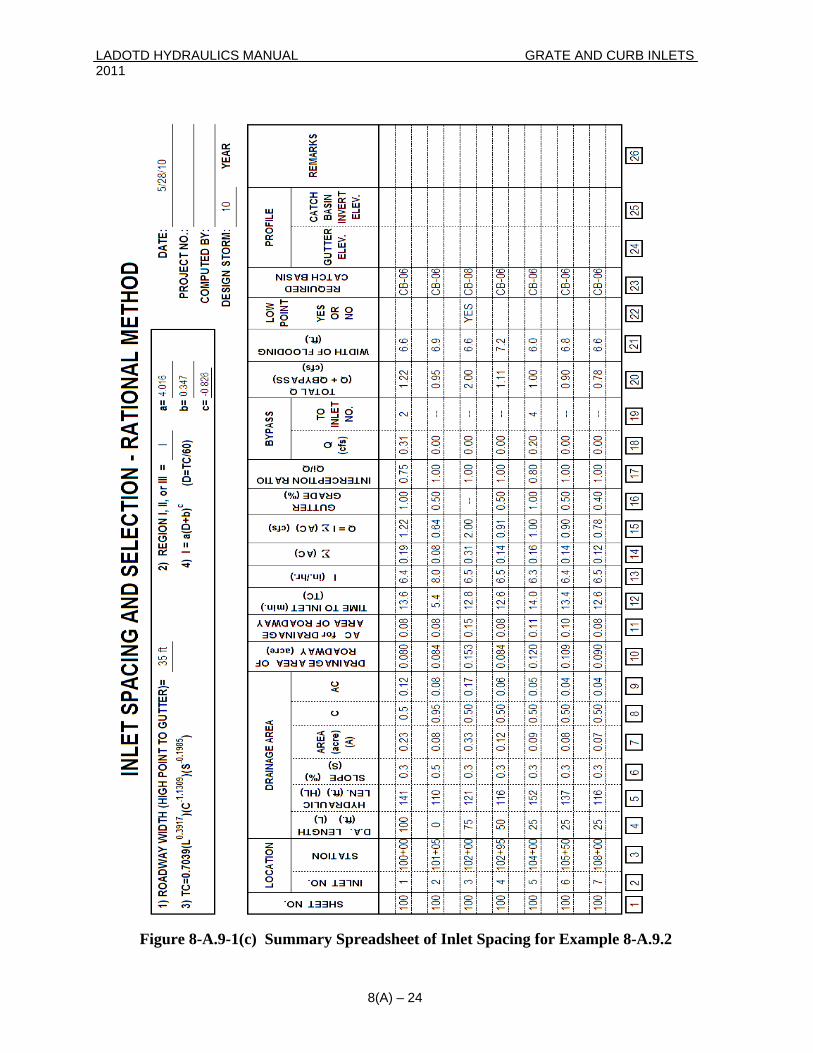
LADOTD HYDRAULICS MANUAL GRATE AND CURB INLETS 2011
8(A) – 24
Figu -A.9.2 re 8-A.9-1(c) Summary Spreadsheet of Inlet Spacing for Example 8
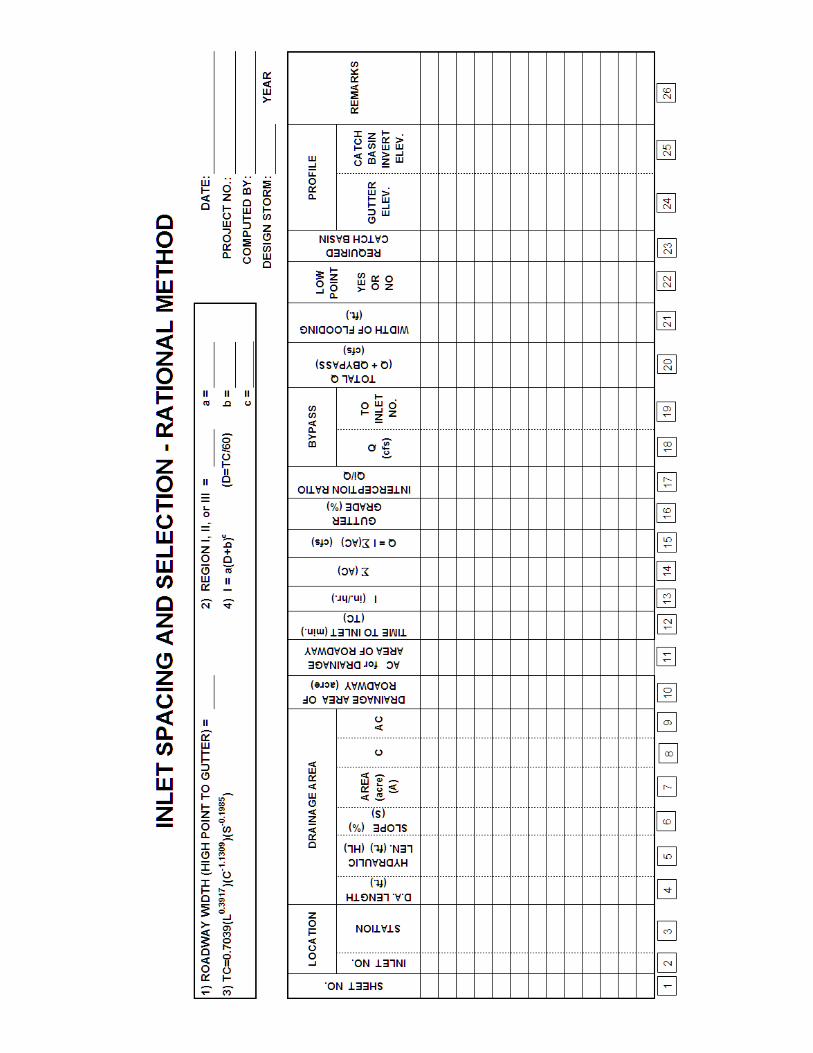

This page intentionally left blank.

LADOTD HYDRAULICS MANUAL CONDUIT SYSTEMS HYDRAULICS 2011
CHAPTER 8 – PART B CONDUIT SYSTEMS HYDRAULICS
8-B.1 INTRODUCTION The following methodology is to be used in determining the capacity and size of the pipes required in a storm drain system. For more information, refer to these references or the latest publications from the following agencies: A.) Urban Drainage Design Manual, Hydraulic Engineering Circular No. 22,
FHWA, Washington, D.C., August 2001. B.) Drainage of Highway Pavements, Hydraulic Engineering Circular No.
12, FHWA, Washington, D.C., March 1984. C.) Design and Construction of Sanitary and Storm Sewers, ASCE Manual
of Practice No. 37 (WPCF Manual of Practice No. 9), New York, 1976. D.) Design of Urban Highway Drainage – The State of the Art, U.S.
Department of Transportation, FHWA, Washington, D.C., August 1979. E.) Elwyn E. Seelye, Data Book for Civil Engineers, Volume 1 – Design,
Second Edition, New York: Johan Wiley and Sons Inc., 1951. F.) Concrete Pipe Design Manual, American Concrete Pipe Association,
First Edition, 1970. 8-B.2 COMPUTER PROGRAMS The following programs have been approved for use in the design of storm drain systems for LADOTD highways: A.) The LADOTD computer program HYDR6020: “Storm Drain Pipes”. 8-B.3 HYDROLOGIC ANALYSIS Storm drains are designed to operate under surcharged (pressure) full flow conditions whenever applicable although some parts of the storm drain system may flow part-full even at design discharges. Most methods of design or analysis of storm drains involve the computation of either the water surface known as the hydraulic grade line (HGL) or energy grade line (EGL). The only advantage one method might have over the other depends upon which elevation is most useful in design and checking.
8(B) – 1
LADOTD HYDRAULICS MANUAL CONDUIT SYSTEMS HYDRAULICS 2011 8-B.3.1 Energy Grade Line The energy grade line (EGL) is a line showing the total available energy in the system (potential energy plus kinetic energy) and is one velocity head above the hydraulic grade line. 8-B.3.2 Velocity Head Velocity head is a quantity proportional to the kinetic energy of flowing water expressed as a height or head of water. One velocity head is obtained from the equation: Hv = V2/2g Eq. 8-B.3-1 8-B.3.3 Hydraulic Grade Line The hydraulic grade line (HGL) is the water surface elevation along an open channel. In closed conduit systems flowing under pressure, the HGL is the level to which water would rise in a vertical tube at any point along the pipe. Under this "surcharged" condition, the hydraulic grade line may rise in the drain high enough that water could flow out of manholes and inlets at low points in the highway grade. Inundation of the highway can be prevented by increasing the size of storm drain pipes downstream from those areas where the elevation of the hydraulic grade line (HGL) exceeds the elevation of the low manholes and inlets. Increasing the size of the pipe reduces the friction loss in the line as well as other head losses associated with flow velocity. 8-B.4 ENERGY LOSSES Hydraulic grade line computations must account for all energy losses in the storm drain system. Energy losses are functions of flow velocities in drain pipes. Following is a list of the various types of energy losses and the calculations required for their determination. 8-B.4.1 Head Losses/Junction Losses There are various methods of computing energy losses at the junction of several entering flows. However, when compared to other complex methods, the following guideline seems to provide adequate measure of energy losses at flow junctions: a.) one velocity head of the outgoing line for several entering flows b.) half a velocity head of the outgoing line for a single entering flow Use of other values of head loss should be upon the approval of the Hydraulics Design Unit. Manhole losses can be determined by the following equation:
8(B) – 2
LADOTD HYDRAULICS MANUAL CONDUIT SYSTEMS HYDRAULICS 2011 Eq. 8-B.4-1
Kj = head loss coefficient: = 0.5 for single entering flows with entering and exiting pipes of equal size
these
HEC
ss. An
r the culvert
Eq. 8-B.4-2
= 0.5
2
V = average exit velocity, ft/s g = acceleration due to gravity, 32.2ft/s2
V Kj ⎟⎟
⎜⎜
Where: Hj = head loss at flow junctions, ft g2 ⎠⎝
Hj2 ⎞⎛
=
= 1.0 for all other cases V = average velocity of the outgoing pipe, ft/s g = acceleration due to gravity, 32.2 ft/s2 8-B.4.2 Head Loss in Bends and Transitions Due to the limited use of bends and transitions in storm drain design, head losses forstructures will not be discussed in this section. For details on head loss computations for bends and transitions, refer to FHWA publication “Urban Drainage Design Manual,22." 8-B.4.3 Entrance Losses Entrance lo es need to be considered in the storm drain design only at those locations where the system originates at a culvert or an inlet. It is calculated using Equation 8-B.4-2Entrance Loss Coefficient of 0.5 may be used for simplification regardless of the type of inlet
entrance configuration. o Where: He = entrance loss, ft Ke = entrance loss coefficient
⎟⎟⎠
⎞
⎝
⎛V2
⎜⎜=
g2 Ke He
V = average velocity in inlet pipe, ft/s
g = acceleration due to gravity, 32.2 ft/s 8-B.4.4 Exit Losses A submerged storm drain outfall pipe discharging into a receiving stream will produce an energy loss at its outlet equivalent to one velocity head. Therefore exit loss for storm drains can be computed by the following equation: Eq. 8-B.4-3
Where: Ho = exit loss, ft
g2
V 1.0 Ho ⎟⎟⎠
⎞⎜⎜⎝
⎛=
2
8(B) – 3
LADOTD HYDRAULICS MANUAL CONDUIT SYSTEMS HYDRAULICS 2011 8-B.4.5 Friction Losses Friction losses are the most significant energy losses in storm drain systems. Friction loss is the head required to maintain the required flow in a straight alignment against frictional resistance because of pipe roughness. It is determined by the equation:
Eq. 8-B.4-4
S = hydraulic slope required,
Eq. 8-B.4-5
except under certain conditions) V = average velocity of flow, ft/s
divided by wetted perimeter)
-B.5 HYDRAULIC GRADIENT COMPUTATIONS
head ss in manholes and inlets, it is possible to calculate the elevations of the hydraulic gradient
rm drain system.
given design storm at the utfall pipe. When the discharge is into a pond, a perennial stream, or a storm water umping sed as starting
nstances, the esigner usually evaluates the outlet conditions hydraulically. This may require some field
erts, small bridges or other onstrictions should also be considered.
S L ×= Hf
Where: Hf = head loss, ft L = length of pipe, ft determined by Equation 8-B.4-5:
Where: S = hydraulic slope required (not necessarily equal to construction slope
(flow rate divided by area of flow) n = Manning's roughness coefficient (See Chapter 6, Table 6-A.4-1) R = hydraulic radius (area of flow
8 Storm drain system hydraulic gradient computations must always start at the outlet for the system and proceed upstream. After calculating the friction head in pipe lines and thelofrom the outlet to the beginning of the sto 8-B.5.1 Stage Elevation The stage elevation used in design is usually the stage for theop station, the stage for the frequency of the system design should be ugrade. Rarely are such data available for ponds or perennial streams. In such idinformation such as alignment, cross sections, and elevations for some practical length downstream. Other hydraulic structures such as culvc
R 1.486 2/3 ⎭⎩
n S2
⎬⎫
⎨=V⎧
8(B) – 4
LADOTD HYDRAULICS MANUAL CONDUIT SYSTEMS HYDRAULICS 2011 8-B.5.2 HGL for Various Pipe Locations
de line (HGL) t various locations.
a.) HGL for the lower end of e ip HGLO (fo the outf p e -1
b.) HGL for the lower end of the pipe when it is not an outfall
HGLO (for pipes other than the outfall pipe) = Eq. 8-B.5-2
= HGLO + friction head Eq. 8-B.5-3
losses are 0 if pipe is not submerged, exit losses are one velocity head if pipe is subm
-B.5.3 HGL for Various Pip r l C
er end of the pipe, ere are four possible cases. These are e scenarios, e variable definitions are as f llows:
LO = hydraulic grade line elevation of lower end of pipe UP = hydraulic grade line elevation of upper end of pipe
s are one velocity head if pipe is submerged Q = actual discharge of the drainage area draining to the pipe Qcap = the flow capacity the pipe can carry
Equations 8-B.5-1, 8-B.5-2 and 8-B.5-3 are used to compute the hydraulic graa th p e when it is an outfall r all ip ) = stage + exit Eq. 8-B.5 HGUP (next pipe) + manhole loss (next pipe) c.) HGL for the upper end of the pipe HGUP Where: HGLO = hydraulic grade line elevation of lower end of pipe HGUP = hydraulic grade line elevation of upper end of pipe Stage = outlet stage at return period Exit = exit losses: exit erged 8 e Wate Leve onditions Based on the relationship between the HGLO and the elevation of the lowth p sented ir n Table 8-B.5-1. For all fourth o Where: HG HG Stage = outlet stage at return period Exit = exit losses: exit losses are 0 if pipe is not submerged, exit losse
8(B) – 5
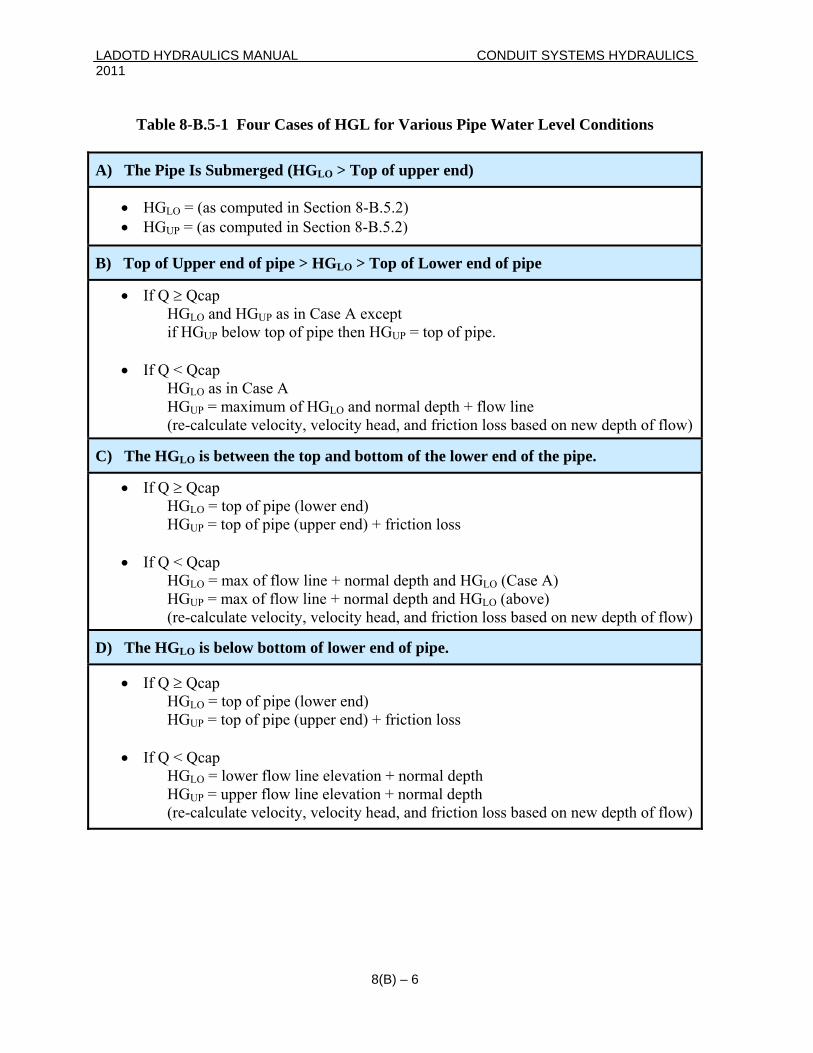
LADOTD HYDRAULICS MANUAL CONDUIT SYSTEMS HYDRAULICS 2011
Table 8-B.5-1 Four Cases of HGL for Various Pipe Water Level Conditions
A) The Pipe Is Submerged (HGLO > Top of upper end)
• HGLO = (as computed in Section 8-B.5.2) • HGUP = (as computed in Section 8-B.5.2)
B) Top of Upper end of pipe > HGLO > Top f Lower endo of pipe
• If Q ≥ Qcap HGLO and HGUP as i se Aif HGUP below top o e the
• If Q < Qcap
HGLO as in Case A HGUP = maximum of HGLO and normal depth + flow line (re-calculate velocity, ve
n ex ept Ca c f pip n HGUP = top of pipe.
locity head, and friction loss based on new depth of flow)
C) top a ottom of the lower end of the pipe. The HGLO is between the nd b
• If Q ≥ Qcap HGLO = top of pipe (lower end) HGUP = top of pipe ( pper end c
• If Q < Qcap HGLO = max of flow line + normal de e A) HGUP = max of flow line + normal depth and HGLO (above) (re-calculate velocity, velocity head, and friction loss based on new depth of flow)
u ) + fri tion loss
pth and HGLO (Cas
D) The HGLO is below bottom of lower end of pipe.
• If Q ≥ Qcap HGLO = top of pipe (lower end) HGUP = top of pipe (upper end) + friction loss
• If Q < Qcap HGLO = lower flow line elevation + normal depth HGUP = upper flow line elevation + normal depth (re-calculate velocity, velocity head, and friction loss based on new depth of flow)
8(B) – 6
LADOTD HYDRAULICS MANUAL CONDUIT SYSTEMS HYDRAULICS 2011 8-B.6 PIPE SELECTION AND PLACEMENT
the remaining storm drain system and size pipe conduits for rcharged-full flow conditions. At the end of Part B of this chapter is a spreadsheet to be
progressing to the utfall pipe.
After determining the placement of the catch basins, the following design procedure may be followed to design suused as an aid in the design of a storm drain system. 8-B.6.1 Design Procedure for Determining Pipe Capacity The following steps should be performed for each pipe, with computationso a.) Inlet Structures – The first four columns give the location of the
structure and the inlets on either end. These numbers are to be
C (Same as structure number Colum e Type; what type of structure
er
.) Pip Lengt
shown on the plans. olumn 1: Line No. of the Pipe )
n 2: Upper End Structur the upper end design number refers to; i.e. whethit is a catch basin (CB) or manhole (MH), etc.
Column 3: Upper End Inlet No. Column 4: Lower End Inlet No. b e h –
n 5: Length of the pipe Colum
c.) Drainage Area Information – Columns 6 through 12 are for the information of the behind the curb or the paved roadway drainage basin, whichever is greater.
Column 6: Hydraulic L ength in feet (the longest length for the
on
rainage ar
lumn n
n 10). Column 12: Total AC; Cumulative values of Column 11.
water to travel, usually the diagonal length rectangular shaped drainage basins.)
basin Column 7: Slope in %, of the drainagecres Column 8: Incremental Area in a
olumn 9: T C otal Area in acres; Cumulative values of deas (Column 8).
Co 10: C, runoff coefficient values mental drainage Colum 11: Incremental AC; Multiply incre
area (Column 8) by runoff coefficient (Colum
8(B) – 7
LADOTD HYDRAULICS MANUAL CONDUIT SYSTEMS HYDRAULICS 2011
d.) Time of Concentration – Enter the Time of Concentration. Calculated later) of concentration for the
Column 13: Travel time in the pipe* (* Column 14: Time, mins.; Total time
pipe e.) Rainfall Intensity – Column 15: Using the time of concentration for
(Column 14), find the correspo the first pipe nding rainfall
intensity from the rainfall intensity curves in
f.)
Chapter 3.
Discharge – Column 16: Q, cfs; Compute the runoff generated by the first
drainage area (Column 12 × Column 15) by the or the first pipe Rational Method (see Chapter 3). F
in the system, the required capacity is equal to the runoff generated by the first drainage area (assume that each inlet has 100% interception ratio).
g.) Pipe Size –
Column 17: Pipe Diam r the first estimate of pipe or the first trial. Use a slope
roughly parallel to the existing surface grade and desirable velocity range in guiding judgment. In
practical to tures. Flow
l accuracy by Manning's
Eq. 8-B.6-1
3/s A = area of flow, ft2
g's roughness coefficient apter 6, Table 6-A.4-1)
S = slope of conduit, ft/ft
igures 8-B.6-1 and 8-B.6-2 provide solutions to Manning's Equation for full flow when the alue of Manning's Roughness Coefficient, n, is equal to 0.012. Plotted on the horizontal ale is the slope in percent. The vertical scale is the design flow. Diagonal lines represent
ipe diameter (or round equivalent diameter for pipe arches) in inches. Velocity lines are also plotted with values along the bottom diagonal line. The required pipe size can be
eter, in.; Entesize. Assume full flow f
flat areas, keep pipe velocities as low asensure minimum head losses in strucrate through a sloping conduit or open channel is given with practicaformula:
Where: Q = rate of flow, ft
n = Mannin
(see Ch R = hydraulic radius (area of flow/wetted perimeter)
2/1S 3/2R n ⎠⎝
486.⎟⎞1 A Q ⎜
⎛=
Fvscp
8(B) – 8
LADOTD HYDRAULICS MANUAL CONDUIT SYSTEMS HYDRAULICS 2011 obtained by projection of a horizontal line from the design flow, Q, and a vertical line from
e slope, S. th h.) Hydraulic Slope – Column 18: The required hydraulic slope is computed from Eq. 8-B.4-5.
i.) Velocity – n 16 and the estimated pipe
size of column 17, compute the velocity. Column 19: Using the total runoff of Colum
j.) Friction Loss – Column 20: Friction loss in ft; Friction loss is computed by multiplying
the length of pipe (Column 5) by the required hydraulic
k.)
slope (Column 18).
Velocity Head – Column 21: Enter the Velocity Head, V2/2g.
l.) Junction Loss –
Enter the Junction Loss (the head loss through inlmanholes). For typical head loss compu
Column 22: ets or tations, see
tion.
m.) Construction Slope
example problem solu –
Enter the construction slope of the pipe.
n.) Travel Time In Pipe
Column 27: –
ity in ipe in
the following relationship: [t = (L/V)(1 min/60 sec)]
o.) Repeat
Column 13: With the length of reach in Column 5 and the velocColumn 19, determine the time of travel in the pminutes from
– Repeat ct of drainage area ), and the time of
d drainage area inage area plus time of flow for
tation progresses, pipe ith a cumulative "AC" multiplied by a
f concentration equal to the inage
area on the syst to the
procedure for next run of pipe using cumulative produand runoff coefficient (Column 12
concentration equal to the time of concentration for the seconor the time of concentration for the first drathe first pipe (Column 13), whichever is greater. As the compu
flow is computed wrainfall intensity derived by using a time olargest time obtained by combining the overland flow time for any dra
em with the pipe flow time from that drainage area pipe under construction.
8(B) – 9
LADOTD HYDRAULICS MANUAL CONDUIT SYSTEMS HYDRAULICS 2011 8-B.6.2 Hydraulic Gradient Computations
ystem hy auli gr e system. With te the
elevations of the hydraulic gradient (Columns 23 and 24) from the outlet to the beginning of e storm drain system.
S dr c adient computations must always start at the outlet for ththe friction loss (Column 20) and the junction loss (Column 22), it is possible to calcula
th p.) Gutter or Inlet Top Elevation –
Enter the street elevation at the upper end of the reThis will be the top of manhole, top of inlet grate, flowof gutter or
Column 25: ach. line
other pertinent elevation. q.) Hydraulic Clearance –
Compute the hydraulic clearance; the difference bethe street elevation (Column 25) and the hydraulic line.
ion
Column 26: tween grade
8-B.6.3 Flow Line Determinat
Slope r.) Construction –
s.) Upper Flow Line
Column 27: Enter the construction slope of the pipe.
s – The upper flow line elevation is determined.
es
Column 28: t.) Lower Flow Lin –
Flow lines or invert elevations are determined satisfactory hydraulic grades have been established.
Column 29: after
u.) Remarks –
mn 30 arks here.
Colu : Enter any pertinent rem
8(B) – 10
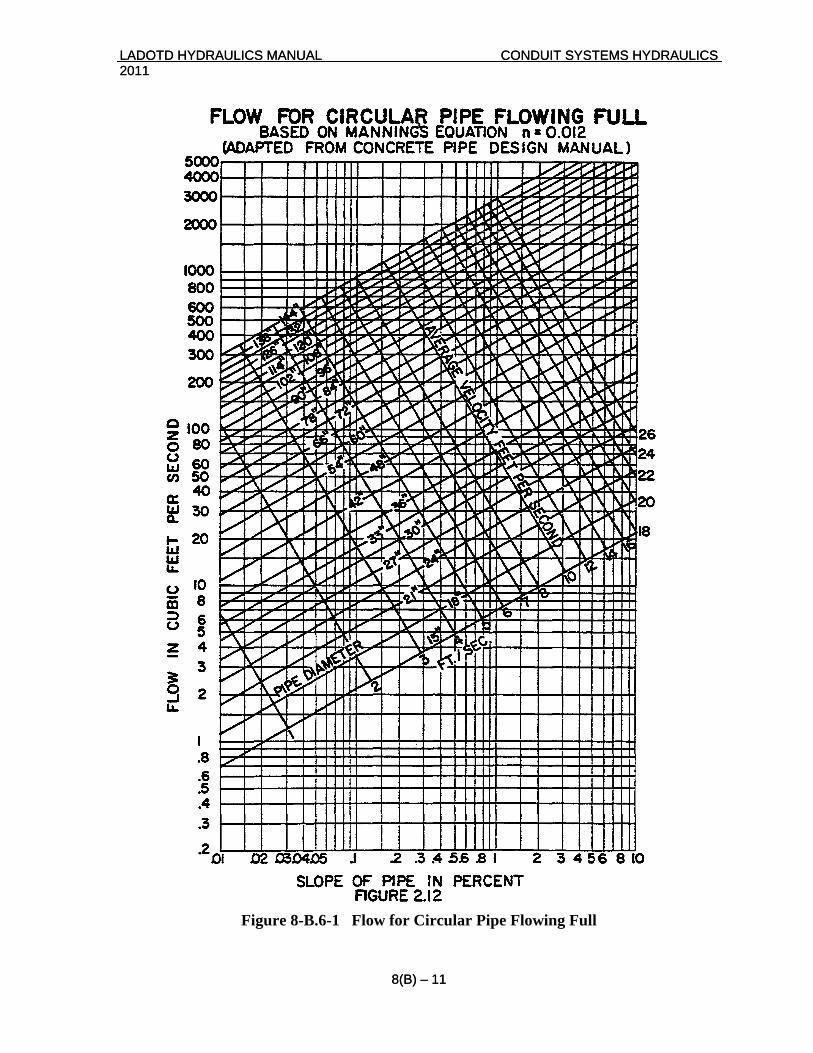
LADOTD HYDRAULICS MANUAL CONDUIT SYSTEMS HYDRAULICS 2011
LADOTD HYDRAULICS MANUAL CONDUIT SYSTEMS HYDRAULICS 2011
8(B) – 11
Figure 8-B.6-1 Flow for Circular Pipe Flowing Full
8(B) – 11
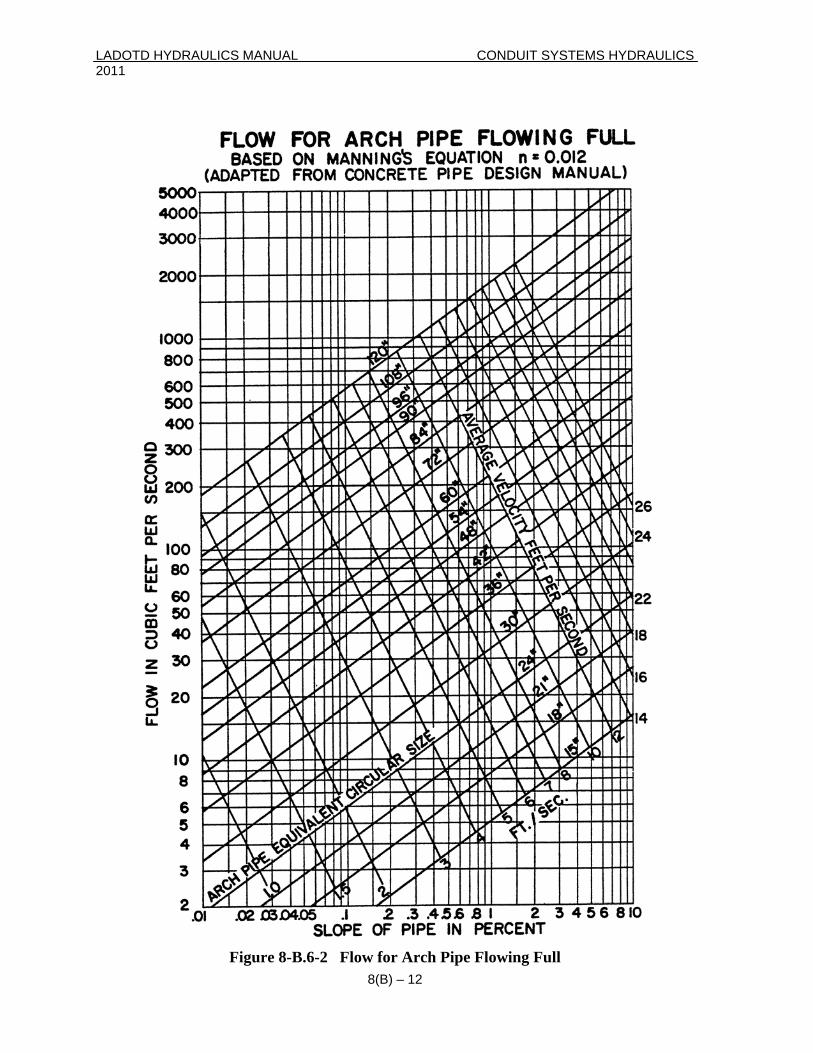
LADOTD HYDRAULICS MANUAL CONDUIT SYSTEMS HYDRAULICS 2011
Figure 8-B.6-2 Flow for Arch Pipe Flowing Full 8(B) – 12
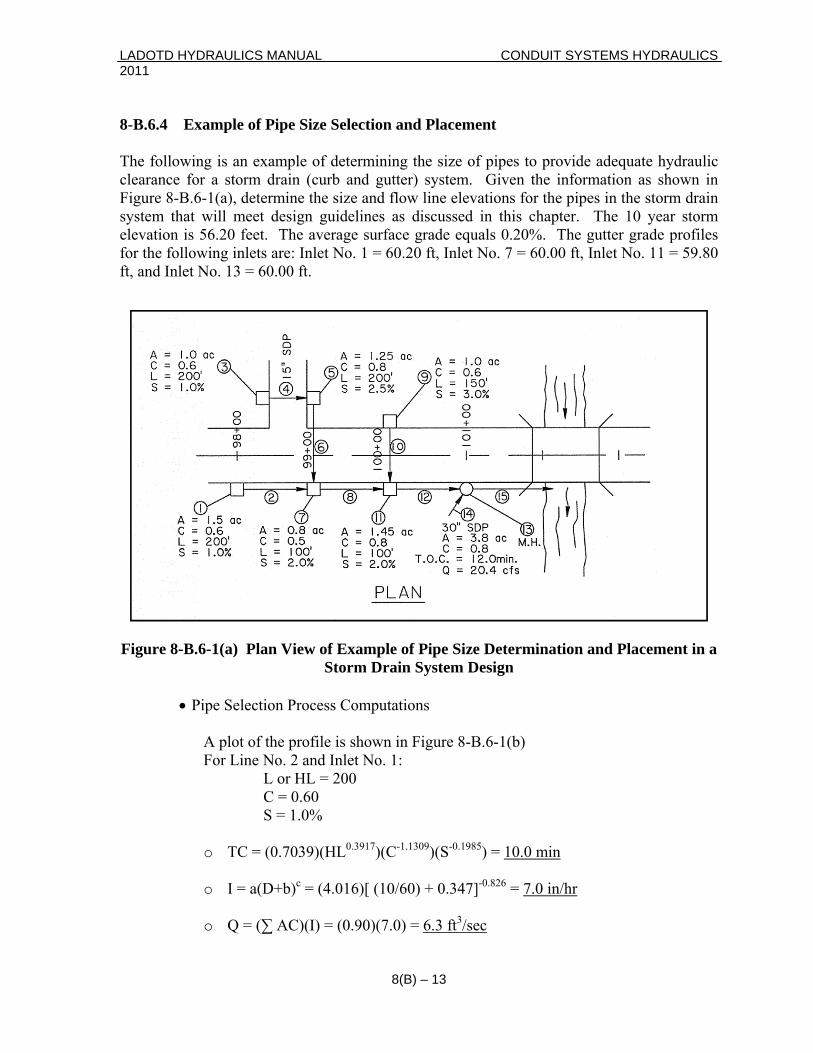
LADOTD HYDRAULICS MANUAL CONDUIT SYSTEMS HYDRAULICS 2011 8-B.6.4 Example of Pipe Size Selection and Placement The following is an example of determining the size of pipes to provide adequate hydraulic clearance for a storm drain (curb and gutter) system. Given the information as shown in Figure 8-B.6-1(a), determine the size and flow line elevations for the pipes in the storm drain system that will meet design guidelines as discussed in this chapter. The 10 year storm elevation is 56.20 feet. The average surface grade equals 0.20%. The gutter grade profiles for the following inlets are: Inlet No. 1 = 60.20 ft, Inlet No. 7 = 60.00 ft, Inlet No. 11 = 59.80 ft, and Inlet No. 13 = 60.00 ft.
Figure 8-B.6-1(a) Plan View of Example of Pipe Size Determination and Placement in a
Storm Drain System Design
• Pipe Selection Process Computations A plot of the profile is shown in Figure 8-B.6-1(b) For Line No. 2 and Inlet No. 1: L or HL = 200 C = 0.60 S = 1.0%
o TC = (0.7039)(HL0.3917)(C-1.1309)(S-0.1985) = 10.0 min
o I = a(D+b)c = (4.016)[ (10/60) + 0.347]-0.826 = 7.0 in/hr
o Q = (∑ AC)(I) = (0.90)(7.0) = 6.3 ft3/sec
8(B) – 13
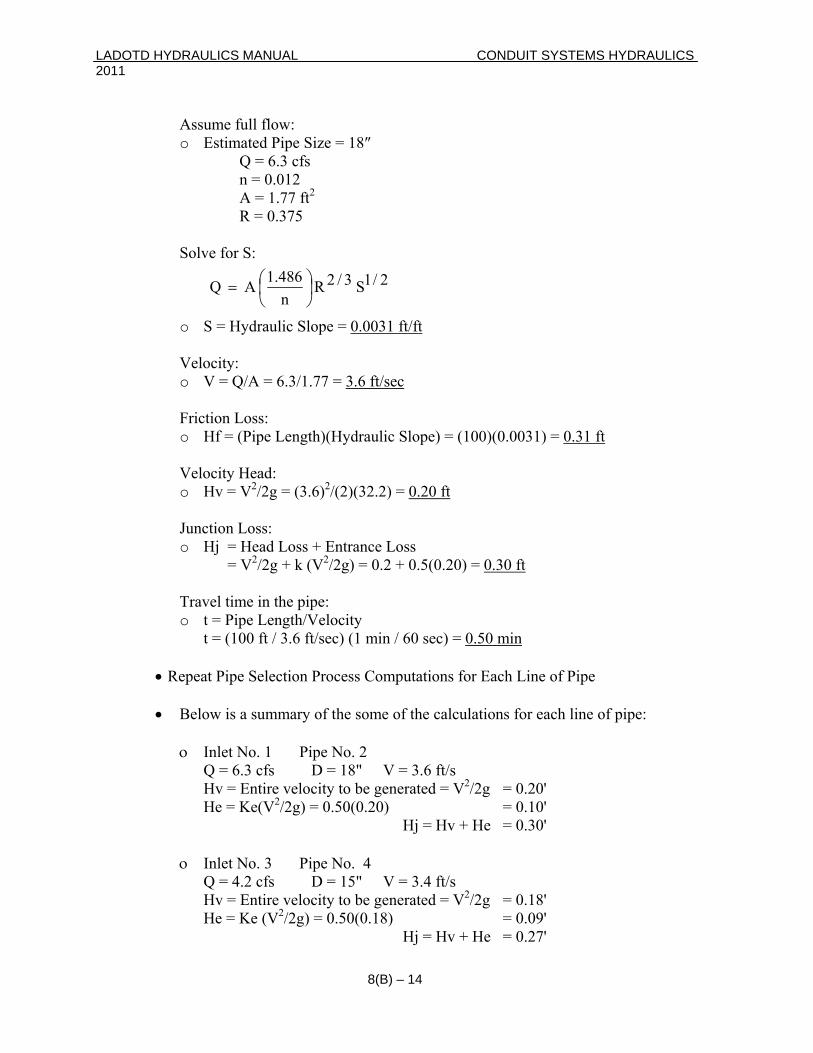
LADOTD HYDRAULICS MANUAL CONDUIT SYSTEMS HYDRAULICS 2011
Assume full flow: o Estimated Pipe Size = 18″
Q = 6.3 cfs n = 0.012 A = 1.77 ft2 R = 0.375
Solve for S:
o S = Hydraulic Slope = 0.0031 ft/ft
2/1S 3/2R n486.1 A Q ⎟
⎠⎞
⎜⎝⎛=
Velocity: o V = Q/A = 6.3/1.77 = 3.6 ft/sec
Friction Loss:
o Hf = (Pipe Length)(Hydraulic Slope) = (100)(0.0031) = 0.31 ft Velocity Head:
o Hv = V2/2g = (3.6)2/(2)(32.2) = 0.20 ft Junction Loss:
o Hj = Head Loss + Entrance Loss = V2/2g + k (V2/2g) = 0.2 + 0.5(0.20) = 0.30 ft Travel time in the pipe:
o t = Pipe Length/Velocity t = (100 ft / 3.6 ft/sec) (1 min / 60 sec) = 0.50 min
• Repeat Pipe Selection Process Computations for Each Line of Pipe
• Below is a summary of the some of the calculations for each line of pipe:
ο Inlet No. 1 Pipe No. 2 Q = 6.3 cfs D = 18" V = 3.6 ft/s Hv = Entire velocity to be generated = V2/2g = 0.20' He = Ke(V2/2g) = 0.50(0.20) = 0.10' Hj = Hv + He = 0.30' ο Inlet No. 3 Pipe No. 4 Q = 4.2 cfs D = 15" V = 3.4 ft/s Hv = Entire velocity to be generated = V2/2g = 0.18' He = Ke (V2/2g) = 0.50(0.18) = 0.09' Hj = Hv + He = 0.27'
8(B) – 14
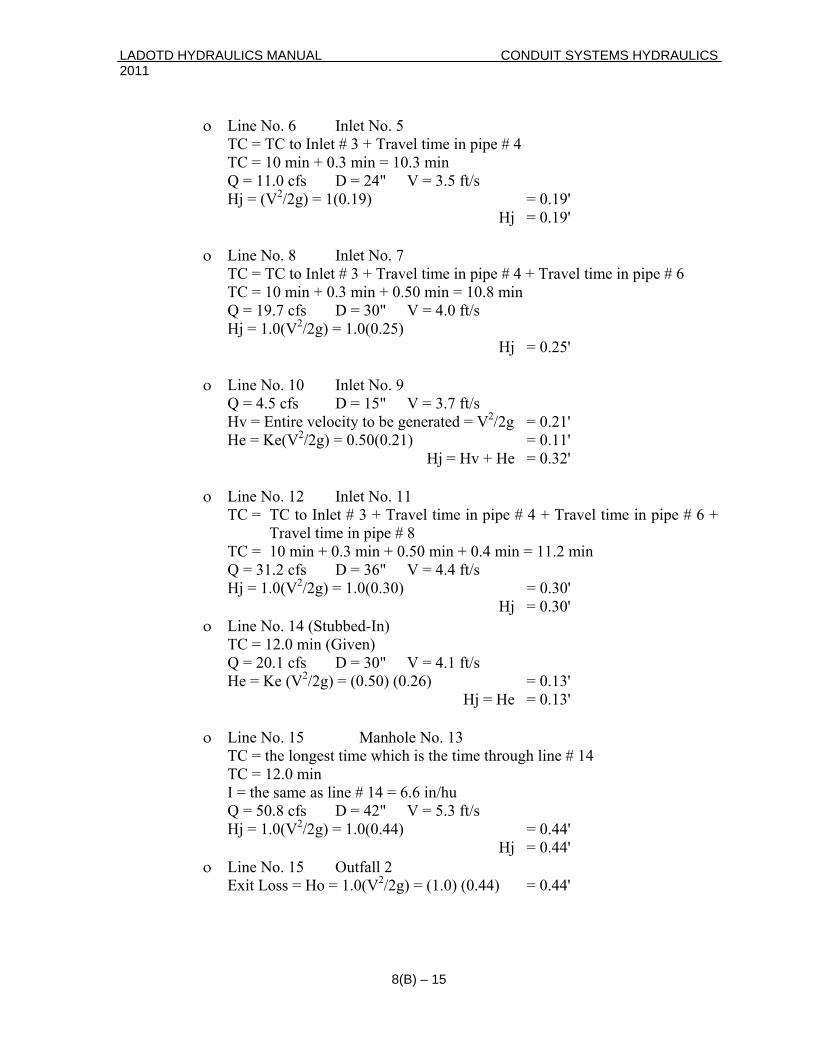
LADOTD HYDRAULICS MANUAL CONDUIT SYSTEMS HYDRAULICS 2011 ο Line No. 6 Inlet No. 5 TC = TC to Inlet # 3 + Travel time in pipe # 4
et # 3 + Travel time in pipe # 4 + Travel time in pipe # 6 TC = 10 min + 0.3 min + 0.50 min = 10.8 min
Q = 19.7 cfs D = 30" V = 4.0 ft/s Hj = 1.0(V2/2g) = 1.0(0.25) Hj = 0.25' ο Line No. 10 Inlet No. 9 Q = 4.5 cfs D = 15" V = 3.7 ft/s Hv = Entire velocity to be generated = V2/2g = 0.21' He = Ke(V2/2g) = 0.50(0.21) = 0.11' Hj = Hv + He = 0.32' ο Line No. 12 Inlet No. 11 TC = TC to Inlet # 3 + Travel time in pipe # 4 + Travel time in pipe # 6 +
Travel time in pipe # 8 TC = 10 min + 0.3 min + 0.50 min + 0.4 min = 11.2 min Q = 31.2 cfs D = 36" V = 4.4 ft/s Hj = 1.0(V2/2g) = 1.0(0.30) = 0.30' Hj = 0.30' ο Line No. 14 (Stubbed-In)
Q = 20.1 cfs He = Ke (V2/2g) = (0.50) (0.26) = 0.13'
Hj = He = 0.13'
is the time through line # 14
I = th 14 = 6.6 in/hu Q = 5 D = 42" V = 5.3 ft/s
Hj = 1.0(V /2g) = 1.0(0.44) = 0.44' ' Line No. 15 Outfall 2
TC = 10 min + 0.3 min = 10.3 min Q = 11.0 cfs D = 24" V = 3.5 ft/s Hj = (V2/2g) = 1(0.19) = 0.19' Hj = 0.19' ο Line No. 8 Inlet No. 7 TC = TC to Inl
TC = 12.0 min (Given) D = 30" V = 4.1 ft/s
ο Line No. 15 Manhole No. 13 TC = the longest time which
TC = 12.0 min line # e same as
0.8 cfs 2
Hj = 0.44ο
Exit Loss = Ho = 1.0(V2/2g) = (1.0) (0.44) = 0.44'
8(B) – 15
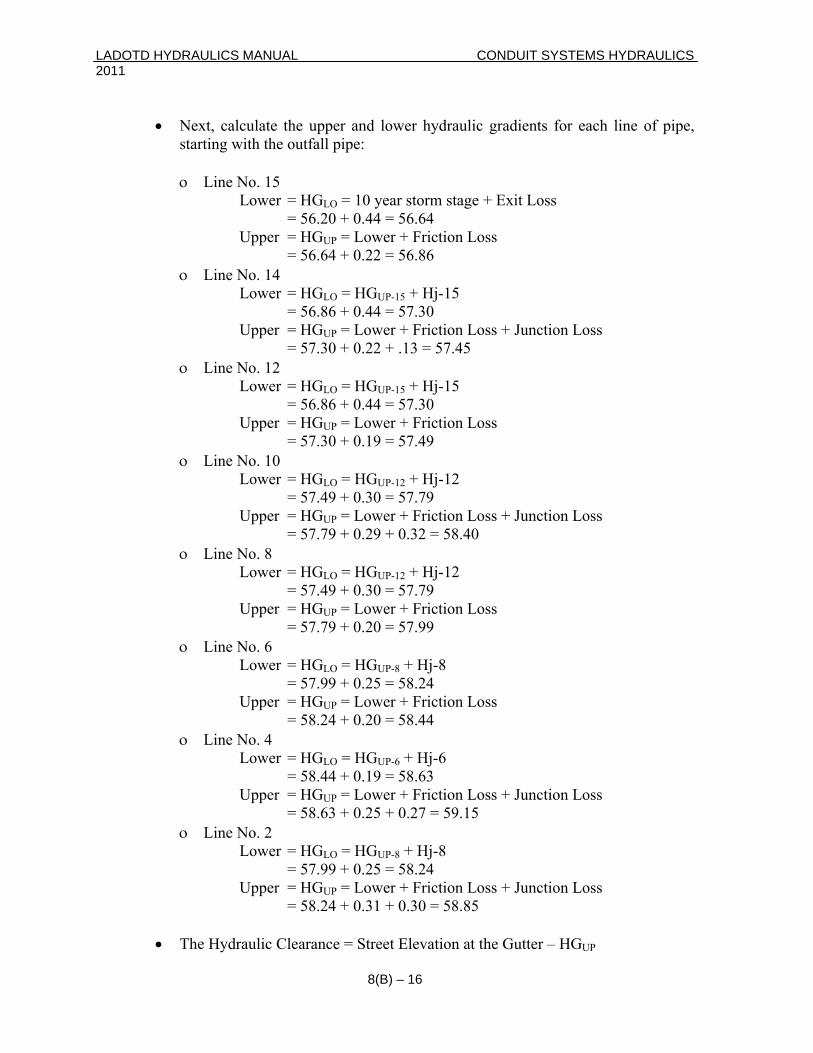
LADOTD HYDRAULICS MANUAL CONDUIT SYSTEMS HYDRAULICS 2011
• Next, calculate the upper and lower hydraulic gradients for each line of pipe,
= 10 year storm stage + Exit Loss + 0.44 = 56.64 Upper = HGUP = Lower + Friction Loss = 56.64 + 0.22 = 56.86 ο Line No. 14 Lower = HGLO = HGUP-15 + Hj-15 = 56.86 + 0.44 = 57.30 ction Loss + Junction Loss = 57.30 + 0.22 + .13 = 57.45
Hj-15 = 56.86 + 0.44 = 57.30 HG = Lower + Friction Loss UP = Lower + Friction Loss + Junction Loss = 58.40
=
Loss
ine No. 2 = + Hj-8 = 57.99 + 0.25 = 58.24
+ on Loss
he ydraulic Clear nce = Stre t UP
starting with the outfall pipe: ο Line No. 15 Lower = HGLO = 56.20
Upper = HGUP = Lower + Fri
ο Line No. 12 Lower = HGLO = HGUP-15 +
Upper = UP = 57.30 + 0.19 = 57.49
ο Line No. 10 Lower = HGLO = HGUP-12 + Hj-12 = 57.49 + 0.30 = 57.79 Upper = HG = 57.79 + 0.29 + 0.32
ο Line No. 8 Lower = HGLO = HGUP-12 + Hj-12
= 57.49 + 0.30 = 57.79 Upper = HG UP = Lower + Friction Loss
= 57.79 + 0.20 = 57.99 ο Line No. 6
Lower = HGLO = HGUP-8 + Hj-8 = 57.99 + 0.25 = 58.24
Upper = HGUP = Lower + Friction Loss = 58.24 + 0.20 = 58.44
ο Line No. 4 Lower HG = HGULO P-6 + Hj-6 8.44 + 0.1 = 58.63 = 5 9 Upper = HG = Lower + Friction Loss + JunctionUP = 58.63 + 0.25 + 0.27 = 59.15 ο L Lower HGLO = HGUP-8 Upper G = Lo er + Friction= H UP w Loss Juncti = 58.24 + 0.31 + 0.30 = 58.85
• T H a e Elevation at the Gutter – HG
8(B) – 16
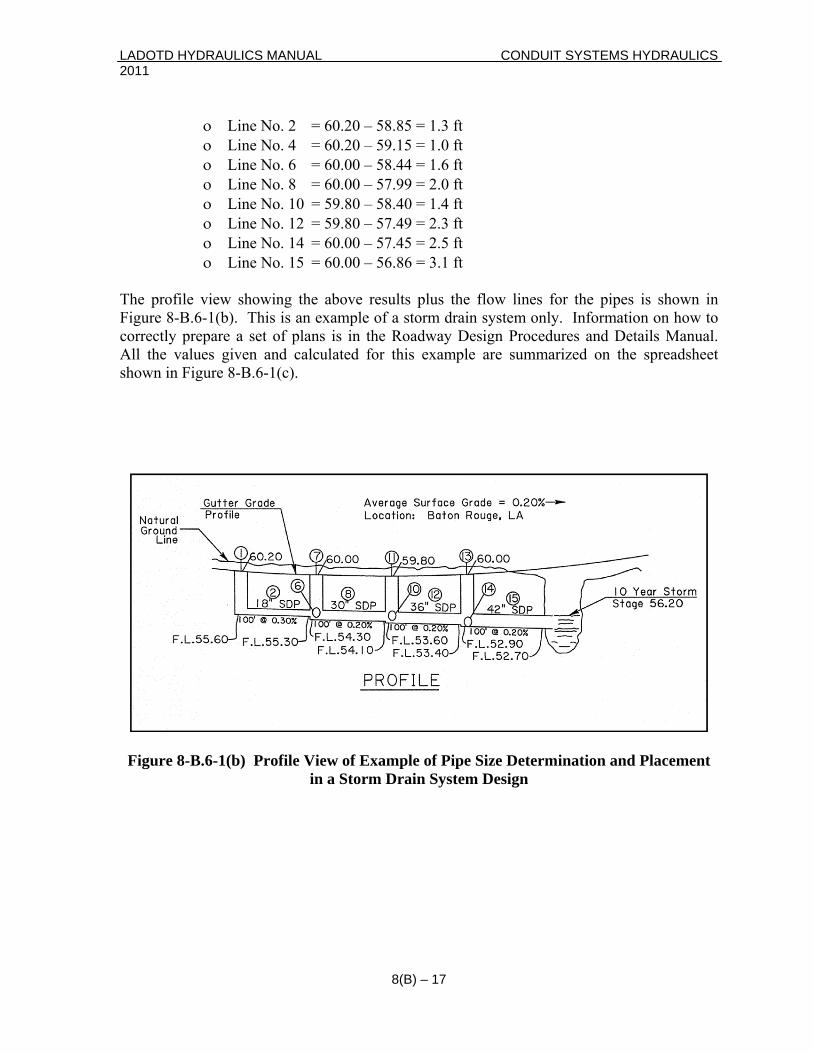
LADOTD HYDRAULICS MANUAL CONDUIT SYSTEMS HYDRAULICS 2011 ο Line No. 2 = 60.20 – 58.85 = 1.3 ft
t 6 9
8.4 .4 ft No. 12 = 59.80 – 57.49 = 2.3 ft
= 60.00 – 57.45 = 2.5 ft
s for the pipes is shown in yste only. Information on how to
ctly ig d Details Manual. the v and calcul ple ar n the spreadsheet
Figure B -1 and Placement m Design
ο Line No. 4 = 60.20 – 59.15 = 1.0 ft ο Line No. 6 = 60.00 – 58.44 = 1.6 f ο Line No. 8 = 0.00 – 57. 9 = 2.0 ft ο Line No. 10 = 59.80 – 5 0 = 1 ο Line ο Line No. 14
ο Line No. 15 = 60.00 – 56.86 = 3.1 ft The profile view showing the above results plus the flow lineFigure 8-B.6-1(b). This is an mple of a storm drain sexa m
e et of plans i the Ro ay Descorr prepare a s s in adw n Procedures anll alues given ated for this exam e summarized oA
shown in Figure 8-B.6-1(c).
8- .6 (b) Profile View of Example of Pipe Size Determination
in a Storm Drain Syste
8(B) – 17
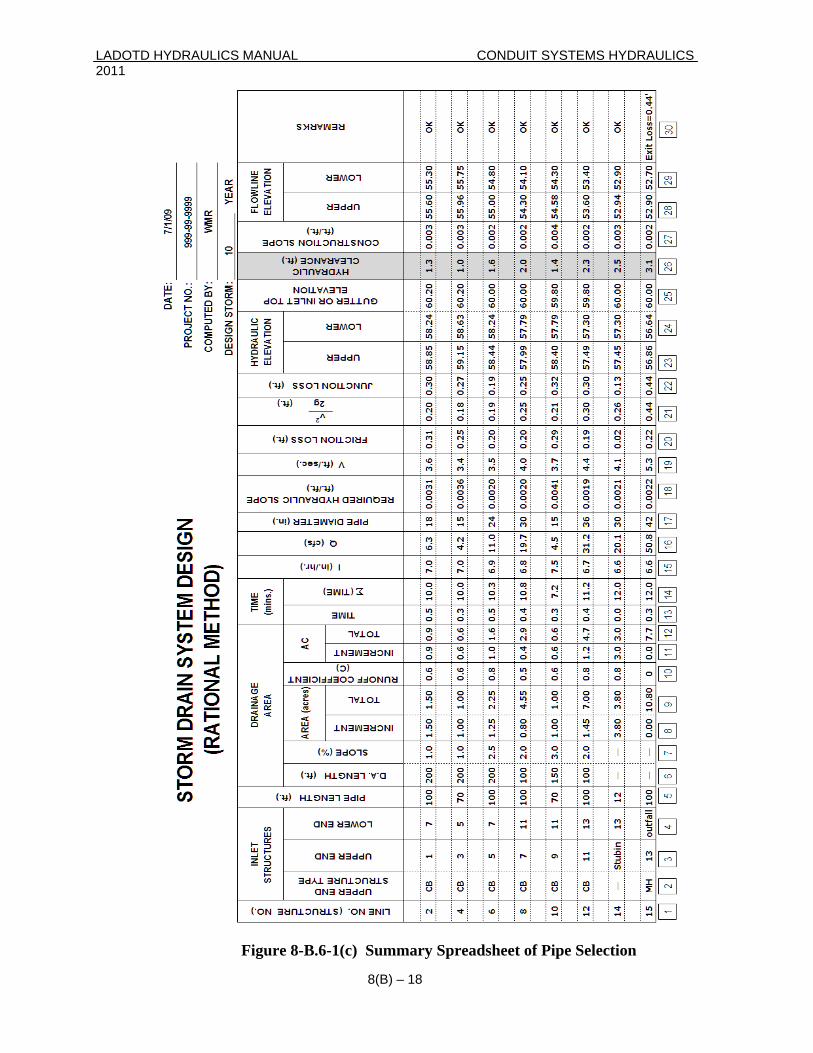
LADOTD HYDRAULICS MANUAL CONDUIT SYSTEMS HYDRAULICS 2011
8(B) – 18
tion
Figure 8-B.6-1(c) Summary Spreadsheet of Pipe Selec
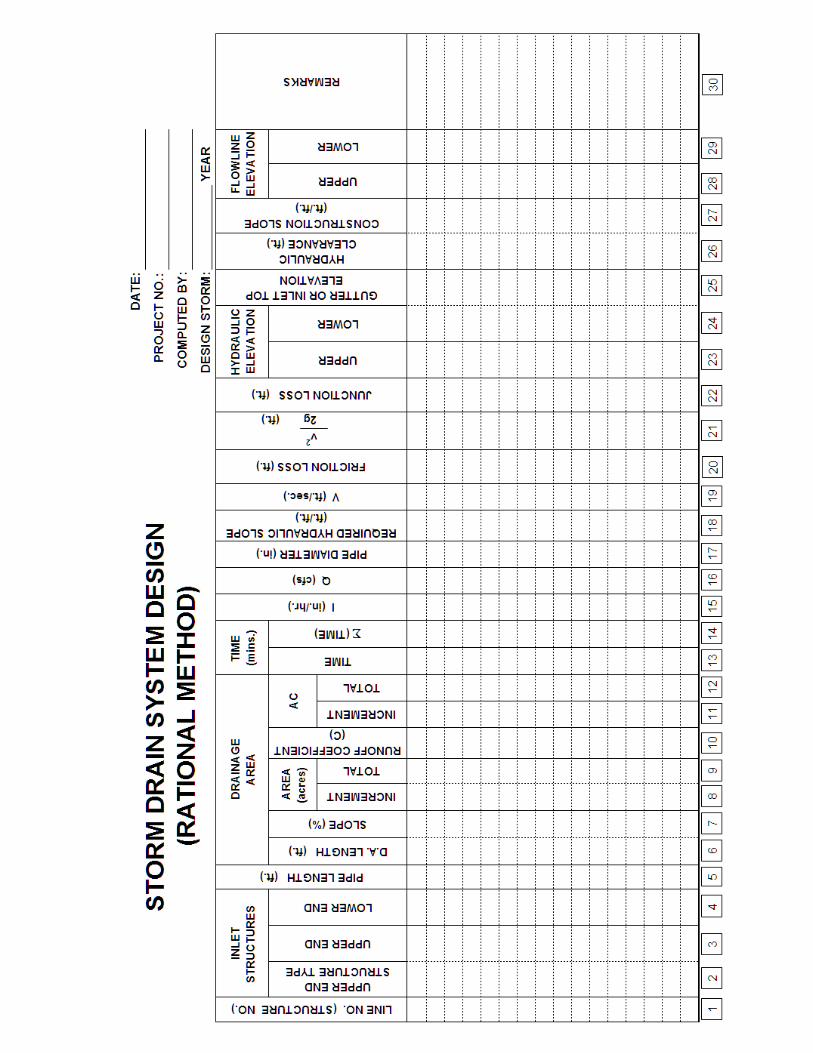

This page intentionally left blank.

LADOTD HYDRAULICS MANUAL WETLANDS 2011
CHAPTER 9 DRAINAGE DESIGN IN WETLANDS
9.1 PURPOSE This chapter describes general drainage design policy for wetland areas. This policy is designed to fit average conditions; therefore, some areas or projects will require modification of this policy. The Hydraulics Unit should be consulted when unusual situations require such modification. The purpose of this policy is to provide drainage which will accommodate a wide range of flow conditions, from everyday sheet flow to large major storms, and do so with negligible changes to existing conditions. A thorough examination of aerial photographs, quadrangle maps, plans, gage records, etc., is required to give the drainage designer a minimum comprehensive overview of a project. This should be supplemented by a field trip to further familiarize the designer with the terrain. 9.2 TERMINOLOGY A.) Wetlands: Lowlands covered with shallow and sometimes temporary or
intermittent waters, which are valuable to the aquatic food chain because of its nutrient output, and whose high nutrient productivity and supply depends to some extent on sheet flow. Wetlands may be salt marsh, freshwater marsh, tree swamp or combinations and variations thereof, and may or may not be subject to tidal action. Slopes are very slight and drainage slow.
B.) Sheet Flow: The type of water flow taking place in most areas of the
wetlands. Flow not contained in a defined or discernible waterway (such as bayou) but rather flowing overland in a "sheet" which is of a relatively constant depth when compared to varying depths of flows occurring in streams, rivers, etc.
C.) Major Drainage Structure: One in, or over, a defined, discernible
waterway such as a bayou, ditch, or canal; hereinafter referred to as a major structure; may be a culvert or a bridge.
D.) Minor Drainage Structure: A culvert which does not serve a defined,
discernible stream; hereinafter referred to as a minor structure. E.) Drainage Area: The area contributing runoff to a particular drainage
structure.
9 – 1
LADOTD HYDRAULICS MANUAL WETLANDS 2011 9.3 DESIGN STORM FREQUENCY The minimum design storm frequency used for major structures will be 50 years, regardless of the class of highway. For minor structures, a 5-year return interval design storm shall be required. 9.4 DRAINAGE AREA Because of the extremely flat terrain, there are many uncertainties associated with wetlands drainage design. For example, in other terrains, determining the drainage area is relatively easy. In wetlands areas, the drainage area is much more difficult to determine. Hilly country has many easily discerned ridge lines which defines the drainage area readily. In wetlands areas, there are usually no ridge lines, and a line which may accurately define a drainage area today may be incorrect tomorrow due to wind shifts, tide, and/or rainfall changes, etc. Drainage areas may be assigned in wetlands areas with acceptable accuracy, considering the following criteria. 9.4.1 Stream Size In determining the placement of a drainage area boundary between two waterways remember that the larger the stream, the larger the area of influence during major floods. Also, drainage areas in this terrain should tend to have their width equally divided by their waterways in most cases. 9.4.2 Direction of Sheet Flow Inside a particular major drainage area, the influence of the central waterway on sheet flow direction decreases as the distance from the waterway increases. For example, if the general or average sheet flow direction is from north to south and the general direction of flow in the waterway is from north to south, a drop of water falling near the stream may actually flow southeast or southwest until reaching the stream. 9.4.3 Channels
Man-made or improved channels usually offer some impediment to sheet flow intersecting them. This is due to the combination of two effects; the spoil banks, and the lesser resistance to flow in the channel. Often such channels may be a portion of a drainage area's boundaries.
9 – 2
LADOTD HYDRAULICS MANUAL WETLANDS 2011 9.5 CHANNEL REQUIREMENTS In order to minimize disruptions to sheet flow, collector (upstream) and distributor (downstream) channels are required. These channels should parallel the roadway and be constructed outside of the spoil bank or embankment (if no spoil bank). These channels are to be blocked near the major structures. It should be remembered that due to hurricanes, abnormally high tides, etc., collector and distributor channels may switch functions. These channels should be designed accordingly. 9.5.1 Channel Depth In designing channel depths, locations, etc., it should be remembered that their purpose is to help maintain sheet flow as close to its original pattern as possible. Channels should neither raise nor lower preconstruction water levels. 9.5.2 Required Channel Dimensions Normally, a four foot bottom channel, two feet deep, (below average natural ground line) with 4:1 side slopes will usually suffice, as the everyday flow serviced is quite slow. 9.5.3 Channel Grade A 0.00% channel grade is acceptable. 9.6 CULVERT REQUIREMENTS 9.6.1 Minimum Spacing Minor structures should be spaced between 500 and 1500 feet apart. Spacing should be varied (by changing the number of structures) to achieve structures which yield differential heads near the allowable. 9.6.2 Flow Lines Flow lines may be set below distributor and collector channel bottom elevations or waterway bottom profiles by a dimension equal to one-third the height of circular, square or rectangular culverts, or one quarter the rise of arch pipes. This dimension is not to exceed one foot.
9 – 3
LADOTD HYDRAULICS MANUAL WETLANDS 2011 9.6.3 Structure Size The minor structure sizes will depend upon their design flow (which depends on the number of structures), the allowable differential head, structure type, and the vertical distances between channel bottoms and normal water surface. 9.6.4 Differential Head Major Drainage Structures:
All major drainage structures shall be designed for 0.5 to 1.0 feet of differential head for a storm with a fifty year return interval.
Minor Drainage Structures:
Minor structures shall be designed for approximately 0.5 feet of differential head for a five year return interval.
9.6.5 Soffits Major Drainage Structures:
The soffits of all major structures may be a maximum of one foot above the average water level.
Minor Drainage Structures:
The soffits of all minor structures should be no higher than 6" above the average water level.
9.7 WETLANDS DRAINAGE DESIGN EXAMPLE The following are the steps in designing the necessary structures for the conditions shown in Figure 9.7-1. Table 9.7-1 displays the final structure information. 9.7.1 Flow Characteristic The area is in what is considered wetlands. It is assumed to have sheet flow.
9 – 4
LADOTD HYDRAULICS MANUAL WETLANDS 2011 9.7.2 Drainage Area Major drainage areas, as well as minor drainage areas, are not actually defined by ridge lines, but are arbitrarily determined considering:
a.) The larger the waterway, the greater its drainage area.
b.) The shorter the distance to a waterway, the greater the effect that waterway has on sheet flow direction.
c.) Man-made or improved channels usually offer some impediment to sheet flow. The older they are the less likely they are to contain breaks. Additionally, the canal itself offers a path of less resistance.
Major Drainage Structures:
The major structures will be designed for these areas: structure Number 5 for the area bounded by A-B-J-D-E-F-A, and structure Number 12 for the area bounded by F-E-D-J-H-I-F. (See Figure 9.7-1)
Minor Drainage Structures:
The remaining minor structures will have portions of the major drainage areas reassigned to them by the following approach:
Upper boundaries will be assigned by approximating a line separating
areas which would drain to the waterway, from areas which would drain to the roadway. These lines are represented in the drawing by B-C so that a drop of rain falling slightly to the west of it will flow in such a direction as to intersect the roadway instead of the waterway. Conversely, a drop of rain falling slightly to the east of B-C would intersect the waterway before draining across the roadway.
The procedure for locating such a line is to set it at an angle ∆ to the
average waterway alignment near the roadway (see Figure 9.7-1). In setting this angle, the relative effect that the waterway has on the hydraulic gradient within its drainage area should be considered. In general, the narrower the drainage area and the larger the waterway, the greater the waterway's influence and the larger the angle ∆ should be. Other parameters are: stream flow direction relative to sheet flow direction, magnitude of stream's natural levee or manmade spoil bank, and number of openings in those levees and/or spoil banks. Angles of 30 and 45 degrees will usually be descriptive.
The total drainage area for the minor structures should now be determined.
9 – 5
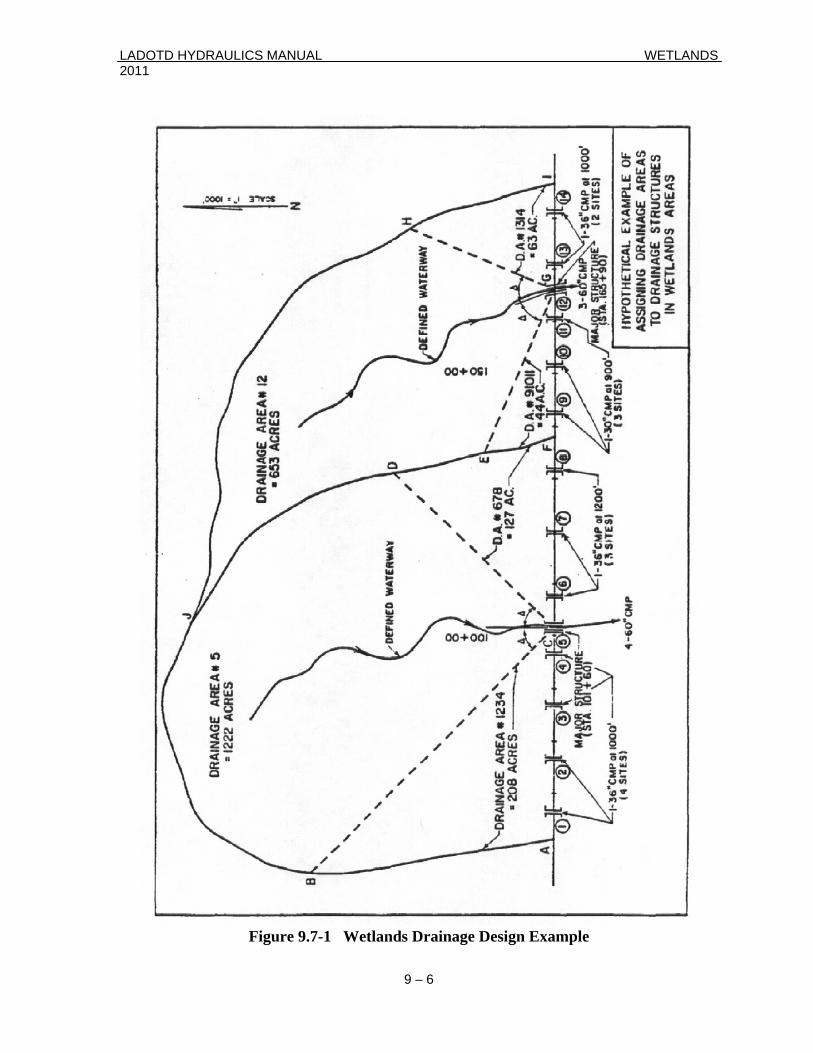
LADOTD HYDRAULICS MANUAL WETLANDS 2011
9 – 6
Figure 9.7-1 Wetlands Drainage Design Example
LADOTD HYDRAULICS MANUAL WETLANDS 2011 9.7.3 Discharge Major Drainage Structures:
The design Q is for a 50-year return interval. Use the NRCS method to determine the runoff with the following:
CN = 80 I = 12" (24 hours) S = 0.1%
Multiply the design Q by 0.55 (wetlands reduction factor for 50-year return interval).
Entire area "above" centerline considered, no reduction for equalizers Minor Drainage Structures:
The design Q is for a 5-year return interval. Use the NRCS method to determine the runoff with the following:
CN = 80 I = 8" (24 hours) S = 0.1%
Multiply the design Q by 0.45 (wetlands reduction factor for 5-year return interval). Areas to be determined as shown in Figure 9.7-1, ∆ = 30° – 45°. The more the expected effect of the major waterway on gradients, the greater the angle ∆.
The runoff (Q) is calculated for the total drainage area for minor structures. This total runoff should be divided into n equal portions, n being the number of minor structures. (Q each structure = (Q total)/(No. Of structures)) For example, D.A. Number 1234 has a total area of 208 acres, which produces 68 cfs for a five year storm. This runoff of 68 cfs divided by four yields 17 cfs, the assigned Q for each minor structure within D.A. Number 1234 (defined by A-B-C-A).
9.7.4 Structure Size Major Drainage Structures:
Major structures are sized for a differential head (ΔH). ΔH = 0.5' to 1.0' assuming:
• Cross Drain Pipe, no headwalls • Length = 180' • Tailwater = height of the structure • Outlet control • S = 0.00001 feet per feet
9 – 7
LADOTD HYDRAULICS MANUAL WETLANDS 2011 Minor Drainage Structures:
Minor structures sized same as major structures with the exception that ΔH = 0.5'. 9.7.5 Structure Spacing Major Drainage Structures:
There are no limits for major structure spacing. Major structures are to be placed where the discernable waterways are located.
Minor Drainage Structures:
Limits: Minimum = 500' Maximum = 1500'
Spacing: Distance between edge of assigned drainage areas and major structures divided by the number of pipes
Exterior structures (outside structures in any particular drainage area) are spaced at
one half spacing to major structure or drainage area boundary. 9.7.6 Collector and Distributor Channels
• Collector channels on upstream side, plugged at major structures. • Distributor channels on downstream side, plugged at major structures. • Standard channel (collector and distributor):
Bottom width = 4' Depth = 2' Side slopes = 4:1 Grade = 0%
9 – 8
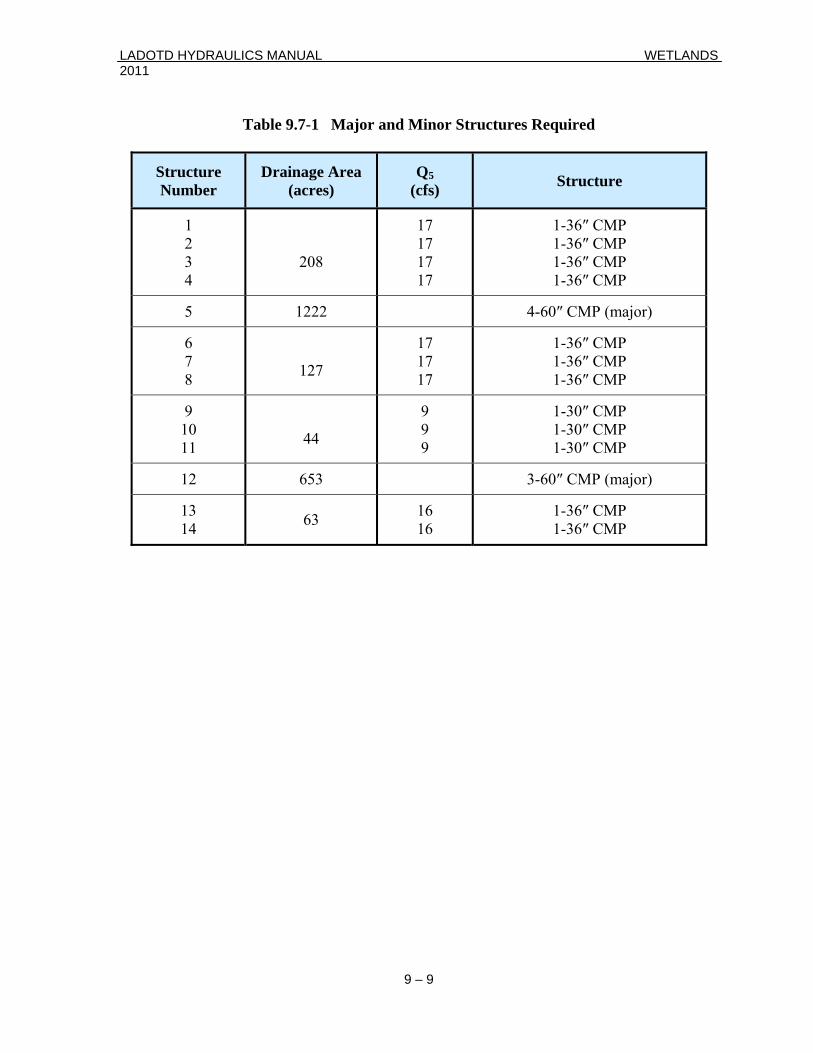
LADOTD HYDRAULICS MANUAL WETLANDS 2011
Table 9.7-1 Major and Minor Structures Required
Structure Number
Drainage Area
(acres) Q5
(cfs)
Structure
1 2 3 4
208
17 17 17 17
1-36″ CMP 1-36″ CMP 1-36″ CMP 1-36″ CMP
5
1222 4-60″ CMP (major)
6 7 8
127
17 17 17
1-36″ CMP 1-36″ CMP 1-36″ CMP
9 10 11
44
9 9 9
1-30″ CMP 1-30″ CMP 1-30″ CMP
12
653 3-60″ CMP (major)
13 14
63 16
16 1-36″ CMP 1-36″ CMP
9 – 9

LADOTD HYDRAULICS MANUAL WETLANDS 2011
9 – 10
This page intentionally left blank.
LADOTD HYDRAULICS MANUAL PUMPING STATIONS AND WET WELLS 2011
CHAPTER 10 STORM WATER PUMPING STATIONS
10.1 GENERAL The quantity of storm water runoff reaching a pumping station is determined by hydrologic analysis of the regional rainfall events, characteristics of the watershed, and the hydraulics of the collection system (gutters, inlets, ditches, channels, and conduits). In the design of storm water pumping stations, it is necessary not only to determine the peak flow, but also to define the variation of flow rate with time (inflow hydrograph). The inflow hydrograph is the basis for the economical design (pump sizes and wet well capacity) of pumping stations. When two or more drainage basins drain into a pumping station, a composite hydrograph should be developed and used as the inflow hydrograph. The incoming main drain should also be large enough to carry the design peak flow for the pumping station. It is generally not economical to size the pumps to accommodate the peak inflow rate or to provide variable pumping capacity to match exactly the inflow hydrograph. The use of available storage volume allows for the pumping capacities which are smaller than peak discharge rates. The basic relationship on which design is based is: Outflow = Inflow − Storage. 10.2 DESIGN FREQUENCIES The recommended design frequencies are:
• For storm drains in residential areas, 5 to 10 years. • For storm drains in commercial and high-value districts, 10 to 50 years. • For flood protection works and depressed roadways, 50 years or more.
Depending on economic justification, the proper storm frequency should be selected at the pre-design conference. 10.3 INFLOW HYDROGRAPH There are several methods for the development of inflow hydrographs. Refer to FHWA publication HDS-02 for examples. The Natural Resource Conservation Service (NRCS) developed one of the methods of estimating the runoff hydrograph. The NRCS method may be used for drainage areas up to 2000 acres. For drainage areas larger than 2000 acres,
10 – 1

LADOTD HYDRAULICS MANUAL PUMPING STATIONS AND WET WELLS 2011 hydrographs developed by the U.S. Geological Survey (USGS) or other general hydrograph procedures may be used. 10.3.1 Future Development Future development of the watershed should be considered and incorporated into the design in deriving the inflow hydrograph. If the watershed or collection system will be modified by future development, it is recommended to plan and design for both present and anticipated conditions, over the life of the pumping station. One way of providing increased future capacity is to allow space for additional pumps in the station. 10.4 WET WELLS To size the wet well for storm water pumping stations, the inflow hydrograph must be routed through the wet well. Methods of reservoir routing are adequately covered in most hydrologic texts (FHWA publication HDS-02). The general equation for reservoir routing is:
(Rate of inflow - Rate of outflow) = Rate of change in storage Eq. 10.4-1 10.4.1 Pump Capacity In a pumping station situation, the rate of inflow is derived from the inflow hydrograph, the rate of outflow is the pumping rate, and the rate of change of storage is a direct function of the shape and volume of the wet well and the piping system leading to the wet well. Therefore, the total pump capacity may be balanced with the required storage volume to obtain the most economical balance between the two. 10.4.2 Wet Well Volume A minimum of two pumps with one being able to discharge the design flow is recommended for small pumping stations. For large pumping stations two pumps can be used, but efficiency of operation over varying ranges of flow usually dictates three or more pumps of the same capacity. Capacities should be selected so that with any pump out of service, the others can handle the design flow. It is not unusual to use one small pump (low-flow pump) to start first, followed by larger pumps to handle the design flow.
10 – 2
LADOTD HYDRAULICS MANUAL PUMPING STATIONS AND WET WELLS 2011 10.5 STORM WATER PUMPING STATIONS HYDRAULICS For more information on the design of storm water pumping stations, equipment and accessories, refer to these references or the latest publications or websites from the following agencies: A.) Highway Stormwater Pump Station Design, Hydraulic Engineering
Circular No. 24, FHWA, Washington, D.C., February 2001 B.) Urban Hydrology For Small Watersheds, Technical Release No. 55,
USDA Natural Resources Conservation Service, June 1986. C.) Highway Hydrology, Hydraulic Design Series No. 2, FHWA,
Washington, D.C., 2nd Edition, October 2002.
10 – 3

LADOTD HYDRAULICS MANUAL PUMPING STATIONS AND WET WELLS 2011
10 – 4
This page intentionally left blank.

LADOTD HYDRAULICS MANUAL BRIDGE HYDRAULIC DESIGN 2011
CHAPTER 11 BRIDGE HYDRAULIC DESIGN
11.1 PURPOSE This chapter is prepared to provide guidance in bridge hydraulic design through appropriate policies and design criteria. For more in-depth fundamental details, the hydraulic design engineer should refer to provisions of AASHTO LRFD Bridge Design Specifications, Hydrology and Hydraulics Section; the AASHTO Highway Drainage Guidelines; and various Hydraulic Engineering Circulars published by the Federal Highway Administration. Unless specified otherwise, the hydraulics design engineer should consult the most recent edition of these references for procedures and guidelines. Adhering to these guidelines does not relieve the hydraulics design engineer from the responsibility of applying sound engineering principles and judgment. While the guidelines apply to the majority of bridge hydrologic and hydraulic design of new and replacement bridges, they are not intended to be exhaustive. If the bridge is in a coastal environment, the design should be in accordance with procedures set forth in HEC-25 – Highways in the Coastal Environment and AASHTO LRFD Bridge Design Specifications. 11.2 DEFINITION Bridges are defined as:
• structures that transport traffic over waterways or other obstructions, • part of a stream crossing system that includes the approach roadway over the
floodplain, relief openings, and the bridge structure and • structures with a centerline span of 20 feet or more. However, structures
designed hydraulically as bridges as described above are treated as bridges in this chapter, regardless of length.
11.3 ANALYSIS/DESIGN Proper hydraulic analysis and design is as vital as the structural design. Bridges should be designed for:
• minimum cost subject to criteria, • desired level of hydraulic performance up to an acceptable risk level, • mitigation of impacts on stream environment, • accomplishment of social, economic, and environmental goals and
11 – 1
LADOTD HYDRAULICS MANUAL BRIDGE HYDRAULIC DESIGN 2011
• full compliance with the requirements of existing Federal Emergency Management Agency (FEMA) or other officially delineated or regulatory floodplains
11.4 DESIGN POLICY 11.4.1 General Policy The hydraulic design of all bridges shall be done in accordance with good engineering practice and comply with all applicable Federal, State, local government and local flood control districts statutes and regulations. Specifically, the hydraulic design shall comply with FHWA’s FAPG 23 CFR 650 Subpart A, and FEMA’s National Flood Insurance Program. 11.4.2 FEMA Floodplain Compliance
• The final design selection should be in full compliance with the maximum
backwater allowed by the National Flood Insurance Program. • The final design should not significantly alter the flow distribution in the
floodplain. • Where design considerations permit, the “crest-vertical curve profile” should
be considered as the preferred highway crossing profile when allowing for embankment overtopping at a lower discharge.
• A specified clearance should be established to allow for passage of debris. 11.5 DESIGN CRITERIA 11.5.1 AASHTO General Criteria Design criteria are the tangible means for placing accepted policies into action and become the basis for the selection of the final design of bridges. Criteria are subject to change when conditions so dictate as approved by LADOTD. Following are certain American Association of State Highway Transportation Officials (AASHTO) general criteria adopted by LADOTD related to the hydraulic analyses for bridges as stated in AASHTO’s Highway Drainage Guidelines:
• Backwater will not significantly increase flood damage to property upstream of the crossing.
• Velocities through the structure(s) will not damage either the highway facility or increase damages to adjacent property.
• Maintain the existing flow distribution to the extent practical. • Pier spacing and orientation, and abutment designed to minimize flow
disruption and potential scour.
11 – 2
LADOTD HYDRAULICS MANUAL BRIDGE HYDRAULIC DESIGN 2011
• Foundation design and/or scour countermeasures to avoid failure by scour. • Freeboard at structure(s) designed to pass anticipated debris. • Minimal disruption of ecosystem and values unique to the floodplain and
stream. 11.5.2 LADOTD Criteria LADOTD criteria augment the general criteria by providing specific, quantifiable values that relate to local site conditions. Evaluation of various alternatives according to these criteria can be accomplished by using the water surface profile programs such as FHWA’s WSPRO or U.S. ACOE’s HEC-RAS. a.) Design Floods/Frequency: Design floods for roadway inundation are discussed in Chapter 1.
Design frequencies may be lower or higher when justified by risk analysis and local site conditions. The flood frequencies used for scour analysis differ. (See Section 11.7)
b.) Backwater/Increases over Existing Conditions: Backwater created by the structure shall conform to FEMA regulations.
It is LADOTD’s policy not to allow any backwater increase for sites covered by the National Flood Insurance Program (NFIP) and for delineated floodplains established under the NFIP. For sites not covered by NFIP the backwater increase shall not exceed one foot during the passage of the 100-year flood. Any increase in backwater shall not significantly change land use values, unless flood rights are acquired.
c.) Clearance: The freeboard, which is defined as the clearance between the low chord
of the bridge and the design approach water surface elevation, should not be less than one foot if there is no debris problem at the bridge site. In addition, the low chord should be set to clear the FEMA base flood (100-year flood) water surface elevation. In cases where debris is considered to be a problem, a minimum one foot additional freeboard should be provided to allow for passage of debris. The minimum freeboard requirements are as follows:
o 1 ft for design WSE & clear for 100-year WSE (without debris site) o 2 ft for design WSE & 1 ft for 100-year WSE (with debris site)
Where the minimum requirement is not practical, the freeboard should
be established based on the type of stream and level of protection desired as approved by LADOTD.
11 – 3
LADOTD HYDRAULICS MANUAL BRIDGE HYDRAULIC DESIGN 2011 d.) Scour: Design for bridge foundation scour should consider the magnitude of
flood that generates the maximum scour depth. It is LADOTD’s practice to evaluate bridge scour from the 500-year flood, or overtopping flood if the overtopping flood is less than the 500-year flood.
11.6 DESIGN PROCEDURE 11.6.1 Hydraulic Performance of Bridges The stream-crossing system is subject to either free-surface flow or pressure flow through one or more bridge openings with possible embankment overtopping. These hydraulic complexities should be analyzed using a water surface profile computer program. FHWA’s WSPRO and U.S. ACOE’s HEC-RAS are acceptable computer programs to analyze the hydraulic performance of bridges over riverine waterways. The Watershed Modeling System (WMS) program is another tool available for performing hydrologic and hydraulic computations. Generally, the hydraulics design engineer should refer to the user’s instruction manual and other documentation of the specific computer program as sources for the theory employed and detailed information on using the computer model. 11.6.2 Design Procedure A detailed hydrologic and hydraulic analysis should be performed for designing all new bridges over waterways, bridge widening, bridge replacement, and significant lateral encroachments resulting from the placement of highway fill embankments within a floodplain. It is necessary to do this to be able to ensure that LADOTD construction is in compliance with FHWA and FEMA rules and regulations. Typically, the basic procedural sequence of the hydrologic and hydraulic analysis process should include Data Collection, Hydrologic Analysis, Hydraulic Analysis, Scour Estimates, Selection of Final Design, and Documentation.
a.) Data collection: The data and resources necessary to perform a hydrologic and hydraulic
analysis usually include, but would not be limited to: topographic maps, aerial photographs, roadway plan/profile sheets, and typical cross-sections to cover the width of the floodplain in the vicinity of the crossing. Stream gage records and high water marks are useful information for calibration and verification of computer model results.
Careful consideration should be given to existing studies, such as floodplain studies that may have been performed by FEMA. In the event a FEMA floodplain (or other officially delineated floodplain) is involved, it will be necessary to have available flood maps, flood profiles, and hydraulic model data. If existing flood studies are used,
11 – 4
LADOTD HYDRAULICS MANUAL BRIDGE HYDRAULIC DESIGN 2011
validity of assumptions and accuracy of the results of such studies should be verified.
b.) Hydrologic Analysis: Discharges at a crossing site are computed by procedures detailed in
Chapter 3 of this Manual. The referenced methods are used in conjunction with gage data, when available at the design site, as found in Reference “Floods in Louisiana, Magnitude and Frequency”. Annual publications such as “Water Resources Data” published by the United States Geological Survey and “Stages and Discharges” published by the Corps of Engineers may also be used when additional information is required. Several computerized water resources databases are also accessible through the United States Geological Survey.
For gaged sites (or gages in the proximity of the site) with good
discharge records, a Log-Pearson Type III frequency distribution (prorated upstream or downstream as appropriate) would be the preferred method for determining peak discharges.
If the site is covered by a FEMA (or other officially delineated)
floodplain, the peak discharges employed in making the official floodplain delineation should be used in the subsequent hydraulic analysis. In situations where the officially delineated study considers only the 10, 50, 100, and 500-year flood events, it will be acceptable to estimate the magnitude of intermediate frequency events such as 2, 5, and 25-year flood events.
In all cases, the 2, 5, 10, 25, 50, 100, and 500-year flood discharges will
either be computed or obtained from appropriate sources, and the discharge-frequency curve can be plotted. Ample documentation should be made throughout the analysis process, especially where judgments are made and where deviations from the normal procedures are necessary to obtain these discharges.
c.) Hydraulic Analysis: LADOTD prefers WSPRO and HEC-RAS computer models for
performing the hydraulic analysis. An existing conditions model and a proposed conditions model should be established for each bridge site.
In order to ensure convergence of the computed profile, the water
surface profile used in the hydraulic analysis of a bridge should extend from a point downstream of the bridge that is beyond the influence of the constriction to a point upstream that is beyond the extent of the bridge backwater. These additional cross-sections may be obtained via survey data or topographic maps. Successful application of a computer
11 – 5

LADOTD HYDRAULICS MANUAL BRIDGE HYDRAULIC DESIGN 2011
program to a specific bridge and proper interpretation of output from the computer program require experience and engineering judgment to supplement the quantitative analysis.
• National Flood Insurance Program (NFIP) Model:
It is necessary to establish the effective hydraulic conditions through a process that will be referred to as a computer model calibration. This calibration is to be accomplished by attempting to reconcile the historical records of discharges vs. water surface elevations. When a FEMA floodplain is involved, the conditions effective at the time of the FEMA floodplain study (including the flows modeled in the original NFIP model, plus any subsequent letters of map change) should be used to calibrate the computer model. Current (existing) development may have increased the flood depths, but remained less than the allowable one foot above flood depth from the legal NFIP map (including all LOMRs). The proposed project should be modeled with the current (existing) conditions to ensure the proposed project will not go over the allowable one foot increase, which would require a letter of map revision (LOMR) to inform the public and FEMA of increased risk in the area.
• Existing Conditions Model – Floodplains not Regulated by NFIP: Computer model calibration is to be accomplished by attempting to
reconcile the historical records of discharges vs. water surface elevations. The existing conditions model should be adjusted to match any known elevation information, such as survey data or gage information. The design, 100, and 500-year (or overtopping) flood events should be included in the model.
• Proposed Conditions Model:
The proposed conditions model should include any and all proposed replacement structures (superimposed on the existing conditions model). The design, 100, and 500-year (or overtopping) flood events should be included in the model. If a FEMA regulated floodplain does not exist, compare the proposed conditions model with the existing conditions model. The difference in water surface elevation (backwater) should be one foot or less. For FEMA regulated floodplains with or without floodways, compare the proposed condition model with the NFIP model. For models of FEMA regulated floodplains without floodways, the difference in water surface elevation (backwater) should be one foot or less.
11 – 6
LADOTD HYDRAULICS MANUAL BRIDGE HYDRAULIC DESIGN 2011
If the FEMA regulated floodplain has a floodway, then there should be no change in water surface elevation between the proposed condition and NFIP model. If the water surface elevation or backwater limits stated above are exceeded, the proposed replacement structures are to be considered unacceptable and must be adjusted until these limits are met.
d.) Final Design Selection: The final design recommendation will include the bridge length, deck
elevation, position in the floodplain (where applicable), abutment slopes, any recommended excavation, any recommended channel alignment, and any special features such as guide banks, erosion or scour protection measures, etc. The final design selection must meet LADOTD policies and design criteria.
11.7 SCOUR 11.7.1 Scour Estimates Scour is most likely to occur where velocities are high and the river bed is a non-cohesive soil. Evidence of scour should be investigated at project sites. The location and severity of scour should be noted. It should also be noted whether the stream bed is movable or stable. Any historical scour data on other bridges or similar facilities along the stream should also be considered carefully. Bridge foundations shall be designed to withstand the effects of scour resulting from the lesser of the following two events:
• The 500-year event, or • The event causing overtopping of the approach roadway or the bridge deck.
LADOTD employs the procedures and guidelines presented in the FHWA’s “Evaluating Scour at Bridges” (HEC-18) and “Stream Stability at Highway Structures” (HEC-20) to determine and counteract the impact of scour on bridges. FHWA’s WSPRO computer program has incorporated the scour equations from HEC-18. The total scour depth can be estimated by WSPRO program or directly from HEC-18 equations. Sound engineering judgment should then be exercised to determine the appropriateness and validity of the estimated total scour depth. Degradation or aggradation of the river should be estimated, contraction and local scour should be determined, and appropriate positioning of the foundation should be set below the scour elevation across the bridge opening if practicable.
11 – 7
LADOTD HYDRAULICS MANUAL BRIDGE HYDRAULIC DESIGN 2011 11.7.2 LADOTD Policy For Predicting The Scour Elevation For Bridges Below is the established LADOTD guidelines and policy for predicting the scour elevation for bridges. This elevation is designed to withstand the worst case scour depths, calculated according to FHWA’s recommendations, as stated in HEC-18, Evaluating Scour at Bridges. This procedure shall be used for “On-System” and “Off-System” bridges.
1) The Predicted Bridge Scour Elevation is based on contraction scour and local scour at piers. The Predicted Bridge Scour Elevation is determined by subtracting the combined contraction scour depth and local scour depth from the lowest point in the channel below the proposed bridge. See sketch on Page 11-9 showing Plot of Total Scour.
2) The Predicted Bridge Scour Elevation applies to all piers including the end bents in
the main channel section. Refer to Sections 2.3.2 and 8.11 in HEC-18. Reasons: Louisiana streams have a great potential for flooding and migrating. Retrofits, scour countermeasures and bridge replacements are costly and disrupt road service to the traveling public.
3) The Predicted Scour Elevation for the main bridge and relief bridge(s) is to be the same. Reason: Louisiana has a history of relief structures having greater scour problems than the structure(s) in the main channel. Even if there is no stream under the relief structure, flooding can cause severe erosion and scour.
4) Abutment scour is not usually calculated. Instead, as per FHWA’s recommendations
in HEC-18, abutments are protected with some type of revetments or riprap.
(a.) Abutment scour protection should be designed and installed to account for any long term degradation and contraction scour at the abutment toe.
(b.) When revetment or rip rap cannot be used, the abutment scour must be determined in order to design the abutment foundation.
5) Long term degradation should be considered in situations where stream bed may be
affected by upstream gravel/sand mining operations or in upland areas where there is a potential for headcutting.
11 – 8
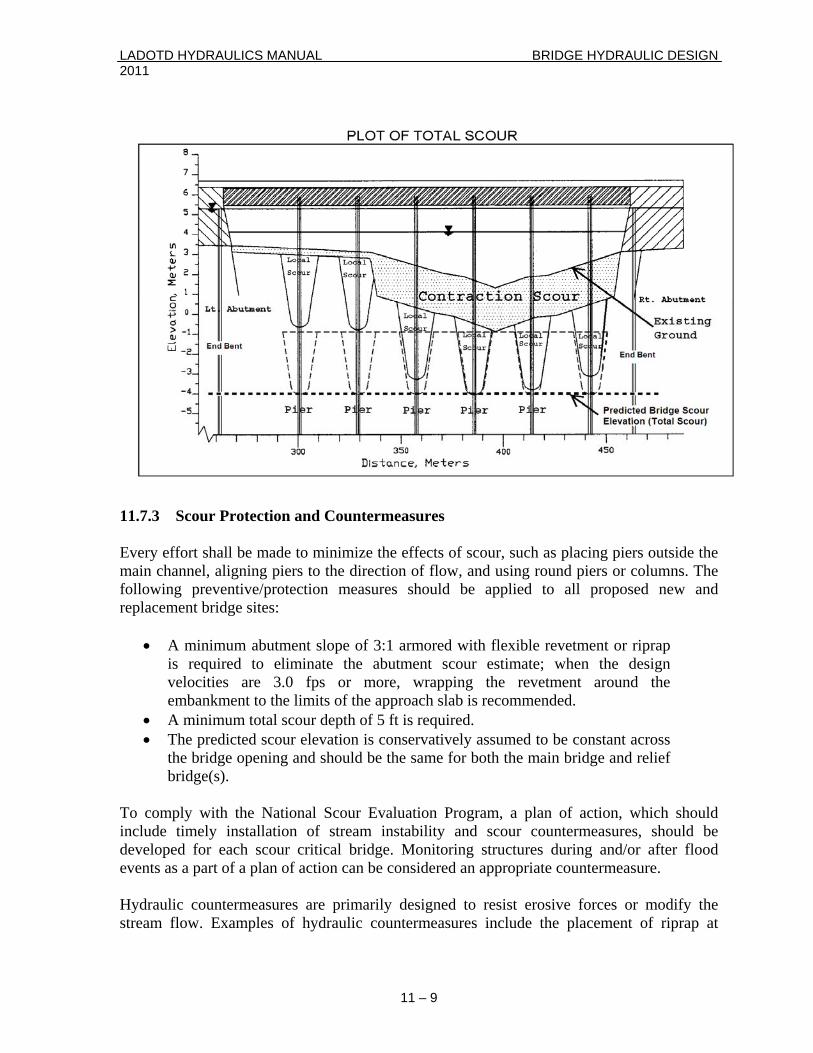
LADOTD HYDRAULICS MANUAL BRIDGE HYDRAULIC DESIGN 2011
11.7.3 Scour Protection and Countermeasures Every effort shall be made to minimize the effects of scour, such as placing piers outside the main channel, aligning piers to the direction of flow, and using round piers or columns. The following preventive/protection measures should be applied to all proposed new and replacement bridge sites:
• A minimum abutment slope of 3:1 armored with flexible revetment or riprap is required to eliminate the abutment scour estimate; when the design velocities are 3.0 fps or more, wrapping the revetment around the embankment to the limits of the approach slab is recommended.
• A minimum total scour depth of 5 ft is required. • The predicted scour elevation is conservatively assumed to be constant across
the bridge opening and should be the same for both the main bridge and relief bridge(s).
To comply with the National Scour Evaluation Program, a plan of action, which should include timely installation of stream instability and scour countermeasures, should be developed for each scour critical bridge. Monitoring structures during and/or after flood events as a part of a plan of action can be considered an appropriate countermeasure. Hydraulic countermeasures are primarily designed to resist erosive forces or modify the stream flow. Examples of hydraulic countermeasures include the placement of riprap at
11 – 9
LADOTD HYDRAULICS MANUAL BRIDGE HYDRAULIC DESIGN 2011 abutments or piers and the installation of river training structures such as guide banks (spur dikes). a.) Riprap: Riprap is considered an acceptable scour countermeasure for protection
of bridge abutments. The use of riprap at bridge piers, on the other hand, is not acceptable for new bridges and is considered only as a temporary countermeasure in the case of scour repairs. LADOTD employs the riprap design guidance and procedures presented in the FHWA’s “Bridge Scour and Stream Instability Countermeasures” (HEC-23) and “Design of Riprap Revetment” (HEC-11).
b.) Guide Banks (Spur Dikes): The purpose of guide banks is to align flow from the floodplain with the
bridge opening and to minimize scour at the abutment by moving the scour-causing turbulence to the upstream end of the guide bank. The design guideline for guide banks should refer to HEC-23.
11.8 DECK DRAINAGE 11.8.1 Spread Standards Effective bridge deck drainage is necessary to minimize the possibilities of vehicular hydroplaning and corrosion of the bridge structure. It is more difficult to drain bridge decks than approach roadways. In general, for traffic safety and life of the structure, the spread of bridge deck drainage should not encroach on any portion of the designated traffic lanes. The design of the deck drainage system should conform to the guidelines and procedures described in FHWA’s publication “Design of Bridge Deck Drainage” (HEC-21). 11.8.2 Scupper and Slot Drains Scupper or slot drains must be adequately sized and spaced to remove rainfall-generated runoff from the bridge deck before it encroaches onto the traveled lanes. 11.8.3 Bridge End Drains Because of the vulnerability of approach roadway shoulders and abutments to erosion from concentrated flow, sufficient bridge end drain capacity should be provided. The bridge-end drainage system comprises the inlets and the outfall pipes or ditches. The inlets should have sufficient capacity to intercept all flow from the bridge and intercept all flow from curbed roadways before it reaches the bridge. A closed conduit is often preferable to an open chute down to the abutment slope. Bridge end drain systems are pavement drainage devices.
11 – 10
LADOTD HYDRAULICS MANUAL BRIDGE HYDRAULIC DESIGN 2011 HEC-21 provides detailed design methods and equations. Refer to EDSM II.2.1.1 for allowable materials. 11.9 DOCUMENTATION Formal documentation of all design considerations, the general design process, and computations and analysis will be presented in the Bridge Hydraulics Report. At a minimum the Bridge Hydraulics Report will include: a brief summary; a general description of the watershed and the hydrologic characteristics of the area; a general statement of the scope and the reasons for the proposed project; documentation of any coordination with other agencies or governments; brief discussion of any local or regional ordinances influencing design; historical flood information and general site data used in hydraulic design; general discussion of design analysis (all hydrology and hydraulic calculations are documented in Appendices); final design recommendations; Hydraulic Data Table for the proposed structure (the design-year, 100-year, and overtopping floods are to be included in the Hydraulic Data Table, 500-year or overtopping flood for scour); and a general flood hazard summary. A typical Table of Contents of a Bridge Hydraulics Report is shown in Section 11.9.1. 11.9.1 Sample Table of Contents of a Bridge Hydraulics Report
Bridge Hydraulics Report Preface
I. Summary II. General Description of the Area III. Site Data IV. Interagency Coordination V. Design Analysis
A. Hydrology B. Hydraulics
(1) Existing Bridge Hydraulics (2) Proposed Bridge Hydraulics
C. Stream Stability and Scour Analysis VI. Recommendations VII. Flood Hazard Summary Appendix A USGS Gage Information Appendix B FEMA Studies and FIRM panel Appendix C Hydrology Appendix D WSPRO for Existing Structure Appendix E WSPRO for Proposed Structure Appendix F Stream Stability and Scour Analysis
11 – 11
LADOTD HYDRAULICS MANUAL BRIDGE HYDRAULIC DESIGN 2011
11 – 12
11.10 REFERENCES
A.) Model Drainage Manual, Third Edition, AASHTO, 2005 B.) Location and Hydraulic Design of Encroachments on Floodplains,
FHWA, FAPG 23 CFR 650A, Federal-Aid Policy Guide, 1994 C.) FEMA, National Flood Insurance Program and Related Regulations.
1987 D.) Highway Drainage Guidelines, Fourth Edition, AASHTO, 2007 E.) Bradley, J.N. Hydraulics of Bridge Waterways, HDS-1, FHWA. 1978 F.) Shearman, J.O., User’s Manual for WSPRO, FHWA, 1998 G.) U.S. Army Corps of Engineers, HEC-RAS River Analysis System,
User’s Manual, Version 3.0. 2001 H.) Highway Hydrology, Hydraulic Design Series No. 2, FHWA,
Washington, D.C., 2nd Edition, October 2002. I.) Ensminger, P.A., Floods in Louisiana, Magnitude and Frequency, Fifth
Edition, 1998 J.) Richardson, E.V., Evaluating Scour at Bridges, HEC-18, FHWA, 2001 K.) Lagasse, P.F., Stream Stability at Highway Structures, HEC-20, FHWA,
2001 L.) Lagasse, P.F., Bridge Scour and Stream Instability Countermeasures,
HEC-23, FHWA, 2001 M.) Brown, S.A., Design of Riprap Revetment, HEC-11, FHWA, 1989 N.) Young, G.K., Design of Bridge Deck Drainage, HEC-21, FHWA, 1993


![Project Delivery Manual 2013 - Louisiana DOTD Project Delivery Manual Chapter 1: Introduction 2013 Louisiana Department of Transportation and Development [6] Safety o …](https://img.pdfslide.net/doc/110x75/5acebd127f8b9a8b1e8bde28/project-delivery-manual-2013-dotd-project-delivery-manual-chapter-1-introduction.jpg)