Embed Size (px)
Citation preview
La Française LUXSociété d'Investissement à Capital Variable
R.C.S. Luxembourg B 66.785Annual Report, including Audited Financial Statements as at December 31, 2018
La Française LUX
La Française LUX - Forum Global Real Estate Securities
La Française LUX - Inflection Point Carbon Impact Euro (previously named La Française LUX - Inflection Point European Equity)
La Française LUX - Inflection Point Gonet Swiss Equity
La Française LUX - Inflection Point Leaders Emergents
La Française LUX - Inflection Point Carbon Impact Global (previously named La Française LUX - Inflection Point Zero Carbon)
La Française LUX - Sustainable Real Estate Securities
La Française LUX - Absolute Emerging Debt
La Française LUX - Euro Inflation
La Française LUX - Global Credit Duration Hedged*
La Française LUX - Global High Yield**
La Française LUX - JKC Asia Bond
La Française LUX - JKC Asia Bond 2023
La Française LUX - Multistrategies Obligataires
La Française LUX - Protectaux
La Française LUX - Rendement Global 2020 - USD****
La Française LUX - Sub Debt***
La Française LUX - GTS Réactif
La Française LUX - Multi-Asset Income
No subscription can be received on the basis of these financial statements. Subscriptions are only valid if made on the basis of the current prospectus and relevant KeyInvestor Information Document ("KIID") which will be accompanied by a copy of the latest available Annual Report, including Audited Financial Statements and a copyof the latest available unaudited Semi-Annual Report, including audited financial statements if published after such Annual Report, including Audited FinancialStatements.
* This Sub-Fund was launched on June 28, 2018.** This Sub-Fund was launched on June 28, 2018.*** This Sub-Fund was launched on June 5, 2018.**** This Sub-Fund was liquidated on May 23, 2018
La Française LUX
1
Table of Contents
Organisation of the SICAV 5
Information to shareholders 9
Directors' Report 10
Report of the Réviseur d'entreprises agréé 27
Statistics 29
Combined Statement of Net Assets as at December 31, 2018 34
Combined Statement of Operations and Changes in Net Assets for the year ended December 31, 2018 34
La Française LUX - Forum Global Real Estate Securities
Statement of Net Assets as at December 31, 2018 35
Statement of Operations and Changes in Net Assets for the year ended December 31, 2018 35
Statement of Changes in Number of Shares 35
Securities Portfolio as at December 31, 2018 37
Financial derivative instruments as at December 31, 2018 37
Portfolio Breakdowns 39
Top Ten Holdings 39
La Française LUX - Inflection Point Carbon Impact Euro (previously named La Française LUX - Inflection Point European Equity)
Statement of Net Assets as at December 31, 2018 40
Statement of Operations and Changes in Net Assets for the year ended December 31, 2018 40
Statement of Changes in Number of Shares 40
Securities Portfolio as at December 31, 2018 41
Portfolio Breakdowns 42
Top Ten Holdings 42
La Française LUX - Inflection Point Gonet Swiss Equity
Statement of Net Assets as at December 31, 2018 43
Statement of Operations and Changes in Net Assets for the year ended December 31, 2018 43
Statement of Changes in Number of Shares 43
Securities Portfolio as at December 31, 2018 44
Portfolio Breakdowns 45
Top Ten Holdings 45
La Française LUX - Inflection Point Leaders Emergents
Statement of Net Assets as at December 31, 2018 46
Statement of Operations and Changes in Net Assets for the year ended December 31, 2018 46
Statement of Changes in Number of Shares 46
Securities Portfolio as at December 31, 2018 47
Portfolio Breakdowns 48
Top Ten Holdings 48
* This Sub-Fund was launched on June 28, 2018.** This Sub-Fund was launched on June 28, 2018.*** This Sub-Fund was launched on June 5, 2018.**** This Sub-Fund was liquidated on May 23, 2018
La Française LUX
2
Table of Contents
La Française LUX - Inflection Point Carbon Impact Global (previously named La Française LUX - Inflection Point Zero Carbon)
Statement of Net Assets as at December 31, 2018 49
Statement of Operations and Changes in Net Assets for the year ended December 31, 2018 49
Statement of Changes in Number of Shares 49
Securities Portfolio as at December 31, 2018 50
Portfolio Breakdowns 52
Top Ten Holdings 52
La Française LUX - Sustainable Real Estate Securities
Statement of Net Assets as at December 31, 2018 53
Statement of Operations and Changes in Net Assets for the year ended December 31, 2018 53
Statement of Changes in Number of Shares 53
Securities Portfolio as at December 31, 2018 54
Financial derivative instruments as at December 31, 2018 54
Portfolio Breakdowns 55
Top Ten Holdings 55
La Française LUX - Absolute Emerging Debt
Statement of Net Assets as at December 31, 2018 56
Statement of Operations and Changes in Net Assets for the year ended December 31, 2018 56
Statement of Changes in Number of Shares 56
Securities Portfolio as at December 31, 2018 57
Financial derivative instruments as at December 31, 2018 57
Portfolio Breakdowns 58
Top Ten Holdings 58
La Française LUX - Euro Inflation
Statement of Net Assets as at December 31, 2018 59
Statement of Operations and Changes in Net Assets for the year ended December 31, 2018 59
Statement of Changes in Number of Shares 59
Securities Portfolio as at December 31, 2018 60
Financial derivative instruments as at December 31, 2018 60
Portfolio Breakdowns 61
Top Ten Holdings 61
La Française LUX - Global Credit Duration Hedged*
Statement of Net Assets as at December 31, 2018 62
Statement of Operations and Changes in Net Assets for the period ended December 31, 2018 62
Statement of Changes in Number of Shares 62
Securities Portfolio as at December 31, 2018 63
Financial derivative instruments as at December 31, 2018 64
Portfolio Breakdowns 65
Top Ten Holdings 65
* This Sub-Fund was launched on June 28, 2018.** This Sub-Fund was launched on June 28, 2018.*** This Sub-Fund was launched on June 5, 2018.**** This Sub-Fund was liquidated on May 23, 2018
La Française LUX
3
Table of Contents
La Française LUX - Global High Yield**
Statement of Net Assets as at December 31, 2018 66
Statement of Operations and Changes in Net Assets for the period ended December 31, 2018 66
Statement of Changes in Number of Shares 66
Securities Portfolio as at December 31, 2018 67
Financial derivative instruments as at December 31, 2018 68
Portfolio Breakdowns 69
Top Ten Holdings 69
La Française LUX - JKC Asia Bond
Statement of Net Assets as at December 31, 2018 70
Statement of Operations and Changes in Net Assets for the year ended December 31, 2018 70
Statement of Changes in Number of Shares 70
Securities Portfolio as at December 31, 2018 71
Financial derivative instruments as at December 31, 2018 72
Portfolio Breakdowns 73
Top Ten Holdings 73
La Française LUX - JKC Asia Bond 2023
Statement of Net Assets as at December 31, 2018 74
Statement of Operations and Changes in Net Assets for the year ended December 31, 2018 74
Statement of Changes in Number of Shares 74
Securities Portfolio as at December 31, 2018 75
Portfolio Breakdowns 77
Top Ten Holdings 77
La Française LUX - Multistrategies Obligataires
Statement of Net Assets as at December 31, 2018 78
Statement of Operations and Changes in Net Assets for the year ended December 31, 2018 78
Statement of Changes in Number of Shares 78
Securities Portfolio as at December 31, 2018 80
Financial derivative instruments as at December 31, 2018 81
Portfolio Breakdowns 82
Top Ten Holdings 82
La Française LUX - Protectaux
Statement of Net Assets as at December 31, 2018 83
Statement of Operations and Changes in Net Assets for the year ended December 31, 2018 83
Statement of Changes in Number of Shares 83
Securities Portfolio as at December 31, 2018 84
Financial derivative instruments as at December 31, 2018 84
Portfolio Breakdowns 85
Top Ten Holdings 85
* This Sub-Fund was launched on June 28, 2018.** This Sub-Fund was launched on June 28, 2018.*** This Sub-Fund was launched on June 5, 2018.**** This Sub-Fund was liquidated on May 23, 2018
La Française LUX
4
Table of Contents
La Française LUX - Rendement Global 2020 - USD****
Statement of Net Assets as at December 31, 2018 86
Statement of Operations and Changes in Net Assets for the period ended December 31, 2018 86
Statement of Changes in Number of Shares 86
La Française LUX - Sub Debt***
Statement of Net Assets as at December 31, 2018 87
Statement of Operations and Changes in Net Assets for the period ended December 31, 2018 87
Statement of Changes in Number of Shares 87
Securities Portfolio as at December 31, 2018 88
Portfolio Breakdowns 89
Top Ten Holdings 89
La Française LUX - GTS Réactif
Statement of Net Assets as at December 31, 2018 90
Statement of Operations and Changes in Net Assets for the year ended December 31, 2018 90
Statement of Changes in Number of Shares 90
Securities Portfolio as at December 31, 2018 91
Financial derivative instruments as at December 31, 2018 74
Portfolio Breakdowns 92
Top Ten Holdings 92
La Française LUX - Multi-Asset Income
Statement of Net Assets as at December 31, 2018 93
Statement of Operations and Changes in Net Assets for the year ended December 31, 2018 93
Statement of Changes in Number of Shares 93
Securities Portfolio as at December 31, 2018 94
Financial derivative instruments as at December 31, 2018 95
Portfolio Breakdowns 96
Top Ten Holdings 96
Notes to the Financial Statements 97
Unaudited information 113
Information for Shareholders in Germany (unaudited) 115
* This Sub-Fund was launched on June 28, 2018.** This Sub-Fund was launched on June 28, 2018.*** This Sub-Fund was launched on June 5, 2018.**** This Sub-Fund was liquidated on May 23, 2018
La Française LUX
5
Registered Office
La Française LUX 60, avenue John Fitzgerald KennedyL-1855 LuxembourgGrand Duchy of Luxembourg
Board of Directors of the SICAV
Chairman
Alain GERBALDILa Française AM International 2, Boulevard de la FoireL-1528 LuxembourgGrand Duchy of Luxembourg
Directors
Pascale AUCLAIR (until August 31, 2018)La Française Asset Management 128, Boulevard RaspailF-75006 ParisFrance
Andrea BERTOCCHINI La Française AM International2, Boulevard de la FoireL-1528 LuxembourgGrand Duchy of Luxembourg
Isabelle KINTZ La Française AM International2, Boulevard de la FoireL-1528 LuxembourgGrand Duchy of Luxembourg
Philippe LESTELLa Française Asset Management 128, Boulevard RaspailF-75006 ParisFrance
Matthew John KIERNAN (since May 15, 2018)Inflection Point by La Française,78, Brook Street, Level 4,WVK5EF, LondonUnited Kingdom
Jean-Luc HIVERT (since October 18, 2018)La Française Asset Management 128, Boulevard RaspailF-75006 ParisFrance
Management Company
La Française AM International (until March 1, 2019)2, Boulevard de la FoireL-1528 LuxembourgGrand Duchy of Luxembourg
La Française AM International (since March 2, 2019)60, Grande RueL-1661 LuxembourgGrand-Duché de Luxembourg
Organisation of the SICAV
La Française LUX
6
Custodian Bank, Domiciliation and Listing Agent
BNP Paribas Securities Services - Luxembourg Branch60, avenue John Fitzgerald KennedyL-1855 LuxembourgGrand Duchy of Luxembourg
Administrator, Registrar and Transfer Agent
BNP Paribas Securities Services - Luxembourg Branch60, avenue John Fitzgerald KennedyL-1855 LuxembourgGrand Duchy of Luxembourg
Investment Managers
For the Sub-Funds:La Française LUX - Inflection Point Carbon Impact Euro (previously named La Française LUX - Inflection Point European Equity)La Française LUX - Inflection Point Leaders EmergentsLa Française LUX - Inflection Point Carbon Impact Global (previously named La Française LUX - Inflection Point Zero Carbon)
La Française Inflection Point (until October 1, 2018)128, Boulevard RaspailF-75006 Paris France
For the Sub-Funds:La Française LUX - Inflection Point Carbon Impact Euro (previously named La Française LUX - Inflection Point European Equity)La Française LUX - Inflection Point Leaders EmergentsLa Française LUX - Inflection Point Carbon Impact Global (previously named La Française LUX - Inflection Point Zero Carbon)La Française LUX - GTS RéactifLa Française LUX - Euro InflationLa Française LUX - Global Credit Duration Hedged (this Sub-Fund was launched on June 28, 2018)La Française LUX - Global High Yield (this Sub-Fund was launched on June 28, 2018)La Française LUX - Multistrategies ObligatairesLa Française LUX - Absolute Emerging DebtLa Française LUX - ProtectauxLa Française LUX - Rendement Global 2020 - USD (this Sub-Fund was liquidated on May 23, 2018)La Française LUX - Sub Debt (this Sub-Fund was launched on June 5, 2018)
La Française Asset Management (since October 1, 2018)128, Boulevard RaspailF-75006 ParisFrance
For the Sub-Funds:La Française LUX - Forum Global Real Estate SecuritiesLa Française LUX - Sustainable Real Estate Securities
La Française Forum Securities (SG) Pte Limited (since June 25, 2018)One Raffles Quay#25-36 North Tower 048583, SingaporeSingapore
Forum Securities (UK) Limited (until June 25, 2018)78, Brook StreetW1K5EF, LondonUnited Kingdom
Investment AdvisorLa Française Forum Securities (UK), Limited (since June 25, 2018)78, Brook StreetW1K5EF, LondonUnited Kingdom
Inflection Point Capital Management (UK), Limited (until June 25, 2018)78, Brook StreetW1K5EF, LondonUnited Kingdom
Organisation of the SICAV (continued)
La Française LUX
7
For the Sub-Fund:La Française LUX - Multi-Asset Income
Investment ManagerLa Française Asset Management128, Boulevard RaspailF-75006 ParisFrance
Sub-Investment ManagerLa Française Forum Securities (SG) Pte Limited (since June 25, 2018)One Raffles Quay#25-36 North Tower 048583, SingaporeSingapore
La Française Inflection Point (until June 25, 2018)128, Boulevard RaspailF-75006 ParisFrance
For the Sub-Funds:La Française LUX - JKC Asia BondLa Française LUX - JKC Asia Bond 2023
Investment ManagerJK Capital Management LimitedSuite 1101, Chinachem Tower34-37 Connaught Road CentralHong Kong
Investment AdvisorLa Française Asset Management128, Boulevard RaspailF-75006 ParisFrance
For the Sub-Fund:La Française LUX - Inflection Point Gonet Swiss Equity
Investment ManagerGonet & Cie S.A., Geneva11, rue Bovy-LysbergCH-1204 GenevaSwitzerland
Investment AdvisorInflection Point by La Française, London (since September 7, 2018)78, Brook StreetW1K5EF, LondonUnited Kingdom
Inflection Point Capital Management (UK), Limited (until September 6, 2018)78, Brook StreetW1K5EF, LondonUnited Kingdom
Cabinet de révision agréé
Deloitte Audit Société à responsabilité limitée560, rue de NeudorfL-2220 LuxembourgGrand Duchy of Luxembourg
Organisation of the SICAV (continued)
La Française LUX
8
Paying Agents / Representative Agents
FranceBNP Paribas Securities Services Paris Les Grands Moulins de Pantin9, rue du DébarcadèreF-93500 PantinFrance
SwitzerlandRepresentative Agent Acolin Fund Services AG56, AffolternstrasseCH-8050 ZürichSwitzerland
Paying Agent NPB Neue Privat Bank AG Limmatquai 1/am BellevueCH-8022 ZurichSwitzerland
Belgium Financial AgentCACEIS BelgiumAvenue du Port 86C b320B-1000 BruxellesBelgium
ItalyBNP Paribas Securities Services Milan BranchPiazza Lina Bo Bardi, 3I-20124 Milan MIItaly
GermanyBNP Paribas Securities Services Frankfurt BranchEuropa Allee, 12D-60327 FrankfurtGermany
AustriaErste Bank der österreichischenSparkassen AGAm Belvedere 1AT-1100 VienaAustria
SwedenSkandinaviska Enskilda Banken ABKungsträdgardsgatan 8SE-10640 Stockholm Sweden
United KingdomBNP Paribas Securities Services London10 Harewood AvenueLondon NW1 6AAUnited Kingdom
Organisation of the SICAV (continued)
La Française LUX
9
Incorporation
La Française LUX is an open-ended undertaking for collective investment (the "SICAV") with multiple sub-funds, subject to Part I of the amendedDecember 17, 2010 Law (the "Law") relating to undertakings for collective investment in transferable securities. Part I covers the provisions of theEuropean Directive dated July 13, 2009 (2009/65/EC). The SICAV has been incorporated on October 28, 1998 for an unlimited period. The SICAV’sArticles of Incorporation were published in the Mémorial C, Recueil des Sociétés et Associations on November 26, 1998 and on February 29 , 2016(date of change of the registered office).
The SICAV's capital is expressed in EUR and is at all times equal to the sum of the values of the Net Assets of its Sub-Funds converted in EUR andrepresented by shares of no par value.
Communications and reports to shareholders
1. Periodic reports
Annual Reports, including audited Financial Statements as of December 31, unaudited semi-annual reports for the six months ended June 30 andthe list of changes made to the composition of the Securities Portfolio are available to shareholders free of charge at the offices of the CustodianBank as well as at the SICAV's registered office. These reports cover each of the Sub-Funds and the assets of the SICAV as a whole.
The Financial statements of each Sub-Fund are drawn up in the reference currency of the Sub-Fund but the Combined Statement of Net Assetsand Statements of Operations and Changes in Net Assets are denominated in EUR.
Annual Reports, including audited Financial Statements are available within four months of the financial year-end.
Unautited semi-annual reports are published within two months of the end of the six-month period they cover.
2. Information to shareholders
a) Net asset values
The net asset values of the shares of each Sub-Fund, category or class of shares of the SICAV are available on each business day at theregistered office of the SICAV. The Board of Directors of the SICAV may subsequently decide to publish these net asset values in the newspapersof countries where the shares of the SICAV are offered or sold. They are posted each business day on Fundsquare and Bloomberg.
Valuation day:Every bank working day in Luxembourg and in France and Hong Kong for some Sub-Funds:
La Française LUX - Forum Global Real Estate Securities;La Française LUX - Inflection Point Carbon Impact Euro (previously named La Française LUX - Inflection Point European Equity); La Française LUX - Inflection Point Gonet Swiss Equity;La Française LUX - Inflection Point Leaders Emergents; La Française LUX - Inflection Point Carbon Impact Global (previously named La Française LUX - Inflection Point Zero Carbon);La Française LUX - Sustainable Real Estate Securities;La Française LUX - Absolute Emerging Debt; La Française LUX - Euro Inflation;La Française LUX - Global Credit Duration Hedged (this Sub-Fund was launched on June 28, 2018);La Française LUX - Global High Yield (this Sub-Fund was launched on June 28, 2018);La Française LUX - JKC Asia Bond;La Française LUX - JKC Asia Bond 2023;La Française LUX - Multistrategies Obligataires; La Française LUX - Protectaux;La Française LUX - Rendement Global 2020 - USD (this Sub-Fund was liquidated on May 23, 2018); La Française LUX - Sub Debt (this Sub-Fund was launched on June 5, 2018);La Française LUX - GTS Réactif;La Française LUX - Multi-Asset Income.
b) Subscription and redemption prices
The subscription and redemption prices of shares in each Sub-Fund, category or class of shares of the SICAV category or class of shares of theSICAV are published daily at the Custodian Bank.
c) Notifications to shareholders
Other information intended for shareholders are published in the Recueil Electronique des Sociétés et Associations, in Luxembourg, if suchpublication is required by law. They may also be published in a Luxembourg newspaper.
Information to shareholders
LA FRANCAISE LUX Directors’ Report ECONOMIC TRENDS States of uncertainty across the globe (in particular, the China-US trade war, BREXIT, political instability in Italy and the imbalance in supply/demand of oil) have led to a reduction in risky assets and in oil (WTI -25% to USD 44.57 and Brent -20% to USD 52.77). On the stock market, the DJ Eurostoxx has recorded a negative performance of -14%; at the same time, the S&P 500 has dropped by around 6%. The Chinese stock market (Shenzhen 300) has fallen 25% over this same period. On the currency market, the FED’s monetary policy carried out over 2018, coupled with the macro-economic trend (driven by President D. Trump’s fiscal reform passed at the end of 2017), has led to the US dollar outperforming all other currencies. At the close of 2018, the EUR/USD dollar exchange rate stood at 1.1467, compared with 1.20 at the close of 2017. The safe havens, the Japanese yen and the Swiss franc, strengthened against the single currency by 7.5% and 3.8% respectively over the year. At the same time, the yen was up 2.81% against the US dollar, at 109.69 yen for one US dollar. On the credit market, the margins of the Investment and High Yield category indexes widened by 67 bp and 227 bp respectively in 2018 according to the ICE BofAML 'Euro Non-Financial Index' and 'Euro High Yield Index' indexes. On the government bonds market, the German 10-year nominal rate closed at 0.24% on 31 December (-18 bp), fluctuating within a bracket [0.23%; 0.77%], while the US 10-year nominal rate stood at 2.68% (+28 bp) on 31 December, fluctuating within a bracket [2.40%; 3.23%]. The deviation in the 10-year rates between the German sovereign debt and US sovereign debt increased by 45 bp over 2018 to 244 bp, given the loss of synchronisation of global growth (US versus EUR zone, in particular) compared to the start of the year. In the eurozone, the decision taken by the ECB to leave the key interest rate unchanged until summer 2019 also limited any increase in rates. In the United States, the 2-10 year slope flattened out, dropping from 52 bp in 2017 to 19 bp at the end of 2018 in parallel to the FED's interest rate hikes throughout the year. On both sides of the Atlantic, break-even inflation rates fell. The 5-year inflation swap rates have dropped in 5 years by around 18 bp to 2.13% in the United States and by 13 bp to 1.60% in the eurozone. In terms of the peripheral countries, on 31 December 2018, the Italian 2-year rate closed at 0.47%, and the 10-year rate stood at 2.74%. At the end of December, the agreement reached on the 2019 budget between the European Commission and the Italian government spared the country from being placed under excessive deficit procedure. This led to a reduction in the Italian sovereign interest rates and a decline in the interest rate differential against German debt at 10 years to 250 bp (compared to the highest level of 327 bp in mid-October). With regards to financial institutions, the European Central Bank has, unsurprisingly, kept its key interest rates unchanged (deposit rate: -0.40%). It reiterated its 'forward guidance' policy on interest rates "at least through the summer of 2019". Furthermore, it confirmed the asset purchase programme would come to an end at the end of December (injection of EUR 2,600 billion) and that it would continue to reinvest its principal payments from the maturing securities purchased under the APP past the date of the interest rate raises and "for as long as necessary to maintain favourable liquidity conditions and an ample degree of monetary accommodation". The United States Federal Reserve, under the presidency of Jerome Powell, has increased its key interest rates by a quarter of a point four times in 2018, bringing the federal fund rate into a bracket [2.25% 2.50%]. At their final end-of-year meeting, the DOTS were downwardly revised: 2 increases in 2019, 1 increase in 2020 and 0 in 2021. The long-term DOT dropped from 3% to 2.75%. The FED’s balance sheet dropped from almost USD 4,450 billion at the end of 2017 to USD 4,085 billion at the end of 2018, at a rate of USD 50 billion a month. Given the strong uncertainties regarding BREXIT, the Bank of England adopted a cautious approach in 2018. It increased its key interest rate by a quarter of a point over the year, to 0.75% last August, as the price acceleration seems to have slowed down appreciably. In November, the Core CPI stood at 1.8% year-on-year after having stood at over 2% in Q1 2018. At the same time, hourly wages (excluding bonuses) were up by 3.3% at the end of October 2018. The Bank of Japan kept its key interest rate unchanged at -0.10% in 2018, in particular due to the low price levels (Core CPI: 0.9% in November 2018). However, in July, President Kuroda announced more flexibility in the application of his quantitative easing programme with the doubling of the control curve bracket to [-0.20%; +0.20%], while maintaining its 10-year bond yield goal at around 0% and his commitment to improve its bond securities portfolio by JPY 80,000 billion per year. This announcement was accompanied by the maintenance of a low interest rate level for a prolonged period. Additionally, it reduced the amount of bank deposits concerned by the negative interest rate (-0.1%) and increased the proportion of exchange-traded funds benchmarked against the Topix index.
10
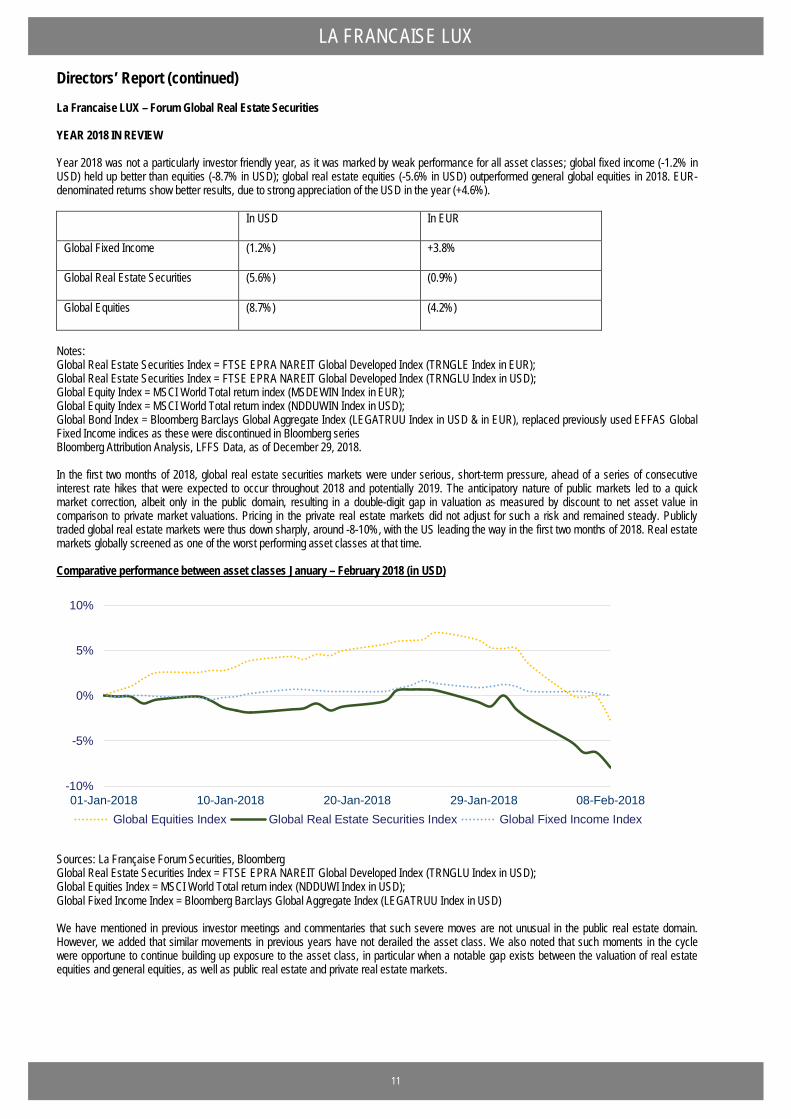
LA FRANCAISE LUX Directors’ Report (continued) La Francaise LUX – Forum Global Real Estate Securities YEAR 2018 IN REVIEW Year 2018 was not a particularly investor friendly year, as it was marked by weak performance for all asset classes; global fixed income (-1.2% in USD) held up better than equities (-8.7% in USD); global real estate equities (-5.6% in USD) outperformed general global equities in 2018. EUR-denominated returns show better results, due to strong appreciation of the USD in the year (+4.6%).
In USD In EUR
Global Fixed Income (1.2%) +3.8%
Global Real Estate Securities (5.6%) (0.9%)
Global Equities (8.7%) (4.2%)
Notes: Global Real Estate Securities Index = FTSE EPRA NAREIT Global Developed Index (TRNGLE Index in EUR); Global Real Estate Securities Index = FTSE EPRA NAREIT Global Developed Index (TRNGLU Index in USD); Global Equity Index = MSCI World Total return index (MSDEWIN Index in EUR); Global Equity Index = MSCI World Total return index (NDDUWIN Index in USD); Global Bond Index = Bloomberg Barclays Global Aggregate Index (LEGATRUU Index in USD & in EUR), replaced previously used EFFAS Global Fixed Income indices as these were discontinued in Bloomberg series Bloomberg Attribution Analysis, LFFS Data, as of December 29, 2018. In the first two months of 2018, global real estate securities markets were under serious, short-term pressure, ahead of a series of consecutive interest rate hikes that were expected to occur throughout 2018 and potentially 2019. The anticipatory nature of public markets led to a quick market correction, albeit only in the public domain, resulting in a double-digit gap in valuation as measured by discount to net asset value in comparison to private market valuations. Pricing in the private real estate markets did not adjust for such a risk and remained steady. Publicly traded global real estate markets were thus down sharply, around -8-10%, with the US leading the way in the first two months of 2018. Real estate markets globally screened as one of the worst performing asset classes at that time. Comparative performance between asset classes January – February 2018 (in USD)
-10%
-5%
0%
5%
10%
01-Jan-2018 10-Jan-2018 20-Jan-2018 29-Jan-2018 08-Feb-2018Global Equities Index Global Real Estate Securities Index Global Fixed Income Index
Sources: La Française Forum Securities, Bloomberg Global Real Estate Securities Index = FTSE EPRA NAREIT Global Developed Index (TRNGLU Index in USD); Global Equities Index = MSCI World Total return index (NDDUWI Index in USD); Global Fixed Income Index = Bloomberg Barclays Global Aggregate Index (LEGATRUU Index in USD) We have mentioned in previous investor meetings and commentaries that such severe moves are not unusual in the public real estate domain. However, we added that similar movements in previous years have not derailed the asset class. We also noted that such moments in the cycle were opportune to continue building up exposure to the asset class, in particular when a notable gap exists between the valuation of real estate equities and general equities, as well as public real estate and private real estate markets.
11
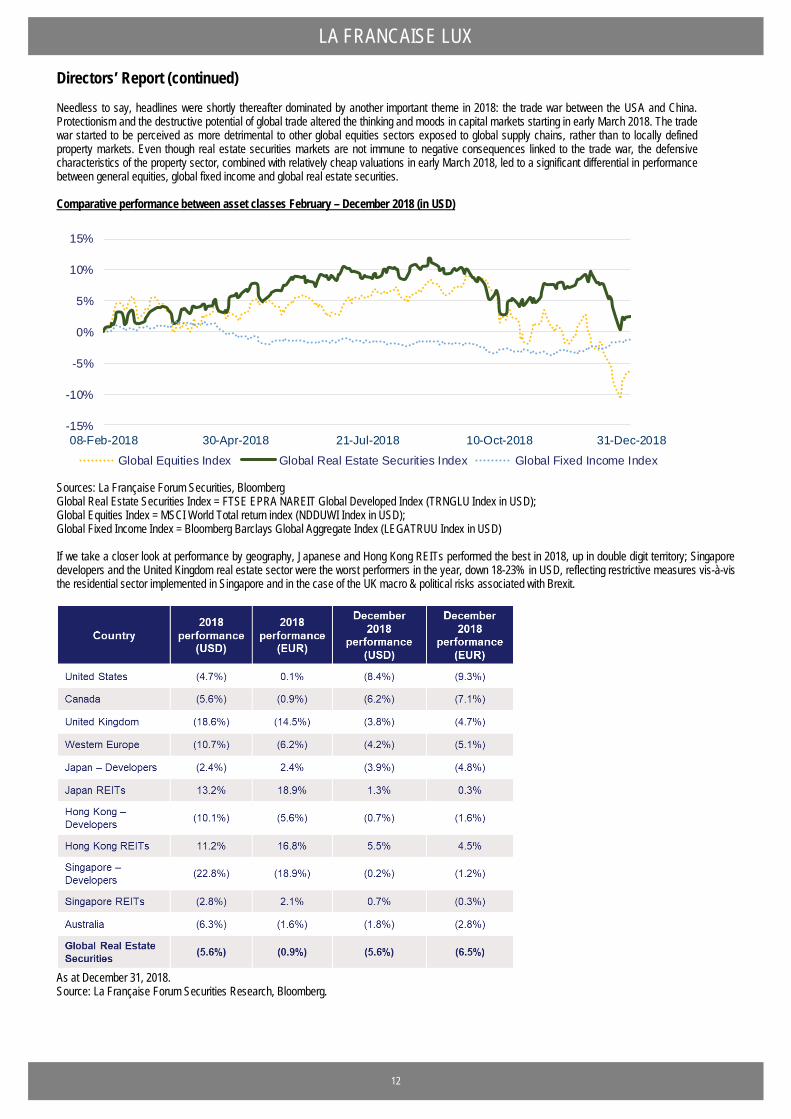
LA FRANCAISE LUX Directors’ Report (continued) Needless to say, headlines were shortly thereafter dominated by another important theme in 2018: the trade war between the USA and China. Protectionism and the destructive potential of global trade altered the thinking and moods in capital markets starting in early March 2018. The trade war started to be perceived as more detrimental to other global equities sectors exposed to global supply chains, rather than to locally defined property markets. Even though real estate securities markets are not immune to negative consequences linked to the trade war, the defensive characteristics of the property sector, combined with relatively cheap valuations in early March 2018, led to a significant differential in performance between general equities, global fixed income and global real estate securities. Comparative performance between asset classes February – December 2018 (in USD)
-15%
-10%
-5%
0%
5%
10%
15%
08-Feb-2018 30-Apr-2018 21-Jul-2018 10-Oct-2018 31-Dec-2018
Global Equities Index Global Real Estate Securities Index Global Fixed Income Index
Sources: La Française Forum Securities, Bloomberg Global Real Estate Securities Index = FTSE EPRA NAREIT Global Developed Index (TRNGLU Index in USD); Global Equities Index = MSCI World Total return index (NDDUWI Index in USD); Global Fixed Income Index = Bloomberg Barclays Global Aggregate Index (LEGATRUU Index in USD) If we take a closer look at performance by geography, Japanese and Hong Kong REITs performed the best in 2018, up in double digit territory; Singapore developers and the United Kingdom real estate sector were the worst performers in the year, down 18-23% in USD, reflecting restrictive measures vis-à-vis the residential sector implemented in Singapore and in the case of the UK macro & political risks associated with Brexit.
As at December 31, 2018. Source: La Française Forum Securities Research, Bloomberg.
12
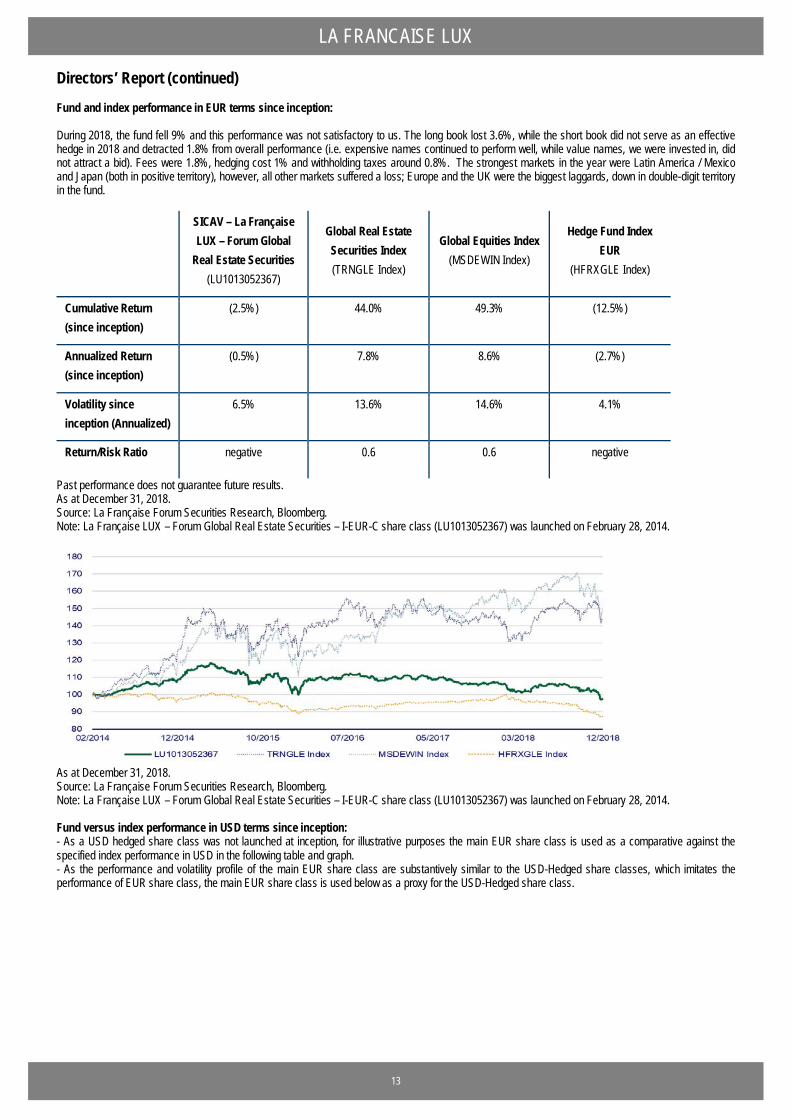
LA FRANCAISE LUX Directors’ Report (continued) Fund and index performance in EUR terms since inception: During 2018, the fund fell 9% and this performance was not satisfactory to us. The long book lost 3.6%, while the short book did not serve as an effective hedge in 2018 and detracted 1.8% from overall performance (i.e. expensive names continued to perform well, while value names, we were invested in, did not attract a bid). Fees were 1.8%, hedging cost 1% and withholding taxes around 0.8%. The strongest markets in the year were Latin America / Mexico and Japan (both in positive territory), however, all other markets suffered a loss; Europe and the UK were the biggest laggards, down in double-digit territory in the fund.
SICAV – La Française LUX – Forum Global
Real Estate Securities (LU1013052367)
Global Real Estate Securities Index (TRNGLE Index)
Global Equities Index (MSDEWIN Index)
Hedge Fund Index EUR
(HFRXGLE Index)
Cumulative Return (since inception)
(2.5%) 44.0% 49.3% (12.5%)
Annualized Return (since inception)
(0.5%) 7.8% 8.6% (2.7%)
Volatility since inception (Annualized)
6.5% 13.6% 14.6% 4.1%
Return/Risk Ratio negative 0.6 0.6 negative
Past performance does not guarantee future results. As at December 31, 2018. Source: La Française Forum Securities Research, Bloomberg. Note: La Française LUX – Forum Global Real Estate Securities – I-EUR-C share class (LU1013052367) was launched on February 28, 2014.
As at December 31, 2018. Source: La Française Forum Securities Research, Bloomberg. Note: La Française LUX – Forum Global Real Estate Securities – I-EUR-C share class (LU1013052367) was launched on February 28, 2014. Fund versus index performance in USD terms since inception: - As a USD hedged share class was not launched at inception, for illustrative purposes the main EUR share class is used as a comparative against the specified index performance in USD in the following table and graph. - As the performance and volatility profile of the main EUR share class are substantively similar to the USD-Hedged share classes, which imitates the performance of EUR share class, the main EUR share class is used below as a proxy for the USD-Hedged share class.
13
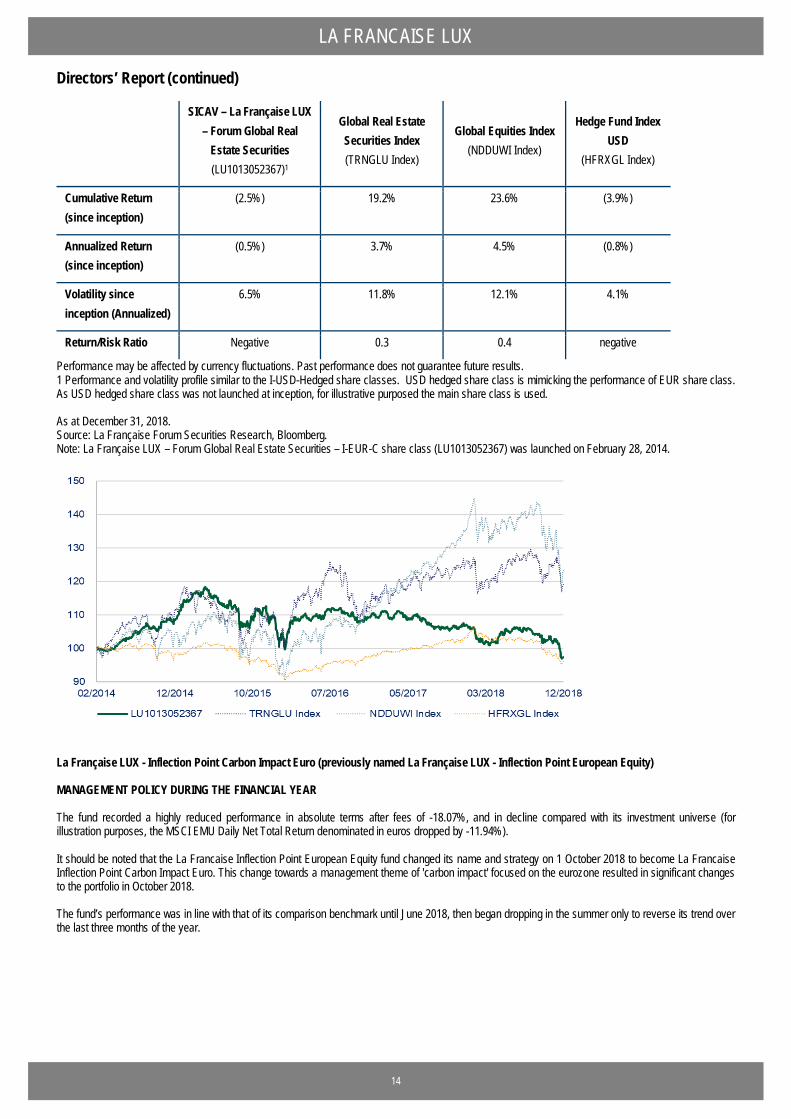
LA FRANCAISE LUX Directors’ Report (continued)
SICAV – La Française LUX – Forum Global Real
Estate Securities (LU1013052367)1
Global Real Estate Securities Index (TRNGLU Index)
Global Equities Index (NDDUWI Index)
Hedge Fund Index USD
(HFRXGL Index)
Cumulative Return (since inception)
(2.5%) 19.2% 23.6% (3.9%)
Annualized Return (since inception)
(0.5%) 3.7% 4.5% (0.8%)
Volatility since inception (Annualized)
6.5% 11.8% 12.1% 4.1%
Return/Risk Ratio Negative 0.3 0.4 negative
Performance may be affected by currency fluctuations. Past performance does not guarantee future results. 1 Performance and volatility profile similar to the I-USD-Hedged share classes. USD hedged share class is mimicking the performance of EUR share class. As USD hedged share class was not launched at inception, for illustrative purposed the main share class is used. As at December 31, 2018. Source: La Française Forum Securities Research, Bloomberg. Note: La Française LUX – Forum Global Real Estate Securities – I-EUR-C share class (LU1013052367) was launched on February 28, 2014.
La Française LUX - Inflection Point Carbon Impact Euro (previously named La Française LUX - Inflection Point European Equity) MANAGEMENT POLICY DURING THE FINANCIAL YEAR The fund recorded a highly reduced performance in absolute terms after fees of -18.07%, and in decline compared with its investment universe (for illustration purposes, the MSCI EMU Daily Net Total Return denominated in euros dropped by -11.94%). It should be noted that the La Francaise Inflection Point European Equity fund changed its name and strategy on 1 October 2018 to become La Francaise Inflection Point Carbon Impact Euro. This change towards a management theme of 'carbon impact' focused on the eurozone resulted in significant changes to the portfolio in October 2018. The fund’s performance was in line with that of its comparison benchmark until June 2018, then began dropping in the summer only to reverse its trend over the last three months of the year.
14
LA FRANCAISE LUX Directors’ Report (continued) The implementation of the fund’s carbon impact theme took place in a context of abrupt correction (the S&P 500 having seen its lowest monthly decline in 7 years!). In an already tense European market complicated by the US-China trade war, complacency on the markets has been damaged by the Italian crisis, Brexit and warnings on results sounded by German actors. The European season of Q3 quarterly results has been noticeably affected by significant stock market sanctions. The portfolio has particularly suffered, especially since 15 September. Before the change in strategy to the 'Carbon Impact' theme in October, we had a poor grasp of the changes in trends brought about by the geopolitical risks and fears of a paradigm change resulting from the policy changes of the central banks added to the fears of a global economic downturn. Investors therefore collected their profits on highly performing securities with an increased valuation and which are indexed to the economic cycle (Luxury Goods, Cars, Manufacturers, Base Materials). As a result, securities that had performed particularly well in the first half of the year, such as Ubisoft, Airbus, SAP and LVMH (positive impact of +0.25% over the financial year after all), lost almost all of their profit. BNP Paribas (-1.13%) and Credit Agricole (-1.01%) also appear amongst the main negative contributions following the severe correction in the financial sector. Finally, at the same time, our underweighting in the "defensive sectors" such as Telecoms, Utilities and Media (excluding Advertising agencies and TV) also worked against us. On the other hand, Carl Zeiss (contribution of +0.25%) did particularly well in the portfolio with a consistently solid growth outlook, both in terms of turnover (very dynamic product cycle) and operational margin (which should reach the highest expected bracket, or even surpass 16% between now and 2020). Likewise, other securities in the Healthcare sector have set themselves apart, such as Ambu (+50.4%) and Shire Pic (+18.2%). Neste Oil (+21.2%) and Logitech (+20.5%) have also had some of the best performances of the financial year. La Française LUX - Inflection Point Gonet Swiss Equity Financial year from December 31, 2017 to December 31, 2018 MANAGER’S OBSERVATIONS Global risk assets experienced an extremely volatile 12 months and ended the year in negative territory (MSCI World: -10.4%, Stoxx 600: -13.2%, S&P 500: -6.2% for 2018). The Swiss stock market did not escape the downturn (-8.6%). However, it actually delivered an acceptable performance in comparison to its European counterparts (DAX: -18.3%, CAC 40: -11%, FTSE MIB: -16.2%). Once again, the SMI benefited from its more defensive structure (Nestlé, Novartis and Roche account for more than 50% of its index); thus enabling the index to limit downside losses. With regard to the LFIP fund, it ended 2018 with a performance of -13.7% (including dividends and fees). Nevertheless, this return closely matched the SLI (-11.9% dividends reinvested) which corresponds to the SPI (UCITS), with the same constraints as this fund. Over the year, the Swiss franc rose +3.8% against the euro. From a sectoral viewpoint, public services (+17.5% for 2018), healthcare (+2.6%) and real estate (-2.2%) were the best performers on an annual basis, underlining the attraction of the defensive sector and the aversion to risk which dominated sentiment throughout the year. Due to their cyclical nature, technology (-29.7%), consumer discretionary stocks (-26.4%) and industrials (-22.8%) posted the sharpest declines. In 2018, the largest contributors to performance in the LFIP Gonet Swiss Equity fund were Swiss Life (+14% over the year, dividends reinvested), Novartis (+5.7%), Zurich Insurance Group (+4.8%), Swiss Re (+4%) and Givaudan (+3.9%). Naturally, these stocks benefited from their defensive nature as well as their attractive dividend yields (in the case of insurance companies). Stocks with low levels of debt, stable dividends and which operate in markets that are less affected by cyclical factors were eagerly sought by investors. The stocks which had a negative effect on the annual performance of the fund were the more cyclical securities, mainly industrials and banks: Implenia (-48.4%, dividends reinvested), Georg Fischer (-37.8%), Credit Suisse (-37%), Clariant (-32.1%) and UBS (-29%). Following the arrival of André Wyss, the new CEO of Implenia, the profitability of business activities which did not meet expectations were reviewed in full. This analysis resulted in management significantly lowering its financial forecasts for 2018. Georg Fischer pointed to a slowdown in key segments, citing a downturn in demand, particularly in China. Clariant was penalised by the cyclical nature of its operations as well as the speculation surrounding its capital following the exit of activist investors. Credit Suisse and UBS suffered due to the fears surrounding the banking sector as a whole, caused by the Italian budget crisis and the downturn in emerging markets (Turkey, Argentina, South Africa). During December, the Swiss National Bank (SNB) met for its quarterly assessment. Following discussions, it chose to leave its monetary policy unchanged. Overall, the tone of the bank was accommodating in view of the sharp rise in the Swiss franc and inflation forecasts. The central bank lowered its inflation forecasts for 2019 to 0.5% (it previously stood at 0.8%) and 1% for 2020 (previously 1.2%), on the assumption that interest rates will remain unchanged. The main reasons given were the fall in the oil price and a slowdown in growth in the country (around 1.5% in 2019 according to SNB). The principal risks listed were Brexit, Italy and protectionist measures adopted by the USA. With regard to relations with Europe, the EU extended Switzerland’s stock market equivalence by six months. The discussions with EU authorities had led to a lot of uncertainty as the agreement with Brussels was due to run out on 31 December 2018. In December 2017, the European Union had limited stock market equivalence to a period of one year. Henceforth, companies and the Swiss stock market will be able to operate normally following an announcement from European Commissioner Johannes Hahn. However, Julian Chan, the spokesperson for the Six Swiss Exchange, has advocated for an indefinite extension to the stock market equivalence. Valdis Dombrovskis, vice-president for financial stability, financial services and the capital markets union, stated “a temporary extension of equivalence should provide time to Switzerland to finalise its internal consultation on the Institutional Framework Agreement”. Thus, this remains a major political and economic project for Switzerland in 2019. In 2019, the direction of the Swiss stock exchange will be dictated by external factors. On the one hand, it should continue to play its role of safe haven owing to the composition of the index, however this will be to the detriment of cyclical and banking stocks. On the other hand, a soft landing for global growth should generate renewed interest in stocks in more cyclical sectors which were hard hit during the phase of strong risk aversion in the second half of 2018.
15
LA FRANCAISE LUX Directors’ Report (continued) La Française LUX - Inflection Point Leaders Emergents MANAGEMENT POLICY DURING THE FINANCIAL YEAR The fund recorded a highly reduced performance in absolute terms after fees of -13.58%, and in decline compared with its benchmark, the MSCI Emerging Markets Daily Net Total Return denominated in euros (-10.27%). The fund has remained in line with its benchmark since it was created on 12/3/2009. Its volatility at one year is slightly below that of the benchmark (+15.34% vs. +15.89%) and the Tracking Error 2018 has increased to 4.35%. While the allocation effect proved to be positive (+1.82%), the choice of securities (-4.56%) and, in particular, the currency effect (-1.8%) are the main reasons for lagging behind the benchmark. The currency effect is primarily the result of overweighting in Asia and, more specifically, the Chinese Renminbi which has dropped markedly in a context of uncertainty related to the China-US trade war and, at the same time, a drop in oil prices. Not surprisingly, the analysis of the selection effect demonstrates that securities linked to Chinese consumption (US-China trade tensions, slowdown of the Chinese economy: retail sales grew at their slowest rate in 15 years in November) are the main negative contributors, such as: Brilliance China Automotive (contribution of -1.97%), Alibaba Group HOLDING-SP Adr (-1.12%), Samsung Electronics Co Ltd Asia (-1.11%), Vipshop Holdings Ltd-Adr (-1.02%) and Sberbank – Sponsored Adr (-1.13%) which have been penalised by the rouble's decline following sanctions imposed by the US government that primarily target large Russian banks with a presence in the United States and impose restrictions on the purchase and ownership of Russian debt. The main positive points have been our holdings in Lukoil –Adr (+0.96%), Itau Unibanco Adr (contribution of 0.61%), Housing Development Finance (+0.43%), Walmart de Mexico (+0.43%) and Havells India Ltd (+0.40%). La Française LUX - Inflection Point Carbon Impact Global (previously named La Française LUX - Inflection Point Zero Carbon) MANAGEMENT POLICY DURING THE FINANCIAL YEAR The fund recorded a highly reduced performance in absolute terms after fees of -9.47%, and in decline compared with its benchmark (for comparison purposes), the MSCI World All Countries Daily Net Total Return denominated in euros (-4.85%). The fund’s performance was in line with that of its comparison benchmark until September (with a peak of nearly 3% relative outperformance in March 2018), then began losing ground at the beginning of October only to reverse its trend again over the last three months of the year. In a context of widespread turmoil on the markets due to global trade tensions and fears of an imminent recession weighing down global indexes, the fund dropped by -9.47% over 2018, with all three investment categories taking a downward turn over the course of the year. Among all these categories, Microsoft was our strongest performer (our largest weighting, with a contribution of +94 bp), followed by Salesforce (which also had a strong portfolio presence, increasing by +57 bp). Visa, Shiseido and Shopify all made positive contributions of +40 bp. We have collected all our profits on Shiseido, but all of these other large weightings remain in the portfolio. Additionally, the worst performance contributions came from Panasonic, contributing to a drop of -66 bp, followed by BNP Paribas, Netflix and Albemarie, which dropped by almost 40-50 bp over the year. Albemarie has been sold, and we have reduced our Netflix weighting. Companies in transition were more highly affected by the drop in the markets than the companies facilitating transition, particularly in the United States and France. Only Japanese, Belgian and Swiss companies in transition recorded a gain. With regards to companies facilitating the transition, Asian (Japanese and Chinese) companies such as Brilliance, BYD, Yutong and Panasonic saw sharp declines. Among the companies the facilitating transition, only the Canadians (Shopify) saw an increase. In view of the notable improvement of the fundamentals of wind energy, Vestas, a solutions supplier, saw growth, while Nextera remained stable over the year and GE and Siemens Gamesa saw a decline. Overall, the negative contribution of the Cleantech category was negligible. All these positions have been kept in the portfolio.
16
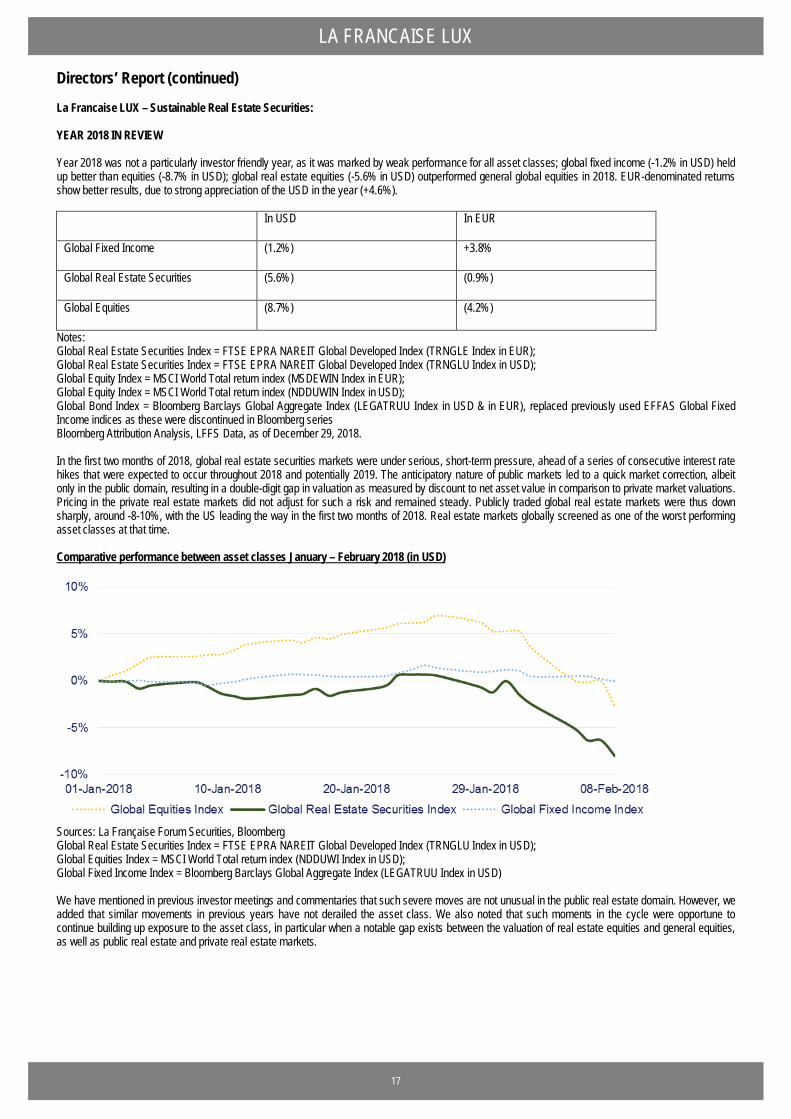
LA FRANCAISE LUX Directors’ Report (continued) La Francaise LUX – Sustainable Real Estate Securities: YEAR 2018 IN REVIEW Year 2018 was not a particularly investor friendly year, as it was marked by weak performance for all asset classes; global fixed income (-1.2% in USD) held up better than equities (-8.7% in USD); global real estate equities (-5.6% in USD) outperformed general global equities in 2018. EUR-denominated returns show better results, due to strong appreciation of the USD in the year (+4.6%).
In USD In EUR
Global Fixed Income (1.2%) +3.8%
Global Real Estate Securities (5.6%) (0.9%)
Global Equities (8.7%) (4.2%)
Notes: Global Real Estate Securities Index = FTSE EPRA NAREIT Global Developed Index (TRNGLE Index in EUR); Global Real Estate Securities Index = FTSE EPRA NAREIT Global Developed Index (TRNGLU Index in USD); Global Equity Index = MSCI World Total return index (MSDEWIN Index in EUR); Global Equity Index = MSCI World Total return index (NDDUWIN Index in USD); Global Bond Index = Bloomberg Barclays Global Aggregate Index (LEGATRUU Index in USD & in EUR), replaced previously used EFFAS Global Fixed Income indices as these were discontinued in Bloomberg series Bloomberg Attribution Analysis, LFFS Data, as of December 29, 2018. In the first two months of 2018, global real estate securities markets were under serious, short-term pressure, ahead of a series of consecutive interest rate hikes that were expected to occur throughout 2018 and potentially 2019. The anticipatory nature of public markets led to a quick market correction, albeit only in the public domain, resulting in a double-digit gap in valuation as measured by discount to net asset value in comparison to private market valuations. Pricing in the private real estate markets did not adjust for such a risk and remained steady. Publicly traded global real estate markets were thus down sharply, around -8-10%, with the US leading the way in the first two months of 2018. Real estate markets globally screened as one of the worst performing asset classes at that time. Comparative performance between asset classes January – February 2018 (in USD)
Sources: La Française Forum Securities, Bloomberg Global Real Estate Securities Index = FTSE EPRA NAREIT Global Developed Index (TRNGLU Index in USD); Global Equities Index = MSCI World Total return index (NDDUWI Index in USD); Global Fixed Income Index = Bloomberg Barclays Global Aggregate Index (LEGATRUU Index in USD) We have mentioned in previous investor meetings and commentaries that such severe moves are not unusual in the public real estate domain. However, we added that similar movements in previous years have not derailed the asset class. We also noted that such moments in the cycle were opportune to continue building up exposure to the asset class, in particular when a notable gap exists between the valuation of real estate equities and general equities, as well as public real estate and private real estate markets.
17
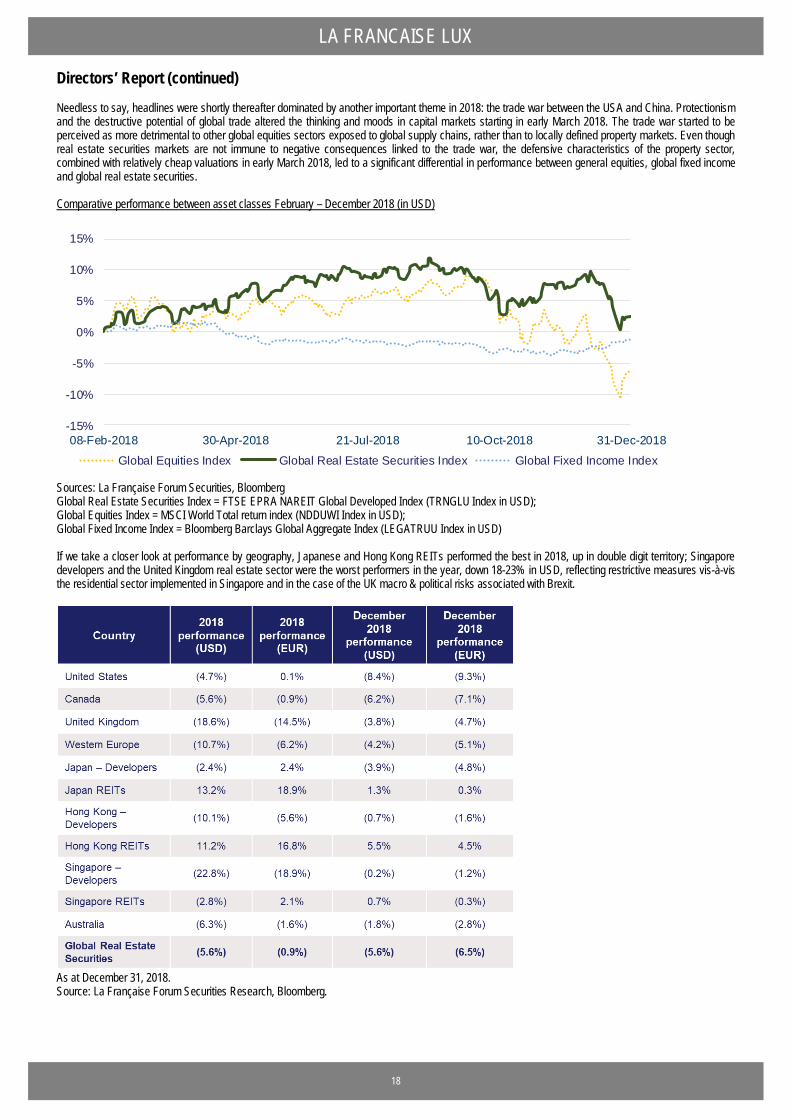
LA FRANCAISE LUX Directors’ Report (continued) Needless to say, headlines were shortly thereafter dominated by another important theme in 2018: the trade war between the USA and China. Protectionism and the destructive potential of global trade altered the thinking and moods in capital markets starting in early March 2018. The trade war started to be perceived as more detrimental to other global equities sectors exposed to global supply chains, rather than to locally defined property markets. Even though real estate securities markets are not immune to negative consequences linked to the trade war, the defensive characteristics of the property sector, combined with relatively cheap valuations in early March 2018, led to a significant differential in performance between general equities, global fixed income and global real estate securities. Comparative performance between asset classes February – December 2018 (in USD)
-15%
-10%
-5%
0%
5%
10%
15%
08-Feb-2018 30-Apr-2018 21-Jul-2018 10-Oct-2018 31-Dec-2018
Global Equities Index Global Real Estate Securities Index Global Fixed Income Index
Sources: La Française Forum Securities, Bloomberg Global Real Estate Securities Index = FTSE EPRA NAREIT Global Developed Index (TRNGLU Index in USD); Global Equities Index = MSCI World Total return index (NDDUWI Index in USD); Global Fixed Income Index = Bloomberg Barclays Global Aggregate Index (LEGATRUU Index in USD) If we take a closer look at performance by geography, Japanese and Hong Kong REITs performed the best in 2018, up in double digit territory; Singapore developers and the United Kingdom real estate sector were the worst performers in the year, down 18-23% in USD, reflecting restrictive measures vis-à-vis the residential sector implemented in Singapore and in the case of the UK macro & political risks associated with Brexit.
As at December 31, 2018. Source: La Française Forum Securities Research, Bloomberg.
18
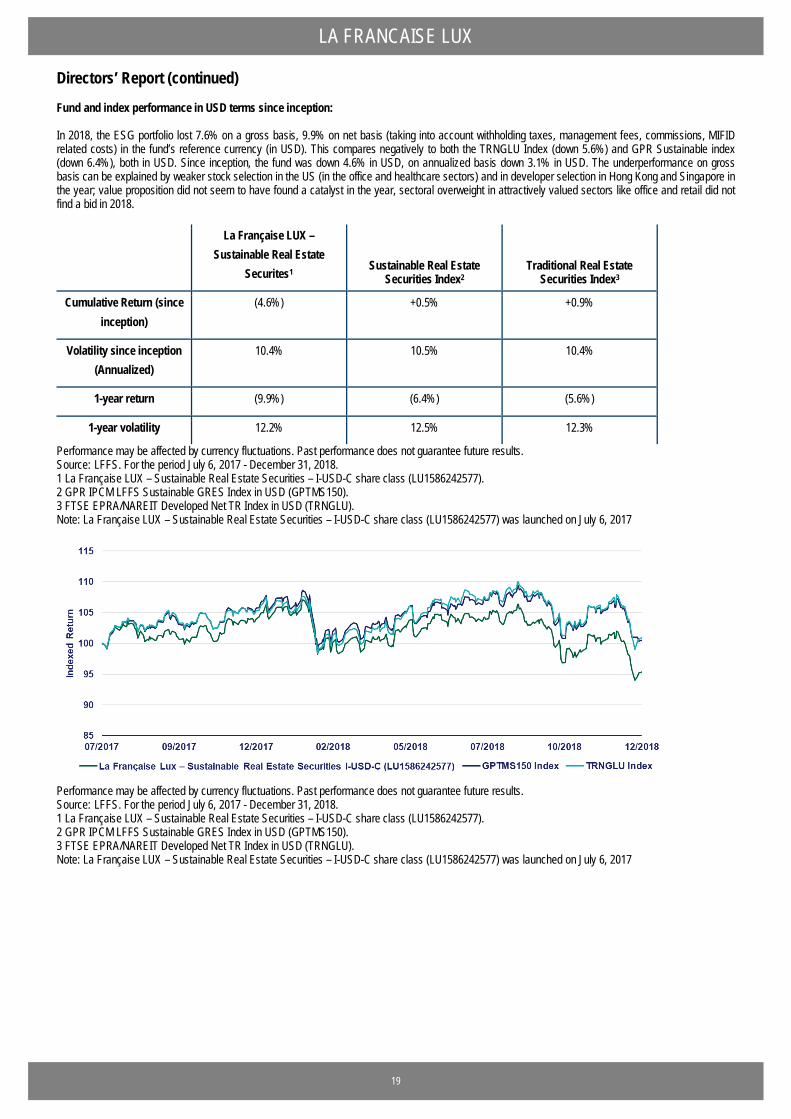
LA FRANCAISE LUX Directors’ Report (continued) Fund and index performance in USD terms since inception: In 2018, the ESG portfolio lost 7.6% on a gross basis, 9.9% on net basis (taking into account withholding taxes, management fees, commissions, MIFID related costs) in the fund’s reference currency (in USD). This compares negatively to both the TRNGLU Index (down 5.6%) and GPR Sustainable index (down 6.4%), both in USD. Since inception, the fund was down 4.6% in USD, on annualized basis down 3.1% in USD. The underperformance on gross basis can be explained by weaker stock selection in the US (in the office and healthcare sectors) and in developer selection in Hong Kong and Singapore in the year; value proposition did not seem to have found a catalyst in the year, sectoral overweight in attractively valued sectors like office and retail did not find a bid in 2018.
La Française LUX –Sustainable Real Estate
Securites1 Sustainable Real Estate Securities Index2
Traditional Real Estate Securities Index3
Cumulative Return (since inception)
(4.6%) +0.5% +0.9%
Volatility since inception (Annualized)
10.4% 10.5% 10.4%
1-year return (9.9%) (6.4%) (5.6%)
1-year volatility 12.2% 12.5% 12.3%
Performance may be affected by currency fluctuations. Past performance does not guarantee future results. Source: LFFS. For the period July 6, 2017 - December 31, 2018. 1 La Française LUX – Sustainable Real Estate Securities – I-USD-C share class (LU1586242577). 2 GPR IPCM LFFS Sustainable GRES Index in USD (GPTMS150). 3 FTSE EPRA/NAREIT Developed Net TR Index in USD (TRNGLU). Note: La Française LUX – Sustainable Real Estate Securities – I-USD-C share class (LU1586242577) was launched on July 6, 2017
Performance may be affected by currency fluctuations. Past performance does not guarantee future results. Source: LFFS. For the period July 6, 2017 - December 31, 2018. 1 La Française LUX – Sustainable Real Estate Securities – I-USD-C share class (LU1586242577). 2 GPR IPCM LFFS Sustainable GRES Index in USD (GPTMS150). 3 FTSE EPRA/NAREIT Developed Net TR Index in USD (TRNGLU). Note: La Française LUX – Sustainable Real Estate Securities – I-USD-C share class (LU1586242577) was launched on July 6, 2017
19
LA FRANCAISE LUX Directors’ Report (continued) La Française LUX - Absolute Emerging Debt MANAGEMENT POLICY DURING THE FINANCIAL YEAR Despite positive fundamental factors across all of the emerging countries, the Fixed Income EM asset class has had many obstacles to overcome this year: trade and political tensions emanating from the United States towards several countries, including Mexico, Turkey and China, the FED’s anticipated policy of monetary tightening policy, the sharp drop in oil prices since October, and, last but not least, early fears of a US and Chinese slowdown. In 2018, emerging markets bonds in US dollars recorded the greatest loss since 2013, with the average yield increasing by 155 base points to 6.06%. The risk premium on emerging market sovereign bonds in US dollars compared to US Treasury securities has increased by 125 base points, up from 410 bp and reaching its highest level since June 2016 according to JPMorgan Chase indexes. In this context, our management got off to a cautious start at the beginning of the year. Opportunities in terms of valuation became apparent following the initial corrections in April. Despite solid fundamentals, strong growth and curbed inflation in general, except in Argentina and Turkey, the emerging rate markets will not bounce back over the year: Political risks in Europe (Italy, Brexit) and in the United States (foreign and trade policy) have damaged investors’ sentiment and appetite for this asset class in 2018. Our total commitment to emerging bonds has sat at 82.16% on average, for 17.84% cash. The component’s performance stood at -4.93%. Foreign currency positions, including euro hedging of US dollar assets, made a -4.24% contribution. Finally, the derived products positions (futures and CDS) which have primarily been used as relative value strategies made a -1.97% contribution. La Française LUX - Euro Inflation MANAGEMENT POLICY DURING THE FINANCIAL YEAR In 2018, the two components inherent to inflation-linked bonds have impacted the performance of these assets: the interest rate component, with the increased volatility of the Italian rates since May, and the inflation component with the almost 40% drop in oil prices in the last quarter significantly impacting inflation expectations. This has resulted in the fund’s negative performance over the year, explained by both the interest rates and break-even inflation present in the portfolio. The negative contribution of the Italian exposure remains, nevertheless, limited (-0.46% compared to -1.16% for the benchmark index), whereas the interest rate and inflation risk management in Germany and France is more marked (-1.73% compared to -0.41% for the benchmark index). Finally, the diversification component has been primarily used on the US markets and has made a positive contribution (+0.41%) over the year. La Française LUX - Global Credit Duration Hedged
MANAGEMENT POLICY DURING THE FINANCIAL YEAR In 2018, the La Française LUX - Global Credit Duration Hedged - I (C) EUR displayed a performance of -4.08%. 2018 was a volatile year for the financial markets due to the global political and geopolitical tensions discussed above. The credit market was no exception, with a significant increase in volatility as well as a noticeable reduction of liquidity at the end of the year, while the ECB reduced its purchases of corporate debt. The first half of the year was marked by two key events for risky assets: the flash-crash that occurred at the beginning of February caused by fears about the trajectory of US inflation, and the political tensions in Italy provoking a strong reaction with regards to sovereign debt and, as a result, to the credit spreads of financial securities. The fund’s exposure to subordinated bank debts suffered from these two incidents, with a progressive reduction over Q3 in the absence of clarity on the situation in Italy and the growing volatility of this type of asset. Moreover, technical factors also contributed to the decrease in valuations with constant outgoing flows on US and Euro Investment Grade credit, in a context of tightening monetary policies by the central banks. During the second half of the year, the volatility continued to make its presence known as the Brexit deadline approaches, as well as in response to the exacerbation of trade tension between China and the United States. As a result, primary activity has dropped significantly (drop of almost 10% compared to 2017 on both sides of the Atlantic), investors have become more risk-averse and the slowdown of certain economic indicators have reinforced this general sentiment, as witnessed by the strong corrections observed on the share, credit and commodities indexes. In view of the deterioration of market conditions, we have opted for a more defensive position since September, which has translated to a large reduction in the average maturity, increased exposure to variable-rate bonds, increased average ratings within the portfolio and a larger liquidity buffer. We have also reduced our exposure to the US market, given the large hedging cost (around 3.5% p.a. over 3 months). Under these conditions, we will maintain a conservative position, with part of the diversification on unlevered beta. We will remain ready to allocate liquidities to upcoming primary activities that should offer large bonuses to attract investors.
20
LA FRANCAISE LUX Directors’ Report (continued) La Française LUX - Global High Yield MANAGEMENT POLICY DURING THE FINANCIAL YEAR On the credit market, the margins (spreads) of the Investment and High Yield category benchmarks widened over 2018. With regards to High Yield, the global benchmark spreads increased by 170 bp, for a performance over the year of -4.69% (total performance of the Barclay’s benchmark hedged in euros). The High Yield euro market was particularly affected given the area-specific difficulties faced by the zone (Italy and Brexit), with a spread of more than 200 bp in 2018. The emerging markets, particularly Asia, also suffered. Finally, with regards to the US market, it held out well until mid-October but has since seen a significant decline which continued to worsen as the year closed, with the drop in oil prices and the specific problems related to the US administration. Over 2018, the La Française Lux Global High Yield fund recorded a performance of -6.20% (I units in EUR) vs -4.69% for its benchmark. The fund’s yield-to-maturity as at 31/12/2018 is at 6.73% corresponding to a spread (vs swap rate) of 479 bp. In terms of geographical distribution, the fund is invested to the tune of 21.43% in Europe; 67.51% in US issuers and the rest in other issuers (not including emerging markets). In terms of sectoral distribution, the fund is overweighted compared to its benchmark in the energy, cyclical consumption, commodities and technology sectors. The fund’s average rating is BB- vs B+ for its index. La Française LUX – JKC Asia Bond The Asian USD bond market had an extremely challenging year in 2018 as rising US Treasury yields combined with a widening of global credit spreads to drive negative returns across both investment grade and high yield markets. Lower rated bonds were particularly hard hit as concerns over the rising US dollar hurt the general sentiment towards global emerging markets while Asia specific issues such as the rising Sino/US trade tensions and the Chinese Government’s deleveraging campaign caused significant volatility in high yield markets. Ultimately the Asian market, as measured by the Markit Asian dollar bond index (ADBI), generated a total return of -0.43% for the year while the HY (AHBI) Index fell -3.52% over the same period. Market weakness began as early as January as the US Fed’s rate hike in Dec 2017 and its signaling for a sustained monetary tightening basis throughout 2018 drove a sharp correction in US Treasury bonds in the 1Q18. Indeed, the yield on the 10 yr UST bond spiked 45bps in the first two months of the year driving weakness across all longer duration assets. Compounding this move, the Asian credit spread tightening seen in 2016/17 left little valuation buffer for the bond market to absorb these rate rises and spreads quickly sold off along with interest rates. In the 2Q, the selloff in Asian bonds accelerated after a rise in the US Dollar sparked a market exodus out of EM and a flight to quality, culminating in the 3Q which saw currency crises in markets such as Turkey, South Africa and Argentina. In Asia, frontier sovereigns such as Sri Lanka and Pakistan were particularly negatively impacted by these EM developments while Indonesian and Indian corporate bonds also fell on refinancing fears. The most volatile sector, however, was Chinese HY bonds which saw a sharp drop in the 2Q18. In late 2017 the Chinese government announced a deleveraging campaign to both combat excessive debt in the state owned enterprise (SOE) sector and to reduce to influence of shadow banking in the Chinese domestic financial system. Although this campaign did have some modest success on improving SOE balance sheets, the unforeseen implication was a heavy curtailment of non-formal financing channels such as domestic bonds, private wealth management products and trust financing. This had a profound impact on private sector corporates which had been heavily reliant on shadow banking liquidity and although the government ultimately moved to ease these policies, the result was an increase in onshore default rates for CNY bonds issued by SME companies. Default rates still remain low in China but a few high profile corporate failures hurt domestic investor sentiment which ultimately spread to the offshore USD market. Exacerbating the situation was headlines surrounding the US/China trade tensions which, although not having a large direct impact on domestically focused bond issuers, did also add to the negative sentiment on the market, particularly from overseas investors. The market did stabilize at year end after the government made several announcements that it would re-stimulate the SME sector and China/US relations started to improve, however the year still ended with the worst annual returns since the 2013 taper tantrum. In 2018, the La Francaise LUX JKC Asia bond fund (USD share class) generated a return of -2.05%. Stripping out management and operational cost, the fund underperformed the ADBI index by 23bps for the year. This underperformance was mainly on account of our high beta due to the overweight in HY bonds relative to the benchmark at the start of the year which, for the same reason, had driven our outperformance the previous year. Significantly offsetting our losses however was the fund’s consistent duration underweight basis throughout 2018 2019 Outlook Given the negative returns in 2018, valuations in Asian USD bonds on both a yield and spread basis significantly improved and the market started 2019 well positioned for a recovery. Indeed, at the end of 2018, average yield on the Asian HY market, climbed to its highest level since the creation of the Markit Asian HY Index in 2013 while the spread premium between similarly rated Asian and US bonds also increased significantly compared to a year previously. Fundamentally speaking we see a balance of positive and negative risks for 2019. There has clearly been a shift in the narrative from the US Federal Reserve which spent most of 2018 implementing systematic monetary tightening but has shifted its stance, since the start of this year, to being more data dependent and, as such, market expectations of further rate hikes has fallen sharply, particularly as economic data out of both US and Europe in early 2019 has been quite mixed. This has created a somewhat benign environment for both US Treasuries and the USD which has been highly supportive of sentiment towards EM bonds.
21
LA FRANCAISE LUX Directors’ Report (continued) Furthermore the large regional overhangs of last year, namely the US/China trade war and China deleveraging campaign also appear to have improved. Negotiations between China and the US regarding trade tariffs have shown signs of progress and, although we do not see this as a major fundamental driver for the bond market specifically, this has started to support overseas fund flows into the region. Meanwhile the appetite for Chinese bonds from domestic investors has also recovered as the Chinese policy makers have tried to loosen onshore liquidity for private enterprises. This is clearly demonstrated by new issues where Chinese HY deals launched since the start of the year have been heavily oversubscribed. On the flip side there do remain risks in the market. In Europe the economic slowdown in Italy combined with uncertainty over Brexit as clearly raised growth fears in the EU where the ECB recently announced plans to extend its easy monetary bias. In the US, growth concerns are also starting to surface as the upside of last year’s fiscal stimulus starts to wane and political stability in Washington remains fractious. Closer to Asia, China continues to deal with its own slowing economy and although it appears to have navigated this soft landing well so far there remains concerns of high leverage in certain segments of the economy overwhelming policy makers ability to contain any market shocks. Elsewhere in Asia, both India and Indonesia face elections in 2019 and although incumbents are expected to win, this could still drive some political volatility on the market. For our funds we maintain our strategy of de-risking through diversification. Asian valuations currently present an attractive investment opportunity but unforeseen risks demand highly disciplined credit selection and significant diversification For the La Francaise LUX JKC Asia Bond fund, we maintain our slightly short duration exposure (relative to the benchmark) in particular targeting BBB and BB names which offer attractive risk reward valuations. La Française LUX – JKC Asia Bond 2023 The Asian USD bond market had an extremely challenging year in 2018 as rising US Treasury yields combined with a widening of global credit spreads to drive negative returns across both investment grade and high yield markets. Lower rated bonds were particularly hard hit as concerns over the rising US dollar hurt the general sentiment towards global emerging markets while Asia specific issues such as the rising Sino/US trade tensions and the Chinese Government’s deleveraging campaign caused significant volatility in high yield markets. Ultimately the Asian market, as measured by the Markit Asian dollar bond index (ADBI), generated a total return of -0.43% for the year while the HY (AHBI) Index fell -3.52% over the same period. Market weakness began as early as January as the US Fed’s rate hike in Dec 2017 and its signaling for a sustained monetary tightening basis throughout 2018 drove a sharp correction in US Treasury bonds in the 1Q18. Indeed, the yield on the 10 yr UST bond spiked 45bps in the first two months of the year driving weakness across all longer duration assets. Compounding this move, the Asian credit spread tightening seen in 2016/17 left little valuation buffer for the bond market to absorb these rate rises and spreads quickly sold off along with interest rates. In the 2Q, the selloff in Asian bonds accelerated after a rise in the US Dollar sparked a market exodus out of EM and a flight to quality, culminating in the 3Q which saw currency crises in markets such as Turkey, South Africa and Argentina. In Asia, frontier sovereigns such as Sri Lanka and Pakistan were particularly negatively impacted by these EM developments while Indonesian and Indian corporate bonds also fell on refinancing fears. The most volatile sector, however, was Chinese HY bonds which saw a sharp drop in the 2Q18. In late 2017 the Chinese government announced a deleveraging campaign to both combat excessive debt in the state owned enterprise (SOE) sector and to reduce to influence of shadow banking in the Chinese domestic financial system. Although this campaign did have some modest success on improving SOE balance sheets, the unforeseen implication was a heavy curtailment of non-formal financing channels such as domestic bonds, private wealth management products and trust financing. This had a profound impact on private sector corporates which had been heavily reliant on shadow banking liquidity and although the government ultimately moved to ease these policies, the result was an increase in onshore default rates for CNY bonds issued by SME companies. Default rates still remain low in China but a few high profile corporate failures hurt domestic investor sentiment which ultimately spread to the offshore USD market. Exacerbating the situation was headlines surrounding the US/China trade tensions which, although not having a large direct impact on domestically focused bond issuers, did also add to the negative sentiment on the market, particularly from overseas investors. The market did stabilize at year end after the government made several announcements that it would re-stimulate the SME sector and China/US relations started to improve, however the year still ended with the worst annual returns since the 2013 taper tantrum. The La Francaise LUX JKC Asia bond 2023 fund generated a return of -5.39% (or -4.47% gross of fees). Although this fund does not have an official benchmark, the portfolio underperformed the general Asian market on account of its 100% HY weighting and high beta nature. The fund maintains a highly diversified structure and as such no one position materially drove the fund’s negative performance which was broad based across all countries and sectors in the HY market. 2019 Outlook Given the negative returns in 2018, valuations in Asian USD bonds on both a yield and spread basis significantly improved and the market started 2019 well positioned for a recovery. Indeed, at the end of 2018, average yield on the Asian HY market, climbed to its highest level since the creation of the Markit Asian HY Index in 2013 while the spread premium between similarly rated Asian and US bonds also increased significantly compared to a year previously. Fundamentally speaking we see a balance of positive and negative risks for 2019. There has clearly been a shift in the narrative from the US Federal Reserve which spent most of 2018 implementing systematic monetary tightening but has shifted its stance, since the start of this year, to being more data dependent and, as such, market expectations of further rate hikes has fallen sharply, particularly as economic data out of both US and Europe in early 2019 has been quite mixed. This has created a somewhat benign environment for both US Treasuries and the USD which has been highly supportive of sentiment towards EM bonds. Furthermore the large regional overhangs of last year, namely the US/China trade war and China deleveraging campaign also appear to have improved. Negotiations between China and the US regarding trade tariffs have shown signs of progress and, although we do not see this as a major fundamental driver for the bond market specifically, this has started to support overseas fund flows into the region. Meanwhile the appetite for Chinese bonds from domestic investors has also recovered as the Chinese policy makers have tried to loosen onshore liquidity for private enterprises. This is clearly demonstrated by new issues where Chinese HY deals launched since the start of the year have been heavily oversubscribed.
22
LA FRANCAISE LUX Directors’ Report (continued) On the flip side there do remain risks in the market. In Europe the economic slowdown in Italy combined with uncertainty over Brexit as clearly raised growth fears in the EU where the ECB recently announced plans to extend its easy monetary bias. In the US, growth concerns are also starting to surface as the upside of last year’s fiscal stimulus starts to wane and political stability in Washington remains fractious. Closer to Asia, China continues to deal with its own slowing economy and although it appears to have navigated this soft landing well so far there remains concerns of high leverage in certain segments of the economy overwhelming policy makers ability to contain any market shocks. Elsewhere in Asia, both India and Indonesia face elections in 2019 and although incumbents are expected to win, this could still drive some political volatility on the market. For our funds we maintain our strategy of de-risking through diversification. Asian valuations currently present an attractive investment opportunity but unforeseen risks demand highly disciplined credit selection and significant diversification. For our 2023 fund in particular we have used new inflows to increase line items from 66 at the end of 2018 to 95 to reduce single name exposure. La Française LUX - Multistratégies Obligataires MANAGEMENT POLICY DURING THE FINANCIAL YEAR The fund’s performance stood at -5.25% over 2018 for the I C EUR units. In terms of management, fund sensitivity fluctuated between -3 and +2. Certain themes have been present in the portfolio throughout 2018 to varying extents: Rising positions of break-even inflation rates in the eurozone and the United States Rising positions of German interest rates Peripheral European country bond allocations (Spain, Portugal and Italy to a much lesser extent) Subordinated bond allocations The allocation of convertible bonds has been managed more strategically, with the total profit-taking in the middle of the year, then a return on the asset class in the last quarter. Our exposure to the exchange rate has been managed very strategically with positions purchased successively with the US dollar, the Japanese yen and the Norwegian krone. In terms of contributions, losses were primarily the result of government borrowing components. The rising positions of German interest rates and the increase of break-even inflation rates contributed by -1.63%. The rising positions of United States break-even interest rates and on nominal bonds contributed by -0.81%. Peripheral bonds contributed positively over the year, as did certain strategies based on Canadian and British interest rates. The credit component has also provided a negative contribution (-1.24%) primarily due to exposure to subordinated debts. The diversification component made a negative contribution, primarily through convertible bonds (-0.50%). La Française LUX - Protectaux MANAGEMENT POLICY DURING THE FINANCIAL YEAR The fund’s performance is -5.14% over 2018, in comparison with the ETF Lyxor Bund Daily -1x Inverse’s performance of -4.68%. The German 10-year rates (bonds maturing 01/2028) and 30-year rates (bonds maturing 07/44) have dropped by 32 bp and 36 bp respectively. Fund sensitivity fluctuated between -8.5 and -10, ending 2018 at -9.22. La Française LUX - Rendement Global 2020 – USD This Sub-Fund was liquidated on May 23, 2018. La Française LUX - Sub Debt (this Sub-Fund was launched on June 5, 2018) La Francaise Lux – Sub Debt had a negative performance over 2018 mostly due to the Macroeconomic context; Political events as the frictions between Italy and the Europe, the incertitude concerning Brexit and the tension over US tariffs. On top of the, the reduction of the BCE QE increased the risk linked to the asset class, causing a net outflow.
23
LA FRANCAISE LUX Directors’ Report (continued) La Française LUX - GTS Réactif MANAGEMENT POLICY DURING THE FINANCIAL YEAR Fund’s performance: Over the same period, the reinvested MSCI Europe Dividendes demonstrated a performance of -10.57%, the Eurostoxx50 dropped by 14.34%, the S&P500 lost 6.2%, and the EuroMTS Global bond index recorded a slight improvement of +0.70%. The performance distribution can be broken down as follows: Equities: -6.97%, of which: European equities: -6.38% Emerging market equities: -0.18% US equities: -0.09% Japanese equities: -0.31% Interest rates: -1.23%, of which: European government borrowing: -0.02% Emerging markets: -0.33% Credit: -0.69% Total return: -0.24% Diversified: -0.01% Other: -1.12%, of which: Foreign exchange: 0.00% Monetary: -0.03% Fees: -1.09% During this year, which was complicated for many securities, the diversification we applied to the portfolio will not have allowed us to mitigate losses: within the equities component, our investment in US equities, in which the weighting has been progressively increased throughout the year (up from 4% to 7% at the end of the period), was not enough to compensate for an intentional preponderance in cyclical European securities that were, however, undervalued (Tarkett, Renault, Thyssenkrupp, Covestro, ArcelorMittal, amongst others) but which suffered a great deal more than the average of the listing. Our allocation in Japanese stocks, on the other hand, suffered from the rise in the Japanese yen, which penalised the country’s export securities as the currency was sought after during this period as a refuge asset. As a result, despite our careful positioning in the equities asset class on the whole (with exposure having dropped from 45% at the beginning of the period to 35% in December), the securities component took a larger hit than European stock market indexes. In the bonds component, we were penalised by our preference for corporate bonds over government bonds in the 1st part of the year, although we did progressively manage to correct this. We were particularly affected by our presence in emerging markets and financial bonds. La Française LUX - Multi-Asset Income MANAGEMENT POLICY DURING THE FINANCIAL YEAR Its negative performance can be explained as follows: Emerging debts: the average allocation was 40.05% over the year, which reflects a strong conviction regarding the asset class. This was negatively affected by fears of a trade war between the United States and China, which resulted in a negative contribution of -2.94%. High yield bonds: the average allocation was 33.79%, reflecting a “neutral” allocation in the portfolio due to a certain costliness of the US market. The credit “spreads” were diverse, in particular during the second half of the year due to the downturn in global activity. The negative contribution is -1.44% over 2019. High-dividend equities: The average allocation was 14.7%, once again reflecting a “neutral” allocation. This asset class also suffered from tensions on the financial markets at the end of the year, as well as from the problems in Italy since May 2018. Its negative contribution is -2.01%. Listed real estate: The average allocation was 7.09%, reflecting a careful outlook on the asset class due to our expectations that interest rates would rise. The negative contribution is -0.22% over the year. Currency hedges, for their part, had a negative impact of -1.85%. At 31 December 2018, 42% is allocated to emerging debt, 24% to high-yield bonds, 15% to high-dividend equities, 9% to listed real estate and 10% to liquidity.
24
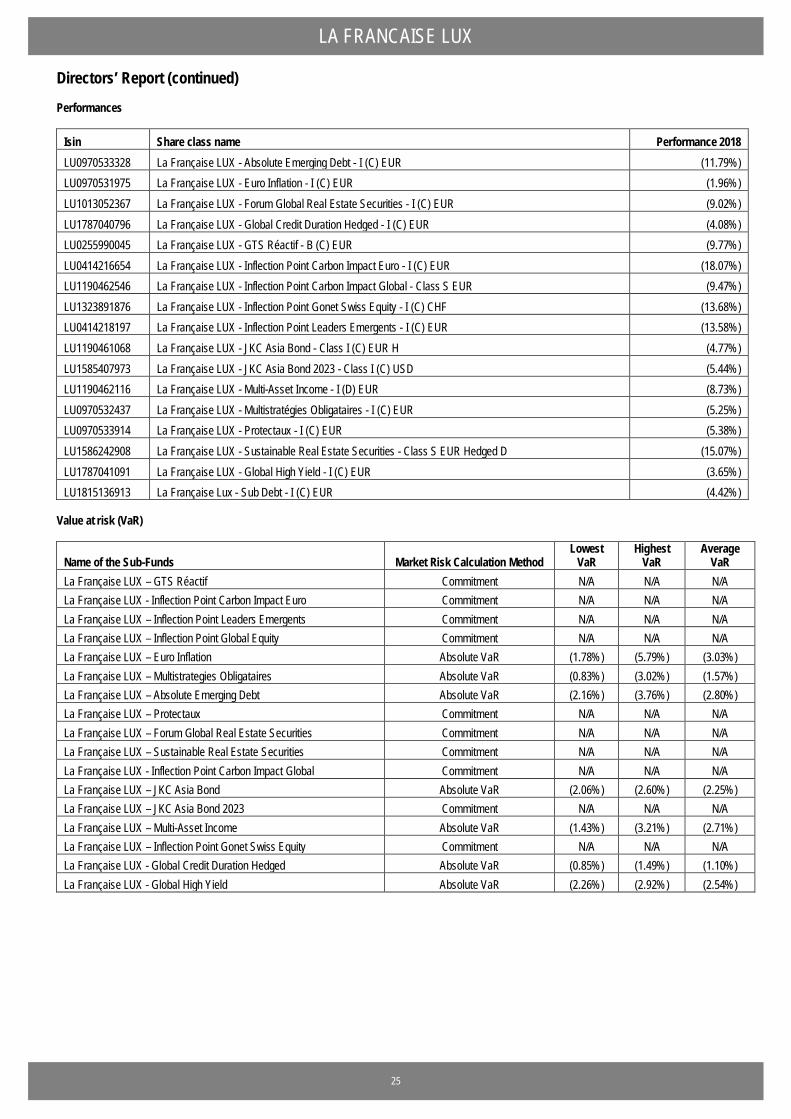
LA FRANCAISE LUX Directors’ Report (continued) Performances
Isin Share class name Performance 2018 LU0970533328 La Française LUX - Absolute Emerging Debt - I (C) EUR (11.79%) LU0970531975 La Française LUX - Euro Inflation - I (C) EUR (1.96%) LU1013052367 La Française LUX - Forum Global Real Estate Securities - I (C) EUR (9.02%) LU1787040796 La Française LUX - Global Credit Duration Hedged - I (C) EUR (4.08%) LU0255990045 La Française LUX - GTS Réactif - B (C) EUR (9.77%) LU0414216654 La Française LUX - Inflection Point Carbon Impact Euro - I (C) EUR (18.07%) LU1190462546 La Française LUX - Inflection Point Carbon Impact Global - Class S EUR (9.47%) LU1323891876 La Française LUX - Inflection Point Gonet Swiss Equity - I (C) CHF (13.68%) LU0414218197 La Française LUX - Inflection Point Leaders Emergents - I (C) EUR (13.58%) LU1190461068 La Française LUX - JKC Asia Bond - Class I (C) EUR H (4.77%) LU1585407973 La Française LUX - JKC Asia Bond 2023 - Class I (C) USD (5.44%) LU1190462116 La Française LUX - Multi-Asset Income - I (D) EUR (8.73%) LU0970532437 La Française LUX - Multistratégies Obligataires - I (C) EUR (5.25%) LU0970533914 La Française LUX - Protectaux - I (C) EUR (5.38%) LU1586242908 La Française LUX - Sustainable Real Estate Securities - Class S EUR Hedged D (15.07%) LU1787041091 La Française LUX - Global High Yield - I (C) EUR (3.65%) LU1815136913 La Française Lux - Sub Debt - I (C) EUR (4.42%)
Value at risk (VaR)
Name of the Sub-Funds Market Risk Calculation Method Lowest
VaR Highest
VaR Average
VaR La Française LUX – GTS Réactif Commitment N/A N/A N/A La Française LUX - Inflection Point Carbon Impact Euro Commitment N/A N/A N/A La Française LUX – Inflection Point Leaders Emergents Commitment N/A N/A N/A La Française LUX – Inflection Point Global Equity Commitment N/A N/A N/A La Française LUX – Euro Inflation Absolute VaR (1.78%) (5.79%) (3.03%) La Française LUX – Multistrategies Obligataires Absolute VaR (0.83%) (3.02%) (1.57%) La Française LUX – Absolute Emerging Debt Absolute VaR (2.16%) (3.76%) (2.80%) La Française LUX – Protectaux Commitment N/A N/A N/A La Française LUX – Forum Global Real Estate Securities Commitment N/A N/A N/A La Française LUX – Sustainable Real Estate Securities Commitment N/A N/A N/A La Française LUX - Inflection Point Carbon Impact Global Commitment N/A N/A N/A La Française LUX – JKC Asia Bond Absolute VaR (2.06%) (2.60%) (2.25%) La Française LUX – JKC Asia Bond 2023 Commitment N/A N/A N/A La Française LUX – Multi-Asset Income Absolute VaR (1.43%) (3.21%) (2.71%) La Française LUX – Inflection Point Gonet Swiss Equity Commitment N/A N/A N/A La Française LUX - Global Credit Duration Hedged Absolute VaR (0.85%) (1.49%) (1.10%) La Française LUX - Global High Yield Absolute VaR (2.26%) (2.92%) (2.54%)
25
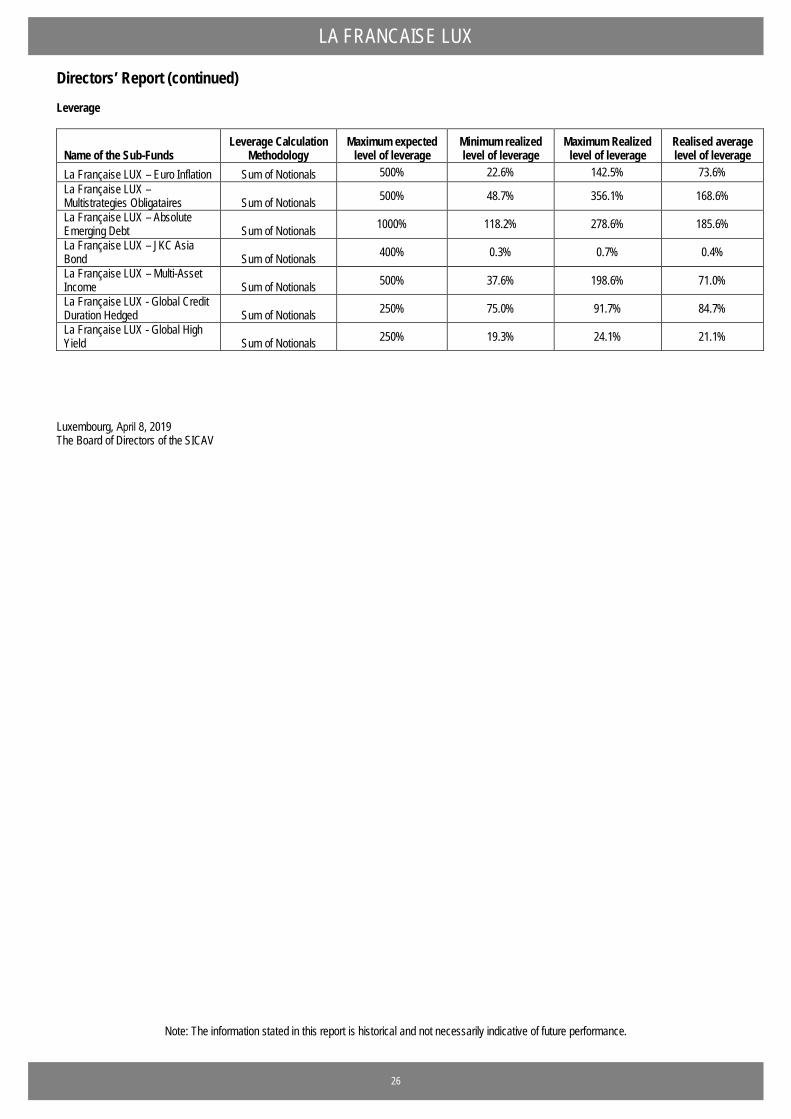
LA FRANCAISE LUX
Directors’ Report (continued)
Leverage
Name of the Sub-Funds Leverage Calculation
Methodology Maximum expected
level of leverage Minimum realized level of leverage
Maximum Realized level of leverage
Realised average level of leverage
La Française LUX – Euro Inflation Sum of Notionals 500% 22.6% 142.5% 73.6% La Française LUX – Multistrategies Obligataires Sum of Notionals 500% 48.7% 356.1% 168.6%
La Française LUX – Absolute Emerging Debt Sum of Notionals 1000% 118.2% 278.6% 185.6%
La Française LUX – JKC Asia Bond Sum of Notionals 400% 0.3% 0.7% 0.4%
La Française LUX – Multi-Asset Income Sum of Notionals 500% 37.6% 198.6% 71.0% La Française LUX - Global Credit Duration Hedged Sum of Notionals 250% 75.0% 91.7% 84.7% La Française LUX - Global High Yield Sum of Notionals 250% 19.3% 24.1% 21.1%
Luxembourg, April 8, 2019 The Board of Directors of the SICAV
Note: The information stated in this report is historical and not necessarily indicative of future performance.
26
Deloitte
To the Shareholders of LA FRANCAISE LUX Societe d'investissement a capital variable 60, avenue John Fitzgerald Kennedy L-1855 Luxembourg Grand Duchy of Luxembourg
REPORT OF THE REVISEUR D'ENTREPRISES AGREE
Report on the Audit of the Financial Statements
Opinion
Deloitte Audit Societe a responsabilite limitee 560, rue de Neudorf L-2220 Luxembourg BP 1173 L-1011 Luxembourg
Tel: + 352 451 451 www.deloitte.lu
We have audited the financial statements of La Frani;;aise LUX {the "SICAV") and of each of its sub-funds, which comprise the statement of net assets and the statement of investments and other net assets as at December 31 , 2018 and the statement of operations and changes in net assets for the year then ended December 31 , 2018, and notes to the financial statements, including a summary of significant accounting policies .
In our opinion, the accompanying financial statements give a true and fair view of the financial position of the SICAV and of each of its sub-funds as at December 31 , 2018, and of the results of their operations and changes in their net assets for the year then ended in accordance with Luxembourg legal and regulatory requirements relating to the preparation and presentation of the financial statements.
Basis for Opinion
We conducted our audit in accordance with the Law of 23 July 2016 on the audit profession (Law of 23 July 2016) and with International Standards on Auditing {ISAs) as adopted for Luxembourg by the Commission de Suiveillance du Secteur Financier (CSSF). Our responsibilities under the Law of 23 July 2016 and ISAs are further described in the "Responsibilities of the Reviseur d'Entreprises Agree for the Audit of the Financial Statements" section of our report. We are also independent of the SICAV in accordance with the International Ethics Standards Board for Accountants' Code of Ethics for Professional Accountants {IESBA Code} as adopted for Luxembourg by the CSSF together with the ethical requirements that are relevant to our audit of the financial statements, and have fulfilled our other ethical responsibilities under those ethical requirements. We believe that the audit evidence we have obtained is sufficient and appropriate to provide a basis for our opinion.
Other information
The Board of Directors of the is responsible for the other information. The other information comprises the information stated in the annual report but does not include the financial statements and our report of the Reviseur d'Entreprises Agree thereon.
Our opinion on the financial statements does not cover the other information and we do not express any form of assurance conclusion thereon.
In connection with our audit of the financial statements, our responsibility is to read the other information and, in doing so, consider whether the other information is materially inconsistent with the financial statements or our knowledge obtained in the audit or otherwise appears to be materially misstated. If, based on the work we have performed, we conclude that there is a material misstatement of this other information, we are required to report this fact. We have nothing to report in this regard.
Responsibilities of the Board of Directors of the SICAV for the Financial Statements
The Board of Directors of the SICAV is responsible for the preparation and fair presentation of the financial statements in accordance with Luxembourg legal and regulatory requirements relating to the preparation and presentation of the financial statements, and for such internal control as the Board of Directors of the SICAV determines is necessary to enable the preparation of financial statements that are free from material misstatement, whether due to fraud or error.
In preparing the financial statements, the Board of Directors of the is responsible for assessing the SICAV's ability to continue as a going concern, disclosing, as applicable, matters related to going concern and using the going concern basis of accounting unless the Board of Directors of the SICAV either intends to liquidate the SICAVor to cease operations, or has no realistic alternative but to do so.
Societe a responsab1Hte limrtee au capital de 35.000 € RCS Luxembourg B 67 .895 Autorisatron d'E!tablissement 10022179
Deloitte Report on the Audit of the Financial Statements (continued)
Responsibilities of the Reviseur d'Entreprises Agree for the Audit of the Financial Statements
The objectives of our audit are to obtain reasonable assurance about whether the financial statements as a whole are free from material misstatement, whether due to fraud or error, and to issue a report of the Reviseur d'Entreprises Agree that includes our opinion. Reasonable assurance is a high level of assurance, but is not a guarantee that an audit conducted in accordance with the Law dated 23 July 2016 and with ISAs as adopted for Luxembourg by the CSSF will always detect a material misstatement when it exists. Misstatements can arise from fraud or error and are considered material if, individually or in the aggregate, they could reasonably be expected to influence the economic decisions of users taken on the basis of these financial statements.
As part of an audit in accordance with the Law of 23 July 2016 and with ISAs as adopted for Luxembourg by the CSSF, we exercise professional judgment and maintain professional scepticism throughout the audit. We also
• Identify and assess the risks of material misstatement of the financial statements, whether due to fraud or error, design and perform audit procedures responsive to those risks, and obtain audit evidence that is sufficient and appropriate to provide a basis for our opinion. The risk of not detecting a material misstatement resulting from fraud is higher than for one resulting from error, as fraud may involve collusion, forgery, intentional omissions, misrepresentations, or the override of internal control.
• Obtain an understanding of internal control relevant to the audit in order to design audit procedures that are appropriate in the circumstances, but not for the purpose of expressing an opinion on the effectiveness of the SICAV internal control.
• Evaluate the appropriateness of accounting policies used and the reasonableness of accounting estimates and related disclosures made by the Board of Directors of the SI CAV.
• Conclude on the appropriateness of Board of Directors of the SICA V's use of the going concern basis of accounting and, based on the audit evidence obtained, whether a material uncertainty exists related to events or conditions that may cast significant doubt on the SICAV ability to continue as a going concern. If we conclude that a material uncertainty exists, we are required to draw attention in our report of the Reviseur d'Entreprises Agree to the related disclosures in the financial statements or, if such disclosures are inadequate, to modify our opinion. Our conclusions are based on the audit evidence obtained up to the date of our report of the Reviseur d'Entreprises Agree. However, future events or conditions may cause the SICAV to cease to continue as a going concern.
• Evaluate the overall presentation, structure and content of the financial statements, including the disclosures, and whether the financial statements represent the underlying transactions and events in a manner that achieves fair presentation.
We communicate with those charged with governance regarding, among other matters, the planned scope and timing of the audit and significant audit findings, including any significant deficiencies in internal control that we identify during our audit.
For Deloitte Audit Cabinet de revision agree
Elisabeth Layer, Reviseur d'entreprises agree Partner
April 8, 2019
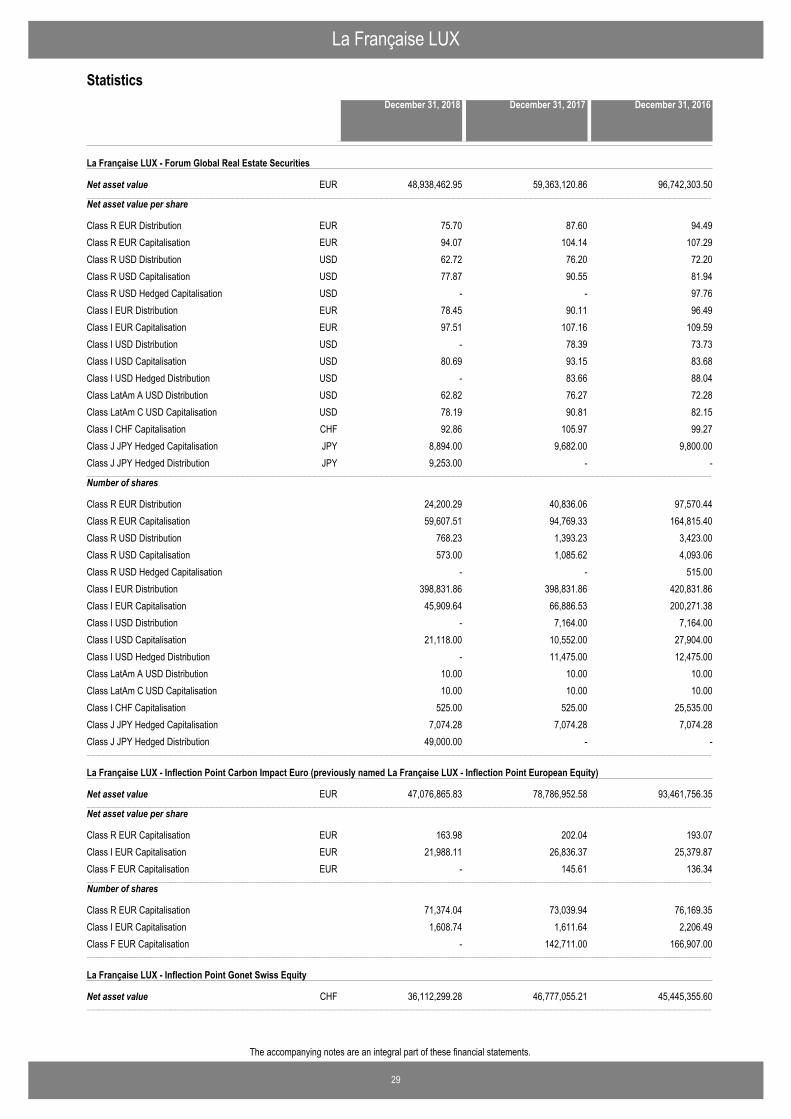
La Française LUX
29
The accompanying notes are an integral part of these financial statements.
Statistics
La Française LUX - Forum Global Real Estate Securities
Net asset value−−−−−−−−−−−−−−−−−−−−−−−−−−−−−−−−−−−−−−−−−−−−−−−−−−−−−−−−−−−−−−−−−−−−−−−−−−−−−−−−−−−−−−−−−−−−−−−−−−−−−−−−−−−−−−−−−−−−−−−−−−−−−−−−−−−−−−−−−−−−−−−−−−−−−−−−−−−−−−−−−−−−−−−−−−−−−−−−−−−−−−−−−−−−−−−−−−−−−−−−−−−−−−−−−−−−−−−−−−−−−−−−−−−−−−−−−−−−−−−−−−−−−−−−−−−−−−−−−−−−−−−−−−−−−−−−−−−−−−−−−−−−−−−−−−−−−−−−−−−−−−−−−−−−−−−−−−−−−−−−−−−−−−−−−−−−−−−−−−−−−−−−−−−−−−−−−−−−−−−−−−−−−−−−−−−−−−−−−−−−−−−−−−−−−−−−−−−−−−−−−−−−−−−−−−−−−−−−−−−−−−−−−−−−−−−−−−−−−−−−−−−−−−−−−−−−−−−−−−−−−−−−−−−−−−−−−−−−−−−−−−−−−−−−−−−−−−−−−−−−−−−
48,938,462.95 59,363,120.86 96,742,303.50EUR
Net asset value per share
Class R EUR Distribution 75.70 87.60 94.49EURClass R EUR Capitalisation 94.07 104.14 107.29EURClass R USD Distribution 62.72 76.20 72.20USDClass R USD Capitalisation 77.87 90.55 81.94USDClass R USD Hedged Capitalisation - - 97.76USDClass I EUR Distribution 78.45 90.11 96.49EURClass I EUR Capitalisation 97.51 107.16 109.59EURClass I USD Distribution - 78.39 73.73USDClass I USD Capitalisation 80.69 93.15 83.68USDClass I USD Hedged Distribution - 83.66 88.04USDClass LatAm A USD Distribution 62.82 76.27 72.28USDClass LatAm C USD Capitalisation 78.19 90.81 82.15USDClass I CHF Capitalisation 92.86 105.97 99.27CHFClass J JPY Hedged Capitalisation 8,894.00 9,682.00 9,800.00JPYClass J JPY Hedged Distribution 9,253.00 - -JPY−−−−−−−−−−−−−−−−−−−−−−−−−−−−−−−−−−−−−−−−−−−−−−−−−−−−−−−−−−−−−−−−−−−−−−−−−−−−−−−−−−−−−−−−−−−−−−−−−−−−−−−−−−−−−−−−−−−−−−−−−−−−−−−−−−−−−−−−−−−−−−−−−−−−−−−−−−−−−−−−−−−−−−−−−−−−−−−−−−−−−−−−−−−−−−−−−−−−−−−−−−−−−−−−−−−−−−−−−−−−−−−−−−−−−−−−−−−−−−−−−−−−−−−−−−−−−−−−−−−−−−−−−−−−−−−−−−−−−−−−−−−−−−−−−−−−−−−−−−−−−−−−−−−−−−−−−−−−−−−−−−−−−−−−−−−−−−−−−−−−−−−−−−−−−−−−−−−−−−−−−−−−−−−−−−−−−−−−−−−−−−−−−−−−−−−−−−−−−−−−−−−−−−−−−−−−−−−−−−−−−−−−−−−−−−−−−−−−−−−−−−−−−−−−−−−−−−−−−−−−−−−−−−−−−−−−−−−−−−−−−−−−−−−−−−−−−−−−−−−−−−−
Number of shares
Class R EUR Distribution 24,200.29 40,836.06 97,570.44Class R EUR Capitalisation 59,607.51 94,769.33 164,815.40Class R USD Distribution 768.23 1,393.23 3,423.00Class R USD Capitalisation 573.00 1,085.62 4,093.06Class R USD Hedged Capitalisation - - 515.00Class I EUR Distribution 398,831.86 398,831.86 420,831.86Class I EUR Capitalisation 45,909.64 66,886.53 200,271.38Class I USD Distribution - 7,164.00 7,164.00Class I USD Capitalisation 21,118.00 10,552.00 27,904.00Class I USD Hedged Distribution - 11,475.00 12,475.00Class LatAm A USD Distribution 10.00 10.00 10.00Class LatAm C USD Capitalisation 10.00 10.00 10.00Class I CHF Capitalisation 525.00 525.00 25,535.00Class J JPY Hedged Capitalisation 7,074.28 7,074.28 7,074.28Class J JPY Hedged Distribution 49,000.00 - -−−−−−−−−−−−−−−−−−−−−−−−−−−−−−−−−−−−−−−−−−−−−−−−−−−−−−−−−−−−−−−−−−−−−−−−−−−−−−−−−−−−−−−−−−−−−−−−−−−−−−−−−−−−−−−−−−−−−−−−−−−−−−−−−−−−−−−−−−−−−−−−−−−−−−−−−−−−−−−−−−−−−−−−−−−−−−−−−−−−−−−−−−−−−−−−−−−−−−−−−−−−−−−−−−−−−−−−−−−−−−−−−−−−−−−−−−−−−−−−−−−−−−−−−−−−−−−−−−−−−−−−−−−−−−−−−−−−−−−−−−−−−−−−−−−−−−−−−−−−−−−−−−−−−−−−−−−−−−−−−−−−−−−−−−−−−−−−−−−−−−−−−−−−−−−−−−−−−−−−−−−−−−−−−−−−−−−−−−−−−−−−−−−−−−−−−−−−−−−−−−−−−−−−−−−−−−−−−−−−−−−−−−−−−−−−−−−−−−−−−−−−−−−−−−−−−−−−−−−−−−−−−−−−−−−−−−−−−−−−−−−−−−−−−−−−−−−−−−−−−−−−
La Française LUX - Inflection Point Carbon Impact Euro (previously named La Française LUX - Inflection Point European Equity)
Net asset value−−−−−−−−−−−−−−−−−−−−−−−−−−−−−−−−−−−−−−−−−−−−−−−−−−−−−−−−−−−−−−−−−−−−−−−−−−−−−−−−−−−−−−−−−−−−−−−−−−−−−−−−−−−−−−−−−−−−−−−−−−−−−−−−−−−−−−−−−−−−−−−−−−−−−−−−−−−−−−−−−−−−−−−−−−−−−−−−−−−−−−−−−−−−−−−−−−−−−−−−−−−−−−−−−−−−−−−−−−−−−−−−−−−−−−−−−−−−−−−−−−−−−−−−−−−−−−−−−−−−−−−−−−−−−−−−−−−−−−−−−−−−−−−−−−−−−−−−−−−−−−−−−−−−−−−−−−−−−−−−−−−−−−−−−−−−−−−−−−−−−−−−−−−−−−−−−−−−−−−−−−−−−−−−−−−−−−−−−−−−−−−−−−−−−−−−−−−−−−−−−−−−−−−−−−−−−−−−−−−−−−−−−−−−−−−−−−−−−−−−−−−−−−−−−−−−−−−−−−−−−−−−−−−−−−−−−−−−−−−−−−−−−−−−−−−−−−−−−−−−−−−
47,076,865.83 78,786,952.58 93,461,756.35EUR
Net asset value per share
Class R EUR Capitalisation 163.98 202.04 193.07EURClass I EUR Capitalisation 21,988.11 26,836.37 25,379.87EURClass F EUR Capitalisation - 145.61 136.34EUR−−−−−−−−−−−−−−−−−−−−−−−−−−−−−−−−−−−−−−−−−−−−−−−−−−−−−−−−−−−−−−−−−−−−−−−−−−−−−−−−−−−−−−−−−−−−−−−−−−−−−−−−−−−−−−−−−−−−−−−−−−−−−−−−−−−−−−−−−−−−−−−−−−−−−−−−−−−−−−−−−−−−−−−−−−−−−−−−−−−−−−−−−−−−−−−−−−−−−−−−−−−−−−−−−−−−−−−−−−−−−−−−−−−−−−−−−−−−−−−−−−−−−−−−−−−−−−−−−−−−−−−−−−−−−−−−−−−−−−−−−−−−−−−−−−−−−−−−−−−−−−−−−−−−−−−−−−−−−−−−−−−−−−−−−−−−−−−−−−−−−−−−−−−−−−−−−−−−−−−−−−−−−−−−−−−−−−−−−−−−−−−−−−−−−−−−−−−−−−−−−−−−−−−−−−−−−−−−−−−−−−−−−−−−−−−−−−−−−−−−−−−−−−−−−−−−−−−−−−−−−−−−−−−−−−−−−−−−−−−−−−−−−−−−−−−−−−−−−−−−−−−
Number of shares
Class R EUR Capitalisation 71,374.04 73,039.94 76,169.35Class I EUR Capitalisation 1,608.74 1,611.64 2,206.49Class F EUR Capitalisation - 142,711.00 166,907.00−−−−−−−−−−−−−−−−−−−−−−−−−−−−−−−−−−−−−−−−−−−−−−−−−−−−−−−−−−−−−−−−−−−−−−−−−−−−−−−−−−−−−−−−−−−−−−−−−−−−−−−−−−−−−−−−−−−−−−−−−−−−−−−−−−−−−−−−−−−−−−−−−−−−−−−−−−−−−−−−−−−−−−−−−−−−−−−−−−−−−−−−−−−−−−−−−−−−−−−−−−−−−−−−−−−−−−−−−−−−−−−−−−−−−−−−−−−−−−−−−−−−−−−−−−−−−−−−−−−−−−−−−−−−−−−−−−−−−−−−−−−−−−−−−−−−−−−−−−−−−−−−−−−−−−−−−−−−−−−−−−−−−−−−−−−−−−−−−−−−−−−−−−−−−−−−−−−−−−−−−−−−−−−−−−−−−−−−−−−−−−−−−−−−−−−−−−−−−−−−−−−−−−−−−−−−−−−−−−−−−−−−−−−−−−−−−−−−−−−−−−−−−−−−−−−−−−−−−−−−−−−−−−−−−−−−−−−−−−−−−−−−−−−−−−−−−−−−−−−−−−−
La Française LUX - Inflection Point Gonet Swiss Equity
Net asset value−−−−−−−−−−−−−−−−−−−−−−−−−−−−−−−−−−−−−−−−−−−−−−−−−−−−−−−−−−−−−−−−−−−−−−−−−−−−−−−−−−−−−−−−−−−−−−−−−−−−−−−−−−−−−−−−−−−−−−−−−−−−−−−−−−−−−−−−−−−−−−−−−−−−−−−−−−−−−−−−−−−−−−−−−−−−−−−−−−−−−−−−−−−−−−−−−−−−−−−−−−−−−−−−−−−−−−−−−−−−−−−−−−−−−−−−−−−−−−−−−−−−−−−−−−−−−−−−−−−−−−−−−−−−−−−−−−−−−−−−−−−−−−−−−−−−−−−−−−−−−−−−−−−−−−−−−−−−−−−−−−−−−−−−−−−−−−−−−−−−−−−−−−−−−−−−−−−−−−−−−−−−−−−−−−−−−−−−−−−−−−−−−−−−−−−−−−−−−−−−−−−−−−−−−−−−−−−−−−−−−−−−−−−−−−−−−−−−−−−−−−−−−−−−−−−−−−−−−−−−−−−−−−−−−−−−−−−−−−−−−−−−−−−−−−−−−−−−−−−−−−−
36,112,299.28 46,777,055.21 45,445,355.60CHF
December 31, 2016December 31, 2018 December 31, 2017
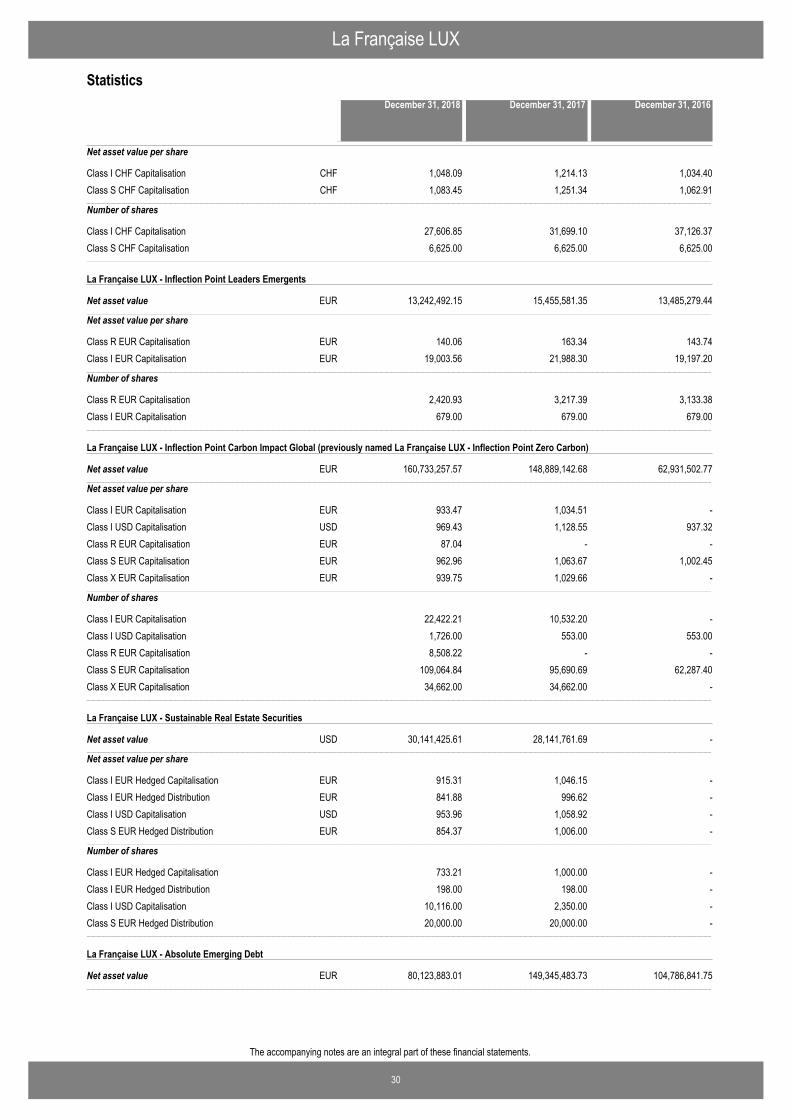
La Française LUX
30
The accompanying notes are an integral part of these financial statements.
Statistics
Net asset value per share
Class I CHF Capitalisation 1,048.09 1,214.13 1,034.40CHFClass S CHF Capitalisation 1,083.45 1,251.34 1,062.91CHF−−−−−−−−−−−−−−−−−−−−−−−−−−−−−−−−−−−−−−−−−−−−−−−−−−−−−−−−−−−−−−−−−−−−−−−−−−−−−−−−−−−−−−−−−−−−−−−−−−−−−−−−−−−−−−−−−−−−−−−−−−−−−−−−−−−−−−−−−−−−−−−−−−−−−−−−−−−−−−−−−−−−−−−−−−−−−−−−−−−−−−−−−−−−−−−−−−−−−−−−−−−−−−−−−−−−−−−−−−−−−−−−−−−−−−−−−−−−−−−−−−−−−−−−−−−−−−−−−−−−−−−−−−−−−−−−−−−−−−−−−−−−−−−−−−−−−−−−−−−−−−−−−−−−−−−−−−−−−−−−−−−−−−−−−−−−−−−−−−−−−−−−−−−−−−−−−−−−−−−−−−−−−−−−−−−−−−−−−−−−−−−−−−−−−−−−−−−−−−−−−−−−−−−−−−−−−−−−−−−−−−−−−−−−−−−−−−−−−−−−−−−−−−−−−−−−−−−−−−−−−−−−−−−−−−−−−−−−−−−−−−−−−−−−−−−−−−−−−−−−−−−
Number of shares
Class I CHF Capitalisation 27,606.85 31,699.10 37,126.37Class S CHF Capitalisation 6,625.00 6,625.00 6,625.00−−−−−−−−−−−−−−−−−−−−−−−−−−−−−−−−−−−−−−−−−−−−−−−−−−−−−−−−−−−−−−−−−−−−−−−−−−−−−−−−−−−−−−−−−−−−−−−−−−−−−−−−−−−−−−−−−−−−−−−−−−−−−−−−−−−−−−−−−−−−−−−−−−−−−−−−−−−−−−−−−−−−−−−−−−−−−−−−−−−−−−−−−−−−−−−−−−−−−−−−−−−−−−−−−−−−−−−−−−−−−−−−−−−−−−−−−−−−−−−−−−−−−−−−−−−−−−−−−−−−−−−−−−−−−−−−−−−−−−−−−−−−−−−−−−−−−−−−−−−−−−−−−−−−−−−−−−−−−−−−−−−−−−−−−−−−−−−−−−−−−−−−−−−−−−−−−−−−−−−−−−−−−−−−−−−−−−−−−−−−−−−−−−−−−−−−−−−−−−−−−−−−−−−−−−−−−−−−−−−−−−−−−−−−−−−−−−−−−−−−−−−−−−−−−−−−−−−−−−−−−−−−−−−−−−−−−−−−−−−−−−−−−−−−−−−−−−−−−−−−−−−
La Française LUX - Inflection Point Leaders Emergents
Net asset value−−−−−−−−−−−−−−−−−−−−−−−−−−−−−−−−−−−−−−−−−−−−−−−−−−−−−−−−−−−−−−−−−−−−−−−−−−−−−−−−−−−−−−−−−−−−−−−−−−−−−−−−−−−−−−−−−−−−−−−−−−−−−−−−−−−−−−−−−−−−−−−−−−−−−−−−−−−−−−−−−−−−−−−−−−−−−−−−−−−−−−−−−−−−−−−−−−−−−−−−−−−−−−−−−−−−−−−−−−−−−−−−−−−−−−−−−−−−−−−−−−−−−−−−−−−−−−−−−−−−−−−−−−−−−−−−−−−−−−−−−−−−−−−−−−−−−−−−−−−−−−−−−−−−−−−−−−−−−−−−−−−−−−−−−−−−−−−−−−−−−−−−−−−−−−−−−−−−−−−−−−−−−−−−−−−−−−−−−−−−−−−−−−−−−−−−−−−−−−−−−−−−−−−−−−−−−−−−−−−−−−−−−−−−−−−−−−−−−−−−−−−−−−−−−−−−−−−−−−−−−−−−−−−−−−−−−−−−−−−−−−−−−−−−−−−−−−−−−−−−−−−
13,242,492.15 15,455,581.35 13,485,279.44EUR
Net asset value per share
Class R EUR Capitalisation 140.06 163.34 143.74EURClass I EUR Capitalisation 19,003.56 21,988.30 19,197.20EUR−−−−−−−−−−−−−−−−−−−−−−−−−−−−−−−−−−−−−−−−−−−−−−−−−−−−−−−−−−−−−−−−−−−−−−−−−−−−−−−−−−−−−−−−−−−−−−−−−−−−−−−−−−−−−−−−−−−−−−−−−−−−−−−−−−−−−−−−−−−−−−−−−−−−−−−−−−−−−−−−−−−−−−−−−−−−−−−−−−−−−−−−−−−−−−−−−−−−−−−−−−−−−−−−−−−−−−−−−−−−−−−−−−−−−−−−−−−−−−−−−−−−−−−−−−−−−−−−−−−−−−−−−−−−−−−−−−−−−−−−−−−−−−−−−−−−−−−−−−−−−−−−−−−−−−−−−−−−−−−−−−−−−−−−−−−−−−−−−−−−−−−−−−−−−−−−−−−−−−−−−−−−−−−−−−−−−−−−−−−−−−−−−−−−−−−−−−−−−−−−−−−−−−−−−−−−−−−−−−−−−−−−−−−−−−−−−−−−−−−−−−−−−−−−−−−−−−−−−−−−−−−−−−−−−−−−−−−−−−−−−−−−−−−−−−−−−−−−−−−−−−−
Number of shares
Class R EUR Capitalisation 2,420.93 3,217.39 3,133.38Class I EUR Capitalisation 679.00 679.00 679.00−−−−−−−−−−−−−−−−−−−−−−−−−−−−−−−−−−−−−−−−−−−−−−−−−−−−−−−−−−−−−−−−−−−−−−−−−−−−−−−−−−−−−−−−−−−−−−−−−−−−−−−−−−−−−−−−−−−−−−−−−−−−−−−−−−−−−−−−−−−−−−−−−−−−−−−−−−−−−−−−−−−−−−−−−−−−−−−−−−−−−−−−−−−−−−−−−−−−−−−−−−−−−−−−−−−−−−−−−−−−−−−−−−−−−−−−−−−−−−−−−−−−−−−−−−−−−−−−−−−−−−−−−−−−−−−−−−−−−−−−−−−−−−−−−−−−−−−−−−−−−−−−−−−−−−−−−−−−−−−−−−−−−−−−−−−−−−−−−−−−−−−−−−−−−−−−−−−−−−−−−−−−−−−−−−−−−−−−−−−−−−−−−−−−−−−−−−−−−−−−−−−−−−−−−−−−−−−−−−−−−−−−−−−−−−−−−−−−−−−−−−−−−−−−−−−−−−−−−−−−−−−−−−−−−−−−−−−−−−−−−−−−−−−−−−−−−−−−−−−−−−−
La Française LUX - Inflection Point Carbon Impact Global (previously named La Française LUX - Inflection Point Zero Carbon)
Net asset value−−−−−−−−−−−−−−−−−−−−−−−−−−−−−−−−−−−−−−−−−−−−−−−−−−−−−−−−−−−−−−−−−−−−−−−−−−−−−−−−−−−−−−−−−−−−−−−−−−−−−−−−−−−−−−−−−−−−−−−−−−−−−−−−−−−−−−−−−−−−−−−−−−−−−−−−−−−−−−−−−−−−−−−−−−−−−−−−−−−−−−−−−−−−−−−−−−−−−−−−−−−−−−−−−−−−−−−−−−−−−−−−−−−−−−−−−−−−−−−−−−−−−−−−−−−−−−−−−−−−−−−−−−−−−−−−−−−−−−−−−−−−−−−−−−−−−−−−−−−−−−−−−−−−−−−−−−−−−−−−−−−−−−−−−−−−−−−−−−−−−−−−−−−−−−−−−−−−−−−−−−−−−−−−−−−−−−−−−−−−−−−−−−−−−−−−−−−−−−−−−−−−−−−−−−−−−−−−−−−−−−−−−−−−−−−−−−−−−−−−−−−−−−−−−−−−−−−−−−−−−−−−−−−−−−−−−−−−−−−−−−−−−−−−−−−−−−−−−−−−−−−
160,733,257.57 148,889,142.68 62,931,502.77EUR
Net asset value per share
Class I EUR Capitalisation 933.47 1,034.51 -EURClass I USD Capitalisation 969.43 1,128.55 937.32USDClass R EUR Capitalisation 87.04 - -EURClass S EUR Capitalisation 962.96 1,063.67 1,002.45EURClass X EUR Capitalisation 939.75 1,029.66 -EUR−−−−−−−−−−−−−−−−−−−−−−−−−−−−−−−−−−−−−−−−−−−−−−−−−−−−−−−−−−−−−−−−−−−−−−−−−−−−−−−−−−−−−−−−−−−−−−−−−−−−−−−−−−−−−−−−−−−−−−−−−−−−−−−−−−−−−−−−−−−−−−−−−−−−−−−−−−−−−−−−−−−−−−−−−−−−−−−−−−−−−−−−−−−−−−−−−−−−−−−−−−−−−−−−−−−−−−−−−−−−−−−−−−−−−−−−−−−−−−−−−−−−−−−−−−−−−−−−−−−−−−−−−−−−−−−−−−−−−−−−−−−−−−−−−−−−−−−−−−−−−−−−−−−−−−−−−−−−−−−−−−−−−−−−−−−−−−−−−−−−−−−−−−−−−−−−−−−−−−−−−−−−−−−−−−−−−−−−−−−−−−−−−−−−−−−−−−−−−−−−−−−−−−−−−−−−−−−−−−−−−−−−−−−−−−−−−−−−−−−−−−−−−−−−−−−−−−−−−−−−−−−−−−−−−−−−−−−−−−−−−−−−−−−−−−−−−−−−−−−−−−−
Number of shares
Class I EUR Capitalisation 22,422.21 10,532.20 -Class I USD Capitalisation 1,726.00 553.00 553.00Class R EUR Capitalisation 8,508.22 - -Class S EUR Capitalisation 109,064.84 95,690.69 62,287.40Class X EUR Capitalisation 34,662.00 34,662.00 -−−−−−−−−−−−−−−−−−−−−−−−−−−−−−−−−−−−−−−−−−−−−−−−−−−−−−−−−−−−−−−−−−−−−−−−−−−−−−−−−−−−−−−−−−−−−−−−−−−−−−−−−−−−−−−−−−−−−−−−−−−−−−−−−−−−−−−−−−−−−−−−−−−−−−−−−−−−−−−−−−−−−−−−−−−−−−−−−−−−−−−−−−−−−−−−−−−−−−−−−−−−−−−−−−−−−−−−−−−−−−−−−−−−−−−−−−−−−−−−−−−−−−−−−−−−−−−−−−−−−−−−−−−−−−−−−−−−−−−−−−−−−−−−−−−−−−−−−−−−−−−−−−−−−−−−−−−−−−−−−−−−−−−−−−−−−−−−−−−−−−−−−−−−−−−−−−−−−−−−−−−−−−−−−−−−−−−−−−−−−−−−−−−−−−−−−−−−−−−−−−−−−−−−−−−−−−−−−−−−−−−−−−−−−−−−−−−−−−−−−−−−−−−−−−−−−−−−−−−−−−−−−−−−−−−−−−−−−−−−−−−−−−−−−−−−−−−−−−−−−−−−
La Française LUX - Sustainable Real Estate Securities
Net asset value−−−−−−−−−−−−−−−−−−−−−−−−−−−−−−−−−−−−−−−−−−−−−−−−−−−−−−−−−−−−−−−−−−−−−−−−−−−−−−−−−−−−−−−−−−−−−−−−−−−−−−−−−−−−−−−−−−−−−−−−−−−−−−−−−−−−−−−−−−−−−−−−−−−−−−−−−−−−−−−−−−−−−−−−−−−−−−−−−−−−−−−−−−−−−−−−−−−−−−−−−−−−−−−−−−−−−−−−−−−−−−−−−−−−−−−−−−−−−−−−−−−−−−−−−−−−−−−−−−−−−−−−−−−−−−−−−−−−−−−−−−−−−−−−−−−−−−−−−−−−−−−−−−−−−−−−−−−−−−−−−−−−−−−−−−−−−−−−−−−−−−−−−−−−−−−−−−−−−−−−−−−−−−−−−−−−−−−−−−−−−−−−−−−−−−−−−−−−−−−−−−−−−−−−−−−−−−−−−−−−−−−−−−−−−−−−−−−−−−−−−−−−−−−−−−−−−−−−−−−−−−−−−−−−−−−−−−−−−−−−−−−−−−−−−−−−−−−−−−−−−−−
30,141,425.61 28,141,761.69 -USD
Net asset value per share
Class I EUR Hedged Capitalisation 915.31 1,046.15 -EURClass I EUR Hedged Distribution 841.88 996.62 -EURClass I USD Capitalisation 953.96 1,058.92 -USDClass S EUR Hedged Distribution 854.37 1,006.00 -EUR−−−−−−−−−−−−−−−−−−−−−−−−−−−−−−−−−−−−−−−−−−−−−−−−−−−−−−−−−−−−−−−−−−−−−−−−−−−−−−−−−−−−−−−−−−−−−−−−−−−−−−−−−−−−−−−−−−−−−−−−−−−−−−−−−−−−−−−−−−−−−−−−−−−−−−−−−−−−−−−−−−−−−−−−−−−−−−−−−−−−−−−−−−−−−−−−−−−−−−−−−−−−−−−−−−−−−−−−−−−−−−−−−−−−−−−−−−−−−−−−−−−−−−−−−−−−−−−−−−−−−−−−−−−−−−−−−−−−−−−−−−−−−−−−−−−−−−−−−−−−−−−−−−−−−−−−−−−−−−−−−−−−−−−−−−−−−−−−−−−−−−−−−−−−−−−−−−−−−−−−−−−−−−−−−−−−−−−−−−−−−−−−−−−−−−−−−−−−−−−−−−−−−−−−−−−−−−−−−−−−−−−−−−−−−−−−−−−−−−−−−−−−−−−−−−−−−−−−−−−−−−−−−−−−−−−−−−−−−−−−−−−−−−−−−−−−−−−−−−−−−−−
Number of shares
Class I EUR Hedged Capitalisation 733.21 1,000.00 -Class I EUR Hedged Distribution 198.00 198.00 -Class I USD Capitalisation 10,116.00 2,350.00 -Class S EUR Hedged Distribution 20,000.00 20,000.00 -−−−−−−−−−−−−−−−−−−−−−−−−−−−−−−−−−−−−−−−−−−−−−−−−−−−−−−−−−−−−−−−−−−−−−−−−−−−−−−−−−−−−−−−−−−−−−−−−−−−−−−−−−−−−−−−−−−−−−−−−−−−−−−−−−−−−−−−−−−−−−−−−−−−−−−−−−−−−−−−−−−−−−−−−−−−−−−−−−−−−−−−−−−−−−−−−−−−−−−−−−−−−−−−−−−−−−−−−−−−−−−−−−−−−−−−−−−−−−−−−−−−−−−−−−−−−−−−−−−−−−−−−−−−−−−−−−−−−−−−−−−−−−−−−−−−−−−−−−−−−−−−−−−−−−−−−−−−−−−−−−−−−−−−−−−−−−−−−−−−−−−−−−−−−−−−−−−−−−−−−−−−−−−−−−−−−−−−−−−−−−−−−−−−−−−−−−−−−−−−−−−−−−−−−−−−−−−−−−−−−−−−−−−−−−−−−−−−−−−−−−−−−−−−−−−−−−−−−−−−−−−−−−−−−−−−−−−−−−−−−−−−−−−−−−−−−−−−−−−−−−−−
La Française LUX - Absolute Emerging Debt
Net asset value−−−−−−−−−−−−−−−−−−−−−−−−−−−−−−−−−−−−−−−−−−−−−−−−−−−−−−−−−−−−−−−−−−−−−−−−−−−−−−−−−−−−−−−−−−−−−−−−−−−−−−−−−−−−−−−−−−−−−−−−−−−−−−−−−−−−−−−−−−−−−−−−−−−−−−−−−−−−−−−−−−−−−−−−−−−−−−−−−−−−−−−−−−−−−−−−−−−−−−−−−−−−−−−−−−−−−−−−−−−−−−−−−−−−−−−−−−−−−−−−−−−−−−−−−−−−−−−−−−−−−−−−−−−−−−−−−−−−−−−−−−−−−−−−−−−−−−−−−−−−−−−−−−−−−−−−−−−−−−−−−−−−−−−−−−−−−−−−−−−−−−−−−−−−−−−−−−−−−−−−−−−−−−−−−−−−−−−−−−−−−−−−−−−−−−−−−−−−−−−−−−−−−−−−−−−−−−−−−−−−−−−−−−−−−−−−−−−−−−−−−−−−−−−−−−−−−−−−−−−−−−−−−−−−−−−−−−−−−−−−−−−−−−−−−−−−−−−−−−−−−−−
80,123,883.01 149,345,483.73 104,786,841.75EUR
December 31, 2016December 31, 2018 December 31, 2017
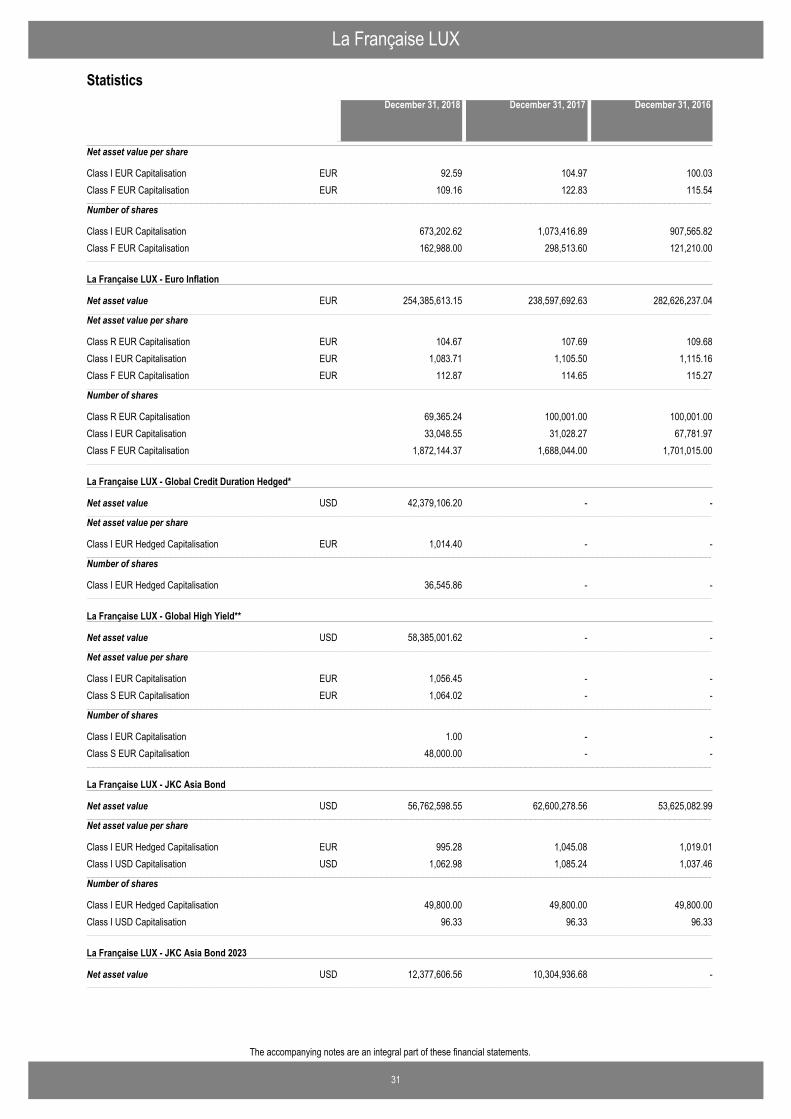
La Française LUX
31
The accompanying notes are an integral part of these financial statements.
Statistics
Net asset value per share
Class I EUR Capitalisation 92.59 104.97 100.03EURClass F EUR Capitalisation 109.16 122.83 115.54EUR−−−−−−−−−−−−−−−−−−−−−−−−−−−−−−−−−−−−−−−−−−−−−−−−−−−−−−−−−−−−−−−−−−−−−−−−−−−−−−−−−−−−−−−−−−−−−−−−−−−−−−−−−−−−−−−−−−−−−−−−−−−−−−−−−−−−−−−−−−−−−−−−−−−−−−−−−−−−−−−−−−−−−−−−−−−−−−−−−−−−−−−−−−−−−−−−−−−−−−−−−−−−−−−−−−−−−−−−−−−−−−−−−−−−−−−−−−−−−−−−−−−−−−−−−−−−−−−−−−−−−−−−−−−−−−−−−−−−−−−−−−−−−−−−−−−−−−−−−−−−−−−−−−−−−−−−−−−−−−−−−−−−−−−−−−−−−−−−−−−−−−−−−−−−−−−−−−−−−−−−−−−−−−−−−−−−−−−−−−−−−−−−−−−−−−−−−−−−−−−−−−−−−−−−−−−−−−−−−−−−−−−−−−−−−−−−−−−−−−−−−−−−−−−−−−−−−−−−−−−−−−−−−−−−−−−−−−−−−−−−−−−−−−−−−−−−−−−−−−−−−−−
Number of shares
Class I EUR Capitalisation 673,202.62 1,073,416.89 907,565.82Class F EUR Capitalisation 162,988.00 298,513.60 121,210.00−−−−−−−−−−−−−−−−−−−−−−−−−−−−−−−−−−−−−−−−−−−−−−−−−−−−−−−−−−−−−−−−−−−−−−−−−−−−−−−−−−−−−−−−−−−−−−−−−−−−−−−−−−−−−−−−−−−−−−−−−−−−−−−−−−−−−−−−−−−−−−−−−−−−−−−−−−−−−−−−−−−−−−−−−−−−−−−−−−−−−−−−−−−−−−−−−−−−−−−−−−−−−−−−−−−−−−−−−−−−−−−−−−−−−−−−−−−−−−−−−−−−−−−−−−−−−−−−−−−−−−−−−−−−−−−−−−−−−−−−−−−−−−−−−−−−−−−−−−−−−−−−−−−−−−−−−−−−−−−−−−−−−−−−−−−−−−−−−−−−−−−−−−−−−−−−−−−−−−−−−−−−−−−−−−−−−−−−−−−−−−−−−−−−−−−−−−−−−−−−−−−−−−−−−−−−−−−−−−−−−−−−−−−−−−−−−−−−−−−−−−−−−−−−−−−−−−−−−−−−−−−−−−−−−−−−−−−−−−−−−−−−−−−−−−−−−−−−−−−−−−−
La Française LUX - Euro Inflation
Net asset value−−−−−−−−−−−−−−−−−−−−−−−−−−−−−−−−−−−−−−−−−−−−−−−−−−−−−−−−−−−−−−−−−−−−−−−−−−−−−−−−−−−−−−−−−−−−−−−−−−−−−−−−−−−−−−−−−−−−−−−−−−−−−−−−−−−−−−−−−−−−−−−−−−−−−−−−−−−−−−−−−−−−−−−−−−−−−−−−−−−−−−−−−−−−−−−−−−−−−−−−−−−−−−−−−−−−−−−−−−−−−−−−−−−−−−−−−−−−−−−−−−−−−−−−−−−−−−−−−−−−−−−−−−−−−−−−−−−−−−−−−−−−−−−−−−−−−−−−−−−−−−−−−−−−−−−−−−−−−−−−−−−−−−−−−−−−−−−−−−−−−−−−−−−−−−−−−−−−−−−−−−−−−−−−−−−−−−−−−−−−−−−−−−−−−−−−−−−−−−−−−−−−−−−−−−−−−−−−−−−−−−−−−−−−−−−−−−−−−−−−−−−−−−−−−−−−−−−−−−−−−−−−−−−−−−−−−−−−−−−−−−−−−−−−−−−−−−−−−−−−−−−
254,385,613.15 238,597,692.63 282,626,237.04EUR
Net asset value per share
Class R EUR Capitalisation 104.67 107.69 109.68EURClass I EUR Capitalisation 1,083.71 1,105.50 1,115.16EURClass F EUR Capitalisation 112.87 114.65 115.27EUR−−−−−−−−−−−−−−−−−−−−−−−−−−−−−−−−−−−−−−−−−−−−−−−−−−−−−−−−−−−−−−−−−−−−−−−−−−−−−−−−−−−−−−−−−−−−−−−−−−−−−−−−−−−−−−−−−−−−−−−−−−−−−−−−−−−−−−−−−−−−−−−−−−−−−−−−−−−−−−−−−−−−−−−−−−−−−−−−−−−−−−−−−−−−−−−−−−−−−−−−−−−−−−−−−−−−−−−−−−−−−−−−−−−−−−−−−−−−−−−−−−−−−−−−−−−−−−−−−−−−−−−−−−−−−−−−−−−−−−−−−−−−−−−−−−−−−−−−−−−−−−−−−−−−−−−−−−−−−−−−−−−−−−−−−−−−−−−−−−−−−−−−−−−−−−−−−−−−−−−−−−−−−−−−−−−−−−−−−−−−−−−−−−−−−−−−−−−−−−−−−−−−−−−−−−−−−−−−−−−−−−−−−−−−−−−−−−−−−−−−−−−−−−−−−−−−−−−−−−−−−−−−−−−−−−−−−−−−−−−−−−−−−−−−−−−−−−−−−−−−−−−
Number of shares
Class R EUR Capitalisation 69,365.24 100,001.00 100,001.00Class I EUR Capitalisation 33,048.55 31,028.27 67,781.97Class F EUR Capitalisation 1,872,144.37 1,688,044.00 1,701,015.00−−−−−−−−−−−−−−−−−−−−−−−−−−−−−−−−−−−−−−−−−−−−−−−−−−−−−−−−−−−−−−−−−−−−−−−−−−−−−−−−−−−−−−−−−−−−−−−−−−−−−−−−−−−−−−−−−−−−−−−−−−−−−−−−−−−−−−−−−−−−−−−−−−−−−−−−−−−−−−−−−−−−−−−−−−−−−−−−−−−−−−−−−−−−−−−−−−−−−−−−−−−−−−−−−−−−−−−−−−−−−−−−−−−−−−−−−−−−−−−−−−−−−−−−−−−−−−−−−−−−−−−−−−−−−−−−−−−−−−−−−−−−−−−−−−−−−−−−−−−−−−−−−−−−−−−−−−−−−−−−−−−−−−−−−−−−−−−−−−−−−−−−−−−−−−−−−−−−−−−−−−−−−−−−−−−−−−−−−−−−−−−−−−−−−−−−−−−−−−−−−−−−−−−−−−−−−−−−−−−−−−−−−−−−−−−−−−−−−−−−−−−−−−−−−−−−−−−−−−−−−−−−−−−−−−−−−−−−−−−−−−−−−−−−−−−−−−−−−−−−−−−
La Française LUX - Global Credit Duration Hedged*
Net asset value−−−−−−−−−−−−−−−−−−−−−−−−−−−−−−−−−−−−−−−−−−−−−−−−−−−−−−−−−−−−−−−−−−−−−−−−−−−−−−−−−−−−−−−−−−−−−−−−−−−−−−−−−−−−−−−−−−−−−−−−−−−−−−−−−−−−−−−−−−−−−−−−−−−−−−−−−−−−−−−−−−−−−−−−−−−−−−−−−−−−−−−−−−−−−−−−−−−−−−−−−−−−−−−−−−−−−−−−−−−−−−−−−−−−−−−−−−−−−−−−−−−−−−−−−−−−−−−−−−−−−−−−−−−−−−−−−−−−−−−−−−−−−−−−−−−−−−−−−−−−−−−−−−−−−−−−−−−−−−−−−−−−−−−−−−−−−−−−−−−−−−−−−−−−−−−−−−−−−−−−−−−−−−−−−−−−−−−−−−−−−−−−−−−−−−−−−−−−−−−−−−−−−−−−−−−−−−−−−−−−−−−−−−−−−−−−−−−−−−−−−−−−−−−−−−−−−−−−−−−−−−−−−−−−−−−−−−−−−−−−−−−−−−−−−−−−−−−−−−−−−−−
42,379,106.20 - -USD
Net asset value per share
Class I EUR Hedged Capitalisation 1,014.40 - -EUR−−−−−−−−−−−−−−−−−−−−−−−−−−−−−−−−−−−−−−−−−−−−−−−−−−−−−−−−−−−−−−−−−−−−−−−−−−−−−−−−−−−−−−−−−−−−−−−−−−−−−−−−−−−−−−−−−−−−−−−−−−−−−−−−−−−−−−−−−−−−−−−−−−−−−−−−−−−−−−−−−−−−−−−−−−−−−−−−−−−−−−−−−−−−−−−−−−−−−−−−−−−−−−−−−−−−−−−−−−−−−−−−−−−−−−−−−−−−−−−−−−−−−−−−−−−−−−−−−−−−−−−−−−−−−−−−−−−−−−−−−−−−−−−−−−−−−−−−−−−−−−−−−−−−−−−−−−−−−−−−−−−−−−−−−−−−−−−−−−−−−−−−−−−−−−−−−−−−−−−−−−−−−−−−−−−−−−−−−−−−−−−−−−−−−−−−−−−−−−−−−−−−−−−−−−−−−−−−−−−−−−−−−−−−−−−−−−−−−−−−−−−−−−−−−−−−−−−−−−−−−−−−−−−−−−−−−−−−−−−−−−−−−−−−−−−−−−−−−−−−−−−
Number of shares
Class I EUR Hedged Capitalisation 36,545.86 - -−−−−−−−−−−−−−−−−−−−−−−−−−−−−−−−−−−−−−−−−−−−−−−−−−−−−−−−−−−−−−−−−−−−−−−−−−−−−−−−−−−−−−−−−−−−−−−−−−−−−−−−−−−−−−−−−−−−−−−−−−−−−−−−−−−−−−−−−−−−−−−−−−−−−−−−−−−−−−−−−−−−−−−−−−−−−−−−−−−−−−−−−−−−−−−−−−−−−−−−−−−−−−−−−−−−−−−−−−−−−−−−−−−−−−−−−−−−−−−−−−−−−−−−−−−−−−−−−−−−−−−−−−−−−−−−−−−−−−−−−−−−−−−−−−−−−−−−−−−−−−−−−−−−−−−−−−−−−−−−−−−−−−−−−−−−−−−−−−−−−−−−−−−−−−−−−−−−−−−−−−−−−−−−−−−−−−−−−−−−−−−−−−−−−−−−−−−−−−−−−−−−−−−−−−−−−−−−−−−−−−−−−−−−−−−−−−−−−−−−−−−−−−−−−−−−−−−−−−−−−−−−−−−−−−−−−−−−−−−−−−−−−−−−−−−−−−−−−−−−−−−−
La Française LUX - Global High Yield**
Net asset value−−−−−−−−−−−−−−−−−−−−−−−−−−−−−−−−−−−−−−−−−−−−−−−−−−−−−−−−−−−−−−−−−−−−−−−−−−−−−−−−−−−−−−−−−−−−−−−−−−−−−−−−−−−−−−−−−−−−−−−−−−−−−−−−−−−−−−−−−−−−−−−−−−−−−−−−−−−−−−−−−−−−−−−−−−−−−−−−−−−−−−−−−−−−−−−−−−−−−−−−−−−−−−−−−−−−−−−−−−−−−−−−−−−−−−−−−−−−−−−−−−−−−−−−−−−−−−−−−−−−−−−−−−−−−−−−−−−−−−−−−−−−−−−−−−−−−−−−−−−−−−−−−−−−−−−−−−−−−−−−−−−−−−−−−−−−−−−−−−−−−−−−−−−−−−−−−−−−−−−−−−−−−−−−−−−−−−−−−−−−−−−−−−−−−−−−−−−−−−−−−−−−−−−−−−−−−−−−−−−−−−−−−−−−−−−−−−−−−−−−−−−−−−−−−−−−−−−−−−−−−−−−−−−−−−−−−−−−−−−−−−−−−−−−−−−−−−−−−−−−−−−
58,385,001.62 - -USD
Net asset value per share
Class I EUR Capitalisation 1,056.45 - -EURClass S EUR Capitalisation 1,064.02 - -EUR−−−−−−−−−−−−−−−−−−−−−−−−−−−−−−−−−−−−−−−−−−−−−−−−−−−−−−−−−−−−−−−−−−−−−−−−−−−−−−−−−−−−−−−−−−−−−−−−−−−−−−−−−−−−−−−−−−−−−−−−−−−−−−−−−−−−−−−−−−−−−−−−−−−−−−−−−−−−−−−−−−−−−−−−−−−−−−−−−−−−−−−−−−−−−−−−−−−−−−−−−−−−−−−−−−−−−−−−−−−−−−−−−−−−−−−−−−−−−−−−−−−−−−−−−−−−−−−−−−−−−−−−−−−−−−−−−−−−−−−−−−−−−−−−−−−−−−−−−−−−−−−−−−−−−−−−−−−−−−−−−−−−−−−−−−−−−−−−−−−−−−−−−−−−−−−−−−−−−−−−−−−−−−−−−−−−−−−−−−−−−−−−−−−−−−−−−−−−−−−−−−−−−−−−−−−−−−−−−−−−−−−−−−−−−−−−−−−−−−−−−−−−−−−−−−−−−−−−−−−−−−−−−−−−−−−−−−−−−−−−−−−−−−−−−−−−−−−−−−−−−−−
Number of shares
Class I EUR Capitalisation 1.00 - -Class S EUR Capitalisation 48,000.00 - -−−−−−−−−−−−−−−−−−−−−−−−−−−−−−−−−−−−−−−−−−−−−−−−−−−−−−−−−−−−−−−−−−−−−−−−−−−−−−−−−−−−−−−−−−−−−−−−−−−−−−−−−−−−−−−−−−−−−−−−−−−−−−−−−−−−−−−−−−−−−−−−−−−−−−−−−−−−−−−−−−−−−−−−−−−−−−−−−−−−−−−−−−−−−−−−−−−−−−−−−−−−−−−−−−−−−−−−−−−−−−−−−−−−−−−−−−−−−−−−−−−−−−−−−−−−−−−−−−−−−−−−−−−−−−−−−−−−−−−−−−−−−−−−−−−−−−−−−−−−−−−−−−−−−−−−−−−−−−−−−−−−−−−−−−−−−−−−−−−−−−−−−−−−−−−−−−−−−−−−−−−−−−−−−−−−−−−−−−−−−−−−−−−−−−−−−−−−−−−−−−−−−−−−−−−−−−−−−−−−−−−−−−−−−−−−−−−−−−−−−−−−−−−−−−−−−−−−−−−−−−−−−−−−−−−−−−−−−−−−−−−−−−−−−−−−−−−−−−−−−−−−
La Française LUX - JKC Asia Bond
Net asset value−−−−−−−−−−−−−−−−−−−−−−−−−−−−−−−−−−−−−−−−−−−−−−−−−−−−−−−−−−−−−−−−−−−−−−−−−−−−−−−−−−−−−−−−−−−−−−−−−−−−−−−−−−−−−−−−−−−−−−−−−−−−−−−−−−−−−−−−−−−−−−−−−−−−−−−−−−−−−−−−−−−−−−−−−−−−−−−−−−−−−−−−−−−−−−−−−−−−−−−−−−−−−−−−−−−−−−−−−−−−−−−−−−−−−−−−−−−−−−−−−−−−−−−−−−−−−−−−−−−−−−−−−−−−−−−−−−−−−−−−−−−−−−−−−−−−−−−−−−−−−−−−−−−−−−−−−−−−−−−−−−−−−−−−−−−−−−−−−−−−−−−−−−−−−−−−−−−−−−−−−−−−−−−−−−−−−−−−−−−−−−−−−−−−−−−−−−−−−−−−−−−−−−−−−−−−−−−−−−−−−−−−−−−−−−−−−−−−−−−−−−−−−−−−−−−−−−−−−−−−−−−−−−−−−−−−−−−−−−−−−−−−−−−−−−−−−−−−−−−−−−−
56,762,598.55 62,600,278.56 53,625,082.99USD
Net asset value per share
Class I EUR Hedged Capitalisation 995.28 1,045.08 1,019.01EURClass I USD Capitalisation 1,062.98 1,085.24 1,037.46USD−−−−−−−−−−−−−−−−−−−−−−−−−−−−−−−−−−−−−−−−−−−−−−−−−−−−−−−−−−−−−−−−−−−−−−−−−−−−−−−−−−−−−−−−−−−−−−−−−−−−−−−−−−−−−−−−−−−−−−−−−−−−−−−−−−−−−−−−−−−−−−−−−−−−−−−−−−−−−−−−−−−−−−−−−−−−−−−−−−−−−−−−−−−−−−−−−−−−−−−−−−−−−−−−−−−−−−−−−−−−−−−−−−−−−−−−−−−−−−−−−−−−−−−−−−−−−−−−−−−−−−−−−−−−−−−−−−−−−−−−−−−−−−−−−−−−−−−−−−−−−−−−−−−−−−−−−−−−−−−−−−−−−−−−−−−−−−−−−−−−−−−−−−−−−−−−−−−−−−−−−−−−−−−−−−−−−−−−−−−−−−−−−−−−−−−−−−−−−−−−−−−−−−−−−−−−−−−−−−−−−−−−−−−−−−−−−−−−−−−−−−−−−−−−−−−−−−−−−−−−−−−−−−−−−−−−−−−−−−−−−−−−−−−−−−−−−−−−−−−−−−−
Number of shares
Class I EUR Hedged Capitalisation 49,800.00 49,800.00 49,800.00Class I USD Capitalisation 96.33 96.33 96.33−−−−−−−−−−−−−−−−−−−−−−−−−−−−−−−−−−−−−−−−−−−−−−−−−−−−−−−−−−−−−−−−−−−−−−−−−−−−−−−−−−−−−−−−−−−−−−−−−−−−−−−−−−−−−−−−−−−−−−−−−−−−−−−−−−−−−−−−−−−−−−−−−−−−−−−−−−−−−−−−−−−−−−−−−−−−−−−−−−−−−−−−−−−−−−−−−−−−−−−−−−−−−−−−−−−−−−−−−−−−−−−−−−−−−−−−−−−−−−−−−−−−−−−−−−−−−−−−−−−−−−−−−−−−−−−−−−−−−−−−−−−−−−−−−−−−−−−−−−−−−−−−−−−−−−−−−−−−−−−−−−−−−−−−−−−−−−−−−−−−−−−−−−−−−−−−−−−−−−−−−−−−−−−−−−−−−−−−−−−−−−−−−−−−−−−−−−−−−−−−−−−−−−−−−−−−−−−−−−−−−−−−−−−−−−−−−−−−−−−−−−−−−−−−−−−−−−−−−−−−−−−−−−−−−−−−−−−−−−−−−−−−−−−−−−−−−−−−−−−−−−−
La Française LUX - JKC Asia Bond 2023
Net asset value−−−−−−−−−−−−−−−−−−−−−−−−−−−−−−−−−−−−−−−−−−−−−−−−−−−−−−−−−−−−−−−−−−−−−−−−−−−−−−−−−−−−−−−−−−−−−−−−−−−−−−−−−−−−−−−−−−−−−−−−−−−−−−−−−−−−−−−−−−−−−−−−−−−−−−−−−−−−−−−−−−−−−−−−−−−−−−−−−−−−−−−−−−−−−−−−−−−−−−−−−−−−−−−−−−−−−−−−−−−−−−−−−−−−−−−−−−−−−−−−−−−−−−−−−−−−−−−−−−−−−−−−−−−−−−−−−−−−−−−−−−−−−−−−−−−−−−−−−−−−−−−−−−−−−−−−−−−−−−−−−−−−−−−−−−−−−−−−−−−−−−−−−−−−−−−−−−−−−−−−−−−−−−−−−−−−−−−−−−−−−−−−−−−−−−−−−−−−−−−−−−−−−−−−−−−−−−−−−−−−−−−−−−−−−−−−−−−−−−−−−−−−−−−−−−−−−−−−−−−−−−−−−−−−−−−−−−−−−−−−−−−−−−−−−−−−−−−−−−−−−−−
12,377,606.56 10,304,936.68 -USD
December 31, 2016December 31, 2018 December 31, 2017
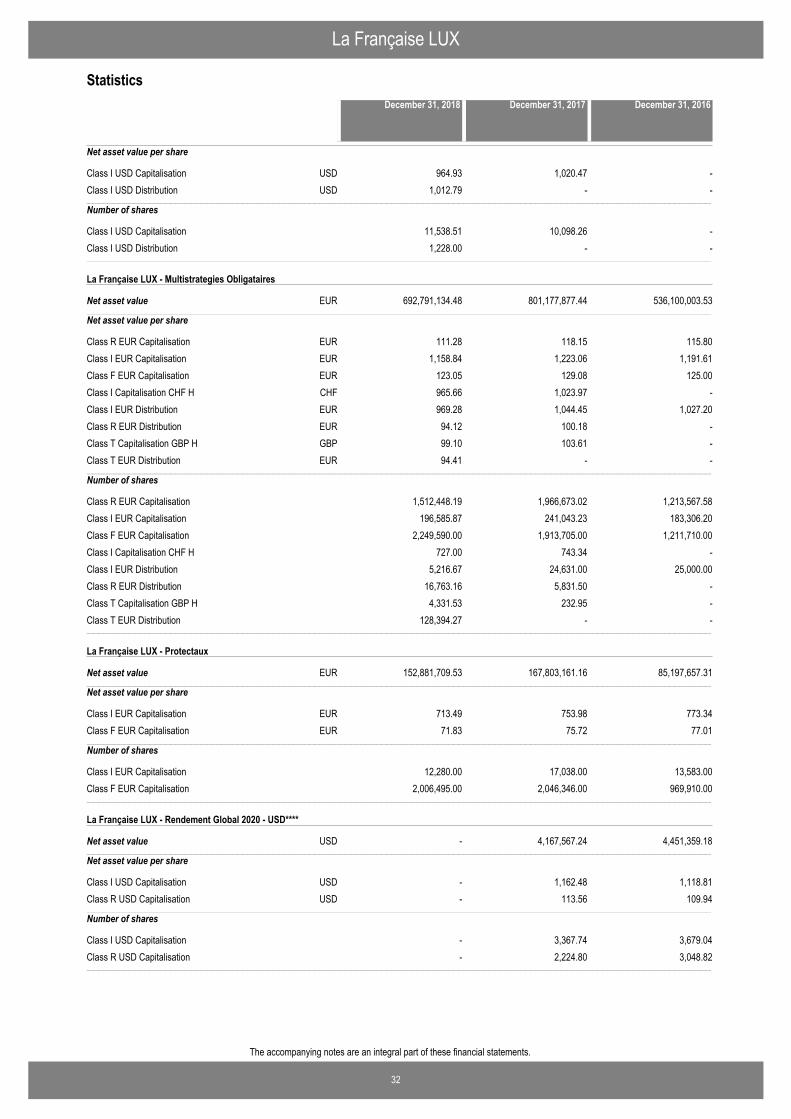
La Française LUX
32
The accompanying notes are an integral part of these financial statements.
Statistics
Net asset value per share
Class I USD Capitalisation 964.93 1,020.47 -USDClass I USD Distribution 1,012.79 - -USD−−−−−−−−−−−−−−−−−−−−−−−−−−−−−−−−−−−−−−−−−−−−−−−−−−−−−−−−−−−−−−−−−−−−−−−−−−−−−−−−−−−−−−−−−−−−−−−−−−−−−−−−−−−−−−−−−−−−−−−−−−−−−−−−−−−−−−−−−−−−−−−−−−−−−−−−−−−−−−−−−−−−−−−−−−−−−−−−−−−−−−−−−−−−−−−−−−−−−−−−−−−−−−−−−−−−−−−−−−−−−−−−−−−−−−−−−−−−−−−−−−−−−−−−−−−−−−−−−−−−−−−−−−−−−−−−−−−−−−−−−−−−−−−−−−−−−−−−−−−−−−−−−−−−−−−−−−−−−−−−−−−−−−−−−−−−−−−−−−−−−−−−−−−−−−−−−−−−−−−−−−−−−−−−−−−−−−−−−−−−−−−−−−−−−−−−−−−−−−−−−−−−−−−−−−−−−−−−−−−−−−−−−−−−−−−−−−−−−−−−−−−−−−−−−−−−−−−−−−−−−−−−−−−−−−−−−−−−−−−−−−−−−−−−−−−−−−−−−−−−−−−
Number of shares
Class I USD Capitalisation 11,538.51 10,098.26 -Class I USD Distribution 1,228.00 - -−−−−−−−−−−−−−−−−−−−−−−−−−−−−−−−−−−−−−−−−−−−−−−−−−−−−−−−−−−−−−−−−−−−−−−−−−−−−−−−−−−−−−−−−−−−−−−−−−−−−−−−−−−−−−−−−−−−−−−−−−−−−−−−−−−−−−−−−−−−−−−−−−−−−−−−−−−−−−−−−−−−−−−−−−−−−−−−−−−−−−−−−−−−−−−−−−−−−−−−−−−−−−−−−−−−−−−−−−−−−−−−−−−−−−−−−−−−−−−−−−−−−−−−−−−−−−−−−−−−−−−−−−−−−−−−−−−−−−−−−−−−−−−−−−−−−−−−−−−−−−−−−−−−−−−−−−−−−−−−−−−−−−−−−−−−−−−−−−−−−−−−−−−−−−−−−−−−−−−−−−−−−−−−−−−−−−−−−−−−−−−−−−−−−−−−−−−−−−−−−−−−−−−−−−−−−−−−−−−−−−−−−−−−−−−−−−−−−−−−−−−−−−−−−−−−−−−−−−−−−−−−−−−−−−−−−−−−−−−−−−−−−−−−−−−−−−−−−−−−−−−−
La Française LUX - Multistrategies Obligataires
Net asset value−−−−−−−−−−−−−−−−−−−−−−−−−−−−−−−−−−−−−−−−−−−−−−−−−−−−−−−−−−−−−−−−−−−−−−−−−−−−−−−−−−−−−−−−−−−−−−−−−−−−−−−−−−−−−−−−−−−−−−−−−−−−−−−−−−−−−−−−−−−−−−−−−−−−−−−−−−−−−−−−−−−−−−−−−−−−−−−−−−−−−−−−−−−−−−−−−−−−−−−−−−−−−−−−−−−−−−−−−−−−−−−−−−−−−−−−−−−−−−−−−−−−−−−−−−−−−−−−−−−−−−−−−−−−−−−−−−−−−−−−−−−−−−−−−−−−−−−−−−−−−−−−−−−−−−−−−−−−−−−−−−−−−−−−−−−−−−−−−−−−−−−−−−−−−−−−−−−−−−−−−−−−−−−−−−−−−−−−−−−−−−−−−−−−−−−−−−−−−−−−−−−−−−−−−−−−−−−−−−−−−−−−−−−−−−−−−−−−−−−−−−−−−−−−−−−−−−−−−−−−−−−−−−−−−−−−−−−−−−−−−−−−−−−−−−−−−−−−−−−−−−−
692,791,134.48 801,177,877.44 536,100,003.53EUR
Net asset value per share
Class R EUR Capitalisation 111.28 118.15 115.80EURClass I EUR Capitalisation 1,158.84 1,223.06 1,191.61EURClass F EUR Capitalisation 123.05 129.08 125.00EURClass I Capitalisation CHF H 965.66 1,023.97 -CHFClass I EUR Distribution 969.28 1,044.45 1,027.20EURClass R EUR Distribution 94.12 100.18 -EURClass T Capitalisation GBP H 99.10 103.61 -GBPClass T EUR Distribution 94.41 - -EUR−−−−−−−−−−−−−−−−−−−−−−−−−−−−−−−−−−−−−−−−−−−−−−−−−−−−−−−−−−−−−−−−−−−−−−−−−−−−−−−−−−−−−−−−−−−−−−−−−−−−−−−−−−−−−−−−−−−−−−−−−−−−−−−−−−−−−−−−−−−−−−−−−−−−−−−−−−−−−−−−−−−−−−−−−−−−−−−−−−−−−−−−−−−−−−−−−−−−−−−−−−−−−−−−−−−−−−−−−−−−−−−−−−−−−−−−−−−−−−−−−−−−−−−−−−−−−−−−−−−−−−−−−−−−−−−−−−−−−−−−−−−−−−−−−−−−−−−−−−−−−−−−−−−−−−−−−−−−−−−−−−−−−−−−−−−−−−−−−−−−−−−−−−−−−−−−−−−−−−−−−−−−−−−−−−−−−−−−−−−−−−−−−−−−−−−−−−−−−−−−−−−−−−−−−−−−−−−−−−−−−−−−−−−−−−−−−−−−−−−−−−−−−−−−−−−−−−−−−−−−−−−−−−−−−−−−−−−−−−−−−−−−−−−−−−−−−−−−−−−−−−−
Number of shares
Class R EUR Capitalisation 1,512,448.19 1,966,673.02 1,213,567.58Class I EUR Capitalisation 196,585.87 241,043.23 183,306.20Class F EUR Capitalisation 2,249,590.00 1,913,705.00 1,211,710.00Class I Capitalisation CHF H 727.00 743.34 -Class I EUR Distribution 5,216.67 24,631.00 25,000.00Class R EUR Distribution 16,763.16 5,831.50 -Class T Capitalisation GBP H 4,331.53 232.95 -Class T EUR Distribution 128,394.27 - -−−−−−−−−−−−−−−−−−−−−−−−−−−−−−−−−−−−−−−−−−−−−−−−−−−−−−−−−−−−−−−−−−−−−−−−−−−−−−−−−−−−−−−−−−−−−−−−−−−−−−−−−−−−−−−−−−−−−−−−−−−−−−−−−−−−−−−−−−−−−−−−−−−−−−−−−−−−−−−−−−−−−−−−−−−−−−−−−−−−−−−−−−−−−−−−−−−−−−−−−−−−−−−−−−−−−−−−−−−−−−−−−−−−−−−−−−−−−−−−−−−−−−−−−−−−−−−−−−−−−−−−−−−−−−−−−−−−−−−−−−−−−−−−−−−−−−−−−−−−−−−−−−−−−−−−−−−−−−−−−−−−−−−−−−−−−−−−−−−−−−−−−−−−−−−−−−−−−−−−−−−−−−−−−−−−−−−−−−−−−−−−−−−−−−−−−−−−−−−−−−−−−−−−−−−−−−−−−−−−−−−−−−−−−−−−−−−−−−−−−−−−−−−−−−−−−−−−−−−−−−−−−−−−−−−−−−−−−−−−−−−−−−−−−−−−−−−−−−−−−−−−
La Française LUX - Protectaux
Net asset value−−−−−−−−−−−−−−−−−−−−−−−−−−−−−−−−−−−−−−−−−−−−−−−−−−−−−−−−−−−−−−−−−−−−−−−−−−−−−−−−−−−−−−−−−−−−−−−−−−−−−−−−−−−−−−−−−−−−−−−−−−−−−−−−−−−−−−−−−−−−−−−−−−−−−−−−−−−−−−−−−−−−−−−−−−−−−−−−−−−−−−−−−−−−−−−−−−−−−−−−−−−−−−−−−−−−−−−−−−−−−−−−−−−−−−−−−−−−−−−−−−−−−−−−−−−−−−−−−−−−−−−−−−−−−−−−−−−−−−−−−−−−−−−−−−−−−−−−−−−−−−−−−−−−−−−−−−−−−−−−−−−−−−−−−−−−−−−−−−−−−−−−−−−−−−−−−−−−−−−−−−−−−−−−−−−−−−−−−−−−−−−−−−−−−−−−−−−−−−−−−−−−−−−−−−−−−−−−−−−−−−−−−−−−−−−−−−−−−−−−−−−−−−−−−−−−−−−−−−−−−−−−−−−−−−−−−−−−−−−−−−−−−−−−−−−−−−−−−−−−−−−
152,881,709.53 167,803,161.16 85,197,657.31EUR
Net asset value per share
Class I EUR Capitalisation 713.49 753.98 773.34EURClass F EUR Capitalisation 71.83 75.72 77.01EUR−−−−−−−−−−−−−−−−−−−−−−−−−−−−−−−−−−−−−−−−−−−−−−−−−−−−−−−−−−−−−−−−−−−−−−−−−−−−−−−−−−−−−−−−−−−−−−−−−−−−−−−−−−−−−−−−−−−−−−−−−−−−−−−−−−−−−−−−−−−−−−−−−−−−−−−−−−−−−−−−−−−−−−−−−−−−−−−−−−−−−−−−−−−−−−−−−−−−−−−−−−−−−−−−−−−−−−−−−−−−−−−−−−−−−−−−−−−−−−−−−−−−−−−−−−−−−−−−−−−−−−−−−−−−−−−−−−−−−−−−−−−−−−−−−−−−−−−−−−−−−−−−−−−−−−−−−−−−−−−−−−−−−−−−−−−−−−−−−−−−−−−−−−−−−−−−−−−−−−−−−−−−−−−−−−−−−−−−−−−−−−−−−−−−−−−−−−−−−−−−−−−−−−−−−−−−−−−−−−−−−−−−−−−−−−−−−−−−−−−−−−−−−−−−−−−−−−−−−−−−−−−−−−−−−−−−−−−−−−−−−−−−−−−−−−−−−−−−−−−−−−−
Number of shares
Class I EUR Capitalisation 12,280.00 17,038.00 13,583.00Class F EUR Capitalisation 2,006,495.00 2,046,346.00 969,910.00−−−−−−−−−−−−−−−−−−−−−−−−−−−−−−−−−−−−−−−−−−−−−−−−−−−−−−−−−−−−−−−−−−−−−−−−−−−−−−−−−−−−−−−−−−−−−−−−−−−−−−−−−−−−−−−−−−−−−−−−−−−−−−−−−−−−−−−−−−−−−−−−−−−−−−−−−−−−−−−−−−−−−−−−−−−−−−−−−−−−−−−−−−−−−−−−−−−−−−−−−−−−−−−−−−−−−−−−−−−−−−−−−−−−−−−−−−−−−−−−−−−−−−−−−−−−−−−−−−−−−−−−−−−−−−−−−−−−−−−−−−−−−−−−−−−−−−−−−−−−−−−−−−−−−−−−−−−−−−−−−−−−−−−−−−−−−−−−−−−−−−−−−−−−−−−−−−−−−−−−−−−−−−−−−−−−−−−−−−−−−−−−−−−−−−−−−−−−−−−−−−−−−−−−−−−−−−−−−−−−−−−−−−−−−−−−−−−−−−−−−−−−−−−−−−−−−−−−−−−−−−−−−−−−−−−−−−−−−−−−−−−−−−−−−−−−−−−−−−−−−−−
La Française LUX - Rendement Global 2020 - USD****
Net asset value−−−−−−−−−−−−−−−−−−−−−−−−−−−−−−−−−−−−−−−−−−−−−−−−−−−−−−−−−−−−−−−−−−−−−−−−−−−−−−−−−−−−−−−−−−−−−−−−−−−−−−−−−−−−−−−−−−−−−−−−−−−−−−−−−−−−−−−−−−−−−−−−−−−−−−−−−−−−−−−−−−−−−−−−−−−−−−−−−−−−−−−−−−−−−−−−−−−−−−−−−−−−−−−−−−−−−−−−−−−−−−−−−−−−−−−−−−−−−−−−−−−−−−−−−−−−−−−−−−−−−−−−−−−−−−−−−−−−−−−−−−−−−−−−−−−−−−−−−−−−−−−−−−−−−−−−−−−−−−−−−−−−−−−−−−−−−−−−−−−−−−−−−−−−−−−−−−−−−−−−−−−−−−−−−−−−−−−−−−−−−−−−−−−−−−−−−−−−−−−−−−−−−−−−−−−−−−−−−−−−−−−−−−−−−−−−−−−−−−−−−−−−−−−−−−−−−−−−−−−−−−−−−−−−−−−−−−−−−−−−−−−−−−−−−−−−−−−−−−−−−−−
- 4,167,567.24 4,451,359.18USD
Net asset value per share
Class I USD Capitalisation - 1,162.48 1,118.81USDClass R USD Capitalisation - 113.56 109.94USD−−−−−−−−−−−−−−−−−−−−−−−−−−−−−−−−−−−−−−−−−−−−−−−−−−−−−−−−−−−−−−−−−−−−−−−−−−−−−−−−−−−−−−−−−−−−−−−−−−−−−−−−−−−−−−−−−−−−−−−−−−−−−−−−−−−−−−−−−−−−−−−−−−−−−−−−−−−−−−−−−−−−−−−−−−−−−−−−−−−−−−−−−−−−−−−−−−−−−−−−−−−−−−−−−−−−−−−−−−−−−−−−−−−−−−−−−−−−−−−−−−−−−−−−−−−−−−−−−−−−−−−−−−−−−−−−−−−−−−−−−−−−−−−−−−−−−−−−−−−−−−−−−−−−−−−−−−−−−−−−−−−−−−−−−−−−−−−−−−−−−−−−−−−−−−−−−−−−−−−−−−−−−−−−−−−−−−−−−−−−−−−−−−−−−−−−−−−−−−−−−−−−−−−−−−−−−−−−−−−−−−−−−−−−−−−−−−−−−−−−−−−−−−−−−−−−−−−−−−−−−−−−−−−−−−−−−−−−−−−−−−−−−−−−−−−−−−−−−−−−−−−
Number of shares
Class I USD Capitalisation - 3,367.74 3,679.04Class R USD Capitalisation - 2,224.80 3,048.82−−−−−−−−−−−−−−−−−−−−−−−−−−−−−−−−−−−−−−−−−−−−−−−−−−−−−−−−−−−−−−−−−−−−−−−−−−−−−−−−−−−−−−−−−−−−−−−−−−−−−−−−−−−−−−−−−−−−−−−−−−−−−−−−−−−−−−−−−−−−−−−−−−−−−−−−−−−−−−−−−−−−−−−−−−−−−−−−−−−−−−−−−−−−−−−−−−−−−−−−−−−−−−−−−−−−−−−−−−−−−−−−−−−−−−−−−−−−−−−−−−−−−−−−−−−−−−−−−−−−−−−−−−−−−−−−−−−−−−−−−−−−−−−−−−−−−−−−−−−−−−−−−−−−−−−−−−−−−−−−−−−−−−−−−−−−−−−−−−−−−−−−−−−−−−−−−−−−−−−−−−−−−−−−−−−−−−−−−−−−−−−−−−−−−−−−−−−−−−−−−−−−−−−−−−−−−−−−−−−−−−−−−−−−−−−−−−−−−−−−−−−−−−−−−−−−−−−−−−−−−−−−−−−−−−−−−−−−−−−−−−−−−−−−−−−−−−−−−−−−−−−
December 31, 2016December 31, 2018 December 31, 2017
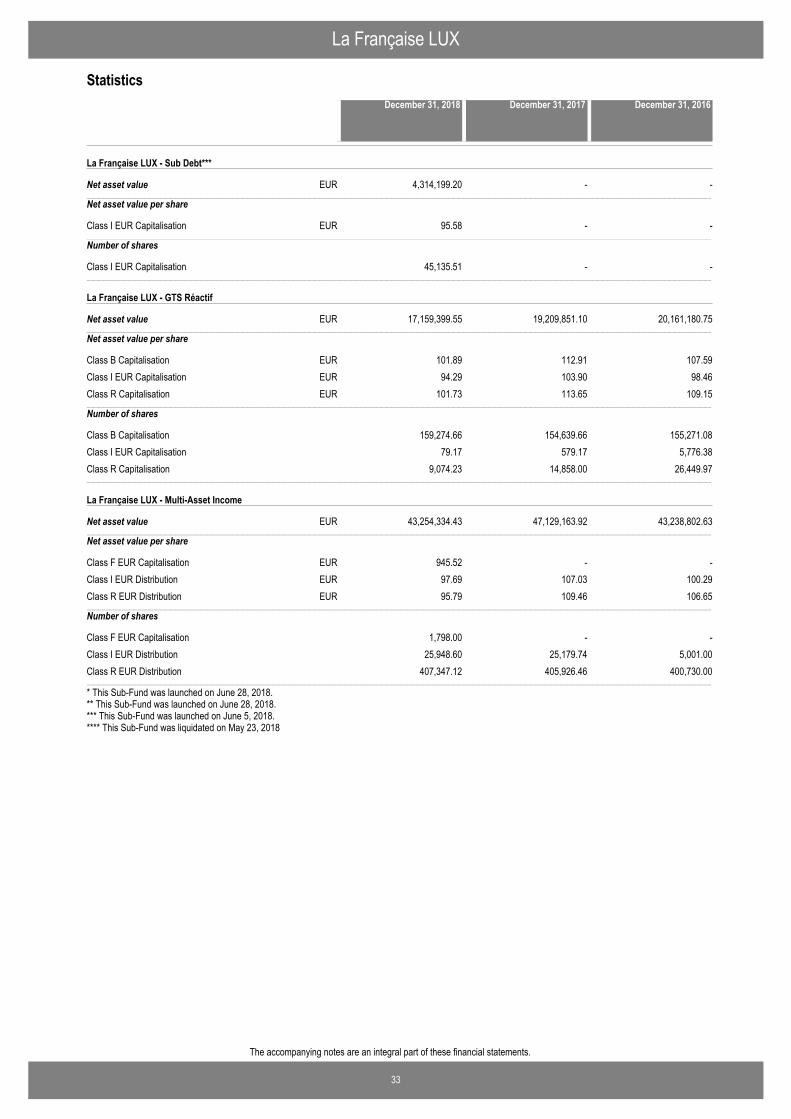
La Française LUX
33
The accompanying notes are an integral part of these financial statements.
Statistics
* This Sub-Fund was launched on June 28, 2018.** This Sub-Fund was launched on June 28, 2018.*** This Sub-Fund was launched on June 5, 2018.**** This Sub-Fund was liquidated on May 23, 2018
La Française LUX - Sub Debt***
Net asset value−−−−−−−−−−−−−−−−−−−−−−−−−−−−−−−−−−−−−−−−−−−−−−−−−−−−−−−−−−−−−−−−−−−−−−−−−−−−−−−−−−−−−−−−−−−−−−−−−−−−−−−−−−−−−−−−−−−−−−−−−−−−−−−−−−−−−−−−−−−−−−−−−−−−−−−−−−−−−−−−−−−−−−−−−−−−−−−−−−−−−−−−−−−−−−−−−−−−−−−−−−−−−−−−−−−−−−−−−−−−−−−−−−−−−−−−−−−−−−−−−−−−−−−−−−−−−−−−−−−−−−−−−−−−−−−−−−−−−−−−−−−−−−−−−−−−−−−−−−−−−−−−−−−−−−−−−−−−−−−−−−−−−−−−−−−−−−−−−−−−−−−−−−−−−−−−−−−−−−−−−−−−−−−−−−−−−−−−−−−−−−−−−−−−−−−−−−−−−−−−−−−−−−−−−−−−−−−−−−−−−−−−−−−−−−−−−−−−−−−−−−−−−−−−−−−−−−−−−−−−−−−−−−−−−−−−−−−−−−−−−−−−−−−−−−−−−−−−−−−−−−−
4,314,199.20 - -EUR
Net asset value per share
Class I EUR Capitalisation 95.58 - -EUR−−−−−−−−−−−−−−−−−−−−−−−−−−−−−−−−−−−−−−−−−−−−−−−−−−−−−−−−−−−−−−−−−−−−−−−−−−−−−−−−−−−−−−−−−−−−−−−−−−−−−−−−−−−−−−−−−−−−−−−−−−−−−−−−−−−−−−−−−−−−−−−−−−−−−−−−−−−−−−−−−−−−−−−−−−−−−−−−−−−−−−−−−−−−−−−−−−−−−−−−−−−−−−−−−−−−−−−−−−−−−−−−−−−−−−−−−−−−−−−−−−−−−−−−−−−−−−−−−−−−−−−−−−−−−−−−−−−−−−−−−−−−−−−−−−−−−−−−−−−−−−−−−−−−−−−−−−−−−−−−−−−−−−−−−−−−−−−−−−−−−−−−−−−−−−−−−−−−−−−−−−−−−−−−−−−−−−−−−−−−−−−−−−−−−−−−−−−−−−−−−−−−−−−−−−−−−−−−−−−−−−−−−−−−−−−−−−−−−−−−−−−−−−−−−−−−−−−−−−−−−−−−−−−−−−−−−−−−−−−−−−−−−−−−−−−−−−−−−−−−−−−
Number of shares
Class I EUR Capitalisation 45,135.51 - -−−−−−−−−−−−−−−−−−−−−−−−−−−−−−−−−−−−−−−−−−−−−−−−−−−−−−−−−−−−−−−−−−−−−−−−−−−−−−−−−−−−−−−−−−−−−−−−−−−−−−−−−−−−−−−−−−−−−−−−−−−−−−−−−−−−−−−−−−−−−−−−−−−−−−−−−−−−−−−−−−−−−−−−−−−−−−−−−−−−−−−−−−−−−−−−−−−−−−−−−−−−−−−−−−−−−−−−−−−−−−−−−−−−−−−−−−−−−−−−−−−−−−−−−−−−−−−−−−−−−−−−−−−−−−−−−−−−−−−−−−−−−−−−−−−−−−−−−−−−−−−−−−−−−−−−−−−−−−−−−−−−−−−−−−−−−−−−−−−−−−−−−−−−−−−−−−−−−−−−−−−−−−−−−−−−−−−−−−−−−−−−−−−−−−−−−−−−−−−−−−−−−−−−−−−−−−−−−−−−−−−−−−−−−−−−−−−−−−−−−−−−−−−−−−−−−−−−−−−−−−−−−−−−−−−−−−−−−−−−−−−−−−−−−−−−−−−−−−−−−−−−
La Française LUX - GTS Réactif
Net asset value−−−−−−−−−−−−−−−−−−−−−−−−−−−−−−−−−−−−−−−−−−−−−−−−−−−−−−−−−−−−−−−−−−−−−−−−−−−−−−−−−−−−−−−−−−−−−−−−−−−−−−−−−−−−−−−−−−−−−−−−−−−−−−−−−−−−−−−−−−−−−−−−−−−−−−−−−−−−−−−−−−−−−−−−−−−−−−−−−−−−−−−−−−−−−−−−−−−−−−−−−−−−−−−−−−−−−−−−−−−−−−−−−−−−−−−−−−−−−−−−−−−−−−−−−−−−−−−−−−−−−−−−−−−−−−−−−−−−−−−−−−−−−−−−−−−−−−−−−−−−−−−−−−−−−−−−−−−−−−−−−−−−−−−−−−−−−−−−−−−−−−−−−−−−−−−−−−−−−−−−−−−−−−−−−−−−−−−−−−−−−−−−−−−−−−−−−−−−−−−−−−−−−−−−−−−−−−−−−−−−−−−−−−−−−−−−−−−−−−−−−−−−−−−−−−−−−−−−−−−−−−−−−−−−−−−−−−−−−−−−−−−−−−−−−−−−−−−−−−−−−−−
17,159,399.55 19,209,851.10 20,161,180.75EUR
Net asset value per share
Class B Capitalisation 101.89 112.91 107.59EURClass I EUR Capitalisation 94.29 103.90 98.46EURClass R Capitalisation 101.73 113.65 109.15EUR−−−−−−−−−−−−−−−−−−−−−−−−−−−−−−−−−−−−−−−−−−−−−−−−−−−−−−−−−−−−−−−−−−−−−−−−−−−−−−−−−−−−−−−−−−−−−−−−−−−−−−−−−−−−−−−−−−−−−−−−−−−−−−−−−−−−−−−−−−−−−−−−−−−−−−−−−−−−−−−−−−−−−−−−−−−−−−−−−−−−−−−−−−−−−−−−−−−−−−−−−−−−−−−−−−−−−−−−−−−−−−−−−−−−−−−−−−−−−−−−−−−−−−−−−−−−−−−−−−−−−−−−−−−−−−−−−−−−−−−−−−−−−−−−−−−−−−−−−−−−−−−−−−−−−−−−−−−−−−−−−−−−−−−−−−−−−−−−−−−−−−−−−−−−−−−−−−−−−−−−−−−−−−−−−−−−−−−−−−−−−−−−−−−−−−−−−−−−−−−−−−−−−−−−−−−−−−−−−−−−−−−−−−−−−−−−−−−−−−−−−−−−−−−−−−−−−−−−−−−−−−−−−−−−−−−−−−−−−−−−−−−−−−−−−−−−−−−−−−−−−−−
Number of shares
Class B Capitalisation 159,274.66 154,639.66 155,271.08Class I EUR Capitalisation 79.17 579.17 5,776.38Class R Capitalisation 9,074.23 14,858.00 26,449.97−−−−−−−−−−−−−−−−−−−−−−−−−−−−−−−−−−−−−−−−−−−−−−−−−−−−−−−−−−−−−−−−−−−−−−−−−−−−−−−−−−−−−−−−−−−−−−−−−−−−−−−−−−−−−−−−−−−−−−−−−−−−−−−−−−−−−−−−−−−−−−−−−−−−−−−−−−−−−−−−−−−−−−−−−−−−−−−−−−−−−−−−−−−−−−−−−−−−−−−−−−−−−−−−−−−−−−−−−−−−−−−−−−−−−−−−−−−−−−−−−−−−−−−−−−−−−−−−−−−−−−−−−−−−−−−−−−−−−−−−−−−−−−−−−−−−−−−−−−−−−−−−−−−−−−−−−−−−−−−−−−−−−−−−−−−−−−−−−−−−−−−−−−−−−−−−−−−−−−−−−−−−−−−−−−−−−−−−−−−−−−−−−−−−−−−−−−−−−−−−−−−−−−−−−−−−−−−−−−−−−−−−−−−−−−−−−−−−−−−−−−−−−−−−−−−−−−−−−−−−−−−−−−−−−−−−−−−−−−−−−−−−−−−−−−−−−−−−−−−−−−−
La Française LUX - Multi-Asset Income
Net asset value−−−−−−−−−−−−−−−−−−−−−−−−−−−−−−−−−−−−−−−−−−−−−−−−−−−−−−−−−−−−−−−−−−−−−−−−−−−−−−−−−−−−−−−−−−−−−−−−−−−−−−−−−−−−−−−−−−−−−−−−−−−−−−−−−−−−−−−−−−−−−−−−−−−−−−−−−−−−−−−−−−−−−−−−−−−−−−−−−−−−−−−−−−−−−−−−−−−−−−−−−−−−−−−−−−−−−−−−−−−−−−−−−−−−−−−−−−−−−−−−−−−−−−−−−−−−−−−−−−−−−−−−−−−−−−−−−−−−−−−−−−−−−−−−−−−−−−−−−−−−−−−−−−−−−−−−−−−−−−−−−−−−−−−−−−−−−−−−−−−−−−−−−−−−−−−−−−−−−−−−−−−−−−−−−−−−−−−−−−−−−−−−−−−−−−−−−−−−−−−−−−−−−−−−−−−−−−−−−−−−−−−−−−−−−−−−−−−−−−−−−−−−−−−−−−−−−−−−−−−−−−−−−−−−−−−−−−−−−−−−−−−−−−−−−−−−−−−−−−−−−−−
43,254,334.43 47,129,163.92 43,238,802.63EUR
Net asset value per share
Class F EUR Capitalisation 945.52 - -EURClass I EUR Distribution 97.69 107.03 100.29EURClass R EUR Distribution 95.79 109.46 106.65EUR−−−−−−−−−−−−−−−−−−−−−−−−−−−−−−−−−−−−−−−−−−−−−−−−−−−−−−−−−−−−−−−−−−−−−−−−−−−−−−−−−−−−−−−−−−−−−−−−−−−−−−−−−−−−−−−−−−−−−−−−−−−−−−−−−−−−−−−−−−−−−−−−−−−−−−−−−−−−−−−−−−−−−−−−−−−−−−−−−−−−−−−−−−−−−−−−−−−−−−−−−−−−−−−−−−−−−−−−−−−−−−−−−−−−−−−−−−−−−−−−−−−−−−−−−−−−−−−−−−−−−−−−−−−−−−−−−−−−−−−−−−−−−−−−−−−−−−−−−−−−−−−−−−−−−−−−−−−−−−−−−−−−−−−−−−−−−−−−−−−−−−−−−−−−−−−−−−−−−−−−−−−−−−−−−−−−−−−−−−−−−−−−−−−−−−−−−−−−−−−−−−−−−−−−−−−−−−−−−−−−−−−−−−−−−−−−−−−−−−−−−−−−−−−−−−−−−−−−−−−−−−−−−−−−−−−−−−−−−−−−−−−−−−−−−−−−−−−−−−−−−−−
Number of shares
Class F EUR Capitalisation 1,798.00 - -Class I EUR Distribution 25,948.60 25,179.74 5,001.00Class R EUR Distribution 407,347.12 405,926.46 400,730.00−−−−−−−−−−−−−−−−−−−−−−−−−−−−−−−−−−−−−−−−−−−−−−−−−−−−−−−−−−−−−−−−−−−−−−−−−−−−−−−−−−−−−−−−−−−−−−−−−−−−−−−−−−−−−−−−−−−−−−−−−−−−−−−−−−−−−−−−−−−−−−−−−−−−−−−−−−−−−−−−−−−−−−−−−−−−−−−−−−−−−−−−−−−−−−−−−−−−−−−−−−−−−−−−−−−−−−−−−−−−−−−−−−−−−−−−−−−−−−−−−−−−−−−−−−−−−−−−−−−−−−−−−−−−−−−−−−−−−−−−−−−−−−−−−−−−−−−−−−−−−−−−−−−−−−−−−−−−−−−−−−−−−−−−−−−−−−−−−−−−−−−−−−−−−−−−−−−−−−−−−−−−−−−−−−−−−−−−−−−−−−−−−−−−−−−−−−−−−−−−−−−−−−−−−−−−−−−−−−−−−−−−−−−−−−−−−−−−−−−−−−−−−−−−−−−−−−−−−−−−−−−−−−−−−−−−−−−−−−−−−−−−−−−−−−−−−−−−−−−−−−−
December 31, 2016December 31, 2018 December 31, 2017
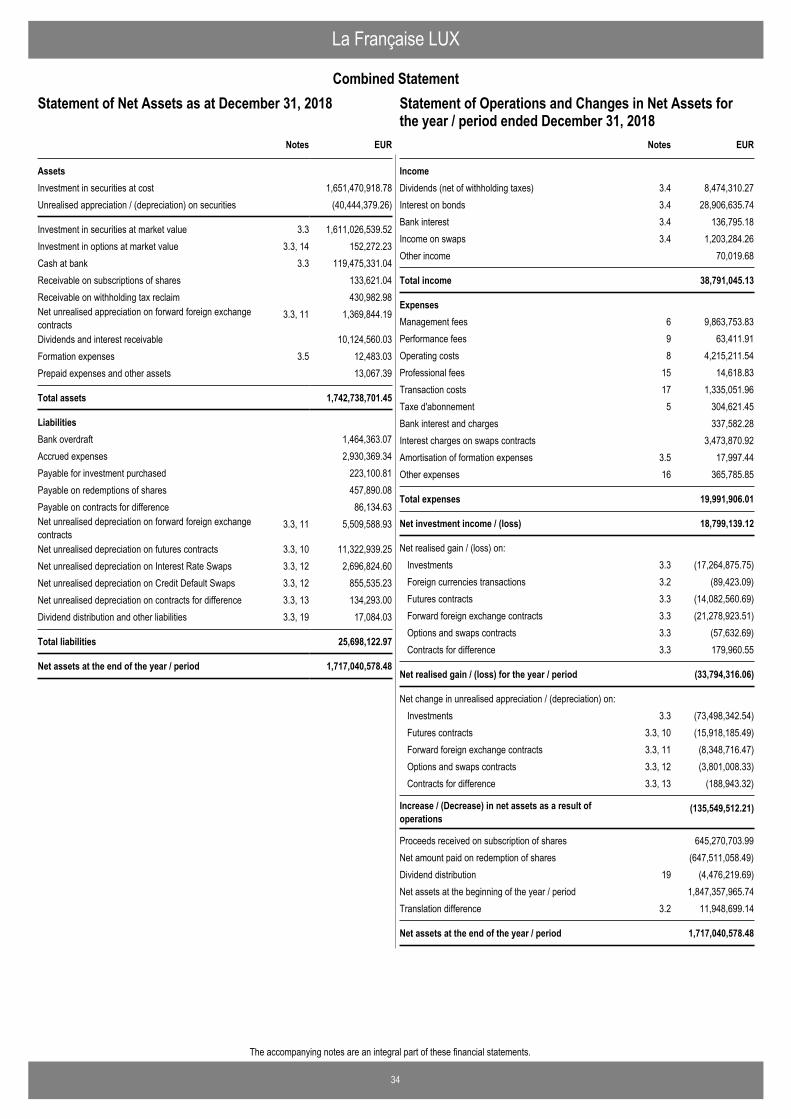
34
The accompanying notes are an integral part of these financial statements.
La Française LUX
Combined Statement
EUR
AssetsInvestment in securities at cost 1,651,470,918.78Unrealised appreciation / (depreciation) on securities (40,444,379.26)
Investment in securities at market value 3.3 1,611,026,539.52Investment in options at market value 3.3, 14 152,272.23Cash at bank 3.3 119,475,331.04Receivable on subscriptions of shares 133,621.04Receivable on withholding tax reclaim 430,982.98Net unrealised appreciation on forward foreign exchangecontracts
3.3, 11 1,369,844.19
Dividends and interest receivable 10,124,560.03Formation expenses 3.5 12,483.03Prepaid expenses and other assets 13,067.39
Total assets 1,742,738,701.45
LiabilitiesBank overdraft 1,464,363.07Accrued expenses 2,930,369.34Payable for investment purchased 223,100.81Payable on redemptions of shares 457,890.08Payable on contracts for difference 86,134.63Net unrealised depreciation on forward foreign exchangecontracts
3.3, 11 5,509,588.93
Net unrealised depreciation on futures contracts 3.3, 10 11,322,939.25Net unrealised depreciation on Interest Rate Swaps 3.3, 12 2,696,824.60Net unrealised depreciation on Credit Default Swaps 3.3, 12 855,535.23Net unrealised depreciation on contracts for difference 3.3, 13 134,293.00Dividend distribution and other liabilities 3.3, 19 17,084.03
Total liabilities 25,698,122.97
Net assets at the end of the year / period 1,717,040,578.48
Notes
Statement of Net Assets as at December 31, 2018
IncomeDividends (net of withholding taxes) 3.4 8,474,310.27Interest on bonds 3.4 28,906,635.74Bank interest 3.4 136,795.18Income on swaps 3.4 1,203,284.26Other income 70,019.68
Total income 38,791,045.13
ExpensesManagement fees 6 9,863,753.83Performance fees 9 63,411.91Operating costs 8 4,215,211.54Professional fees 15 14,618.83Transaction costs 17 1,335,051.96Taxe d'abonnement 5 304,621.45Bank interest and charges 337,582.28Interest charges on swaps contracts 3,473,870.92Amortisation of formation expenses 3.5 17,997.44Other expenses 16 365,785.85
Total expenses 19,991,906.01
Net investment income / (loss) 18,799,139.12
Net realised gain / (loss) on:Investments 3.3 (17,264,875.75)Foreign currencies transactions 3.2 (89,423.09)Futures contracts 3.3 (14,082,560.69)Forward foreign exchange contracts 3.3 (21,278,923.51)Options and swaps contracts 3.3 (57,632.69)Contracts for difference 3.3 179,960.55
Net realised gain / (loss) for the year / period (33,794,316.06)
Net change in unrealised appreciation / (depreciation) on:Investments 3.3 (73,498,342.54)Futures contracts 3.3, 10 (15,918,185.49)Forward foreign exchange contracts 3.3, 11 (8,348,716.47)Options and swaps contracts 3.3, 12 (3,801,008.33)Contracts for difference 3.3, 13 (188,943.32)
Increase / (Decrease) in net assets as a result ofoperations
(135,549,512.21)
Proceeds received on subscription of shares 645,270,703.99Net amount paid on redemption of shares (647,511,058.49)Dividend distribution 19 (4,476,219.69)Net assets at the beginning of the year / period 1,847,357,965.74Translation difference 3.2 11,948,699.14
Net assets at the end of the year / period 1,717,040,578.48
EURNotes
Statement of Operations and Changes in Net Assets forthe year / period ended December 31, 2018
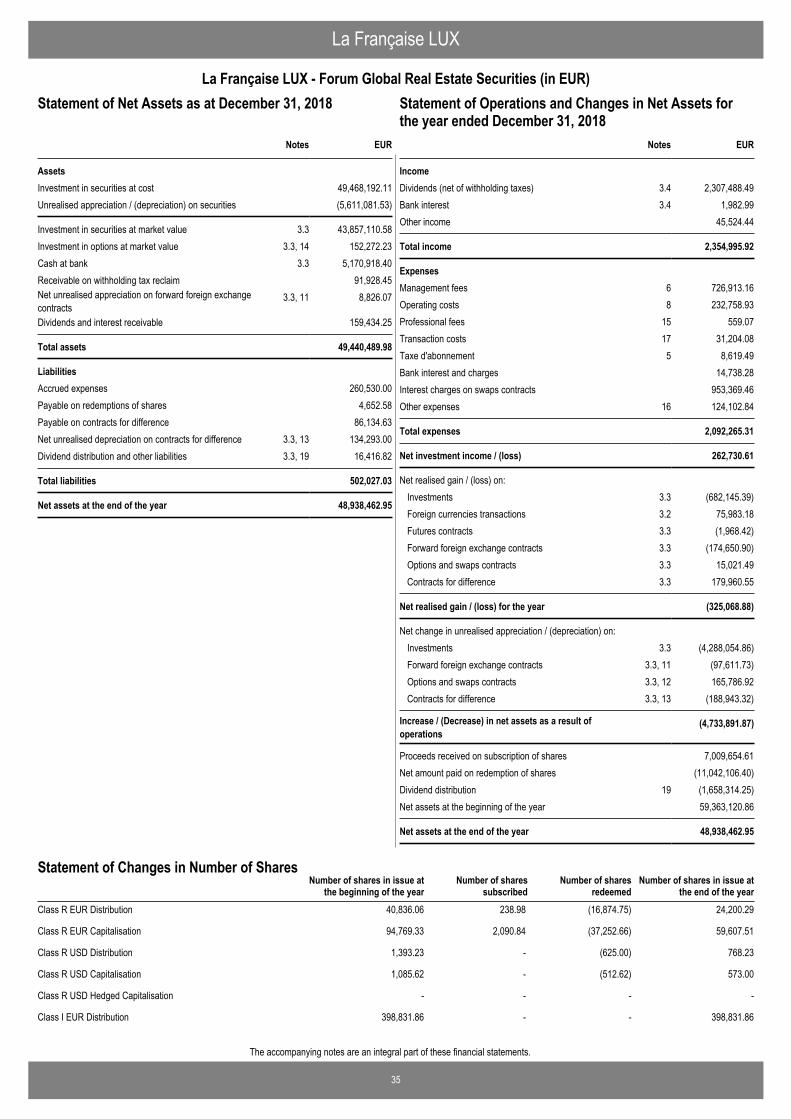
35
The accompanying notes are an integral part of these financial statements.
La Française LUX
La Française LUX - Forum Global Real Estate Securities (in EUR)Statement of Operations and Changes in Net Assets for theyear ended December 31, 2018
EUR
AssetsInvestment in securities at cost 49,468,192.11Unrealised appreciation / (depreciation) on securities (5,611,081.53)
Investment in securities at market value 3.3 43,857,110.58Investment in options at market value 3.3, 14 152,272.23Cash at bank 3.3 5,170,918.40Receivable on withholding tax reclaim 91,928.45Net unrealised appreciation on forward foreign exchangecontracts
3.3, 11 8,826.07
Dividends and interest receivable 159,434.25
Total assets 49,440,489.98
LiabilitiesAccrued expenses 260,530.00Payable on redemptions of shares 4,652.58Payable on contracts for difference 86,134.63Net unrealised depreciation on contracts for difference 3.3, 13 134,293.00Dividend distribution and other liabilities 3.3, 19 16,416.82
Total liabilities 502,027.03
Net assets at the end of the year 48,938,462.95
Notes
Statement of Net Assets as at December 31, 2018
IncomeDividends (net of withholding taxes) 3.4 2,307,488.49Bank interest 3.4 1,982.99Other income 45,524.44
Total income 2,354,995.92
ExpensesManagement fees 6 726,913.16Operating costs 8 232,758.93Professional fees 15 559.07Transaction costs 17 31,204.08Taxe d'abonnement 5 8,619.49Bank interest and charges 14,738.28Interest charges on swaps contracts 953,369.46Other expenses 16 124,102.84
Total expenses 2,092,265.31
Net investment income / (loss) 262,730.61
Net realised gain / (loss) on: Investments 3.3 (682,145.39)Foreign currencies transactions 3.2 75,983.18Futures contracts 3.3 (1,968.42)Forward foreign exchange contracts 3.3 (174,650.90)Options and swaps contracts 3.3 15,021.49Contracts for difference 3.3 179,960.55
Net realised gain / (loss) for the year (325,068.88)
Net change in unrealised appreciation / (depreciation) on: Investments 3.3 (4,288,054.86)Forward foreign exchange contracts 3.3, 11 (97,611.73)Options and swaps contracts 3.3, 12 165,786.92Contracts for difference 3.3, 13 (188,943.32)
Increase / (Decrease) in net assets as a result ofoperations
(4,733,891.87)
Proceeds received on subscription of shares 7,009,654.61Net amount paid on redemption of shares (11,042,106.40)Dividend distribution 19 (1,658,314.25)Net assets at the beginning of the year 59,363,120.86
Net assets at the end of the year 48,938,462.95
EURNotes
Statement of Operations and Changes in Net Assets forthe year ended December 31, 2018
Number of shares in issue atthe end of the year
Number of shares in issue atthe beginning of the year
Number of sharessubscribed
Number of sharesredeemed
Statement of Changes in Number of Shares
Class R EUR Distribution 40,836.06 238.98 (16,874.75) 24,200.29
Class R EUR Capitalisation 94,769.33 2,090.84 (37,252.66) 59,607.51
Class R USD Distribution 1,393.23 - (625.00) 768.23
Class R USD Capitalisation 1,085.62 - (512.62) 573.00
Class R USD Hedged Capitalisation - - - -
Class I EUR Distribution 398,831.86 - - 398,831.86
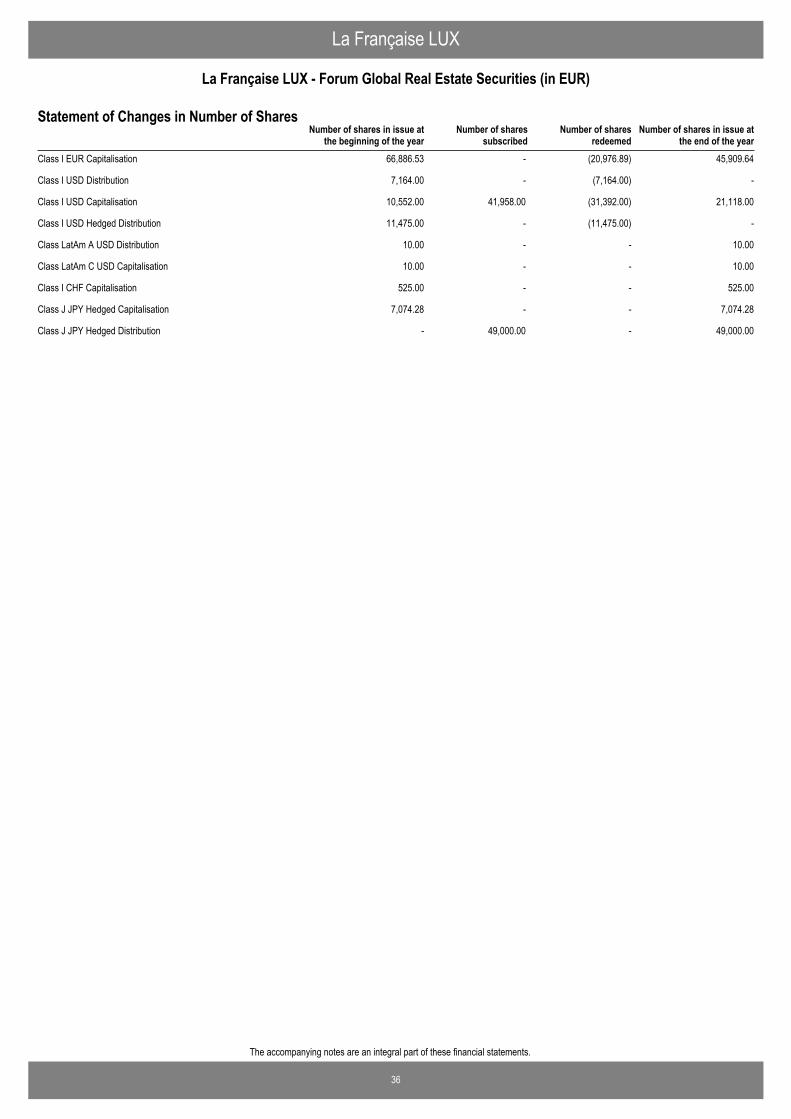
36
The accompanying notes are an integral part of these financial statements.
La Française LUX
La Française LUX - Forum Global Real Estate Securities (in EUR)
Number of shares in issue atthe end of the year
Number of shares in issue atthe beginning of the year
Number of sharessubscribed
Number of sharesredeemed
Statement of Changes in Number of Shares
Class I EUR Capitalisation 66,886.53 - (20,976.89) 45,909.64
Class I USD Distribution 7,164.00 - (7,164.00) -
Class I USD Capitalisation 10,552.00 41,958.00 (31,392.00) 21,118.00
Class I USD Hedged Distribution 11,475.00 - (11,475.00) -
Class LatAm A USD Distribution 10.00 - - 10.00
Class LatAm C USD Capitalisation 10.00 - - 10.00
Class I CHF Capitalisation 525.00 - - 525.00
Class J JPY Hedged Capitalisation 7,074.28 - - 7,074.28
Class J JPY Hedged Distribution - 49,000.00 - 49,000.00
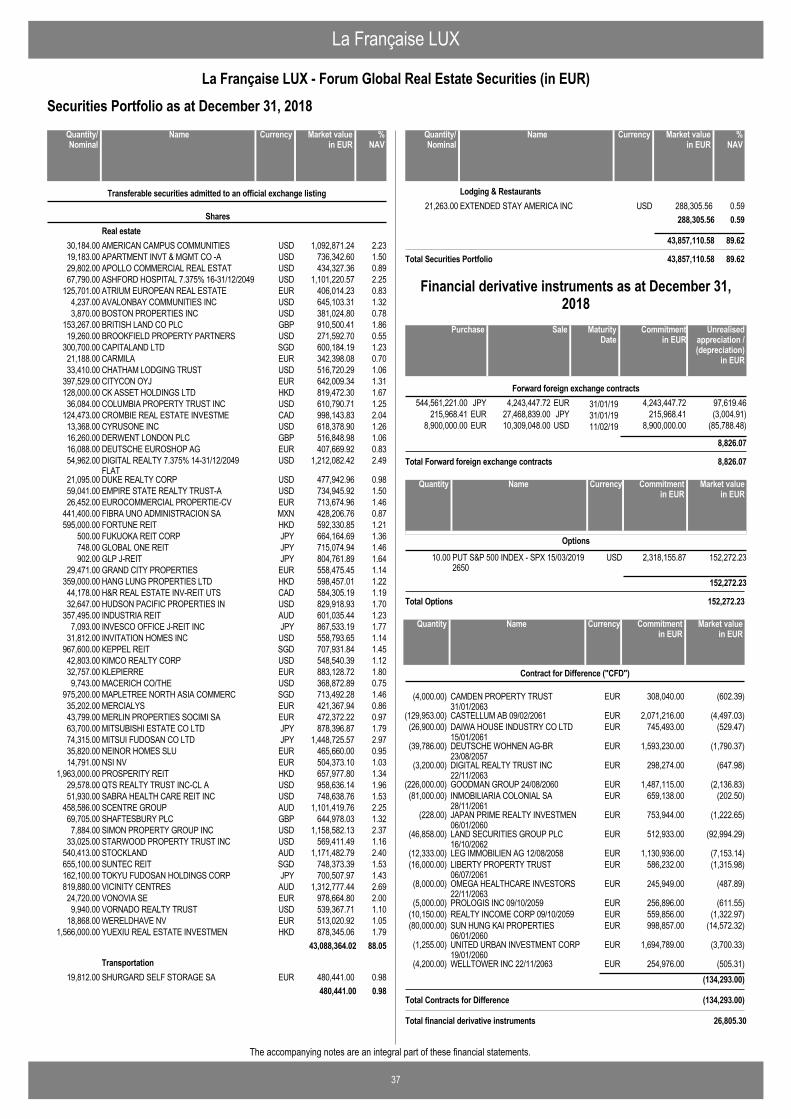
La Française LUX
37
La Française LUX - Forum Global Real Estate Securities (in EUR)
The accompanying notes are an integral part of these financial statements.
Securities Portfolio as at December 31, 2018
AMERICAN CAMPUS COMMUNITIES USD 1,092,871.24 2.2330,184.00
Transferable securities admitted to an official exchange listing
SharesReal estate
APARTMENT INVT & MGMT CO -A USD 736,342.60 1.5019,183.00APOLLO COMMERCIAL REAL ESTAT USD 434,327.36 0.8929,802.00ASHFORD HOSPITAL 7.375% 16-31/12/2049 USD 1,101,220.57 2.2567,790.00ATRIUM EUROPEAN REAL ESTATE EUR 406,014.23 0.83125,701.00AVALONBAY COMMUNITIES INC USD 645,103.31 1.324,237.00BOSTON PROPERTIES INC USD 381,024.80 0.783,870.00BRITISH LAND CO PLC GBP 910,500.41 1.86153,267.00BROOKFIELD PROPERTY PARTNERS USD 271,592.70 0.5519,260.00CAPITALAND LTD SGD 600,184.19 1.23300,700.00CARMILA EUR 342,398.08 0.7021,188.00CHATHAM LODGING TRUST USD 516,720.29 1.0633,410.00CITYCON OYJ EUR 642,009.34 1.31397,529.00CK ASSET HOLDINGS LTD HKD 819,472.30 1.67128,000.00COLUMBIA PROPERTY TRUST INC USD 610,790.71 1.2536,084.00CROMBIE REAL ESTATE INVESTME CAD 998,143.83 2.04124,473.00CYRUSONE INC USD 618,378.90 1.2613,368.00DERWENT LONDON PLC GBP 516,848.98 1.0616,260.00DEUTSCHE EUROSHOP AG EUR 407,669.92 0.8316,088.00DIGITAL REALTY 7.375% 14-31/12/2049FLAT
USD 1,212,082.42 2.4954,962.00
DUKE REALTY CORP USD 477,942.96 0.9821,095.00EMPIRE STATE REALTY TRUST-A USD 734,945.92 1.5059,041.00EUROCOMMERCIAL PROPERTIE-CV EUR 713,674.96 1.4626,452.00FIBRA UNO ADMINISTRACION SA MXN 428,206.76 0.87441,400.00FORTUNE REIT HKD 592,330.85 1.21595,000.00FUKUOKA REIT CORP JPY 664,164.69 1.36500.00GLOBAL ONE REIT JPY 715,074.94 1.46748.00GLP J-REIT JPY 804,761.89 1.64902.00GRAND CITY PROPERTIES EUR 558,475.45 1.1429,471.00HANG LUNG PROPERTIES LTD HKD 598,457.01 1.22359,000.00H&R REAL ESTATE INV-REIT UTS CAD 584,305.19 1.1944,178.00HUDSON PACIFIC PROPERTIES IN USD 829,918.93 1.7032,647.00INDUSTRIA REIT AUD 601,035.44 1.23357,495.00INVESCO OFFICE J-REIT INC JPY 867,533.19 1.777,093.00INVITATION HOMES INC USD 558,793.65 1.1431,812.00KEPPEL REIT SGD 707,931.84 1.45967,600.00KIMCO REALTY CORP USD 548,540.39 1.1242,803.00KLEPIERRE EUR 883,128.72 1.8032,757.00MACERICH CO/THE USD 368,872.89 0.759,743.00MAPLETREE NORTH ASIA COMMERC SGD 713,492.28 1.46975,200.00MERCIALYS EUR 421,367.94 0.8635,202.00MERLIN PROPERTIES SOCIMI SA EUR 472,372.22 0.9743,799.00MITSUBISHI ESTATE CO LTD JPY 878,396.87 1.7963,700.00MITSUI FUDOSAN CO LTD JPY 1,448,725.57 2.9774,315.00NEINOR HOMES SLU EUR 465,660.00 0.9535,820.00NSI NV EUR 504,373.10 1.0314,791.00PROSPERITY REIT HKD 657,977.80 1.341,963,000.00QTS REALTY TRUST INC-CL A USD 958,636.14 1.9629,578.00SABRA HEALTH CARE REIT INC USD 748,638.76 1.5351,930.00SCENTRE GROUP AUD 1,101,419.76 2.25458,586.00SHAFTESBURY PLC GBP 644,978.03 1.3269,705.00SIMON PROPERTY GROUP INC USD 1,158,582.13 2.377,884.00STARWOOD PROPERTY TRUST INC USD 569,411.49 1.1633,025.00STOCKLAND AUD 1,171,482.79 2.40540,413.00SUNTEC REIT SGD 748,373.39 1.53655,100.00TOKYU FUDOSAN HOLDINGS CORP JPY 700,507.97 1.43162,100.00VICINITY CENTRES AUD 1,312,777.44 2.69819,880.00VONOVIA SE EUR 978,664.80 2.0024,720.00VORNADO REALTY TRUST USD 539,367.71 1.109,940.00WERELDHAVE NV EUR 513,020.92 1.0518,868.00YUEXIU REAL ESTATE INVESTMEN HKD 878,345.06 1.791,566,000.00
43,088,364.02 88.05
SHURGARD SELF STORAGE SA EUR 480,441.00 0.9819,812.00Transportation
480,441.00 0.98
NameQuantity/Nominal
Market valuein EUR
Currency %NAV
EXTENDED STAY AMERICA INC USD 288,305.56 0.5921,263.00Lodging & Restaurants
288,305.56 0.59
43,857,110.58 89.62
Total Securities Portfolio 43,857,110.58 89.62
NameQuantity/Nominal
Market valuein EUR
Currency %NAV
4,243,447.72 31/01/19544,561,221.00 97,619.46EURJPY 4,243,447.72Forward foreign exchange contracts
27,468,839.00 31/01/19215,968.41 (3,004.91)JPYEUR 215,968.4110,309,048.00 11/02/198,900,000.00 (85,788.48)USDEUR 8,900,000.00
8,826.07
Total Forward foreign exchange contracts 8,826.07
SalePurchase Unrealisedappreciation /(depreciation)
in EUR
MaturityDate
Commitmentin EUR
Financial derivative instruments as at December 31,2018
PUT S&P 500 INDEX - SPX 15/03/20192650
USD10.00 2,318,155.87 152,272.23
Options
152,272.23
Total Options 152,272.23
NameQuantity Market valuein EUR
Currency Commitmentin EUR
CAMDEN PROPERTY TRUST31/01/2063
EUR (602.39)308,040.00(4,000.00)
Contract for Difference ("CFD")
NameQuantity Market valuein EUR
Currency Commitmentin EUR
CASTELLUM AB 09/02/2061 EUR (4,497.03)2,071,216.00(129,953.00)DAIWA HOUSE INDUSTRY CO LTD15/01/2061
EUR (529.47)745,493.00(26,900.00)
DEUTSCHE WOHNEN AG-BR23/08/2057
EUR (1,790.37)1,593,230.00(39,786.00)
DIGITAL REALTY TRUST INC22/11/2063
EUR (647.98)298,274.00(3,200.00)
GOODMAN GROUP 24/08/2060 EUR (2,136.83)1,487,115.00(226,000.00)INMOBILIARIA COLONIAL SA28/11/2061
EUR (202.50)659,138.00(81,000.00)
JAPAN PRIME REALTY INVESTMEN06/01/2060
EUR (1,222.65)753,944.00(228.00)
LAND SECURITIES GROUP PLC16/10/2062
EUR (92,994.29)512,933.00(46,858.00)
LEG IMMOBILIEN AG 12/08/2058 EUR (7,153.14)1,130,936.00(12,333.00)LIBERTY PROPERTY TRUST06/07/2061
EUR (1,315.98)586,232.00(16,000.00)
OMEGA HEALTHCARE INVESTORS22/11/2063
EUR (487.89)245,949.00(8,000.00)
PROLOGIS INC 09/10/2059 EUR (611.55)256,896.00(5,000.00)REALTY INCOME CORP 09/10/2059 EUR (1,322.97)559,856.00(10,150.00)SUN HUNG KAI PROPERTIES06/01/2060
EUR (14,572.32)998,857.00(80,000.00)
UNITED URBAN INVESTMENT CORP19/01/2060
EUR (3,700.33)1,694,789.00(1,255.00)
WELLTOWER INC 22/11/2063 EUR (505.31)254,976.00(4,200.00)(134,293.00)
Total Contracts for Difference (134,293.00)
Total financial derivative instruments 26,805.30
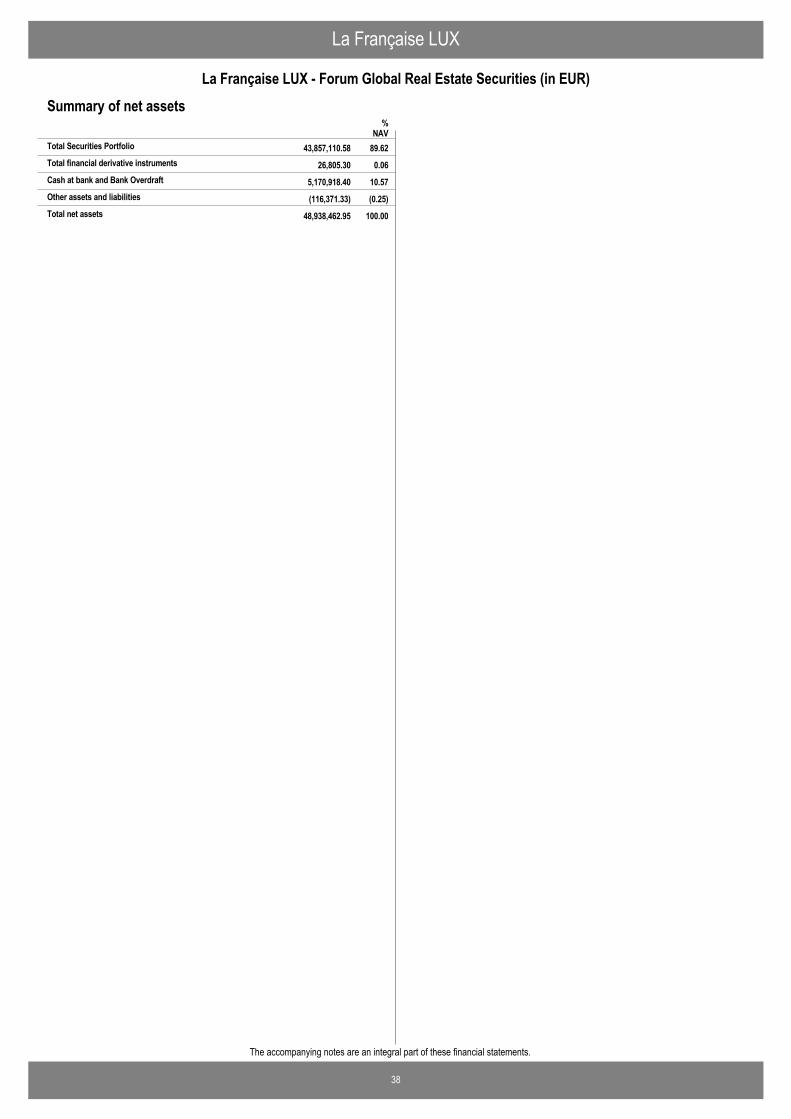
La Française LUX
38
La Française LUX - Forum Global Real Estate Securities (in EUR)
The accompanying notes are an integral part of these financial statements.
Summary of net assets
26,805.30 0.06Total financial derivative instruments
%NAV
43,857,110.58 89.62Total Securities Portfolio
5,170,918.40 10.57Cash at bank and Bank Overdraft
(116,371.33) (0.25)Other assets and liabilities
48,938,462.95 100.00Total net assets
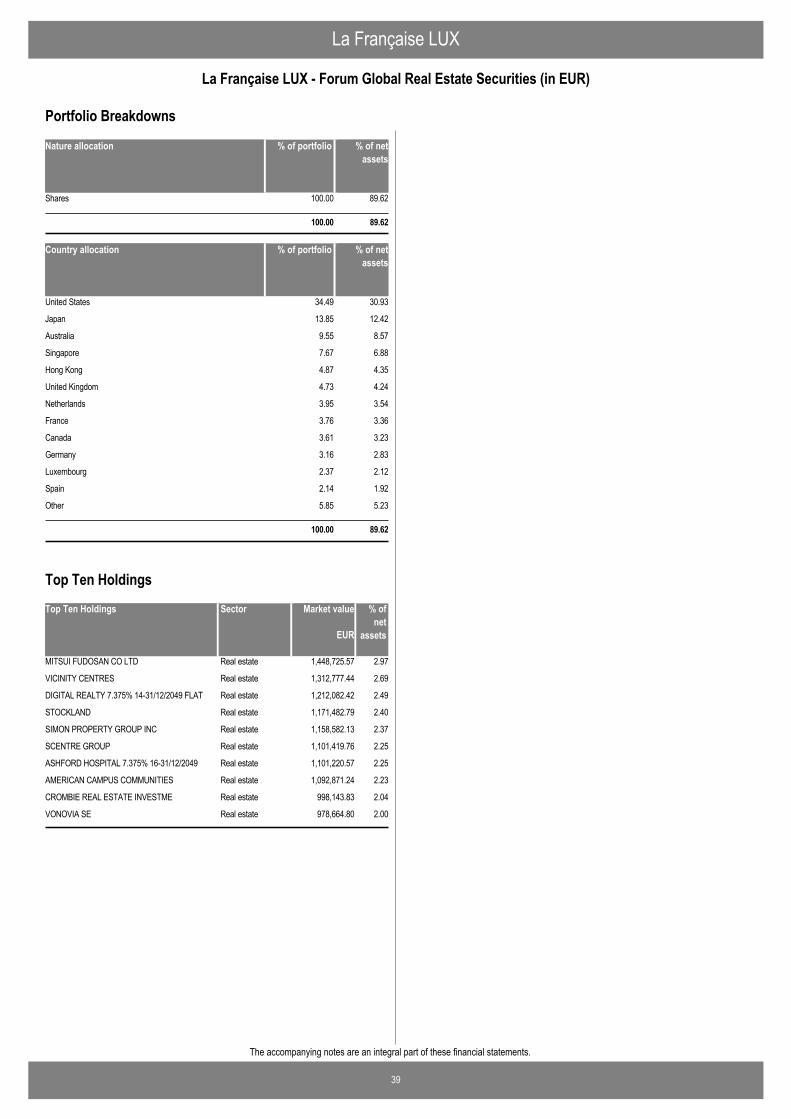
La Française LUX
39
La Française LUX - Forum Global Real Estate Securities (in EUR)
The accompanying notes are an integral part of these financial statements.
Nature allocation % of portfolio % of netassets
Shares 100.00 89.62
100.00 89.62
Country allocation % of portfolio % of netassets
United States 34.49 30.93
Japan 13.85 12.42
Australia 9.55 8.57
Singapore 7.67 6.88
Hong Kong 4.87 4.35
United Kingdom 4.73 4.24
Netherlands 3.95 3.54
France 3.76 3.36
Canada 3.61 3.23
Germany 3.16 2.83
Luxembourg 2.37 2.12
Spain 2.14 1.92
Other 5.85 5.23
100.00 89.62
Portfolio Breakdowns
Top Ten Holdings Market value % ofnet
assets
MITSUI FUDOSAN CO LTD 1,448,725.57 2.97Real estate
VICINITY CENTRES 1,312,777.44 2.69Real estate
DIGITAL REALTY 7.375% 14-31/12/2049 FLAT 1,212,082.42 2.49Real estate
STOCKLAND 1,171,482.79 2.40Real estate
SIMON PROPERTY GROUP INC 1,158,582.13 2.37Real estate
SCENTRE GROUP 1,101,419.76 2.25Real estate
ASHFORD HOSPITAL 7.375% 16-31/12/2049 1,101,220.57 2.25Real estate
AMERICAN CAMPUS COMMUNITIES 1,092,871.24 2.23Real estate
CROMBIE REAL ESTATE INVESTME 998,143.83 2.04Real estate
VONOVIA SE 978,664.80 2.00Real estate
EUR
Sector
Top Ten Holdings
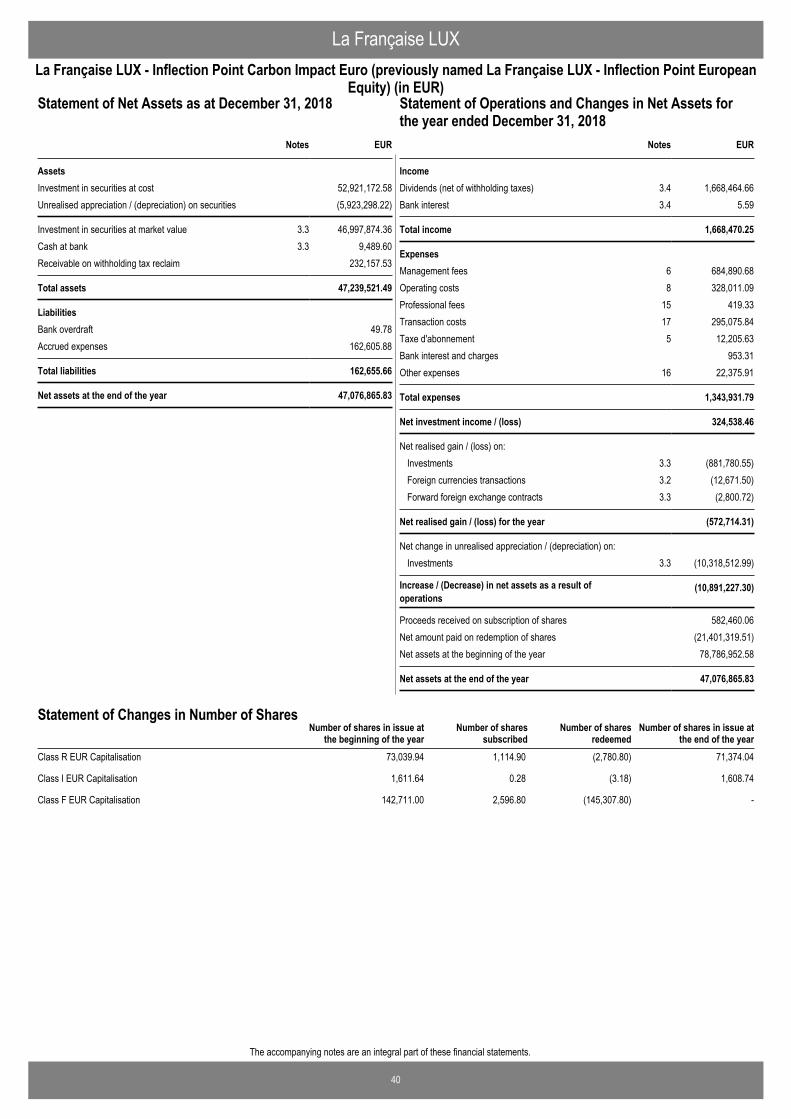
40
The accompanying notes are an integral part of these financial statements.
La Française LUXLa Française LUX - Inflection Point Carbon Impact Euro (previously named La Française LUX - Inflection Point European
Equity) (in EUR)Statement of Operations and Changes in Net Assets for theyear ended December 31, 2018
EUR
AssetsInvestment in securities at cost 52,921,172.58Unrealised appreciation / (depreciation) on securities (5,923,298.22)
Investment in securities at market value 3.3 46,997,874.36Cash at bank 3.3 9,489.60Receivable on withholding tax reclaim 232,157.53
Total assets 47,239,521.49
LiabilitiesBank overdraft 49.78Accrued expenses 162,605.88
Total liabilities 162,655.66
Net assets at the end of the year 47,076,865.83
Notes
Statement of Net Assets as at December 31, 2018
IncomeDividends (net of withholding taxes) 3.4 1,668,464.66Bank interest 3.4 5.59
Total income 1,668,470.25
ExpensesManagement fees 6 684,890.68Operating costs 8 328,011.09Professional fees 15 419.33Transaction costs 17 295,075.84Taxe d'abonnement 5 12,205.63Bank interest and charges 953.31Other expenses 16 22,375.91
Total expenses 1,343,931.79
Net investment income / (loss) 324,538.46
Net realised gain / (loss) on: Investments 3.3 (881,780.55)Foreign currencies transactions 3.2 (12,671.50)Forward foreign exchange contracts 3.3 (2,800.72)
Net realised gain / (loss) for the year (572,714.31)
Net change in unrealised appreciation / (depreciation) on: Investments 3.3 (10,318,512.99)
Increase / (Decrease) in net assets as a result ofoperations
(10,891,227.30)
Proceeds received on subscription of shares 582,460.06Net amount paid on redemption of shares (21,401,319.51)Net assets at the beginning of the year 78,786,952.58
Net assets at the end of the year 47,076,865.83
EURNotes
Statement of Operations and Changes in Net Assets forthe year ended December 31, 2018
Number of shares in issue atthe end of the year
Number of shares in issue atthe beginning of the year
Number of sharessubscribed
Number of sharesredeemed
Statement of Changes in Number of Shares
Class R EUR Capitalisation 73,039.94 1,114.90 (2,780.80) 71,374.04
Class I EUR Capitalisation 1,611.64 0.28 (3.18) 1,608.74
Class F EUR Capitalisation 142,711.00 2,596.80 (145,307.80) -
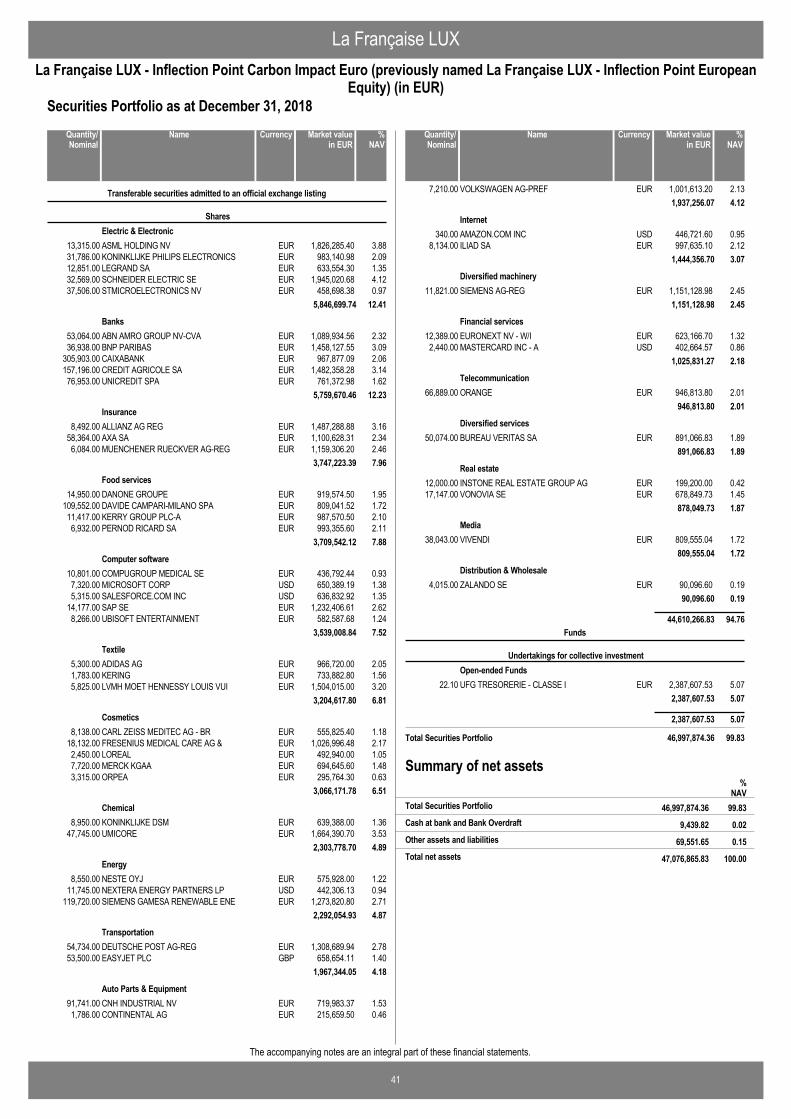
La Française LUX
41
La Française LUX - Inflection Point Carbon Impact Euro (previously named La Française LUX - Inflection Point EuropeanEquity) (in EUR)
The accompanying notes are an integral part of these financial statements.
Securities Portfolio as at December 31, 2018
ASML HOLDING NV EUR 1,826,285.40 3.8813,315.00
Transferable securities admitted to an official exchange listing
SharesElectric & Electronic
KONINKLIJKE PHILIPS ELECTRONICS EUR 983,140.98 2.0931,786.00LEGRAND SA EUR 633,554.30 1.3512,851.00SCHNEIDER ELECTRIC SE EUR 1,945,020.68 4.1232,569.00STMICROELECTRONICS NV EUR 458,698.38 0.9737,506.00
5,846,699.74 12.41
ABN AMRO GROUP NV-CVA EUR 1,089,934.56 2.3253,064.00Banks
BNP PARIBAS EUR 1,458,127.55 3.0936,938.00CAIXABANK EUR 967,877.09 2.06305,903.00CREDIT AGRICOLE SA EUR 1,482,358.28 3.14157,196.00UNICREDIT SPA EUR 761,372.98 1.6276,953.00
5,759,670.46 12.23
ALLIANZ AG REG EUR 1,487,288.88 3.168,492.00Insurance
AXA SA EUR 1,100,628.31 2.3458,364.00MUENCHENER RUECKVER AG-REG EUR 1,159,306.20 2.466,084.00
3,747,223.39 7.96
DANONE GROUPE EUR 919,574.50 1.9514,950.00Food services
DAVIDE CAMPARI-MILANO SPA EUR 809,041.52 1.72109,552.00KERRY GROUP PLC-A EUR 987,570.50 2.1011,417.00PERNOD RICARD SA EUR 993,355.60 2.116,932.00
3,709,542.12 7.88
COMPUGROUP MEDICAL SE EUR 436,792.44 0.9310,801.00Computer software
MICROSOFT CORP USD 650,389.19 1.387,320.00SALESFORCE.COM INC USD 636,832.92 1.355,315.00SAP SE EUR 1,232,406.61 2.6214,177.00UBISOFT ENTERTAINMENT EUR 582,587.68 1.248,266.00
3,539,008.84 7.52
ADIDAS AG EUR 966,720.00 2.055,300.00Textile
KERING EUR 733,882.80 1.561,783.00LVMH MOET HENNESSY LOUIS VUI EUR 1,504,015.00 3.205,825.00
3,204,617.80 6.81
CARL ZEISS MEDITEC AG - BR EUR 555,825.40 1.188,138.00Cosmetics
FRESENIUS MEDICAL CARE AG & EUR 1,026,996.48 2.1718,132.00LOREAL EUR 492,940.00 1.052,450.00MERCK KGAA EUR 694,645.60 1.487,720.00ORPEA EUR 295,764.30 0.633,315.00
3,066,171.78 6.51
KONINKLIJKE DSM EUR 639,388.00 1.368,950.00Chemical
UMICORE EUR 1,664,390.70 3.5347,745.002,303,778.70 4.89
NESTE OYJ EUR 575,928.00 1.228,550.00Energy
NEXTERA ENERGY PARTNERS LP USD 442,306.13 0.9411,745.00SIEMENS GAMESA RENEWABLE ENE EUR 1,273,820.80 2.71119,720.00
2,292,054.93 4.87
DEUTSCHE POST AG-REG EUR 1,308,689.94 2.7854,734.00Transportation
EASYJET PLC GBP 658,654.11 1.4053,500.001,967,344.05 4.18
CNH INDUSTRIAL NV EUR 719,983.37 1.5391,741.00Auto Parts & Equipment
CONTINENTAL AG EUR 215,659.50 0.461,786.00
NameQuantity/Nominal
Market valuein EUR
Currency %NAV
VOLKSWAGEN AG-PREF EUR 1,001,613.20 2.137,210.001,937,256.07 4.12
AMAZON.COM INC USD 446,721.60 0.95340.00Internet
ILIAD SA EUR 997,635.10 2.128,134.001,444,356.70 3.07
SIEMENS AG-REG EUR 1,151,128.98 2.4511,821.00Diversified machinery
1,151,128.98 2.45
EURONEXT NV - W/I EUR 623,166.70 1.3212,389.00Financial services
MASTERCARD INC - A USD 402,664.57 0.862,440.001,025,831.27 2.18
ORANGE EUR 946,813.80 2.0166,889.00Telecommunication
946,813.80 2.01
BUREAU VERITAS SA EUR 891,066.83 1.8950,074.00Diversified services
891,066.83 1.89
INSTONE REAL ESTATE GROUP AG EUR 199,200.00 0.4212,000.00Real estate
VONOVIA SE EUR 678,849.73 1.4517,147.00878,049.73 1.87
VIVENDI EUR 809,555.04 1.7238,043.00Media
809,555.04 1.72
ZALANDO SE EUR 90,096.60 0.194,015.00Distribution & Wholesale
90,096.60 0.19
44,610,266.83 94.76
UFG TRESORERIE - CLASSE I EUR 2,387,607.53 5.0722.10
Funds
Undertakings for collective investmentOpen-ended Funds
2,387,607.53 5.07
2,387,607.53 5.07
Total Securities Portfolio 46,997,874.36 99.83
NameQuantity/Nominal
Market valuein EUR
Currency %NAV
Summary of net assets%
NAV46,997,874.36 99.83Total Securities Portfolio
9,439.82 0.02Cash at bank and Bank Overdraft
69,551.65 0.15Other assets and liabilities
47,076,865.83 100.00Total net assets
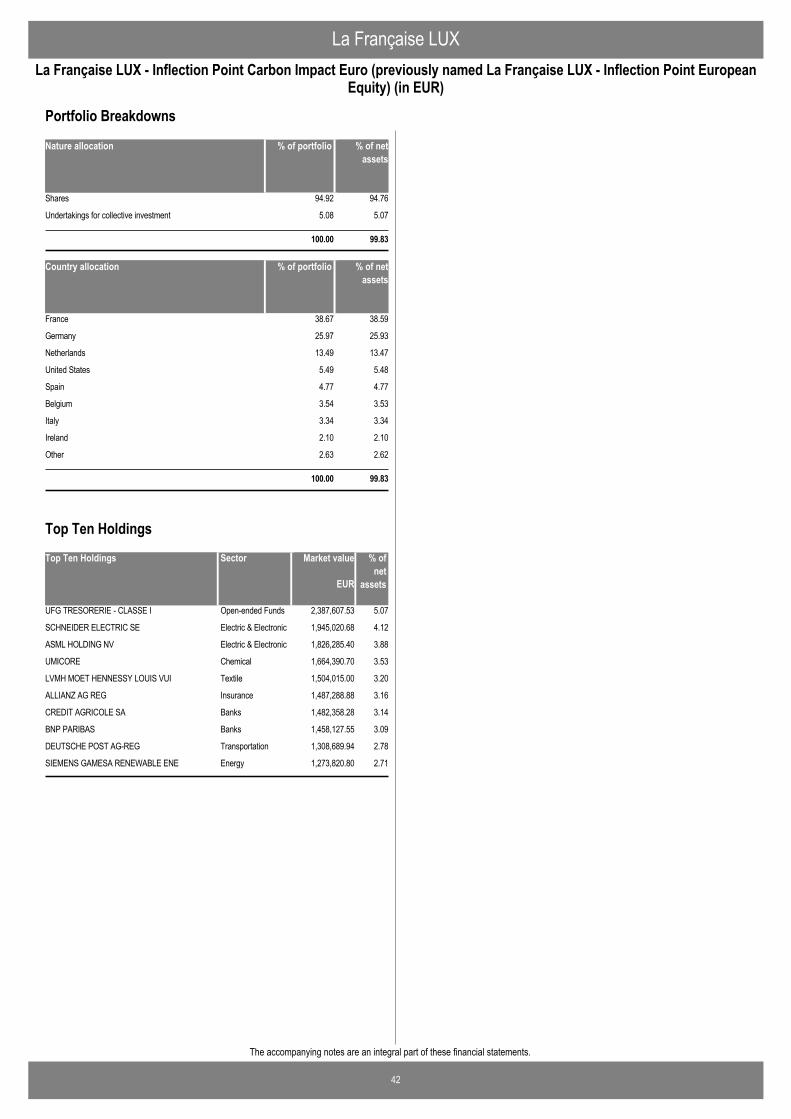
La Française LUX
42
La Française LUX - Inflection Point Carbon Impact Euro (previously named La Française LUX - Inflection Point EuropeanEquity) (in EUR)
The accompanying notes are an integral part of these financial statements.
Nature allocation % of portfolio % of netassets
Shares 94.92 94.76
Undertakings for collective investment 5.08 5.07
100.00 99.83
Country allocation % of portfolio % of netassets
France 38.67 38.59
Germany 25.97 25.93
Netherlands 13.49 13.47
United States 5.49 5.48
Spain 4.77 4.77
Belgium 3.54 3.53
Italy 3.34 3.34
Ireland 2.10 2.10
Other 2.63 2.62
100.00 99.83
Portfolio Breakdowns
Top Ten Holdings Market value % ofnet
assets
UFG TRESORERIE - CLASSE I 2,387,607.53 5.07Open-ended Funds
SCHNEIDER ELECTRIC SE 1,945,020.68 4.12Electric & Electronic
ASML HOLDING NV 1,826,285.40 3.88Electric & Electronic
UMICORE 1,664,390.70 3.53Chemical
LVMH MOET HENNESSY LOUIS VUI 1,504,015.00 3.20Textile
ALLIANZ AG REG 1,487,288.88 3.16Insurance
CREDIT AGRICOLE SA 1,482,358.28 3.14Banks
BNP PARIBAS 1,458,127.55 3.09Banks
DEUTSCHE POST AG-REG 1,308,689.94 2.78Transportation
SIEMENS GAMESA RENEWABLE ENE 1,273,820.80 2.71Energy
EUR
Sector
Top Ten Holdings
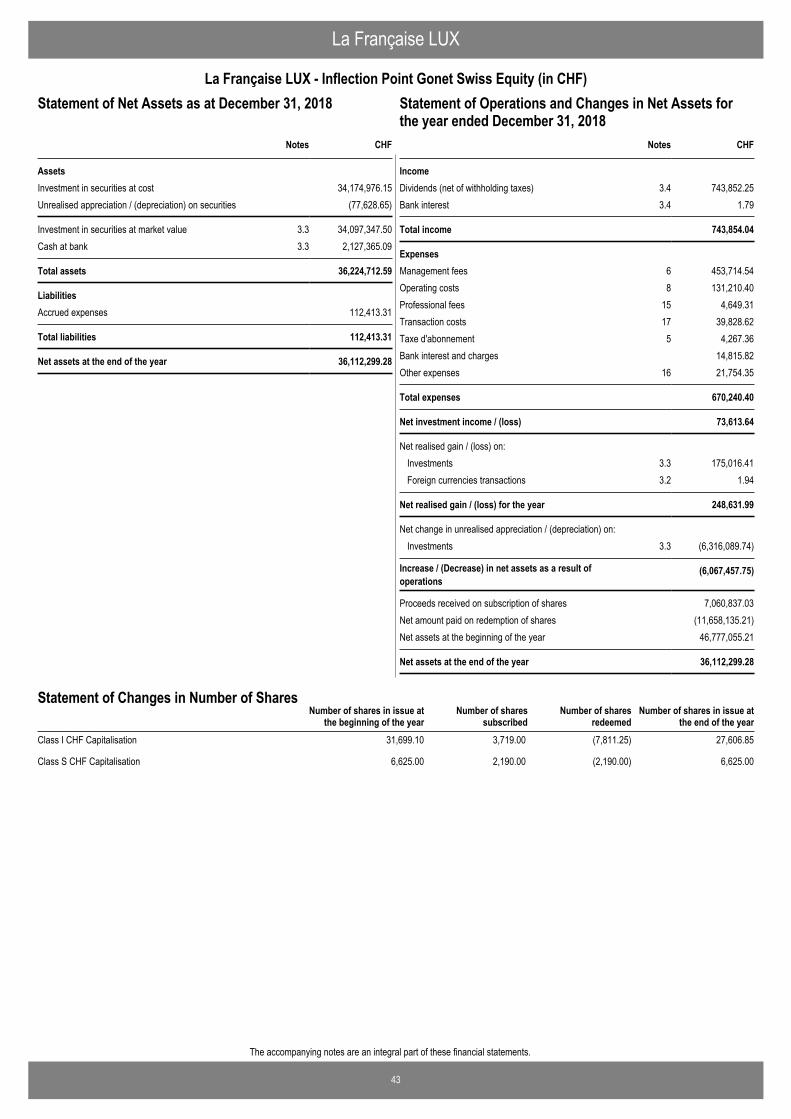
43
The accompanying notes are an integral part of these financial statements.
La Française LUX
La Française LUX - Inflection Point Gonet Swiss Equity (in CHF)Statement of Operations and Changes in Net Assets for theyear ended December 31, 2018
CHF
AssetsInvestment in securities at cost 34,174,976.15Unrealised appreciation / (depreciation) on securities (77,628.65)
Investment in securities at market value 3.3 34,097,347.50Cash at bank 3.3 2,127,365.09
Total assets 36,224,712.59
LiabilitiesAccrued expenses 112,413.31
Total liabilities 112,413.31
Net assets at the end of the year 36,112,299.28
Notes
Statement of Net Assets as at December 31, 2018
IncomeDividends (net of withholding taxes) 3.4 743,852.25Bank interest 3.4 1.79
Total income 743,854.04
ExpensesManagement fees 6 453,714.54Operating costs 8 131,210.40Professional fees 15 4,649.31Transaction costs 17 39,828.62Taxe d'abonnement 5 4,267.36Bank interest and charges 14,815.82Other expenses 16 21,754.35
Total expenses 670,240.40
Net investment income / (loss) 73,613.64
Net realised gain / (loss) on: Investments 3.3 175,016.41Foreign currencies transactions 3.2 1.94
Net realised gain / (loss) for the year 248,631.99
Net change in unrealised appreciation / (depreciation) on: Investments 3.3 (6,316,089.74)
Increase / (Decrease) in net assets as a result ofoperations
(6,067,457.75)
Proceeds received on subscription of shares 7,060,837.03Net amount paid on redemption of shares (11,658,135.21)Net assets at the beginning of the year 46,777,055.21
Net assets at the end of the year 36,112,299.28
CHFNotes
Statement of Operations and Changes in Net Assets forthe year ended December 31, 2018
Number of shares in issue atthe end of the year
Number of shares in issue atthe beginning of the year
Number of sharessubscribed
Number of sharesredeemed
Statement of Changes in Number of Shares
Class I CHF Capitalisation 31,699.10 3,719.00 (7,811.25) 27,606.85
Class S CHF Capitalisation 6,625.00 2,190.00 (2,190.00) 6,625.00
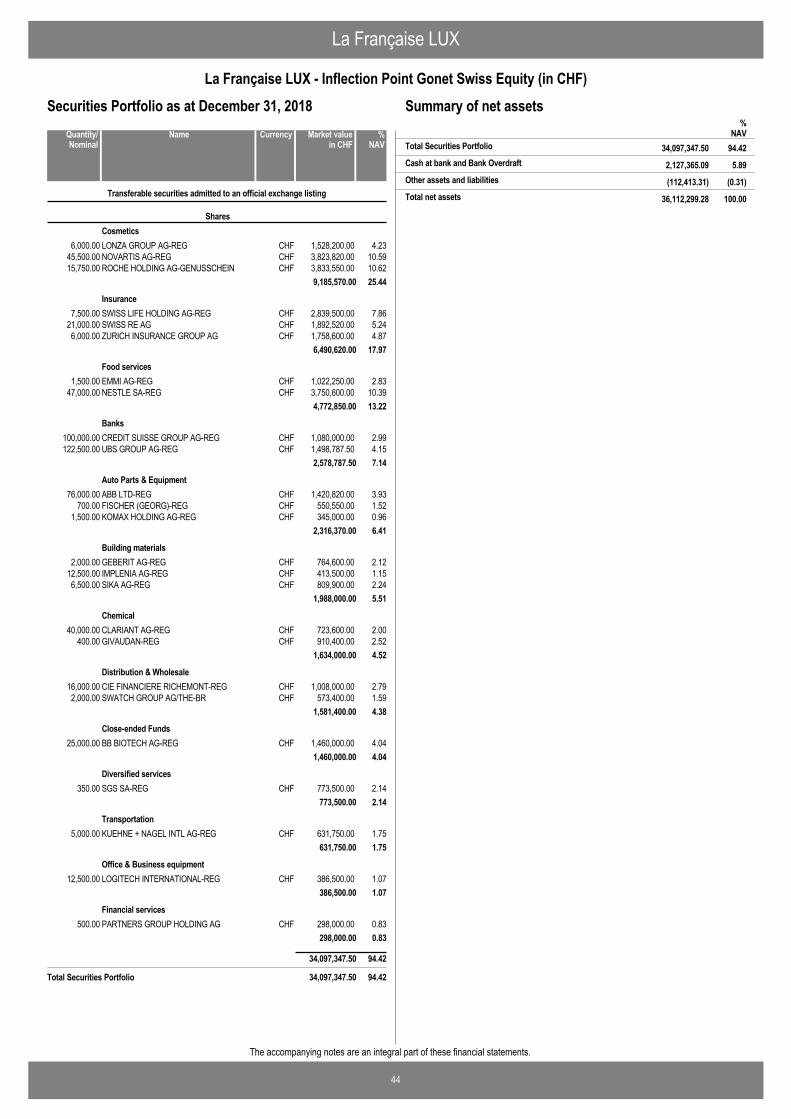
La Française LUX
44
La Française LUX - Inflection Point Gonet Swiss Equity (in CHF)
The accompanying notes are an integral part of these financial statements.
Securities Portfolio as at December 31, 2018
LONZA GROUP AG-REG CHF 1,528,200.00 4.236,000.00
Transferable securities admitted to an official exchange listing
SharesCosmetics
NOVARTIS AG-REG CHF 3,823,820.00 10.5945,500.00ROCHE HOLDING AG-GENUSSCHEIN CHF 3,833,550.00 10.6215,750.00
9,185,570.00 25.44
SWISS LIFE HOLDING AG-REG CHF 2,839,500.00 7.867,500.00Insurance
SWISS RE AG CHF 1,892,520.00 5.2421,000.00ZURICH INSURANCE GROUP AG CHF 1,758,600.00 4.876,000.00
6,490,620.00 17.97
EMMI AG-REG CHF 1,022,250.00 2.831,500.00Food services
NESTLE SA-REG CHF 3,750,600.00 10.3947,000.004,772,850.00 13.22
CREDIT SUISSE GROUP AG-REG CHF 1,080,000.00 2.99100,000.00Banks
UBS GROUP AG-REG CHF 1,498,787.50 4.15122,500.002,578,787.50 7.14
ABB LTD-REG CHF 1,420,820.00 3.9376,000.00Auto Parts & Equipment
FISCHER (GEORG)-REG CHF 550,550.00 1.52700.00KOMAX HOLDING AG-REG CHF 345,000.00 0.961,500.00
2,316,370.00 6.41
GEBERIT AG-REG CHF 764,600.00 2.122,000.00Building materials
IMPLENIA AG-REG CHF 413,500.00 1.1512,500.00SIKA AG-REG CHF 809,900.00 2.246,500.00
1,988,000.00 5.51
CLARIANT AG-REG CHF 723,600.00 2.0040,000.00Chemical
GIVAUDAN-REG CHF 910,400.00 2.52400.001,634,000.00 4.52
CIE FINANCIERE RICHEMONT-REG CHF 1,008,000.00 2.7916,000.00Distribution & Wholesale
SWATCH GROUP AG/THE-BR CHF 573,400.00 1.592,000.001,581,400.00 4.38
BB BIOTECH AG-REG CHF 1,460,000.00 4.0425,000.00Close-ended Funds
1,460,000.00 4.04
SGS SA-REG CHF 773,500.00 2.14350.00Diversified services
773,500.00 2.14
KUEHNE + NAGEL INTL AG-REG CHF 631,750.00 1.755,000.00Transportation
631,750.00 1.75
LOGITECH INTERNATIONAL-REG CHF 386,500.00 1.0712,500.00Office & Business equipment
386,500.00 1.07
PARTNERS GROUP HOLDING AG CHF 298,000.00 0.83500.00Financial services
298,000.00 0.83
34,097,347.50 94.42
Total Securities Portfolio 34,097,347.50 94.42
NameQuantity/Nominal
Market valuein CHF
Currency %NAV
Summary of net assets%
NAV34,097,347.50 94.42Total Securities Portfolio
2,127,365.09 5.89Cash at bank and Bank Overdraft
(112,413.31) (0.31)Other assets and liabilities
36,112,299.28 100.00Total net assets
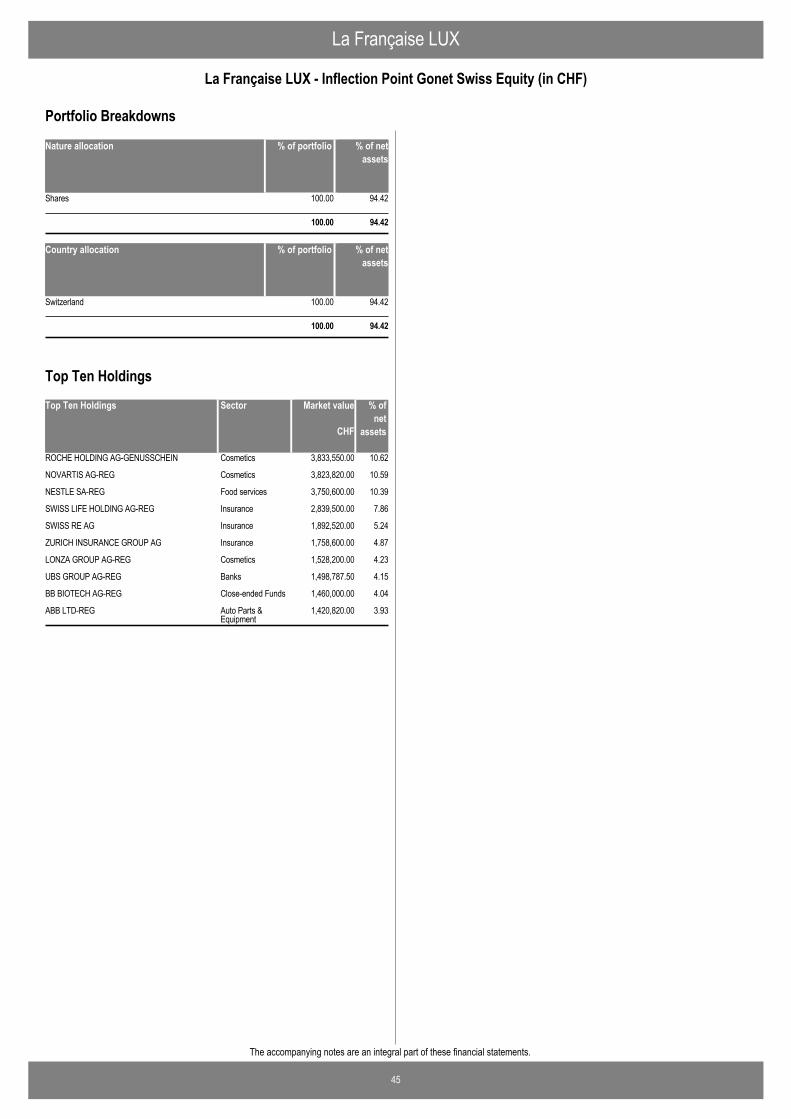
La Française LUX
45
La Française LUX - Inflection Point Gonet Swiss Equity (in CHF)
The accompanying notes are an integral part of these financial statements.
Nature allocation % of portfolio % of netassets
Shares 100.00 94.42
100.00 94.42
Country allocation % of portfolio % of netassets
Switzerland 100.00 94.42
100.00 94.42
Portfolio Breakdowns
Top Ten Holdings Market value % ofnet
assets
ROCHE HOLDING AG-GENUSSCHEIN 3,833,550.00 10.62Cosmetics
NOVARTIS AG-REG 3,823,820.00 10.59Cosmetics
NESTLE SA-REG 3,750,600.00 10.39Food services
SWISS LIFE HOLDING AG-REG 2,839,500.00 7.86Insurance
SWISS RE AG 1,892,520.00 5.24Insurance
ZURICH INSURANCE GROUP AG 1,758,600.00 4.87Insurance
LONZA GROUP AG-REG 1,528,200.00 4.23Cosmetics
UBS GROUP AG-REG 1,498,787.50 4.15Banks
BB BIOTECH AG-REG 1,460,000.00 4.04Close-ended Funds
ABB LTD-REG 1,420,820.00 3.93Auto Parts &Equipment
CHF
Sector
Top Ten Holdings
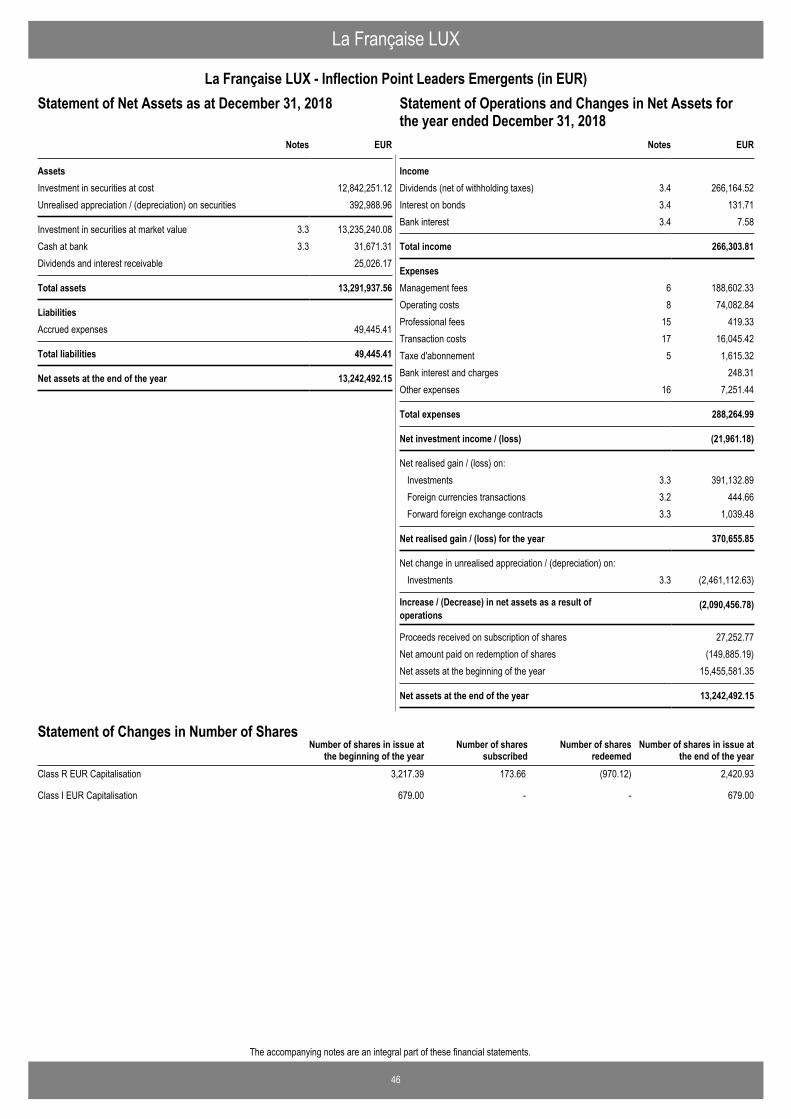
46
The accompanying notes are an integral part of these financial statements.
La Française LUX
La Française LUX - Inflection Point Leaders Emergents (in EUR)Statement of Operations and Changes in Net Assets for theyear ended December 31, 2018
EUR
AssetsInvestment in securities at cost 12,842,251.12Unrealised appreciation / (depreciation) on securities 392,988.96
Investment in securities at market value 3.3 13,235,240.08Cash at bank 3.3 31,671.31Dividends and interest receivable 25,026.17
Total assets 13,291,937.56
LiabilitiesAccrued expenses 49,445.41
Total liabilities 49,445.41
Net assets at the end of the year 13,242,492.15
Notes
Statement of Net Assets as at December 31, 2018
IncomeDividends (net of withholding taxes) 3.4 266,164.52Interest on bonds 3.4 131.71Bank interest 3.4 7.58
Total income 266,303.81
ExpensesManagement fees 6 188,602.33Operating costs 8 74,082.84Professional fees 15 419.33Transaction costs 17 16,045.42Taxe d'abonnement 5 1,615.32Bank interest and charges 248.31Other expenses 16 7,251.44
Total expenses 288,264.99
Net investment income / (loss) (21,961.18)
Net realised gain / (loss) on: Investments 3.3 391,132.89Foreign currencies transactions 3.2 444.66Forward foreign exchange contracts 3.3 1,039.48
Net realised gain / (loss) for the year 370,655.85
Net change in unrealised appreciation / (depreciation) on: Investments 3.3 (2,461,112.63)
Increase / (Decrease) in net assets as a result ofoperations
(2,090,456.78)
Proceeds received on subscription of shares 27,252.77Net amount paid on redemption of shares (149,885.19)Net assets at the beginning of the year 15,455,581.35
Net assets at the end of the year 13,242,492.15
EURNotes
Statement of Operations and Changes in Net Assets forthe year ended December 31, 2018
Number of shares in issue atthe end of the year
Number of shares in issue atthe beginning of the year
Number of sharessubscribed
Number of sharesredeemed
Statement of Changes in Number of Shares
Class R EUR Capitalisation 3,217.39 173.66 (970.12) 2,420.93
Class I EUR Capitalisation 679.00 - - 679.00
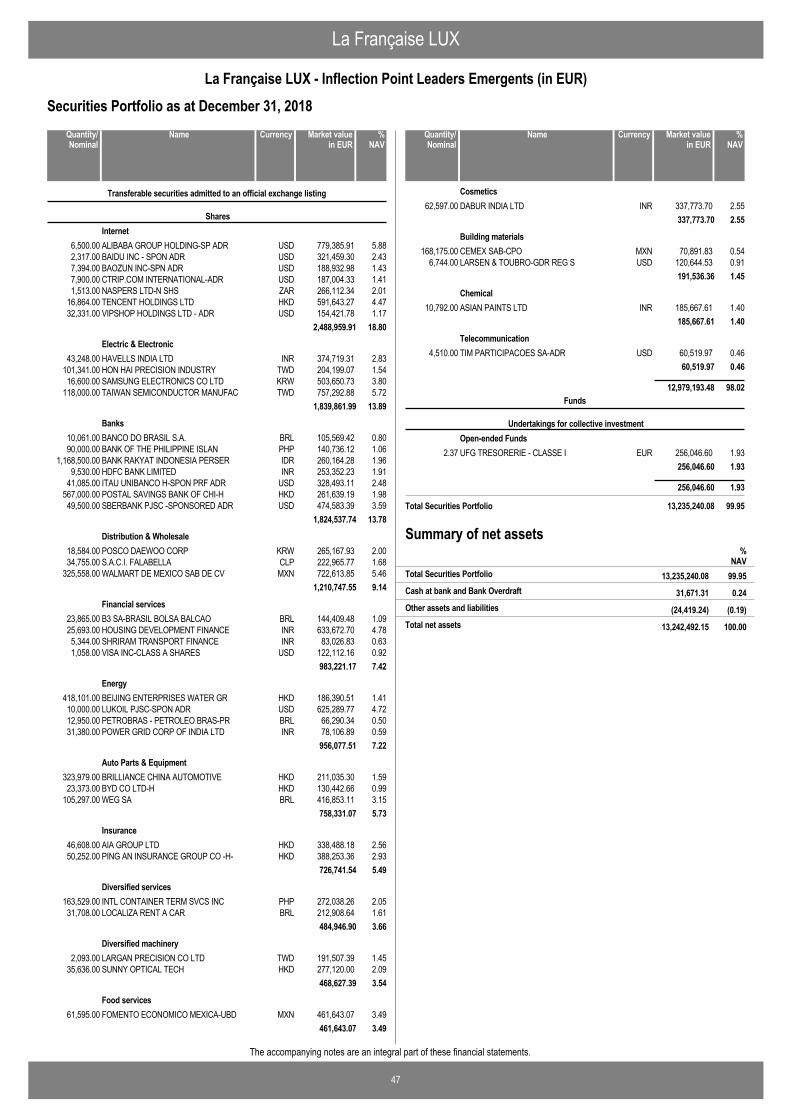
La Française LUX
47
La Française LUX - Inflection Point Leaders Emergents (in EUR)
The accompanying notes are an integral part of these financial statements.
Securities Portfolio as at December 31, 2018
ALIBABA GROUP HOLDING-SP ADR USD 779,385.91 5.886,500.00
Transferable securities admitted to an official exchange listing
SharesInternet
BAIDU INC - SPON ADR USD 321,459.30 2.432,317.00BAOZUN INC-SPN ADR USD 188,932.98 1.437,394.00CTRIP.COM INTERNATIONAL-ADR USD 187,004.33 1.417,900.00NASPERS LTD-N SHS ZAR 266,112.34 2.011,513.00TENCENT HOLDINGS LTD HKD 591,643.27 4.4716,864.00VIPSHOP HOLDINGS LTD - ADR USD 154,421.78 1.1732,331.00
2,488,959.91 18.80
HAVELLS INDIA LTD INR 374,719.31 2.8343,248.00Electric & Electronic
HON HAI PRECISION INDUSTRY TWD 204,199.07 1.54101,341.00SAMSUNG ELECTRONICS CO LTD KRW 503,650.73 3.8016,600.00TAIWAN SEMICONDUCTOR MANUFAC TWD 757,292.88 5.72118,000.00
1,839,861.99 13.89
BANCO DO BRASIL S.A. BRL 105,569.42 0.8010,061.00Banks
BANK OF THE PHILIPPINE ISLAN PHP 140,736.12 1.0690,000.00BANK RAKYAT INDONESIA PERSER IDR 260,164.28 1.961,168,500.00HDFC BANK LIMITED INR 253,352.23 1.919,530.00ITAU UNIBANCO H-SPON PRF ADR USD 328,493.11 2.4841,085.00POSTAL SAVINGS BANK OF CHI-H HKD 261,639.19 1.98567,000.00SBERBANK PJSC -SPONSORED ADR USD 474,583.39 3.5949,500.00
1,824,537.74 13.78
POSCO DAEWOO CORP KRW 265,167.93 2.0018,584.00Distribution & Wholesale
S.A.C.I. FALABELLA CLP 222,965.77 1.6834,755.00WALMART DE MEXICO SAB DE CV MXN 722,613.85 5.46325,558.00
1,210,747.55 9.14
B3 SA-BRASIL BOLSA BALCAO BRL 144,409.48 1.0923,865.00Financial services
HOUSING DEVELOPMENT FINANCE INR 633,672.70 4.7825,693.00SHRIRAM TRANSPORT FINANCE INR 83,026.83 0.635,344.00VISA INC-CLASS A SHARES USD 122,112.16 0.921,058.00
983,221.17 7.42
BEIJING ENTERPRISES WATER GR HKD 186,390.51 1.41418,101.00Energy
LUKOIL PJSC-SPON ADR USD 625,289.77 4.7210,000.00PETROBRAS - PETROLEO BRAS-PR BRL 66,290.34 0.5012,950.00POWER GRID CORP OF INDIA LTD INR 78,106.89 0.5931,380.00
956,077.51 7.22
BRILLIANCE CHINA AUTOMOTIVE HKD 211,035.30 1.59323,979.00Auto Parts & Equipment
BYD CO LTD-H HKD 130,442.66 0.9923,373.00WEG SA BRL 416,853.11 3.15105,297.00
758,331.07 5.73
AIA GROUP LTD HKD 338,488.18 2.5646,608.00Insurance
PING AN INSURANCE GROUP CO -H- HKD 388,253.36 2.9350,252.00726,741.54 5.49
INTL CONTAINER TERM SVCS INC PHP 272,038.26 2.05163,529.00Diversified services
LOCALIZA RENT A CAR BRL 212,908.64 1.6131,708.00484,946.90 3.66
LARGAN PRECISION CO LTD TWD 191,507.39 1.452,093.00Diversified machinery
SUNNY OPTICAL TECH HKD 277,120.00 2.0935,636.00468,627.39 3.54
FOMENTO ECONOMICO MEXICA-UBD MXN 461,643.07 3.4961,595.00Food services
461,643.07 3.49
NameQuantity/Nominal
Market valuein EUR
Currency %NAV
DABUR INDIA LTD INR 337,773.70 2.5562,597.00Cosmetics
337,773.70 2.55
CEMEX SAB-CPO MXN 70,891.83 0.54168,175.00Building materials
LARSEN & TOUBRO-GDR REG S USD 120,644.53 0.916,744.00191,536.36 1.45
ASIAN PAINTS LTD INR 185,667.61 1.4010,792.00Chemical
185,667.61 1.40
TIM PARTICIPACOES SA-ADR USD 60,519.97 0.464,510.00Telecommunication
60,519.97 0.46
12,979,193.48 98.02
UFG TRESORERIE - CLASSE I EUR 256,046.60 1.932.37
Funds
Undertakings for collective investmentOpen-ended Funds
256,046.60 1.93
256,046.60 1.93
Total Securities Portfolio 13,235,240.08 99.95
NameQuantity/Nominal
Market valuein EUR
Currency %NAV
Summary of net assets%
NAV13,235,240.08 99.95Total Securities Portfolio
31,671.31 0.24Cash at bank and Bank Overdraft
(24,419.24) (0.19)Other assets and liabilities
13,242,492.15 100.00Total net assets
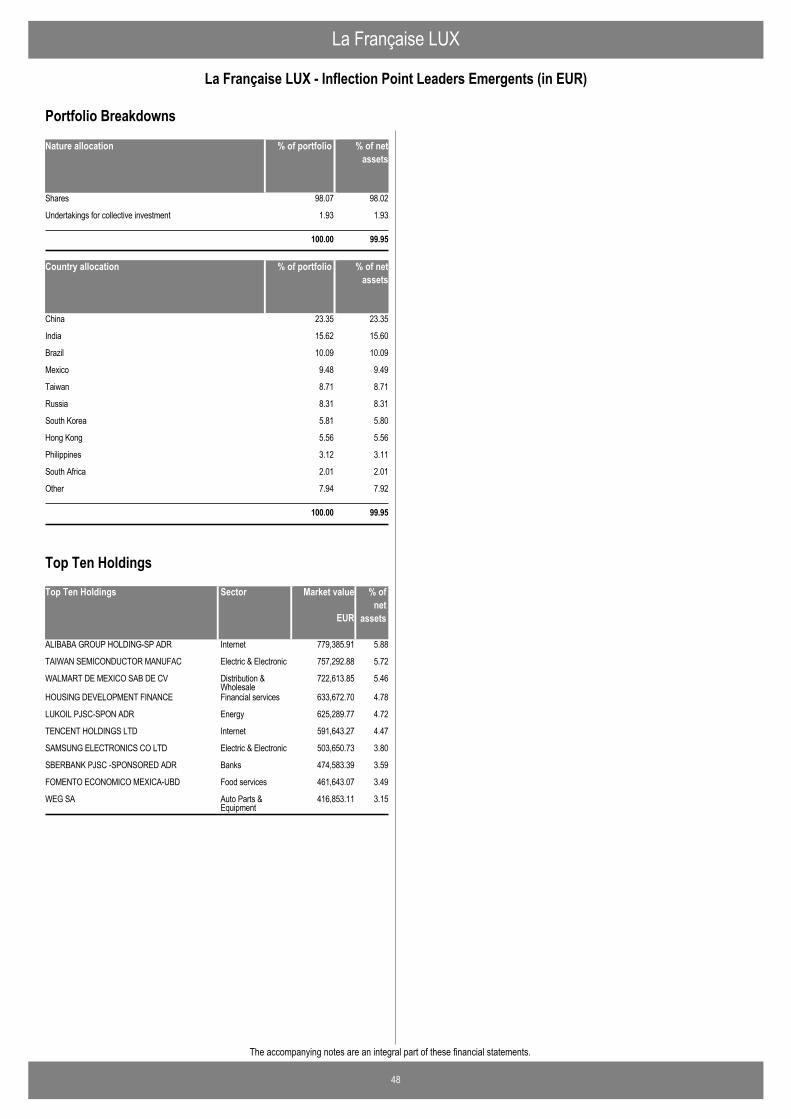
La Française LUX
48
La Française LUX - Inflection Point Leaders Emergents (in EUR)
The accompanying notes are an integral part of these financial statements.
Nature allocation % of portfolio % of netassets
Shares 98.07 98.02
Undertakings for collective investment 1.93 1.93
100.00 99.95
Country allocation % of portfolio % of netassets
China 23.35 23.35
India 15.62 15.60
Brazil 10.09 10.09
Mexico 9.48 9.49
Taiwan 8.71 8.71
Russia 8.31 8.31
South Korea 5.81 5.80
Hong Kong 5.56 5.56
Philippines 3.12 3.11
South Africa 2.01 2.01
Other 7.94 7.92
100.00 99.95
Portfolio Breakdowns
Top Ten Holdings Market value % ofnet
assets
ALIBABA GROUP HOLDING-SP ADR 779,385.91 5.88Internet
TAIWAN SEMICONDUCTOR MANUFAC 757,292.88 5.72Electric & Electronic
WALMART DE MEXICO SAB DE CV 722,613.85 5.46Distribution &Wholesale
HOUSING DEVELOPMENT FINANCE 633,672.70 4.78Financial services
LUKOIL PJSC-SPON ADR 625,289.77 4.72Energy
TENCENT HOLDINGS LTD 591,643.27 4.47Internet
SAMSUNG ELECTRONICS CO LTD 503,650.73 3.80Electric & Electronic
SBERBANK PJSC -SPONSORED ADR 474,583.39 3.59Banks
FOMENTO ECONOMICO MEXICA-UBD 461,643.07 3.49Food services
WEG SA 416,853.11 3.15Auto Parts &Equipment
EUR
Sector
Top Ten Holdings
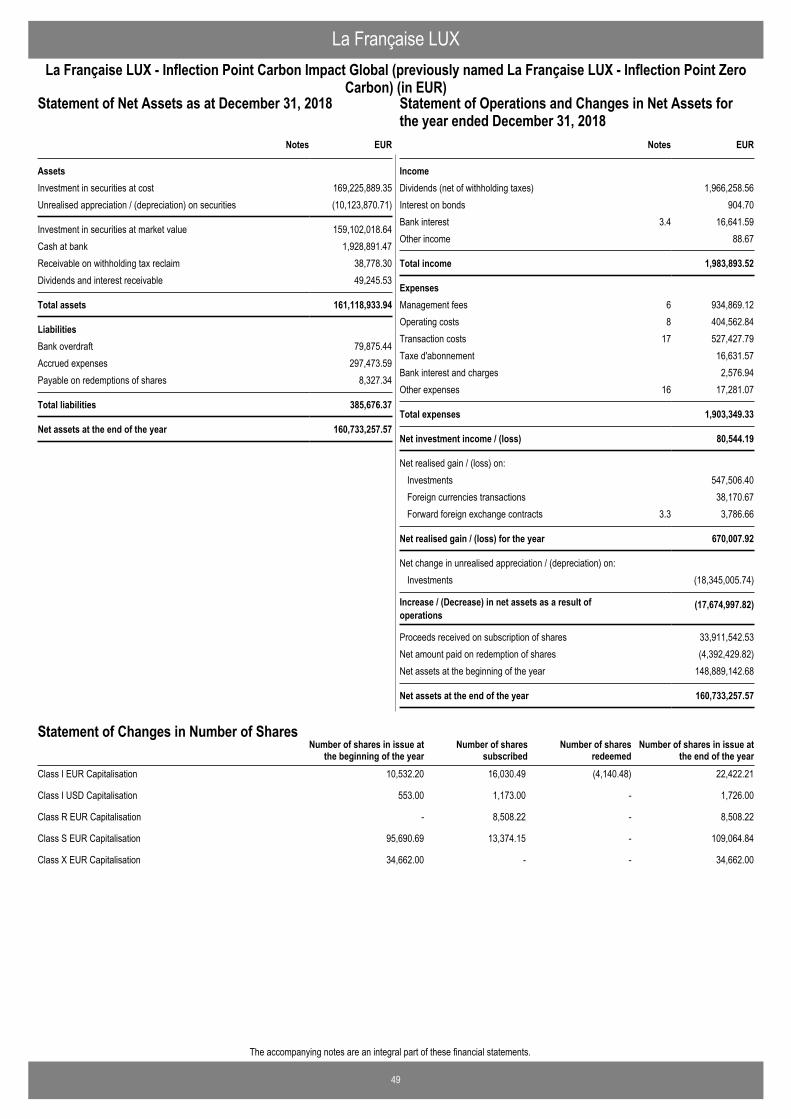
49
The accompanying notes are an integral part of these financial statements.
La Française LUXLa Française LUX - Inflection Point Carbon Impact Global (previously named La Française LUX - Inflection Point Zero
Carbon) (in EUR)Statement of Operations and Changes in Net Assets for theyear ended December 31, 2018
EUR
AssetsInvestment in securities at cost 169,225,889.35Unrealised appreciation / (depreciation) on securities (10,123,870.71)
Investment in securities at market value 159,102,018.64Cash at bank 1,928,891.47Receivable on withholding tax reclaim 38,778.30Dividends and interest receivable 49,245.53
Total assets 161,118,933.94
LiabilitiesBank overdraft 79,875.44Accrued expenses 297,473.59Payable on redemptions of shares 8,327.34
Total liabilities 385,676.37
Net assets at the end of the year 160,733,257.57
Notes
Statement of Net Assets as at December 31, 2018
IncomeDividends (net of withholding taxes) 1,966,258.56Interest on bonds 904.70Bank interest 3.4 16,641.59Other income 88.67
Total income 1,983,893.52
ExpensesManagement fees 6 934,869.12Operating costs 8 404,562.84Transaction costs 17 527,427.79Taxe d'abonnement 16,631.57Bank interest and charges 2,576.94Other expenses 16 17,281.07
Total expenses 1,903,349.33
Net investment income / (loss) 80,544.19
Net realised gain / (loss) on: Investments 547,506.40Foreign currencies transactions 38,170.67Forward foreign exchange contracts 3.3 3,786.66
Net realised gain / (loss) for the year 670,007.92
Net change in unrealised appreciation / (depreciation) on: Investments (18,345,005.74)
Increase / (Decrease) in net assets as a result ofoperations
(17,674,997.82)
Proceeds received on subscription of shares 33,911,542.53Net amount paid on redemption of shares (4,392,429.82)Net assets at the beginning of the year 148,889,142.68
Net assets at the end of the year 160,733,257.57
EURNotes
Statement of Operations and Changes in Net Assets forthe year ended December 31, 2018
Number of shares in issue atthe end of the year
Number of shares in issue atthe beginning of the year
Number of sharessubscribed
Number of sharesredeemed
Statement of Changes in Number of Shares
Class I EUR Capitalisation 10,532.20 16,030.49 (4,140.48) 22,422.21
Class I USD Capitalisation 553.00 1,173.00 - 1,726.00
Class R EUR Capitalisation - 8,508.22 - 8,508.22
Class S EUR Capitalisation 95,690.69 13,374.15 - 109,064.84
Class X EUR Capitalisation 34,662.00 - - 34,662.00
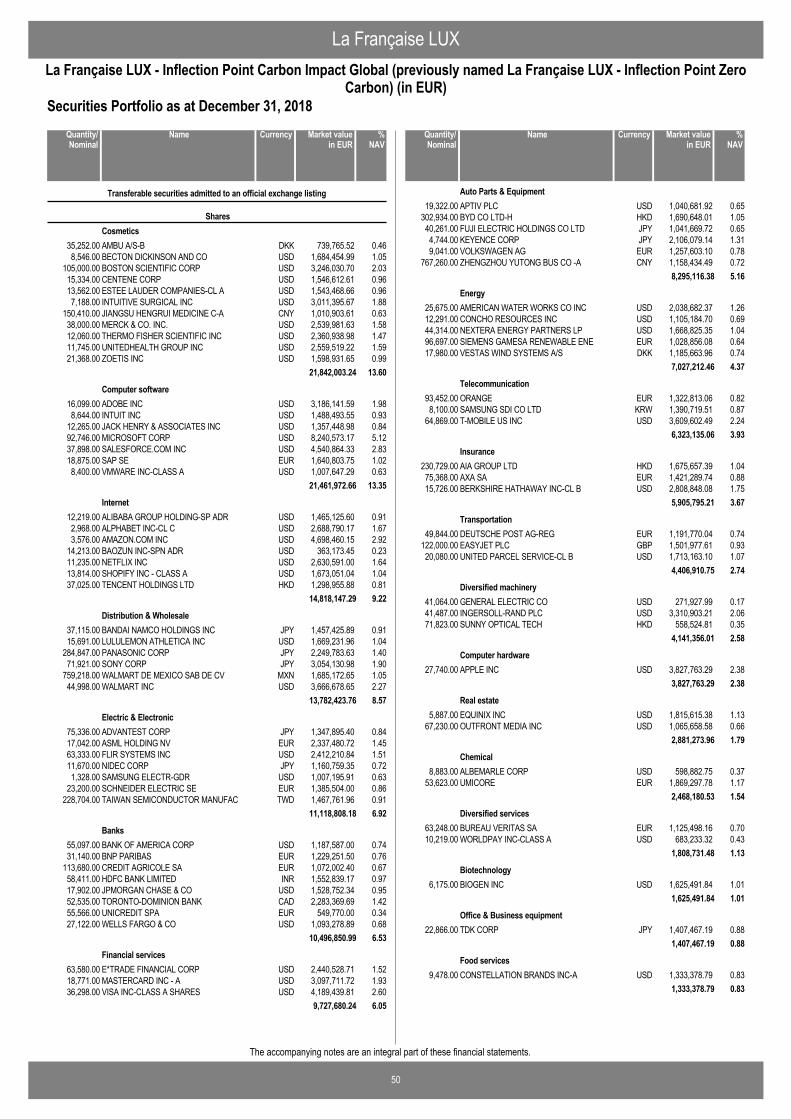
La Française LUX
50
La Française LUX - Inflection Point Carbon Impact Global (previously named La Française LUX - Inflection Point ZeroCarbon) (in EUR)
The accompanying notes are an integral part of these financial statements.
Securities Portfolio as at December 31, 2018
AMBU A/S-B DKK 739,765.52 0.4635,252.00
Transferable securities admitted to an official exchange listing
SharesCosmetics
BECTON DICKINSON AND CO USD 1,684,454.99 1.058,546.00BOSTON SCIENTIFIC CORP USD 3,246,030.70 2.03105,000.00CENTENE CORP USD 1,546,612.61 0.9615,334.00ESTEE LAUDER COMPANIES-CL A USD 1,543,468.66 0.9613,562.00INTUITIVE SURGICAL INC USD 3,011,395.67 1.887,188.00JIANGSU HENGRUI MEDICINE C-A CNY 1,010,903.61 0.63150,410.00MERCK & CO. INC. USD 2,539,981.63 1.5838,000.00THERMO FISHER SCIENTIFIC INC USD 2,360,938.98 1.4712,060.00UNITEDHEALTH GROUP INC USD 2,559,519.22 1.5911,745.00ZOETIS INC USD 1,598,931.65 0.9921,368.00
21,842,003.24 13.60
ADOBE INC USD 3,186,141.59 1.9816,099.00Computer software
INTUIT INC USD 1,488,493.55 0.938,644.00JACK HENRY & ASSOCIATES INC USD 1,357,448.98 0.8412,265.00MICROSOFT CORP USD 8,240,573.17 5.1292,746.00SALESFORCE.COM INC USD 4,540,864.33 2.8337,898.00SAP SE EUR 1,640,803.75 1.0218,875.00VMWARE INC-CLASS A USD 1,007,647.29 0.638,400.00
21,461,972.66 13.35
ALIBABA GROUP HOLDING-SP ADR USD 1,465,125.60 0.9112,219.00Internet
ALPHABET INC-CL C USD 2,688,790.17 1.672,968.00AMAZON.COM INC USD 4,698,460.15 2.923,576.00BAOZUN INC-SPN ADR USD 363,173.45 0.2314,213.00NETFLIX INC USD 2,630,591.00 1.6411,235.00SHOPIFY INC - CLASS A USD 1,673,051.04 1.0413,814.00TENCENT HOLDINGS LTD HKD 1,298,955.88 0.8137,025.00
14,818,147.29 9.22
BANDAI NAMCO HOLDINGS INC JPY 1,457,425.89 0.9137,115.00Distribution & Wholesale
LULULEMON ATHLETICA INC USD 1,669,231.96 1.0415,691.00PANASONIC CORP JPY 2,249,783.63 1.40284,847.00SONY CORP JPY 3,054,130.98 1.9071,921.00WALMART DE MEXICO SAB DE CV MXN 1,685,172.65 1.05759,218.00WALMART INC USD 3,666,678.65 2.2744,998.00
13,782,423.76 8.57
ADVANTEST CORP JPY 1,347,895.40 0.8475,336.00Electric & Electronic
ASML HOLDING NV EUR 2,337,480.72 1.4517,042.00FLIR SYSTEMS INC USD 2,412,210.84 1.5163,333.00NIDEC CORP JPY 1,160,759.35 0.7211,670.00SAMSUNG ELECTR-GDR USD 1,007,195.91 0.631,328.00SCHNEIDER ELECTRIC SE EUR 1,385,504.00 0.8623,200.00TAIWAN SEMICONDUCTOR MANUFAC TWD 1,467,761.96 0.91228,704.00
11,118,808.18 6.92
BANK OF AMERICA CORP USD 1,187,587.00 0.7455,097.00Banks
BNP PARIBAS EUR 1,229,251.50 0.7631,140.00CREDIT AGRICOLE SA EUR 1,072,002.40 0.67113,680.00HDFC BANK LIMITED INR 1,552,839.17 0.9758,411.00JPMORGAN CHASE & CO USD 1,528,752.34 0.9517,902.00TORONTO-DOMINION BANK CAD 2,283,369.69 1.4252,535.00UNICREDIT SPA EUR 549,770.00 0.3455,566.00WELLS FARGO & CO USD 1,093,278.89 0.6827,122.00
10,496,850.99 6.53
E*TRADE FINANCIAL CORP USD 2,440,528.71 1.5263,580.00Financial services
MASTERCARD INC - A USD 3,097,711.72 1.9318,771.00VISA INC-CLASS A SHARES USD 4,189,439.81 2.6036,298.00
9,727,680.24 6.05
NameQuantity/Nominal
Market valuein EUR
Currency %NAV
APTIV PLC USD 1,040,681.92 0.6519,322.00Auto Parts & Equipment
BYD CO LTD-H HKD 1,690,648.01 1.05302,934.00FUJI ELECTRIC HOLDINGS CO LTD JPY 1,041,669.72 0.6540,261.00KEYENCE CORP JPY 2,106,079.14 1.314,744.00VOLKSWAGEN AG EUR 1,257,603.10 0.789,041.00ZHENGZHOU YUTONG BUS CO -A CNY 1,158,434.49 0.72767,260.00
8,295,116.38 5.16
AMERICAN WATER WORKS CO INC USD 2,038,682.37 1.2625,675.00Energy
CONCHO RESOURCES INC USD 1,105,184.70 0.6912,291.00NEXTERA ENERGY PARTNERS LP USD 1,668,825.35 1.0444,314.00SIEMENS GAMESA RENEWABLE ENE EUR 1,028,856.08 0.6496,697.00VESTAS WIND SYSTEMS A/S DKK 1,185,663.96 0.7417,980.00
7,027,212.46 4.37
ORANGE EUR 1,322,813.06 0.8293,452.00Telecommunication
SAMSUNG SDI CO LTD KRW 1,390,719.51 0.878,100.00T-MOBILE US INC USD 3,609,602.49 2.2464,869.00
6,323,135.06 3.93
AIA GROUP LTD HKD 1,675,657.39 1.04230,729.00Insurance
AXA SA EUR 1,421,289.74 0.8875,368.00BERKSHIRE HATHAWAY INC-CL B USD 2,808,848.08 1.7515,726.00
5,905,795.21 3.67
DEUTSCHE POST AG-REG EUR 1,191,770.04 0.7449,844.00Transportation
EASYJET PLC GBP 1,501,977.61 0.93122,000.00UNITED PARCEL SERVICE-CL B USD 1,713,163.10 1.0720,080.00
4,406,910.75 2.74
GENERAL ELECTRIC CO USD 271,927.99 0.1741,064.00Diversified machinery
INGERSOLL-RAND PLC USD 3,310,903.21 2.0641,487.00SUNNY OPTICAL TECH HKD 558,524.81 0.3571,823.00
4,141,356.01 2.58
APPLE INC USD 3,827,763.29 2.3827,740.00Computer hardware
3,827,763.29 2.38
EQUINIX INC USD 1,815,615.38 1.135,887.00Real estate
OUTFRONT MEDIA INC USD 1,065,658.58 0.6667,230.002,881,273.96 1.79
ALBEMARLE CORP USD 598,882.75 0.378,883.00Chemical
UMICORE EUR 1,869,297.78 1.1753,623.002,468,180.53 1.54
BUREAU VERITAS SA EUR 1,125,498.16 0.7063,248.00Diversified services
WORLDPAY INC-CLASS A USD 683,233.32 0.4310,219.001,808,731.48 1.13
BIOGEN INC USD 1,625,491.84 1.016,175.00Biotechnology
1,625,491.84 1.01
TDK CORP JPY 1,407,467.19 0.8822,866.00Office & Business equipment
1,407,467.19 0.88
CONSTELLATION BRANDS INC-A USD 1,333,378.79 0.839,478.00Food services
1,333,378.79 0.83
NameQuantity/Nominal
Market valuein EUR
Currency %NAV
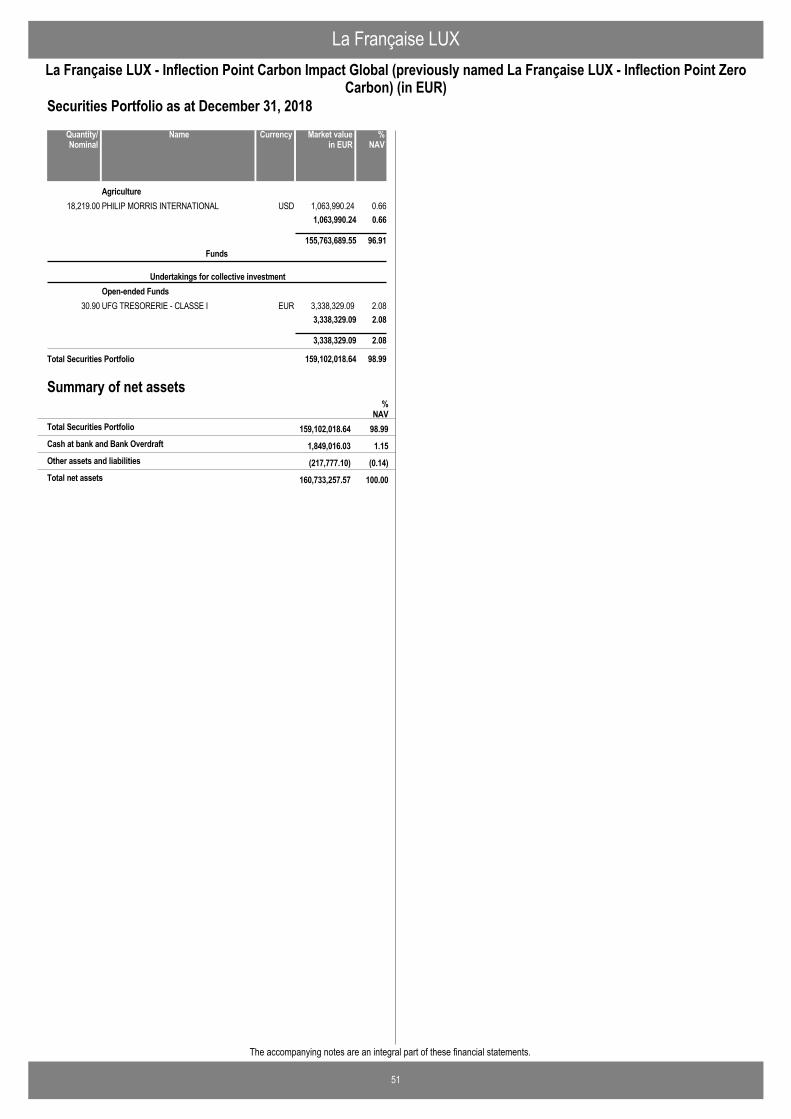
La Française LUX
51
La Française LUX - Inflection Point Carbon Impact Global (previously named La Française LUX - Inflection Point ZeroCarbon) (in EUR)
The accompanying notes are an integral part of these financial statements.
Securities Portfolio as at December 31, 2018
PHILIP MORRIS INTERNATIONAL USD 1,063,990.24 0.6618,219.00Agriculture
1,063,990.24 0.66
155,763,689.55 96.91
UFG TRESORERIE - CLASSE I EUR 3,338,329.09 2.0830.90
Funds
Undertakings for collective investmentOpen-ended Funds
3,338,329.09 2.08
3,338,329.09 2.08
Total Securities Portfolio 159,102,018.64 98.99
NameQuantity/Nominal
Market valuein EUR
Currency %NAV
Summary of net assets%
NAV159,102,018.64 98.99Total Securities Portfolio
1,849,016.03 1.15Cash at bank and Bank Overdraft
(217,777.10) (0.14)Other assets and liabilities
160,733,257.57 100.00Total net assets
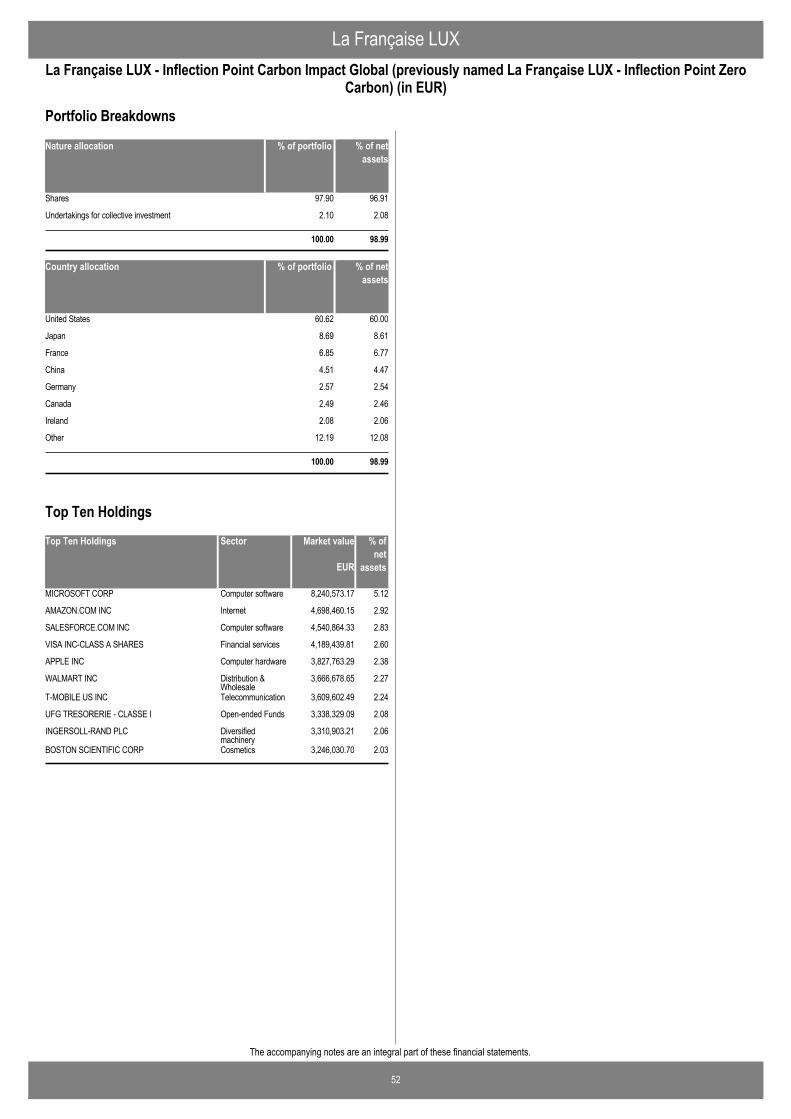
La Française LUX
52
La Française LUX - Inflection Point Carbon Impact Global (previously named La Française LUX - Inflection Point ZeroCarbon) (in EUR)
The accompanying notes are an integral part of these financial statements.
Nature allocation % of portfolio % of netassets
Shares 97.90 96.91
Undertakings for collective investment 2.10 2.08
100.00 98.99
Country allocation % of portfolio % of netassets
United States 60.62 60.00
Japan 8.69 8.61
France 6.85 6.77
China 4.51 4.47
Germany 2.57 2.54
Canada 2.49 2.46
Ireland 2.08 2.06
Other 12.19 12.08
100.00 98.99
Portfolio Breakdowns
Top Ten Holdings Market value % ofnet
assets
MICROSOFT CORP 8,240,573.17 5.12Computer software
AMAZON.COM INC 4,698,460.15 2.92Internet
SALESFORCE.COM INC 4,540,864.33 2.83Computer software
VISA INC-CLASS A SHARES 4,189,439.81 2.60Financial services
APPLE INC 3,827,763.29 2.38Computer hardware
WALMART INC 3,666,678.65 2.27Distribution &Wholesale
T-MOBILE US INC 3,609,602.49 2.24Telecommunication
UFG TRESORERIE - CLASSE I 3,338,329.09 2.08Open-ended Funds
INGERSOLL-RAND PLC 3,310,903.21 2.06Diversifiedmachinery
BOSTON SCIENTIFIC CORP 3,246,030.70 2.03Cosmetics
EUR
Sector
Top Ten Holdings
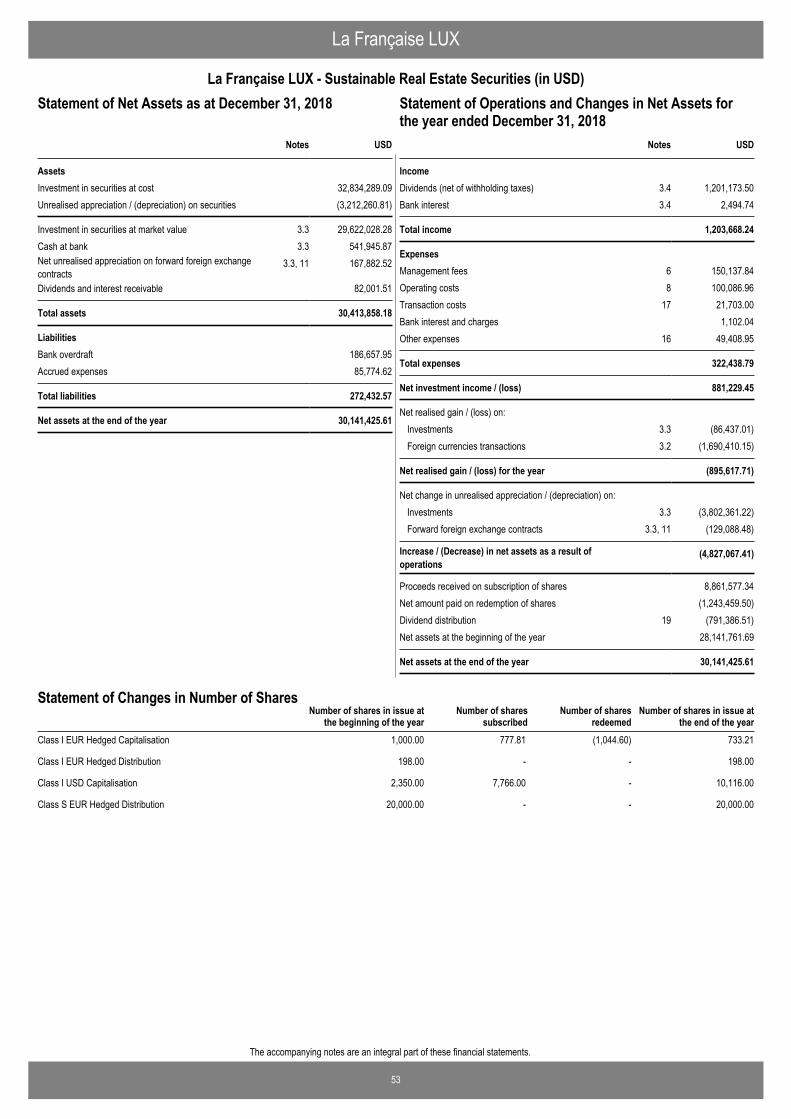
53
The accompanying notes are an integral part of these financial statements.
La Française LUX
La Française LUX - Sustainable Real Estate Securities (in USD)Statement of Operations and Changes in Net Assets for theyear ended December 31, 2018
USD
AssetsInvestment in securities at cost 32,834,289.09Unrealised appreciation / (depreciation) on securities (3,212,260.81)
Investment in securities at market value 3.3 29,622,028.28Cash at bank 3.3 541,945.87Net unrealised appreciation on forward foreign exchangecontracts
3.3, 11 167,882.52
Dividends and interest receivable 82,001.51
Total assets 30,413,858.18
LiabilitiesBank overdraft 186,657.95Accrued expenses 85,774.62
Total liabilities 272,432.57
Net assets at the end of the year 30,141,425.61
Notes
Statement of Net Assets as at December 31, 2018
IncomeDividends (net of withholding taxes) 3.4 1,201,173.50Bank interest 3.4 2,494.74
Total income 1,203,668.24
ExpensesManagement fees 6 150,137.84Operating costs 8 100,086.96Transaction costs 17 21,703.00Bank interest and charges 1,102.04Other expenses 16 49,408.95
Total expenses 322,438.79
Net investment income / (loss) 881,229.45
Net realised gain / (loss) on: Investments 3.3 (86,437.01)Foreign currencies transactions 3.2 (1,690,410.15)
Net realised gain / (loss) for the year (895,617.71)
Net change in unrealised appreciation / (depreciation) on: Investments 3.3 (3,802,361.22)Forward foreign exchange contracts 3.3, 11 (129,088.48)
Increase / (Decrease) in net assets as a result ofoperations
(4,827,067.41)
Proceeds received on subscription of shares 8,861,577.34Net amount paid on redemption of shares (1,243,459.50)Dividend distribution 19 (791,386.51)Net assets at the beginning of the year 28,141,761.69
Net assets at the end of the year 30,141,425.61
USDNotes
Statement of Operations and Changes in Net Assets forthe year ended December 31, 2018
Number of shares in issue atthe end of the year
Number of shares in issue atthe beginning of the year
Number of sharessubscribed
Number of sharesredeemed
Statement of Changes in Number of Shares
Class I EUR Hedged Capitalisation 1,000.00 777.81 (1,044.60) 733.21
Class I EUR Hedged Distribution 198.00 - - 198.00
Class I USD Capitalisation 2,350.00 7,766.00 - 10,116.00
Class S EUR Hedged Distribution 20,000.00 - - 20,000.00
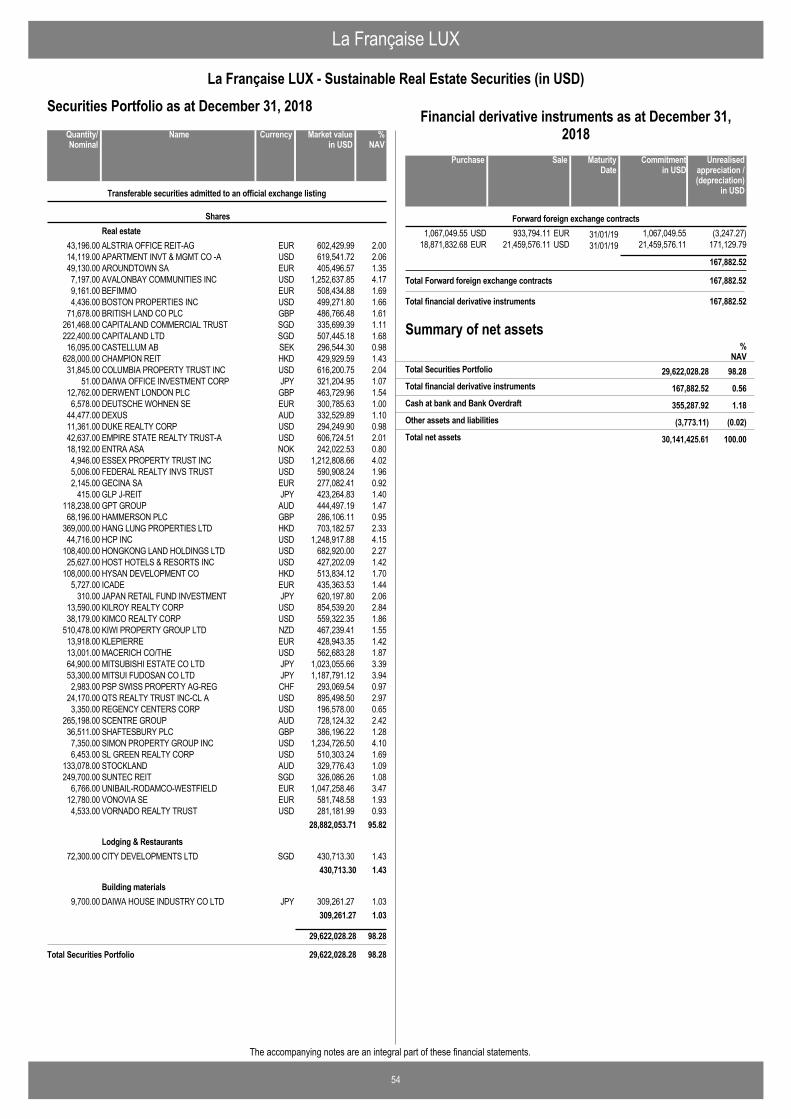
La Française LUX
54
La Française LUX - Sustainable Real Estate Securities (in USD)
The accompanying notes are an integral part of these financial statements.
Securities Portfolio as at December 31, 2018
ALSTRIA OFFICE REIT-AG EUR 602,429.99 2.0043,196.00
Transferable securities admitted to an official exchange listing
SharesReal estate
APARTMENT INVT & MGMT CO -A USD 619,541.72 2.0614,119.00AROUNDTOWN SA EUR 405,496.57 1.3549,130.00AVALONBAY COMMUNITIES INC USD 1,252,637.85 4.177,197.00BEFIMMO EUR 508,434.88 1.699,161.00BOSTON PROPERTIES INC USD 499,271.80 1.664,436.00BRITISH LAND CO PLC GBP 486,766.48 1.6171,678.00CAPITALAND COMMERCIAL TRUST SGD 335,699.39 1.11261,468.00CAPITALAND LTD SGD 507,445.18 1.68222,400.00CASTELLUM AB SEK 296,544.30 0.9816,095.00CHAMPION REIT HKD 429,929.59 1.43628,000.00COLUMBIA PROPERTY TRUST INC USD 616,200.75 2.0431,845.00DAIWA OFFICE INVESTMENT CORP JPY 321,204.95 1.0751.00DERWENT LONDON PLC GBP 463,729.96 1.5412,762.00DEUTSCHE WOHNEN SE EUR 300,785.63 1.006,578.00DEXUS AUD 332,529.89 1.1044,477.00DUKE REALTY CORP USD 294,249.90 0.9811,361.00EMPIRE STATE REALTY TRUST-A USD 606,724.51 2.0142,637.00ENTRA ASA NOK 242,022.53 0.8018,192.00ESSEX PROPERTY TRUST INC USD 1,212,808.66 4.024,946.00FEDERAL REALTY INVS TRUST USD 590,908.24 1.965,006.00GECINA SA EUR 277,082.41 0.922,145.00GLP J-REIT JPY 423,264.83 1.40415.00GPT GROUP AUD 444,497.19 1.47118,238.00HAMMERSON PLC GBP 286,106.11 0.9568,196.00HANG LUNG PROPERTIES LTD HKD 703,182.57 2.33369,000.00HCP INC USD 1,248,917.88 4.1544,716.00HONGKONG LAND HOLDINGS LTD USD 682,920.00 2.27108,400.00HOST HOTELS & RESORTS INC USD 427,202.09 1.4225,627.00HYSAN DEVELOPMENT CO HKD 513,834.12 1.70108,000.00ICADE EUR 435,363.53 1.445,727.00JAPAN RETAIL FUND INVESTMENT JPY 620,197.80 2.06310.00KILROY REALTY CORP USD 854,539.20 2.8413,590.00KIMCO REALTY CORP USD 559,322.35 1.8638,179.00KIWI PROPERTY GROUP LTD NZD 467,239.41 1.55510,478.00KLEPIERRE EUR 428,943.35 1.4213,918.00MACERICH CO/THE USD 562,683.28 1.8713,001.00MITSUBISHI ESTATE CO LTD JPY 1,023,055.66 3.3964,900.00MITSUI FUDOSAN CO LTD JPY 1,187,791.12 3.9453,300.00PSP SWISS PROPERTY AG-REG CHF 293,069.54 0.972,983.00QTS REALTY TRUST INC-CL A USD 895,498.50 2.9724,170.00REGENCY CENTERS CORP USD 196,578.00 0.653,350.00SCENTRE GROUP AUD 728,124.32 2.42265,198.00SHAFTESBURY PLC GBP 386,196.22 1.2836,511.00SIMON PROPERTY GROUP INC USD 1,234,726.50 4.107,350.00SL GREEN REALTY CORP USD 510,303.24 1.696,453.00STOCKLAND AUD 329,776.43 1.09133,078.00SUNTEC REIT SGD 326,086.26 1.08249,700.00UNIBAIL-RODAMCO-WESTFIELD EUR 1,047,258.46 3.476,766.00VONOVIA SE EUR 581,748.58 1.9312,780.00VORNADO REALTY TRUST USD 281,181.99 0.934,533.00
28,882,053.71 95.82
CITY DEVELOPMENTS LTD SGD 430,713.30 1.4372,300.00Lodging & Restaurants
430,713.30 1.43
DAIWA HOUSE INDUSTRY CO LTD JPY 309,261.27 1.039,700.00Building materials
309,261.27 1.03
29,622,028.28 98.28
Total Securities Portfolio 29,622,028.28 98.28
NameQuantity/Nominal
Market valuein USD
Currency %NAV
933,794.11 31/01/191,067,049.55 (3,247.27)EURUSD 1,067,049.55Forward foreign exchange contracts
21,459,576.11 31/01/1918,871,832.68 171,129.79USDEUR 21,459,576.11
167,882.52
Total Forward foreign exchange contracts 167,882.52
SalePurchase Unrealisedappreciation /(depreciation)
in USD
MaturityDate
Commitmentin USD
Financial derivative instruments as at December 31,2018
Total financial derivative instruments 167,882.52
Summary of net assets
167,882.52 0.56Total financial derivative instruments
%NAV
29,622,028.28 98.28Total Securities Portfolio
355,287.92 1.18Cash at bank and Bank Overdraft
(3,773.11) (0.02)Other assets and liabilities
30,141,425.61 100.00Total net assets

La Française LUX
55
La Française LUX - Sustainable Real Estate Securities (in USD)
The accompanying notes are an integral part of these financial statements.
Nature allocation % of portfolio % of netassets
Shares 100.00 98.28
100.00 98.28
Country allocation % of portfolio % of netassets
United States 42.08 41.38
Japan 13.11 12.89
France 7.39 7.25
Australia 6.19 6.08
Hong Kong 5.56 5.46
United Kingdom 5.48 5.38
Singapore 5.40 5.30
Germany 5.01 4.93
Bermuda 2.31 2.27
Other 7.47 7.34
100.00 98.28
Portfolio Breakdowns
Top Ten Holdings Market value % ofnet
assets
AVALONBAY COMMUNITIES INC 1,252,637.85 4.17Real estate
HCP INC 1,248,917.88 4.15Real estate
SIMON PROPERTY GROUP INC 1,234,726.50 4.10Real estate
ESSEX PROPERTY TRUST INC 1,212,808.66 4.02Real estate
MITSUI FUDOSAN CO LTD 1,187,791.12 3.94Real estate
UNIBAIL-RODAMCO-WESTFIELD 1,047,258.46 3.47Real estate
MITSUBISHI ESTATE CO LTD 1,023,055.66 3.39Real estate
QTS REALTY TRUST INC-CL A 895,498.50 2.97Real estate
KILROY REALTY CORP 854,539.20 2.84Real estate
SCENTRE GROUP 728,124.32 2.42Real estate
USD
Sector
Top Ten Holdings
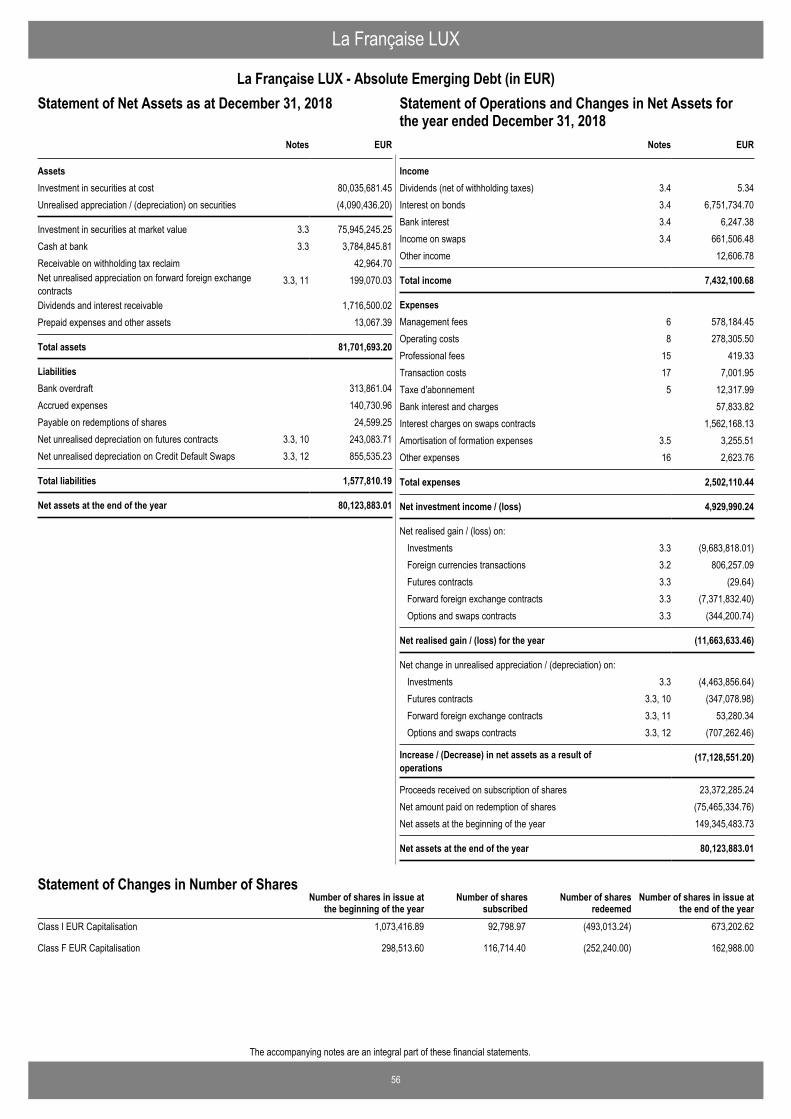
56
The accompanying notes are an integral part of these financial statements.
La Française LUX
La Française LUX - Absolute Emerging Debt (in EUR)Statement of Operations and Changes in Net Assets for theyear ended December 31, 2018
EUR
AssetsInvestment in securities at cost 80,035,681.45Unrealised appreciation / (depreciation) on securities (4,090,436.20)
Investment in securities at market value 3.3 75,945,245.25Cash at bank 3.3 3,784,845.81Receivable on withholding tax reclaim 42,964.70Net unrealised appreciation on forward foreign exchangecontracts
3.3, 11 199,070.03
Dividends and interest receivable 1,716,500.02Prepaid expenses and other assets 13,067.39
Total assets 81,701,693.20
LiabilitiesBank overdraft 313,861.04Accrued expenses 140,730.96Payable on redemptions of shares 24,599.25Net unrealised depreciation on futures contracts 3.3, 10 243,083.71Net unrealised depreciation on Credit Default Swaps 3.3, 12 855,535.23
Total liabilities 1,577,810.19
Net assets at the end of the year 80,123,883.01
Notes
Statement of Net Assets as at December 31, 2018
IncomeDividends (net of withholding taxes) 3.4 5.34Interest on bonds 3.4 6,751,734.70Bank interest 3.4 6,247.38Income on swaps 3.4 661,506.48Other income 12,606.78
Total income 7,432,100.68
ExpensesManagement fees 6 578,184.45Operating costs 8 278,305.50Professional fees 15 419.33Transaction costs 17 7,001.95Taxe d'abonnement 5 12,317.99Bank interest and charges 57,833.82Interest charges on swaps contracts 1,562,168.13Amortisation of formation expenses 3.5 3,255.51Other expenses 16 2,623.76
Total expenses 2,502,110.44
Net investment income / (loss) 4,929,990.24
Net realised gain / (loss) on: Investments 3.3 (9,683,818.01)Foreign currencies transactions 3.2 806,257.09Futures contracts 3.3 (29.64)Forward foreign exchange contracts 3.3 (7,371,832.40)Options and swaps contracts 3.3 (344,200.74)
Net realised gain / (loss) for the year (11,663,633.46)
Net change in unrealised appreciation / (depreciation) on: Investments 3.3 (4,463,856.64)Futures contracts 3.3, 10 (347,078.98)Forward foreign exchange contracts 3.3, 11 53,280.34Options and swaps contracts 3.3, 12 (707,262.46)
Increase / (Decrease) in net assets as a result ofoperations
(17,128,551.20)
Proceeds received on subscription of shares 23,372,285.24Net amount paid on redemption of shares (75,465,334.76)Net assets at the beginning of the year 149,345,483.73
Net assets at the end of the year 80,123,883.01
EURNotes
Statement of Operations and Changes in Net Assets forthe year ended December 31, 2018
Number of shares in issue atthe end of the year
Number of shares in issue atthe beginning of the year
Number of sharessubscribed
Number of sharesredeemed
Statement of Changes in Number of Shares
Class I EUR Capitalisation 1,073,416.89 92,798.97 (493,013.24) 673,202.62
Class F EUR Capitalisation 298,513.60 116,714.40 (252,240.00) 162,988.00
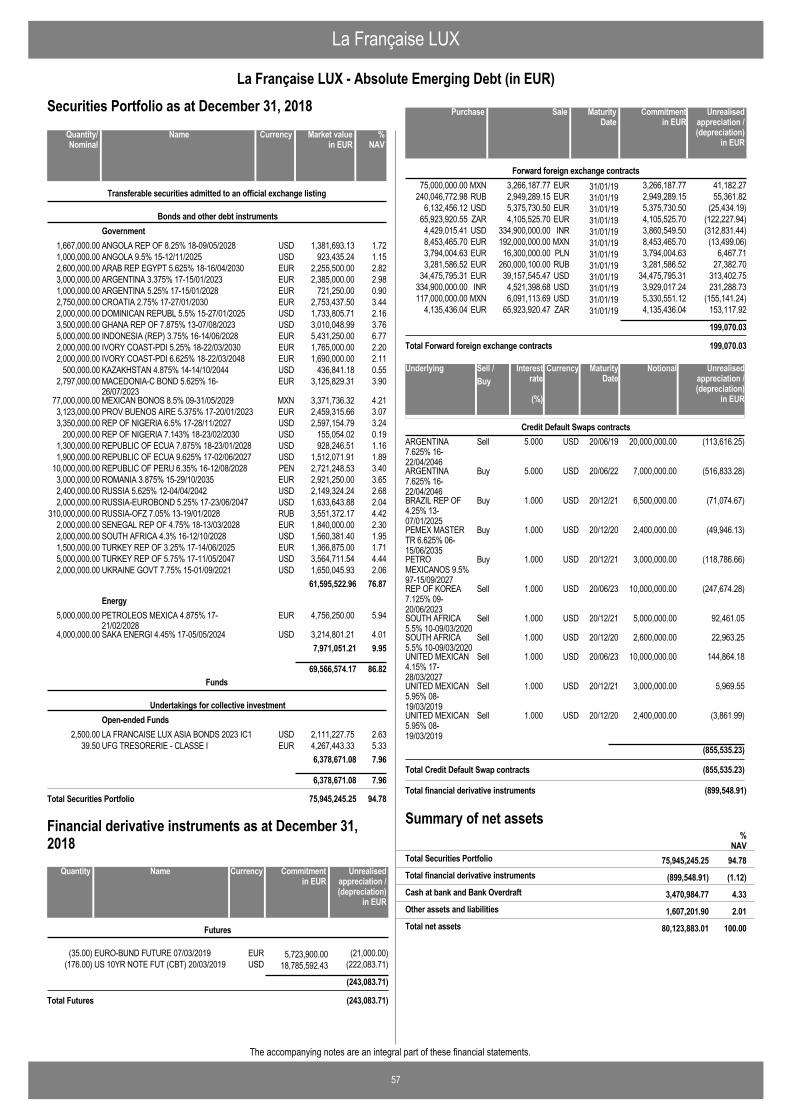
La Française LUX
57
La Française LUX - Absolute Emerging Debt (in EUR)
The accompanying notes are an integral part of these financial statements.
Securities Portfolio as at December 31, 2018
ANGOLA REP OF 8.25% 18-09/05/2028 USD 1,381,693.13 1.721,667,000.00
Transferable securities admitted to an official exchange listing
Bonds and other debt instrumentsGovernment
ANGOLA 9.5% 15-12/11/2025 USD 923,435.24 1.151,000,000.00ARAB REP EGYPT 5.625% 18-16/04/2030 EUR 2,255,500.00 2.822,600,000.00ARGENTINA 3.375% 17-15/01/2023 EUR 2,385,000.00 2.983,000,000.00ARGENTINA 5.25% 17-15/01/2028 EUR 721,250.00 0.901,000,000.00CROATIA 2.75% 17-27/01/2030 EUR 2,753,437.50 3.442,750,000.00DOMINICAN REPUBL 5.5% 15-27/01/2025 USD 1,733,805.71 2.162,000,000.00GHANA REP OF 7.875% 13-07/08/2023 USD 3,010,048.99 3.763,500,000.00INDONESIA (REP) 3.75% 16-14/06/2028 EUR 5,431,250.00 6.775,000,000.00IVORY COAST-PDI 5.25% 18-22/03/2030 EUR 1,765,000.00 2.202,000,000.00IVORY COAST-PDI 6.625% 18-22/03/2048 EUR 1,690,000.00 2.112,000,000.00KAZAKHSTAN 4.875% 14-14/10/2044 USD 436,841.18 0.55500,000.00MACEDONIA-C BOND 5.625% 16-26/07/2023
EUR 3,125,829.31 3.902,797,000.00
MEXICAN BONOS 8.5% 09-31/05/2029 MXN 3,371,736.32 4.2177,000,000.00PROV BUENOS AIRE 5.375% 17-20/01/2023 EUR 2,459,315.66 3.073,123,000.00REP OF NIGERIA 6.5% 17-28/11/2027 USD 2,597,154.79 3.243,350,000.00REP OF NIGERIA 7.143% 18-23/02/2030 USD 155,054.02 0.19200,000.00REPUBLIC OF ECUA 7.875% 18-23/01/2028 USD 928,246.51 1.161,300,000.00REPUBLIC OF ECUA 9.625% 17-02/06/2027 USD 1,512,071.91 1.891,900,000.00REPUBLIC OF PERU 6.35% 16-12/08/2028 PEN 2,721,248.53 3.4010,000,000.00ROMANIA 3.875% 15-29/10/2035 EUR 2,921,250.00 3.653,000,000.00RUSSIA 5.625% 12-04/04/2042 USD 2,149,324.24 2.682,400,000.00RUSSIA-EUROBOND 5.25% 17-23/06/2047 USD 1,633,643.88 2.042,000,000.00RUSSIA-OFZ 7.05% 13-19/01/2028 RUB 3,551,372.17 4.42310,000,000.00SENEGAL REP OF 4.75% 18-13/03/2028 EUR 1,840,000.00 2.302,000,000.00SOUTH AFRICA 4.3% 16-12/10/2028 USD 1,560,381.40 1.952,000,000.00TURKEY REP OF 3.25% 17-14/06/2025 EUR 1,366,875.00 1.711,500,000.00TURKEY REP OF 5.75% 17-11/05/2047 USD 3,564,711.54 4.445,000,000.00UKRAINE GOVT 7.75% 15-01/09/2021 USD 1,650,045.93 2.062,000,000.00
61,595,522.96 76.87
PETROLEOS MEXICA 4.875% 17-21/02/2028
EUR 4,756,250.00 5.945,000,000.00Energy
SAKA ENERGI 4.45% 17-05/05/2024 USD 3,214,801.21 4.014,000,000.007,971,051.21 9.95
69,566,574.17 86.82
LA FRANCAISE LUX ASIA BONDS 2023 IC1 USD 2,111,227.75 2.632,500.00
Funds
Undertakings for collective investmentOpen-ended Funds
UFG TRESORERIE - CLASSE I EUR 4,267,443.33 5.3339.506,378,671.08 7.96
6,378,671.08 7.96
Total Securities Portfolio 75,945,245.25 94.78
NameQuantity/Nominal
Market valuein EUR
Currency %NAV
EURO-BUND FUTURE 07/03/2019 EUR 5,723,900.00(35.00) (21,000.00)
Futures
US 10YR NOTE FUT (CBT) 20/03/2019 USD 18,785,592.43(176.00) (222,083.71)
(243,083.71)
Total Futures (243,083.71)
NameQuantity Commitmentin EUR
Currency Unrealisedappreciation /(depreciation)
in EUR
Financial derivative instruments as at December 31,2018
3,266,187.77 31/01/1975,000,000.00 41,182.27EURMXN 3,266,187.77Forward foreign exchange contracts
2,949,289.15 31/01/19240,046,772.98 55,361.82EURRUB 2,949,289.155,375,730.50 31/01/196,132,456.12 (25,434.19)EURUSD 5,375,730.504,105,525.70 31/01/1965,923,920.55 (122,227.94)EURZAR 4,105,525.70
334,900,000.00 31/01/194,429,015.41 (312,831.44)INRUSD 3,860,549.50192,000,000.00 31/01/198,453,465.70 (13,499.06)MXNEUR 8,453,465.7016,300,000.00 31/01/193,794,004.63 6,467.71PLNEUR 3,794,004.63
260,000,100.00 31/01/193,281,586.52 27,382.70RUBEUR 3,281,586.5239,157,545.47 31/01/1934,475,795.31 313,402.75USDEUR 34,475,795.314,521,398.68 31/01/19334,900,000.00 231,288.73USDINR 3,929,017.246,091,113.69 31/01/19117,000,000.00 (155,141.24)USDMXN 5,330,551.12
65,923,920.47 31/01/194,135,436.04 153,117.92ZAREUR 4,135,436.04
199,070.03
Total Forward foreign exchange contracts 199,070.03
SalePurchase Unrealisedappreciation /(depreciation)
in EUR
MaturityDate
Commitmentin EUR
20/06/19ARGENTINA7.625% 16-22/04/2046
20,000,000.00 (113,616.25)USDSell 5.000Credit Default Swaps contracts
20/06/22ARGENTINA7.625% 16-22/04/2046
7,000,000.00 (516,833.28)USDBuy 5.000
20/12/21BRAZIL REP OF4.25% 13-07/01/2025
6,500,000.00 (71,074.67)USDBuy 1.000
20/12/20PEMEX MASTERTR 6.625% 06-15/06/2035
2,400,000.00 (49,946.13)USDBuy 1.000
20/12/21PETROMEXICANOS 9.5%97-15/09/2027
3,000,000.00 (118,786.66)USDBuy 1.000
20/06/23REP OF KOREA7.125% 09-20/06/2023
10,000,000.00 (247,674.28)USDSell 1.000
20/12/21SOUTH AFRICA5.5% 10-09/03/2020
5,000,000.00 92,461.05USDSell 1.000
20/12/20SOUTH AFRICA5.5% 10-09/03/2020
2,600,000.00 22,963.25USDSell 1.000
20/06/23UNITED MEXICAN4.15% 17-28/03/2027
10,000,000.00 144,864.18USDSell 1.000
20/12/21UNITED MEXICAN5.95% 08-19/03/2019
3,000,000.00 5,969.55USDSell 1.000
20/12/20UNITED MEXICAN5.95% 08-19/03/2019
2,400,000.00 (3,861.99)USDSell 1.000
(855,535.23)
Sell /Buy
Underlying NotionalMaturityDate
Unrealisedappreciation /(depreciation)
in EUR
CurrencyInterestrate
(%)
Total Credit Default Swap contracts (855,535.23)
Total financial derivative instruments (899,548.91)
Summary of net assets
(899,548.91) (1.12)Total financial derivative instruments
%NAV
75,945,245.25 94.78Total Securities Portfolio
3,470,984.77 4.33Cash at bank and Bank Overdraft
1,607,201.90 2.01Other assets and liabilities
80,123,883.01 100.00Total net assets
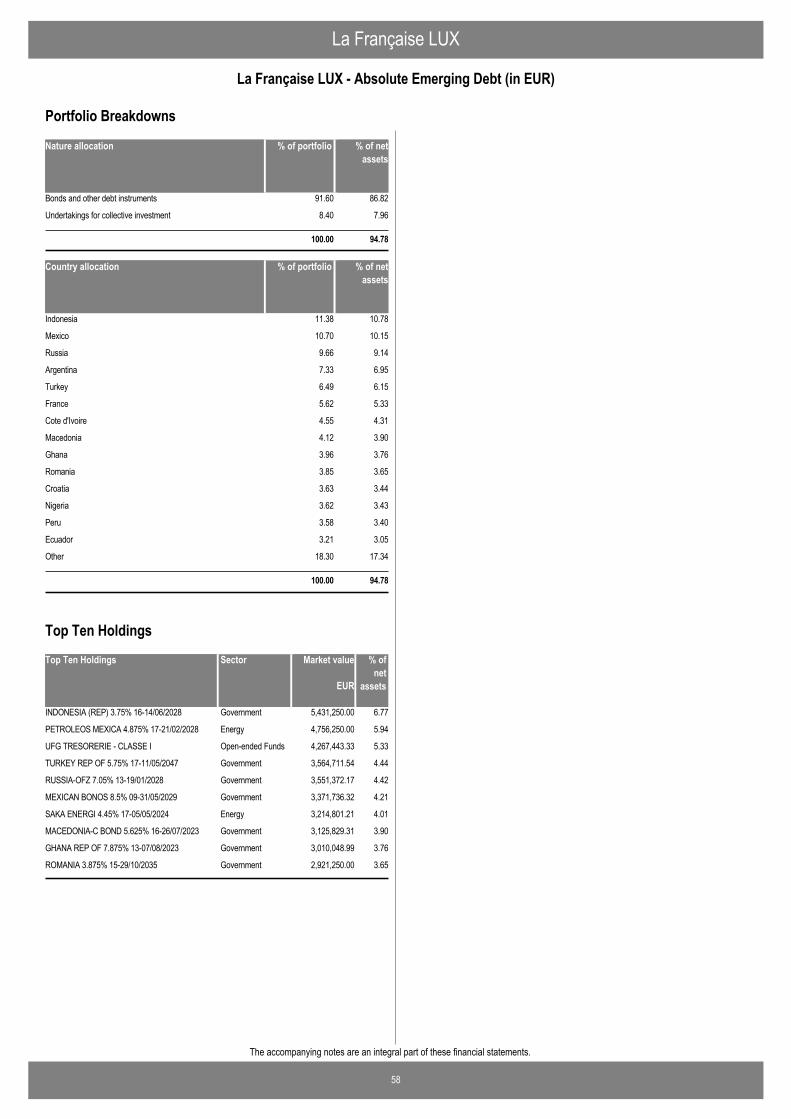
La Française LUX
58
La Française LUX - Absolute Emerging Debt (in EUR)
The accompanying notes are an integral part of these financial statements.
Nature allocation % of portfolio % of netassets
Bonds and other debt instruments 91.60 86.82
Undertakings for collective investment 8.40 7.96
100.00 94.78
Country allocation % of portfolio % of netassets
Indonesia 11.38 10.78
Mexico 10.70 10.15
Russia 9.66 9.14
Argentina 7.33 6.95
Turkey 6.49 6.15
France 5.62 5.33
Cote d'Ivoire 4.55 4.31
Macedonia 4.12 3.90
Ghana 3.96 3.76
Romania 3.85 3.65
Croatia 3.63 3.44
Nigeria 3.62 3.43
Peru 3.58 3.40
Ecuador 3.21 3.05
Other 18.30 17.34
100.00 94.78
Portfolio Breakdowns
Top Ten Holdings Market value % ofnet
assets
INDONESIA (REP) 3.75% 16-14/06/2028 5,431,250.00 6.77Government
PETROLEOS MEXICA 4.875% 17-21/02/2028 4,756,250.00 5.94Energy
UFG TRESORERIE - CLASSE I 4,267,443.33 5.33Open-ended Funds
TURKEY REP OF 5.75% 17-11/05/2047 3,564,711.54 4.44Government
RUSSIA-OFZ 7.05% 13-19/01/2028 3,551,372.17 4.42Government
MEXICAN BONOS 8.5% 09-31/05/2029 3,371,736.32 4.21Government
SAKA ENERGI 4.45% 17-05/05/2024 3,214,801.21 4.01Energy
MACEDONIA-C BOND 5.625% 16-26/07/2023 3,125,829.31 3.90Government
GHANA REP OF 7.875% 13-07/08/2023 3,010,048.99 3.76Government
ROMANIA 3.875% 15-29/10/2035 2,921,250.00 3.65Government
EUR
Sector
Top Ten Holdings
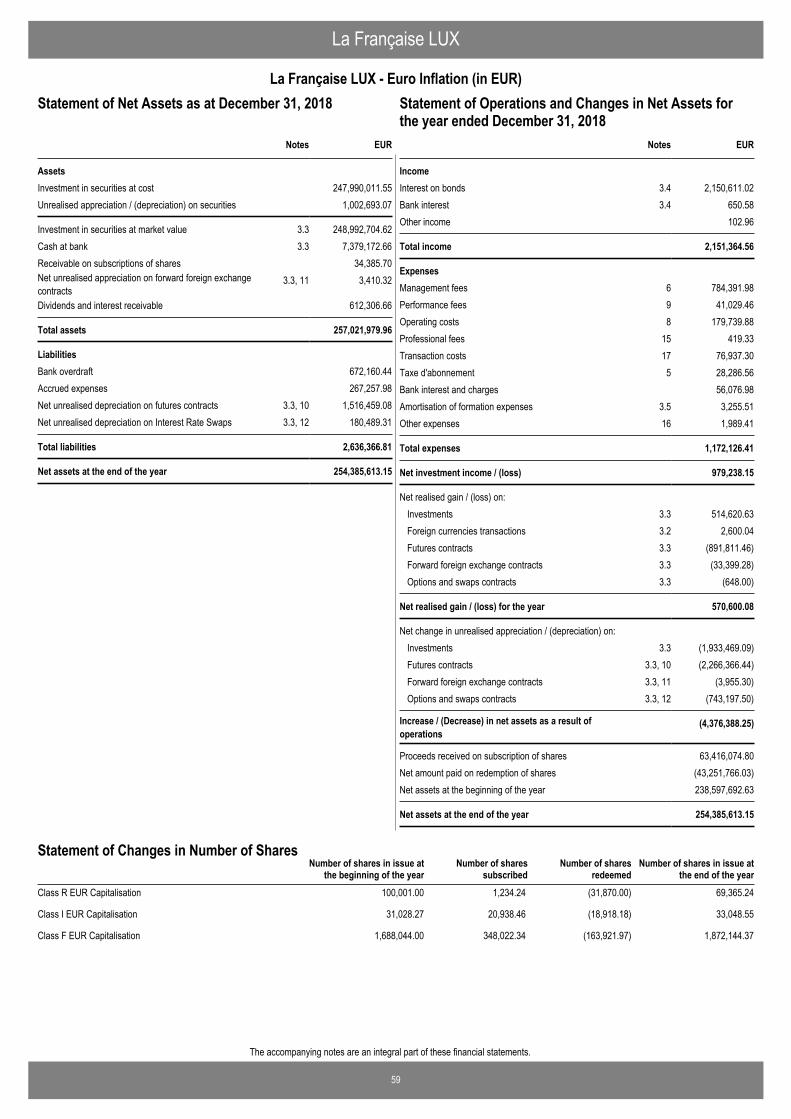
59
The accompanying notes are an integral part of these financial statements.
La Française LUX
La Française LUX - Euro Inflation (in EUR)Statement of Operations and Changes in Net Assets for theyear ended December 31, 2018
EUR
AssetsInvestment in securities at cost 247,990,011.55Unrealised appreciation / (depreciation) on securities 1,002,693.07
Investment in securities at market value 3.3 248,992,704.62Cash at bank 3.3 7,379,172.66Receivable on subscriptions of shares 34,385.70Net unrealised appreciation on forward foreign exchangecontracts
3.3, 11 3,410.32
Dividends and interest receivable 612,306.66
Total assets 257,021,979.96
LiabilitiesBank overdraft 672,160.44Accrued expenses 267,257.98Net unrealised depreciation on futures contracts 3.3, 10 1,516,459.08Net unrealised depreciation on Interest Rate Swaps 3.3, 12 180,489.31
Total liabilities 2,636,366.81
Net assets at the end of the year 254,385,613.15
Notes
Statement of Net Assets as at December 31, 2018
IncomeInterest on bonds 3.4 2,150,611.02Bank interest 3.4 650.58Other income 102.96
Total income 2,151,364.56
ExpensesManagement fees 6 784,391.98Performance fees 9 41,029.46Operating costs 8 179,739.88Professional fees 15 419.33Transaction costs 17 76,937.30Taxe d'abonnement 5 28,286.56Bank interest and charges 56,076.98Amortisation of formation expenses 3.5 3,255.51Other expenses 16 1,989.41
Total expenses 1,172,126.41
Net investment income / (loss) 979,238.15
Net realised gain / (loss) on: Investments 3.3 514,620.63Foreign currencies transactions 3.2 2,600.04Futures contracts 3.3 (891,811.46)Forward foreign exchange contracts 3.3 (33,399.28)Options and swaps contracts 3.3 (648.00)
Net realised gain / (loss) for the year 570,600.08
Net change in unrealised appreciation / (depreciation) on: Investments 3.3 (1,933,469.09)Futures contracts 3.3, 10 (2,266,366.44)Forward foreign exchange contracts 3.3, 11 (3,955.30)Options and swaps contracts 3.3, 12 (743,197.50)
Increase / (Decrease) in net assets as a result ofoperations
(4,376,388.25)
Proceeds received on subscription of shares 63,416,074.80Net amount paid on redemption of shares (43,251,766.03)Net assets at the beginning of the year 238,597,692.63
Net assets at the end of the year 254,385,613.15
EURNotes
Statement of Operations and Changes in Net Assets forthe year ended December 31, 2018
Number of shares in issue atthe end of the year
Number of shares in issue atthe beginning of the year
Number of sharessubscribed
Number of sharesredeemed
Statement of Changes in Number of Shares
Class R EUR Capitalisation 100,001.00 1,234.24 (31,870.00) 69,365.24
Class I EUR Capitalisation 31,028.27 20,938.46 (18,918.18) 33,048.55
Class F EUR Capitalisation 1,688,044.00 348,022.34 (163,921.97) 1,872,144.37
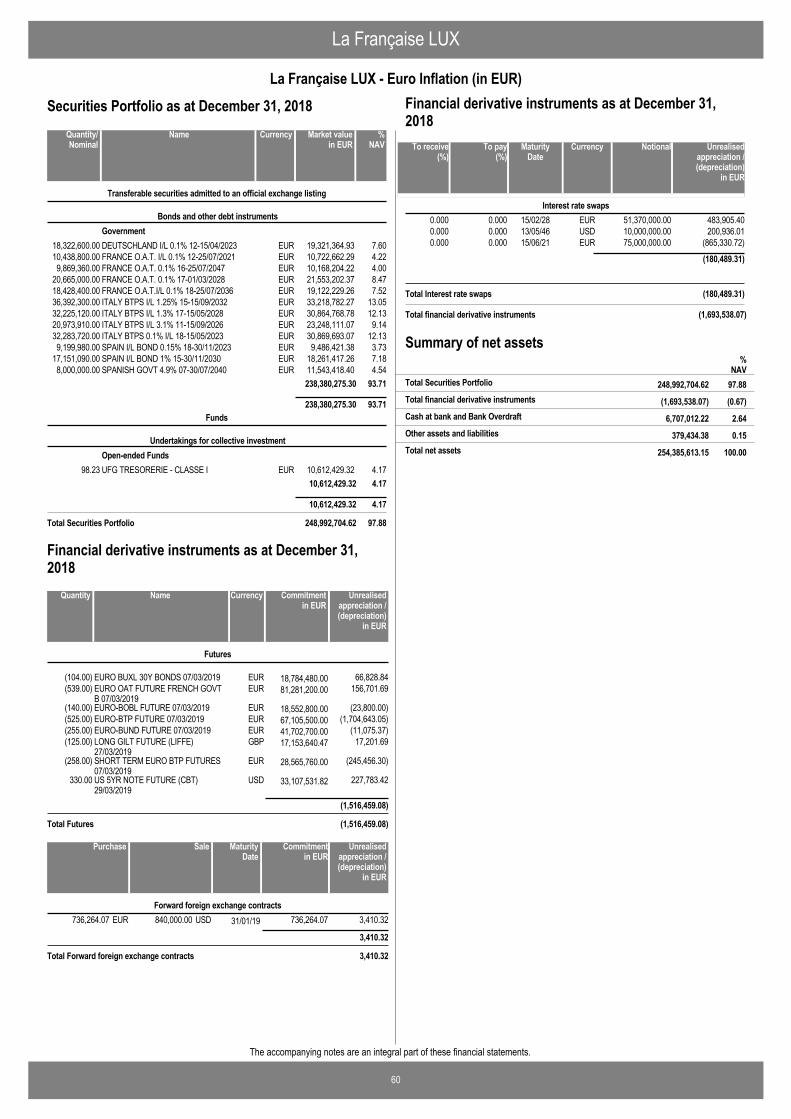
La Française LUX
60
La Française LUX - Euro Inflation (in EUR)
The accompanying notes are an integral part of these financial statements.
Securities Portfolio as at December 31, 2018
DEUTSCHLAND I/L 0.1% 12-15/04/2023 EUR 19,321,364.93 7.6018,322,600.00
Transferable securities admitted to an official exchange listing
Bonds and other debt instrumentsGovernment
FRANCE O.A.T. I/L 0.1% 12-25/07/2021 EUR 10,722,662.29 4.2210,438,800.00FRANCE O.A.T. 0.1% 16-25/07/2047 EUR 10,168,204.22 4.009,869,360.00FRANCE O.A.T. 0.1% 17-01/03/2028 EUR 21,553,202.37 8.4720,665,000.00FRANCE O.A.T.I/L 0.1% 18-25/07/2036 EUR 19,122,229.26 7.5218,428,400.00ITALY BTPS I/L 1.25% 15-15/09/2032 EUR 33,218,782.27 13.0536,392,300.00ITALY BTPS I/L 1.3% 17-15/05/2028 EUR 30,864,768.78 12.1332,225,120.00ITALY BTPS I/L 3.1% 11-15/09/2026 EUR 23,248,111.07 9.1420,973,910.00ITALY BTPS 0.1% I/L 18-15/05/2023 EUR 30,869,693.07 12.1332,283,720.00SPAIN I/L BOND 0.15% 18-30/11/2023 EUR 9,486,421.38 3.739,199,980.00SPAIN I/L BOND 1% 15-30/11/2030 EUR 18,261,417.26 7.1817,151,090.00SPANISH GOVT 4.9% 07-30/07/2040 EUR 11,543,418.40 4.548,000,000.00
238,380,275.30 93.71
238,380,275.30 93.71
UFG TRESORERIE - CLASSE I EUR 10,612,429.32 4.1798.23
Funds
Undertakings for collective investmentOpen-ended Funds
10,612,429.32 4.17
10,612,429.32 4.17
Total Securities Portfolio 248,992,704.62 97.88
NameQuantity/Nominal
Market valuein EUR
Currency %NAV
EURO BUXL 30Y BONDS 07/03/2019 EUR 18,784,480.00(104.00) 66,828.84
Futures
EURO OAT FUTURE FRENCH GOVTB 07/03/2019
EUR 81,281,200.00(539.00) 156,701.69
EURO-BOBL FUTURE 07/03/2019 EUR 18,552,800.00(140.00) (23,800.00)EURO-BTP FUTURE 07/03/2019 EUR 67,105,500.00(525.00) (1,704,643.05)EURO-BUND FUTURE 07/03/2019 EUR 41,702,700.00(255.00) (11,075.37)LONG GILT FUTURE (LIFFE)27/03/2019
GBP 17,153,640.47(125.00) 17,201.69
SHORT TERM EURO BTP FUTURES07/03/2019
EUR 28,565,760.00(258.00) (245,456.30)
US 5YR NOTE FUTURE (CBT)29/03/2019
USD 33,107,531.82330.00 227,783.42
(1,516,459.08)
Total Futures (1,516,459.08)
NameQuantity Commitmentin EUR
Currency Unrealisedappreciation /(depreciation)
in EUR
Financial derivative instruments as at December 31,2018
840,000.00 31/01/19736,264.07 3,410.32USDEUR 736,264.07Forward foreign exchange contracts
3,410.32
Total Forward foreign exchange contracts 3,410.32
SalePurchase Unrealisedappreciation /(depreciation)
in EUR
MaturityDate
Commitmentin EUR
0.000 15/02/280.000 51,370,000.00 483,905.40EURInterest rate swaps
0.000 13/05/460.000 10,000,000.00 200,936.01USD0.000 15/06/210.000 75,000,000.00 (865,330.72)EUR
(180,489.31)
To pay (%)
To receive (%)
NotionalMaturityDate
Unrealisedappreciation /(depreciation)
in EUR
Currency
Total Interest rate swaps (180,489.31)
Financial derivative instruments as at December 31,2018
Total financial derivative instruments (1,693,538.07)
Summary of net assets
(1,693,538.07) (0.67)Total financial derivative instruments
%NAV
248,992,704.62 97.88Total Securities Portfolio
6,707,012.22 2.64Cash at bank and Bank Overdraft
379,434.38 0.15Other assets and liabilities
254,385,613.15 100.00Total net assets
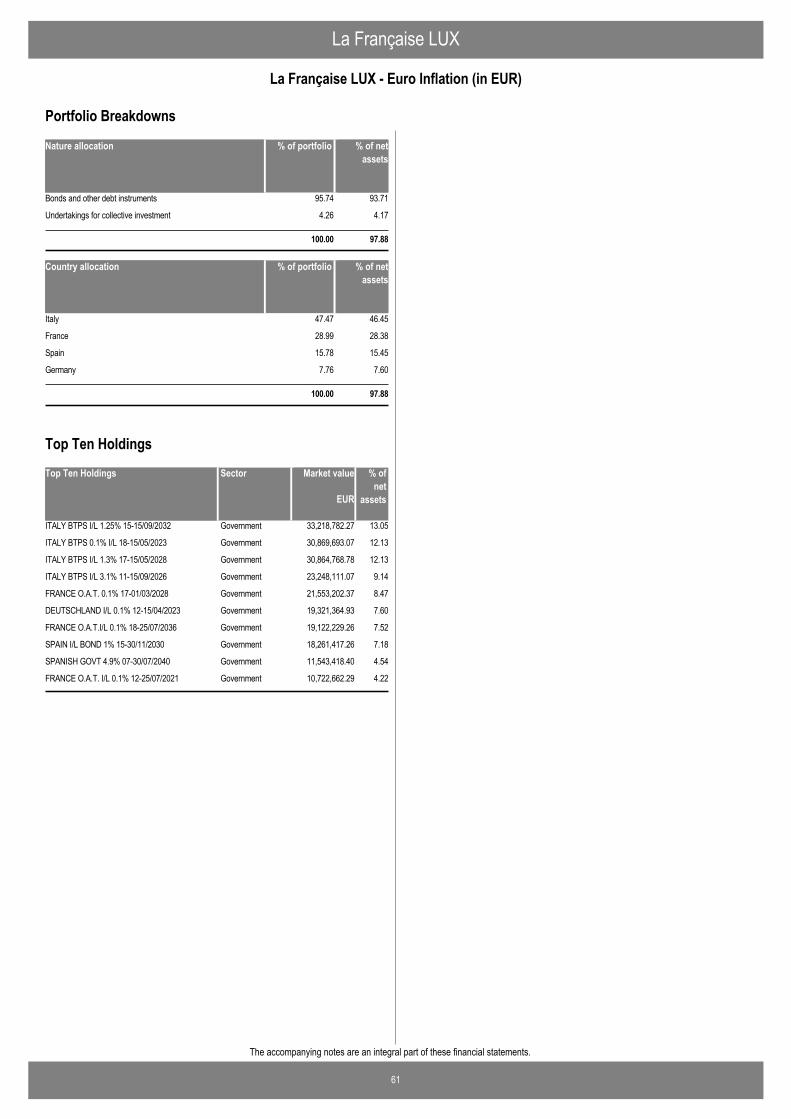
La Française LUX
61
La Française LUX - Euro Inflation (in EUR)
The accompanying notes are an integral part of these financial statements.
Nature allocation % of portfolio % of netassets
Bonds and other debt instruments 95.74 93.71
Undertakings for collective investment 4.26 4.17
100.00 97.88
Country allocation % of portfolio % of netassets
Italy 47.47 46.45
France 28.99 28.38
Spain 15.78 15.45
Germany 7.76 7.60
100.00 97.88
Portfolio Breakdowns
Top Ten Holdings Market value % ofnet
assets
ITALY BTPS I/L 1.25% 15-15/09/2032 33,218,782.27 13.05Government
ITALY BTPS 0.1% I/L 18-15/05/2023 30,869,693.07 12.13Government
ITALY BTPS I/L 1.3% 17-15/05/2028 30,864,768.78 12.13Government
ITALY BTPS I/L 3.1% 11-15/09/2026 23,248,111.07 9.14Government
FRANCE O.A.T. 0.1% 17-01/03/2028 21,553,202.37 8.47Government
DEUTSCHLAND I/L 0.1% 12-15/04/2023 19,321,364.93 7.60Government
FRANCE O.A.T.I/L 0.1% 18-25/07/2036 19,122,229.26 7.52Government
SPAIN I/L BOND 1% 15-30/11/2030 18,261,417.26 7.18Government
SPANISH GOVT 4.9% 07-30/07/2040 11,543,418.40 4.54Government
FRANCE O.A.T. I/L 0.1% 12-25/07/2021 10,722,662.29 4.22Government
EUR
Sector
Top Ten Holdings
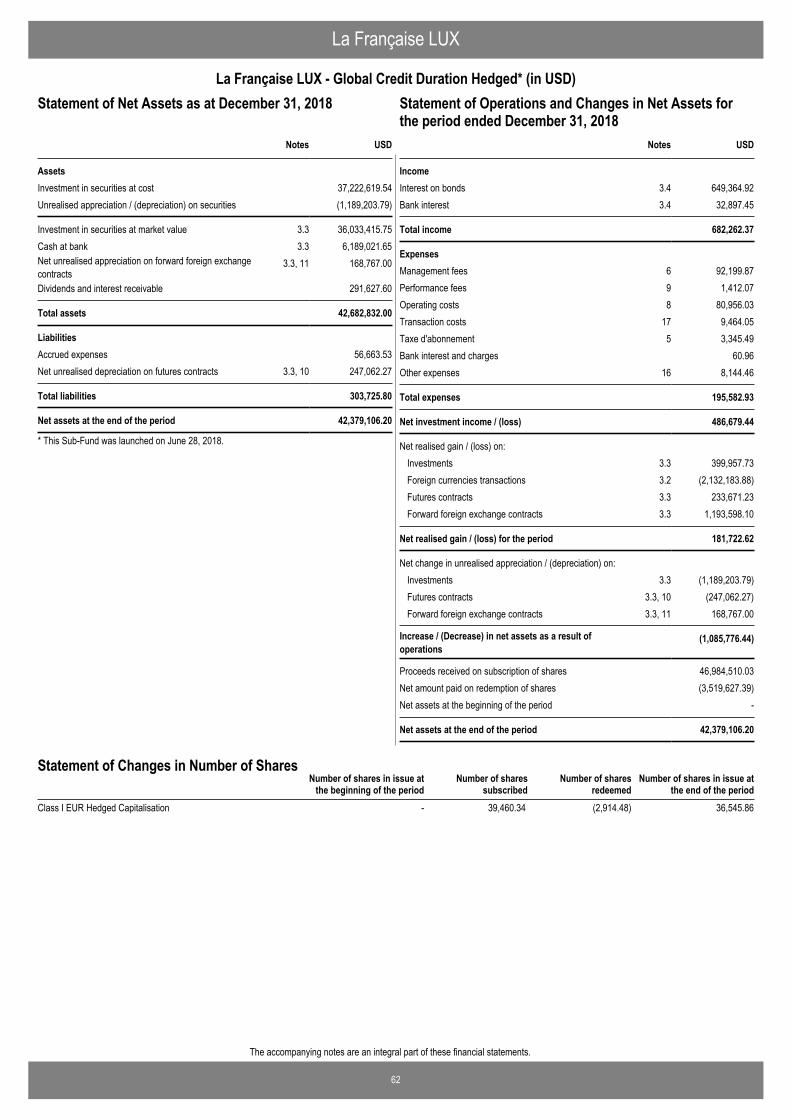
62
The accompanying notes are an integral part of these financial statements.
La Française LUX
La Française LUX - Global Credit Duration Hedged* (in USD)Statement of Operations and Changes in Net Assets for theperiod ended December 31, 2018
USD
AssetsInvestment in securities at cost 37,222,619.54Unrealised appreciation / (depreciation) on securities (1,189,203.79)
Investment in securities at market value 3.3 36,033,415.75Cash at bank 3.3 6,189,021.65Net unrealised appreciation on forward foreign exchangecontracts
3.3, 11 168,767.00
Dividends and interest receivable 291,627.60
Total assets 42,682,832.00
LiabilitiesAccrued expenses 56,663.53Net unrealised depreciation on futures contracts 3.3, 10 247,062.27
Total liabilities 303,725.80
Net assets at the end of the period 42,379,106.20
Notes
Statement of Net Assets as at December 31, 2018
* This Sub-Fund was launched on June 28, 2018.
IncomeInterest on bonds 3.4 649,364.92Bank interest 3.4 32,897.45
Total income 682,262.37
ExpensesManagement fees 6 92,199.87Performance fees 9 1,412.07Operating costs 8 80,956.03Transaction costs 17 9,464.05Taxe d'abonnement 5 3,345.49Bank interest and charges 60.96Other expenses 16 8,144.46
Total expenses 195,582.93
Net investment income / (loss) 486,679.44
Net realised gain / (loss) on: Investments 3.3 399,957.73Foreign currencies transactions 3.2 (2,132,183.88)Futures contracts 3.3 233,671.23Forward foreign exchange contracts 3.3 1,193,598.10
Net realised gain / (loss) for the period 181,722.62
Net change in unrealised appreciation / (depreciation) on: Investments 3.3 (1,189,203.79)Futures contracts 3.3, 10 (247,062.27)Forward foreign exchange contracts 3.3, 11 168,767.00
Increase / (Decrease) in net assets as a result ofoperations
(1,085,776.44)
Proceeds received on subscription of shares 46,984,510.03Net amount paid on redemption of shares (3,519,627.39)Net assets at the beginning of the period -
Net assets at the end of the period 42,379,106.20
USDNotes
Statement of Operations and Changes in Net Assets forthe period ended December 31, 2018
Number of shares in issue atthe end of the period
Number of shares in issue atthe beginning of the period
Number of sharessubscribed
Number of sharesredeemed
Statement of Changes in Number of Shares
Class I EUR Hedged Capitalisation - 39,460.34 (2,914.48) 36,545.86
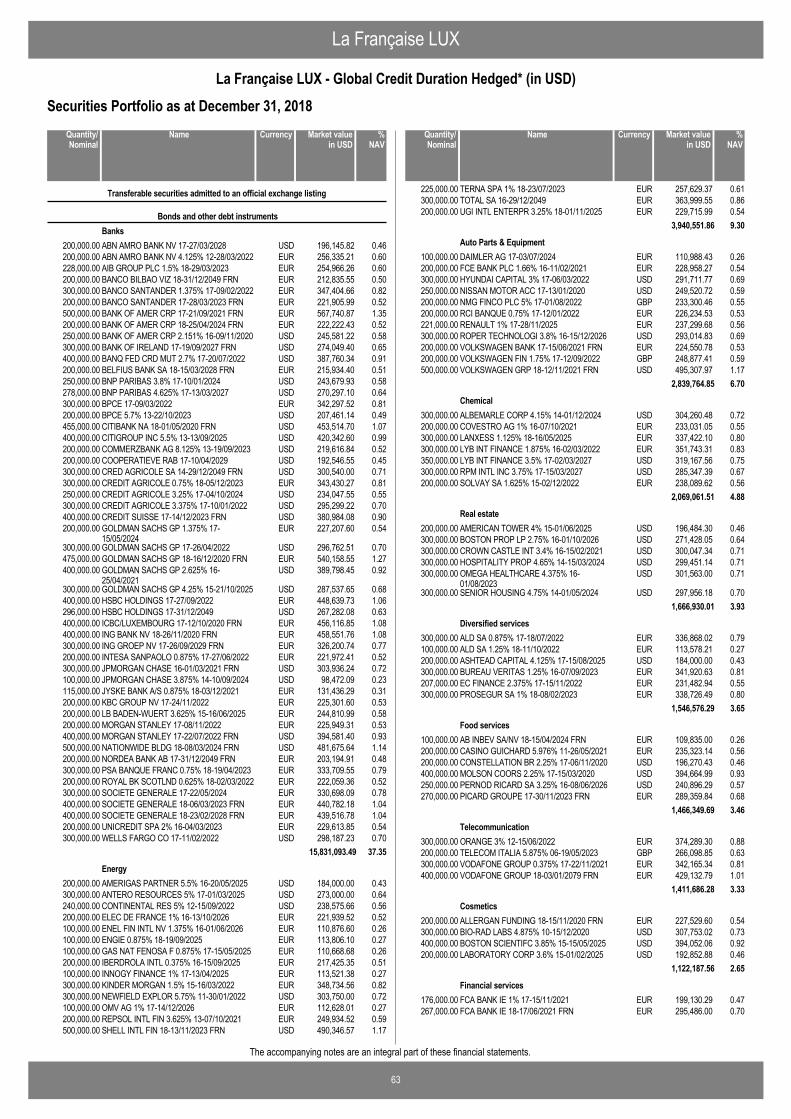
La Française LUX
63
La Française LUX - Global Credit Duration Hedged* (in USD)
The accompanying notes are an integral part of these financial statements.
Securities Portfolio as at December 31, 2018
ABN AMRO BANK NV 17-27/03/2028 USD 196,145.82 0.46200,000.00
Transferable securities admitted to an official exchange listing
Bonds and other debt instrumentsBanks
ABN AMRO BANK NV 4.125% 12-28/03/2022 EUR 256,335.21 0.60200,000.00AIB GROUP PLC 1.5% 18-29/03/2023 EUR 254,966.26 0.60228,000.00BANCO BILBAO VIZ 18-31/12/2049 FRN EUR 212,835.55 0.50200,000.00BANCO SANTANDER 1.375% 17-09/02/2022 EUR 347,404.66 0.82300,000.00BANCO SANTANDER 17-28/03/2023 FRN EUR 221,905.99 0.52200,000.00BANK OF AMER CRP 17-21/09/2021 FRN EUR 567,740.87 1.35500,000.00BANK OF AMER CRP 18-25/04/2024 FRN EUR 222,222.43 0.52200,000.00BANK OF AMER CRP 2.151% 16-09/11/2020 USD 245,581.22 0.58250,000.00BANK OF IRELAND 17-19/09/2027 FRN USD 274,049.40 0.65300,000.00BANQ FED CRD MUT 2.7% 17-20/07/2022 USD 387,760.34 0.91400,000.00BELFIUS BANK SA 18-15/03/2028 FRN EUR 215,934.40 0.51200,000.00BNP PARIBAS 3.8% 17-10/01/2024 USD 243,679.93 0.58250,000.00BNP PARIBAS 4.625% 17-13/03/2027 USD 270,297.10 0.64278,000.00BPCE 17-09/03/2022 EUR 342,297.52 0.81300,000.00BPCE 5.7% 13-22/10/2023 USD 207,461.14 0.49200,000.00CITIBANK NA 18-01/05/2020 FRN USD 453,514.70 1.07455,000.00CITIGROUP INC 5.5% 13-13/09/2025 USD 420,342.60 0.99400,000.00COMMERZBANK AG 8.125% 13-19/09/2023 USD 219,616.84 0.52200,000.00COOPERATIEVE RAB 17-10/04/2029 USD 192,546.55 0.45200,000.00CRED AGRICOLE SA 14-29/12/2049 FRN USD 300,540.00 0.71300,000.00CREDIT AGRICOLE 0.75% 18-05/12/2023 EUR 343,430.27 0.81300,000.00CREDIT AGRICOLE 3.25% 17-04/10/2024 USD 234,047.55 0.55250,000.00CREDIT AGRICOLE 3.375% 17-10/01/2022 USD 295,299.22 0.70300,000.00CREDIT SUISSE 17-14/12/2023 FRN USD 380,984.08 0.90400,000.00GOLDMAN SACHS GP 1.375% 17-15/05/2024
EUR 227,207.60 0.54200,000.00
GOLDMAN SACHS GP 17-26/04/2022 USD 296,762.51 0.70300,000.00GOLDMAN SACHS GP 18-16/12/2020 FRN EUR 540,158.55 1.27475,000.00GOLDMAN SACHS GP 2.625% 16-25/04/2021
USD 389,798.45 0.92400,000.00
GOLDMAN SACHS GP 4.25% 15-21/10/2025 USD 287,537.65 0.68300,000.00HSBC HOLDINGS 17-27/09/2022 EUR 448,639.73 1.06400,000.00HSBC HOLDINGS 17-31/12/2049 USD 267,282.08 0.63296,000.00ICBC/LUXEMBOURG 17-12/10/2020 FRN EUR 456,116.85 1.08400,000.00ING BANK NV 18-26/11/2020 FRN EUR 458,551.76 1.08400,000.00ING GROEP NV 17-26/09/2029 FRN EUR 326,200.74 0.77300,000.00INTESA SANPAOLO 0.875% 17-27/06/2022 EUR 221,972.41 0.52200,000.00JPMORGAN CHASE 16-01/03/2021 FRN USD 303,936.24 0.72300,000.00JPMORGAN CHASE 3.875% 14-10/09/2024 USD 98,472.09 0.23100,000.00JYSKE BANK A/S 0.875% 18-03/12/2021 EUR 131,436.29 0.31115,000.00KBC GROUP NV 17-24/11/2022 EUR 225,301.60 0.53200,000.00LB BADEN-WUERT 3.625% 15-16/06/2025 EUR 244,810.99 0.58200,000.00MORGAN STANLEY 17-08/11/2022 EUR 225,949.31 0.53200,000.00MORGAN STANLEY 17-22/07/2022 FRN USD 394,581.40 0.93400,000.00NATIONWIDE BLDG 18-08/03/2024 FRN USD 481,675.64 1.14500,000.00NORDEA BANK AB 17-31/12/2049 FRN EUR 203,194.91 0.48200,000.00PSA BANQUE FRANC 0.75% 18-19/04/2023 EUR 333,709.55 0.79300,000.00ROYAL BK SCOTLND 0.625% 18-02/03/2022 EUR 222,059.36 0.52200,000.00SOCIETE GENERALE 17-22/05/2024 EUR 330,698.09 0.78300,000.00SOCIETE GENERALE 18-06/03/2023 FRN EUR 440,782.18 1.04400,000.00SOCIETE GENERALE 18-23/02/2028 FRN EUR 439,516.78 1.04400,000.00UNICREDIT SPA 2% 16-04/03/2023 EUR 229,613.85 0.54200,000.00WELLS FARGO CO 17-11/02/2022 USD 298,187.23 0.70300,000.00
15,831,093.49 37.35
AMERIGAS PARTNER 5.5% 16-20/05/2025 USD 184,000.00 0.43200,000.00Energy
ANTERO RESOURCES 5% 17-01/03/2025 USD 273,000.00 0.64300,000.00CONTINENTAL RES 5% 12-15/09/2022 USD 238,575.66 0.56240,000.00ELEC DE FRANCE 1% 16-13/10/2026 EUR 221,939.52 0.52200,000.00ENEL FIN INTL NV 1.375% 16-01/06/2026 EUR 110,876.60 0.26100,000.00ENGIE 0.875% 18-19/09/2025 EUR 113,806.10 0.27100,000.00GAS NAT FENOSA F 0.875% 17-15/05/2025 EUR 110,668.68 0.26100,000.00IBERDROLA INTL 0.375% 16-15/09/2025 EUR 217,425.35 0.51200,000.00INNOGY FINANCE 1% 17-13/04/2025 EUR 113,521.38 0.27100,000.00KINDER MORGAN 1.5% 15-16/03/2022 EUR 348,734.56 0.82300,000.00NEWFIELD EXPLOR 5.75% 11-30/01/2022 USD 303,750.00 0.72300,000.00OMV AG 1% 17-14/12/2026 EUR 112,628.01 0.27100,000.00REPSOL INTL FIN 3.625% 13-07/10/2021 EUR 249,934.52 0.59200,000.00SHELL INTL FIN 18-13/11/2023 FRN USD 490,346.57 1.17500,000.00
NameQuantity/Nominal
Market valuein USD
Currency %NAV
TERNA SPA 1% 18-23/07/2023 EUR 257,629.37 0.61225,000.00TOTAL SA 16-29/12/2049 EUR 363,999.55 0.86300,000.00UGI INTL ENTERPR 3.25% 18-01/11/2025 EUR 229,715.99 0.54200,000.00
3,940,551.86 9.30
DAIMLER AG 17-03/07/2024 EUR 110,988.43 0.26100,000.00Auto Parts & Equipment
FCE BANK PLC 1.66% 16-11/02/2021 EUR 228,958.27 0.54200,000.00HYUNDAI CAPITAL 3% 17-06/03/2022 USD 291,711.77 0.69300,000.00NISSAN MOTOR ACC 17-13/01/2020 USD 249,520.72 0.59250,000.00NMG FINCO PLC 5% 17-01/08/2022 GBP 233,300.46 0.55200,000.00RCI BANQUE 0.75% 17-12/01/2022 EUR 226,234.53 0.53200,000.00RENAULT 1% 17-28/11/2025 EUR 237,299.68 0.56221,000.00ROPER TECHNOLOGI 3.8% 16-15/12/2026 USD 293,014.83 0.69300,000.00VOLKSWAGEN BANK 17-15/06/2021 FRN EUR 224,550.78 0.53200,000.00VOLKSWAGEN FIN 1.75% 17-12/09/2022 GBP 248,877.41 0.59200,000.00VOLKSWAGEN GRP 18-12/11/2021 FRN USD 495,307.97 1.17500,000.00
2,839,764.85 6.70
ALBEMARLE CORP 4.15% 14-01/12/2024 USD 304,260.48 0.72300,000.00Chemical
COVESTRO AG 1% 16-07/10/2021 EUR 233,031.05 0.55200,000.00LANXESS 1.125% 18-16/05/2025 EUR 337,422.10 0.80300,000.00LYB INT FINANCE 1.875% 16-02/03/2022 EUR 351,743.31 0.83300,000.00LYB INT FINANCE 3.5% 17-02/03/2027 USD 319,167.56 0.75350,000.00RPM INTL INC 3.75% 17-15/03/2027 USD 285,347.39 0.67300,000.00SOLVAY SA 1.625% 15-02/12/2022 EUR 238,089.62 0.56200,000.00
2,069,061.51 4.88
AMERICAN TOWER 4% 15-01/06/2025 USD 196,484.30 0.46200,000.00Real estate
BOSTON PROP LP 2.75% 16-01/10/2026 USD 271,428.05 0.64300,000.00CROWN CASTLE INT 3.4% 16-15/02/2021 USD 300,047.34 0.71300,000.00HOSPITALITY PROP 4.65% 14-15/03/2024 USD 299,451.14 0.71300,000.00OMEGA HEALTHCARE 4.375% 16-01/08/2023
USD 301,563.00 0.71300,000.00
SENIOR HOUSING 4.75% 14-01/05/2024 USD 297,956.18 0.70300,000.001,666,930.01 3.93
ALD SA 0.875% 17-18/07/2022 EUR 336,868.02 0.79300,000.00Diversified services
ALD SA 1.25% 18-11/10/2022 EUR 113,578.21 0.27100,000.00ASHTEAD CAPITAL 4.125% 17-15/08/2025 USD 184,000.00 0.43200,000.00BUREAU VERITAS 1.25% 16-07/09/2023 EUR 341,920.63 0.81300,000.00EC FINANCE 2.375% 17-15/11/2022 EUR 231,482.94 0.55207,000.00PROSEGUR SA 1% 18-08/02/2023 EUR 338,726.49 0.80300,000.00
1,546,576.29 3.65
AB INBEV SA/NV 18-15/04/2024 FRN EUR 109,835.00 0.26100,000.00Food services
CASINO GUICHARD 5.976% 11-26/05/2021 EUR 235,323.14 0.56200,000.00CONSTELLATION BR 2.25% 17-06/11/2020 USD 196,270.43 0.46200,000.00MOLSON COORS 2.25% 17-15/03/2020 USD 394,664.99 0.93400,000.00PERNOD RICARD SA 3.25% 16-08/06/2026 USD 240,896.29 0.57250,000.00PICARD GROUPE 17-30/11/2023 FRN EUR 289,359.84 0.68270,000.00
1,466,349.69 3.46
ORANGE 3% 12-15/06/2022 EUR 374,289.30 0.88300,000.00Telecommunication
TELECOM ITALIA 5.875% 06-19/05/2023 GBP 266,098.85 0.63200,000.00VODAFONE GROUP 0.375% 17-22/11/2021 EUR 342,165.34 0.81300,000.00VODAFONE GROUP 18-03/01/2079 FRN EUR 429,132.79 1.01400,000.00
1,411,686.28 3.33
ALLERGAN FUNDING 18-15/11/2020 FRN EUR 227,529.60 0.54200,000.00Cosmetics
BIO-RAD LABS 4.875% 10-15/12/2020 USD 307,753.02 0.73300,000.00BOSTON SCIENTIFC 3.85% 15-15/05/2025 USD 394,052.06 0.92400,000.00LABORATORY CORP 3.6% 15-01/02/2025 USD 192,852.88 0.46200,000.00
1,122,187.56 2.65
FCA BANK IE 1% 17-15/11/2021 EUR 199,130.29 0.47176,000.00Financial services
FCA BANK IE 18-17/06/2021 FRN EUR 295,486.00 0.70267,000.00
NameQuantity/Nominal
Market valuein USD
Currency %NAV
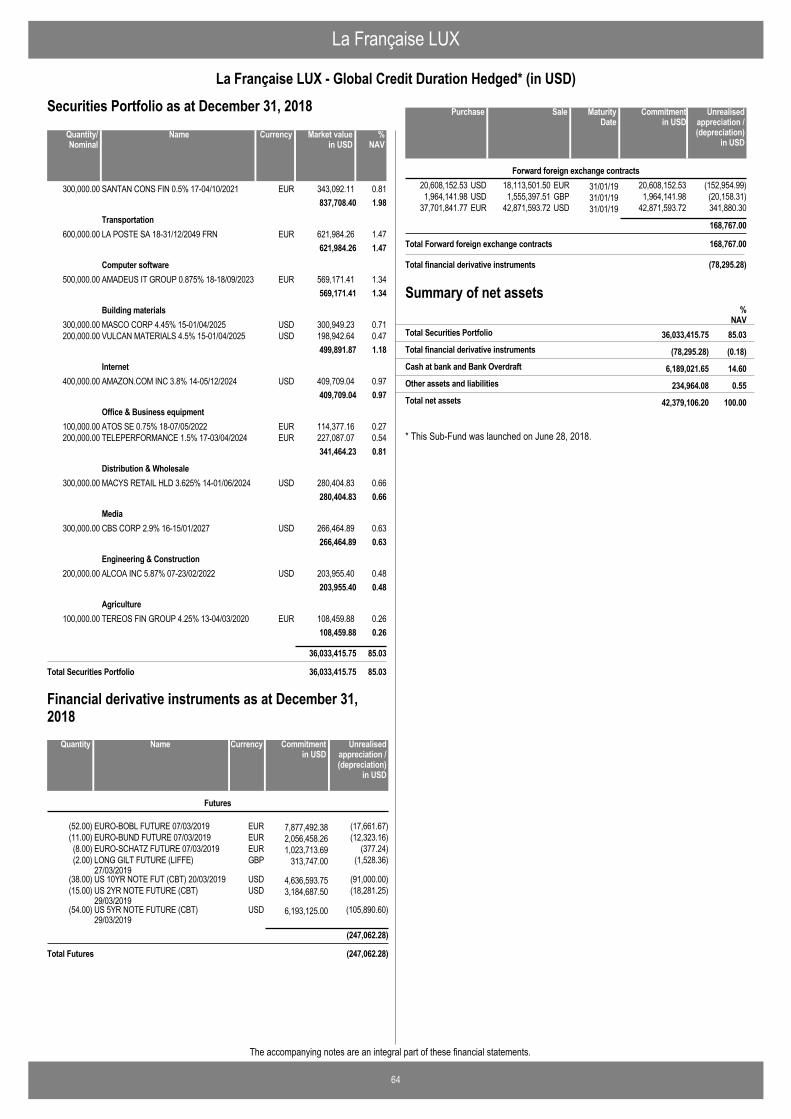
La Française LUX
64
La Française LUX - Global Credit Duration Hedged* (in USD)
The accompanying notes are an integral part of these financial statements.
Securities Portfolio as at December 31, 2018
SANTAN CONS FIN 0.5% 17-04/10/2021 EUR 343,092.11 0.81300,000.00837,708.40 1.98
LA POSTE SA 18-31/12/2049 FRN EUR 621,984.26 1.47600,000.00Transportation
621,984.26 1.47
AMADEUS IT GROUP 0.875% 18-18/09/2023 EUR 569,171.41 1.34500,000.00Computer software
569,171.41 1.34
MASCO CORP 4.45% 15-01/04/2025 USD 300,949.23 0.71300,000.00Building materials
VULCAN MATERIALS 4.5% 15-01/04/2025 USD 198,942.64 0.47200,000.00499,891.87 1.18
AMAZON.COM INC 3.8% 14-05/12/2024 USD 409,709.04 0.97400,000.00Internet
409,709.04 0.97
ATOS SE 0.75% 18-07/05/2022 EUR 114,377.16 0.27100,000.00Office & Business equipment
TELEPERFORMANCE 1.5% 17-03/04/2024 EUR 227,087.07 0.54200,000.00341,464.23 0.81
MACYS RETAIL HLD 3.625% 14-01/06/2024 USD 280,404.83 0.66300,000.00Distribution & Wholesale
280,404.83 0.66
CBS CORP 2.9% 16-15/01/2027 USD 266,464.89 0.63300,000.00Media
266,464.89 0.63
ALCOA INC 5.87% 07-23/02/2022 USD 203,955.40 0.48200,000.00Engineering & Construction
203,955.40 0.48
TEREOS FIN GROUP 4.25% 13-04/03/2020 EUR 108,459.88 0.26100,000.00Agriculture
108,459.88 0.26
36,033,415.75 85.03
Total Securities Portfolio 36,033,415.75 85.03
NameQuantity/Nominal
Market valuein USD
Currency %NAV
EURO-BOBL FUTURE 07/03/2019 EUR 7,877,492.38(52.00) (17,661.67)
Futures
EURO-BUND FUTURE 07/03/2019 EUR 2,056,458.26(11.00) (12,323.16)EURO-SCHATZ FUTURE 07/03/2019 EUR 1,023,713.69(8.00) (377.24)LONG GILT FUTURE (LIFFE)27/03/2019
GBP 313,747.00(2.00) (1,528.36)
US 10YR NOTE FUT (CBT) 20/03/2019 USD 4,636,593.75(38.00) (91,000.00)US 2YR NOTE FUTURE (CBT)29/03/2019
USD 3,184,687.50(15.00) (18,281.25)
US 5YR NOTE FUTURE (CBT)29/03/2019
USD 6,193,125.00(54.00) (105,890.60)
(247,062.28)
Total Futures (247,062.28)
NameQuantity Commitmentin USD
Currency Unrealisedappreciation /(depreciation)
in USD
Financial derivative instruments as at December 31,2018
18,113,501.50 31/01/1920,608,152.53 (152,954.99)EURUSD 20,608,152.53Forward foreign exchange contracts
1,555,397.51 31/01/191,964,141.98 (20,158.31)GBPUSD 1,964,141.9842,871,593.72 31/01/1937,701,841.77 341,880.30USDEUR 42,871,593.72
168,767.00
Total Forward foreign exchange contracts 168,767.00
SalePurchase Unrealisedappreciation /(depreciation)
in USD
MaturityDate
Commitmentin USD
Total financial derivative instruments (78,295.28)
Summary of net assets
(78,295.28) (0.18)Total financial derivative instruments
%NAV
36,033,415.75 85.03Total Securities Portfolio
6,189,021.65 14.60Cash at bank and Bank Overdraft
234,964.08 0.55Other assets and liabilities
42,379,106.20 100.00Total net assets
* This Sub-Fund was launched on June 28, 2018.
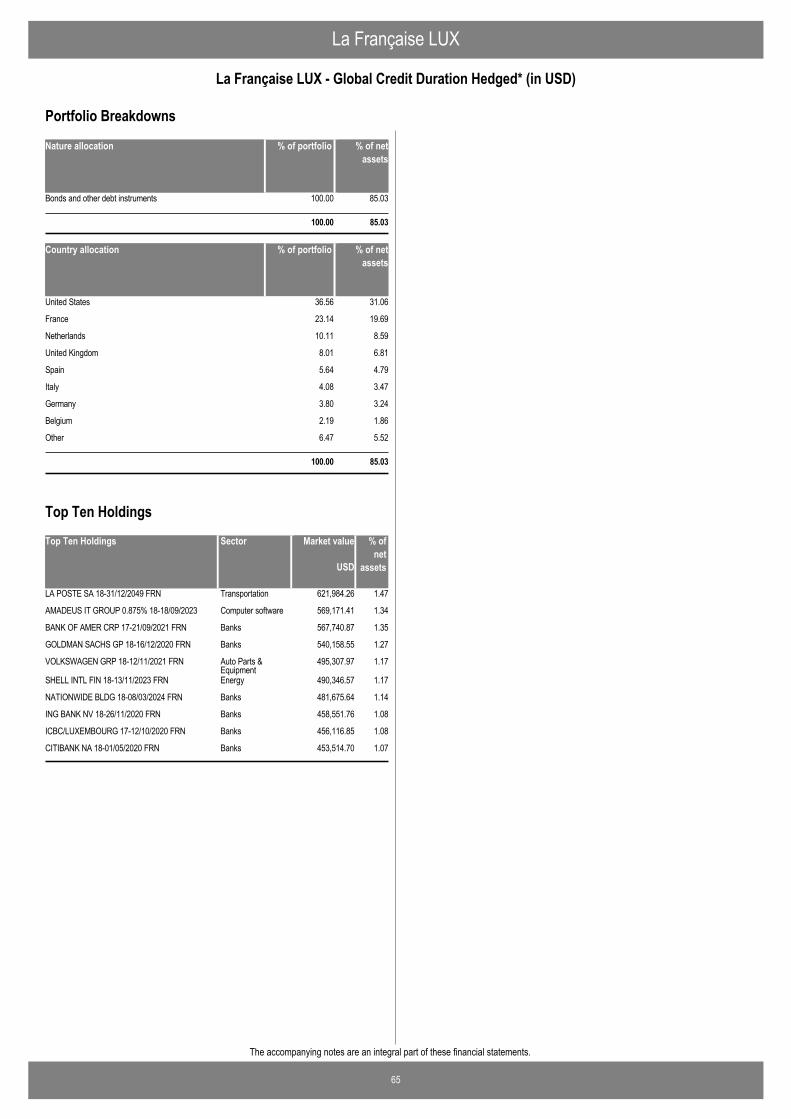
La Française LUX
65
La Française LUX - Global Credit Duration Hedged* (in USD)
The accompanying notes are an integral part of these financial statements.
Nature allocation % of portfolio % of netassets
Bonds and other debt instruments 100.00 85.03
100.00 85.03
Country allocation % of portfolio % of netassets
United States 36.56 31.06
France 23.14 19.69
Netherlands 10.11 8.59
United Kingdom 8.01 6.81
Spain 5.64 4.79
Italy 4.08 3.47
Germany 3.80 3.24
Belgium 2.19 1.86
Other 6.47 5.52
100.00 85.03
Portfolio Breakdowns
Top Ten Holdings Market value % ofnet
assets
LA POSTE SA 18-31/12/2049 FRN 621,984.26 1.47Transportation
AMADEUS IT GROUP 0.875% 18-18/09/2023 569,171.41 1.34Computer software
BANK OF AMER CRP 17-21/09/2021 FRN 567,740.87 1.35Banks
GOLDMAN SACHS GP 18-16/12/2020 FRN 540,158.55 1.27Banks
VOLKSWAGEN GRP 18-12/11/2021 FRN 495,307.97 1.17Auto Parts &Equipment
SHELL INTL FIN 18-13/11/2023 FRN 490,346.57 1.17Energy
NATIONWIDE BLDG 18-08/03/2024 FRN 481,675.64 1.14Banks
ING BANK NV 18-26/11/2020 FRN 458,551.76 1.08Banks
ICBC/LUXEMBOURG 17-12/10/2020 FRN 456,116.85 1.08Banks
CITIBANK NA 18-01/05/2020 FRN 453,514.70 1.07Banks
USD
Sector
Top Ten Holdings
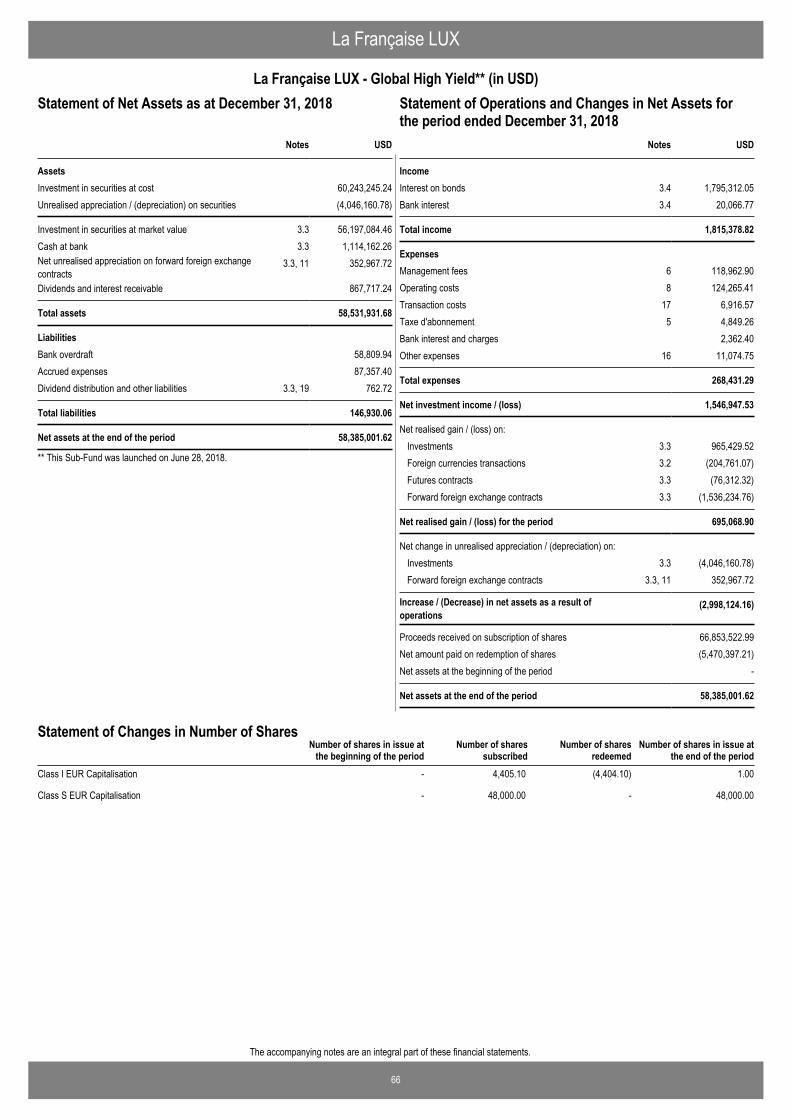
66
The accompanying notes are an integral part of these financial statements.
La Française LUX
La Française LUX - Global High Yield** (in USD)Statement of Operations and Changes in Net Assets for theperiod ended December 31, 2018
USD
AssetsInvestment in securities at cost 60,243,245.24Unrealised appreciation / (depreciation) on securities (4,046,160.78)
Investment in securities at market value 3.3 56,197,084.46Cash at bank 3.3 1,114,162.26Net unrealised appreciation on forward foreign exchangecontracts
3.3, 11 352,967.72
Dividends and interest receivable 867,717.24
Total assets 58,531,931.68
LiabilitiesBank overdraft 58,809.94Accrued expenses 87,357.40Dividend distribution and other liabilities 3.3, 19 762.72
Total liabilities 146,930.06
Net assets at the end of the period 58,385,001.62
Notes
Statement of Net Assets as at December 31, 2018
** This Sub-Fund was launched on June 28, 2018.
IncomeInterest on bonds 3.4 1,795,312.05Bank interest 3.4 20,066.77
Total income 1,815,378.82
ExpensesManagement fees 6 118,962.90Operating costs 8 124,265.41Transaction costs 17 6,916.57Taxe d'abonnement 5 4,849.26Bank interest and charges 2,362.40Other expenses 16 11,074.75
Total expenses 268,431.29
Net investment income / (loss) 1,546,947.53
Net realised gain / (loss) on: Investments 3.3 965,429.52Foreign currencies transactions 3.2 (204,761.07)Futures contracts 3.3 (76,312.32)Forward foreign exchange contracts 3.3 (1,536,234.76)
Net realised gain / (loss) for the period 695,068.90
Net change in unrealised appreciation / (depreciation) on: Investments 3.3 (4,046,160.78)Forward foreign exchange contracts 3.3, 11 352,967.72
Increase / (Decrease) in net assets as a result ofoperations
(2,998,124.16)
Proceeds received on subscription of shares 66,853,522.99Net amount paid on redemption of shares (5,470,397.21)Net assets at the beginning of the period -
Net assets at the end of the period 58,385,001.62
USDNotes
Statement of Operations and Changes in Net Assets forthe period ended December 31, 2018
Number of shares in issue atthe end of the period
Number of shares in issue atthe beginning of the period
Number of sharessubscribed
Number of sharesredeemed
Statement of Changes in Number of Shares
Class I EUR Capitalisation - 4,405.10 (4,404.10) 1.00
Class S EUR Capitalisation - 48,000.00 - 48,000.00
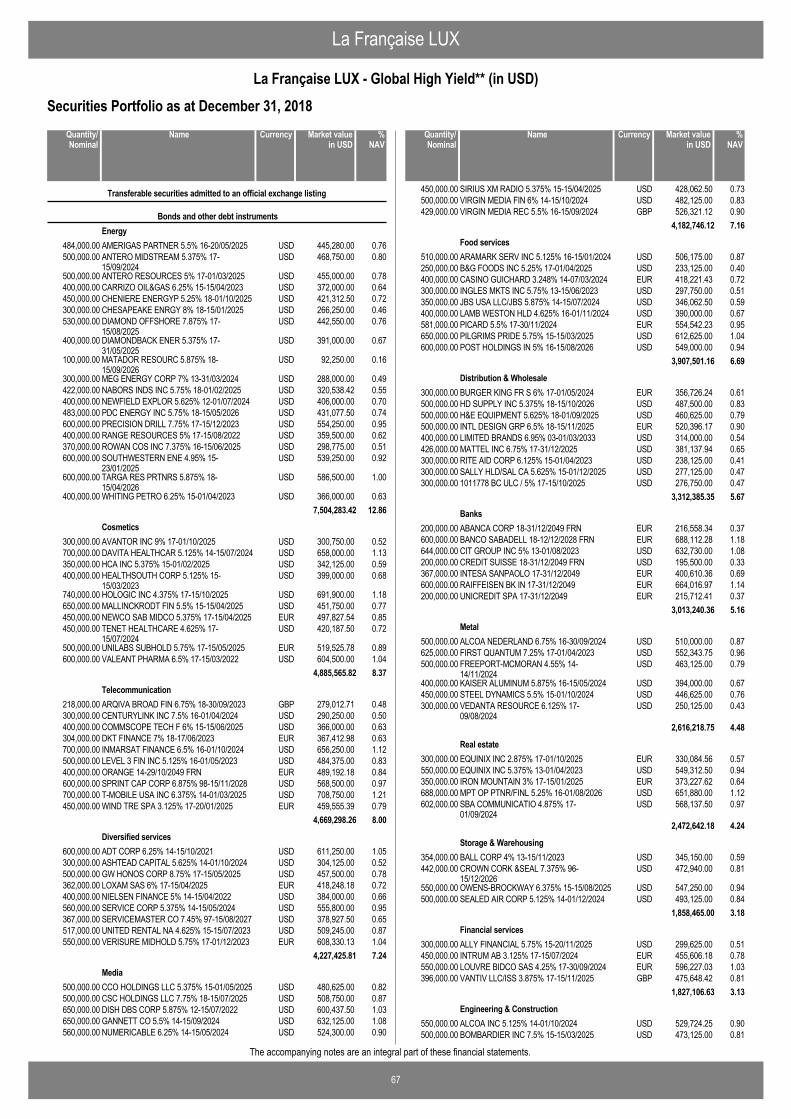
La Française LUX
67
La Française LUX - Global High Yield** (in USD)
The accompanying notes are an integral part of these financial statements.
Securities Portfolio as at December 31, 2018
AMERIGAS PARTNER 5.5% 16-20/05/2025 USD 445,280.00 0.76484,000.00
Transferable securities admitted to an official exchange listing
Bonds and other debt instrumentsEnergy
ANTERO MIDSTREAM 5.375% 17-15/09/2024
USD 468,750.00 0.80500,000.00
ANTERO RESOURCES 5% 17-01/03/2025 USD 455,000.00 0.78500,000.00CARRIZO OIL&GAS 6.25% 15-15/04/2023 USD 372,000.00 0.64400,000.00CHENIERE ENERGYP 5.25% 18-01/10/2025 USD 421,312.50 0.72450,000.00CHESAPEAKE ENRGY 8% 18-15/01/2025 USD 266,250.00 0.46300,000.00DIAMOND OFFSHORE 7.875% 17-15/08/2025
USD 442,550.00 0.76530,000.00
DIAMONDBACK ENER 5.375% 17-31/05/2025
USD 391,000.00 0.67400,000.00
MATADOR RESOURC 5.875% 18-15/09/2026
USD 92,250.00 0.16100,000.00
MEG ENERGY CORP 7% 13-31/03/2024 USD 288,000.00 0.49300,000.00NABORS INDS INC 5.75% 18-01/02/2025 USD 320,538.42 0.55422,000.00NEWFIELD EXPLOR 5.625% 12-01/07/2024 USD 406,000.00 0.70400,000.00PDC ENERGY INC 5.75% 18-15/05/2026 USD 431,077.50 0.74483,000.00PRECISION DRILL 7.75% 17-15/12/2023 USD 554,250.00 0.95600,000.00RANGE RESOURCES 5% 17-15/08/2022 USD 359,500.00 0.62400,000.00ROWAN COS INC 7.375% 16-15/06/2025 USD 298,775.00 0.51370,000.00SOUTHWESTERN ENE 4.95% 15-23/01/2025
USD 539,250.00 0.92600,000.00
TARGA RES PRTNRS 5.875% 18-15/04/2026
USD 586,500.00 1.00600,000.00
WHITING PETRO 6.25% 15-01/04/2023 USD 366,000.00 0.63400,000.007,504,283.42 12.86
AVANTOR INC 9% 17-01/10/2025 USD 300,750.00 0.52300,000.00Cosmetics
DAVITA HEALTHCAR 5.125% 14-15/07/2024 USD 658,000.00 1.13700,000.00HCA INC 5.375% 15-01/02/2025 USD 342,125.00 0.59350,000.00HEALTHSOUTH CORP 5.125% 15-15/03/2023
USD 399,000.00 0.68400,000.00
HOLOGIC INC 4.375% 17-15/10/2025 USD 691,900.00 1.18740,000.00MALLINCKRODT FIN 5.5% 15-15/04/2025 USD 451,750.00 0.77650,000.00NEWCO SAB MIDCO 5.375% 17-15/04/2025 EUR 497,827.54 0.85450,000.00TENET HEALTHCARE 4.625% 17-15/07/2024
USD 420,187.50 0.72450,000.00
UNILABS SUBHOLD 5.75% 17-15/05/2025 EUR 519,525.78 0.89500,000.00VALEANT PHARMA 6.5% 17-15/03/2022 USD 604,500.00 1.04600,000.00
4,885,565.82 8.37
ARQIVA BROAD FIN 6.75% 18-30/09/2023 GBP 279,012.71 0.48218,000.00Telecommunication
CENTURYLINK INC 7.5% 16-01/04/2024 USD 290,250.00 0.50300,000.00COMMSCOPE TECH F 6% 15-15/06/2025 USD 366,000.00 0.63400,000.00DKT FINANCE 7% 18-17/06/2023 EUR 367,412.98 0.63304,000.00INMARSAT FINANCE 6.5% 16-01/10/2024 USD 656,250.00 1.12700,000.00LEVEL 3 FIN INC 5.125% 16-01/05/2023 USD 484,375.00 0.83500,000.00ORANGE 14-29/10/2049 FRN EUR 489,192.18 0.84400,000.00SPRINT CAP CORP 6.875% 98-15/11/2028 USD 568,500.00 0.97600,000.00T-MOBILE USA INC 6.375% 14-01/03/2025 USD 708,750.00 1.21700,000.00WIND TRE SPA 3.125% 17-20/01/2025 EUR 459,555.39 0.79450,000.00
4,669,298.26 8.00
ADT CORP 6.25% 14-15/10/2021 USD 611,250.00 1.05600,000.00Diversified services
ASHTEAD CAPITAL 5.625% 14-01/10/2024 USD 304,125.00 0.52300,000.00GW HONOS CORP 8.75% 17-15/05/2025 USD 457,500.00 0.78500,000.00LOXAM SAS 6% 17-15/04/2025 EUR 418,248.18 0.72362,000.00NIELSEN FINANCE 5% 14-15/04/2022 USD 384,000.00 0.66400,000.00SERVICE CORP 5.375% 14-15/05/2024 USD 555,800.00 0.95560,000.00SERVICEMASTER CO 7.45% 97-15/08/2027 USD 378,927.50 0.65367,000.00UNITED RENTAL NA 4.625% 15-15/07/2023 USD 509,245.00 0.87517,000.00VERISURE MIDHOLD 5.75% 17-01/12/2023 EUR 608,330.13 1.04550,000.00
4,227,425.81 7.24
CCO HOLDINGS LLC 5.375% 15-01/05/2025 USD 480,625.00 0.82500,000.00Media
CSC HOLDINGS LLC 7.75% 18-15/07/2025 USD 508,750.00 0.87500,000.00DISH DBS CORP 5.875% 12-15/07/2022 USD 600,437.50 1.03650,000.00GANNETT CO 5.5% 14-15/09/2024 USD 632,125.00 1.08650,000.00NUMERICABLE 6.25% 14-15/05/2024 USD 524,300.00 0.90560,000.00
NameQuantity/Nominal
Market valuein USD
Currency %NAV
SIRIUS XM RADIO 5.375% 15-15/04/2025 USD 428,062.50 0.73450,000.00VIRGIN MEDIA FIN 6% 14-15/10/2024 USD 482,125.00 0.83500,000.00VIRGIN MEDIA REC 5.5% 16-15/09/2024 GBP 526,321.12 0.90429,000.00
4,182,746.12 7.16
ARAMARK SERV INC 5.125% 16-15/01/2024 USD 506,175.00 0.87510,000.00Food services
B&G FOODS INC 5.25% 17-01/04/2025 USD 233,125.00 0.40250,000.00CASINO GUICHARD 3.248% 14-07/03/2024 EUR 418,221.43 0.72400,000.00INGLES MKTS INC 5.75% 13-15/06/2023 USD 297,750.00 0.51300,000.00JBS USA LLC/JBS 5.875% 14-15/07/2024 USD 346,062.50 0.59350,000.00LAMB WESTON HLD 4.625% 16-01/11/2024 USD 390,000.00 0.67400,000.00PICARD 5.5% 17-30/11/2024 EUR 554,542.23 0.95581,000.00PILGRIMS PRIDE 5.75% 15-15/03/2025 USD 612,625.00 1.04650,000.00POST HOLDINGS IN 5% 16-15/08/2026 USD 549,000.00 0.94600,000.00
3,907,501.16 6.69
BURGER KING FR S 6% 17-01/05/2024 EUR 356,726.24 0.61300,000.00Distribution & Wholesale
HD SUPPLY INC 5.375% 18-15/10/2026 USD 487,500.00 0.83500,000.00H&E EQUIPMENT 5.625% 18-01/09/2025 USD 460,625.00 0.79500,000.00INTL DESIGN GRP 6.5% 18-15/11/2025 EUR 520,396.17 0.90500,000.00LIMITED BRANDS 6.95% 03-01/03/2033 USD 314,000.00 0.54400,000.00MATTEL INC 6.75% 17-31/12/2025 USD 381,137.94 0.65426,000.00RITE AID CORP 6.125% 15-01/04/2023 USD 238,125.00 0.41300,000.00SALLY HLD/SAL CA 5.625% 15-01/12/2025 USD 277,125.00 0.47300,000.001011778 BC ULC / 5% 17-15/10/2025 USD 276,750.00 0.47300,000.00
3,312,385.35 5.67
ABANCA CORP 18-31/12/2049 FRN EUR 216,558.34 0.37200,000.00Banks
BANCO SABADELL 18-12/12/2028 FRN EUR 688,112.28 1.18600,000.00CIT GROUP INC 5% 13-01/08/2023 USD 632,730.00 1.08644,000.00CREDIT SUISSE 18-31/12/2049 FRN USD 195,500.00 0.33200,000.00INTESA SANPAOLO 17-31/12/2049 EUR 400,610.36 0.69367,000.00RAIFFEISEN BK IN 17-31/12/2049 EUR 664,016.97 1.14600,000.00UNICREDIT SPA 17-31/12/2049 EUR 215,712.41 0.37200,000.00
3,013,240.36 5.16
ALCOA NEDERLAND 6.75% 16-30/09/2024 USD 510,000.00 0.87500,000.00Metal
FIRST QUANTUM 7.25% 17-01/04/2023 USD 552,343.75 0.96625,000.00FREEPORT-MCMORAN 4.55% 14-14/11/2024
USD 463,125.00 0.79500,000.00
KAISER ALUMINUM 5.875% 16-15/05/2024 USD 394,000.00 0.67400,000.00STEEL DYNAMICS 5.5% 15-01/10/2024 USD 446,625.00 0.76450,000.00VEDANTA RESOURCE 6.125% 17-09/08/2024
USD 250,125.00 0.43300,000.00
2,616,218.75 4.48
EQUINIX INC 2.875% 17-01/10/2025 EUR 330,084.56 0.57300,000.00Real estate
EQUINIX INC 5.375% 13-01/04/2023 USD 549,312.50 0.94550,000.00IRON MOUNTAIN 3% 17-15/01/2025 EUR 373,227.62 0.64350,000.00MPT OP PTNR/FINL 5.25% 16-01/08/2026 USD 651,880.00 1.12688,000.00SBA COMMUNICATIO 4.875% 17-01/09/2024
USD 568,137.50 0.97602,000.00
2,472,642.18 4.24
BALL CORP 4% 13-15/11/2023 USD 345,150.00 0.59354,000.00Storage & Warehousing
CROWN CORK &SEAL 7.375% 96-15/12/2026
USD 472,940.00 0.81442,000.00
OWENS-BROCKWAY 6.375% 15-15/08/2025 USD 547,250.00 0.94550,000.00SEALED AIR CORP 5.125% 14-01/12/2024 USD 493,125.00 0.84500,000.00
1,858,465.00 3.18
ALLY FINANCIAL 5.75% 15-20/11/2025 USD 299,625.00 0.51300,000.00Financial services
INTRUM AB 3.125% 17-15/07/2024 EUR 455,606.18 0.78450,000.00LOUVRE BIDCO SAS 4.25% 17-30/09/2024 EUR 596,227.03 1.03550,000.00VANTIV LLC/ISS 3.875% 17-15/11/2025 GBP 475,648.42 0.81396,000.00
1,827,106.63 3.13
ALCOA INC 5.125% 14-01/10/2024 USD 529,724.25 0.90550,000.00Engineering & Construction
BOMBARDIER INC 7.5% 15-15/03/2025 USD 473,125.00 0.81500,000.00
NameQuantity/Nominal
Market valuein USD
Currency %NAV
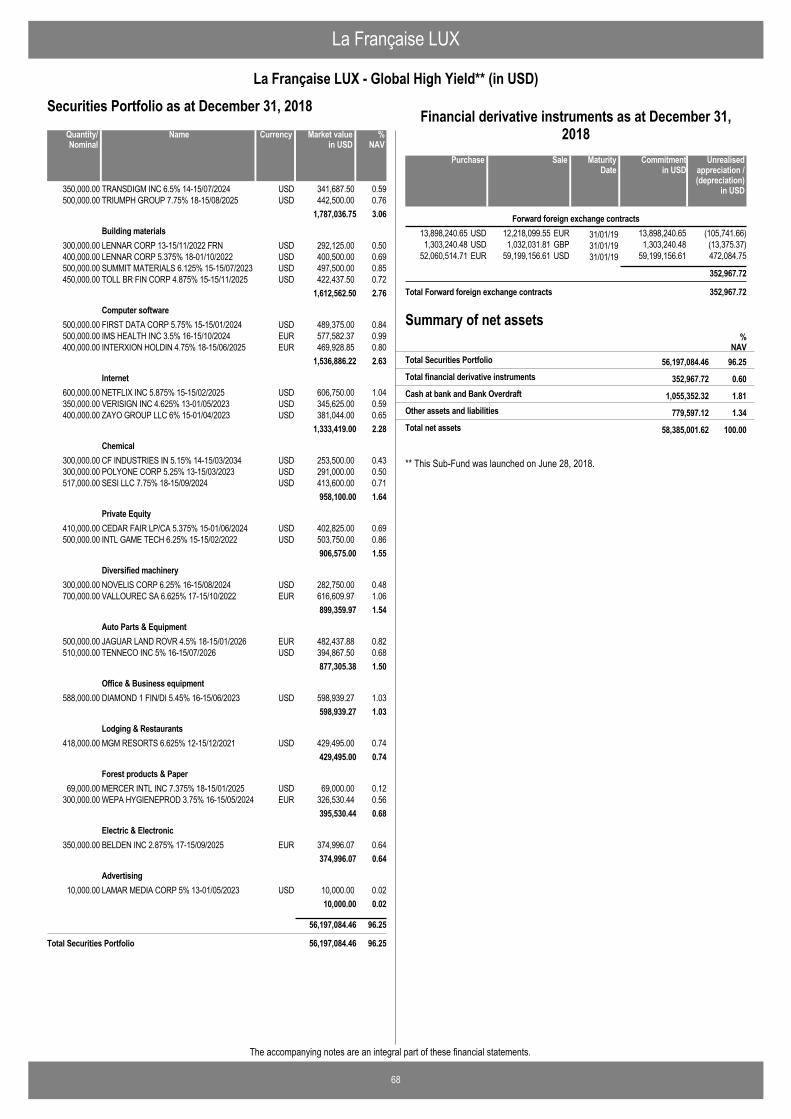
La Française LUX
68
La Française LUX - Global High Yield** (in USD)
The accompanying notes are an integral part of these financial statements.
Securities Portfolio as at December 31, 2018
TRANSDIGM INC 6.5% 14-15/07/2024 USD 341,687.50 0.59350,000.00TRIUMPH GROUP 7.75% 18-15/08/2025 USD 442,500.00 0.76500,000.00
1,787,036.75 3.06
LENNAR CORP 13-15/11/2022 FRN USD 292,125.00 0.50300,000.00Building materials
LENNAR CORP 5.375% 18-01/10/2022 USD 400,500.00 0.69400,000.00SUMMIT MATERIALS 6.125% 15-15/07/2023 USD 497,500.00 0.85500,000.00TOLL BR FIN CORP 4.875% 15-15/11/2025 USD 422,437.50 0.72450,000.00
1,612,562.50 2.76
FIRST DATA CORP 5.75% 15-15/01/2024 USD 489,375.00 0.84500,000.00Computer software
IMS HEALTH INC 3.5% 16-15/10/2024 EUR 577,582.37 0.99500,000.00INTERXION HOLDIN 4.75% 18-15/06/2025 EUR 469,928.85 0.80400,000.00
1,536,886.22 2.63
NETFLIX INC 5.875% 15-15/02/2025 USD 606,750.00 1.04600,000.00Internet
VERISIGN INC 4.625% 13-01/05/2023 USD 345,625.00 0.59350,000.00ZAYO GROUP LLC 6% 15-01/04/2023 USD 381,044.00 0.65400,000.00
1,333,419.00 2.28
CF INDUSTRIES IN 5.15% 14-15/03/2034 USD 253,500.00 0.43300,000.00Chemical
POLYONE CORP 5.25% 13-15/03/2023 USD 291,000.00 0.50300,000.00SESI LLC 7.75% 18-15/09/2024 USD 413,600.00 0.71517,000.00
958,100.00 1.64
CEDAR FAIR LP/CA 5.375% 15-01/06/2024 USD 402,825.00 0.69410,000.00Private Equity
INTL GAME TECH 6.25% 15-15/02/2022 USD 503,750.00 0.86500,000.00906,575.00 1.55
NOVELIS CORP 6.25% 16-15/08/2024 USD 282,750.00 0.48300,000.00Diversified machinery
VALLOUREC SA 6.625% 17-15/10/2022 EUR 616,609.97 1.06700,000.00899,359.97 1.54
JAGUAR LAND ROVR 4.5% 18-15/01/2026 EUR 482,437.88 0.82500,000.00Auto Parts & Equipment
TENNECO INC 5% 16-15/07/2026 USD 394,867.50 0.68510,000.00877,305.38 1.50
DIAMOND 1 FIN/DI 5.45% 16-15/06/2023 USD 598,939.27 1.03588,000.00Office & Business equipment
598,939.27 1.03
MGM RESORTS 6.625% 12-15/12/2021 USD 429,495.00 0.74418,000.00Lodging & Restaurants
429,495.00 0.74
MERCER INTL INC 7.375% 18-15/01/2025 USD 69,000.00 0.1269,000.00Forest products & Paper
WEPA HYGIENEPROD 3.75% 16-15/05/2024 EUR 326,530.44 0.56300,000.00395,530.44 0.68
BELDEN INC 2.875% 17-15/09/2025 EUR 374,996.07 0.64350,000.00Electric & Electronic
374,996.07 0.64
LAMAR MEDIA CORP 5% 13-01/05/2023 USD 10,000.00 0.0210,000.00Advertising
10,000.00 0.02
56,197,084.46 96.25
Total Securities Portfolio 56,197,084.46 96.25
NameQuantity/Nominal
Market valuein USD
Currency %NAV
12,218,099.55 31/01/1913,898,240.65 (105,741.66)EURUSD 13,898,240.65Forward foreign exchange contracts
1,032,031.81 31/01/191,303,240.48 (13,375.37)GBPUSD 1,303,240.4859,199,156.61 31/01/1952,060,514.71 472,084.75USDEUR 59,199,156.61
352,967.72
Total Forward foreign exchange contracts 352,967.72
SalePurchase Unrealisedappreciation /(depreciation)
in USD
MaturityDate
Commitmentin USD
Financial derivative instruments as at December 31,2018
Summary of net assets
352,967.72 0.60Total financial derivative instruments
%NAV
56,197,084.46 96.25Total Securities Portfolio
1,055,352.32 1.81Cash at bank and Bank Overdraft
779,597.12 1.34Other assets and liabilities
58,385,001.62 100.00Total net assets
** This Sub-Fund was launched on June 28, 2018.
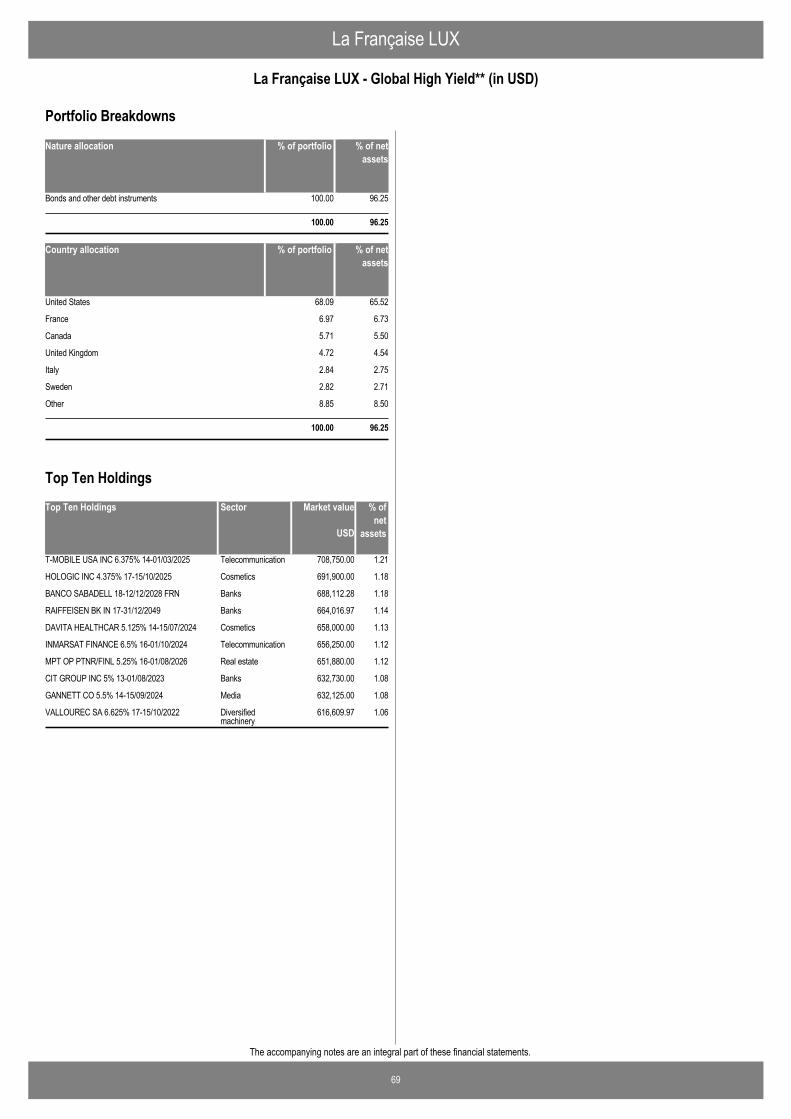
La Française LUX
69
La Française LUX - Global High Yield** (in USD)
The accompanying notes are an integral part of these financial statements.
Nature allocation % of portfolio % of netassets
Bonds and other debt instruments 100.00 96.25
100.00 96.25
Country allocation % of portfolio % of netassets
United States 68.09 65.52
France 6.97 6.73
Canada 5.71 5.50
United Kingdom 4.72 4.54
Italy 2.84 2.75
Sweden 2.82 2.71
Other 8.85 8.50
100.00 96.25
Portfolio Breakdowns
Top Ten Holdings Market value % ofnet
assets
T-MOBILE USA INC 6.375% 14-01/03/2025 708,750.00 1.21Telecommunication
HOLOGIC INC 4.375% 17-15/10/2025 691,900.00 1.18Cosmetics
BANCO SABADELL 18-12/12/2028 FRN 688,112.28 1.18Banks
RAIFFEISEN BK IN 17-31/12/2049 664,016.97 1.14Banks
DAVITA HEALTHCAR 5.125% 14-15/07/2024 658,000.00 1.13Cosmetics
INMARSAT FINANCE 6.5% 16-01/10/2024 656,250.00 1.12Telecommunication
MPT OP PTNR/FINL 5.25% 16-01/08/2026 651,880.00 1.12Real estate
CIT GROUP INC 5% 13-01/08/2023 632,730.00 1.08Banks
GANNETT CO 5.5% 14-15/09/2024 632,125.00 1.08Media
VALLOUREC SA 6.625% 17-15/10/2022 616,609.97 1.06Diversifiedmachinery
USD
Sector
Top Ten Holdings
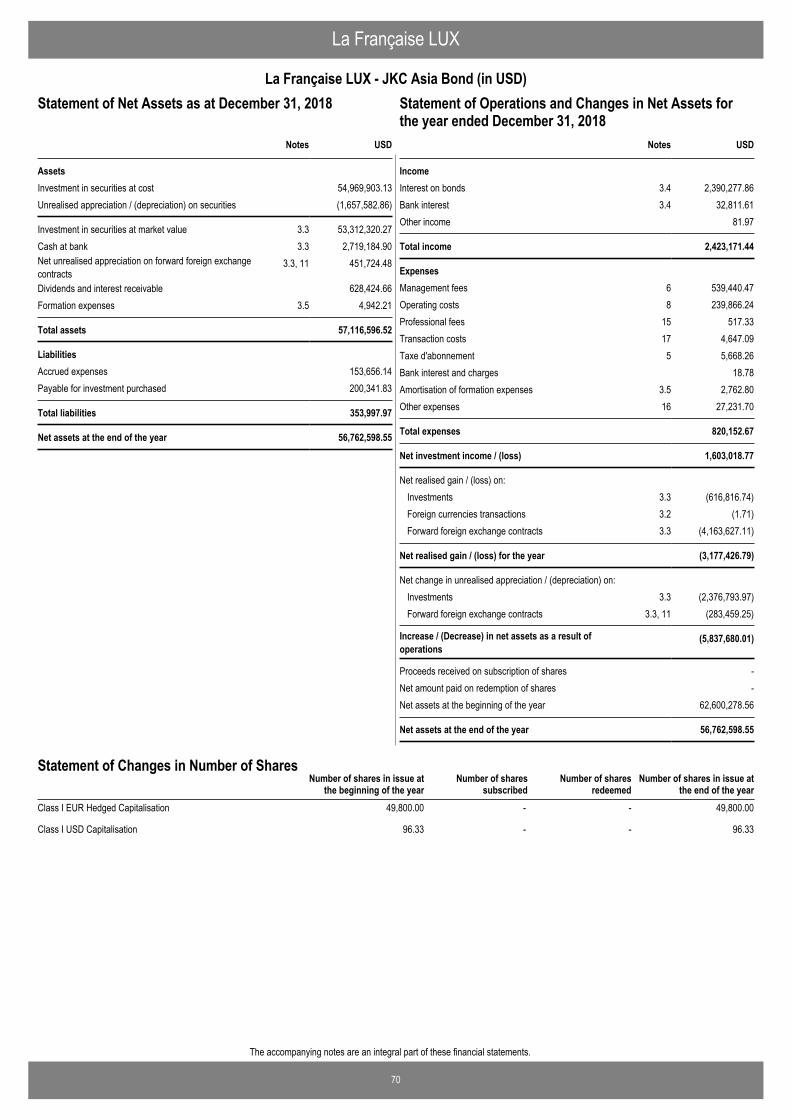
70
The accompanying notes are an integral part of these financial statements.
La Française LUX
La Française LUX - JKC Asia Bond (in USD)Statement of Operations and Changes in Net Assets for theyear ended December 31, 2018
USD
AssetsInvestment in securities at cost 54,969,903.13Unrealised appreciation / (depreciation) on securities (1,657,582.86)
Investment in securities at market value 3.3 53,312,320.27Cash at bank 3.3 2,719,184.90Net unrealised appreciation on forward foreign exchangecontracts
3.3, 11 451,724.48
Dividends and interest receivable 628,424.66Formation expenses 3.5 4,942.21
Total assets 57,116,596.52
LiabilitiesAccrued expenses 153,656.14Payable for investment purchased 200,341.83
Total liabilities 353,997.97
Net assets at the end of the year 56,762,598.55
Notes
Statement of Net Assets as at December 31, 2018
IncomeInterest on bonds 3.4 2,390,277.86Bank interest 3.4 32,811.61Other income 81.97
Total income 2,423,171.44
ExpensesManagement fees 6 539,440.47Operating costs 8 239,866.24Professional fees 15 517.33Transaction costs 17 4,647.09Taxe d'abonnement 5 5,668.26Bank interest and charges 18.78Amortisation of formation expenses 3.5 2,762.80Other expenses 16 27,231.70
Total expenses 820,152.67
Net investment income / (loss) 1,603,018.77
Net realised gain / (loss) on: Investments 3.3 (616,816.74)Foreign currencies transactions 3.2 (1.71)Forward foreign exchange contracts 3.3 (4,163,627.11)
Net realised gain / (loss) for the year (3,177,426.79)
Net change in unrealised appreciation / (depreciation) on: Investments 3.3 (2,376,793.97)Forward foreign exchange contracts 3.3, 11 (283,459.25)
Increase / (Decrease) in net assets as a result ofoperations
(5,837,680.01)
Proceeds received on subscription of shares -Net amount paid on redemption of shares -Net assets at the beginning of the year 62,600,278.56
Net assets at the end of the year 56,762,598.55
USDNotes
Statement of Operations and Changes in Net Assets forthe year ended December 31, 2018
Number of shares in issue atthe end of the year
Number of shares in issue atthe beginning of the year
Number of sharessubscribed
Number of sharesredeemed
Statement of Changes in Number of Shares
Class I EUR Hedged Capitalisation 49,800.00 - - 49,800.00
Class I USD Capitalisation 96.33 - - 96.33
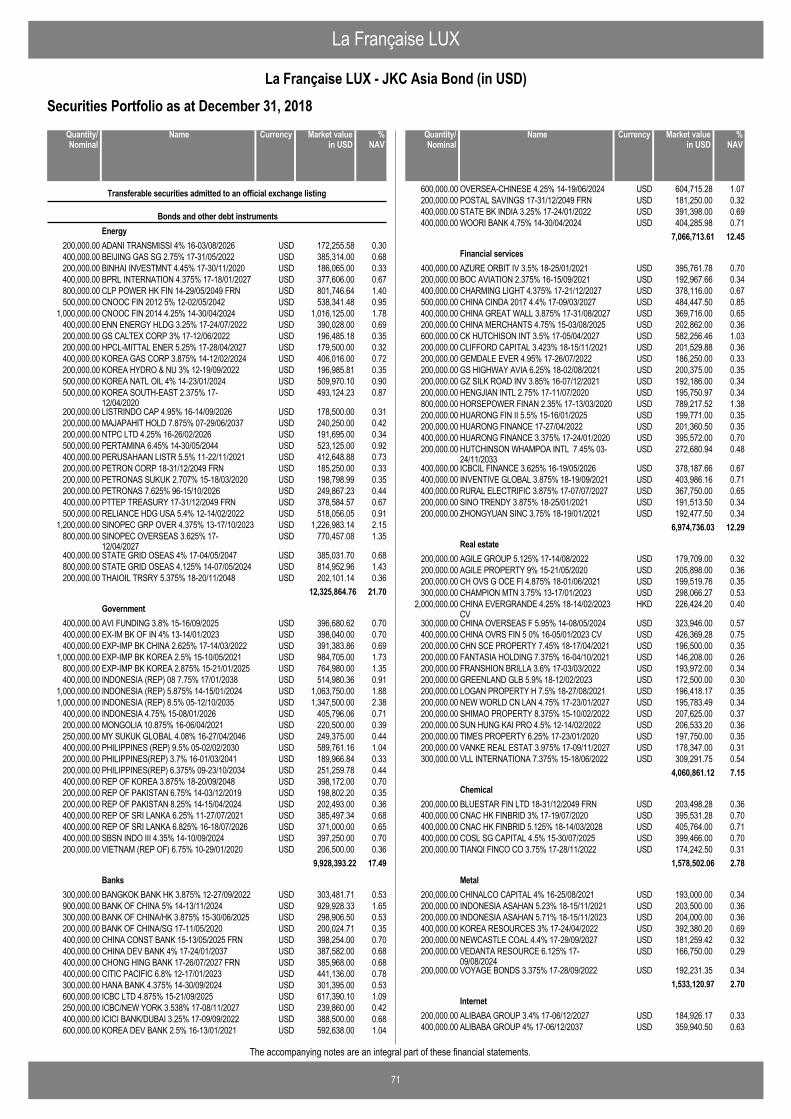
La Française LUX
71
La Française LUX - JKC Asia Bond (in USD)
The accompanying notes are an integral part of these financial statements.
Securities Portfolio as at December 31, 2018
ADANI TRANSMISSI 4% 16-03/08/2026 USD 172,255.58 0.30200,000.00
Transferable securities admitted to an official exchange listing
Bonds and other debt instrumentsEnergy
BEIJING GAS SG 2.75% 17-31/05/2022 USD 385,314.00 0.68400,000.00BINHAI INVESTMNT 4.45% 17-30/11/2020 USD 186,065.00 0.33200,000.00BPRL INTERNATION 4.375% 17-18/01/2027 USD 377,606.00 0.67400,000.00CLP POWER HK FIN 14-29/05/2049 FRN USD 801,746.64 1.40800,000.00CNOOC FIN 2012 5% 12-02/05/2042 USD 538,341.48 0.95500,000.00CNOOC FIN 2014 4.25% 14-30/04/2024 USD 1,016,125.00 1.781,000,000.00ENN ENERGY HLDG 3.25% 17-24/07/2022 USD 390,028.00 0.69400,000.00GS CALTEX CORP 3% 17-12/06/2022 USD 196,485.18 0.35200,000.00HPCL-MITTAL ENER 5.25% 17-28/04/2027 USD 179,500.00 0.32200,000.00KOREA GAS CORP 3.875% 14-12/02/2024 USD 406,016.00 0.72400,000.00KOREA HYDRO & NU 3% 12-19/09/2022 USD 196,985.81 0.35200,000.00KOREA NATL OIL 4% 14-23/01/2024 USD 509,970.10 0.90500,000.00KOREA SOUTH-EAST 2.375% 17-12/04/2020
USD 493,124.23 0.87500,000.00
LISTRINDO CAP 4.95% 16-14/09/2026 USD 178,500.00 0.31200,000.00MAJAPAHIT HOLD 7.875% 07-29/06/2037 USD 240,250.00 0.42200,000.00NTPC LTD 4.25% 16-26/02/2026 USD 191,695.00 0.34200,000.00PERTAMINA 6.45% 14-30/05/2044 USD 523,125.00 0.92500,000.00PERUSAHAAN LISTR 5.5% 11-22/11/2021 USD 412,648.88 0.73400,000.00PETRON CORP 18-31/12/2049 FRN USD 185,250.00 0.33200,000.00PETRONAS SUKUK 2.707% 15-18/03/2020 USD 198,798.99 0.35200,000.00PETRONAS 7.625% 96-15/10/2026 USD 249,867.23 0.44200,000.00PTTEP TREASURY 17-31/12/2049 FRN USD 378,584.57 0.67400,000.00RELIANCE HDG USA 5.4% 12-14/02/2022 USD 518,056.05 0.91500,000.00SINOPEC GRP OVER 4.375% 13-17/10/2023 USD 1,226,983.14 2.151,200,000.00SINOPEC OVERSEAS 3.625% 17-12/04/2027
USD 770,457.08 1.35800,000.00
STATE GRID OSEAS 4% 17-04/05/2047 USD 385,031.70 0.68400,000.00STATE GRID OSEAS 4.125% 14-07/05/2024 USD 814,952.96 1.43800,000.00THAIOIL TRSRY 5.375% 18-20/11/2048 USD 202,101.14 0.36200,000.00
12,325,864.76 21.70
AVI FUNDING 3.8% 15-16/09/2025 USD 396,680.62 0.70400,000.00Government
EX-IM BK OF IN 4% 13-14/01/2023 USD 398,040.00 0.70400,000.00EXP-IMP BK CHINA 2.625% 17-14/03/2022 USD 391,383.86 0.69400,000.00EXP-IMP BK KOREA 2.5% 15-10/05/2021 USD 984,705.00 1.731,000,000.00EXP-IMP BK KOREA 2.875% 15-21/01/2025 USD 764,980.00 1.35800,000.00INDONESIA (REP) 08 7.75% 17/01/2038 USD 514,980.36 0.91400,000.00INDONESIA (REP) 5.875% 14-15/01/2024 USD 1,063,750.00 1.881,000,000.00INDONESIA (REP) 8.5% 05-12/10/2035 USD 1,347,500.00 2.381,000,000.00INDONESIA 4.75% 15-08/01/2026 USD 405,796.06 0.71400,000.00MONGOLIA 10.875% 16-06/04/2021 USD 220,500.00 0.39200,000.00MY SUKUK GLOBAL 4.08% 16-27/04/2046 USD 249,375.00 0.44250,000.00PHILIPPINES (REP) 9.5% 05-02/02/2030 USD 589,761.16 1.04400,000.00PHILIPPINES(REP) 3.7% 16-01/03/2041 USD 189,966.84 0.33200,000.00PHILIPPINES(REP) 6.375% 09-23/10/2034 USD 251,259.78 0.44200,000.00REP OF KOREA 3.875% 18-20/09/2048 USD 398,172.00 0.70400,000.00REP OF PAKISTAN 6.75% 14-03/12/2019 USD 198,802.20 0.35200,000.00REP OF PAKISTAN 8.25% 14-15/04/2024 USD 202,493.00 0.36200,000.00REP OF SRI LANKA 6.25% 11-27/07/2021 USD 385,497.34 0.68400,000.00REP OF SRI LANKA 6.825% 16-18/07/2026 USD 371,000.00 0.65400,000.00SBSN INDO III 4.35% 14-10/09/2024 USD 397,250.00 0.70400,000.00VIETNAM (REP OF) 6.75% 10-29/01/2020 USD 206,500.00 0.36200,000.00
9,928,393.22 17.49
BANGKOK BANK HK 3.875% 12-27/09/2022 USD 303,481.71 0.53300,000.00Banks
BANK OF CHINA 5% 14-13/11/2024 USD 929,928.33 1.65900,000.00BANK OF CHINA/HK 3.875% 15-30/06/2025 USD 298,906.50 0.53300,000.00BANK OF CHINA/SG 17-11/05/2020 USD 200,024.71 0.35200,000.00CHINA CONST BANK 15-13/05/2025 FRN USD 398,254.00 0.70400,000.00CHINA DEV BANK 4% 17-24/01/2037 USD 387,582.00 0.68400,000.00CHONG HING BANK 17-26/07/2027 FRN USD 385,968.00 0.68400,000.00CITIC PACIFIC 6.8% 12-17/01/2023 USD 441,136.00 0.78400,000.00HANA BANK 4.375% 14-30/09/2024 USD 301,395.00 0.53300,000.00ICBC LTD 4.875% 15-21/09/2025 USD 617,390.10 1.09600,000.00ICBC/NEW YORK 3.538% 17-08/11/2027 USD 239,860.00 0.42250,000.00ICICI BANK/DUBAI 3.25% 17-09/09/2022 USD 388,500.00 0.68400,000.00KOREA DEV BANK 2.5% 16-13/01/2021 USD 592,638.00 1.04600,000.00
NameQuantity/Nominal
Market valuein USD
Currency %NAV
OVERSEA-CHINESE 4.25% 14-19/06/2024 USD 604,715.28 1.07600,000.00POSTAL SAVINGS 17-31/12/2049 FRN USD 181,250.00 0.32200,000.00STATE BK INDIA 3.25% 17-24/01/2022 USD 391,398.00 0.69400,000.00WOORI BANK 4.75% 14-30/04/2024 USD 404,285.98 0.71400,000.00
7,066,713.61 12.45
AZURE ORBIT IV 3.5% 18-25/01/2021 USD 395,761.78 0.70400,000.00Financial services
BOC AVIATION 2.375% 16-15/09/2021 USD 192,967.66 0.34200,000.00CHARMING LIGHT 4.375% 17-21/12/2027 USD 378,116.00 0.67400,000.00CHINA CINDA 2017 4.4% 17-09/03/2027 USD 484,447.50 0.85500,000.00CHINA GREAT WALL 3.875% 17-31/08/2027 USD 369,716.00 0.65400,000.00CHINA MERCHANTS 4.75% 15-03/08/2025 USD 202,862.00 0.36200,000.00CK HUTCHISON INT 3.5% 17-05/04/2027 USD 582,256.46 1.03600,000.00CLIFFORD CAPITAL 3.423% 18-15/11/2021 USD 201,529.88 0.36200,000.00GEMDALE EVER 4.95% 17-26/07/2022 USD 186,250.00 0.33200,000.00GS HIGHWAY AVIA 6.25% 18-02/08/2021 USD 200,375.00 0.35200,000.00GZ SILK ROAD INV 3.85% 16-07/12/2021 USD 192,186.00 0.34200,000.00HENGJIAN INTL 2.75% 17-11/07/2020 USD 195,750.97 0.34200,000.00HORSEPOWER FINAN 2.35% 17-13/03/2020 USD 789,217.52 1.38800,000.00HUARONG FIN II 5.5% 15-16/01/2025 USD 199,771.00 0.35200,000.00HUARONG FINANCE 17-27/04/2022 USD 201,360.50 0.35200,000.00HUARONG FINANCE 3.375% 17-24/01/2020 USD 395,572.00 0.70400,000.00HUTCHINSON WHAMPOA INTL 7.45% 03-24/11/2033
USD 272,680.94 0.48200,000.00
ICBCIL FINANCE 3.625% 16-19/05/2026 USD 378,187.66 0.67400,000.00INVENTIVE GLOBAL 3.875% 18-19/09/2021 USD 403,986.16 0.71400,000.00RURAL ELECTRIFIC 3.875% 17-07/07/2027 USD 367,750.00 0.65400,000.00SINO TRENDY 3.875% 18-25/01/2021 USD 191,513.50 0.34200,000.00ZHONGYUAN SINC 3.75% 18-19/01/2021 USD 192,477.50 0.34200,000.00
6,974,736.03 12.29
AGILE GROUP 5.125% 17-14/08/2022 USD 179,709.00 0.32200,000.00Real estate
AGILE PROPERTY 9% 15-21/05/2020 USD 205,898.00 0.36200,000.00CH OVS G OCE FI 4.875% 18-01/06/2021 USD 199,519.76 0.35200,000.00CHAMPION MTN 3.75% 13-17/01/2023 USD 298,066.27 0.53300,000.00CHINA EVERGRANDE 4.25% 18-14/02/2023CV
HKD 226,424.20 0.402,000,000.00
CHINA OVERSEAS F 5.95% 14-08/05/2024 USD 323,946.00 0.57300,000.00CHINA OVRS FIN 5 0% 16-05/01/2023 CV USD 426,369.28 0.75400,000.00CHN SCE PROPERTY 7.45% 18-17/04/2021 USD 196,500.00 0.35200,000.00FANTASIA HOLDING 7.375% 16-04/10/2021 USD 146,208.00 0.26200,000.00FRANSHION BRILLA 3.6% 17-03/03/2022 USD 193,972.00 0.34200,000.00GREENLAND GLB 5.9% 18-12/02/2023 USD 172,500.00 0.30200,000.00LOGAN PROPERTY H 7.5% 18-27/08/2021 USD 196,418.17 0.35200,000.00NEW WORLD CN LAN 4.75% 17-23/01/2027 USD 195,783.49 0.34200,000.00SHIMAO PROPERTY 8.375% 15-10/02/2022 USD 207,625.00 0.37200,000.00SUN HUNG KAI PRO 4.5% 12-14/02/2022 USD 206,533.20 0.36200,000.00TIMES PROPERTY 6.25% 17-23/01/2020 USD 197,750.00 0.35200,000.00VANKE REAL ESTAT 3.975% 17-09/11/2027 USD 178,347.00 0.31200,000.00VLL INTERNATIONA 7.375% 15-18/06/2022 USD 309,291.75 0.54300,000.00
4,060,861.12 7.15
BLUESTAR FIN LTD 18-31/12/2049 FRN USD 203,498.28 0.36200,000.00Chemical
CNAC HK FINBRID 3% 17-19/07/2020 USD 395,531.28 0.70400,000.00CNAC HK FINBRID 5.125% 18-14/03/2028 USD 405,764.00 0.71400,000.00COSL SG CAPITAL 4.5% 15-30/07/2025 USD 399,466.00 0.70400,000.00TIANQI FINCO CO 3.75% 17-28/11/2022 USD 174,242.50 0.31200,000.00
1,578,502.06 2.78
CHINALCO CAPITAL 4% 16-25/08/2021 USD 193,000.00 0.34200,000.00Metal
INDONESIA ASAHAN 5.23% 18-15/11/2021 USD 203,500.00 0.36200,000.00INDONESIA ASAHAN 5.71% 18-15/11/2023 USD 204,000.00 0.36200,000.00KOREA RESOURCES 3% 17-24/04/2022 USD 392,380.20 0.69400,000.00NEWCASTLE COAL 4.4% 17-29/09/2027 USD 181,259.42 0.32200,000.00VEDANTA RESOURCE 6.125% 17-09/08/2024
USD 166,750.00 0.29200,000.00
VOYAGE BONDS 3.375% 17-28/09/2022 USD 192,231.35 0.34200,000.001,533,120.97 2.70
ALIBABA GROUP 3.4% 17-06/12/2027 USD 184,926.17 0.33200,000.00Internet
ALIBABA GROUP 4% 17-06/12/2037 USD 359,940.50 0.63400,000.00
NameQuantity/Nominal
Market valuein USD
Currency %NAV
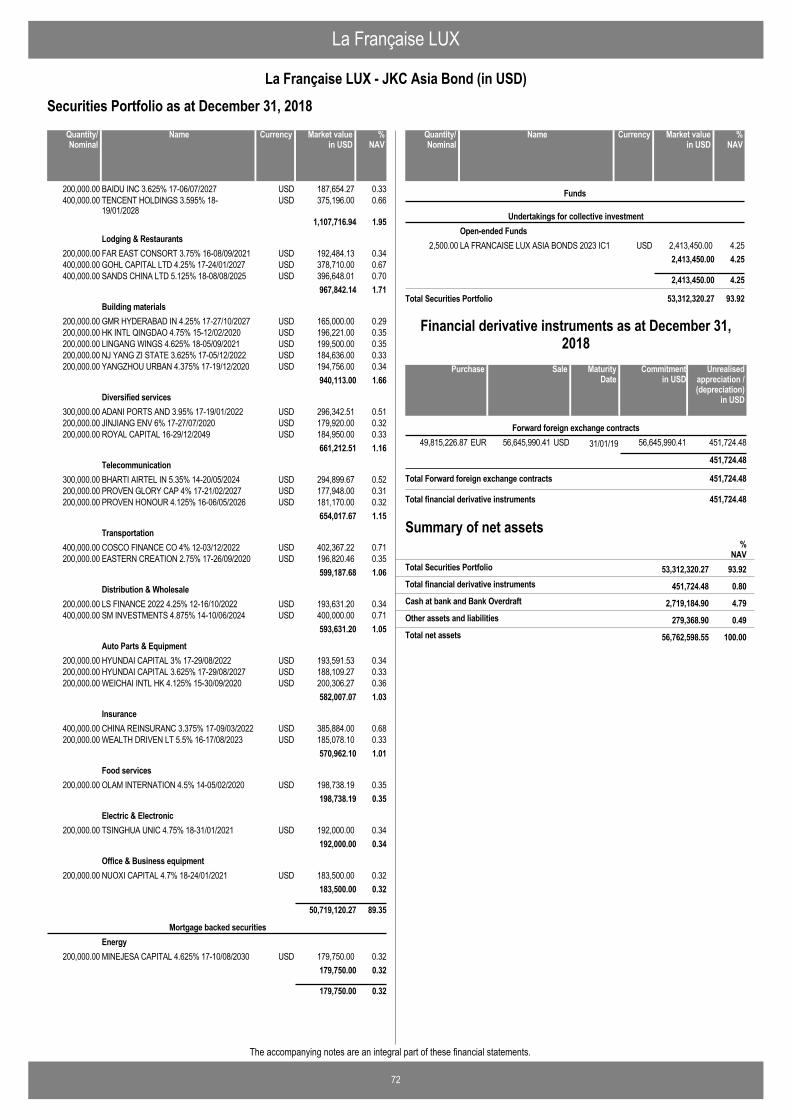
La Française LUX
72
La Française LUX - JKC Asia Bond (in USD)
The accompanying notes are an integral part of these financial statements.
Securities Portfolio as at December 31, 2018
BAIDU INC 3.625% 17-06/07/2027 USD 187,654.27 0.33200,000.00TENCENT HOLDINGS 3.595% 18-19/01/2028
USD 375,196.00 0.66400,000.00
1,107,716.94 1.95
FAR EAST CONSORT 3.75% 16-08/09/2021 USD 192,484.13 0.34200,000.00Lodging & Restaurants
GOHL CAPITAL LTD 4.25% 17-24/01/2027 USD 378,710.00 0.67400,000.00SANDS CHINA LTD 5.125% 18-08/08/2025 USD 396,648.01 0.70400,000.00
967,842.14 1.71
GMR HYDERABAD IN 4.25% 17-27/10/2027 USD 165,000.00 0.29200,000.00Building materials
HK INTL QINGDAO 4.75% 15-12/02/2020 USD 196,221.00 0.35200,000.00LINGANG WINGS 4.625% 18-05/09/2021 USD 199,500.00 0.35200,000.00NJ YANG ZI STATE 3.625% 17-05/12/2022 USD 184,636.00 0.33200,000.00YANGZHOU URBAN 4.375% 17-19/12/2020 USD 194,756.00 0.34200,000.00
940,113.00 1.66
ADANI PORTS AND 3.95% 17-19/01/2022 USD 296,342.51 0.51300,000.00Diversified services
JINJIANG ENV 6% 17-27/07/2020 USD 179,920.00 0.32200,000.00ROYAL CAPITAL 16-29/12/2049 USD 184,950.00 0.33200,000.00
661,212.51 1.16
BHARTI AIRTEL IN 5.35% 14-20/05/2024 USD 294,899.67 0.52300,000.00Telecommunication
PROVEN GLORY CAP 4% 17-21/02/2027 USD 177,948.00 0.31200,000.00PROVEN HONOUR 4.125% 16-06/05/2026 USD 181,170.00 0.32200,000.00
654,017.67 1.15
COSCO FINANCE CO 4% 12-03/12/2022 USD 402,367.22 0.71400,000.00Transportation
EASTERN CREATION 2.75% 17-26/09/2020 USD 196,820.46 0.35200,000.00599,187.68 1.06
LS FINANCE 2022 4.25% 12-16/10/2022 USD 193,631.20 0.34200,000.00Distribution & Wholesale
SM INVESTMENTS 4.875% 14-10/06/2024 USD 400,000.00 0.71400,000.00593,631.20 1.05
HYUNDAI CAPITAL 3% 17-29/08/2022 USD 193,591.53 0.34200,000.00Auto Parts & Equipment
HYUNDAI CAPITAL 3.625% 17-29/08/2027 USD 188,109.27 0.33200,000.00WEICHAI INTL HK 4.125% 15-30/09/2020 USD 200,306.27 0.36200,000.00
582,007.07 1.03
CHINA REINSURANC 3.375% 17-09/03/2022 USD 385,884.00 0.68400,000.00Insurance
WEALTH DRIVEN LT 5.5% 16-17/08/2023 USD 185,078.10 0.33200,000.00570,962.10 1.01
OLAM INTERNATION 4.5% 14-05/02/2020 USD 198,738.19 0.35200,000.00Food services
198,738.19 0.35
TSINGHUA UNIC 4.75% 18-31/01/2021 USD 192,000.00 0.34200,000.00Electric & Electronic
192,000.00 0.34
NUOXI CAPITAL 4.7% 18-24/01/2021 USD 183,500.00 0.32200,000.00Office & Business equipment
183,500.00 0.32
50,719,120.27 89.35
MINEJESA CAPITAL 4.625% 17-10/08/2030 USD 179,750.00 0.32200,000.00
Mortgage backed securitiesEnergy
179,750.00 0.32
179,750.00 0.32
NameQuantity/Nominal
Market valuein USD
Currency %NAV
LA FRANCAISE LUX ASIA BONDS 2023 IC1 USD 2,413,450.00 4.252,500.00
Funds
Undertakings for collective investmentOpen-ended Funds
2,413,450.00 4.25
2,413,450.00 4.25
Total Securities Portfolio 53,312,320.27 93.92
NameQuantity/Nominal
Market valuein USD
Currency %NAV
56,645,990.41 31/01/1949,815,226.87 451,724.48USDEUR 56,645,990.41Forward foreign exchange contracts
451,724.48
Total Forward foreign exchange contracts 451,724.48
SalePurchase Unrealisedappreciation /(depreciation)
in USD
MaturityDate
Commitmentin USD
Financial derivative instruments as at December 31,2018
Total financial derivative instruments 451,724.48
Summary of net assets
451,724.48 0.80Total financial derivative instruments
%NAV
53,312,320.27 93.92Total Securities Portfolio
2,719,184.90 4.79Cash at bank and Bank Overdraft
279,368.90 0.49Other assets and liabilities
56,762,598.55 100.00Total net assets
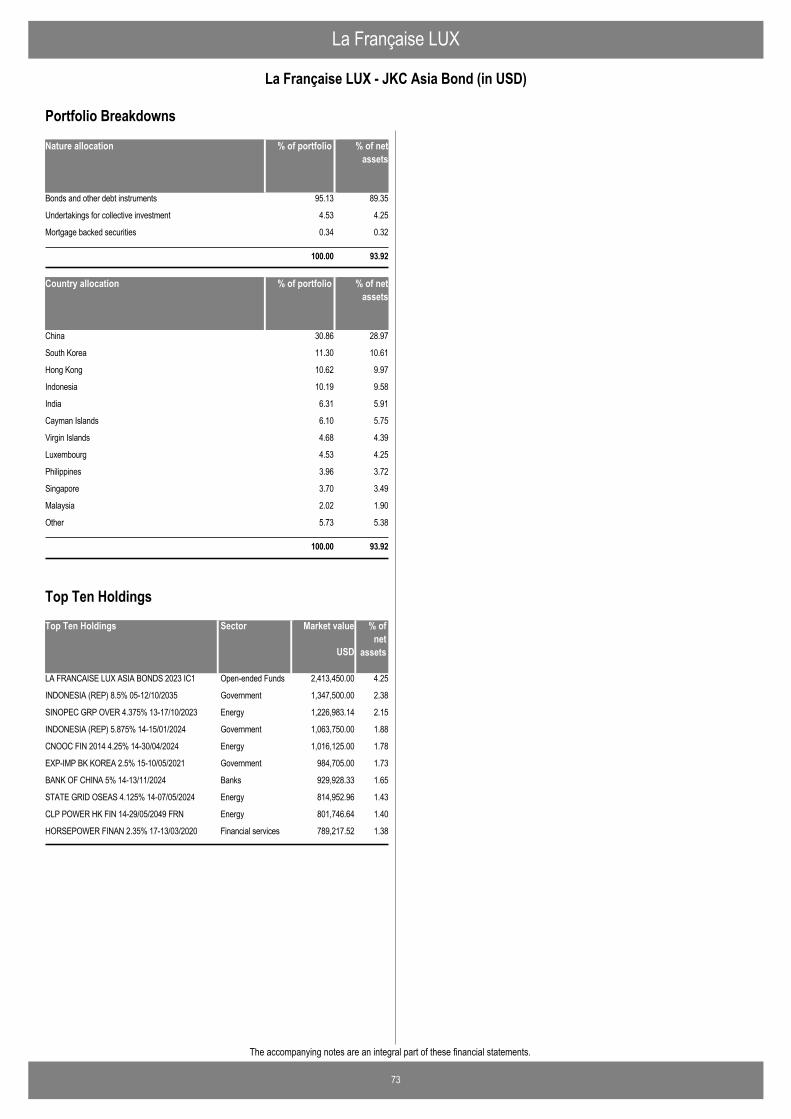
La Française LUX
73
La Française LUX - JKC Asia Bond (in USD)
The accompanying notes are an integral part of these financial statements.
Nature allocation % of portfolio % of netassets
Bonds and other debt instruments 95.13 89.35
Undertakings for collective investment 4.53 4.25
Mortgage backed securities 0.34 0.32
100.00 93.92
Country allocation % of portfolio % of netassets
China 30.86 28.97
South Korea 11.30 10.61
Hong Kong 10.62 9.97
Indonesia 10.19 9.58
India 6.31 5.91
Cayman Islands 6.10 5.75
Virgin Islands 4.68 4.39
Luxembourg 4.53 4.25
Philippines 3.96 3.72
Singapore 3.70 3.49
Malaysia 2.02 1.90
Other 5.73 5.38
100.00 93.92
Portfolio Breakdowns
Top Ten Holdings Market value % ofnet
assets
LA FRANCAISE LUX ASIA BONDS 2023 IC1 2,413,450.00 4.25Open-ended Funds
INDONESIA (REP) 8.5% 05-12/10/2035 1,347,500.00 2.38Government
SINOPEC GRP OVER 4.375% 13-17/10/2023 1,226,983.14 2.15Energy
INDONESIA (REP) 5.875% 14-15/01/2024 1,063,750.00 1.88Government
CNOOC FIN 2014 4.25% 14-30/04/2024 1,016,125.00 1.78Energy
EXP-IMP BK KOREA 2.5% 15-10/05/2021 984,705.00 1.73Government
BANK OF CHINA 5% 14-13/11/2024 929,928.33 1.65Banks
STATE GRID OSEAS 4.125% 14-07/05/2024 814,952.96 1.43Energy
CLP POWER HK FIN 14-29/05/2049 FRN 801,746.64 1.40Energy
HORSEPOWER FINAN 2.35% 17-13/03/2020 789,217.52 1.38Financial services
USD
Sector
Top Ten Holdings
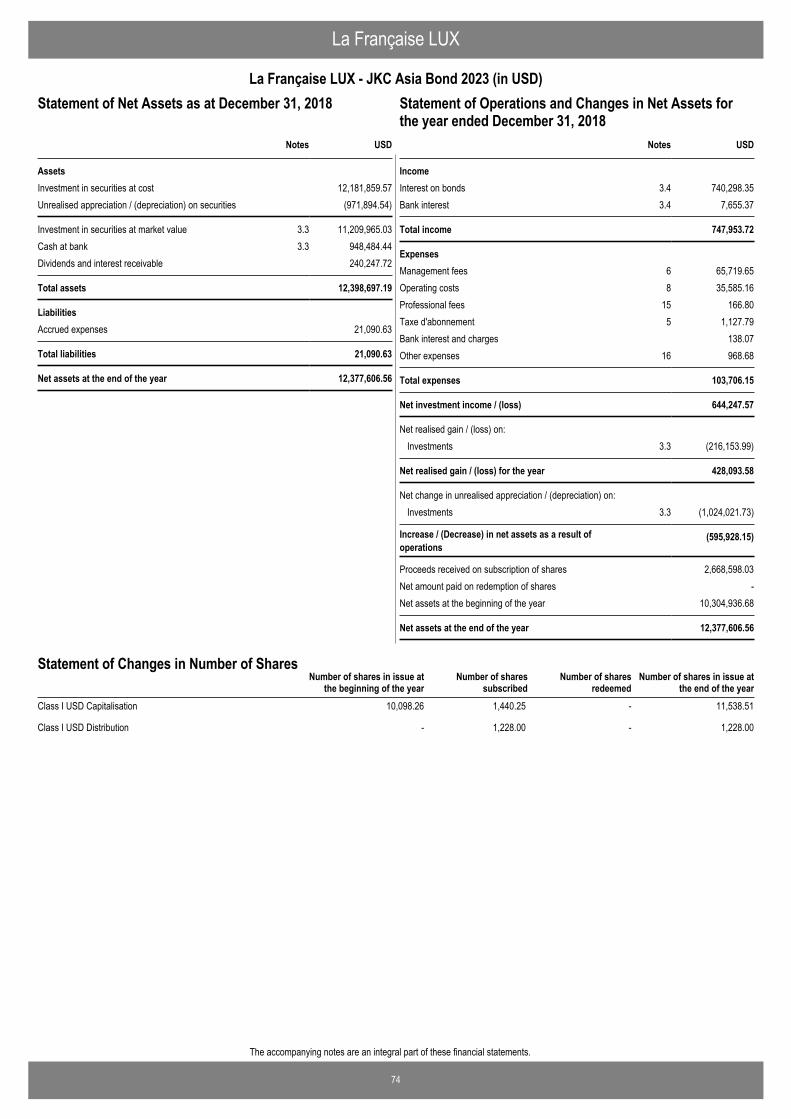
74
The accompanying notes are an integral part of these financial statements.
La Française LUX
La Française LUX - JKC Asia Bond 2023 (in USD)Statement of Operations and Changes in Net Assets for theyear ended December 31, 2018
USD
AssetsInvestment in securities at cost 12,181,859.57Unrealised appreciation / (depreciation) on securities (971,894.54)
Investment in securities at market value 3.3 11,209,965.03Cash at bank 3.3 948,484.44Dividends and interest receivable 240,247.72
Total assets 12,398,697.19
LiabilitiesAccrued expenses 21,090.63
Total liabilities 21,090.63
Net assets at the end of the year 12,377,606.56
Notes
Statement of Net Assets as at December 31, 2018
IncomeInterest on bonds 3.4 740,298.35Bank interest 3.4 7,655.37
Total income 747,953.72
ExpensesManagement fees 6 65,719.65Operating costs 8 35,585.16Professional fees 15 166.80Taxe d'abonnement 5 1,127.79Bank interest and charges 138.07Other expenses 16 968.68
Total expenses 103,706.15
Net investment income / (loss) 644,247.57
Net realised gain / (loss) on: Investments 3.3 (216,153.99)
Net realised gain / (loss) for the year 428,093.58
Net change in unrealised appreciation / (depreciation) on: Investments 3.3 (1,024,021.73)
Increase / (Decrease) in net assets as a result ofoperations
(595,928.15)
Proceeds received on subscription of shares 2,668,598.03Net amount paid on redemption of shares -Net assets at the beginning of the year 10,304,936.68
Net assets at the end of the year 12,377,606.56
USDNotes
Statement of Operations and Changes in Net Assets forthe year ended December 31, 2018
Number of shares in issue atthe end of the year
Number of shares in issue atthe beginning of the year
Number of sharessubscribed
Number of sharesredeemed
Statement of Changes in Number of Shares
Class I USD Capitalisation 10,098.26 1,440.25 - 11,538.51
Class I USD Distribution - 1,228.00 - 1,228.00
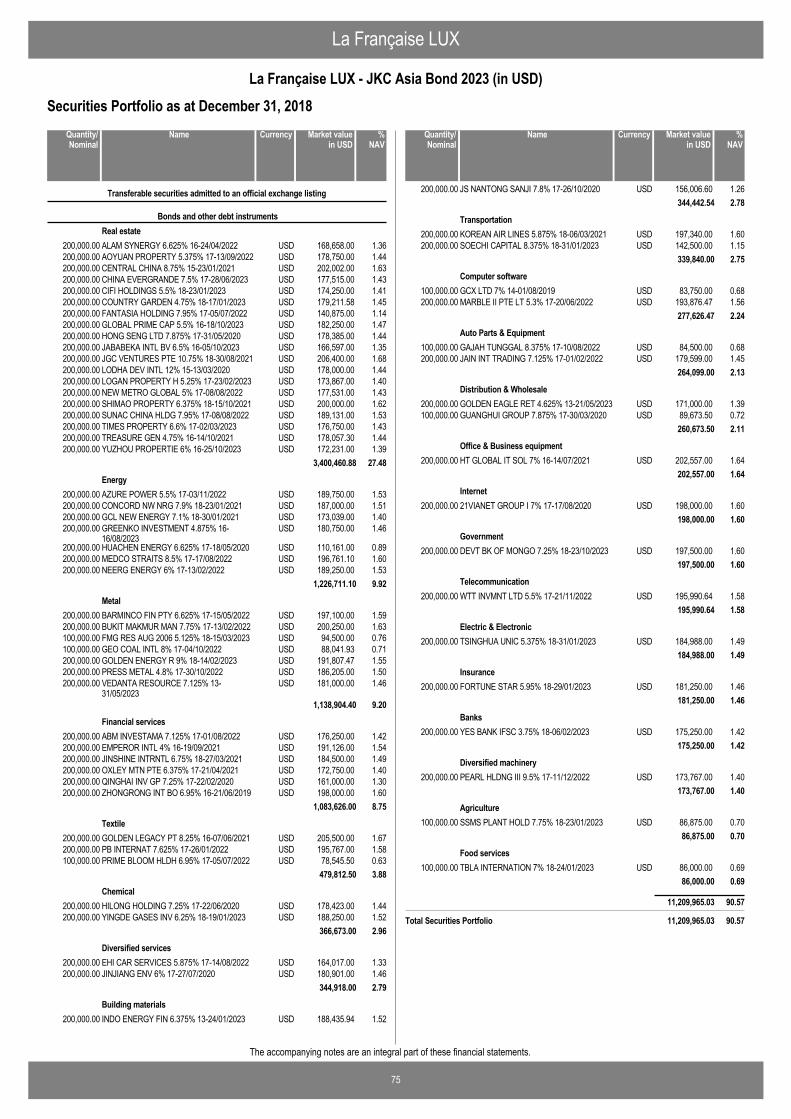
La Française LUX
75
La Française LUX - JKC Asia Bond 2023 (in USD)
The accompanying notes are an integral part of these financial statements.
Securities Portfolio as at December 31, 2018
ALAM SYNERGY 6.625% 16-24/04/2022 USD 168,658.00 1.36200,000.00
Transferable securities admitted to an official exchange listing
Bonds and other debt instrumentsReal estate
AOYUAN PROPERTY 5.375% 17-13/09/2022 USD 178,750.00 1.44200,000.00CENTRAL CHINA 8.75% 15-23/01/2021 USD 202,002.00 1.63200,000.00CHINA EVERGRANDE 7.5% 17-28/06/2023 USD 177,515.00 1.43200,000.00CIFI HOLDINGS 5.5% 18-23/01/2023 USD 174,250.00 1.41200,000.00COUNTRY GARDEN 4.75% 18-17/01/2023 USD 179,211.58 1.45200,000.00FANTASIA HOLDING 7.95% 17-05/07/2022 USD 140,875.00 1.14200,000.00GLOBAL PRIME CAP 5.5% 16-18/10/2023 USD 182,250.00 1.47200,000.00HONG SENG LTD 7.875% 17-31/05/2020 USD 178,385.00 1.44200,000.00JABABEKA INTL BV 6.5% 16-05/10/2023 USD 166,597.00 1.35200,000.00JGC VENTURES PTE 10.75% 18-30/08/2021 USD 206,400.00 1.68200,000.00LODHA DEV INTL 12% 15-13/03/2020 USD 178,000.00 1.44200,000.00LOGAN PROPERTY H 5.25% 17-23/02/2023 USD 173,867.00 1.40200,000.00NEW METRO GLOBAL 5% 17-08/08/2022 USD 177,531.00 1.43200,000.00SHIMAO PROPERTY 6.375% 18-15/10/2021 USD 200,000.00 1.62200,000.00SUNAC CHINA HLDG 7.95% 17-08/08/2022 USD 189,131.00 1.53200,000.00TIMES PROPERTY 6.6% 17-02/03/2023 USD 176,750.00 1.43200,000.00TREASURE GEN 4.75% 16-14/10/2021 USD 178,057.30 1.44200,000.00YUZHOU PROPERTIE 6% 16-25/10/2023 USD 172,231.00 1.39200,000.00
3,400,460.88 27.48
AZURE POWER 5.5% 17-03/11/2022 USD 189,750.00 1.53200,000.00Energy
CONCORD NW NRG 7.9% 18-23/01/2021 USD 187,000.00 1.51200,000.00GCL NEW ENERGY 7.1% 18-30/01/2021 USD 173,039.00 1.40200,000.00GREENKO INVESTMENT 4.875% 16-16/08/2023
USD 180,750.00 1.46200,000.00
HUACHEN ENERGY 6.625% 17-18/05/2020 USD 110,161.00 0.89200,000.00MEDCO STRAITS 8.5% 17-17/08/2022 USD 196,761.10 1.60200,000.00NEERG ENERGY 6% 17-13/02/2022 USD 189,250.00 1.53200,000.00
1,226,711.10 9.92
BARMINCO FIN PTY 6.625% 17-15/05/2022 USD 197,100.00 1.59200,000.00Metal
BUKIT MAKMUR MAN 7.75% 17-13/02/2022 USD 200,250.00 1.63200,000.00FMG RES AUG 2006 5.125% 18-15/03/2023 USD 94,500.00 0.76100,000.00GEO COAL INTL 8% 17-04/10/2022 USD 88,041.93 0.71100,000.00GOLDEN ENERGY R 9% 18-14/02/2023 USD 191,807.47 1.55200,000.00PRESS METAL 4.8% 17-30/10/2022 USD 186,205.00 1.50200,000.00VEDANTA RESOURCE 7.125% 13-31/05/2023
USD 181,000.00 1.46200,000.00
1,138,904.40 9.20
ABM INVESTAMA 7.125% 17-01/08/2022 USD 176,250.00 1.42200,000.00Financial services
EMPEROR INTL 4% 16-19/09/2021 USD 191,126.00 1.54200,000.00JINSHINE INTRNTL 6.75% 18-27/03/2021 USD 184,500.00 1.49200,000.00OXLEY MTN PTE 6.375% 17-21/04/2021 USD 172,750.00 1.40200,000.00QINGHAI INV GP 7.25% 17-22/02/2020 USD 161,000.00 1.30200,000.00ZHONGRONG INT BO 6.95% 16-21/06/2019 USD 198,000.00 1.60200,000.00
1,083,626.00 8.75
GOLDEN LEGACY PT 8.25% 16-07/06/2021 USD 205,500.00 1.67200,000.00Textile
PB INTERNAT 7.625% 17-26/01/2022 USD 195,767.00 1.58200,000.00PRIME BLOOM HLDH 6.95% 17-05/07/2022 USD 78,545.50 0.63100,000.00
479,812.50 3.88
HILONG HOLDING 7.25% 17-22/06/2020 USD 178,423.00 1.44200,000.00Chemical
YINGDE GASES INV 6.25% 18-19/01/2023 USD 188,250.00 1.52200,000.00366,673.00 2.96
EHI CAR SERVICES 5.875% 17-14/08/2022 USD 164,017.00 1.33200,000.00Diversified services
JINJIANG ENV 6% 17-27/07/2020 USD 180,901.00 1.46200,000.00344,918.00 2.79
INDO ENERGY FIN 6.375% 13-24/01/2023 USD 188,435.94 1.52200,000.00Building materials
NameQuantity/Nominal
Market valuein USD
Currency %NAV
JS NANTONG SANJI 7.8% 17-26/10/2020 USD 156,006.60 1.26200,000.00344,442.54 2.78
KOREAN AIR LINES 5.875% 18-06/03/2021 USD 197,340.00 1.60200,000.00Transportation
SOECHI CAPITAL 8.375% 18-31/01/2023 USD 142,500.00 1.15200,000.00339,840.00 2.75
GCX LTD 7% 14-01/08/2019 USD 83,750.00 0.68100,000.00Computer software
MARBLE II PTE LT 5.3% 17-20/06/2022 USD 193,876.47 1.56200,000.00277,626.47 2.24
GAJAH TUNGGAL 8.375% 17-10/08/2022 USD 84,500.00 0.68100,000.00Auto Parts & Equipment
JAIN INT TRADING 7.125% 17-01/02/2022 USD 179,599.00 1.45200,000.00264,099.00 2.13
GOLDEN EAGLE RET 4.625% 13-21/05/2023 USD 171,000.00 1.39200,000.00Distribution & Wholesale
GUANGHUI GROUP 7.875% 17-30/03/2020 USD 89,673.50 0.72100,000.00260,673.50 2.11
HT GLOBAL IT SOL 7% 16-14/07/2021 USD 202,557.00 1.64200,000.00Office & Business equipment
202,557.00 1.64
21VIANET GROUP I 7% 17-17/08/2020 USD 198,000.00 1.60200,000.00Internet
198,000.00 1.60
DEVT BK OF MONGO 7.25% 18-23/10/2023 USD 197,500.00 1.60200,000.00Government
197,500.00 1.60
WTT INVMNT LTD 5.5% 17-21/11/2022 USD 195,990.64 1.58200,000.00Telecommunication
195,990.64 1.58
TSINGHUA UNIC 5.375% 18-31/01/2023 USD 184,988.00 1.49200,000.00Electric & Electronic
184,988.00 1.49
FORTUNE STAR 5.95% 18-29/01/2023 USD 181,250.00 1.46200,000.00Insurance
181,250.00 1.46
YES BANK IFSC 3.75% 18-06/02/2023 USD 175,250.00 1.42200,000.00Banks
175,250.00 1.42
PEARL HLDNG III 9.5% 17-11/12/2022 USD 173,767.00 1.40200,000.00Diversified machinery
173,767.00 1.40
SSMS PLANT HOLD 7.75% 18-23/01/2023 USD 86,875.00 0.70100,000.00Agriculture
86,875.00 0.70
TBLA INTERNATION 7% 18-24/01/2023 USD 86,000.00 0.69100,000.00Food services
86,000.00 0.69
11,209,965.03 90.57
Total Securities Portfolio 11,209,965.03 90.57
NameQuantity/Nominal
Market valuein USD
Currency %NAV
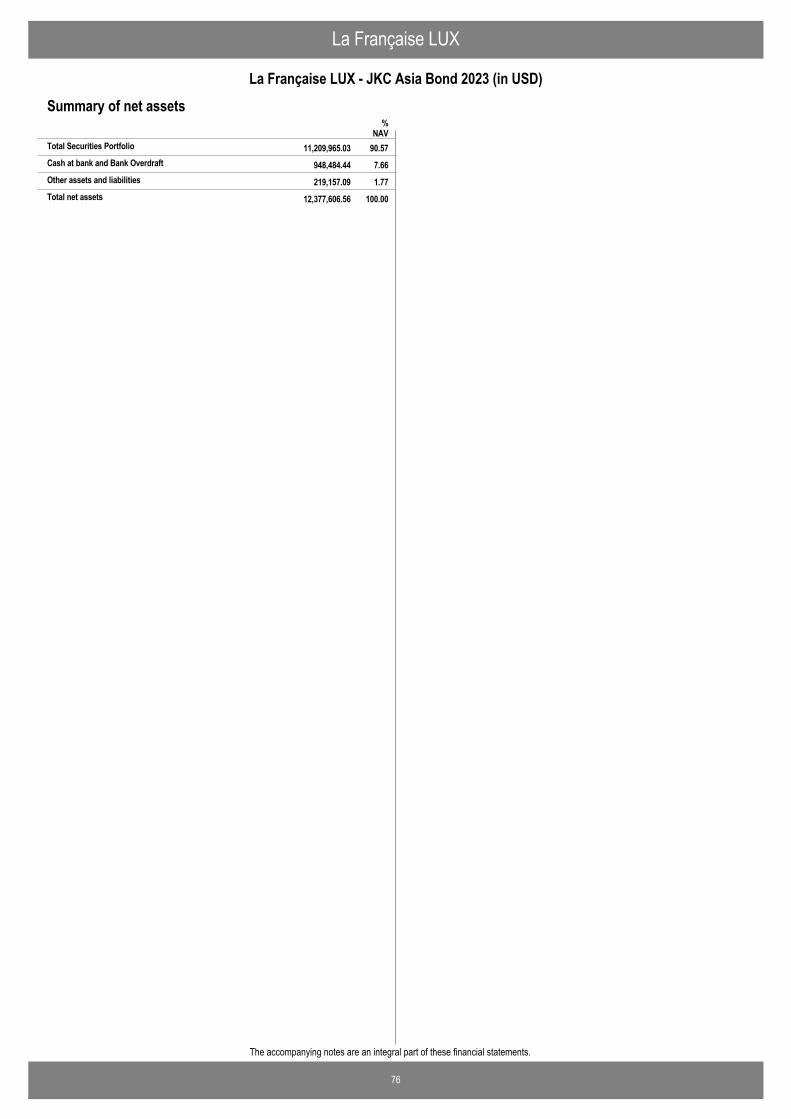
La Française LUX
76
La Française LUX - JKC Asia Bond 2023 (in USD)
The accompanying notes are an integral part of these financial statements.
Summary of net assets%
NAV11,209,965.03 90.57Total Securities Portfolio
948,484.44 7.66Cash at bank and Bank Overdraft
219,157.09 1.77Other assets and liabilities
12,377,606.56 100.00Total net assets
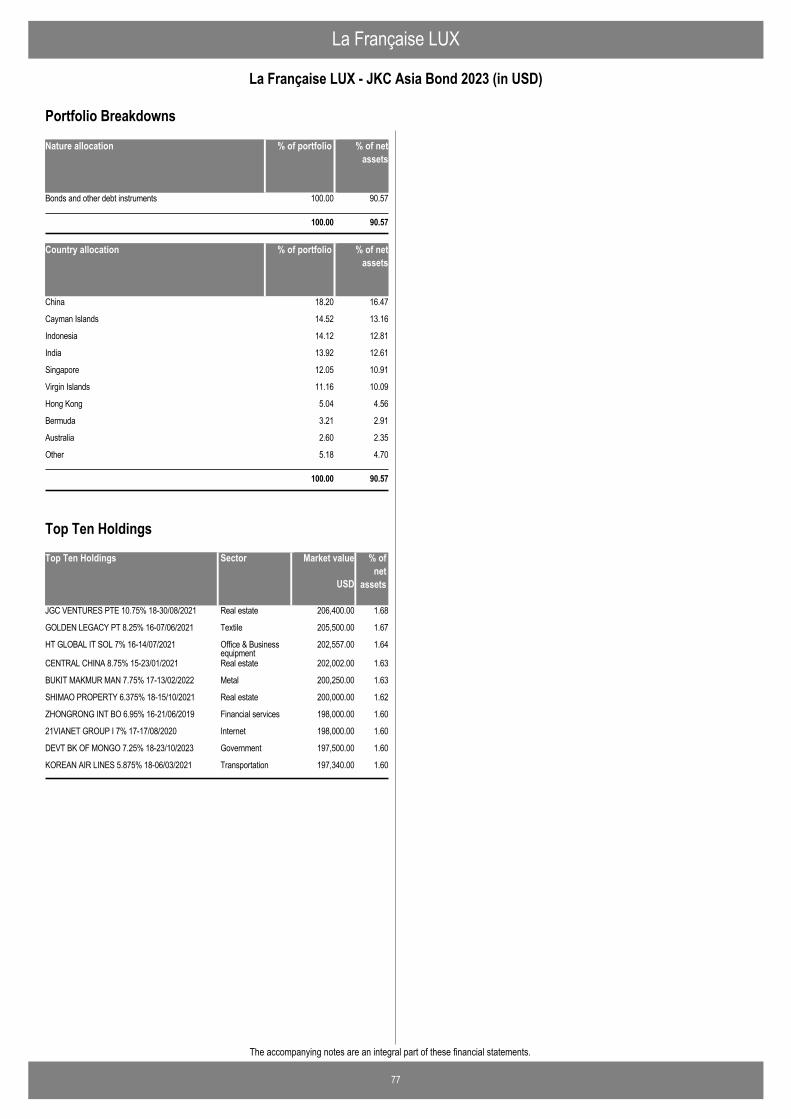
La Française LUX
77
La Française LUX - JKC Asia Bond 2023 (in USD)
The accompanying notes are an integral part of these financial statements.
Nature allocation % of portfolio % of netassets
Bonds and other debt instruments 100.00 90.57
100.00 90.57
Country allocation % of portfolio % of netassets
China 18.20 16.47
Cayman Islands 14.52 13.16
Indonesia 14.12 12.81
India 13.92 12.61
Singapore 12.05 10.91
Virgin Islands 11.16 10.09
Hong Kong 5.04 4.56
Bermuda 3.21 2.91
Australia 2.60 2.35
Other 5.18 4.70
100.00 90.57
Portfolio Breakdowns
Top Ten Holdings Market value % ofnet
assets
JGC VENTURES PTE 10.75% 18-30/08/2021 206,400.00 1.68Real estate
GOLDEN LEGACY PT 8.25% 16-07/06/2021 205,500.00 1.67Textile
HT GLOBAL IT SOL 7% 16-14/07/2021 202,557.00 1.64Office & Businessequipment
CENTRAL CHINA 8.75% 15-23/01/2021 202,002.00 1.63Real estate
BUKIT MAKMUR MAN 7.75% 17-13/02/2022 200,250.00 1.63Metal
SHIMAO PROPERTY 6.375% 18-15/10/2021 200,000.00 1.62Real estate
ZHONGRONG INT BO 6.95% 16-21/06/2019 198,000.00 1.60Financial services
21VIANET GROUP I 7% 17-17/08/2020 198,000.00 1.60Internet
DEVT BK OF MONGO 7.25% 18-23/10/2023 197,500.00 1.60Government
KOREAN AIR LINES 5.875% 18-06/03/2021 197,340.00 1.60Transportation
USD
Sector
Top Ten Holdings
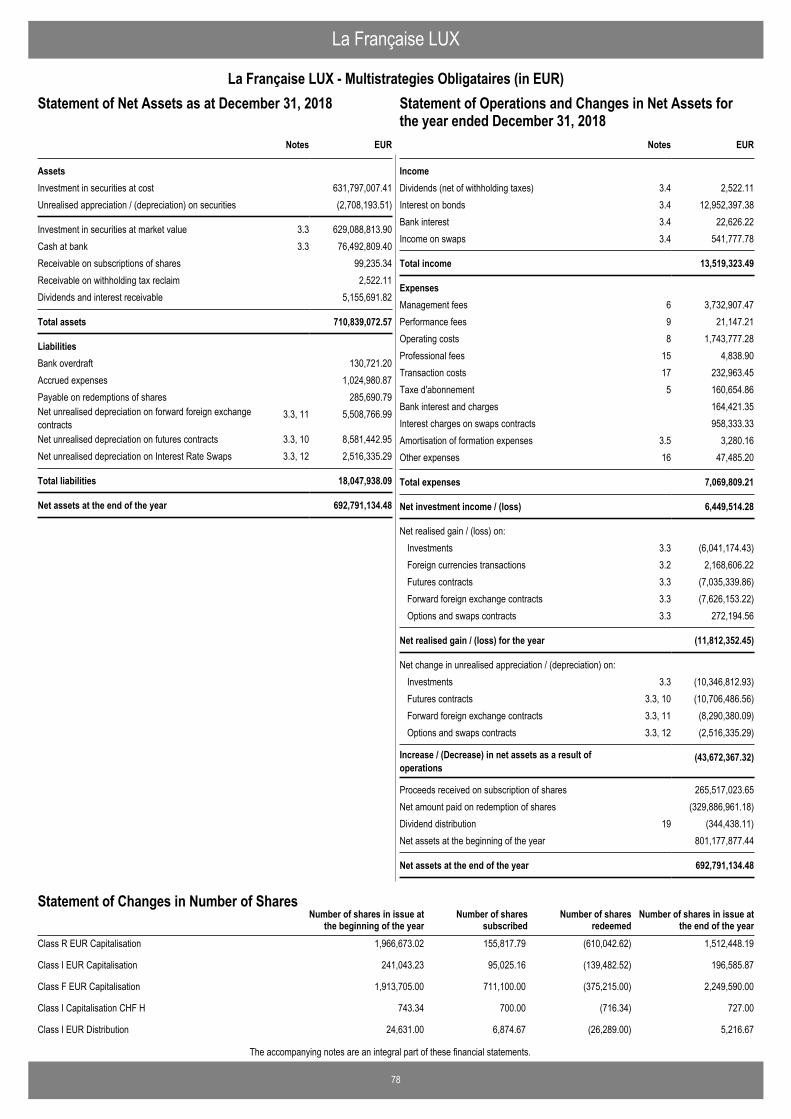
78
The accompanying notes are an integral part of these financial statements.
La Française LUX
La Française LUX - Multistrategies Obligataires (in EUR)Statement of Operations and Changes in Net Assets for theyear ended December 31, 2018
EUR
AssetsInvestment in securities at cost 631,797,007.41Unrealised appreciation / (depreciation) on securities (2,708,193.51)
Investment in securities at market value 3.3 629,088,813.90Cash at bank 3.3 76,492,809.40Receivable on subscriptions of shares 99,235.34Receivable on withholding tax reclaim 2,522.11Dividends and interest receivable 5,155,691.82
Total assets 710,839,072.57
LiabilitiesBank overdraft 130,721.20Accrued expenses 1,024,980.87Payable on redemptions of shares 285,690.79Net unrealised depreciation on forward foreign exchangecontracts
3.3, 11 5,508,766.99
Net unrealised depreciation on futures contracts 3.3, 10 8,581,442.95Net unrealised depreciation on Interest Rate Swaps 3.3, 12 2,516,335.29
Total liabilities 18,047,938.09
Net assets at the end of the year 692,791,134.48
Notes
Statement of Net Assets as at December 31, 2018
IncomeDividends (net of withholding taxes) 3.4 2,522.11Interest on bonds 3.4 12,952,397.38Bank interest 3.4 22,626.22Income on swaps 3.4 541,777.78
Total income 13,519,323.49
ExpensesManagement fees 6 3,732,907.47Performance fees 9 21,147.21Operating costs 8 1,743,777.28Professional fees 15 4,838.90Transaction costs 17 232,963.45Taxe d'abonnement 5 160,654.86Bank interest and charges 164,421.35Interest charges on swaps contracts 958,333.33Amortisation of formation expenses 3.5 3,280.16Other expenses 16 47,485.20
Total expenses 7,069,809.21
Net investment income / (loss) 6,449,514.28
Net realised gain / (loss) on: Investments 3.3 (6,041,174.43)Foreign currencies transactions 3.2 2,168,606.22Futures contracts 3.3 (7,035,339.86)Forward foreign exchange contracts 3.3 (7,626,153.22)Options and swaps contracts 3.3 272,194.56
Net realised gain / (loss) for the year (11,812,352.45)
Net change in unrealised appreciation / (depreciation) on: Investments 3.3 (10,346,812.93)Futures contracts 3.3, 10 (10,706,486.56)Forward foreign exchange contracts 3.3, 11 (8,290,380.09)Options and swaps contracts 3.3, 12 (2,516,335.29)
Increase / (Decrease) in net assets as a result ofoperations
(43,672,367.32)
Proceeds received on subscription of shares 265,517,023.65Net amount paid on redemption of shares (329,886,961.18)Dividend distribution 19 (344,438.11)Net assets at the beginning of the year 801,177,877.44
Net assets at the end of the year 692,791,134.48
EURNotes
Statement of Operations and Changes in Net Assets forthe year ended December 31, 2018
Number of shares in issue atthe end of the year
Number of shares in issue atthe beginning of the year
Number of sharessubscribed
Number of sharesredeemed
Statement of Changes in Number of Shares
Class R EUR Capitalisation 1,966,673.02 155,817.79 (610,042.62) 1,512,448.19
Class I EUR Capitalisation 241,043.23 95,025.16 (139,482.52) 196,585.87
Class F EUR Capitalisation 1,913,705.00 711,100.00 (375,215.00) 2,249,590.00
Class I Capitalisation CHF H 743.34 700.00 (716.34) 727.00
Class I EUR Distribution 24,631.00 6,874.67 (26,289.00) 5,216.67
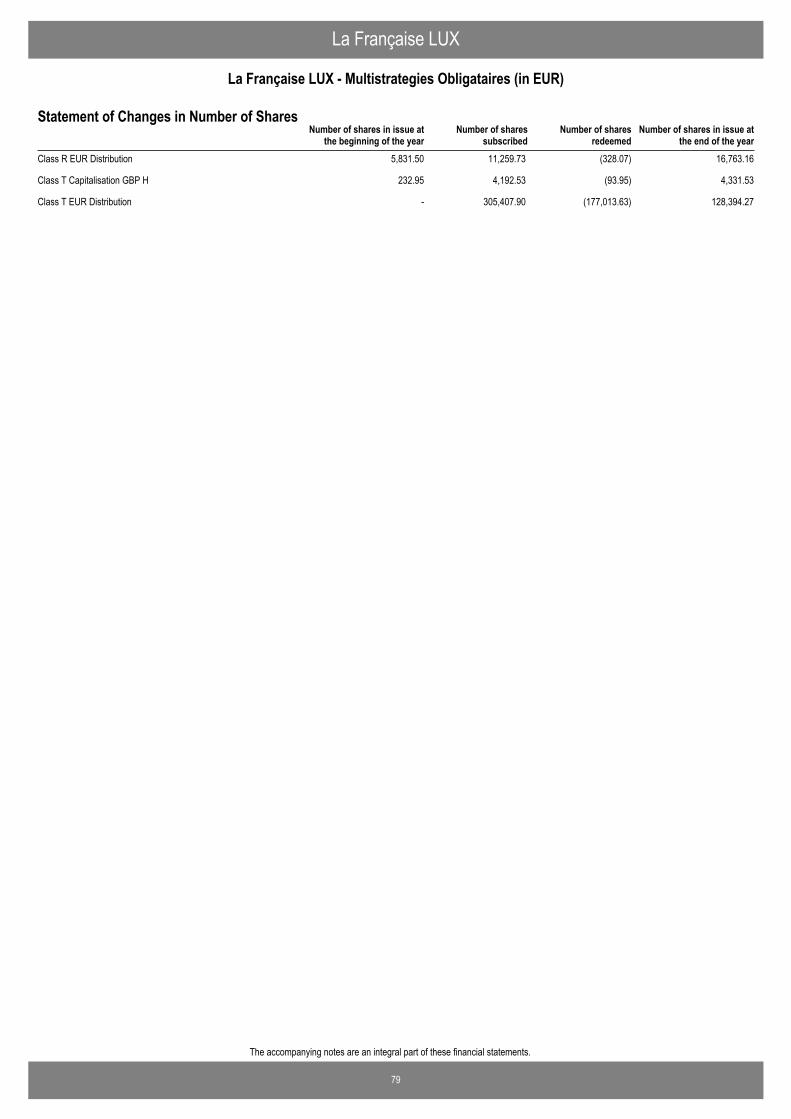
79
The accompanying notes are an integral part of these financial statements.
La Française LUX
La Française LUX - Multistrategies Obligataires (in EUR)
Number of shares in issue atthe end of the year
Number of shares in issue atthe beginning of the year
Number of sharessubscribed
Number of sharesredeemed
Statement of Changes in Number of Shares
Class R EUR Distribution 5,831.50 11,259.73 (328.07) 16,763.16
Class T Capitalisation GBP H 232.95 4,192.53 (93.95) 4,331.53
Class T EUR Distribution - 305,407.90 (177,013.63) 128,394.27
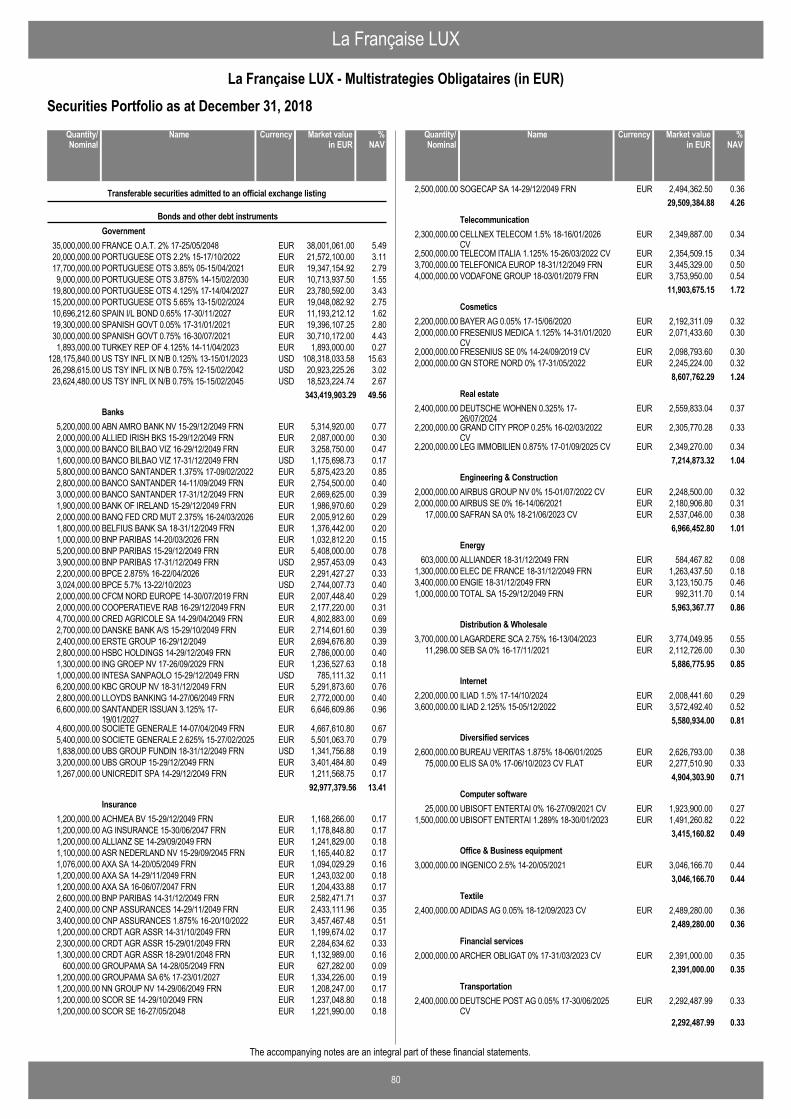
La Française LUX
80
La Française LUX - Multistrategies Obligataires (in EUR)
The accompanying notes are an integral part of these financial statements.
Securities Portfolio as at December 31, 2018
FRANCE O.A.T. 2% 17-25/05/2048 EUR 38,001,061.00 5.4935,000,000.00
Transferable securities admitted to an official exchange listing
Bonds and other debt instrumentsGovernment
PORTUGUESE OTS 2.2% 15-17/10/2022 EUR 21,572,100.00 3.1120,000,000.00PORTUGUESE OTS 3.85% 05-15/04/2021 EUR 19,347,154.92 2.7917,700,000.00PORTUGUESE OTS 3.875% 14-15/02/2030 EUR 10,713,937.50 1.559,000,000.00PORTUGUESE OTS 4.125% 17-14/04/2027 EUR 23,780,592.00 3.4319,800,000.00PORTUGUESE OTS 5.65% 13-15/02/2024 EUR 19,048,082.92 2.7515,200,000.00SPAIN I/L BOND 0.65% 17-30/11/2027 EUR 11,193,212.12 1.6210,696,212.60SPANISH GOVT 0.05% 17-31/01/2021 EUR 19,396,107.25 2.8019,300,000.00SPANISH GOVT 0.75% 16-30/07/2021 EUR 30,710,172.00 4.4330,000,000.00TURKEY REP OF 4.125% 14-11/04/2023 EUR 1,893,000.00 0.271,893,000.00US TSY INFL IX N/B 0.125% 13-15/01/2023 USD 108,318,033.58 15.63128,175,840.00US TSY INFL IX N/B 0.75% 12-15/02/2042 USD 20,923,225.26 3.0226,298,615.00US TSY INFL IX N/B 0.75% 15-15/02/2045 USD 18,523,224.74 2.6723,624,480.00
343,419,903.29 49.56
ABN AMRO BANK NV 15-29/12/2049 FRN EUR 5,314,920.00 0.775,200,000.00Banks
ALLIED IRISH BKS 15-29/12/2049 FRN EUR 2,087,000.00 0.302,000,000.00BANCO BILBAO VIZ 16-29/12/2049 FRN EUR 3,258,750.00 0.473,000,000.00BANCO BILBAO VIZ 17-31/12/2049 FRN USD 1,175,698.73 0.171,600,000.00BANCO SANTANDER 1.375% 17-09/02/2022 EUR 5,875,423.20 0.855,800,000.00BANCO SANTANDER 14-11/09/2049 FRN EUR 2,754,500.00 0.402,800,000.00BANCO SANTANDER 17-31/12/2049 FRN EUR 2,669,625.00 0.393,000,000.00BANK OF IRELAND 15-29/12/2049 FRN EUR 1,986,970.60 0.291,900,000.00BANQ FED CRD MUT 2.375% 16-24/03/2026 EUR 2,005,912.60 0.292,000,000.00BELFIUS BANK SA 18-31/12/2049 FRN EUR 1,376,442.00 0.201,800,000.00BNP PARIBAS 14-20/03/2026 FRN EUR 1,032,812.20 0.151,000,000.00BNP PARIBAS 15-29/12/2049 FRN EUR 5,408,000.00 0.785,200,000.00BNP PARIBAS 17-31/12/2049 FRN USD 2,957,453.09 0.433,900,000.00BPCE 2.875% 16-22/04/2026 EUR 2,291,427.27 0.332,200,000.00BPCE 5.7% 13-22/10/2023 USD 2,744,007.73 0.403,024,000.00CFCM NORD EUROPE 14-30/07/2019 FRN EUR 2,007,448.40 0.292,000,000.00COOPERATIEVE RAB 16-29/12/2049 FRN EUR 2,177,220.00 0.312,000,000.00CRED AGRICOLE SA 14-29/04/2049 FRN EUR 4,802,883.00 0.694,700,000.00DANSKE BANK A/S 15-29/10/2049 FRN EUR 2,714,601.60 0.392,700,000.00ERSTE GROUP 16-29/12/2049 EUR 2,694,676.80 0.392,400,000.00HSBC HOLDINGS 14-29/12/2049 FRN EUR 2,786,000.00 0.402,800,000.00ING GROEP NV 17-26/09/2029 FRN EUR 1,236,527.63 0.181,300,000.00INTESA SANPAOLO 15-29/12/2049 FRN USD 785,111.32 0.111,000,000.00KBC GROUP NV 18-31/12/2049 FRN EUR 5,291,873.60 0.766,200,000.00LLOYDS BANKING 14-27/06/2049 FRN EUR 2,772,000.00 0.402,800,000.00SANTANDER ISSUAN 3.125% 17-19/01/2027
EUR 6,646,609.86 0.966,600,000.00
SOCIETE GENERALE 14-07/04/2049 FRN EUR 4,667,610.80 0.674,600,000.00SOCIETE GENERALE 2.625% 15-27/02/2025 EUR 5,501,063.70 0.795,400,000.00UBS GROUP FUNDIN 18-31/12/2049 FRN USD 1,341,756.88 0.191,838,000.00UBS GROUP 15-29/12/2049 FRN EUR 3,401,484.80 0.493,200,000.00UNICREDIT SPA 14-29/12/2049 FRN EUR 1,211,568.75 0.171,267,000.00
92,977,379.56 13.41
ACHMEA BV 15-29/12/2049 FRN EUR 1,168,266.00 0.171,200,000.00Insurance
AG INSURANCE 15-30/06/2047 FRN EUR 1,178,848.80 0.171,200,000.00ALLIANZ SE 14-29/09/2049 FRN EUR 1,241,829.00 0.181,200,000.00ASR NEDERLAND NV 15-29/09/2045 FRN EUR 1,165,440.82 0.171,100,000.00AXA SA 14-20/05/2049 FRN EUR 1,094,029.29 0.161,076,000.00AXA SA 14-29/11/2049 FRN EUR 1,243,032.00 0.181,200,000.00AXA SA 16-06/07/2047 FRN EUR 1,204,433.88 0.171,200,000.00BNP PARIBAS 14-31/12/2049 FRN EUR 2,582,471.71 0.372,600,000.00CNP ASSURANCES 14-29/11/2049 FRN EUR 2,433,111.96 0.352,400,000.00CNP ASSURANCES 1.875% 16-20/10/2022 EUR 3,457,467.48 0.513,400,000.00CRDT AGR ASSR 14-31/10/2049 FRN EUR 1,199,674.02 0.171,200,000.00CRDT AGR ASSR 15-29/01/2049 FRN EUR 2,284,634.62 0.332,300,000.00CRDT AGR ASSR 18-29/01/2048 FRN EUR 1,132,989.00 0.161,300,000.00GROUPAMA SA 14-28/05/2049 FRN EUR 627,282.00 0.09600,000.00GROUPAMA SA 6% 17-23/01/2027 EUR 1,334,226.00 0.191,200,000.00NN GROUP NV 14-29/06/2049 FRN EUR 1,208,247.00 0.171,200,000.00SCOR SE 14-29/10/2049 FRN EUR 1,237,048.80 0.181,200,000.00SCOR SE 16-27/05/2048 EUR 1,221,990.00 0.181,200,000.00
NameQuantity/Nominal
Market valuein EUR
Currency %NAV
SOGECAP SA 14-29/12/2049 FRN EUR 2,494,362.50 0.362,500,000.0029,509,384.88 4.26
CELLNEX TELECOM 1.5% 18-16/01/2026CV
EUR 2,349,887.00 0.342,300,000.00Telecommunication
TELECOM ITALIA 1.125% 15-26/03/2022 CV EUR 2,354,509.15 0.342,500,000.00TELEFONICA EUROP 18-31/12/2049 FRN EUR 3,445,329.00 0.503,700,000.00VODAFONE GROUP 18-03/01/2079 FRN EUR 3,753,950.00 0.544,000,000.00
11,903,675.15 1.72
BAYER AG 0.05% 17-15/06/2020 EUR 2,192,311.09 0.322,200,000.00Cosmetics
FRESENIUS MEDICA 1.125% 14-31/01/2020CV
EUR 2,071,433.60 0.302,000,000.00
FRESENIUS SE 0% 14-24/09/2019 CV EUR 2,098,793.60 0.302,000,000.00GN STORE NORD 0% 17-31/05/2022 EUR 2,245,224.00 0.322,000,000.00
8,607,762.29 1.24
DEUTSCHE WOHNEN 0.325% 17-26/07/2024
EUR 2,559,833.04 0.372,400,000.00Real estate
GRAND CITY PROP 0.25% 16-02/03/2022CV
EUR 2,305,770.28 0.332,200,000.00
LEG IMMOBILIEN 0.875% 17-01/09/2025 CV EUR 2,349,270.00 0.342,200,000.007,214,873.32 1.04
AIRBUS GROUP NV 0% 15-01/07/2022 CV EUR 2,248,500.00 0.322,000,000.00Engineering & Construction
AIRBUS SE 0% 16-14/06/2021 EUR 2,180,906.80 0.312,000,000.00SAFRAN SA 0% 18-21/06/2023 CV EUR 2,537,046.00 0.3817,000.00
6,966,452.80 1.01
ALLIANDER 18-31/12/2049 FRN EUR 584,467.82 0.08603,000.00Energy
ELEC DE FRANCE 18-31/12/2049 FRN EUR 1,263,437.50 0.181,300,000.00ENGIE 18-31/12/2049 FRN EUR 3,123,150.75 0.463,400,000.00TOTAL SA 15-29/12/2049 FRN EUR 992,311.70 0.141,000,000.00
5,963,367.77 0.86
LAGARDERE SCA 2.75% 16-13/04/2023 EUR 3,774,049.95 0.553,700,000.00Distribution & Wholesale
SEB SA 0% 16-17/11/2021 EUR 2,112,726.00 0.3011,298.005,886,775.95 0.85
ILIAD 1.5% 17-14/10/2024 EUR 2,008,441.60 0.292,200,000.00Internet
ILIAD 2.125% 15-05/12/2022 EUR 3,572,492.40 0.523,600,000.005,580,934.00 0.81
BUREAU VERITAS 1.875% 18-06/01/2025 EUR 2,626,793.00 0.382,600,000.00Diversified services
ELIS SA 0% 17-06/10/2023 CV FLAT EUR 2,277,510.90 0.3375,000.004,904,303.90 0.71
UBISOFT ENTERTAI 0% 16-27/09/2021 CV EUR 1,923,900.00 0.2725,000.00Computer software
UBISOFT ENTERTAI 1.289% 18-30/01/2023 EUR 1,491,260.82 0.221,500,000.003,415,160.82 0.49
INGENICO 2.5% 14-20/05/2021 EUR 3,046,166.70 0.443,000,000.00Office & Business equipment
3,046,166.70 0.44
ADIDAS AG 0.05% 18-12/09/2023 CV EUR 2,489,280.00 0.362,400,000.00Textile
2,489,280.00 0.36
ARCHER OBLIGAT 0% 17-31/03/2023 CV EUR 2,391,000.00 0.352,000,000.00Financial services
2,391,000.00 0.35
DEUTSCHE POST AG 0.05% 17-30/06/2025CV
EUR 2,292,487.99 0.332,400,000.00Transportation
2,292,487.99 0.33
NameQuantity/Nominal
Market valuein EUR
Currency %NAV
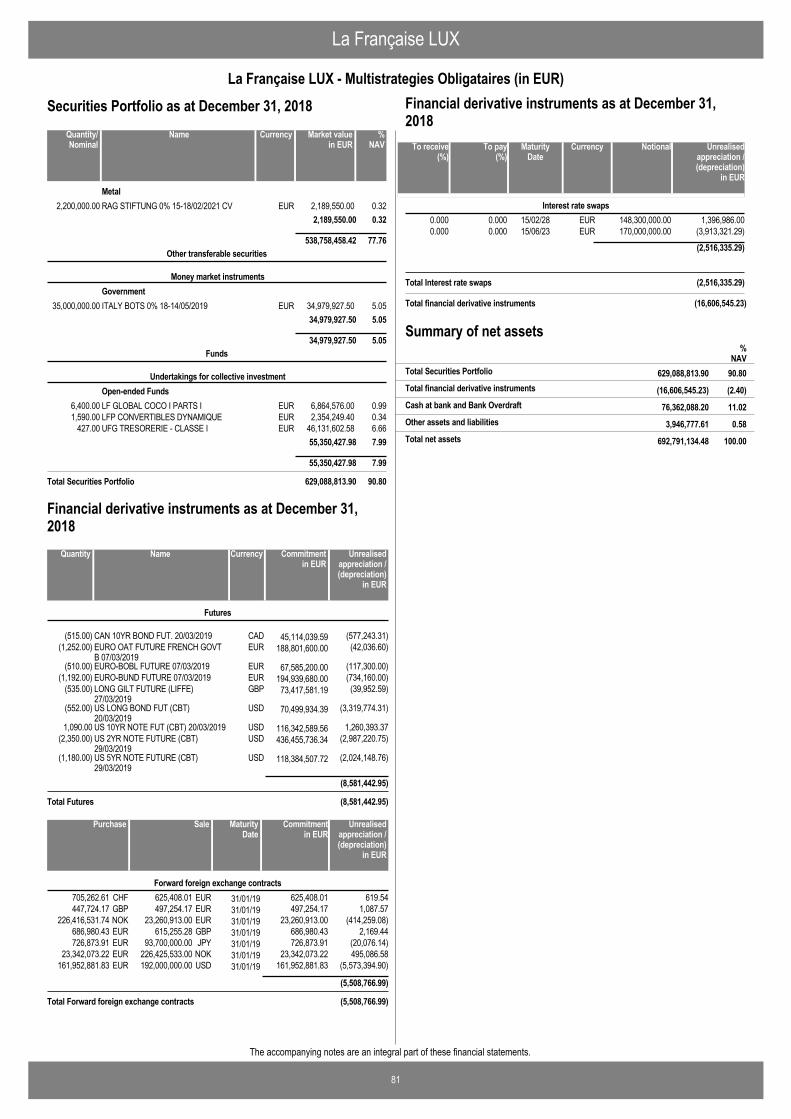
La Française LUX
81
La Française LUX - Multistrategies Obligataires (in EUR)
The accompanying notes are an integral part of these financial statements.
Securities Portfolio as at December 31, 2018
RAG STIFTUNG 0% 15-18/02/2021 CV EUR 2,189,550.00 0.322,200,000.00Metal
2,189,550.00 0.32
538,758,458.42 77.76
ITALY BOTS 0% 18-14/05/2019 EUR 34,979,927.50 5.0535,000,000.00
Other transferable securities
Money market instrumentsGovernment
34,979,927.50 5.05
34,979,927.50 5.05
LF GLOBAL COCO I PARTS I EUR 6,864,576.00 0.996,400.00
Funds
Undertakings for collective investmentOpen-ended Funds
LFP CONVERTIBLES DYNAMIQUE EUR 2,354,249.40 0.341,590.00UFG TRESORERIE - CLASSE I EUR 46,131,602.58 6.66427.00
55,350,427.98 7.99
55,350,427.98 7.99
Total Securities Portfolio 629,088,813.90 90.80
NameQuantity/Nominal
Market valuein EUR
Currency %NAV
CAN 10YR BOND FUT. 20/03/2019 CAD 45,114,039.59(515.00) (577,243.31)
Futures
EURO OAT FUTURE FRENCH GOVTB 07/03/2019
EUR 188,801,600.00(1,252.00) (42,036.60)
EURO-BOBL FUTURE 07/03/2019 EUR 67,585,200.00(510.00) (117,300.00)EURO-BUND FUTURE 07/03/2019 EUR 194,939,680.00(1,192.00) (734,160.00)LONG GILT FUTURE (LIFFE)27/03/2019
GBP 73,417,581.19(535.00) (39,952.59)
US LONG BOND FUT (CBT)20/03/2019
USD 70,499,934.39(552.00) (3,319,774.31)
US 10YR NOTE FUT (CBT) 20/03/2019 USD 116,342,589.561,090.00 1,260,393.37US 2YR NOTE FUTURE (CBT)29/03/2019
USD 436,455,736.34(2,350.00) (2,987,220.75)
US 5YR NOTE FUTURE (CBT)29/03/2019
USD 118,384,507.72(1,180.00) (2,024,148.76)
(8,581,442.95)
Total Futures (8,581,442.95)
NameQuantity Commitmentin EUR
Currency Unrealisedappreciation /(depreciation)
in EUR
Financial derivative instruments as at December 31,2018
625,408.01 31/01/19705,262.61 619.54EURCHF 625,408.01Forward foreign exchange contracts
497,254.17 31/01/19447,724.17 1,087.57EURGBP 497,254.1723,260,913.00 31/01/19226,416,531.74 (414,259.08)EURNOK 23,260,913.00
615,255.28 31/01/19686,980.43 2,169.44GBPEUR 686,980.4393,700,000.00 31/01/19726,873.91 (20,076.14)JPYEUR 726,873.91
226,425,533.00 31/01/1923,342,073.22 495,086.58NOKEUR 23,342,073.22192,000,000.00 31/01/19161,952,881.83 (5,573,394.90)USDEUR 161,952,881.83
(5,508,766.99)
Total Forward foreign exchange contracts (5,508,766.99)
SalePurchase Unrealisedappreciation /(depreciation)
in EUR
MaturityDate
Commitmentin EUR
0.000 15/02/280.000 148,300,000.00 1,396,986.00EURInterest rate swaps
0.000 15/06/230.000 170,000,000.00 (3,913,321.29)EUR
(2,516,335.29)
To pay (%)
To receive (%)
NotionalMaturityDate
Unrealisedappreciation /(depreciation)
in EUR
Currency
Total Interest rate swaps (2,516,335.29)
Financial derivative instruments as at December 31,2018
Total financial derivative instruments (16,606,545.23)
Summary of net assets
(16,606,545.23) (2.40)Total financial derivative instruments
%NAV
629,088,813.90 90.80Total Securities Portfolio
76,362,088.20 11.02Cash at bank and Bank Overdraft
3,946,777.61 0.58Other assets and liabilities
692,791,134.48 100.00Total net assets
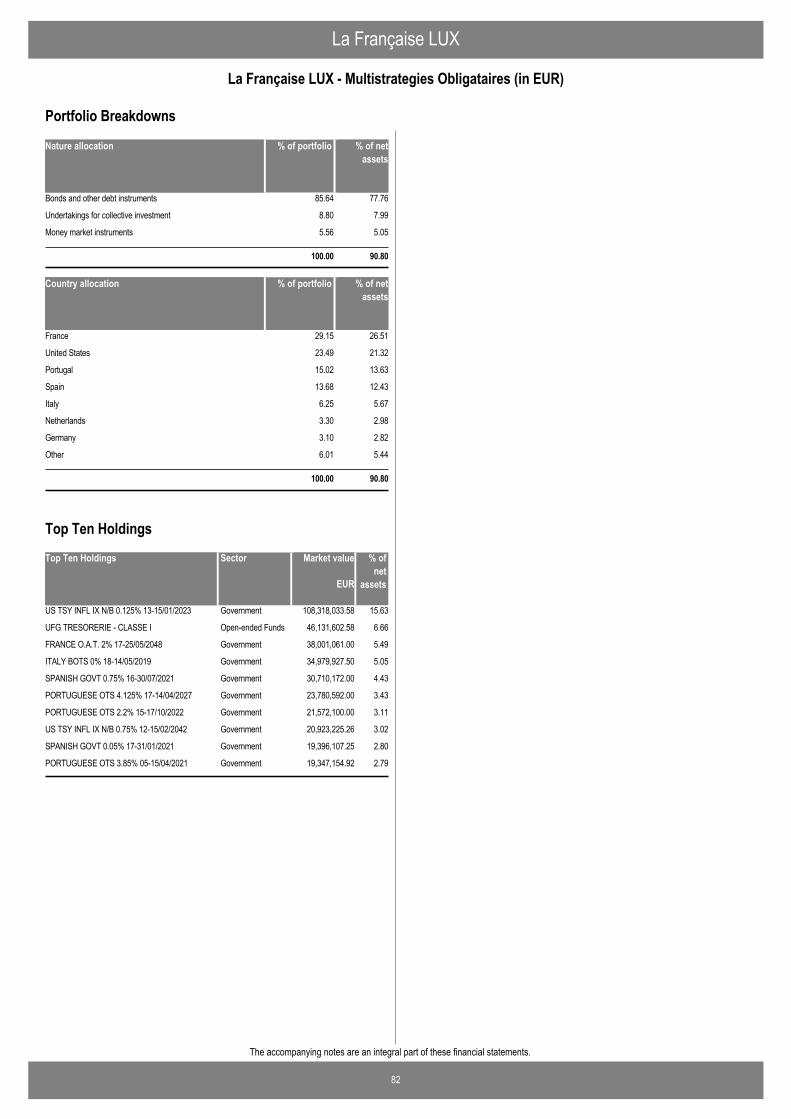
La Française LUX
82
La Française LUX - Multistrategies Obligataires (in EUR)
The accompanying notes are an integral part of these financial statements.
Nature allocation % of portfolio % of netassets
Bonds and other debt instruments 85.64 77.76
Undertakings for collective investment 8.80 7.99
Money market instruments 5.56 5.05
100.00 90.80
Country allocation % of portfolio % of netassets
France 29.15 26.51
United States 23.49 21.32
Portugal 15.02 13.63
Spain 13.68 12.43
Italy 6.25 5.67
Netherlands 3.30 2.98
Germany 3.10 2.82
Other 6.01 5.44
100.00 90.80
Portfolio Breakdowns
Top Ten Holdings Market value % ofnet
assets
US TSY INFL IX N/B 0.125% 13-15/01/2023 108,318,033.58 15.63Government
UFG TRESORERIE - CLASSE I 46,131,602.58 6.66Open-ended Funds
FRANCE O.A.T. 2% 17-25/05/2048 38,001,061.00 5.49Government
ITALY BOTS 0% 18-14/05/2019 34,979,927.50 5.05Government
SPANISH GOVT 0.75% 16-30/07/2021 30,710,172.00 4.43Government
PORTUGUESE OTS 4.125% 17-14/04/2027 23,780,592.00 3.43Government
PORTUGUESE OTS 2.2% 15-17/10/2022 21,572,100.00 3.11Government
US TSY INFL IX N/B 0.75% 12-15/02/2042 20,923,225.26 3.02Government
SPANISH GOVT 0.05% 17-31/01/2021 19,396,107.25 2.80Government
PORTUGUESE OTS 3.85% 05-15/04/2021 19,347,154.92 2.79Government
EUR
Sector
Top Ten Holdings
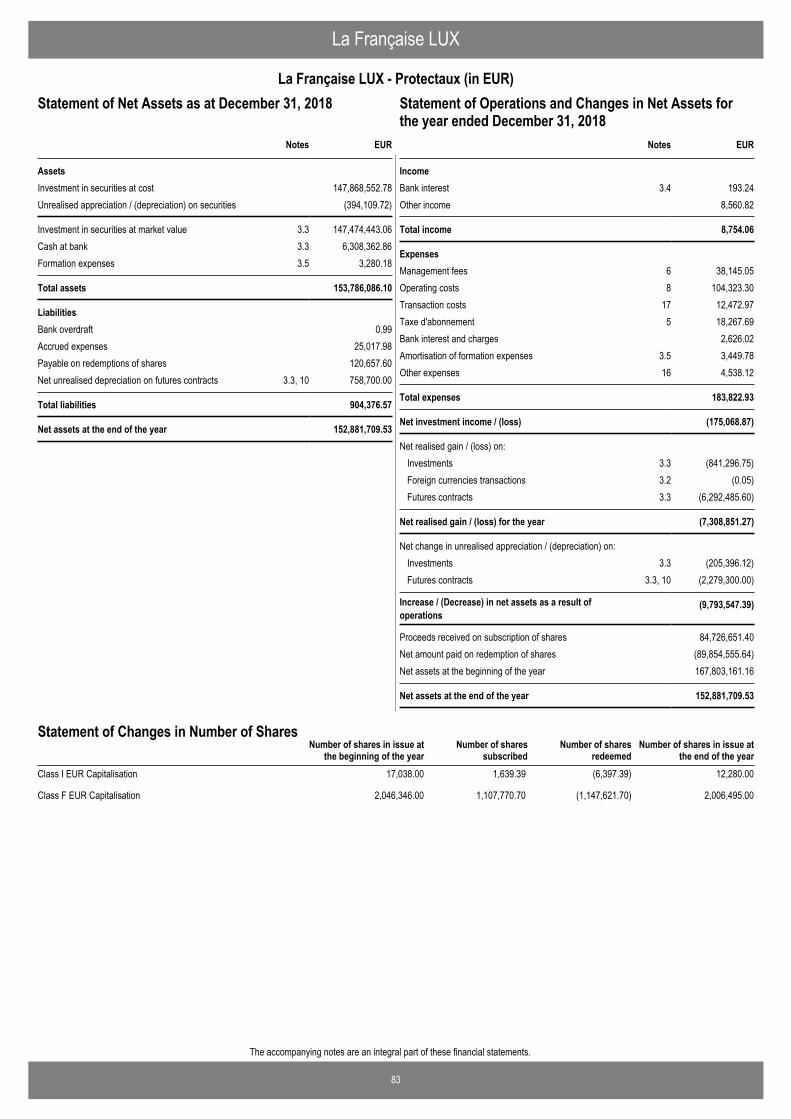
83
The accompanying notes are an integral part of these financial statements.
La Française LUX
La Française LUX - Protectaux (in EUR)Statement of Operations and Changes in Net Assets for theyear ended December 31, 2018
EUR
AssetsInvestment in securities at cost 147,868,552.78Unrealised appreciation / (depreciation) on securities (394,109.72)
Investment in securities at market value 3.3 147,474,443.06Cash at bank 3.3 6,308,362.86Formation expenses 3.5 3,280.18
Total assets 153,786,086.10
LiabilitiesBank overdraft 0.99Accrued expenses 25,017.98Payable on redemptions of shares 120,657.60Net unrealised depreciation on futures contracts 3.3, 10 758,700.00
Total liabilities 904,376.57
Net assets at the end of the year 152,881,709.53
Notes
Statement of Net Assets as at December 31, 2018
IncomeBank interest 3.4 193.24Other income 8,560.82
Total income 8,754.06
ExpensesManagement fees 6 38,145.05Operating costs 8 104,323.30Transaction costs 17 12,472.97Taxe d'abonnement 5 18,267.69Bank interest and charges 2,626.02Amortisation of formation expenses 3.5 3,449.78Other expenses 16 4,538.12
Total expenses 183,822.93
Net investment income / (loss) (175,068.87)
Net realised gain / (loss) on: Investments 3.3 (841,296.75)Foreign currencies transactions 3.2 (0.05)Futures contracts 3.3 (6,292,485.60)
Net realised gain / (loss) for the year (7,308,851.27)
Net change in unrealised appreciation / (depreciation) on: Investments 3.3 (205,396.12)Futures contracts 3.3, 10 (2,279,300.00)
Increase / (Decrease) in net assets as a result ofoperations
(9,793,547.39)
Proceeds received on subscription of shares 84,726,651.40Net amount paid on redemption of shares (89,854,555.64)Net assets at the beginning of the year 167,803,161.16
Net assets at the end of the year 152,881,709.53
EURNotes
Statement of Operations and Changes in Net Assets forthe year ended December 31, 2018
Number of shares in issue atthe end of the year
Number of shares in issue atthe beginning of the year
Number of sharessubscribed
Number of sharesredeemed
Statement of Changes in Number of Shares
Class I EUR Capitalisation 17,038.00 1,639.39 (6,397.39) 12,280.00
Class F EUR Capitalisation 2,046,346.00 1,107,770.70 (1,147,621.70) 2,006,495.00
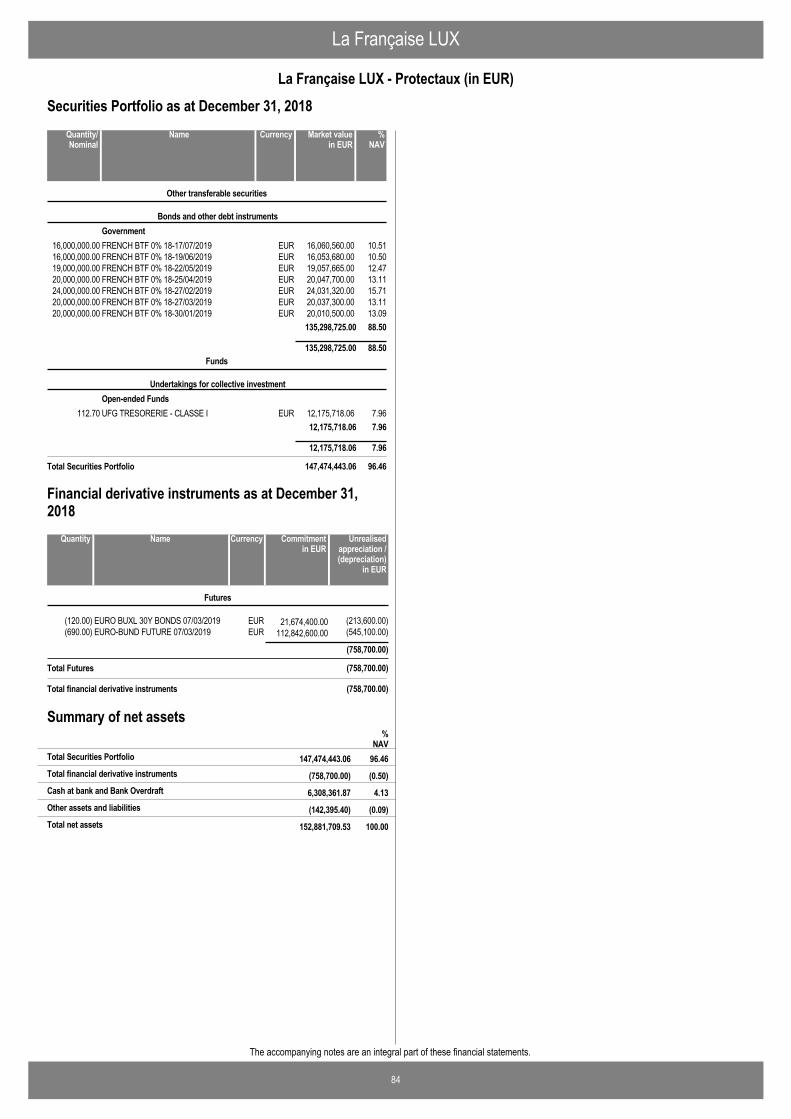
La Française LUX
84
La Française LUX - Protectaux (in EUR)
The accompanying notes are an integral part of these financial statements.
Securities Portfolio as at December 31, 2018
FRENCH BTF 0% 18-17/07/2019 EUR 16,060,560.00 10.5116,000,000.00
Other transferable securities
Bonds and other debt instrumentsGovernment
FRENCH BTF 0% 18-19/06/2019 EUR 16,053,680.00 10.5016,000,000.00FRENCH BTF 0% 18-22/05/2019 EUR 19,057,665.00 12.4719,000,000.00FRENCH BTF 0% 18-25/04/2019 EUR 20,047,700.00 13.1120,000,000.00FRENCH BTF 0% 18-27/02/2019 EUR 24,031,320.00 15.7124,000,000.00FRENCH BTF 0% 18-27/03/2019 EUR 20,037,300.00 13.1120,000,000.00FRENCH BTF 0% 18-30/01/2019 EUR 20,010,500.00 13.0920,000,000.00
135,298,725.00 88.50
135,298,725.00 88.50
UFG TRESORERIE - CLASSE I EUR 12,175,718.06 7.96112.70
Funds
Undertakings for collective investmentOpen-ended Funds
12,175,718.06 7.96
12,175,718.06 7.96
Total Securities Portfolio 147,474,443.06 96.46
NameQuantity/Nominal
Market valuein EUR
Currency %NAV
EURO BUXL 30Y BONDS 07/03/2019 EUR 21,674,400.00(120.00) (213,600.00)
Futures
EURO-BUND FUTURE 07/03/2019 EUR 112,842,600.00(690.00) (545,100.00)
(758,700.00)
Total Futures (758,700.00)
NameQuantity Commitmentin EUR
Currency Unrealisedappreciation /(depreciation)
in EUR
Financial derivative instruments as at December 31,2018
Total financial derivative instruments (758,700.00)
Summary of net assets
(758,700.00) (0.50)Total financial derivative instruments
%NAV
147,474,443.06 96.46Total Securities Portfolio
6,308,361.87 4.13Cash at bank and Bank Overdraft
(142,395.40) (0.09)Other assets and liabilities
152,881,709.53 100.00Total net assets

La Française LUX
85
La Française LUX - Protectaux (in EUR)
The accompanying notes are an integral part of these financial statements.
Nature allocation % of portfolio % of netassets
Bonds and other debt instruments 91.74 88.50
Undertakings for collective investment 8.26 7.96
100.00 96.46
Country allocation % of portfolio % of netassets
France 100.00 96.46
100.00 96.46
Portfolio Breakdowns
Top Ten Holdings Market value % ofnet
assets
FRENCH BTF 0% 18-27/02/2019 24,031,320.00 15.71Government
FRENCH BTF 0% 18-25/04/2019 20,047,700.00 13.11Government
FRENCH BTF 0% 18-27/03/2019 20,037,300.00 13.11Government
FRENCH BTF 0% 18-30/01/2019 20,010,500.00 13.09Government
FRENCH BTF 0% 18-22/05/2019 19,057,665.00 12.47Government
FRENCH BTF 0% 18-17/07/2019 16,060,560.00 10.51Government
FRENCH BTF 0% 18-19/06/2019 16,053,680.00 10.50Government
UFG TRESORERIE - CLASSE I 12,175,718.06 7.96Open-ended Funds
EUR
Sector
Top Ten Holdings
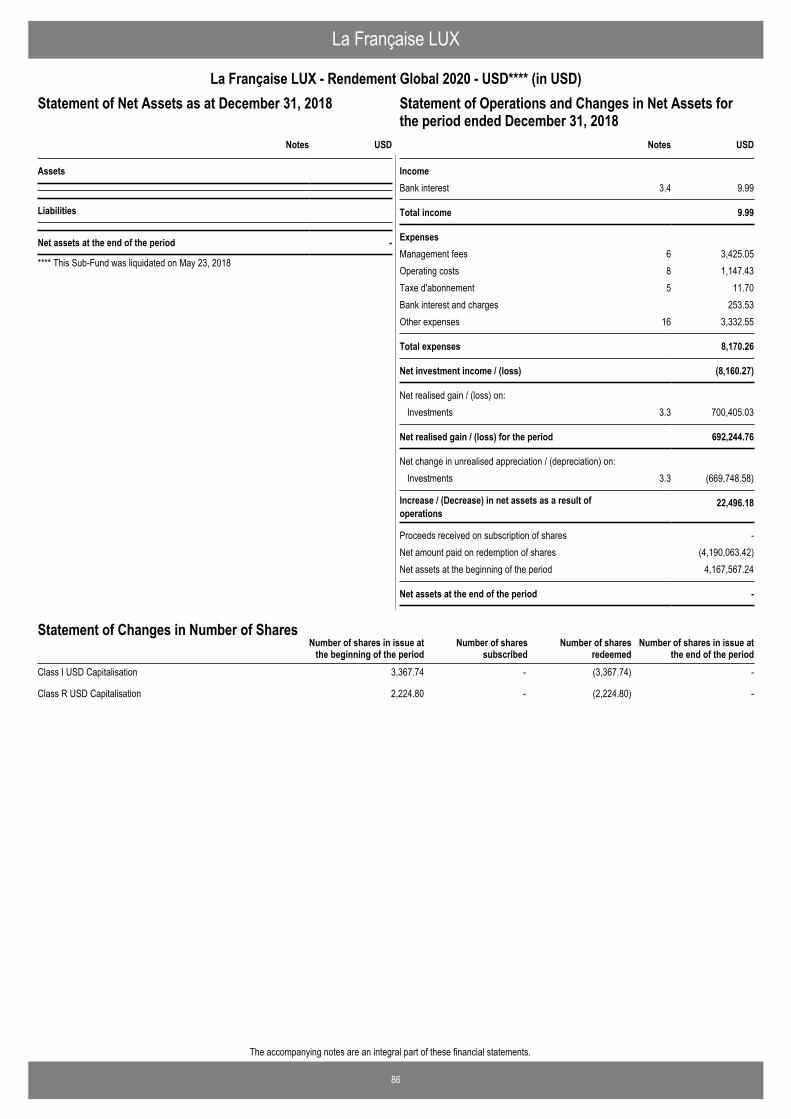
86
The accompanying notes are an integral part of these financial statements.
La Française LUX
La Française LUX - Rendement Global 2020 - USD**** (in USD)Statement of Operations and Changes in Net Assets for theperiod ended December 31, 2018
USD
Assets
Liabilities
Net assets at the end of the period -
Notes
Statement of Net Assets as at December 31, 2018
**** This Sub-Fund was liquidated on May 23, 2018
IncomeBank interest 3.4 9.99
Total income 9.99
ExpensesManagement fees 6 3,425.05Operating costs 8 1,147.43Taxe d'abonnement 5 11.70Bank interest and charges 253.53Other expenses 16 3,332.55
Total expenses 8,170.26
Net investment income / (loss) (8,160.27)
Net realised gain / (loss) on: Investments 3.3 700,405.03
Net realised gain / (loss) for the period 692,244.76
Net change in unrealised appreciation / (depreciation) on: Investments 3.3 (669,748.58)
Increase / (Decrease) in net assets as a result ofoperations
22,496.18
Proceeds received on subscription of shares -Net amount paid on redemption of shares (4,190,063.42)Net assets at the beginning of the period 4,167,567.24
Net assets at the end of the period -
USDNotes
Statement of Operations and Changes in Net Assets forthe period ended December 31, 2018
Number of shares in issue atthe end of the period
Number of shares in issue atthe beginning of the period
Number of sharessubscribed
Number of sharesredeemed
Statement of Changes in Number of Shares
Class I USD Capitalisation 3,367.74 - (3,367.74) -
Class R USD Capitalisation 2,224.80 - (2,224.80) -
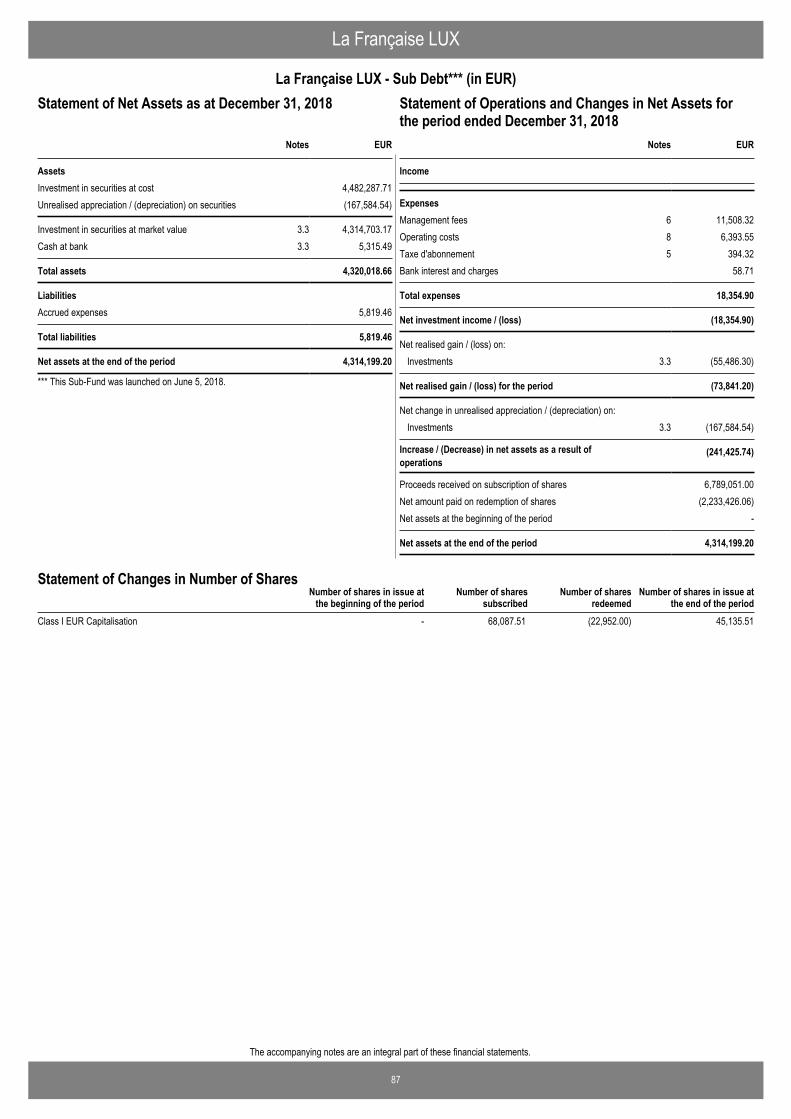
87
The accompanying notes are an integral part of these financial statements.
La Française LUX
La Française LUX - Sub Debt*** (in EUR)Statement of Operations and Changes in Net Assets for theperiod ended December 31, 2018
EUR
AssetsInvestment in securities at cost 4,482,287.71Unrealised appreciation / (depreciation) on securities (167,584.54)
Investment in securities at market value 3.3 4,314,703.17Cash at bank 3.3 5,315.49
Total assets 4,320,018.66
LiabilitiesAccrued expenses 5,819.46
Total liabilities 5,819.46
Net assets at the end of the period 4,314,199.20
Notes
Statement of Net Assets as at December 31, 2018
*** This Sub-Fund was launched on June 5, 2018.
Income
ExpensesManagement fees 6 11,508.32Operating costs 8 6,393.55Taxe d'abonnement 5 394.32Bank interest and charges 58.71
Total expenses 18,354.90
Net investment income / (loss) (18,354.90)
Net realised gain / (loss) on: Investments 3.3 (55,486.30)
Net realised gain / (loss) for the period (73,841.20)
Net change in unrealised appreciation / (depreciation) on: Investments 3.3 (167,584.54)
Increase / (Decrease) in net assets as a result ofoperations
(241,425.74)
Proceeds received on subscription of shares 6,789,051.00Net amount paid on redemption of shares (2,233,426.06)Net assets at the beginning of the period -
Net assets at the end of the period 4,314,199.20
EURNotes
Statement of Operations and Changes in Net Assets forthe period ended December 31, 2018
Number of shares in issue atthe end of the period
Number of shares in issue atthe beginning of the period
Number of sharessubscribed
Number of sharesredeemed
Statement of Changes in Number of Shares
Class I EUR Capitalisation - 68,087.51 (22,952.00) 45,135.51
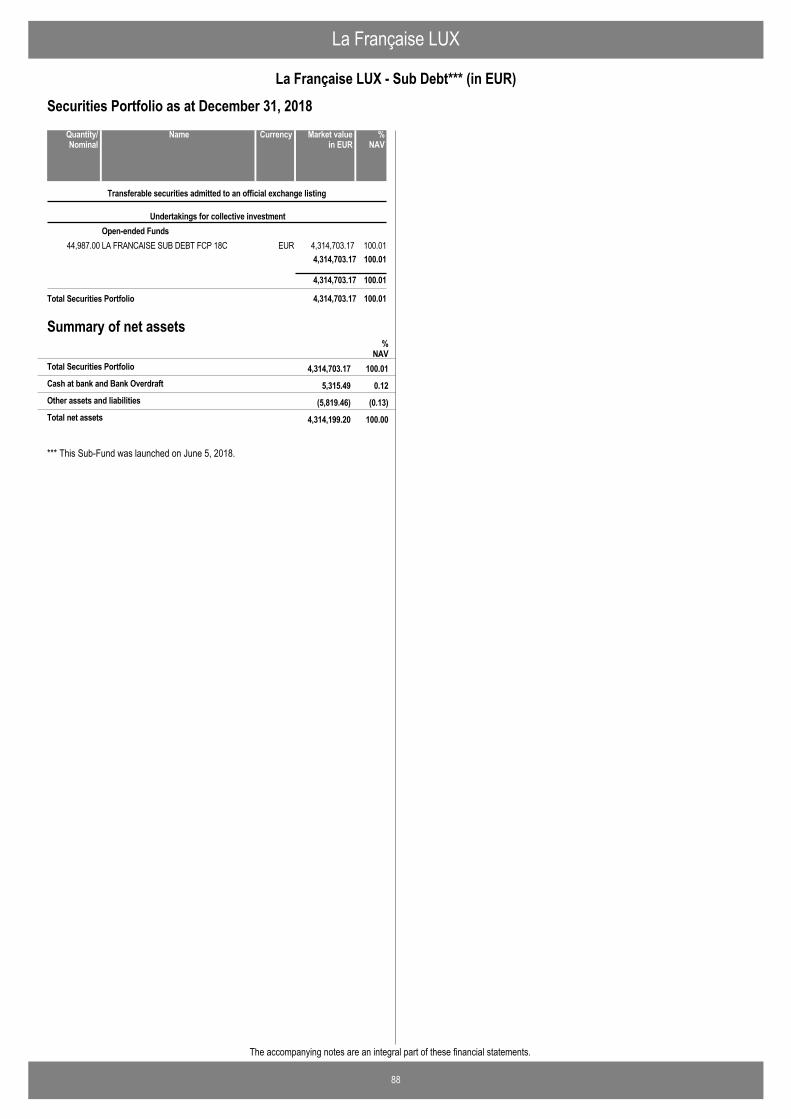
La Française LUX
88
La Française LUX - Sub Debt*** (in EUR)
The accompanying notes are an integral part of these financial statements.
Securities Portfolio as at December 31, 2018
LA FRANCAISE SUB DEBT FCP 18C EUR 4,314,703.17 100.0144,987.00
Transferable securities admitted to an official exchange listing
Undertakings for collective investmentOpen-ended Funds
4,314,703.17 100.01
4,314,703.17 100.01
Total Securities Portfolio 4,314,703.17 100.01
NameQuantity/Nominal
Market valuein EUR
Currency %NAV
Summary of net assets%
NAV4,314,703.17 100.01Total Securities Portfolio
5,315.49 0.12Cash at bank and Bank Overdraft
(5,819.46) (0.13)Other assets and liabilities
4,314,199.20 100.00Total net assets
*** This Sub-Fund was launched on June 5, 2018.
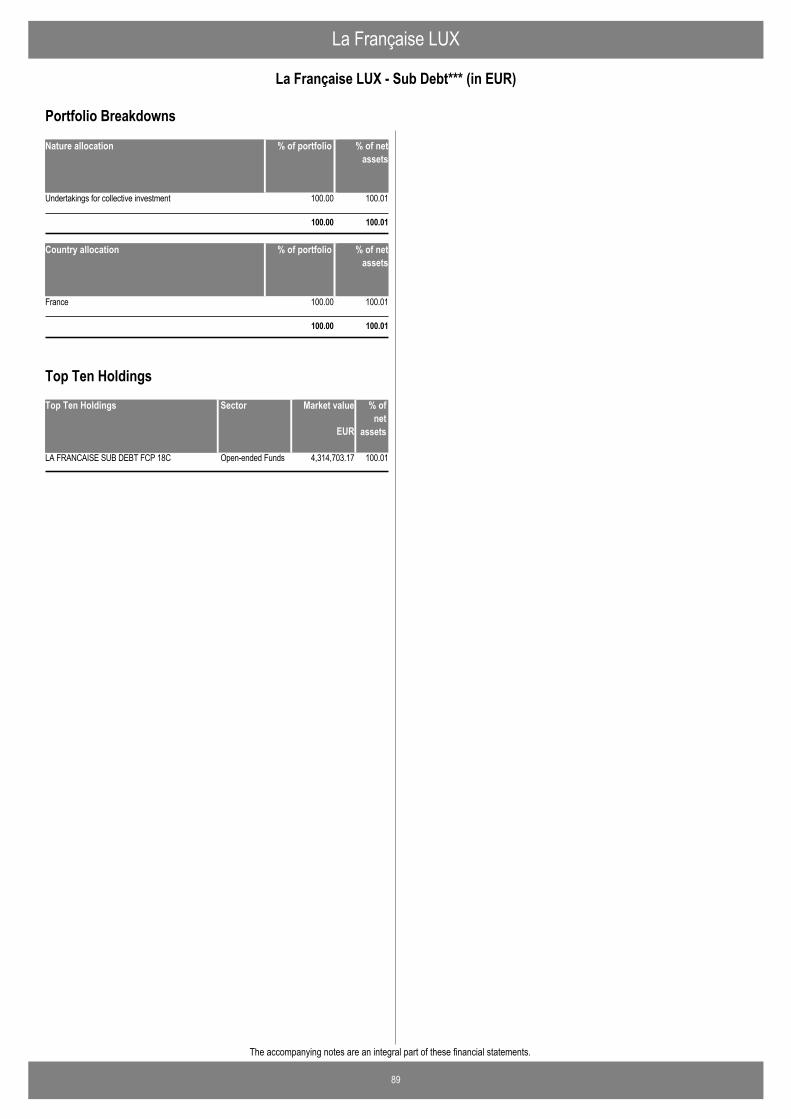
La Française LUX
89
La Française LUX - Sub Debt*** (in EUR)
The accompanying notes are an integral part of these financial statements.
Nature allocation % of portfolio % of netassets
Undertakings for collective investment 100.00 100.01
100.00 100.01
Country allocation % of portfolio % of netassets
France 100.00 100.01
100.00 100.01
Portfolio Breakdowns
Top Ten Holdings Market value % ofnet
assets
LA FRANCAISE SUB DEBT FCP 18C 4,314,703.17 100.01Open-ended Funds
EUR
Sector
Top Ten Holdings
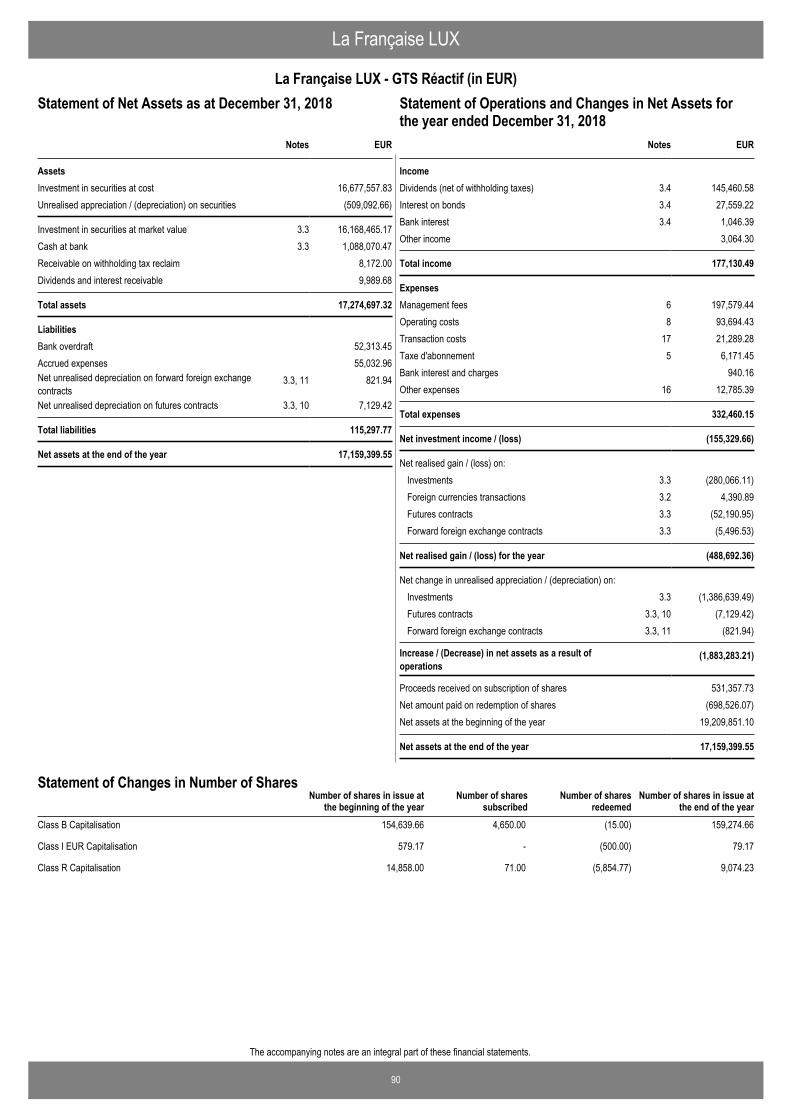
90
The accompanying notes are an integral part of these financial statements.
La Française LUX
La Française LUX - GTS Réactif (in EUR)Statement of Operations and Changes in Net Assets for theyear ended December 31, 2018
EUR
AssetsInvestment in securities at cost 16,677,557.83Unrealised appreciation / (depreciation) on securities (509,092.66)
Investment in securities at market value 3.3 16,168,465.17Cash at bank 3.3 1,088,070.47Receivable on withholding tax reclaim 8,172.00Dividends and interest receivable 9,989.68
Total assets 17,274,697.32
LiabilitiesBank overdraft 52,313.45Accrued expenses 55,032.96Net unrealised depreciation on forward foreign exchangecontracts
3.3, 11 821.94
Net unrealised depreciation on futures contracts 3.3, 10 7,129.42
Total liabilities 115,297.77
Net assets at the end of the year 17,159,399.55
Notes
Statement of Net Assets as at December 31, 2018
IncomeDividends (net of withholding taxes) 3.4 145,460.58Interest on bonds 3.4 27,559.22Bank interest 3.4 1,046.39Other income 3,064.30
Total income 177,130.49
ExpensesManagement fees 6 197,579.44Operating costs 8 93,694.43Transaction costs 17 21,289.28Taxe d'abonnement 5 6,171.45Bank interest and charges 940.16Other expenses 16 12,785.39
Total expenses 332,460.15
Net investment income / (loss) (155,329.66)
Net realised gain / (loss) on: Investments 3.3 (280,066.11)Foreign currencies transactions 3.2 4,390.89Futures contracts 3.3 (52,190.95)Forward foreign exchange contracts 3.3 (5,496.53)
Net realised gain / (loss) for the year (488,692.36)
Net change in unrealised appreciation / (depreciation) on: Investments 3.3 (1,386,639.49)Futures contracts 3.3, 10 (7,129.42)Forward foreign exchange contracts 3.3, 11 (821.94)
Increase / (Decrease) in net assets as a result ofoperations
(1,883,283.21)
Proceeds received on subscription of shares 531,357.73Net amount paid on redemption of shares (698,526.07)Net assets at the beginning of the year 19,209,851.10
Net assets at the end of the year 17,159,399.55
EURNotes
Statement of Operations and Changes in Net Assets forthe year ended December 31, 2018
Number of shares in issue atthe end of the year
Number of shares in issue atthe beginning of the year
Number of sharessubscribed
Number of sharesredeemed
Statement of Changes in Number of Shares
Class B Capitalisation 154,639.66 4,650.00 (15.00) 159,274.66
Class I EUR Capitalisation 579.17 - (500.00) 79.17
Class R Capitalisation 14,858.00 71.00 (5,854.77) 9,074.23
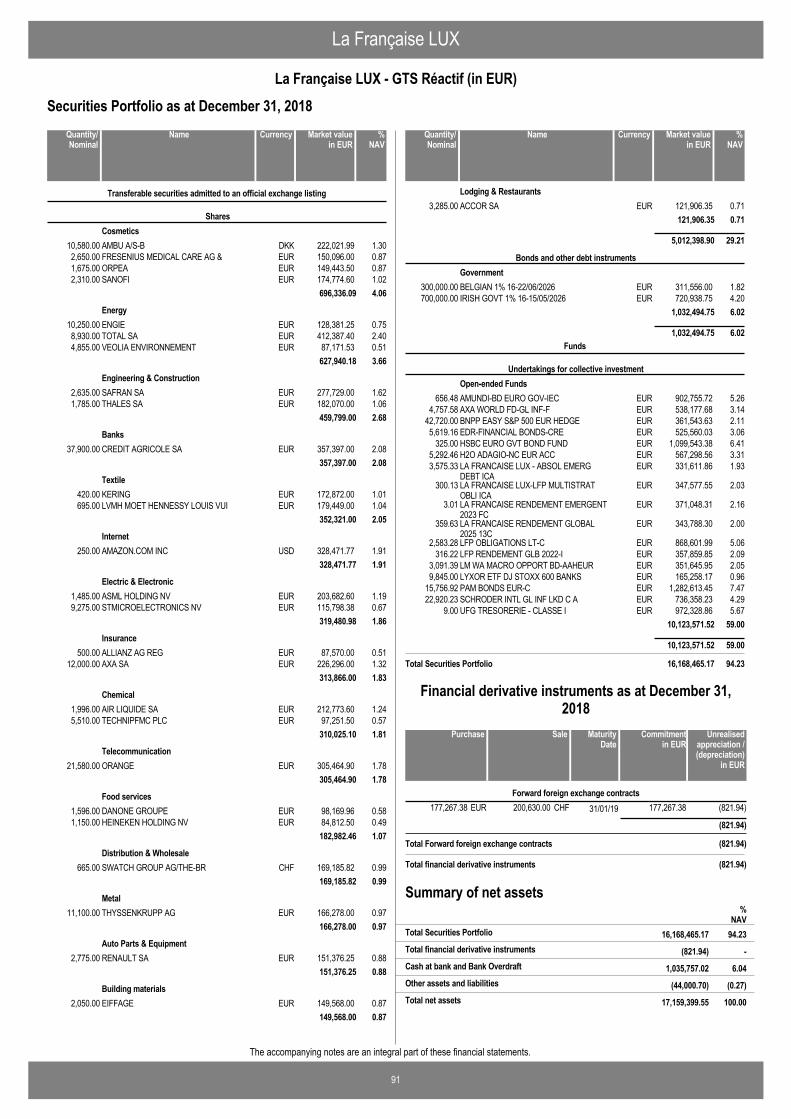
La Française LUX
91
La Française LUX - GTS Réactif (in EUR)
The accompanying notes are an integral part of these financial statements.
Securities Portfolio as at December 31, 2018
AMBU A/S-B DKK 222,021.99 1.3010,580.00
Transferable securities admitted to an official exchange listing
SharesCosmetics
FRESENIUS MEDICAL CARE AG & EUR 150,096.00 0.872,650.00ORPEA EUR 149,443.50 0.871,675.00SANOFI EUR 174,774.60 1.022,310.00
696,336.09 4.06
ENGIE EUR 128,381.25 0.7510,250.00Energy
TOTAL SA EUR 412,387.40 2.408,930.00VEOLIA ENVIRONNEMENT EUR 87,171.53 0.514,855.00
627,940.18 3.66
SAFRAN SA EUR 277,729.00 1.622,635.00Engineering & Construction
THALES SA EUR 182,070.00 1.061,785.00459,799.00 2.68
CREDIT AGRICOLE SA EUR 357,397.00 2.0837,900.00Banks
357,397.00 2.08
KERING EUR 172,872.00 1.01420.00Textile
LVMH MOET HENNESSY LOUIS VUI EUR 179,449.00 1.04695.00352,321.00 2.05
AMAZON.COM INC USD 328,471.77 1.91250.00Internet
328,471.77 1.91
ASML HOLDING NV EUR 203,682.60 1.191,485.00Electric & Electronic
STMICROELECTRONICS NV EUR 115,798.38 0.679,275.00319,480.98 1.86
ALLIANZ AG REG EUR 87,570.00 0.51500.00Insurance
AXA SA EUR 226,296.00 1.3212,000.00313,866.00 1.83
AIR LIQUIDE SA EUR 212,773.60 1.241,996.00Chemical
TECHNIPFMC PLC EUR 97,251.50 0.575,510.00310,025.10 1.81
ORANGE EUR 305,464.90 1.7821,580.00Telecommunication
305,464.90 1.78
DANONE GROUPE EUR 98,169.96 0.581,596.00Food services
HEINEKEN HOLDING NV EUR 84,812.50 0.491,150.00182,982.46 1.07
SWATCH GROUP AG/THE-BR CHF 169,185.82 0.99665.00Distribution & Wholesale
169,185.82 0.99
THYSSENKRUPP AG EUR 166,278.00 0.9711,100.00Metal
166,278.00 0.97
RENAULT SA EUR 151,376.25 0.882,775.00Auto Parts & Equipment
151,376.25 0.88
EIFFAGE EUR 149,568.00 0.872,050.00Building materials
149,568.00 0.87
NameQuantity/Nominal
Market valuein EUR
Currency %NAV
ACCOR SA EUR 121,906.35 0.713,285.00Lodging & Restaurants
121,906.35 0.71
5,012,398.90 29.21
BELGIAN 1% 16-22/06/2026 EUR 311,556.00 1.82300,000.00
Bonds and other debt instrumentsGovernment
IRISH GOVT 1% 16-15/05/2026 EUR 720,938.75 4.20700,000.001,032,494.75 6.02
1,032,494.75 6.02
AMUNDI-BD EURO GOV-IEC EUR 902,755.72 5.26656.48
Funds
Undertakings for collective investmentOpen-ended Funds
AXA WORLD FD-GL INF-F EUR 538,177.68 3.144,757.58BNPP EASY S&P 500 EUR HEDGE EUR 361,543.63 2.1142,720.00EDR-FINANCIAL BONDS-CRE EUR 525,560.03 3.065,619.16HSBC EURO GVT BOND FUND EUR 1,099,543.38 6.41325.00H2O ADAGIO-NC EUR ACC EUR 567,298.56 3.315,292.46LA FRANCAISE LUX - ABSOL EMERGDEBT ICA
EUR 331,611.86 1.933,575.33
LA FRANCAISE LUX-LFP MULTISTRATOBLI ICA
EUR 347,577.55 2.03300.13
LA FRANCAISE RENDEMENT EMERGENT2023 FC
EUR 371,048.31 2.163.01
LA FRANCAISE RENDEMENT GLOBAL2025 13C
EUR 343,788.30 2.00359.63
LFP OBLIGATIONS LT-C EUR 868,601.99 5.062,583.28LFP RENDEMENT GLB 2022-I EUR 357,859.85 2.09316.22LM WA MACRO OPPORT BD-AAHEUR EUR 351,645.95 2.053,091.39LYXOR ETF DJ STOXX 600 BANKS EUR 165,258.17 0.969,845.00PAM BONDS EUR-C EUR 1,282,613.45 7.4715,756.92SCHRODER INTL GL INF LKD C A EUR 736,358.23 4.2922,920.23UFG TRESORERIE - CLASSE I EUR 972,328.86 5.679.00
10,123,571.52 59.00
10,123,571.52 59.00
Total Securities Portfolio 16,168,465.17 94.23
NameQuantity/Nominal
Market valuein EUR
Currency %NAV
200,630.00 31/01/19177,267.38 (821.94)CHFEUR 177,267.38Forward foreign exchange contracts
(821.94)
Total Forward foreign exchange contracts (821.94)
SalePurchase Unrealisedappreciation /(depreciation)
in EUR
MaturityDate
Commitmentin EUR
Financial derivative instruments as at December 31,2018
Total financial derivative instruments (821.94)
Summary of net assets
(821.94) -Total financial derivative instruments
%NAV
16,168,465.17 94.23Total Securities Portfolio
1,035,757.02 6.04Cash at bank and Bank Overdraft
(44,000.70) (0.27)Other assets and liabilities
17,159,399.55 100.00Total net assets
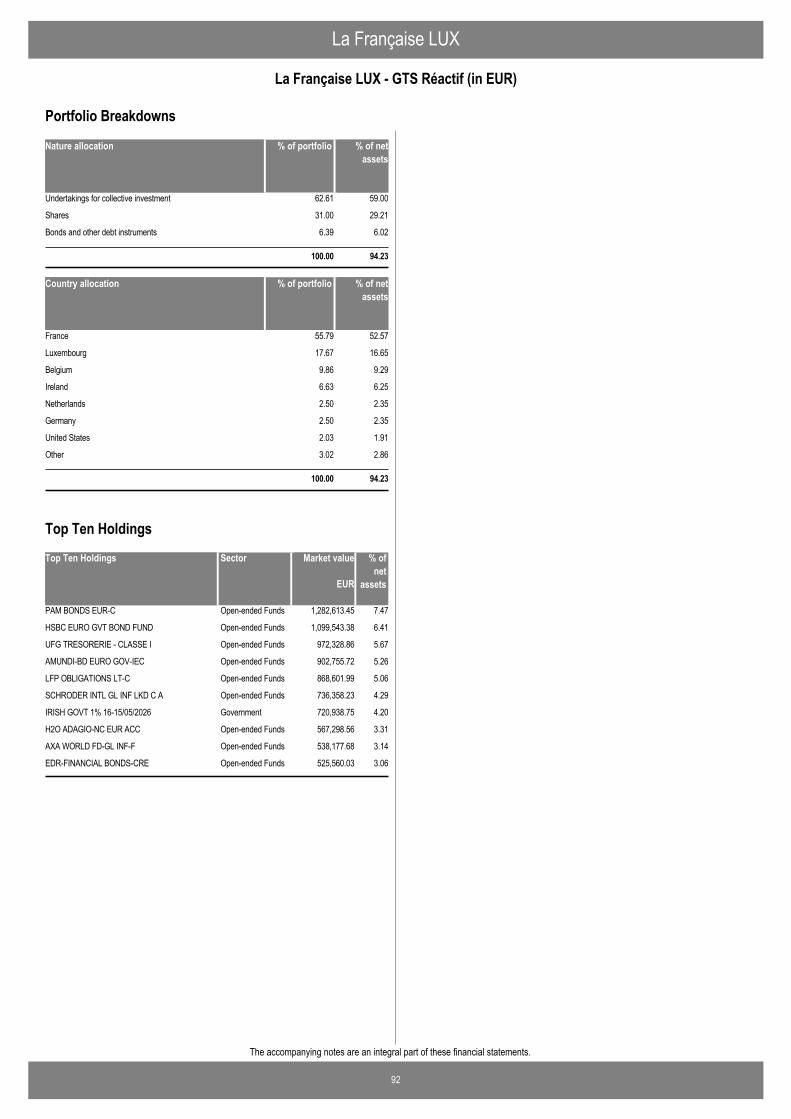
La Française LUX
92
La Française LUX - GTS Réactif (in EUR)
The accompanying notes are an integral part of these financial statements.
Nature allocation % of portfolio % of netassets
Undertakings for collective investment 62.61 59.00
Shares 31.00 29.21
Bonds and other debt instruments 6.39 6.02
100.00 94.23
Country allocation % of portfolio % of netassets
France 55.79 52.57
Luxembourg 17.67 16.65
Belgium 9.86 9.29
Ireland 6.63 6.25
Netherlands 2.50 2.35
Germany 2.50 2.35
United States 2.03 1.91
Other 3.02 2.86
100.00 94.23
Portfolio Breakdowns
Top Ten Holdings Market value % ofnet
assets
PAM BONDS EUR-C 1,282,613.45 7.47Open-ended Funds
HSBC EURO GVT BOND FUND 1,099,543.38 6.41Open-ended Funds
UFG TRESORERIE - CLASSE I 972,328.86 5.67Open-ended Funds
AMUNDI-BD EURO GOV-IEC 902,755.72 5.26Open-ended Funds
LFP OBLIGATIONS LT-C 868,601.99 5.06Open-ended Funds
SCHRODER INTL GL INF LKD C A 736,358.23 4.29Open-ended Funds
IRISH GOVT 1% 16-15/05/2026 720,938.75 4.20Government
H2O ADAGIO-NC EUR ACC 567,298.56 3.31Open-ended Funds
AXA WORLD FD-GL INF-F 538,177.68 3.14Open-ended Funds
EDR-FINANCIAL BONDS-CRE 525,560.03 3.06Open-ended Funds
EUR
Sector
Top Ten Holdings
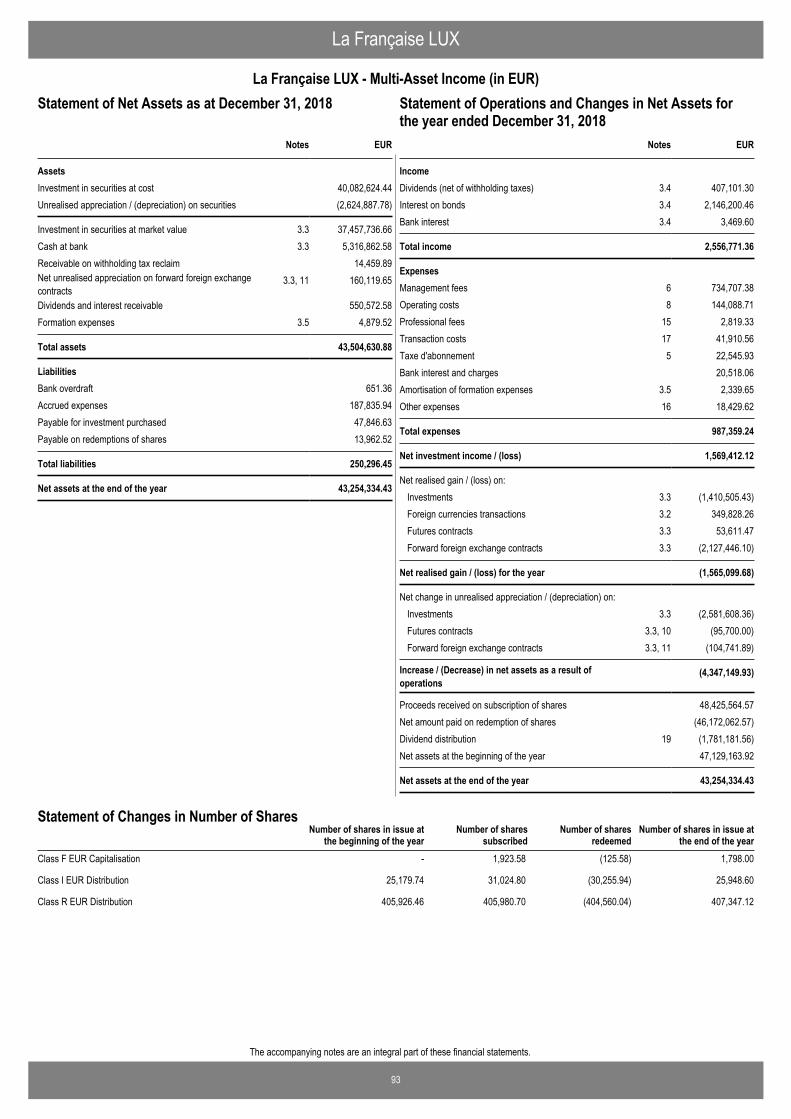
93
The accompanying notes are an integral part of these financial statements.
La Française LUX
La Française LUX - Multi-Asset Income (in EUR)Statement of Operations and Changes in Net Assets for theyear ended December 31, 2018
EUR
AssetsInvestment in securities at cost 40,082,624.44Unrealised appreciation / (depreciation) on securities (2,624,887.78)
Investment in securities at market value 3.3 37,457,736.66Cash at bank 3.3 5,316,862.58Receivable on withholding tax reclaim 14,459.89Net unrealised appreciation on forward foreign exchangecontracts
3.3, 11 160,119.65
Dividends and interest receivable 550,572.58Formation expenses 3.5 4,879.52
Total assets 43,504,630.88
LiabilitiesBank overdraft 651.36Accrued expenses 187,835.94Payable for investment purchased 47,846.63Payable on redemptions of shares 13,962.52
Total liabilities 250,296.45
Net assets at the end of the year 43,254,334.43
Notes
Statement of Net Assets as at December 31, 2018
IncomeDividends (net of withholding taxes) 3.4 407,101.30Interest on bonds 3.4 2,146,200.46Bank interest 3.4 3,469.60
Total income 2,556,771.36
ExpensesManagement fees 6 734,707.38Operating costs 8 144,088.71Professional fees 15 2,819.33Transaction costs 17 41,910.56Taxe d'abonnement 5 22,545.93Bank interest and charges 20,518.06Amortisation of formation expenses 3.5 2,339.65Other expenses 16 18,429.62
Total expenses 987,359.24
Net investment income / (loss) 1,569,412.12
Net realised gain / (loss) on: Investments 3.3 (1,410,505.43)Foreign currencies transactions 3.2 349,828.26Futures contracts 3.3 53,611.47Forward foreign exchange contracts 3.3 (2,127,446.10)
Net realised gain / (loss) for the year (1,565,099.68)
Net change in unrealised appreciation / (depreciation) on: Investments 3.3 (2,581,608.36)Futures contracts 3.3, 10 (95,700.00)Forward foreign exchange contracts 3.3, 11 (104,741.89)
Increase / (Decrease) in net assets as a result ofoperations
(4,347,149.93)
Proceeds received on subscription of shares 48,425,564.57Net amount paid on redemption of shares (46,172,062.57)Dividend distribution 19 (1,781,181.56)Net assets at the beginning of the year 47,129,163.92
Net assets at the end of the year 43,254,334.43
EURNotes
Statement of Operations and Changes in Net Assets forthe year ended December 31, 2018
Number of shares in issue atthe end of the year
Number of shares in issue atthe beginning of the year
Number of sharessubscribed
Number of sharesredeemed
Statement of Changes in Number of Shares
Class F EUR Capitalisation - 1,923.58 (125.58) 1,798.00
Class I EUR Distribution 25,179.74 31,024.80 (30,255.94) 25,948.60
Class R EUR Distribution 405,926.46 405,980.70 (404,560.04) 407,347.12
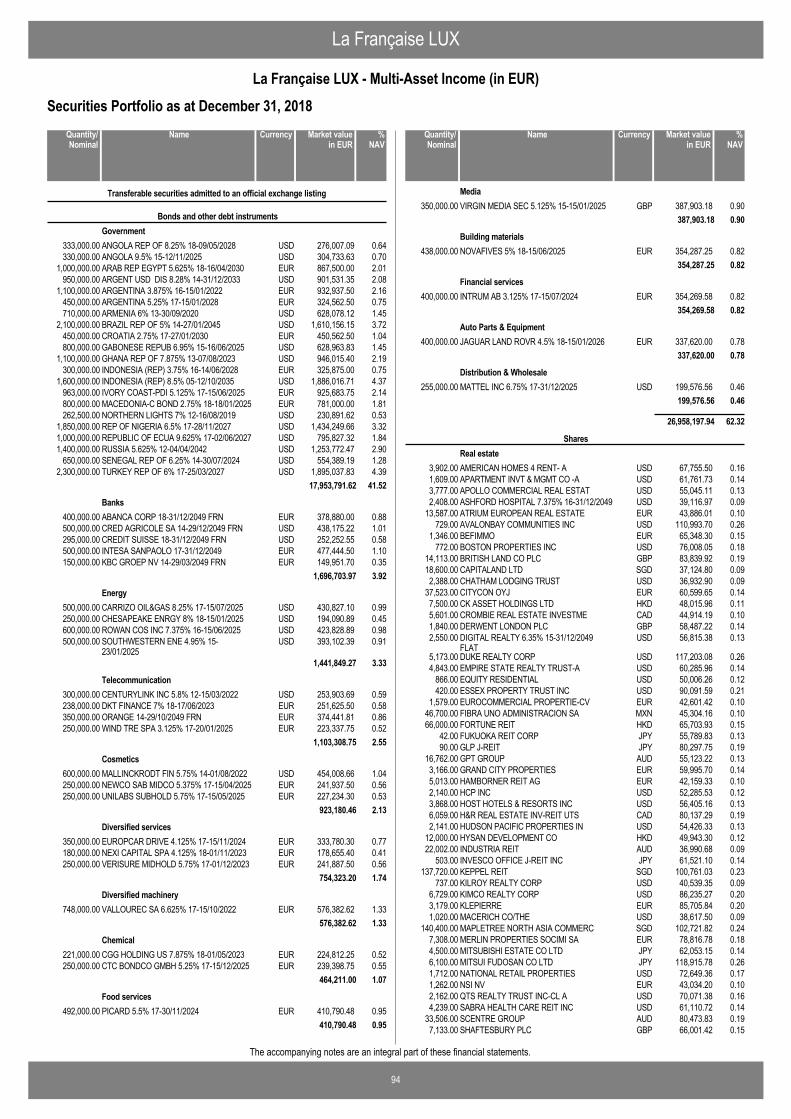
La Française LUX
94
La Française LUX - Multi-Asset Income (in EUR)
The accompanying notes are an integral part of these financial statements.
Securities Portfolio as at December 31, 2018
ANGOLA REP OF 8.25% 18-09/05/2028 USD 276,007.09 0.64333,000.00
Transferable securities admitted to an official exchange listing
Bonds and other debt instrumentsGovernment
ANGOLA 9.5% 15-12/11/2025 USD 304,733.63 0.70330,000.00ARAB REP EGYPT 5.625% 18-16/04/2030 EUR 867,500.00 2.011,000,000.00ARGENT USD DIS 8.28% 14-31/12/2033 USD 901,531.35 2.08950,000.00ARGENTINA 3.875% 16-15/01/2022 EUR 932,937.50 2.161,100,000.00ARGENTINA 5.25% 17-15/01/2028 EUR 324,562.50 0.75450,000.00ARMENIA 6% 13-30/09/2020 USD 628,078.12 1.45710,000.00BRAZIL REP OF 5% 14-27/01/2045 USD 1,610,156.15 3.722,100,000.00CROATIA 2.75% 17-27/01/2030 EUR 450,562.50 1.04450,000.00GABONESE REPUB 6.95% 15-16/06/2025 USD 628,963.83 1.45800,000.00GHANA REP OF 7.875% 13-07/08/2023 USD 946,015.40 2.191,100,000.00INDONESIA (REP) 3.75% 16-14/06/2028 EUR 325,875.00 0.75300,000.00INDONESIA (REP) 8.5% 05-12/10/2035 USD 1,886,016.71 4.371,600,000.00IVORY COAST-PDI 5.125% 17-15/06/2025 EUR 925,683.75 2.14963,000.00MACEDONIA-C BOND 2.75% 18-18/01/2025 EUR 781,000.00 1.81800,000.00NORTHERN LIGHTS 7% 12-16/08/2019 USD 230,891.62 0.53262,500.00REP OF NIGERIA 6.5% 17-28/11/2027 USD 1,434,249.66 3.321,850,000.00REPUBLIC OF ECUA 9.625% 17-02/06/2027 USD 795,827.32 1.841,000,000.00RUSSIA 5.625% 12-04/04/2042 USD 1,253,772.47 2.901,400,000.00SENEGAL REP OF 6.25% 14-30/07/2024 USD 554,389.19 1.28650,000.00TURKEY REP OF 6% 17-25/03/2027 USD 1,895,037.83 4.392,300,000.00
17,953,791.62 41.52
ABANCA CORP 18-31/12/2049 FRN EUR 378,880.00 0.88400,000.00Banks
CRED AGRICOLE SA 14-29/12/2049 FRN USD 438,175.22 1.01500,000.00CREDIT SUISSE 18-31/12/2049 FRN USD 252,252.55 0.58295,000.00INTESA SANPAOLO 17-31/12/2049 EUR 477,444.50 1.10500,000.00KBC GROEP NV 14-29/03/2049 FRN EUR 149,951.70 0.35150,000.00
1,696,703.97 3.92
CARRIZO OIL&GAS 8.25% 17-15/07/2025 USD 430,827.10 0.99500,000.00Energy
CHESAPEAKE ENRGY 8% 18-15/01/2025 USD 194,090.89 0.45250,000.00ROWAN COS INC 7.375% 16-15/06/2025 USD 423,828.89 0.98600,000.00SOUTHWESTERN ENE 4.95% 15-23/01/2025
USD 393,102.39 0.91500,000.00
1,441,849.27 3.33
CENTURYLINK INC 5.8% 12-15/03/2022 USD 253,903.69 0.59300,000.00Telecommunication
DKT FINANCE 7% 18-17/06/2023 EUR 251,625.50 0.58238,000.00ORANGE 14-29/10/2049 FRN EUR 374,441.81 0.86350,000.00WIND TRE SPA 3.125% 17-20/01/2025 EUR 223,337.75 0.52250,000.00
1,103,308.75 2.55
MALLINCKRODT FIN 5.75% 14-01/08/2022 USD 454,008.66 1.04600,000.00Cosmetics
NEWCO SAB MIDCO 5.375% 17-15/04/2025 EUR 241,937.50 0.56250,000.00UNILABS SUBHOLD 5.75% 17-15/05/2025 EUR 227,234.30 0.53250,000.00
923,180.46 2.13
EUROPCAR DRIVE 4.125% 17-15/11/2024 EUR 333,780.30 0.77350,000.00Diversified services
NEXI CAPITAL SPA 4.125% 18-01/11/2023 EUR 178,655.40 0.41180,000.00VERISURE MIDHOLD 5.75% 17-01/12/2023 EUR 241,887.50 0.56250,000.00
754,323.20 1.74
VALLOUREC SA 6.625% 17-15/10/2022 EUR 576,382.62 1.33748,000.00Diversified machinery
576,382.62 1.33
CGG HOLDING US 7.875% 18-01/05/2023 EUR 224,812.25 0.52221,000.00Chemical
CTC BONDCO GMBH 5.25% 17-15/12/2025 EUR 239,398.75 0.55250,000.00464,211.00 1.07
PICARD 5.5% 17-30/11/2024 EUR 410,790.48 0.95492,000.00Food services
410,790.48 0.95
NameQuantity/Nominal
Market valuein EUR
Currency %NAV
VIRGIN MEDIA SEC 5.125% 15-15/01/2025 GBP 387,903.18 0.90350,000.00Media
387,903.18 0.90
NOVAFIVES 5% 18-15/06/2025 EUR 354,287.25 0.82438,000.00Building materials
354,287.25 0.82
INTRUM AB 3.125% 17-15/07/2024 EUR 354,269.58 0.82400,000.00Financial services
354,269.58 0.82
JAGUAR LAND ROVR 4.5% 18-15/01/2026 EUR 337,620.00 0.78400,000.00Auto Parts & Equipment
337,620.00 0.78
MATTEL INC 6.75% 17-31/12/2025 USD 199,576.56 0.46255,000.00Distribution & Wholesale
199,576.56 0.46
26,958,197.94 62.32
AMERICAN HOMES 4 RENT- A USD 67,755.50 0.163,902.00
SharesReal estate
APARTMENT INVT & MGMT CO -A USD 61,761.73 0.141,609.00APOLLO COMMERCIAL REAL ESTAT USD 55,045.11 0.133,777.00ASHFORD HOSPITAL 7.375% 16-31/12/2049 USD 39,116.97 0.092,408.00ATRIUM EUROPEAN REAL ESTATE EUR 43,886.01 0.1013,587.00AVALONBAY COMMUNITIES INC USD 110,993.70 0.26729.00BEFIMMO EUR 65,348.30 0.151,346.00BOSTON PROPERTIES INC USD 76,008.05 0.18772.00BRITISH LAND CO PLC GBP 83,839.92 0.1914,113.00CAPITALAND LTD SGD 37,124.80 0.0918,600.00CHATHAM LODGING TRUST USD 36,932.90 0.092,388.00CITYCON OYJ EUR 60,599.65 0.1437,523.00CK ASSET HOLDINGS LTD HKD 48,015.96 0.117,500.00CROMBIE REAL ESTATE INVESTME CAD 44,914.19 0.105,601.00DERWENT LONDON PLC GBP 58,487.22 0.141,840.00DIGITAL REALTY 6.35% 15-31/12/2049FLAT
USD 56,815.38 0.132,550.00
DUKE REALTY CORP USD 117,203.08 0.265,173.00EMPIRE STATE REALTY TRUST-A USD 60,285.96 0.144,843.00EQUITY RESIDENTIAL USD 50,006.26 0.12866.00ESSEX PROPERTY TRUST INC USD 90,091.59 0.21420.00EUROCOMMERCIAL PROPERTIE-CV EUR 42,601.42 0.101,579.00FIBRA UNO ADMINISTRACION SA MXN 45,304.16 0.1046,700.00FORTUNE REIT HKD 65,703.93 0.1566,000.00FUKUOKA REIT CORP JPY 55,789.83 0.1342.00GLP J-REIT JPY 80,297.75 0.1990.00GPT GROUP AUD 55,123.22 0.1316,762.00GRAND CITY PROPERTIES EUR 59,995.70 0.143,166.00HAMBORNER REIT AG EUR 42,159.33 0.105,013.00HCP INC USD 52,285.53 0.122,140.00HOST HOTELS & RESORTS INC USD 56,405.16 0.133,868.00H&R REAL ESTATE INV-REIT UTS CAD 80,137.29 0.196,059.00HUDSON PACIFIC PROPERTIES IN USD 54,426.33 0.132,141.00HYSAN DEVELOPMENT CO HKD 49,943.30 0.1212,000.00INDUSTRIA REIT AUD 36,990.68 0.0922,002.00INVESCO OFFICE J-REIT INC JPY 61,521.10 0.14503.00KEPPEL REIT SGD 100,761.03 0.23137,720.00KILROY REALTY CORP USD 40,539.35 0.09737.00KIMCO REALTY CORP USD 86,235.27 0.206,729.00KLEPIERRE EUR 85,705.84 0.203,179.00MACERICH CO/THE USD 38,617.50 0.091,020.00MAPLETREE NORTH ASIA COMMERC SGD 102,721.82 0.24140,400.00MERLIN PROPERTIES SOCIMI SA EUR 78,816.78 0.187,308.00MITSUBISHI ESTATE CO LTD JPY 62,053.15 0.144,500.00MITSUI FUDOSAN CO LTD JPY 118,915.78 0.266,100.00NATIONAL RETAIL PROPERTIES USD 72,649.36 0.171,712.00NSI NV EUR 43,034.20 0.101,262.00QTS REALTY TRUST INC-CL A USD 70,071.38 0.162,162.00SABRA HEALTH CARE REIT INC USD 61,110.72 0.144,239.00SCENTRE GROUP AUD 80,473.83 0.1933,506.00SHAFTESBURY PLC GBP 66,001.42 0.157,133.00
NameQuantity/Nominal
Market valuein EUR
Currency %NAV
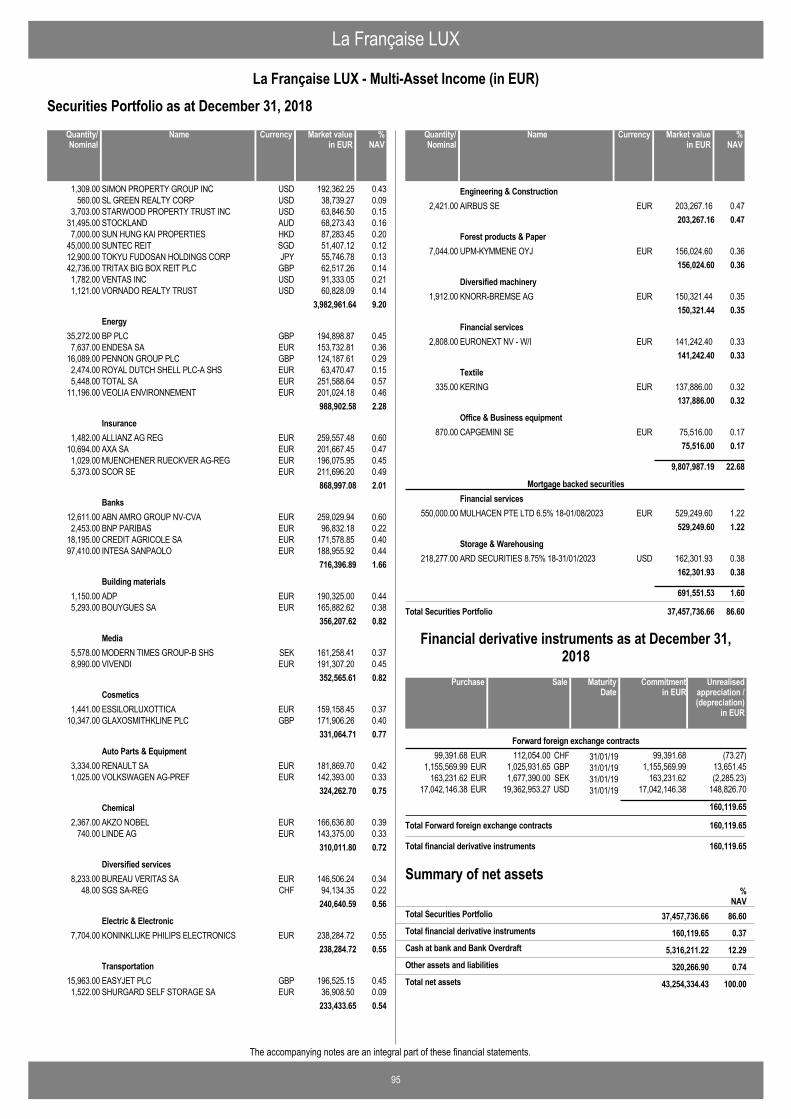
La Française LUX
95
La Française LUX - Multi-Asset Income (in EUR)
The accompanying notes are an integral part of these financial statements.
Securities Portfolio as at December 31, 2018
SIMON PROPERTY GROUP INC USD 192,362.25 0.431,309.00SL GREEN REALTY CORP USD 38,739.27 0.09560.00STARWOOD PROPERTY TRUST INC USD 63,846.50 0.153,703.00STOCKLAND AUD 68,273.43 0.1631,495.00SUN HUNG KAI PROPERTIES HKD 87,283.45 0.207,000.00SUNTEC REIT SGD 51,407.12 0.1245,000.00TOKYU FUDOSAN HOLDINGS CORP JPY 55,746.78 0.1312,900.00TRITAX BIG BOX REIT PLC GBP 62,517.26 0.1442,736.00VENTAS INC USD 91,333.05 0.211,782.00VORNADO REALTY TRUST USD 60,828.09 0.141,121.00
3,982,961.64 9.20
BP PLC GBP 194,898.87 0.4535,272.00Energy
ENDESA SA EUR 153,732.81 0.367,637.00PENNON GROUP PLC GBP 124,187.61 0.2916,089.00ROYAL DUTCH SHELL PLC-A SHS EUR 63,470.47 0.152,474.00TOTAL SA EUR 251,588.64 0.575,448.00VEOLIA ENVIRONNEMENT EUR 201,024.18 0.4611,196.00
988,902.58 2.28
ALLIANZ AG REG EUR 259,557.48 0.601,482.00Insurance
AXA SA EUR 201,667.45 0.4710,694.00MUENCHENER RUECKVER AG-REG EUR 196,075.95 0.451,029.00SCOR SE EUR 211,696.20 0.495,373.00
868,997.08 2.01
ABN AMRO GROUP NV-CVA EUR 259,029.94 0.6012,611.00Banks
BNP PARIBAS EUR 96,832.18 0.222,453.00CREDIT AGRICOLE SA EUR 171,578.85 0.4018,195.00INTESA SANPAOLO EUR 188,955.92 0.4497,410.00
716,396.89 1.66
ADP EUR 190,325.00 0.441,150.00Building materials
BOUYGUES SA EUR 165,882.62 0.385,293.00356,207.62 0.82
MODERN TIMES GROUP-B SHS SEK 161,258.41 0.375,578.00Media
VIVENDI EUR 191,307.20 0.458,990.00352,565.61 0.82
ESSILORLUXOTTICA EUR 159,158.45 0.371,441.00Cosmetics
GLAXOSMITHKLINE PLC GBP 171,906.26 0.4010,347.00331,064.71 0.77
RENAULT SA EUR 181,869.70 0.423,334.00Auto Parts & Equipment
VOLKSWAGEN AG-PREF EUR 142,393.00 0.331,025.00324,262.70 0.75
AKZO NOBEL EUR 166,636.80 0.392,367.00Chemical
LINDE AG EUR 143,375.00 0.33740.00310,011.80 0.72
BUREAU VERITAS SA EUR 146,506.24 0.348,233.00Diversified services
SGS SA-REG CHF 94,134.35 0.2248.00240,640.59 0.56
KONINKLIJKE PHILIPS ELECTRONICS EUR 238,284.72 0.557,704.00Electric & Electronic
238,284.72 0.55
EASYJET PLC GBP 196,525.15 0.4515,963.00Transportation
SHURGARD SELF STORAGE SA EUR 36,908.50 0.091,522.00233,433.65 0.54
NameQuantity/Nominal
Market valuein EUR
Currency %NAV
AIRBUS SE EUR 203,267.16 0.472,421.00Engineering & Construction
203,267.16 0.47
UPM-KYMMENE OYJ EUR 156,024.60 0.367,044.00Forest products & Paper
156,024.60 0.36
KNORR-BREMSE AG EUR 150,321.44 0.351,912.00Diversified machinery
150,321.44 0.35
EURONEXT NV - W/I EUR 141,242.40 0.332,808.00Financial services
141,242.40 0.33
KERING EUR 137,886.00 0.32335.00Textile
137,886.00 0.32
CAPGEMINI SE EUR 75,516.00 0.17870.00Office & Business equipment
75,516.00 0.17
9,807,987.19 22.68
MULHACEN PTE LTD 6.5% 18-01/08/2023 EUR 529,249.60 1.22550,000.00
Mortgage backed securitiesFinancial services
529,249.60 1.22
ARD SECURITIES 8.75% 18-31/01/2023 USD 162,301.93 0.38218,277.00Storage & Warehousing
162,301.93 0.38
691,551.53 1.60
Total Securities Portfolio 37,457,736.66 86.60
NameQuantity/Nominal
Market valuein EUR
Currency %NAV
112,054.00 31/01/1999,391.68 (73.27)CHFEUR 99,391.68Forward foreign exchange contracts
1,025,931.65 31/01/191,155,569.99 13,651.45GBPEUR 1,155,569.991,677,390.00 31/01/19163,231.62 (2,285.23)SEKEUR 163,231.62
19,362,953.27 31/01/1917,042,146.38 148,826.70USDEUR 17,042,146.38
160,119.65
Total Forward foreign exchange contracts 160,119.65
SalePurchase Unrealisedappreciation /(depreciation)
in EUR
MaturityDate
Commitmentin EUR
Financial derivative instruments as at December 31,2018
Total financial derivative instruments 160,119.65
Summary of net assets
160,119.65 0.37Total financial derivative instruments
%NAV
37,457,736.66 86.60Total Securities Portfolio
5,316,211.22 12.29Cash at bank and Bank Overdraft
320,266.90 0.74Other assets and liabilities
43,254,334.43 100.00Total net assets
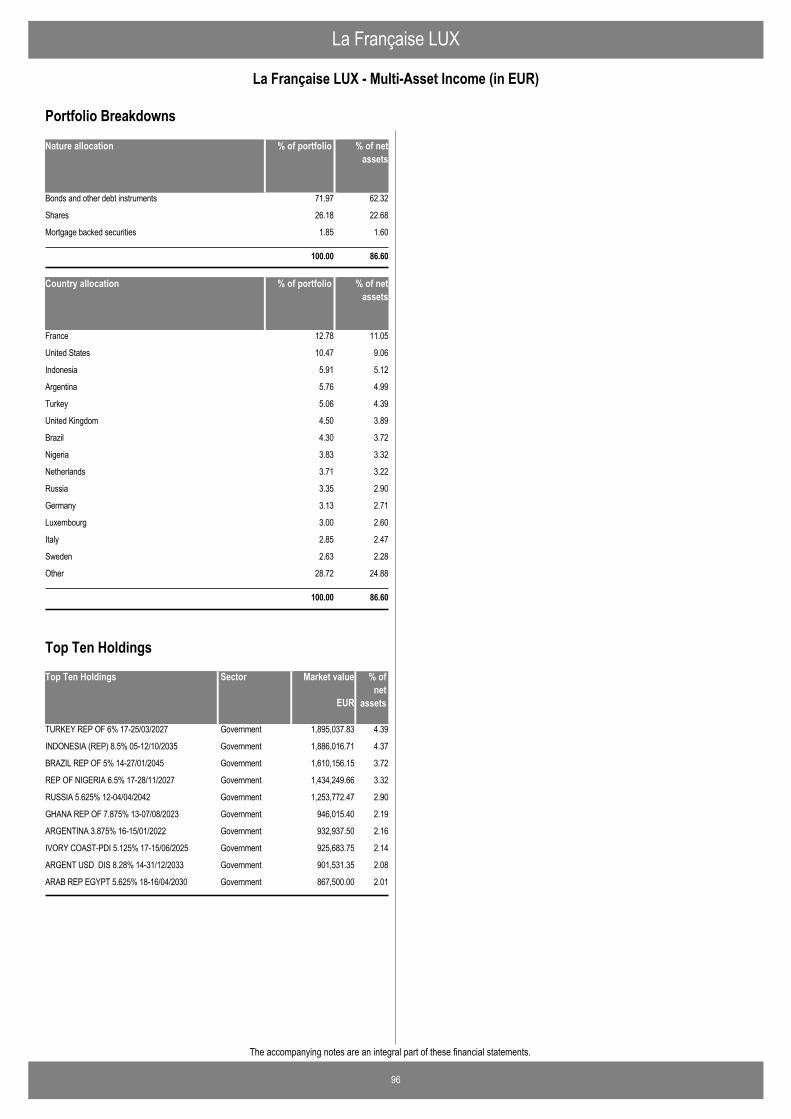
La Française LUX
96
La Française LUX - Multi-Asset Income (in EUR)
The accompanying notes are an integral part of these financial statements.
Nature allocation % of portfolio % of netassets
Bonds and other debt instruments 71.97 62.32
Shares 26.18 22.68
Mortgage backed securities 1.85 1.60
100.00 86.60
Country allocation % of portfolio % of netassets
France 12.78 11.05
United States 10.47 9.06
Indonesia 5.91 5.12
Argentina 5.76 4.99
Turkey 5.06 4.39
United Kingdom 4.50 3.89
Brazil 4.30 3.72
Nigeria 3.83 3.32
Netherlands 3.71 3.22
Russia 3.35 2.90
Germany 3.13 2.71
Luxembourg 3.00 2.60
Italy 2.85 2.47
Sweden 2.63 2.28
Other 28.72 24.88
100.00 86.60
Portfolio Breakdowns
Top Ten Holdings Market value % ofnet
assets
TURKEY REP OF 6% 17-25/03/2027 1,895,037.83 4.39Government
INDONESIA (REP) 8.5% 05-12/10/2035 1,886,016.71 4.37Government
BRAZIL REP OF 5% 14-27/01/2045 1,610,156.15 3.72Government
REP OF NIGERIA 6.5% 17-28/11/2027 1,434,249.66 3.32Government
RUSSIA 5.625% 12-04/04/2042 1,253,772.47 2.90Government
GHANA REP OF 7.875% 13-07/08/2023 946,015.40 2.19Government
ARGENTINA 3.875% 16-15/01/2022 932,937.50 2.16Government
IVORY COAST-PDI 5.125% 17-15/06/2025 925,683.75 2.14Government
ARGENT USD DIS 8.28% 14-31/12/2033 901,531.35 2.08Government
ARAB REP EGYPT 5.625% 18-16/04/2030 867,500.00 2.01Government
EUR
Sector
Top Ten Holdings
Notes to the Financial Statements as at December 31, 2018
La Française LUX
Note 1 - General information La Française LUX, (the "SICAV"), is an open-ended investment SICAV organised as a société anonyme under the laws of the Grand Duchy of Luxembourg and qualifies as a société d’investissement à capital variable ("SICAV"), incorporated on October 28, 1998 and authorised by the Part I of the amended Law of December 17, 2010 (the “Law”) relating to Undertakings for Collective Investment in Transferable Securities. The SICAV is registered with the Luxembourg Trade and Companies Register under number B 66.785. LA FRANCAISE AM INTERNATIONAL (the “Management Company”) has been appointed as Management Company of the SICAV. The Management Company is accredited as Management Company in accordance with the Chapter 15 of the Law. The following Sub-Funds are open to subscription as at December 31, 2018: La Française LUX - Forum Global Real Estate Securities; La Française LUX - Inflection Point Carbon Impact Euro (previously named La Française LUX - Inflection Point European Equity); La Française LUX - Inflection Point Gonet Swiss Equity; La Française LUX - Inflection Point Leaders Emergents; La Française LUX - Inflection Point Carbon Impact Global (previously named La Française LUX - Inflection Point Zero Carbon); La Française LUX - Sustainable Real Estate Securities; La Française LUX - Absolute Emerging Debt; La Française LUX - Euro Inflation; La Française LUX - Global Credit Duration Hedged (this Sub-Fund was launched on June 28, 2018); La Française LUX - Global High Yield (this Sub-Fund was launched on June 28, 2018); La Française LUX - JKC Asia Bond; La Française LUX - JKC Asia Bond 2023; La Française LUX - Multistrategies Obligataires; La Française LUX - Protectaux; La Française LUX - Sub Debt (this Sub-Fund was launched on June 5, 2018); La Française LUX - GTS Réactif; La Française LUX - Multi-Asset Income. As at October 1, 2018, the Board of Directors of the SICAV has decided to change the name of the following Sub-Funds: La Française LUX - Inflection Point European Equity into La Française LUX - Inflection Point Carbon Impact Euro; La Française LUX - Inflection Point Zero Carbon into La Française LUX - Inflection Point Carbon Impact Global; The following Sub-Fund was closed during the year ended December 31, 2018: La Française LUX - Rendement Global 2020 - USD (this Sub-Fund was liquidated on May 23, 2018) the amount of cash remaining in the NAV before distribution to the last remaining investors is EUR 287,904.18. Feeder Funds The Sub-Fund La Française LUX - Rendement Global 2020 - USD (this Sub-Fund was liquidated on May 23, 2018) was a Feeder Sub-Fund of the Master Fund LFP Rendement Global 2020. The Sub-Fund La Française Lux – Sub Debt (this Sub-Fund was launched on June 5, 2018) is a Feeder Sub-Fund of the Master Fund La Française Sub Debt. The Master Funds’ prospectuses, the annual and unaudited semi-annual reports are made available to the shareholders of the SICAV on the website of La Française AM www.la-francaise.com or at its registered office and at the registered office of its Management Company, La Française AM, 128, Boulevard Raspail, F-75006 Paris. The Sub-Fund invests at least 85% of net assets in class F shares of the Master Fund and up to 15% in cash and cash equivalents or derivatives for hedging porpose only. The objective, the investment policy and the risk profile of the respective Feeder Sub-Fund and Master Fund are similar. The performance of the Feeder Sub-Fund and the Master Fund are similar with the exception of the assets of the Feeder Sub-Fund which will not be invested in the Master Fund.
97
Notes to the Financial Statements as at December 31, 2018 (continued)
La Française LUX
Note 1 - General information (continued) Feeder Funds (continued) La Française LUX - Rendement Global 2020 - USD (this Sub-Fund was liquidated on May 23, 2018) The objective of the Sub-Fund is to outperform (net of fees) the US Treasury Note 2.625% 15/11/2020 [US912828PC88] maturing in 2020 over the recommended investment period of 7 years from the launch date of the Sub-Fund until December 31, 2020. The Master Fund invests in bonds and money market instruments of any credit quality issued and that are mainly issued in OECD member states. The Master Fund invests only in securities denominated in EUR, USD or GBP. The Master Fund’s exposure to non-OECD countries may be up to 30%. The Master Fund may invest in, or be exposed to, the following investments up to the percentage of net assets indicated: - convertible securities: 30% - bonds issued in emerging markets: 30% - equities: 10% - other UCITS/UCIs: 10% - deposits: 10% Non-EUR investments are hedged to EUR. The Master Fund may use derivatives or invest in securities with embedded derivatives for hedging or for gaining exposure to interest rates and credit risk. In addition to core derivatives (defined in “How the Sub-Funds Use Derivatives and Techniques”), the Master Fund may use credit default swaps (including those based on indices). The Master Fund may also use repurchase and reverse repurchase agreements for efficient portfolio management. The Master Fund’s modified duration may vary from 0 to 6 and decreases over time. The Investment Manager builds a diversified portfolio by selecting securities that offer a superior combination of yield and creditworthiness, and by taking tactical positions, including arbitrage, in the event of new market opportunities or an increased risk of default by one of the issuers in the portfolio. La Française LUX – Sub Debt (this Sub-Fund was launched on June 5, 2018) The objective of the Sub-Funds is to achieve income and long-term capital growth (total return). Specificially, the Sub-Fund seeks to achieve an annualised return of 7% (net of fees) over any 10-year period. The Master Fund La Française Sub Debt is a UCITS fund established under French laws and regulated by the AMF (Autorité des Marchés Financiers). The Master Fund invests in subordinated debt of any type and credit quality, and in money market instruments, that are denominated in EUR and issued by public or private issuers in the European Union (including UK), Norway and Switzerland. These securities may include contingent convertible bonds (coco bonds) and convertible bonds. The Master Fund may invest in, or be exposed to, the following investments up to the percentage of net assets indicated: - government or corporate bonds: 100% - equities: 10% - other UCITS/UCIs: 10% - deposits: 10%
The Master Fund may use derivatives or invest in securities with embedded derivatives for hedging, for efficient portfolio management or for gaining exposure to interest rates and equity risk. In addition to core derivatives (defined in “How the Sub-Funds Use Derivatives and Techniques”), the Master Fund may use total return swaps and credit default swaps (including those based on indices). The Master Fund may also use repurchase and reverse agreements for efficient portfolio management. The Sub-Fund’s modified duration may vary from 0 to 10.
98
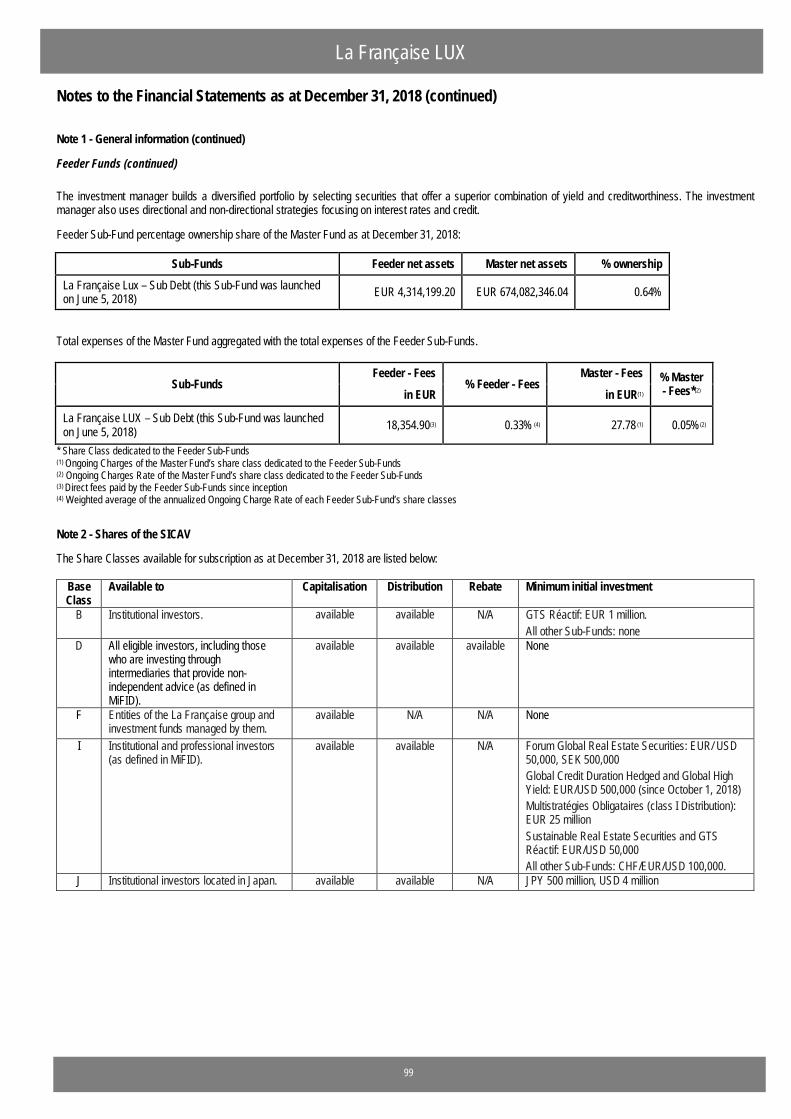
Notes to the Financial Statements as at December 31, 2018 (continued)
La Française LUX
Note 1 - General information (continued) Feeder Funds (continued) The investment manager builds a diversified portfolio by selecting securities that offer a superior combination of yield and creditworthiness. The investment manager also uses directional and non-directional strategies focusing on interest rates and credit. Feeder Sub-Fund percentage ownership share of the Master Fund as at December 31, 2018:
Sub-Funds Feeder net assets Master net assets % ownership La Française Lux – Sub Debt (this Sub-Fund was launched on June 5, 2018) EUR 4,314,199.20 EUR 674,082,346.04 0.64%
Total expenses of the Master Fund aggregated with the total expenses of the Feeder Sub-Funds.
Sub-Funds Feeder - Fees
% Feeder - Fees Master - Fees % Master
- Fees*(2) in EUR in EUR(1)
La Française LUX – Sub Debt (this Sub-Fund was launched on June 5, 2018) 18,354.90(3) 0.33% (4) 27.78 (1) 0.05%(2)
* Share Class dedicated to the Feeder Sub-Funds (1) Ongoing Charges of the Master Fund’s share class dedicated to the Feeder Sub-Funds (2) Ongoing Charges Rate of the Master Fund’s share class dedicated to the Feeder Sub-Funds (3) Direct fees paid by the Feeder Sub-Funds since inception (4) Weighted average of the annualized Ongoing Charge Rate of each Feeder Sub-Fund’s share classes Note 2 - Shares of the SICAV The Share Classes available for subscription as at December 31, 2018 are listed below:
Base Class
Available to Capitalisation Distribution Rebate Minimum initial investment
B Institutional investors. available available N/A GTS Réactif: EUR 1 million. All other Sub-Funds: none
D All eligible investors, including those who are investing through intermediaries that provide non-independent advice (as defined in MiFID).
available available available None
F Entities of the La Française group and investment funds managed by them.
available N/A N/A None
I Institutional and professional investors (as defined in MiFID).
available available N/A Forum Global Real Estate Securities: EUR/ USD 50,000, SEK 500,000 Global Credit Duration Hedged and Global High Yield: EUR/USD 500,000 (since October 1, 2018) Multistratégies Obligataires (class I Distribution): EUR 25 million Sustainable Real Estate Securities and GTS Réactif: EUR/USD 50,000 All other Sub-Funds: CHF/EUR/USD 100,000.
J Institutional investors located in Japan. available available N/A JPY 500 million, USD 4 million
99
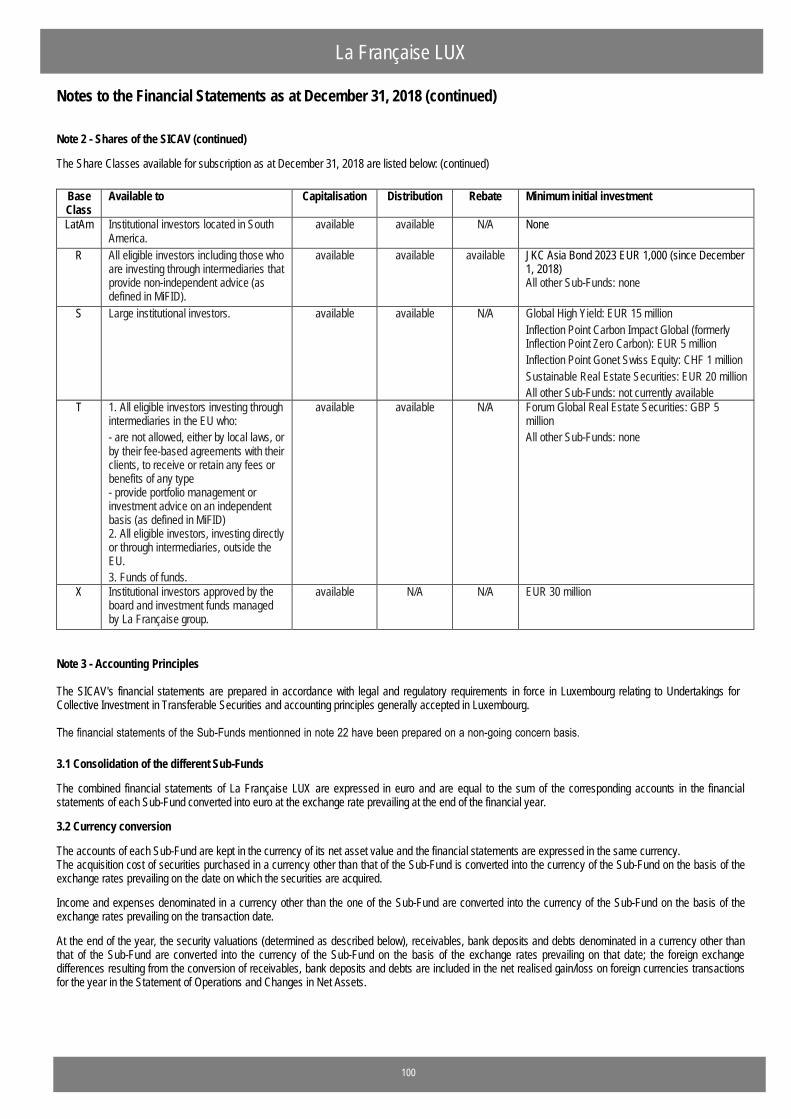
Notes to the Financial Statements as at December 31, 2018 (continued)
La Française LUX
Note 2 - Shares of the SICAV (continued)
The Share Classes available for subscription as at December 31, 2018 are listed below: (continued)
Base Class
Available to Capitalisation Distribution Rebate Minimum initial investment
LatAm Institutional investors located in South America.
available available N/A None
R All eligible investors including those who are investing through intermediaries that provide non-independent advice (as defined in MiFID).
available available available JKC Asia Bond 2023 EUR 1,000 (since December 1, 2018) All other Sub-Funds: none
S Large institutional investors. available available N/A Global High Yield: EUR 15 million Inflection Point Carbon Impact Global (formerly Inflection Point Zero Carbon): EUR 5 million Inflection Point Gonet Swiss Equity: CHF 1 million Sustainable Real Estate Securities: EUR 20 million All other Sub-Funds: not currently available
T 1. All eligible investors investing throughintermediaries in the EU who: - are not allowed, either by local laws, or by their fee-based agreements with their clients, to receive or retain any fees or benefits of any type - provide portfolio management or investment advice on an independent basis (as defined in MiFID) 2. All eligible investors, investing directlyor through intermediaries, outside the EU. 3. Funds of funds.
available available N/A Forum Global Real Estate Securities: GBP 5 million All other Sub-Funds: none
X Institutional investors approved by the board and investment funds managed by La Française group.
available N/A N/A EUR 30 million
Note 3 - Accounting Principles
The SICAV's financial statements are prepared in accordance with legal and regulatory requirements in force in Luxembourg relating to Undertakings for Collective Investment in Transferable Securities and accounting principles generally accepted in Luxembourg.
The financial statements of the Sub-Funds mentionned in note 22 have been prepared on a non-going concern basis.
3.1 Consolidation of the different Sub-Funds
The combined financial statements of La Française LUX are expressed in euro and are equal to the sum of the corresponding accounts in the financial statements of each Sub-Fund converted into euro at the exchange rate prevailing at the end of the financial year.
3.2 Currency conversion
The accounts of each Sub-Fund are kept in the currency of its net asset value and the financial statements are expressed in the same currency.The acquisition cost of securities purchased in a currency other than that of the Sub-Fund is converted into the currency of the Sub-Fund on the basis of the exchange rates prevailing on the date on which the securities are acquired.
Income and expenses denominated in a currency other than the one of the Sub-Fund are converted into the currency of the Sub-Fund on the basis of the exchange rates prevailing on the transaction date.
At the end of the year, the security valuations (determined as described below), receivables, bank deposits and debts denominated in a currency other than that of the Sub-Fund are converted into the currency of the Sub-Fund on the basis of the exchange rates prevailing on that date; the foreign exchange differences resulting from the conversion of receivables, bank deposits and debts are included in the net realised gain/loss on foreign currencies transactions for the year in the Statement of Operations and Changes in Net Assets.
100
Notes to the Financial Statements as at December 31, 2018 (continued)
La Française LUX
Note 3 - Accounting Principles (continued) 3.3 Valuation of investments The assets and liabilities of the SICAV’s Sub-Funds are valued on the basis of the following principles: a) The value of cash in hand or on deposit, notes and bills payable on demand and all accounts receivable, prepaid costs, dividends and interest due but not yet received shall correspond to the full par value, unless it proves to be unlikely that the full value shall be received; in which case the value shall be calculated by subtracting a certain amount which appears to be appropriate in order to reflect the true value of such assets with prudence and in good faith by the Board of Directors of the SICAV; b) The valuation of transferable securities and money market instruments listed or traded on an official stock market or other regulated market which operates regularly and is recognised and open to the public, shall be based on the last known price and if that transferable security / money market instrument is traded on several markets, on the basis of the last known price on the principal market for that security or instrument. If the last known price is not representative, the valuation shall be based on the probable realisation value estimated with prudence and in good faith by the Board of Directors of the SICAV; c) Securities and money market instruments not listed or traded on an official stock exchange or on another regulated market which operates regularly and is recognized and open to the public shall be valued on the basis of their probable sale price as estimated prudently and in accordance with the principle of prudence and good faith by the Board of Directors of the SICAV; d) The Board of Directors of the SICAV may authorise the use of amortised cost method of valuation for short-term transferable debt securities in the Sub-Fund. This method involves valuing a security at its cost and thereafter assuming a constant amortisation to maturity of any discount or premium regardless of the impact of fluctuating interest rates on the market value of the security or other instrument. While this method provides certainty in valuation, it may result in periods during which value as determined by amortised cost, is higher or lower than the price the Sub-Funds would receive if it has sold the securities. This method of valuation will only be used in accordance with ESMA guidelines concerning eligible assets for investments by UCITS and only with respect to securities with a maturity at issuance or residual term to maturity of 397 days or less or securities that undergo regular yield adjustments at least every 397 days; e) All other securities and assets shall be valued at their market value determined in good faith, in accordance with the procedures established by the Board of Directors of the SICAV; f) Prices of securities denominated in currencies other than the currency of account of the Sub-Funds shall be converted at the last available exchange rate at each NAV calculation; g) The settlement value of futures contracts and option contracts which are not traded on regulated markets shall be equivalent to their net settlement value determined in accordance with the policies established by the Board of Directors of the SICAV, on a basis applied consistently to each type of contract. The settlement value of futures contracts or option contracts traded on regulated markets shall be based on the last price available for settlement of those contracts on the regulated markets on which those futures contracts or those option contracts are traded by the SICAV; insofar as if a future contract or an option contract cannot be settled on the day on which the net assets are valued, the basis which shall serve to determine the settlement value of that contract shall be determined by the Board of Directors of the SICAV in a fair and reasonable manner. h) Open forward foreign exchange contracts are valued with reference to the forward exchange rate corresponding to the remaining life of the contract. Net realised gain and loss and net change in unrealised appreciation and depreciation are included in the Statement of Operations and Changes in Net Assets. i) Interest rate swaps are valued at their market value established by reference to the applicable rate curve. Swaps on indices or financial instruments are valued at their market value established by reference to the index of the financial instrument concerned. The valuation of swap contracts relating to those indices or financial instruments are based on the market value of those swaps contracts in accordance with the procedures established by the Board of Directors of the SICAV at each NAV calculation. Net realised gains and losses and net changes in unrealized appreciation and depreciation are included in the Statement of Operations and Changes in Net Assets. j) Contracts for Difference ("CFD") are over-the-counter financial instruments which allow an investor to take advantage of the share price movements without having to hold such shares or to manage the holding constraints (custody, financing, loan for shorts). Indeed, a "CFD" is a contract entered into between two parties to exchange, at the end of this contract, the difference between the opening and the closing prices of the contract, multiplied by the number of units of the underlying asset as specified in the contract. The settlement of these differences is completed through a cash payment, not through a physical delivery of the underlying assets. Contracts for Difference are valued at their market value according to the closing price of the underlying securities on the valuation day. The market value of the corresponding line indicates the difference between the market value and the strike price of the underlying securities. Net realised gain and loss and net change in unrealised appreciation and depreciation are included in the Statement of Operations and Changes in Net Assets.
101
Notes to the Financial Statements as at December 31, 2018 (continued)
La Française LUX
Note 3 - Accounting Principles (continued) 3.3 Valuation of investments (continued) k) Total return swap is a bilateral agreement in which each party agrees to exchange payments based on the performance of an underlying instrument represented by a security, commodity, basket or index thereof for a fixed or variable rate. One party pays out the total return of a specific reference asset, and in return, receives a regular stream of payments. The total performance will include gains and losses on the underlying, as well as any interest or dividends during the contract period according to the type of underlying. The cash flows to be exchanged are calculated by reference to an agreed upon notional amount or quantity. Total return swaps are marked to market at each NAV calculation date. The unrealised appreciation/(depreciation) is disclosed in the Statement of Net Assets under "Net unrealised appreciation/(depreciation) on Swaps contracts".Net realised gain and loss and net change in unrealised appreciation and depreciation as a result thereof are included in the Statement of Operations and Changes in Net Assets respectively under "Net realised gain/(loss) on Swaps contracts" and "Net change in unrealised appreciation/(depreciation) on Swaps contracts. Net realised gain and loss on the sales of investments in securities are usually determined on the average cost basis. l) Credit Default Swaps are valued at their market value established by reference to the applicable rate curve. Swaps on indices or financial instruments are valued at their market value established by reference to the index of the financial instrument concerned. The valuation of swap contracts relating to those indices or financial instruments shall be based on the market value of those swaps contracts in accordance with the procedures established by the Board of Directors of the SICAV. Net realised gain and loss and net change in unrealised appreciation and depreciation are included in the Statement of Operations and Changes in Net Assets. 3.4 Income Dividends are recognised as income on the date when shares are quoted ex-dividend for the first time. Dividends and interest received by the SICAV on its investments are in many cases subject to irrecoverable withholding taxes at source. Interest income is accrued net of withholding tax at the time of each Net Asset Value calculation. 3.5 Formation expenses The formation expenses are being amortised over a period of 5 years. If the launch of a Sub-Fund occurs after the launch date of the SICAV, the formation expenses in connection with the launch of the new Sub-Fund will be charged to this single Sub-Fund and may be amortized over a maximum of five years from the date of launch of the Sub-Fund. Note 4 - Exchange rates at December 31, 2018 The exchange rates used in the conversion on the SICAV’s assets or liabilities denominated in currencies other than Euro (EUR) are:
1 EUR = 1.623800 AUD 1 EUR = 0.897550 GBP 1 EUR = 22.512900 MXN 1 EUR = 4.655050 RON 1 EUR = 4.430600 BRL 1 EUR = 8.950150 HKD 1 EUR = 9.898750 NOK 1 EUR = 10.135000 SEK 1 EUR = 1.561300 CAD 1 EUR = 320.800000 HUF 1 EUR = 1.704800 NZD 1 EUR = 1.558150 SGD 1 EUR = 1.126900 CHF 1 EUR = 16,438.497750 IDR 1 EUR = 3.862150 PEN 1 EUR = 6.081450 TRY 1 EUR = 793.346200 CLP 1 EUR = 79.809050 INR 1 EUR = 60.112500 PHP 1 EUR = 35.137000 TWD 1 EUR = 7.848550 CNY 1 EUR = 125.420700 JPY 1 EUR = 4.294550 PLN 1 EUR = 1.143150 USD 1 EUR = 7.462450 DKK 1 EUR = 1,275.526800 KRW 1 EUR = 79.303150 RUB 1 EUR = 16.444200 ZAR
Note 5 - Taxes Luxembourg The SICAV is not subject to any taxes in Luxembourg on income or capital gains. The only tax to which the SICAV in Luxembourg is subject is the “taxe d’abonnement” of 0.05% p.a. based on the net assets of the Sub-Fund at the end of the relevant quarter, calculated and paid quarterly. In respect of any share class which comprises only Institutional Investors, the tax levied is at the rate of 0.01% p.a.. In accordance with article 175 a) of the Law, the portion of the net assets invested in UCIs already subject to the “taxe d’abonnement” is exempt from this tax. Belgium The SICAV is registered with the Belgium Financial Services and Markets Authority in accordance with the Article 154 of the Law of August 3, 2012 relating to financials markets. Funds registered for public distribution in Belgium are subject to an annual tax of 0.0925% on the Net Asset Value of shares distributed in Belgium via Belgian intermediaries as at December 31 of the previous year.
102
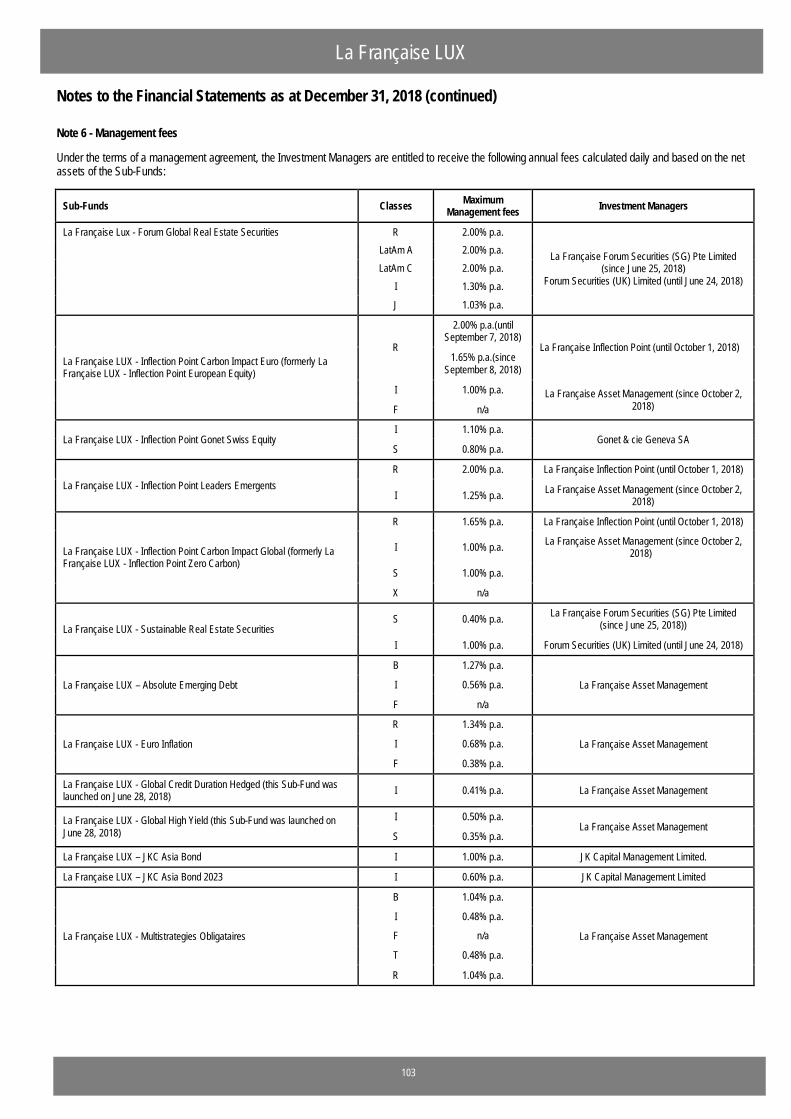
Notes to the Financial Statements as at December 31, 2018 (continued)
La Française LUX
Note 6 - Management fees Under the terms of a management agreement, the Investment Managers are entitled to receive the following annual fees calculated daily and based on the net assets of the Sub-Funds:
Sub-Funds Classes Maximum Management fees Investment Managers
La Française Lux - Forum Global Real Estate Securities R 2.00% p.a.
La Française Forum Securities (SG) Pte Limited (since June 25, 2018)
Forum Securities (UK) Limited (until June 24, 2018)
LatAm A 2.00% p.a. LatAm C 2.00% p.a. I 1.30% p.a.
J 1.03% p.a.
La Française LUX - Inflection Point Carbon Impact Euro (formerly La Française LUX - Inflection Point European Equity)
R
2.00% p.a.(until September 7, 2018)
La Française Inflection Point (until October 1, 2018) 1.65% p.a.(since
September 8, 2018)
I 1.00% p.a. La Française Asset Management (since October 2, 2018) F n/a
La Française LUX - Inflection Point Gonet Swiss Equity I 1.10% p.a.
Gonet & cie Geneva SA S 0.80% p.a.
La Française LUX - Inflection Point Leaders Emergents R 2.00% p.a. La Française Inflection Point (until October 1, 2018)
I 1.25% p.a. La Française Asset Management (since October 2, 2018)
La Française LUX - Inflection Point Carbon Impact Global (formerly La Française LUX - Inflection Point Zero Carbon)
R 1.65% p.a. La Française Inflection Point (until October 1, 2018)
I 1.00% p.a. La Française Asset Management (since October 2, 2018)
S 1.00% p.a. X n/a
La Française LUX - Sustainable Real Estate Securities S 0.40% p.a. La Française Forum Securities (SG) Pte Limited
(since June 25, 2018))
I 1.00% p.a. Forum Securities (UK) Limited (until June 24, 2018)
La Française LUX – Absolute Emerging Debt
B 1.27% p.a.
La Française Asset Management I 0.56% p.a.
F n/a
La Française LUX - Euro Inflation
R 1.34% p.a.
La Française Asset Management I 0.68% p.a.
F 0.38% p.a.
La Française LUX - Global Credit Duration Hedged (this Sub-Fund was launched on June 28, 2018) I 0.41% p.a. La Française Asset Management
La Française LUX - Global High Yield (this Sub-Fund was launched on June 28, 2018)
I 0.50% p.a. La Française Asset Management
S 0.35% p.a.
La Française LUX – JKC Asia Bond I 1.00% p.a. JK Capital Management Limited.
La Française LUX – JKC Asia Bond 2023 I 0.60% p.a. JK Capital Management Limited
La Française LUX - Multistrategies Obligataires
B 1.04% p.a.
La Française Asset Management
I 0.48% p.a.
F n/a
T 0.48% p.a.
R 1.04% p.a.
103
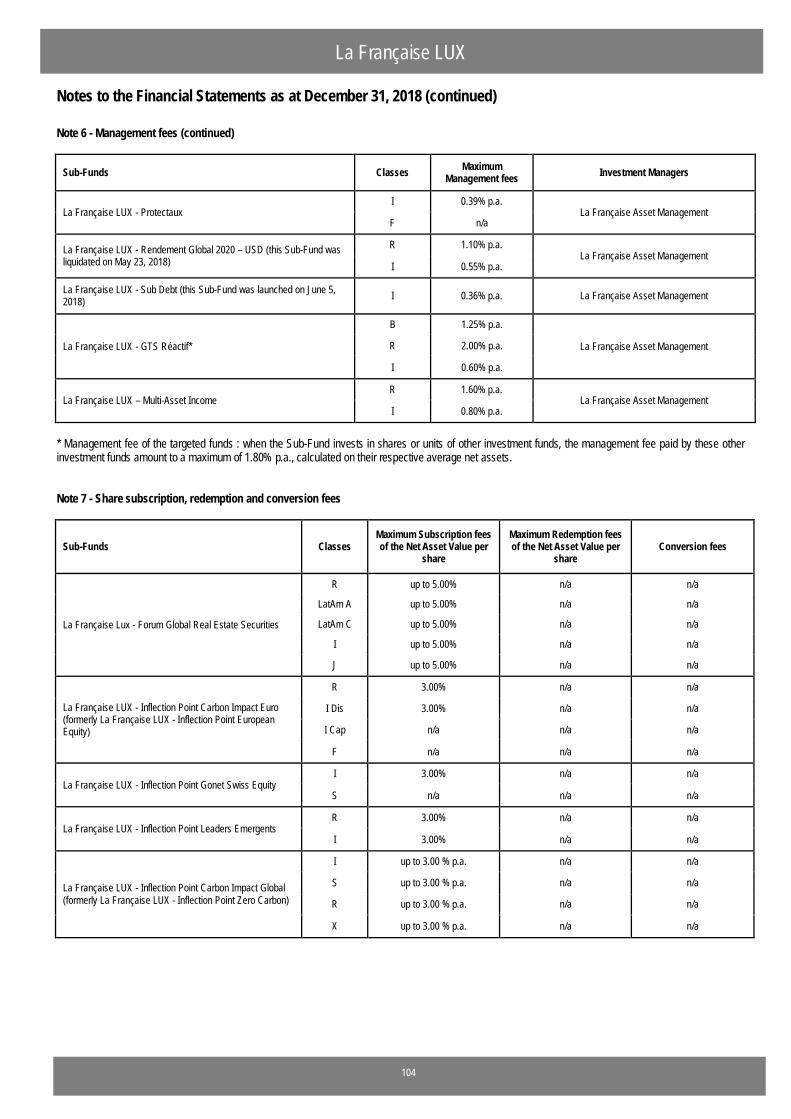
Notes to the Financial Statements as at December 31, 2018 (continued)
La Française LUX
Note 6 - Management fees (continued)
Sub-Funds Classes Maximum Management fees Investment Managers
La Française LUX - Protectaux I 0.39% p.a.
La Française Asset Management F n/a
La Française LUX - Rendement Global 2020 – USD (this Sub-Fund was liquidated on May 23, 2018)
R 1.10% p.a. La Française Asset Management
I 0.55% p.a.
La Française LUX - Sub Debt (this Sub-Fund was launched on June 5, 2018) I 0.36% p.a. La Française Asset Management
La Française LUX - GTS Réactif*
B 1.25% p.a.
La Française Asset Management R 2.00% p.a.
I 0.60% p.a.
La Française LUX – Multi-Asset Income R 1.60% p.a.
La Française Asset Management I 0.80% p.a.
* Management fee of the targeted funds : when the Sub-Fund invests in shares or units of other investment funds, the management fee paid by these other investment funds amount to a maximum of 1.80% p.a., calculated on their respective average net assets. Note 7 - Share subscription, redemption and conversion fees
Sub-Funds Classes Maximum Subscription fees of the Net Asset Value per
share
Maximum Redemption fees of the Net Asset Value per
share Conversion fees
La Française Lux - Forum Global Real Estate Securities
R up to 5.00% n/a n/a
LatAm A up to 5.00% n/a n/a
LatAm C up to 5.00% n/a n/a
I up to 5.00% n/a n/a
J up to 5.00% n/a n/a
La Française LUX - Inflection Point Carbon Impact Euro (formerly La Française LUX - Inflection Point European Equity)
R 3.00% n/a n/a
I Dis 3.00% n/a n/a
I Cap n/a n/a n/a
F n/a n/a n/a
La Française LUX - Inflection Point Gonet Swiss Equity I 3.00% n/a n/a
S n/a n/a n/a
La Française LUX - Inflection Point Leaders Emergents R 3.00% n/a n/a
I 3.00% n/a n/a
La Française LUX - Inflection Point Carbon Impact Global (formerly La Française LUX - Inflection Point Zero Carbon)
I up to 3.00 % p.a. n/a n/a
S up to 3.00 % p.a. n/a n/a
R up to 3.00 % p.a. n/a n/a
X up to 3.00 % p.a. n/a n/a
104
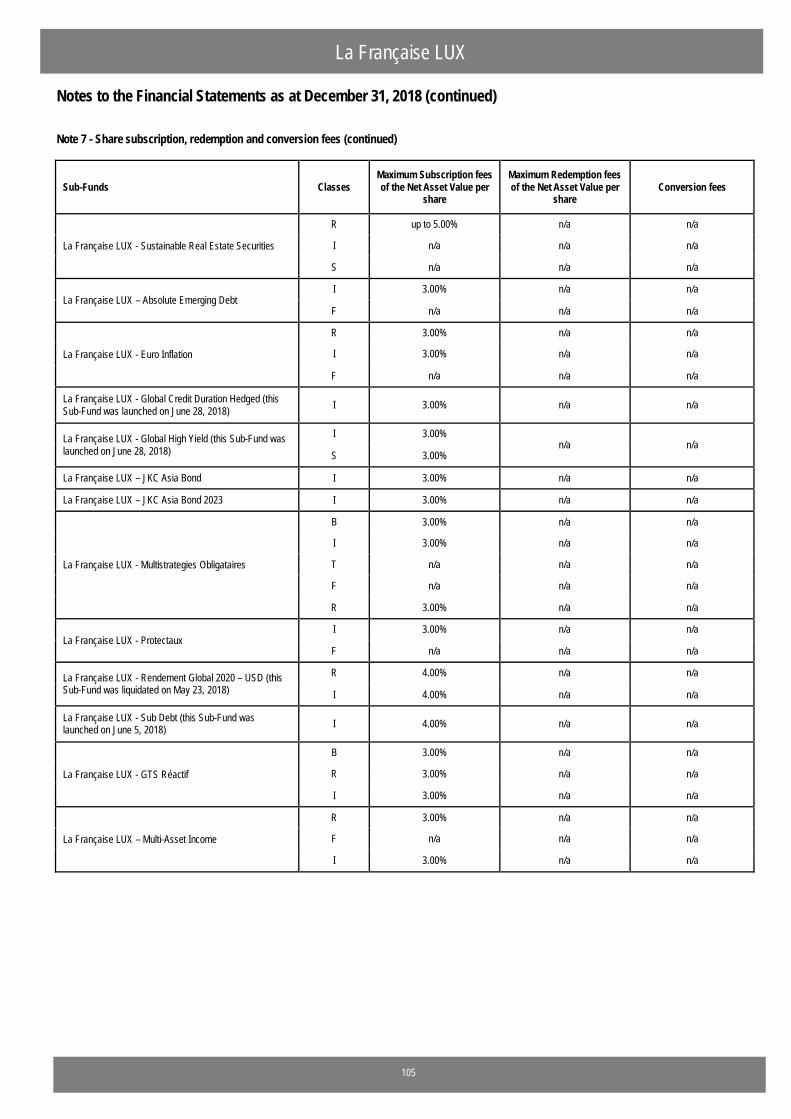
Notes to the Financial Statements as at December 31, 2018 (continued)
La Française LUX
Note 7 - Share subscription, redemption and conversion fees (continued)
Sub-Funds Classes Maximum Subscription fees of the Net Asset Value per
share
Maximum Redemption fees of the Net Asset Value per
share Conversion fees
La Française LUX - Sustainable Real Estate Securities
R up to 5.00% n/a n/a
I n/a n/a n/a
S n/a n/a n/a
La Française LUX – Absolute Emerging Debt I 3.00% n/a n/a
F n/a n/a n/a
La Française LUX - Euro Inflation
R 3.00% n/a n/a
I 3.00% n/a n/a
F n/a n/a n/a
La Française LUX - Global Credit Duration Hedged (this Sub-Fund was launched on June 28, 2018) I 3.00% n/a n/a
La Française LUX - Global High Yield (this Sub-Fund was launched on June 28, 2018)
I 3.00% n/a n/a
S 3.00%
La Française LUX – JKC Asia Bond I 3.00% n/a n/a
La Française LUX – JKC Asia Bond 2023 I 3.00% n/a n/a
La Française LUX - Multistrategies Obligataires
B 3.00% n/a n/a
I 3.00% n/a n/a
T n/a n/a n/a
F n/a n/a n/a
R 3.00% n/a n/a
La Française LUX - Protectaux I 3.00% n/a n/a
F n/a n/a n/a
La Française LUX - Rendement Global 2020 – USD (this Sub-Fund was liquidated on May 23, 2018)
R 4.00% n/a n/a
I 4.00% n/a n/a
La Française LUX - Sub Debt (this Sub-Fund was launched on June 5, 2018) I 4.00% n/a n/a
La Française LUX - GTS Réactif
B 3.00% n/a n/a
R 3.00% n/a n/a
I 3.00% n/a n/a
La Française LUX – Multi-Asset Income
R 3.00% n/a n/a
F n/a n/a n/a
I 3.00% n/a n/a
105
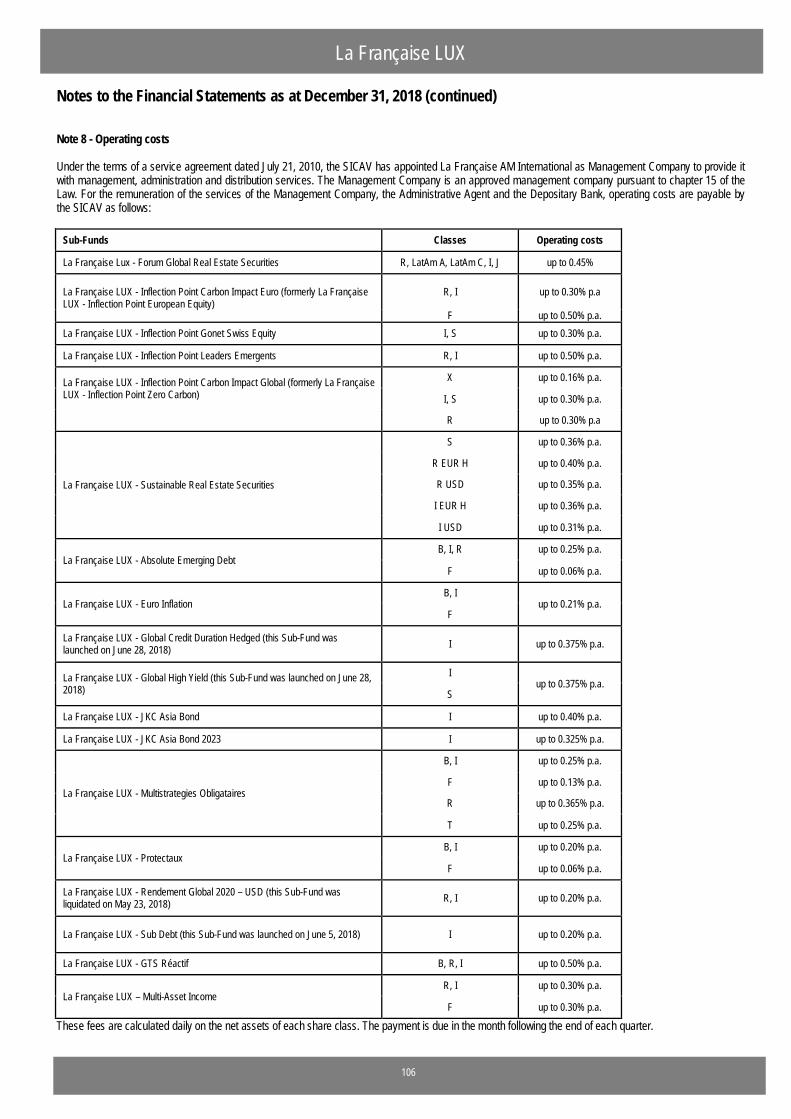
Notes to the Financial Statements as at December 31, 2018 (continued)
La Française LUX
Note 8 - Operating costs Under the terms of a service agreement dated July 21, 2010, the SICAV has appointed La Française AM International as Management Company to provide it with management, administration and distribution services. The Management Company is an approved management company pursuant to chapter 15 of the Law. For the remuneration of the services of the Management Company, the Administrative Agent and the Depositary Bank, operating costs are payable by the SICAV as follows:
Sub-Funds Classes Operating costs
La Française Lux - Forum Global Real Estate Securities R, LatAm A, LatAm C, I, J up to 0.45%
La Française LUX - Inflection Point Carbon Impact Euro (formerly La Française LUX - Inflection Point European Equity)
R, I up to 0.30% p.a
F up to 0.50% p.a. La Française LUX - Inflection Point Gonet Swiss Equity I, S up to 0.30% p.a.
La Française LUX - Inflection Point Leaders Emergents R, I up to 0.50% p.a.
La Française LUX - Inflection Point Carbon Impact Global (formerly La Française LUX - Inflection Point Zero Carbon)
X up to 0.16% p.a.
I, S up to 0.30% p.a.
R up to 0.30% p.a
La Française LUX - Sustainable Real Estate Securities
S up to 0.36% p.a.
R EUR H up to 0.40% p.a.
R USD up to 0.35% p.a.
I EUR H up to 0.36% p.a.
I USD up to 0.31% p.a.
La Française LUX - Absolute Emerging Debt B, I, R up to 0.25% p.a.
F up to 0.06% p.a.
La Française LUX - Euro Inflation B, I
up to 0.21% p.a. F
La Française LUX - Global Credit Duration Hedged (this Sub-Fund was launched on June 28, 2018) I up to 0.375% p.a.
La Française LUX - Global High Yield (this Sub-Fund was launched on June 28, 2018)
I up to 0.375% p.a.
S
La Française LUX - JKC Asia Bond I up to 0.40% p.a.
La Française LUX - JKC Asia Bond 2023 I up to 0.325% p.a.
La Française LUX - Multistrategies Obligataires
B, I up to 0.25% p.a.
F up to 0.13% p.a.
R up to 0.365% p.a.
T up to 0.25% p.a.
La Française LUX - Protectaux B, I up to 0.20% p.a.
F up to 0.06% p.a.
La Française LUX - Rendement Global 2020 – USD (this Sub-Fund was liquidated on May 23, 2018) R, I up to 0.20% p.a.
La Française LUX - Sub Debt (this Sub-Fund was launched on June 5, 2018) I up to 0.20% p.a.
La Française LUX - GTS Réactif B, R, I up to 0.50% p.a.
La Française LUX – Multi-Asset Income R, I up to 0.30% p.a.
F up to 0.30% p.a.
These fees are calculated daily on the net assets of each share class. The payment is due in the month following the end of each quarter.
106
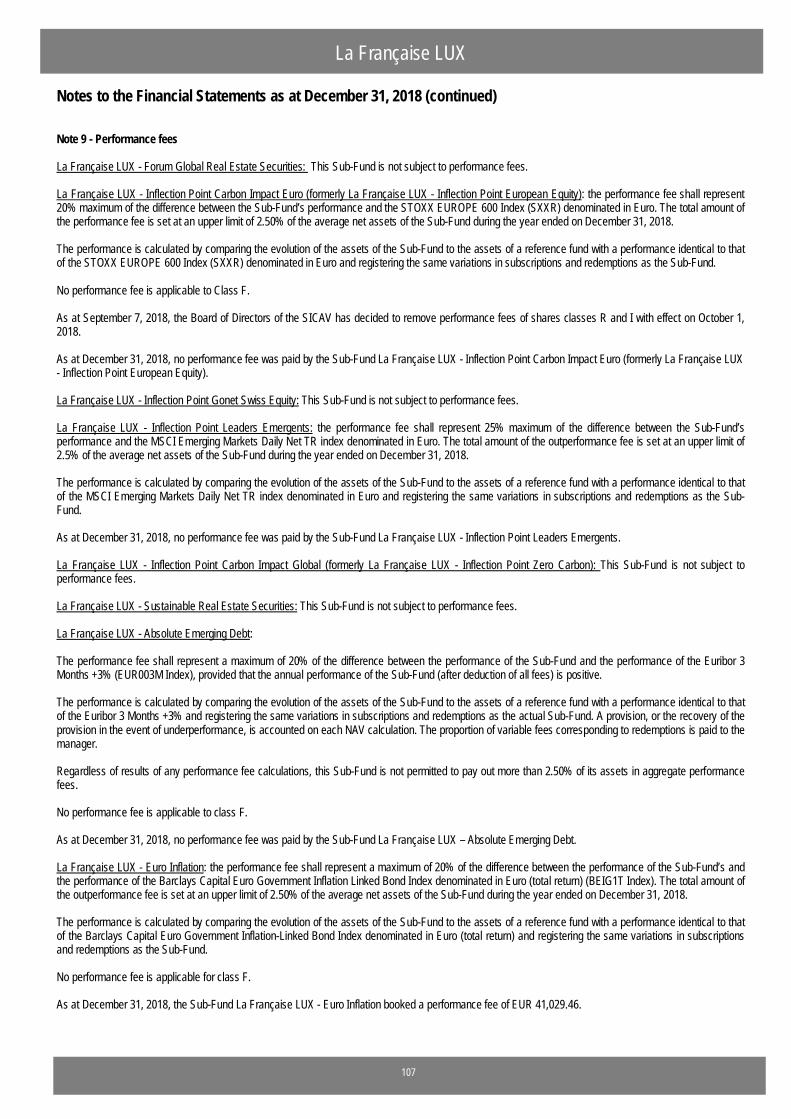
Notes to the Financial Statements as at December 31, 2018 (continued)
La Française LUX
Note 9 - Performance fees La Française LUX - Forum Global Real Estate Securities: This Sub-Fund is not subject to performance fees. La Française LUX - Inflection Point Carbon Impact Euro (formerly La Française LUX - Inflection Point European Equity): the performance fee shall represent 20% maximum of the difference between the Sub-Fund’s performance and the STOXX EUROPE 600 Index (SXXR) denominated in Euro. The total amount of the performance fee is set at an upper limit of 2.50% of the average net assets of the Sub-Fund during the year ended on December 31, 2018. The performance is calculated by comparing the evolution of the assets of the Sub-Fund to the assets of a reference fund with a performance identical to that of the STOXX EUROPE 600 Index (SXXR) denominated in Euro and registering the same variations in subscriptions and redemptions as the Sub-Fund. No performance fee is applicable to Class F. As at September 7, 2018, the Board of Directors of the SICAV has decided to remove performance fees of shares classes R and I with effect on October 1, 2018. As at December 31, 2018, no performance fee was paid by the Sub-Fund La Française LUX - Inflection Point Carbon Impact Euro (formerly La Française LUX - Inflection Point European Equity). La Française LUX - Inflection Point Gonet Swiss Equity: This Sub-Fund is not subject to performance fees. La Française LUX - Inflection Point Leaders Emergents: the performance fee shall represent 25% maximum of the difference between the Sub-Fund’s performance and the MSCI Emerging Markets Daily Net TR index denominated in Euro. The total amount of the outperformance fee is set at an upper limit of 2.5% of the average net assets of the Sub-Fund during the year ended on December 31, 2018. The performance is calculated by comparing the evolution of the assets of the Sub-Fund to the assets of a reference fund with a performance identical to that of the MSCI Emerging Markets Daily Net TR index denominated in Euro and registering the same variations in subscriptions and redemptions as the Sub-Fund. As at December 31, 2018, no performance fee was paid by the Sub-Fund La Française LUX - Inflection Point Leaders Emergents. La Française LUX - Inflection Point Carbon Impact Global (formerly La Française LUX - Inflection Point Zero Carbon): This Sub-Fund is not subject to performance fees. La Française LUX - Sustainable Real Estate Securities: This Sub-Fund is not subject to performance fees. La Française LUX - Absolute Emerging Debt: The performance fee shall represent a maximum of 20% of the difference between the performance of the Sub-Fund and the performance of the Euribor 3 Months +3% (EUR003M Index), provided that the annual performance of the Sub-Fund (after deduction of all fees) is positive. The performance is calculated by comparing the evolution of the assets of the Sub-Fund to the assets of a reference fund with a performance identical to that of the Euribor 3 Months +3% and registering the same variations in subscriptions and redemptions as the actual Sub-Fund. A provision, or the recovery of the provision in the event of underperformance, is accounted on each NAV calculation. The proportion of variable fees corresponding to redemptions is paid to the manager. Regardless of results of any performance fee calculations, this Sub-Fund is not permitted to pay out more than 2.50% of its assets in aggregate performance fees. No performance fee is applicable to class F. As at December 31, 2018, no performance fee was paid by the Sub-Fund La Française LUX – Absolute Emerging Debt. La Française LUX - Euro Inflation: the performance fee shall represent a maximum of 20% of the difference between the performance of the Sub-Fund’s and the performance of the Barclays Capital Euro Government Inflation Linked Bond Index denominated in Euro (total return) (BEIG1T Index). The total amount of the outperformance fee is set at an upper limit of 2.50% of the average net assets of the Sub-Fund during the year ended on December 31, 2018. The performance is calculated by comparing the evolution of the assets of the Sub-Fund to the assets of a reference fund with a performance identical to that of the Barclays Capital Euro Government Inflation-Linked Bond Index denominated in Euro (total return) and registering the same variations in subscriptions and redemptions as the Sub-Fund. No performance fee is applicable for class F. As at December 31, 2018, the Sub-Fund La Française LUX - Euro Inflation booked a performance fee of EUR 41,029.46.
107
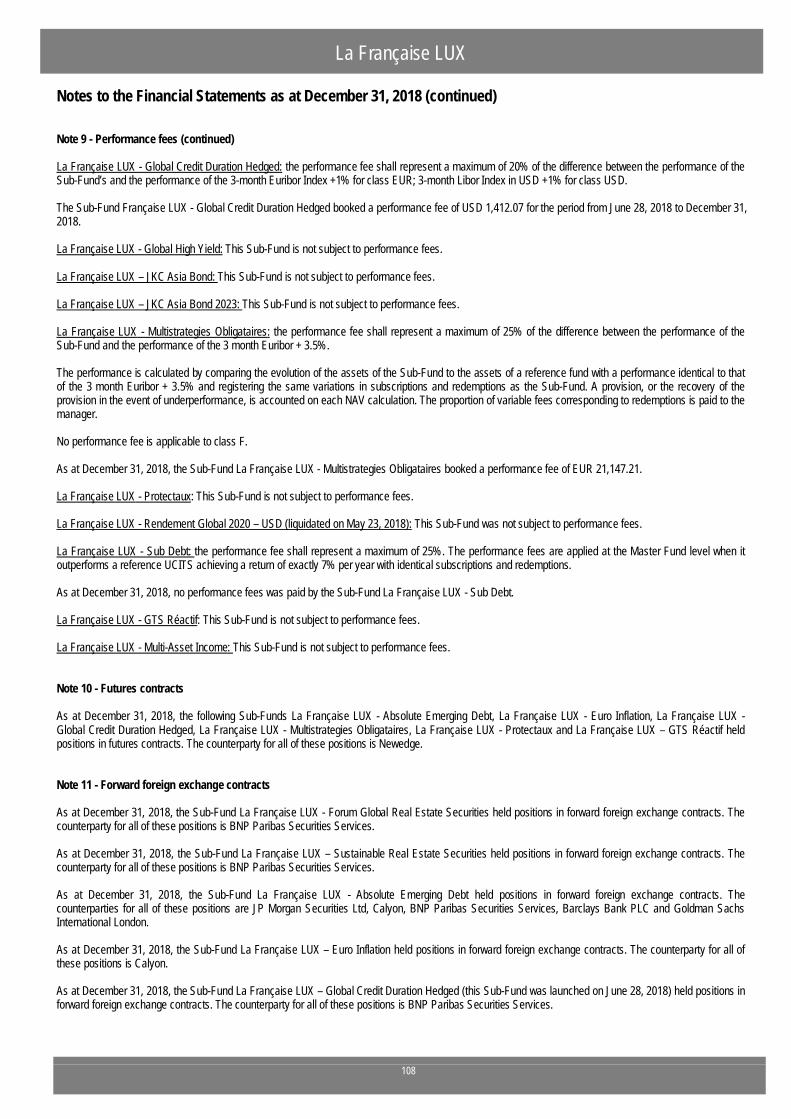
Notes to the Financial Statements as at December 31, 2018 (continued)
La Française LUX
Note 9 - Performance fees (continued) La Française LUX - Global Credit Duration Hedged: the performance fee shall represent a maximum of 20% of the difference between the performance of the Sub-Fund’s and the performance of the 3-month Euribor Index +1% for class EUR; 3-month Libor Index in USD +1% for class USD. The Sub-Fund Française LUX - Global Credit Duration Hedged booked a performance fee of USD 1,412.07 for the period from June 28, 2018 to December 31, 2018. La Française LUX - Global High Yield: This Sub-Fund is not subject to performance fees. La Française LUX – JKC Asia Bond: This Sub-Fund is not subject to performance fees. La Française LUX – JKC Asia Bond 2023: This Sub-Fund is not subject to performance fees. La Française LUX - Multistrategies Obligataires: the performance fee shall represent a maximum of 25% of the difference between the performance of the Sub-Fund and the performance of the 3 month Euribor + 3.5%. The performance is calculated by comparing the evolution of the assets of the Sub-Fund to the assets of a reference fund with a performance identical to that of the 3 month Euribor + 3.5% and registering the same variations in subscriptions and redemptions as the Sub-Fund. A provision, or the recovery of the provision in the event of underperformance, is accounted on each NAV calculation. The proportion of variable fees corresponding to redemptions is paid to the manager. No performance fee is applicable to class F. As at December 31, 2018, the Sub-Fund La Française LUX - Multistrategies Obligataires booked a performance fee of EUR 21,147.21. La Française LUX - Protectaux: This Sub-Fund is not subject to performance fees. La Française LUX - Rendement Global 2020 – USD (liquidated on May 23, 2018): This Sub-Fund was not subject to performance fees. La Française LUX - Sub Debt: the performance fee shall represent a maximum of 25%. The performance fees are applied at the Master Fund level when it outperforms a reference UCITS achieving a return of exactly 7% per year with identical subscriptions and redemptions. As at December 31, 2018, no performance fees was paid by the Sub-Fund La Française LUX - Sub Debt. La Française LUX - GTS Réactif: This Sub-Fund is not subject to performance fees. La Française LUX - Multi-Asset Income: This Sub-Fund is not subject to performance fees. Note 10 - Futures contracts As at December 31, 2018, the following Sub-Funds La Française LUX - Absolute Emerging Debt, La Française LUX - Euro Inflation, La Française LUX - Global Credit Duration Hedged, La Française LUX - Multistrategies Obligataires, La Française LUX - Protectaux and La Française LUX – GTS Réactif held positions in futures contracts. The counterparty for all of these positions is Newedge. Note 11 - Forward foreign exchange contracts As at December 31, 2018, the Sub-Fund La Française LUX - Forum Global Real Estate Securities held positions in forward foreign exchange contracts. The counterparty for all of these positions is BNP Paribas Securities Services. As at December 31, 2018, the Sub-Fund La Française LUX – Sustainable Real Estate Securities held positions in forward foreign exchange contracts. The counterparty for all of these positions is BNP Paribas Securities Services. As at December 31, 2018, the Sub-Fund La Française LUX - Absolute Emerging Debt held positions in forward foreign exchange contracts. The counterparties for all of these positions are JP Morgan Securities Ltd, Calyon, BNP Paribas Securities Services, Barclays Bank PLC and Goldman Sachs International London. As at December 31, 2018, the Sub-Fund La Française LUX – Euro Inflation held positions in forward foreign exchange contracts. The counterparty for all of these positions is Calyon. As at December 31, 2018, the Sub-Fund La Française LUX – Global Credit Duration Hedged (this Sub-Fund was launched on June 28, 2018) held positions in forward foreign exchange contracts. The counterparty for all of these positions is BNP Paribas Securities Services.
108
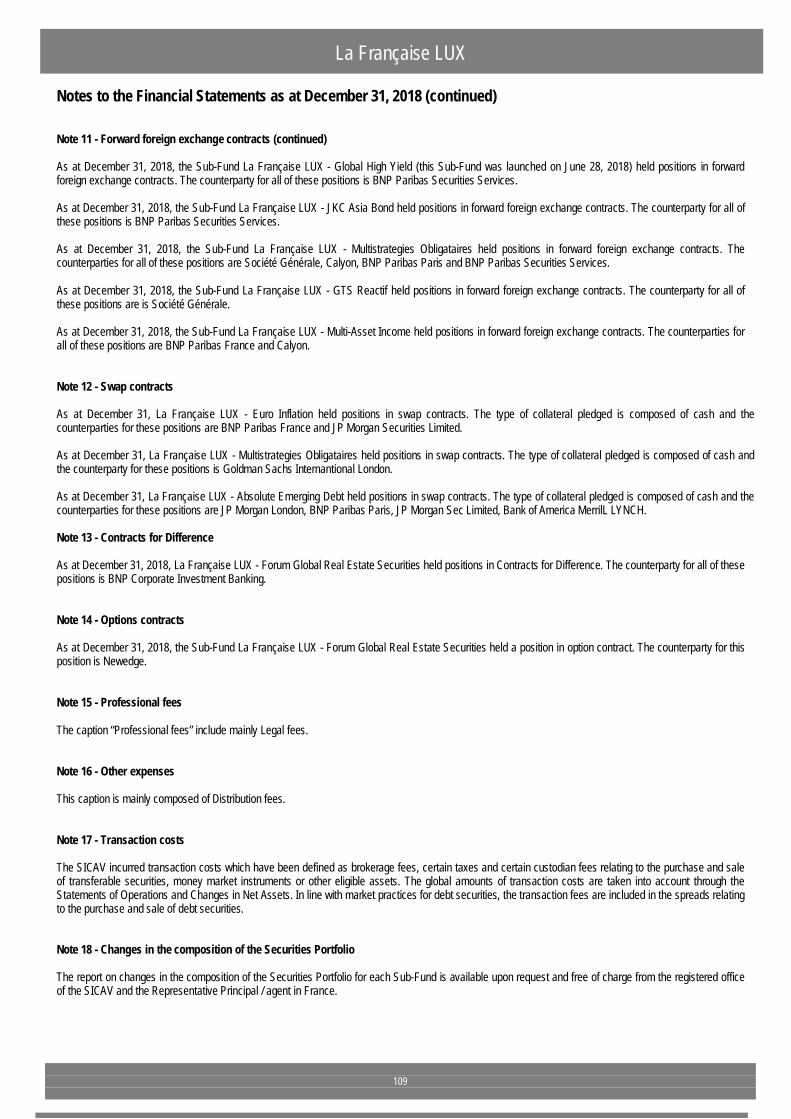
Notes to the Financial Statements as at December 31, 2018 (continued)
La Française LUX
Note 11 - Forward foreign exchange contracts (continued) As at December 31, 2018, the Sub-Fund La Française LUX - Global High Yield (this Sub-Fund was launched on June 28, 2018) held positions in forward foreign exchange contracts. The counterparty for all of these positions is BNP Paribas Securities Services. As at December 31, 2018, the Sub-Fund La Française LUX - JKC Asia Bond held positions in forward foreign exchange contracts. The counterparty for all of these positions is BNP Paribas Securities Services. As at December 31, 2018, the Sub-Fund La Française LUX - Multistrategies Obligataires held positions in forward foreign exchange contracts. The counterparties for all of these positions are Société Générale, Calyon, BNP Paribas Paris and BNP Paribas Securities Services. As at December 31, 2018, the Sub-Fund La Française LUX - GTS Reactif held positions in forward foreign exchange contracts. The counterparty for all of these positions are is Société Générale. As at December 31, 2018, the Sub-Fund La Française LUX - Multi-Asset Income held positions in forward foreign exchange contracts. The counterparties for all of these positions are BNP Paribas France and Calyon. Note 12 - Swap contracts As at December 31, La Française LUX - Euro Inflation held positions in swap contracts. The type of collateral pledged is composed of cash and the counterparties for these positions are BNP Paribas France and JP Morgan Securities Limited. As at December 31, La Française LUX - Multistrategies Obligataires held positions in swap contracts. The type of collateral pledged is composed of cash and the counterparty for these positions is Goldman Sachs Internantional London. As at December 31, La Française LUX - Absolute Emerging Debt held positions in swap contracts. The type of collateral pledged is composed of cash and the counterparties for these positions are JP Morgan London, BNP Paribas Paris, JP Morgan Sec Limited, Bank of America MerrilL LYNCH. Note 13 - Contracts for Difference As at December 31, 2018, La Française LUX - Forum Global Real Estate Securities held positions in Contracts for Difference. The counterparty for all of these positions is BNP Corporate Investment Banking. Note 14 - Options contracts As at December 31, 2018, the Sub-Fund La Française LUX - Forum Global Real Estate Securities held a position in option contract. The counterparty for this position is Newedge. Note 15 - Professional fees The caption “Professional fees” include mainly Legal fees. Note 16 - Other expenses This caption is mainly composed of Distribution fees. Note 17 - Transaction costs The SICAV incurred transaction costs which have been defined as brokerage fees, certain taxes and certain custodian fees relating to the purchase and sale of transferable securities, money market instruments or other eligible assets. The global amounts of transaction costs are taken into account through the Statements of Operations and Changes in Net Assets. In line with market practices for debt securities, the transaction fees are included in the spreads relating to the purchase and sale of debt securities. Note 18 - Changes in the composition of the Securities Portfolio The report on changes in the composition of the Securities Portfolio for each Sub-Fund is available upon request and free of charge from the registered office of the SICAV and the Representative Principal / agent in France.
109
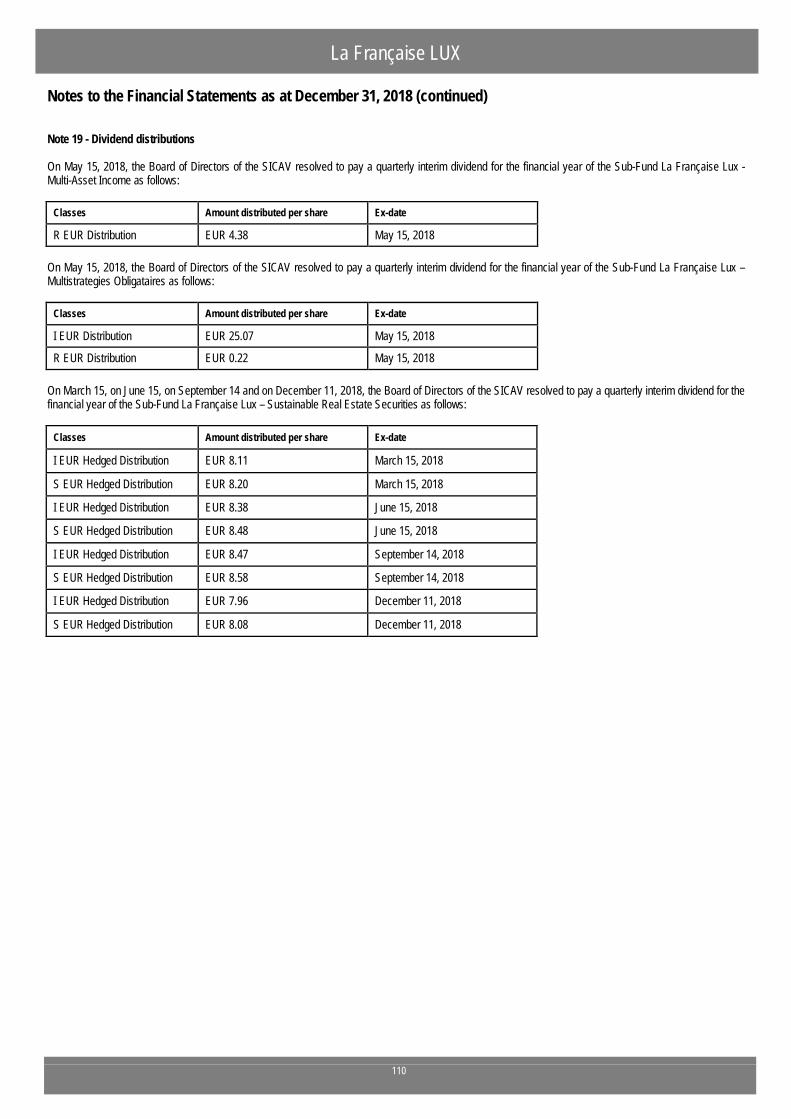
Notes to the Financial Statements as at December 31, 2018 (continued)
La Française LUX
Note 19 - Dividend distributions On May 15, 2018, the Board of Directors of the SICAV resolved to pay a quarterly interim dividend for the financial year of the Sub-Fund La Française Lux - Multi-Asset Income as follows:
Classes Amount distributed per share Ex-date
R EUR Distribution EUR 4.38 May 15, 2018 On May 15, 2018, the Board of Directors of the SICAV resolved to pay a quarterly interim dividend for the financial year of the Sub-Fund La Française Lux – Multistrategies Obligataires as follows:
Classes Amount distributed per share Ex-date
I EUR Distribution EUR 25.07 May 15, 2018
R EUR Distribution EUR 0.22 May 15, 2018 On March 15, on June 15, on September 14 and on December 11, 2018, the Board of Directors of the SICAV resolved to pay a quarterly interim dividend for the financial year of the Sub-Fund La Française Lux – Sustainable Real Estate Securities as follows:
Classes Amount distributed per share Ex-date
I EUR Hedged Distribution EUR 8.11 March 15, 2018
S EUR Hedged Distribution EUR 8.20 March 15, 2018
I EUR Hedged Distribution EUR 8.38 June 15, 2018
S EUR Hedged Distribution EUR 8.48 June 15, 2018
I EUR Hedged Distribution EUR 8.47 September 14, 2018
S EUR Hedged Distribution EUR 8.58 September 14, 2018
I EUR Hedged Distribution EUR 7.96 December 11, 2018
S EUR Hedged Distribution EUR 8.08 December 11, 2018
110
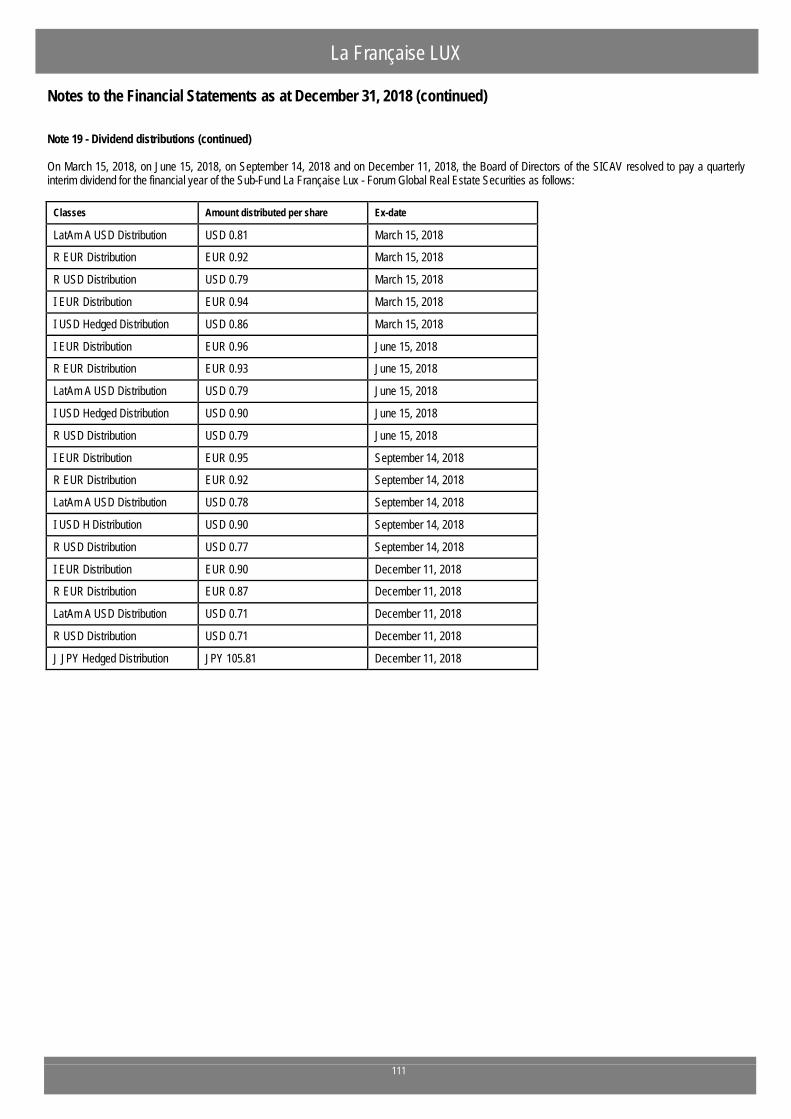
Notes to the Financial Statements as at December 31, 2018 (continued)
La Française LUX
Note 19 - Dividend distributions (continued) On March 15, 2018, on June 15, 2018, on September 14, 2018 and on December 11, 2018, the Board of Directors of the SICAV resolved to pay a quarterly interim dividend for the financial year of the Sub-Fund La Française Lux - Forum Global Real Estate Securities as follows:
Classes Amount distributed per share Ex-date
LatAm A USD Distribution USD 0.81 March 15, 2018
R EUR Distribution EUR 0.92 March 15, 2018
R USD Distribution USD 0.79 March 15, 2018
I EUR Distribution EUR 0.94 March 15, 2018
I USD Hedged Distribution USD 0.86 March 15, 2018
I EUR Distribution EUR 0.96 June 15, 2018
R EUR Distribution EUR 0.93 June 15, 2018
LatAm A USD Distribution USD 0.79 June 15, 2018
I USD Hedged Distribution USD 0.90 June 15, 2018
R USD Distribution USD 0.79 June 15, 2018
I EUR Distribution EUR 0.95 September 14, 2018
R EUR Distribution EUR 0.92 September 14, 2018
LatAm A USD Distribution USD 0.78 September 14, 2018
I USD H Distribution USD 0.90 September 14, 2018
R USD Distribution USD 0.77 September 14, 2018
I EUR Distribution EUR 0.90 December 11, 2018
R EUR Distribution EUR 0.87 December 11, 2018
LatAm A USD Distribution USD 0.71 December 11, 2018
R USD Distribution USD 0.71 December 11, 2018
J JPY Hedged Distribution JPY 105.81 December 11, 2018
111
Notes to the Financial Statements as at December 31, 2018 (continued)
La Française LUX
Note 20 - Related party transactions During the year ended December 31, 2018, the Sub-Funds GTS Réactif, Inflection Point Carbon Impact Euro (previously named Inflection Point European Equity), Inflection Point Leaders Emergents, Euro Inflation, JKC Asia Bond, Multistrategies Obligataires, Absolute Emerging Debt, Protectaux and Inflection Point Carbon Impact Global (previously named Inflection Point Zero Carbon) La Française LUX - Sub Debt (launched on June 5, 2018) invested part of their assets in other UCIs of the La Française Group. No subscription or redemption fees were charged to the SICAV but these UCIs paid Management fees. Note 21 - Cross Sub-Fund investment (art. 181 of the amended Law of 17, December 2010) Cross Sub-Funds investment envisages that any Sub-Fund created within an undertaking for collective investment (UCI) with multiple Sub-Funds may invest in one or more other Sub-Funds of the same UCI. This allows a single legal structure with cross Sub-Funds investment to subscribe for, acquire and hold its own shares as part of investment within the same UCI. During the year, the Sub-Fund La Française LUX - Absolute Emerging Debt invested in the Sub-Fund La Française LUX - JKC Asia Bond 2023. As at December 31, 2018 the total amount of cross-investments for the Sub-Fund La Française LUX - Absolute Emerging Debt was EUR 2,111,227.75 and is representing 2.63% of the net asset value. During the year, the Sub-Fund La Française LUX - JKC Asia Bond invested in the Sub-Fund La Française LUX - JKC Asia Bond 2023. As at December 31, 2018 the total amount of cross-investments for the Sub-Fund La Française LUX - JKC Asia Bond was EUR 2,413,450.00 and is representing 4.25% of the net asset value. During the year, the Sub-Fund La Française LUX - GTS Réactif invested in the Sub-Funds La Française LUX - Absolute Emerging Debt and La Française LUX - Multistrategies Obligataires. As at December 31, 2018 the total amount of cross-investments for the Sub-Fund La Française LUX - GTS Réactif was EUR 679,189.41 and is representing 3.96% of the net asset value. No management fees are applied on the underlying cross-Sub-Funds investments. The market value of investment realised and unrealised amounts have been eliminated in the combined Statement of Net Assets as at December 31, 2018 and in the combined Statement of Operations and Changes in Net Assets for the year then ended. Note 22 - Subsequent event The Sub-Fund La Française LUX - Sub Debt was liquidated on January 9, 2019. The Sub-Fund La Française LUX - Global High Yield was liquidated on January 31, 2019. The Sub-Fund La Française LUX - Inflection Point Leaders Emergents was liquidated on March 25, 2019.
112
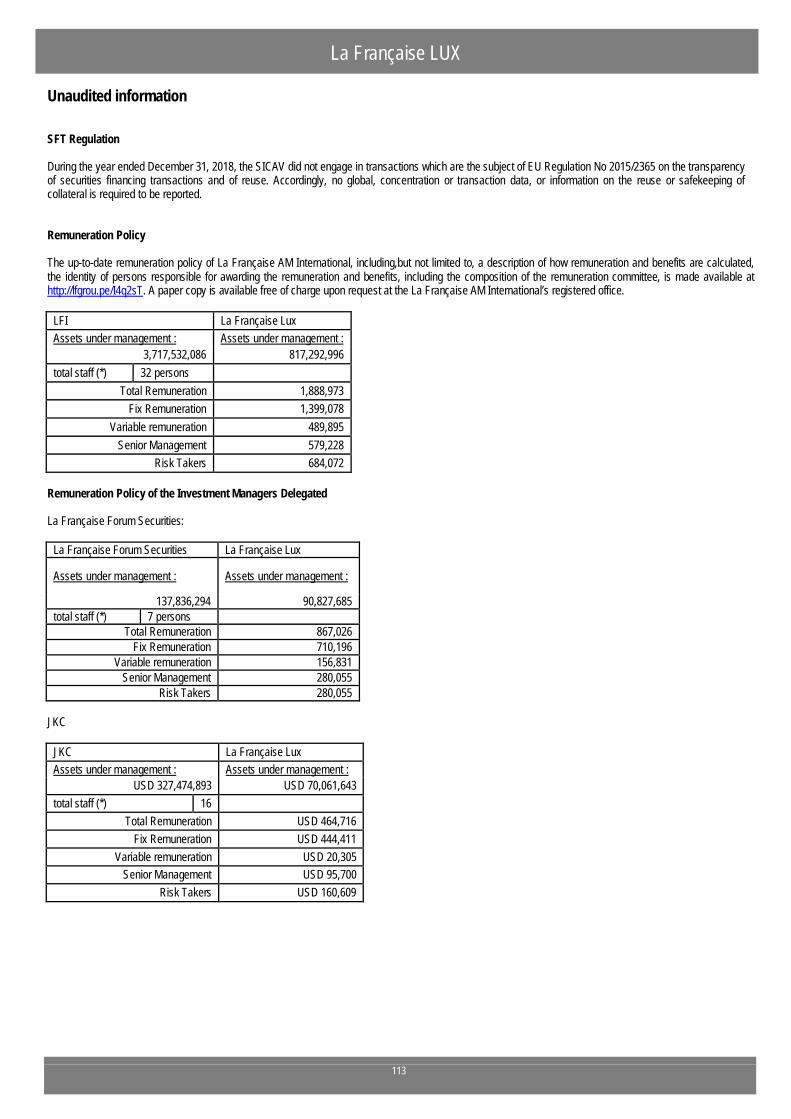
Unaudited information
La Française LUX
SFT Regulation During the year ended December 31, 2018, the SICAV did not engage in transactions which are the subject of EU Regulation No 2015/2365 on the transparency of securities financing transactions and of reuse. Accordingly, no global, concentration or transaction data, or information on the reuse or safekeeping of collateral is required to be reported. Remuneration Policy The up-to-date remuneration policy of La Française AM International, including,but not limited to, a description of how remuneration and benefits are calculated, the identity of persons responsible for awarding the remuneration and benefits, including the composition of the remuneration committee, is made available at http://lfgrou.pe/I4q2sT. A paper copy is available free of charge upon request at the La Française AM International’s registered office.
LFI La Française Lux Assets under management : Assets under management :
3,717,532,086 817,292,996 total staff (*) 32 persons
Total Remuneration 1,888,973 Fix Remuneration 1,399,078
Variable remuneration 489,895 Senior Management 579,228
Risk Takers 684,072 Remuneration Policy of the Investment Managers Delegated La Française Forum Securities:
La Française Forum Securities La Française Lux
Assets under management : Assets under management :
137,836,294 90,827,685 total staff (*) 7 persons
Total Remuneration 867,026 Fix Remuneration 710,196
Variable remuneration 156,831 Senior Management 280,055
Risk Takers 280,055 JKC
JKC La Française Lux Assets under management : Assets under management :
USD 327,474,893 USD 70,061,643 total staff (*) 16
Total Remuneration USD 464,716 Fix Remuneration USD 444,411
Variable remuneration USD 20,305 Senior Management USD 95,700
Risk Takers USD 160,609
113
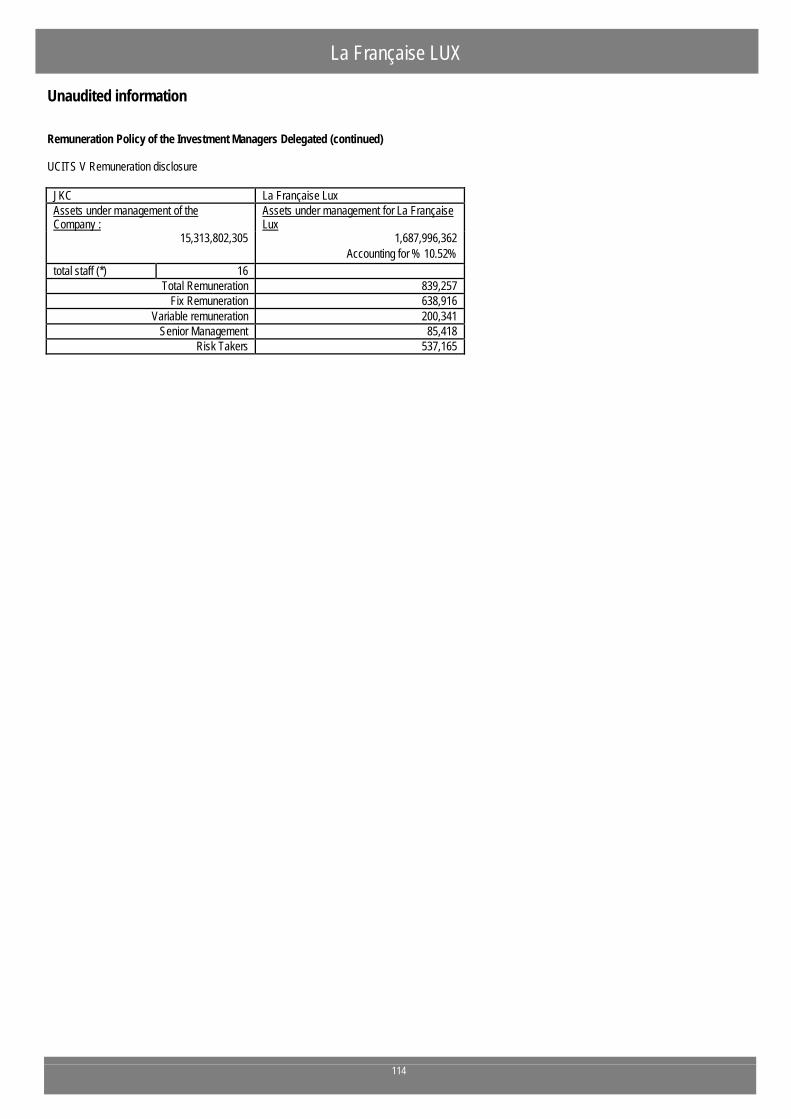
Unaudited information
La Française LUX
Remuneration Policy of the Investment Managers Delegated (continued) UCITS V Remuneration disclosure
JKC La Française Lux Assets under management of the Company :
Assets under management for La Française Lux
15,313,802,305 1,687,996,362 Accounting for % 10.52%
total staff (*) 16 Total Remuneration 839,257
Fix Remuneration 638,916 Variable remuneration 200,341
Senior Management 85,418 Risk Takers 537,165
114
Information for Shareholders in Germany (unaudited)
La Française LUX
No distribution notices have been submitted for the Sub-Funds named below, which means that shares of those Sub-Funds may not be distributed to investors within the scope of the German Investment Code. As a consequence the following Sub-Funds are not available to investors in Germany: La Française LUX – Absolute Emerging Debt La Française LUX – Euro Inflation La Française LUX – GTS Réactif La Française LUX – Inflection Point Carbon Impact Euro (formerly La Française LUX - Inflection Point European Equity); La Française LUX – Inflection Point Gonet Swiss Equity La Française LUX – Inflection Point Leaders Emergents La Française LUX – Inflection Point Carbon Impact Global (formerly La Française LUX - Inflection Point Zero Carbon); La Française LUX – JKC Asia Bond La Française LUX – Multi-Asset Income La Française LUX – Protectaux La Française LUX – JKC Asia Bond 2023. La Française LUX - Rendement Global 2020 - USD (this Sub-Fund was liquidated on May 23, 2018) The function of the Paying and Information Agent in the Federal Republic of Germany is performed by: BNP Paribas Securities Services S.C.A. Zweigniederlassung Frankfurt am Main Address: Europa-Allee 12, 60327 Frankfurt am Main (hereafter: Paying and Information Agent). Requests for redemption or conversion of shares may be submitted to the Paying and Information Agent. All payments to investors, including redemption proceeds and potential distributions and other payments may, upon request, be conducted through the Paying and Information Agent. The following documents may be obtained, free of charge, in hardcopy form at the office of the Paying and Information Agent: • the prospectus, • the key investor information documents, • the current annual and unaudited semi-annual reports, • the Articles of Incorporation of the SICAV. The issue, redemption and conversion prices, the net asset value as well as any notices to investors are also available from the Paying and Information Agent. In addition, the issue, redemption and conversion prices and any notices to investors are published on the website www.fundinfo.com No shares of EU UCITS will be issued as printed individual certificates. In addition, communications to investors in Germany will be made available by means of a durable medium (section 167 of the Investment Code) in the following cases: • suspension of the redemption of the shares, • termination of the management of the SICAV or its liquidation, • any amendments to the articles of incorporation which are inconstant with the previous investment principles, which affect material investor rights or which relate
to remuneration and reimbursement of expenses that may be paid or made out of the asset pool, • merger of the fund with one or more other funds and • the change of the SICAV into a feeder fund or the modification of a Master Fund.
115


![COMITE NORD DE JUDO - Fédération Française de Judo€¦ · 3D JOURDAN, Mickael [M1-73] 1 1 9 2D TAVERNE, Ludovic [M1-73] 2 5 13 FRA Cfismes . (FRA) 1D HOUTTEVILLE, Nordhal [M1-73]](https://img.pdfslide.net/doc/110x75/5f98c57d432d0828b25ed2d4/comite-nord-de-judo-fdration-franaise-de-judo-3d-jourdan-mickael-m1-73.jpg)